PART I - BUSINESS AND GENERAL INFORMATION - PDS ...
932
SEC FORM 17-A 1 3 4 2 1 8 A Y A L A C O R P O R A T I O N A N D S U B S I D I A R I E S 3 2 F T O 3 5 F , T O W E R O N E A N D E X C H A N G E P L A Z A , A Y A L A T R I A N G L E , A Y A L A A V E N U E , M A K A T I C I T Y 1 2 3 1 1 7 - A 0 4 2 4 C F D Dept. Requiring this Doc. 6 4 3 1 Total No. Of Stockholders Remarks = pls. Use black ink for scanning purposes Cashier S T A M P S Domestic Foreign To be accomplished by SEC Personnel concerned File Number LCU Annual Meeting Secondary License Type, if Applicable Amended Articles Number/Section Document I.D. ₱39.9 billion bonds COVER SHEET (Company's Full Name) (Business Address: No. Street City / Tow n / Province) Josephine G. De Asis (632) 7908-3000 Total Amount of Borrow ings Contact Person Company Telephone Number Month Day Month Day Fiscal Year
-
Upload
khangminh22 -
Category
Documents
-
view
0 -
download
0
Transcript of PART I - BUSINESS AND GENERAL INFORMATION - PDS ...

S E C F O R M 1 7 - A 1
3 4 2 1 8
A Y A L A C O R P O R A T I O N A N D S U B S I D I A
R I E S
3 2 F T O 3 5 F , T O W E R O N E A N D E X C H
A N G E P L A Z A , A Y A L A T R I A N G L E , A Y
A L A A V E N U E , M A K A T I C I T Y
1 2 3 1 1 7 - A 0 4 2 4
C F D
Dept. Requiring this Doc.
6 4 3 1
Total No. Of Stockholders
Remarks = pls. Use black ink for scanning purposes
Cashier
S T A M P S
Domestic Foreign
To be accomplished by SEC Personnel concerned
File Number LCU
Annual Meeting
Secondary License Type, if Applicable
Amended Articles Number/Section
Document I.D.
₱39.9 billion bonds
COVER SHEET
(Company's Full Name)
(Business Address: No. Street City / Tow n / Province)
Josephine G. De Asis (632) 7908-3000
Total Amount of Borrow ings
Contact Person Company Telephone Number
Month Day Month Day
Fiscal Year

Certification
I, Josephine G. de Asis, Comptroller, a duly authorized representative of Ayala Corporation (Company) with SEC registration number 34218 with principal office at 32F to 35F, Tower One and Exchange Plaza, Ayala Triangle, Ayala Avenue, Makati City, do hereby certify and state that:
1) In compliance with the guidelines issued by the Securities and Exchange Commission (SEC) for the filing of structured and current reports by publicly listed companies with the SEC in light of the imposition of an Enhanced Community Quarantine and Stringent Social Distancing Measures over the entire region of Luzon to prevent the spread of the 2019 Coronavirus Disease (COVID-2019), the Company is timely filing its SEC Form 17-A by uploading the same through the PSE EDGE in accordance with the relevant PSE rules and procedures.
2) The information contained in SEC Form 17 A dated April 8, 2020 is true and correct
to the best of my knowledge.
3) On behalf of the Company, I hereby undertake to a) submit hard or physical copies of SEC Form 17 A dated April 8, 2020 with proper notarization and certification, b) pay the filing fees (where applicable) c) pay the penalties due (where applicable) d) other impositions (where applicable), within ten (10) calendar days from the date of the lifting of the Enhanced Community Quarantine period and resumption of SEC’s normal working hours.
4) I am fully aware that non-submission of hard/physical copies of reports as well as
certification that they refer to one and the same document submitted online, within ten (10) calendar days from the lifting of the Enhanced Community Quarantine period and resumption of SEC’s normal working hours, shall invalidate the reports, applications, compliance, requests and other documents submitted via email. Hence, the corresponding penalties under existing rules and regulations of the Commission shall apply without prejudice to the imposition of penalties under Section 54 of the Securities Regulation Code and other applicable existing rules and regulations for failure to comply with the orders of the Commission.
5) I am executing this certification this April 8, 2020 to attest to the truthfulness of the
foregoing facts and for whatever legal purpose it may serve.
Josephine G. de Asis
Comptroller
Passport No. P0174919B

S E C F O R M 1 7 - A 2
SEC No. 34218 File No. _____
AYALA CORPORATION
(Company’s Full Name)
32F to 35F, Tower One and Exchange Plaza Ayala Triangle, Ayala Avenue
Makati City
(Company’s Address)
(632) 7908-3000
(Telephone Number)
December 31, 2019
(Fiscal Year Ending) (Month & Day)
SEC Form 17- A
(Form Type)

S E C F O R M 1 7 - A 3
SECURITIES AND EXCHANGE COMMISSION (SEC)
SEC FORM 17-A
ANNUAL REPORT PURSUANT TO SECTION 17 OF THE SECURITIES REGULATION CODE AND SECTION 141 OF THE CORPORATION CODE OF THE PHILIPPINES
1. For the fiscal year ended: December 31, 2019 2. SEC Identification No.: 34218 3. BIR Tax Identification No. 000-153-610-000 4. Exact name of the registrant as specified in its charter: AYALA CORPORATION 5. Province, country or other jurisdiction of incorporation or organization: Makati City, Philippines 6. Industry Classification Code: _______ (SEC Use Only) 7. Address of principal office: 32F to 35F, Tower One and Exchange Plaza, Ayala Triangle, Ayala
Avenue, Makati City Postal Code: 1226 8. Registrant’s telephone number: (632) 7908-3000 / 7908-3357 9. Former name, former address, former fiscal year: Not applicable 10. Securities registered pursuant to Sections 8 and 12 of the SRC, or Sections 4 and 8 of the RSA:
Title of each class Number of shares issued & outstanding As of December 31, 2019
Preferred A Preferred B Series 1 Preferred B Series 2
0* 20,000,000** 30,000,000
Voting Preferred Common
200,000,000 626,683,595***
* net of 12,000,000 treasury shares ** net of 8,000,000 treasury shares *** net of 4,478,644 treasury shares
Amount of debt outstanding as of December 31, 2019: ₱39,903.4 million in bonds **** ****amount represents only debt of Ayala Corporation registered with Philippine SEC. The debt of subsidiaries registered with SEC are reported in their respective SEC17A report.
11. Are any or all of these securities listed in the Philippine Stock Exchange? Yes [x] No [ ]
As of December 31, 2019, a total of 627,098,147 common shares, 12,000,000 preferred A (“ACPA”) shares, 28,000,000 preferred B series 1 (“ACPB1”) shares, and 30,000,000 preferred B series 2 (“ACPB2”) shares are listed in the Philippine Stock Exchange (“PSE”). A total of 4,478,644 common shares, 12,000,000 ACPA shares and 8,000,000 ACPB1 shares are held in Treasury by the Company.
12. Check whether the registrant:
(a) has filed all reports required to be filed by Section 17 of the SRC and SRC Rule 17.1 thereunder or Section 11 of the RSA and RSA Rule 11 (a)-1 thereunder, and Sections 26 and 141 of the Corporation Code of the Philippines during the preceding 12 months (or for such shorter period that the registrant was required to file such reports):
Yes [x] No [ ] (b) has been subject to such filing requirements for the past 90 days: Yes [x] No [ ]

S E C F O R M 1 7 - A 4
13. Aggregate market value of the voting stock held by non-affiliates: About ₱152.5 billion (based on closing price of Ayala Corporation’s common shares as of March 31, 2020 and outstanding shares owned by the public as of December 31, 2019).
APPLICABLE ONLY TO ISSUERS INVOLVED IN INSOLVENCY/SUSPENSION OF PAYMENTS PROCEEDINGS
DURING THE PRECEEDING FIVE YEARS 14. Check whether the issuer has filed all documents and reports required to be filed by Section 17 of
the Code subsequent to the distribution of securities under a plan confirmed by a court or the Commission. Not applicable
Yes [ ] No [ ]
DOCUMENTS INCORPORATED BY REFERENCE 15. Briefly describe documents incorporated by reference and identify the part of the SEC Form 17-A
into which the document is incorporated: 2019 Opinion on and Individual Supplementary Schedules
2019 Consolidated Financial Statements of Ayala Corporation and Subsidiaries 2019 Consolidated Financial Statements of Bank of the Philippine Islands and Subsidiaries 2019 Consolidated Financial Statements of Globe Telecom, Inc. and Subsidiaries 2019 Financial Statements of Ayala Corporation (with BIR ITR Filing Reference)

S E C F O R M 1 7 - A 5
TABLE OF CONTENTS PART I BUSINESS AND GENERAL INFORMATION Item 1 Business 6 Item 2 Properties 150 Item 3 Legal Proceedings 158 Item 4 Submission of Matters to a Vote of Security Holders 169 PART II OPERATIONAL AND FINANCIAL INFORMATION Item 5 Market for Registrant’s Common Equity and Related Stockholder Matters 170 Item 6 Management’s Discussion and Analysis or Plan of Operations 182 Item 7 Financial Statements and Supplementary Schedules 205 Item 8 Changes in and Disagreements with Accountants on Accounting and Financial Disclosures 205 PART III CONTROL AND COMPENSATION INFORMATION Item 9 Directors and Executive Officers of the Registrant 207 Item 10 Executive Compensation 215 Item 11 Security Ownership of Certain Beneficial Owners and Management 217 Item 12 Certain Relationships and Related Transactions 218 PART IV COPORATE GOVERNANCE AND SUSTAINABILITY Item 13.A Corporate Governance 224 Item 13.B Sustainability report 224 PART V EXHIBITS AND SCHEDULES Item 14 Exhibits and Reports on SEC Form 17-C (Current Report) 225 SIGNATURES 227 INDEX TO FINANCIAL STATEMENTS AND SUPPLEMENTARY SCHEDULES 228

S E C F O R M 1 7 - A 6
PART I - BUSINESS AND GENERAL INFORMATION Item 1. Business Ayala Corporation (the Company, the Parent Company or Ayala) is the holding company of one of the oldest and largest business groups in the Philippines that traces its history back to the establishment of the Casa Roxas business house in 1834. The Company was incorporated in January 23, 1968, and its Class A Shares and Class B Shares were first listed on the Manila and Makati Stock Exchanges (the predecessors of the PSE) in 1976. In 1997 the Company’s Class A and Class B Shares were declassified and unified as Common Shares. The Company is a limited liability corporation having a renewable term of 50 years. On April 15, 2016 during its annual meeting of stockholders, the stockholders ratified the amendment of the Fourth Article of the Articles of Incorporation to extend the corporate term for 50 years from January 23, 2018. The extension of corporate life was approved by SEC on April 5, 2017. As of December 31, 2019, the Company is 47.33% owned by Mermac, Inc. and the rest by the public. Mermac, Inc., a private holding company incorporated in the Philippines is the dominant shareholder of Ayala. On the other hand, Mitsubishi Corporation (which held 6.03% of Ayala common shares as at December 31, 2019) is Ayala’s long-time strategic shareholder. Its registered office address and principal place of business is 32F to 35F, Tower One and Exchange Plaza, Ayala Triangle, Ayala Avenue, Makati City. The Company is organized as a holding company holding equity interests in the Ayala Group (the "Group"), one of the largest and most diversified groups in the Philippines. Ayala's business activities are divided into: (a) real estate, (b) financial services, (c) telecommunications, (d) power, (e) water, (f) industrial technologies, (g) infrastructure, (h) healthcare, and (i) education. Ayala’s real estate business is primarily conducted through its subsidiary, Ayala Land, Inc. (“Ayala Land” or “ALI”), a diversified real estate company in the Philippines. Its involvement in financial services is through an affiliate, the Bank of the Philippine Islands (“BPI”), which, together with its subsidiaries (together, the “BPI Group”), form a universal banking group in the Philippines. Ayala’s telecommunications business is carried out through an affiliate, Globe Telecom, Inc. (“Globe”), a leading telecommunications company in the Philippines. Ayala’s investments in the power sector are held under AC Energy, Inc. (“AC Energy” or “ACEI”), while its interest in water infrastructure is under Manila Water Company, Inc. (“Manila Water” or “MWC”). Its international business in electronics manufacturing services and vehicle distribution and retail are under AC Industrial Technology Holdings Inc. (“AC Industrials or ACI”)., while its investments in transport and logistics infrastructure are housed under AC Infrastructure Holdings Corp. ("AC Infra"). Its business in healthcare is conducted through Ayala Healthcare Holdings (“AC Health”). In May 2, 2019, Ayala finalized the merger of its wholly-owned subsidiary AC Education Inc. (“AC Education” or “AEI”) to iPeople Inc. (“iPeople”), with iPeople as the surviving entity. The merger resulted in Ayala owning a 33.5% stake and House of Investments (“HI”) a 51.3% stake in iPeople. Certain members of the Ayala Group, namely ALI, BPI, Globe, MWC, Integrated Micro-Electronics, Inc. (“IMI”), AyalaLand Logistics Holdings (“ALLHC” or formerly known as Prime Orion Philippines Inc.(“POPI”)), Cebu Holdings, Inc. (“CHI”), AC Energy Philippines (“ACEPH”) and ACE Enexor, Inc. (“ACEX”) are likewise publicly listed corporations. Some of Ayala’s subsidiaries and affiliates have holdings in the equity of other subsidiaries and affiliates. The lists of subsidiaries and associates and joint ventures are contained in the attached Company’s Consolidated Financial Statements for December 31, 2019. For management purposes, the Group is organized into the following business units:
• Parent Company - represents operations of the Parent Company including its financing entities such as ACIFL, AYCFL, PFIL and MHI.
• Real estate and hotels - planning and development of large-scale fully integrated mixed-used communities that become thriving economic centers in their respective regions. These include development and sale of residential, leisure and commercial lots and the development and leasing of retail and office space and land in these communities; construction and sale of residential condominiums and office buildings; development of industrial and business parks; development

S E C F O R M 1 7 - A 7
and sale of high-end, upper middle-income and affordable and economic housing; strategic land bank management; hotel, cinema and theater operations; and construction and property management.
• Financial services and insurance - commercial banking operations with expanded banking license. These include diverse services such as deposit taking and cash management (savings and time deposits in local and foreign currencies, payment services, card products, fund transfers, international trade settlement and remittances from overseas workers); lending (corporate, consumer, mortgage, leasing and agri-business loans); asset management (portfolio management, unit funds, trust administration and estate planning); securities brokerage (on-line stock trading); foreign exchange and capital markets investments (securities dealing); corporate services (corporate finance, consulting services); investment banking (trust and investment services); a fully integrated bancassurance operations (life, non-life, pre-need and reinsurance services); and other services (internet banking, foreign exchange and safety deposit facilities).
• Telecommunications (Telecoms) – provider of digital wireless communications services using a fully digital network; domestic and international long distance communication services or carrier services; broadband internet and wireline voice and data communication services; also licensed to establish, install, operate and maintain a nationwide local exchange carrier (LEC) service, particularly integrated local telephone service with public payphone facilities and public calling stations, and to render and provide international and domestic carrier and leased line services. In recent years, operations include developing, designing, administering, managing and operating software applications and systems, including systems designed for the operations of bill payment and money remittance, payment facilities through various telecommunications systems operated by telecommunications carriers in the Philippines and throughout the world and to supply software and hardware facilities for such purposes.
• Water infrastructure – contractor to manage, operate, repair, decommission, and refurbish all fixed and movable assets (except certain retained assets) required to provide water delivery, sewerage and sanitation, distribution services, pipeworks, used water management and management services. In 2016, a new business initiative was undertaken where the group will exclusively provide water and used water services and facilities to all property development projects of major real estate companies.
In 2019, investment in MWC was reclassified to “Assets and liabilities and operations of segment under PFRS 5” (see Note 25 of the 2019 Company’s Consolidated Financial Statements attached as index to this SEC17A Report).
• Electronics manufacturing – global provider of electronics manufacturing services (EMS) and power semiconductor assembly and test services with manufacturing facilities in Asia, Europe, and North America. It serves diversified markets that include those in the automotive, industrial, medical, telecommunications infrastructure, storage device, and consumer electronics industries. Committed to cost-development to manufacturing and order fulfillment), the company's comprehensive capabilities and global manufacturing presence allow it to take on specific outsourcing needs.
• Power generation – unit that will build a portfolio of power generation assets using renewable and conventional technologies which in turn will operate business of generating, transmission of electricity, distribution of electricity and supply of electricity, including the provision of related services.
• Automotive, Outsourcing and Others – includes operations of Automotive unit’s business on manufacturing, distribution and sale and providing repairs and services for passenger cars and commercial vehicles. In 2016, this unit launched initiatives to include industrial manufacturing activity for long-term synergy and integration with automotive business. This segment also includes outsourcing services unit (venture capital for technology businesses and emerging markets; onshore and offshore outsourcing services in the research, analytics, legal, electronic discovery, document management, finance and accounting, full-service creative and marketing, human capital management solutions, and full-service accounting); International unit (investments in overseas property companies and projects); Aviation (air-chartered services); consultancy, agri-business and other operating companies. This business segment group also includes the companies for Infrastructure (development arm for various types of infrastructure); education, human capital resource management and health services.
Please refer to Note 30 on Operating Segment Information of the Company’s Consolidated Financial Statements attached as index to this SEC17A Report (Report) regarding operating segments which

S E C F O R M 1 7 - A 8
presents assets and liabilities as of December 31, 2019 and 2018 and revenue and profit information for the years ended December 31, 2019, 2018 and 2017. Management monitors the operating results of its business units separately for the purpose of making decisions about resource allocation and performance assessment. Segment performance is evaluated based on operating profit or loss and is measured consistently with operating profit or loss in the consolidated financial statements. For the years ended December 31, 2019, 2018 and 2017, there were no revenue transactions with a single external customer which accounted for 10% or more of the consolidated revenue from external customers. Intersegment transfers or transactions are entered into under the normal commercial terms and conditions that would also be available to unrelated third parties. Segment revenue, segment expense and segment results include transfers between operating segments. Those transfers are eliminated in consolidation. For the detailed discussion on the specific subsidiaries falling under each business unit as well as the major transactions of the Group, please refer to Note 2 on Group Information of the Consolidated Financial Statements for December 31, 2019 which forms part of the Index of this Report. Other major transactions and developments were also disclosed in the Company’s previously filed SEC17Q and SEC17-C reports, listing of which also forms part of the Index of this Report. The consolidated financial statements of the Group as of December 31, 2019 and 2018 and for the years ended December 31, 2019, 2018 and 2017 were endorsed for approval by the Audit Committee on March 6, 2020 and authorized for issue by the Board of Directors (BOD) on March 12, 2020. Strategy Amid the Philippines’ economic growth, Ayala’s unique portfolio of businesses provides various engines for growth and diversification. The positive domestic environment has served as a catalyst for Ayala to unlock opportunities, develop new ideas, incubate new businesses, and explore prospects for disruptive innovation. Ayala took advantage of this encouraging environment to create a portfolio that creates certain hedges against specific macroeconomic trends that solidified the industry leadership of Ayala Land, Bank of the Philippine Islands, Globe Telecom, and in parallel, built a significant presence in power through AC Energy. These four businesses are Ayala’s core value drivers. In addition, Ayala likewise entered new spaces in industrial technologies, infrastructure, healthcare, and education. Ayala maintains a healthy balance sheet with access to various financing options to meet debt and dividend obligations as well as fund new investments. A robust risk management system allows the Company to maximize opportunities for reinvention, and navigate the challenges faced by its business units. Future Plans and Prospects Ayala addresses structural and societal gaps in the Philippines by building impactful businesses and transforming its industry-leading subsidiaries. Our long-term value creation is driven by strategic business development, a robust capital allocation process, active portfolio and balance sheet management, with sustainability at our core. Ayala believes that the Philippines continues to be fundamentally strong, having remained resilient amid the challenges in the global economy. Going forward, the Ayala group will continue to execute on its five-year growth strategy for 2020 as it closely monitors key trends and potential risks in the global and domestic economies as well as in the industries where it operates. The Company will continue to strengthen its portfolio of emerging businesses, led by AC Energy, which has started to become a significant component of Ayala’s earnings and value creation. In addition, the Company will continue to build scale and explore growth areas in industrial technologies, healthcare, and infrastructure. Based on SEC’s parameters, the significant subsidiaries of Ayala Corporation as of December 31, 2019 are Ayala Land, Inc. (ALI - organized in 1988), Manila Water Co, Inc. (MWC – established in 1997), Integrated Micro-Electronics, Inc. (IMI - organized in 1980) and AC Energy, Inc. (ACEI – established in 2005). Except as stated in the succeeding paragraphs and in the discussion for each of the Company’s significant subsidiaries, there has been no other business development such as

S E C F O R M 1 7 - A 9
bankruptcy, receivership or similar proceeding not in the ordinary course of business that affected the registrant for the past three years. As to the material reclassification, merger, consolidation or purchase or sale of a significant amount of assets For detailed discussion as to material reclassification, merger, consolidation and purchase transactions with subsidiaries and investees, please refer to Note 2 Group Information, Note 10 Investments in Associates and Joint Ventures and Note 24 on Business Combinations and Transactions with Non-controlling Interests of the Company’s Consolidated Financial Statements for December 31, 2019 which forms part of the Index of this Report. Distribution methods of the company’s products and services This is not applicable to the Company being a holding company. The Company’s operating companies, however, have their respective distribution methods of products and services. Please refer to Significant Subsidiaries, Associates and Joint Ventures portion for the discussion on distribution methods. Competition The Company is subject to significant competition in each of the industry segments where its subsidiaries and investees operate. Please refer to Significant Subsidiaries, Associates and Joint Ventures portion for the discussion on competition. Transactions with related parties The Company, in the regular conduct of business, has entered into transactions consisting of advances, loans and reimbursements of expenses, purchase, lease and sale of real estate properties, and administrative service agreements, with associates and other related parties. Sales and purchases of goods and services to and from related parties are made at arms-length basis fair, and inure to the interest of both parties. Material related party transactions are reviewed by the Risk Management and Related Party Transactions Committee of the Board and properly disclosed in the accompanying audited financial statements. Material transactions involving the Company or its associates and in which any of its directors and executive officers has a direct or indirect material interest are likewise reviewed by the Risk Management and Related Party Transactions Committee of the Board to ensure arms-length and fair terms. To date, there have been no complaints received by the Company regarding related-party transactions. None of the Company’s directors has entered into self-dealing and related party transactions in 2019. The Company, all publicly-listed companies and certain entities within the Group have approval requirements and limits on the amount and extent of related party transactions in compliance with the requirements under the Revised SRC Rule 68 (refer to Item 12. Certain Relationships and Related Transactions). Related party transactions are further discussed in the Note 32 of the Consolidated Financial Statements for December 31, 2019 which forms part of the Index of this Report. Developmental and Other Activities Being a holding company, the Company has no material patent, trademark, or intellectual property right to a product or any of its direct services. The Company’s operating companies, however, may have these material intellectual property rights, but the dates and terms of their expiration or renewal is not perceived to have a material adverse effect on the Company. The Company complies with all existing government regulations and environmental laws, the costs of which are not material. As a holding company, it has no material development activities. Employees Ayala is committed to promoting the safety and welfare of the employees. It believes in inspiring the employees, developing their talents, and recognizing their needs as business partners. Strong and open lines of communication are maintained to relay Ayala’s concern for their and safety, and deepen their understanding of Ayala’s value-creating proposition. The Company has a total workforce of 156 employees as of December 31, 2019, classified as follows: Staff 60 Managers and Executives 87 Consultants 9 156

S E C F O R M 1 7 - A 10
The Company expects to increase its number of employees in the next 12 months. The Company has an existing Collective Bargaining Agreement (CBA) with the Ayala Corporation Employees Union for a period of 3 years, from January 2017 until December 2019. The CBA generally provides for improvement in compensation and benefits. Union and Management relations continue to be harmonious. The Company’s management had not encountered difficulties with its labor force, nor have strikes been staged in the past. In addition to the basic salary and 13th month pay, other supplemental benefits provided by the Company to its employees include: mid-year bonus, performance bonus, retirement benefit, life and health insurance, medical and dental benefits, and various loan facilities. Risks Factors Risk Management has become an increasingly important business driver and part of successful corporate governance. By treating risk as intrinsic to the conduct of business, risk management is elevated from an exercise in risk avoidance to an essential consideration in every decision, initiative and activity. At Ayala, we ensure that our risk management system has the right architecture, strategy, and protocols to support the risk management process. We revisit these three key factors yearly to ensure that we have the right approach in mitigating risks and maximizing opportunities. The oversight for the operationalization of Ayala’s risk management program rests with the Risk Management and Related Party Transactions Committee, a Board-level committee that provides transparency and visibility into the corporate’s risk management practices. The Chief Risk Officer (CRO), being a risk management advocate, reports to the Committee any improvement in the design, implementation and maintenance of the enterprise risk management roadmap. The Group Risk Management and Sustainability Unit supports the CRO in the execution of its responsibilities and continues to align Ayala’s risk governance with Deloitte’s concept of risk intelligent enterprise, espousing a best practice that goes beyond risk avoidance and mitigation to utilize risk-calculated decision-making as a means to create value. Every year, the corporate conducts an enterprise-wide risk assessment workshop to identify emerging risks, evaluate its impact to the corporate and the business units, and prioritize risks according to both impact and likelihood. For 2019, The Company assessed that key risk exposures include brand and reputation, political and regulatory, and business resiliency. At the group level, key risk exposures are political and regulatory, portfolio management, and operational. The Company and the Group have laid down the objectives to address these exposures. Risk Policy For the Company
Risk Exposure Risk Definition Objective/ Strategy
Brand and reputation The inability to maintain our stature as a company of choice may result in significant difficulty in creating and/or maximizing value for all stakeholders
To maintain and improve one of its core values, the strong Ayala brand
Political and regulatory The inability to anticipate changes in the political and regulatory landscapes may result in the Group being unable to shield our profitability and brand value.
To ensure that the Corporation can adapt to the changes in the political and regulatory landscapes to continue its long-term value creation process for all its stakeholders.
Business resiliency Being unable to restore normal operations following natural/man-made disasters and/or failure of business contingency processes and systems may cause significant revenue loss and customer trust.
To put measures in place that will allow the continuity of business operations and swift recovery following a natural or man-made disaster

S E C F O R M 1 7 - A 11
For the Group
Risk Exposure Risk Definition Objective
Political and regulatory The inability to anticipate changes in the political and regulatory landscapes may result in the Group being unable to shield our profitability and our brand value.
To improve the Group’s ability to anticipate and adapt to political and regulatory changes, which may impact each business unit’s financial models and other value-creation activities
Portfolio management The inability to align portfolio management strategy with business objectives may result in the failure to provide the right balance of risk and return.
• To ensure that the portfolio composition will provide the right balance of risk and return to the organization.
Operational Failure and/or inefficient operational processes, people and systems may result in inability to meet business objectives.
To ensure that all business units have efficient and effective processes, right talent and appropriate systems to support the achievement of business objectives.
Please refer to significant subsidiaries, associates and joint ventures portion for their detailed discussion on Risk Management. Financial Risks Management For detailed discussion, please refer to Note 33 on Financial Instruments – Financial Risk Management of the Company’s Consolidated Financial Statements for December 31, 2019 which form part of the Index of this Report. Other Risks of the Company and the Group Countries around the world are bracing themselves for unprecedented health, social and economic impact of Covid-19. While the full impact economic and market outlook remain uncertain, we believe there will be opportunity to help society stay resilient and eventually transition to a new normal. First and foremost, Ayala Corporation is focused on maintaining a healthy balance sheet to weather looming economic headwinds. We face this growing threat with a strong liquidity position and ability to take advantage of market opportunities. Further, we are prepared with scenario-based business continuity plans to ensure the health and safety of our employees, to continue to serve our customers, and to maintain the trust of our investors. Finally, we are pro-active in helping address the health, social and economic needs of the country in line with our shared values of nation-building The Group is active in many regulated sectors and failure to adequately anticipate and/or address regulatory changes may adversely impact the Group. The Group, one of the largest conglomerates in the Philippines, engages in the following sectors: real estate, financial services, telecommunications, water, industrial technologies, power, infrastructure, healthcare, education, and others. Some of its business activities are in regulated industries that regularly undergo a significant amount of regulatory and/or political changes. While Ayala and certain member companies of the Ayala Group have dedicated resources and personnel to monitor, study and influence policymaking in their respective industries in the Philippines, Ayala cannot fully ensure the accuracy of such studies or the effectiveness of such attempts in a constantly shifting environment. Any failure to accurately predict or successfully influence or address policy outcomes may have a material adverse effect on the Group’s business, financial condition and results of operations. Ayala is actively monitoring the regulatory landscape for current regulations and any changes that may have an impact on its existing and potential markets. Ayala’s Public Policy Unit and the group’s Regulatory Council regularly identify, monitor, and evaluate new policy issues across sectors and industries. The unit is also in charge of maintaining and strengthening relationships with all levels of government by conducting policy dialogues and consultations among others. Ayala is increasing its investments in the industrial technologies, infrastructure, healthcare and other sectors and may not realize short- or long-term gains from these planned investments. As part of its business strategy, Ayala is rebalancing its portfolio by investing in sectors that it believes are key growth areas in the Philippines, including, but not limited to, industrial technologies, infrastructure, healthcare, education and technology ventures. Additionally, Ayala, through its Subsidiaries, Associates and Joint Ventures has increased and may continue to increase its investments in other businesses. These investments may not realize short- or long-term gains for multiple reasons. As a result, it is possible that the expected benefits of these investments may not

S E C F O R M 1 7 - A 12
materialize within the time periods or to the extent anticipated or at all, thus affecting Ayala’s financial condition. Ayala’s core businesses in real estate, banking, and telecommunications are dominant industry players that will continue to drive a significant component of its earnings and value in the medium term. Over the past decade, Ayala has been establishing a presence in new sectors from which it can derive new sources of growth and value creation. Part of its five-year strategic targets for 2020 is to generate 20% contribution to its equity earnings from emerging businesses, namely power, industrial technologies, education, and healthcare. While Ayala is always open to new areas of investment, it employs a rigorous gating process at the management level, with final evaluation and approval at the board level. During this process, a thorough discussion of the business plan, strategy for execution, and risks is carried out and responsible persons are identified. In addition, Ayala has adopted a capital allocation process where the board’s Finance Committee, upon recommendation of management, determines the amount of capital assigned to the various business ventures. Capital is allocated and committed over a set time frame (usually three to five years), which ensures that management has the funds to execute their proposed business plan. The Finance Committee endorses the recommended capital allocation to the Board which has final approval over all investments. Ayala has conducted and may continue to conduct acquisitions, the impact of which could be less favorable than anticipated or which could affect its financial situation. As part of its business strategy, Ayala has conducted and continues to carry out acquisitions of varying sizes, some of which are significant at the Group level. These acquisitions involve numerous risks, including, without limitation, the following: (a) the assumptions used in the underlying business plans may not prove to be accurate, in particular with respect to synergies and expected commercial demand; (b) Ayala may not integrate acquired businesses, technologies, products, personnel, and operations effectively; (c) Ayala may fail to retain key employees, customers and suppliers of the companies acquired; (d) Ayala may be required or wish to terminate pre-existing contractual relationships, which could be costly and/or on unfavorable terms; and (e) Ayala may increase its indebtedness to finance these acquisitions. As a result, it is possible that the expected benefits of completed or future acquisitions may not materialize within the time periods or to the extent anticipated, or affect Ayala’s financial condition. To mitigate this risk, Ayala, through its Strategic Planning Unit provides market intelligence, compares key metrics with competition, analyzes annual innovation trends and new sectors, and strengthens Ayala’s gating process, where all possible business ventures are discussed and monitored. The Chief Financial Officer (“CFO”), through the Financial Planning and Corporate Finance and Asset Management teams, complements these activities with regular deep-dive analysis of portfolio and business unit performance. The Senior Management Team is also expected to strengthen relationships and establish networks with potential partners and advisers. The Company’s subsidiaries and affiliates are subject to specific industry risks. Ayala operates in several key sectors: real estate, financial services, telecommunications, water, industrial technologies, power, infrastructure, healthcare, education and technology ventures. These various industries have inherent risks, which ultimately exposes the Group. Below are some of the key risks that Ayala’s subsidiaries face in their day-to-day operations.
a) High level of competition; b) Slowdown in business activity due to global financial and local political, socio-economic turmoil,
and security concerns; c) Lack of skilled and properly trained workforce to deploy to its various business operations; d) Risks associated with information and technology infrastructure; e) Risks associated with market disruptors and changes or shifts in technology and market
preferences; f) Non-compliance to, or breach of, regulatory limits imposed on some of its highly regulated
businesses; g) Changes in tax policies, government regulations, laws, or the interpretation thereof, and sudden
shifts in government policies and initiatives that could adversely affect Ayala’s businesses; h) Loss of key personnel or the inability to attract and retain them; i) Litigation risks both on business dealings with the private and public sectors, which could result in
financial losses or harm its businesses; j) Natural catastrophes;

S E C F O R M 1 7 - A 13
k) Shortages in raw materials or feedstock, or the increase in the prices thereof, that can limit the production and operations of some of its subsidiaries and affiliates; and
l) Inability to implement growth strategies across its various business segments, including, but not limited to, realizing value from its various acquisitions and business integrations, securing of business contracts, concessions, and business partnerships, completing its business expansion plans, etc.
To mitigate such risks, Ayala ensures that each of the operating companies has a full management team which is responsible for having their own plan to manage risk which is reviewed by their respective Risk Management Committees and periodically by Ayala.

S E C F O R M 1 7 - A 14
SIGNIFICANT SUBSIDIARIES, ASSOCIATES AND JOINT VENTURES AYALA LAND, INC. Background and Business Ayala Land, Inc. (alternately referred to as ALI, Ayala Land, “the Company” or “the Group” in the entire discussion of Ayala Land, Inc.) is the real estate arm of the Ayala Group. Its defining project was the 1948 development of a planned mixed-use community on 930 hectares of swamp and grassland in the Makati district of Metro Manila. Over the course of the following 25 years, the Ayala Group transformed Makati into the premier central business district of the Philippines and a site of some of Metro Manila’s most prestigious residential communities. Ayala Land has become the largest real estate company in the Philippines engaged principally in the planning, development, subdivision and marketing of large-scale communities having a mix of residential, commercial, leisure and other uses. Ayala Land was organized in 1988 when Ayala Corporation decided to spin off its real estate division into an independent subsidiary to enhance management focus on its real estate business. ALI went public in July 1991 when its Class “B” Common shares were listed both in the Manila and Makati Stock Exchanges (the predecessors of the Philippine Stock Exchange - PSE). On September 12, 1997, the Securities and Exchange Commission (SEC) approved the declassification of the Company’s common class “A” and common class “B” shares into common shares. Ayala Land is the largest and most diversified real estate conglomerate in the Philippines. It is engaged in land acquisition, planning, and development of large scale, integrated, mixed-use, and sustainable estates, industrial estates, development and sale of residential and office condominiums, house and lots, and commercial and industrial lots, development and lease of shopping centers and offices, co-working spaces, and standard factory buildings and warehouses, and the development, management, and operation of hotels and resorts and co-living spaces. The Company is also engaged in construction, property management, retail electricity supply and airline services. It also has investments in AyalaLand Logistics Holdings Corp., Cebu Holdings, Inc., Ortigas Land Corp., MCT Bhd, Qualimed and Merkado Supermarket. Ayala Land has 29 estates, is present in in 57 growth centers nationwide and has a total land bank of 12,192 hectares at the end of 2019. Products / Business Lines Property Development Property Development is composed of the Strategic Land Bank Management Group, Visayas-Mindanao Group, Residential Business Group and MCT Bhd, Ayala Land’s listed subsidiary in Malaysia. The Strategic Land Bank Management Group handles the acquisition, planning and development of large scale, mixed-use, and sustainable estates, and the development and sale, or lease of its commercial lots in its estates in Metro Manila and the Luzon region. The Visayas-Mindanao Group handles the acquisition, planning and development of large scale, mixed-use, and sustainable estates, and the development and sale, or lease of its commercial lots in its estates in key cities in the Visayas and Mindanao regions. The Residential Business Group handles the development and sale of residential and office condominiums and house and lots for the luxury, upscale, middle-income, affordable, and socialized housing segments, and the development and sale of commercial lots under the following brands: AyalaLand Premier (“ALP”) for luxury lots, residential and office condominiums, Alveo Land Corp. (“Alveo”) for upscale lots, residential and office condominiums, Avida Land Corp. (“Avida”) for middle-income lots, house and lot packages, and residential and office condominiums, Amaia Land Corp. (“Amaia”) for affordable house and lot packages and residential condominiums, and BellaVita Land Corp. (“BellaVita”) for socialized house and lot packages. MCT Bhd. is a publicly-listed property developer in Malaysia engaged in land acquisition, planning, and development of residential condominiums for sale for middle income segment. MCT has a land bank of 417 acres located in Subang Jaya, Cyberjaya and Petaling Jaya. Ayala Land owns 66.3% in MCT Bhd.

S E C F O R M 1 7 - A 15
Commercial Leasing Commercial Leasing involves the development and lease of shopping centers through Ayala Malls, and offices, through Ayala Land Offices, co-working spaces through the “Clock In” brand, and standard factory buildings and warehouses under Laguna Technopark, Inc., and the development, management, and operation of hotels and resorts through AyalaLand Hotels and Resorts, Inc. and co-living spaces through “The Flats” brand.
Services Services include construction, property management, retail electricity supply and airline services. Construction of Ayala Land and third-party projects and land development is done through Makati Development Corporation (“MDC”). Property Management is done through Ayala Property Management Corporation (“APMC”). Retail electricity supply is done through Direct Power Services, Inc. (DPSI), Ecozone Power Management, Inc. (EPMI), and Philippine Integrated Energy Solutions, Inc. (PhilEnergy). Airline service is done through AirSWIFT for Ayala Land’s tourism estates in Lio, Palawan and Sicogon Island resort through its fleet of four modern turbo-prop aircrafts. Strategic Investments Ayala Land’s strategic investments include AyalaLand Logistics Holdings Corp. (71.68%) Cebu Holdings, Inc. (71.13%), OCLP Holdings, Inc. (21.01%), MCT Bhd., (66.3%) Qualimed (40.0%) and Merkado Supermarket (50.0%). Products / Business Lines (with 10% or more contribution to 2019 consolidated revenues before intercompany adjustments):
Property Development 71% Commercial Leasing 24% Services 5%
Distribution Methods of Products The Company’s residential products are distributed to a wide range of property buyers through various sales groups. Ayala Land has its own in-house sales team for ALP projects. In addition, it has a wholly-owned subsidiary, Ayala Land Sales, Inc. (“ALSI”), which employs commission-based sales people. Ayala Land uses a sales force of about 15,000 brokers and sales agents guided by a strict Code of Ethics. Separate sales groups have also been formed for Alveo, Avida, Amaia and BellaVita. Ayala Land and its subsidiaries also tap external brokers to complement these sales groups. Marketing to the Overseas Filipino (“OF”) market is handled by Ayala Land International Sales, Inc. (“ALISI”). Created in March 2005, ALISI leads the marketing, sales and channel development activities and marketing initiatives of the brands abroad through project websites, permanent sales offices or broker networks, and regular roadshows with strong follow-through marketing support in key cities abroad. ALISI has marketing offices in North America (Milpitas and San Francisco), Hong Kong, Singapore, Dubai, Rome, and London. ALISI likewise assumed operations of AyalaLand Int’l. Marketing in Italy and London, in 2014. In addition, the Ayala Group also developed “One Ayala,” a program which bundles the products and services of Ayala Land, BPI, and Globe Telecom, Inc. and gives access to potential Ayala Land clients overseas through BPI’s 17 overseas offices and 81 tie-ups. An Ayala Land-BPI Dream Deals program was also created to generate additional sales from the local market. Since 2008, all residential sales support transactions are undertaken by the shared services company Amicassa Process Solutions, Inc. (“APSI”) while all transactional accounting processes across the Ayala Land Group are handled by Aprisa Business Solutions, Inc. (“APRISA”) since 2010. Bankruptcy, Receivership or Similar Proceedings None for any of the subsidiaries and affiliates.

S E C F O R M 1 7 - A 16
Various diversification/ new product lines introduced by the company during the last three years The Flats Ayala Land opened its first co-living product, branded as “The Flats” in September 2018. It is located in Amorsolo, Makati and offers a total of 728 beds across 196 multiple occupancy rooms and communal spaces. The second branch was opened in January 2019 at 5th Ave. BGC which has a total of 1,316 beds and 375 rooms. Clock In In 2017, Ayala Land launched a co-working space product branded as “Clock In” with three operating branches in Makati and BGC. To date, it now has a total of 1,404 seats across 6,473 sq. meters of GLA with new branches in Vertis North, The 30th , Ayala North Exchange, Lio and Alabang Town Center. Standard Factory Buildings and Warehouses In 2018, Ayala Land started to offer standard factory buildings (SFB) and warehouses for lease inside industrial parks to capture the growing opportunities in manufacturing and logistics. Ayala Land has a total of 175,000 sq. meters of SFB and warehouse GLA across various locations such as Laguna Technopark, Cavite Technopark, the Tutuban complex in Manila, the Lepanto Ceramics facility in Laguna, and Alviera Industrial Park in Pampanga. Hospitals/Clinics Ayala Land entered into a strategic partnership with the Mercado Group in July 2013 to establish hospitals and clinics located in the Company’s integrated mixed-use developments branded as QualiMed. In 2014, QualiMed opened three (3) clinics in Trinoma, Fairview Terraces, McKinley Exchange Corporate Center, and Qualimed General Hospital in Atria Park, Iloilo while UP Town Center Clinic in Quezon City was opened in the end of 2015. In the 2nd Quarter of 2016, Qualimed opened a hospital in Altaraza San Jose Del Monte Bulacan. In the 3rd Quarter of 2017, Qualimed opened its 102-bed hospital in Nuvali, Sta. Rosa, Laguna. Supermarkets ALI Capital Corporation (formerly Varejo Corporation), a subsidiary of Ayala Land, entered into a joint venture agreement with Entenso Equities Incorporated, a wholly-owned entity of Puregold Price Club, Inc., to develop and operate mid-market supermarkets for some of Ayala Land’s mixed-use projects branded as Merkado Supermarket. The first supermarket was opened in the 3rd quarter of 2015 at UP Town Center while its second store was opened in December 2017 at Ayala Malls Vertis North. Competition Ayala Land is the only full-line real estate developer in the Philippines with a major presence in almost all sectors of the industry. Ayala Land believes that, at present, there is no other single property company that has a significant presence in all sectors of the property market. Ayala Land has different competitors in each of its principal business lines. With respect to its shopping center business, Ayala Land’s main competitor is SM which owns numerous shopping centers around the country. Ayala Land is able to effectively compete for tenants given that most of its shopping centers are located inside its mixed-used estates, populated by residents and office workers. The design of Ayala Land’s shopping centers also features green open spaces and parks. For office rental properties, Ayala Land sees competition in smaller developers such as Kuok Properties (developer of Enterprise Building), Robinsons Land (developer of Robinsons Summit Center) and non-traditional developers such as the AIG Group (developer of Philam Towers) and RCBC (developer of RCBC towers). For BPO office buildings, Ayala Land competes with the likes of Megaworld, SM Prime Holdings and Robinsons Land. Ayala Land is able to effectively compete for tenants primarily based upon the quality and location of its buildings, reputation as a building owner and the quality of support services provided by its property manager, rental and other charges. With respect to residential lots and condominium products, Ayala Land competes with developers such as Megaworld, DMCI Homes, Robinsons Land, and SM Development Corporation. Ayala Land is able to effectively compete for purchasers primarily on the basis of reputation, price, reliability, and the quality and location of the community in which the relevant site is located. For the middle-income business, Ayala Land sees the likes of SM Development Corp, Megaworld, Filinvest Land and DMCI Homes as key competitors. Alveo and Avida are able to effectively compete for buyers based on quality and location of the project and availability of attractive in-house financing terms.

S E C F O R M 1 7 - A 17
For the affordable housing segment, Amaia competes with Camella Homes, DMCI Homes, Filinvest, Robinsons Land and SM Development Corporation. BellaVita, a player in the socialized housing market, will continue to aggressively expand its geographical footprint with product launches primarily located in provincial areas. Suppliers The Company has a broad base of suppliers, both local and foreign. The Company is not dependent on one or a limited number of suppliers. Customers Ayala Land has a broad market base including local and foreign individual and institutional clients. The Company does not have a customer that will account for twenty percent (20%) or more of its revenues. Transactions with related parties Please refer to Item 12 of this report (“Certain Relationships and Related Transactions). Government approvals/regulations The Company secures various government approvals such as the environmental compliance certificate, development permits, license to sell, etc. as part of the normal course of its business. Employees Ayala Land has a total workforce of 335 regular employees as of December 31, 2019. The breakdown as follows:
Senior Management 23 Middle Management 218 Staff 94
Total 335 Employees take pride in being an ALI employee because of the company’s long history of bringing high quality developments to the Philippines. With the growth of the business, career advancement opportunities are created for employees. These attributes positively affect employee engagement and retention. The Company aims that its leadership development program and other learning interventions reinforce ALI’s operating principles and provide participants with a set of tools and frameworks to help them develop skills and desired qualities of an effective leader. The programs are also venues to build positive relations and manage networks within the ALI Group. ALI has a healthy relation with its employees’ union. Both parties openly discuss employee concerns without necessity of activating the formal grievance procedure. Further, employees are able to report fraud, violations of laws, rules and regulations, or misconduct in the organization thru reporting channels under the ALI Business Integrity Program. Ayala Land is subject to significant competition in each of its principal businesses of property development, commercial leasing and services. In property development, Ayala Land competes with other developers to attract condominium and house and lot buyers. In commercial leasing, it competes for shopping center and office space tenants, as well as customers of the retail outlets, restaurants, and hotels and resorts across the country. However, Ayala Land believes that, at present, there is no single property company that has a significant presence in all sectors of the property market. Risks Ayala Land is subject to significant competition in each of its principal businesses. Ayala Land competes with other developers and developments to attract land and condominium buyers, shopping center and office tenants, and customers of retail outlets, restaurants, and hotels and resorts across the country. However, Ayala Land believes that, at present, there is no single property company that has a significant presence in all sectors of the property market.

S E C F O R M 1 7 - A 18
High-End, Middle-Income, Affordable Residential, and Economic and Socialized Housing Developments With respect to high-end and middle-income land and condominium sales, Ayala Land competes for buyers primarily on the basis of reputation, reliability, price, quality, and the location of the community in which the relevant site is located. For the affordable, economic and socialized housing markets, Ayala Land competes for buyers based on quality of projects, affordability of units and availability of financing. Ayala Land is also actively tapping the overseas Filipino market. In addition, it has seen demand from foreign buyers both residing in the country and abroad. Shopping Center, Office Space and Land Rental For its shopping centers, Ayala Land competes for tenants primarily based on the ability of the shopping center to attract customers. This is typically hinged on the location and the tenant-mix of the retail center, the reputation of the retail center owner, as well as rental and other charges. The market for shopping centers has become competitive and with the growing number of pipeline and new shopping center openings across the country. Some competing shopping centers are located within relatively close proximity of Ayala Land's commercial centers. With respect to its office rental properties, Ayala Land competes for tenants primarily based on the quality and location of the relevant building, reputation of the building's owner, quality of support services provided by the property manager, and rental and other charges. The Company is addressing the continuing demand from BPOs and corporate by providing fully integrated and well-maintained developments (high rise or campus facility) in key locations in the country. Hotel and Resort Operations The local hotel and resort sector is largely driven by foreign and local travel for leisure or business purposes. Any slowdown in tourism and business activity due to global financial and local political turmoil and security concerns could potentially limit growth of the Company's hotels and resorts. Construction Ayala Land's construction business, Makati Development Corporation (MDC), is benefiting from the improved performance of the construction industry, particularly from an uptick in development activities mostly from the residential and retail sector. With booming construction across the country, Ayala Land must manage the risk of providing enough skilled workers to deploy to its various projects. Any slowdown in the construction business could potentially cap growth of the Company's construction arm. Property Management Ayala Land directly manages its properties as well as other third-party properties through Ayala Property Management Corporation (APMC). Its employees directly interface with customers and must ensure that Ayala Land’s brand, quality and reputation are upheld in the regular upkeep of managed properties. Employees must continuously be trained to be able to provide high-quality service in order to preserve Ayala Land’s brand equity. Other risks that the company may be exposed to are the following: - Changes in Philippine and international interest rates - Changes in the value of the Peso versus other currencies - Changes in construction material and labor costs, power rates and other costs - Changes in laws and regulations that apply to the Philippine real estate industry - Changes in the country's political and economic conditions - Changes in the country’s liquidity and credit exposures To mitigate the above-mentioned risks, Ayala Land shall continue to adopt appropriate risk management tools as well as conservative financial and operational controls and policies to manage the various business risks it faces. Working Capital Ayala Land finances its working capital requirements through a combination of internally-generated cash, pre-selling, joint ventures agreements, borrowings and issuance of bond proceeds from the sale of non-core assets.

S E C F O R M 1 7 - A 19
Domestic and Export Sales The table below illustrates the amounts of revenue, profitability, and identifiable assets attributable to domestic and foreign operations for the years ended December 31, 2019, 2018, 2017: (in P’000)
2019 2018 2017
Consolidated revenues
Domestic 160,143,686 156,142,062 139,131,909
Foreign 6,561,646 7,604,756 241,432
166,705,332 163,746,818 139,373,341
Net operating income
Domestic 61,357,618 52,436,826 43,071,498
Foreign 1,228,417 1,129,534 (90,142)
62,586,035 53,566,360 42,981,356
Net Income Attributable to Equity Holders of ALI
Domestic 32,321,166 28,283,472 25,321,099
Foreign 867,233 957,408 (16,134)
Total 33,188,399 29,240,880 25,304,965
Total Assets
Domestic 678,162,085 636,521,219 564,182,334
Foreign 35,761,193 32,299,263 9,810,000
Total 713,923,278 668,820,482 573,992,334
For further information on ALI, please refer to its 2019 Financial Reports and SEC17A which are available in its website www.ayalaland.com.ph.

S E C F O R M 1 7 - A 20
MANILA WATER COMPANY, INC. Background and Business Manila Water Company, Inc. (alternately referred to as MWC, Manila Water, “the Company” or “the Group” in the entire discussion of Manila Water Company, Inc) holds the right to provide water and used water services to the eastern side of Metro Manila (Manila Concession or East Zone) under a Concession Agreement (CA) entered into between the Company and the Metropolitan Waterworks and Sewerage System (MWSS) in August 1997. The original term of the concession was for a period of 25 years to expire in 2022. The Company's concession was extended by another 15 years by MWSS and the Philippine Government in 2009, thereby extending the term from May 2022 to May 2037. The Company provides water treatment, water distribution, sewerage and sanitation services to more than six million people in the East Zone, comprising a broad range of residential, semi-business, commercial and industrial customers. The East Zone encompasses 23 cities and municipalities spanning a 1,400- square kilometer area that includes Makati, Mandaluyong, Pasig, Pateros, San Juan, Taguig, Marikina, most parts of Quezon City, portions of Manila, as well as the following towns of Rizal: Angono, Antipolo, Baras, Binangonan, Cainta, Cardona, Jala-Jala, Morong, Pililia, Rodriguez, San Mateo, Tanay, Taytay, and Teresa. Under the terms of the CA, the Company has the right to the use of land and operational fixed assets, and the right, as agent and concessionaire of MWSS, to extract and treat raw water, distribute and sell water, and collect, transport, treat and dispose used water, including reusable industrial effluent discharged by the sewerage system in the East Zone. The Company is entitled to recover over the concession period its operating, capital maintenance and investment expenditures, business taxes, and concession fee payments, and to earn a rate of return on these expenditures for the remaining term of the concession. Aside from the Manila Concession, the Group has a holding company for all its domestic operating subsidiaries in Manila Water Philippine Ventures, Inc. (MWPV). Currently under MWPV are (1) bulk water supply businesses Manila Water Consortium, Inc. (MW Consortium), a subsidiary of MW Consortium - Cebu Manila Water Development, Inc. (Cebu Water), Davao del Norte Water Infrastructure Company, Inc. (Davao Water), a subsidiary of Davao Water - Tagum Water Company, Inc. (Tagum Water); (2) Water distribution and used water services businesses namely, Boracay Island Water Company (Boracay Water), Clark Water Corporation (Clark Water), Laguna AAAWater Corporation (Laguna Water), Filipinas Water Consortium Holdings Corp. (Filipinas Water), subsidiaries of Filipinas Water - Obando Water Company, Inc. (Obando Water), Metro Ilagan Water Company, Inc. (Ilagan Water), MWPV South Luzon Water Corp. (South Luzon Water) and Bulakan Water Company, Inc. (Bulakan Water), Calbayog Water Company, Inc. (Calbayog Water), North Luzon Water Company, Inc. (North Luzon Water) and Leyte Water Company, Inc. (Leyte Water). Another subsidiary of Manila Water is Calasiao Water Company, Inc. (Calasiao Water), a water supply project for the Calasiao Water District; (3) Business-to-business water and used water service businesses are comprised of Aqua Centro MWPV Corp. (Aqua Centro), Bulacan MWPV Development Corporation (BMDC), Manila Water Technical Ventures, Inc. (MWTV), and EcoWater MWPV Corp. (EcoWater); and (4) performance-based leakage reduction services are provided by Zamboanga Water Company, Inc. (Zamboanga Water) to the city of Zamboanga. Under MWPV is Estate Water, a division that operates and manages the water systems of townships developed by Ayala Land, Inc. The holding company for Manila Water's international ventures is Manila Water Asia Pacific Pte. Ltd. (MWAP). Under MWAP are two affiliated companies in Vietnam, namely Thu Duc Water B.0.0. Corporation (Thu Duc Water) and Kenh Dong Water Supply Joint Stock Company (Kenh Dong Water), both supplying treated water to Saigon Water Corporation (SAWAC0) under a take-or-pay arrangement. Also under MWAP are Saigon Water Infrastructure Corporation (Saigon Water), a holding company listed in the Ho Chi Minh City Stock Exchange, and Cu Chi Water Supply Sewerage Company, Ltd. (Cu Chi Water). Apart from its operations in Vietnam, MWAP has associates in Thailand and Indonesia through Eastern Water Resources Development and Management Public Company Limited (East Water), a fully integrated water supply and distribution company listed in the Stock Exchange of Thailand (SET), and PT Sarana Tirta Ungaran (PT STU), an industrial water supply operation in Indonesia, respectively. Lastly, Manila Water Total Solutions Corp. (MWTS), a wholly-owned subsidiary, handles after-the-meter products and services including pipe-laying, integrated used water services, the incubation of new sector businesses and the sale of Healthy Family Purified Water in five-gallon, 500-ml and 350-ml bottles in selected areas in Metro Manila.

S E C F O R M 1 7 - A 21
Manila Water Foundation, Inc. (“Manila Water Foundation”) is the corporate social responsibility arm of the enterprise. It aims to be the enabler of change that will uplift the quality of life of the base of the pyramid (BOP) communities through the provision of sustainable water and wastewater services. Please refer to the supplementary schedules on the relationships of the entities within the Group. The Concession The following are some of the key terms of the Concession Agreement with the MWSS:
• Term and Service Area of Concession. The Concession Agreement took effect on August 1, 1997 (“Commencement Date”) and will expire on May 6, 2037 or on an early termination date as provided therein. By virtue of the Concession Agreement, MWSS grants to the Company (as contractor to perform certain functions and as agent for the exercise of certain rights and power under RA No. 6234) the sole right to manage, operate, repair, decommission, and refurbish all fixed and movable assets (except certain retained assets) required to provide water delivery and sewerage services in the East Zone.
• Ownership of Assets. While the Company has the right to manage, operate, repair, decommission and refurbish specified MWSS facilities in the East Zone, legal title to these assets remains with MWSS. The legal title to all fixed assets contributed to the existing MWSS System by the Company during the concession remains with the Company until the expiration date (or the early termination date), at which time, all rights, titles and interests in such assets will automatically vest in MWSS.
• Ownership of the Company. Under the Concession Agreement, MWSS granted concessions to operate the system of waterworks and sewerage services referred to under RA No. 6234 to private-sector corporations at least 60% of the outstanding capital stock of which is owned and controlled by Philippine nationals. For this purpose, the Company monitors its foreign ownership to ensure that its outstanding voting capital is at least 60% owned by citizens of the Philippines or by corporations that are themselves at least 60% owned by citizens of the Philippines.
• Sponsor Commitment. Unless waived in writing by the MWSS-Regulatory Office, Ayala, as local sponsor, and United Utilities PLC, as international operator, are each required to own, directly or through a subsidiary that is at least 51% owned or controlled, at least 20% of the outstanding capital stock of the Company for the first five years (through December 31, 2002), and thereafter at least 10% each. At present, United Utilities PLC no longer holds any equity in the Company, whether direct or indirect.
• Operations and Performance. The Company has the right to bill and collect for water and sewerage services supplied in the East Zone. In return, the Company is responsible for the management, operation, repair and refurbishment of MWSS facilities in the East Zone and must provide service in accordance with specific operating and performance targets described in the Concession Agreement.
• Concession Fees. The Company is required to pay MWSS the following:
• Concession fees consisting of the peso equivalent of (i) 10% of the payments due under any MWSS loan that was disbursed prior to the Commencement Date; (ii) 10% of payments due under any MWSS loan designated for the Umiray-Angat Transbasin Project (UATP) that was not disbursed prior to the Commencement Date; (iii) 10% of the local component costs and cost overruns related to the UATP; (iv) 100% of the payments due under any MWSS designated loans for existing projects in the East Zone that were not disbursed prior to the Commencement Date and were awarded to third party bidders or elected by the Company for continuation; and (v) 100% of the local component costs and cost overruns related to existing projects in the East Zone; and
• Share in the annual operating budget of MWSS amounting to Php396 million each year subject to annual inflation adjustments. MWSS is required to provide the Company with a schedule of concession fees payable during any year by January 15 of that year and a written notice of amounts due no later than 14 days prior to the scheduled payment date of principal, interest, fees and other amounts due. Currently, MWSS gives monthly invoices to the Company for these fees.

S E C F O R M 1 7 - A 22
• Appropriate Discount Rate. The Company is entitled to earn a rate of return equal to the Appropriate Discount Rate (ADR) on its expenditures prudently and efficiently incurred for the remaining term of the concession. The ADR is the real (i.e. not inflation adjusted) weighted average cost of capital after taxes as determined by the MWSS Regulatory Office based on conventionally and internationally accepted methods, using estimates of the cost of debt in domestic and international markets, the cost of equity for utility business in the Philippines and abroad with adjustments to reflect country risk, exchange rate risk and any other project risk.
• Tariff Adjustments and Rate Regulation. Water tariff rates are adjusted according to mechanisms that relate to inflation, extraordinary events, foreign currency differentials and Rate Rebasing exercises.
• Early Termination. MWSS has a right to terminate the concession under certain circumstances which include insolvency of the Company or failure to perform an obligation under the Concession Agreement, which, in the reasonable opinion of the MWSS-Regulatory Office, jeopardizes the provision of essential water and sewerage supply services to all or any significant part of the East Zone.
The Company also has the right to terminate the concession for the failure of MWSS to perform an obligation under the Concession Agreement, which prevents the Company from carrying out its responsibilities or upon occurrence of certain events that would impair the rights of the Company.
• Reversion. On the expiration of the Concession Agreement, all the rights, duties and powers of the Company automatically revert to MWSS or its successors or assigns. MWSS has the option to rebid the concession or renew the agreement with the express written consent of the government.
• Joint Venture. Under the Concession Agreement, the Company and the concessionaire of the West Zone of Metro Manila, Maynilad Water Services, Inc. (“Maynilad”), were required to enter into a joint venture or other arrangement that identifies the responsibilities and liabilities of each with regard to the operation, maintenance, renewal and decommissioning of Common Purpose Facilities (CPF), as well as an interconnection agreement which governs such matters as water supply transfers between the East and West Zones and boundary definitions and identifies the responsibilities and liabilities of parties with regard to the management, operation and maintenance of certain interconnection facilities. Pursuant to this, the Concessionaires entered into the Common Purpose Facilities Agreement and the Interconnection Agreement in July 1997.
The Regulatory Office of MWSS The Concession Agreement also provided for the establishment of the MWSS Regulatory Office (MWSS –RO) under the jurisdiction of the MWSS Board of Trustees (MWSS-BOT), to monitor the operations of the Concessionaires. The MWSS-Regulatory Office is composed of five members with five-year term, and no member of the MWSS-Regulatory Office may have any present or prior affiliation with MWSS, the Company, or Maynilad. The MWSS-Regulatory Office is funded by MWSS through the Concession Fee payments of the Concessionaires based on a fixed amount as agreed in the Concession Agreement (CA). In the case of disagreement or disputes, the CA provides that major disputes between the Company and the MWSS-Regulatory Office be referred to an appeals panel consisting of two (2) members appointed by each of the MWSS-Regulatory Office and the Company and a third member appointed by the Chairman of the International Chamber of Commerce. Under the Concession Agreement, both parties waive their right to contest decisions of the appeals panel through the courts. Key Performance Indicators and Business Efficiency Measures The Concession Agreement initially set service targets relating to the delivery of services by the Company. As part of the Rate Rebasing exercise that ended on December 31, 2002, the Company and MWSS mutually agreed to amend these targets based on the Company’s business and capital investment plan accepted by the MWSS-Regulatory Office. In addition, the Company and MWSS adopted a new performance-based framework. This performance-based framework, designed to mimic the characteristics of a competitive market and help the MWSS-Regulatory Office determine prudent and efficient expenditures, utilizes Key Performance Indicators (KPI) and Business Efficiency Measures (BEM) to monitor the implementation of the Company’s business plan and will be the basis for certain rewards and penalties in every Rate Rebasing exercise. Fourteen KPIs, representing critical performance levels for the range of activities the Company is responsible for, relate to water service, sewerage and sanitation service and customer service. The

S E C F O R M 1 7 - A 23
BEMs are intended to enable the MWSS-Regulatory Office to evaluate the efficiency of the management and operation of the concessions and gauge progress toward the efficient fulfillment of the Concessionaire’s business plans. There are seven (7) BEMs relating to income, operating expenses, capital expenditures and NRW. The BEMs are evaluated for trends and annual forecasts. Amendments to the Concession Agreement The Concession Agreement was amended under Amendment No. 1 to the Concession Agreement executed on October 26, 2001 (“Amendment No. 1”). Amendment No. 1 adjusted water tariffs to permit adjustment for foreign exchange losses and reversal of such losses, which under the original Concession Agreement were recovered only when the concessionaire petitioned for an Extraordinary Price Adjustment (EPA). The Concession Agreement was further amended under the Memorandum of Agreement and Confirmation executed on October 23, 2009 wherein the Company and the MWSS agree to renew and extend the Concession Agreement for an additional period of fifteen (15) years from the year 2022 or until 2037, under the same terms and conditions. Organization The Organizational structure of the Company has the objective of decentralizing the locus of operating control to the Senior Leadership Team composed of the President, Chief Executive Officer and Chief Sustainability Officer, the Chief Operating Officer for Manila Water Operations, the Chief Operating Officer for New Business Operations, and the Chief Finance Officer, Treasurer, Compliance Officer and Group Director for Corporate Finance and Strategy. A. The Manila Water Operations Manila Water Operations (MWO) is responsible for the East Zone Business Operations and the Company’s Corporate Support Functions. It is headed by the Chief Operating Officer for Manila Water Operations. The East Zone Business Operations (EZBO) is responsible for ensuring that the Company meets the demand of all the customers in the East Zone, managing the drivers for revenue growth, delivering customer service, and building and maintaining community and stakeholder relationships. It is composed of the East Zone Business Area Operations, and East Zone Business Support.
• The East Zone Business Area Operations consists of the six (6) Business Areas (BAs) – Quezon City, Mandaluyong-Makati, Marikina, Pasig, Rizal, and Taguig. The area of operations of this Division covers the major business districts in Quezon City, Makati, Ortigas and Taguig, as well as the entire province of Rizal. The BAs are directly responsible for the processing of application for new water service connections, management of meter reading, billing and collection activities, and facilitation of complaints resolution and other after sales services, which form part of the end-to-end process of account management. They are also tasked to find specific business opportunities from different market segments. Their key mandates, as such, include the management of customer demand, differentiating touchpoints per customer type aligned with the specific needs of the customers and key accounts, geared towards achieving company targets on billed volume, revenue and customer centricity.
• The East Zone Business Support Division is composed of four (4) departments: Demand Forecasting and Total Management System (TMS) Management, Billing and Collection, Customer Service and Stakeholder Management, and Program and Policy Development. i. The Demand Forecasting and TMS Management Department is responsible for revenue
management, demand forecasting, provision of systems and analytical tools and performance management of all EZBO employees.
ii. The Billing and Collection Department ensures efficient meter reading to deliver quality
customer bills. It also provides collection support to the business areas through service provider management and payment facilities sourcing.
iii. The Customer Service and Stakeholder Management Department reviews and enhances
customer service processes and standards aimed to drive customer satisfaction. It regularly monitors customer centricity metrics to ensure that all customers’ concerns are attended to efficiently and effectively.

S E C F O R M 1 7 - A 24
iv. The Program and Policy Development Department handles policy development and
compliance as well as various engagement initiatives for the Group such as the EZBO rewards and recognition programs.
• The Business Areas and HQ departments aim towards driving the growth of the business, providing customer service at the grassroots, and building relationships with the community to ensure achievement of regulatory targets in terms of delivery of quality service to Manila Water customers.
The Corporate Support Functions are responsible for providing support to the entire organization. It leads in the development of enterprise-wide policies, plans, and programs. The following are the Corporate Support Functions: a. The Corporate Operations Group (COG) operates and maintains all of Manila Water’s water and
used water facilities. It constantly seeks ways to further improve the efficiency and reliability in managing all of Manila Water’s facilities by developing high quality operating standards, delivering innovative technology solutions and support, exploring new technologies and promoting a culture of a safe work environment while remaining compliant to environmental and regulatory standards. The COG is composed of Water Supply Operations, Used Water Operations, Corporate Business Resiliency, Operations Services, Technical Services and Concession Management System.
• From the La Mesa Dam, Water Supply Operations manages the water treatment facilities, pumping stations, service reservoirs, and the primary and distribution lines to provide 24/7 water supply at a reliability level of, at least, 99.99% while maintaining 100% compliance in water quality as defined in the Philippine National Standards for Drinking Water. It is also responsible for ensuring that water supply meets demand by means of accurate forecasting from source to production, despite variability in consumer demand or environmental pressures. The Water Supply Operations, in cooperation with counterparts from Maynilad, manages the Water Source or the Common Purpose Facilities (CPF), which includes headworks upstream of the La Mesa Dam (Angat Dam, Ipo Dam and the Novaliches portals). Water Source ensures that sufficient raw water allocation is maintained throughout the year.
• Used Water Operations manages the used water treatment facilities and lift stations to ensure that treated used water discharge is consistently compliant to environmental standards and is responsible for implementing the used water service expansion plan.
• The Corporate Business Resiliency (CBR) function is committed to developing a culture of preparedness, resiliency and continual improvement towards a world-class water service company, thus ensuring coordination, integration and alignment of national, local and company emergency plans and protocols. CBR enables Manila Water to immediately respond to emergencies, especially when there is a need to provide potable water to disaster-stricken areas. Through CBR, Manila Water is able to extend help even beyond its concession area by providing mobile water treatment assistance to various areas in the country. Moreover, since Manila Water operates a regulated business and by the nature of its business, it is exposed to threats that may disrupt major services, the Company adapted the ISO 22301:2012 – Societal Security – Business Continuity Management System. Under this system, Manila Water plans, establishes, implements, operates, monitors, reviews, maintains and continually improves a documented management system to protect against, reduce the likelihood of occurrence, prepare for, respond to, and recover from disruptive incidents when they arise.
• Technical Services is composed of four (4) departments: the Laboratory Services, Systems Analytics, Energy and Innovations, and Telemetry and Process Automation Departments.
(1) The Laboratory Services collects water samples daily from strategically located sampling
points all over the East Zone from water treatment facilities to the distribution and effluent samples from all used water facilities. The samples are tested for physical, chemical and microbiological parameters to ensure true world-class standards. Aside from being recognized by the Department of Health (DOH) and the Department of Environment and Natural Resources (DENR), the Laboratory is also ISO standards certified (ISO 17025, ISO 9001, ISO 14001, and OHSAS 18001). The department also actively contributes to process optimization towards improved operational control and efficiency.
(2) System Analytics Department facilitates operational data flow, consolidation, analytics
and general information architecture and provides relevant and timely notification,

S E C F O R M 1 7 - A 25
reporting, and escalation of operational information through the Operations Communications Center.
(3) The Energy and Innovations Department monitors power consumption, recommends
power-efficiency measures, and develops and implements strategies for the Company to avail of advantageous power rates in all its facilities. It also drives the enhancement of an innovative culture and the delivery of new or higher gains from core innovations or innovations related to water and used water operations towards better, more efficient delivery of outputs and services.
(4) The Telemetry and Process Automation Department is responsible for developing and
maintaining the operating facilities instrumentation, control and automation based on the operating philosophy. It also oversees the accurate, reliable and secured integration of vital operational data to a central repository with 24/7 remote access.
• Under Operations Services are four (4) departments: The Operations Management, Inventory Management, Maintenance Services and Fleet Management Departments:
(1) The Operations Management Department strategizes a unified management system to
ensure the effectiveness and efficiency of group targets and programs. Operations Management is accountable for the ISO certifications (Quality, Environment, Health and Safety) and serves as a framework in order to produce and promote well-balanced implementation of all policies and processes across the Corporate Operations Group including specific requirements of international standards (ISO 9001,ISO 14001, and OHSAS 18001). The department also ensures efficiency through continuous process improvement as well as financial and operational performance management.
(2) The Inventory Management Department is responsible for the strategic supply/inventory
planning and inventory management to ensure the adequate and timely provision of critical supplies and materials for the Company’s operations and project requirements. The department has established policies and procedures to respond to the requirements in a fast-paced environment aligned with the corporate goals and business needs with due regard to good governance.
(3) Maintenance Services is responsible for ensuring that assets of Manila Water are working
efficiently. This includes the monitoring, maintenance, repair, and/or replacement of assets and components that sustain the efficient operation of all operational, ancillary and office facilities. MSD efforts seek to enable the company to maintain efficient costs of Repair and Maintenance while maximizing the life expectancy and intended functionality of assets.
(4) The Fleet Management is responsible for the dispatch and maintenance of Company
vehicles and equipment. It also provides vehicle assistance during incidents / emergencies and special events of the Company.
• Concession Management System Department leads and drives the integration of MWO end to end processes and alignment of cross-functional policies and procedures aligned to business objectives. It also creates the standard for the development, management and compliance to processes, in accordance with internal/local policies, rules and regulations, and international standards (ISO).
b. The Corporate Human Resources Group (CHRG) is organized into four (4) core functions which focus on talent attraction, development, engagement and retention, and group partnership:
• Talent Acquisition, Organization Development and Succession Management Department is responsible for organization and job design, workforce planning, recruitment, succession and competency management
• People Engagement and Development Department drives programs that focus on people experience and connection, capability development, communication and change management, and performance management
• Total Rewards Management Department handles the design of rewards programs including employee recognition, and manages manpower cost

S E C F O R M 1 7 - A 26
• HR Business Partnership Department provides business-focused HR solutions to stakeholders, and handles labor relations, union management and employee discipline
c. The Corporate Project Management Group (CPMG) is tasked with the planning, design and
construction of all water, used water and network capital projects that are crucial for the Company to achieve regulatory commitments as stipulated in the Concession Agreement and Rate Rebasing plans. The careful delivery of projects, strict adherence to the target timelines, prudent and efficient cost and highest standards of quality and safety, is the basis for the achievement of corporate business objectives aligned with the sustainable expansion of services that improve people's lives and support regional economic growth. CPMG is organized for an integrated, collaborative approach to project execution. It is composed of seven (7) departments namely: Project Management, Construction Management, Engineering, Project Management Office, Project Stakeholder Engagement, Quality Assurance, and Safety Solutions.
• The Project Management Department is entrusted to manage the whole project-life cycle of capital expenditure programs of the Company. The department ensures timely, cost-efficient and quality delivery of all planned infrastructure projects.
• The Construction Management Department is tasked with managing the multi-billion project portfolio of the Company. Construction Managers (CMs) are accountable for keeping the project in line with time, cost and quality, safety and environmental standards by leading a cross-functional team that manages the numerous interconnected components of execution.
• The Engineering Department ensures the compliance of projects to established engineering standards by reviewing design concepts and cost estimates; conducting preliminary and detailed design, as necessary; spearheading the technical evaluation of technical proposals during bidding; design submissions during execution; and developing high-quality and cost-effective engineering standards that are used across the business. It is also at the forefront of studying the latest construction technologies and methodologies in view of value-engineering.
• The Project Management Office is responsible for (1) project control functions to support construction projects, (2) implementation of integrated project management system and facilitation of continuous improvement initiatives, (3) strengthening of project information and analytics, and (4) building systems to ensure project construction documentation and control.
• The Project Stakeholder Engagement Department ensures that the projects have the support of critical stakeholders such as local governments, national agencies and the public through proactive project pre-selling and relationship building that ensure timely and smooth resolution of any project concerns.
• The Quality Assurance Department is in charge of the development and implementation of quality management procedures and system across CPMG through (1) process documentation, including policy formulation and system rollout, (2) management of the Quality Execution Academy and, (3) review/analysis of quality execution metrics/statistics for continuous improvement of CMs.
• The Safety Solutions Department performs a vital role in ensuring that not only are Manila Water employees empowered to work safely, but also ensures that vendors and contractors are well-trained in keeping worksites safe for employees and the general public, especially during construction activities. This utmost regard for a safety environment and mindset has top management support and carried-out by its employees and contractors/vendors.
d. The Strategic Asset Management Group (SAMG) was formed to help the Company achieve the
optimal and sustainable delivery of services and profitability through the efficient and effective management and development of assets. The group is mandated to provide a comprehensive, holistic and integrated master plan that will address capital investments both for water and used water systems, the operation and maintenance of existing and new assets, and the rationalization and disposal of surplus assets.
To deliver these services, SAMG is organized into six (6) departments namely, Value Assurance, Portfolio Management, Strategic Asset Planning, Asset Management Asset Investment and Management Support, and Water Sources and Environmental Planning.
• The Value Assurance Department provides a holistic approach that will help ensure the delivery of the programs/projects’ ultimate goals through value analysis and risk assessment

S E C F O R M 1 7 - A 27
that facilitate faster decision-making and thus optimize capital expenditures/life cycle costs and satisfy stakeholders.
• The Portfolio Management Department is tasked to deliver the overall corporate capital expenditure portfolio according to the approved corporate master plan. The department manages the overall portfolio performance, identifies the right mix of projects to maximize overall benefits, and meets regulatory and business goals. The department provides comprehensive analysis for portfolio impact assessment and investment, recommending changes and adjustments required to meet the objectives. It ensures that project-related issues are corrected in a timely manner.
• The Strategic Asset Planning Department is entrusted to strategically plan, develop and calibrate the water and used water master plan, and capital and operational expenditure programs for all the businesses of the entire enterprise through conducting concept studies to determine the annual project list and providing technical justification for the approval of the corporate master plan.
• The Asset Management Department is in charge of optimizing financial and operational performance of assets at the least cost through risk-based, data driven strategies to deliver the Company’s service obligations.
• The Asset Investment and Management Support Department provides assistance to the whole group on policy development, process improvement and implementation of programs to enhance project life cycle and asset management principles. It also provides comprehensive analysis for capital investments to aid in the attainment of the Company’s business and regulatory commitments.
• The Water Sources and Environmental Planning Department is responsible for the development of new water resources and environmental master plan for all the businesses of the entire enterprise.
e. The Enterprise Stakeholder Engagement Group (ESEG) is the group that has the mandate in the Company to: (1) provide strategies, guidance and advisories for regulatory purposes; (2) lead the implementation of best practices, policies and processes to ensure compliance and performance; (3) lead strategic business, technical and financial management for regulatory compliance; and (4) manage the relationship with stakeholders.
The above mandates are carried out through the following four (4) departments: 1. Business Operations Regulation (BOR) Department; 2. Financial Regulation (FR) Department; 3. Technical Regulation (TR) Department; and 4. Public Policy Department. The Group, through its head and members, leads and monitors compliance particularly to the Concession Agreement and leads the Company’s interface with the MWSS. Necessary actions to fulfill the mandates include but are not limited to the following: 1. submission of reports, requirements and disclosures relating to compliance; 2. leading the discussions with the MWSS relating to the Company’s service obligations and targets; 3. producing and periodically updating business, technical and financial projections specifically used as bases for petitions submitted to the MWSS for quarterly, annual, and five-year tariff adjustments; 4. collaborating with the Company’s other groups for collation and analysis of data and vital information for the Company’s strategic guidance and direction; and 5. leading engagement on matters relating to the Company’s position on public policy issues, including but not limited to preparation of position papers, attendance in various policy fora/dialogues, hearings and establishing good will and relations with key government and non-government stakeholders.
f. The Corporate Strategic Affairs Group (CSAG) is responsible for creating consistent corporate
messaging and harmonizing communication channels that are aligned with the Company’s objectives in order to enhance its image and reputation and effectively connect with various customers and stakeholders. The group is composed of two (2) departments: The Advocacy and Research Department, and the Corporate Communications Department.
• The Advocacy and Research Department handles the ‘Lakbayan’ or Water Trail program as the Company’s information, education and communication program on water and used water appreciation. It also handles environmental advocacy programs such as ‘Toka Toka” which is the country’s first and only environmental movement focused on used water management. It is also in charge of building and differentiating the Manila Water brand through strategic communications research and development, and visual standards management.

S E C F O R M 1 7 - A 28
• The Corporate Communications Department handles the execution of the Company’s strategic as well as tactical and crisis communication programs through publicity, events and other stakeholder services. The department handles all Company publicity in the media (TV, radio, print and below-the-line), as well as media planning, relations and engagement. It is also responsible for ensuring a well-informed workforce through the development and implementation of relevant internal communications. Lastly, it handles the company’s digital media platforms on social media and web.
B. The New Business Operations and New Business Development Group The New Business Operations Group focuses on operating new subsidiaries and promoting organic growth in existing service areas while the New Business Development Group focuses on expanding services to unserved and underserved areas and market segments. Both groups leverage on existing products and services to create value and strategically expand to new geographies in the Philippines and in Southeast Asia, specifically in Vietnam, Indonesia, Myanmar, and Thailand. Products and services are intended to be delivered through the Manila Water Group’s wholly-owned subsidiaries, Manila Water Philippine Ventures, Inc. (MWPV), Manila Water Asia Pacific Pte. Ltd. (MWAP), and Manila Water Total Solutions Corporation (MWTS) to ensure sustained growth beyond the East Zone Concession. MWPV and MWAP are mandated to expand the business in the Philippines and in Southeast Asia, respectively. These geographical expansions are anchored on the core competencies of the Company developed and nurtured in the East Zone Concession and MWPV’s subsidiaries, Laguna AAAWater Corporation, Clark Water Corporation, Boracay Island Water Company, Inc., and Cebu Manila Water Development, Inc., among others. In 2016, MWPV has started to develop its own capability through the establishment of its operating division, Estate Water. Borne out of a strategic partnership with Ayala Land, Inc., Estate Water serves as MWPV’s vehicle to provide service to the non-municipal market segments. Outside the Philippines, the Manila Water Group has significantly gained traction in Vietnam, Indonesia, and Thailand, through MWAP and its Singapore subsidiaries, Manila Water South Asia Holdings Pte. Ltd., Kenh Dong Water Holdings Pte. Ltd., Thu Duc Water Holdings Pte. Ltd., Manila South East Asia Holdings Pte. Ltd., and Manila Water Thailand Holdings Pte. Ltd. The Manila Water Group remains the largest foreign investor in the Vietnam Water Sector through its affiliates/associates, Kenh Dong Water Supply Joint Stock Company, Thu Duc Water B.O.O. Corporation, Saigon Water Infrastructure Corporation, Asia Water Network Solutions Joint Stock Company, and Cu Chi Water Supply Sewerage Company Limited. MWPV has expanded its footprint in the Philippines through the addition of eleven (11) new projects in its portfolio. This includes a bulk water and septage management project with the City of Ilagan Water District (Isabela) and new concession projects in San Jose City (Nueva Ecija), Tanauan City (Batangas), Calbayog City (Samar), and Municipalities of Calinog and Lambunao (Iloilo). We have expanded our existing businesses and secured Pagsanjan and Victoria in Laguna, Bulakan and Balagtas in Bulacan, and Malasiqui, San Fabian, Manaoag, and Sta. Barbara in Pangasinan. Outside the Philippines, our Thailand (Eastern Water Resources Development and Management PCL or East Water) and Indonesia (PT Sarana Tirta Utama) investments started to contribute to the improved performance of our businesses. Lastly, MWTS handles after-the-meter products and environmental service offerings outside the conventional water value chain, and is in the business of producing and marketing the company’s packaged water business in Metro Manila under the Healthy Family Purified Drinking Water brand. C. The Corporate Finance and Strategy Group The Corporate Finance and Strategy Group (CFSG) is headed by the Chief Finance Officer and Treasurer. The Group is composed of four (4) divisions – Controllership, Accounting and Planning Division, Treasury and Enterprise Risk Management Division, Finance and Governance for Manila Water Asia Pacific Division, and Finance and Governance for Manila Water Philippine Ventures and Manila Water Total Solutions Division – and three (3) departments, Corporate Planning and Investor Relations, Tax Management, and Sustainability Development.
• The Controllership, Accounting and Planning Division is composed of the Controllership and Analysis Department, the Financial Accounting Department, the Concession Investment

S E C F O R M 1 7 - A 29
Accounting Department, and the Financial Planning Department. The division provides controllership and management reporting, financial and regulatory accounting, and financial planning services.
i. The Controllership and Analysis Department supports top management’s decision-making
processes through the provision of timely financial information and analysis, coordinated budget planning activities, and periodic review against plans of the Manila Water Operations and the Parent Company. The department is also responsible for the setting and management of financial related policies and performance management of the CFSG as well as handling special projects involving process and systems improvements.
ii. The Financial Accounting Department maintains and safeguards the integrity of the Company’s
computerized accounting system, books of accounts and processes to ensure the preparation of accurate and timely financial reports for the purpose of providing management, regulators and other stakeholders with financial information reflective of the Company’s true financial performance and condition. The department is ISO 9001:2015 certified and implements a Quality Management System which assures the consistent application of relevant accounting standards, policies, regulations and rules aimed at the continuous improvement of its processes.
iii. The Concession Investment Accounting Department is a multi-disciplinary group playing a key role in the Company’s regulatory compliance with MWSS. It is responsible for providing management and regulators with timely reports that are compliant with all applicable accounting and regulatory standards. In line with the Company’s obligations as concessionaire of the East Zone, it maintains records of the acquisition, status, and disposal/transfer of all fixed and movable assets of the Company. The department provides appropriate safeguards on capital disbursements of the Company and ensures that payments are carried out in accordance with contractual requirements, and consistent with internal policies and tax requirements. It is also responsible for the financial monitoring of capital projects as well as the secretariat function of the Capital Investment Committee.
iv. The Financial Planning Department is responsible for the overall budget preparation and
monitoring of the Manila Water Group. It provides financial analysis and reporting of the financial and operating performance of the enterprise and its subsidiaries. The Department is responsible for the preparation of the long-term financial plans of the Metro-Manila East Zone concession and the consolidated Manila Water Group. The Department monitors the performance of the various businesses of Manila Water and their contribution to the enterprise. It also provides financial advisory support to business development, capital investments, and other corporate initiatives. It handles the secretariat function of the New Business Investment Committee.
• The Treasury and Enterprise Risk Management Division, headed by the Deputy Group Treasurer and Chief Risk Officer, is composed of two (2) departments: Treasury Department, and Enterprise Risk Management Department. The division is responsible for the effective management of the Company’s cash resources and financing activities, and sustained implementation of enterprise risk and insurance programs. The division also provides treasury and risk advisory services across the Manila Water Enterprise.
i. The Treasury Department is responsible for the effective management of the Parent Company’s
cash resources, including collections and disbursements, through efficient liquidity planning and maximization of cash investments. It is also responsible in the capital raising activities of the Enterprise ensuring cost-efficient and timely closing of financing transactions. For the Parent Company, the Department also manages Manila Water’s concession fee obligations with MWSS and ensures compliance with loan reportorial requirements and covenants. For new businesses, the Department provides strategic advisory in terms of financing strategies and treasury operations, and support for subsidiaries’ banking requirements. In carrying out its functions, the Department maintains a sustainable and mutually beneficial relationship with its lenders and banking partners. It also maintains its ISO 9001:2015 Certification for Quality Management System ensuring transparency of operations and adherence with its risk-based policies. It is headed by the Treasury Department Head who directly reports to the Deputy Group Treasurer and Chief Risk Officer.
ii. The Enterprise Risk Management Department is responsible for developing risk management
tools, methodologies, and processes and leads the implementation and dissemination of ERM programs across the Manila Water Enterprise in coordination with the risk owners, the CRO

S E C F O R M 1 7 - A 30
and ERM Champions/ Partners/ Risk Officers of the business units. It is also responsible for managing the insurance programs of the Enterprise and for providing oversight of the insurance programs of the subsidiaries with the objective of making the programs cost-effective, risk-based and responsive to the Group’s needs. The integration of risk management with insurance ensures the effective development and application of risk transfer strategies for the Enterprise and its projects. The Insurance Management Section has successfully obtained its ISO 9001:2015 certification for Quality Management System (QMS) in 2018. The QMS certification is an affirmation of compliance to global best standards for insurance management. The Department is headed by the Chief Risk Officer and reports functionally to the Board Risk Oversight Committee and administratively to the Chief Finance Officer and Treasurer.
• The Finance and Governance for Manila Water Asia Pacific Pte. Ltd. (MWAP F&G) is responsible for the statutory reporting of the companies under the group as well as the management reporting and analysis of performance of investee companies. The division also ensures compliance with the taxation and financial reporting requirements of the regulatory agencies. MWAP F&G handles controllership functions which includes development and implementation of financial policies as well as the formulation of the budget and forward plans and monitoring the utilization of the budget. The division also provides corporate finance support to new business development activities and ensures the smooth and efficient operationalization of the finance and governance function in new entities.
• The Finance and Governance for Manila Water Philippine Ventures and Manila Water Total Solutions leads the finance and accounting operations of all local subsidiaries of Manila Water Company, Inc. The division ensures the preparation of accurate and timely financial reports to aid in top management’s decision-making process, as well as the implementation of effective financial systems and controls in all local subsidiaries. The division also leads the coordinated budget planning activities, and periodic review against plans of all local subsidiaries to ensure that over-all corporate goals are met. It is also responsible for building the capability of the new businesses to be able to manage and perform all finance-related operations such as, but not limited to, accounting, treasury, procurement, policy development, risk management and tax management.
The Corporate Planning and Investor Relations Department is responsible for supporting the Enterprise in crafting the organization’s strategic roadmap and driving the investor communication strategy. It has two main functional units, namely, Corporate Planning and Investor Relations. Corporate Planning supports top management in charting the strategic roadmap of the Enterprise, and in aligning the execution of its various initiatives. This support is extended to the rest of the organization through the development and provision of market and industry information; coupled with the prioritization and alignment of strategic actions. Equally important, Corporate Planning aims to provide support to the actual execution of Enterprise strategies, through the Enterprise Program Management Office (EPMO) – which oversees execution inter-dependencies of Enterprise projects; and correspondingly through implementation of an enterprise-wide Performance Management System. Investor Relations (IR) supports top management in driving the organization’s investor communication strategy through timely investor and market analysis, efficient coordination of Enterprise information and effective key message development and delivery. For this purpose, IR conducts regular analysts’ briefings, meetings and roadshows with shareholders, fund managers and analysts to keep them updated on the financial and operating performance of the Company, as well as other relevant material information.
• The Tax Management Department provides strategic assistance to the different business and support units of the Company on matters relating to all taxes and tax incentives applicable in the Company’s operations and growth initiatives. The department also provides a focused analysis, interpretation, and application of relevant tax laws, rules and regulations, and advocates for process and policy improvements to ensure compliance with all reportorial requirements of the Bureau of Internal Revenue, Board of Investments, and pertinent local government units and government agencies.
• The Sustainability Department ensures that Manila Water’s implementation of projects and operations of facilities are compliant with current environmental regulations and aligned with the Company’s sustainability commitments. It incubates sustainability programs such as resource efficiency, communications and advocacy initiatives that are intended for institutionalization among the responsible business units. The department keeps track of the material sustainability indicators of the enterprise and in coordination with Investor Relations, is responsible for the preparation of the Company’s annual Integrated Report.

S E C F O R M 1 7 - A 31
D. Business and Technology Services The Business and Technology Services Group (BTS) is responsible for providing core support to Manila Water enterprise initiatives towards greater efficiency and growth. It is accountable for the delivery of IT solutions, infrastructure and information security, and for the provision of shared services including HR operations, accounts payable, general ledger and procurement.
• The BTS Governance Department is responsible for strategic planning and performance management, transition and service delivery support, and business relationship and stakeholder management functions. It also handles the oversight functions on program management, risk and compliance management, and other IT processes.
• The HR Operations Domain oversees payroll processing, benefits administration and the HR integrated system. Its duties include the delivery of timely, accurate and complete compensation and benefits, as well as up-to-date employee profile and information.
• The Supply Chain Domain provides sourcing, procurement, contract drafting, and vendor management services. It is responsible for procuring services, materials and supplies with due consideration to quality, efficiency and cost-effectiveness. It also employs strategic sourcing and category management approach to adapt to changing market conditions and address the growing needs of the business.
• The Finance Domain provides accounts payable and general ledger processing enabled by technology to deliver a high quality of standard-based finance services. It supports the provision of appropriate safeguards on disbursements ensuring that payments for goods and services are carried out in accordance with the applicable internal policies and tax requirements. It also supports the preparation of timely and accurate financial reports consistent with the application of relevant standards and policies.
• The IT Service Management Domain oversees the day-to-day operations of IT services including the availability, performance, and capacity of IT resources. It is responsible for the development of tactical plans in the deployment of hardware, operating systems, and data networks, in order to meet business-driven service levels and business continuity requirements.
• The Information Security Department is in charge of developing and enforcing the enterprise-wide IT security strategies, policies, standards, procedures and awareness program, and ensuring compliance with relevant information security standards. It also implements and maintains technical and procedural controls to protect information flow across networks.
• The Infrastructure Planning and Delivery Department looks after the infrastructure planning and design, infrastructure deployment, and data network connectivity, and carries out demand management, project management and delivery of IT infrastructure projects.
• The Systems and Solutions Department is responsible for the development and maintenance of all projects and systems supporting the business. It is in charge of identifying, designing, and delivering technology solutions and applications that support the success of the business.
E. Legal The Legal and Corporate Governance Department (“Legal”) provides legal services, advice and support across the entire organization. It proactively ensures that the Company is fully compliant with all the applicable laws, rules and regulations, and defends and protects the Company’s interests in the courts, administrative agencies and other tribunals. It is also responsible for the drafting and reviewing of contracts and other legal documents to ensure that they are advantageous to the Company and do not infringe any law, domestic or foreign, or any government rules and regulations. Its functions likewise include the provision of guidance and assistance through the entire process of acquiring properties, maintenance of existing rights-of-way, and acquisition of rights-of-way required for the implementation of water and used water projects. In matters of corporate governance, the Legal Department ensures that the Company adheres to the compliance, reporting and disclosure requirements of the Securities and Exchange Commission and the Philippine Stock Exchange for publicly listed companies, and to international standards of good corporate governance and practices. The department continuously orients all employees and business partners regarding the Company’s governance policies, particularly on matters relating to fair business dealings as well as the prompt and adequate disclosure of material information. It also provides corporate secretarial services to the Board of Directors and the Board

S E C F O R M 1 7 - A 32
Committees and assistance to the Office of the Corporate Secretary in the preparation and conduct of the stockholders’ meeting and board meetings. F. Internal Audit
The Internal Audit (IA) team conducts an independent, objective assurance and consulting activity designed to add value and improve the organization's operations. It helps the organization accomplish its objectives by bringing a systematic, disciplined approach to evaluate and improve the effectiveness of risk management, control, and governance processes.
The IA reports to and supports the Audit Committee in the effective discharge of the Committee's oversight roles and responsibilities. The IA conducts its activities guided by the Institute of Internal Auditors’ (IIA) Professional Practices Framework consisting of the International Standards for the Professional Practice of Internal Auditing (Standards), the Definition of Internal Auditing and the Code of Ethics. In December 2017, the external auditing firm Punongbayan & Araullo conducted an independent validation of the internal audit function's Quality Assessment Review (QAR) and concurred that the internal audit activity "Generally Conforms" to the International Professional Practice Framework (IPPF) and its mandatory elements namely: (1) Core Principles for the Professional Practice of Internal Auditing; (2) Definition of Internal Auditing; (3) Code of Ethics; and, (4) International Standards for the Professional Practice of Internal Auditing (Standards). The rating is considered the highest possible rating per Institute of Internal Auditors (IIA) methodology.
Water Operations The whole water supply chain generally involves the abstraction of water from water sources, treated subsequently through the water treatment facilities, and conveyed and distributed to customers through the Company’s network of pipelines, reservoirs, and pump stations. In 2019, the Manila concession supplied an average of 1,514.55 million liters per day (MLD) of clean and potable water to its customers and billed a corresponding volume of 493.94 million cubic meters (MCM). This is equivalent to a total of 1.075 million water service connections or approximately 6.7 million served population. Water Source Under the Concession Agreement, MWSS is responsible for the supply of raw water to the Company’s distribution system and is required to supply to the Company a maximum quantity of water, currently pegged at 1,600 MLD. In case MWSS fails to supply the required quantity, the Company is required to distribute available water equitably. The Company substantially relies on surface waters coming from the Angat River System. The principal river, Angat River, originates from the Sierra Madre Mountains. It has three major tributaries namely the Talaguio, Catmon and Matulid Rivers. The surface waters from these sources are collected and impounded through the Angat Dam, conveyed subsequently through the Ipo Dam where water is diverted through tunnels to Bicti and Aqueducts to La Mesa. Meanwhile, the Company’s Treatment Plant in Cardona, Rizal sources water from the Laguna Lake. To date, ground-source water supply increased to an average of 34 MLD with a max of 58 MLD at the height of dry season. These deep wells are part of the companies’ contingency plan to alleviate the water shortage. These wells are a combination of old rehabilitated wells scattered across the east zone and new drilled wells situated near our reservoirs. Water Treatment Raw water is stored at the La Mesa reservoir located immediately downstream of the Novaliches portal interconnection before going to the three (3) major treatment plants - two (2) of which are in Balara located seven (7) kilometers away from the reservoir and the third is nestled just at the northeast of La Mesa Dam. The Balara treatment plants have a total design capacity of 1,600 MLD and consist of two (2) separate treatment systems: Balara Treatment Plant 1 (BTP1) which was commissioned in 1935 having a design capacity of 470 MLD and Balara Treatment Plant 2 (BTP2) which was commissioned in 1958 with another 1,130 MLD. The East La Mesa Treatment Plant (ELMTP), on the other hand, is located in Payatas, Quezon City. Relatively new to the system, the facility began its operation in June 2012. It has a capacity of treating

S E C F O R M 1 7 - A 33
150 MLD of water. It supplies water to far-flung expansion areas in the Rizal province, improving the supply balance of the entire network. The above treatment plants use a conventional treatment process which involves coagulation, flocculation, sedimentation, filtration and chlorination. The facilities consume higher quantities of chemicals during the rainy season when the turbidity of raw water increases, which consequentially leads to increased costs of treatment operations. The Company’s Treatment Plant in Cardona became operational in March 2019 and as of December 2019 provides 98 MLD of water to the towns of Taytay, Angono, Binangonan, Cardona, Baras, Pililia and Jalajala in the Rizal province. The Cardona Treament Plant uses several advanced technical processes to ensure safe treated water given that it extracts raw water from Laguna Lake. Based on raw water data, raw water characteristics are “difficult” with high variation and fluctuations in the various parameters like salinity, organic matters and turbidity, making the water treatment process much more complex than a typical surface water. These techniques include pre-ozonation, Actiflo® settlers and Actiflo® CARB, dual media filters, reverse osmosis and post chlorination. It also includes raw water intake structures, raw water pump station, waste treatment facility, process optimization research facility as well as storage reservoir and distribution pipelines. Another treatment plant was constructed and put into operation in June 2019 to cater to the needs of the upper barangays of Quezon City affected by the water supply deficit experienced in Q1. This is the Luzon Water Treatment Plant which gets water from AQ2, one of the aqueducts from Lamesa Dam going to the Balara Treatment Plants. The treatment process used is an ultrafiltration system, which is different from the conventional treatment employed by BTP 1, BTP 2, and ELMTP. Ultrafiltration is a type of membrane filtration process wherein pressure-driven raw water passes through a semi-permeable membrane, of very small pore size, enough to separate suspended solids, endotoxins, bacteria, viruses, and other pathogens. The filtered water has most turbidity removed, thus it has high purity and low silt density. Water Distribution After treatment, water is conveyed through the Company's network of pipelines, pumping stations and reservoirs, and mini-boosters to bring potable water to its customers conveniently at set pressure standards. As of December 31, 2019, 78.61% percent of currently served areas have a water supply pressure of 7 psi and above. The lower than target of 98% water availability at 7psi was the result of the reduction in raw water allocation from Angat that necessitates scheduled water interruption for the entire East Zone and also to protect whatever raw water is available for next year. As of December 31, 2019, the Company's network consisted of approximately more than 5,116 km of total pipeline, comprising of primary, secondary and tertiary mains ranging in diameter from 50 to 2,200 mm. The pipes are made of steel, cast iron, high-density polyethylene (HDPE), polyvinyl chloride (PVC) and other materials. From the start of the concession in 1997 until the end of 2019, the Company has laid almost 4,892 km of pipeline for service expansion or pipe replacement or rehabilitation. Pumping stations also play a critical part in water distribution. Approximately 66% of the treated water supplied by the Company is pumped to ensure pressure compliance especially for the highly elevated areas. Currently, the Company operates twenty one (21) pumping stations with a combined maximum pumping capacity of 3,100 MLD and an average plant output of around 1270 MLD. Most of the major pumping stations have reservoirs with a combined capacity of almost 550 ML. The Company operates forty six (46) line boosters to reach the fringe areas, which are quite distant from the treatment plants and pumping stations. At the height of the water supply shortage, a total of 68 line boosters were operated by the Company. Line boosters typically are small facilities aimed at augmenting water supply for areas that are not sufficiently supplied during the regular pumping operations of the pump stations. Non-Revenue Water (NRW) NRW refers to the volume of water lost in the Company’s distribution system due to leakage, pilferage, illegal connections and metering errors. As determined by the MWSS-Regulatory Office, NRW is calculated as the percentage of water lost against the net volume of water supplied by the Company. Over the years, the Company has delivered remarkable strides in managing its NRW. The concession started with a high system loss of 63% in 1997. In 2010, its NRW level is reduced to and maintained at just 11%. Year-end figure for 2019 was recorded at 10.37%. Continuous improvements of water supply

S E C F O R M 1 7 - A 34
management coupled with massive pipe replacement projects were done to maintain and improve the reduction of Company’s system losses. Water Quality Raw water quality from Angat, Bicti, Ipo and La Mesa as well as Laguna Lake is regularly tested by the laboratory to assess any changes to raw water quality over time. This source monitoring provides early warning of potential raw water quality problems in terms of Microbiological and Physico-chemical (Inorganic and Organic constituents). Aside from source monitoring, routine monitoring of raw water at the treatment plant inlet is conducted on a daily to weekly basis for operational control to effectively and efficiently manage treatment process operation. These routine monitoring include Microbiological and selected Physico-chemical parameters. Raw water from Laguna that is treated at the Cardona Water Treatment Plant is also monitored. The Company’s water quality consistently meets the Philippine National Standards for Drinking Water (PNSDW) set by the Department of Health (DOH) and based on World Health Organization (WHO) water quality guidelines. To ensure that water supplied at the tap is safe to drink, stringent water quality monitoring is also continuously implemented at the treatment plants and throughout the distribution system. From the results of analysis conducted, water quality has always been maintained compliant based on the Microbiological, Physical and Chemical standards at the customers taps. In 2019, the Company surpassed the required tests for Microbiological and Physico-chemical quality at the treatment plant outlet, facilities and reservoirs annually. Continuous monitoring of water quality indicators throughout the network is also conducted at the customers taps by with more than 40,000 tests annually are tested from samples collected at the 886 pre-identified sampling points located at various influence area. Regulatory sampling points are designated at strategic locations across the distribution system - where sampling is conducted daily by the Company. The MWSS-Regulatory Office, Local Government Units (LGUs) and DOH likewise collect random samples from these designated sampling points and have them tested by third party laboratories and designated government laboratories. The Company’s water samples scored an average water quality compliance of 100%, surpassing the threshold of 95% set in the PNSDW. In 1997, when the concession began, only 87% of water samples complied with these quality standards. The Company’s rating is based on a series of tests conducted regularly at these points within the East Zone. The samples collected are tested at Manila Water’s own Laboratory, which is accredited by the DOH and a recognized EMB-DENR testing laboratory. The Laboratory has also gained its recognition as an ISO/IEC 17025:2005 accredited laboratory, granted by the Philippine Accreditation Office, Department of Trade and Industry (DTI). These recognition and accreditations subject the laboratory to regular surveillance audits. Consistently, the Laboratory has gained excellent and satisfactory ratings on most proficiency testing programs it has participated through local and international proficiency testing program providers. In 2010, the Laboratory also gained IMS certifications for ISO 9001:2008, ISO 14001:2004 and OSHAS 18001:2007. These recognitions have gained the confidence of the MWSS-Regulatory Office, the DOH and DENR in the tests results that are regularly provided to them. Sewerage Operations The Company is responsible for the provision of sewerage and sanitation services through the operation of new and existing sewerage systems and a program of regular desludging of household septic tanks in the East Zone. Sewerage and Sanitation System Since 1997, the Company has significantly improved and expanded the limited used water infrastructure originally operated and maintained by the MWSS. Sewerage services are provided in areas where treatment facilities are available. Sewered areas currently include Quezon City and Makati. Parts of Manila, Taguig, Cainta, Pasig and Mandaluyong are also connected to sewer networks. The Company had few facilities for sewerage services in 1997. The Sewage Treatment Plant (STP) in Magallanes Village was then the largest treatment facility in the country with a 40 MLD capacity. The STP in Magallanes provides sewerage services to the Makati central business district and some residential villages. Prior to privatization, this facility had poor treatment efficiency and did not meet effluent quality standards. The Karangalan Bio-module in Karangalan Village was serving approximately 100 households but also produced substandard effluent quality before 1997. In addition

S E C F O R M 1 7 - A 35
to these facilities, an Imhoff tank in Phil-Am Village and thirty-one communal septic tanks (CSTs) in Quezon City were also turned-over by the MWSS to Manila Water in 1997. These facilities were then serving approximately 19,000 households only. Manila Water upgraded these facilities to meet the effluent standards set by the DENR. In 2001, the Company constructed two (2) pilot package plants to determine if they were feasible in terms of social, financial, and environmental aspects. These are located in Valle Verde Homes, Pasig, one of which serves approximately 100 households and another serves some 400 households of the housing project in Makati together with approximately 4,000 students and employees in Rizal Elementary School. With the success of the two (2) pilot STPs, the Company implemented the Manila Second Sewerage Project (MSSP) funded by World Bank. Under the MSSP, twenty-six (26) STPs were constructed. Sixteen (16) of these STPs were formerly CSTs and the rest are on-site STPs for medium and high rise housing establishments and for the University of the Philippines campus. Takeover and upgrade of the STP in Diego Silang, Taguig was also part of the MSSP. As part of its commitment to expand this service, the Company constructed and subsequently operated in 2008 under the Manila Third Sewerage Project (MTSP) two (2) Septage Treatment Plans (SpTPs) aimed at managing septic tank materials siphoned from the East Concession customers. A total of 77 desludging trucks are available daily for deployment to ensure the desludging service is rendered to the entire East Zone population over the next five (5) years. Since 1997, the Company has already provided desludging service to more than 1,000,000 households. The MTSP is a follow-up to the MSSP and has the ultimate objective of improving sewerage and sanitation conditions in the East Zone. It was developed as a means of achieving the Company’s sewerage and sanitation service targets. The remaining components of the MTSP include the construction of sewer networks and treatment plants in several locations in the East Zone including upgrading of existing communal septic tanks with secondary treatment levels. There were six (6) sewage and septage treatment plants that were constructed under MTSP. It was in this project that combined sewer and drainage system was implemented. Out of the six (6) facilities, four (4) employed this approach. In 2015, the Marikina North Sewage Treatment Plant and Liwasan ng Kagitingan at Kalikasan Sewage Treatment Plant became operational. These two facilities have a combined capacity of 175 MLD and are by far, the two biggest STPs of the Company. Another remarkable feature of the two (2) STPs is that both have the same treatment technology known as the Sequencing Batch Reactor (SBR) whereas the thirty-eight (38) facilities that were constructed under MSSP, MTSP and the take-over projects all employ the Conventional Activated Sludge treatment. As of end of 2019, the Company operates forty (40) used water facilities including the Marikina North and Liwasan ng Kagitingan at Kalikasan STPs, with a total capacity of 310MLD, compared to 40MLD in 1997. Customers who are not connected to the sewer network are provided with septic tank maintenance services through the “Sanitasyon Para Sa Barangay” (SPSB) program. Through cooperation with the barangays, the program aims to desludge all septic tanks in a barangay over a specified, set schedule. The environmental fees paid by customers cover the cost of desludging household septic tanks. For 2019, the Company has provided the service to 212,125 households which is equivalent to 117,441 septic tanks emptied. For the years covering 2017-2019, the total households provided with the desludging service were 597,172 equivalent to 334,447 septic tanks desludged. Furthermore, the average availment rate of the program has significantly increased through a more intensive Information, Education and Communication (IEC) program per barangay to educate customers of the East Zone about the importance of a properly maintained septic tanks. The technical assistance component focus on information and education campaigns on proper liquid waste disposal and environment preservation and the preparation of follow-up programs on sewerage and sanitation, with emphasis on low-cost sanitation systems. New Business and Investments The Manila Water Group further brings its expertise in water and used water services outside the East Zone Concession through partnerships with private companies, local water districts and local government units of major cities and municipalities in the Philippines, and emerging cities in Southeast Asia. Manila Water offers value-added services across the water value chain from source development

S E C F O R M 1 7 - A 36
to used water and sanitation services anchored on Public-Private Partnership (PPP) and Business-to-Business (B2B) models. Manila Water Group also execute several contracts related to the water business such as Performance-Based Contracts (PBCs) for NRW reduction, Bulk Water Supply arrangements, Property Management and Operation (Estate Water) models, Lease Agreements, and Operations and Maintenance Contracts. Furthermore, Merger and Acquisition (M&A) is extensively and aggressively used to support growth especially in the Southeast Asian Region. Towards this end, the Manila Water Group has signed joint venture agreements and/or investment agreements with local and international partners in the last few years. Laguna Water’s Concession Agreement with the Provincial Government of Laguna Laguna AAAWater Corporation (Laguna Water) is a Joint Venture (JV) between the Provincial Government of Laguna (PGL) and Manila Water Philippine Ventures, Inc. (MWPV) with shareholdings of 30% and 70%, respectively. On April 09, 2002, Laguna Water and PGL have entered into a Concession Agreement which grants Laguna Water (as contractor and as agent for the exercise of certain rights in Laguna) the sole and exclusive rights and discretion during the concession period to manage, occupy, operate, repair, maintain, decommission, and refurbish the identified facilities required to provide water services to specific areas for an operational period of twenty-five (25) years which commenced on October 20, 2004. In December 2013, Laguna Water signed an Asset Purchase Agreement with the Laguna Technopark, Inc. (LTI) for the acquisition of the water reticulation system of LTI in Laguna Technopark, a premier industrial park located in Sta. Rosa and Binan, Laguna, which houses the region’s largest and more successful light to medium non-polluting industries. On June 30, 2015, Laguna Water and the PGL signed an amendment to the concession agreement which expands the concession area to cover all cities and municipalities in the province of Laguna, as well as the service obligation to include the provision of wastewater services and the establishment of an integrated sewage and septage system in the province. In connection with the amendment to the concession agreement, the Sangguniang Bayan of the Municipality of Calauan, Laguna approved the resolution allowing Laguna Water to provide water and wastewater services to the municipality of Calauan. The provision of services by Laguna Water in the municipality of Calauan is being implemented in phases, with full coverage of the area targeted by the first quarter of 2020. Furthermore, the concession period’s commencement date was amended to have commenced on September 30, 2010 and shall end on September 30, 2035. On August 23, 2017, the Sangguniang Bayan of Victoria, Laguna has approved the inclusion of its municipality within the service area of Laguna Water. On July 12, 2018, Laguna Water received the Notice of Award from Pagsanjan Water District (PAGWAD) for the implementation of the contractual JV project for the design, improvement, upgrade, rehabilitation, and expansion of water supply and sanitation facilities including the financing and construction of such facilities and infrastructure in the service area of the PAGWAD, and the management, operation, and maintenance of such water supply and sanitation facilities and the provision of the services necessary or incidental thereto in the PAGWAD’s service area. On December 11, 2018, Laguna Water entered into four (4) Asset Purchase Agreements (APAs) with Extraordinary Development Corporate Group (EDCG)’s subsidiaries to acquire the subsidiaries’ assets related to or used in its water service provision operations in Biñan, Laguna. The APAs are with the following EDCG subsidiaries, namely, Earth Aspire Corporation, Earth Prosper Corporation, Earth and Style Corporation and Extraordinary Development Corp. Boracay Water’s Concession Agreement with Tourism Infrastructure and Enterprise Zone Authority Boracay Island Water Company, Inc. (Boracay Water) is a JV between Manila Water and Tourism Infrastructure and Enterprise Zone Authority (TIEZA), formerly Philippine Tourism Authority (PTA) with shareholdings of 80% and 20%, respectively. On December 17, 2009, Boracay Water entered into a concession agreement with TIEZA. The concession agreement grants Boracay Water the sole right to manage, operate, repair, decommission, and refurbish all fixed and movable assets (except certain retained assets) required to provide water delivery and sewerage services to the entire Boracay Island for a period of twenty-five (25) years commencing on January 1, 2010 until December 31, 2035.
S E C F O R M 1 7 - A 37
Clark Water’s Concession Agreement with Clark Development Corporation Clark Water Corporation (Clark Water) is the water and used water concessionaire of Clark Development Corporation (CDC) in the Clark Freeport Zone in Angeles, Pampanga. By virtue of an amendment agreement executed on August 15, 2014, the 25-year concession agreement with CDC was extended by another fifteen (15) years until October 1, 2040. In November 2011, Manila Water acquired 100% ownership of Clark Water through a Sale and Purchase Agreement with Veolia Water Philippines, Inc. and Philippine Water Holdings, Inc. MW Consortium Agreement with the Provincial Government of Cebu On March 21, 2012, Manila Water Consortium, Inc. (formerly, Northern Waterworks and Rivers of Cebu, Inc.) (MW Consortium), a consortium of Manila Water (51%), MetroPac Water Investments Corporation (39%) and Vicsal Development Corporation (10%), signed a Joint Investment Agreement (JIA) with the Provincial Government of Cebu (PGC) for the formation of a joint venture company. Under the JIA, the parties agreed to develop and operate a bulk water supply system that will supply 35 million liters of water per day to target areas in the province of Cebu with the joint venture company serving as a bulk water supplier. The term of the agreement is thirty (30) years starting March 2012 and renewable for another twenty-five (25) years. MW Consortium and the PGC incorporated Cebu Manila Water Development, Inc. (Cebu Water) with an ownership of 51% and 49%, respectively, pursuant to the JIA. On December 13, 2013, Cebu Water signed a 20-year Bulk Water Supply Contract with the Metropolitan Cebu Water District for the supply of 18 million liters per day of bulk water for the first year and 35 million liters per day of bulk water for years two (2) to twenty (20). Non-revenue Water (NRW) Reduction Activities in Zamboanga City On December 19, 2014, Manila Water received a notice from Zamboanga City Water District (ZCWD) awarding the project for NRW reduction in Zamboanga City. On January 30, 2015, Manila Water and ZCWD signed and executed a Joint Venture Agreement (JVA) in relation to the NRW reduction project in Zamboanga City. On April 10, 2015, Manila Water and ZCWD incorporated Zamboanga Water Company (Zamboanga Water) with an ownership of 70% and 30%, respectively, to implement the NRW project. On June 2, 2015, Zamboanga Water entered into an NRW Service Agreement (NRWSA) with ZCWD. Under the NRWSA, ZCWD grants Zamboanga Water the right to implement Network Restructuring and NRW Reduction Programs for ZCWD’s water distribution system. On July 2, 2018, through a Deed of Absolute Sale of Shares, the Parent Company sold to MWPV, its wholly owned subsidiary, its shares in Zamboanga Water. Bulk Water Supply Agreements between Davao Water and Tagum City Water District On July 28, 2015, Tagum Water District (TCWD) awarded the Tagum City Bulk Water Supply Project to Davao del Norte Water Infrastructure Company, Inc. (Davao Water), a consortium of Manila Water and iWater, Inc. On October 15, 2015, Davao Water has signed and executed a JVA with TCWD. The JVA governs the relationship of Davao Water and TCWD as joint venture partners in the Tagum Bulk Water Project. Pursuant to the JVA, Davao Water and the TCWD caused the incorporation of a joint venture company, namely, Tagum Water Company, Inc. (Tagum Water), which shall implement the Tagum Bulk Water Project for fifteen (15) years from the Operations Start Date as defined in the JVA. The Davao Water owns 90.00% while TCWD owns 10.00% of Tagum Water’s outstanding capital stock. Tagum Water was registered with the SEC on December 15, 2015 and its primary purpose is to develop, construct, operate and maintain the bulk water supply facilities, including the development of raw surface water sources, water treatment, delivery and sale of treated bulk water exclusively to TCWD. On February 26, 2016, Tagum Water and TCWD signed and executed a Bulk Water Sales and Purchase Agreement for the supply of bulk water to TCWD for a period of fifteen (15) years from the Operations start date. On May 23, 2018, through a Deed of Absolute Sale of Shares, the Parent Company sold to MWPV its shares in Davao Water.

S E C F O R M 1 7 - A 38
Estate Water, Aqua Centro MWPV Corporation and EcoWater MWPV Corporation On January 15, 2016, MWPV entered into a MOA with Ayala Land, Inc. (ALI) and its subsidiaries (collectively, the ALI Group), whereby MWPV shall exclusively provide water and used water services and facilities to all property development projects of the ALI Group. This MOA is implemented through Estate Water, a division of MWPV. On December 8, 2016, MWPV entered into MOAs with each of SM Prime Holdings Inc.’s and the latter’s affiliates and subsidiaries, SM Development Corporation and SM Residences Corp. (collectively, the SM Group). Pursuant to the MOA, MWPV will provide the water and/or used water services and facilities to the property development projects of the SM Group identified in each of the MOA. On October 5, 2017, Aqua Centro MWPV Corporation (Aqua Centro) was incorporated to handle property development projects, other than those within the ALI Group, by engaging in the development, improvement, maintenance, and expansion of water, sewerage, wastewater, and drainage facilities, and provide services necessary or incidental thereto. December 28, 2017, MWPV entered into a Novation Agreement with the SM Group and Aqua Centro to transfer its rights, duties and obligations to provide water and/or used water services and facilities to the property development projects of the SM Group to Aqua Centro, effective from the inception of the MOA. As of December 31, 2018 and 2017, Aqua Centro has six (6) and four (4) signed MOAs with the SM Group, respectively. MWPV has one (1) signed MOA with SM Group as of December 31, 2018 and 2017. On December 18, 2017, MWPV signed a twenty-five (25) year lease agreement with the Philippine Economic Zone Authority (PEZA). Pursuant to the agreement, MWPV will lease, operate, and manage the water and used water facilities of PEZA in the Cavite Special Economic Zone (CEZ) for the provision of water and used water services to the locators therein. MWPV shall apply its expertise in the industrial zones operations and shall provide capital expenditures for the duration of the agreement. On July 27, 2018, MWPV incorporated EcoWater MWPV Corporation (EcoWater) which will eventually handle the Lease Agreement for the Operations and Management of the Water and Used Water Facilities of PEZA in CEZ. On December 11, 2018, Aqua Centro entered into seven (7) Asset Purchase Agreements (APAs) with Extraordinary Development Corporate Group (EDCG)’s subsidiaries to acquire the subsidiaries’ assets related to the provision of water service in ten (10) subdivisions in Imus, General Trias, and Naic in the province of Cavite. These subsidiaries are Earth Aspire Corporation, First Advance Development Corporation, Ambition Land Inc., Prosperity Builders Resources Inc., Tahanang Yaman Homes Corporation, Extraordinary Development Corp., and Earth + Style Corporation. As of December 31, 2018, Aqua Centro has already started operations in six (6) out of the ten (10) subdivisions. Aqua Centro shall operate in the remaining subdivisions once all the conditions precedent under the APAs have been fulfilled. Bulacan MWPV Development Corporation and its Asset Purchase Agreements On January 4, 2017, MWPV entered into an Asset Purchase Agreement (APA) with Asian Land Strategies Corporation (Asian Land) to acquire and operate the latter’s assets used in the water business operations in Asian Land’s developments in the province of Bulacan. The intention of MWPV was to assign the rights under the APA to its wholly owned subsidiary upon its incorporation. On April 11, 2017, Bulacan MWPV Development Corporation (BMDC) was incorporated to design, construct, rehabilitate, maintain, operate, finance, expand, and manage water supply system and sanitation facilities. BMDC is the ultimate entity that will own and operate the assets acquired from Asian Land. On July 31, 2017, MWPV assigned all its rights and obligations on the APA to BMDC, a wholly-owned subsidiary of MWPV, under a Deed of Assignment. On the same day, the Deed of Absolute Sale was also executed between Asian Land and BMDC. On July 26, 2017, BMDC entered into an APA with Solar Resources, Inc. (Solar Resources) to acquire and operate the latter’s assets used in the water business operations in Solar Resources developments in the province of Bulacan. On the same day, Solar Resources executed a Deed of Absolute Sale to sell and transfer its properties pertaining to water facilities and its operations in the Las Palmas Subdivisions Phases 1 to 7 to BMDC.

S E C F O R M 1 7 - A 39
On December 14, 2017, BMDC and Borland Development Corporation (Borland) executed the APA, Deed of Assignment, and Deed of Absolute Sale between the parties for the sale, assignment, transfer, and conveyance of Borland’s assets pertaining to water facilities and its operation in San Vicente Homes subdivision in Bulacan. Calasiao Water’s Concession Agreement with Calasiao Water District On December 9, 2016, the Manila Water received a Notice of Award from Calasiao Water District (CWD) for the implementation of the joint venture project for the design, construction, rehabilitation, maintenance, operation, financing, expansion and management of the water supply system of CWD in Calasiao, Pangasinan. On June 19, 2017, Manila Water signed a JVA with CWD which will govern the relationship of the two in undertaking the joint venture project. Under the JVA, Manila Water and CWD shall cause the incorporation of a joint venture company where Manila Water and CWD shall own 90% and 10%, respectively, of the outstanding capital stock. On August 2, 2017, the SEC approved the incorporation of Calasiao Water Company, Inc. (Calasiao Water) On October 23, 2017, Calasiao Water and CWD signed and executed a concession agreement that grants Calasiao Water, the sole right to develop, manage, operate, maintain, repair, decommission, and refurbish all fixed and movable assets (except certain retained assets) required to provide water delivery in the entire Municipality of Calasiao for a period of twenty-five (25) years commencing on December 29, 2017. Filipinas Water Consortium Holdings Corp. and Its Partnerships On January 24, 2017, the consortium of Manila Water and MWPV received the Notice of Award from Obando Water District (OWD) for the implementation of the joint venture project for the design, construction, rehabilitation, maintenance, operation, financing, expansion, and management of the water supply system and sanitation facilities of OWD. February 2, 2017, Obando Water Consortium Holdings Corp. (now Filipinas Water Consortium Holdings Corporation, or Filipinas Water) was registered with the SEC. Filipinas Water is the consortium between the Parent Company and MWPV with an equity share of 49% and 51%, respectively. The primary purpose of Filipinas Water is to engage in the business of a holding company without acting as stockbroker or dealer in securities. On July 26, 2017, Filipinas Water signed and executed a JVA with OWD for the implementation of the project. Subsequently, on October 10, 2017, Obando Water Company, Inc. (Obando Water) was incorporated. Obando Water is 90% and 10% owned by Filipinas Water and OWD, respectively. The project includes a Concession Agreement (CA) which was executed on October 12, 2017 for the design, construction, rehabilitation, maintenance, operation, financing, expansion, and management of the water supply system and sanitation facilities of OWD in Obando, Bulacan for a period of twenty-five (25) years from the commencement date. On January 26, 2018, the consortium of Manila Water and MWPV received the Notice of Award from the City of Ilagan Water District (CIWD) for the implementation of a joint venture project for the development, financing, operation, and management of a raw water source, provision of bulk water supply with system expansion, and the development of septage management in the City of Ilagan, Isabela. On April 26, 2018, the consortium of Manila Water and MWPV received the Notice of Award from Bulakan Water District (BWD) for the joint venture project for the development, financing, design, engineering, construction, rehabilitation, upgrade, testing, commissioning, operation, management, and maintenance of water facilities and the provision of water and sanitation services in the Municipality of Bulakan. On August 16, 2018, Filipinas Water and the BWD entered into a JVA for the implementation of the project. On October 16, 2018, the joint venture company was incorporated and was registered with SEC under the name of Bulakan Water Company, Inc. (Bulakan Water). Bulakan Water is owned by Filipinas Water and BWD having an equity share of 90% and 10%, respectively. On November 16, 2018, Filipinas Water entered into a Joint Venture Agreement with CIWD for the implementation of the project. Upon completion of conditions precedent in the JVA, a JV Company will consequently enter into a Bulk Water Sales and Purchase Agreement and Septage Management Agreement with CIWD for the implementation of the Ilagan Project for twenty-five (25) years from the commencement date.

S E C F O R M 1 7 - A 40
MWPV JVA with Tubig Pilipinas Group, Inc. (TPGI) On December 11, 2017, the Municipality of Malasiqui granted a franchise to MWPV and Tubig Pilipinas Group, Inc. (TPGI) for the implementation of a joint venture project to establish, construct, operate, manage, repair, and maintain water supply and wastewater system and facilities in the municipality of Malasiqui, Pangasinan. The franchise has a term of twenty-five (25) years from the commencement date. On February 20, 2018, the board of directors of MWPV approved the creation of a SPV for this project. On November 16, 2018, MWPV has signed and executed a JVA with TPGI. Under the agreement, MWPV and TPGI shall incorporate a joint venture company, with 50% and 50% ownership, respectively, which shall implement the project. On December 21, 2018, the consortium of MWPV and TPGI received a Notice of Award from San Jose City Water District (SJCWD) for the implementation of the joint venture project for the design, construction, improvement, upgrade, rehabilitation, maintenance, operation, financing, expansion, and management of the water supply system and the provision of water and sanitation services of SJCWD in San Jose City, Nueva Ecija. Upon the completion of the conditions precedent specified in the notice of award, the consortium partners and the water district would enter into a JVA that will grant them as contractor to perform certain functions and as agent for the exercise of its right and powers, the sole right to develop, manage, operate, maintain, repair, refurbish and improve, expand and as appropriate, decommission, the facilities in the service area, including the right to bill and collect tariff for water and sanitation services supplied in the service area of SJCWD. Notice to Proceed from the Municipality of Sta. Barbara, Pangasinan On June 14, 2018, MWPV received a Notice to Proceed from the municipality of Sta. Barbara, Pangasinan following the enactment of the municipality’s ordinance granting a franchise to MWPV for the provision of water supply and the improvement, operation, maintenance, management, financing, and expansion of water supply facilities, and the provision of septage management in Sta. Barbara. The franchise shall be for a term of twenty-five (25) years and is expected to be operational by 2019. Notice to Proceed from the Municipality of San Fabian, Pangasinan On October 15, 2018, MWPV received a Notice to Proceed from the municipality of San Fabian, Pangasinan following the enactment of the municipality’s ordinance granting a franchise to MWPV to establish, construct, operate, manage, repair, and maintain water supply system and facilities, and the provision of septage management in the municipality of San Fabian, Pangasinan. The franchise shall be for a term of twenty-five (25) years and is expected to be operational by 2019. Notice of Award from Leyte Metropolitan Water District (LMWD) On December 6, 2017, the Manila Water received the Notice of Award from Leyte Metropolitan Water District (LMWD) for the implementation of the joint venture project (the Leyte Project) for the design, construction, rehabilitation, maintenance, operation, financing, expansion, and management of the water supply and sanitation facilities and services of LMWD in the Province of Leyte. The conditions precedent specified in the Notice of Award include the incorporation of a special purpose vehicle (SPV) which will implement the Leyte Project under a contractual joint venture with LMWD. Upon completion of the conditions precedent specified in the Notice of Award, the SPV and LMWD shall enter into a JVA that will grant the SPV, as contractor, to perform certain functions and as agent for the exercise of, the sole and exclusive right to manage, operate, maintain, repair, refurbish and improve, expand and as appropriate, decommission, the facilities of LMWD in its Service Area, including the right to bill and collect tariff for the provision of water supply and sanitation services in the Service Area of LMWD. LMWD’s service area covers the City of Tacloban and seven other municipalities namely Palo, Tanauan, Dagami, Tolosa, Pastrana, TabonTabon, and Santa Fe. Notice of Award from Balagtas Water District On April 25, 2018, a consortium of Manila Water and MWPV received the Notice of Award from Balagtas Water District (BWD) for the implementation of a joint venture project for the design, construction,

S E C F O R M 1 7 - A 41
rehabilitation, maintenance, operation, financing, expansion and management of the water supply system and sanitation facilities of BWD in the municipality of Balagtas, Bulacan. Notice of Award from Tanauan Water District On October 12, 2018, the Consortium of Manila Water and MWPV received the Notice of Award from Tanauan Water District (TWD) for the joint venture project for the design, construction, rehabilitation, maintenance, operation, financing, expansion, and management of the water supply and sanitation facilities and services in the service area of TWD in the City of Tanauan. On February 4, 2019, the Consortium and the Tanuaan Water District entered into a JVA for the implementation of the Project. Notice of Award from Lambunao Water District On November 27, 2018, the Parent Company received a Notice of Award from Lambunao Water District for a joint venture for the design, construction, rehabilitation, maintenance, operation, financing, expansion, and management of the water supply system of Lambunao Water District in the Municipality of Lambunao, Iloilo. Upon completion of conditions precedent specified in the notice, Manila Water and Lambunao Water District shall enter into a JVA, the implementation of the joint venture activity of which shall be undertaken by Aqua Centro. Notice of Award from Calinog Water District On November 27, 2018, the Parent Company received a Notice of Award from Calinog Water District for a joint venture for the design, construction, rehabilitation, maintenance, operation, financing, expansion, and management of the water supply system of Calinog Water District in the Municipality of Calinog, Iloilo. Upon completion of conditions precedent specified in the notice, the Parent Company and Calinog Water District shall enter into a JVA, the implementation of the joint venture activity of which shall be undertaken by Aqua Centro. Notice of Award from Calbayog City Water District On December 27, 2018, the Parent Company received the Notice of Award from Calbayog City Water District for the implementation of the joint venture project for the design, construction, rehabilitation, maintenance, operation, financing, expansion, and management of the water and wastewater systems of Calbayog City Water District in the Calbayog City, as well as other areas which may eventually form part of the service coverage of the Calbayog City Water District in the Province of Samar. Upon completion of the conditions precedent specified in the notice, the Parent Company shall enter into a JVA with the Calbayog City Water District for the implementation of the joint venture project over a twenty five (25) year contract period. International New Business and Investments International new business investments of the Manila Water Group are generally undertaken through its wholly-owned Singapore subsidiary, Manila Water Asia Pacific Pte. Ltd (MWAP), and its direct subsidiaries, Manila Water South Asia Holdings Pte. Ltd. (MWSAH), Thu Duc Water Holdings Pte. Ltd. (TDWH), Kenh Dong Water Holdings Pte. Ltd. (KDWH), Manila South East Asia Water Holdings Pte. Ltd (MSEA), and Manila Water Thailand Holdings Pte. Ltd. (MWTC). In December 2011, TDWH purchased a 49% share ownership in Thu Duc Water B.O.O. Corporation (Thu Duc Water) which owns the second largest water treatment plant in Ho Chi Minh City. Thu Duc Water has a bulk water supply contract with Saigon Water Corporation (SAWACO) for a minimum consumption of 300 MLD on a take-or-pay arrangement. In July 2012, KDWH completed the acquisition of a 47.35% stake in Kenh Dong Water Supply Joint Stock Company (Kenh Dong Water), a Vietnamese company established in 2003 to build, own, and operate major water infrastructure facilities in Ho Chi Minh City. In October 2013, MWSAH completed the acquisition of 31.47% stake in Saigon Water Infrastructure Corporation (Saigon Water), a listed company in Vietnam. In 2017, MWSAH infused an additional equity of 103B VND, and increased its shareholding percentage to 38%. In 2015, MWSAH also entered into a Capital Transfer Agreement with Saigon Water Infrastructure Corporation and Vietnam-Oman Investment Company to develop and operate the water network in Cu

S E C F O R M 1 7 - A 42
Chi, a district in Ho Chi Minh City. The project will be undertaken with Cu Chi Water Supply Sewerage Company Limited (Cu Chi Water), a Vietnam limited company. Through this agreement, MWSAH holds 24.5% share in the charter capital of Cu Chi Water. On November 6, 2015, MWAP signed an MOU with PDAM Tirtawening Bandung City for a non-revenue water reduction demonstration project in Bandung City, Indonesia. PDAM Bandung is a water utility company owned and controlled by the Regional Government of Bandung City in West Java, Indonesia. On June 21, 2017, MWSAH subscribed to an additional 6.15 million primary shares of Saigon Water at a subscription price of VND16,900.00 per share for a total amount of P=229.16 million (VND103.87 billion). As a result of this additional subscription, MWSAH now holds 37.99% of the outstanding capital stock of Saigon Water. On February 19, 2018, the Manila Water signed a SPA with EGCO to acquire EGCO’s 18.72% equity in Eastern Water Resources Development and Management Public Company Limited (East Water). East Water is a publicly listed company whose shares are traded in the Stock Exchange of Thailand. It is engaged in the provision of raw water and tap water since 1992 in the eastern seaboard of Thailand. On March 5, 2018, MWTC entered into a one-year term facility agreement with Mizuho Bank, Ltd., Bangkok Branch (Mizuho Bangkok), whereby Mizuho Bangkok extended credit to MWTC for THB5.30 billion to finance MWTC’s acquisition of shares in East Water On March 14, 2018, MWTC acquired 311,443,190 ordinary shares in East Water representing 18.72% equity of East Water On March 6, 2018, PT Manila Water Indonesia (PTMWI), a wholly-owned subsidiary of MSEA signed a SPA with PT Triguna Rapindo Mandiri to acquire 4,478 shares of PT Sarana Tirta Ungaran (PT STU) which allowed PT MWI to own twenty percent (20%) of the outstanding capital stock of PT STU. PT STU is a bulk water supply company servicing PDAM Kabupaten Semarang and industrial customers in Bawen, located in Ungaran area of Semarang Regency, Central Java Province, with a capacity of 21.5 million liters per day. Environmental Compliance The Company’s water and used water facilities must comply with Philippine environmental standards set by the Department of Environment and Natural Resources (DENR) on water quality, air quality, hazardous and solid wastes, and environmental impacts. In keeping with the Company’s commitment to sustainable development, all projects are assessed for their environmental impact and where applicable, must obtain an Environmental Compliance Certificate (ECC) from the DENR prior to construction or expansion and the conditions complied with, along with all other existing environmental regulations. During and subsequent to construction, ambient conditions and facility-specific emissions (e.g. air, water, hazardous wastes, treatment by-products) from water and used water facilities are routinely sampled and tested against DENR environmental quality standards using international sampling, testing and reporting procedures. The Company has made efforts to meet and exceed all statutory and regulatory standards. The Company employs the appropriate environmental management systems and communicates to its employees, business partners and customers the need to take environmental responsibility seriously. The Company uses controlled work practices and preventive measures to minimize risk to the water supply, public health and the environment. The Company’s regular maintenance procedures involve regular disinfection of service reservoirs and mains and replacement of corroded pipes. Implementation and effectiveness of established operations and maintenance procedures is being monitored and checked for continual improvement through the Operations Management System (OMS). Monitoring of environmental compliance for operating facilities and on-going projects is being carried out proactively using risk-based assessment checklist in order to internally address compliance risks before it resulted into legal non-compliances. The Company’s water and used water treatment processes meet the current standards of the PNSDW, DOH, DENR and Laguna Lake Development Authority (LLDA). The Company continues to undertake improvements in the way it manages both treated water and used water as well as treatment of by-products such as backwash water, sludge and biosolids. The Company has contingency plans in the event of unforeseen failures in the water and used water treatment or chemical leakage and accidental discharge of septage and sewage. The Company’s Customer Care Center is trained to ensure that environmental incidents are tracked, monitored and resolved.

S E C F O R M 1 7 - A 43
A policy on climate change was formulated to define the Company’s commitment to the National Framework Strategy for Climate Change. While the company is undertaking climate change mitigating measures such as greenhouse gas accounting and reporting along with initiatives to optimize consumption of fuel and electricity to reduce its carbon footprint, there is a current emphasis towards climate change adaptation such as intensifying watershed rehabilitation work, vulnerability assessment of water sources and assets, improving the climate-resiliency of existing and future water and used water facilities, strengthening risk reduction and management systems with a business continuity plan, and development of new water sources. Sustainable Development Projects Manila Water has always committed to value creation, recognizing that there is a mission to fulfill, not just a business to run. The company believes that long term viability is very much dependent on alignment with social, economic and environmental goals - the ability to empower employees and business partners in improving the lives of the customers through the provision of safe and affordable water and wastewater services, and the manner with how natural capitals are managed as the business is uniquely reliant upon the environment, and vice versa. Manila Water’s sustainability framework pillars are: 1) Developing Employees; 2) Helping Build Communities; 3) Protecting the Environment; 4) Safeguarding Health and Safety and 5) Contributing to Local and National Economies.
Developing Employees Manila Water regards its employees as the most important resource and partner in creating lasting value, and always keeps the welfare of all its workforce as a primary concern. Manila Water provides talents access to various learning and development opportunities composed of in-house and external trainings as well as accelerated development programs under the Manila Water University. In 2019, there were a total of 42,332 training hours for 2,167 employees. In response to challenging city conditions and to exploit available technology solutions, the company provides flexible time and work arrangements for its employees to encourage productivity and collaboration while meeting the changing talent profile. Five work hubs with adjunct support facilities can be accessed across Metro Manila East Zone, while simultaneously acting as contingency sites to ensure quick business recovery in the case of natural disasters and emergencies. Opportunities are provided for employees to promote teamwork and camaraderie, such as volunteer-driven calamity response, sports and fitness programs as well as corporate events. Corporate award mechanisms are in place for employees who exemplify excellent performance and work ethic. These recognition programs are the Huwarang Manggagawa Awards for rank and file employees, the President’s Pride due to Performance Awards for middle managers, and the Chairman’s Circle Awards for the senior managers. Helping Build Communities Access to water and sanitation is a universally acknowledged fundamental human right, and consequently is a basic lifeline in any community that ensures healthy and productive inhabitants and a thriving economy. The company has aligned its vision and mission with, best articulated in the United Nation’s Sustainable Development Goal 6 that seeks to increase the proportion of the population that has no access to clean water and sanitation. Manila Water provides potable water to a total of 8,167,319 population across the Philippines through 1,241,155 water service connections. Manila Water believes that inclusivity is fundamental in its service expansion plans, making sure that no one gets left behind, especially the marginalized communities, also known as the base of the pyramid. The “Tubig Para Sa Barangay” (TPSB) program addresses the needs of low-income communities of having clean and affordable water. Complementing the TPSB program is the Lingap program which provides clean water to public service institutions such as schools, public markets, and hospitals, making sure that families have clean and safe water beyond their dwellings. Both TPSB and Lingap have been replicated and adapted to local conditions in Boracay and Laguna, in partnership with the Manila Water Foundation. Protecting the Environment Manila Water’s service obligations include the collection and treatment of wastewater of customers

S E C F O R M 1 7 - A 44
prior to proper discharge to receiving bodies of water. In 2019, Manila Water treated a total of 63.69 million cubic meter of wastewater which resulted in the diversion of 13,304 tons of organic pollutants from waterways through the 61 wastewater treatment facilities. The company meets effluent water quality standards set by the Department of Environment and Natural Resources (DENR). Opportunities to reduce negative environmental impacts and provide continuous services includes optimizing water efficiency through non-revenue water (NRW) program, reducing wastes and emissions, and educating the consumers. Non-revenue water is the total amount of treated water which do not reach the customer taps, usually due to pilferage, pipe leaks and metering error. Through the NRW program, the Manila Concession recovers 750 million liters per day - volume that is equivalent to the output of a medium-sized dam. The company’s Climate Change Policy, while putting more emphasis on adaptation measures and resiliency, makes a commitment to help mitigate carbon emissions primarily through energy efficiency efforts such as demand-based network management, system load balancing, pump efficiency testing and refurbishment, wastewater ‘Project Zero’, and ‘Biggest Loser: Trimming the Energy Bulge’ competition and clean fleet initiatives. The 1,166,786 trees planted and nurtured in watersheds and surrounding areas offset some carbon emissions. Manila Water continues to protect 9,263 hectares of watersheds particularly Ipo Watershed and La Mesa Watershed through the Bantay Gubat and ABS-CBN Foundation, respectively. The total organic pollution removed in wastewater treatment in 2019 translates to 83,816 tons of carbon dioxide equivalent of avoided methane formation, using the latest updated factors generated by the Intergovernmental Panel on Climate Change. Environmental education and engagement program is an integral part of Manila Water’s environmental sustainability. Manila Water has been educating and engaging its customers, communities and employees through its Lakbayan tour, Toka Toka program, Bawat Patak, Tumatak Goes to School and various environmental seminars and trainings. The Lakbayan Tour, whose objective is to provide an opportunity for members of the public to experience the water trail and foster an in-depth understanding of the value of water conservation and managing water after it is used. Since the program’s inception in 2006, 102, 753 individuals from various sectors have benefitted from the Lakbayan experience. The Toka Toka Movement is Manila Water’s advocacy program that aims to inform and educate people on the need for wastewater management in communities, the value of personal commitment and the collective impact of individual actions for the environment such as having septic tanks desludged, connecting houses to sewer lines where available, segregating solid waste and spreading the gospel of environmental sustainability among one’s family and friends. The Manila Concession has partnered with a total of 34 government and non-government organizations to sustain the campaign. Boracay Water developed its own local version called Amot Amot Para Sa Malimpyong Boracay, and Laguna Water also launched its TSEK ng Bayan (Tamang Sanitasyon Equals Kalusugan, Kalinisan, at Kaunlaran ng Bayan). All three programs have received awards for excellence in communications. Launched in 2015, ‘Bawat Patak Tumatatak’ Goes to School, is a sub-program of the Bawat Patak Tumatatak (“every drop makes a mark”) employee engagement program, which gives volunteer employees an opportunity to communicate the importance of proper environmental practices to elementary school students. As of end of 2019, the program has partnered with 36 elementary schools, reached 3,658 grade school students and tapped the assistance of 398 Manila Water volunteer employees. Safeguarding Health and Safety Manila Water ensures that the water it supplies to its customers are compliant to the Philippine National Standards for Drinking Water. Water quality risks are continuously addressed across the water value chain, minimizing the contamination of raw water at the source, ensuring treatment complies with allowable limits, and providing protection at reservoir storage and during distribution. All potential risks are assessed, and appropriate control measures are incorporated in all parts of operations, control measures are identified and implemented, and policies and procedures are always upgraded as part of continuing improvement. In 2019, the Manila Concession collected 77,834 water samples of raw and treated water at the facilities and drinking water from customers’ taps. In a similar manner, the other Philippine subsidiaries collected

S E C F O R M 1 7 - A 45
2,686 water samples in world-class laboratories accredited by the Department of Health, recognized by the Philippine Department of Environment and Natural Resources, and certified against ISO standards. The Manila Concession’s revised and expanded Water Safety Plan (WSP) has been approved by the Department of Health in November 2019. The other Philippine subsidiaries are in various stages of WSP preparation, review and regulator approval, in accordance with the Department of Health directive to develop and implement plans to ensure delivery of safe drinking water. Manila Water also commits to strengthening a culture of health and safety across its workforce, supply chain, and the general public, and continually assesses, implements, and improves business processes by adapting best practices in safety communications, procedures and compliance. Manila Water is certified according to OHSAS 18000: 2007 Occupational Safety and Health Management Systems which is also integrated with other management systems. Policies and procedures for compliance on occupational health standards of the country are well established. In response to the recently approved implementing rules and regulations of Republic Act 11058 covering Occupational Safety and Health, the safety programs of the company were re-scoped to include and/or strengthen drug free workplace, healthy lifestyle, HIV program, tuberculosis and Hepatitis B program and mental health services. Contributing to Local and National Economies As of the end of 2019, Manila Water has provided direct employment to 2,288 individuals in the Metro Manila’s East Zone and its subsidiaries across the Philippines and in Vietnam. Out of its pool of business partners, the company has in 2019 provided business opportunities to 289 vendors including material suppliers, contractors, consulting firms, and service providers. A total of Php12.6 billion capital expenditure was used in 2019 for the improvement of water and wastewater services across the Philippine and Manila Water Asia Pacific operations. Employees As of December 31, 2019, MWCI had 1,994 employees. Approximately 22% were non-management employees and 78% held management positions. The following table presents the number of employees as of December 31, 2019:
Year Former MWSS Direct Hires Subsidiaries Total
2019 443 998 553 1,994
The following table presents the number of employees by function as of December 31, 2019:
Group Management Non-Management Total
Office of the President 3 0 3
Corprate Finance & Strategy 74 6 80
Office of the MWO-COO 2 0 2
Corporate Operations 395 150 545
Strategic Asset Management 49 5 54
Corporate Human Resources 28 3 31
East Zone Business Operations 282 57 339
Business & Technology Services 73 16 89
Corporate Project Management 141 31 172
Corporate Regulatory Affairs 12 2 14
Corporate Strategic Affairs 17 7 24
Legal 11 0 11
Internal Audit 7 0 7
MWF 1 0 1
Subsdiaries 470 152 622
1,565 429 1,994

S E C F O R M 1 7 - A 46
Before privatization, the MWSS had 8.4 employees per 1,000 service connections. Manila Water Company has improved this ratio to 1.4 employees per 1,000 service connections as of December 31, 2019. This was accomplished through improvements in productivity achieved through, among other initiatives, value enhancement programs, improvements in work processes, employee coaching and mentoring, transformation of employees into knowledge workers, and various training programs. Manila Water’s organizational structure has been streamlined, and has empowered employees through decentralized teams with responsibility for managing territories. In addition, the Company formed multi-functional working teams which are composed of members of the management team tasked with addressing corporate issues such as quality and risk, and crisis management.
As of December 31, 2019, 182 or 13.2% of the employees of the Company are members of the Manila Water Employees Union (MWEU). In 2013, the company and the MWEU concluded negotiations on a new collective bargaining agreement (CBA). MWEU has the option under the law to renegotiate the non-representation provisions of the CBA by the third quarter of 2016. The management of the Company maintains a strong partnership with union officials and members and there has never been any strike since its inception. Grievances are handled in management-led labor councils. The CBA also provides for a mechanism for the settlement of grievances. The Company has a two-pronged strategy in talent development – strengthening leadership capabilities, and building and strengthening technical expertise to maintain its leadership in the water industry and contribute to national development. Programs were implemented in partnership with the line managers with the aim of ensuring an agile, enabled, mobile and highly engaged workforce that will support the corporate growth strategy. On the Talent Management and Leadership development front, several initiatives were undertaken to ensure a strategic and holistic approach to talent development. Cadetship Training Program: The Cadetship Training Program is a 6-month program that provides qualified fresh graduates the opportunities for specialized training and work experience that aim for excellence in business and technical skills. The end in mind is to ensure that the cadets will have strong understanding of business operations, water and used water processes and project management. Their functional competencies are honed through a 4-month immersion in their actual job assignment where they are paired with a mentor who will teach them the ropes of the business. Mentors are provided with competency learning checklist to ensure that every cadet is evaluated the same way and regular checkpoints happen monthly. A revalida with the SLT and Mancom serves as the culminating learning check for the cadets before they are fully deployed to their line functions. Business Zone Leadership School (BZLS): This is a competency-based training to ensure a steady supply of competent talents in the East Zone Business Operations who can assume the Business Zone Manager (BZM) role as needed by the business. Succession Management: Manila Water has strengthen its succession management process to further strengthen the senior management pool of the organization. Talents are assessed, received deliberate development interventions such as Individual Development Plan (IDP), stretched assignments and coaching to accelerate their development. Talent Reviews are conducted annually with line managers across the organization to identify and develop talents to assume current and emerging roles. This process has been integrated with the New Business Operations, in the aim that they may become a talent source for the Group. Complementing the efforts on leadership development, the same level of focus is given to technical roles where talents occupying highly technical positions are likewise given technical development through the Manila Water University’s Center for Technical Excellence. It aims to ensure that the Company strengthens the technical competencies of its talents in its fields of operations. The Company ensures that its reward system is market competitive, performance-based, aligned with business strategies and results, and within regulatory parameters. In 2005, the Company extended an equal cash incentive to each employee covered by the reward system. In succeeding years, the Company further improved the system by taking care of the gaps in the distribution system and aligning the reward system with the yearend goals of the Company, which are anchored on the KPI/ BEM targets. In 2013, the Company updated its guaranteed pay structure to ensure alignment with industry practices. Also in 2013, the company enhanced its variable pay program to increase the alignment of bonus scheme with business results. The Company continues to monitor pay competitiveness and reward talents according to their achievements and contributions to the business objectives.

S E C F O R M 1 7 - A 47
In 2014, the Company implemented the Talent Mobility Program which is a talent management and reward platform that allows the seamless transition of talents from one Manila Water business unit to another. The program ensures a reasonable, engaging, and competitive secondment process to Manila Water businesses covering pre-deployment, actual deployment, and repatriation benefits and support for secondees. In 2001, pursuant to the concession agreement (CA), the Company adopted the Employee Stock Option Plan (ESOP). The ESOP was instituted to allow employees to participate directly in the growth of the company and enhance the employees’ commitment toward its long-term profitability. In 2005, the company adopted an Employee Stock Ownership (ESOWN) Plan as part of its incentives and rewards system. Also in 2005, the company's Board of Directors approved the establishment of an enhanced retirement and welfare plan. The plan is being administered by a Retirement and Welfare Plan Committee, which also has the authority to make decisions on the investment parameters to be used by the trustee bank. Over and above these benefit and reward schemes, the Company gives recognition for employees who best exemplify the Company’s culture of excellence through the Chairman’s Circle (C2) Awards for senior managers, the President’s Pride due to Performance (P3) honors for middle managers and the Huwarang Manggagawa (Model Employee) Awards for the rank-and-file employees. Eight (8) of the Company’s model employee awardees have also been awarded ‘The Outstanding Workers of the Republic’ (TOWER) Award by the Rotary Club of Manila from 1999 to 2009, by far the most number of awards won by any single company over that period. The exemplary performance of its employees has earned for Manila Water several awards and recognitions. Over the past seventeen years, the Company has been the recipient of numerous awards. A landmark recognition was earned by Company when it was cited the 2006 Employer of the Year by the People Management Association of the Philippines. Another prestigious award earned by the Company was the Asian Human Capital Award given by the Singaporean government in 2012. The 2006 Employer of the Year honors were bestowed upon Manila Water for providing a remarkable example of how a group of much-maligned government workers was transformed into a thoroughly efficient organization that is now a leader in its industry. The Asian Human Capital Award, is one of the biggest recognition earned by the Company as an employer and is an award that is so difficult to obtain due the stringent standards of its giver, the Singaporean Ministry of Manpower. However, the comprehensive selection process did not prevent Manila Water from becoming the first-ever Filipino company to capture the elite honors when the Singaporean government deemed the Company worthy of the award for harnessing its people in transforming from a languishing water service provider into a world-class water and used water company, citing not only its accomplishments but also the way it turned around its business using its human resource. In 2014, the Company bagged the following awards and recognitions: One of 20 Global Growth Companies (GGC) in East Asia – World Economic Forum (May 2014); No. 2 in the 2014 Sustainability Ranking – Channel NewsAsia (November 2014); Asia’s Icon on Corporate Governance – Corporate Governance Asia (November 2014); 1st in Innovation in Water, Wastewater and Stormwater Network Modelling and Analysis for the Marikina North STP Project - Bentley Systems, Inc.’s Be Inspired Awards (November 2014); PSE Bell Award for Corporate Governance, Hall of Fame – Philippine Stock Exchange (November 2014); Asia Geospatial Excellence Award – Asia Geospatial Forum (November 2014); Philippine Esri Best Overall Map Award for ‘The Business Risk Exposure Assessment of Manila Water Network Asset Project Map’ – Philippine Esri User Conference and 2nd Philippine Esri Education GIS Conference (September 2014); First Don Emilio Abello Energy Efficiency Award for the San Juan Pumping Station – Department of Energy (October 2014); IABC Quill Awards, Awards of Excellence and Awards of Merit for various business communication programs – International Association of Business Communicators (IABC) Philippines (2014). In April 2014, the Laguna Lake Development Authority cited the following employees as Outstanding Pollution Control Officers – Blue Ratee for the 7 Sewage Treatment Plants of Manila Water: Sharon B. Cerbito - North Septage Treatment Plant (San Mateo); Jimaima M. Hoque - Sikatuna STP; Jocelyn M. General (PCO), Johannes Paulus O. Costales (Plant Manager) - Fisheries STP; John Von Wernher C. Dela Cruz - Pagasa STP, Heroes’ Hill STP; Ninya Kristina L. Cabico - Belarmino Stp, Palosapis STP; and Jeremaine V. Esguerra - East Ave STP. In August 2014, the Department of Health also gave the Typhoon Yolanda ‘Unsung Heroes’ Plaque of Recognition for Manila Water’s Mobile Treatment Plant Operations. In 2014, Manila Water was given the ISO 50001 Certification for Energy Management System (April 2014). Manila Water was the first Philippine company to receive this certification. As of 2015, Manila

S E C F O R M 1 7 - A 48
Water has the following ISO Certifications: ISO 50001: 2011 Energy Management System (ENMS) for five (5) water supply and five (5) used water facilities; ISO 9001:2008 Quality Management System, ISO 14001:2004 Environmental Management System, and OHSAS 18001:2007 Occupational Health and Safety Management System (QEHSMS) for nine (9) water supply and six (6) used water facilities, and two (2) support departments (Laboratory and Maintenance Services); and ISO/IEC 17025:2005 for the Company’s Laboratory Management System. In 2015, the awards and recognitions received by the Company include the following: Awards and Citations for Corporate Governance and Management (2015 One of ASEAN Top 50 Publicly Listed Companies, ASEAN Corporate Governance Conference and Awards; 2015 9th ING-FINEX CFO of the Year for Mr. Luis Juan B. Oreta); Awards and Citations for Corporate Social Responsibility and Sustainability (2015 Change the World List (Ranked No. 29 out of 51), Fortune; 2015 One of Top Corporate Social Responsibility (CSR) Advocates in Asia, Asia Corporate Excellence and Sustainability (ACES) Awards; 2015 Winner, Sustainability Strategy and Resource Efficiency Category, ASEAN Corporate Sustainability Summit and Awards (ACSSA); 2015 Runner-up, Supply Chain Sustainability Category, ASEAN Corporate Sustainability Summit and Awards (ACSSA)); Awards and Citations for Operations and Technical Management (2015 Asia Geospatial Excellence Award for the Critical Activity Review and Geographic Information System (GIS) Integration, Asia Geospatial Forum; 2015 Special Award for Performance in Energy Efficiency and Conservation for Siruna Pumping Station, Don Emilio Abello Energy Efficiency Awards, Department of Energy; 2015 Award of Recognition for ASEAN Energy Awards Competition for Balara Pumping Station, Don Emilio Abello Energy Efficiency Awards, Department of Energy; 2015 Outstanding Award for Performance in Energy Efficiency and Conservation for San Juan Pumping Station, Don Emilio Abello Energy Efficiency Awards, Department of Energy; 2015 Outstanding Energy Manager Award (Mr. Rolando Mosqueda, San Juan Pumping Station), Don Emilio Abello Energy Efficiency Awards, Department of Energy; 2015 Special Award for Performance in Energy Efficiency and Conservation for Kingsville Pumping Station), Don Emilio Abello Energy Efficiency Awards, Department of Energy); Awards and Citations for Communications (2015 Gold Anvil Award and Silver Anvil Awards, 50th Anvil Awards, Public Relations Society of the Philippines (PRSP); 2015 Awards of Excellence and Awards of Merit, Quill Awards, International Association of Business Communicators (IABC) Philippines); Others (Subsidiaries) (2015 Case Study Category Winner of the Public-Private Partnerships (PPP) Short Stories Competition for Laguna Water’s Alternative PPP Model: The Laguna Water Story, World Bank Group and the Public-Private Infrastructure Advisory Facility (PPIAF)). In 2016, the awards and citations received by the Company include the following: Awards and Citations for Corporate Governance and Management (2016 PSE Bell Award for Corporate Governance, Philippine Stock Exchange; 2016 Governance Awardee, Investors’ Forum, Institute of Corporate Directors (ICD) in partnership with Fund Managers Association of the Philippines, Philippine Investment Funds Association, Trust Officers Association of the Philippines and PJS Corporate Support Inc.; 2016 Risk Management Professional of the Year Award for Ms. Ma. Victoria P. Sugapong, Ayala Risk Awards; 2016 Delivering Value through Risk Management Award for “The Big One: The East Zone Earthquake Impact and Risk Reduction (EZEIRR) Study,” Ayala Risk Awards); Awards and Citations for Operations and Technical Management (2017 Computerworld Premier 100 Technology Leader for Mr. Rodell A. Garcia; 2016 Certified National Expert for Pumping System Optimization for Mr. William Alcantara Don Emilio Abello Energy Efficiency Awards, Department of Energy; 2016 Citation Award for Kingsville Pumping Station Don Emilio Abello Energy Efficiency Awards, Department of Energy; 2016 Special Award for Siruna Pumping Station, Don Emilio Abello Energy Efficiency Awards, Department of Energy; 2016 Special Award for San Juan Pumping Station, Don Emilio Abello Energy Efficiency Awards, Department of Energy; 2016 Chairman’s Prize for Healthy Family Purified Water, Ayala Innovation Excellence Awards; 2016 Innovation Excellence Award for the Demand-Based Network Management (DBNM) System, Ayala Innovation Excellence Awards; 2016 CIO 100 (US) Awardee for the Enterprise Asset Management – Asset Management Information System (EAM-AMIS) Project, CIO 100 Awards, CIO Asia; 2016 CIO 100 Index (Asia) for the Enterprise Asset Management – Asset Management Information System (EAM-AMIS) Project, 15th Annual CIO Asia Awards, CIO Asia; 2016 People’s Choice Award and Best Overall Map for Cartographic Design and Analytic Presentation, ESRI Philippines GIS User Conference Map Gallery Competition); Awards and Citations for Corporate Social Responsibility and Sustainability (2016 One of Top 3 Most Sustainable Corporations, Channel NewsAsia Sustainability Ranking; 2016 Unilever Global Development Award for “Tubig Para Sa Barangay”, Annual Responsible Business Awards, Business in the Community (BITC) Network of the United Kingdom; Awards and Citations for Communications (2016 Top Award in Communication Management for Boracay Water’s “Lingap Para Sa Katutubo,” Philippine Quill Awards, International Association of Business Communicators (IABC) Philippines; 2016 Special Award for Excellence in PR for Social Good for “Toka Toka: The First and Only Used Water Advocacy in the Philippines,” Anv il Awards, Public Relations Society of the Philippines (PRSP); 2016 Gold Anvil Awards and Silver Anvil Awards, Anvil Awards, Public Relations Society of the Philippines (PRSP); 2016 Quill Awards of

S E C F O R M 1 7 - A 49
Excellence and Awards of Merit, Philippine Quill Awards, International Association of Business Communicators (IABC) Philippines) In 2017, the Company was awarded with the following: 52nd Anvil Awards (Public Relations Society of the Phils.): Gold Anvil Award - Manila Water's 2016 Corporate Video; Gold Anvil Award - Clark Water's Ahon Pinoy Program in Sitio Monicayo; Silver Anvil Award - Boracay Water's Amot Amot (Toka Toka) Sa Malimpyong Boracay; Silver Anvil Award - Laguna Water's Inauguration of the Laguna Wellfield; Silver Anvil Award - The Laguna Water Story Video; Silver Anvil Award - The Month-Long and Nationwide Celebration of the 2016 Global Handwashing Day; Rodell Garcia, Named one of 2017 Computerworld Premier 100 Technology Leaders; 'Kampeon ng Katubigan' Award, 2017 World Water Day Awards (organized by Maynilad and the National Water Resources Board); No. 1 Best Managed Utilities Company in Asia, 17th Annual Asia's Best Companies, Finance Asia; 15th Philippine Quill Awards (International Association of Business Communicators): Quill Award of Excellence – Si Rungis at Si Linis: Ang Kwento ng Dalawang Patak ng Tubig; Quill Award of Excellence - Manila Water's 2016 Corporate Video; Quill Award of Merit – Gawad Iwas-Lunas Risk Management Excellence Awards, Best Corporate Investor Relations (by Country) Award, 7th Asian Excellence Awards, Corporate Governance Asia; Luis Juan Oreta, Asia's Best CFO (Investor Relations) Award, 7th Asian Excellence Awards, Corporate Governance Asia; Outstanding Blood Services Partner of the Year Award, Blood Donors Recognition Ceremony, Philippine Red Cross; Ferdinand Dela Cruz, 2017 Most Distinguished Alumnus Award, University of the Philippines Alumni Engineers (UPAE); Clark Water, One of Top Community Care Companies in Asia, Asia Corporate Excellence and Sustainability (ACES) Awards; Award of Excellence for 10 Million Safe Man-Hours, Safety Organization of the Philippines Inc. (SOPI); 2017 Don Emilio Abello Energy Efficiency Awards (Department of Energy): Special Award - Balara Pumping Station, Special Award - San Juan Pumping Station, Outstanding Award - Lucban Pumping Station, and Outstanding Energy Manager Award - John Paul Galman. For 2018, Manila Water was awarded with the following: The Asset Platinum Award (Excellence in Environmental, Social and Governance Practices), Top 50 ASEAN Publicly Listed Companies (PLC) during the 2nd ASEAN Corporate Governance (CG) Awards, 2017 Top 10 PLC, Top 5 PLC – Industrial Sector – by the Institute of Corporate Directors for the ASEAN CG Scorecard, ASEAN Energy Awards – First Runner-up for Energy Management – Building and Industries, Small and Medium Industry Category for “Project Lights-Out” at N. Domingo Pumping Station, Award of Excellence for 12.7 Million Safe Man-Hours without Lost-Time Accident Safety Organization of the Philippines Inc., Chairman’s Prize for Emergency Reservoirs at the Ayala Innovation Excellence Awards, Enterprise Risk Programme of the Year Award during the StrategicRISK Asia-Pacific Risk Management Awards, Gold Anvil Awards – Public Relations Society of the Philippines for the 2016 Integrated Annual and Sustainability Report (PR Tools – Publications), The Marikina North Sewerage System Project Story (PR Tools – Multimedia/ Audio-Visual Presentation), Silver Anvil Awards, Public Relations Society of the Philippines for Kasangga Day: Manila Water’s Customer Appreciation Program (PR Program – Consumers/ Communities), Manila Water’s 20th Anniversary Corporate Video and Mural (PR Tool – Multimedia/ Audio-Visual Presentation), Clark Water’s Sitio Haduan Water Project (PR Program – Indigenous People) Boracay Water’s Lingap Eskwela (PR Program – Communities/Schools) Laguna Water TSEK ng Bayan!: Tamang Sanitasyon Equals Kalinisan, Kalusugan at Kaunlaran ng Bayan (PR Program – Consumers/Communities), Quill Award of Excellence by the International Association of Business Communicators Philippines for the 2016 Integrated Annual and Sustainability Report (Communication Skills – Publications), and Quill Award of Merit by the International Association of Business Communicators Philippines for Manila Water’s 20th Anniversary Corporate Video (Communication Skills – Audio-Visual Category). In 2019, Manila Water received the following awards: 2019 Top-Performing Publicly Listed Companies (PLCs) against the ASEAN Corporate Governance Scorecard, 3-Star Arrow Recognition from the Institute of Corporate Directors (ICD) for its performance rating against the 2018 ASEAN Corporate Governance Scorecard; 2019 Ayala Innovation Award for the Plug and Play Hybrid Water Treatment System developed by Manila Water Total Solutions and Manila Water Philippine Ventures – Bulacan Aqua Estates; 2019 Asia’s Community Care Company of the Year awarded to Manila Water Foundation by the Asia Corporate Excellence and Sustainability (ACES) Awards; Gold Anvil Award to Laguna Water for its TSEK! (Tamang Sanitasyon Equals Kalinisan, Kalusugan at Kaunlaran ng Bayan) Campaign during the 54th Anvil Awards of the Public Relations Society of the Philippines (PRSP); Silver Anvil Award awarded to Manila Water for QX Academy: Creating Share Value and Sustainable Quality through Skills and Training Development for Partner Vendors during the 54th Anvil Awards of the Public Relations Society of the Philippines; Mr. Benigno Acacio, a Fleet Heavy Equipment Officer from the Corporate Operations Group awarded the 2019 The Outstanding Workers of the Republic (TOWER)

S E C F O R M 1 7 - A 50
award by the Rotary Club of Manila, People Management Association of the Philippines (PMAP), Petron Foundation Inc., and the Department of Labor and Employment (DOLE). Related Party Transactions To further instill the Company’s policies on related party transactions, the Board adopted the Policy on Related Party Transactions (the “RPT Policy”). The RPT Policy confirms that the Company and its subsidiaries shall enter into any related party transactions solely in the ordinary course of business, on ordinary commercial terms, and on the basis of arm’s length arrangements, which shall be subject to appropriate corporate approvals and actions of the Company or the related parties, as the case may be. Any related party transactions entered into by the Company or its affiliates shall be in accordance with applicable law, rules and regulations, and the RPT Policy. Related party transactions entered into by the Company with one or more of its directors or officers are voidable at the option of the Company, unless the transaction is deemed fair and reasonable under the circumstances and at arm’s length, and the procedure for the procurement and approval for similar transactions was strictly complied with. The RPT Policy provides for the process of approving related party transactions, as well as the implications for violations. In addition, the RPT Policy prohibits related party transactions involving loans and/or financial assistance to a director and loans and/ or financial assistance to members of the Management, except when allowed pursuant to an established Company benefit or plan. Under the RPT Policy, the approval of the Related Party Transactions Committee is required for material related party transactions. On October 28, 2019, the Related Party Transactions Committee approved the amendments to the Company’s Policy on Related Party Transactions in order to comply with the provisions of the Rules on Material Party Transactions for Publicly Listed Companies of the SEC. The amendments to the Company’s Policy were ratified by the Board of Directors during its Regular Meeting on November 26, 2019 Risks Disclosure
2019 TOP ENTERPRISE RISKS MITIGATION STRATEGIES
POLITICAL AND REGULATORY Failure to manage political and regulatory stakeholders which can lead to revision or termination of the Concession Agreement.
Manila Water proactively participated and advocated with the MWSS for the passage of Concession Accounting and Auditing Guidelines (CAAGs) and Technical Audit Guidelines (TAGs). A more stringent monitoring was done on the delivery of service obligations among groups internally to ensure compliance and prevent issues. Kept open lines of communications and engaged with various Stakeholders to provide clarifications on compliance to service obligations, strengthen relationship, and advocate for matters relating to the validity and protection of the Concession Agreement & its financial viability. Proactively prepared and participated in legislative proceedings and various fora and conferences of industry organizations to stand for the truth on the operational efficiency & performance of Manila Water and avert its being muddled with fake news and false information.
LEGAL RISK Failure to secure a favorable Supreme Court resolution regarding the Clean Water Act issue which can lead to termination of the Concession Agreement.
Filed the Motion for Reconsideration (MR) for the unfavorable Supreme Court Decision imposing penalties. Coordinated and aligned with MWSS and Maynilad on arguments and issues to raise prior to the filing of the MR.
Strong and responsive information/clarification and communication initiative (social media) with due consideration to the sub judice rule (which means that when a matter is before the court, it should not be discussed in other fora)

S E C F O R M 1 7 - A 51
WATER SUPPLY • Failure to ensure adequacy, security, quality
and reliability of water supply. • Inability to provide East Zone customers with
24-hour water with at least 7psi
All existing sources are maximized including Cardona Treatment Plant. Continuous effort to secure the 40% allocation at the portal. Building additional capacity from immediate new term water sources. For 2019, MWC built additional capacity at 92.17 mld. Extensive pressure management and network reconfiguration practiced to equitably distribute limited supply of water.
CAPEX EXECUTION Failure to execute Capex plan per Approved Business Plan on a timely manner and cost basis leading to MWSS Regulatory Office (RO) tariff claw back and non-recoverability of expenses.
Initiated and implemented Project Ark. Project ARK is a cross-functional and comprehensive program aimed at identifying gaps and implementing critical changes targeted to improve CAPEX delivery. The program targeted core CAPEX processes, policies, tools, and structures critical to being able to fast-track our water supply and used water commitments and meet the 2019-2022 CAPEX target of P86 Billion. Ark 1.0 (Phase 1) includes improvement in the CAPEX organizational structure and delivery strategy by (a) creating a more aligned and streamlined project team structure within Corporate Project Management Group (CPMG), (b) maximizing technical talents in the organization by decentralizing project execution, (c) establishing the Strategic Procurement and Supply Chain Group to allow for a more flexible and targeted approach to procurement, (d) implementing a more structured and holistic approach to land acquisition, and (e) applying a more efficient revised approval process. Ark 2.0 (Phase 2) specifically targets process improvements, aimed at further improving end to end CAPEX delivery by reducing touch points and cycle times across all critical processes. This sub-program aims to improve CAPEX throughput by utilizing workflows, automation, reports, and dashboards to improve visibility and streamline coordination across all units. Ark 2.0 is currently ongoing and is expected to be completed by June 2020. Continued to embed more effective risk identification and management in all processes, standardizing to the appropriate measure to deliver projects aligned with targeted timeliness, cost, safety and quality, and documented effectively to align with the CPMG Quality Management System and MWSS RO guidelines.
FINANCIAL RISKS Liquidity Risk • Failure to pay obligations in a timely manner
resulting to fines and penalties or loan default. Loan Default Risk • Failure to make the required payment on debt
obligation
Various initiatives have been implemented to ensure that the company is able to mitigate liquidity risk. Reduction in OPEX and streamlining of CAPEX are some of the cash conservation strategies that the company undertook. Focus was likewise given to tighter and more efficient liquidity planning and monitoring which includes better disbursement oversight and raising new sources of funds. Proactively managed relationship with lenders by ensuring that they are updated on the various corporate developments in Manila Water. The company held several lenders’ briefings where Manila Water’s management discussed and

S E C F O R M 1 7 - A 52
clarified various news reports and updated partner banks on the status of its operations and other legal matters (e.g. review of the Concession Agreement). Timely payment of debt maturities and submission of loan compliance requirements are also strictly observed to ensure compliance with loan provisions/covenants.
BUSINESS CONTINUITY Failure to ensure immediate recovery and continuity of business operations through execution of a comprehensive business continuity management plan.
Continuous improvement of MWC Business Continuity Management, which is composed of risk reduction and management, incident management, business continuity planning Completed resiliency and business interruption study and implemented projects covering earthquake, typhoon, flooding and fire. This includes retrofitting facilities and activating emergency online reservoirs and deep wells. Improve monitoring and alert systems through the strengthening of the Operations Monitoring and Control Center. For incident management, acquired contingency vehicles and 40 business continuity responders.
COMPLIANCE RISKS Regulations Compliance • Water Supply Quality
• Failure to ensure quality of water based on PNSDW Standards
• Wastewater Operational Compliance
• Failure to meet regulatory commitments particularly on effluent compliance to DENR standards
Rate Rebasing Commitments Compliance • Failure to deliver rate rebasing commitments
leading to claw back in tariff and non-recoverability of expenses.
For existing water sources, adherence to Water Safety Plan is practiced. For Deep well (as new water source), its operations and maintenance are further established and is augmented by partner service providers To address root cause of the risk which is the lack of control over the quality of the influent received at the plants, MWC:
▪ Exercises ongoing effort to influence MWSS on pre-treatment standards
▪ Continues to lobby for laws and ordinances, leveraging on the Manila Bay Rehabilitation Plan. Traction was gained in 2019 as evidenced by MWC’s active participation in the Manila Bay Task Force Regional/Cluster Meetings
Timely submission of reports and responses to letters of inquiries from MWSS (RO, CO and Board of Trustees) Strict implementation of Asset Management Plan for asset renewal or asset improvement to avoid non-conformance in operating results particularly in Wastewater Facilities. Stringent review of the KPI+BEMs. Internally assessed the alignment of CAPEX accomplishment using the Technical Audit Guidelines and the components of Opening Cash Position using Concession Accounting and Auditing Guidelines.
BRAND AND REPUTATION Failure to maintain our stature as a company which may result in significant difficulty in creating and/or maximizing value for all stakeholders and may affect our ability to execute growth plans, affect employee morale and our ability to attract talents.
Brand-building initiatives are in place to strengthen internal and external stakeholder engagement. A steady stream of positive news in traditional and non-traditional media channels are published regularly to highlight company accomplishments, alongside goodwill programs and partnerships with

S E C F O R M 1 7 - A 53
TV, radio and print media. Equal attention is also given to maximizing online presence through social media channels and website. Programs promoting Information, Education and Communication (IEC) of the company’s advocacies as well as collaboration with key stakeholders on agreed areas of synergy are also implemented.
TALENT MANAGEMENT Talent Capacity • Failure to provide ready succession into critical
roles and retention of critical people and teams.
• Failure to maintain organization size required and to define clear accountabilities required to deliver.
Team and Organizational Connection • Failure to apply big picture thinking to support
organizational success – seeing the impact of one’s action, output and behavior to peers, other teams, and the bigger organization; siloed thinking
• Failure to recognize the changing workforce profile and values
A robust succession plan is in place to ensure a strong pipeline for critical roles. The Technical Development Curriculum has been developed in partnership with the Operations Subject Matter Experts to ensure that we further strengthen and sustain the technical capabilities within the organization. This is complemented by the Core and Leadership Development Programs offered to talents to foster a values-based and institutionalized ways of working across all levels and roles.
NEW BUSINESS OPERATIONS Failure to operate new businesses properly as a result of poor integration, planning and execution.
The Subsidiary Operations Group (SOG) was created to oversee all operating subsidiaries. It is headed by a Group Director who directly supervises the General Managers of the subsidiaries to enforce functional standards across the business units. Under SOG supervision, transition teams are created to properly implement integration activities as new businesses transition from development phase to operating stage.
NEW BUSINESS DEVELOPMENT Failure to launch significant new businesses to meet current and future business objectives.
Regional Business Development with different leadership teams are in place to handle business development and look for business expansion opportunities in their respective areas. Manila Water’s review framework of new business projects includes risk assessment and is a critical component in the business development and approval process. The risk profile of the project is considered in the determination of the cost of capital.
In order to achieve its corporate objectives, Manila Water acknowledges the need for the active management of the risks inherent in its business which should involve the entire enterprise. For this reason, Manila Water has established an Enterprise Risk Management (ERM) Program which aims to use a globally accepted approach in managing imminent and emerging risks in its internal and external operating environments. Under the ERM Program, Manila Water shall appropriately respond to risks and manage them in order to increase shareholder value and enhance its competitive advantage.
Manila Water, through its Enterprise Risk Management Department (ERIM Department), seeks to integrate risk awareness and responsibility into each level of management activities, and into all strategic planning and decision-making processes within Manila Water and its subsidiaries to support the achievement of strategies and objectives. In its report to the Board of Directors adopted in its meeting held on February 20, 2020, the Audit Committee confirmed that:
• The Committee reviewed and approved annual Audited Consolidated Financial Statements of Manila Water Company, Inc. and subsidiaries, including Management’s Discussion and Analysis of Financial Condition and Results of Operations as of and for the year ended December 31, 2019, Management’s Representation Letter with the Company’s Management, internal auditors, and SGV & Co. These activities were conducted in the following context:

S E C F O R M 1 7 - A 54
▪ Management has the primary responsibility for the financial statements and the reporting process.
▪ SGV & Co. is responsible for expressing an opinion on the conformity of the Company’s audited consolidated financial statements with the Philippine Financial Reporting Standards.
• The Committee reviewed and approved the Management representation letter before submission to the Company’s independent external auditors.
• The Committee recommended to the Board of Directors the re-appointment of SGV & Co. as independent external auditors of Manila Water Company and all domestic subsidiaries except for Laguna AAA Water Corporation for 2019 based on its review of SGV’s performance and qualifications, including consideration of Management’s recommendation.
• The Committee recommended to the Board of Directors the re-appointment of Punongbayan & Araullo as the external auditor of Laguna AAA Water Corporation.
• The Committee also recommended the delegation of the 2020 Audit Fee approval of the Company’s external auditors for the year 2020 to Management subject to the terms discussed during the Audit Committee Meeting held on February 17, 2020.
• The Committee reviewed and approved all audit and audit-related services provided by SGV & Co. to the Company and the related fees for such services.
• The Committee discussed and approved the overall scope and the respective audit plans of the Company’s internal auditors and of SGV & Co., the results of their audits and their assessment of the Company’s internal controls, and the overall quality of the financial reporting process.
• The Committee discussed the reports of the internal auditors and ensured that Management is taking appropriate actions in a timely manner, including addressing internal control and compliance issues. All the activities performed by Internal Audit were conducted in conformance with the International Standards for the Professional Practice of Internal Auditing.
• The Committee, through the audits conducted by SGV & Co. and Internal Audit, has reviewed Management’s system of internal controls and the Committee found the internal control system to be adequate and effective.
• The Committee discussed with Management the adequacy and effectiveness of the Enterprise Risk Management process, including significant risk exposures, the related risk-mitigation efforts and initiatives, and the status of the mitigation plans. The review was undertaken in the context that Management is primarily responsible for the risk management process.
• The Committee reviewed and confirmed that the existing Audit and Internal Audit Charters are sufficient to accomplish the Committee’s and Internal Audit’s objectives. The Audit Committee Charter is in compliance with the Securities and Exchange Commission Memo Circular No. 04 (2012).
• The Committee conducted a self-assessment of its performance to confirm that the Committee continues to meet the expectations of the Board, Management and shareholders.
Government Regulations Through the Company’s Integrated Management System which include Quality, Environment, Health and Safety and Energy Management Systems, the company meets the requirements of environmental laws and other regulations which include: General Environmental Safeguards
• Presidential Decree No. 1586 (Philippine Environmental Impact Statement System)
• Republic Act No. 7586 – National Integrated Protected Areas System (NIPAS)
• DENR Administrative Order No. 30, Series of 2003 (Implementing Rules and Regulations for the Philippine Environmental Impact Statement System)
• DENR Administrative Order No. 2000-08 (Implementing Guidelines on Engineering Geological and Geohazard Assessment as Additional Requirement for ECC Applications)
• DENR Administrative Order No. 02, Series of 2014 (Appointment/Designation of Pollution Control Officers)
• DENR Administrative Order No. 27, Series of 2003 (Self-Monitoring Report System)
• DENR Administrative Order No. 2017-15 (Guidelines on Public Participation under the Philippine Environmental Impact Statement (EIS) System)
• EMB MC 2014-005 (Revised Guidelines for Coverage Screening and Standard Requirements under PEISS)

S E C F O R M 1 7 - A 55
Water
• Republic Act No. 9275 or the Philippine Clean Water Act of 2004
• DENR Administrative Order No. 10, Series of 2005 (Implementing Rules and Regulations of R.A. No. 9275)
• DENR Administrative Order No. 35, Series of 1990 (General Effluent Standards)
• DENR Administrative Order No. 39, Series of 2003 (Environmental Users Fees)
• DENR Administrative Order 2016-08 (Water Quality Guidelines & General Effluent Standards)
• DOH Operations Manual on the Rules and Regulations Governing Domestic Sludge and Septage
Air
• Republic Act No. 8749 or the Philippine Clean Air Act of 1999
• DENR Administrative Order No. 81, Series of 2000 (Implementing Rules and Regulations of R.A. 8749)
• EMB Memorandum Circular 2007-003 (Policy on Compliance and Permitting for Industrial Facilities Relating to Air Quality)
Solid Waste
• Republic Act No. 9003 or the Ecological Solid Waste Management Act of 2000
• DENR Administrative Order No. 34, Series of 2001 (Implementing Rules and Regulations of R.A. No. 9003)
Hazardous Wastes and Chemicals
• Republic Act No. 6969 or the Toxic Substances, and Hazardous and Nuclear Waste Control Act of 1990
• Philippine Drug Enforcement Agency – Republic Act 9165- Regulatory Controls in Licit Trade of Controlled Precursors and Essential Chemicals
• Philippine National Police – License to Possess/Purchase Explosives (Chemical used in the laboratory that are ingredients/kind of explosives)
• DENR Administrative Order No. 29, Series of 1992 (Implementing Rules and Regulations of R.A. No. 6969)
• DENR Administrative Order 2004-36 (Revised Procedural Manual on Hazardous Waste Management)
• DENR Administrative Order No. 22, Series of 2013 (Revised Procedures and Standards for the Management of Hazardous Waste)
• DENR Administrative Order 2005-27 (Revised Priority Chemical List)
• DENR Administrative Order 2007-23 (Prescribing additional Requirements for the Issuance of the Priority Chemical List Compliance Certificate)
• DENR Administrative Order for all Chemical Control Orders
• DENR Administrative Order 2013-24 Chemical Control Order for Lead
• DENR Administrative Order 1997-38 Chemical Control Order for Mercury & Mercury Compounds
• DENR Administrative Order 1997-39 Chemical Control Order for Cyanide & its Compound
• DENR Administrative Order 2004-08 Revised Regulations on the Chemical Control Order for Ozone Depleting Substances (ODS)
• DENR Administrative Order 2000-02 Chemical Control Order for Asbestos
• DENR Administrative Order 2004-01 Chemical Control Order for Polychlorinated Biphenyls (PCB)
LLDA
• Board Resolution No. 408, Series of 2011 (Approving Revised Definition of Developmental Activities Required to Secure LLDA Clearance and Its Implementing Rules and Regulations)
• Board Resolution No. 408, Series of 2011 (Approving Revised Definition of Developmental Activities Required to Secure LLDA Clearance and Its Implementing Rules and Regulations)
• Board Resolution No. 248, Series of 2005 (Providing Guidelines on the Use of Shoreland Areas Surrounding the Laguna De Bay)
• Board Resolution No. 283, Series of 2006 (Resolution Providing Guidelines on Reclamation within the Shoreland of Laguna De Bay)
• Board Resolution No. 113, Series of 1999 (Adding the Implementing Guidelines Governing the Lease of the Laguna De Bay Shoreland Areas)
• Board Resolution No. 523, series of 2017, Adoption of Department Administrative Order 2016-08 of the DENR as the New Effluent Standards for the Continuous Implementation of the

S E C F O R M 1 7 - A 56
Environmental Users Fee System and Water Quality Guidelines for Surface Waters within the Laguna de Bay Region and for Other Purposes
Others
• Republic Act No. 4850 or the Act Creating the LLDA
• Relevant LLDA Board Resolutions and Memorandum Circulars, including but not limited to Resolution No. 25, Series of 1996 (Environmental User Fee System in the Laguna de Bay Region) and Resolution No. 33, Series of 1996 (Approving the Rules and Regulations Implementing the Environmental User Fee System in the Laguna de Bay Region)
• Presidential Decree No. 856 or the Philippine Sanitation Code
• Implementing Rules and Regulations of the Philippine Sanitation Code
• RA 9514 Fire Code of the Philippines
• DOLE Dept. Order 198, Series of 2018, An Act Strengthening Compliance with OSH Standards
• RA 9136, Electric Power Industry Reform Act of 2001
• Philippine National Standards for Drinking Water 2007
• NWRB Resolution No. 03-0715 0f 2015 (Approval of the revised 2015 NWRB Fees & Charges
• PD 1067 Water Code of the Philippines
• IRR of Water Code of the Philippines 1979
Social
• Republic Act 8371 - The Indigenous Peoples Rights Act of 1997. Other Matters The Group has not been involved in any bankruptcy, receivership or similar proceeding as of December 31, 2019. Further, except as discussed above, the Group has not been involved in any material reclassification, consolidation or purchase or sale of a significant amount of assets not in the ordinary course of business. The Group is not dependent on a single customer or a few customers, the loss of any or more of which would have a material adverse effect on the Group. For further information on MWC, please refer to its 2019 Financial Reports and SEC17A which are available in its website www.manilawater.com.ph.

S E C F O R M 1 7 - A 57
INTEGRATED MICRO-ELECTRONICS, INC. Background and Business Established in 1980, Integrated Micro-Electronics, Inc. (alternately referred to as IMI, “the Company”, “the Parent Company” or “the Group” in the entire discussion of Integrated Micro-Electronics, Inc), has grown into a global company offering core manufacturing capabilities as well as higher value competencies in design, engineering, prototyping and supply chain management. IMI is a vertically integrated EMS provider to leading global original equipment manufacturers (“OEMs”) across industries including computing, communications, consumer, automotive, industrial and medical electronics segments, as well as emerging industries like renewable energy. IMI also provides power semiconductor assembly and test services.
Business Development Integrated Micro-Electronics, Inc., a stock corporation organized and registered under the laws of the Republic of the Philippines on August 8, 1980, has four wholly-owned subsidiaries, namely: IMI International (Singapore) Pte. Ltd. (IMI Singapore), IMI USA, Inc. (IMI USA), IMI Japan, Inc. (IMI Japan) and PSi Technologies, Inc. (PSi) (collectively referred to as the Group). The Parent Company is 52.03% owned by AC Industrial Technology Holdings, Inc. (AC Industrials), a wholly-owned subsidiary of Ayala Corporation (AC), a corporation incorporated in the Republic of the Philippines and listed in the Philippine Stock Exchange (PSE). AC is 47.33% owned by Mermac, Inc. (Ultimate Parent Company) and the rest by the public. The registered office address of the Parent Company is at North Science Avenue, Laguna Technopark- Special Economic Zone (LT-SEZ), Bo. Biñan, Biñan, Laguna. The Parent Company was listed by way of introduction in the PSE on January 21, 2010. It has completed its follow-on offering and listing of 215,000,000 common shares on December 5, 2014. On March 2, 2018, the Parent Company completed the stock rights offer and listing of 350,000,000 common shares to all eligible stockholders. The Parent Company is registered with the Philippine Economic Zone Authority (PEZA) as an exporter of printed circuit board assemblies (PCBA), flip chip assemblies, electronic sub-assemblies, box build products and enclosure systems. It also provides the following solutions: product design and development, test and systems development, automation, advanced manufacturing engineering, and power module assembly, among others. It serves diversified markets that include those in the automotive, industrial, medical, storage device, and consumer electronics industries, and non-electronic products (including among others, automobiles, motorcycles, solar panels) or parts, components or materials of non-electronic products, as well as to perform and provide information technology services such as but not limited to data labeling/encoding or image annotation services. IMI Singapore is a strategic management, investment and holding entity that owns operating subsidiaries of the Group and was incorporated and domiciled in Singapore. Its wholly-owned subsidiary, Speedy-Tech Electronics Ltd. (STEL), was incorporated and domiciled also in Singapore. STEL, on its own, has subsidiaries located in Hong Kong and China. STEL and its subsidiaries (collectively referred to as the STEL Group) are principally engaged in the provision of electronic manufacturing services (EMS) and power electronics solutions to original equipment manufacturers (OEMs) in the automotive, consumer electronics, telecommunications, industrial equipment, and medical device sectors, among others. In 2009, IMI Singapore established its Philippine Regional Operating Headquarters (IMI International ROHQ or IMI ROHQ). It serves as an administrative, communications and coordinating center for the affiliates and subsidiaries of the Group. In 2011, the Parent Company, through its indirect subsidiary, Cooperatief IMI Europe U.A. (Cooperatief) acquired Integrated Micro-Electronics Bulgaria EOOD (formerly EPIQ Electronic Assembly EOOD) (IMI BG), Integrated Micro-Electronics Czech Republic s.r.o. (formerly EPIQ CZ s.r.o.) (IMI CZ) and Integrated Micro-Electronics Mexico, S.A.P.I. de C.V. (formerly EPIQ MX, S.A.P.I. de C.V.) (IMI MX) (collectively referred to as the IMI EU/MX Subsidiaries). IMI EU/MX Subsidiaries design and produce PCBA, engage in plastic injection, embedded toolshop, supply assembled and tested systems and sub-systems which include drive and control elements for automotive equipment, household appliances, and industrial equipment, among others. IMI EU/MX Subsidiaries also provide engineering, test and system development and logistics management services.

S E C F O R M 1 7 - A 58
In 2016, Cooperatief acquired a 76.01% ownership interest in VIA Optronics GmbH (VIA), a Germany-based company with operations in Germany and China and sales offices in the USA and Taiwan. VIA is a leading provider of enhanced display solutions for multiple end markets in which superior functionality or durability is a critical differentiating factor. The acquisition allows the Group to strengthen its partnerships with customers by offering complementary automotive camera and display monitor solutions for advanced driver assistance systems. The Group together with VIA enables the scale to introduce patented technology into automotive camera monitor systems for increased safety. In 2018, VIA acquired 65% ownership interest in VTS-Touchsensor Co., Ltd. (VTS), a Japanese entity that develops and manufactures metal mesh touch sensor technologies and electrode base film. In 2018, the Group opened its 21st manufacturing site in Niš, Republic of Serbia in line with the IMI’s strategy to strengthen its global footprint and support the growing market for automotive components in the European region. In 2019, VIA formed VIA Optronics AG (VIA AG) by way of a contribution in kind against issuance of new shares making VIA AG the sole shareholder of VIA Optronics GmbH. The contribution in kind and resulting re-organization was recognized as a business combination under common control. In the same year, VIA Optronics (Taiwan) Ltd was also founded as a new subsidiary with the purpose of conducting sales activities. In 2017, IMI, through its indirect subsidiary Integrated Micro-electronics UK Limited (IMI UK), acquired an 80% stake in Surface Technology International Enterprises Limited (STI), an EMS company based in the United Kingdom (UK). STI has factories in the UK and Cebu, Philippines. STI provides electronics design and manufacturing solutions in both PCBA and full box-build manufacturing for high-reliability industries. The acquisition of STI strengthens the Group’s industrial and automotive manufacturing competencies, broaden its customer base, and also provides access to the UK market. Further, the partnership allows the Group’s entry into the aerospace, security and defense sectors. IMI USA acts as direct support to the Group’s customers by providing program management, customer service, engineering development and prototype manufacturing services to customers, especially for processes using direct die attach to various electronics substrates. It specializes in prototyping low to medium PCBA and sub-assembly and is at the forefront of technology with regard to precision assembly capabilities including, but not limited to, surface mount technology (SMT), chip on flex, chip on board and flip chip on flex. IMI USA is also engaged in advanced manufacturing process development, engineering development, prototype manufacturing and small precision assemblies. IMI Japan was registered and is domiciled in Japan to serve as IMI’s front-end design and product development and sales support center. IMI Japan was established to attract more Japanese OEMs to outsource their product development to IMI. PSi is a power semiconductor assembly and test services company serving niche markets in the global power semiconductor market. PSi provides comprehensive package design, assembly and test services for power semiconductors used in various electronic devices. IMI France serves as a support entity which provides manufacturing support services, market research and analysis, sales promotional activity support, strategic planning advisory, and general corporate marketing support.
Product Capabilities
IMI has experience in working with some of the world’s leading companies in the following products:
Automotive Electronics Safety ▪ Electronic Power Steering ▪ Communication Power ▪ Electronic Stability Program (ESP) ▪ Body Control Module (BCM) ▪ Headlight ▪ Backlight ▪ Switch and Fan Controller ▪ HVAC control panel

S E C F O R M 1 7 - A 59
Advanced Driver Assistance Systems ▪ Front Vision ▪ Surround View ▪ Rear View Camera ▪ Mirror Replacement Systems ▪ ADAS ECUs Sensors ▪ Tire Pressure Sensor ▪ Temperature and Humidity Sensor ▪ Rotor Position Sensor (RPS) ▪ Gasoline System sensor ▪ Transmission sensor ▪ Speed sensor ▪ Connector sensor ▪ Engine sensor Others ▪ Anti-fogging system ▪ Wiper ▪ Gear box shift ▪ Window lifter ▪ Head rest Industrial Electronics Security ▪ Electronic Door Access System ▪ Biometrics ▪ Asset tracking ▪ Radiation detector ▪ Security alarm Automation ▪ System Integration (Robotics) ▪ Automated Meter Readers Power Management and Smart Grid ▪ Modules for Renewable Energy Generation, Transmission and Conversion ▪ Solar Panel ▪ Solar Inverters ▪ EV Charging Systems ▪ Power module ▪ Building and lighting control ▪ Thermostat ▪ Charger for agricultural machine ▪ Energy management ▪ Timer ▪ Monitoring and control system Controls and Sensors ▪ Printer Control ▪ Power Amplifier ▪ DC-DC Power Converter ▪ Engine Controllers ▪ Mirror Controls ▪ Industrial system and switch ▪ Anti-pitch sensors ▪ Luminaire Controller Others ▪ LED lighting ▪ Aircon damper ▪ Accelerometer ▪ UPS ▪ Industrial power

S E C F O R M 1 7 - A 60
▪ Power supply ▪ Industrial tooling Medical Electronics Diagnostics ▪ Static detectors for fix and mobile RAD exams ▪ Auto Body Contouring Imaging Equipment ▪ Defibrillator Component ▪ Biomedical and Laboratory Equipment ▪ Centrifuge Control ▪ Fitness Equipment Control Others ▪ Dental Imaging System ▪ Hearing Aids Communications Electronics Telecom Equipment and Devices ▪ Cellular alarm communicators for LTE networks ▪ Back Panel ▪ Fiber to “X” (FFTx) systems ▪ Booster Amplifier ▪ GPON (Gigabit Passive Optical Network) Systems ▪ Base Station Power Supply ▪ Digital Station Control ▪ Power Transistors for amplifiers in cellular base stations ▪ Power Conversion ICs in adapters and chargers for cell phones and cordless phones ▪ DC Port and USB Port Protection for cell phones and satellite radio peripherals ▪ RF Signal Analyzer ▪ RF Meter Consumer Electronics White goods ▪ Gas Ignitor and Re-Ignitor ▪ Air-Conditioning (HVAC) Controller ▪ Refrigerator and Cooker Hood Control ▪ Power Management & Home Appliance ▪ Household Metering Device ▪ Electric Drive Control for Home Appliances ▪ Programmable Timer ▪ Pressure Cookers ▪ Washing Machine controllers ▪ Coffee Machines Personal devices and lighting ▪ Ultrasonic Toothbrush ▪ Projector Lamp Drivers ▪ Bluetooth Headset ▪ Main Power Supply for Flat-panel TV ▪ Power Supply for Game Consoles and Entertainment Electronics ▪ High Voltage Power Conversion ICs in Adapters and Chargers for Personal Electronics Power Semiconductor ▪ Low˗Medium Power Packages ▪ Medium˗High Power Packages ▪ Small Signal Packages Optical Bonding, Enhanced Display Solutions and Metal Mesh Touch Sensor Technology
(VIA/VTS) ▪ Fully customized Interactive Display Systems (mirror replacement, driver monitoring systems,
camera management systems, etc.) ▪ High reliable, sunlight readable enhanced display solutions ▪ Metal mesh touch sensor technology and image processing ▪ Camera solutions (Minicube, MicroCube, Configurable Standard Camera Modules)

S E C F O R M 1 7 - A 61
Precision Machining ▪ Conventional machines ▪ CNC Turning with Milling function ▪ CNC Vertical Machining center (3 axis, 5 axis) ▪ Coordinate Measuring Machine (CMM) ▪ Hydraulic Press Brake and Hydraulic Shear Aviation ▪ Fuel Computers ▪ Brake by Wire ▪ Entertainment Controls ▪ Satellite Communications ▪ Inflight internet systems ▪ Lighting Retro-fit ▪ Safety equipment ▪ Captor Radar ▪ Navigation and Communications Systems ▪ Cockpit Displays
Except as otherwise disclosed as above, there are no other publicly-announced new products or services during the year.
Other Capabilities and Services
Design and Development (D&D) Group Our Product Design and Development or D&D team has extensive competencies in electronic design, mechanical design, software and product development, and building platforms in the areas of automotive cameras, motor drives, and power modules. The team has developed platforms that can be customized to the requirements of our customers as well. The D&D team also provides full design services from concept to product validation and can be involved in full design or in co-design level depending on the customer’s needs. Test and Systems Development (TSD) IMI Test and Systems Development expanded its portfolio of tester solutions for automotive applications and power module manufacturing in 2019. Most projects were executed through cross-site collaboration of TSD teams from different IMI global locations. Two new fully automated test platforms for automotive electronic products (power tailgate and window lifter controllers) were built for IMI China and Mexico plants. These platforms integrated high speed automation for device under test (DUT) handling to maximize throughput and efficiency. The TSD team in China also introduced a new line of testers for high end ambient lighting systems based on LIN-RGB technology. For IMI PH operations, a new tester platform which includes an automated focusing and alignment station and an end of line tester for a driver monitoring system camera was designed and built for a major OEM. This is now utilized for samples build. The team also supported the ramp of existing automotive camera customers with replications of camera testers running in mass production as well as the development of new prototype testers for new projects and customers. The TSD PH team also introduced a tester-handler system solution for power modules which demonstrates capability for testing at >150C. This solution will be integrated in new projects for high power IGBT and silicon carbide power modules. Development of mass production testers solutions for next generation power module products, in particular for silicon carbide technology products, kicked off during the last quarter of 2019. Analytical Testing and Calibration (ATC) Laboratory Analytical Testing and Calibration (ATC) Laboratory continues to develop its testing and calibration services to both IMI internal and external customers from various industries such as automotive, medical and aerospace. In 2019, the vibration test system with climatic chamber located in the ATC Lab Extension Building is on full operations accommodating job requests from IMI Automotive and Power Module business as well as External Customers. The laboratory is able to expand its nano scale capabilities and capacity through established partnership with top internationally known ISO17025 accredited laboratories with frontier technological capabilities.

S E C F O R M 1 7 - A 62
ATCOS, the ATC Online System made its debut launch for Phase 1 last Q2 of 2019. The said laboratory information management system effectively manages work activities and associated data to improve laboratory efficiency. Advanced Manufacturing Engineering (AME) IMI’s global AME team in the Philippines and Asia focused on developing a new production line for an industrial grade fingerprint sensor module assembly of bare sensors with thin cover glass and fine trace ACF (anisotropic conductive film) interconnects to supplement an existing fingerprint ID box build assembly and test operation previously utilizing pre-built sensor module assemblies in IMI Laguna. In parallel, the AME team worked on enhancing process and mechanical component DFM (design for manufacturability), as well as Value Engineering capability in preparatory and early collaboration activities for products such as automotive ECU (electronic control unit) and ADAS (advanced driver-assistance system) sensor modules - including projects based on IMI minicube platform, modules utilizing BSI (backside illumination) bare imagers, and LIDAR (light imaging, detection, and ranging) modules; also lighting modules, RF (radio frequency) exposure test modules, EV (electric vehicle) scooters, industrial security access interface modules, and even educational programming robots. AME teams in the Philippines and China also continued to share engineering expertise during ramp-up of the modular automated lines manufacturing complex electro-mechanical ECU assemblies in IMI Jiaxing and IMI Mexico with two lines developed, completed, and commissioned together with IMI Automation Backend (ABE), and the local plant Manufacturing Engineering, CFT, Quality and Production teams, including on resolving strict cleanliness, selective conformal coating, thermal operating validation test findings resolution, and general line optimization. The AME team in China also extended technical support and operational expertise at the Power Module New Product Introduction (NPI) and Operations at IMI Laguna for the power modules supplied to the IMI Jiaxing plant. AME team in China (in coordination with China Regional Engineering) efforts are focusing and anticipating the development of H2 & H3 processes that are aligned to IMI’s new specialized electronics manufacturing service (EMS) segment and direction. In-demand processes were already identified and are on the way to development. The AME team in the Philippines also expanded engineering personnel rotation to IMI USA operations to enhance learning and synergies as well as supporting early collaboration work with industrial, medical and other US based customers while preparing to set-up the local prototyping line in Laguna. AME also collaborates with D&D on a low cost automotive camera using Himax and flip chip technologies, and also works with D&D Europe on the power module – which are used primarily in power management platforms for partial to full vehicle electrification. Automation IMI’s global Automation Back End (ABE) group has successfully set-up a full Automation Line for ECU Assembly at its Factory in Jiaxing, PRC. This 3rd Automated Back-End Line is by far the best version of the previous 2 Lines. This was achieved by carefully going through Design FMEA, rectifying all the flaws and lessons learned, detailed and crisp execution of the Project Plan, and better collaboration with the new professional Integrator. It is also the Year where IMI Automation Group has demonstrated its capability to set-up on its own a fully automated Cell for its plastic Injection factory in IMI Mexico, serving another big Automotive Customer who appreciated highly and commended the successful deployment of the project. Camera Vision Technology (CVT) IMI continually work with both Automotive Tier 1 and Tier 2 in areas where high levels of innovation happen such as mirror replacement, driver monitoring, and autonomous driving. VIA Optronics, IMI’s subsidiary in Germany that manufactures advanced display solutions, oversees the camera vision technology services to support the various ADAS application requirements in automotive. Equipped with ten years of camera and extreme vision technology development experience, the group develops platform designs that can be customized to reduce total development time.

S E C F O R M 1 7 - A 63
Segment Information
Management monitors operating results per geographical area for the purpose of making decisions about resource allocation and performance assessment. It evaluates the segment performance based on gross revenue, interest income and expense and net income before and after tax of its major manufacturing sites. The Parent Company and PSi are combined under Philippine segment, STEL Group is categorized under China segment, IMI BG, IMI CZ and IMI Serbia are combined under Europe based on the industry segment and customers served, IMI Mexico is presented under Mexico segment, VIA and STI are combined under Germany/UK segment representing non-wholly owned subsidiaries, IMI USA, IMI Japan, IMI UK and IMI Singapore/ROHQ are combined being the holding and support facilities for strategic management, research and development, engineering development and sales and marketing. Prior period information is consistent with the current year basis of segmentation. Intersegment revenue is generally recorded at values that approximate third-party selling prices.
Revenue Contribution by Industry Segment (in US$)
Revenue Contribution by Customer Nationality (in US$)
Foreign Subsidiaries’ Contribution
2019 2018 2017
Revenue Net
Income Revenue
Net
Income Revenue
Net
Income
Foreign Subsidiaries:
China/SG 22% 15% 25% 36% 25% 9%
Europe/Mexico 39% (86%) 31% 14% 33% 76%
Germany/UK (VIA/STI) 20% 137% 23% 21% 18% 15%
TOTAL 81% 66% 79% 71% 76% 101%
Attributable to equity holders of the Parent Company
Revenues are attributed to countries on the basis of the customer’s location. Certain customers that are independent of each other, but within the same company group, account for 9.94%, 10.55% and 12.58% of the Group’s total revenue in 2019, 2018 and 2017, respectively.
Sales and Distribution
The Company’s global presence allows it to provide solutions to OEMs thru its Tier 1 customers catering to regional and international markets. Given the Company’s presence worldwide, it is able to provide its customers access to a number of services and resources through its manufacturing facilities, engineering and design centers, and sales networks in Asia (China, Singapore, Taiwan, Japan, and the Philippines), North America (U.S. and Mexico), and Europe (Bulgaria, Czech Republic, France, and Germany).
2019 2018 2017
Automotive $599,518,201 $541,859,546 $446,460,645 Industrial 315,327,149 334,634,178 221,670,425 Consumer 127,298,191 176,176,123 188,760,154 Telecommunication 94,873,717 134,078,546 121,639,521 Aerospace/defense 52,919,112 56,827,484 24,973,446 Medical 15,980,478 12,954,240 19,303,996 Multiple market/others 44,449,066 92,870,328 67,780,002
$1,250,365,914 $1,349,400,445 $1,090,588,189
2019 2018 2017
Europe $639,508,462 $670,603,567 $519,149,422
America 218,518,165 292,610,530 240,888,727
Japan 39,191,710 45,241,436 42,842,182
Rest of Asia/Others 353,147,577 340,944,912 287,707,858
$1,250,365,914 $1,349,400,445 $1,090,588,189

S E C F O R M 1 7 - A 64
IMI Japan was registered and is domiciled in Japan to serve as IMI’s front-end design and development and sales support center. IMI Japan was established to attract more Japanese OEMs thru Tier 1 customers to outsource the design and development and manufacturing to IMI. In 2019, IMI continued to pursue opportunities in segments with the highest potential for growth and customer impact. The company’s core business pipeline expanded by US$283 million in new project awards, 74 percent of which are for automotive applications. By location, new program wins derived from Philippines and China accounted for 36 percent while 64 percent were awarded to Europe and Mexico. Meanwhile, STI Enterprises continued to strengthen its industrial and mil-aero capabilities with £81.9 million (US$104.3 million) major projects closed as of 2019.
Mergers and Acquisition
On April 9, 2018, VIA and Toppan Printing Co., Ltd. (Toppan) entered into an agreement to serve the market for copper-based metal mesh touch sensors. The agreement provides that Toppan transfer 65% of its shares in VTS to VIA. VTS is a newly formed spin-off company of Toppan. VTS develops and manufactures the metal mesh touch sensors in Japan on the existing premises of Toppan. The new setup strengthens VIA’s portfolio of differentiated and value-added sensor technology for touch panels, touch-display modules, display head assemblies, and interactive display systems across multiple markets and segments. As part of our strategic initiatives, IMI acquired an 80% stake in STI Enterprise Ltd., a private limited company based in the United Kingdom which provides electronics design and manufacturing solutions in both printed circuit board assembly and full box-build manufacturing for high-reliability industries. The company currently has two factories in the United Kingdom in Hook and Poynton as well as one in Cebu, Philippines and operates a design center in London. The acquisition will enable IMI to expand into the aerospace and defense markets while strengthening the industrial segment in manufacturing as well as in technology development and engineering.
Competition
IMI is now a global technology solutions company with 22 manufacturing facilities with presence in more than 10 countries, spanning through the continents of Asia, Americas, and Europe. The company has technology expertise and offerings in the whole breadth of electronics manufacturing services (EMS), power semiconductor assembly tests and services and vehicle assembly. IMI currently ranks 17th in the list of top 50 EMS providers in the world by the Manufacturing Market Insider (March 2019 edition), based on 2018 revenues. In the automotive market, it is now the 5th largest EMS provider in the world per New Venture Research. For almost 40 years, the company has developed its competence and value through cutting-edge engineering, design, innovation, and collaboration with partners. From being largely product-centric, IMI is now moving towards a technology-solutions approach by addressing efficiency, cost, quality, and productivity, while closely working with customers in research and development. IMI continues to leverage on its geographical footprint in providing services closer to our target markets. This in turn strengthens its ability to mitigate risks over market volatilities and geo-political trends in the global environment. IMI competes worldwide with focus on Europe, North America and Asia. IMI specializes in highly reliable and quality electronic solutions for long product life cycle segments such as automotive, industrial electronics and more recently, the aerospace market. In the automotive segment, IMI designs and manufacture next-generation automotive camera systems, displays, ADAS controllers, sensors, steering modules, and telematics. IMI also aims to accommodate more Internet-of-Things (IoT) opportunities in the pipeline that will enhance its current capabilities. It is involved in this sphere specifically in the areas of security, asset tracking, next generation displays, wireless monitoring, smart meters, and communication systems in aerospace and defense. IMI also continues to thrive in the production of various electronic systems that manage and control power in automotive and industrial markets. The Company’s performance is affected by its ability to compete and by the competition it faces from other global EMS companies. While it is unlikely for EMS companies to pursue identical business activities, the industry remains competitive. Competitive factors that influence the market for the Company’s products and services include: product quality, pricing and timely delivery.

S E C F O R M 1 7 - A 65
The Company is further dependent on its customers’ ability to compete and succeed in their respective markets for the products that the Company manufactures. There are two methods of competition: a) price competitiveness; and b) robustness of total solution (service, price, quality, special capabilities or technology). IMI competes with EMS companies original design manufacturer (ODM) manufacturers all over the world. Some of its fierce EMS provider competitors include Flex, Plexus and Kimball. Flextronics is a Singapore-headquartered company with annual revenues of US$26.2 billion in 2019; its cost structure is very competitive it is vertically integrated as well. Flextronics poses competition to IMI in the consumer and industrial segment. Plexus, a U.S.-based EMS, recorded US$3.2billion revenues in 2019. Plexus is a key EMS player in industrial, medical, communication and military sectors, which IMI play in this market. Kimball Electronics as a manufacturing facility located in Jasper, Indian with revenues of US$1.2 billion in 2019. Kimball is a competitor of IMI in the automotive, industrial and medical market
Principal Suppliers IMI’s suppliers are situated globally and are managed by the Global Procurement organization. The Company’s top 10 suppliers in 2019 comprise about 24% of global purchases. Purchases from suppliers generally comprise of electronic components processed by our facilities. The Company strives to manage the quality of the products supplied to ensure strict adherence to quality standards and only purchase from suppliers whose product meet all applicable health and safety standards.
Transactions with Related Parties Parties are considered to be related if one party has the ability, directly or indirectly, to control the other party or exercise significant influence over the other party in making financial and operating decisions. Parties are also considered to be related if they are subject to common control or common significant influence which include affiliates. Related parties may be individuals or corporate entities. The Group, in its regular conduct of business, has entered into transactions with subsidiaries, affiliate, and other related parties principally consisting of advances, loans and reimbursement of expenses. Sales and purchases of goods and services as well as other income and expenses to and from related parties are made at normal commercial prices and terms. Terms and Conditions of Transactions with Related Parties The Group has a Related Party Transactions (RPT) Committee that evaluates and governs related party transactions. Prior to finalization of any related party agreement, the management shall report for review and approval to the RPT Committee all new and proposed significant related party transaction above the threshold set by the RPT Committee. Outstanding balances at year-end are unsecured and settlement occurs in cash unless otherwise stated. For the years ended December 31, 2019, 2018 and 2017, the Group has not recorded any impairment on receivables relating to amounts owed by related parties. Impairment assessment is undertaken each financial year through examining the financial position of the related parties and the markets in which the related parties operate.
Intellectual Property
The table below summarizes the intellectual properties registered with the Patent and Trademark Offices in the United States, Europe and Asia:
• Auto camera – Minicube filed in December 2013
• In addition to certain patents, know-how and expertise is critical
• IMI is able to leverage its extensive experience in unique applications to other relevant products
Existing / Pending Patents
Descriptions Location / Filing Date
Expiration Date
United States Patent 9,839,142
Vacuum Pallet Reflow, a soldering device and method of soldering enabling vacuum reflow while using a standard reflow oven conveyor.
Dec 2017

S E C F O R M 1 7 - A 66
Pending USPTO 13457670
Used for die attach of power devices that require very minimal voiding between device and substrate to avoid localized heating and potential failure. Describes a new process to perform soldering in a vacuum environment to promote minimal voiding without the use of specialized and expensive equipment, solder preform and gas atmospheres, but with the efficiency of a standard reflow soldering process.
April 2012 In Process
Pending PCT/US12/51573
A flip chip video camera mounted on a flexible substrate with glass stiffener
August 2012 In Process
Pending USPTO 14109918
Unique construction of camera module that enhances the dissipation of heat generated by the image sensor while being easy to manufacture.
December 2013 In Process
United States Patent 6,571,468 6,846,701
A method for forming a fine-pitch flip chip assembly interconnects fine pitch devices after they have been connected to a carrier substrate.
California, USA, 2001
2021
United States Patent 6,776,859
An improved anisotropic bonding system and method connects two conductive surfaces together using an anisotropic material having elastic conductive particles dispersed in an insulating heat-curable carrier.
California, USA, 2000
2020
United States Patent 6,648,213
A method for manufacturing a chip assembly that includes the steps of applying a controlled amount of flux to plurality of solder balls on a die, applying a non-fluxing underfill material to a substrate, and assembling the die and substrate together to form the chip assembly such that the non-fluxing underfill material is trapped between the die and the substrate.
California, USA and Singapore,
2001
2021
United States Patent 6,414,859
A passive component circuit comprising a bridge rectifier that is coupled in parallel to three capacitors.
Singapore, 2000 2020
United States Patent 7,787,265 B2
A dual switch forward power converter, and a method of operating the same, employs a self- coupled driver to achieve among other advantages higher efficiency, lower part count and component cost.
Singapore, 2007 2027
United States Patent 8,937,432 B2
Light Source Having LED Arrays for Direct Operation in Alternating Current Network and Production Method Thereof.
USA, 2015 2031
Japan - 6 267 665
Bezelless display system
January 5, 2018
Taiwan - I 444 942 July 2014
USA - US7924362 April 2011
China - ZL 2013 1 0446342.1
Nozzle to apply dry bonding preform
April 2018
Germany – 102013219628B4
August 2016
South Korea – 10-1 703 383
January 2017
Taiwan – I 530 330 April 2016
Japan - JP 5513136 Enhanced liquid crystal display system and methods
April 2014
Taiwan - I 437 068 May 2014
USA – 9 348 167 May 2016
Germany – 600 42 590.8-08
SBLR (Super Bright Low Reflectance
July 2009
Canada – 2 359 228 August 2005
Taiwan – I 280 443 May 2007
USA – 7 405 779 July 2008
USA – 6 933 991 August 2005
USA – 7 649 577 January 2010
Taiwan – I 601 801 Partial curing of the bond layer through temperature control
October 2017
China – ZL 2016 8 0016748.8
Bonding for large displays October 2019
China – ZL 2016 1 0749648.8
Curved screen and flat panel display module full-lamination method and integrated screen
August 2018

S E C F O R M 1 7 - A 67
Government Regulations and Approvals IMI complies with all existing government regulations applicable to the company and secures all government approvals for its registered activities. Currently, there are no known probable governmental regulations that may significantly affect the business of the Company. IMI is subject to various national and local environmental laws and regulations in the areas where it operates, including those governing the use, storage, discharge, and disposal of hazardous substances in the ordinary course of its manufacturing processes. If more stringent compliance or cleanup standards under environmental laws or regulations are imposed, or the results of future testing and analyses at IMI’s manufacturing plants indicate that it is responsible for the release of hazardous substances, IMI may be exposed to liability. Further, additional environmental matters may arise in the future at sites where no problem is currently known or at sites that IMI may acquire in the future. IMI closely coordinates with various government agencies and customers to comply with existing regulations and continuously looks for ways to improve its environmental and safety standards. Below is the detailed enumeration of its permits and licenses together with its pertinent details:
License/Permit Name Regulatory Body
SEC Certificate of Registration Securities and Exchange Commission
PEZA Certificate of Registration - Export Enterprise Philippine Economic Zone Authority
PEZA Certificate of Registration - Facilities Enterprise Philippine Economic Zone Authority
BIR Form 2303 - Certificate of Registration Bureau of Internal Revenue
Permit to Use Computerized Accounting System Bureau of Internal Revenue
Permit to Use Loose-leaf Invoices Bureau of Internal Revenue
Authority to Print Invoices
Bureau of Internal Revenue 1. Sales Invoice; Official Receipt (back up invoices
during system downtime 2. Billing Invoice; Collection Receipt (back up
invoices during system downtime) 3. Official Receipt; Service Invoice;
Acknowledgement Receipt 4. Debit Memo; Credit Memo
Barangay Business Clearance Barangay Binan
Business Permit City of Binan
Environmental Clearance (for Business Permit) City of Binan
Engineering Clearance (for Business Permit) City of Binan
Zoning Clearance (for Business Permit) City of Binan
Sanitary Permit (For Business Permit) City of Binan
Environmental Compliance Certficate Department of Environment and Natural Resources
Laguna Lake Development Authority Discharge Permit Laguna Lake Development Authority
Permit To Operate - Emission Source Installation
Department of Environment and Natural Resources CG
SSCG
Philippine Drug Enforcement Agency Permit Philippine Drug Enforcement Agency
License to Operate and X-Ray Facility Department of Health - Food and Drug Administration
License to Handle Controlled Precursors & Essential Chemicals
Philippine Drug Enforcement Agency
License-to-Possess Explosives (Nitric Acid)
Philippine National Police CG
SSCG
Radioactive Material License Philippine Nuclear Research Institute
Fire Safety Inspection Certificate Bureau of Fire Protection
License/Permit Name Location Integrated Micro-Electronics, Inc.
License/Permit No. Issue Date Expiry Date
SEC Certificate of Registration 94419 8/8/1980
PEZA Certificate of Registration - Export and IT Enterprise
Laguna and Cavite
94-59 (Amended) 6/11/2019
PEZA Certificate of Registration - Facilities Enterprise
Laguna 11-19-F 11/29/2011
BIR Form 2303 - Certificate of Registration
Laguna OCN 8RC0001459939E
2/28/2018
Cavite OCN 8RC0000039988 12/12/2012

S E C F O R M 1 7 - A 68
Permit to Use Computerized Accounting System
Laguna and Cavite
1214-116-00171CAS 1/1/2015
Permit to Use Loose-leaf Invoices Laguna and Cavite
LTAD-LL-09-769-14 9/5/2014
Authority to Print Invoices
Laguna OCN 8AU0000356125 8/28/2019 8/27/2024
OCN 8AU0000356126 8/28/2019 8/27/2024
Cavite OCN 8AU0000356508 8/30/2019 8/29/2024
OCN 8AU0000356509 8/30/2019 8/29/2024
Business Permit Laguna 2020-06430 3/9/2020 12/31/2020
Barangay Business Clearance Laguna 2020-01 1/22/2020 12/31/2020
Environmental Clearance (for Business Permit)
N/A
Engineering Clearance (for Business Permit)
N/A
Zoning Clearance (for Business Permit)
N/A
Sanitary Permit (For Business Permit)
N/A
License/Permit Name IMI ROHQ
License No. Issue Date Expiry Date
SEC Certificate of Registration FS200905182 4/16/2009
BIR Form 2303 - Certificate of Registration OCN 1RC000634390 6/25/2013
Authority to Print Invoices OCN 1AU0001692572 9/22/2017 9/21/2022
OCN 1AU0001802502 5/21/2018 5/20/2023
Barangay Business Clearance 2020-01 1/10/2020 12/31/2020
Business Permit 2020-00975 1/10/2020 12/31/2020
Environmental Clearance (for Business Permit) N/A
Engineering Clearance (for Business Permit) N/A
Zoning Clearance (for Business Permit) N/A
Sanitary Permit (For Business Permit) N/A
IMI paid nominal fees required for the submission of applications for the above-mentioned environmental laws. Research and Development Activities New capabilities for Power Module packages using transfer mold technology have been set up and will be ready for production in 2020 for automotive applications. This now gives IMI ability to develop and manufacture medium-power applications for high reliability and safety critical automotive applications. The design and development of the hybrid version of a pin-fin baseplate and heatsink for a full Silicon Carbide power module for electric vehicles is nearing completion. It will be ready for production by 2021. Also in full swing are the design and development of a medium power module using transfer molding process for aerospace application, and a complex power module with integrated control driver IC. This will pave the way for a new intelligent power package platform for automotive application. D&D Laguna is also developing an automotive grade camera lens heater and illumination module that supplements IMI’s automotive camera platform. This showcases its capabilities in CAN communication, LED light control, mechanical design for efficient thermal transfer, ingress protection and design in accordance to functional safety. IMI spent the following for research and development activities in the last three years: % to Revenues
2019 $4,645,409 0.37 2018 $6,287,175 0.47 2017 $3,506,223 0.32

S E C F O R M 1 7 - A 69
Human Resources
The Company has a total workforce of 17,215 employees as of December 31, 2019, shown in the following table:
2018 2019
Managers 473 497
Supervisors 1,622 2,148
Rank-and-File 3,064 3,079
Technicians/Operators 11,989 11,491
TOTAL 17,148 17,215
IMI’s projected headcount for 2020 is 18,325. The relationship between management and employees has always been of solidarity and collaboration from the beginning of its operations up to the present. The Company believes that open communication and direct engagement between management and employees are the most effective ways to resolve workplace issues. IMI has existing supplemental benefits for its employees such as transportation and meal subsidy, group hospitalization insurance coverage and non-contributory retirement plan. The Company has or will have no supplemental benefits or incentive arrangements with its employees other than those mentioned above. Risk Factors The Company’s business, financial condition and results of operation could be materially and adversely affected by risks relating to the Company and the Philippines. IMI’s operating results may significantly fluctuate from period to period There is a risk that the Company’s operating results may fluctuate significantly due to various factors including but not limited to geopolitical issues, macro-economic factors, changes in demand for its products and services, customers’ sales outlook, purchasing patterns, and inventory adjustments, changes in the types of services provided to customers, variations in the, volume of products, adjustments in the processes and manner of delivery of services, as well as alterations to product specifications on account of complexity of product maturity, the extent to which the Company can provide vertically integrated services for a product. The result is also affected by the Company’s effectiveness in managing its manufacturing processes, controlling costs, and integrating any potential future acquisitions, the Company’s ability to make optimal use of its available manufacturing capacity, changes in the cost and availability of labor, raw materials, and components, which affect its margins and its ability to meet delivery schedules, and the ability to manage the timing of its component purchases so that components are available when needed for production while avoiding the risks of accumulating inventory in excess of immediate production needs. Fluctuations in operating results may also be experienced by the Company on account of the advent of new technology and customer qualification of technology employed in the production, and the occurrence of any changes in local conditions or occurrence of events that may affect production volumes and costs of production, such as, but not limited to labor conditions, political instability, changes in law and regulation, economic disruptions or changes in economic policies affecting flow of capital, entry of competition, substantial rate hikes of utilities required for production. The Company may also experience possible business disruptions as a result of natural events such as fire and explosion due to presence and use of flammable materials in the operations, or force majeure. The factors identified above and other risks discussed in this section affect the Company’s operating results from time to time. Some of these factors are beyond the Company’s control. The Company may not be able to effectively sustain its growth due to restraining factors concerning corporate competencies, competition, global economies, and market and customer requirements. To meet the needs of its customers, the Company has expanded its operations in recent years and, in conjunction with the execution of its strategic plans, the Company expects to continue expanding in terms of geographical reach, customers served, products, and services. To manage its growth, the Company must continue to enhance its managerial, technical, operational, and other resources.

S E C F O R M 1 7 - A 70
The Company’s ongoing operations and future growth may also require funding either through internal or external sources. There can also be no assurance that any future expansion plans will not adversely affect the Company’s existing operations since execution of said plans may involve challenges. For instance, the Company may be required to be confronted with such issues as shortages of production equipment and raw materials or components, capacity constraints, difficulties in ramping up production at new facilities or upgrading or expanding existing facilities, and training an increasing number of personnel to manage and operate those facilities. Compounding these issues are other restraining factors such as more aggressive efforts of competition in expanding business, volatility in global economies and market and customer requirements. All these challenges could make it difficult for the Company to implement any expansion plans successfully and in a timely manner. In response to a very dynamic operating environment and intense industry competition, the Company focuses on high-growth/high-margin specialized product niches, diversifies its markets and products, engages in higher value add services, improves its cost structure, and pursues strategies to grow existing accounts. IMI is highly dependent on an industry that is characterized by rapid technological changes The demand for the Company’s solutions is derived from the demand of end customers particularly for end-use applications in the automotive, industrial, communications, consumer, and medical electronics industries. These industries have historically been characterized by rapid technological changes, evolving industry standards, and changing customer needs. Original Equipment Manufacturers (OEMS) continues to make adjustments to the design, and the choice of components, for their PCBAs, therefore requiring the Company to maintain regular communication with OEM customers and share forecast information with suppliers. The sudden change of demand may also create inventory buildup and may affect the supply chain flexibilities of IMI and abilities to adapt to the market change. New services or technologies may also render the Company’s existing services or technologies less competitive. If the Company does not promptly make measures to respond to technological developments and industry standard changes, the eventual integration of new technology or industry standards or the eventual upgrading of its facilities and production capabilities may require substantial time, effort, and capital investment. The Company is focusing on longer life cycle industries such as automotive, industrial and telecommunication infrastructure to reduce the volatility of model and design changes. The Company also keeps itself abreast of trends and technology development the electronics industry and is continuously conducting studies to enhance its technologies, capabilities and value proposition to its customers. It defines and executes technology road maps that are aligned with market and customer requirements. With rapid technological changes comes increasingly sophisticated methods to infiltrate information and communication systems. IMI’s maybe vulnerable to cybersecurity, information security, and data privacy breach. Information and cybersecurity risks, DDoS, ransomware, data breach, sabotage of production systems, penalties resulting from data privacy violations, reputation loss are important risk factors that the company needs to be able to manage and ensure sufficient and appropriate controls are in place. In this regard, we ensure strong and adequate information security controls are implemented to safeguard confidentiality, integrity, and prevent loss of our critical information. Automation, analytics and machine-learning algorithms have taken its step to a number of factories for quicker, more efficient production, with human operators monitoring and maintaining the systems. Understanding the role of our employees as resilient participants in this digital age, our cybersecurity awareness program is continuously running. We engaged a third-party online security training provider to support this initiative. Secure Email Gateway (SEG), Security Incident & Event Management (SIEM) and Security Operations (SOC) are in place to enhance security controls and mitigate existing risks at the same time. The company also complies with the Data Privacy Act (DPA) to protect all forms of information that are personal, private, or privileged. IMI has also as a global company IMI also maintains strict compliance to General Data Protection Regulations (GDPR). The industry where IMI operates in does not serve, generally, firm or long-term volume purchase commitments Save for specific engagements peculiar to certain products and services required, the Company’s customers do not generally contract for firm and long-term volume purchase. Customers may place

S E C F O R M 1 7 - A 71
lower-than-expected orders, cancel existing or future orders or change production quantities. There are no guaranteed or fixed volume orders that are committed on a monthly or periodic basis. In addition, the Company makes significant investment decisions, including determining the levels of business that it will seek and accept capacity expansion, personnel needs, and other resource requirements. These key decisions are ultimately based on estimates of customer long-term requirements. The rapid changes in demand for its products reduce its ability to estimate accurately long-term future customer requirements. Thus, there is the risk that resource investments are not optimized at a certain period. In order to manage the effects of these uncertainties, customers are required to place firm orders within the manufacturing lead time to ensure delivery. The Company does not solely rely on the forecast provided by the clients. By focusing on the longer cycle industry segments, the volatility that comes with rapid model changes is reduced and the Company is able to have a more accurate production planning and inventory management process. Buy-back agreements are also negotiated by the Company in the event there are excess inventory when customer products reach their end-of-life .To the extent possible, the Company’s contract include volume break pricing, and materials buy-back conditions to taper the impact of sudden cancellations, reductions, and delays in customer requirements. IMI may encounter difficulties in connection with its global expansion The Company’s globalization strategy has transformed it from a Philippines-centric company into a global network with manufacturing and engineering facilities as well as sales offices in Asia, Europe, and North America. This global expansion may expose the Company to potential difficulties that include diversion of management’s attention from the normal operations of the Company’s business, potential loss of key employees and customers of the acquired companies, physical, legal, cultural, and social impediments in managing and integrating operations in geographically dispersed locations, lack of experience operating in the geographic market of the acquired business, reduction in cash balance and increases in expenses and working capital requirements, which may reduce return on invested capital, potential increases in debt, which may increase operating costs as a result of higher interest payments, and complexities in integrating acquired businesses into existing operations, which may prevent it from achieving, or may reduce the anticipated synergy. The Company’s acquisitions of new companies or creation of new units, whether onshore or offshore, may also have an immediate financial impact to the Company due to the dilution of the percentage of ownership of current stockholders if the acquisition requires any payment in the form of equity of the Company, the periodic impairment of goodwill and other intangible assets, and liabilities, litigations, and/or unanticipated contingent liabilities assumed from the acquired companies. If the Company is not able to successfully manage these potential difficulties, any such acquisitions may not result in material revenue enhancement or other anticipated benefits or even adversely affect its financial and/or operating condition. To limit its exposure, the Company performs a thorough assessment of the upside and downside of any merger or acquisition. Supported by a team which focuses on business development, finance, legal, and engineering units, the vision, long-term strategy, compatibility with the culture, customer relationship, technology, and financial stability of the company to be acquired is carefully examined thorough due diligence to ensure exposures are mitigated through proper warranties. In addition, the Company looks at acquisitions that are immediately accretive to the P&L of the Company. The decision is then reviewed and endorsed by the Finance Committee, and approved by the Board. The Company carefully plans any merger or acquisition for a substantial period prior to closing date. Prior to closing of transactions, the Company forms an integration team and formulates detailed execution plans to integrate the key functions of the acquired entity into the Company. IMI may not be able to mitigate the effects of declining prices of goods over the life cycles of its products or as a result of changes in its mix of new and mature products, mix of turnkey and consignment business arrangements, and lower prices offered by competition The price of the Company’s products tends to decline over the later years of the product life cycle, reflecting decreased costs of input components, improved efficiency, decreased demand, and increased competition as more manufacturers are able to produce similar or alternative products. The gross margin for manufacturing services is highest when a product is first developed but as products mature, average selling prices of a product drop due to various market forces resulting in gross margin erosion. The Company may be constrained to reduce the price of its service for more mature products in order to remain competitive against other manufacturing services providers. This is most apparent in the automotive segment, where the reduction has historically been observed to occur between the first

S E C F O R M 1 7 - A 72
two to three years. The Company’s gross margin may further decline to be competitive with the lower prices offered by competition or to absorb excess capacity, liquidate excess inventories, or restructure or attempt to gain market share. The Company is moving towards a higher proportion of contracting under a turnkey production (with the Company providing labor, materials and overhead support), as compared to those under a consignment model, indicating a possible deterioration in its margins. The Company will also need to deploy larger amounts of working capital for turnkey engagements. To mitigate the effects of price declines in the Company’s existing products and to sustain margins, the Company continues to improve its production efficiency by increasing yields, increasing throughputs through LEAN and six sigma manufacturing process. In addition, the Company continues to leverage on its purchase base and supplier programs to avail of discounts and reduced costs in component prices. It also utilizes its global procurement network and supply chain capabilities to reduce logistics costs for components including inventory levels. The Company also intensifies its effort to contract with customers with higher-margin products most of which involve higher engineering value add and more complex box build or system integration requirements. IMI operates in a highly competitive industry Some of the Company’s competitors in the industry may have greater design, engineering, manufacturing, financial capabilities, or superior resources than the Company. Customers evaluate EMS and ODMs based on, among other things, global manufacturing capabilities, speed, quality, engineering services, flexibility, and costs. In outsourcing, OEMs seek to reduce cost. In addition, major OEMs typically outsource the same type of products to at least two or three outsourcing partners in order to diversify their supply risks. The competitive nature of the industry may result in substantial price competition. The Company faces increasing challenges from competitors who are able to put in place a competitive cost structure by consolidating with or acquiring other competitors, relocating to lower cost areas, strengthening supply chain partnerships, or enhancing solutions through vertical integration, among others. The Company’s customers may opt to transact with the Company’s competitors instead of the Company or if the Company fails to develop and provide the technology and skills required by its customers at a rate comparable to its competitors. There can be no assurance that the Company will be able to competitively develop the higher value add solutions necessary to retain business or attract new customers. There can also be no assurance that it will be able to establish a compelling advantage over its competitors. The industry could become even more competitive if OEMs fail to significantly increase their overall levels of outsourcing. Increased competition could result in significant price competition, reduced revenues, lower profit margins, or loss of market share, any of which would have a material adverse effect on the Company’s business, financial condition, and results of operations. The Company regularly assesses the appropriate pricing model (so as to ensure that it is strategic/value based or demand based, among others) to be applied on its quotation to existing or prospective customers. The Company is also strengthening its risk management capabilities to be able to turn some of the risks (e.g., credit risks) into opportunities to gain or maintain new or existing customers, respectively. The Company also continues to develop high value-add services that fit the dynamic markets it serves. It continues to enhance capabilities in design and development, advanced manufacturing engineering, test and systems development, value engineering, and supply chain management to ensure an efficient product realization experience for its customers. In addition, the Company’s size, stability and geographical reach allow it to attract global OEMs customers that look for stable partners that can service them in multiple locations. This is evidenced by increasing number of global contracts that the Company is able to develop and have multiple sites serving single customers. Focusing on high value automotive (such as those for ADAS and safety-related, power modules and electronic control units, among others), industrial, aerospace/defense and medical segments where strict performance and stringent certification processes are required, the Company is able to establish a high barrier of entry, business sustainability and better pricing. Generally, the Company has observed that it is usually difficult for customers in these industries to shift production as they would have to go through a long lead time in the certification process. The direction the Company has taken resulted in the rise of the Company’s ranking in the global and automotive EMS spaces. IMI may be subject to reputation and financial risks due to product quality and liability issues The contracts the Company enters into with its customers, especially customers from the automotive and medical industry, typically include warranties that its products will be free from defects and will perform in accordance with agreed specifications. To the extent that products delivered by the Company to its customers do not, or are not deemed to, satisfy such warranties, the Company could be

S E C F O R M 1 7 - A 73
responsible for repairing or replacing any defective products, or, in certain circumstances, for the cost of effecting a recall of all products which might contain a similar defect in an occurrence of an epidemic failure, as well as for consequential damages. Defects in the products manufactured by the Company adversely affect its customer relations, standing and reputation in the marketplace, result in monetary losses, and have a material adverse effect on its business, financial condition, and results of operations. There can be no assurance that the Company will be able to recover any losses incurred as a result of product liability in the future from any third party. In order to prevent or avoid a potential breach of warranties which may expose the Company to liability, the Company’s quality assurance focused on defect prevention, globalizing the culture of early detection and reaction to internal issues. The Company also refined its Advanced Product Quality Planning (APQP) procedure to ensure customer specific requirements on process and product quality are met early on the design and development phase before the product gets launched into production. The Company performs a detailed review and documentation of the manufacturing process that is verified, audited and signed-off by the customers. In addition, customers are encouraged, and in some cases, required to perform official audits of the Company’s manufacturing and quality assurance processes, to ensure compliance with specifications. The Company works closely with customers to define customer specifications and quality requirements and follow closely these requirements to mitigate future product liability claims. The Company also insures itself on product liability and recall on a global basis. IMI’s production capacity may not correspond precisely to its production demand The Company’s customers may require it to have a certain percentage of excess capacity that would allow the Company to meet unexpected increases in purchase orders. On occasion, however, customers may require rapid increases in production beyond the Company’s production capacity, and the Company may not have sufficient capacity at any given time to meet sharp increases in these requirements. On the other hand, there is also a risk of the underutilization of the production line, which may slightly lower the Company’s profit margins. In response, the Company makes the necessary adjustments in order to have a match between demand and supply. In the case of a lack in supply, the Company equips itself with flexible systems that allow it to temporarily expand its production lines in order to lower the overhead costs, and then make corresponding increases in its capacity when there is a need for it as well. To soften the impact of this, the Company closely coordinates with customers to provide the parties with regular capacity reports and action plan/s for common reference and future capacity utilizations. The Company also closely collaborates with its customers to understand the required technology roadmaps, anticipate changes in technological requirements, and discuss possible future solutions. IMI may be involved in intellectual property disputes The Company’s business depends in part on its ability to provide customers with technologically sophisticated products. The Company’s failure to protect its intellectual property or the intellectual property of its customers exposes it to legal liability, loss of business to competition and could hurt customer relationships and affect its ability to obtain future business. It could incur costs in either defending or settling any intellectual property disputes. Customers typically require that the Company indemnify them against claims of intellectual property infringement. If any claims are brought against the Company’s customers for such infringement, whether these have merit or not, it could be required to expend significant resources in defending such claims. In the event the Company is subjected to any infringement claims, it may be required to spend a significant amount of money to develop non-infringing alternatives or obtain licenses. The Company may not be successful in developing such alternatives or in obtaining such licenses on reasonable terms or at all, which could disrupt manufacturing processes, damage its reputation, and affect its profitability. Since the Company is not positioned as an ODM, the likelihood of the Company infringing upon product-related intellectual property of third parties is significantly reduced. Product designs are prescribed by and ultimately owned by the customer. The Company observes strict adherence to approved processes and specifications and adopts appropriate controls to ensure that the Company’s intellectual property and that of its customers are protected and respected. It continuously monitors compliance with confidentiality undertakings of the Company and management. As of the date of this Prospectus, there has been no claim or disputes involving the Company or between the Company and its customers involving any intellectual property.

S E C F O R M 1 7 - A 74
Demand for services in the EMS industry depends on the performance and business of the industry’s customers as well as the demand from end consumers of electronic products The performance and profitability of the Company’s customers’ industries are partly driven by the demand for electronic products and equipment by end-consumers. If the end-user demand is low for the industry’s customers’ products, companies in the Company’s industry may see significant changes in orders from customers and may experience greater pricing pressures. Therefore, risks that could harm the customers of its industry could, as a result, adversely affect the Company as well. These risks include the customer’s inability to manage their operations efficiently and effectively, the reduced consumer spending in key customers’ markets, the seasonality demand for their products, and failure of the customer’s products to gain widespread commercial acceptance. The impact of these risks was very evident in the aftermath of the global financial crisis which resulted in global reduction of demand for electronics products by end-customers. The Company mitigates the impact of industry downturns on demand by rationalizing excess labor and capacity to geographical areas that are most optimal, and by initiating cost containment programs. With indications of global financial recovery already in place, the Company has been able to re-hire some of its employees. There are also electronics requirements resulting from global regulations, such as those for improving vehicle safety and promoting energy-efficient technologies that would increase the demand for electronic products and equipment. The Company continuously addresses its concentration risks. There is no single customer that the Company is dependent on or accounts for more than 15% of the Company’s revenues. The Company also serves global customers which are not concentrated on a specific geographic market. IMI’s industry is dependent on the continuous growth of outsourcing by OEMs The Company belongs to an industry that is dependent on the strong and continuous growth of outsourcing in the communications, consumer automotive, industrial, and medical electronics industries where customers choose to outsource production of certain components and parts, as well as functions in the production process. A customer’s decision to outsource is affected by its ability and capacity for internal manufacturing and the competitive advantages of outsourcing. The Company’s industry depends on the continuing trend of increased outsourcing by its customers. Future growth in its revenue depends on new outsourcing opportunities in which it assumes additional manufacturing and supply chain management responsibilities from its customers. To the extent that these opportunities do not materialize, either because the customers decide to perform these functions internally or because they use other providers of these services, the Company’s future growth could be limited. The Company believes that its global footprint with manufacturing operations in Asia, Europe, and North America, its global supply chain systems and capabilities, and its design services will continue to provide strategic advantages for customers to outsource parts of their product development and manufacturing processes to the Company. IMI’s industry may experience shortages in, or rises in the prices of components, which may adversely affect business There is a risk that the Company will be unable to acquire necessary components for its business as a result of strong demand in the industry for those components or if suppliers experience any problems with production or delivery. The Company is also exposed to challenges surrounding lead-times within the electronic component market. The Company is often required by its customers to source certain key components from customer-nominated and accredited suppliers only, and it may not be able to obtain alternative sources of supply should such suppliers be unable to meet the supply of key components in the future. Shortages of components could limit its production capabilities or cause delays in production, which could prevent it from making scheduled shipments to customers. If the Company is unable to make scheduled shipments, it may experience a reduction in its sales, an increase in costs, and adverse effects on its business. Component shortages may also increase costs of goods sold because it may be required to pay higher prices for components in short supply and redesign or reconfigure products to accommodate substitute components. To the extent possible, the Company works closely with customers to ensure that there are back up suppliers or manufacturers for customer-supplied components or components supplied by customer-nominated suppliers to mitigate uncertainties in the supply chain. The changes in market also allows opportunities for the Company to consolidate strategic suppliers and improve supply chain cost,

S E C F O R M 1 7 - A 75
efficiencies and flexibilities, especially in passive and discrete components, and consolidate the global spend for global supplier management and negotiation instead of regional negotiation. In addition, the Company has established supplier certification and development programs designed to assess and improve suppliers’ capability in ensuring uninterrupted supply of components to the Company. Any shortage of raw materials or components could impair IMI’s ability to ship orders of its products in a cost-efficient manner or could cause IMI to miss its delivery requirements of its retailers or distributors, which could harm IMI’s business The ability of the Company’s manufacturers to supply its products is dependent, in part, upon the availability of raw materials and certain components. The Company’s manufacturers may experience shortages in the availability of raw materials or components, which could result in delayed delivery of products to the Company or in increased costs to it. Any shortage of raw materials or components or inability to control costs associated with manufacturing could increase the costs for the Company’s products or impair its ability to ship orders in a timely cost-efficient manner. As a result, it could experience cancellation of orders, refusal to accept deliveries, or a reduction in the Company’s prices and margins, any of which could harm the Company’s financial performance and results of operations. Other than for customer-nominated suppliers or specialty components for the manufacture of specific products, the Company is not dependent on a single supplier for its raw materials. IMI may be exposed to risk of inventory obsolescence and working capital tied up in inventories As an EMS provider, the Company may be exposed to a risk of inventory obsolescence because of rapidly changing technology and customer requirements. Delays in ramp up of new projects may result to inventory buildup therefore giving the Company exposure to potential inventory obsolescence which may require it to make adjustments to write down inventory to the lower of cost or net realizable value, and its operating results could be adversely affected. The Company is cognizant of these risks and accordingly exercises due diligence in materials planning. The Company works with key suppliers to establish supplier-managed inventory arrangements that will mutually reduce the risk. The Company also puts tight control in the inventory with regular negotiation with customers on demand change and suppliers on the pushout and cancellation of deliveries. In addition, the Company often negotiates buy back arrangements with customers where, in the event the customers’ purchase orders are delayed, canceled, or enter in the end-of-life phase, the customers assume the risk and compensate the Company for the excess inventory. IMI may, from time to time, be involved in legal and other proceedings arising out of its operations. The Company’s expanding global activities while continuing to present a myriad of growth opportunities, may tend to increase exposure to potential disputes with its employees and various parties involved in its manufacturing operations, including contractual disputes with customers or suppliers, labor disputes with workers or be exposed to damage or personal liability claims. Regardless of the outcome, these disputes may lead to legal or other proceedings that may affect the ability of the Company to realize its short and long-term target revenues and margins, and may result in substantial costs, delays in the Company’s development schedule, and the diversion of resources and management’s attention. The Company may also have disagreements with regulatory bodies in the course of its operations, which may subject it to administrative proceedings and unfavorable decisions that result in penalties and/or delay the development of its projects. In such cases, the Company’s business, financial condition, results of operations and cash flows could be materially and adversely affected. IMI is highly dependent on the continued service of its directors, members of senior management and other key officers The Company’s directors, members of its senior management, and other key officers have been an integral part of its success, and the experience, knowledge, business relationships and expertise that would be lost should any such persons depart could be difficult to replace and may result in a decrease in the Company’s operating efficiency and financial performance. Key executives and members of management of the Company include CEO, President and COO, CFO, Chief Procurement Officer, Leaders of Strategic Business Development and Mergers and Acquisitions, Global Sales and Marketing, Global HR, Global Design and Development, Global Advanced Manufacturing Engineering, and Global Quality, and Plant General Managers (GMs). In the event that the Company loses the services of any such person and is unable to fill any vacant key executive or management positions with qualified candidates, or if the qualified individual takes time to learn the details of the Company, the Company’s business and results of operations may be adversely affected. Any deterioration in IMI’s employee relations could materially and adversely affect the Company’s operations The Company’s success depends partially on the ability of the Company, its contractors, and its third party marketing agents to maintain productive workforces. Any strikes, work stoppages, work

S E C F O R M 1 7 - A 76
slowdowns, grievances, complaints or claims of unfair practices or other deterioration in the Company’s, its contractors’ or its third party marketing agents’ employee relations could have a material and adverse effect on the Company’s financial condition and results of operations. The Company conducts Employee Engagement Survey to better understand the diverse needs and aspiration of its workforce, and ultimately contribute to their professional and personal goals. It also aims to instill corporate values and institutionalize an employee-centric and high impact working culture. There have been no historical events related to strikes or protests from its employees or unions, despite having higher labor unrest risk due to growing population, given the well-established employee relations programs of the Company. IMI’s success depends on attracting, engaging, and retaining key talents, including skilled research and development engineers In order to sustain its ability to complete contracted services and deliver on commitments and promote growth, the Company will have to continuously attract, develop, engage and retain skilled workforce highly capable to achieve business goals. The Company recognizes that its competitiveness is dependent on its key talent pipeline, including leadership, talent and skill pool, and succession plan. The Company continuously identifies top-caliber candidates and keeps the pipeline full to be ready to assume new roles and fuel growth. The Company has a strong ability to hire in terms of the quality of recruits as well as in scale. Specifically, there is strong recruitment in Philippines and in China, having been able to tie up with universities. In the case of an immediate need for to provide manpower, there are contractual agreements at hand to meet the demand. They have the ability to rapidly organize and train skilled workers for new products and services and retain qualified personnel. The Company also leverages on its global reach to identify, recruit and develop the right employees who can be deployed to the various operating units or divisions of the Company. It also implements on a regular basis pertinent employee training and development programs, including a cadetship program that enables it to tap and employ capable graduates from different leading universities. The Company has implemented proactive measures to retain employees through sound retention programs, encouraging work-life balance among its employees, and providing structured career development paths to promote career growth within the organization and loyalty to the Company. RISKS RELATING TO COUNTRIES WHERE THE COMPANY OPERATES (INCLUDING THE PHILIPPINES) IMI conducts business in various jurisdictions, exposing it to business, political, operational, financial, and economic risks due to its operations in these jurisdictions There is no assurance that there will be no occurrence of an economic slowdown in the countries where the Company operates, including the Philippines. Factors that may adversely affect an economy include but are not limited to:
• decreases in business, industrial, manufacturing or financial activity in the Philippines or in the global market,
• scarcity of credit or other financing, resulting in lower demand for products and services
• the sovereign credit ratings of the country,
• exchange rate fluctuations,
• a prolonged period of inflation or increase in interest rates,
• changes in the relevant government's taxation policies,
• natural disasters, including typhoons, earthquakes, fires, floods and similar events,
• political instability, terrorism or military conflict, and
• other regulatory, political or economic developments in or affecting the Company Notwithstanding the foregoing, the global operations, marketing, and distribution of the Company’s products inherently integrate the impact of any economic downturn affecting a single country where the Company operates, and enables the Company to shift the focus of its operations to other jurisdictions. The Company’s manufacturing and sales operations are located in a number of countries throughout Asia, Europe, and North America. As a result, it is affected by business, political, operational, financial, and economic risks inherent in international business, many of which are beyond the Company’s control, including difficulties in obtaining domestic and foreign export, import, and other governmental approvals, permits, and licenses, and compliance with foreign laws, which could halt, interrupt, or delay the Company’s operations if it is unable to obtain such approvals, permits, and licenses, and could have a material adverse effect on the Company’s results of operations. Changes in law including unexpected changes in regulatory requirements affect the Company’s business plans, such as those relating to labor, environmental compliance and product safety. Delays

S E C F O R M 1 7 - A 77
or difficulties, burdens, and costs of compliance with a variety of foreign laws, including often conflicting and highly prescriptive regulations also directly affect the Company’s business plans and operations, cross-border arrangements and the inter-company systems. Increases in duties and taxation and a potential reversal of current tax or other currently favorable policies encouraging foreign investment or foreign trade by host countries leading to the imposition of government controls, changes in tariffs, or trade restrictions on component or assembled products may result in adverse tax consequences, including tax consequences which may arise in connection with inter-company pricing for transactions between separate legal entities within a group operating in different tax jurisdictions, also result in increases in cost of duties and taxation. Actions which may be taken by foreign governments pursuant to any trade restrictions, such as “most favored nation” status and trade preferences, as well as potential foreign exchange and repatriation controls on foreign earnings, exchange rate fluctuations, and currency conversion restrictions may adversely affect the Company’s business and financial condition. Under existing foreign exchange controls in the Philippines, as a general rule, Philippine residents may freely dispose of their foreign exchange receipts and foreign exchange may be freely sold and purchased outside the Philippine banking system. Restrictions exist on the sale and purchase of foreign exchange in the Philippine banking system. In the past, the Government has instituted restrictions on the ability of foreign companies to use foreign exchange revenues or to convert Philippine pesos into foreign currencies to satisfy foreign currency- denominated obligations, and no assurance can be given that the Government will not institute such or other restrictive exchange policies in the future. A substantial portion of the Company’s manufacturing operations is located in China, which has regulated financial and foreign exchange regime. The Company continuously evaluates the options available to the organization to ensure maximum usage of excess liquidity. Among others, excess liquidity may be repatriated out of China through dividend payments, payment of management service or royalty fees, use of leading and lagging payment, and transfer pricing. Also, because of China’s role in many important supply chains, its exports contain a large amount of value added applied in other Asian economies. At least as importantly, China has become a principal final destination for Asian exports. As China, is hit by US trade tariffs, the spill-over into other APAC economies takes place via international supply chains and changes in China’s domestic demand. Environmental laws applicable to IMI’s projects could have a material adverse effect on its business, financial condition or results of operations The Company cannot predict what environmental legislation or regulations will be amended or enacted in the future, how existing or future laws or regulations will be enforced, administered or interpreted, or the amount of future expenditures that may be required to comply with these environmental laws or regulations or to respond to environmental claims. The introduction or inconsistent application of, or changes in, laws and regulations applicable to the Company’s business could have a material adverse effect on its business, financial condition and results of operations. There can be no assurance that current or future environmental laws and regulations applicable to the Company will not increase the costs of conducting its business above currently projected levels or require future capital expenditures. In addition, if a violation of any environmental law or regulation occurs or if environmental hazards on land where the Company’s projects are located cause damage or injury to buyers or any third party, the Company may be required to pay a fine, to incur costs in order to cure the violation and to compensate its buyers and any affected third parties. Any political instability in the Philippines and the countries where IMI operates may adversely affect the business operations, plans, and prospects of the Company The Philippines has from time to time experienced severe political and social instability. The Philippine Constitution provides that, in times of national emergency, when the public interest so requires, the Government may take over and direct the operation of any privately owned public utility or business. The impact of the Brexit upon the technology and innovation sector largely depends upon what model the UK adopts for its relationship with the EU. If the UK remains in the European Economic Area then the changes may be minimal. If the UK joins the European Free Trade Association and negotiates sector specific access to the single market then the landscape depends on the exact nature of that relationship. If the UK distances itself further from the EU then the changes may be more extensive.

S E C F O R M 1 7 - A 78
Macro-economic conditions of different countries where IMI operates may adversely affect the Company’s business and prospectus Historically, the Philippines’ sovereign debt has been rated relatively low by international credit rating agencies. Although the Philippines’ long-term foreign currency-denominated debt was recently upgraded by each of Standard & Poor’s, and Moody’s to investment-grade, no assurance can be given that Standard & Poor’s, or Moody’s or any other international credit rating agency will not downgrade the credit ratings of the Government in the future and, therefore, Philippine companies. Any such downgrade could have an adverse impact on the liquidity in the Philippine financial markets, the ability of the Government and Philippine companies, including the Parent Company, to raise additional financing and the interest rates and other commercial terms at which such additional financing is available In addition, some countries in which the Company operates, such as China, Czech Republic and Mexico, have experienced periods of slow or negative growth, high inflation, significant currency devaluations, or limited liability of foreign exchange. In countries such as UK, China and Mexico, governmental authorities exercise significant influence over many aspects of the economy which may significantly affect the Company. Furthermore, the risk of imposing big border tax to US manufacturers that move jobs outside the country will have impact to where the company operates, particularly Mexico. In January 2017, US President Donald Trump has met with executives of the Big Three U.S. automakers and told the executives of General Motors, Ford and Fiat Chrysler that he was going to make it easier for them to invest in the country. He will reduce the taxes and unnecessary regulations to those manufacturing in the United States. Trump began singling out companies that were planning investments in Mexico that involved moving American jobs. Trump promised a big border tax on cars shipped from Mexico into the United States. On an as-need basis, the Company seeks the help of consultants and subject matter experts for changes in laws and regulations that may have a significant impact in the Company’s business operations. It also maintains good relationship with local government, customs, and tax authorities through business transparency and compliance and/or payment of all government-related assessments in a timely manner. The Company has been able to overcome major crises brought about by economic and political factors affecting the countries where it operates. The strong corporate governance structure of the Company and its prudent management team are the foundations for its continued success. The Company also constantly monitors its macroeconomic risk exposure, identifies unwanted risk concentration, and modifies its business policies and activities to navigate such risks. There is no single customer that the Company is dependent on or accounts for more than 15% of the Company’s revenues. The Company also serves global customers which are not concentrated on a specific geographic market. Severe macroeconomic contractions may conceivably lead the Company to tweak or modify its investment decisions to meet the downturn. As a holding company, the Company affirms the principles of fiscal prudence and efficiency in the operations to its subsidiaries operating in various countries. IMI faces risks of international expansion and operation in multiple jurisdictions The Company expects to have an international customer base which may require worldwide service and support. The Company may expand its operations internationally and enter additional markets, which will require significant management attention. Any such expansion may cause a strain in existing management resources. The distances between the Company, the customers, and the suppliers globally, create a number of logistical and communications challenges, including managing operations across multiple time zones, directing the manufacture and delivery of products across significant distances, coordinating the procurement of raw materials and their delivery to multiple locations, and coordinating the activities and decisions of the Company’s management team, the members of which are spread out internationally. While the Company tries to keep its local expertise, it established global functions to ensure that there is adequate coordination of activities. In addition, the availability and use of cell phones, e-mails, and internet-based communication tools by the Company resulted in more efficient and timely coordination of activities and decision making by management from different sites and countries. The Company aggressively pursues hiring of experienced international managers and staff globally. This enables the Company to ensure that it has sufficient manpower complement possessed with the required skills and experience to work with customers, vendors, and other partners in and out of the relevant country where it operates.

S E C F O R M 1 7 - A 79
Natural or other catastrophes, including severe weather conditions and epidemics, that may materially disrupt IMI’s operations, affect its ability to complete projects and result in losses not covered by its insurance The Philippines has experienced a number of major natural catastrophes over the years, including typhoons, droughts, volcanic eruptions and earthquakes. In October 2013, a 7.2 magnitude earthquake affected Cebu and the island of Bohol, and in November 2013, Super Typhoon Haiyan (called Yolanda in the Philippines) caused destruction and casualties of an as yet undetermined amount, in Tacloban, certain parts of Samar, and certain parts of Cebu City, all of which are located in the Visayas, the southern part of the Philippines. There can be no assurance that the occurrence of such natural catastrophes will not materially disrupt the Company’s operations. These factors, which are not within the Company’s control, could potentially have significant effects on the Company’s manufacturing facilities. As a result, the occurrence of natural or other catastrophes or severe weather conditions may adversely affect the Company’s business, financial condition and results of operations. Natural disasters, such as the 2008 earthquake in China, where most of the Company’s manufacturing operations are located, could severely disrupt the Company’s manufacturing operations and increase the Company’s supply chain costs. These events, over which we have little or no control, could cause a decrease in demand for the Company’s services, make it difficult or impossible for the Company to manufacture and deliver products and for the Company’s suppliers to deliver components allowing it to manufacture those products, require large expenditures to repair or replace the Company’s facilities, or create delays and inefficiencies in the Company’s supply chain. In addition, epidemic or pandemic such as Severe Acute Respiratory Syndrome (SARS) of 2003, H1N1 Influenza virus of 2009, Middle East Respiratory Syndrome (MERS) of 2012. May have severe effects on global supply chain affecting company’s employees, and business. Any escalation in these events or similar future events may disrupt the Company’s operations and the operations of the Company’s customers and suppliers, and may affect the availability of materials needed for the Company’s manufacturing services. Such events may also disrupt the transportation of materials to the Company’s manufacturing facilities and finished products to the Company’s customers. There can be no assurance that the Company is fully capable to deal with these situations and that the insurance coverage it maintains will fully compensate it for all the damages and economic losses resulting from these catastrophes. Political instability or threats that may disrupt IMI’s operations could result in losses not covered by the Company’s insurance No assurance can be given that the political environment in the Philippines will remain stable and any political instability in the future could reduce consumer demand, or result in inconsistent or sudden changes in regulations and policies that affect the Company’s business operations, which could have an adverse effect on the results of operations and the financial condition of the Company. Increased political instability threats or occurrence of terrorist attacks, enhanced national security measures, and conflicts, as well as territorial and other disputes, which strain international relations, may reduce consumer confidence and economic weakness. Any impact on the following cases in countries in which the Company has operations could materially and adversely affect the Company’s business plans and prospects, financial condition and results of operations. The Philippines, China, and several Southeast Asian nations have been engaged in a series of long-standing territorial disputes over certain islands in the West Philippine Sea, also known as the South China Sea. Moreover, In January 2017, President Donald Trump’s nominee at that time for Secretary of State Rex Tillerson said China must be denied access to artificial islands it has built in the disputed waters. Trump had previously accused China of building a military fortress in the South China Sea. China claims more than 80 percent of the South China Sea, where it has built up its military presence as well as constructing the islands. Vietnam, the Philippines, Brunei, Malaysia and Taiwan claim parts of the same maritime area, a thriving fishing zone through which more than $5 trillion of trade passes each year. In July 2016, an international tribunal in The Hague ruled against China in a case brought by the Philippines, saying it had no historic rights to the resources within a dashed line drawn on a 1940s map that had formed the basis of its claims. While the court said the ruling was binding, China said the 29 tribunal had no jurisdiction. China is also in dispute with Japan and India over claims to a separate set of islands.

S E C F O R M 1 7 - A 80
President Donald Trump signed an executive order on January 27, 2017 that indefinitely suspends admissions for Syrian refugees and limits the flow of other refugees into the United States by instituting what the President has called "extreme vetting" of immigrants. The executive order on Protection of the Nation from Foreign Terrorist Entry into The United States is the start of tightening borders and halting certain refugees from entering the United States. The order bars all persons from certain "terror-prone" countries from entering the United States for 90 days and suspends the US Refugee Admissions Program for 120 days until it is reinstated "only for nationals of countries for whom" members of Trump's Cabinet deem can be properly vetted. The “British exit of the European Union (EU)," or known as Brexit on June 23, 2016 is considered the most significant economic demerger between major economies since the Second World War. British vote to leave the European Union is likely to impose major instability on top of economic fragility and artificial financial markets. The Brexit referendum roiled global markets, including currencies, causing the British pound to fall to its lowest level in decades. In November 2016, the British High Court ruled that the government needs the Parliament's approval to trigger Article 50 of the Lisbon Treaty and begin the two-year process of withdrawing the UK from the EU. On February 1, 2017, Prime Minister Theresa May won votes from Members of Parliament in the House of Commons for the bill to invoke Article 50 and start the Brexit process in March 2017. In March 19, 2018, the EU and UK agree on a transition phase, and by 25th of November 2018, Draft withdrawal deal was agreed. After an intense political battle new Prime Minister Boris Jonson was elected in parliament July 2019. In September 2019 the European Union (Withdrawal) Act 2019 also known as “Benn Act” which required the British Prime Minister to the Brexit withdrawal date-then scheduled 31 October 2019. Subsequently, 28th of the same month, EU heads of state and government approved the new and final extension date of 31 January 2020. Investors may face difficulties enforcing judgments against IMI It may be difficult for investors to enforce judgments against the Company owing to its global operations, diverse residencies of its different officers, and assets located in different jurisdictions. It may particularly be difficult for investors to effect service of process upon any officer who is not a resident of the country where judgments from courts or arbitral tribunals are obtained outside or within the Philippines if these are predicated upon the laws of jurisdictions other than the country where such judgments are obtained. The Philippines is party to the United Nations Convention on the Enforcement and Recognition of Arbitral Awards, though it is not party to any international treaty relating to the recognition or enforcement of foreign judgments. Nevertheless, the Philippine Rules of Civil Procedure provide that a judgment or final order of a foreign court is, through the institution of an independent action, enforceable in the Philippines as a general matter, unless there is evidence that: (i) the foreign court rendering judgment did not have jurisdiction, (ii) the judgment is contrary to the laws, public policy, customs or public order of the Philippines, (iii) the party against whom enforcement is sought did not receive notice, or (iv) the rendering of the judgment entailed collusion, fraud, or a clear mistake of law or fact. For further information on IMI, please refer to its 2019 Financial Reports and SEC17A which are available in its website www.global-imi.com.

S E C F O R M 1 7 - A 81
AC ENERGY, INC. AC Energy, Inc. (alternately referred to as “AC Energy”, “the AC Energy Group”, “the Company” or “the Group” in the entire discussion of AC Energy) is a Philippine corporation that manages a diversified portfolio of renewable and conventional power generation projects and engages primarily in power project development operations and in other businesses located in the Philippines, Indonesia, Vietnam, and Australia. AC Energy was designated in 2011 as Ayala Corporation’s vehicle for investments in the power sector to pursue greenfield, as well as currently operating, power-related projects for both renewable and conventional technologies in various parts of the Philippines. In 2016, the Company expanded its business purpose to include the purchase, retail, supply and delivery of electricity and in 2017, the business purposes were expanded further to include the development, operation and maintenance of power projects. AC Energy is in the process of transitioning from a Philippine-focused energy investment holding company into a regional player with investment, development and operation capabilities, and is actively scaling up its renewable energy platform through partnerships and expected investments in various projects in the pipeline in the Philippines, Indonesia, and Vietnam, and in markets where it is a new participant such as Australia and other countries in the Asia Pacific region. The Company has a target to reach 5,000MW of renewables capacity and generate at least 50 per cent of energy output from renewables by 2025. As of December 31, 2019, the Company had a total net attributable capacity of 1,159MW in operation and under construction across the region, which includes strategic investments in renewable and conventional power generation projects. As of the same period, the Company’s Philippine operating projects has over 90% contracted capacity (excluding GN power related assets) while its international operating projects has 100% contracted capacity. The table below shows the net attributable capacity per country for operating projects and projects under construction (based on net attributable capacity in MW):
Operating Under Construction Total
Philippines 445 270 715
Indonesia 184 Nil 184
Vietnam 229 32 261
Total 857 667 1,159 * Note: Excludes 710MW attributable capacity in operation and under construction in respect of the GN Power related assets.
As of December 31, 2019, 54% of the Company’s net attributable capacity is sourced from renewable energy assuming completion of the Company’s transfer of its interests in GN Power assets. Philippines Since 2011, the Company has made strategic investments in the power sector in the Philippines, including in greenfield and brownfield projects. These include the following, as of December 31, 2019:
• 52MW wind farm in Ilocos Norte, Philippines (the “NorthWind Project”); • 81MW wind farm in Ilocos Norte, Philippines (the “North Luzon Renewables Project”); • 2 x 122MW CFB thermal project located in Batangas, Philippines (the “SLTEC Project”); • 2 x 668MW supercritical coal-fired plant in Bataan, Philippines (the “GNPD Project”); • 2 x 316MW coal-fired plant in Bataan, Philippines (the “GNPower Mariveles Project”); • 4 x 138MW coal-fired plant in Lanao del Norte, Philippines (the “GNPK Project”); and • 18MW solar power farm in Negros Occidental, Philippines (the “Montesol Project”).
Significantly, in June 2019, the Company completed its acquisition of 51.48% combined stake in PHINMA Energy Corp. (“PHINMA Energy” now known as AC Energy Philippines, Inc. or “ACEPH”, a company listed on the PSE) from, Phinma Corporation and Phinma, Inc. (the “ACEPH Acquisition”). Following an equity infusion and a mandatory tender offer for the publicly listed company’s shares, the Company increased its ownership to 66.34% of ACEPH’s outstanding voting shares, which is the Company’s current ownership as of December 31, 2019 (see Notes 2, 10 and 24 of the 2019 Ayala Corporation’s Consolidated Financial Statements attached as index to this Report). As a result of the ACEPH Acquisition, a portfolio of operating renewable and conventional power plants were added to AC Energy’s portfolio. ACEPH is engaged in the business of providing integrated power solutions, power generation and electricity supply, renewable energy, and resource exploration and development and is a pioneer in electricity supply and trading in the WESM. As part of its energy

S E C F O R M 1 7 - A 82
resource and exploration activities, ACEPH, through its subsidiary, ACE Enexor, Inc. (“ACE Enexor”, formerly PHINMA Petroleum and Geothermal, Inc) is engaged in oil and gas exploration and development. ACEPH is also actively pursuing clean and sustainable power projects and renewable energy supply, with a focus on wind and solar energy. ACE Enexor is also a public company listed on the PSE. As a power generator and electricity supplier, ACEPH manages the following portfolio of renewable and conventional power generation projects as of December 31, 2019:
• 116MW (110MW net) diesel plant in Pampanga, Philippines (the “One Subic Plant”); • 52MW (48MW net) diesel plant in Bulacan, Philippines (the “PPGC Plant”); • 21MW (20MW net) diesel bunker C-fired power plant in La Union, Philippines (the “CIP Plant”); • 66MW in aggregate net capacity for three diesel power barges located in Iloilo and in Cebu,
Philippines (each, a “Power Barge”); • 45% economic ownership of ACEPH in the SLTEC project; • 32MW geothermal plant in Maibarara, Santo Tomas, Batangas, Philippines (the “Maibarara
Geothermal Plant”); and • 54MW wind farm in Guimaras, Philippines (the “Guimaras Wind Farm”).
As part of its strategy to develop, grow and streamline its Philippine energy platform, AC Energy entered into an agreement with ACEPH for the transfer of certain onshore operating and development companies owned by AC Energy to ACEPH in exchange for ACEPH shares (the “AC Energy-ACEPH Exchange”). Upon completion of conditions and other requirements of the AC Energy-ACEPH Exchange, the Company’s ownership of ACEPH will increase to 81.5%. AC Energy has also made strategic dispositions of certain investments. In June 2019, the Company completed the sale of a 49% voting stake and 60% economic stake in AA Thermal, Inc. (“AA Thermal”). AA Thermal holds the Company’s interests in the GNPower Mariveles Project and in a 2 x 668MW supercritical coal-fired plant in Bataan (the “GNPD Project”), which is currently under construction (see Notes 2, 23 and 25 of the 2019 Ayala Corporation’s Consolidated Financial Statements attached as index to this Report). In July 2019, the Company entered into an agreement for the transfer of its interests in the GNPK Project to Power Partners Ltd. Co. (“Power Partners”, and such transfer, the “GNPK Disposition”). The transfer will be implemented in tranches and is pending certain conditions precedent (see Notes 2 and 25 of the 2019 Ayala Corporation’s Consolidated Financial Statements attached as index to this Report). Indonesia In January 2017, AC Renewables International Pte. Ltd. (“AC Renewables International”, formerly AC Energy International Holdings Pte Ltd.), in partnership with UPC Renewables, invested in the development of a 75MW wind farm in Sidrap, South Sulawesi, Indonesia (the “Sidrap Wind Project”). The Sidrap Wind Project commenced commercial operations in April 2018. This was AC Energy’s first greenfield offshore investment and it is the first utility-scale wind farm project in Indonesia. In April 2017, the Company, as part of a consortium with Star Energy Group Holdings Pte. Ltd, Star Energy Geothermal Pte. Ltd. of Indonesia (collectively “Star Energy”) and The Electricity Generating Company (“EGCO”) of Thailand completed the acquisition of the Salak and Darajat geothermal projects (the “Salak-Darajat Geothermal Projects”) in West Java, Indonesia with a combined capacity of 637MW of steam and power. Vietnam In December 2017, AC Energy Vietnam Investments Pte. Ltd. (“ACEV”), a wholly-owned subsidiary of AC Renewables International, entered into a 50:50 joint venture with AMI Renewables Energy Joint Stock Company (“AMI Renewables”), a joint stock company incorporated in Vietnam to invest in AMI AC Renewables Corporation (“AMI AC Renewables”, formerly New Energy Investments Corporation), a joint stock company with 100% ownership over the shares of the following entities situated in Vietnam: (i) AMI Energy Khanh Hoa Joint Stock Company (“AMI Khanh Hoa”), which owns a 50MW solar farm in Khanh Hoa province (the “Khanh Hoa Solar Plant”), (ii) BMT Renewable Energy Joint Stock Company (“BMT Dak Lak”), which owns a 30MW solar farm located in Dak Lak province (the “Dak Lak Solar Plant”), and (iii) B&T Windfarm Joint Stock Company (“B&T Quang Binh”), which has entered into an agreement with the government of Quang Binh province for the development of an up to 200MW wind farm located in Quang Binh province. The Khanh Hoa and Dak Lak Solar Plants commenced commercial operations in the second quarter of 2019 with a total net capacity of 80MW.

S E C F O R M 1 7 - A 83
In addition, as of June 2018, the Company, through ACEV, entered into a partnership with the BIM Group of Vietnam for the development of an aggregate of 330MW of solar power plants located in the province of Ninh Thuan, Vietnam (the “Ninh Thuan Solar Plants”). The Ninh Thuan Solar Plants commenced commercial operations in the second quarter of 2019. In April 2018, AC Renewables International and Jetfly Asia Pte. Ltd. entered into an agreement for the acquisition by AC Renewables International of 25.0% interest in The Blue Circle Pte. Ltd. (“The Blue Circle”) as well as co-investment rights in The Blue Circle’s projects in Southeast Asia. The Blue Circle is an international renewable energy developer which has a pipeline of projects in Southeast Asia, over which the Company has certain investment rights. In May 2019, construction of a 40MW wind farm located in the Binh Thuan Province (the “Dai Phong Project”) commenced with project completion expected by 2020, before the wind FIT deadline of November 2021. Australia In May 2018, the Company, through its subsidiary AC Renewables International, entered the Australian renewable energy market through a joint venture with international renewable energy developer, UPC Renewable Asia Pacific Holdings Limited (“UPC Renewables”). AC Renewables International invested U.S.$30 million for 50.0% ownership in UPC-AC Energy Renewables Australia (HK) Limited (“UPC-AC Energy Renewables Australia”). AC Energy also extended a U.S.$200 million revolver facility to partially fund the Australia projects. UPC-AC Energy Renewables Australia has certain projects in the pipeline, including the New England Solar Farm (the “NE Solar Farm”) currently under development located near Uralla in New South Wales with an expected net capacity of up to 700MWac. The first phase of the NE Solar Farm will have a capacity of 400MWac and expects commercial operations by early 2022. UPC-AC Energy Renewables Australia is also developing wind farms on Robbins Island and Jim’s Plain in North West Tasmania with a targeted net capacity of up to 1,000MW. In addition to the revolver facility, AC Energy has investment rights to invest equity directly into the projects. UPC-AC Energy Renewables Australia continues to assess potential investments into additional renewable energy projects across Australia in various stages of development.
Retail Electricity Supply Business The retail electricity supply business continues its active participation in the WESM through buying the electricity requirements of customers and selling the excess output of the Company’s generation supply portfolio. On September 8, 2016, AC Energy obtained a Retail Electricity Supplier (“RES”) license allowing it to sell electricity to the end-users in the contestable market. As a result of the ACEPH acquisition, a portfolio of additional renewable and conventional power businesses was added to AC Energy’s portfolio, including retail electricity supply and trading in the WESM, in which PHINMA Energy is a pioneer. PHINMA Energy secured its RES license on November 19, 2012. On September 8, 2017, PHINMA Energy timely filed its application for renewal of its RES license, and upon directives of the ERC, made supplemental submissions on 9 October 2019. On 21 November 2019, the Company received notice from the ERC of the approval of the application for renewal of the Company’s RES license. The RES license of the Company shall subsequently be issued by the ERC. As of December 31, 2019, the AC Energy group’s RES business has contracted capacity of over 300MW from several contestable customers across a mix of industries including manufacturing, office, and mall operators. Risks relating to the Company and its Businesses Increased competition in the power industry, including competition resulting from legislative, regulatory and industry restructuring efforts could have a material adverse effect on the Company’s operations and financial performance. The Company’s success depends on its ability to identify, invest in and develop new power projects, and the Company faces competition to acquire future rights to develop power projects and to generate and sell power. No assurance can be given that the Company will be able to acquire or invest in new power projects successfully. The Philippine government has sought to implement measures designed to establish a competitive power market. These measures include the ongoing privatization of at least 70% of the NPC-owned-and-controlled power generation facilities and the grant of a concession to operate transmission

S E C F O R M 1 7 - A 84
facilities, as well as the implementation of retail competition and open access. The move towards a more competitive environment could result in the emergence of new and numerous competitors. These competitors may have greater financial resources, and have more extensive experience than the Company, giving them the ability to respond to operational, technological, financial and other challenges more quickly than AC Energy. These competitors may therefore be more successful than the Company in acquiring existing power generation facilities or in obtaining financing for and the construction of new power generation facilities. The type of fuel that competitors use for their generation facilities may also allow them to produce electricity at a lower cost and to sell electricity at a lower price. The Company may therefore be unable to meet the competitive challenges it will face. The impact of the restructuring of the Philippine power industry changes the competitive landscape of the industry and such changes affect the Company’s financial position, results of operations and cash flows in various ways. In addition, any decision to develop and construct power projects in various jurisdictions, including, but not limited to, the Philippines, Indonesia, Vietnam, and Australia is made after careful consideration of regulatory requirements, availability of fiscal incentives, market conditions (including the demand and supply conditions), land availability, and other considerations. For those jurisdictions that require participation through a competitive bidding process or through the submission of a formal proposal, in which the Company will need to compete for projects based on pricing, technical and engineering qualifications, the financial condition of the Company, availability of land, access to financings, track record and other specifications of the proposed project, the bidding or proposal submission process and selection process may be affected by a number of factors, including factors which may be beyond the Company’s control, such as market conditions or government incentive programs. In such cases, the Company may not acquire the rights to develop new power projects in the event that the Company misjudges its competitiveness when submitting its bids or proposals or, where bidding includes price competition, if the Company’s competitors have more competitive pricing. The ability of the Company’s competitors to access resources that it does not have access to, including labor and capital, may prevent the Company from acquiring additional power projects in strategic locations or from increasing its generating capacity, and the Company may not be able to expand its business as a result. AC Energy may not successfully implement its growth strategy and the impact of acquisitions, investments and value realization initiatives could be less favorable than anticipated. As part of its business strategy, AC Energy seeks to actively manage its portfolio of power projects to maximize its capital base and has conducted and continues to carry out acquisitions and investments of varying sizes as well as value realization through certain dispositions, some of which are significant, as well as develop additional power projects in both the Philippines and in international markets. This strategy may require entering into strategic alliances and partnerships and will involve substantial investments. The Company’s success in implementing this strategy will depend on, among other things, its ability to identify and assess potential partners, investments and acquisitions, opportunities for value realization and redeployment of capital, and to successfully finance, close and integrate such investments and acquisitions, control costs and maintain sufficient operational and financial controls. This growth strategy could place significant demands on AC Energy’s management and other resources. AC Energy’s future growth may be adversely affected if it is unable to make these investments, value realization and capital recycling initiatives or form these partnerships, or if these investments, value realization and capital recycling initiatives and partnerships prove unsuccessful. Further, acquisitions and investments involve numerous risks, including, without limitation, the following: (i) the assumptions used in the underlying business plans may not prove to be accurate, in particular with respect to synergies and expected demand; (ii) the Company may not be able to integrate acquired businesses, technologies, products, personnel, and operations effectively; (iii) the Company may fail to retain key employees, customers, and suppliers of the companies acquired; (iv) the Company may be required or wish to terminate pre-existing contractual relationships, which could be costly and/or on unfavorable terms; and (v) the Company may increase its indebtedness to finance these acquisitions. As a result, it is possible that the expected benefits of completed or future acquisitions, investments and value realization and capital recycling initiatives may not materialize within the time periods or to the extent anticipated or affect the Company’s financial condition. Further, the Company may not be able to identify suitable acquisition and investment opportunities or make acquisitions and investment, on beneficial terms, or obtain financing necessary to complete and support such acquisitions. Regulation of merger and acquisition activity by relevant authorities or other national regulators may also limit the Company’s ability to make future acquisitions, mergers or dispositions. The impact on the Company of any future acquisitions or investments and dispositions cannot be fully predicted and any of the risks outlined above, should they materialize, could have a material adverse effect on the Company’s business, financial condition, results of operations and prospects.

S E C F O R M 1 7 - A 85
Moreover, the Company’s growth to date, in particular driven by acquisitions and investments, has placed, and the anticipated further expansion of the Company’s operations will continue to place, a significant strain on the Company’s management, systems and resources. In addition to training, managing and integrating the Company’s workforce, the Company will need to continue to develop the Company’s financial and management controls. The Company can provide no assurance that the Company will be able to efficiently or effectively manage the growth and integration of the Company’s operations and internationally dispersed businesses and any failure to do so may materially and adversely affect the Company’s business, financial condition, results of operations and prospects. In addition, if general economic and regulatory conditions or market and competitive conditions change, or if operations do not generate sufficient funds or other unexpected events occur, AC Energy may decide to delay, modify or forego some aspects of its growth strategies, and its future growth prospects could be adversely affected. The operations of the Company’s power projects are subject to significant government regulation, including regulated tariffs such as FIT, and AC Energy’s margins and results of operations could be adversely affected by changes in the law or regulatory schemes. The inability of the Company and the applicable power projects to predict, influence or respond appropriately to changes in law or regulatory schemes, including any inability or delay in obtaining expected or contracted increases in electricity tariff rates or tariff adjustments for increased expenses, or any inability or delay in obtaining or renewing permits for any facilities, could adversely impact the Company’s results of operations and cash flow. Furthermore, changes in laws or regulations or changes in the application or interpretation of laws or regulations in jurisdictions where power projects are located, (particularly utilities where electricity tariffs are subject to regulatory review or approval) could adversely affect the Company’s business, including, but not limited to:
• adverse changes in tax law; • changes in the timing of tariff increases or in the calculation of tariff incentives; • change in existing subsidies and other changes in the regulatory determinations under the
relevant concessions; • other changes related to licensing or permitting which increase capital or operating costs or
otherwise affect the ability to conduct business; or • other changes that have retroactive effect and/or take account of revenues previously received
and expose power projects to additional compliance costs or interfere with the Company’s existing financial and business planning.
Any of the above events may result in lower margins for the affected businesses, which could adversely affect the Company’s results of operations. For renewable assets, pricing is either fixed by regulatory arrangements which operate instead of, or in addition to, contractual arrangements or is based on market prices. To the extent that costs rise above the level approved in the tariff, the power projects that are subject to regulated tariffs would bear the risk. During the life of a project, the relevant government authority may unilaterally impose additional restrictions on the project’s tariff rates, subject to the regulatory frameworks applicable in each jurisdiction. Future tariffs may not permit the project to maintain current operating margins, which could have a material adverse effect on the Company’s business, financial condition, results of operations and prospects. Failure to obtain financing on reasonable terms or at all could adversely impact the execution of the Company’s expansion and growth plans. The Company’s expansion and growth plans are expected to require significant fund raising. The Company is targeting to develop at least 5,000MW of renewable energy capacity by 2025. The Company’s continued access to debt and equity financing as a source of funding for new projects, acquisitions and investments, and for refinancing maturing debt is subject to many factors, including: (i) laws, regulations, and internal bank policies limiting bank exposure (including single borrower limits) to a single borrower or related group of borrowers; (ii) the Company’s compliance with existing debt covenants; (iii) the ability of the Company to service new debt; (iv) the macroeconomic fundamentals driving credit ratings of the Philippines and other countries where the Company has significant exposure; and (v) perceptions in the capital markets regarding the Company and the industries and regions in which it operates and other factors, some of which may be outside of its control, including general conditions in the debt and equity capital markets, political instability, an economic downturn, social unrest, changes in the regulatory environments where any power projects are located or the bankruptcy of an unrelated company operating in one or more of the same industries as the Company, any of which could increase borrowing costs or restrict the Company’s ability to obtain debt or equity financing. There is no assurance that the Company will be able to arrange financing on acceptable

S E C F O R M 1 7 - A 86
terms, if at all. Any inability of the Company to obtain financing from banks and other financial institutions or from capital markets would adversely affect the Company’s ability to execute its expansion and growth strategies. The Company’s international businesses and results of operations are subject to the macroeconomic, social and political developments and conditions of the countries where the Company’s portfolio of projects are located. In addition to the Philippines, the Company’s portfolio of power projects in operation and under construction are currently located in Australia, Indonesia, and Vietnam, with plans for further international expansion in other countries such as India and Myanmar. International operations and plans for further international expansion may be affected by the respective domestic economic and market conditions as well as social and political developments in these countries, government interference in the economy in certain countries and changes in regulatory conditions, and there is no guarantee that the Company’s existing operations as well as expansion plans will be successful in those countries. The Company’s financial condition, prospects and results of operations could be adversely affected if it is not successful internationally or if these international markets are affected by changes in political, economic and other factors, over which the Company has no control. Changes in tax policies, affecting tax exemptions and tax incentives could adversely affect the Company’s results of operations. Certain subsidiaries, affiliates and joint ventures of AC Energy are registered with the Board of Investments (the “BOI”) and the Philippine Economic Zone Authority (“PEZA”) and benefit from certain incentives including, among others, income tax holidays (“ITH”) for a certain period and lower corporate income tax upon expiry of the applicable ITH, and duty-free importation of capital equipment, spare parts and accessories. On September 13, 2019, House Bill No. 4157, otherwise known as the Corporate Income Tax and Incentive Rationalization Act (“CITIRA Bill”) was passed on the 3rd and final reading. The CITIRA Bill is the renamed version of the TRABAHO Bill which is the second package of the Comprehensive Tax Reform Program (“CTRP”) of the Duterte administration. The second package of the CTRP reportedly aims to lower corporate income taxes while rationalising fiscal incentives for corporations, such as income tax holidays, special rates, and custom duty exemptions. If passed into law, the fiscal incentives enjoyed by specific members of the Group may be affected. If the CITIRA Bill is passed into law, or if these tax exemptions or tax incentives expire, are revoked, or are repealed or other new laws are enacted, the income from these sources will be subject to the corporate income tax rate, which is 30.0% of net taxable income as of 30 September 2019 or the new tax rates as per any new laws enacted. As a result, the Company’s tax expense would increase and its profitability would decrease. The expiration, non-renewal, revocation or repeal of these tax exemptions and tax incentives, the enactment of any new laws, and any associated impact on the Company, could have a material adverse effect on the Company’s business, financial condition and results of operations. The Company’s long term success is dependent upon its ability to attract and retain key personnel and in sufficient numbers. The Company depends on its senior executives and key management members to implement the Company’s projects and business strategies. If any of these individuals resigns or discontinues his or her service, it is possible that a suitable replacement may not be found in a timely manner or at all. If this were to happen, there could be a material adverse effect on the Company’s ability to successfully operate its power projects and implement its business strategies. Power generation involves the use of highly complex machinery and processes and the Company’s success depends on the effective operation and maintenance of equipment for its power generation assets. Technical partners and third-party operators are responsible for the operation and maintenance of certain power projects. Any failure on the part of such technical partners and third-party operators to properly operate and/or adequately maintain these power projects could have a material adverse effect on the Company’s business, financial condition and results of operations. In addition, the Company’s growth to date has placed, and the anticipated further expansion of the Company’s operations may continue to place, a significant strain on the Company’s management, systems and resources. In addition to training, managing and integrating the Company’s workforce, the Company will need to continue to develop the Company’s financial and management controls. The Company can provide no assurance that the Company will be able to efficiently or effectively manage the growth and integration of the Company’s operations dispersed businesses and any failure to do so may materially and adversely affect the Company’s business, financial condition, results of operations and prospects. In addition, if general economic and regulatory conditions or market and competitive conditions change, or if operations do not generate sufficient funds or other unexpected events occur, the Company may

S E C F O R M 1 7 - A 87
decide to delay, modify or forego some aspects of its growth strategies, and its future growth prospects could be adversely affected. The Company’s business depends on commitments to the promotion of renewable energy. The countries in which the Company has investments have demonstrated a commitment to renewable energy. As a result, these countries have created favorable regulatory and tax regimes and financial incentives, as well as renewable portfolio standards that require distributors to source a certain percentage of their power requirements from renewable energy sources. For example, Vietnam’s FIT programme provides for a FIT rate of U.S.$0.0935 / kWh for 20 years for solar plants completed by June 2019 and U.S.$0.0850 /kWh for wind projects completed by November 2021. These commitments are, however, generally matters of domestic public policy and are subject to the execution of the relevant power purchase agreement (“PPA”). Should these commitments to renewable energy be reduced for any reason, it could affect the Company’s ability to operate or renew the Company’s permits and licenses and reduce the financial incentives available to the Company, which could, in turn, have a material adverse effect on the Company’s business, financial condition, results of operations and prospects. AC Energy may not be able to adequately influence the operations of its associates and joint ventures and the failure of one or more of its strategic partnerships may negatively impacts its business, financial condition, results of operations and prospects. AC Energy derives a portion of its income from investments in associates and joint ventures in which it does not have majority voting control. These relationships involve certain risks including the possibility that these partners:
• may have economic interests or business goals that are different from the Company; • may be unable or unwilling to fulfill their obligations under relevant agreements, including
shareholder agreements under which the Company has certain voting rights in respect of key strategic, operating, and financial matters;
• may take actions or omit to take any actions contrary to, or inconsistent with, the Company’s policies or objectives or prevailing laws;
• may have disputes with the Company as to the scope of their responsibilities and obligations; and/or
• may have difficulties in respect of seeking funds for the development or construction of projects. The success of these partnerships depends significantly on the satisfactory performance by the partners and the fulfillment of their obligations. If the Company or a strategic partner fails to perform its obligations satisfactorily, or at all, the partnership may be unable to perform adequately. As a result, cooperation among its partners or consensus with other shareholders in these entities is crucial to these businesses’ sound operation and financial success. The Company’s business, financial condition, results of operations and prospects may be materially adversely affected if disagreements develop with its strategic partners and are not resolved in a timely manner. In addition, if any of the Company’s strategic partners discontinues its arrangement with the Company, is unable to provide expected resources or assistance, or competes with the Company on business opportunities, the Company may not be able to find a substitute for such strategic partner. Failure of one or more of the Company’s strategic partners to perform their obligations may have a material adverse effect on the Company’s business, financial condition, results of operations and prospects. Risks and delays relating to the development of greenfield power projects could have a material adverse effect on the Company’s operations and financial performance. The development of greenfield power projects involves substantial risks that could give rise to delays, cost overruns, unsatisfactory construction or development in the projects. Such risks include the inability to secure adequate financing, inability to negotiate acceptable offtake agreements, and unforeseen engineering and environmental problems, among others. Any such delays, cost overruns, unsatisfactory construction or development could have a material adverse effect on the business, financial condition, results of operations and growth prospects of the Company. For the Company’s projects under development, the estimated time frame and budget for the completion of critical tasks may be materially different from the actual completion date and costs, which may delay the date of commercial operations of the projects or result in cost overruns. The Company is expanding its power generation operations and there are a number of projects in its energy portfolio under construction. These projects involve environmental, engineering, construction and commission risks, which may result in cost overruns, delays or performance that is below expected levels of output or efficiency. In addition, projects under construction may be affected by the timing of the issuance of permits and licenses by government agencies, any litigation or disputes, inclement

S E C F O R M 1 7 - A 88
weather, natural disasters, accidents or unforeseen circumstances, manufacturing and delivery schedules for key equipment, defect in design or construction, and supply and cost of equipment and materials. Further, project delays or cancelations or adjustments to the scope of work may occur from time to time due to incidents of force majeure or legal impediments. Depending on the severity and duration of the relevant events or circumstances, these risks may significantly delay the commencement of new projects, reduce the economic benefit from such projects, including higher capital expenditure requirements and loss of revenues, which in turn could have a material adverse effect on the Company’s business, financial condition, results of operations and cash flows. Any restriction or prohibition on the Company’s ability to receive dividends, interest income, and other distributions from its subsidiaries, associates or joint ventures would have a negative effect on its financial condition, results of operations, and its ability to fulfill its guarantee obligations under the Notes. The Company, as a holding company, conducts its operations through its subsidiaries, associates, and joint ventures. As a holding company, the Company’s income is derived primarily from dividends, interest income, and other distributions paid to the Company by its subsidiaries, associates and joint ventures. The Company is reliant on these sources of funds with respect to its obligations and in order to finance its subsidiaries. The ability of the Company’s direct and indirect subsidiaries, associates and joint ventures to pay dividends, interest income, and other distributions to the Company (and their shareholders in general) is subject to applicable law and may be subject to deduction of taxes and/or restrictions contained in loans and/or debt instruments of such subsidiaries. Currently, the payment of dividends by a Philippine corporation to another Philippine corporation is not subject to tax. In addition, certain subsidiaries are subject to debt covenants for their respective existing debt. Failure to comply with these covenants may result in an event of default, which if not waived, could result in debt becoming immediately due and payable. This could affect the relevant company’s liquidity and ability to generally fund its day-to-day operations. In the event this occurs, it may be difficult to repay or refinance such debt on acceptable terms or at all. Furthermore, such restrictions could likewise impact the Company’s ability to fulfill its guarantee obligations under the Notes. Any restriction or prohibition on the ability of some or all of the Company’s subsidiaries, associates and/or joint ventures to distribute dividends or make other distributions to the Company, either due to regulatory restrictions, debt covenants, operating or financial difficulties or other limitations, could have a negative effect on the Company’s cash flow and therefore, its financial condition. The administration and operation of power generation projects by project companies involve significant risks. The administration and/or operation of power generation projects by project companies involve significant risks, including:
• breakdown or failure of power generation equipment, transmission lines, pipelines or other
equipment or processes, leading to unplanned outages and operational issues; • flaws in the equipment design or in power plant construction; • issues with the quality or interruptions in the supply of key inputs, including fuel or water; • material changes in legal, regulatory or licensing requirements; • human errors in the operation of equipment or operator error; • performance below expected levels of output or efficiency; • actions affecting power generation assets owned or managed by the Company, its joint ventures,
affiliates or its contractual counterparties; • pollution or environmental contamination affecting the operation of power generation assets;
• force majeure and catastrophic events including fires, explosions, earthquakes, volcanic
eruptions, floods and terrorist acts that could cause forced outages, suspension of operations, loss of life, severe damage and plant destruction;
• planned and unplanned power outages due to maintenance, expansion and refurbishment; • inability to obtain or the cancelation of required regulatory permits and approvals; and • opposition from local communities and special interest groups.
For example, Unit 2 of the SLTEC Project has been on forced outage since June 2018 to March 2019 due to a complication with the turbine rotor problem. The rotor has been tested and commissioned in March 2019 and has been running since then. SLTEC invested in a spare rotor which is now being manufactured and expected delivery at site is in June 2020.

S E C F O R M 1 7 - A 89
There is no assurance that any event similar or dissimilar to those listed above will not occur or will not significantly increase costs or decrease or eliminate revenues derived by the Company, its joint ventures and affiliates from their power projects. Climate change policies may adversely affect the Company’s business and prospects. The Company is currently invested in certain coal-fired power plants in the Philippines. Policy and regulatory changes, technological developments and market and economic responses relating to climate change may affect the Company’s business and the markets in which it operates. The enactment of an international agreement on climate change or other comprehensive legislation focusing on greenhouse gas emissions could have the effect of restricting the use of coal. Other efforts to reduce greenhouse gas emissions and initiatives in various countries to use cleaner alternatives to coal such as natural gas may also affect the use of coal as an energy source. In addition, technological developments may increase the competitiveness of alternative energy sources, such as renewable energy, which may decrease demand for coal generated power. Other efforts to reduce emissions of greenhouse gases and initiatives in various countries to encourage the use of natural gas or renewable energy may also discourage the use of coal as an energy source. The physical effects of climate change, such as changes in rainfall, water shortages, rising sea levels, increased storm intensities and higher temperatures, may also disrupt the Company’s operations. As a result of the above, the Company’s business, financial condition, results of operations and prospects may be materially and adversely affected. Environmental regulations may cause the relevant project companies to incur significant costs and liabilities. The operations of the Company’s project companies are subject to environmental laws and regulations by central and local authorities in the countries in which the projects operate. These include laws and regulations pertaining to pollution, the protection of human health and the environment, air emissions, wastewater discharges, occupational safety and health, and the generation, handling, treatment, remediation, use, storage, release and exposure to hazardous substances and wastes. These requirements are complex, subject to frequent change and have tended to become more stringent over time. The project companies have incurred, and will continue to incur, costs and capital expenditures in complying with these laws and regulations and in obtaining and maintaining all necessary permits. While the project companies have procedures in place to allow it to comply with environmental laws and regulations, there can be no assurance that these will at all times be in compliance with all of their respective obligations in the future or that they will be able to obtain or renew all licenses, consents or other permits necessary to continue operations. Any failure to comply with such laws and regulations could subject the relevant project company to significant fines, penalties and other liabilities, which could have a material adverse effect on the Company’s business, financial condition, results of operations and prospects. In addition, environmental laws and regulations, and their interpretations, are constantly evolving and it is impossible to predict accurately the effect that changes in these laws and regulations, or their interpretation, may have upon the Company’s business, financial condition, results of operations or prospects. If environmental laws and regulations, or their interpretation, become more stringent, the costs of compliance could increase. If the Company cannot pass along future costs to customers, any increases could have a material adverse effect on the Company’s business, financial condition, results of operations and prospects. The Company’s power project development operations and the operations of the power projects are subject to inherent operational risks and occupational hazards, which could cause an unexpected suspension of operations and/or incur substantial costs. Due to the nature of the business of power project development and operations, the Company and its project companies engage or may engage in certain inherently hazardous activities, including operations at height, use of heavy machinery and working with flammable and explosive materials. These operations involve many risks and hazards, including the breakdown, failure or substandard performance of equipment, the improper installation or operation of equipment, labor disturbances, natural disasters, environmental hazards and industrial accidents. These hazards can cause personal injury and loss of life, damage to or destruction of property and equipment, and environmental damage and pollution, any of which could result in suspension of the development or operations of any of the power projects or even imposition of civil or criminal penalties, which could in turn cause the Company or any of the project companies to incur substantial costs and damage its reputation and may have a material adverse effect on the Company’s business, financial condition and results of operations.

S E C F O R M 1 7 - A 90
Grid curtailments may limit the generation capacity of power projects. From time to time, national grid operators curtail the energy generation for a number of reasons, including line congestions and during the instances that dispatch schedules of power plants are not implementable (i.e. if the grid operators foresee that the dispatch schedules may place the grid system at risk). In such circumstances, a power project’s access to the grid and thus its generation dispatch can be reduced. Such reductions result in a corresponding reduction in revenue, which, if prolonged or numerous could have a material adverse effect on the Company’s business, financial condition, results of operations and prospects. The Company enters into transactions with related parties. In the ordinary course of business, the Company transacts with its related parties, such as its subsidiaries and certain of its associates and joint ventures, and affiliates enter into transactions with each other. These transactions have principally consisted of advances, loans, bank deposits, reimbursement of expenses, purchase and sale of real estate and other properties and services, sale of electricity, management, marketing and administrative service agreements. The Company has instituted internal policies with respect to related party transactions and the related party transaction committee of Ayala Corporation oversees such matters. These related party transactions may involve conflicts of interest, which, although not contrary to law, may be detrimental to the Company. The Company is exposed to credit and collection risks. As in other businesses, the power business, including the Company’s RES business in the Philippines, is exposed to credit and collection risks related to its customers. These include the National Transmission Corporation (“TransCo”), contestable customers as well as electric cooperatives that have varying credit ratings and private distribution utilities including the Manila Electric Company (“Meralco”). In addition, the power projects in Indonesia and in Vietnam are exposed to collection risks from the Perusahaan Listrik Negara (“PLN”) as the sole electricity business authority in Indonesia and Vietnam Electricity (“EVN”), which has total control of the national power transmission and distribution market in Vietnam, respectively. There can, however, be no assurance that all customers will pay the Company in a timely manner or at all. In such circumstances, the Company’s working capital needs would increase, which could, in turn, divert resources away from the Company’s other projects. If a large amount of its customers were unable or unwilling to pay AC Energy, its financial condition could be negatively affected. Exchange rate and/or interest rate fluctuations may have a significant adverse impact on the Company’s business, financial condition, results of operations and prospects. As a result of the international nature of the Company’s business, changes in foreign currency rates could have an adverse impact on the Company’s business, financial condition, results of operations and prospects. Currency fluctuations affect the Company because of mismatches between the currencies in which operating costs are incurred and those in which revenues are received. The Company’s functional currency is the Philippine Peso, and the Company has and may have assets, income streams and liabilities denominated in a number of currencies, including the U.S. Dollars, Indonesian Rupiah, Vietnamese Dong, and Australian Dollars. The insurance coverage of the power projects may not be adequate. The power projects maintain levels of insurance, which the Company believes are typical with the respective business structures and in amounts that it believes to be commercially appropriate. However, a power project may become subject to liabilities against which it has not insured adequately or at all, or is unable to insure. In addition, insurance policies contain certain exclusions and limitations on coverage, which may result in claims not being honored to the extent of losses or damages suffered. Further, such insurance policies may not continue to be available at economically acceptable premiums, or at all. The occurrence of a significant adverse event, the risks of which are not fully covered or honored by such insurers, could have a material adverse effect on a power project’s business, financial condition, results of operations and prospects. In addition, under some of the power project’s debt agreements, the power project is required to name the lenders under such debt agreements as a beneficiary or a loss payee under some of its insurance policies, or assign the benefit of various insurance policies to the lenders. Therefore, even if insurance proceeds were to be payable under such policies, any such insurance proceeds may be paid directly to the relevant lenders instead of to the power project. If an insurable loss has a material effect on a power project’s operations, the power project’s lenders may not be required to pay any insurance proceeds or to compensate the power project for loss of profits or for liabilities resulting from business interruption, and this could have a material adverse effect on the Company’s business, financial condition, results of operations and prospects.

S E C F O R M 1 7 - A 91
Competitive Strengths The Company believes that it has the following strengths: Well-positioned to benefit from a rapidly growing region that is increasingly embracing renewable energy to address its long-term energy needs AC Energy has selected highly attractive markets in the Asia Pacific region in which to pursue growth, particularly in the renewable energy space. The Philippine power sector is underpinned by robust economic fundamentals and attractive demographics. Based on information from the Philippine Statistics Authority, the Philippines’ nominal GDP has been growing at 6.6% CAGR from 2008 to 2018 (U.S.$331 billion in 2018). Over the same period, power consumption grew by 5.3% CAGR to reach 99,765GWh based on the DOE. To meet increasing demand, the Philippine government encouraged expansion in renewable energy capacity. The National Renewable Energy Board (“NREB”) has set a target of reaching 15GW and 20 GW of installed renewable capacity by 2030 and 2040, respectively, compared to currently installed renewable capacity of c.7.2GW in 2018. Renewable initiatives are also currently in place which include (i) income tax holiday, (ii) lower corporate income tax rate and (iii) tax-free importation. Additionally, the NREB launched the Renewable Portfolio Standards (“RPS”), which mandates distribution utilities to source a portion of their power supply from renewable energy and requires 35% of power demand to come from renewable energy by 2030. Similar to the Philippines, Indonesia’s nominal GDP growth has been driving activity in the country, with GDP growing at 7.4% CAGR from 2008 to 2018 (U.S.$1,042 billion in 2018), according to the World Bank. Over the same period, power generation grew by 6.6% CAGR to 283,815GWh based on information from the Perusahaan Listrik Negara (“PLN”, Indonesia’s sole electricity business authority), underpinned by strong economic growth and the government’s electrification efforts. Renewable power is expected to play a significant role in further supply expansion as the government targets new and renewable energy sources to account for 23% of total energy generation by 2025 and 31% by 2050 based on the 2018 Rencana Umum Penyediaan Tenaga Listrik or General Plan for Electric Supply (“RUPTL”) issued by the Ministry of Energy and Mineral Resources of Indonesia. To support this growth, several renewable initiatives have been introduced or are under review, such as favourable tariff for solar and wind, income tax and importation incentives. Vietnam offers one of the most attractive renewable energy markets in the region due to its large population and rapid nominal GDP growth of 9.5% CAGR from 2008 to 2018 (U.S.$245 billion in 2018), according to the World Bank. From 2007 to 2017, electricity consumption grew by 10.7% CAGR driven by strong economic growth and the country’s rapidly expanding manufacturing sector, based on information from the Ministry of Industry and Trade of Vietnam. According to Revised National Development Master Plan for 2011-2020 (“PDP 7”), the Vietnam government is targeting power generation of over 265TWh by 2020 and over 572TWh by 2030, which are significantly higher than the aggregate electricity generated in 2018 of 183TWh. Further, the government is targeting to increase the share of electricity produced from renewable sources to 7% by 2020 and over 10% by 2030. Total capacity of hydropower sources is targeted to increase to 21.6GW by 2020 and 27.8GW by 2030. Wind and solar are targeted to have total capacities of 6GW and 12GW, respectively, by 2030. In addition, renewable initiatives are currently in-place to support this renewable target: for example, a 20-year FIT for solar and wind import tax exemptions and corporate income tax reductions. Australia continues to be one of the world’s most stable economies due to its consistent output and activity. In 2018, the World Bank reports the country’s GDP to reach U.S.$1.4Tn, representing a CAGR of 3.1% from 2008 to 2018. GDP performance continued to be driven by a low unemployment rate, and constant infrastructure investments. During the same period, Australia’s population increased by a CAGR of 1.6% to reach 25 million people. In line with the economic statistics, Australia’s power generation capacity has increased by a CAGR of 1% from 2008 to 2018 to reach 48,247MW. Being a mature and developed market, Australia offers stability with growth driven by the national directive to shift towards renewable energy sources and the increasing cost competitiveness of renewable technology. Australia has an established renewable market underpinned by the Renewable Energy Act 2000. With the support of positive regulatory framework and the country’s strong renewable projects pipeline, Australia’s non-hydroelectric renewable market capacity is expected to grow 7.2% annually during 2018 to 2027 especially with the decommissioning of coal-fired power plants that begun in 2012. From 2012 to 2016, there were nine coal-fired power plant closures across Queensland, New South Wales, Victoria, and South Australia with a total capacity of 3,559MW. Further, according to the Australian Energy Market Operator’s (“AEMO”) Integrated System Plan, it is expected that 14 GW of coal-fired generation will reach the end of its technical life and retire by 2040. In addition, the Government of Australia has set a Renewable Energy Target (“RET”) that aims to achieve a minimum

S E C F O R M 1 7 - A 92
of 20% of energy generated from renewable sources by 2020. The RET is made up of two schemes: (1) The Largescale Renewable Energy Target and (2) The Small-scale Renewable Energy Scheme. The first scheme provides the creation and expansion of renewable energy power stations while the second scheme creates financial incentives for individuals and small businesses to install eligible small-scale renewable energy sources. The Largescale Renewable Energy Target was set at 33TWh renewable electricity generation by 2020. The Clean Energy Finance Corporation (“CEFC”) was established by the Australian Government under the Clean Energy Finance Corporation Act 2012, CEFC co-finances and invests, directly and indirectly in renewable energy and energy efficiency projects. After two years of large scale investment in renewable energy of aggregate 15,700MW of new capacity, predominantly in wind and solar projects, the Clean Energy Council reported in September 2019 that it has achieved its 20% renewable energy composition goal. In addition the markets set out above, AC Energy continues to evaluate and assess opportunities in other markets in Asia Pacific that meet the Company’s strategic framework and financial criteria. The Company continues to explore additional opportunities in other attractive locations including India, Myanmar, Korea, and Taiwan. Proven track record of delivering growth, execution speed, asset performance and value realization In 2011, Ayala Corporation designated AC Energy, (formerly AC Energy Holdings, Inc.), as the group’s platform for its investments in the power sector. In view of the Company’s desire to be responsive to the rapidly growing power supply needs of the Philippines and to its commitment to sustainability, it assembled a portfolio and pipeline of projects from both conventional and renewable energy sources. Delivering Growth To deliver on its objectives, AC Energy made its initial foray in 2011 into the renewables space with its acquisition of a 50.0% stake in NorthWind Power Development Corporation (“NorthWind”), which currently operates a wind farm operating in Ilocos Norte, for a 16MW attributable capacity. At the time of the investment, it was the only wind farm in the country and considered the largest in Southeast Asia. AC Energy also signed a 50:50 JV agreement in 2011 with the PHINMA Group, a leading diversified business group in the Philippines, to develop a 2 x 122MW CFB thermal project located in Batangas, Philippines through South Luzon Thermal Energy Corporation (“SLTEC”), the Company’s first investment in conventional energy. The project was subsequently expanded to include a second unit. Having established its foothold in the Philippine power sector, AC Energy embarked on a series of strategic power sector investments over the succeeding years. In 2012, AC Energy announced that it was entering into a joint venture with Power Partners, Ltd. Co. (“Power Partners”), a private partnership with a long history of power plant development in the Philippines and founded in 2001, and Sithe Global Power, a company affiliated with the Blackstone Group, as sponsors of GMCP which was undergoing commissioning at the time. In 2013, the Company announced that it entered into an Investment Framework Agreement with UPC Renewables Partners, and the Philippine Investment Alliance for Infrastructure (“PINAI”), a fund financed by the Government Service Insurance System, Dutch pension fund asset manager APG Asset Management, the Macquarie Group and the Asian Development Bank. The agreement saw the launch of the North Luzon Renewables Project, an 81MW wind farm in Ilocos Norte, the PINAI consortium’s first-ever investment in the country. In the same year, AC Energy and Power Partners also established a JV to develop a thermal power plant in Lanao del Norte which would later become the GNPower Kauswagan Project. The period from 2014 to 2016 saw AC Energy further growing its attributable capacity and network of partnerships, in the course of which the Company achieved several key milestones. In addition to the acquisition of a 50% stake in GNPD, and the start of SLTEC Project’s Unit 1 and 2’s commercial operations, in 2016 the Company announced its first geothermal investment and first international investment in partnership with Star Energy and EGCO of Thailand to acquire a stake in the Salak-Darajat Geothermal Project, Chevron’s geothermal operations in Indonesia. Execution Speed and Asset Performance In 2016, AC Energy was granted a RES license by the Energy Regulatory Commission, enabling it to supply electricity to end-users in contestable markets, after successfully demonstrating its technical, financial and managerial capability to procure electricity and establish a system and the infrastructure needed to ensure the supply of electricity to contestable customers. The Company also began commercial operations of the Montesol Project, its first solar farm project, expanding AC Energy’s portfolio and renewables technology capabilities to include solar, in addition to thermal, wind and geothermal.

S E C F O R M 1 7 - A 93
In 2017, AC Energy acquired 100.0% of Bronzeoak Clean Energy (now Visayas Renewables Corporation, “VRC”), a Philippines-based renewable energy developer, further expanding AC Energy’s in-house renewable energy developmental and operational capability. To date, the AC Energy group intends to consolidate all its project development, management, and operations under AC Energy Development, Inc. (“AC Energy DevCo”) as its development platform. AC Energy DevCo has been transferred to ACEPH as of October 9, 2019 subject to certain conditions and requirements. For its international operations, AC Energy broadened its international footprint with an investment in Indonesia, with the inauguration of the Sidrap Wind Project in 2018. The Sidrap Wind Project was AC Energy’s first offshore utility-scale wind farm and Indonesia’s first commercial-scale wind farm. Through its partnership with the BIM Group and the AMI Group, the acquisition of The Blue Circle, and establishment of a joint venture with UPC Renewables in Australia, the Company has expanded its international presence and on-the-ground expertise to include the rapidly developing renewable energy markets of Vietnam and Australia, respectively. With sustained strong growth in revenue, net income, and attributable capacity, AC Energy has demonstrated its ability to identify and deliver attractive projects, attract world-class partners that complement its capabilities and create growth particularly in the renewable energy space. Further to its achievements, to date, the company has also achieved several awards among which are:
• 2019 Best New Green Bond Issuer by London-based International Finance and 2019 Renewable Energy Deal of the Year by The Asset for the Ninh Thuan Solar Plants
• Fastest Growing Energy Platform in IFM Awards 2017—Philippines by London-based International Finance Magazine
• 2017 Smart Project Award by Project Finance International during the Asia Best Practice Citations
• Recognized as the Fastest Growing Energy Platform in the Philippines by London-based International Finance Magazine in 2017
• Recognized by several regional and international organizations including The Asset, Alpha Southeast Asia, Project Finance International, International Financing Review Asia and IJGlobal for the acquisition of the geothermal and power business of Chevron Global Energy in Indonesia in 2017
Value Realisation Starting 2015, AC Energy began to realize value from its earlier investments. Mitsubishi Corporation (“Mitsubishi”) and Marubeni Corporation (“Marubeni”), among Japan’s largest trading houses and among the most active Japanese business groups in the country, partnered with AC Energy by acquiring equity interest in the North Luzon Renewables Project (in 2015) and SLTEC (in 2016), respectively. In June 2019, AC Energy completed the sale of a 60% economic stake in its thermal platform, AA Thermal, to Aboitiz Power for U.S.$574.2 million, providing the Company with significant realized value and allowing it to focus on its renewable energy objectives. In July 2019, AC Energy and Power Partners Ltd. Co. (“Power Partners”) signed a binding agreement for the transfer of AC Energy’s economic interest in the 4x135MW coal-fired power project in Kauswagan, Lanao del Norte (the “GNPK Project”) in favor of Power Partners. Power Partners is AC Energy’s existing developer-partner in the GNPK Project. The transfer of AC Energy’s economic ownership will be implemented in tranches, with the final transfer price to be agreed upon by the parties at a later date after taking into account agreed adjustments. The completion of the transfer is subject to satisfaction of certain conditions precedent, including approvals by the lenders of the GNPK Project. The Company received the approval for the transaction from the Philippine Competition Commission last September 30, 2019. With fresh capital from the sale of its strategic stakes in its portfolio, a larger balance sheet, and the improved cost efficiency of emerging solar and wind technologies, AC Energy was able to reinvest the proceeds from the value realization in the expansion of its renewable energy and international capabilities. Portfolio of projects across geographies, technologies and regulatory regimes provides stable cashflows, diversification and a strong platform for growth AC Energy benefits from a portfolio approach to its investments, providing the Company with a blend of seasoned and new operating projects that provide stable cashflows underpinned by attractive, long-term contractual arrangements. This diversity in business model (combination of bilateral contracts, spot sales and FIT contracts), fuel types, geographies and regulatory regimes provides a stable platform which the Company is able to leverage for renewable capacity expansion and international growth.

S E C F O R M 1 7 - A 94
The NorthWind Project, Southeast Asia’s first commercial wind farm, is a 52MW wind farm in the Ilocos Norte province. Phases 1 and 2, with combined capacity of 33MW and began commercial operations in 2005 and 2008 respectively, benefit from a FIT rate of ₱5.76/KWh for 20 years beginning from June 2014. Phase 3 has a FIT rate of ₱8.53/KWh and is valid for 20 years. Phases 1 and 2, and Phase 3 have demonstrated strong availability factors at 88% and 90% respectively in the first nine months of 2019, owing to the attractive wind energy potential of the country’s northern region. The North Luzon Renewables Project, an 81MW wind farm in the Ilocos Norte province, was awarded a FIT rate of ₱8.53/KWh from November 2014 and until 20 years thereafter. In the first nine months of 2019, it registered an availability factor of 94%. AC Energy’s initial foray into solar energy, the Montesol Project, is an 18MW solar farm in Negros Oriental in the Visayas region of the Philippines. It is entitled to a FIT rate of ₱8.69/KWh valid for 20 years from March 2016. In Indonesia, the Salak-Darajat Geothermal Projects and Sidrap Wind Project, similarly enjoy attractive commercial arrangements. The Salak- Darajat Geothermal Projects has PLN, the national electricity distributor and the Indonesia market’s primary power purchaser, as its offtaker having granted the project with a take-or-pay contract. The Sidrap Wind Project, on the other hand, has a 30-year PPA with the PLN at a US dollar-linked, levelized tariff of U.S.$0.1141/KWh, providing AC Energy with a hedge against any potential volatility in the Indonesia Rupiah. In Vietnam, the Khanh Hoa Solar Plant, the Dak Lak Solar Plant, and the Ninh Thuan Solar Plants each have respective 20-year PPAs with EVN with a FIT rate of U.S.$0.0935/KWh. The contract is paid in the Vietnamese Dong but the amount received is indexed to the U.S. Dollar on a monthly basis, preserving the U.S. Dollar FIT rate under the PPA. The GNPower Mariveles Project, one of AC Energy’s largest operating power asset in its portfolio to-date in partnership with Power Partners and Aboitiz Power, provides the Company with access to a highly attractive 2 x 316MW clean pulverized coal-fired power generation facility. Located in the Luzon island, the country’s population and industrial base, over 95% of GNPower Mariveles Project’s offtake is contracted by electric cooperatives, with PPSAs with various tenors until 2029. Most of the electric cooperatives that are off-takers of the GNPower Mariveles Project are rated AAA by the National Electrification Administration as of end-2017 GMCP began commercial operations in February 2014. The SLTEC project similarly benefits from its proximity Metro Manila, Central Luzon, and the CALABARZON area in the Philippines. SLTEC’s capacity is substantially contracted with the Manila Electric Company (“Meralco”) under an Administration and Management Agreement with ACEPH. Units 1 and 2 of SLTEC began commercial operations in April 2015 and February 2016, respectively. Visible path to growth based on strong pipeline of projects in partnership with recognized and accomplished power industry developers, operators and investors Among AC Energy’s partners in its domestic and international operations are some of the most established developers and operators of conventional and renewable assets. In addition to pursuing attractive investment opportunities together with the sector’s most established names, AC Energy’s commitment to its objectives, visible track record of success in achieving growth and the ability to forge partnerships in various market segments has made it a partner of choice. In the conventional energy business in the Philippines, key partnerships have included the cooperation with Power Partners (a private limited partnership organized and established in the Philippines in 2001 and formed by principals having extensive backgrounds in power development both in the Philippines and around the world), PINAI, and Aboitiz Power Corporation. Aboitiz Power Corporation, one of the country’s largest power generation companies by gross installed capacity, has been a long-term partner of the Company in the GNPower Mariveles and the GNPower Dinginin Projects, and the cooperation has been deepened further by the sale of 60% stake in the overall AA Thermal platform. PINAI, an infrastructure-focused fund whose investors include the Macquarie Group, and the Asian Development Fund, has also been a repeat partner of the group. Initially a partner for the North Luzon Renewables Project, PINAI subsequently co-invested in the GNPower Kauswagan Project, joining AC Energy and Power Partners as an additional limited partner. In the international space, the Company has partnered with UPC Renewables, a US-based renewable energy developer with over 20 years of global experience in the construction and operations of wind and solar energy projects. UPC Renewables has developed over 3,500MW of wind and solar projects,

S E C F O R M 1 7 - A 95
has presence across 12 countries and has built 70 projects with approximately U.S.$5.0 billion of project debt and equity deployed. AC Energy began its partnership with UPC Renewables in 2013 in the North Luzon Renewables Project. Subsequent to this, AC Energy and UPC Renewables expanded their partnership by developing and constructing the Sidrap Wind Project. In 2018, UPC Renewables and AC Energy, through AC Renewables International, established a joint venture, UPC-AC Energy Renewables Australia, which saw AC Energy invest U.S.$30 million for a 50% equity stake and provide a U.S.$200 million facility to fund the partnership’s equity needs. UPC-AC Energy Renewables Australia is developing the Robbins Island and Jim’s Plain wind projects and the NE Solar Farm located in Australia, which in total potentially combine for up to 1,700MW of renewable energy capacity. In 2019, UPC-AC Energy Renewables Australia also acquired the 2x125MW Baroota Pump Hydro project and the 300MW Bridle Solar Farm. Also in 2019, UPC Renewables and AC Renewables International established a new joint venture, UPC-AC Energy Solar Limited, for the construction of over 1,000MW in the next few years, with initial focus on India, South Korea, and Taiwan. In Southeast Asia, AC Energy has forged ties with The Blue Circle, the BIM Group, the AMI Group, Star Energy, EGCO, and the Yoma Group for various wind, solar, and geothermal projects. Through The Blue Circle, AC Energy is participating in the development of The Blue Circle’s pipeline of projects across Southeast Asia. Through the partnerships with BIM Group and AMI group, AC Energy is participating in several solar and wind projects in Vietnam. Through Star Energy and EGCO, AC Energy is participating in the operation of the 637MW Salak-Darajat Geothermal Projects in West Java, Indonesia. Through its joint venture with the Yoma Group, AC Energy intends to participate in the development of micro power plants and mini-grids that provide electricity to off-grid rural communities and telecommunications towers in Myanmar. AC Energy’s various partnerships provide it with the ability to source high quality projects efficiently and with local market expertise. Collectively, the Company’s current partnerships provide visibility to over 5GW of expected gross capacity across wind, solar and geothermal in the Philippines, Indonesia, Vietnam, Australia, and other countries, helping drive the Company towards its goal of achieving 5GW of attributable capacity from renewable energy sources by 2025. Strong balance sheet and good credit history AC Energy has prudent standards with regards to financing and risk management, in which to-date, AC Energy has retained a strong balance sheet with low leverage. As of 30 September 2019, the Company has U.S.$431.5 million net debt, with net debt computed as total bonds and loans payable (inclusive of non recourse loans) less cash and cash equivalents, and U.S.$1,603.3 million equity. The Company’s financial prudence starts with the assessment of any proposed investment or project. The Company sets certain criteria that need to be met among which are the fundamental soundness of the proposed investment or project and its business case, the sound reputation and capability of the partners, and the long-term sustainability of the investment or project. When debt is required to fund new investments, the company ensures that cash inflows are adequate to cover operations, capital expenditure, and loan repayment requirements as well as meet relevant loan covenants. In 2019, AC Energy successfully issued two senior CBI certified Green Bonds: (i) U.S.$ 300 million senior Green Bond with a 5-year tenor and a coupon of 4.75% p.a., with International Finance Corporation as one of the investors, and (ii) U.S.$ 110 million senior Green Bond with a coupon of 5.25%, with the Asian Development Bank as one of the investors. In the 4th quarter of the same year, the Company issued the its senior first perpetual fixed-for-life green bond issuance at U.S.$400 million with a fixed coupon of 5.65% with no step-up and no reset. The Company’s good credit history and strong relationship with its Philippine and international bank partners, institutional investors, and its parent provides AC Energy with the capability to mobilize and deploy financial resources as needed in both the domestic and international space. Supported by a strong shareholder fully committed to delivering AC Energy’s vision AC Energy benefits from having a shareholder in Ayala Corporation which is fully committed to seeing AC Energy’s vision of providing low-cost energy to Filipinos and becoming a leading renewable energy player in the Asia Pacific. Ayala Corporation, founded in 1834, is among Southeast Asia’s most respected business groups (the “Ayala Group”). Led by the Zobel de Ayala Family, Ayala Corporation has a market capitalization of

S E C F O R M 1 7 - A 96
U.S.$10.0 billion as of 15 November 2019. Under the Ayala Group is a portfolio of market leading businesses in the country with their respective market capitalisation as of the same date as follows:
• Ayala Land, Inc.— Leading and most diversified property developer in the country with the largest landbank and holds several of the country’s most premium commercial and residential properties;
• Bank of the Philippine Islands: Founded in 1851, it is the oldest bank in Southeast Asia and the third largest bank in the country by assets;
• Globe Telecom, Inc. —Largest telecommunications provider in the country by subscriber base; and
• Manila Water Company, Inc.— the sole water and wastewater services provider in the east zone of Metro Manila, Philippines, serving over 6 million residents across 23 cities and municipalities.
In addition, the Ayala Group has set for itself nation-building as a core commitment, and has a portfolio of rapidly growing verticals devoted to each of infrastructure, healthcare, education, industrials and strategic ventures. Ayala Corporation’s most recent recognitions, particularly in the area of sustainability and governance, are a testament to the alignment between the Ayala Group and AC Energy with regard to leadership, sustainability and advocacy for the environment:
• “Top Performing Companies” (2018) by Institute of Corporate Directors • “Top 50 ASEAN PLCs” (2018) by ASEAN Corporate Governance • Ranked 3rd “Best CEO” (2018) awarded by the Institutional Investor • “Asia’s Best Integrated Report” (2018) by Asia Sustainability Reporting Awards • Ranked 1st (2016) and 2nd (2017) “Best Managed Companies” by Finance Asia • Ranked 3rd, “Best CEO” (2017) by Finance Asia • Ranked 1st (2016) and 2nd (2017) “Most Committed to Corporate Governance” by Finance Asia • “United Nations SDG Pioneer” (2017) recognition for Chairman and CEO Jaime Augusto Zobel
de Ayala • Ranked 18th, “Global 2000: World’s Best Employers” (2017) by Forbes Magazine • “Best at Corporate Social Responsibility” (2016) by Finance Asia • Among Top 3 CSR Advocates in Asia, by Asia Corporate Excellence and Sustainability Awards
(2016) Since AC Energy’s founding, it has enjoyed the full support of the Ayala Group and has had access to the Ayala Group’s experience in governance, network, management and financial resources. Among AC Energy’s board members are the Ayala Corporation’s Chairman, CEO and CFO with several of AC Energy’s key management having been officers at Ayala Corporation. From 2011, Ayala Corporation has invested/committed over U.S.$800 million to support the Company’s expansion. Going forward, Ayala Corporation remains committed to furthering its support for the Company and its objectives to expand beyond the Philippines and become a recognized leader in the regional renewable energy space. Led by a reputable and experienced board and management team AC Energy has assembled a strong management team with the right combination of management experience, project management expertise, international exposure and entrepreneurship. The Company is led by John Eric T. Francia, President and CEO who joined the company in 2011 for the Ayala Corporation with a four-man team. Previously a management consultant at the Monitor Group based in Cambridge, Massachusetts in the U.S. he joined the Ayala Group in 2009 as Head of Corporate Strategy before eventually leading the infrastructure and power businesses concurrently. Eric’s vision for the business has driven the very rapid growth that AC Energy has achieved in the last 7 years. To date, he leads over 650 employees and applies his international experience derived from management consulting, strategy and building infrastructure and utilities businesses in emerging markets. Supporting Mr. Francia is a highly experienced management team: Maria Corazon G. Dizon, seasoned finance and business development professional from the Ayala Group, and Jose Maria P. Zabaleta, founder and CEO of Bronzeoak Clean Energy (now Visayas Renewables Corp.) and chairman of AC Energy DevCo, who has developed hundreds of MWs of renewable projects, respectively the Chief Financial Officer and Treasurer and Chief Development Officer of AC Energy. The management team is supported by a highly-engaged employee force developed and accumulated by the Company since its founding. Based on a Willis Towers Watson Employee Engagement Survey completed in 2019, AC Energy enjoys an employee engagement score of 95% which is above the Philippine national average and energy and utilities industry norm for the same year.

S E C F O R M 1 7 - A 97
Ayala Corporation is involved in the governance of AC Energy, with several of the Ayala Group’s most senior leaders participating in its board of directors. Fernando Zobel de Ayala is the Chairman of the board of directors of the Company. He is the President and Chief Operating Officer of Ayala Corporation since April 2006. He holds various positions in the following publicly-listed companies: Chairman of Ayala Land, Inc. and Manila Water Company, Inc.; Director of Bank of the Philippine Islands, Globe Telecom, Inc., and Integrated Micro-Electronics, Inc.; and Independent Director of Pilipinas Shell Petroleum Corporation. He graduated with a B.A. in Liberal Arts at Harvard College in 1982 and holds a CIM from INSEAD, France. One of the Directors is Jaime Augusto Zobel de Ayala, the Chairman and CEO of the Ayala Corporation since 2006. He is one of the Philippines’ most pre-eminent leaders, and has received multiple recognitions for his leadership, such as the Harvard Business School’s Alumni Achievement Award, the Presidential Medal of Merit, and recognition into the Philippines’ Legion of Honor. He is also a member of the JP Morgan International Council and the Mitsubishi Corporation International Advisory Committee. Good corporate governance is a key component of the Company’s culture As part of Ayala Group, the Company aligns its Corporate Governance with that of the Ayala Corporation. Ayala Corporation believes that good corporate governance is essential for the achievement of its strategic goals. Ayala Corporation pursues measures that bring up the level of awareness and practices in the organization to help drive value creation and long-term growth. To this end, Ayala has set in place a comprehensive set of oversight controls to put management decisions in check and ensure that it conforms to regulatory requirements and global best practices. AC Energy’s management reports to the board of directors, among which are Ayala Corporations’ Chairman, CEO and CFO. The board convenes at least quarterly and where necessary special meetings are convened to ensure that strategic directions are properly aligned and that appropriate approvals are secured prior to implementing initiatives. Internally, AC Energy has established committees to assist the management in exercising its authority and monitoring the performance of the Company. Among such Committees are the Strategic Management Committee, Investment Committee, Organizational Development Committee, Compensation and Promotion Committee and the Finance Committee. The Strategic Management Committee is headed by the CEO with the key officers of the company as members. Such committee regularly meets to determine the strategic plans, key results areas and business plans of the company. The Investment Committee reviews, provides direction, sets the investment policies, approves investments, prioritizes projects and allocates appropriate resources and endorses projects for board approval. The Compensation and Promotion Committee is tasked to establish, review and as needed make changes to the Company’s compensation policies and package. The Finance Committee reviews financial performance, approves financial initiatives, sets financing policies, prioritizes financing initiatives and endorse financing initiatives board approval. A strong independent internal audit team directly reporting to the Audit and Risk Committee is in place and conducts regular review of key identified areas including relevant policies, internal controls, corporate governance, operations and security of the various subsidiaries and affiliates under the AC Energy group. Results of the audits including tracking of the completion of remedial measures are reported quarterly to the Audit and Risk Committee. The Company regularly reports its results of operations initially to the Audit and Risk Committee which endorses the results to the board. The Company also participates in various other initiatives driven by Ayala Corporation among which are Enterprise Risk Management and Sustainability, Corporate Social Responsibility and group-wide insurance optimization. Highly motivated organization with capabilities to anticipate and react to developing market thematics and trends rapidly While the Company started as an investment holding company with a portfolio of conventional and renewable energy assets through partnerships and acquisitions, the Company has been able to develop and acquire investment, development and operational competencies transforming it into one of the leading energy companies in renewable and thermal energy in the Philippines and around the region. The Company strengthens its capabilities by developing home-grown resources through training and project assignments, attracting high potential talents in the market, actively participating in employee

S E C F O R M 1 7 - A 98
engagement activities, linking rewards to performance and practicing sound compensation policies which are on par with the market. Strategically, the Company’s acquisition of BCE’s development platform in 2017 enabled it to add organic project development capability in its competency index. Such acquisition enables the Company to develop projects end-to-end, from permits and feasibility studies all the way to construction and operations. Based on a Willis Towers Watson Employee Engagement Survey completed in 2019, AC Energy enjoys an employee engagement score of 95% which is above the Philippine national average and energy and utilities industry norm for the same year. This survey is conducted every two years with employee participation rate achieving 100% in the last two surveys conducted. The foregoing, allows the company to retain and continuously augment its pool of talents and competencies enabling the company to easily tap and deploy resources to address growth opportunities and market changes, as well as to ensure excellent project execution even in new markets and partnerships. Invests in accordance with globally-accepted sustainability norms and frameworks The AC Energy group aligns itself with the United Nations Framework Convention on Climate Change and the Paris Agreement on reducing global carbon emissions to limit global temperature increase to well below two degrees Celsius. Consistent with the Ayala group’s commitment to the UN Sustainable Development Goals, AC Energy is additionally focused on protecting the wider environment and creating value for the communities it serves. As such, the AC Energy group launched its maiden Green Bond in early 2019, and along with it, the development of its Environment and Social (E&S) Policy and management system. This policy statement serves to guide AC Energy’s and its subsidiaries’ priority environmental and social goals: 1. Achieving a Low Carbon Portfolio by 2030 2. Aspiring for excellence in environmental management 3. Fulfilling our commitment to the community Regulatory Downstream Oil Industry Deregulation Law
Republic Act No. 8479, otherwise known as the Downstream Oil Industry Deregulation Act of 1998 (the “Oil Deregulation Law”), provides the regulatory framework for the downstream oil industry in the Philippines. Under the Oil Deregulation Law, any person may import or purchase any quantity of crude oil and petroleum products from foreign and domestic sources, lease or own and operate refineries and other downstream oil facilities, and market such crude oil and petroleum products either in a generic name or in its own trade name, or use the same for its own requirement. The same law declared as policy of the state the liberalization and deregulation of the downstream oil industry in order to ensure a truly competitive market under a regime of fair prices, adequate and continuous supply of environmentally clean and high-quality petroleum products. To ensure the attainment of these objectives, the DOE, in consultation with relevant government agencies, promulgated the Implementing Rules and Regulations of the Oil Deregulation Law in March 1998 through Department Circular No. 98-03-004 and the Supplementing Rules and Regulations of the Oil Deregulation Law in June 1998 through Department Circular No. 98-06-009. The rules require any person or entity engaged in any activity in the downstream oil industry to comply with the notice, reportorial, quality, health, safety and environmental requirements set forth therein. The DOE is the lead government agency overseeing the oil sector. With the enactment of the Oil Deregulation Law, the regulatory functions of the DOE were significantly reduced. Deregulating the downstream oil industry effectively removed the rate-setting function of the then Energy Regulatory Board, leaving price-setting to market forces. DOE’s current function is solely to monitor prices and violations under the law, which includes prohibited acts such as cartelization and predatory pricing. Other functions of the DOE under the Oil Deregulation Law include the following:
a. monitoring and publishing the daily international crude oil prices, following the movements of
domestic oil prices, monitoring the quality of petroleum and stopping the operation of businesses involved in the sale of petroleum products which do not comply with national standards of quality;

S E C F O R M 1 7 - A 99
b. monitoring the refining and manufacturing processes of local petroleum products to ensure that clean and safe technologies are applied;
c. maintaining a periodic schedule of present and future total industry inventory of petroleum products to determine the level of supply;
d. immediately acting upon any report from any person of an unreasonable rise in prices of petroleum products; and
e. in times of national emergency, when the public interest so requires, during the emergency and under reasonable terms, temporarily taking over or directing the operations of any person or entity engaged in the industry.
Promotion of Retail Competition
Pursuant to the Oil Deregulation Law’s objective to promote a competitive petroleum product market at the retail level, the DOE is mandated to promote and encourage the active and direct participation of the private sector and cooperatives in the retailing of petroleum products through joint venture or supply agreements with new industry participants for the establishment and operation of gasoline stations. Under prevailing rules and regulations, new industry participants are given preference in the (i) formulation and implementation on management and skills training for the establishment, operation, management and maintenance of gasoline stations and (ii) grant of gasoline station training and loans to be used as capital for the establishment and operation of gasoline stations.
Rules Relating to Retailing of Liquid Petroleum Products
In November 2017, the DOE promulgated Department Circular No. 2017-11-0011 or the Revised Rules and Regulations Governing the Business of Retailing Liquid Fuels (the “Revised Retail Rules”). The Revised Retail Rules apply to all persons engaged or intending to engage in the business of Retailing Liquid Fuels. Liquid Fuels refer to gasoline, diesel, and kerosene. A person intending to engage in the business of retailing liquid petroleum products must notify the Oil Industry Management Bureau (“OIMB”) of its intention to engage in such activity and, upon compliance with the requirements under the Liquid Petroleum Products Retail Rules, secure a certificate of compliance (“Certificate of Compliance”) from the OIMB. The certificate shall be valid for a period of five (5) years. The owner or operator of a retail outlet shall be deemed to be engaged in illegal trading of liquid petroleum products if such owner or operator operates a retail outlet without a Certificate of Compliance. Storage and dispensing of liquid fuels that are for own-use operation shall not be covered by the Revised Retail Rules only upon issuance of a CNC by the DOE. The Revised Retail Rules likewise imposes: (a) mandatory standards and requirements for new retail outlets and minimum facility requirements for existing retail outlets; (b) rules and procedures relating to fuel storage, handling, transfer and/or dispensing of liquid fuels; (c) requirements of other types of retail outlets; (d) the conduct of inspection and monitoring by the OIMB; (e) rules and procedures relating to liquid fuels quantity and quality; and (f) fines and/or sanctions against prohibited acts. Liquid petroleum products dispensed at retail outlets must comply with the Philippine National Standards. The Prohibited Acts include illegal trading, adulteration, underdelivering, refusal/obstruction of inspection and sampling, hoarding, and continuing to operate after an order or notice of cessation of operation has been issued by the DOE. The refusal of inspection shall constitute prima facie evidence of the commission of Prohibited Acts under the Revised Retail Rules.
The Biofuels Act of 2006
Republic Act No. 9367, also known as “The Biofuels Act of 2006”, aims to reduce the dependence of the transport sector on imported fuel and, pursuant to such law, regulations mandate that all premium gasoline fuel sold by every oil company in the Philippines should contain a minimum 10% blend of bioethanol starting August 6, 2011. For diesel engines, the mandated biodiesel blend in the country was increased from 1% to 2% starting February 2009. In June 2015, the DOE issued Department Circular No. DC 2015-06-005, or the Amended Guidelines on E-10 Implementation, which temporarily waives compliance by oil companies with the required bioethanol blend for premium plus grade gasoline products when supply of locally produced bioethanol products are insufficient to meet demand. In 2008, a Joint Administrative Order known as the “Guidelines Governing the Biofuel Feedstock Production and Biofuel Blends Production, Distribution and Sale” (the “Guidelines”) was issued by various Philippine government agencies. The Guidelines mandate oil companies to blend biodiesel with

S E C F O R M 1 7 - A 100
diesel and bioethanol with gasoline. The Guidelines further require oil companies to source biofuels only from biofuel producers accredited by the DOE or from biofuel distributors registered with the DOE. Moreover, unless authorized by DOE to import in case of shortage of supply of locally produced bioethanol as provided for under the Act, an oil company’s failure to source its biofuels from accredited biofuels producers and/or registered biofuel distributors would constitute a prohibited act.
In June 2015, the DOE issued Department Circular No. DC 2015-06-007, or the Revised Guidelines on the Utilization of Locally-Produced Bioethanol (“Revised Guidelines”), which repealed Department Circular No. 2011-12-0013, or the “Guidelines on the Utilization of Locally-Produced Bioethanol in the Production of E-Gasoline Consistent with the Biofuels Act of 2006”. The Revised Guidelines require oil companies operating within the Philippines to secure and maintain a DOE accreditation as an “Oil Industry Participant in the Fuel Bioethanol Program” and submit to the OIMB certain reports in order for the OIMB to monitor the oil companies’ compliance with the Revised Guidelines, including an annual performance compliance report relating to the oil companies’ compliance with the minimum biofuel blends and monthly reports on compliance with local monthly allocations for the use of locally-sourced bioethanol. The Revised Guidelines further require oil companies to strictly comply with the Local Monthly Allocation (“LMA”). The LMA refers to the local bioethanol volume imposed on oil companies based on the committed volume by the local bioethanol producers of bioethanol available for lifting by the oil companies and computed and circulated by the OIMB.
In February 2016, the Congress of the Philippines promulgated Republic Act No. 10745, amending The Biofuels Act of 2006. The law allows natural gas power generation plants to use neat diesel (instead of the mandated biofuel blend) as alternative fuel during shortages of natural gas supply. The DOE issued Department Order No. 2016-07-0012 or the implementing rules and regulations for Republic Act No. 10745. This provides that the natural gas power generating plants with duly issued Certificate of Compliance from the ERC can avail of the use of neat diesel in the following instances:
a. During maintenance and/or shutdown of facilities used for the supply of natural gas such as
pipelines, terminal, etc. b. During force majeure which adversely affect the supply of natural gas to natural gas power
plants, or c. Other analogous instances.
All suppliers of natural gas shall submit to the DOE their preventive maintenance schedule indicating the dates when the suppliers of natural gas would be critical. During force majeure events, the DOE shall determine the affected facilities for proper issuance of certification of the shortage of natural gas supplies.
LPG Laws and Regulations
B.P. 33
B.P. 33, as amended by PD 1865, provides for certain prohibited acts inimical to public interest and national security involving petroleum and/or petroleum products. These prohibited acts include, among others, (a) illegal trading in petroleum and/or petroleum products, and (b) under delivery or underfilling beyond authorized limits in the sale of petroleum products or possession of underfilled liquefied petroleum gas cylinder for the purpose of sale, distribution, transportation, exchange or barter. For this purpose, the existence of the facts hereunder gives rise to the following presumptions:
a. That cylinders containing less than the required quantity of liquefied petroleum gas which are
not property identified, tagged and set apart and removed or taken out from the display area and made accessible to the public by marketers, dealers, sub-dealers or retail outlets are presumed to be for sale;
b. In the case of a dispensing pump in a petroleum products retail outlet selling such products to the public, the absence of an out-of-order sign, or padlocks, attached or affixed to the pump to prevent delivery of petroleum products therefrom shall constitute a presumption of the actual use of the pump in the sale or delivery of such petroleum products; and
c. When the seal, whether official or of the oil company, affixed to the dispensing pump, tank truck or liquefied petroleum gas cylinder, is broken or is absent or removed, it shall give rise to the presumption that the dispensing pump is underdelivering, or that the liquefied petroleum gas cylinder is underfilled, or that the tank truck contains adulterated finished petroleum products or is underfilled.

S E C F O R M 1 7 - A 101
The use of such pumps, cylinders or containers referred to above, to deliver products for sale or distribution shall constitute prima facie evidence of intent of the hauler, marketer, refiller, dealer or retailer outlet operator to defraud. Under the said law, “illegal trading in petroleum and/or petroleum products” is understood to mean, among others, (a) the sale or distribution of petroleum products without license or authority from the OIMB, (b) non-issuance of receipts by licensed oil companies, marketers, distributors, dealers, subdealers and other retail outlets, to final consumers; provided: that such receipts, in the case of gas cylinders, shall indicate therein the brand name, tare weight, gross weight, and price thereof, (c) refilling of liquefied petroleum gas cylinders without authority from the OIMB, or refilling of another company’s or firm’s cylinders without such company’s or firm’s written authorization, and (d) marking or using in such cylinders a tare weight other than the actual or true tare weight thereof. “Underfilling” or “under delivery” refers to a sale, transfer, delivery or filling of petroleum products of a quantity that is actually beyond authorized limits than the quantity indicated or registered on the metering device of container. This refers, among others, to the quantity of petroleum retail outlets or to liquefied petroleum gas in cylinder or to lube oils in packages.
R.A. 9514 - IRR
The Implementing Rules and Regulations of Republic Act No. 9514 or the Fire Code of 2008 also outlines requirements for storage and handling of LPG by outside bulk LPG stores and filling stations and the transportation of LPG which require among others, that during the unloading or transfer of LPG, the tank truck shall be located or parked clear of a public thoroughfare, unless the failure to transfer would create a hazard or it is impossible due to topography.
LPG Industry Rules
In January 2014, the DOE issued Department Circular 2014-01-0001, or the Rules and Regulations Governing the Liquefied Petroleum Gas Industry (the “LPG Industry Rules”). The LPG Industry Rules apply to all persons engaged or intending to engage in the business of importing, refining, refilling, marketing, distributing, handling, storing, retailing, selling and/or trading of LPG. A Standards Compliance Certificate (“SCC”) from the OIMB is required before engaging in any LPG Industry Activity. The SCC is valid for a maximum of three calendar years from date of issue and may be renewed. LPG Industry participants must also submit certain reports to the OIMB. The LPG Industry Rules also imposes (a) minimum standards and requirements for refilling and transportation of LPG; (b) qualifications and responsibilities for LPG Industry participants such as bulk suppliers, refillers, marketers, dealers, and retail outlets. Brand owners whose permanent mark appear on the LPG cylinder are presumed under the rules as the owner thereof, irrespective of their custody, and shall ensure that their cylinders comply with all required quality and safety standards. The owner of the cylinders is also required to secure product liability insurance for any liability that may result from an unsafe condition of LPG cylinders.
Rules Pertinent to Auto-LPG Motor Vehicles
On February 13, 2007, the DOE issued DOE Circular No. DC 2007-02-0002 entitled “Providing for the Rules and Regulations Governing the Business of Supplying, Hauling, Storage, Handling, Marketing and Distribution of Liquefied Petroleum Gas for Automotive Use” (the “Auto-LPG Rules”). The Auto-LPG Rules govern the business of supplying, hauling, storage, handling, marketing and distribution of LPG for automotive use. Under the Auto-LPG Rules, an Auto-LPG Industry Participant is required to secure from the DOE through the OIMB an SCC before it can operate. The Auto-LPG Rules also mandate all participants to observe a code of practice consisting of operational guidelines and procedures to ensure the safe operation in the auto LPG business. Illegal trading, adulteration and hoarding are likewise prohibited. Under the Auto-LPG Rules, the following shall constitute prima facie evidence of hoarding: (a) the refusal of Auto-LPG Dispensing Stations to sell LPG products for automotive use shortly before a price increase or in times of tight supply, and in both instances if the buyer or consumer has the ability to pay in cash for the product; and (b) the undue accumulation of Auto-LPG Dispensing Stations of LPG products for automotive use in times of tight supply or shortly before a price increase. For purposes of the Auto LPG Rules, “undue accumulation” means the keeping or stocking of quantities of LPG products for automotive use beyond the inventory levels as required to be maintained by the Auto-LPG

S E C F O R M 1 7 - A 102
Dispensing Stations, for a period of thirty (30) days immediately preceding the period of tight supply or price increase. The Land Transportation Office (“LTO”) also issued Memorandum Circular No. RIB-2007-891 or the “Implementing Rules and Regulations in the Inspection and Registration of Auto-LPG Motor Vehicles.” The Circular requires the device for the use of LPG as fuel by any motor vehicle to be installed only by the conversion/installing shop duly certified by the Bureau of Product and Standards (“BPS”) of the DTI under its Philippine Standards Certification Mark scheme. The converted vehicle shall be subjected to an annual maintenance and inspection by the BPS certified conversion/installing shop. The BPS certified conversion/installing shop shall issue a corresponding Certificate of Inspection and Maintenance Compliance.
Governmental approval of AC Energy’s products and services is generally not required. However, petroleum products refined at the Limay Refinery are subject to Philippine National Standards (“PNS”) specifications. The DTI, through the Bureau of Products Standards, ensures that all products comply with the specifications of the PNS. The Oil Deregulation Law also requires the registration with the DOE of any fuel additive prior to its use in a product. On September 7, 2010, the DENR issued Department Order No. 2010-23 on the Revised Emission Standards for Motor Vehicles Equipped with Compression Ignition and Spark Ignition Engines, mandating compliance of all new passenger and light duty motor vehicles with Euro IV (PH) emission limits subject to fuel availability, starting on January 1, 2016. Euro IV vehicle emission technology requires a more stringent fuel quality of 0.005% sulfur content for both diesel and gasoline. Philippine government regulations also require the following: fire safety inspection certificates; certificates of conformance of facilities to national or accepted international standards on health, safety and environment; product liability insurance certificates or product certificate of quality; and the ECC issued by the DENR for service stations and for environmentally-critical projects. These certificates have to be submitted to the DOE for monitoring (not regulation) purposes. Reports to the DOE are required for the following activities/projects relating to petroleum products: (a) refining, processing, including recycling and blending; (b) storing/ transshipment; (c) distribution/operation of petroleum carriers; (d) gasoline stations; (e) LPG refilling plant; (f) bunkering from freeports and special economic zones; and (g) importations of petroleum products and additives. In addition, importations of restricted goods require clearances from the proper governmental authorities.
Oil Pollution Compensation Act of 2007
Republic Act No. 9483, otherwise known as the Oil Pollution Compensation Act of 2007, imposes strict liability on the owner of the ship for any pollution damage caused within the Philippine territory. Pollution damage is the damage caused outside the ship by contamination due to the discharge of oil from the ship, as well as the cost of preventive measures to protect it from further damage. The law also provides that any person who has received more than 150,000 tons of “contributing oil” (as explained below) in a calendar year in all ports or terminal installations in the Philippines through carriage by sea shall pay contributions to the International Oil Pollution Compensation Fund in accordance with the provisions of the 1992 International Convention on the Establishment of an International Fund for Compensation for Oil Pollution Damage. For this purpose, “oil” includes any persistent hydrocarbon mineral oil such as crude oil, fuel oil, heavy diesel oil and lubricating oil, whether carried on board a ship as cargo or in bunkers of such a ship. A person shall be deemed to have received “contributing oil,” for purposes of determining required contributions, if he received such oil from another country or from another port or terminal installation within the Philippines, notwithstanding that this oil had already been previously received by him. Where the quantity of contributing oil received by any person in the Philippines in a calendar year, when aggregated with the quantity of contributing oil received in the Philippines in that year by such person’s subsidiaries or affiliates, exceeds 150,000 tons, such person, including its subsidiaries and affiliates, shall pay contributions in respect of the actual quantity received by each, notwithstanding that the actual quantity received by each did not exceed 150,000 tons. Persons who received contributing oil are required to report to the DOE. Contributing oil means crude oil and fuel oil as defined under Republic Act No. 9483. Republic Act No. 9483 provides for the establishment of a fund to be constituted from, among others, an impost amounting to ten centavos per liter levied on owners and operators and tankers and barges hauling oil and/or petroleum products in Philippine waterways and coast wise shipping routes. This new fund, named the Oil Pollution Management Fund, will be in addition to the requirement under the 1992

S E C F O R M 1 7 - A 103
Civil Liability Convention and 1992 Fund Convention and will be administered by the Maritime Industry Authority (“MARINA”). In April 2016, the DOTr (then the DOTC) promulgated the implementing rules and regulations of Republic Act No. 9483. Under the rules, oil companies are required to submit (a) reports on the amount of contributing oil received and (b) sales and delivery reports of persistent oil. Other Regulations on Water Pollution
Philippine maritime laws and regulations are enforced by two Philippine government agencies: the MARINA and the Philippine Coast Guard. Both are agencies under the DOTr. The MARINA is responsible for integrating the development, promotion, and regulation of the maritime industry in the Philippines. It exercises jurisdiction over the development, promotion, and regulation of all enterprises engaged in the business of designing, constructing, manufacturing, acquiring, operating, supplying, repairing, and/or maintaining vessels, or component parts thereof, of managing and/or operating shipping lines, shipyards, dry docks, marine railways, marine repair ships, shipping and freight forwarding agencies, and similar enterprises. To address issues on marine pollution and oil spillage, the MARINA issued: (a) Circular No. 2007-01 which mandated the use of double-hull vessels including those below 500 tons deadweight tonnage by the end of 2008 for transporting Black Products; and (b) Circular No. 2010-01 for transporting White Products in certain circumstances by 2011. The Philippine Coast Guard, in a 2005 Memorandum Circular, provided implementing guidelines based on the International Convention for the Prevention of Pollution from Ships, MARPOL 73/78. The guidelines provide that oil companies in major ports or terminals/depots are required to inform the Philippine Coast Guard through its nearest station of all transfer operations of oil cargoes in their respective areas. Furthermore, oil companies and tanker owners are required to conduct regular team trainings on managing oil spill operations including the handling and operations of MARPOL combating equipment. A dedicated oil spill response team is required to be organized to react to land and ship-originated oil spills. Oil companies, oil explorers, natural gas explorers, power plants/barges and tanker owners are also required to develop shipboard oil pollution emergency plans to be approved by the Philippine Coast Guard. Moreover, both the Clean Water Act and the Philippine Coast Guard Guidelines provide that the spiller or the person who causes the pollution has the primary responsibility of conducting clean-up operations at its own expense. Renewable Energy Act Republic Act No. 9513, otherwise known as the Renewable Energy Act of 2008 (the “RE Law”) was signed into law by former President Gloria Macapagal-Arroyo on December 16, 2008 and became effective on January 31, 2009. The RE Law provides for the acceleration and development of renewable resources. It aims to increase the utilization of renewable energy which will provide enhanced market and business opportunities for the renewable energy generation subsidiaries. Among the RE Law’s declared policies is to accelerate and develop the use of the country’s renewable energy (“RE”) resources to (a) reduce the country’s dependence on fossil fuels, thereby minimizing exposure to price fluctuations in the international markets, and (b) reduce or prevent harmful emissions and promote a healthy and sustainable environment. The RE Law imposes a government share on existing and new RE development projects at a rate of 1% of the gross income from the sale of renewable energy and other incidental income from generation, transmission and sale of electric power, except for indigenous geothermal energy which shall be at a rate of 1.50% of gross income. Proceeds from micro-scale projects for communal purposes and non-commercial operations, not exceeding 100 kW, and proceeds from the development of biomass resources will not be subject to the said government share. The RE Law offers fiscal and non-fiscal incentives to RE developers, including developers of hybrid systems, subject to certification by the DOE in consultation with the BOI. These incentives include an ITH for the first seven years of commercial operations; duty-free importations of RE machinery, equipment and materials effective within ten years upon issuance of certification, provided, said machinery, equipment and materials are directly and actually needed and exclusively used in RE facilities; special realty tax rates on civil works, equipment, machinery and other improvements of a
S E C F O R M 1 7 - A 104
registered RE developer not exceeding 1.50% of the net book value; net operating loss carry-over; corporate tax rate of 10% after the seventh year; accelerated depreciation; zero-percent VAT on sale of fuel or power generated from RE sources and other emerging sources using technologies such as fuel cells and hydrogen fuels and on purchases of local supply of goods, properties and services needed for the development, construction and installation of RE facilities; cash incentives for missionary electrification; tax exemption on the sale of carbon emission credits; and tax credit on domestic purchases of capital equipment and services. All fiscal incentives apply to all RE capacities upon the effectivity of the RE Law. RE producers from intermittent RE resources are given the option to pay transmission and wheeling charges on a per kilowatt-hour basis at a cost equivalent to the average per kilowatt-hour rate of all other electricity transmitted through the grid. Qualified and registered RE generators with intermittent RE resources shall be considered “must dispatch” based on available energy and shall enjoy the benefit of priority dispatch. Electricity generated from RE resources for the generator’s own consumption and/or for free distribution to off-grid areas is exempt from the universal charge. The RE Law further provides financial assistance from government financial institutions for the development, utilization and commercialization of renewable energy projects, as may be recommended and endorsed by the DOE. Pursuant to Department Circular No. DO2009-05-008 dated May 25, 2009 (Rules and Regulations Implementing the Renewable Energy Act of 2008), the DOE, the BIR and the Department of Finance shall, within six months from its issuance, formulate the necessary mechanism and/or guidelines to implement the entitlement to the general incentives and privileges of qualified RE developers. However, to fully implement the RE Law, the Renewable Portfolio Standards, the RE Market and the changes in the WESM Rules for intermittent generation should still be implemented. Further, the RE Law provides a policy on FIT. The FIT scheme mandates electric power industry participants to source RE-derived electricity at a guaranteed fixed price (the “FIT Rate”). This scheme was primarily viewed as a way to entice the private sector players to hasten investment into the renewable power generation sector due to the urgent need of the Philippines to deploy additional capacity. RE projects are governed by an RE Contract, a service agreement between the Philippine Government and an RE developer over an appropriate period of time as determined by the DOE in which the RE developer will have the exclusive right to explore, develop or utilize a particular RE area. Feed-In Tariff The ERC issued Resolution No. 16, Series of 2010 (“ERC Resolution No. 16-2010” or the “FIT Rules”), otherwise known as “Resolution Adopting the Feed-In Tariff Rules”, which establishes the FIT system and regulates the method of establishing and approving the FITs and the FIT Allowance (“FIT-All”). The FIT Rules are specific for each emerging renewable energy technology and to be applied only to generation facilities which enter into commercial operation after effectivity of the FIT Rules or to such parts of such existing facilities which have been substantially modified or expanded as provided under the FIT Rules. Under the FIT Rules, the FITs are specific for each eligible renewable energy plants (“Eligible RE Plants”), which are those power facilities with COCs issued to them that utilize emerging renewable energy resources or to such parts of such existing facilities that have been substantially modified or expanded, which enter into commercial operation after effectivity of the FIT Rules. These include facilities intended for their owners’ use, which are connected to the transmission or distribution networks and are able to deliver to such networks their generation or parts thereof. The renewable energy plants which have started commercial operations after the effectivity of the RE Law and are not bound under any contract to supply the energy they generate to any distribution utility or consumer, may avail of the FITs from time to time they are certified by the ERC as eligible through an amendment of the COC issued to them and for a period of 20 years less the number of years they have been in operation. FITs shall be established for each generation plant using: (a) wind energy resources; (b) solar energy resources; (c) ocean energy resources; (d) run-of-river hydroelectric power resources; (e) biomass energy resources; and (f) renewable energy components of technologies listed above of hybrid systems under the RE Law.

S E C F O R M 1 7 - A 105
The FIT System applicable to renewable energy plants in on-grid areas are: (a) Technology-specific FITs; (b) Fixed FITs; and (c) Time-of-Use FITs. Eligible RE Plants shall be entitled to the applicable FITs to them for a period of 20 years. After this period, should these plants continue to operate, their tariffs will be based on prevailing market prices or whatever prices they should agree with an offtaker. Electricity consumers who are supplied with electricity through the distribution of transmission network shall share in the cost of the FITs in part through a uniform charge (in P/kWh) referred to as the FIT-All and applied to all billed kWh. NGCP ensures that the FIT-All fund is sufficient to pay all renewable energy producers regularly. For further information on AC Energy, please refer to its website www.acenergy.com.ph.

S E C F O R M 1 7 - A 106
Ayala Group also conducts business in the areas of automotive/ motors, infrastructure and healthcare. AC Industrials Re-established in 2016, AC Industrial Technology Holdings, Inc. (“AC Industrials”) is the Ayala group’s industrial technology arm. AC Industrials operates and manages a global portfolio composed of operating units and high technology, developmental platforms. Its business lines include global electronics manufacturing solutions, automotive design and engineering, specialty solar, and automotive distribution and retail. The company is founded on Integrated Micro-Electronics, Inc., one of the Philippines’s EMS (Electronics manufacturing services) pioneers and now a globally leading manufacturing and technology solutions partner, and AC Motors, one of the country’s largest multi-brand automotive distribution & retail groups. AC Industrials operates in twelve countries around the world, with the capacity to tap markets in North America, Europe, and Asia. It is Ayala’s platform to boost its presence in the global and domestic industrial technologies spaces by capitalizing on opportunities opened by disruptive technological shifts, changing industry landscapes, and increasing demand from end-users. AC Motors AC Motors is a group of companies that are directly owned by AC Industrials and active across the downstream vehicle value chain. AC Motors is one of the largest vehicle businesses in the Philippines with operations in vehicle assembly and manufacturing, vehicle distribution and vehicle retail. From a primarily Honda and Isuzu-based dealership business, it has since grown its portfolio to offer a total of six (6) vehicle brands. AC Motors started its operations in 1990 when Ayala decided to invest in and retail Honda vehicles. Through AC Motors, AC Industrials owns the largest Honda and Isuzu dealership networks in the country in terms of vehicle sales. AC Motors owns and manages eleven Honda dealerships through Honda Cars Makati, Inc. and ten Isuzu dealerships through Isuzu Automotive Dealership, Inc. In addition, AC Industrials has a 12.5% stake in Honda Cars Philippines, Inc. (“HCPI”) and a 15% share in Isuzu Philippines Corporation (“IPC”). HCPI is a joint venture with Honda Motors Co. Ltd. and RCBC while IPC is a joint venture with Isuzu Motors, Ltd., Mitsubishi Corporation and RCBC. In 2012, AC Motors marked its foray into automotive distribution when it was appointed as the distributor of Volkswagen vehicles in the Philippines. Volkswagen is currently sold across the country through eight dealerships. In 2018, AC Motors expanded its distribution arm when it acquired the national distributorships of the Kia and Maxus brands. The Volkswagen and Maxus businesses are housed under Automobile Central Enterprise, Inc. AC Motors also actively retails its vehicles through Iconic Dealership, Inc., which owns and operates four Volkswagen dealerships, one Kia dealership and one Maxus dealership. AC Motors invested in its first two-wheel vehicle brand in 2016 when it formed a strategic partnership with KTM AG, one of Europe’s leading motorcycle companies. AC Motors, through Adventure Cycle Philippines Inc. (ACPI) is the official distributor of KTM motorcycles in the Philippines. In addition, ACPI holds a 66% share in KTM Asia Motorcycle Manufacturing, Inc. (KAMMI), a joint venture with KTM AG that assembles and manufactures KTM motorcycles in the Philippines. ACPI serves 40 KTM dedicated dealerships throughout the Philippines, and through KAMMI, supplies motorcycles for both local and export markets. The Kia distributorship business operates for the time being under ACPI, while KP Motors Corporation, a 65% joint venture with Roadworthy Cars, Inc., the brand’s previous Philippine distributor, is operationalized. Operationalization of KP Motors is expected to be complete by the second quarter of 2020. The full year 2019 growth of the Philippine automotive market was 4%. This represents a modest but emerging recovery from the 15% drop posted by the industry in 2018. The weakness in 2018 was caused by the implementation of a new excise tax regime, which softened demand during the year, but accelerated purchases in 2017 in anticipation of the new excise taxes. Prior to this, the automotive sector had grown at a compounded annual growth rate of 17% from 2009 to 2016. AC Motors continues to weather internal and external challenges, which include flattish industry growth and intensifying competition. For full year 2019, AC Motors offered six vehicle brands and held a 4%

S E C F O R M 1 7 - A 107
market share based on the unit sales of the Honda and Isuzu dealerships it manages and the total unit sales of the brands it distributes. AC Motors directly owns and operates a total of 27 automotive dealerships and one KTM dealership. High Technology Developmental Businesses In 2017, AC Industrials started assembling its portfolio of enabling technologies when it acquired Misslbeck Technologies initially with 94.9% stake that year and at 100% as of December 2019. Misslbeck, based in Ingolstadt, Germany, was renamed MT Technologies post transaction closing. It is a tooling, cubing, and serial production business that primarily produces tools, provides modelling services, and manufactures parts for German automotive original equipment manufacturers (“OEMs”). These capabilities were further strengthened in 2019 when MT Technologies acquired a 75.1% share in C-Con GmbH, a group of three companies based in Germany that provides development, design, manufacturing and process design services to automotive and aerospace OEMs. C-Con GmbH also offers a unique proprietary process for carbon fiber reinforced polymer production. AC Industrials also entered the smart energy space after acquiring Merlin Solar Technologies initially with 98.96% stake in February 2018 and at 99.20% as of December 2019. Based in San Jose, California, Merlin holds proprietary grid technology that enables specialty solar panels for unique and demanding applications primarily in transport, marine, roofing and mobile. Merlin Solar Technologies, Inc. manufactures in the Philippines, U.S. and Thailand. For further information on AC Industrials, please refer to its website www.acindustrialtech.com.ph. Infrastructure AC Infrastructure Holdings Corporation AC Infrastructure Holdings Corporation (“AC Infra”) is Ayala Corporation’s vehicle for investments in the infrastructure and logistics sector. It operates and manages a portfolio of projects in the toll road, rail, airport, and logistics sectors through its various subsidiaries. AC Infra intends to meet the country’s urgent need for efficient, reliable, safe, and sustainable modes of mass transportation and transport services to move people, goods, and services by investing in strategic solutions using new or existing technologies and platforms. It develops businesses and infrastructure projects to support the growing needs of the public and private sectors in the areas of mass transportation, mobility, and fulfilment solutions services. Established in 2006, AC Infra has been participating in various PPP bids and has been awarded three PPP projects to date. Following its first PPP win of the Muntinlupa-Cavite Expressway (“MCX”), formerly known as the Daang Hari-SLEX connector road, in 2012, it also won, through a consortium comprising the Ayala and First Pacific groups, the Automated Fare Collection System project as well as the operation and maintenance of LRT 1 and the LRT 1 Cavite Extension project, together with the Metro Pacific and Macquarie groups. Since its inauguration in July 2015, MCX serves an average of 35,000 vehicles daily in 2019. Light Rail Manila Corporation, which operates and maintains LRT1, has increased the number of light rail vehicles running on the line from 77 to 113 as of July 2019 since it took over operations in September 2015. Construction work on the Cavite extension project is ongoing, which will add 11.7 kms to the line from Baclaran to Bacoor, Cavite. The beep payment system has sold over 7.9 million cards and facilitated ₱16 billion in transaction value across various rail, bus, and toll road systems in 2018. In 2017, AC Infra entered the logistics space with its investment in Entrego Fulfillment Solutions, Inc. Entrego was initially set-up as Zalora Philippine’s in-house fulfillment solutions division to ensure delivery lead times and service levels are aligned with customers’ expectations. In 2017, this division was spun-off and Entrego emerged as an independent company – a joint venture between AC Infra and the Global Fashion Group, an affiliate of Zalora. Entrego helps businesses manage their B-to-C and B-to-B logistics and fulfillment needs by providing customized end-to-end solutions. Its technology backbone enables real-time tracking of shipment, providing clients visibility and peace of mind that goods get to their destination.

S E C F O R M 1 7 - A 108
AC Infra constantly looks for opportunities to build infrastructure needed to support new and innovative business models and accelerate growth in the country. MCX Tollway Inc. Ownership: 100% owned by Ayala Corporation Concession Terms: 30 Years MCX Tollway, Inc. is Ayala’s first toll road project, which was awarded in 2011, under the Government’s PPP program. It is a vital access road that links the rapidly growing city of Muntinlupa and the province of Cavite to Metro Manila. Project Overview: 4-km, 4-lane toll road, from the junction of Daang Reyna and Daang Hari in Las Pinas/Bacoor, Cavite to SLEX through Susana Heights Interchange in Muntinlupa, traversing the New Bilibid Prison Reservation. The link-road passes through the Susana Heights Interchange as exit and entry from north and south of SLEX and widening of the existing bridge crossing SLEX as well as the expansion of the Susana Heights toll plaza. Light Rail Manila Corporation AC Infra Effective Stake: 35% Concession Terms: 35 Years Light Rail Manila Corporation (“LRMC”) is a joint venture company of AC Infra, Metro Pacific Light Rail Corporation, and Philippine Investment Alliance for Infrastructure fund. LRMC operates and maintains the existing LRT Line 1 and will construct an 11.7-km extension from the present endpoint at Baclaran to the Niog area in Bacoor, Cavite. A total of eight new stations will be built along this route, which traverses the cities of Parañaque and Las Piñas up to Bacoor, Cavite to help ease the worsening traffic conditions in this corridor and enhance commercial development around the rail stations. Project Overview: Line 1 runs a total of 20 kilometers from Baclaran in Pasay City to Roosevelt in Quezon City and will be extended by another 11.7-kilometers extension from the present end point at Baclaran to the Niog area in Bacoor, Cavite. Of this length, 10.5 kilometers will be elevated and 1.2kilometers will be at-grade. The whole stretch of the integrated LRT 1 will have a total length of approximately 32.4 kilometers. AF Payments Inc. Ownership: The AF Consortium is composed of the following companies:
• 36% Ayala Group Effective Stake, composed of AC Infra, BPI Card Finance Corporation and Globe.
• 20% Metro Pacific Investments, 20% Smart Communications, Inc., and 10% Meralco Financial Services Corp. for the First Pacific group.
Concession Terms: 10 years AF Payments Inc. is a consortium between the two of the country’s biggest conglomerates, the Ayala Group and First Pacific Group – known as the AF Consortium. The AF Consortium brings together companies that have strong track records and experience in operating banking and payments, utilities, retail, telecommunications, and toll road businesses, focused on developing commuting efficiency and improving customer experience. Project Overview: AFPI provides contactless and electronic payment systems used in various mass transportation systems. The cashless payment system is used to make payments on public transport, specifically the rail system, and is planned to be available in a wide range of retailers and facilities. The name of the application is beep™. Entrego Fulfillment Solutions, Inc. In 2017, AC Infra entered the logistics space with its investment in Entrego Fulfillment Solutions, Inc. Entrego was initially set-up as Zalora Philippine’s in-house fulfillment solutions division to ensure delivery lead times and service levels are aligned with customers’ expectations. In 2017, this division was spun-off and Entrego emerged as an independent company – a joint venture between AC Infra (60%) and the Global Fashion Group (40%), an affiliate of Zalora. For further information on AC Infra, please refer to its website www.acinfra.com.ph.

S E C F O R M 1 7 - A 109
Healthcare In 2015, Ayala set up Ayala Healthcare Holdings, Inc. or AC Health. AC Health is envisioned to be a portfolio of healthcare business currently comprising retail pharmacy and primary care, targeting the growing middle-income segment. AC Health’s initial entry into the space was the acquisition of a 50% stake in the Generika group, the pioneer in the retail of quality generic medicines in the country. In 2019, AC Health additional stake in the Generika companies which increased its ownership from 50% to 52.5%. The third largest pharmacy chain in the Philippines, Generika has a total of over 830 stores nationwide in 2019. Generika was established in September 2003 to address the need for quality and affordable medicines and promote use of generic drugs, which offer up to 85% savings vs. branded equivalents. Generika continues to expand its footprint, with a target to reach 1,000 stores by 2020. It is also improving access to quality generics by growing its housebrand portfolio which, to date, has 100 medicines under the Actimed and Nutrawell brand. In primary care, AC Health started a chain of community-based retail clinics under the FamilyDOC brand, now the largest retail clinic chain in the country. FamilyDOC offers the combined services of an outpatient doctor’s clinic, a diagnostic facility, and a pharmacy at an affordable cost. As of September 2019, it has 68 clinics in the Greater Metro Manila Area (Cavite, Laguna, Las Pinas, Paranaque, Manila, Pasig, Taguig, Pateros, Marikina, Rizal, Quezon City, Caloocan, and Valenzuela), and has served over 400,000 unique patients since it opened in December 2015. FamilyDOC employs almost 700 medical professionals, including over 120 Family Medicine residents under its duly accredited Residency Training Program, the largest program in the country. To boost program on primary care, in 2019, AC Health signed a binding agreement to acquire a 100% stake in Healthway Philipines, Inc. (Healthway) from Healthway Asia Ltd. Healthway Philippines, Inc. owns, through its wholly-owned subsidiary HMC, Inc., the Healthway chain of clinics that comprises of 7 mall-based specialty clinics and 40 corporate clinics in the country. This acquisition transaction was completed in January 2020. In 2019, AC Health also subscribed to shares of I.E. Medica Inc., an importer of pharmaceutical products for an initial 49% interest in the company with a call option to acquire an additional 2% stake. At the same time, AC Health signed another SPA to purchase shares of Medethix Inc., a pharmaceutical and cosmetics importer, for a 20% interest. AC Health has also established Vigos Technologies, the first digital health portfolio in the Philippines. Vigos’ portfolio of health technology solutions includes VigosEMR, an Electronic Medical Record system, MedGrocer, an FDA-licensed online pharmacy, and AIDE, a home health care platform. It has also invested in Tikehau-SPRIM, a Singapore-based health fund, and in Fibronostics, a global US-based healthcare technology company focusing on non-invasive algorithm-based solutions for diagnostic testing. Please see Notes 10 and 24 of the 2019 Consolidated Financial Statement for further details on the above key transactions. AC Health’s vision is to build an integrated healthcare ecosystem, strengthening synergies and partnerships across the various healthcare units, and within the Ayala Group. It continues to be mindful of potentially disruptive trends, exploring other segments of the industry to enhance its portfolio of services, with a strong focus on making healthcare more accessible and affordable to more Filipinos. For further information on AC Health, please refer to its website www.ac.health.com.ph.

S E C F O R M 1 7 - A 110
Bank of the Phil. Islands (BPI or the Bank), and Globe Telecom (Globe) are significant associate and joint venture of the Group, respectively. BANK OF THE PHILIPPINE ISLANDS Bank of the Philippine Islands’ highlights of Consolidated Statements of Condition and Statements of Income are shown in the Note 10 of the Group’s 2019 Consolidated Financial Statements as well as in the BPI’s 2018 Consolidated Financial Statements which form part of Index to Financial Statements and Supplementary Schedules of this SEC 17A report. Background and Business The Ayala Group conducts its financial services business through Bank of the Philippine Islands (alternately referred to as BPI, “the Bank” or “the Company” in the entire discussion of Bank of the Philippine Islands). BPI is a Philippine-based universal bank with an expanded banking license. Founded in 1851, BPI is the country’s oldest bank. In the post-World War II era, BPI evolved, largely through a series of mergers and acquisitions during the 1980s and 1990s, from a purely commercial bank to a fully diversified universal bank with activities encompassing traditional commercial banking as well as investment and consumer banking. Together with its subsidiaries, BPI offers a wide range of financial services that include corporate banking, consumer banking, consumer lending, investment banking, asset management, securities distribution, insurance services and leasing. Such services are offered to a wide range of customers, including multinationals, government entities, large corporations, SMEs and individuals.
Business Development The 168-year-old Bank of the Philippine Islands (“BPI”) is the first bank in the Philippines and Southeast Asia, and licensed by the Bangko Sentral ng Pilipinas (“BSP”) to provide universal banking services. The Bank is among the highest in the industry in terms of total assets, equity capital, and market capitalization, and has a significant share of total banking system deposits, loans, and investment assets under management. It is recognized as one of the country’s top providers of crossborder remittances, life and non-life bancassurance services, as well as asset finance and leasing. BPI also has a significant capital markets presence, particularly in fixed income and equities underwriting, distribution and brokerage. It is a significant provider of foreign exchange to both retail and corporate clients. The Bank also has the country’s second largest branch network and operates the second largest ATM network. It is a leader and innovator in the use of digital channels, and is a major provider of financial services through internet and mobile banking. Historical Background. Founded in 1851, BPI was the first bank formed in the Philippines and was the issuer of the country’s first currency notes in 1855. It opened its first branch in Iloilo in 1897 and pioneered in sugar crop loans. It also financed the first tram service, telephone system, and electric power utility in Manila and the first steamship in the country. As such, BPI and its “escudo” ranks as one of the largest home-grown Philippine brands and carries an extensive legacy. Recent History. For many years after its founding, BPI was the only domestic commercial bank in the Philippines. BPI’s business was largely focused on deposit taking and extending credit to exporters and local traders of raw materials and commodities, such as sugar, tobacco, coffee, and indigo, as well as funding public infrastructure. In keeping with the regulatory model set by the Glass Steagall Act of 1932, the Bank operated for many years as a private commercial bank. In the early 1980s, the Monetary Board of the Central Bank of the Philippines (now the Bangko Sentral ng Pilipinas, or BSP) allowed BPI to evolve into a fully diversified universal bank, with activities encompassing traditional commercial banking as well as investment and consumer banking. This transformation into a universal bank was accomplished through both organic growth and mergers and acquisitions, with BPI absorbing an investment house, a stock brokerage, a leasing company, a savings bank, a retail finance company, and bancassurance platforms. BPI consummated three bank mergers since the late 1990s. In 1996, it merged with City Trust Banking Corp., the retail banking arm of Citibank in the Philippines, which enhanced its franchise in consumer banking. In 2000, BPI acquired Far East Bank & Trust Company (“FEBTC”), then the largest banking merger in the Philippines. This merger established BPI’s dominance in asset management & trust services and branch banking; furthermore, it enhanced the Bank’s penetration of middle market clients. In 2000, BPI also formalized its acquisition of major insurance companies in the life, non-life and

S E C F O R M 1 7 - A 111
reinsurance fields. In 2005, BPI acquired and merged with Prudential Bank, a medium sized bank with a clientele of middle market entrepreneurs. In 2011, BPI became the first bank in the Philippines to acquire the trust business of a foreign bank when it purchased the trust and investment management business of ING Bank N.V. Manila. In 2014, BPI completed a strategic partnership with Century Tokyo Leasing Corp., one of the largest leasing companies in Japan, to form BPI Century Tokyo Lease & Finance Corp., with BPI retaining 51% of ownership. This strategic partnership is expected to help BPI innovate in asset financing products and enhance the service experience of an expanding base of Philippine consumers and corporations seeking asset leasing and rental solutions. In 2015, BPI completed another strategic partnership with Global Payments (“GPN”), an Atlantabased, NYSE-listed provider of international payment services. By combining its merchant acquiring network with that of GPN, BPI stands to provide enhanced services to its card customers, as well as to its merchant clients. The partnership with GPN remained 49% owned by BPI. In August 2016, BPI acquired a 10% minority stake in Rizal Bank Inc. (“RBI”), a member institution of Center for Agriculture and Rural Development Mutually Reinforcing Institutions (“CARD MRI”), a group of social development organizations that specialize in microfinance. Effective September 20, 2016, BPI has taken full control over BPI Globe BanKO, Inc. after acquiring the 20% and 40% stake of Ayala Corporation and Globe Telecom, respectively. On December 29, 2016, the Securities and Exchange Commission approved change of the corporate name to BPI Direct BanKo, Inc., A Savings Bank, after BPI Direct absorbed the entire assets and liabilities of BanKO. Also on December 29, 2016, BPI successfully spun off its BPI Asset Management and Trust Group (“BPI AMTG”) to a Stand-Alone Trust Corporation (“SATC”) named BPI Asset Management and Trust Corp. (“BPI AMTC”). BPI AMTC officially commenced its operations on February 1, 2017. BPI evolved to its present position as a leader in Philippine banking through a continuous process of improving its array of products and services, while maintaining a balanced and diversified risk profile that helped reinforce the stability of its earnings. Business Milestones (2017-2019). On November 20, 2019, BPI Investment Management Inc. ("BIMI"), a wholly owned subsidiary of BPI, and PhilAm Asset Management, Inc. (“PAMI”) first announced the agreement to transfer the management of funds. Effective January 29, 2020, BIMI assumed the management and distribution of nine mutual funds previously managed by PAMI. Principal Subsidiaries. The Bank’s principal subsidiaries are: 1) BPI Family Savings Bank, Inc. ("BFSB") is BPI's flagship platform for retail lending, in particular,
housing and auto loans. It is also one of BPI's primary vehicles for retail deposits. BFSB was acquired by BPI in 1984;
2) BPI Capital Corp. ("BPI Cap") is an investment house focused on corporate finance and the
underwriting, distribution, and trading of debt and equity securities. It began operations in December 1994. BPI Cap wholly owns BPI Securities Corp., a stock brokerage;
3) BPI Direct BanKo, Inc., A Savings Bank ("BanKo"), serves microfinance customers through branch,
digital, and partnership channels. Founded in February 2000 as BPI Globe BanKO, it is now wholly-owned, following a September 2016 purchase of stakes owned by Ayala Corp. (20%) and Globe Telecom, Inc. (40%) and a December 2016 merger with BPI Direct Savings Bank, Inc.;
4) BPI International Finance Limited ("BPI IFL") is a deposit taking company in Hong Kong. Originally
established in August 1974, it provides deposit services as well as client-directed sourcing services for international investments;
5) BPI Remittance Centre Hong Kong Ltd. ("BERC HK") is a licensed money service operator in Hong
Kong servicing the remittance services to beneficiaries residing throughout the Philippines. On November 21, 2018, BPI IFL distributed its shares in BERC HK as a property dividend to the Parent Bank. BERC HK became an immediate subsidiary of the Parent Bank following this;
6) BPI Europe Plc. ("BPI Europe") commenced operations in the United Kingdom in May 2007 as a
bank registered in England and Wales. It is a UK-licensed bank authorized by the Prudential

S E C F O R M 1 7 - A 112
Regulation Authority (PRA), and regulated by the PRA and the Financial Conduct Authority (FCA). It started its operations offering retail deposit products and money services, servicing retail customers, primarily targeting the Filipino community;
7) BPI Century Tokyo Lease & Finance Corp. ("BPI CTL") is a non-bank financial institution ("NBFI")
that provides financing services pursuant to the Financing Company Act. BPI CTL is a joint venture with Century Tokyo Leasing Corp., who purchased a 49% stake in 2014. BPI CTL wholly owns BPI Century Tokyo Rental Corp., which offers operating leases;
8) BPI/MS Insurance Corp. ("BPI MS") is a non-life insurance company. It is a joint venture with Mitsui
Sumitomo Insurance Co. (who owns a 49% stake), and is the result of a merger of FGU Insurance Co. and FEB Mitsui Marine Insurance Co., which was acquired as a subsidiary of Far East Bank in 2000;
9) BPI Asset Management and Trust Corporation ("BPI AMTC") is a Stand Alone Trust Corporation
(SATC) serving both individual and institutional investors with a full suite of local and global investment solutions. BPI AMTC was established after a Certificate of Authority to Operate was issued by the BSP on December 29, 2016 and it started operations on February 1, 2017;
10) BPI Investment Management Inc. ("BIMI") is a wholly owned subsidiary of the Bank and serves as
the Bank's manager and investment advisor to the ALFM mutual funds, which comprise a number of open-end investment companies registered with, and regulated by, the Securities and Exchange Commission (“SEC”). BIMI is also responsible for formulating and executing the funds' investment strategies.
Principal Products & Services The Bank offers a wide range of corporate and retail banking products. The Bank has two major categories for products and services. The first category covers its core financial intermediation business, which includes, deposit taking, lending, and securities investments. Revenue from this category is collectively termed as net interest income and accounts for 70% of net revenues. The second category covers services ancillary to the Bank’s financial intermediation business, and from which it derives transaction-based commissions, service charges and other fees. These include investment banking and corporate finance fees, asset management and trust fees, stock brokerage fees, credit card-related fees, rental of bank assets, income from insurance subsidiaries and service charges or commissions earned on international trade transactions, drafts, fund transfers, various deposit-related services, and revenues from transactions on the digital channels. Commissions, service charges, and other fees, when combined with trading gains and losses arising from the Bank’s fixed income and foreign exchange operations, constitute non-interest income, which accounts for the remaining 30% of net revenues. Foreign Offices Contribution
2017 2018 2019
Share in Total Revenue (%) 1.51 0.56 0.47
Hong Kong 0.37 0.37 0.31
USA 0.86 (0.00) (0.00)
Europe 0.28 0.20 0.16
Share in Total Net Income (%) 1.57 (0.02) (0.28)
Hong Kong 0.18 (0.12) (0.32)
USA 1.43 0.04 (0.06)
Europe (0.04) 0.05 0.09
Distribution Network BPI had 867 branches across the country, including 6 kiosk branches, as of end 2019. Kiosks are branches much smaller than traditional full-service branches, but are fully equipped with terminals allowing direct electronic access to product information and customers’ accounts, as well as processing of self-service transactions. Kiosks serve as sales outlets in high foot traffic areas such as supermarkets, shopping malls, transit stations, and large commercial establishments. Additionally, there are 300 BPI Direct BanKo branches and Branch-Lite Units (BLUs) set up in strategic locations in the country. Overseas, BPI has one (1) Hong Kong office (BPI IFL) and two (2) BPI Europe offices in London.

S E C F O R M 1 7 - A 113
BPI maintains a specialized network of overseas offices to service Filipinos working abroad. To date, BPI has 3 Remittance Centers located in Hong Kong and 2 representative offices located in UAE and Japan. BPI also maintains remittance tie-up arrangements with various foreign entities in several countries to widen its network in serving the needs of Filipinos overseas. On the lending side, there are 26 business centers, servicing both corporate and retail clients, across the country to process loan applications, loan releases, and international trade transactions. These centers also provide after-sales servicing of loan accounts. BPI’s ATM network has a total of 2,822 terminals as of end-2019, of which 2,323 are ATMs and 499 are Cash Accept Machines (CAMs). This complements the branch network by providing cash related banking services to customers at any place and time of the day. In addition, the interconnection with Bancnet gives BPI cardholders access to over 20,000 ATMs across the country. BPI’s ATM network is likewise interconnected with Mastercard, China Union Pay (CUP), Discover/Diners, JCB, and Visa. Through the Bank’s extensive physical and digital networks, the Bank provides a broad range of value-added services to its clients, enhancing convenience and self-service capabilities, as well as greater accessibility. BPI’s retail digital platforms (BPI Online and BPI Mobile) provide clients a reliable, safe and intuitive digital banking experience. This translates to an ultimate convenience through quick and paperless transactions anytime, anywhere. Aside from the standard banking features (i.e. account inquiry, funds transfer, bills payment), the digital platforms have introduced a new set of innovative features and services. These include: • Cash-in transactions to Partner Merchants via Application Programming Interface (“API”) where
clients now have more service offerings to choose from, such as loading the following e-wallets real time: Gcash, Paymaya, Smart Money, Beep, Easytrip, Autosweep RFID, Dibz and Get Go;
• Enrollment of billers and other merchants now made easier with the use of One-Time PIN; • Inter-bank Funds Transfer which now allow clients transfer to other local banks in the country; • BPI Express Assist to set branch appointments in advance; • Recent and Favorites - Clients may now view their last 3 transactions and save their 10 favorite
unenrolled accounts for easier access; • Push Notifications - Clients may now receive transactional notifications (Funds Transfer Advice,
Device Registration, and Load Prepaid Card); • Plus, clients can now choose which accounts they want to see under the new Manage Accounts
feature. BPI Phone Banking provides clients with 24/7 self-service banking facilities and a gateway to get live support through the Bank's Contact Center. Using any phone, customers can call 889-10000 to inquire about their account balances and latest transactions, transfer funds to other BPI accounts in real time and pay for their various bills. Concerns and queries on any of BPI's products and services are addressed by the highly-trained Phone Banking Specialists any time, any day. Competition Mergers, acquisitions and closures continued to reduce the number of players in the industry from a high of 50 upon the liberalization of rules on the entry of foreign banks, down to 46 universal and commercial banks in December 2019. Lending by universal and commercial banks, excluding thrift banks, grew by 10.4% in 2019, lower than the 14.6% registered growth in 2018. The top five industry sectors that banks have lent to are the following: 1. Water supply, sewerage, waste management and remediation 2. Construction 3. Real estate activities 4. Financial and insurance activities 5. Agriculture, forestry and fishing The above sectors grew by 28.5%, 23.4%, 19.6%, 17.3%, and 15.4%, respectively. Decent credit demands were also seen from administrative and support service activities, information and communication, arts, entertainment and recreation, electricity, gas, steam and air-conditioning supply, and education. Consumer loans also grew by 26.5% in December 2019 versus the prior year. Based on required published statements by the BSP as of December 2019, BPI is the third largest bank operating in the country in terms of assets, customer loans, and capital, while ranking fourth in terms of deposits. The Bank ranks second in terms of trust assets. Total assets of BPI, based on Philippine

S E C F O R M 1 7 - A 114
Accounting Standards (PAS) compliant audited financial statements, are higher than the published statements prepared along BSP standards. Please refer to the section "Future Prospects" of this report for a general outlook on the economy and banking industry. Patents, Trademarks, Licenses, Franchises, etc. BPI provides its products and services through the BPI trademark and/or trade name. All its major financial subsidiaries carry the BPI name prefix (e.g., BPI Family Savings Bank, BPI Capital, BPI Securities, BPI Leasing, and BPI Direct BanKo), and so do its major product and service lines. Following are some of BPI’s trademarks for its products and services: 1. BPI Express Assist (BEA), for its branch queuing facility 2. BPI ATM, for its automated teller machine 3. BPI CAM, for its cash accept machine 4. BPI Debit and BPI Debit Cards, for its debit cards 5. Express Credit, BPI Credit and BPI Credit Cards, for its credit cards 6. Express Cash, My ePrepaid and BPI ePay, for its prepaid cards 7. BPI Phone Banking, for its contact center facility 8. BPI Online, for its internet-based transaction platform for retail customers 9. BPI Mobile App, for its mobile banking facility 10. BPI ExpressLink/BizLink, for its internet-based transaction platform for corporate customers 11. ExpressLink Mobile, for its mobile banking for corporate customers 12. Express Collect, for its over-the-counter bills collection At BFSB, the product trademarks include the BPI Family Housing Loan and the BPI Family Auto Loan. Other product brands of BPI, BFSB and BanKo are Kaya Savings, Jumpstart, PondoKo Savings, MaxiOne, Save-up, Advance Savings, Maxi-Saver, Pamana Savings Account, Pamana Padala, Padala Moneyger, Ka-Negosyo Checking Account, Plan Ahead, the BPI Personal Loan and a loan product specifically offered by BanKo, BanKo NegosyoKo. All the Bank’s Trademark registrations are valid for 10 years with years of expiration varying from year 2020 to 2029. Trademarks intended to be used or maintained by the Bank are so maintained and renewed in accordance with applicable Intellectual Property laws and regulations. The Bank closely monitors the expiry and renewal dates of its trademarks to protect the Bank’s brand equity. In terms of business licenses, BPI has an expanded commercial banking license while BFSB and BanKo have savings bank licenses. BPI Capital Corp. has an investment house license and is a registered Government Securities Eligible Dealer (“GSED”) with Broker/Dealer of Securities Function and Mutual Fund Distributor. BPI CTL has a finance company license. BPI AMTC has a trust license, securities custodian and registry license and is a PERA-accredited administrator while BIMI has an investment company adviser license, mutual fund distributor license, and is a registered transfer agent. BPI MS was granted by the Insurance Commission a Certificate of Authority to transact and sell non-life insurance products. For foreign business licenses, BPI (Europe) Plc is a UK-licensed bank authorized by the Prudential Regulation Authority (“PRA”), and regulated by the PRA and the Financial Conduct Authority (“FCA”). Meanwhile, BPI IFL is licensed by the Hong Kong Monetary Authority as a deposit-taking company. It was further granted by the Hong Kong Securities and Futures Commission with licenses to engage in securities dealing and advising, and asset management. Related Parties In the ordinary course of business, the Bank has entered into various transactions with its Directors, Officers, Stockholders and their Related Interest, or DOSRI, including loan transactions. BPI and all its subsidiaries have always been in compliance with the General Banking Act, BSP circulars and regulations on DOSRI loans and transactions. As of December 31, 2019, DOSRI loans amounted to 0.67% of loans and advances as per Note 30 of the 2019 Audited Financial Statements. Government Regulations (2017-2019)

S E C F O R M 1 7 - A 115
Under the General Banking Act, the Monetary Board of the BSP is responsible for regulating and supervising financial intermediaries like BPI. The implementation and enforcement of the BSP regulations is primarily the responsibility of the supervision and examination sector of the BSP. BPI, as a publicly listed company (“PLC”), is also governed by SEC memorandum circulars and BIR revenue regulations. Below is a non-exhaustive list of the regulations BPI has adopted in the last three years:
Issuance No. Issue Date Effective Date Title/Summary
BSP Circulars
No. 941 January 20,
2017 January 1, 2018 Amendments to the Regulations on Past Due and
Non-Performing Loans
No. 989 January 4, 2018 January 27,
20181
Guidelines on the Conduct of Stress Testing
Exercises
No. 990 January 22,
2018
February 9, 20181 Amendments to the Basel III Leverage Ratio
Framework
No. 997 No.
1004
February 15,
2018
May 24, 2018 March 2, 2018
June 1, 2018
Reduction in Reserve Requirements:
• 100 basis points to 19%
• 100 basis points to 18%
No. 1007 June 6, 2018 January 1, 2019
Implementing Guidelines on the adoption of the
Basel III Framework on Liquidity Standards - Net
Stable Funding Ratio (“NSFR”)
No. 1011 August 14, 2018 September 7,
20191
Guidelines on the Adoption of the Philippine
Financial Reporting Standard (“PFRS”) 9 – Financial
Instruments
No. 1024 December 6,
2018 January 4,20191 Philippine Adoption of the Basel III Countercyclical
Capital Buffer
No. 1027 December 28,
2018
February 2, 20191 Amendments to the Guidelines on the Computation
of Required Capital
No. 1034
No. 1035 March 15, 2019 April 6, 20191
Amendments to the BASEL III:
• Framework on Liquidity Standards – NSFR
• Liquidity Coverage Ratio Framework and
Minimum Liquidity Ratio Framework
No. 1041
No. 1056
No. 1063
May 29, 2019
October 22,
2019
December 3,
2019
May 31, 2019
June 28, 2019
July 26, 2019 November 1, 2019
December 6,
2019
Reduction in Reserve Requirements:
• 100 basis points to 17%
• 50 basis points to 16.5%
• 50 basis points to 16%
• 100 basis points to 15%
• 100 basis points to 14%
No. 1044 August 6, 2019 August 27, 20191
Guidelines on the Management of Interest Rate
Risk in the Banking Book and Amendment of the
Guidelines on Market Risk Management
No. 1051 September 27,
2019
October 17,
20191
Amendments to the Framework for Dealing with
Domestic Systemically Important Banks (D-SIBs)
No. 1054 October 11,
2019
November 1,
2019
Reduction in the Reserve Requirement of Bonds to
3%
No. 1055 October 17,
2019
November 5,
20191
Adoption of a National Quick Response (QR) Code
Standard
No. 1059 November 15,
2019 January 1, 2021
Moratorium on the lssuance of Long-Term
Negotiable Certificates of Time Deposit (“LTNCDs”)
No. 1061 November 25,
2019
December 17,
20191
Amendment to the Definition of a Deposit
Substitute

S E C F O R M 1 7 - A 116
No. 1062 November 26,
2019
December 17,
20191
Amendment of the Requirements on the lssuance of
LTNCTDs, Bonds and Commercial Papers
No. 1067 December 13,
2019 January 4, 20201 Amendments to the Disclosure Requirement on
Interest Rate Risk in the Banking Book
Monetary Policy
Decisions
May 9, 2019
August 8, 2019
September 26,
2019
May 10, 2019
August 8, 2019
September 27,
2019
Key Policy Rate Cuts:
• 25 basis points to 4.50%
• 25 basis points to 4.25%
• 25 basis points to 4.00%
SEC
MC No.12-2018 August 31, 2018
September 15,
2018
Guidelines on the issuance of Green Bonds under
the ASEAN Green Bonds standards in the
Philippines
MC No. 4-2019 February 15,
2019 March 2, 2019
Sustainability Reporting Guidelines for PubliclyListed
Companies
MC No. 10-2019 April 25, 2019 April 27, 2019 Rules on Material Related Party Transactions for
Publicly-Listed Companies
MC No. 24-2019 December 19,
2019 January 12, 2020
Code of Corporate Governance for Public
Companies and Registered Issuers
Tax
Republic Act2
No. 10963
December 19,
2017 January 1, 2018
Tax Reform for Acceleration and Inclusion
(“TRAIN”).
This is the first package of the Comprehensive Tax
Reform Program (“CTRP”), which amends various
provisions of the 1997 National Internal Revenue
Code.
1 The Circular took effect 15 calendar days following its publication in the Official Gazette or in a newspaper of general circulation 2 Subsequently, BPI also complied with all pertinent BIR revenue regulations implementing it.
Research and Development Activities BPI spent the following for the last three years on Personnel Training and on Systems/Application Software:
In Million Pesos % of Revenues
2017 595.3 0.8
2018 802.1 1.0
2019 1,018.9 1.1
Employees Below is a breakdown of the manpower complement of BPI in 2018 and 2019:
December 31, 2018 Actual December 31, 2019 Actual
Officers Staff Total Officers Staff Total
Unibank 6,541 11,749 18,290 7,225 13,588 20,813
Consumer 4,176 10,228 14,404 4,517 12,026 16,543
Corporate 840 792 1,632 929 849 1,778
Investment 418 248 666 409 225 634
Support 1,107 481 1,588 1,370 488 1,858
Insurance Companies 120 501 621 127 489 616
TOTAL 6,661 12,250 18,911 7,352 14,077 21,429

S E C F O R M 1 7 - A 117
Majority or 83% of the staff are members of various unions and are subject to Collective Bargaining Agreements (“CBAs”). The current CBA of the parent company was concluded and signed last May 29, 2019, which covers the period of April 1, 2019 to March 31, 2021. CBA for BFSB was concluded and signed last December 13, 2018. The BFSB CBA covers the period November 1, 2018 to October 31, 2020. Enterprise Risk Management The Bank has an established enterprise risk management (“ERM”) and capital management framework that allows the Bank to identify, measure, control, and monitor its significant financial and non-financial risk exposures, ensure adequate liquidity, and set aside sufficient amounts of capital to cover and mitigate such risks. The framework reflects the Bank’s internal standards as guided by the regulatory guidelines and directives issued by the BSP in promoting effective risk management governance, in implementing robust business continuity and resiliency standards that are regularly tested, and in performing the internal capital adequacy assessment and other risk management processes. The Bank’s ERM is anchored on the pillars of: ▪ Sound risk management governance; ▪ Value-enhancing risk methods and processes; and ▪ Risk-intelligent data and technology. The Bank’s Board of Directors fulfills its risk management function through the Risk Management Committee (“RMC”), which directs risk strategy, defines risk appetite statements, and reviews risk management structures, metrics, limits, and issues across the BPI Group. The Chief Risk Officer (“CRO”) of the BPI Group reports directly to the RMC and is responsible in leading the formulation of risk management policies, methodologies, and metrics consistent with the overall business strategies of the Bank, ensuring that risks are prudently and rationally undertaken, within the Bank’s risk appetite, and commensurate to maximize returns on capital. The CRO is supported by the Risk Management Office (“RMO”) and they actively engage the RMC, Management and business units to effectively communicate through various internal channels the Bank’s risk culture, risk awareness campaigns and learning programs, and risk management best practices. The Bank’s risk exposures are identified, measured, controlled, and monitored according to three (3) major risk classifications: Credit Risk, the single largest risk for most local banks, arises from the Bank’s core lending and investing businesses, and involves thorough credit evaluation, appropriate approval, management and continuous monitoring of risk exposures such as borrower (or counterparty) risk, facility risk, concentrations and industry risks relating to each loan account. In BPI, the entire credit risk management process is governed by stringent underwriting policies and rating parameters, and lending procedures and standards which are regularly reviewed and updated given regulatory requirements and market developments. The Bank’s loan portfolio is continuously monitored and reviewed as to overall asset quality, concentration, and utilization of limits. The Bank continuously experiences growth in loan volumes, but is able to manage overall low credit risk and maintain asset quality (as evidenced by generally low NPLs and adequate reserves cover), and does so in general compliance with regulatory and prudential requirements relating to credit risk management (e.g., RPT and DOSRI restrictions, single borrower’s limits, credit concentration, and internal and regulatory stress tests, amongst others). Market and Liquidity Risks arise from the Bank’s business in managing interest rate and liquidity gaps, as well as in the trading and distribution of fixed income, foreign exchange, and derivative instruments (as allowed by regulation). Market and liquidity risks are managed using a set of established policies and metrics guided by the Bank's market, interest rate risk in the banking book (“IRRBB”), and liquidity risk management framework set by the Board-level RMC. Market risk is the risk that the Bank's earnings or capital will decline immediately (or over time) because of volatility in interest rates, foreign exchange rates, or equity prices. The Bank employs various risk metrics such as value-at-risk (“VaR”) and stop loss limits for price risk and balance sheet value-at-risk (“BS VaR”), and earnings at-risk (“EaR”) for interest rate risk, supplemented by quarterly stress tests. Liquidity exposures mainly come from the mismatches of asset, liability, and foreign exchange contract maturities. The Bank manages liquidity risk by employing a minimum cumulative liquidity gap (“MCLG” – smallest net cumulative cash inflow or the largest net cumulative cash outflow) and complying with the liquidity coverage ratio (“LCR”) and net stable funding ratio (“NSFR”) BSPprescribed minimum limit. The Bank also conducts liquidity stress tests which have consistently revealed ample liquidity to meet its financial obligations under both bank-specific and systemic or market-wide crisis scenarios and

S E C F O R M 1 7 - A 118
periodically testing an established liquidity contingency funding plan (“LCFP”). The Bank’s market, IRRBB, and liquidity risk exposures are generally well within the RMC-approved risk limits at the BPI Parent and Consolidated levels. Operational and IT Risks arise from the Bank’s people and processes, its information technology, threats to the security of its facilities, personnel, or data, models, business interruption risk, reputational risk, and compliance obligations to regulatory or taxing authorities, amongst others. Operational and IT risk management in the Bank involves the formulation of policies, setting and monitoring of key risk indicators, overseeing the thoroughness of bank-wide risk and control selfassessments and loss incident management; and in the process, creating and maintaining a sound business operating environment that ensures and protects the integrity of the Bank’s assets, transactions, reputation, records and data of the Bank and its customers, the enforceability of the Bank’s claims, and compliance with all pertinent legal and regulatory parameters. The Bank’s actual operational losses are generally less than 1% of the Bank’s annual gross income, which is well within the Bank’s appetite for operational and IT risks. Risk management is carried out by a dedicated team of skilled risk managers and senior officers who have extensive prior operational experience working within the Bank. The Bank’s risk managers regularly monitor key risk indicators and report exposures against carefully-established credit, market, liquidity and operational and IT risk metrics and limits approved by the RMC. Independent reviews are regularly conducted by the Bank’s Internal Audit group, external auditors, and regulatory examiners to ensure that risk controls and mitigants are in place and functioning effectively as intended. Compliance Business or compliance risk, which can be defined as “the risk of regulatory or legal sanctions, material financial loss, or loss to reputation a bank may suffer as a result of its failure to comply with laws, regulations, rules, related self-regulatory organization standards, and codes of conduct applicable to its banking activities”, is addressed and managed within the Bank through its compliance function and its component system and program. As the Bank’s second line of defense, the compliance function has also evolved in recent years to adapt to the shift towards more technology-heavy strategies, as it seeks to deliver the compliance risk management outcomes required in an era of digital transformation. While remaining a key advisory function, it has embraced a more forward-thinking, risk-based and stress-tested approach to continuously monitor, evaluate and improve its ability to ensure compliance in a banking landscape that is subject to disruption and rapid change. The Bank’s compliance system is critically important in identifying, evaluating, and addressing the regulatory and reputational risks while the enterprise-wide compliance program helps the Bank to look at and across business lines and activities of the organization as a whole and to consider how activities in one area of the Bank may affect the business or compliance risks of other business lines and the entire group/enterprise. The compliance program also helps the Board and management in understanding where such regulatory and reputational risks in the organization are concentrated, provide comparisons of the level and changing nature of risks, and identify those control processes that most need enhancement. Oversight of the management of the Bank’s business risk and implementation of its compliance function is the responsibility of our Board of Directors, through the Audit Committee and the Corporate Governance Committee with respect to corporate governance compliance. At the management level, the compliance function is carried out by the Compliance Office, headed by the Chief Compliance Officer, who is not a member of the Board of Directors. The Compliance Office oversees the implementation of the Bank's enterprise-wide compliance programs. These programs take into account the size and complexity of the Bank, the relevant rules and regulations that affect its operations, and the business risks that may arise due to non-compliance. By using regulatory and self-assessment compliance matrices, compliance measures are formulated to mitigate identified business risks and tested to ensure effectiveness. The Compliance Office is currently organized to cover Regulatory Compliance, Corporate Governance, Anti-Money Laundering Compliance and FATCA Compliance and the Data Privacy Office. Considering the rapid developments in the regulatory sphere as well as the growing complexity of bank products, services and transactions, the Compliance Office evolves in its coverage of compliance practice areas to anticipate and meet forward challenges. Enhancement of our compliance function’s scope and domain is redefined for new and emerging sources of compliance risk. The Compliance Office is also empowered by the accountability to it of 22 Group Compliance Officers, or GCOs, who are embedded

S E C F O R M 1 7 - A 119
in operational units throughout the Bank. The GCOs are charged with enforcing compliance office initiatives, as well as providing timely reports to the compliance office. Overall enforcement is through self-regulation within the business units, and independent testing and reviews conducted by the Compliance Office and Internal Audit. Results of these reviews are elevated to the Board’s Audit Committee and Corporate Governance Committee, with respect to governance issues. The Compliance Office promotes adherence and awareness to laws, rules and regulations by electronically posting information and documents in a compliance database that is accessible to all employees. Regular meetings are conducted by the Compliance Office with the GCOs to discuss the impact of new regulations, decide on the required compliance measures and amend compliance matrices as necessary. Through continued liaison and dialogue with regulators, the Compliance Office ensures the prompt dissemination of new regulations and other developments affecting bank operations. Financial Consumer Protection In 2017, the Bank, through its Customer Experience Management Office (“CXMO”) initiated the BPI Customer Assistance Program to establish guidelines that will help ensure that all feedback from customers and potential customers are well handled in alignment with the Bank’s consumer protection policies. The designated Customer Assistance Officers underwent onsite training to equip them in their function in addressing customer issues and to ensure compliance with the Bank’s Consumer Protection Program. The need to conduct a continuous information and education campaign on the Financial Consumer Protection Program (“FCP”) has been a major priority of the unit. To deepen customer engagement and address specific customer needs, CXMO monitored customer complaints in each business area and identified the root causes and action plans which is part of the regular management reporting. CXMO intensified the conduct of FCP roll-outs in the branches, which also includes customer complaints handling where scenarios are based on actual customer complaints received. The Customer Feedback Database, which was created in 2017, underwent continuous improvements to facilitate immediate routing of customer feedback to the concerned business units. This further strengthened the role of the frontliners in addressing and reporting customer issues. For 2019, the Bank tracked and monitored customer issues and feedback concerning its products and services (the table below shows the number of customer complaints the Bank received for the past three years, and the number of customer transactions recorded for the same year). Action plans were implemented to ensure that the most pressing and important issues raised by customers were resolved within the committed turnaround times.
2017 2018 2019
Complaints (in Thousands) 437.5 424.4 415.9
Transactions (in Millions) 1,442.1 1,540.8 2,383.7
In 2019, there were no confirmed incidents of non-compliance where BPI was officially cited by a regulator or government agency. Data Privacy Republic Act No. 10173, known as the Data Privacy Act of 2012, requires government and private sector entities to apply the principles of Transparency, Legitimate Purpose and Proportionality in their processing of personal data so that the data is (1) only used in relevant and specifically stated ways, (2) not stored for longer than necessary, (3) kept safe and secure, (4) used only within the confines of the law, and (5) stored following people’s data protection rights. Cybersecurity and data privacy and protection have become corporate governance and risk management concerns. BPI has established a comprehensive Data Privacy Program utilizing a combination of policies, organizational structure, access controls and technologies designed for risk reduction. The Bank has a Data Privacy Office, headed by a Board-appointed Data Privacy Officer (“DPO”), a senior management officer. The key focus of the DPO is to oversee data privacy compliance and manage data protection risks for the organization consistent with the Data Privacy Act rules and regulations, issuances by the National Privacy Commission and other applicable laws. Management has also appointed Compliance Officers for Privacy (“COP”) for major business units of the Bank to augment the Data Privacy Office

S E C F O R M 1 7 - A 120
and ensure the sustained implementation of the Data Privacy Management Program across business lines. Future Prospects Economic Growth The Philippine economy expanded by 5.9% in 2019, below the 6-7% target of the government. Despite the strength of household consumption, delays in the implementation of infrastructure projects and the decline in investment spending dragged growth below the 6% level. For 2020, the coronavirus outbreak has become the greatest challenge for the global and domestic economies. Quantifying the potential impact of the coronavirus on the Philippine economy is difficult as the phenomenon has been unique. However, it is clear that it will have a severe negative impact on the economy. Household Consumption Household consumption recovered in 2019 as inflation slowed down. Stable oil prices and sufficient rice supply pulled down average inflation from 5.2% in 2018 to 2.5% in 2019. Household consumption will likely continue to be the main driver of growth in the medium term with support from OFW remittances and record-low unemployment. However, the enhanced community quarantine in various parts of the economy has crippled household consumption to an extent not seen since the early 1980s. Investment Spending Capital formation contracted in 2019 for the first time in 7 years as demand for machinery and equipment declined. Corporates may have postponed or scaled down the purchase of durable equipment given the elevated global growth uncertainties and expectations of lower interest rates in the coming months. Meanwhile, public construction posted a 2.4% contraction as a result of government underspending. The budget impasse and election spending ban in the first half of the year prevented the government from spending on new infrastructure projects. Looking ahead, capital expenditures may fall as business will most likely prioritize their liquidity to sustain themselves and their employees amid the measures to prevent the spread of Covid-19. Growth of Major Sectors Among the 3 major sectors of the economy, services outperformed in 2019 with 7.1% growth. Retail trade grew at a faster pace with the help of lower inflation, while financial intermediation recorded higher growth given wider interest margins and trading gains resulting from the bond market rally. The industry sector slowed down amid the weakness in manufacturing and construction. Global trade uncertainties weighed down manufacturing growth despite the stability shown by household consumption. In 2020, the coronavirus outbreak may hurt several industries given the restrictions on movement and economic activity. In particular, the following industries may see a decline in economic output and revenues: tourism, airline, real estate, transport, manufacturing Financial Markets Low inflation in 2019 gave the BSP the opportunity to revert its policy stance from tightening to monetary easing. Given the liquidity and growth challenges being faced by the economy, the Monetary Board reduced the policy rate by 75 bps from 4.75% to 4.00% and brought down the reserve requirement ratio (RRR) by 400 bps from 18% to 14% in 2019. Benchmark interest rates declined as liquidity improved gradually. The BSP has reduced the policy rate by another 75 bps so far and may resume its monetary easing in 2020 given the economic damage that the coronavirus could bring. The enhanced community quarantine may squeeze liquidity amid the lack of spending and the need for savings in this time of crisis. As a result, the central bank may inject liquidity into the financial system through its monetary policy tools such as open market operations and further reduction in the reserve requirement on deposits. Meanwhile, global risk aversion due to the coronavirus may fuel the demand for safe haven like the Dollar. Emerging market currencies like the Peso may weaken as investors shift their funds to assets that could protect them from the impact of the coronavirus. However, the possible decline in imports and remittances due to supply disruptions may temper the depreciation pressure from risk aversion. Implications on Business and Strategy Against this backdrop, BPI and the entire banking industry play a major role in the economic recovery of the country. BPI remains focused on prudently accelerating growth in the higher-margin SME and consumer lending businesses, which will be hardest hit by the coronavirus outbreak. The Bank has already announced a 90-day deferral in loan payments to doctors, nurses and other medical workers as well as policemen and soldiers to provide financial relief during the COVID-19 lockdown. BSP has

S E C F O R M 1 7 - A 121
also offered relief measures, notably, to Banks such as staggered recognition of provisioning, and a 30-day grace period for loan payments. BPI also maintains strength in the corporate segment, which comprises 75% of its loan portfolio. We strive to be the main operating bank for our clients, especially those bounce-back industries and companies, while evaluating what assistance can be provided to clients in affected sectors such as tourism, hospitality, transport, and retail trade and manufacturing. The current environment also requires that we continue to place emphasis on managing risks by enhancing our credit process in the aspects of underwriting, monitoring, and collections, in consideration of the corona virus impact. Liquidity is also a top priority for BPI, just having raised P34 billion in a 1.5-year bond issuance that was completed before the Luzon lockdown in March 2020. The Bank proceeds with an invigorated focus on CASA deposit growth in the near-term. Reinforcing the Bank’s operational resilience during this health crisis, BPI has put in motion business continuity plans and a pandemic response plan and protocol for the entire organization. The objective of our pandemic response plan is three-fold: (1) ensure continuous delivery of products and services to our customers and the banking public, (2) ensure the health and well-being of our employees, and (3) cooperate with authorities in their efforts to contain transmission. BPI has select branches and critical units open, some with modified physical layouts and protective screens to observe social distancing, while the rest of the skeletal work force operate in home/remote site arrangements. The Bank recognizes the importance of building strong digital capabilities, which was tested during the enhanced community quarantine, via our digital distribution platforms to increase client access points, how we could enhance overall customer experience, as well as in the back office infrastructure to increase efficiency and reduce costs. Significant investments have been made around the five pillars of our digital ecosystem: (1) omni-channel experience, (2) customer experience, (3) high tech, high touch channels, (4) open banking, and (5) cybersecurity and privacy. At this point in time, we seek to accelerate the shift to digital, enabling us to deliver a convenient and frictionless banking experience for our clients. We are also maximizing our use of technology to enable work continuity without physical proximity. The success of all of these efforts will contribute to a more sustainable business and, under favorable market conditions, recovery and growth of our share price.
For further details on the BPI’s financial condition and operations, please refer to its 2019 Consolidated Financial Statements which is incorporated herein as part of Index to Financial Statements and Supplementary Schedules. Also, for further information on BPI, please refer to its SEC17A which is available in its website www.bpiexpressonline.com

S E C F O R M 1 7 - A 122
GLOBE TELECOM, INC. Globe Telecom, Inc.’s highlights of Consolidated Statements of Financial Position and Statements of Income are shown in the Note 10 of the Group’s 2019 Consolidated Financial Statements as well as in the Globe’s 2019 Consolidated Financial Statements which form part of Index to Financial Statements and Supplementary Schedules of this SEC 17A report. Background and Business The Ayala Group conducts its telecommunications business through Globe Telecom, Inc (alternately referred to as Globe, Globe Telecom, Globe Group or “the Company” in the entire discussion of Globe Telecom, Inc.). Globe’s origin can be traced back to Robert Dollar Company, a California company which provided wireless long-distance message services. After subsequent mergers and re-namings, the company was named Globe Telecom, Inc. in 1983, when the partnership between Ayala and Singapore Telecom, the principal shareholders of Globe, was formalized. Since then, Globe has been recognized as the first company to offer SMS services in the Philippines and as the first Philippine internet service provider in the Philippines. Globe Telecom, Inc. is a major provider of telecommunications services in the Philippines, supported by over 8,000 employees and over 1.2 million AutoloadMax (AMAX) retailers, distributors, suppliers, and business partners nationwide. The Company operates one of the largest and most technologically-advanced mobile, fixed line and broadband networks in the country, providing reliable, superior communications services to individual customers, small and medium-sized businesses, and corporate and enterprise clients. Globe currently has 94.2 million mobile subscribers (including fully mobile subscribers), over 2.0 million Home Broadband customers, and 1.4 million landline subscribers. Globe is one of the largest and most profitable companies in the country, and has been consistently recognized both locally and internationally for its corporate governance practices. It is listed on the Philippine Stock Exchange under the ticker symbol GLO and had a market capitalization of US$5.3 billion as of the end of December 2019. The Company’s principal shareholders are Ayala Corporation and Singapore Telecom, both industry leaders in their respective countries. Aside from providing financial support, this partnership has created various synergies and has enabled the sharing of best practices in the areas of purchasing, technical operations, and marketing, among others. Sustainability at Globe is anchored on The Globe Purpose, “In everything we do, we treat people right to do a Globe of Good. As a purpose-led organization, the Company aims to contribute to the UN Sustainable Development Goals by promoting innovation and technology for greater social impact. Together with business growth, Globe actively participate in nation-building through an engaged and empowered workforce that strives to achieve inclusive and sustainable development for all. In 2019, Globe became a signatory to the United Nations Global Compact, committed to implement universal sustainability principles. Globe Bridging Communities (GlobeBridgeCom) is the corporate social responsibility arm of the company, which leads various programs that promote quality education, environmental conservation, social innovation, active citizenship through volunteerism and responsible use of information and communications technology to enrich the lives of our key stakeholders. The Globe Group is composed of the following companies:
• Globe Telecom, Inc. (Globe) provides digital wireless communications services in the Philippines under the Globe Postpaid, Globe Prepaid, and Touch Mobile (TM) brands, using a fully digital network. It also offers domestic and international long-distance communication services or carrier services;
• Innove Communications Inc. (Innove), a wholly-owned subsidiary, holds a license to provide digital wireless communication services in the Philippines. Innove also has a license to establish, install, operate and maintain a nationwide local exchange carrier (LEC) service, particularly integrated local telephone service with public payphone facilities and public calling stations, and to render and provide international and domestic carrier and leased line services. On December 14, 2018, the President of the Philippines signed House Bill No. 5556 into RA No. 11151 entitled “Act Renewing For Another Twenty Five (25) Years the Franchise Granted to Isla Communications Company, Inc. Presently Known as Innove Communications, Inc., Amending for

S E C F O R M 1 7 - A 123
the Purpose Republic Act No. 7372 entitled “An Act Granting the Isla Communications Co. a Franchise to Install, Operate and Maintain Telecommunications Services Within the Territory of the Republic of the Philippines and International Points and for Other Purposes. On November 2, 2015, Innove and Techzone Philippines incorporated TechGlobal Data Center, Inc. (TechGlobal), a joint venture company formed for the purpose of operating and managing all kinds of data centers, and providing information technology-enabled, knowledge-based and computer-enabled support services. Innove and Techzone hold ownership interest of 49% and 51%, respectively. TechGlobal started commercial operations in August 2017;
• GTI Business Holdings, Inc. (GTI) is a wholly-owned subsidiary with authority to provide VOIP services. GTI was incorporated and registered under the laws of the Philippines, on November 25, 2008, as a holding company. GTI Corporation (GTIC) In July 2009, GTI incorporated a wholly owned subsidiary, GTI Corporation (GTIC), a company organized under the General Corporation Law of the United States of America, State of Delaware as a wireless and data communication services provider. Globe Telecom HK Limited (GTHK) In December 2011, GTI incorporated a wholly owned subsidiary, Globe Telecom HK Limited (GTHK), a limited company organized under the Companies Ordinance of Hong Kong as a marketing and distribution company. On March 17, 2015, GTHK applied for a services-based operator license (SBO) with the Office of the Communications Authority in Hong Kong (OFCA) which was subsequently approved on May 7, 2015. GTHK is engaged in the marketing and selling of telecommunication products and services in the international market, except the United States of America and the Philippines, under a distributor arrangement. Globetel European Limited (GTEU) and Subsidiaries On May 10, 2013, GTI incorporated a wholly owned subsidiary, Globetel European Limited (GTEU) as holding company for the operating companies of the Globe Group located in the United Kingdom, Spain and Italy. In 2013, GTEU incorporated its wholly owned subsidiaries, UK Globetel Limited (UKGT), Globe Mobilé Italy S.r.l. (GMI), and Globetel Internacional European España, S.L. (GIEE), for the purpose of establishing operations in Europe by marketing and selling Mobile telecommunications services to Filipino individuals and businesses located in the United Kingdom, Spain and Italy. On June 2, 2016, the BOD approved the cessation of the operations of UKGT, GMI and GIEE effective July 31, 2016. UKGT and GMI completed the liquidation process in 2018. On July 30, 2019, GIEE completed its regulatory requirements for liquidation. Globetel Singapore Pte. Ltd. (GTSG) On November 12, 2014, GTI incorporated GTSG, a wholly owned subsidiary, for the purpose of offering full range of international data services in Singapore under a facilities-based operations license (FBO) with Infocomm Media and Development Authority (IMDA) in Singapore which was granted on January 7, 2015;
• Kickstart Ventures, Inc. (Kickstart), a wholly-owned subsidiary and is the Philippines' most active Corporate Venture Capital firm investing in Seed to Series D digital startups. On March 28, 2012, Globe Telecom incorporated Kickstart, a stock corporation organized under the laws of the Philippines and formed for the purpose of investing in individual, corporate, or start-up businesses, and to do research, technology development and commercializing of new business ventures. In February 2014, Kickstart acquired 40% equity interest in Flipside Publishing Services, Inc. (FPSI). Since Kickstart was able to demonstrate control over FPSI despite of less than 50% ownership interest, FPSI was assessed to be a subsidiary of Kickstart and is included in the consolidation of Globe Group. FPSI is engaged primarily to acquire publishing rights, produce, publish, market, and sell printed and electronic books (ebooks) and other electronic documents and content for international and domestic sales. FPSI ceased operations in July 2016. FPSI remains a dormant company as of reporting date;
• Asticom Technology, Inc., a wholly-owned subsidiary, is primarily engaged in providing business process and shared service support, as well as IT system integration and consultancy services. Asticom was consolidated beginning June 2014;

S E C F O R M 1 7 - A 124
• Globe Capital Venture Holdings, lnc. (GCVHI), a wholly-owned subsidiary incorporated on June 29, 2015. On June 29, 2015, Globe Telecom incorporated its wholly owned subsidiary, GCVHI as an investing and holding company primarily engaged in purchasing, subscribing, owning, holding, assigning real and personal property, shares of stock and other securities. In August 2019, GCVHI was rebranded to “917 Ventures” and will house Globe Telecom’s non-telco incubated products. On October 13, 2015, GCVHI incorporated its wholly owned subsidiary Adspark Holdings, Inc. (AHI), a holding company established for the acquisition of additional investment in Globe Telecom’s non-core business. AHI holds 100% of Adspark Inc. (AI), an advertising company. On January 29, 2016, AI acquired 70% of the outstanding shares of Socialytics Inc., a social media marketing firm. GCVHI holds 46.30% ownership interest in Globe Fintech Innovations, Inc. (GFI) and 50% ownership interest in Global Telehealth, Inc. (GTHI).;
• Bayan Telecommunications, Inc. (Bayan), is a provider of data and communications services such as dedicated domestic and international leased lines, frame relay services, Internet access, and other managed data services like Digital Subscriber Lines (DSL). Globe Telecom owns approximately 99% of BTI. . On July 2, 2015, BTI issued additional shares to Globe Telecom following the approval of National Telecommunications Commission (NTC) on the conversion of BTI’s Tranche A convertible debt to equity. The conversion increased the ownership of Globe Telecom on BTI’s outstanding shares from 38% to 54% controlling interest. On July 20, 2015, Globe Telecom acquired additional voting shares of BTI, which further increased its controlling interest to 99%. BTI is a facilities-based provider of data services and fixed-line telecommunications. BTI’s subsidiaries are: Radio Communications of the Philippines, Inc. (RCPI), Telecoms Infrastructure Corp. of the Philippines (Telicphil), Sky Internet, Incorporated (Sky Internet), GlobeTel Japan (formerly BTI Global Communications Japan, Inc.), and NDTN Land, Inc. (NLI), (herein collectively referred to as “BTI Group”). On May 30, 2017, the Management Committee, with representation of at least sixty-seven percent of the total voting interest, approved the termination of the Agreement on the Construction, Operation and Maintenance of the National Digital Transmission Network dated November 28, 1996, as well as the dissolution of Telicphil and NLI. On December 11, 2019, the House of Representatives received House Bill No. 5797, an act to renew and amend the franchise granted to BTI. The proposed law seeks to extend BTI’s legislative franchise for another 25 years. The House Committee on Legislative franchises is yet to schedule the bill for public hearing as of February 3, 2019;
• TaoDharma (Tao), 67% owned by Globe Telecom, was established to operate and maintain retail stores in strategic locations within the Philippines that will sell telecommunications or internet-related services, devices, gadgets, and accessories.
• GTowers Inc. (GTowers), a fully owned subsidiary of Globe Telecom incorporated on August 17, 2018. GTowers is still under pre-operating stage.
• Yondu, Inc, is engaged in the development and creation of wireless products and services accessible through mobile devices or other forms of communication devices. It also provides internet and mobile value-added services, information technology and technical services including software development and related services. Yondu is registered with the Department of Transportation and Communication (DOTC) as a content provider. As of December 31, 2018, Yondu was 51% owned by Xurpas Inc. (Xurpas) and 49% owned by Globe Telecom. On September 11, 2019, the BOD of Globe Telecom approved the acquisition of 51% of the outstanding shares of Yondu, equivalent to 22,950 shares. The acquisition increased Globe Telecom’s ownership interest from 49% to 100% and was accounted for as an acquisition of a subsidiary.

S E C F O R M 1 7 - A 125
Yondu holds 100% of Rocket Search, Inc. (formerly Yondu Software Labs, Inc.), a company primarily engaged in providing information technology (IT) products and services and engaged in IT placement services.
• EC Pay, is primarily engaged in the business of providing IT and e-commerce solutions, including, but not limited to, prepaid phone and internet products, bills payments and others. On October 25, 2019, Globe Telecom signed and executed an agreement with third parties to complete its transaction to acquire 77% ownership of ECPay.
The Company is a grantee of various authorizations and licenses from the National Telecommunications Commission (NTC) as follows: (1) license to offer and operate facsimile, other traditional voice and data services and domestic line service using Very Small Aperture Terminal (VSAT) technology; (2) license for inter-exchange services; and (3) Certificate of Public Convenience and Necessity (CPCN) for: (a) international digital gateway facility (IGF) in Metro Manila, (b) nationwide digital cellular mobile telephone system under the GSM standard (CMTS-GSM), (c) nationwide local exchange carrier (LEC) services after being granted a provisional authority in June 2005, and (d) international cable landing stations located in Nasugbu, Batangas, Ballesteros, Cagayan and Brgy. Talomo, Davao City.
A. Business Development and Corporate History In 1928, Congress passed Act No. 3495 granting the Robert Dollar Company, a corporation organized and existing under the laws of the State of California, a franchise to operate wireless long distance message services in the Philippines. Subsequently, Congress passed Act No. 4150 in 1934 to transfer the franchise and privileges of the Robert Dollar Company to Globe Wireless Limited which was incorporated in the Philippines on 15 January 1935. Globe Wireless Limited was later renamed as Globe-Mackay Cable and Radio Corporation (“Globe-Mackay”). Through Republic Act (“RA”) 4630 enacted in 1965 by Congress, its franchise was further expanded to allow it to operate international communications systems. Globe-Mackay was granted a new franchise in 1980 by Batasan Pambansa under Batas Pambansa 95. In 1974, Globe-Mackay sold 60% of its stock to Ayala Corporation, local investors and its employees. It offered its shares to the public on 11 August 1975. In 1992, Globe-Mackay merged with Clavecilla Radio Corporation, a domestic telecommunications pioneer, to form GMCR, Inc. (“GMCR”). The merger gave GMCR the capability to provide all forms of telecommunications to address the international and domestic requirements of its customers. GMCR was subsequently renamed Globe Telecom, Inc. (“Globe”). In 1993, Globe welcomed a new foreign partner, Singapore Telecom, Inc. (STI), a wholly-owned subsidiary of Singapore Telecommunications Limited (“SingTel”), after Ayala and STI signed a Memorandum of Understanding. In 2001, Globe acquired Isla Communications Company, Inc. (“Islacom”) which became its wholly-owned subsidiary effective 27 June 2001. In 2003, the National Telecommunications Commission (“NTC”) granted Globe’s application to transfer its fixed line business assets and subscribers to Islacom, pursuant to its strategy to integrate all of its fixed line services under Islacom. Subsequently, Islacom was renamed as Innove Communications, Inc. (“Innove”). In 2004, Globe invested in G-Xchange, Inc. (“GXI”), a wholly-owned subsidiary, to handle the mobile payment and remittance service marketed under the GCash brand using Globe’s network as transport channel. GXI started commercial operations on 16 October 2004. In November 2004, Globe and seven other leading Asia Pacific mobile operators (‘JV partners’) signed an agreement (‘JV agreement’) to form Bridge Alliance. The joint venture company operates through a Singapore-incorporated company, Bridge Mobile Pte. Limited (BMPL) which serves as a commercial vehicle for the JV partners to build and establish a regional mobile infrastructure and common service platform to deliver different regional mobile services to their subscribers. The Bridge Alliance currently has a combined customer base of over 250 million subscribers among its partners in India, Thailand, Hong Kong, South Korea, Macau, Philippines, Malaysia, Singapore, Australia, Taiwan and Indonesia. In 2005, Innove was awarded by the NTC with a nationwide franchise for its fixed line business, allowing it to operate a Local Exchange Carrier service nationwide and expand its network coverage. In

S E C F O R M 1 7 - A 126
December 2005, the NTC approved Globe’s application for third generation (3G) radio frequency spectra to support the upgrade of its cellular mobile telephone system (“CMTS”) network to be able to provide 3G services. The Company was assigned with 10-Megahertz (MHz) of the 3G radio frequency spectrum. On May 19, 2008, following the approval of the NTC, the subscriber contracts of Touch Mobile or TM prepaid service were transferred from Innove to Globe which now operates all wireless prepaid services using its integrated cellular networks. In August 2008, and to further grow its mobile data segment, Globe acquired 100% ownership of Entertainment Gateway Group (“EGG”), a leading mobile content provider in the Philippines. EGG offers a wide array of value-added services covering music, news and information, games, chat and web-to-mobile messaging. On 25 November 2008, Globe formed GTI Business Holdings, Inc. (GTIBH) primarily to act as an investment company. On October 30, 2008, Globe, the Bank of the Philippine Islands (BPI) and Ayala Corporation (AC) signed a memorandum of agreement to form a joint venture that would allow rural and low-income customers’ access to financial products and services. Last October 2009, the Bangko Sentral ng Pilipinas (BSP) approved the sale and transfer by BPI of its shares of stock in Pilipinas Savings Bank, Inc. (PSBI), formalizing the creation of the venture. Globe’s and BPI’s ownership stakes in PSBI is at 40% each, while AC’s shareholding is at 20%. The partners plan to transform PSBI (now called BPI Globe BanKO, Inc.) into the country’s first mobile microfinance bank. The bank’s initial focus will be on wholesale lending to other microfinance institutions but will eventually expand to include retail lending, deposit-taking, and micro-insurance. BPI Globe BanKO opened its first branch in Metro Manila in the first quarter of 2011 and now has 6 branches nationwide, over 2,000 partner outlets, 261,000 customers and over ₱2.4 billion in its wholesale loan portfolio. On March 2012, Globe launched Kickstart Ventures, Inc. (Kickstart) to help, support and develop the dynamic and growing community of technopreneurs in the Philippines. Kickstart is a business incubator that is focused on providing aspiring technopreneurs with the efficient environment and the necessary mechanisms to start their own business. Since its launch, Kickstart has 10 companies in its portfolio covering the digital media and technology, and web/mobile platform space. In October 2013, following the court's approval of the Amended Rehabilitation Plan (jointly filed by Globe and Bayantel in May 2013), Globe acquired a 38% interest in Bayantel by converting Bayantel's unsustainable debt into common shares. This follows Globe's successful tender offer for close to 97% of Bayantel's outstanding indebtedness as of December 2012. As part of the amended rehab plan and pending regulatory approvals, Globe would further convert a portion of its sustainable debt into common shares of Bayantel, bringing up its stake to around 56%. On October 2014, Globe Telecom received a copy of the temporary restraining order (TRO) issued by the Court of Appeals (CA) stopping the National Telecommunications Commission’s (NTC) proceedings in connection with the bid of Globe Telecom Inc. to take over Bayan Telecommunications Inc. (Bayantel). Despite the lapse of the Temporary Restraining Order (TRO) last December 9, 2014, the Court of Appeals has advised the NTC to refrain from conducting any proceedings in connection with the bid of Globe assume majority control of Bayantel. On June 3, 2014, Globe signed an agreement with Azalea Technology, Inc. and SCS Computer Systems, acquiring the entire ownership stake in Asticom. a systems integrator and information technology services provider to domestic and international markets. On July 20, 2015, Globe Telecom, lnc. ("Globe") has agreed to purchase from Bayan Telecommunications Holdings, Corporation ("BTHC') and Lopez Holdings, Corporation ("LHC") all the equity in the capital stock of Bayan Telecommunications, lnc. ("Bayan") that is held by BTHC and LHC. The transaction involved up to 70,763,707 Bayan shares and increased Globe's equity interests in Bayan from 56.87% to 98.57% of outstanding capital stock. On November 12, 2015, Globe received the resolution from the rehabilitation court granting its motion for the termination of the rehabilitation proceedings involving Bayan. The resolution sets a key milestone for Bayan, wherein it successfully exits rehabilitation and provides key steps for Globe to continue to unlock opportunities for synergies with Bayan. Globe Telecom, Inc. (Globe), Ayala Corporation (AC) and Bank of the Philippine Islands (BPI) signed an agreement on August 27, 2015 to turn over full ownership of BPI Globe BanKO (BanKO) to BPI, one

S E C F O R M 1 7 - A 127
of the majority owners of the joint venture. Despite the change in shareholder structure, BanKO will continue to provide broader and more competitive access to funds and critical financial services to the underbanked. Globe and AC sold their respective 40% and 20% stakes in BanKO to BPI, which already owned 40% of BanKO. Xurpas Inc. signed an agreement with Globe Telecom on September 1, 2015, investing Php900 Million for a 51% equity stake in Yondu Inc. The investment solidifies the Globe and Xurpas partnership in the internet and digital space and will transform Yondu into a regional arm for digital content distribution and other technology driven services. The strategic alliance of Globe and Xurpas in Yondu bolsters Globe’s track record of partnering with leading digital players to strengthen its position as the purveyor of the Filipino digital lifestyle. On September 1, 2015, Yondu Inc. and GCVHI entered into a Deed of Assignment to assign the former’s interest in Global Telehealth, Inc. (“GTHI”) to GCVHI for a total consideration of ₱15 million. On September 15, 2015, Globe Telecom sold its controlling interest in Yondu for a total consideration of ₱670 million. On the same date, Yondu issued additional 5,000 common shares from its unissued authorized capital stock to a third party which further dilutes Globe Telecom’s ownership interest to 49% as of September 2015. On May 30, 2016, the Board of Directors of Globe, through its Executive Committee, approved the acquisition and signing of a sale and share purchase agreement and other related definitive agreements for the following entities:
• 50% of the issued and outstanding capital stock of Vega Telecom, Inc. (“VTI”) from San Miguel Corporation (“SMC”) (PSE: SMC);
• 50% of the issued and outstanding capital stock of Bow Arken Holdings Company Inc. (“BAHC”); and,
• 50% of the issued and outstanding capital stock of Brightshare Holdings Corporation (“BHC”). VTI owns an equity stake in Liberty Telecom Holdings, Inc., a publicly listed company in the Philippine Stock Exchange. It also owns, directly and indirectly, equity stakes in various enfranchised companies, including Bell Telecommunication Philippines, Inc., Eastern Telecom Philippines, Inc., Express Telecom, Inc., and Tori Spectrum Telecom, Inc., among others. The remaining 50% equity stake in VTI, BAHC and BHC was acquired by Philippine Long Distance Telephone Company (PLDT) under similar definitive agreements. The acquisition provided Globe access to certain frequencies assigned to Bell Tel in the 700 Mhz, 900 Mhz, 1800 Mhz, 2300 Mhz and 2500 Mhz bands through a co-use arrangement approved by the NTC on May 27, 2016. NTC's approval is subject to the fulfilment of certain conditions including roll out of telecom infrastructure covering at least 90% of the cities and municipalities in three years to address the growing demand for broadband infrastructure and internet access. On June 21, 2016, Globe Telecom exercised its rights as holder of 50% equity interest of VTI to cause VTI to propose the conduct of a tender offer on the common shares of Liberty Telecom Holdings, Inc. (LIB) held by minority shareholders as well as the voluntary delisting of LIB. At the completion of the tender offer and delisting of LIB, VTI’s ownership of LIB is at 99.1%. On August 17, 2018, Globe Telecom incorporated GTowers, Inc., a fully owned subsidiary aimed at the building and deployment of cellular towers in the country. As of December 31, 2019, GTowers is still under pre-operating stage. On September 11, 2019, the BOD of Globe Telecom approved the acquisition of 51% of the outstanding shares of Yondu, equivalent to 22,950 shares. The acquisition increased Globe Telecom’s ownership interest from 49% to 100% and was accounted for as an acquisition of a subsidiary. On October 25, 2019, Globe Telecom signed and executed an agreement with third parties to complete its transaction to acquire 77% ownership of ECPay. There was no bankruptcy, receivership or similar proceedings initiated during the past four years.

S E C F O R M 1 7 - A 128
B. Business Segments 1. Mobile Business Globe provides digital Mobile communication and internet-on-the-go services nationwide using a fully digital network based on the Global System for Mobile Communication (GSM), 3G, HSPA+, 4G, and LTE technologies. It provides voice, SMS, data and value-added services to its Mobile subscribers through three major brands: Globe Postpaid, Globe Prepaid and TM (including fully Mobile, internet-on-the-go service).
Postpaid Globe Postpaid is the leading brand in the postpaid market, with various plan offerings. Over the years, these plans have evolved in order to cater to the changing needs, lifestyles and demands of its customers. In order to keep up with these growing demands, Globe once again highlights its portfolio of postpaid plans featuring "ThePLAN PLUS" which is the Company's SIM-ONLY Plans, that offers up to 2x larger than life data. With ThePLAN PLUS (ranging from Plan 599 to Plan 2999), all customers have to do is bring their own smartphone and get a minimum of 3GB to as much as 61GB of data for more time online. For ThePLAN PLUS 599 to 999, customers can enjoy unlimited call to Globe/TM, unlimited text to All-networks, 100 minutes call to All-networks. While for ThePLAN PLUS 1299 to 1799 customers can enjoy from 18GB to 31GB data allocation with unlimited call to Globe/TM, unlimited text to All-networks, 200 minutes call to All-networks. ThePLAN PLUS 1999 and 2499 customers can enjoy 32GB and 52GB data allocation, respectively, plus unlimited call to Globe/TM, unlimited text to All-networks, 300 minutes call to All-networks. ThePLAN PLUS 2999 on the other hand, gives 61GB of data allocation plus unlimited call and texts to All-networks. ThePLAN PLUS 999 and up also includes 1GB allocation of Facebook per month, 6-months free subscription to DisneyLife and Amazon Prime. "ThePlan", the Company’s postpaid plan with device likewise ranges from plan 599 to 2999 includes a choice of handset, 24-month FB subscription (with 1GB data allocation per month), free 1-month gadget care and free shipping. While ThePlan 999 to 2999 includes an additional free 6 months subscription to DisneyLife and Amazon Prime. ThePlan599 offers 2GB data allocation and unlimited calls and texts to Globe/TM; ThePlan799, 999 and 1,299 offers 3GB, 5GB and 8GB data allocation, respectively, plus unlimited calls and texts to Globe/TM and 50 minutes call to All-networks; ThePlan1499 and 1799 offers 10GB and 15GB data allocation respectively, plus unlimited call and texts to Globe/TM and 100 minutes calls to All-networks; ThePlan1999 and 2499 offers 16GB and 21GB data allocation respectively, plus unlimited call and texts to Globe/TM and 150 minutes calls to All-networks; ThePlan2999 offers 31 data allocation plus unlimited call and texts to Globe/TM and 300 minutes calls to All-networks. Prepaid Globe Prepaid and TM are the prepaid brands of Globe. Globe Prepaid is focused on the mainstream market while TM caters to the value-conscious segment of the market. Each brand is positioned at different market segments to address the needs of the subscribers by offering affordable innovative products and services. Globe Prepaid's GoSakto is a self-service menu that provides its subscribers easy access to avail of the latest promos and services of Globe by simply dialing *143# or through the GoSakto Mobile app (available on Android and iOS). This menu also allows the subscribers to build their own promos (call, text and surf promos) that are best suited for their needs and lifestyle. Globe Prepaid customers can personalize their call, text and surfing needs for 1 day, 2 days, 3 days, 7 days, 15 days or even for 30 days. They can also select the type and number of call minutes and texts they need and adjust data allocation (in MBs) of Mobile surfing the way they want it.
Globe Prepaid and TM subscribers can reload airtime value or credits using various reloading channels including prepaid call and text cards, gcash, bank channels such as ATMs, credit cards, and through internet banking. Subscribers can also top-up via AutoLoad Max retailers nationwide, all at affordable denominations and increments. A consumer-to-consumer top-up facility, Share-A-Load, is also available to enable subscribers to share prepaid load credits via SMS.
Loyalty & Rewards Program The Globe Rewards Program - "MyRewards MyGlobe" is the Company's way of granting special treats to its active customers for their continued loyal use of Globe's products and services. Awesome rewards

S E C F O R M 1 7 - A 129
await its loyal customers in exchange for the points earned -- more rewards points mean more wonderful perks. All customers with active Globe/TM SIMs are automatically members of the program. No registration required. Subscribers can:
• Earn Points from Prepaid reloads or monthly Postpaid usage.
• Redeem Rewards in the form of Mobile promos, bill rebates, gadgets and gift certificates, and more or use the earned points as cash at partner stores. Subscribers have the option to redeem rewards instantly, or accumulate points to avail of higher value rewards. Redeemed points in the form of telecom services is netted out against revenues whereas points redeemed in the form of non-telco services such as gift certificates and other products are reflected as marketing expense. At the end of each period, Globe estimates and records the amount of probable future liability for unredeemed points
• Enjoy Perks through special discounts, exclusive treats, and more wonderful surprises (a) Mobile Voice
Globe's voice services include local, national and international long-distance call services. It has one of the most extensive local calling options designed for multiple calling profiles. In addition to its standard, pay-per-use rates, subscribers can choose from bulk and unlimited voice offerings for all-day, and in several denominations to suit different budgets. Globe keeps Filipinos connected wherever they may be in the world, through its tie-up with 776 roaming partners in 237 calling destinations worldwide. Globe also offers roaming coverage on-board selected shipping lines and airlines, via satellite. Globe also provides an extensive range of international call and text services to allow OFWs (Overseas Filipino Workers) to stay connected with their friends and families in the Philippines. This includes prepaid reloadable call cards and electronic PINs available in popular OFW destinations worldwide.
(b) Mobile SMS
Globe's Mobile SMS service includes local and international SMS offerings. Globe also offers various bucket and unlimited SMS packages to cater to the different needs and lifestyles of its postpaid and prepaid subscribers.
(c) Mobile Data
Globe's Mobile Data services allow subscribers to access the internet using their internet-capable handsets, devices, laptops with USB modems, a plug-and-play USB modem/Mobile Wifi. Data access can be made using various technologies including LTE, HSPA+, 4G, 3G with HSDPA, EDGE and GPRS or Wi-Fi. The Company spearheaded the shift from unlimited time-based data plans to volume-based consumable plans, geared towards improving the Mobile data experience of its subscribers and ensures the most appropriate pricing of data. Globe and TM subscribers can choose from a variety of GoSurf consumable data plans, ranging from Php15 for 100 MB to Php2,499 for 50 GB per month. Globe's Value-Added Services offers a full range of downloadable content covering multiple topics including news, information, and entertainment through its web portal. Subscribers can purchase or download music, movie pictures and wallpapers, games, Mobile advertising, applications or watch clips of popular TV shows and documentaries as well as participate in interactive TV, do Mobile chat, and play games, among others. Additionally, Globe subscribers can send and receive Multimedia Messaging Service (MMS) pictures and video, or do local and international video calling.
2. Fixed Line and Broadband Business
Globe offers a full range of fixed line communications services, wired and wireless Broadband access, and end-to-end connectivity solutions customized for consumers, SMEs (Small & Medium Enterprises), large corporations and businesses.
(a) Fixed Line Voice
Globe's fixed line voice services include local, national and international long-distance calling services in postpaid and prepaid packages through its Globelines brand. Subscribers get to enjoy toll-free rates for national long-distance calls with other Globelines subscribers nationwide. Additionally, postpaid fixed line voice consumers enjoy free unlimited dial-up internet from their Globelines subscriptions. Low-MSF (monthly service fee) fixed line voice services bundled with

S E C F O R M 1 7 - A 130
internet plans are available nationwide and can be customized with value-added services including multi-calling, call waiting and forwarding, special numbers and voice mail. For corporate and enterprise customers, Globe offers voice solutions that include regular and premium conferencing, enhanced voice mail, IP-PBX solutions and domestic or international toll-free services. With the Company's cutting-edge Next Generation Network (NGN), Globe Business Voice solutions offer enterprises a bevy of fully managed traditional and IP-based voice packages that can be customized to their needs.
(b) Corporate Data
Corporate Data services include end-to-end data solutions customized according to the needs of businesses. Globe's product offerings include international and domestic leased line services, wholesale and corporate internet access, data center services and other connectivity solutions tailored to the needs of specific industries. Globe's international data services provide corporate and enterprise customers with the most diverse international connectivity solutions. Globe's extensive data network allow customers to manage their own virtual private networks, subscribe to wholesale internet access via managed international private leased lines, run various applications, and access other networks with integrated voice services over high-speed, redundant and reliable connections. In addition to bandwidth access from multiple international submarine cable operators, Globe also has two international cable landing stations situated in different locales to ensure redundancy and network resiliency. The Company's domestic data services include data center solutions such as business continuity and data recovery services, 24x7 monitoring and management, dedicated server hosting, maintenance for application-hosting, managed space and carrier-class facilities for co-location requirements and dedicated hardware from leading partner vendors for off-site deployment. Other Corporate Data services include premium-grade access solutions combining voice, Broadband and video offerings designed to address specific connectivity requirements. These include Broadband Internet Zones (BIZ) for Broadband-to-room internet access for hotels, and Internet Exchange (GiX) services for bandwidth-on-demand access packages based on average usage. Globe Business knows that success is made up of different elements: effective products, streamlined processes, and reliable manpower, and that is why Globe's business solutions are a fusion of all three. Among the products and solutions are as follows:
• Mobility – Maintain your business momentum with Mobility solutions that increase productivity within and beyond the workplace. With Globe's enterprise mobility solutions, it's easier to build and maintain the business momentum: (1) Postpaid - Leverage on flexible Postpaid plans that suit companies of every scale (2) Enterprise Mobile Management - Gain more control over enterprise Mobile devices while simultaneously maximizing workforce productivity (3) IsatPhone Pro - Take communications to the next level with a satellite phone that lets you call, text, and do more-even from remote places around the globe.
• Voice – Simplify your communications infrastructure with Globe's wide range of cost-efficient Voice Solutions and enjoy the freedom of tailoring the services to fit your business needs. (Globelines; ISDN-PRI; Toll-Free Services; Enhanced Managed Voice Solution (EMVS); Managed IP-PBX; SIP Trunk; Hosted PBX System & Services; Collaboration Solutions).
• Connectivity - Keep your business up to speed with a fast and resilient connection powered by dedicated and reliable technologies (Domestic Data; International Data; Internet Services; Managed Services).
• Cloud - Improve efficiency and agility in the face of evolving business environments while keeping costs low with Globe's range of cloud services: Infrastructure-as-a-Service (IaaS); Backup-as-a-Service (BaaS); Disaster-Recovery-as-a-Service (DRaaS); Amazon Web Services; AWS Direct Connect.
• Data Center - Globe Data Center provides a superior experience that goes beyond technology. Ease your worries on day-to-day operations by outsourcing your data center hosting and management, so you can focus more on your business.
• Cybersecurity - Handle security threats and IT infrastructure cost-effectively. Manage your tasks and functions cost-effectively with Globe Business' Cybersecurity. Gain access to the best-in-class tool sets, hardware, software, and even niche technology experts while only paying for what you need, when you need it.
• Business applications – Choose from a diverse range of solutions to streamline and enhance the business’ operations and raise efficiency, productivity, and customer satisfaction (G Suite; Go Canvas, Office 365; Learning Management Solutions, HR Solutions, M2M).

S E C F O R M 1 7 - A 131
In November 2019, Globe Business, the enterprise arm of Globe, introduces another game-changing solution for Philippine businesses that will enable them with a reliable cloud platform for video and audio conferencing, collaboration, chat, and webinars across mobile devices, desktops, telephones, and room systems. Zoom, a video first unified communications solution provided by Zoom Video Communications, Inc., is designed to eliminate overlapping communication systems, on-premise hardware, and weak mobile experience. Zoom is able to do all of these things for one reason: Zoom’s architecture was built video-first from the ground up, which results in a platform that is highly scalable and globally distributed. By remaining digitally agile, Globe is able to extend the same services to its corporate clients so that they can optimize the way they do business and harness the inevitable digital changes.
(c) Home Broadband
Globe offers wired and fixed wireless Broadband services, across various technologies and connectivity speeds for its residential and business customers. Globe Home Broadband consists of wired or DSL Broadband packages bundled with voice, or Broadband data-only services which are available with download speeds ranging from 1 Mbps up to 15 Mbps. Globe also expanded its Long-Term Evolution (LTE) footprint through LTE @Home offerings, bringing latest internet technology to households and allowing subscribers to surf the internet at ultrafast speeds to watch high-definition videos, downloading and uploading large files, seamless music streaming, and voice-over-internet-protocol (VOIP) calling with clear quality. This LTE service is backed by the largest 4G network in the country deployed by Globe. In June 2019, Globe joined leaders of the global telecommunications industry, by being the first in Southeast Asia to commercially introduce 5G fixed wireless Home Broadband service in the Philippines. This makes use of fixed location wireless radios instead of fiber and could provide fiber-like speeds ranging from 50 Mbps to 100 Mbps. Home Broadband Plans available are GoUnli and GoBIG Plans. GoUnli is the ultimate unlimited data offering that allows customers to stream video, play music and games without having to worry about lock-up period, data capping, and speed throttling. GoUnli wired plans start at Php1,699 a month, which come with unlimited surfing and streaming up to 5 Mbps. Faster speeds are also available with the following plans: Plan 1899 for speeds up to 10, 15, or 20 Mbps, Plan 2499 for speeds up to 50 Mbps, and Plan 2899 for speeds up to 100 Mbps. To avail of the no-lock up offer, interested parties need only pay for a one-time modem fee of Php2,500 or Php4,500 depending on the chosen plan. Those who choose to discontinue their subscription within the first 15 days will get a 100% refund of their modem fee upon the return of the modem and telephone set provided during installation. For those looking for an option without modem fees, 24-month contract plans are also available. GoBig plans have bigger data allocations at affordable rates alongside fast and reliable speeds. Access to free content apps also remain a major part of the Broadband bundle. For Plan 1299, customers can enjoy 150GB of data allocation per month, with speeds of up 10Mbps. Those who want to stream more can avail of Plan 1699, which has a data allowance of 600GB and speeds of up to 20Mbps; Plan 4499, which has 1.5TB of data and speeds of up to 200Mbps, Plan 6,999, which has 3TB of data with speeds up to 500Mbps or Plan 9499, which has 6TB of data with speeds up to 1Gbps. All Broadband Plans (GoUnli and GoBIG) come with free landline with unlimited calls to Globe and TM for 24 months plus free nine months subscription to DisneyLife, FOX+, HOOQ, Amazon Prime Video, iflix. Experience reliable prepaid internet that is not just easy to install but also easy on the budget. Globe At Home Prepaid Wifi is an improved WiFi connection, with wide internet coverage, ready-to-use freebie and features. Load, track, and manage your Prepaid WiFi with the Globe At Home App. In addition, Globe Streamwatch Xtreme Prepaid, the world's first all-in-one entertainment device, is likewise available. It is equipped with free clear local live TV channels and serves as an internet TV with over a million videos, shows, and movies. It also boasts of an internet connection that is 2x faster, 2x stronger, with 2x wider coverage than your average pocket WiFi device. Multiple devices can also be connected to Globe Streamwatch Xtreme, so everyone can access all the content they want at the same time. In June 2019, Globe launched the Globe At Home Air Fiber 5G postpaid plans. The Globe At Home Air Fiber 5G postpaid plans which offer fiber-like speeds up to 100Mbps and super-sized data packages of up to 2 terabytes was initially available in select areas in Pasig, Cavite, and Bulacan. Globe at Home Air Fiber 5G was made available to eligible customers in July 2019. Plans come at Php1,899 per month for up to 20Mbps, Php2,499 for up to 50Mbps and Php2,899 for up to 100Mbps. All plans come with up to 2TB data capacity. In November, 2019, Globe At Home Prepaid WiFi customers subscribed to HomeSurf199 and up can enjoy free 1GB of YouTube daily for the duration of the promo subscribed to. Globe At Home

S E C F O R M 1 7 - A 132
Prepaid HomeSurf promos may be availed through the Globe At Home App (downloaded for free via Google Play Store or the App Store).
C. Sales and Distribution Globe has various sales and distribution channels to address the diverse needs of its subscribers. 1. Independent Dealers Globe utilizes a number of independent dealers throughout the Philippines to sell and distribute its prepaid wireless services. This includes major distributors of wireless phone handsets who usually have their own retail networks, direct sales force, and sub-dealers Dealers are compensated based on the type, volume and value of reload made in a given period. This takes the form of fixed discounts for prepaid airtime cards and SIM packs, and discounted selling price for phonekits. Additionally, Globe also relies on its distribution network of over 1.2 million AutoloadMax retailers nationwide who offer prepaid reloading services to Globe and TM subscribers. 2. Globe Stores As of December 31, 2019, the Company has a total of 214 Globe Stores all over the country where customers are able to inquire and subscribe to wireless, broadband and fixed line services, reload prepaid credits, make GCASH transactions, purchase handsets and accessories, request for handset repairs, try out communications devices, and pay bills. The Globe Stores are also registered with the Bangko Sentral ng Pilipinas (BSP) as remittance outlets. In line with the Company’s thrust to become a more customer-focused and service-driven organization, Globe departed from the traditional store concept which is transactional in nature and launched the redesigned Globe Store which carries a seamless, semi-circular, two-section design layout that allows anyone to easily browse around the product display as well as request for after sales support. It boasts of a wide array of mobile phones that the customers can feel, touch and test. There are also laptops with high speed internet broadband connections for everyone to try. The Globe store has an Express Section for fast transactions such as modification of account information and subscription plans; a Full-Service Section for more complex transactions and opening of new accounts; and a Cashier Section for bill payments. The store also has a self-help area where customers can, among others, print a copy of their bill, and use interactive touch screens for easy access to information about the different mobile phones and Globe products and services. Globe stores also include NegoStore areas, which serve as additional sales channels for current and prospective Globe customers. Moreover, select stores also have ‘Tech Coaches’ or device experts that can help customers with their concerns on their smartphones. The Company opened the first concept store in Greenbelt 4 in 2010 and accelerated its roll-out throughout 2011, averaging 4-5 new stores a month. In 2012, Globe introduced other store formats in response to the need for more customer service channels to accommodate more subscribers availing of Globe postpaid, prepaid and internet services. The new store formats - the premium dealership store, pop-up store, microstore, kiosk, and store-on-the-go – were carefully designed based on demographics, lifestyle and shopping behaviors of its customers, each providing a different retail mix and experience to subscribers. In 2013, Globe opened 50 concept stores and will open more concept stores in the country as part of its commitment to a wonderful customer service experience. In 2014, Globe simultaneously unveiled its Generation 3 flagship stores in SM North EDSA, Quezon City, Manila and in Limketkai Mall, Cagayan de Oro. Designed by Tim Kobe, the founder and CEO of Eight, Inc. and designer of Apple Stores, the Globe Gen3 stores features reconfigurable and interactive elements, all designed to empower the growing digital lifestyle of customers. The stores feature four lifestyle zones – music, entertainment, productivity, and life – each with their own interactive kiosks. Continuing with its journey of transforming customer experience, Globe opened two more Gen3 stores in 2015. On July 2015, Globe opened its third Gen3 store in Ayala Center, Cebu and on August 2015, opened its fourth Gen3 and first two-storey store in Greenbelt, Makati. In 2016, Globe opened its Flagship ICONIC store in Bonifacio Global City Central Square Taguig. Designed by Tim Kobe of Eight Inc., the same designer of the Globe GEN3 stores, the Globe ICONIC store is the first all-in-one retail and entertainment space and was launched in two phases. Phase 1 was completed in the June 2016 and featured the entertainment space that will house shows, concerts, and a variety of on-ground events and activities. Phase 2, completed in December 2016 features the

S E C F O R M 1 7 - A 133
complete Globe ICONIC Store with a glass bridge that links two Globe stores from opposite sides of the BGC Central Square. 3. Customer Facing Units To better serve the various needs of its customers, Globe is organized along two key customer facing units (CFUs) tasked to focus on the integrated mobile, Fixed Line and international voice and roaming needs of specific market segments. The Company has a Consumer CFU with dedicated marketing and sales groups to address the needs of retail customers, and a Business CFU (Globe Business) focused on the needs of big and small businesses. Globe Business provides end-to-end mobile and Fixed Line solutions and is equipped with its own technical and customer relationship teams to serve the requirements of its client base. Globe Business also caters to the international voice and roaming needs of overseas Filipinos, whether transient or permanent. Moreover, it is tasked to grow the Company's international revenues by leveraging on Globe's product portfolio and developing and capitalizing on regional and global opportunities. 4. Others Globe also distributes its prepaid products SIM packs, prepaid call cards and credits through consumer distribution channels such as convenience stores, gas stations, drugstores and bookstores. D. Operating Revenues
Gross Operating Revenues by Business Segment
Year Ended December 31
(in Php Mn) 2019 % of total 2018 % of total
Service Revenues
Mobile*…………………………………………… 111,767 67% 99,530 66%
Voice1………………………………………….. 24,276 15% 28,408 19%
SMS2…………………………………………… 15,690 9% 20,162 13%
Data3…………………………………………… 71,801 43% 50,961 34%
Fixed Line and Home Broadband**………… 37,243 22% 33,345 22%
Home Broadband4……………………………. 21,747 13% 18,606 12%
Corporate Data5………………………………. 12,828 8% 11,762 8%
Fixed Line Voice6……………………...……... 2,668 1% 2,977 2%
Service Revenues……..…..………………….. 149,010 89% 132,875 88%
Non Service Revenues……………………….. 17,650 11% 18,297 12%
Operating Revenues.…………………………. 166,660 100% 151,172 100%
*Mobile business includes mobile and fully mobile broadband **Home Broadband includes fixed wireless and wired broadband
1 Mobile voice service revenues include the following: a) Prorated monthly service fees on consumable minutes of postpaid plans; b) Subscription fees on unlimited and bucket voice promotions including the expiration of the unused value of denomination
loaded; c) Charges for intra-network and outbound calls in excess of the consumable minutes for various Globe Postpaid plans,
including currency exchange rate adjustments, or CERA, net of loyalty discounts credited to subscriber billings; and d) Airtime fees for intra network and outbound calls recognized upon the earlier of actual usage of the airtime value or expiration
of the unused value of the prepaid reload denomination (for Globe Prepaid and TM) which occurs between 3 and 120 days after activation depending on the prepaid value reloaded by the subscriber net of (i) bonus credits and (ii) prepaid reload discounts; and revenues generated from inbound international and national long distance calls and international roaming calls; and
e) Mobile service revenues of GTI.
Revenues from (a) to (d) are reduced by any payouts to content providers. 2 Mobile SMS revenues consist of local and international revenues from value-added services such as inbound and outbound
SMS and MMS, infotext, and subscription fees on unlimited and bucket prepaid SMS services, net of any interconnection or settlement payouts to international and local carriers and content providers.
3 Mobile data service revenues consist of revenues from mobile internet browsing and content downloading, mobile commerce
services, other add-on value added services (VAS), and service revenues of GXI and Yondu, net of any interconnection or settlement payouts to international and local carriers and content providers, except where Globe is acting as principal to the contract where revenues are presented at gross billed to subscriber and settlement pay-out are classified as part of costs and expenses. Beginning 2017, revenues from premium content services (where Globe is acting as principal to the contract) will be reported gross of the licensors’ fees. Revenues for similar services reported in 2016 have also been restated for purposes of comparison.
4 Home broadband service revenues consist of the following: a) Monthly service fees of wired, fixed wireless, and bundled voice and data subscriptions;

S E C F O R M 1 7 - A 134
b) Browsing revenues from all postpaid and prepaid wired and fixed wireless broadband packages in excess of allocated free browsing minutes and expiration of unused value of prepaid load credits;
c) Value-added services such as games; and d) Installation charges and other one-time fees associated with the service. e) Beginning 2017, revenues from premium content services (where Globe is acting as principal to the contract) will be reported
gross of the licensors’ fees. Revenues for similar services reported in 2016 have also been restated for purposes of comparison. Licensors’ fees will be reflected as part of maintenance expense.
5 Corporate data (previously called Fixed line data) service revenues consist of the following: a) Monthly service fees from international and domestic leased lines; b) Other wholesale transport services; c) Revenues from value-added services; and d) One-time connection charges associated with the establishment of service.
6 Fixed Line voice service revenues consist of the following:
a) Monthly service fees; b) Revenues from local, international and national long distance calls made by postpaid, prepaid fixed line voice subscribers
and payphone customers, as well as broadband customers who have subscribed to data packages bundled with a voice service. Revenues are net of prepaid and payphone call card discounts;
c) Revenues from inbound local, international and national long distance calls from other carriers terminating on Globe’s network;
d) Revenues from additional landline features such as caller ID, call waiting, call forwarding, multi-calling, voice mail, duplex and hotline numbers and other value-added features;
e) Installation charges and other one-time fees associated with the establishment of the service; and f) Revenues from DUO and SUPERDUO (fixed line portion) services consisting of monthly service fees for postpaid and
subscription fees for prepaid subscribers.
Globe’s mobile business contributed ₱111.8 billion in 2019 accounting for 67% of total operating revenues, 12% higher than last year’s level of ₱99.5 billion. Mobile voice service revenues amounted to ₱24.3 billion in 2019, contributing 15% of operating revenues. Mobile SMS service revenues contributed ₱15.7 billion in 2019 or 9% of operating revenues. Mobile data posted strong revenue growth compared to last year’s level and contributed ₱71.8 billion in 2019, 43% of operating revenues. Accounting for 22% of total operating revenues, Globe’s fixed line and broadband business grew 12%, registering ₱37.2 billion in 2019, compared to ₱33.3 billion in 2018. Home broadband contributed revenues of ₱21.7 billion, or 13% of operating revenues. Corporate data contributed 8%, at ₱12.8 billion and fixed line voice contributed 1% at ₱2.7 billion. E. Competition 1. Industry, Competitors and Methods of Competition (a) Mobile Market
The Philippine mobile market has a total industry SIM base of more than 167 million with an industry penetration rate of 152% as of December 31, 2019. With the growing penchant of Filipinos for smartphones, the mobile data business in the Philippines presents more opportunities for revenue growth. Mobile data usage of both prepaid and postpaid subscribers continues to be a promising market with fast-paced growth. The Philippine government liberalized the communications industry in 1993, after a framework was developed to promote competition in the industry and accelerate the development of the telecommunications market. Ten (10) operators were granted licenses to provide CMTS services – Globe, Innove (previously Isla Communications, Inc. or “Islacom”), Bayan Telecommunications, Inc. (“Bayantel”), Connectivity Unlimited Resources Enterprises (“CURE”), Digitel Telecommunications Philippines, Inc. (“Digitel”), Express Telecom (“Extelcom”), MultiMedia Telephony, Inc., Next Mobile (“NEXTEL”), Pilipino Telephone Corporation (“Piltel”) and Smart Communications, Inc. (“Smart”). Nine of the ten operators continued on to operate commercially except for Bayantel, which have yet to roll out their CMTS services commercially. When Sun Cellular, Digitel’s mobile brand, entered the market in 2003, it introduced to the market value-based unlimited call and text propositions, allowing it to build subscriber scale over time. With the market’s preference for these value-based unlimited and bulk call and text services, Globe and Smart responded by creating a new set of value propositions for their subscribers. Today, with the high level of mobile penetration, driven by the prevalence of multi-SIMming (i.e., individuals having two SIMs), the competition in the mobile market remains intense, albeit in a more rational environment.

S E C F O R M 1 7 - A 135
Mobile Subscribers (Mn) Penetration Rates (%) Growth Rate
1998 1.62 2.5 43% 1999 2.68 3.8 65% 2000 5.26 8.6 96% 2001 10.53 14.2 100% 2002 15.17 19.0 44% 2003 22.31 27.3 47% 2004 32.87 39.4 47% 2005 34.61 40.6 5% 2006 42.04 48.3 21% 2007 54.86 61.2 30% 2008 68.03 74.6 24% 2009 75.43* 82.3 11% 2010 86.15* 93.0 14% 2011 2012
93.74* 102.99*
98.7 106.4
9% 10%
2013 2014 2015
108.52* 113.89* 124.79
110.0 116.0 115.2
5% 5% 3%
20161 125.56 120.4 1%
20172 118.98 111.9 -5%
20183 134.59 124.3 13%
2019 167.32 151.8 24%
* Estimated end of year figures. Source: National Telecommunications Commission (Statistical Data 2007), publicly available information and Company estimates 1 Starting 2016, nomadic subscribers are included in mobile subscribers (previously reported under broadband subscribers) 2 In 2017, the industry has excluded in their reporting the prepaid subscribers who do not reload within 90 days of the second expiry period, versus the previous cut-off of 120 days 3 In 2018, under Joint Memorandum Circular No. 05-12-2017, all prepaid load now carries a one-year expiration period
Since 2000, the mobile communications industry has experienced a number of consolidations and ushered in new entrants, namely:
• In 2000, Philippine Long Distance and Telephone Company (“PLDT”) acquired and consolidated Smart and Piltel, complementing the former’s fixed line businesses with the latter’s wireless businesses. Subsequently in 2008, PLDT, through Smart, purchased CURE, one of the four recipients of 3G licenses awarded by the NTC, and has since launched another wireless brand in the market in Red Mobile, further heightening competition in the market at that time.
In October 2011, PLDT also acquired 99.4% of the outstanding common stock of Digitel, which owns the Sun Cellular brand, thereby allowing it to control over two-thirds of the industry subscribers. As a condition of PLDT’s acquisition of Digitel, PLDT returned to the NTC the 3G license in CURE, which is expected to be re-auctioned in the near-term.
• In 2008, San Miguel Corporation (“SMC”), partnering with Qatar Telecom, bought interests in Liberty Telecom Holdings, Inc. (“Liberty”) and announced plans to enter the mobile and broadband businesses. In 2010, SMC acquired 100% stake in Bell Telecommunication Philippines, Inc. (“BellTel”), after acquiring shares in three companies that own the shares of BellTel. Also in 2010, SMC purchased a 40% stake in Eastern Telecommunications Philippines, Inc. (“ETPI”) to expand its telecommunications services. SMC subsequently gained a majority stake of ETPI in 2011. It now owns 77.7% of the telecommunications company.
In 2012, NTC has granted BellTel, San Miguel Corporation’s mobile telephony arm, an extension to its operating license to provide cellular mobile telephone system (CMTS) service in the country for another three years.
• In 2001, Globe acquired Islacom (now Innove). Globe, likewise, acquired approximately 96.5% of the total debt of Bayantel, in December 2012. On October 2013, Globe converted a portion of the debt it holds in Bayantel into a 38% interest in the latter, based on the Amended Rehabilitation Plan approved by the Rehabilitation Court in August of the same year. Upon obtaining relevant and regulatory approvals, Globe would further convert debt into a total 56.6% share of the common stock of Bayantel.

S E C F O R M 1 7 - A 136
• In May 2013, ABS-CBN Convergence, Inc. (“ABS-C”, formerly Multimedia Telephony, Inc.) announced the launch of its mobile brand, ABS-CBN Mobile. The launch of the new mobile brand was being supported through a network sharing agreement with Globe, wherein the latter provides network capacity and coverage to ABS-C on a nationwide basis. ABS-C formally launched the brand in November 26, 2013. On November 30, 2018, ABS-C discontinued its mobile phone services business and terminated the mobile network sharing arrangement with Globe Telecom.
• In November 2015, Cherry Mobile, a leading mobile phone company in the Philippines, entered into a co-branding partnership with Globe to launch the Cherry Prepaid SIM that also comes bundled with a Cherry Mobile phone. The Cherry Prepaid SIM will operate through a network sharing agreement with Globe, similar to ABS-CBN-Mobile.
• In November 2018, the Department of Information and Communications Technology (DICT) and the National Telecommunications Commission (NTC) declared Mislatel a new major telco player, a consortium composed of Mindanao Islamic Telephone Inc., Udenna Corporation, Chelsea Logistics Holdings, and China Telecom. As of reporting date, the new major player has not begun operations.
Today, only the PLDT Group and the Globe Group have built significant bases of mobile subscribers. (b) Fixed Line Market
Fixed Line Voice The number of lines in service in the fixed line voice market is estimated at 4.17 million lines as of December 31, 2019 with PLDT’s subscriber market share at 66% and Globe subscriber market share at 34%. The fixed line voice market is currently in decline as the country continues to shift towards alternative communication solutions like VoIP and chat messaging applications. Corporate Data The fixed line data business is a growing segment of the fixed line industry. As the Philippine economy grows, businesses are increasingly utilizing new networking technologies and the internet for critical business needs such as sales and marketing, intercompany communications, database management and data storage. The expansion of the local IT Enabled Service (ITES) industry which includes call centers and Business Process Outsourcing (BPO) companies has also helped drive the growth of the corporate data business. Dedicated business units have been created and organized within the Company to focus on the mobile and fixed line needs of specific market segments and customers – be they residential subscribers, wholesalers and other large corporate clients or smaller scale industries. This structure has also been driven by Globe’s corporate clients’ preferences for integrated mobile and fixed line communications solutions.
(c) Home Broadband Market Home broadband continues to be a major growth area for the local telecom industry. Industry home broadband subscribers is now at 4.18 million, growing 15% versus 2018. Globe’s subscriber market share stands at 48% as of December 31, 2019, up from 44% a year ago. The aggressive network roll-out of the various operators, the wider availability of affordable prepaid broadband packages, as well as lower PC and tablet prices were the main drivers of subscriber growth. Operators used both wired and wireless technologies to serve the growing demand for internet connectivity. While household penetration rates remains low, competition continues to intensify as telecom operators aim to capture the market by accelerating the rollout of broadband network to provide subscribers with faster internet connection and introducing more affordable and bundled offerings.

S E C F O R M 1 7 - A 137
2. Principal Competitive Strengths of the Company (a) Market Leadership Position
Globe is a major provider of telecommunications services in the Philippines. It is a strong player in the market and operates one of the largest and most technologically-advanced mobile, fixed line and broadband networks in the country, providing reliable, superior communications services to individual customers, small and medium-sized businesses, and corporate and enterprise clients. Globe’s distinct competitive strengths include its technologically advanced mobile, fixed line and broadband network, a substantial subscriber base, high quality customer service, a well-established brand identity and a solid track record in the industry.
(b) Strong Brand Identity
The Company has some of the best-recognized brands in the Philippines. This strong brand recognition is a critical advantage in securing and growing market share, and significantly enhances Globe’s ability to cross-sell and push other product and service offerings in the market.
(c) Financial Strength and Prudent Leverage Policies
Globe’s financial position remains strong with ample liquidity, and gearing comfortably within bank covenants. At the end of 2019, Globe had total interest bearing debt of ₱136.3 billion representing 63% of total book capitalization. As of December 31, 2019, consolidated gross debt to equity ratio is at 1.68x, well within the 3:1 debt to equity limit. Additionally, debt to EBITDA is also well within the 3.5:1 covenant level, currently at 1.86x. Approximately 84% of its debt is in pesos while the balance of 16% is denominated in US dollars. Expected US dollar inflows from the business offset any unhedged US dollar liabilities, helping insulate Globe’s balance sheet from any volatilities in the foreign exchange markets. Globe intends to maintain its strong financial position through prudent fiscal practices including close monitoring of its operating expenses and capital expenditures, debt position, investments, and currency exposures.
(d) Proven Management Team
Globe has a strong management team with the proven ability to execute on its business plan and achieve positive results. With its continued expansion, it has been able to attract and retain senior managers from the telecommunications, consumer products and finance industries with experience in managing large scale and complex operations.
(e) Strong Shareholder Support
The Company’s principal shareholders are Ayala Corporation (AC) and Singapore Telecom (STI), both industry leaders in the country and in the region. Apart from providing financial support, this partnership has created various synergies and has enabled the sharing of best practices in the areas of purchasing, technical operations, and marketing, among others.
F. Suppliers Globe works with both local and foreign suppliers and contractors. Equipment and technology required to render telecommunications services are mainly sourced from foreign countries. Its principal suppliers, among others, are as follows: The Company’s suppliers of mobile equipment include Huawei Technologies Co., Ltd. (China) and Nokia Corporation (Finland); and for transmission and IP equipment, Company has partnered with Huawei Technologies Co., Ltd, (China), Nokia Corporation (Finland), NEC (Japan), ECI Telecom, Ltd. (Israel), Aviat Networks (USA), and Coriant (USA, recently acquired by Infinera (USA). For providing cell site backhaul via Very Small Aperture Terminal (VSAT), Globe partnered with Gilat Satellite Networks, Inc. (Israel). In 2019, Globe also partnered with IP Access Inc, (UK) for small cell access solutions for residential and enterprise. For Fixed Line and Fixed Broadband Service, Globe’s principal equipment suppliers include Huawei Technologies Co., Ltd. (China), FiberHome Telecom Tech (China), Nokia Corporation (Finland), Juniper Networks (USA), ZTE Corporation, and Tellabs (USA/Singapore).

S E C F O R M 1 7 - A 138
For WiFi service, Company partnered with Aruba Networks (USA) and Ruckus Networks (USA). For Network Management and Operational Support Systems, Globe’s primary solution provider includes IBM (USA), Mycom OSI (United Kingdom), Incognito (Canada), Netcracker (USA), Radcom (Israel) among others. For the Company’s IT systems and infrastructure, Globe also engaged Amdocs for continuous enhancement of its Services and Operations. Amdocs Intelligent Operations will assist Globe in managing third-party systems and cloud management solutions. This includes modernizing and running IT operations for multiple lines of businesses, including prepaid and postpaid mobile services, fixed-line broadband, and enterprise services.
G. Customers Globe has a large subscriber base across the country. The Company ended 2019 with 94.2 million mobile subscribers, comprised of 2.7 million postpaid and 91.5 million prepaid subscribers. Meanwhile, Globe has over 2.0 million home broadband customers and around 1.4 million fixed line voice subscribers. No single customer and contract accounted for more than 20% of the Company’s total sales in 2019. H. Licenses, Patents, and Trademarks
1. Licenses Globe currently holds the following major licenses:
Service Type of
License Date Issued or Last
Extended Expiration Date
Globe
Wireless CPCN (1) July 22, 2002 December 24, 2030
Local Exchange Carrier CPCN (1) July 22, 2002 December 24, 2030
International Long Distance CPCN (1) July 22, 2002 December 24, 2030
Interexchange Carrier CPCN (1) February 14, 2003 December 24, 2030
VSAT CPCN (1) February 6, 1996 February 6, 2021
International Cable Landing Station & Submarine Cable System (Nasugbu, Batangas)
CPCN (1) October 19, 2007 December 24, 2030
International Cable Landing Station & Submarine Cable System (Ballesteros, Cagayan)
CPCN (1) June 29, 2010 December 24, 2030
Innove Type of
License Date Issued or Last
Extended Expiration Date
Wireless CPCN (1) December 14, 2018 January 29, 2044
Local Fixed line CPCN (1) December 14, 2018 January 29, 2044
International Long Distance CPCN (1) December 14, 2018 January 29, 2044
Interexchange Carrier CPCN (1) December 14, 2018 January 29, 2044
Bayantel Type of License
Date Issued or Last Extended
Expiration Date
Local Exchange Carrier (a) Quezon City, Malabon &
Valenzuela, all in M.M., Albay, Camarines Norte, Camarines Sur, Catanduanes, Sorsogon & Masbate, all in Bicol Region
CPCN (1)
(a) July 9, 1999
(a) July 8, 2024
(b) Manila, Caloocan, Navotas
CPCN (1) (b) May 3, 2007 (b) August 9, 2021
(c) Tacloban City, Tanauan and Palo, Leyte & Sogod, Southern Leyte
CPCN (1) (c) March 16, 2004 (c) March 15, 2029

S E C F O R M 1 7 - A 139
(d) Leyte (Abuyog, Baybay, Burauen, Carigara, Dulag, Hilongos, Isabel, Palompon & Hilaga) Eastern Samar (Guiuan & Borongan) Western Samar (Catbalogan & Basey) Southern Leyte (Maasin)
CPCN (1) (d) March 18, 2008 (d) August 9, 2021
(e) Antique, Iloilo, Bohol, Bukidnon, Misamis Occidental, Misamis, Zamboanga del Sur, Davao del Norte, Davao del Sur, Davao Oriental, Saranggani, South Cotabato and Surigao del Sur
PA (e) March 9, 1998 (e) July 25, 2006 (2)
(f) Aklan, Capiz (including Roxas City), Guimaras, Negros Occidental (including cities of Bacolod and Bago), Negros Oriental (including Dumaguete City), Cebu (including cities of Cebu, Lapu-Lapu and Mandaue), Zamboanga del Norte, Surigao del Norte (including Surigao City), Tagbilaran City, Cagayan de Oro City and Tagum City
PA (f) November 18, 2004 (f) May 1, 2006 (2)
(g) Butuan City, Agusan del Norte & Agusan del Sur
PA (g) December 14, 1998 (g) June 14, 2005 (2)
VSAT CPCN (1) January 11, 2001 January 10, 2026
International Gateway Facility CPCN (1) April 19, 1996 April 18, 2021
Trunked Mobile Radio System CPCN (1) April 2, 1998 April 1, 2023
Domestic Data and Voice Communications
CPCN (1) April 10, 2008 August 9, 2021
1Certificate of Public Convenience and Necessity. The term of a CPCN is co-terminus with the franchise term. 2 Motion for Extension of PA still pending with the NTC. No roll-out to justify the PA extension
In July 2002, the NTC issued CPCNs to Globe and Innove which allow the Company to operate respective services for a term co-terminus with the congressional franchise under RA 7229 (Globe) and RA 11151 (amending RA 7372; Innove). Globe was granted permanent licenses after having demonstrated legal, financial and technical capabilities in operating and maintaining wireless telecommunications systems, local exchange carrier services and international gateway facilities. Additionally, Globe and Innove have exceeded the 80% minimum roll-out compliance requirement for coverage of all provincial capitals, including all chartered cities within a period of seven years. 2. Trademarks Globe has the following registered trademarks in the Philippines: Globe, Globe Life Device, #LevelUpPH, #Next Level Ka Tournament, 0917, Area 917, EasyShare, EasyExtend, GG30, GG50, Globe At Home, Globe At Home Air Fiber 5G, Globe At Home Streamfest, Globe Broadband, Globe Connected Home, Globe Home Broadband, Globe MyBusiness, Globe Prism, Globe Rewards, Globe Streamwatch, Good Games, Load Up, Midnight Surf, Points Battle, Sagad Surf, Sunkissed Boracay, Supersurf, Tattoo, Tattoo Home Broadband, Tattoo@Home, and Ticket Hub. Globe also applied for the following trademarks: 917V, 917 Ventures, Elements Music Camp, Globe At Home Air, Globe at Home Air Fiber, Globe at Home Prepaid Wifi, Gomo, K-mmunity Ph, Schoor, Secret Surf, and Sulit Surf. Globe and Saga Events, Inc. own the registered trademark “Stylefestph”. Further, Globe also applied and registered the following brand names: Globe Telecom (Australia, Taiwan, Japan, Singapore, Macau, Austria, Belgium, Cyprus, Czech Republic, Denmark, Estonia, Finland, France, Germany, Great Britain, Greece, Hungary, Ireland, Italy, Latvia, Lithuania,

S E C F O R M 1 7 - A 140
Luxembourg, Malta, Netherlands, Poland, Portugal, Slovak Republic, Slovenia, Spain, Sweden, Korea, Canada, China, Saudi Arabia), Globe and Globe Life Device (Hong Kong, Taiwan, Singapore, Japan, Austria, Belgium, Cyprus, Czech Republic, Denmark, Estonia, Finland, France, Germany, Great Britain, Greece, Hungary, Ireland, Italy, Latvia, Lithuania, Luxembourg, Malta, Netherlands, Poland, Portugal, Slovak Republic, Slovenia, Spain, Sweden, Macau, Qatar, UAE, USA, Saudi Arabia), Globe GCash (Singapore, Hong Kong, United Kingdom, Taiwan, Japan, Macau, Austria, Belgium, Cyprus, Czech Republic, Denmark, Estonia, Finland, France, Germany, Great Britain, Greece, Hungary, Ireland, Italy, Latvia, Lithuania, Luxembourg, Malta, Netherlands, Poland, Portugal, Slovak Republic, Slovenia, Spain, Sweden, Qatar, Korea, UAE, Saudi Arabia, New Zealand, Ireland, Lebanon, Denmark, Sweden, Switzerland, Israel), Globe Kababayan (Singapore, Hong Kong, Taiwan, United Kingdom, Australia, Japan, Macau, USA, Saudi Arabia, Austria, Belgium, Cyprus, Czech Republic, Denmark, Estonia, Finland, France, Germany, Great Britain, Greece, Hungary, Ireland, Italy, Latvia, Lithuania, Luxembourg, Malta, Netherlands, Poland, Portugal, Slovak Republic, Slovenia, Spain, Sweden, Malaysia, UAE, Italy, Korea, Taiwan), Globe Autoload Max (Norway, Singapore, Austria, Belgium, Cyprus, Czech Republic, Denmark, Estonia, Finland, France, Germany, Great Britain, Greece, Hungary, Ireland, Italy, Latvia, Lithuania, Luxembourg, Malta, Netherlands, Poland, Portugal, Slovak Republic, Slovenia, Spain, Sweden, Japan, Hong Kong), Globe M-Commerce Hub (Taiwan, Singapore, Korea, Austria, Belgium, Cyprus, Czech Republic, Denmark, Estonia, Finland, France, Germany, Great Britain, Greece, Hungary, Ireland, Italy, Latvia, Lithuania, Luxembourg, Malta, Netherlands, Poland, Portugal, Slovak Republic, Slovenia, Spain, Sweden, Australia, Macau, Qatar, Malaysia), Muzta, and Smiley With Salakot Device (Japan, UK, Australia, Kuwait, USA, Saudi Arabia, Bahrain, UAE), Smiley with Salakot (Japan, United Kingdom, Australia, USA, Saudi Arabia, Bahrain, UAE), and Muzta (Bahrain, UAE, Canada, Qatar, Saudi Arabia, UAE), GCash Remit and Logo (Austria, Belgium, Cyprus, Czech Republic, Denmark, Estonia, Finland, France, Germany, Great Britain, Greece, Hungary, Ireland, Italy, Latvia, Lithuania, Luxembourg, Malta, Netherlands, Poland, Portugal, Slovak Republic, Slovenia, Spain, Sweden. Lebanon, Japan, Switzerland, Macau, Hong Kong, Taiwan, New Zealand, China, Japan, Israel), GCash Express and Logo (Hong Kong, Singapore, Taiwan, Malaysia), Globe Load (Austria, Belgium, Cyprus, Czech Republic, Denmark, Estonia, Finland, France, Germany, Great Britain, Greece, Hungary, Ireland, Italy, Latvia, Lithuania, Luxembourg, Malta, Netherlands, Poland, Portugal, Slovak Republic, Slovenia, Spain, Sweden, Switzerland, Macau). Globe subsidiaries and affiliates have applied/registered their respective marks with the Intellectual Property Office, namely:
a) Innove Communications, Inc. has registered the mark @Free, GoWifi, GoWifi Auto and EasySurf.
b) GXchange has the following registered trademarks GCash, GCash Remit, G-Xchange and PowerPay+. It has pending trademark applications for Cash In, GCash QR, GCash Mo na Yan! and GScore.
c) Globe Fintech Innovations, Inc. has the following registered trademarks: GPay and A Fresh Look
at Money.
d) Fuse Lending, Inc. has the following registered marks Fuse, Fuse and Logo, First Loan for Everyone, Power Payday Advance, Go Loan, Spark Loan, Instaloan, and Fuse Business Loan
3. Patents Gxchange, Inc. and UTIBA Pty Ltd. have registered the following patents in the Philippines: 1. Person-to-Person Virtual Cash Transfer Transaction Using Mobile Phones; 2. A Method of Converting Cash into Virtual Cash and Loading it to Mobile Phone Cash Account; 3. A Method of Cashless, Cardless Purchase Transaction Using Mobile Phones; and 4. A Method of Converting Virtual Cash into Cash and Deducting it to Mobile Phone Cash Account. Gxchange, Inc. and UTIBA Pty Ltd. have likewise registered the following patents in the United States: 1. Person-to-Person Virtual Cash Transfer Transaction Using Mobile Phones; and 2. A Method of Converting Virtual Cash into Cash and Deducting it to Mobile Phone Cash Account
Gxchange, Inc. and UTIBA Pty Ltd. have likewise filed the following patent applications in Indonesia, Singapore and Europe. 1. Person-to-Person Virtual Cash Transfer Transaction Using Mobile Phones; 2. A Method of Converting Cash into Virtual Cash and Loading it to Mobile Phone Cash Account;

S E C F O R M 1 7 - A 141
3. A Method of Cashless, Cardless Purchase Transaction Using Mobile Phones; and 4. A Method of Converting Virtual Cash into Cash and Deducting it to Mobile Phone Cash Account. Globe has applied the patent for “Systems and/or Methods for Authorizing and Facilitating Third-Party Withdrawals or Payment” with the Intellectual Property Office. I. Government approvals/regulations The Globe Group is regulated by the NTC under the provisions of the Public Service Act (CA 146), Executive Order (EO) 59, EO 109, and RA 7925. Under these laws, Globe is required to do the following: a) To secure a CPCN/PA from the NTC for those services it offers which are deemed regulated
services, as well as for those rates which are still deemed regulated, under RA 7925. b) To observe the regulations of the NTC on interconnection of public telecommunications networks. c) To observe (and has complied with) the provisions of EO 109 and RA 7925 which impose an
obligation to rollout 700,000 fixed lines as a condition to the grant of its provisional authorities for the cellular and international gateway services.
d) Globe remains under the supervision of the NTC for other matters stated in CA 146 and RA 7925
and pays annual supervision fees and permit fees to the NTC. On October 19, 2007, the NTC granted Globe a CPCN to operate and maintain an International Cable Landing Station and submarine cable system in Nasugbu, Batangas. On May 19, 2008, Globe Telecom, Inc. announced that the National Telecommunications Commission (NTC) has approved the assignment by its wholly-owned subsidiary Innove Communications (Innove) of its Touch Mobile (TM) consumer prepaid subscriber contracts in favor of Globe. Globe would be managing all migrated consumer mobile subscribers of TM, in addition to existing Globe subscribers in its integrated cellular network. On September 11, 2008, the NTC granted Globe a CPCN to operate and maintain an International Cable Landing Station in Ballesteros, Cagayan Province. J. Research and Development Globe incurred market research costs amounting to ₱163 million in 2019, 21% higher versus 2018 spend. K. Compliance with Environmental Laws The Globe Group complies with the Environmental Impact Statement (‘EIS’) system of the Department of Environment and Natural Resources (‘DENR’) and pays nominal filing fees required for the submission of applications for Environmental Clearance Certificates (‘ECC’) or Certificates of Non-Coverage (‘CNC’) for its cell sites and certain other facilities, as well as miscellaneous expenses incurred in the preparation of applications and the related environmental impact studies. The Globe Group does not consider these amounts material. Globe has not been subject to any significant legal or regulatory action regarding non-compliance to relevant environmental regulations. L. Employees The Globe Group has 8,048 active regular employees as of December 31, 2019, of which 4% or 299 are covered by a Collective Bargaining Agreement (CBA) through the Globe Telecom Employee’s Union (GTEU). Breakdown of employees by main category of activity from 2017 to 2019 are as follows:
Employee Type 2019 2018 2017
Rank & File, CBU 2,191 2,791 2,527

S E C F O R M 1 7 - A 142
Supervisory 3,497 2,760 2,605
Managerial 1,839 1,698 1,598
Executives 521 480 476
Total 8,048 7,729 7,206
In conformance with the Department of Labor and Employment’s (DOLE) Collective Bargaining Agreement (CBA), the Globe Telecom Employees Union-Federation of Free Workers (GTEU-FFW) remains active to pledge the right of every Ka-Globe to form a collective bargaining unit. All employees are allowed to participate in CBA and through GTEU-FFW, everyone is informed and made aware of the mandates. Globe has a long-standing, healthy, and constructive relationship with the GTEU characterized by healthy and constructive discussions and industrial peace. Both have shared goals such as enhancing productivity levels and ensuring consistent quality of service to customers across various segments. Globe and GTEU-FFW renewed their collective bargaining agreement for another 5 years, beginning 2016. This is a testament to the strong partnership built between them and the alignment in their advocacies.
M. Risk Factors The achievement of Globe’s key business objectives can be affected by a wide array of risk factors. Some of these risk factors are universal while some are unique to the telecommunications industry. The risks vary widely in occurrence and severity, some of which are beyond the company’s control. There may also be risks that are either presently unknown or not currently assessed as significant, which may later prove to be material. We aim to mitigate these exposures through appropriate RM strategies, strong internal controls and capabilities, close monitoring of risks and mitigation plans. The section below sets out the principal risk types, listed in no particular order of significance: 1. Political and Socio-Economic Risks
The growth and profitability of Globe may be influenced by the overall political and economic situation of the Philippines. Any political or geopolitical instability in the Philippines could negatively affect the country’s general economic conditions which, in turn, could adversely affect the company’s business, financial condition or results of operations, including the ability to enhance the growth of its customer base, improve its revenue base and implement its business strategies. The current administration is implementing major changes to the telecommunications industry that can positively or negatively affect the company’s business. These include:
• Pressure to improve network performance
• Sharing of network/facilities across operators
• Providing portability of mobile numbers
• Possible pressure on pricing
• Potential entry of foreign telecom players
• Potential improved LGU support
• Promise of increased infrastructure spend
• Potential changes that aim to disrupt the current industry model A regular environmental scanning exercise is performed to ensure the identification of any uncertainties arising from political and socioeconomic factors. Management is closely monitoring the shift in policies to anticipate the potential impact to the business plans as well as maintaining open communication lines with the various government sectors.
2. Financial Markets Risk
(a) Foreign Exchange Risk
Exposure to foreign exchange risks remains a risk to Globe. Foreign exchange risk results primarily from movements of the Philippine peso against the US dollar (USD) with respect to the company’s USD-denominated financial assets, liabilities, revenues and expenditures. There are no assurances that declines in the value of the Peso will not occur in the future or that the availability of foreign exchange will not be limited. Recurrence of these conditions may adversely affect Globe’s financial condition and results of operations.

S E C F O R M 1 7 - A 143
(b) Interest Rate Risk
In order to fund major expenditures, Globe has entered into various short and long-term debt obligations, which exposes the company to the risk of changes in interest rates. The company’s exposure to interest rate risk and currency risk are being managed by:
• Using a mix of fixed and variable rate debt that are meant to achieve a balance between cost and volatility.
• Entering into interest rate swaps, in which the company agrees to exchange, at specified intervals, the difference between fixed and variable interest amounts calculated by reference to an agreed upon notional principal amount.
• Using a combination of natural hedges and derivative hedging to manage foreign exchange exposure.
Globe also regularly evaluates its projected and actual cash flows and continuously assess conditions in the financial markets for opportunities to pursue fund raising activities, in case any requirements arise.
3. Industry and Operational Risks
(a) Competition Risk
(i) Traditional Competition Competition remains intense in the Philippine telecommunications industry amidst a mature mobile market and high growth data business, as current competitor seeks to regain market share with aggressive offerings. In late 2018, a 3rd player was allowed by the government to enter the Philippine telecommunications industry, selected through a bidding process spearheaded by the Department of Information and Communications Technology (DICT). These factors are seen to further heighten the competitive dynamics amidst a mature mobile market.
(ii) Alternative Competition
The competitiveness of the industry is further underscored by cheap alternatives to communication such as instant messaging, social network services and voice over internet protocol. These alternatives are also driven by the proliferation of affordable smartphones and internet-capable mobile devices.
The continued growth and development of the telecommunications industry will depend on many factors. Any significant economic, technological, or regulatory development could result in either a slowdown or growth in demand for mobile services and may impact the company’s business, revenues, and net income. These factors heighten the need to continuously expand and modernize the company’s network and IT services, thus requiring an equally heightened level of capital spending. Globe continues to assert its market position through the offering of personalized plans and attractive product/device bundles, and launching innovative products and services that are relevant and responsive to the needs of the customers and focusing on superior customer experience. The company also partners with leading providers of content, mobile messaging, social media and other popular applications in order to provide products and services that anticipate and cater to shifting customer preferences.
(b) Regulatory Risk
Globe Telecom is regulated by the National Telecommunications Commission (NTC), an attached agency of the Department of Information and Communications Technology (DICT), for its telecommunications business, and by the Securities and Exchange Commission (SEC) for other aspects of its business as well as the Philippine Stock Exchange (PSE) as one of its capital market regulators, to name a few. On the other hand, the Philippine Competition Commission (PCC) has oversight over mergers, acquisitions, and other similar transactions as it is tasked to

S E C F O R M 1 7 - A 144
effectively level the playing field among businesses and penalize anti-competitive agreements and abuse of market dominance. The introduction of new, modifications, or the inconsistent application of laws or regulations from time to time, may materially affect the operations of Globe, and ultimately the company’s earnings which could impair its ability to service debt. There is no assurance that the regulatory environment will support any increase in the company’s business and financial activity. Globe manages its regulatory risks through regular monitoring of regulatory rulings, especially those that could negatively impact its businesses, and proactive engagement with the regulators.
(c) Customer Preference and Technology Shift Risk
Globe’s ability to recognize and quickly respond to changes in customer preferences by upgrading existing infrastructure and systems may impact its competitiveness in the marketplace. Mobile data applications and the rising popularity of smartphones, mobile applications, and social media platforms as enabled by mobile and connected devices are key contributors to the explosion of data traffic. This phenomenon is putting a strain on the company’s network capacity as well as the supporting back end systems, negatively impacting customer experience. Globe’s business, product and technical teams continue to keep abreast of the latest innovations and trends in telecommunications technologies, devices and gadgets. The information and insights gathered are considered in the roadmap of future products and services and the company’s network and IT infrastructure evolution. Proper timing of investments in technology and infrastructure always consider its strategic implications, velocity of technology cycles and customer adoption. The Globe data network is continuously being enhanced by deploying new mobile and data technologies, increasing network capacity and coverage while modernizing the fixed line data infrastructure.
(d) Change Program Risk
Globe is in the process of transforming its businesses and such changes permeate into its network and IT systems and supporting processes. Crucial changes in the company’s network infrastructure are being pursued mainly to improve network quality, anticipate the surge in voice and data traffic, decrease total cost of ownership, and make the network robust enough to meet future needs. IT transformation programs are set to re-engineer the company’s IT systems and key processes to enhance its ability to deliver superior customer experience and understand what customers value, while being able to roll out products to the market in a more efficient and effective manner. Should Globe Telecom’s ambitious and complex transformation programs fail to achieve the desired outcomes, Globe could ultimately lose market share thus impacting its financial results. Globe has institutionalized the appropriate program governance organizations with Management Team oversight and accountability to ensure program risks are properly considered and managed aimed at achieving key program objectives and improving customer experience. Globe ensures that a competent program office and project organization are in place for major change programs. Supporting processes have been established to closely monitor and provide a venue for regular progress updates, alignment of efforts, discussion of critical implementation issues and challenges and help ensure successful execution of its change programs.
(e) Organizational Agility Risk
Leading the digital lifestyle for customers and diversification of Globe’s business portfolio is critical to maintain market competitiveness. Failure to drive the entire organization to quickly adapt work practices and make the right shift in skills and competencies necessary for the company to lead in the digital space and forge into adjacent spaces may lead to missed business opportunities.
Globe has initiated cultural change programs that focus on customer centricity and innovation. Opportunistic hiring of talents required for innovation and new investment areas are also carefully considered. Globe continues to build the right leadership structures and system team that will support an agile, future-ready and customer-centric organization.

S E C F O R M 1 7 - A 145
(f) Human Capital Risks
Globe is exposed to risks in staffing critical functions with competent management and technical expertise. Globe’s greatest asset is its people and the company’s success is largely dependent on its ability to attract highly skilled personnel and to retain and motivate the best employees. As new players are poised to ramp up their operations, this may result in poaching of key employees from the company’s talent pool. In line with Globe’s Purpose of treating people right, and in support of the Department of Labor and Employment’s campaign against all illegal forms of contractualization, Globe strictly monitors its accredited partners on their sustained compliance with pertinent labor laws and regulations. Various people-related programs designed to engage and motivate employees are being implemented in order to retain and attract key talents. Globe University was formally organized to address the growing competency and development needs of Globe. With the need to develop key talent imperatives, it is a significant move towards achieving key improvements in workforce capabilities and performance.
(g) Reputational Risk
Globe is recognized as one of the Philippines’ top companies providing innovative services and delivering superior customer experience while maintaining a socially responsible business. The company is exposed to reputational risks which may result from its actions or that of its competitors; indirectly due to the actions of an employee; or consequently through actions of outsourced partners, suppliers, or joint venture partners. Damage to Globe Telecom’s reputation and erosion of brand equity could also be triggered by the inability to swiftly and adequately handle negative traditional and social media sentiments on Globe Telecom’s products and services resulting from unfavorable customer experience, among others. Regular process effectiveness and efficiency reviews on existing customer-impacting processes are being conducted to identify and address existing gaps, thus minimizing exposure to reputational risks arising from problem areas. Front line staff are regularly trained to enable them to effectively handle customer cases. On the other hand, close monitoring of customers’ online sentiments is being performed to quickly detect subscriber issues being surfaced in social media and be able to manage them early on.
(h) Compliance Risks
(i) Cyber Threats The cyber security landscape is rapidly evolving and users are heavily relying on digitized information and sharing vast amounts of data across complex and inherently vulnerable networks. This exposes Globe to various forms of cyber-attacks which could result in disruption of business operations, damage to reputation, legal and regulatory fines and customer claims. New technologies and systems being installed in the name of advanced capabilities and processing efficiencies may introduce new risks which could outpace the organization’s ability to properly identify, assess and address such risks. Further, new business models that rely heavily on global digitization, use of cloud, big data, mobile devices and social media increase the organization’s exposure to cyber-attacks. Globe continues to strengthen and enhance its existing security detection, vulnerability and patch management, configuration management, identity access management, events monitoring, data loss prevention and network/end-user perimeter capabilities to ensure that cyber threats are effectively managed. As part of the company’s mission to promote the intelligent and judicious use of the internet, Globe also educates the youth to better understand the impact of their online behavior so they can be responsible digital citizens, thereby lessening cyber threats to Globe. In parallel, online security is promoted through customer education drives.

S E C F O R M 1 7 - A 146
(ii) Data Privacy
Globe, in the course of regular business, acquires personal information of its customers and retains the same either electronically or via hard copies. Existing laws require that information, especially customer information, be adequately protected against unauthorized access and or/disclosure. The risk of data leakage is high with the level of empowerment granted to in-house and outsourced employees handling sales and after sales support transactions to enable the efficient discharge of their functions. Employee awareness on data protection and loss prevention is reinforced through regular corporate communication channels. Further, employees are made accountable for maintaining the confidentiality of data handled, including disclosures and information shared in various social media platforms. Controls over processes that require handling of customers’ personal information are being tightened, coupled with enhancements in existing security capabilities to prevent compromise of customer data. A Chief Information Security Officer and Data Protection Officer was appointed to strengthen the management of risks relating to the confidentiality and integrity of customer information while ensuring compliance with Data Privacy Act of 2012 or Republic Act 10173 (DPA). Our CISO/DPO reports to our Chief Technology and Information Officer (CTIO), and acts as Chairman of the Information Security and Privacy Committee in Management as well as leads our Information Security and Data Privacy Division (ISDP). ISDP is a fully-operationalized group that focuses on Globe’s data privacy and cybersecurity matters. The CISO provides regular updates on information security and data privacy matters to the Board, through the ARPT Committee to ensure that cyber risks and technology or digital threats to the business and our customers are addressed and managed effectively.
(iii) Business disruptions
The quality and continued delivery of Globe’s services are highly dependent on its network and IT infrastructure which are vulnerable to damages caused by extreme weather disturbances, natural calamities, fire, acts of terrorism, intentional damage, malicious acts and other similar events which could negatively impact the attainment of revenue targets and the company’s reputation. Since 2012, our Business Continuity Management System (BCMS), which governs our Business Continuity and Disaster Recovery Planning, has been certified by BSI, Singapore – an internationally recognized certification body. The Globe BCMS is primarily responsible in ensuring that programs are in place for Globe to continuously improve on:
• the readiness of our employees to manage disastrous incidents;
• the ability of the organization to deliver critical products and services especially during disasters, and;
• the commitment to deliver on important legal and regulatory requirements. The company is continuously enhancing its incident and crisis management plans and capabilities and have incorporated disaster risk reduction and response objectives in its business continuity planning. Part of Globe’s Business Continuity Management Program initiatives include:
• Partnering with the Metropolitan Manila Development Authority (MMDA) and the Philippine Disaster Recovery Foundation (PDRF), to create a network of support during disasters.
• Sponsored the development of hazard maps for 54 out of 81 Philippine provinces, which will be used by Phivolcs to assist the provinces in their disaster management plans.
• Reinforced Ayala ASSIST, an app that enables Globe and other Ayala employees to easily seek assistance during disasters.
• Re-certification in Business Continuity (ISO 22301) on an enterprise-wide scale
• Reinforcing the company’s business continuity policies and best practices through various awareness drives and training programs

S E C F O R M 1 7 - A 147
(iv) Revenue leakage The telecommunications industry is inherently vulnerable to revenue leakage with the continuing innovations in telco technologies, networks and IT systems and the multitude of its service plan offerings and accompanying such advancements. The pace at which new offers are launched in the market and the speed of technological innovations being adopted by Globe, coupled with the ongoing network and IT transformation programs heightens the need to identify and plug revenue leakages becomes an even more important capability in maximizing revenues and returns. Globe strengthens its revenue assurance capabilities through the identification and embedding of appropriate revenue assurance controls into new products, services, and new systems as well as the implementation of sound controls on existing products and services. Globe is continuously improving control effectiveness, efficiency, and coverage through periodic controls review exercises, controls discovery, and review of critical revenue-impacting processes. The company has recently completed the implementation of a revenue assurance tool that would increase efficiency in its operations through automated execution of controls.
(v) Fraud
Globe runs the risk of falling victim to fraud perpetrated by unscrupulous persons or syndicates either to avail of “free” services, to take advantage of device offers or defraud its customers. With the increased complexity of technologies, network elements and IT infrastructure, new types of fraud that are more difficult to detect or combat could also arise. This risk also involves irregularities in transactions or activities executed by employees for personal gain. Globe remains committed to preventing and detecting fraud by institutionalizing processes and building capabilities that enable the early detection, investigation, resolution and enforcement of sanctions and legal options, close monitoring and timely reporting of various instances of fraudulent activities. The company has initiated various programs to equip its customers with the right and sufficient information so that they do not fall victim to fraudsters. Moreover, the company closely coordinates with law enforcement agencies to help protect customers from activities meant to defraud them. Globe implements standards and practices that remind and deter employees, who through the course of business transactions with various partners, from engaging in corrupt or unethical practices. Management has zero tolerance for such acts and have corresponding severe penalties as provided in the company’s Code of Conduct and Ethics (CoC). Globe employees, by virtue of his/her employment, are bound to uphold trust given to them by not seeking to gain any undue personal or pecuniary advantage (other than the rightful proceeds of employment) from dealings with or for and in behalf of Globe. Our employees maintain the highest standards of honesty, integrity, and professional conduct. Seeking undue financial and material advantage from transactions with Globe is a breach of trust between the employee and the company. Globe’s CoC promulgates policies governing conflict of interest, whistleblowers, unethical, and corrupt practices, among others.
N. Management of Risks Realizing the need to protect the business from losses arising from failures in internal processes, people, and systems or external events, which is an integral part of Globe’s RM responsibility, an Operational Risk Management and Business Protection (ORB) department was established. ORB’s primary objective is to provide end-to-end support for all activities under risk management, overseeing safety, environment, infrastructure hazard management, insurance, as well as enterprise business continuity management. ORB reports to the Head of Logistics and Administrative Services who directly reports to the CFO/CRO. The department is mandated to do the following:
• Provide hazard identification and risk assessment for Globe Telecom’s operations, activities, events, and infrastructure;
• Facilitate implementation of risk control and mitigation measures for safety and environmental management, in collaboration with operational and business groups;

S E C F O R M 1 7 - A 148
• Provide and facilitate risk transfer and business protection solutions through insurance or contractor liability agreements;
• Establish an effective framework for business continuity management for the organization to effectively respond to threats such as natural disasters, equipment failure, data breaches, and in effect, protect its business interests.
O. Debt Issues For details on Globe Group’s Loans Payable see Note 19 of Globe’s 2019 Consolidated Financial Statements which is part of the exhibits to this report. Corporate Developments:
• The NTC issued an advisory, ordering local telecommunication companies to move the migration date to October 6, 2019 from March 18, 2019. This was after the Bankers Association of the Philippines (BAP) and the Credit Card Association of the Philippines (CCAP) filed their respective petitions to postpone the migration to a later date to provide banks and credit card companies sufficient time to implement the necessary changes to their operations and systems.
From October 6,2019 to January 5, 2020, customers who will still incorrectly dial the old 7-digit number will hear a special announcement, saying the format has been changed to 8 digits. Globe will continue reminding its customers on the upcoming migration in October through all available channels, including SMS, email, and social media. Globe and Bayan customers may visit www.globe.com.ph/help/eight-digit-number-for-landlines-and-duo.html for more information on the migration.
• Globe Telecom has entered into a tripartite agreement with ISOC Infrastructure Inc. and Malaysia-based tower giant edotco Group Sdn. Bhd., becoming the first telco to support the common tower initiative of the Department of Information and Communications Technology (DICT). ISOC and edotco, who were the first towercos to seek vendor accreditation with Globe, will build an initial 150 sites for the company.
The DICT signed agreements with 23 tower companies with ISOC and edotco leading the pack as among the first to do so. Despite the agreements, the government has yet to release a common tower policy governing towercos in the country. The DICT targets to build at least 50,000 new common towers across the country in the next seven to ten years. The government agency also announced its recent plans to accelerate the building of 2,500 common towers in properties owned by government agencies. Telco stakeholders, however, are seeking the immediate release of the long-delayed Common Tower Policy.
• Globe Telecom, Aboitiz InfraCapital, and Frontier Tower Associates Philippines (FTAP) signed a memorandum of understanding (MOU) on July 2, 2019 to improve connectivity in Cebu, Davao, and Olongapo. The MOU, in support of the common tower initiatives of the Department of Information and Communications Technology (DICT), will explore the possibility of leasing build-to-suit sites, towers, and other passive telecommunications infrastructure and facilities.
The MOU signing between Globe and the Aboitiz-FTAP partnership came immediately after Aboitiz and FTAP signed on June 19 a cooperation agreement for the development, construction, operation, and maintenance of a common tower network. The DICT targets to roll out at least 50,000 new common towers across the country in the next seven to ten years. Recently, the government agency announced its plans to accelerate the building of 2,500 common towers in properties owned by government agencies.
• On July 22, 2019, Globe Telecom sold its interest in AFPI to Globe Fintech Innovations for a total consideration of ₱240 million. Gain on disposal of investment in AFPI was recognized as part of other income
• On September 11, 2019, the Board of Directors of Globe through its Executive Committee, approved the acquisition of 51% of Yondu Inc., equivalent to 22,950 shares for Php501 million from Xurpass Inc. and the signing of the corresponding Deed of Sale of Shares and other related definitive agreements. The transaction is consistent with Globe’s strategic imperative of developing its ICT capabilities responsive to the changing needs of its customers. Yondu’s strong

S E C F O R M 1 7 - A 149
IT core competencies combined with Globe’s digital expertise will strengthen the value proposition of products and services catered to entreprise clients.
• On September 24, 2019, Globe has signed a memorandum of understanding (MOU) with Transcend Towers Infrastructure (Philippines) Inc., a wholly owned subsidiary of American Tower Corporation, to build more towers in the Philippines. In support of the common tower initiative of the Department of Information and Communications Technology (DICT), the agreement will have Transcend Towers build an initial 150 sites for Globe in North Luzon.
• On February 8, 2019, the RA 11202 or the “Mobile Number Portability Act” was signed into law. The act allows subscribers to change their subscription plans or service providers and still keep their current mobile numbers. Moreover, no interconnection fee or charge shall be imposed for domestic calls and SMS made by a subscriber. This act shall take effect fifteen days after its publication in the Official Gazette or in any newspaper of general circulation.
Within ninety (90) days from the effectivity of the act, NTC shall coordinate with the Department of Information and Communications Technology, The National Privacy Commission, the Philippine Competition Commission, and other concerned agencies, and promulgate rules and regulations and other issuances to ensure the effective implementation of the Act. Within six (6) months from the promulgation of the rules and regulations, service providers shall comply with the provisions of the act and set up a mechanism for the purpose of implementing nationwide.
On December 26, 2019, the country's major mobile operators Globe, new player Dito Telecommunity and PLDT subsidiary Smart Communications have joined forces to put up a new company using fresh investments to enable number porting services in line with the new mobile number portability initiative of the government. This is an important first step towards the full implementation of Republic Act 11202 also known as the "Mobile Number Portability Act" ("the MNP Act"). Syniverse, the world's most connected company, was chosen by the Philippine mobile operators through a rigorous technical and commercial evaluation process, to be the mobile number portability service provider (MNPSP). The company will bring in the technical infrastructure to fulfill its primary function as clearinghouse for the telcos and ensuring smooth implementation of number porting services.
As MNPSP, Syniverse is likewise expected to fulfill all functions outlined in the implementing rules and regulations under the NTC Memorandum Circular 03-06-2019 issued in July this year. With the initial step of setting up the support mechanisms, the actual implementation of MNP will be contingent upon the completion of integration and interoperability tests of the clearinghouse facilities with the separate multi-vendor systems of the mobile operators.
For further details on the Globe’s financial condition and operations, please refer to its 2019 Consolidated Financial Statements which is incorporated herein as part of Index to Financial Statements and Supplementary Schedules. Also, for further information on Globe, please refer to its SEC17A which is available in its website www.globe.com.ph.

S E C F O R M 1 7 - A 150
Item 2. Properties Ayala Corporation Ayala Corporation owns, among others the following properties: significant area in the 4 floors of the Tower One Building located in Ayala Triangle, Ayala Avenue, Makati (which were purchased in 1995 and are used as corporate headquarters of the Company); various provincial lots relating to its business operations totaling about 1,350.95 hectares and Metro Manila lots totaling 3.36 hectares including lots and buildings for the Honda Cars Makati, Honda Cars Pasig, Honda Cars Alabang and Isuzu Alabang dealerships (which are leased to these dealerships). Certain properties are subject to certain conditions, restrictions and covenants in which the Company is compliant. ALI The following table provides summary information on ALI’s land bank as of December 31, 2019. Properties included are either wholly-owned or part of a joint venture and free of lien unless noted.
In Estates Location Hectares Outside Estates Hectares
Metro Manila 173 Metro Manila 105
Makati CBD Makati City 46 Las Pinas 84 BGC Taguig City 27 QC 9 Arca South Taguig City 21 Pasig 4 Parklinks Quezon City - Pasig City 18 Paranaque 3 Ayala Alabang Muntinlupa City 18 Makati 2 Circuit Makati Makati City 17 Muntinlupa 2 Cloverleaf Quezon City 10 Mandaluyong 1 Vertis North Quezon City 7 Manila 0.3 The Junction Place Quezon City 6 Pasay 0.1 Southpark District Muntinlupa City 3 Luzon 5,395 Luzon 4,578
Nuvali Sta. Rosa, Laguna 1,480 Cavite 2,059 Alviera Porac, Pampanga 1,302 Laguna 985 Altaraza San Jose Del Monte, Bulacan 869 Batangas 844 Lio El Nido, Palawan 867 Bulacan 239 Vermosa Imus, Cavite 407 Pampanga 210 Cresendo Tarlac City, Tarlac 281 Bataan 160 Broadfield Binan, Laguna 160 Quezon 46 Evo City Kawit, Cavite 29 Camarines Sur 17 Rizal 15 Cagayan – Tuguegarao 2 Nueva Ecija 2 Visayas 996 Visayas 210
Sicogon Island Resort Iloilo 810 Cebu 181 North Point Talisay, Negros Occidental 119 Iloilo 19 Cebu Park District Cebu City, Cebu 33 Negros Occidental 11 Gatewalk Central Mandaue, Cebu 13 Seagrove Mactan Island, Cebu 12 Atria Park District Mandurriao, Iloilo 10 Capitol Central Talisay, Negros Occidental 0.4 Mindanao 235 Mindanao 501
Habini Bay Laguindingan, Misamis Oriental 200 Misamis Oriental 274 Azuela Cove Davao City, Davao del Sur 22 Davao del Sur 227 Abreeza Davao City, Davao del Sur 9
Centrio Cagayan de Oro, Misamis Oriental
3
2019 Land Bank: 12,192 6,798 5,394
Leased Properties The Company has an existing contract with BCDA to develop, under a lease agreement a mall with an estimated gross leasable area of 152,000 square meters on a 9.8-hectare lot inside Fort Bonifacio. The lease agreement covers 25 years, renewable for another 25 years subject to reappraisal of the lot at market value. The annual fixed lease rental amounts to P106.5 million while the variable rent ranges from 5% to 20% of gross revenues. Subsequently, the Company transferred its rights and obligations granted to or imposed under the lease agreement to SSECC, a subsidiary, in exchange for equity.

S E C F O R M 1 7 - A 151
On January 28, 2011, a notice was given to the Company for the P4.0 billion development of a 7.4-hectare lot at the University of the Philippines’ Diliman East Campus, also known as the UP Integrated School, along Katipunan Avenue, Quezon City. The Company signed a 25-year lease contract for the property last June 22, 2011, with an option to renew 58,000 square meters for another 25 years by mutual agreement. The project involves the construction of a retail establishment with 63,000 square meters of available gross leasable area and a combination of Headquarter-and-BPO- type buildings with an estimated 8,000 square meters of office space. (For the complete list of leased properties, please refer to Audited FS of ALI) Rental Properties The Company’s properties for lease are largely shopping centers, office buildings and hotels and resorts. As of December 31, 2019, rental revenues from these properties amount to P39.3 billion or 23% consolidated revenues, 13% higher than P34.9 billion recorded in 2018. Property Acquisitions With 12,192 hectares in its land bank as of December 31, 2019, Ayala Land believes that it has sufficient properties for development in next 25 years. Nevertheless, the Company continues to seek new opportunities for additional, large-scale, master-planned developments in order to replenish its inventory and provide investors with an entry point into attractive long-term value propositions. The focus is on acquiring key sites in the Mega Manila area and other geographies with progressive economies that offer attractive potential and where projected value appreciation will be fastest. On July 19, 2019, AyalaLand Logistics Holdings, Corp. (ALLHC), formerly Prime Orion Philippines, Inc. acquired 100% ownership of Unity Realty & Development Corporation (URDC). URDC owns a 192-hectare property in Mabalacat City, Pampanga which will be developed into an industrial park.
On May 15, 2018, Ayala Land, Inc. (“ALI”) entered into a Memorandum of Understanding with Green Square Properties Corporation (“GSPC”) and Green Circle Properties and Resources, Inc. (“GCPRI”) on May 11, 2018 for the formation of a Joint-Venture Company (“JVC”) that will own and develop 27,852 hectares of land (“the Properties”), specifically located in Dingalan, Aurora and General Nakar, Province of Quezon. ALI will own 51%, and GSPC and GCPRI will jointly own 49% of the JVC. On April 4, 2018, Ayala Land, Inc. (ALI) signed a Deed of Absolute Sale with Central Azucarera de Tarlac, Inc. for the acquisition of several parcels of land with an aggregate area of approximately 290 hectares located in Barangay Central, City of Tarlac, Province of Tarlac. On February 20, 2018, the Philippine Competition Commission (PCC) approved the setting up of a joint venture between the Company and Royal Asia Land, Inc. to acquire, own, and develop a 936-hectare commercial and residential project in Silang and Carmona, Cavite. Both firms will own 50% equity in the joint venture vehicle while Royal Asia Land will receive a consultation fee of 2% of the joint venture firm's gross revenue for its participation in the planning and development of the property. ALI, meanwhile, will develop and market the project and receive a management fee of 12% and sales and marketing fee of 5% of the gross revenue. The PCC has deemed that the transaction does not result in a substantial lessening of competition because it will not have a structural effect on the market.
In June 2015, ALI, through SM-ALI Group consortium, participated and won in the bidding for Lot No. 8-B-1, containing an area of 263,384 sqm, which is a portion of Cebu City-owned lot located at the South Road Properties, Cebu City covered by Transfer Certificate of Title No. 107-2011000963 (the “Property”). SM-ALI Group consortium is a consortium among SM Prime Holdings, Inc. (“SM”), Ayala Land, and Cebu Holdings, Inc. (“CHI”, together with ALI collectively referred to as the “ALI Group”). The SM-ALI Group will co-develop the property pursuant to a joint master plan. In April 2015, ALI purchased all of the 8.2 million common shares of Aegis PeopleSupport Realty Corporation amounting to P435 million. Aegis PeopleSupport Realty Corporation is a PEZA-registered entity and the owner of Aegis building along Villa Street, Cebu IT Park, Lahug, Cebu City. The building is a certified LEED-Gold Office with a gross leasable area of 18,092 sqm and is largely occupied by Teleperformance under a long-term lease. On February 6, 2015, ALI purchased the combined remaining interest of Allante Realty and Development Corporation (Allante) and DBH, Inc. (DBH) in North Triangle Depot Commercial

S E C F O R M 1 7 - A 152
Corporation (NTDCC) consisting of 167,548 common shares and 703,904 preferred shares amounting to P229 million. This brings ALIC) consisting of 167,548 common shares and 703,904 total outstanding capital stock of NTDCC. In January 2014, ALI entered and signed into a 50-50% joint venture agreement with AboitizLand, Inc. for the development of a 15-hectare mixed-use community in Mandaue City, Cebu. The first project of this joint venture will involve the construction of a mall and a residential condominium unit with an estimated initial cost of P3 billion. On November 23, 2013, ALI, through its wholly-owned subsidiary, Ayala Hotels and Resorts Corp, (AHRC) signed an agreement to acquire 100% interest in Asian Conservation Company, Inc. (ACCI) which effectively consolidates the remaining 40% interest in Ten Knots Development Corp. (TKDC) and Ten Knots Philippines Inc. (TKPI) (60%-owned subsidiary of the Company prior to this acquisition). The agreement resulted in the Company effectively obtaining 100% interest in TKPI and TKDC. On April 16, 2013, ALI entered into a Sale and Purchase Agreement (SPA) with Global International Technologies Inc. (GITI) to acquire the latter’s 32% interest in ALI Property Partners Co. (APPCo) for P3.52 billion. GITI is a 100% owned company of the Goldman Sachs Group Inc. The acquisition increased ALI’s stake in APPCo from 68% to 100%. APPCo owns BPO buildings in Makati, Quezon City and Laguna with a total gross leasable area of around 230,000 sqm. The carrying amount of the non-controlling interest is reduced to nil as APPCo became wholly owned by the Company. The difference between the fair value of the consideration paid and the amount by which the non-controlling interest is adjusted is recognized in equity attributable to the Company amounting to P2,722.6 million. Mortgage, Lien or Encumbrance over Properties The Company has certain properties in Makati City that are mortgaged with BPI in compliance with BSP rules on directors, officers, stockholders and related interests.
MWC MWC Group has various properties across the Philippines which are generally used in its provision of water, integrated used water, sewerage and sanitation, distribution services, pipeworks and management services. MWC Group’s properties are either company-owned or are required to be turned over to grantors of MWC Group’s concession agreements or joint venture agreements. Property, Plant and Equipment Major property, plant and equipment of MWC Group are as follows:
Locations Types of Assets
Metro Manila, Bataan, Batangas Bicol, Bulacan, Cavite, Laguna Nueva Ecija, Pampanga, Quezon Rizal, Cebu, Iloilo, Negros Occidental, Davao
Water service connection Water network Wells and facilities Distribution reservoir and boosters Transmission and distribution mainline Sewer facilities Sewer network
Zamboanga
Asset management and leak detection tool
Metro Manila Water purification and bottling facilities
Assets Held in Trust under MWC Group’s Concession or Joint Venture Agreements MWSS MWC was granted the right to operate, maintain in good working order, repair, decommission and refurbish the movable property required to provide the water and sewerage services under the Concession Agreement. The legal title to all movable property in existence at the Commencement Date, however, shall be retained by MWSS and upon expiration of the useful life of any such movable property as may be determined by the Parent Company, such movable property shall be returned to MWSS in its then-current condition at no charge to MWSS or the Parent Company. The Concession Agreement also provides for the Concessionaires to have equal access to MWSS facilities involved in the provision of water supply and sewerage services in both the East and West
S E C F O R M 1 7 - A 153
Zones including, but not limited to, the MWSS management information system, billing system, telemetry system, central control room and central records. PGL Laguna Water was granted the right to manage, occupy, operate, repair, maintain, decommission and refurbish the property required to provide water services under its concession agreement with PGL. The legal title of all property in existence at the commencement date shall be retained by PGL. Upon expiration of the useful life of any such property as may be determined by Laguna Water, such property shall be returned to PGL in its then condition at no charge to PGL or Laguna Water. TIEZA Boracay Water was granted the right to operate, maintain in good working order, repair, decommission and refurbish all fixed and movable property (except retained assets) required to provide the water and sewerage services under its concession agreement with TIEZA. The legal title to all these assets in existence at the commencement date, however, shall be retained by TIEZA and upon expiration of the useful life of such assets as may be determined by Boracay Water, such assets shall be returned to TIEZA in its then-current condition at no charge to TIEZA or Boracay Water. CDC Clark Water was granted the right to finance, design and construct new facilities and to manage, exclusively possess, occupy, operate, repair, maintain, decommission, and refurbish all facilities, except private deepwells, to provide and manage the water and wastewater-related services in the CFZ. OWD On October 12, 2017, Obando Water was granted the right to manage, operate, maintain, repair, refurbish and improve, expand and as appropriate, decommission all fixed and movable assets, including movable property but excluding retained assets, required to provide water delivery and sanitation services in the Municipality of Obando. Legal title to all facilities (including any fixed assets resulting from the exercise of rights and powers), other than new assets contributed by Obando Water, shall remain with OWD. CWD On October 23, 2017, Calasiao Water was granted the right to develop, manage, operate, maintain, repair, refurbish and improve, expand, and as appropriate, decommission all fixed and movable assets, including movable property but excluding retained assets, required to provide water delivery and sanitation services in the Municipality of Calasiao. Legal title to all facilities (including any fixed assets resulting from the exercise of rights and powers), other than new assets contributed by Calasiao Water, shall remain with CWD. PAGWAD On January 21, 2019, Laguna Water was granted the right to operate, finance, maintain, repair, improve, expand, renew, and as appropriate, decommission all fixed and movable assets, including movable property but excluding retained assets, required and exclusively used to provide water delivery and sanitation services in the service area of PAGWAD. TnWD On February 4, 2019, South Luzon Water was granted the right to operate, maintain, repair, improve, expand, renew, and as appropriate, decommission all fixed and movable assets, including movable property but excluding retained assets, required to provide water supply and sanitation services in the service area of TnWD. BuWD On June 14, 2019, Bulakan Water was granted the right to operate, maintain, repair, improve, expand, renew, and as appropriate, decommission all fixed and movable assets, including movable property but excluding retained assets, required to provide water delivery and sanitation services in the service area of BuWD. LWD On July 3, 2019, Aqua Centro was granted the right to operate, maintain, repair, improve, expand, renew, and as appropriate, decommission all fixed and movable assets, including movable property but excluding retained assets, required to provide water supply in the service area of LWD. CCWD On July 3, 2019, Calbayog Water was granted the right to operate, maintain, repair, improve, expand, renew, and as appropriate, decommission all fixed and movable assets, including movable property but

S E C F O R M 1 7 - A 154
excluding retained assets, required to provide water supply and sanitation services in the service area of CCWD. Leases On January 1, 2019, MWC Group adopted PFRS 16, Leases, which requires a lessee, at the commencement date of a lease, to recognize a liability to make lease payments (i.e., the lease liability) and an asset representing the right to use the underlying asset during the lease term (i.e., the right-of-use asset). MWC leases office space and storage and plant facilities wherein it is the lessee. Further details of the MWC Group’s property, plant and equipment, assets held in trust and leases are in Notes 1, 9, 23 and 28 of its Audited Consolidated Financial Statements. IMI IMI has production facilities in the Philippines (Laguna, Cavite and Taguig), China (Shenzhen, Jiaxing, Chengdu, and Suzhou), Bulgaria, Czech Republic, Germany, Mexico and the UK. It also has a prototyping and NPI facility located in Tustin, California. Engineering and design centers, on the other hand, are located in the Philippines, Singapore, China, United States, Bulgaria, Czech Republic, and Germany. IMI also has a global network of sales and logistics offices in Asia, North America and Europe. IMI’s global facilities and capabilities of each location as of December 31, 2019 are shown below:
Location Floor Area
(square meters) Capabilities
Manufacturing Sites
Philippines-Laguna (2 sites)
96,182 ▪ 31 SMT lines, 2 FC lines ▪ 5 COB/COF lines ▪ Box build to Complex Equipment manufacturing ▪ LVHM, HVLM ▪ Solder Wave, Potting, Al & AG W/B ▪ Protective Coating ▪ ICT, FCT, AOI, RF Testing ▪ Design & Development ▪ Test & System Development ▪ Cleanroom to class 100 ▪ Low Pressure Molding (Overmold) ▪ Precision Metals/Machining
Philippines-Cavite 2,350 ▪ 3 SMT lines ▪ Box Build ▪ System Integration ▪ PTH, Solder Wave ▪ ICT, FCT, AOI ▪ 3D X-ray ▪ LVHM
Philippines-PSi Laguna 9,858 ▪ Power Component Discrete Packaging, e.g., 2L,3L,4L TO-247, 3L TO252, 2L,3L TO-220
▪ Silicon Carbide and Gallium Nitride Packaging ▪ Ag Sintering Process ▪ Diversified Packaging - from Low to High Power
and Small to Large Outline ▪ R&D line/ Captive Lines for Power QFN and
Modules ▪ Customized Power Packaging Requirements ▪ Low/ Med Power Discrete Packaging and
Processes including Au Wire Bonding ▪ Al Ribbon, Cu Clip interconnect ▪ 3D Packaging, MCM, High Reliability OFN
Packages: 3 x 3 mm,3.3x3.3 mm, 4x5 mm, 5x6mm, 6x5mm 8x8 mm at 1 mm to 1.5 mm package height
China-Pingshan 29,340 ▪ 17 SMT lines, 1 COB line ▪ Box Build ▪ PTH, Solder Wave ▪ POP, Auto Pin Insertion ▪ Potting, Conformal coating and Burn-in ▪ ICT, FCT, AOI, RF Testing ▪ Test & System Development ▪ Design & Development

S E C F O R M 1 7 - A 155
▪ LVHM, HVLM
China-Kuichong 23,524 ▪ 21 SMT lines ▪ Box Build ▪ PTH, Auto Pin Insertion, Solder Wave ▪ ICT, FCT, AOI, SPI, RF Testing ▪ Test & System Development ▪ LVHM, HVLM ▪ X-RAY 3D testing, RoHS screening instrument,
BGA rework ▪ Burn-in test for high-end power supply, Thermal
cycle test, Vibration test. ▪ Conformal Coating, Potting, PCB router, Underfill ▪ Bar-code tracking system
China-Jiaxing 18,452 ▪ 11 SMT lines ▪ Vapor Phase Vacuum Reflow, SMD Odd shape
Component Auto Mount ▪ Box Build (w/ Automated Customized Assembly
Line) ▪ PTH, Auto Pin Insertion, Solder Wave, Selective
Solder Wave ▪ Full Auto Selective Conformal Coating Line and
CC AOI ▪ Ultrasonic welding and lamination ▪ Plastic injection (180T/300T press) ▪ SPI, 2D & 3D AOI, ICT, FCT, 3D X-ray, Run-in ▪ Test & System Development ▪ HVLM
China-Chengdu 7,500 ▪ 6 SMT lines ▪ Box Build ▪ PTH, Auto Pin Insertion, BGA, X-Ray ▪ Solder Wave ▪ Automated Conformal Coating ▪ ICT, FCT, AOI ▪ HVLM / LVHM ▪ Test Development
USA-Tustin, CA* 1,184 ▪ 2 SMT prototyping lines ▪ Engineering Development ▪ Prototype Manufacturing Center ▪ Precision Assembly ▪ SMT, COB FCOF ▪ Box build
Botevgrad, Bulgaria (1 sites) Sofia, Bulgaria (1 site) Niš, Serbia (1 site)
115, 416
50,000
▪ Bulgaria - 15 SMT lines ▪ Serbia – 6 SMT lines ▪ Box build ▪ PCB Assembly and Testing ▪ PTH, Auto Pin Insertion, Solder Wave ▪ Protective Coating ▪ Cabling ▪ ICT, FCT, AOI ▪ Test & System Development ▪ Design & Development ▪ Plastic Injection Embedded Toolshop ▪ Overmolding ▪ Metrology & laboratory ▪ Chip on board ▪ Tooling ▪ Automation
El Salto, Guadalajara, Mexico (2 sites)
25,000 ▪ 9 SMT lines ▪ 40 Plastic Injection Machines (50-1,600T)
including Overmolding ▪ Box build (w/ Automated Customized Assembly
Line) ▪ PTH, Auto Pin Insertion, Solder Wave, Selective
Solder Wave ▪ Full Auto Selective Conformal Coating Line and
CC AOI, Automated potting ▪ SPI, 2D & 3D AOI, ICT, FCT, 3D X-Ray ▪ Embedded Toolshop ▪ Test & System Development
Třemošná, Plzeňská, Czech Republic
7,740 ▪ 6 SMT lines ▪ 2 Pin Insertion

S E C F O R M 1 7 - A 156
▪ 3 Wave soldering ▪ 2 Selective soldering ▪ 3 Selective coating ▪ ICT, FCT, AOI (SMT, CC) ▪ Mechanical Assembly ▪ 4 Automated line ▪ Further customized assembly line
Nuremberg, Germany (VIA) VIA optronics GmbH
4,268 ▪ VIA bond plus qualification ▪ Bonding material development ▪ Manual line, mainly lower quantity projects ▪ Prototype 84Inch ▪ 2 clear rooms (ISO class 6 & ISO class 7) ▪ ESD control ▪ Engineering, prototyping and production process
improvement ▪ Test & system development (electrical) ▪ Optical test labor (mainly for display evaluation)
Suzhou, China (VIA) VIA optronics Suzhou
9,750 ▪ Semi autoline and full autoline ▪ Large size bonding in MaxVu II ▪ Touch capabilities, ACF process ▪ Curved bonding & bonding to plastic cover
Shiga, Japan (VIA) (2 sites) VTS-Touchsensor Co., Ltd
10,000 ▪ Metal Mesh Sensor on roll ▪ Customized design ▪ 100µm/50µm Film thickness ▪ Up to 55“ VTS internal ▪ Up to 85“ through external partners
UK-Hook (STI) 5,946 ▪ 3 high-speed ASM Siplace SMT Lines (2.4m components/day)
▪ High Reliability PCB Assembly & Box Build
▪ Full Test facilities
▪ Dedicated prototype facility with 2 flexible Mydata lines
▪ Special processes & full repair and rework facility
▪ Clean Room, NPI, RF Screened Room
UK-Poynton (STI) 5,481 ▪ Manufacturer of highly secure satellite communications equipment (under long term Airbus DS contract)
▪ Manufacturer of specialist amplifiers
▪ Specialist spares and repairs
▪ Full rack wiring and integration
▪ Specialist test facility – RF Testing, Anechoic Chamber, EMC Chamber & Moog 6 Degree of Freedom Motion Bed
▪ Complex Wiring & Heavy Metalwork
▪ Advanced Box Build
▪ AS9100-D
Cebu, Phils (STI) 2,601 ▪ 3 high-speed placement systems (6m components/day capacity)
▪ High volume PCB Assembly and Box Build
▪ Equipment and operational standards fully compatible with Hook manufacturing site
▪ IP protection and full product traceability guaranteed
Total Manufacturing Space 424,592
Sales and Marketing Support
Hong Kong* 300 Procurement, marketing and supply chain support
Japan* 110 Sales Support
Total Support Space 410
Total 425,002
Further details of the IMI Group’s property, plant and equipment and lease commitments are in Notes 3, 10 and 30 of its Audited Consolidated Financial Statements.
BPI

S E C F O R M 1 7 - A 157
In view of the planned re-development of the BPI Head Office building located at 6768 Ayala Avenue, Makati City, BPI’s executive office and select business and support units have temporarily relocated to the Ayala North Exchange Tower 1, Ayala Avenue corner Salcedo St., Legaspi Village, Makati City and BPI Buendia Center, located at Sen. Gil J. Puyat Avenue, Makati City. The remaining business and support units have also temporarily relocated to various other sites in Makati, San Juan, Quezon City, and Muntinlupa. Meanwhile, BFSB’s Head Office remains located at BFB Center, Paseo De Roxas, corner Dela Rosa St., Makati City. Of the Bank’s 867 local branches, 705 operate as BPI branches and 162 as BFSB branches; 458 located in the National Capital Region and 409 in the provincial areas. These offices and branches are maintained in good condition for the benefit of both the employees and the transacting public. The Bank enforces standards for branch facade, layout, number and types of equipment and upkeep of the premises. As it adjusts to the needs of its customers, the Bank also continuously reconfigures the mix of its traditional branches, kiosk branches, and branch-lite units, while complemented by its digital channels. BPI (as lessee) has various lease agreements which mainly pertain to branch premises and equipment that are renewable under certain terms and conditions. Rental contracts are typically made for fixed periods of 4 to 6 years. On January 1, 2019, the Bank adopted PFRS 16: Leases which requires recognition of both right-of-use assets and lease liability arising from long-term leases. As of December 31, 2019, right-of-use assets and lease liabilities amounted to P7,787 million and P7,856 million, respectively. Prior to January 1, 2019, the Bank’s lease contracts were accounted for as operating leases following the provisions of PAS 17. Total lease expense for 2018 for BPI and its subsidiaries amounted to P1,809 million. Further details pertaining to leases under PFRS 16 and PAS 17 and impact of initial adoption of PFRS 16 are reflected in Notes 20 and 29 of the 2019 Audited Financial Statements which is part of the exhibit to this report. Globe Globe Telecom’s Corporate Office is located at The Globe Tower, 32nd Street corner 7th Avenue, Bonifacio Global City, Taguig. Globe also owns several floors of condominium corporation Pioneer Highlands Towers 1 and 2, located at Pioneer Street in Mandaluyong City. In addition, the Company also owns host exchanges in the following areas: Bacoor, Batangas, Ermita, Iligan, Makati, Mandaluyong, Marikina, Cubao-Aurora, among others. The Company leases office spaces in W City Center, located at 7th Avenue corner 30th Street, Bonifacio Global City, Taguig, for its Network Technical Group. It also leases office spaces in Limketkai Gateway Tower located in Cagayan de Oro City and in Abreeza Technohub located in Davao City. It also leases the space for most of its Globe Stores, as well as the Company’s base stations and cell sites scattered throughout the Philippines. Globe’s existing business centers and cell sites located in strategic locations all over the country are generally in good condition and are covered by specific lease agreements with various lease payments, expiration periods and renewal options. As the Company continues to expand its network, Globe intends to lease more spaces for additional cell sites, stores, and support facilities with lease agreements, payments, expiration periods and renewal options that are undeterminable at this time. For more information on the Globe’s properties and equipment and lease commitments see Notes 3, 11 and 13 of Globe’s 2019 Consolidated Financial Statements which is part of the exhibits to this report).

S E C F O R M 1 7 - A 158
Item 3. Legal Proceedings Except as disclosed herein or in the Definitive Information Statements (DIS) of the Company or its subsidiaries or associates and joint ventures which are themselves public companies or as has been otherwise publicly disclosed, there are no material legal proceedings, bankruptcy petition, conviction by final judgment, order, judgment or decree or any violation of a securities or commodities law for the past five years to which the Company or any of its subsidiaries or associates and joint ventures or its directors or executive officers is a party or of which any of its material properties is subject in any court or administrative government agency. The Company’s DIS is available at its website www.ayala.com.ph. In any event, below are the significant legal proceedings involving the Company’s subsidiaries, associates and joint ventures: ALI As of December 31, 2019, ALI, its subsidiaries, and its affiliates, are not involved in any litigation regarding an event which occurred during the past five (5) years that they consider material. However, there are certain litigation ALI is involved in which it considers material, and though the events giving rise to the said litigation occurred beyond the five (5) year period, the same are still unresolved, as follows: Las Piñas Property
Certain individuals and entities have claimed an interest in ALI’s properties located in Las Piñas, Metro Manila.
Prior to purchasing the aforesaid properties, ALI conducted an investigation of titles to the properties and had no notice of any title or claim that was superior to the titles purchased by ALI. ALI traced its titles to their original certificates of title and ALI believes that it has established its superior ownership position over said parcels of land. ALI has assessed these adverse claims and believes that its titles are in general superior to the purported titles or other evidence of alleged ownership of these claimants. On this basis, beginning October 1993, ALI filed petitions in the Regional Trial Court of Makati and Las Piñas for quieting of title to nullify the purported titles or claims of these adverse claimants. These cases are at various stages of trial and appeal. Some of these cases have been decided by the Supreme Court (“SC”). These include decisions affirming the title of ALI to some of these properties, which have been developed and offered for sale to the public as Sonera, Ayala Southvale. The SC issued a decision adverse to ALI’s title over these properties dated 26 July 2017 and denied ALI’s motions for reconsideration.
Ayala Property Management Corp.(APMC)
As a result of the explosion which occurred on October 19, 2007 at the basement of the Makati Supermarket Building, the Philippine National Police has filed a complaint with the Department of Justice (“DOJ”) and recommended the prosecution of certain officers/employees of Makati Supermarket Corporation, the owner of the building, as well as some employees of ALI’s subsidiary, APMC, among other individuals, for criminal negligence. In a Joint Resolution dated April 23, 2008, the DOJ special panel of prosecutors ruled that there was no probable cause to prosecute the APMC employees for criminal negligence. This was affirmed by the DOJ Secretary in a Resolution dated November 17, 2008. A Motion for Reconsideration was filed by the Philippine National Police which remains pending with the DOJ. To date, no civil case has been filed by any of the victims of the incident.
ALI has made no allowance in respect of such actual or threatened litigation expenses. MWC MWC is presently involved in the following cases: 1. Manila Water Company, Inc. vs. The Republic of the Philippines
In the Matter of the Notice of Arbitration to the Republic of the Philippines Arbitration under the United Nations Commission on International Trade Law ("UNCITRAL") Rules (1976)

S E C F O R M 1 7 - A 159
Permanent Court of Arbitration On April 23, 2015, MWC served on the Republic of the Philippines (the "Republic"), through the Department of Finance, its Notice of Claim of even date demanding that the Republic indemnify MWC in accordance with the indemnity clauses in the Republic’s Letter Undertaking dated July 31, 1997 and the Letter Undertaking dated October 19, 2009. On November 29, 2019, MWC received the Award rendered by the Arbitral Tribunal. Said Award ruled that MWC has a right to indemnification for actual losses suffered by it on account of the Republic’s breach of its obligation. The Tribunal ordered the Republic to indemnify MWC the amount of PHP7.39 billion, representing actual losses it suffered from June 1, 2015 until November 22, 2019, and to pay 100% of the amounts paid by MWC to the Permanent Court of Arbitration, and 85% of MWC’s other claimed costs. In December 2019, MWC publicly disclosed that it will not collect the monetary claims adjudged by the Tribunal in its favor. 2. Manila Water Company, Inc. and Maynilad Water Services, Inc. vs. Hon. Borbe, et al.
CBAA Case No. L-69 Central Board of Assessment Appeals ("Central Board")
This is an appeal from the denial by the Local Board of Assessment Appeals of Bulacan Province (the "Local Board") of MWC’s (and Maynilad Water Services, Inc.’s [Maynilad]) appeal from the Notice of Assessment and Notice of Demand for Payment of Real Property Tax in the amount of PHP357,110,945 made by the Municipal Assessor of Norzagaray, Bulacan. MWC is being assessed for half of the amount. In a letter dated April 3, 2008, the Municipal Treasurer of Norzagaray and the Provincial Treasurer of the Province of Bulacan, informed both the Concessionaires (MWC and Maynilad) that their total real property tax accountabilities have reached PHP648,777,944.60 as of December 31, 2007. This amount, if paid by the Concessionaires, will ultimately be charged to the customers as part of the water tariff rate. The Concessionaires (and the MWSS, which intervened as a party in the case) are thus contesting the legality of the tax on a number of grounds, including the fact that the properties subject of the assessment are owned by MWSS, which is both a government-owned and controlled corporation and an instrumentality of the National Government exempt from taxation under the Local Government Code. The Central Board conducted a hearing on June 25, 2009. In the said hearing, the parties were given the opportunity and time to exchange pleadings regarding a motion for reconsideration filed by the Municipality of Norzagaray, Bulacan to have the case remanded to and heard by the Local Board rather than by the Central Board. MWC and Maynilad have already concluded presentation of their respective evidence and witnesses, while MWSS waived its right to present evidence. On August 12, 2015, the newly constituted members of the Central Board's Panel conducted an ocular inspection of the subject properties. On September 17, 2015, the Province of Bulacan presented its first witness, Ms. Gloria P. Sta. Maria, the former Municipal Assessor of Norzagaray, Bulacan. MWC, Maynilad and MWSS have completed their cross-examination of Ms. Sta. Maria. In an Order dated July 15, 2016, the Central Board denied the motion for reconsideration of the Municipality of Norzagaray, Bulacan for which it filed a Petition for Certiorari with the Court of Tax Appeals (CTA) on August 24, 2016. In compliance with the directive of the CTA, MWC filed a Comment dated January 3, 2017. MWSS and Maynilad have likewise filed their respective Comments. On January 31, 2017, the CTA requested the parties to file their respective memoranda. MWC filed its Memorandum on March 27, 2017. Maynilad filed its Memorandum dated March 16, 2017 while the Office of the Solicitor General (OSG) filed its Memorandum last March 29, 2017. On May 10, 2018, the CTA rendered a Decision denying the Petition for Certiorari finding that there was no grave abuse of discretion on the part of the Central Board. At present, MWC has not received any motion for reconsideration or appeal from the Municipality of Norzagaray, Bulacan of the said Decision. To date, this case remains pending.

S E C F O R M 1 7 - A 160
3. Manila Water Company, Inc. vs. The Regional Director, Environmental Management
Bureau- National Capital Region, et al. G.R. No. 206823 (DENR-PAB Case No. NCR-00794-09, CA-G.R. No. 112023), Supreme Court
This case arose from a complaint filed by the OIC Regional Director Roberto D. Sheen of the Environmental Management Bureau-National Capital Region (EMB-NCR) before the Pollution Adjudication Board (PAB) against MWC, Maynilad and the MWSS for alleged violation of R.A. No. 9275 (Philippine Clean Water Act of 2004, or “CWA”), particularly the five-year deadline imposed in Section 8 thereof for connecting the existing sewage line found in all subdivisions, condominiums, commercial centers, hotels, sports and recreational facilities, hospitals, market places, public buildings, industrial complex and other similar establishments including households, to an available sewerage system. Two (2) similar complaints against Maynilad and MWSS were consolidated with this case. On April 22, 2009, the PAB, through the Department of Environment and Natural Resources ("DENR") Secretary and Chair Jose L. Atienza, Jr., issued a Notice of Violation finding MWC, Maynilad and MWSS to have committed the aforesaid violation of the CWA. Subsequently, a Technical Conference was scheduled on May 5, 2009. In the said Technical Conference, MWC, MWSS and Maynilad explained to the PAB their respective positions and it was established that DENR has a great role to play to compel people to connect to existing sewage lines and those that are yet to be established by MWC and Maynilad. In addition to the explanations made by MWC during the Technical Conference, MWC together with MWSS and Maynilad wrote a letter dated May 25, 2009 and addressed to the respondent Secretary where they outlined their position on the matter. In response to the May 25, 2009 letter, the OIC Regional Director for NCR, the Regional Director of Region IV-A and the Regional Director of EMB Region III submitted their respective Comments. MWC thereafter submitted its letter dated July 13, 2009 to the PAB where it detailed its compliance with the provisions of the CWA and reiterated its position that the continuing compliance should be within the context of MWC’s Concession Agreement with MWSS. Despite the explanations of MWC, the PAB issued an Order dated October 7, 2009 which found MWC, Maynilad and MWSS to have violated the CWA. MWC filed its Motion for Reconsideration dated October 22, 2009 which the PAB denied in an Order dated December 2, 2009. Hence, MWC filed its Petition for Review dated December 21, 2009 with the Court of Appeals. MWC thereafter filed an amended Petition for Review dated January 25, 2010. In a Decision dated August 14, 2012, the Court of Appeals denied MWC’s Petition for Review and on September 26, 2012, MWC filed a Motion for Reconsideration of the Court of Appeals’ Decision. On April 29, 2013, MWC received the Resolution dated April 11, 2013 of the Court of Appeals, denying its Motion for Reconsideration. MWC filed its appeal from the Decision and Resolution of the Court of Appeals in the form of a Petition for Review on Certiorari with the Supreme Court on May 29, 2013. In this Petition, MWC reinforced its argument that it did not violate Section 8 of the CWA as it was able to connect existing sewage lines to available sewage facilities, contrary to the findings of the Court of Appeals. In a Decision dated August 6, 2019, the Supreme Court ruled against MWC and held it jointly and severally liable with MWSS for PHP921,464,184 and a fine of PHP322,102 per day until full compliance with Section 8 of the CWA. On October 2, 2019, MWC timely filed a Motion for Reconsideration raising, among others, the following arguments: (a) MWC is compliant with its obligations and responsibilities under Section 8 of the CWA; (b) in MMDA vs. Concerned Citizens of Manila Bay (2011), the Supreme Court ruled that MWC had until 2037 to complete the obligations imposed by MWC’s Concession Agreement; (c) Section 8 of the CWA cannot be interpreted as requiring MWSS and its concessionaires to install a complete centralized sewerage system within five (5) years; and (d) providing a complete centralized sewerage system within the 5-year timeframe would entail a substantial amount of time and money to complete, not to mention that it would monumentally exacerbate an already burdensome vehicular traffic situation in Metro Manila. To date, the Motion for Reconsideration remains pending.

S E C F O R M 1 7 - A 161
4. The Consolidated Cases:
A. Waterwatch Coalition, Inc. et al. vs. Ramon Alikpala, MWSS, et al., G.R. No. 207444
B. Water for All Refund Movement vs. MWSS, et al., G.R. No. 208207 C. Javier vs. MWSS, et al., G.R. No. 210147 D. ABAKADA Guro Party List vs. MWSS, et al.GR No. 213227 E. Neri Colmenares and Carlos Isagani Zarate, Representatives of Bayan Muna
Partylist vs. Cesar V. Purisima, in his capacity as the Secretary of Finance, et al. G.R. No. 219362
A. The Waterwatch Petition: On June 25, 2013, MWC received a copy of the Petition for Certiorari and Mandamus with Prayer for the Issuance of a Temporary Restraining Order dated June 20, 2013 filed by the Waterwatch Coalition ("Waterwatch"), Inc. The issues raised in the Petition are as follows: (a) The Concession Agreements are unconstitutional for granting inherent sovereign powers to the
Concessionaires which insist they are private entities and mere agents of the MWSS; (b) The Concessionaires are public utilities; (c) The Concession system of MWSS, MWC and Maynilad is in a state of regulatory capture; (d) The Concession Agreements are State Contracts and cannot invoke the non-impairment clause in
the Constitution; (e) The Concessionaires have no vested property rights; and (f) MWSS is in a state of regulatory capture. B. The WARM Petition On August 14, 2013, MWC received a copy of a Petition for Certiorari, Prohibition and Mandamus dated August 5, 2013 filed by the Water for All Refund Movement ("WARM"). The issues raised in the WARM Petition are as follows: (a) The Concession Agreements unduly grant to the Concessionaires the exercise of governmental
powers even without the benefit of legislation or, at the very least, a franchise for such purpose; (b) Concessionaires are performing public service and are therefore, governed by the Public Service
Law, and subject to the 12% rate of return cap; (c) Concessionaires are public utilities, not mere agents or contractors of the MWSS; (d) Public utility or not, Concessionaires may not pass on their income taxes to the water consumers
as expenditures; and (e) The Concession Agreements cannot cause the creation of a Regulatory Office, a public office
performing public functions, or even source its funding from the Concessionaires, which are the very same entities it is supposed to regulate.
C. The Javier Petition On January 3, 2014, MWC received a copy of a Petition for Certiorari, Prohibition and Mandamus dated December 13, 2013 filed by the Virginia S. Javier, et.al, ("Javier") who were suing in their capacity as consumers/customers of the Concessionaires. The issues raised in the Javier Petition are as follows: (a) The Concession Agreements are unconstitutional and/or ultra vires for being delegations of
sovereign power without the consent of Congress; (b) The Concessionaires are public utilities; (c) Respondents have improperly implemented RORB calculations for purposes of establishing tariffs; (d) The Concession Agreements are not protected by the non-impairment clause; (e) Respondents should be enjoined from proceeding with arbitration; and (f) MWSS is in a state of regulatory capture. On February 4, 2014, MWC received a copy of the Supreme Court's Resolution dated January 14, 2014 consolidating the three (3) cases. MWC filed a Consolidated Comment on the aforesaid Petitions. The arguments raised by MWC in response to the Petitions are as follows: (a) The Concession Agreements are valid, legal and constitutional as these have statutory basis and
do not involve any grant or delegation of the "inherent sovereign powers of police power, eminent domain and taxation";

S E C F O R M 1 7 - A 162
(b) The Concessionaires are not public utilities in themselves but are mere agents and contractors of a public utility (MWSS);
(c) The Concession Agreements are protected by the non-impairment clause. Petitioners cannot invoke police power for courts to nullify, modify, alter or supplant the Concession Agreements. Police power is exercised by Congress, through the enactment of laws for the general welfare. No such law or enactment is involved in this case. If and when Congress passes a law affecting the Concession Agreements, only then will it be proper to examine the interplay between police power vis-a-vis due process and the non-impairment clause;
(d) The rates set under the Concession Agreements are compliant with the 12% rate of return cap in the MWSS Charter. Not being public utilities but mere agents of the MWSS, the Concessionaires are not subject to audit by the Commission on Audit (COA); and
(e) The Concessionaires are authorized to pass on corporate income taxes to water consumers. D. The ABAKADA-Guro Petition On September 22, 2014, MWC received another Petition for Certiorari and Prohibition filed by the ABAKADA-Guro Party List, represented by Atty. Florante B. Legaspi, Jr. This Petition was likewise consolidated with the Waterwatch, WARM and Javier Petitions due to similarities in the issues raised. In particular, the Petition questions the constitutionality of the Concession Agreements entered into by MWSS with both MWC and Maynilad and the extension of the Concession Agreements for another 15 years from year 2022. The Petition also seeks to nullify the arbitration proceedings between MWSS and the Concessionaires. MWC has filed its Comment on the Petition. In its Resolution dated April 21, 2015, the Supreme Court directed the parties to file their respective memoranda within thirty (30) days from notice thereof. After moving for the extension of the deadline on several occasions, on September 18, 2015, MWC filed its Memorandum. Maynilad, MWSS and Waterwatch have likewise filed their respective Memoranda. Petitioners WARM, ABAKADA-Guro and Javier, et al. have manifested that they would adopt their respective Petitions as their Memoranda. E. The Colmenares Petition This case is a Petition for Certiorari and Prohibition [with Application for the Issuance of a Temporary Restraining Order and/or Writ of Preliminary Injunction] dated August 6, 2015 filed by petitioners Neri Colmenares and Carlos Isagani Zarate, representatives of Bayan Muna Partylist. The Petition was filed primarily for the following purposes: a) To nullify, supposedly for being unconstitutional, the Arbitration Clause contained in the Concession
Agreements entered into by MWSS with MWC and Maynilad, respectively; b) To nullify, supposedly for being unconstitutional, the Sovereign Guarantee contained in the
Undertaking Letters executed by the Republic in favor of the Concessionaires; and c) To declare that the Concessionaires' payments for corporate income taxes cannot be deducted as
part of their operational expenditures; and (d) To prevent Secretary Cesar V. Purisima and President Benigno Simeon C. Aquino III from
processing the Concessionaires' claims under the Sovereign Guarantee. On November 16, 2015, the Supreme Court issued a Resolution consolidating the Colmenares Petition with the Waterwatch, WARM, Javier, and ABAKADA-Guro Petitions and directing the respondents to file their respective Comments. On November 23, 2015, MWC filed its Comment/Opposition (Re: Petition for Certiorari and Prohibition [with Application for the Issuance of a Temporary Restraining Order and/or Writ of Preliminary Injunction] dated 06 August 2015). On November 13, 2015, the MWSS and MWSS- Regulatory Office filed their Comment. On November 28, 2015, Maynilad filed its Comment with Opposition (To the Application for the Issuance of a Temporary Restraining Order and/or Writ of Preliminary Injunction). On March 10, 2016, MWC received the Manifestation dated March 7, 2016 of the OSG requesting that the Department of Finance and the said Office be excused from filing a Comment on the instant Petition in view of the pendency of the arbitration proceedings related to the Undertaking Letters. On May 26, 2016, MWC received Maynilad's Counter-Manifestation and Motions dated May 17, 2016, praying that the OSG be required to comment on the instant Petition. Maynilad also prayed that the instant case be set for oral arguments in accordance with the Rules of Court.

S E C F O R M 1 7 - A 163
In its Resolution dated March 15, 2016, the Supreme Court noted and granted the Manifestation dated March 7, 2016 of the OSG and excused the same from filing a Comment on the instant Petition. On June 16, 2016, MWC received Maynilad's Motion for Reconsideration dated June 7, 2016 praying that the Supreme Court reconsider its Resolution dated March 15, 2016. On July 25, 2016, MWC filed its Manifestation and Motion of even dated ("Manifestation and Motion"), where MWC joined Maynilad in seeking a reconsideration of the Supreme Court's Resolution dated March 15, 2016 and moved to set the consolidated cases for oral arguments. MWC's Manifestation and Motion was noted in the Supreme Court's Resolution dated August 2, 2016. On August 15, 2016, MWC received the Manifestation dated August 10, 2016 of the Secretary of Finance Carlos G. Dominguez III, represented by the OSG, stating that he is adopting the position taken by his predecessor in office as stated in the Manifestation dated March 7, 2016, that the Secretary of Finance and the OSG be excused from filing a comment on the instant Petition. The Manifestation and Motion filed by MWC, as well as the Manifestation dated August 10, 2016 filed by Secretary of Finance Carlos G. Dominguez III, were noted in the Supreme Court's Resolution dated August 23, 2016. In a Resolution dated September 19, 2017, the Supreme Court denied Maynilad's Motion for Reconsideration. Maynilad again filed another Motion for Reconsideration dated November 6, 2017 to apprise the Supreme Court that in the interim, the arbitration between the Republic and Maynilad had been resolved by the issuance of an award in favor of Maynilad. Thus, according to Maynilad, the OSG can no longer use said arbitration proceeding as an excuse from filing its comment. Last December 12, 2017, MWC filed a Manifestation and Comment in support of Maynilad's Motion. In a Resolution dated March 6, 2018, the Supreme Court granted the Motion for Reconsideration dated November 6, 2017 filed by Maynilad and the Motion for Leave to File Manifestation and Comment dated December 12, 2017 by MWC. On July 31, 2018, MWC received MWSS' Comment dated July 18, 2018 on the Petition. On February 10, 2020, MWC received a Very Urgent Motion (to Set Case for Oral Arguments) dated January 30, 2020 filed by the Office of the Solicitor General on behalf of the Department of Finance, praying that the cases be set for oral arguments. On the same date, MWC received a Notice dated January 7, 2020 from the Supreme Court requiring the parties to inform the court of recent developments which may be of help in the immediate disposition of the case. On February 26, 2020, MWC filed its Compliance/Manifestation and Compliance with Comment. On March 2, 2020, MWC received a Manifestation and Motion from the Secretary of Finance reiterating its urgent motion to set the cases for preliminary conference and oral arguments. To date, the foregoing cases remain pending. 5. Allan Mendoza et al. vs. Manila Water Company, Inc. Special Civil Action No. R-QZN-14-
04863-SC, RTC QC Branch 77 On May 23, 2014, Allan Mendoza, et al. ("Petitioners") filed a Petition for Mandamus under Rule 65 of the Rules of Court praying that MWC and its President, Mr. Gerardo C. Ablaza, Jr. be commanded to: (a) reinstitute the Welfare Fund, under terms and conditions which are no less favorable than those provided in the MWSS Employees Savings and Welfare Plan; to make an accounting, and reimburse and/or return to the MWC Welfare Fund the employer's share as of December 2005 which was diverted to the MWC Retirement Plan; and to implement the progressive employer share from the time the Welfare Fund was dissolved in 2005 up to the time when the Fund is finally reinstituted for the petitioners who are still employed, and up to the end of employment for those who are already separated on account of resignation, retirement, termination, etc.; (b) to implement correctly the benefits of petitioners which are guaranteed against non-diminution, as indicated in Exhibit "F" of the Concession Agreement; (c) to allow petitioners to accumulate their paid leaves of 15 days of vacation leave and 15 days of sick leave annually; and (d) to pay interest on the foregoing at 12% per annum. In an Order dated June 11, 2014, MWC and Mr. Ablaza were directed to file their Comment. On June 27, 2014, MWC and Mr. Ablaza filed their Comment and argued as follows: (a) the court has no jurisdiction over the subject matter of the instant Petition; being essentially an action for payment of employee benefits, the Labor Arbiters under the National Labor Relations Commission have original and exclusive jurisdiction over this case; (b) petitioners have resorted to mandamus in order to avoid

S E C F O R M 1 7 - A 164
payment of filing fees for a collection case; thus, the court has not acquired jurisdiction over the case for failure of the petitioners to pay the prescribed docket fees as set forth in Rule 141 of the Rules of Court; (c) petitioners are not entitled to a writ of mandamus; (d) there was a plain, speedy and adequate remedy available to the petitioners; (e) the case should not be treated as a class suit; (f) the claims of petitioners have prescribed; (g) the Complaint should be dismissed because petitioners' alleged cause of action is barred by laches; and (h) petitioners have received benefits no less favorable than those granted to such employees by the MWSS at the time of their separation from MWSS. In an Order dated July 28, 2014, the Court set the presentation of petitioners' evidence on September 10, 2014 and October 8, 2014. However, the September 10, 2014 hearing was cancelled because the branch clerk of court, the clerk-in-charge of civil cases, the court interpreter and the court aide of the branch were attending a seminar for the e-Court system. Thereafter, petitioners filed a Motion to Cancel (the October 8, 2014) Hearing and to Allow Parties to Submit Memoranda. In their Motion, petitioners claimed that the issues for resolution in the instant case are legal questions and prayed that the parties be required to submit Memoranda in lieu of presentation of evidence. On October 1, 2014, MWC and Mr. Ablaza filed a Comment on the Motion and stated that they do not entirely agree with petitioners' statement as they have made factual allegations in their Petition that would need to be proven in a full-blown trial. These allegations include, among others, that the employees have suffered diminution of benefits and that MWC had allegedly used part of the Welfare Fund as seed money for the Retirement Fund. However, MWC and Mr. Ablaza proposed that the following legal issues be initially disposed of by way of simultaneous Memoranda to be submitted by the parties, namely, whether or not: (a) the court has jurisdiction over the subject matter of the Petition being essentially an action for payment of employee benefits; (b) the court has acquired jurisdiction over the case considering the failure of the petitioners to pay the prescribed docket fees as set forth in Rule 141 of the Rules of Court; (c) the petitioners are entitled to a writ of mandamus; (d) there was a plain, speedy and adequate remedy available to the petitioners; (e) this case should be treated as a class suit; (f) the claims of petitioners have prescribed; and (g) the Petition should be dismissed because petitioners' alleged cause of action is barred by laches. On October 8, 2014, the scheduled hearing for the initial presentation of petitioners' evidence was cancelled reset to March 5, 2015 due to the absence of the presiding judge. At the March 5, 2015 hearing, petitioners reiterated their prayer that the parties be required to submit Memoranda in lieu of presentation of evidence considering that only legal questions are involved. MWC and Mr. Ablaza again countered that petitioners have made factual allegations in their Petition that would need to be proven in a full-blown trial. The presiding judge stated that the proceedings for a petition for mandamus are summary in nature. Thus, he directed the parties to simultaneously submit their respective Memoranda within sixty days, or by May 5, 2015. He directed the parties to address all legal issues and if there are factual issues, to attach judicial affidavits of witnesses. Upon submission of the Memoranda, he will determine if a party would be allowed to cross-examine the other's witnesses or if he would still conduct oral arguments. The parties subsequently filed their respective Memoranda. In an Order dated September 14, 2015, the parties were directed to manifest whether they would be submitting the case on the basis of their respective Memoranda or if they would request for a trial on the merits. At the October 12, 2015 hearing before the clerk of court, MWC and Mr. Ablaza, through counsel, reiterated that they would prefer if the issues on jurisdiction and other grounds for dismissal be resolved first before deciding whether or not the case should go to trial. The clerk of court noted this manifestation for discussion with the presiding judge. The trial court thereafter set the case for initial trial on March 30, 2016. During the hearing, both parties stated that their respective positions are already set forth in the Memorandum each submitted. The issues on jurisdiction and other grounds for dismissal were submitted for resolution. In an Order dated April 1, 2016, the trial court dismissed the case, without prejudice, on the ground that the Petition filed by Mr. Mendoza failed to state a cause of action for mandamus. In an Order dated July 14, 2016, the trial court denied the Motion for Reconsideration of the petitioners. Mr. Allan M. Mendoza proceeded to file a Petition for Certiorari with the Court of Appeals. On October 24, 2016, the Court of Appeals ordered the counsel of Mr. Mendoza to submit an Amended Petition,

S E C F O R M 1 7 - A 165
this time impleading the names of the other petitioners, stating their actual addresses, and appending copies of their Special Powers of Attorney. On December 1, 2016, the Amended Petition was filed. In a Resolution dated January 19, 2017, the Court of Appeals directed the counsel for the petitioners to submit the addresses of some of the co-petitioners and to implead one additional petitioner. On February 21, 2017, MWC received a Second Amended Petition filed by petitioners supposedly to comply with the directive of the court. In a Resolution dated September 8, 2017, the Court of Appeals directed MWC to comment on the Amended Petition. MWC filed its Comment on October 30, 2017. The Court of Appeals thereafter referred the parties to compulsory mediation, which however failed. In a Resolution dated March 6, 2018, the parties were directed to file their respective Memoranda. MWC filed its Memorandum on May 24, 2018. In a Resolution dated July 31, 2018, the Court of Appeals admitted the Memorandum filed by MWC. However, the Memorandum filed by the Petitioners was deemed not filed, as their Motion for Extension of Time to file the same was unsigned. The Petitioners were directed to show cause why their Memorandum should be admitted despite being filed late. In a Compliance with Manifestation and Motion to Admit, Petitioners' counsel explained that late filing was an oversight caused by counsel's recent surgery and the medications prescribed and prayed that Petitioners’ Memorandum be admitted. To date, this case remains pending. IMI There are no material pending legal proceedings, bankruptcy petition, conviction by final judgment, order, judgment or decree or any violation of a securities or commodities law for the past five years up to the present date to which the Company or any of its subsidiaries or its directors or executive officers is a party or of which any of its material properties are subject in any court or administrative government agency. The Company filed a civil case on April 11, 2011 against Standard Insurance (“Standard”) seeking to collect Standard’s share in the loss incurred by the Company consisting in damage to production equipment and machineries as a result of the May 24, 2009 fire at the Company’s Cebu facility which the Company claims to be covered by Standard’s “Industrial All Risks Material Damage with Machinery Breakdown and Business Interruption” policy. The share of Standard in the loss is 22% or US $1,117,056.84 after its co-insurers all paid the amount of loss respectively claimed from them. The Company had to resort to court action after Standard denied its claim on the ground that the claim is an excepted peril. Standard filed a motion to dismiss on various grounds, such as lack of cause of action and of prescription. The Regional Trial Court denied the motion to dismiss but Standard filed a Motion for Reconsideration with the Court of Appeals (CA). On April 26, 2013, the CA dismissed the case on the ground that the claim has prescribed. On April 19, 2013, IMI filed a Motion for Reconsideration. On December 10, 2013, IMI received a decision promulgated on December 2, 2013 denying the said Motion for Reconsideration. IMI filed a Petition for Review on Certiorari dated January 23, 2014 which is pending with the Supreme Court as of December 31, 2019. IMI’s expanding global activities, while continuing to present a myriad of growth opportunities, also tend to increase its exposure to potential disputes with customers and suppliers. Such exposure could, in turn, directly or indirectly, affect IMI’s ability to realize its short and long-term target revenues and operating margins from its services as well as adversely impact its net assets, financial position and results of operations. In this connection, IMI is currently involved in an ongoing arbitration proceeding arising from a contractual dispute with its customer. BPI BPI does not have any material pending legal proceedings to which BPI or any of its subsidiaries or affiliates is a party or of which any of their property is the subject.

S E C F O R M 1 7 - A 166
Globe Interconnection Charges for Short Messaging Service On October 10, 2011, the NTC issued Memorandum Circular (MC) No. 02-10-2011 titled Interconnection Charge for Short Messaging Service requiring all public telecommunication entities to reduce their interconnection charge to each other from ₱0.35 to ₱0.15 per text, which Globe Telecom complied as early as November 2011. On December 11, 2011, the NTC One Stop Public Assistance Center (OSPAC) filed a complaint against Globe Telecom, Smart and Digitel alleging violation of the said MC No. 02-10-2011 and asking for the reduction of SMS off-net retail price from ₱1.00 to ₱0.80 per text. Globe Telecom filed its response maintaining the position that the reduction of the SMS interconnection charges does not automatically translate to a reduction in the SMS retail charge per text. On November 20, 2012, the NTC rendered a decision directing Globe Telecom to:
• Reduce its regular SMS retail rate from P1.00 to not more than ₱0.80;
• Refund/reimburse its subscribers the excess charge of ₱0.20; and
• Pay a fine of ₱200.00 per day from December 1, 2011 until date of compliance.
On May 7, 2014, NTC denied the Motion for Reconsideration (MR) filed by Globe Telecom last December 5, 2012 in relation to the November 20, 2012 decision. Globe Telecom’s assessment is that Globe Telecom is in compliance with the NTC Memorandum Circular No. 02-10-2011. On June 9, 2014, Globe Telecom filed petition for review of the NTC decision and resolution with the Court of Appeals (CA). The CA granted the petition in a resolution dated September 3, 2014 by issuing a 60-day temporary restraining order on the implementation of Memorandum Circular 02-10-2011 by the NTC. On October 15, 2014, Globe Telecom posted a surety bond to compensate for possible damages as directed by the CA. On June 27, 2016, the CA rendered a decision reversing the NTC’s abovementioned decision and resolution requiring telecommunications companies to cut their SMS rates and return the excess amount paid by subscribers. The CA said that the NTC order was baseless as there is no showing that the reduction in the SMS rate is mandated under MC No. 02-10-2011; there is no showing, either that the present P1.00 per text rate is unreasonable and unjust, as this was not mandated under the memorandum. Moreover, under the NTC’s own MC No. 02-05-2008, SMS is a value added service (VAS) whose rates are deregulated. The respective motions for reconsideration filed by NTC and that of intervenor Bayan Muna Party List (Bayan Muna) Representatives Neri Javier Colmenares and Carlos Isagani Zarate were both denied. The NTC thus elevated the CA’s ruling to the Supreme Court (SC) via a Petition for Review on Certiorari dated September 15, 2017. For its part, Bayan Muna filed its own Petition for Review on Certiorari of the CA’s Decision. On January 4, 2018, Globe received a copy of the SC’s Resolution dated November 6, 2017, requiring it to comment on said petition of Bayan Muna. Subsequently, on February 21, 2018, Globe received a copy of the SC’s Resolution dated December 13, 2017 consolidating the Petitions for Review filed by Bayan Muna and NTC, and requiring Globe to file its comment on the petition for review filed by NTC. Thus, on April 2, 2018, Globe filed its Consolidated Comment on both Bayan Muna and the NTC’s petitions for review. On September 18, 2018, Globe received a copy of Bayan Muna’s Consolidated Reply to Globe’s Consolidated Comment and Digitel and Smart’s Comment. Globe Telecom believes that it did not violate NTC MC No. 02-10-2011 when it did not reduce its SMS retail rate from Php 1.00 to Php 0.80 per text, and hence, would not be obligated to refund its subscribers. However, if it is ultimately decided by the Supreme Court (in case an appeal is taken thereto by the NTC from the adverse resolution of the CA) that Globe Telecom is not compliant with said circular, Globe may be contingently liable to refund to its subscribers the ₱0.20 difference (between ₱1.00 and ₱0.80 per text) reckoned from November 20, 2012 until said decision by the SC becomes final and executory. Management does not have an estimate of the potential claims currently. Guidelines on Unit of Billing of Mobile Voice Service On July 23, 2009, the NTC issued NTC MC No. 05-07-2009 (Guidelines on Unit of Billing of Mobile Voice Service). The MC provides that the maximum unit of billing for the Cellular Mobile Telephone System (CMTS) whether postpaid or prepaid shall be six (6) seconds per pulse. The rate for the first

S E C F O R M 1 7 - A 167
two (2) pulses, or equivalent if lower period per pulse is used, may be higher than the succeeding pulses to recover the cost of the call set-up. Subscribers may still opt to be billed on a one (1) minute per pulse basis or to subscribe to unlimited service offerings or any service offerings if they actively and knowingly enroll in the scheme. On December 28, 2010, the Court of Appeals (CA) rendered its decision declaring null and void and reversing the decisions of the NTC in the rates applications cases for having been issued in violation of Globe Telecom and the other carriers’ constitutional and statutory right to due process. However, while the decision is in Globe Telecom’s favor, there is a provision in the decision that NTC did not violate the right of petitioners to due process when it declared via circular that the per pulse billing scheme shall be the default. On January 21, 2011, Globe Telecom and two other telecom carriers, filed their respective Motions for Partial Reconsideration (MR) on the pronouncement that “the Per Pulse Billing Scheme shall be the default”. The petitioners and the NTC filed their respective Motion for Reconsideration, which were all denied by the CA on January 19, 2012. On March 12, 2012, Globe and Innove elevated to the Supreme Court the questioned portions of the Decision and Resolution of the CA dated December 28, 2010 and its Resolution dated January 19, 2012. The other service providers, as well as the NTC, filed their own petitions for review. The adverse parties have filed their comments on each other’s petitions, as well as their replies to each other’s comments. Parties were required to file their respective Memoranda and Globe filed its Memorandum on May 25, 2018. The case is now submitted for resolution. Right of Innove to Render Service and Build Telecommunications Infrastructure in BGC
• PLDT and its affiliate, Bonifacio Communications Corporation (BCC) and Innove and Globe Telecom are in litigation over the right of Innove to render services and build telecommunications infrastructure in the Bonifacio Global City (BGC). In the case filed by Innove before the NTC against BCC, PLDT and the Fort Bonifacio Development Corporation (FBDC), the NTC has issued a Cease and Desist Order preventing BCC from performing further acts to interfere with Innove’s installations in the BGC. On January 21, 2011, BCC and PLDT filed with the CA a Petition for Certiorari and Prohibition against the NTC, et al. seeking to annul the Order of the NTC dated October 28, 2008 directing BCC, PLDT and FBDC to comply with the provisions of NTC MC 05-05-02 and to cease and desist from performing further acts that will prevent Innove from implementing and providing telecommunications services in the Fort Bonifacio Global City pursuant to the authorization granted by the NTC. On April 25, 2011, Innove Communications, filed its comment on the Petition. On August 16, 2011, the CA ruled that the petition against Innove and the NTC lacked merit, holding that neither BCC nor PLDT could claim the exclusive right to install telecommunications infrastructure and providing telecommunications services within the BGC. Thus, the CA denied the petition and dismissed the case. PLDT and BCC filed their motions for reconsideration thereto, which the CA denied. On July 6, 2012, PLDT and BCC assailed the CA’s rulings via a petition for review on certiorari with the Supreme Court. Innove and Globe filed their comment on said petition on January 14, 2013, to which said petitioners filed their reply on May 21, 2013. The case remains pending with the SC.
• In a case filed by BCC against FBDC, Globe Telecom, and Innove before the RTC of Pasig, which case sought to enjoin Innove from making any further installations in the BGC and claimed damages from all the parties for the breach of the exclusivity of BCC in the area, the court did not issue a TRO and has instead scheduled several hearings on the case. The defendants filed their respective motions to dismiss the complaint on the grounds of forum shopping and lack of jurisdiction, among others. On March 30, 2012, the RTC of Pasig, as prayed for, dismissed the complaint on the aforesaid grounds. The motion for reconsideration filed by BCC on July 20, 2012 remains pending with the trial court.
Acquisition by Globe Telecom and PLDT of the Entire Issued and Outstanding Shares of VTI In a letter dated June 7, 2016 issued by Philippine Competition Commission (PCC) to Globe Telecom, PLDT, SMC and VTI regarding the Joint Notice filed by the aforementioned parties on May 30, 2016,

S E C F O R M 1 7 - A 168
disclosing the acquisition by Globe Telecom and PLDT of the entire issued and outstanding shares of VTI, the PCC claims that the Notice was deficient in form and substance and concludes that the acquisition cannot be claimed to be deemed approved. On June 10, 2016, Globe Telecom formally responded to the letter reiterating that the Notice, which sets forth the salient terms and conditions of the transaction, was filed pursuant to and in accordance with Memorandum Circular No. l6-002 (MC No. l6-002) issued by the PCC. MC No. 16-002 provides that before the implementing rules and regulations for Republic Act No. 10667 (the Philippine Competition Act of 2015) come into full force and effect, upon filing with the PCC of a notice in which the salient terms and conditions of an acquisition are set forth, the transaction is deemed approved by the PCC and as such, it may no longer be challenged. Further, Globe Telecom clarified in its letter that the supposed deficiency in form and substance of the Notice is not a ground to prevent the transaction from being deemed approved. The only exception to the rule that a transaction is deemed approved is when a notice contains false material information. In this regard, Globe Telecom stated that the Notice does not contain any false information. On June 17, 2016, Globe Telecom received a copy of the second letter issued by PCC stating that notwithstanding the position of Globe Telecom, it was ruling that the transaction was still subject for review. On July 12, 2016, Globe Telecom asked the CA to stop the government's anti-trust body from reviewing the acquisition of SMC's telecommunications business. Globe Telecom maintains the position that the deal was approved after Globe Telecom notified the PCC of the transaction and that the anti-trust body violated its own rules by insisting on a review. On the same day, Globe Telecom filed a Petition for Mandamus, Certiorari and Prohibition against the PCC, docketed as CA-G.R. SP No. 146538. On July 25, 2016, the CA, through its 6th Division issued a resolution denying Globe Telecom’s application for TRO and injunction against PCC’s review of the transaction. In the same resolution, however, the CA required the PCC to comment on Globe Telecom's petition for certiorari and mandamus within 10 days from receipt thereof. The PCC filed said comment on August 8, 2016. In said comment, the PCC prayed that the ₱70 billion deal between PLDT-Globe Telecom and San Miguel be declared void for PLDT and Globe Telecom’s alleged failure to comply with the requirements of the Philippine Competition Act of 2015. The PCC also prayed that the CA direct Globe Telecom to: cease and desist from further implementing its co-acquisition of the San Miguel telecommunications assets; undo all acts consummated pursuant to said acquisition; and pay the appropriate administrative penalties that may be imposed by the PCC under the Philippine Competition Act for the illegal consummation of the subject acquisition. The case remains pending with the CA. Meanwhile, PLDT filed a similar petition with the CA, docketed as CA G.R. SP No. 146528, which was raffled off to its 12th Division. On August 26, 2016, PLDT secured a TRO from said court. Thereafter, Globe Telecom’s petition was consolidated with that of PLDT, before the 12th Division. The consolidation effectively extended the benefit of PLDT’s TRO to Globe Telecom. The parties were required to submit their respective Memoranda, after which, the case shall be deemed submitted for resolution. On February 17, 2017, the CA issued a Resolution denying PCC’s Motion for Reconsideration dated September 14, 2016 for lack of merit. In the same Resolution, the Court granted PLDT’s Urgent Motion for the Issuance of a Gag Order and ordered the PCC to remove the offending publication from its website and also to obey the sub judice rule and refrain from making any further public pronouncements regarding the transaction while the case remains pending. The Court also reminded the other parties, PLDT and Globe, to likewise observe the sub judice rule. For this purpose, the Court issued its gag order admonishing all the parties “to refrain, cease and desist from issuing public comments and statements that would violate the sub judice rule and subject them to indirect contempt of court. The parties were also required to comment within ten days from receipt of the Resolution, on the Motion for Leave to Intervene, and Admit the Petition-in Intervention dated February 7, 2017 filed by Citizenwatch, a nonstock and non-profit association. On April 18, 2017, PCC filed a petition before the SC docketed as G.R. No. 230798, to lift the CA's order that has prevented the review of the sale of San Miguel Corp.'s telecommunications unit to PLDT Inc. and Globe Telecom. On April 25, 2017, Globe filed before the SC a Motion for Intervention with Motion to Dismiss the petition filed by the PCC. As of June 30, 2017, the SC did not issue any TRO on the PCC's petition to lift the injunction issued by the CA. Hence, the PCC remains barred from reviewing the SMC deal.

S E C F O R M 1 7 - A 169
On July 26, 2017, Globe received the SC en banc Resolution granting Globe's Extremely Urgent Motion to Intervene. In the same Resolution, the Supreme Court treated as Comment, Globe's Motion to Dismiss with Opposition Ad Cautelam to PCC's Application for the Issuance of a Writ of Preliminary Injunction and/or TRO. On August 31, 2017, Globe received another Resolution of the SC en banc, requiring the PCC to file a Consolidated Reply to the Comments respectively filed by Globe and PLDT, within ten (10) days from notice. Globe has yet to receive the Consolidated Reply of PCC since the latter requested for extension of time to file the same. In the meantime, in a Decision dated October 18, 2017, the CA, in CA-G.R. SP No. 146528 and CA-G.R. SP No. 146538, granted Globe and PLDTs Petition to permanently enjoin and prohibiting PCC from reviewing the acquisition and compelling the PCC to recognize the same as deemed approved. PCC elevated the case to the SC via Petition for Review on Certiorari. Co-use of Frequencies by PLDT/Smart and Globe Telecom as a result of the acquisition of controlling shares in VTI On January 21, 2019, Globe filed its Comment to a petition filed by lawyers Joseph Lemuel Baligod and Ferdinand Tecson before the Supreme Court, against the NTC, PCC, Liberty Broadcasting Network, Inc. (LBNI), Bell Telecommunications Inc. (BellTel), Globe, PLDT and Smart, docketed as G.R. No. 242353. The petition sought to, among others enjoin PLDT/Smart and Globe from co-using the frequencies assigned to LBNI and BellTel in view of alleged irregularities in NTC’s assignment of these frequencies to these entities. In its Comment, Globe argued that the frequencies were assigned in accordance with existing procedures prescribed by law and that to prevent the use of the frequencies will only result to its being idle and unutilized. Moreover, in view of the substantial investments made by Globe for the use of these frequencies, enjoining its use will cause grave and irreparable injury not only to Globe but to subscribers who will be deprived of the benefits of fast and reliable telecommunications services. The other Respondents have likewise filed their respective Comments to the petition.
Details on these transactions have been extensively discussed in the disclosures filed by Globe with the SEC and PSE and may be accessed from the PSE and Globe websites. Item 4. Submission of Matters to a Vote of Security Holders Except for matters taken up during the annual meeting of stockholders, there was no other matter submitted to a vote of security holders during the period covered by this report.

S E C F O R M 1 7 - A 170
PART II - OPERATIONAL AND FINANCIAL INFORMATION
Item 5. Market for Registrant’s Common Equity and Related Stockholder Matters A) Market Information
Principal market where the registrant’s common equity is traded.
The following table shows the high and low prices (in PHP) of Ayala Corporation’s shares in the Philippine Stock Exchange for the year 2019 and 2018:
2019
2018
High Low High Low 1st qtr 1,000.00 906.00 1,095.00 916.00 2nd qtr 931.00 838.00 990.00 876.00 3rd qtr 983.00 884.50 1,020.00 876.00 4th qtr 879.50 752.00 970.50 882.00
Source: Bloomberg
The market capitalization of the Company’s common shares as of end-2019, based on the closing price of ₱785.50/share, was approximately ₱492 billion.
The price information of Ayala common, preferred B series 1 and preferred B series 2 shares as of
the close of the latest practicable trading date, March 19, 2020, is ₱394.00, ₱506.60, and ₱498.00,
respectively.
B) Holders
The following are the top 20 registered holders of the Company’s securities based on the records of our stock transfer agents: Common Shares There are 6,423 registered holders of common shares as of February 29, 2020.
Stockholder name No. of common
shares Percentage of
common shares
1. Mermac, Inc. 296,625,706 47.4069%
2. PCD Nominee Corporation (Non-Filipino) 162,032,358 25.8961%
3. PCD Nominee Corporation (Filipino) 107,795,772 17.2280%
4. Mitsubishi Corporation 37,771,896 6.0367%
5. Shoemart, Inc. 7,529,203 1.2033%
6. Sysmart Corporation 1,500,912 0.2399%
7. SM Investment Corporation 1,418,610 0.2267%
8. Philippine Remnants Co., Inc. 823,046 0.1315%
9. ESOWN Administrator 2019 515,904 0.0825%
10. ESOWN Administrator 2018 486,572 0.0778%
11. ESOWN Administrator 2016 481,726 0.0770%
12. ESOWN Administrator 2017 441,426 0.0705%
13. ESOWN Administrator 2015 431,619 0.0690%
14. Mitsubishi Logistics Corporation 360,512 0.0576%
15. ESOWN Administrator 2012 315,963 0.0505%
16. ESOWN Administrator 2014 291,345 0.0466%
17. Telengtan Brothers & Sons, Inc. 136,857 0.0219%
18. Lucio Yan 127,996 0.0205%
19. Xavier P. Loinaz 126,052 0.0201%
20. Era Management & Development Corp. 106,118 0.0170%

S E C F O R M 1 7 - A 171
Preferred B Series 1 Shares
There are 17 registered holders of preferred B series 1 shares as of February 29, 2020.
Stockholder name
No. of preferred B series 1 shares
Percentage of preferred B series
1 shares
1. PCD Nominee Corp – Filipino 19,826,660 99.1333%
2. PCD Nominee Corp – Non Filipino 89,680 0.4484%
3. Insigne Fortuna Holdings Inc. 19,320 0.0966%
4. One Point Contact, Inc. 18,000 0.0900%
5. Mariano Vicente Lim Tan or Katherine Tan or Elena Lim Tan
8,000 0.0400%
6. Santos, Leonel A. and/or Santos, Alicia 7,000 0.0350%
7. Tan, Ben Cuevo and/or Tan, Imelda Toralba 6,000 0.0300%
8. Chan, Raymond O. or Chan Lynette 5,000 0.0250%
9. Chavez, Felix B. or Aida T. Chavez or Irene T. Chavez 5,000 0.0250%
10. Philippine British Assurance Company, Inc. 4,000 0.0200%
11. Zalamea, Enriquez M. Jr. 4,000 0.0200%
12. Jose Maximillan F. Lumawig or Grace T. Lumawig 4,000 0.0200%
13. Henry Dy Tan and or Sherly G. Tan 3,400 0.0170%
14. Macabuhay, Melchor T. 1,540 0.0077%
15. Bautista, Feliciano M. and or Bautista, Elisa D. 1,000 0.0050%
16. Lim, Iris Veronica Go 600 0.0030%
17. GD Tan and Company 200 0.0010%
Preferred B Series 2 Shares
There are three (3) registered holders of preferred B series 2 shares as of February 29, 2020.
Stockholder name No. of preferred B
series 2 shares Percentage of
preferred B series 2 shares
1. PCD Nominee Corp – Filipino 29,987,920 99.8027%
2. PCD Nominee Corp – Non Filipino 12,080 0.1773%
3. Marieta K. Ilusorio 6,000 0.0200%
Voting Preferred Shares There are 1,038 registered holders of voting preferred shares as of February 29, 2020.
Stockholder name No. of voting
preferred shares Percentage of
voting preferred shares
1. Mermac, Inc. 172,778,760 86.3893%
2. Mitsubishi Corporation 19,545,678 9.7728%
3. Deutsche Bank AG Manila OBO UBS HK A/C 12105904001
1,561,478 0.7807%
4. Fernando Zobel de Ayala 554,983 0.2775%
5. Jaime Augusto Zobel de Ayala 543,802 0.2719%
6. CBNA MLA OBO AC 6002079755 364,810 0.1824%
7. Delfin L. Lazaro 258,297 0.1291%
8. Britel Fund Trustees Limited 170,064 0.0850%
9. HSBC Manila OBO A/C 000-808154-573 169,803 0.0849%
10. Deutsche Regis Partners, Inc. A/C Clients 137,372 0.0687%
11. BDO Securities Corporation 115,794 0.0579%
12. AB Capital Securities Inc. 113,164 0.0566%
13. Deutsche Bank AG, Manila Branch 111,385 0.0557%
14. Mercedita S. Nolledo 84,996 0.0425%
15. Ariston Dela Rosa Estrada, Jr. 84,396 0.0422%
16. Asiasec Equities Inc. 78,007 0.0390%
17. HSBC Manila OBO A/C 000-083766-550 73,272 0.0366%
18. HSBC Manila OBO A/C 000-171512-575 72,884 0.0364%
19. Papa Securities Corporation 69,646 0.0348%
20. Ansaldo Godinez & Company Inc. 65,977 0.0330%

S E C F O R M 1 7 - A 172
C) Dividends
Stock Dividends
Percent Record Date Payment Date
20% May 22, 2007 June 18, 2007
20% April 24, 2008 May 21, 2008
20% July 5, 2011 July 29, 2011
Cash Dividends On Common Shares
Year Payment Date Rate (Php) Record Date
2017 July 22, 2017
December 31, 2017
3.46/share 3.46/share
July 7, 2017
December 15, 2017
2018 July 22, 2018
January 5, 2019
3.46/share 3.46/share
July 6, 2018
December 20, 2018
2019 August 15, 2019
January 4, 2020
4.15/share 4.15/share
July 30, 2019
December 19, 2019
Dividend policy As a holding company, Ayala’s policy is to provide a fixed-rate, semi-annual cash dividend on common shares. For voting preferred shares, the rate is 5.7730% per annum. For non-voting Preferred B Series 1 and 2 shares, the dividends are distributed at the rates of 5.25% and 4.8214% per annum, respectively.
D) Recent Sales of Securities
The following shares were issued to/subscribed by the Company’s executives as a result of the exercise of stock options (ESOP) and the subscription to the stock ownership (ESOWN) plans:
Year No. of shares
ESOP ESOWN* 2018 8,636 518,681 2019 89,611 515,904
*Net of cancelled subscriptions.
The above shares formed part of the 8,864,000 ESOP and ESOWN shares subject of the Commission’s resolution dated January 12, 2006 confirming the issuance of such shares as exempt transactions pursuant to Section 10.2 of the Securities Regulation Code.
E) Corporate Governance
The Company’s corporate governance principles were formalized in its Manual on Corporate Governance, as revised and filed with the SEC on May 31, 2017 (the “Revised Manual”), in compliance with SEC Memorandum Circular No. 19, Series of 2016. The Revised Manual establishes corporate governance practices that are founded on internationally recognized rigorous standards, systems and processes designed to ensure the Company’s progress and stability, that an effective system of check and balance is in place and that a high standard of accountability and transparency to all stakeholders is enforced. The Revised Manual conforms to the SEC’s requirements for manuals o n corporate governance. It defines primarily the roles and responsibilities of the Board and Management. More importantly, it includes a statement of their respective liabilities in the event of non-compliance with or violation of any of the provisions of the Revised Manual. It also establishes, among others, policies on (a) independent directors, (b) Board committees, (c) conflicts of interest, (d) internal and external audit procedures and practices, including risk management, (e) whistleblowing, (f) stockholders’ rights and interests and (g) management’s responsibility to communicate and inform stakeholders matters related to the Company’s affairs. The principles embodied in the Revised Manual lay the foundation for the appropriate supervision and proper management of the Company to safeguard shareholders and other stakeholders’ interests and to ensure the Company’s long-term growth and sustainability. In line with this, Ayala ensures its compliance with the Revised Manual, through among others, the following:

S E C F O R M 1 7 - A 173
i. The Board conducts and accomplishes an annual Board Performance Self-Assessment indicating the compliance ratings. The evaluation system was established to measure or determine the level of compliance of the Board of Directors and top-level management with the Revised Manual and the ratings are submitted to the Chief Compliance Officer who prepares the required Integrated Annual Corporate Governance Report submitted to the SEC.
ii. To ensure good governance, the Board establishes the vision, strategic objectives, key policies, and procedures for the management of the Company, as well as the mechanism for monitoring and evaluating Management’s performance.
iii. The Company ensures full compliance with the leading practices and principles of good corporate governance contained in the Revised Manual since its adoption.
iv. The Company is taking further steps to enhance adherence to principles and practices of good corporate governance. In line with this, the Board is updating the Charter of the Board of Directors adopted on June 26, 2014 as well as the Revised Manual.
Amendments to the By-Laws
Article and
Section Nos. From To
Art. III, Sec. 2 The meetings of stockholders may be regular
or special, and shall be held at the offices of
the Corporation or at any place in Metro
Manila designated by the Board of Directors.
The meetings of stockholders may be
regular or special, and shall be held at the
principal office of the Corporation or at
any place in the city where the principal
office of the Corporation is located.
Art. III, Sec. 3 The notice shall be sent to each stockholder
by personal delivery or by mail, postal or
electronic, addressed to the physical or
electronic or e-mail address of the
stockholder registered in the books of the
Corporation, at least fifteen (15) business
days advance of the date for which the
meeting is called. The notice shall be
deemed to have been given at the time when
delivered personally or deposited in the
Makati Central Post Office, or sent
electronically or by e-mail and addressed as
herein provided.
Notice of regular or special meeting shall
contain, in addition to the date, hour and
place of the meeting, a statement of the
matters to be transacted at the meeting, and
no business other than that specified in the
call shall be transacted at such meeting. The
notice of the stockholders’ meeting shall also
set the date, time and place of the validation
of proxies, which in no case, shall be less
than five (5) business days prior to the
stockholders’ meeting.
The notice shall be sent to each
stockholder by personal delivery, by mail,
postal or electronic, or by such other
manner as allowed by the Securities and
Exchange Commission, addressed to the
physical or electronic address of the
stockholder registered in the books of the
Corporation. For regular meetings, the
notice shall be sent at least twenty-one
(21) days prior to the date of the
meeting, while for special meetings, at
least one (1) week written notice shall
be sent to all stockholders. The notice
shall be deemed to have been given at the
time when delivered personally or
deposited in the Makati Central Post Office,
or sent electronically, or sent by such
other manner allowed by the Securities
and Exchange Commission and
addressed as herein provided.
Notice of regular or special meeting shall
contain, in addition to the date, hour and
place of the meeting, a statement of the
matters to be transacted at the meeting,
and no business other than that specified
in the notice shall be transacted at such
meeting. Any director or stockholder
may propose any other matter for
inclusion in the agenda at any regular or
special stockholders meeting, subject to
reasonable guidelines issued by the
Board which are consistent with
applicable laws, rules and regulations of
the Securities and Exchange
Commission, as may be amended from
time to time. The notice of the

S E C F O R M 1 7 - A 174
stockholders’ meeting shall also set the
date, time and place of the validation of
proxies, which in no case, shall be less
than five (5) business days prior to the
stockholders’ meeting. The notice shall
also contain the procedures to be
followed when a stockholder elects to
vote through remote communication or
in absentia.
x x x
Notice to any meeting may be waived,
expressly or impliedly, including
through a stockholder’s attendance at a
meeting unless the stockholder’s
presence is for the express purpose of
contending that the meeting is not
lawfully convened.
Art. III, Sec. 11 The Board of Directors shall fix a record date
for the purpose of determining the
stockholders entitled to notice of or to vote at
any meeting of stockholders or any
adjournment thereof, or entitled to receive
payment of any dividend or other distribution
or allotment of any rights, or entitled to
exercise any rights in respect of any change,
conversion or exchange of stock or for the
purpose of any other lawful action.
The Board of Directors shall fix a record
date for the purpose of determining the
stockholders entitled to notice of or to vote
at any meeting of stockholders or any
adjournment thereof, or entitled to receive
payment of any dividend or other
distribution or allotment of any rights, or
entitled to exercise any rights in respect of
any change, conversion or exchange of
stock or for the purpose of any other lawful
action, provided that the stock and
transfer book shall be closed at least
twenty (20) days for regular meetings
and seven (7) days for special meetings,
before the scheduled date of the
meeting.
Art. IV, Sec. 1 The Board of Directors is the supreme
authority in matters of governance and in
managing the regular and ordinary business
of the Corporation. Within their chartered
authority, the directors acting as a board
have the fullest powers to regulate the
concerns of the Corporation according to
their best judgment. It shall be the Board’s
responsibility to promote and adhere to the
principles and best practices of corporate
governance and to foster the long-term
success of the Corporation and secure its
sustained competitiveness in the global
environment in a manner consistent with its
fiduciary responsibility, which it shall exercise
in the best interest of the Corporation, its
shareholders and other stakeholders.
x x x
As a corporation publicly listed in the
Philippine Stock Exchange (PSE), the
Corporation shall conform with the
requirement to have such number of
independent directors as may be required by
law, and with the procedures for the
nomination and election of independent
directors as prescribed by law or regulations.
x x x
As a corporation publicly listed in the
Philippine Stock Exchange (PSE), the
Corporation shall comply with the
requirement to have such number of
independent directors as may be required
by law, and with the legally prescribed
procedures for their nomination and
election.

S E C F O R M 1 7 - A 175
Art. IV, Sec. 3 No person shall qualify or be eligible for
nomination or election to the Board of
Directors if he is engaged in any business
which competes with or is antagonistic to
that of the Corporation.
x x x
For the proper implementation of this
provision, all nominations for election of
Directors by the stockholders shall be
submitted in writing to the Board of Directors
at least thirty (30) business days before the
date of the regular meeting.
No person shall qualify or be eligible for
nomination or election to the Board of
Directors if he is in possession of any of
the grounds for disqualification
provided in applicable laws and the
rules and regulation of the Securities
and Exchange Commission, as may be
amended from time to time, or if he is
engaged in any business which competes
with or is antagonistic to that of the
Corporation.
x x x
For the proper implementation of this
provision, all nominations for election of
Directors by the stockholders shall be
submitted in writing to the Corporate
Governance and Nomination Committee
at least thirty (30) business days before the
date of the regular meeting of the
stockholders.
Art. IV, Sec. 4 An Independent Director shall hold no
interests or relationships with the
Corporation that may hinder his
independence from the Corporation or
Management which would materially
interfere with the exercise of independent
judgment in carrying out the responsibilities
of a Director.
An Independent Director shall submit to the
Corporate Secretary a letter of confirmation
stating that he holds no interests affiliated
with the Corporation, Management or
controlling shareholder at the time of his
election or appointment and/or re-election as
a Director.
-
Art. IV, Sec. 5 In case any vacancy or vacancies should
occur on the Board of Directors during the
period between two stockholders’ meetings
due to death, resignation or other causes,
the remaining Directors, if still constituting a
quorum, may fill said vacancies by election
from among the stockholders, and the
stockholders so elected shall act as
members of said Board until the new Board
of Directors is elected.
Section 4 – Any vacancy due to
expiration of term shall be filled no later
than the day of such expiration at the
annual stockholders’ meeting. For any
vacancy arising from removal by the
stockholders, the election shall be held
on the same meeting if so stated in the
agenda and notice of meeting. In all
other cases, the vacancy may be filled
by at least a majority vote of the
remaining directors, if still constituting
a quorum; otherwise, the vacancy shall
be filled in a special stockholders’
meeting called for that purpose, in any
instance no later than forty-five (45)
days from the time the vacancy
occurred. The director so elected shall
be referred to as replacement director
and act as a member of the said Board
only for the unexpired term of his
predecessor.
However, when the remaining directors
cannot constitute a quorum and

S E C F O R M 1 7 - A 176
emergency action is required to prevent
grave, substantial or irreparable loss or
damage to the Corporation, the vacancy
may be temporarily filled from among
the officers of the Corporation by the
unanimous vote of the remaining
directors. The designated director’s
actions shall be limited to any
necessary emergency action and his
term shall cease within a reasonable
time from the termination of the
emergency or upon election of the
replacement director, whichever comes
first.
Art. IV, Sec. 6 The Board of Directors shall designate the
days when it shall meet in regular session,
but it shall meet at least six (6) times a year.
It may be convened in special session by the
Chairman or at the request of three (3)
Directors.
Section 5 – The Board of Directors shall
designate the days when it shall meet in
regular session, but it shall meet at least
six (6) times a year. It may be convened in
special session by the Chairman or at the
request of three (3) Directors. (Two-thirds
(2/3) of the number of directors as fixed
in the articles of incorporation shall
constitute a quorum for the transaction
of corporate business, except for the
election of officers, which shall require
the presence of all directors.
Participation of directors, including
voting, at board meetings can be in
person, through remote communication,
such as videoconferencing,
teleconferencing or other alternative
modes of communication allowed by the
Securities and Exchange Commission.
Participation and voting cannot be done
by proxy.
Art. IV, Sec. 7 The Board of Directors shall have the
following duties, powers and attributes, in
addition to those assigned to it by the
Corporation Code and other sections of
these By-Laws:
a. Determine the period, manner and
conditions under which the Corporation shall engage in the kinds of businesses comprised in Article II of the Articles of Incorporation;
b. Determine the manner in which the
corporate capital shall be invested, subject to the provisions of Article II of these By-Laws;
c. Make rules for the internal regulation of
the company;
d. Create committees and other bodies it may deem advantageous and necessary in running the affairs of the Corporation, as well as appoint advisory Directors who can participate in board deliberations but whose functions shall be strictly advisory and non-voting; and appoint officers as the Board may deem necessary, and fix their duties and
Section 6 - The Board of Directors shall
have the duties, powers and attributes,
assigned to it by the Corporation Code, as
may be amended from time to time,
other sections of these By-Laws, the
Board Charter and the Corporate
Governance Manual. (

S E C F O R M 1 7 - A 177
powers; (As Amended on 4 December 2014).
e. Determine the creation of branches,
agencies, office departments of any class, under the conditions it may deem convenient;
f. Decide as to the safekeeping of the
funds of the Corporation, open current accounts, fixed deposit accounts and savings accounts with any bank authorized to operate in the Philippines and/or abroad;
g. Approve the budgets and general
expense accounts of the Corporation;
h. Fix annually the percentage to be written off on all capital expenditures of the Corporation such as buildings, furniture and fixtures, etc. and determine the distribution of profits and dividends.
i. Submit annually to the annual meeting
of stockholders the Balance Sheet, Profit and Loss Statement and Annual Report on the condition of the Corporation;
j. Call special meetings of stockholders;
k. Authorize any other person or persons it
may deem fit, aside from the Chairman of the Executive Committee, to purchase, sell, or mortgage the real or personal properties of the Corporation;
l. Authorize any other person or persons it
may deem fit, aside from the Chairman of the Executive Committee, to cancel mortgages or pledges executed as securities for loans and bonds when the mortgages have been repaid to the Corporation and when the bonds have been cancelled;
m. Determine the time and manner of
issuance of unissued stocks and treasury shares of the Corporation (As amended on 4 December 2014);
n. Fix, upon the recommendation of the
Chairman of the Executive Committee, the budget of administration expenses;
o. Determine the manner and conditions
under which employees of the Corporation shall be granted pensions, retirement gratuity or life insurance protection;
p. Institute, maintain, defend, compromise
or drop any litigation in which the Corporation or its officers may be interested in as plaintiff or defendant in connection with the business of the Corporation and grant extension of time for the payment or settlement of any indebtedness in favor of the Corporation;

S E C F O R M 1 7 - A 178
q. Settle any doubts that may arise relative to the interpretation of these By-Laws and supply any omissions, reporting thereon to the stockholders’ General Meeting for such action as it may see fit to take.
- - Section 7 – Directors with interest,
potential or otherwise, in any related
party transaction shall timely and fully
disclose any and all material facts and
abstain from deliberations on and
approval of the same without prejudice
to compliance with the requirements of
the law and the rules and regulations of
the Securities and Exchange
Commission, as may be amended from
time to time. Material related party
contracts, as defined in applicable laws,
rules and regulations of the Securities
and Exchange Commission, shall be
approved by at least two-thirds (2/3) of
all the directors, including at least a
majority of the independent directors.
Art. IV, Sec. 8 Directors and officers may borrow money
from the Corporation subject to review and
approval to ensure that they are at arm’s
length, the terms are fair, and they will inure
to the best interest of the Corporation and its
shareholders, in accordance with the
Corporation’s Policy on Related Party
Transactions.
-
Art. IV, Sec. 9 The corporate signature required for
contracts, powers of attorney, etc., of all
kinds shall be that of the Chairman of the
Executive Committee alone, or that of any
other person or persons that the Board may
designate.
Checks and orders of payment shall be
signed by the Chairman of the Executive
Committee, or by the President, or by the
Chief Finance Officer or Treasurer, or by the
persons or persons that the Board may
designate.
-
Art. IV, Sec. 10 The Chairman of the Board of Directors shall
have the following powers:
a. To preside at all of stockholders’ meetings and meetings of the Board of Directors; and
b. To exercise such other powers which are
given him by these By-Laws.
Section 8 - The Chairman of the Board of Directors shall have the following powers: a. To preside at all of stockholders’
meetings and meetings of the Board of Directors;
b. To cast the deciding vote in case of
a tie in the stockholders’ meetings or in the Board meetings; and
c. To exercise such other powers which
are given him by these By-Laws.
Art. IV, Sec. 11 Likewise, the Chairman of the Executive Committee shall manage the business of the Corporation and shall have the following additional powers and duties:
a. Prepare semi-annually the budget of
administration expenses;
Section 10 – With the consent of the Board of Directors, the Chairman of the Executive Committee may delegate to any of the officers of the Corporation any and all powers granted him under this section, provided, however, that such delegation shall not divest the

S E C F O R M 1 7 - A 179
b. Appoint and discharge the employees occupying the positions authorized by the Board of Directors or by the Executive Committee;
c. Supervise the accounting and cash and
sign, with the President and the Chief Finance Officer or Treasurer, the Balance Sheet, Profit and Loss Statement and Annual Reports.
d. Attend to the correspondence and sign
receipts for incoming monies. With the consent of the Board of Directors, the Chairman of the Executive Committee may delegate to any of the officers of the Corporation any and all powers granted him under this section, provided, however, that such delegation shall not divest the Chairman of the authority to exercise the same powers.
Any delegation of powers made by the
Chairman of the Executive Committee
pursuant to the provisions of the next
preceding paragraph should likewise be
submitted for ratification and confirmation at
the next annual meeting of stockholders.
Chairman of the authority to exercise the same powers.
Any delegation of powers made by the Chairman of the Executive Committee pursuant to the provisions of the next preceding paragraph should likewise be submitted for ratification and confirmation at the next annual meeting of stockholders.
Art. IV, Sec. 20 Each Director shall be entitled to receive
from the Corporation, pursuant to a
resolution of the Board of Directors, fees and
other compensation for his services as
Director. The Board of Directors shall have
the sole authority to determine the amount,
form and structure of the fees and other
compensation of the Directors. In no case
shall the total yearly compensation of
Directors exceed one percent (1%) of the net
income before income tax of the Corporation
during the preceding year.
The compensation and remuneration
committee of the Board of Directors shall
have the responsibility of recommending to
the Board of Directors the fees and other
compensation for directors. In discharging
this duty, the committee shall be guided by
the objective of ensuring that the level of
compensation should fairly pay directors for
work required in a company of the
Corporation’s size and scope.
Section 14 – Directors shall be entitled to
receive from the Corporation, pursuant to a
resolution of the Board of Directors, fees
and other compensation for their services.
In no case shall the total yearly
compensation of Directors exceed one
percent (1%) of the net income before
income tax of the Corporation during the
preceding year.
The Personnel and Compensation
Committee of the Board of Directors shall
have the responsibility of recommending to
the Board of Directors the fees and other
compensation for directors. In discharging
this duty, the committee shall be guided by
the objective of ensuring that the level of
compensation should fairly pay directors for
work required in a company of the
Corporation’s size and scope. No Director
shall be involved in deciding his own
remuneration during his incumbent
term.
Art. V OF MANAGEMENT OF MANAGEMENT AND OFFICERS
Art. V, Sec. 1 Management stands as the locus of
decision-making for the day-to-day affairs of
the Corporation.
Management stands as the locus of
decision-making for the day-to-day affairs
of the Corporation and is primarily
accountable to the Board of Directors
for the operations of the Corporation.
Art. V, Sec. 2 Management is primarily accountable to the
Board of Directors for the operations of the
Corporation. As part of its accountability, it is
also obligated to provide the Board with
complete, adequate information on the
-

S E C F O R M 1 7 - A 180
operations and affairs of the Corporation in a
timely manner. It shall inform the Board
regularly, promptly and comprehensively
about any issues concerning the
Corporation’s strategy, risk management and
compliance.
- - Section 2 – The Chief Executive Officer shall determine the Corporation’s strategic direction and formulate and implement its strategic plan on the direction of the business, oversee the operations of the Corporation and manage human and financial resources in accordance with the strategic plan , and such other powers which may be assigned to him by the Board. Section 3 – The President shall have exercise general supervision of the business, affairs and property of the Corporation, and over its officers and employees and such other the powers which may be delegated to him by the Chairman of the Executive Committee, with the consent of the Executive Committee. Any delegation of powers by the Chairman of the Executive Committee to the President shall be submitted for ratification and confirmation by the stockholders pursuant to the provisions of the last paragraph of Section 10 of Article IV. In the absence of the President, the Acting President, shall be, in this order of precedence, (a) The Chief Executive Officer; (b) the Chairman of the Executive Committee; and (c) any Senior Officer, as may be determined by the Board of Directors. Section 4 – The Treasurer or a Vice President (or Managing Director) so appointed by the Board of Directors shall have custody of the funds, credit instruments and documents of the Corporation and shall furnish a bond, conditioned on the faithful performance of this duties, in a sum to be fixed by the Board of Directors. Section 5 – The Secretary shall prepare and keep the minutes of all meetings of the Board of Directors and stockholders and attend to the correspondence and files of the Corporation, sign, jointly with the President, all stock certificates, keep and affix the Corporate seal, record all transfers of stock and cancellations and keep all stock certificates transferred, likewise, keep a list in alphabetical order of all stockholders of the Corporation and of their residences and the shares owned by each, and perform all other duties which may be assigned to him by the Board of Directors.

S E C F O R M 1 7 - A 181
Section 6 – The Compliance Officer shall ensure compliance by the Corporation, its directors and officers with applicable laws, rules and regulations, and governance issuances of regulatory agencies, proper onboarding of new directors, identification and appropriate resolution of any compliance issues, and the integrity and accuracy of all documentary submissions to regulators, and perform all other duties which may be assigned to him by the Board of Directors.
Section 7 – In case of illness or absence
of any officer of the Company, he shall
be temporarily replaced by any other
officer that the Chairman of the
Executive Committee may designate.
- - ARTICLE VIII
ARBITRATION Section 1 – Any dispute, controversy or claim between the Corporation and its stockholders arising from, relating to, or in connection with the implementation of the articles of incorporation or by-laws, or from intra-corporate relations, except those involving criminal offenses and interests of third parties, may be referred to and resolved by arbitration in accordance with prevailing Philippine Dispute Resolution Center, Inc. (PDRCI) Arbitration Rules and Securities and Exchange Commission Rules and Regulations. Section 2 – The number of arbitrators shall be three (3) appointed by the Philippine Dispute Resolution Center, Inc. (PDRCI) and the place of arbitration shall be in Metro Manila, Philippines. The language to be used for the arbitral proceedings shall be English. Section 3 – The parties shall be bound by the award rendered by the Arbitral Tribunal and confirmed by the appropriate Regional Trial Court. Arbitration shall not be available for disputes involving claims in excess of One Million Pesos (Php1,000,000.00) or involving the determination of the fair valuation of shares in appraisal proceedings.
Art. VIII MISCELLANEOUS AND TRANSITORY
PROVISIONS
ARTICLE IX
MISCELLANEOUS AND TRANSITORY
PROVISIONS
For further details please refer to Item 13.A. Corporate Governance of Part IV Corporate Governance and Sustainability.

S E C F O R M 1 7 - A 182
Item 6. Management’s Discussion and Analysis or Plan of Operations 2019 Full-Year Highlights
▪ Ayala Corporation’s full year earnings amounted to ₱35.3 billion, including the divestments gains of ₱23.6 billion from AC Education and AC Energy.
▪ Strong consumer driven revenue growth of ALI, Globe and BPI drove the bottom-line.
▪ Results tempered by the recognition of a remeasurement loss of ₱18.1 billion for Manila Water.
▪ Slowdown in AC Industrials resulted in a net loss of ₱2.4 billion. In December 2019, Ayala recognized a remeasurement loss of ₱18.1 billion as a result of the reclassification of its investment in Manila Water (MWC) as asset held under PFRS 5 (the accounting standard for assets held for sale). This accounting standard requires applying a fair market value accounting for Ayala’s investment in MWC, if the completion of the divestment and or subsequent loss of voting control is expected to occur within one year from the date of the financial statement. It also requires the assets and liabilities of MWC to be presented as one line item in the consolidated balance sheet and P&L in 2019 as opposed to line by line consolidation in prior years. Please see as summary table below showing the effect of accounting for MWC investment under PFRS 5.
Consolidated Sales of Goods and Services Sale of goods and rendering services rose three percent to ₱264.9 billion on higher revenues from Ayala Land’s sale of commercial lots and office spaces, middle-market residential products, and improved performance of its leasing segments. This was further supported by increments from AC Energy’s retail electricity supply unit and AC Health. However, this was partly offset by AC Industrials’ lower revenues. Real Estate The conglomerate’s real estate arm, Ayala Land, saw a 13 percent growth in its bottom-line in 2019, which reached ₱33.2 billion for the year. Meanwhile, its total revenues increased by two percent to ₱168.79 billion from ₱166.25 billion the previous year, mainly supported by office and commercial and industrial lot sales as well as higher contribution of new leasing assets. Property development revenues was slightly down two percent year-on-year, reaching ₱117.6 billion in 2019. The performance was due to an eight percent decline in residential revenues given the lower
(in million pesos)
Pre - MWCI
Reclass
PFRS 5
Reclass Final 2018
Continuing Operations
Revenues 284,704 (19,797) 264,907 256,891
Share of profit of associates & joint ventures 22,998 (654) 22,344 19,761
Interest & other income 55,995 (12,340) 43,655 18,642
363,697 (32,791) 330,906 295,293
Cost of sales 198,207 (8,223) 189,983 189,707
General and administrative 75,737 (43,624) 32,113 25,957
Interest expense & other charges 35,337 (12,928) 22,410 17,379
Provision for income tax 12,433 1,551 13,984 13,367
321,714 (63,225) 258,490 246,410
Net income from continuing operations 41,982 30,433 72,416 48,884
Operations segment under PFRS 5 - (30,433) [a] (30,433) 6,181
Net Income (NIAT) 41,982 - 41,982 55,065
NIAT - owners of Parent Co 35,279 35,279 31,818
NIAT - noncontrolling interests 6,703 6,703 23,247
2019
[a] Includes the 2019 NIAT of MWCI less consolidation adjustments and the P35.2Bn after-tax
remeasurement loss on MWCI Investment (P18.1 Bn AC share).

S E C F O R M 1 7 - A 183
contribution of its Ayalaland Premier and ALVEO brands as most of its vertical projects recognized in 2019 were booked in previous periods and are nearing completion. On the other hand, it exhibited growth in office for sale developments and commercial and industrial lots, which rose 12 percent and 46 percent, respectively. During the year, Ayala Land introduced three new estates and successfully launched ₱158.9 billion worth of property development projects. On the other hand, commercial leasing saw double-digit growth from all its segments as it expanded 13 percent to ₱39.3 billion during the year. Revenues from shopping centers grew 11 percent to ₱22.0 billion from ₱19.91 billion on the back of sustained growth from its stable malls and increased contributions from its newly opened malls, Ayala Malls Feliz, Capitol Central, and Circuit Makati. Similarly, office leasing revenues increased by 12 percent to ₱9.67 billion from previous year’s ₱8.61 billion, with the new offices in Ayala North Exchange, Vertis North, and Circuit Makati improving the segment’s performance. Revenues coming from hotels and resorts rose by 19 percent to ₱7.62 billion from ₱6.39 billion in 2018 on strong patronage of Seda Ayala Center Cebu and Seda Lio. Ayala Land expanded its leasing portfolio with malls and offices totaling 2.1 million and 1.2 million square meters of gross leasing area, respectively, and hotels and resorts with 3,705 rooms. Ayala Land spent a total of ₱108.7 billion in capital expenditures in 2019. Most of the amount supported the construction of residential projects at 40 percent of total. Following this,26 percent was spent on the company’s rental assets, 17 percent on land acquisition, 14 percent on estate development and the rest on other investments. Ayala Land, through its subsidiary, AREIT Inc., became the first Philippine company to file a real estate investment trust (REIT) offering to the Securities and Exchange Commission last February 7, 2020. AREIT is seeded with Grade A office assets located in Makati CBD and is expected to expand its portfolio with new acquisitions in the future. Through this initial capital market transaction, Ayala Land hopes to pave the way for the development of a REIT market in the country, bringing another milestone to the Philippine stock market. Ayala Land seeks to do an Initial Public Offering (IPO) of AREIT, Inc. after receiving the regulatory approvals from the SEC and the PSE. Water Manila Water’s full-year net profits dipped 16 percent year on year to ₱5.5 billion as the water supply shortage in March severely impacted the East Zone concession while some cost-side challenges also weighed down on profitability. The decline in La Mesa dam water levels caused water service availability to drop significantly, with the dam reaching its lowest level at 68.5 meters in April 2019. To assist severely affected customers, Manila Water implemented a one-time Bill Waiver Program. Additionally, in July, raw water allocation from Angat Dam hit its lowest, with releases limited to 35 cubic meters per second for the MWSS Concessionaires. To mitigate this, Manila Water pushed for network efficiency to maintain service availability by ensuring water service of at least 7 pounds per square inch (psi) of pressure, enough to reach the ground floor level, enabling it to serve more than 7 million people covering over 1.3 million households in the East Zone. Throughout 2019, Manila Water also affirmed its wastewater commitment of providing 32 percent coverage of the East Zone by 2021. Wastewater coverage in the East Zone is currently over 30 percent, equivalent to two million people served through nearly 400 kilometers of laid sewer network. Wastewater coverage was only at three percent prior to Manila Water taking over operations from MWSS in 1997. Considering these factors, costs and expenses for the East Zone concession increased 32 percent to ₱6.4 billion for the year, mainly driven by the ₱534 million penalty imposed by MWSS and additional service recovery and operations costs. In all, the Manila concession’s net income for the year was at ₱5.1 billion, a decline of 22% from 2018. In February, Ayala announced a strategic partnership with an infrastructure company of Enrique K. Razon Jr., Prime Metroline Holdings Inc., through a company that it will incorporate for the transaction (hereafter, “Trident Water”), with the acquisition of a 25 percent stake in Manila Water. Ayala remains a shareholder with a 38.6 percent stake. Subsequently, Ayala announced that as part of the shareholder agreement to be executed among Ayala, its wholly owned subsidiary Philwater Holdings Company, and Trident Water, the conglomerate’s Executive Committee approved the grant of proxy rights by Philwater

S E C F O R M 1 7 - A 184
to Trident Water over such number of preferred shares to enable the latter to achieve 51 percent voting interest in Manila Water. Upon the grant of proxy rights to Trident Water, Ayala’s effective voting interest in Manila Water will stand at 31.6 percent. The shareholders’ agreement will become effective after the closing of the subscription agreement, which will occur after certain conditions are met, including required lenders’ consent and regulatory approvals. Power Ayala’s more recent core business, AC Energy, registered net profits of ₱24.6 billion in 2019, lifted by contribution from its solar projects in Vietnam, recovery of costs incurred from adjustments in the construction and operations of its power plants, and gains from the partial divestment of its thermal assets. AC Energy increased its attributable energy output in 2019 by 25% to 3,500 Gigawatt hours, of which 50% came from renewables sources. As it shifts its portfolio towards renewable energy, AC Energy has a pipeline of more than 1,000MW in various renewable projects in the Philippines and overseas that are expected to reach financial close within 2020. This will bring AC Energy’s renewable energy capacity close to 2,000MW by the end of 2020, in line with its goal of achieving 5,000MW of renewables capacity by 2025. AC Energy saw several developments that supported its international businesses. The start of operations of the company’s solar farms in Vietnam supported profits during the year. Three plants with a total of 410MW commenced commercial operations in the second quarter, in time to meet Vietnam’s solar feed-in tariff deadline. AC Energy also announced a joint venture project with UPC Solar Asia Pacific, its existing partner for various projects in and out of the Philippines, for the development of solar projects in the Asia-Pacific region. In addition, AC Energy and Yoma Strategic Holdings Ltd. also announced its decision to form a 50:50 joint venture to drive the growth of Yoma Micro Power (S) Pte. Ltd., and jointly explore developing around 200MW of additional renewable energy projects within Myanmar including participation in large utility scale renewable projects. Locally, subsidiary AC Energy Philippines signed share purchase agreements to increase its stakes in the North Luzon Renewables wind project, and the Sacasol and Islasol solar plants. It also started the construction of the 120MW Alaminos solar plant and the 150MW Ingrid peaking plant. In line with its commitment to scale up its renewable energy investments, AC Energy issued two green bonds in 2019, effectively raising US$810 million in fresh capital to support its pipeline of renewable energy projects. The first issuance, which happened in January-February 2019, was the power company’s maiden green bonds and fetched a total amount of US$410 million. The bonds were the first publicly syndicated Climate Bond Initiative-certified US$ Green Bonds in Southeast Asia. Subsequently in November, AC Energy raised US$400 million through the first ever US dollar denominated fixed-for-life green bond issued globally. The perpetual green bonds were listed on SGX-ST and certified under the ASEAN Green Bonds Standards by the Philippine Securities and Exchange Commission on 18 November 2019. Industrial Technologies AC Industrials recorded a net loss of ₱2.4 billion as headwinds in both the electronics manufacturing services industry and the global auto industry hampered earnings across its several business lines. The company’s EMS platform, Integrated Micro-Electronics Inc., continued to weather challenges in its main market segments, particularly the industrial and consumer spaces. As the automotive sector contracted globally, most notably in China, IMI’s revenues, dropped 17 percent year-on-year. Additionally, investments in capacity and technical capabilities for future growth increased the company’s overhead expenditures, which partly affected gross profit margins. Overall, these factors hindered IMI growth in 2019, with the company posting a net loss of US$7.8 million for the year. Revenues from IMI’s wholly owned operations tallied at US$1 billion, down 7 percent from the previous year. The company’s Asian operating units dropped a total of 11 percent, as a function of the aforementioned slowdown in China’s automotive market for the year. This was offset by the performance of IMI Europe, also largely automotive based, which grew three percent year-on-year as the company’s newest production facility in Serbia continued its ramp-up in its first full year of

S E C F O R M 1 7 - A 185
operations. In parallel, IMI’s Mexico operations, which serve the North American markets, continued their robust trajectories with a 50 percent revenue growth in 2019. IMI’s core subsidiaries, Via Optronics and STI, Ltd., posted combined revenues of $248 million, a decline of 21 percent from the previous year. VIA’s drop was mainly driven by the slump in the overall computing consumer segment and the delay in the release of a new generation component from one of its major customers. Meanwhile, the uncertainty over Brexit, which persisted at least through 2019, caused some delays in the awarding of several contracts where STI is a key competitor. AC Industrials’ Philippine vehicle distribution and retail arm, AC Motors, recorded a net loss of ₱337 million on lower sales volumes across its Honda, Isuzu, Kia, and Volkswagen brands. The domestic automotive market grew moderately in 2019 by four percent to over 416,000 vehicles sold. As the industry recovers from the previous year’s sizable, policy-driven decline, competition continues to be highly competitive, with over 50 players vying for slowly recovering customer demand. Meanwhile, AC Industrials’ startup investments, Merlin Solar, MT Technologies, and C-CON, recorded higher net losses during the period as they continue to grow their revenue pipelines, invest in capacity and infrastructure, and manage underutilization of capacity resulting from the global downturn in automotive and manufacturing. Share in Net Profits of Associates and Joint Ventures Share in net profits of associates and joint ventures expanded 13 percent to ₱22.3 billion on Globe’s higher revenues and lower non-operating expenses and BPI’s higher interest and non-interest income. This was, however, partly offset by lower earnings from AC Energy’s investee companies. Banking BPI’s net earnings, which was supported by solid core income, higher securities trading gains, and steadily growing fee-based businesses, jumped 25 percent to ₱28.8 billion in 2019. Total revenues grew 20 percent to ₱94.3 billion as both net interest income and non-interest income saw robust growth for the full year. BPI’s net interest income was up 18 percent to ₱65.9 billion on the back of a 9-percent improvement in average asset base and a 24-basis point expansion in net interest margin. Net interest margin increased from 3.11% in 2018 to 3.35% in 2019, as a result of asset yields rising 69 basis points, partially offset by higher cost of funds. Total loans grew 9 percent year-on-year, reaching ₱1.48 trillion, primarily driven by consumer loans which grew 13 percent, much faster than corporate and SME loans, which also grew 8 percent and 6 percent, respectively. Total deposits rose 7 percent to ₱1.70 trillion during the year. The bank’s CASA ratio stood at 69.1%, while the loan-to-deposit ratio was at 87.0%. Non-interest income was ₱28.4 billion, an increase of 25 percent versus 2018, primarily from higher securities trading gains and fee-based income. Fees, commissions, and other income increased by 12 percent, driven by higher fees from credit cards, transaction banking, branch services, and digital channels. Operating expenses totaled ₱50.1 billion, higher by 15 percent from the previous year. Cost-to-income ratio was at 53.1%, lower than the 55.5% recorded in the prior year. Provision for losses for 2019 was ₱5.8 billion, increasing the Bank’s loss coverage ratio to 104.8%. NPL ratio improved to 1.66% from 1.85% in 2018. The bank’s total assets stood at ₱2.21 trillion, higher by 6 percent year-on-year, with return on assets at 1.38%. Total equity amounted to ₱269.6 billion, with a common equity tier 1 ratio of 15.17% and capital adequacy ratio of 16.07%, both well above regulatory requirements. Return on equity for 2019 was at 10.97%. BPI also issued over P3.1 billion of Long-Term Negotiable Certificates of Time Deposit (LTNCTDs) in October 2019. The LTNCDs have a tenor of 5.5 years and an interest rate of 4% p.a. In December 2019, BPI Family Savings Bank (“BFSB”), the Bank’s wholly-owned thrift bank and consumer lending unit, issued ₱9.6 billion of 2.5-year bonds with an interest rate of with 4.3% p.a. Telco

S E C F O R M 1 7 - A 186
Globe’s net income ended at ₱22.3 billion, up 20 percent, boosted by the company’s data-related products and services. Overall, Globe’s total service revenues were up 12 percent to ₱149 billion, lifted by data-related services, which accounted for 71 percent of the total. The company’s strategy is aligned to the evident growth in data driven customers across all segments. Mobile data users rose 7 percent to 39.6 million subscribers, which consequently pushed mobile data traffic up substantially by 78 percent to 1.7 petabytes. Likewise, the company’s home broadband subscriber base increased 25 percent to over 2 million customers as Globe Home Pre-paid Wifi gained more traction in its segment. In order to further solidify its foothold in the home broadband space through an expanded portfolio of data offerings, Globe also launched At Home Air Fiber 5G on July 2019. Globe’s EBITDA ended at ₱76 billion, up 17 percent due to robust service revenues as well as subdued operating expenses. Operating expenses grew a modest eight percent despite higher costs related to marketing, subsidies, and staff as interconnect charges dropped significantly during the period. The company’s EBITDA margin was steady at 51 percent for 2019. Capital expenditure reached a record-high of ₱51 billion, 18 percent higher year-on-year. This was allocated to fast-tracking network rollout. During the year, Globe put up more sites and added more 3G and 4G base stations. Costs and Expenses General and administrative expenses rose 24 percent to ₱32.1 billion, mainly driven by AC Energy’s higher manpower costs, professional fees, and restructuring costs related to the partial divestment of its thermal assets drove the increase. AC Industrials’ manpower and advertising costs as well as AC Health’s clinic network expansion and the consolidation of Generika and Entrego into AC Health and AC Infra, respectively, likewise drove the higher GAE. Balance Sheet Highlights The company’s balance sheet remains strong with enough capacity to support its future investments and cover dividend and debt obligations. At the end of 2019, Ayala’s total assets stood at ₱1.3 trillion. Investment properties expanded 8 percent to ₱246.7 billion on the back of ALI’s malls and office expansion. Investments in associates and joint ventures, meanwhile, ended at ₱246.7 billion on account of higher equity in net earnings contribution of BPI and Globe as well as additional investments made by Ayala Land, AC Health, AC Infra, and AC Ventures. At the end of 2019, total debt at the consolidated level stood at ₱405.3 billion, two percent lower from its end-2018 level, despite additional borrowings of Ayala Land and AC Energy as MWCI’s total debt of ₱56.4 billion was reclassified to liabilities under PFRS 5. Ayala’s parent level cash stood at ₱22.6 billion, with net debt at ₱83.2 billion. Ayala’s parent net debt-to-equity ratio stood at 63 percent. The conglomerate’s loan-to-value ratio, the ratio of its parent net debt to the total value of its assets, was at 6.5 percent at the end 2019. Capital Expenditure The consolidated capital expenditure of the group reached ₱215 billion in 2019, mainly driven by Ayala Land and Globe, which respectively tallied ₱109 billion and ₱51 billion in capital outlay for the year. Parent-only capital expenditure, on the other hand, reached ₱30 billion, which went mostly to the newer businesses of Ayala. For 2020, the Ayala Group has programmed ₱275 billion in capital expenditures, of which ₱20.8 billion has been earmarked under the parent to support the emerging businesses in its portfolio.

S E C F O R M 1 7 - A 187
Key performance indicators of the Company and its significant subsidiaries The table sets forth the comparative key performance indicators of the Company and its significant subsidiaries.
Ayala Corporation (Consolidated)
(In million pesos, except ratios) 2019 2018 2017 Income* 295,265 283,801 249,669 Net Income Attributable to Equity Holders 35,279 31,818 30,264 Total Assets 1,345,286 1,197,926 1,021,546 Total Debt 405,338 412,262 350,612 Total Stockholders' Equity 509,314 469,108 411,092 Current Ratio1 1.51 1.25 1.39 Debt to Equity Ratio2 0.80 0.88 0.85 * Excludes MWCI accounts which are shown as Operations of the segment under PFRS 5
(see Note 25 of the Group's consolidated financial statement)
Ayala Land, Inc.
(In million pesos, except ratios) 2019 2018 2017 Revenue 166,705 163,747 139,373 Net Income Attributable to Equity Holders 33,188 29,241 25,305 Total Assets 713,923 668,820 573,992 Total Debt 211,097 187,099 174,386 Total Stockholders' Equity 242,706 220,221 192,263 Current Ratio1 1.30 1.26 1.30 Debt to Equity Ratio2 0.87 0.85 0.91
Integrated Micro-Electronics, Inc.
(In thousand US dollars, except ratios) 2019 2018 2017 Revenue 1,250,366 1,349,400 1,090,588 Net Income Attributable to Equity Holders -7,781 47,187 34,002 Total Assets 1,096,336 1,077,197 920,918 Total Debt 268,475 324,314 300,154 Total Stockholders' Equity 483,779 410,635 276,595 Current Ratio1 1.49 1.31 1.28 Debt to Equity Ratio2 0.55 0.80 1.09
Manila Water Company, Inc.
(In million pesos, except ratios) 2019 2018 2017 Revenue 21,950 19,836 18,516 Net Income Attributable to Equity Holders 5,496 6,524 6,147 Total Assets 134,602 122,533 103,394 Total Debt 56,356 51,647 39,724 Total Stockholders' Equity 55,991 53,621 48,561 Current Ratio1 0.66 0.59 1.09 Debt to Equity Ratio2 1.01 0.96 0.82 AC Energy, Inc.
(In million pesos, except ratios) 2019 2018 2017 Revenue 15,788 10,059 6,501 Net Income Attributable to Equity Holders 24,966 4,070 3,509 Total Assets 209,055 105,443 79,031 Total Debt 26,116 46,834 32,156 Total Stockholders' Equity 87,754 54,818 42,990 Current Ratio1 2.34 2.78 1.98 Debt to Equity Ratio2 0.30 0.85 0.75 1 Current Assets/ Current Liabilities. 2 Total Debt/ Total Stockholders' Equity (Total Debt includes short term debt, long-term debt both current and noncurrent portion).

S E C F O R M 1 7 - A 188
Causes for any material variances (Increase or decrease of 5% or more in the financial statements)
The December 31, 2019 and 2018 consolidated financial statements show several significant increases in Balance Sheet and Income Statement accounts relating to five (5) key factors: 1. Adoption of new accounting standard PFRS 16 (Leases) which give rise to new accounts in the
balance sheet namely Right-of-use Assets and Lease Liabilities. The impact to income statement is shown in the depreciation (classified under cost of sales and general & administrative expenses) and interest expenses of the Group (Note 3 of notes to financial statements).
2. Significant acquisitions and divestments as follows (see Notes 2 and 10): 1. Merger of AC Education and IPeople with IPeople as the surviving entity and now an AJV
entity of AC from previously consolidated subsidiary. 2. AC Energy’s increase of ownership share in SLTEC (previously classified as AJV entity) from
35% in December 2018 to 80% (now a subsidiary). 3. Acquisition of additional 2.5% stake in each of the Generika companies, which resulted to
52.5% ownership of AC Health as of December 31, 2019.
3. Reclassification of the investment in MWCI as assets under PFRS/ IFRS 5. With MWCI and Prime Metroline Holdings signing of a subscription agreement in February 2020, MWC qualified as a group held for deemed disposal. Since the operations of MWC represents the Group’s water infrastructure business segment, it qualifies as a discontinued operation of segment under PFRS 5 in the Group’s consolidated financial statements (see Notes 2 and 25).
4. Reclassification of the investment in GNPK as assets under PFRS/ IFRS 5. With AC Energy and Power Partners transaction in July 2019 which resulted in indirect control of AC Energy over GNPKauswagan (GNPK), the assets and liabilities of GNPK, a subsidiary, were reclassified into assets held for sale and liabilities of unit for disposal as of December 31, 2019 (see Notes 2 and 25).
5. Reclassification of accounts arising from PFRS 15: Reclassification of contract assets and liabilities as permitted under PIC’s September 2019 letter response to real estate industry which ALI adopted to comply with PFRS 15. As a result, ALI’s contract assets and liabilities are classified as receivable and other current liabilities for year end 2019 and 2018, respectively (see Note 3).
The summarized impact of these transactions and reclassifications in the balance sheet are shown below. The impact to income statement is shown in the discussion of income statement variances.
(Amounts in Millions) December 31, 2019
December 31,
2018 Inc (Dec)
Pre-PFRS PFRS 16
PFRS 5
GNPK PFRS 5 MWC Audited Restated
2019 Audited vs.
2018 Restated
(Item 1) (Item 4) (Item 3)
Cash and cash equivalents 107,354₱ -₱ (4,990)₱ (8,958)₱ 93,406₱ 60,624₱ 32,781₱ 54%
Short-term investments 13,497 - - (109) 13,388 5,956 7,432 125%
Accounts and notes receivable 135,032 - (2,345) (1,819) 130,868 153,992 (23,123) -15%
Inventories 135,803 - (396) (342) 135,065 120,560 14,504 12%
Other current assets 68,990 - (4,144) (1,913) 62,933 57,728 5,205 9%
Assets under PFRS 5 (0) - 60,705 109,762 170,467 10,162 160,304 1577%
Noncurrent accounts and notes receivable 55,807 - (34) (53) 55,720 41,803 13,917 33%
Investments in associates and joint ventures 256,511 - - (9,780) 246,731 240,141 6,591 3%
Investment properties 246,732 - - - 246,732 227,646 19,087 8%
Property, plant and equipment 138,759 - (47,109) (2,868) 88,782 104,492 (15,711) -15%
Right-of-use assets - 18,516 (296) 18,220 - 18,220 -
Service concession assets 77,947 - - (76,308) 1,639 98,404 (96,766) -98%
Deferred tax assets - net 13,411 2,682 - (1,846) 14,247 15,546 (1,299) -8%
Other assets 74,246 - (1,687) (5,470) 67,089 60,870 6,218 10%
Total Assets 1,324,088₱ 21,198₱ -₱ -₱ 1,345,286₱ 1,197,926₱ 147,360₱ 12%
ASSETS

S E C F O R M 1 7 - A 189
Balance Sheet Items As at December 31, 2019 vs. 2018 (Restated) Cash and cash equivalents – 54% increase from ₱60,624 million to ₱93,405 million Increase due to AC’s proceeds from loans, dividends received and net proceeds from reissuance and redemption of preferred shares, partly offset by buy-back of common shares, dividends and loan payments; AC Energy’s proceeds from sale of AA Thermal shares, from Green bonds and fixed-for-life (FFL) and dividends received, partly offset by acquisition of Phinma Energy; and AYC’s proceeds from FFL bonds. Use of cash includes ALI’s funding for land acquisitions, real estate expansion projects and property acquisitions, partly funded by proceeds for issued bonds and loans. This account is at 7% and 5% of the total assets as of December 31, 2019 and 2018, respectively. Short-term investments – 125% increase from ₱5,956 million to ₱13,388 million Increase due to additional placements by AC Energy and AYC partly offset by maturity of placements of ALI. This account is 1% and below 1% of the total assets as of December 31, 2019 and 2018, respectively. Accounts and notes receivable (current) – 15% decrease from ₱153,992 million to ₱130,869 million Decrease attributable to ALI’s decline affected by bookings from residential and sale of trade accounts to banks; IMI’s lower receivables caused by lower consumer/ telecom business lines from China sales and collections of Philippine accounts; partly offset by increase of AC Energy’s RES business and advances for projects. This account is at 10% and 13% of the total assets as of December 31, 2019 and 2018, respectively. Inventories – 12% increase from ₱120,560 million to ₱135,064 million Increase attributable to ALI’s higher real estate inventories partly offset by IMI’s recoveries of backlogs. This account is at 10% of the total assets as of December 31, 2019 and 2018. Other current assets – 9% increase from ₱57,728 million to ₱62,933 million Increase mainly coming from ALI’s higher prepayments for projects expenses, CWT and input tax. This account is at 5% of the total assets as of December 31, 2019 and 2018. Assets under PFRS 5 – 16x increase from ₱10,162 million to ₱170,467 million December 31, 2019 balance represents total assets of MWCI (₱109,762 million) and GNPK’s (₱60,705 million) as these two entities are considered assets held for sale following certain transactions and condition as discussed in Note 25 and Note 2 of the consolidated audited financial statements. As shown in the table above, MWCI’s key assets are service concession asset and investment in associates and joint ventures, while GNPK’s assets are in property, plant and equipment – causing declines in these accounts year-on-year. Meanwhile, 2018 balance represents accounts of GMCP Mariveles, GNPDinginin and AC Education. This account is at 13% and 1% of the total assets as of December 31, 2019 and 2018, respectively.
(Amounts in Millions) December 31, 2019
December 31,
2018 Inc (Dec)
Pre-PFRS PFRS 16
PFRS 5
GNPK PFRS 5 MWC Audited Restated
2019 Audited vs.
2018 Restated
(Item 1) (Item 4) (Item 3)
LIABILITIES AND EQUITY
Liabilities
Short-term debt 29,789₱ -₱ -₱ -₱ 29,789₱ 39,518₱ (9,730)₱ -25%
Accounts payable and accrued expenses 206,691 - (2,701) (8,573) 195,417 204,758 (9,342) -5%
Income tax payable 2,705 - - (308) 2,397 3,407 (1,010) -30%
Other current liabilities 28,404 - - (9) 28,395 31,929 (3,534) -11%
Liabilities under PFRS 5 0 - 42,885 78,602 121,487 1,075 120,412 11198%
Long-term debt 470,843 - (38,942) (56,351) 375,550 372,743 2,806 1%
Lease liabilities - 22,690 - (308) 22,382 - 22,382 -
Service concession obligation 9,083 - - (9,017) 66 7,839 (7,773) -99%
Deferred tax liabilities - net 8,580 - - (544) 8,036 10,999 (2,964) -27%
Pension liabilities 3,950 - - (194) 3,756 2,590 1,166 45%
Other liabilities 53,239 - (1,242) (3,298) 48,699 53,958 (5,260) -10%
Total Liabilities 813,283 22,690 - - 835,972 728,817 107,155 15%-
Equity
Equity attributable to owners of the parent company 329,626 (819) - 1,467 330,274 290,607 39,667 14%
Reserves under PFRS 5 - - - (1,467) (1,467) - (1,467) -
Non-controlling interests 181,179 (673) - - 180,506 178,501 2,005 1%
Total Equity 510,806 (1,492) - - 509,314 469,108 40,205 9%
Total Liabilities and Equity 1,324,088₱ 21,198₱ -₱ -₱ 1,345,286₱ 1,197,926₱ 147,360₱ 12%

S E C F O R M 1 7 - A 190
Accounts and notes receivable (noncurrent) – 33% increase from ₱41,803 million to ₱55,720 million Increase resulting mainly from ALI’s and AC Energy’s higher receivables. This account is at 4% and 3% of the total assets as of December 31, 2019 and 2018, respectively. Investment Properties – 8% increase from ₱227,646 million to ₱246,732 million Increase attributable to ALI group’s expansion projects mainly on malls and office buildings. This account is at 18% and 19% of the total assets as of December 31, 2019 and 2018, respectively. Property, plant and equipment – 15% decrease from ₱104,492 million to ₱88,782 million Decrease coming from AC Energy’s reclassification of GNPK accounts; partly offset by ALI’s acquisitions. This account is at 7% and 9% of the total assets as of December 31, 2019 and 2018, respectively. Other noncurrent assets – 18% increase from ₱40,088 million to ₱47,304 million Increase pertains to: ALI’s higher project advances and deferred tax; and AYCFL’s hold-out cash for a loan availed by AC. The account also includes the Group’s pension asset amounting to ₱81 million and ₱82 million in December 31, 2019 and 2018, respectively.1 This account is at 4% and 3% of the total assets as of December 31, 2019 and 2018, respectively. Short-term debt – 25% decrease from ₱39,518 million to ₱29,789 million Decrease due to settlements made by IMI and AC Energy as well as AC Industrials’ lower borrowing; partly offset by ALI’s subsidiaries borrowings. This account is at 4% and 5% of the total liabilities as of December 31, 2019 and 2018, respectively. Accounts payable and accrued expenses – 5% decrease from ₱204,758 million to ₱195,416 million Decrease mainly due to ALI’s lower development and project costs of residential and commercial business groups coupled partly offset by AC Energy’s and AC Industrial’s higher trade payables. This account is at 23% and 28% of the total liabilities as of September 30, 2019 and December 31, 2018, respectively. Contract liabilities (current and noncurrent) – 121% increase from ₱114 million to ₱252 million Increase coming from IMI contract liabilities. This account is at below 1% of the total liabilities as of December 31, 2019 and 2018. Income tax payable – 30% decrease from ₱3,407 million to ₱2,397 million Decrease mainly arising from lower tax payable of ALI and IMI groups. This account is below 1% of the total liabilities as of December 31, 2019 and 2018. Other current liabilities – 11% decrease from ₱31,929 million to ₱28,395 million Mainly due to ALI’s lower other current liabilities (deposits, reservation fees and advance rental payments). This account is at 3% and 4% of the total liabilities as of December 31, 2019 and 2018, respectively. Liabilities under PFRS 5 – 112x increase from ₱1,075 million to ₱121,488 million Similar with assets, the 2019 balance represents total liabilities of MWCI (₱78,602 million) and GNPK’s (₱42,885 million) reclassified to this account, similar to the treatment of assets (see Note 25 and Note 2 of the consolidated audited financial statements). As shown in the table above, both entities main liabilities are in long term debt and service concession obligation which caused declines in this accounts year-on-year. 2018 balance represents accounts of AC Education. This account is at 15% and below 1% of the total liabilities as of December 31, 2019 and 2018, respectively.
Long-term debt (current) – 59% decrease from ₱48,481 million to ₱19,884 million Decrease due to loans maturity of ALI and AYC’s actual exchange of its bonds into ALI shares; partly offset by ALI’s bond issuance. This account is at 2% and 7% of the total liabilities as of December 31, 2019 and 2018, respectively. Long-term debt (noncurrent) – 10% increase from ₱324,263 million to ₱355,666 million
1 The Parent Company's pension fund is known as the AC Employees Welfare and Retirement Fund (ACEWRF). ACEWRF is a legal entity separate and distinct from the Parent Company, governed by a board of trustees appointed under a Trust Agreement between the Parent Company and the initial trustees. It holds common and preferred shares of the Parent Company in its portfolio. All such shares have voting rights under certain conditions, pursuant to law. ACEWRF's portfolio is managed by a committee appointed by the fund's trustees for that purpose. The members of the committee include the Parent Company’s Chief Finance Officer, Group Head of Corporate Governance, General Counsel, Corporate Secretary and Compliance Officer, Head for Strategic Human Resources, Treasurer and Comptroller. ACEWRF has not exercised voting rights over any shares of the Parent Company that it owns.

S E C F O R M 1 7 - A 191
Increase due to ALI’s bond issuance, AYC’s FFL bonds issuance and AC Energy’s green bonds and FFL bonds issuance. This account is at 43% and 44% of the total liabilities as of December 31, 2019 and 2018, respectively. Pension liabilities1 – 45% increase from ₱2,590 million to ₱3,756 million Increase attributable to AC parent, ALI and IMI pension liabilities. This account is below 1% of the total liabilities as of December 31, 2019 and 2018. Other noncurrent liabilities – 10% decrease from ₱53,844 million to ₱48,447 million Decrease attributable to ALI’s lower deposits and other liabilities. This account is at 6% and 7% of the total liabilities as of December 31, 2019 and 2018, respectively. Cost of share-based payments – 10% decrease from ₱239 million to ₱215 million Decrease coming from issuance on the exercise of stock ownership plans. This account is below 1% of the total equity as of December 31, 2019 and 2018. Remeasurement losses on defined benefit plan – 140% decrease from negative ₱1,299 million to negative ₱3,117 million Decrease caused by discount rate assumptions. This account is at 1% and below 1% of the total equity as of December 31, 2019 and 2018, respectively. Fair value reserve of financial assets at fair value through other comprehensive income (FVOCI) – 112% increase from negative ₱545 million to positive ₱67 million Increase attributable to higher market value of securities held by BPI group. This account is at below 1% of the total equity as of December 31, 2019 and 2018. Cumulative translation adjustments – 42% increase from ₱2,277 million to ₱3,235 million Increase due to increase in foreign-denominated accounts particularly investments of AC Energy and ACIFL partly offset by movement in forex for PhP vs. USD. Forex of PhP vs USD amounted to ₱50.635 in December 2019 vs. ₱52.58 in December 2018. This account is at 1% and below 1% of the total equity as of December 31, 2019 and 2018, respectively. Equity reserve and Equity conversion option – 111% increase from ₱11,959 million to ₱25,283 million Increase due to gain on sale of ALI shares in relation to AYC’s exchangeable bonds conversions and AC Energy’s consolidation of PHEN. This account is at 5% and 3% of the total equity as of December 31, 2019 and 2018, respectively. Retained Earnings – 14% increase from ₱196,915 million to ₱225,455 million Increase due to overall growth in net income of the group. This account is 44% and 42% of the total equity as of December 31, 2019 and 2018, respectively. Treasury stock – 149% increase from ₱2,300 million to ₱5,738 million Increase due to AC parent’s buy-back of common shares (see Note 21). This account is 1% and below 1% of the total equity as of December 31, 2019 and 2018, respectively.

S E C F O R M 1 7 - A 192
Income Statement items For the Year Ended December 31, 2019 and 2018 (Restated)
Share in net profits of associates and joint ventures – 13% increase from ₱19,761 million to ₱22,344 million Increase coming from Globe’s higher revenues and lower non-operating expenses and BPI’s higher interest and non-interest income; partly offset by AC Energy’s investees lower earnings. As a percentage to total revenue, this account is at 8% and 7% in December 31, 2019 and 2018, respectively. Interest income from real estate and interest income – 20% increase from ₱9,336 million to ₱11,243 million Increase attributable to interest income from ALI and AC Energy groups. General and administrative expenses – 24% increase from ₱25,957 million to ₱32,113 million Increase mainly from AC Energy’s higher manpower costs, professional fees, restructuring costs for sale of thermal assets, partly on consolidation of SLTEC; AC Industrials increase due to higher manpower costs, advertising, transportation and provisions; and AC Health’s clinic expansion and consolidation of Generika. GAE also increased due to the Group’s adoption of PFRS 16 amounting to ₱394 million (see Note 3). Factoring out impact of the new consolidated units, GAE increased by 16% year-on year. As a percentage to total costs and expenses, this account is at 14% and 12% in December 31, 2019 and 2018, respectively. Dividend and other income – 248% increase from ₱9,306 million to ₱32,411 million Increase pertains to AC Energy’s gain on the partial sale of AA Thermal, Inc. to Aboitiz Power Corporation, remeasurement gain on SLTEC, and higher liquidated damages on delayed completion of GNPK plant partly offset by impact of last year’s Sithe commission fees; Parent Company’s gain on AC Education and iPeople merger. These were partly offset by impact of last year’s IMI’s gain on disposal of China asset plus this year’s provisions. Interest and other financing charges – 29% increase from ₱17,379 million to ₱22,410 million Increase due to higher interest expenses of the Parent Company, ALI and AC Energy as a result of higher debt balance level this year as compared to last year. The Group’s adoption of PFRS 16 also increased interest expense amounting to ₱788 million shown in the table below (see Note 3).
(Amounts in Millions) Years Ended December 31, 2019 Years Ended December 31, 2018 Inc (Dec)
Pre-PFRS PFRS 16
PFRS 5
MWC Audited Pre-PFRS
PFRS 5
MWC Audited Audited Balance
(Item 1) (Item 3) (Item 3)
CONTINUING OPERATIONS
REVENUE (Note 19)
Sale of goods and rendering of services 284,704₱ -₱ (19,797)₱ 264,907₱ 274,881₱ (17,990)₱ 256,891₱ 8,015₱ 3%
Share in net profits of associates and joint ventures 23,196 (198) (654) 22,344 20,460 (699) 19,761 2,584 13%
Interest income from real estate 7,891 - 7,891 7,042 - 7,042 849 12%
Dividend income 123 - 123 107 - 107 16 15%
315,913 (198) (20,451) 295,265 302,490 (18,689) 283,801 11,464 4%
COSTS AND EXPENSES
Costs of sales and services 198,207 (8,223) 189,983 196,608 (6,901) 189,707 277 0%
General and administrative expenses 75,343 394 (43,624) 32,113 29,822 (3,865) 25,957 6,156 24%
273,549 394 (51,848) 222,096 226,430 (10,766) 215,663 6,433 3%
OTHER INCOME (CHARGES) - Net
Interest income 3,757 (405) 3,352 2,706 (412) 2,294 1,059 46%
Other income 44,224 (11,935) 32,288 20,182 (10,983) 9,199 23,090 251%
Interest and other financing charges (23,186) (1,298) 2,075 (22,410) (19,101) 1,722 (17,379) (5,031) -29%
Other charges (10,853) 10,853 - (9,662) 9,662 - - -
13,942 (1,298) 587 13,231 (5,876) (11) (5,886) 19,118 325%
INCOME BEFORE INCOME TAX 56,306 (1,890) 31,984 86,400 70,185 (7,934) 62,251 24,149 39%
PROVISION FOR INCOME TAX
Current 15,727 (2,009) 13,718 16,331 (2,034) 14,297 (579) -4%
Deferred (2,457) (836) 3,560 266 (1,211) 281 (930) 1,196 129%
13,270 (836) 1,551 13,984 15,120 (1,753) 13,367 617 5%
INCOME AFTER INCOME TAX 43,036 (1,054) 30,433 72,416 55,065 (6,181) 48,884 23,532 48%
OPERATIONS OF THE SEGMENT UNDER PFRS 5
Net income (loss) after tax - (30,433) (30,433) - 6,181 6,181 (36,615) -592%
NET INCOME 43,036₱ (1,054)₱ -₱ 41,982₱ 55,065₱ -₱ 55,065₱ (13,083)₱ -24%
Net Income Attributable to:
Owners of the Parent Company 35,755₱ (476)₱ 35,279₱ 31,818₱ 31,818₱ 3,462₱ 11%
Non-controlling interests 7,281 (578) 6,703 23,247 23,247 (16,544) -71%
43,036₱ (1,054)₱ -₱ 41,982₱ 55,065₱ -₱ 55,065₱ (13,083)₱ -24%

S E C F O R M 1 7 - A 193
Provision for income tax (current and deferred) – 5% increase from P=13,367 million to P=13,984 million Increase mainly attributed to ALI from its better operating results partly offset by decrease in provision for income tax of AC Energy and IMI groups. Operations of the segment under PFRS 5 – from ₱6,181 million income to ₱30,433 million loss Includes the net income after tax of MWCI less consolidation adjustments. For the year 2019, this line also includes the impact of P35.2Bn after-tax remeasurement loss on MWCI Investment (see Item 3 above). Income attributable to Owners of the parent – 11% increase from ₱31,818 million to ₱35,279 million Increase resulting from better operating results of ALI and higher equity in net earnings of Globe and BPI and on AC Energy’s gain from sale of AA Thermal; partly offset by remeasurement loss in MWC. As a percentage to total net income, this account is at 84% and 58% in December 31, 2019 and 2018, respectively. Income attributable to Non-controlling interests – 71% decrease from P=23,247 million to P=6,703 million Decrease mainly due to the share in the remeasurement loss in MWC; partly offset by better operating results of ALI. As a percentage to total net income, this account is at 16% and 42% in December 31, 2019 and 2018, respectively. Outlook for 2020 While the Philippines fell short of its economic growth target in 2019, it continues to provide a favorable backdrop for Ayala to operate in given the country’s strong fundamentals and consumption driven narrative. The central bank’s intention to sustain easing rates throughout the year should support private sector investment spending moving forward. Additionally, the combination of strong remittances and manageable inflation, which are both expected to continue throughout the year, should further augment the country’s growth trajectory. The delay of last year’s budget was one of the reasons for the country’s underperformance in 2019. The postponement ultimately hindered infrastructure spending, which continues to be a critical component in the government’s overall growth strategy. With the budget for 2020 already in place, the economy may see higher growth this year granted proper and timely execution of infrastructure projects in the pipeline. Furthermore, the successful rollout of the government’s infrastructure plans should serve as the country’s pillar for long-term sustainable growth. Numerous external headwinds in 2019 weighed down on the Philippines and subsequently on Ayala. The US-China trade war reached its peak last year as higher tariffs were imposed to one another in a series of trade sanctions. The effect was more apparent in larger markets, but pockets of industries onshore were also affected. Since then, tensions have deescalated after a series of trade talks between the superpowers. The development should be widely favorable to developed and emerging economies. Another issue in 2019 was Brexit, which dampened sentiment globally as it created a lot of uncertainties in how the European bloc will continue without one of its biggest members on board. The divorce of the UK from the EU saw a lot of turns since the 2016 referendum but has since then been resolved earlier in 2020. With more clarity related to this, companies that have businesses in related countries should be able to better manage their plans. One of the biggest headwinds for the year is the spread of Covid-19 in December 2019, which continued through early 2020. As of March 2020, the global death toll is at over 3,200 with more than 92,000 people infected across 75 countries. The contagion is expected to weigh down further on global economies as multiple industries such as airlines, hotels, and manufacturing are already being drastically affected as early as now. In a bid to curb the economic impact of the epidemic, central banks have expressed their willingness to cut interest rates to stimulate their economies. Against the backdrop of these developments, the Ayala group will continue to execute on its five-year growth strategy for 2020 as it closely monitors key trends and potential risks in the global and domestic economies as well as in the industries where it operates. Ayala maintains a healthy balance sheet with access to various funding options to meet requirements. A robust risk management system allows the company to maximize opportunities for reinvention and navigate the challenges faced by its business units.

S E C F O R M 1 7 - A 194
2018 Ayala Corporation’s net income in 2018 grew five percent to ₱31.8 billion from the previous year, boosted by strong earnings contribution from its real estate, telecommunications, and power businesses. Consolidated Sales of Goods and Services Sale of goods and services expanded 13 percent to ₱274.9 billion of which 3% was a result of the adoption of PFRS 15 (new accounting standard in 2018 pertaining to Revenues from Contracts with Customers). Revenue growth was driven by Ayala Land which posted higher sales across all its business segments, supported by higher sales from IMI’s Europe, China, Philippines, and Mexico units as well as contribution of VIA Optronics and Manila Water’s new business units. Real Estate Ayala Land sustained its growth momentum during the year with net income expanding 16 percent to ₱29.2 billion, primarily driven by the strong performance of its property development and commercial leasing businesses. Property development revenues jumped 18 percent to ₱120.3 billion on strong sales across its residential, office-for-sale, and commercial lot segments. Residential revenues jumped 20 percent to ₱101.1 billion, while reservation sales grew 16 percent to ₱141.9 billion, bolstered by strong demand from local and overseas Filipinos, which accounted for 82 percent of total sales during the year. Fresh bookings from One Vertis Plaza in Vertis North, Quezon City, The Stiles East Enterprise Plaza in Circuit Makati, and completion of Park Triangle Corporate Plaza in Bonifacio Global City lifted the sale of office spaces, with revenues reaching ₱11.4 billion, 14% higher year-on-year. In addition, revenues from the sale of commercial and industrial lots grew 10 percent to ₱7.7 billion, lifted by sales from its estates in the Visayas and Mindanao region, Evo City in Cavite, Alviera in Pampanga, and Cavite Technopark. Meanwhile, the opening of new malls and office spaces as well as the launch of new hotel and resort rooms drove the 17 percent expansion in commercial leasing revenues to ₱34.9 billion from its year-ago level. In 2018, Ayala Land added 142,000 square meters of mall space with the opening of three new malls: the Circuit Mall in Makati, the Capitol Central Mall in Bacolod, One Bonifacio High Street in Taguig, bringing its total mall gross leasable area to 1.9 million square meters. Moreover, the completion of Bacolod Capitol Corporate Center, Vertis North Corporate Center 3, and Ayala North Exchange pushed up Ayala Land’s total office GLA to 1.1 million square meters. Ayala Land’s commercial leasing business was further boosted by its hotels and resorts portfolio, which continues to benefit from the growth of the country’s tourism sector. In 2018, it added 390 rooms across its portfolio of branded hotels and its own Seda brand as well as bed and breakfast rooms in its Lio and Sicogon eco-tourism estates, bringing the total to 2,973 rooms. The sustained strong performance of its leasing segment has supported the continued buildup of Ayala Land’s recurring income business, which increased at a compounded annual rate of 26 percent since 2013. Meanwhile, its development income, which comprises residential, office, and lot sales, grew at a compounded annual rate of 18 percent. Water Manila Water recorded a net income of ₱6.5 billion, 6 percent higher from the previous year, largely driven by the Manila Concession, boosted by the contribution of its newly acquired platforms in Thailand and Indonesia. The Manila Concession posted steady growth, with a three percent increase in billed volume to 503 million cubic meters. This was supported by the 28 percent positive tariff adjustment granted by the Metropolitan Waterworks and Sewerage System to be implemented on a staggered basis over a five-year period from 2018 to 2022. Outside the Manila Concession, revenues from Manila Water Philippine Ventures rose six percent to ₱3.3 billion. Lowered billed volume across its domestic subsidiaries as well as operational and regulatory challenges, including the closure of Boracay island, weighed down MWPV’s performance during the year.

S E C F O R M 1 7 - A 195
Manila Water Asia Pacific’s overseas investments continues to bear fruit. It booked a 53 percent surge in equity share in net income of associates to ₱699 million. This was mainly driven by the two platforms it acquired during the year, East Water in Thailand, and PT Sarana Tirta Ungaran in Indonesia, which contributed ₱262.7 million and ₱1.4 million in equity earnings, respectively. To support its diversification strategy, Manila Water continues to ramp up its domestic and international business development initiatives, securing 13 new businesses in 2018. These include the full concession projects in Calbayog in Samar, San Jose in Nueva Ecija, and in Iloilo, Isabela, Pangasinan, Batangas, Bulacan, and Laguna as well as the acquisition of a 19 percent stake in East Water and a 20 percent stake in PT Sarana Tirta Ungaran. Power AC Energy’s net earnings expanded 16 percent to ₱4.1 billion in 2018, largely driven by its domestic thermal and renewable assets as well as higher contribution from its Indonesia investments. The strong performance and higher equity stake in GNPower Mariveles, strong wind regime, and fresh contribution of its greenfield offshore project, the 75-megawatt Sidrap wind farm in Indonesia, as well as the full-year recognition of SD Geothermal boosted AC Energy’s performance during the year. Equity earnings from AC Energy’s investee companies reached ₱3.6 billion, 37 percent higher from the previous year. Recovery of the costs incurred due to adjustments in the construction schedule of GNPower Kauswagan also lifted AC Energy’s net earnings during the period. During the year, AC Energy generated 2,800 gigawatt hours of attributable energy, of which 48 percent was from renewable sources. To support its strategy to scale up its renewable portfolio, AC Energy raised US$410 million in green bond in January 2019, the first publicly syndicated US dollar green bond in Southeast Asia to be certified by the Climate Bonds Initiative. AC Energy continued to expand its international footprint through strategic partnerships with developers and operating companies. AC Energy has identified the Philippines, Vietnam, Indonesia, and Australia as key markets in its expansion strategy. The 330-MWp Ninh Thuan solar farm in Vietnam, a joint venture between AC Energy and the BIM Group, is expected to commence early in the second quarter of 2019. Once completed, it will be one of the largest solar farms in Southeast Asia, benefiting Ninh Thuan province with income generation and job creation. AC Energy also broke ground on the 80-MWp solar farms located in the provinces of Khanh Hoa and Dak Lak, in partnership with AMI Renewables Energy. In addition, AC Energy signed a memorandum of understanding with Quang Binh Province to jointly develop a wind power project with AMI Renewables. AC Energy has also entered the Australian renewables market through a joint venture with international RE developer UPC Renewables, investing US$30M for a 50% ownership in UPC's Australian business. The platform is developing the 1,000 MW Robbins Island and Jims Plain projects in North West Tasmania and the 700 MW New England Solar Farm located near Uralla in New South Wales. It also has a further development portfolio of another 3,000 megawatts located in NSW, Tasmania and Victoria. In September, AC Energy announced the partial sell-down of its thermal platform to Aboitiz Power, which includes the GNPower Mariveles and GNPower Dinginin assets in Bataan. The sale, valued at US$ 579.2 million, represents approximately 35% of AC Energy’s attributable thermal capacity and is part of the company’s strategy to actively recycle capital and will enable the expansion of AC Energy’s domestic and offshore renewable energy businesses. In late February, AC Energy received approval on the transaction from the Philippine Competition Commission. Industrial Technologies AC Industrials’ net income dropped 53 percent year-on-year to ₱578 million, largely due to the weaker performance of its automotive businesses and startup losses from newly acquired businesses. This decline was partially offset by a one-time gain in its electronics manufacturing services arm. IMI’s revenues expanded 24 percent to ₱70.8 billion on the back of a 16 percent growth in revenues from traditional businesses and a 61 percent growth in recently acquired companies, VIA and STI. It likewise benefited from new programs in the industrial and automotive segments which grew 41 percent and 21 percent, respectively. IMI reported a net income of ₱2.4 billion, up 34 percent from a year ago, boosted by non-operating items such as net gains from the sale of a China entity and reversal of contingent consideration related

S E C F O R M 1 7 - A 196
to the STI acquisition, partially offset by impairment provisions on some offshore investments. The effect of the RMB and EUR depreciation and higher interest rates also added downward pressure to IMI’s performance during the year. Excluding the impact of the one-time net gain, IMI’s net income went down 49 percent year-on-year. AC Motors registered a 76 percent decline in net earnings to ₱164 million owing to significantly lower earnings of the group’s Honda and Isuzu dealerships, both hit by weaker sales amid an industry-wide slowdown. This was aggravated by lower contributions from AC Industrials’ investments in the Philippine distribution companies of Isuzu and Honda. Meanwhile Volkswagen’s sales volume was affected by the delay in delivery of its China-sourced vehicles. AC Industrials continues to ramp up its automotive retail portfolio and in 2018, it partnered with Kia Motors and China’s SAIC Motor for the distribution of Kia and Maxus vehicles in the Philippines, respectively. Share of Profit of Associates and Joint Ventures Share of profits of associates and joint ventures grew 11 percent to ₱20.5 billion, lifted by Globe’s higher data-driven revenues plus the growth in BPI’s core businesses. The adoption of the new accounting standards PFRS 9 (Financial Instruments) and PFRS 15 has minimal effect in the net income of BPI and Globe in 2018. Higher equity in net earnings from AC Energy’s investee companies, namely GN Power Mariveles, SD Geothermal, and Sidrap, as well as contribution of Manila Water’s new overseas investments also drove the increase. However, this was partially offset by Ayala Land’s consolidation of MCT, previously reported as an associate, as well as AC Ventures’ share in net losses of Zalora and Mynt. Banking Bank of the Philippine Islands reported a net income of ₱23.1 billion, up 3 percent from the previous year, boosted by the robust growth of its core banking business but tempered by higher provisions and operational spending. The bank’s total revenues grew 11 percent to ₱78.5 billion on the back of a 16 percent growth in net interest income, which reached ₱55.8 billion. The increase in net interest income was a result of a 9 percent improvement in average asset base and a 21-basis point expansion in net interest margin. Total loans stood at ₱1.35 trillion, reflecting a 13 percent growth year-on-year, boosted by strong performance of its corporate loans and credit card loans, which increased 13 percent and 24 percent, respectively. Total deposits reached ₱1.59 trillion, up 1.5 percent, with current and savings accounts registering faster growth at 2.4 percent. The bank’s current account and savings account ratio stood at 71.9 percent while the loan-to-deposit ratio was at 85.4 percent. The bank recorded higher fee income from its transaction-based service charges, credit card, and rental businesses. However, lower trust, investment management, and corporate finance fees, and securities trading income during the year, tempered BPI’s non-interest income, which slid 1 percent to ₱22.7 billion. Operating expenses totaled ₱43.6 billion for 2018, an increase of 13.2 percent year-on-year on accelerated spending to support the bank’s digitalization strategy and investments in its microfinance network. In 2018, BPI Direct Banko, its microfinance arm, doubled its branch network to 200. These initiatives resulted in cost-to-income ratio of 55.5 percent in 2018 from 54.3 percent a year ago. At the end of 2018, the bank’s total assets stood at ₱2.1 trillion, up 9.5 percent from the previous year, with return on assets at 1.2 percent. With the success of its capital raising exercises - the ₱50 billion stock rights offering, the US$600 million in senior unsecured bonds, and the ₱25 billion in peso fixed rate bonds - BPI’s total capital reached ₱248.52 billion, up by 38 percent from its year-ago level. Capital adequacy ratio was at 16.09 percent and Common equity tier 1 ratio was at 15.19 percent. Telco Data-driven demand across its business segments bolstered Globe’s net profits, which reached ₱18.6 billion during the year. On a post-PFRS basis, service revenues reached ₱132.9 billion. Mobile revenues grew nine percent to ₱106.9 billion driven by mobile data services, which accounted for 51 percent of the segment from 44

S E C F O R M 1 7 - A 197
percent a year ago. This was supported by the sustained higher prepaid top-ups, indicating greater consumer spending on mobile data. This in turn, drove the mobile data traffic growth to 956 petabytes from 600 petabytes a year ago. Globe’s home broadband business jumped 19 percent to ₱18.5 billion on continued subscriber expansion in fixed wireless solutions, specifically the Home Prepaid Wi-Fi product. Similarly, its corporate data business expanded 15 percent to ₱11.8 billion amid increasing demand for fast, reliable, and secure internet connectivity and modern business solutions. With a consistent strong revenue and well managed costs throughout the year, Globe’s EBITDA improved 22 percent to ₱64.9 billion, with EBITDA margin at 46 percent from its year-ago level of 42 percent. Globe continues to build its network capacities to address the increasing data traffic growth and customer base as it ramped up its LTE rollout. It spent ₱43.3 billion in capital expenditures in 2018, equivalent to 32 percent of its service revenues. Costs and Expenses Consolidated cost of sales and rendering services rose 12 percent to ₱196.6 billion, tracking the revenue growth. General and administrative expenses expanded 18 percent to ₱29.8 billion, primarily driven by the combined increments in the group’s expenses, particularly Ayala Land’s taxes, contracted services, depreciation; Manila Water’s management fees, manpower-related and selling expenses, and Ayala parent’s higher business development and manpower costs. Moreover, the consolidation of our new subsidiaries namely MCT of Ayala Land, MT Technologies and Merlin Solar of AC Industirals, and VIA Optronics and STI of IMI drove the higher GAE during the period. This was further lifted by IMI‘s restructuring costs from its employee relocation in China prior to the property sale. Without the effect of these newly consolidated subsidiaries, GAE grew nine percent year-on-year. Balance Sheet Highlights At the end of 2018, Ayala’s total assets stood at ₱1.2 trillion. Investments in associates and joint ventures expanded 19 percent to ₱240.1 billion owing to Ayala parent’s subscription to BPI’s stock rights offering as well as new investments of Manila Water in East Water in Thailand and PT Sarana in Indonesia, and AC Energy in renewable platforms in Australia and Vietnam. Furthermore, the growth was lifted by additional investments of AC Infrastructure in the LRT 1 project and higher share of net earnings in BPI and Globe and investee companies of Ayala Land, Manila Water, and AC Energy. This was partly offset by Ayala Land’s consolidation of MCT, which was previously reported as associate as well AC Ventures‘ equity losses in Zalora and Mynt. Investments in properties jumped 12 percent to ₱227.6 billion driven by Ayala Land’s expansion projects in its malls, office properties, land development initiatives, and the impact of the consolidation of MCT. An adjustment in land classification required under the PFRS 15 likewise contributed to the increase. At the end of the year, total debt at the consolidated level stood at ₱412 billion, 18 percent higher from the end-2017 level. This was driven by higher borrowings of the parent as well as higher loan balances of Ayala Land, Manila Water, and AC Energy. Ayala’s balance sheet remained healthy with enough capacity to undertake investments and cover its dividend and debt obligations. As of end-2018, parent level cash stood at ₱8.5 billion, while net debt stood at ₱96 billion. Loan-to-value ratio, the ratio of its parent net debt to the total value of its assets, stood at 11 percent. The conglomerate’s peso-dollar debt split ended at 64:36 for 2018. Ayala’s dollar denominated debts are fully covered by foreign currency assets. Outlook for 2019 Most ASEAN economies experienced a slowdown in 2018 as external risks weighed on local demand and exports. As the US economy showed strength, the Federal Reserve continued to raise policy rate that prompted ASEAN central banks to increase interest rates to temper currency depreciation. In

S E C F O R M 1 7 - A 198
addition, household consumption declined as global oil prices surged, while exports struggled amid the growth slowdown in China. Moving forward, risk-aversion is expected as many awaits the development on key global geopolitical and economic issues, including the US-China trade war and the Brexit. On the domestic front, inflation challenges marked the Philippine economy in 2018 as average inflation accelerated to a nine-year high, largely fueled by higher global oil prices, local food supply problems, and the weaker peso. At the start of 2019, inflation has softened, falling to its lowest level in 10 months. Many analysts believe this trend will continue over the medium term as the national government carried out efforts to ease supply of key food items to allow food prices to stabilize. Looking ahead, with inflation now in a downtrend, the Philippine economy has the opportunity to return to a low-inflation and high growth environment, especially as election spending boosts overall demand. Investment spending is still expected to be robust in 2019 to meet strong consumer demand. Against the backdrop of these developments, the Ayala group will continue to execute on its five-year growth strategy for 2020 as it closely monitors key trends and potential risks in the global and domestic economies as well as in the industries where it operates. Ayala maintains a healthy balance sheet with access to various funding options to meet requirements. A robust risk management system allows the company to maximize opportunities for reinvention, and navigate the challenges faced by its business units. Capital Expenditure For the year 2018, a total of P=217.4 billion was spent at the group level in support of the parent’s own investment program as well as the expansion initiatives of its real estate, telecom, water, and energy units, and the ramp-up of its industrial technologies, education, infrastructure, and healthcare businesses. Ayala Ayala parent has set aside P=51.8 billion in capital spending for the year. In 2018, 84% or P=43.7 billion of this budget has been deployed largely to support the stock rights offering of BPI and IMI as well as to fund the expansion of our emerging businesses: AC Energy, AC Industrials, AC Infra, AC Health and AC Education. ALI ALI spent P=110.1 billion in capital expenditures to support the aggressive completion of new projects, 41% of which was spent on residential projects; 23% on commercial projects; 15%, land acquisition; 12%, development of estates; and 9%, on investments. MWC MWC ended 2018 with total capital expenditures of P=10.0 billion, 23% lower than the previous year. The Manila Concession spent a total of P=8.0 billion (inclusive of concession fee payments) for capital expenditures in 2018. Of the total amount, 93% was spent on wastewater expansion, network reliability, and water supply projects, while the balance of 7% was accounted for by concession fees paid to MWSS. Meanwhile, total capital expenditures of the domestic subsidiaries dropped by 20% to P=1.9 billion from the P=2.3 billion spent in 2017. Of the total amount, P=561 million was spent by Laguna Water for its water network expansion, while Boracay Water and Tagum Water disbursed P=444 million and P=203 million, respectively. Estate Water spent P=490 million for its greenfield and brownfield projects, with the balance being taken on by the remaining subsidiaries for its various projects. IMI In 2018, IMI spent $65 million on capital expenditures to build more complex manufacturing capabilities which were funded by proceeds from the stock rights offering. For 2019, IMI expects additional $68 million of capital expenditures intended to expand IMI’s capacity and support expected increases in demand, as well as to sustain IMI’s productivity and efficiency.

S E C F O R M 1 7 - A 199
ACEI For the year 2018, ACEI’s budget for capital expenditures amounts to P=20.1 billion of which P=9.8 billion has been disbursed as of the twelve-month period mainly for investments in GNPD and GNPK and in foreign countries mainly Vietnam and Australia. BPI For the whole year 2018, total capital expenditures amounted to P=3.5 billion. Globe As of end-December 2018, total cash capital expenditures stood at about P=43.3 billion (approximately US$821 million), 2% higher than last year’s level of P=42.5 billion. The increase in capex was due to Globe’s continued network upgrade and expansion.
Key performance indicators of the Company and its significant subsidiaries The table sets forth the comparative key performance indicators of the Company and its significant subsidiaries.
Ayala Corporation (Consolidated) (In million pesos, except ratios) 2018 2017 2016
Income 302,490 266,786 222,944 Net Income Attributable to Equity Holders 31,818 30,264 26,011 Total Assets 1,197,926 1,021,546 911,705 Total Debt 412,262 350,612 295,854 Total Stockholders' Equity 469,108 411,092 370,996 Current Ratio1 1.25 1.39 1.22 Debt to Equity Ratio2 0.88 0.85 0.80
Ayala Land, Inc. (In million pesos, except ratios) 2018 2017 2016
Revenue 163,747 139,373 123,266 Net Income Attributable to Equity Holders 29,241 25,305 20,908 Total Assets 668,820 573,992 536,433 Total Debt 187,099 174,386 159,801 Total Stockholders' Equity 220,221 192,263 172,683 Current Ratio1 1.26 1.30 1.12 Debt to Equity Ratio2 0.85 0.91 0.93
Integrated Micro-Electronics, Inc. (In thousand US dollars, except ratios) 2018 2017 2016
Revenue 1,349,400 1,090,588 842,966 Net Income Attributable to Equity Holders 45,507 34,002 28,116 Total Assets 1,070,593 920,918 639,128 Total Debt 324,314 300,154 180,774 Total Stockholders' Equity 406,436 276,595 239,328 Current Ratio1 1.32 1.28 1.51 Debt to Equity Ratio2 0.80 1.09 0.76
Manila Water Company, Inc. (In million pesos, except ratios) 2018 2017 2016
Revenue 19,836 18,516 17,712 Net Income Attributable to Equity Holders 6,524 6,147 6,065 Total Assets 122,533 103,394 85,479 Total Debt 51,647 39,724 27,619 Total Stockholders' Equity 53,621 48,561 56,780 Current Ratio1 0.59 1.09 1.10 Debt to Equity Ratio2 0.96 0.82 0.49 1 Current Assets/ Current Liabilities. 2Total Debt/ Total Stockholders' Equity (Total Debt includes short term debt, long-term debt both current and noncurrent portion).

S E C F O R M 1 7 - A 200
Causes for any material variances (Increase or decrease of 5% or more in the financial statements) The December 31, 2018 and December 31, 2017 consolidated financial statements show several significant increases in Balance Sheet and Income Statement accounts relating to two (2) key factors: 1. Major acquisitions made by subsidiaries as follows:
In year 2018 a. Ayala Land, Inc.’s (ALI’s) increase of ownership share in MCT Berhard (MCT) from 33% in
December 2017 to 72.31% in February 2018.
In year 2017 b. AC Energy, Inc.’s (ACEI’s) acquisition of 100% ownership of Visayas Renewable Corp. (VRC)
(formerly Bronzeoak Clean Energy), AC Energy Development, Inc. (AEDI) (formerly AC Energy Devco, Inc.), and 66% in Manapla Sun Power Development Corp. (MSPDC) in March 2017; 100% ownership in SCC Bulk Water Supply, Inc. (SCC) and Solienda, Inc. (Solienda) in December 2017.
c. Integrated Micro-Electronic’s (IMI’s) acquisition of 80% stake in Surface Technology International Enterprises Limited (STI) in April 2017.
d. AC Industrial Technology Holdings, Inc.’s (AITHI’s/ACI’s) acquisition through AC Industrials (Singapore) Ptd. Ltd. of 94.9% ownership of MT Technologies Gmbh (MT) in July 2017.
2. Adoption of three major accounting standards – PFRS 9 (Financial Instruments) and 15 (Revenue from Contracts with Customers) and PIC Q&A (Advances to Contractors and Land Classification) give rise to new accounts in the balance sheet plus certain reclassifications within the balance sheet (contract assets and contract liabilities). The summarized impact of these new standards in the balance sheet are shown below. The impact to income statement is shown in the discussion of income statement variances.
IMPACT OF PFRS 15 & 9; and PIC Q&A
Inc (dec)
(in million pesos) As reported PFRS Adj* PIC Adj Pre - PFRS As reported PIC Adj Pre - PFRS Pre - PFRS
ASSETS
Cash 60,624 - - 60,624 64,259 - 64,259 (3,635) -6%
Short-term investment 5,956 - - 5,956 5,400 - 5,400 556 10%
Accounts & notes receivable 105,519 48,871 23,866 178,256 100,243 23,866 124,109 54,147 44%
Contract assets 52,209 (52,209) - - - - - -
Inventories 120,560 2,971 (28,653) 94,878 105,196 (28,653) 76,543 18,335 24%
Other current assets 67,890 - (16,530) 51,361 61,854 (16,530) 45,325 6,036 13%
Noncurrent accts & notes receivable 6,366 35,671 - 42,037 45,774 - 45,774 (3,737) -8%
Noncurrent contract assets 35,930 (35,930) - - - - - -
Invest. in assoc & JVs 240,141 (1,605) - 238,535 202,649 - 202,649 35,886 18%
Investment properties 227,646 - 28,653 256,299 202,873 28,653 231,527 24,772 11%
Property, plant and equipment 104,492 - - 104,492 85,431 - 85,431 19,062 22%
Other noncurrent assets 40,088 259 (7,337) 33,010 27,390 (7,337) 20,054 12,956 65%
Service concession assets 98,404 - - 98,404 91,050 - 91,050 7,355 8%
Deferred tax assets - net 15,546 - - 15,546 12,721 - 12,721 2,825 22%
Others ** 16,553 - - 16,553 16,705 - 16,705 (152) -1%
Total Assets 1,197,926 (1,972) 0 1,195,953 1,021,546 0 1,021,546 174,407 17%
December 31, 2018 December 31, 2017

S E C F O R M 1 7 - A 201
Given the above, the discussion of variances below will focus on comparison of pre-PFRS/ PIC balances.
Balance Sheet Items As of December 31, 2018 vs. December 31, 2017 Cash and cash equivalents – 6% decrease from P=64,259 million to P=60,624 million Slight decline due to group’s advances for/acquisition of Merlin Solar and ACEI’s investments; AITHI/ACI’s lower sales; Bestfull Holdings, Ltd.’s (BHL’s) additional FVPL investments; AC’s new loans were used to fund Bank of the Philippine Islands (BPI) stock rights offer (SRO) and additional capital infusion in existing subsidiaries. Sources of cash during the year: ACEI’s dividends from investment and loan drawdowns; ALI’s loan proceeds and consolidation of MCT; IMI’s proceeds from SRO; and Manila Water Company, Inc.’s (MWC’s) revenue collections and loan proceeds were used to fund new investments in Thailand by MWC and project expansions by ALI and ACEI. This account is at 5% and 6% of the total assets as of December 31, 2018 and 2017, respectively. Short-term investments – 10% increase from P=5,400 million to P=5,956 million Increase due to AYC’s short-term placements partly offset by ALI’s placements maturity. This account is at less than 1% of the total assets as of December 31, 2018 and 2017. Accounts and notes receivable (current) – 44% increase from P=124,109 million to P=178,256 million Increase resulting from ALI’s higher sales and impact of consolidation of MCT; higher sales of IMI; and ACEI’s retail electricity supply (RES) business and advances for projects; partly offset by ALI’s sale of trade accounts to banks; and AITHI/ACI’s decline due to lower sales. This account is at 15% and 12% of the total assets as of December 31, 2018 and 2017, respectively. Inventories – 24% increase from P=76,545 million to P=94,878 million Increase pertains to AITHI/ACI’s increase in inventories resulting from lower sales in 2018. This account is at 8% and 7% of the total assets as of December 31, 2018 and 2017. Other current assets – 13% increase from P=45,325 million to P=51,361 million Increase pertains to: ALI’s consolidation of MCT; higher creditable withholding tax, input tax, prepayments in ALI, IMI, AITHI/ACI’s and MWC’s; BHL’s additional infusion in certain FVPL investments and impact of forex translation; partly offset by ACEI’s reclassification of deferred input taxes to noncurrent assets. The account also included those assets held for sale such as: (1) AC Education, Inc. (AEI) (after consolidation of National Teachers College (NTC)) and (2) ACEI’s net investment in GMCP and GN Power Dinginin Ltd. Co. (GNPD). This account is at 4% of the total assets as of December 31, 2018 and 2017.
IMPACT OF PFRS 15 & 9; and PIC Q&A
Inc (dec)
(in million pesos) As reported PFRS Adj* PIC Adj Pre - PFRS As reported PIC Adj Pre - PFRS Pre - PFRS
LIABILITIES AND EQUITY
Liabilities
Short-term debt 39,518 39,518 29,905 - 29,905 9,614 32%
Accts payable & accr expenses 204,758 204,758 169,653 - 169,653 35,106 21%
Income tax payable 3,407 3,407 1,710 - 1,710 1,697 99%
Long-term debt - current 48,481 48,481 13,732 - 13,732 34,749 253%
Contract liabilities 21,989 (21,989) - - - - - -
Other current liabilities 11,129 30,523 - 41,652 25,984 - 25,984 15,668 60%
Service concession obligation 7,839 7,839 8,552 - 8,552 (713) -8%
Long-term debt - net of current portion 324,263 324,263 306,975 - 306,975 17,288 6%
Deferred tax liabilities - net 10,999 10,999 8,108 - 8,108 2,891 36%
Noncurrent contract liabilities 8,630 (8,630) - - - - - -
Noncurrent liabilities - others ** 47,804 46 - 47,849 45,835 - 45,835 2,015 4%
Total Liabilities 728,817 (51) - 728,767 610,453 - 610,453 118,313 19%
Equity
Paid-in capital 83,362 83,362 75,001 - 75,001 8,361 11%
Cumulative translation adj 2,277 27 2,304 2,794 - 2,794 (491) -18%
Non-controlling interests 178,501 (154) 178,347 154,745 - 154,745 23,603 15%
FV reserver on FVOCI (545) (1,261) - (1,806) (1,108) - (1,108) (698) -63%
Retained earnings 196,915 (534) - 196,381 170,302 - 170,302 26,079 15%
Equity reserve 10,872 - 10,872 11,600 - 11,600 (728) -6%
Equity - others ** (2,273) - - (2,273) (2,242) 0 (2,242) (31) 1%
Total Equity 469,108 (1,922) - 467,187 411,092 0 411,092 56,094 14%
* includes impact of PFRS 15 and 9 **accounts with individual variance of below 5%
December 31, 2018 December 31, 2017

S E C F O R M 1 7 - A 202
Accounts and notes receivable (non-current) – 8% decrease from P=45,774 million to P=42,037 million Account decrease due to ALI’s sale of trade receivables partly offset by ACEI’s receivable from UPC Renewables. This account is at less than 4% of the total assets as of December 31, 2018 and 2017. Investments in associates & joint ventures – 18% increase from P=202,649 million to P=238,535 million Increase attributable to AC’s subscription to BPI’s SRO; new investments of MWC (East Water – Thailand and PT Sarana - Indonesia) and ACEI (UPC Renewables Australia and solar unit in Vietnam) and additional infusion of AC Infrastructure Holdings, Inc. (AC Infra) for Light Rail Manila Holdings, Inc. (LRMHI); plus equity in net earnings (less dividends) from BPI, Globe, and from existing investees of ALI, MWC and ACEI groups. These were partly offset by ALI’s step-up acquisition of MCT as discussed in item 1 above; ACEI’s reclassification of part of its coal investments to assets held for sale and AC Ventures Holding Corp.’s (AVHC’s) share in equity losses in Zalora and Mynt. This account is at 20% of the total assets as of December 31, 2018 and 2017. Investment Properties – 11% increase from P=231,527 million to P=256,299 million The increase relates to ALI group’s expansion projects mainly on malls and office buildings plus impact of MCT consolidation. This account is at 21% and 23% of the total assets as of December 31, 2018 and 2017, respectively. Property, plant and equipment – 22% increase from P=85,431 million to P=104,492 million Increase coming from ACEI’s construction of power plants for GN Power Kauswagan Ltd. Co.'s (GNPK’s) coal unit plus impact of forex translation adjustment; ALI’s consolidation of MCT; IMI’s and MWC’s expansion projects. This account is at 9% and 8% of the total assets as of December 31, 2018 and 2017, respectively. Service concession assets – 8% increase from P=91,050 million to P=98,404 million Increase attributable to MWC’s additional service concession assets. This account is at 8% and 9% of the total assets as of December 31, 2018 and 2017, respectively. Deferred tax assets-net - 22% increase from P=12,721 million to P=15,546 million Increase related to additional deferred tax assets of ALI’s leasing group. This account is at 1% of the total assets as of December 31, 2018 and 2017. Other noncurrent assets - 65% increase from P=20,054 million to P=33,010 million Increase pertains to: ALI’s higher project advances, deferred tax and non-current prepaid expenses; MWC’s higher FCDA; ACEI’s reclassification of deferred input tax and project development cost from other current assets; AYC Finance Ltd.’s (AYC’s) hold-out cash for a loan availed by AC; and BHL’s additional FVOCI investments. The account also includes the Group’s pension asset amounting to P=82 million.2 This account is at 3% and 2% of the total assets as of December 31, 2018 and 2017, respectively. Short-term debt – 32% increase from P=29,905 million to P=39,518 million Increase in loans due to additional borrowings of MWC and ACEI partly offset by ALI’s net payments and AITHI/ACI’s lower borrowing due to lower vehicle purchases. This account is at 5% of the total liabilities as of December 31, 2018 and 2017. Accounts payable and accrued expenses – 21% increase from P=169,653 million to P=204,759 million Increase mainly coming from ALI’s trade payables, accrued project and manpower costs; IMI’s increase in sales volume driving the vendors payable; and MWC’s increase arising from acceleration of projects and accrual of expenses. These were partly offset by AITHI/ACI’s and ACEI’s lower trade payables. This account is at 28% of the total liabilities as of December 31, 2018 and 2017. Income tax payable – 99% increase from P=1,710 million to P=3,407 million Increase mainly arising from higher tax payable of ALI group. This account is less than 1% of the total liabilities as of December 31, 2017 and 2016.
2 The Parent Company's pension fund is known as the AC Employees Welfare and Retirement Fund (ACEWRF). ACEWRF is a legal entity separate and distinct from the Parent Company, governed by a board of trustees appointed under a Trust Agreement between the Parent Company and the initial trustees. It holds common and preferred shares of the Parent Company in its portfolio. All such shares have voting rights under certain conditions, pursuant to law. ACEWRF's portfolio is managed by a committee appointed by the fund's trustees for that purpose. The members of the committee include the Parent Company’s Chief Finance Officer, Group Head of Corporate Governance, General Counsel, Corporate Secretary and Compliance Officer, Head for Strategic Human Resources, Treasurer and Comptroller. ACEWRF has not exercised voting rights over any shares of the Parent Company that it owns.

S E C F O R M 1 7 - A 203
Other current liabilities – 60% increase from P=25,984 million to P=41,652 million Excluding the PFRS reclassification, account increase due to ALI’s higher customer deposits. This account is at 6% and 4% of the total liabilities as of December 31, 2018 and 2017, respectively. Long-term debt (current) – 253% increase from P=13,732 million to P=48,481 million Increase in loans due to ALI’s additional borrowings for expansion projects and effect of consolidation of MCT; AYC’s reclassification of noncurrent long-term debt to current portion and impact of forex translation on outstanding USD debt; and IMI’s increase for working capital requirements. These were partly offset by AC’s payment of maturing loans. This account is at 7% and 2% of the total liabilities as of December 31, 2018 and 2017, respectively. Long-term debt (noncurrent) – 6% increase from P=306,975 million to P=324,263 million Increase in loans due to additional borrowings of AC to fund subscription to BPI and IMI SRO and infusions to subsidiaries; ACEI’s additional drawdowns for GNPK project and new investments, including impact of forex translation; and MWC’s new debt to fund various capital expenditures and projects. These were partly offset by IMI’s and ALI’s debt payments and AYC’s reclassification of noncurrent long-term debt to current portion. This account is at 44% and 50% of the total liabilities as of December 31, 2018 and 2017, respectively. Service concession obligation (total) – 8% decrease from P=8,552 million to P=7,839 million Decrease was due to periodic payments made by MWC as well as to the reclassification of noncurrent to current account. This account is at 1% of the total liabilities as of December 31, 2018 and 2017. Deferred tax liabilities – 36% increase from P=8,108 million to P=10,999 million Increase attributable to increase in deferred tax liabilities of ALI. This account is at 2% and 1% of the total liabilities as of December 31, 2018 and 2017, respectively. Other noncurrent liabilities – 4% increase from P=45,835 million to P=47,849 million Increase primarily due to ALI’s higher customer deposits and MWC’s higher retentions payable and customer guaranty deposits. This account is at 6% and 7% of the total liabilities as of December 31, 2018 and 2017. Paid-in capital – 11% increase from P=75,001 million to P=83,362 million Increase attributable to the issuance of common shares to a single long-term institutional investor (see Note 21 of the Notes to Consolidated Financial Statements). This account is at 18% of the total equity as of December 31, 2018 and 2017. Fair value reserve of financial assets at fair value through other comprehensive income (FVOCI) – 63% decrease from negative P=1,108 million to negative P1,806 million Decrease attributable to decline in market value of securities held by BPI group. This account is at less than 1% of the total equity as of December 31, 2018 and 2017. Cumulative translation adjustments - 18% decrease from P=2,794 million to P=2,304 million Decrease due to higher foreign liabilities of ACEI, AC International Finance Ltd. (ACIFL) and AYC; partly offset by upward impact of higher net asset of BHL, MWC and investment in Globe. Forex of PhP= vs US$ amounted to P=52.58 in December 2018 vs. P=49.93 in December 2017. This account is at 1% of the total equity as of December 31, 2018 and 2017. Equity Reserve - 6% decrease from P=11,600 million to P=10,872 million Decrease related to ALI’s equity transactions for additional investment in Prime Orion Philippines, Inc, (POPI) and consolidation of MCT; plus impact of AEI’s acquisition of remaining minority interest in NTC. This account is at 2% and 3% of the total equity as of December 31, 2018 and 2017, respectively. Retained earnings – 15% increase from P=170,302 million to P=196,381 million Increase represents share in group net income net of dividends declared. This account is at 42% and 41% of the total equity as of December 31, 2018 and 2017, respectively. Non-controlling interests – 15% increase from P=154,745 million to P=178,347 million Higher amount represents share in group net income and other comprehensive income net of dividends declared by subsidiaries to its non-controlling interests; plus impact of ALI’s consolidation of MCT. This account is at 38% of the total equity as of December 31, 2018 and 2017.

S E C F O R M 1 7 - A 204
Income Statement items For the Year Ended December 31, 2018 vs. December 31, 2017 In 2017, the Group changed the presentation of its consolidated statement of income from the single step to the multiple step presentation. This presentation better reflects and distinguishes other income from revenue and other charges from the operating expenses of the Group. Prior years consolidated statements of income have been re-presented for comparative purposes. The change in presentation has no impact on the consolidated net income, equity, cash flows and earnings per share of the Group. For 2018, the Group classified certain revenues from goods and rendering services to contract revenues, in compliance with provisions of PFRS 15 (see Note 2 of Notes to Consolidated Financial Statements) summarized as follows. Prior years consolidated statements of income have been re-presented for comparative purposes:
The discussion of variances focuses on pre-IFRS balances. Sale of goods and rendering services – 13% increase from P=242,228 million to P=274,881 million Increase in overall sale of goods and rendering services due to ALI’s higher sales coming from all segments; IMI from its Europe, China, Philippines and Mexico units plus contribution of Via; MWC’s and ACEI’s service revenues arising from consolidation of new subsidiary and its RES unit. As a percentage to total revenue, this account is at 91% in December 31, 2018 and 2017. Share of profit of associates and joint ventures – 11% increase from P=18,494 million to P=20,460 million, of which P=83.7 million or 4% was due to PFRS reclassification as discussed in item 2 above Increase coming from Globe’s higher revenues; ACEI’s share in net earnings of GNPD, Salak-Darajat and UPC Sidrap; MWC’s stable earnings from foreign investments; and BPI’s increase in NIAT coming from net interest income. These were partly offset by decline in ALI due to consolidation of MCT (previously reported as an associate) and AVHC’s share in net losses of Zalora and Mynt. As a percentage to total revenue, this account is at 7% in December 31, 2018 and 2017. Interest income from real estate – 30% increase from P=5,410 million to P=7,042 million Increase attributable to interest income from ALI group. This account is at 2% of the total revenue in December 31, 2018 and 2017. Dividend income – 84% decrease from P=654 million to P=107 million Decrease in dividend income arising lower dividend income of AITHI/ACI and partly due to reclassification of accounts by ACEI. This account is at less than 1% of the total revenue in December 31, 2018 and 2017. Cost of sales and rendering services – 12% increase from P=175,674 million to P=196,608 million Increase in the overall cost of sales and rendering services is aligned with the growth in revenues. As a percentage to total costs and expenses, this account is at 87% in December 31, 2018 and 2017. General and administrative expenses (GAE) – 18% increase from P=25,213 million to P=29,822 million of which P2,283 million or 50% of the increase represent impact of consolidation of new subsidiaries Increase mainly on combined increments in the group’s expenses specifically from: ALI (taxes, contracted services and depreciation plus impact of consolidation of MCT), MWCI (management fees,
IMPACT OF PFRS 15
Inc (dec)
(in million pesos) As reported PFRS 15 Pre - PFRS As reported PFRS 15 Pre - PFRS Pre - PFRS
Sale of goods & services
Revenues from customer contracts
Real estate 129,415 (129,415) - 109,876 (109,876) -
Manufacturing services 69,731 (69,731) - 55,028 (55,028) -
Water and sewer services 19,836 (19,836) - 18,516 (18,516) -
Others 22,317 (22,317) - 30,176 (30,176) -
Rental income 33,582 (33,582) - 28,631 (28,631) -
Sale of goods - 200,766 200,766 - 178,676 178,676 22,090
Rendering of services - 73,254 73,254 - 63,552 63,552 9,702
274,881 (862) * 274,019 242,228 - 242,228 31,792 13%
*pertains to IMI's adjustment of revenues under PFRS 15.
Equity in net earnings of
associates and joint venture20,460 (96) 20,364 18,494 - 18,494 1,869 10%
For the year 2018 For the year 2017

S E C F O R M 1 7 - A 205
manpower-related, selling expenses, provision for doubtful accounts and taxes), AITHI/ACI (mainly impact of consolidation of MT and Merlin), IMI (restructuring costs of Shenzen plant, consolidation of VIA and STI and partial impairment of certain goodwill asset), and AC (higher business development, sustainability and manpower costs. Without the effect of newly consolidated subsidiaries, GAE increased by P2,326 million or 9% year on year. As a percentage to total costs and expenses, this account is at 13% in December 31, 2018 and 2017. Interest income – 93% increase from P=1,404 million to P=2,706 million Increase mainly coming from interest income from ACEI group. Interest and other financing charges – 32% increase from P=14,441 million to P=19,101 million Increase due to higher interest expenses of ALI, AC/AYC, IMI, MWC and ACEI as a result of higher debt balance level this year as compared to last year. Other charges – 17% decrease from P=11,672 million to P=9,662 million Decrease due to MWC’s lower rehabilitation works of service concession assets. Provision for income tax (current and deferred) – 23% increase from P=12,260 million to P=15,120 million Increase primarily due to higher taxable income attributable mainly to ALI’s on account of better sales/revenues and better operating results plus ACEI’s deferred income tax for GNPK investment. Income attributable to Owners of the parent – 5% increase from P=30,264 million to P=31,818 million Increase resulting from better operating results of most subsidiaries of the Group. Income attributable to Non-controlling interests – 19% increase from P=19,603 million to P=23,247 million Increase resulting from better operating results of most subsidiaries of the Group. Item 7. Financial Statements and Supplementary Schedules The consolidated financial statements and schedules as listed in the accompanying Index to Financial Statements and Supplementary Schedules are filed as part of this Form 17 A. Item 8. Changes in and Disagreements with Accountants on Accounting and Financial Disclosures The Company has engaged the services of SGV & Co. during the two most recent fiscal years. There were no disagreements with SGV & Co. on any matter of accounting principles or practices, financial statement disclosures, or auditing scope or procedure. Information on Independent Public Accountant a. The external auditor of the Company is the accounting firm of SyCip, Gorres, Velayo & Company
(SGV & Co.). The Board, upon the recommendation of the Company’s Audit Committee (with Mr. Loinaz as Chairman and Messrs. Del Rosario, Jr. and Matsunaga as members), approved the election of SGV & Co. as the Company’s independent auditor for 2020 based on its performance and qualifications, and fixed its remuneration amounting to P6,059,200.00, inclusive of value-added tax. The election of SGV & Co., and the fixing of its remuneration will be presented to the stockholders for their approval at the annual stockholders’ meeting.
b. Representatives of SGV & Co. for the current year and for the most recently completed fiscal year are expected to be present at the annual stockholders’ meeting. They will have the opportunity to make a statement if they desire to do so and are expected to be available to respond to appropriate questions.
Pursuant to the General Requirements of SRC Rule 68 (2011 Amended), Par. 3 (Qualifications and Reports of Independent Auditors), the Company has engaged SGV & Co. as external auditor, and Ms. Lucy L. Chan is the Partner In-Charge starting audit year 2016.

S E C F O R M 1 7 - A 206
External Audit Fees and Services The Company paid or accrued the following fees, including VAT, to its external auditor in the past two years:
Audit Fees Audit-related Fees
Tax Fees Non-Audit Fees
2019 ₱5.77M ₱7.28M - ₱0.12M 2018 ₱5.99M ₱4.93M - ₱0.12M
SGV & Co. was engaged by the Company to audit its annual financial statements and midyear review of financial statements in connection with the statutory and regulatory filings or engagements for the years ended 2019 and 2018. The audit-related fees include assurance and services that are reasonably related to the performance of the audit or review of the Company’s financial statements pursuant to the regulatory requirements.
No tax consultancy services had been rendered by SGV & Co. for the past two years. In 2019 and 2018, SGV & Co. billed the Company a fee of ₱0.12M for the validation of stockholders’ votes during the annual stockholders’ meeting each year. The Audit Committee reviewed the nature of non-audit services rendered by SGV & Co. and the corresponding fees and concluded that these are not in conflict with the audit functions of the independent auditor. The Audit Committee has an existing policy to review and to pre-approve the audit and non-audit services rendered by the Company’s independent auditor. It does not allow the Company to engage the independent auditor for certain non-audit services expressly prohibited by regulations of the SEC to be performed by an independent auditor for its audit clients. This is to ensure that the independent auditor maintains the highest level of independence from the Company, both in fact and appearance.

S E C F O R M 1 7 - A 207
PART III - CONTROL AND COMPENSATION INFORMATION Item 9. Directors and Executive Officers of the Registrant The following persons have been nominated to the Board for election at the annual stockholders’ meeting and have accepted their respective nominations:
JAIME AUGUSTO ZOBEL DE AYALA FERNANDO ZOBEL DE AYALA KEIICHI MATSUNAGA XAVIER P. LOINAZ DELFIN L. LAZARO ANTONIO JOSE U. PERIQUET RIZALINA G. MANTARING
The nominees were formally nominated to the Corporate Governance and Nomination Committee of the Board by a minority shareholder of the Company, Ms. Nina Jacinto Aquino, who holds 4,057 common shares, or 0.00049% of the total outstanding voting shares of the Company, and who is not related to any of the nominees. Messrs. Xavier P. Loinaz and Antonio Jose U. Periquet, incumbent directors, and Ms. Rizalina G. Mantaring are being nominated as independent directors in accordance with SRC Rule 38 (Requirements on Nomination and Election of Independent Directors). The Corporate Governance and Nomination Committee evaluated the qualifications of all the nominees and prepared the final list of nominees in accordance with the Amended By-Laws and the Charter of the Board of Directors of the Company. Only nominees whose names appear on the final list of candidates are eligible for election as directors. No nominations will be entertained or allowed on the floor during the annual stockholders’ meeting. Ms. Mantaring is being nominated as an independent director of the Company for the first time. Mr. Matsunaga has served as director of the Company for three years. All other nominees, have served as directors of the Company for more than five years.
The officers of the Company are elected annually by the Board during its organizational meeting. A summary of the qualifications of the incumbent directors, who are all nominees for directors for election at the stockholders’ meeting and incumbent officers, including positions held as of December 31, 2019 and in the past five years and personal data as of December 31, 2019, of directors and executive officers, is set forth below.
Board of Directors
Jaime Augusto Zobel de Ayala Chairman and Chief Executive Officer
Fernando Zobel de Ayala President and Chief Operating Officer
Delfin L. Lazaro Non-Executive Director
Keiichi Matsunaga Non-Executive Director
Xavier P. Loinaz Lead Independent Director Ramon R. del Rosario, Jr. Independent Director Antonio Jose U. Periquet Independent Director
Jaime Augusto Zobel de Ayala, Filipino, 60, Director of Ayala Corporation since May 1987. He is the Chairman and CEO of Ayala Corporation since April 2006. He holds the following positions in publicly listed companies: Chairman of Globe Telecom, Inc., Integrated Micro-Electronics, Inc. and Bank of the Philippine Islands; and Vice Chairman of Ayala Land, Inc., Manila Water Company, Inc. and AC Energy Philippines, Inc. He is also the Chairman of Ayala Retirement Fund Holdings, Inc., AC Industrial Technology Holdings, Inc., AC Ventures Holding Corp., AC Infrastructure Holdings Corporation and Asiacom Philippines, Inc.; Co-Chairman of Ayala Foundation, Inc. and Ayala Group Club, Inc.; Director of Alabang Commercial Corporation, Ayala International Pte. Ltd., AC Energy, Inc., Ayala Healthcare Holdings, Inc., Light Rail Manila Holdings, Inc. and AG Holdings Ltd. Outside the Ayala group, he is a member of various business and socio- civic organizations in the Philippines and abroad, including the JP Morgan International Council, JP Morgan Asia Pacific Council, and Mitsubishi Corporation International Advisory Council. He sits on the board of the Singapore Management University and on various advisory boards of Harvard University, including the Global Advisory Council, HBS Board of Dean’s Advisors, and HBS Asia-Pacific Advisory Board, which he chairs. He is Chairman Emeritus of the Asia Business Council, a member of the Global Board of Adviser of the Council on Foreign Relations, and Co-Vice Chairman of the Makati Business Club, Chairman of Endeavor Philippines, and a board

S E C F O R M 1 7 - A 208
member of Eisenhower Fellowships. He was awarded the Presidential Medal of Merit in 2009, the Philippine Legion of Honor with rank of Grand Commander in 2010, and the Order of Mabini with rank of Commander in 2015 by the President of the Philippines in recognition of his outstanding public service. In 2017, he was recognized as a United Nations Sustainable Development Goals Pioneer by the UN Global Compact for his work in sustainable business strategy and operations. The first recipient of the award from the Philippines, he was one of 10 individuals recognized for championing sustainability and the pursuit of the 17 SDGs in business. He graduated with B.A. in Economics (Cum Laude) from Harvard College in 1981 and obtained an MBA from the Harvard Graduate School of Business in 1987. Fernando Zobel de Ayala, Filipino, 59, Director of Ayala Corporation since May 1994. He is the President and Chief Operating Officer of Ayala Corporation since April 2006. He holds the following positions in publicly listed companies: Chairman of Ayala Land, Inc., Manila Water Company, Inc., and AC Energy Philippines, Inc.; and Director of Bank of the Philippine Islands, Globe Telecom, Inc. and Integrated Micro- Electronics, Inc.; and Independent Director of Pilipinas Shell Petroleum Corporation. He is the Chairman of AC International Finance Ltd., ALI Eton Property Development Corporation, Liontide Holdings, Inc., AC Energy, Inc., Ayala Healthcare Holdings, Inc., Automobile Central Enterprise, Inc., Alabang Commercial Corporation, Accendo Commercial Corp. and Hero Foundation, Inc.; Co- Chairman of Ayala Foundation, Inc. and Ayala Group Club, Inc.; Vice-Chairman of AC Industrial Technology Holdings, Inc., Ceci Realty Inc., Fort Bonifacio Development Corporation, Bonifacio Land Corporation, Emerging City Holdings, Inc., Columbus Holdings, Inc., Berkshires Holdings, Inc. AKL Properties, Inc., AC Ventures Holdings Corp., and Bonifacio Art Foundation, Inc.; Director of LiveIt Investments, Ltd., AG Holdings Ltd., AC Infrastructure Holdings Corporation, Asiacom Philippines, Inc., Ayala Retirement Fund Holdings, Inc., Honda Cars Philippines, Inc., Isuzu Philippines Corporation, and Manila Peninsula; Member of the Board of INSEAD Business School and Georgetown University; Member of the International Advisory Board of Tikehau Capital and of the Hispanic Society Museum & Library International Advisory Council; Vice Chairman of the Philippine-Singapore Business Council, member of the World Presidents’ Organization and Chief Executives Organization; Chairman of Habitat for Humanity International’s Asia-Pacific Capital Campaign Steering Committee; and Member of the Board of Trustees of Caritas Manila, Pilipinas Shell Foundation, and the National Museum. He graduated with B.A. Liberal Arts at Harvard College in 1982 and holds a CIM from INSEAD, France. Delfin L. Lazaro, Filipino, 73, Non-Executive Director of Ayala Corporation since January 2007. He holds the following positions in publicly listed companies: Director of Ayala Land, Inc., Integrated Micro-Electronics, Inc., Manila Water Company, Inc., and Globe Telecom, Inc. His other significant positions include: Chairman of Atlas Fertilizer & Chemicals Inc., Chairman and President of A.C.S.T. Business Holdings, Inc.; Vice Chairman and President of Asiacom Philippines, Inc.; Director of AC Industrial Technology Holdings, Inc., AYC Holdings, Ltd.., AC International Finance, Ltd., Purefoods International Limited and Probe Productions, Inc. He graduated with BS Metallurgical Engineering at the University of the Philippines in 1967 and took his MBA (with Distinction) at Harvard Graduate School of Business in 1971. Keiichi Matsunaga, Japanese, 55, has been a Director of Ayala Corporation since April 2017. He is the General Manager of Mitsubishi Corporation Manila Branch. Currently, he is also the Chairman of International Elevator & Equipment Inc.; President of MC Diamond Realty Investment Phils., MC Oranbo Investment, MC Cavite Holdings, Inc., FMT Kalayaan, Inc., Japanese Chamber of Commerce & Industry of the Philippines (JCCIPI) and Director of Century City Development II Corporation (CCDC II), Isuzu Philippines Corporation, Kepco Ilijan Corporation, Portico Land Corp., and The Japanese Association Manila, Inc. (JAMI). He is not a director of any publicly listed company in the Philippines other than Ayala Corporation. He entered Mitsubishi Corporation after graduating from the Faculty of Law at Waseda University in 1988 and has since held various leadership positions. Xavier P. Loinaz, Filipino, 76, Independent Director of Ayala Corporation since April 2009. He has been our Lead Independent Director since April 2017. He is also an Independent Director of the Bank of the Philippine Islands, a publicly listed company. He also holds the following positions: Independent Director of BPI Family Savings Bank, Inc., and BPI/MS Insurance Corporation; Trustee of E. Zobel Foundation; Chairman of Alay Kapwa Kilusan Pangkalusugan and XPL Manitou Properties, Inc.; and Vice Chairman of XPL MTJL Properties, Inc. He was formerly the President of the Bank of the Philippine Islands (BPI) from 1982 to 2004. He was also the President of Bankers Association of the Philippines from 1989 to 1991. He graduated with an AB Economics degree at Ateneo de Manila University in 1963 and took his MBA-Finance at Wharton School, University of Pennsylvania in 1965. Ramon R. del Rosario, Jr., Filipino, 75, Independent Director of Ayala Corporation since April 2010. He is President and Chief Executive Officer of Phinma Corporation, President and Chief Executive Officer of Philippine Investment Management, Inc.; Chairman of PHINMA Education Holdings, Inc., .PHINMA Araullo University, PHINMA University of Iloilo, PHINMA University of Pangasinan, PHINMA

S E C F O R M 1 7 - A 209
Cagayan de Oro College, Southwestern University PHINMA, PHINMA St. Jude College, United Pulp and Paper Co., Inc., PHINMA Microtel Hotels, Inc. and PHINMA Hospitality, Inc. He is Vice-Chairman of Phinma Foundation, Inc. and Phinma Property Holdings Corp.; Director of Union Galvasteel Corp.and Philcement Corp. He is the Chairman of Philippine Business for Education; and Vice-Chairman of Caritas Manila and Philippine Business for Social Progress. He is a former chairman of the National Museum of the Philippines, Ramon Magsaysay Award Foundation and Makati Business Club, where he remains a Trustee. Mr. del Rosario graduated from De La Salle College in 1967 with degrees in BSC-Accounting and AB Social Sciences Magna cum Laude and from Harvard Business School in 1969 for a Master in Business Administration degree. He has managed Phinma since 2002 and brings with him a wealth of experience in leading a diversified conglomerate.
Antonio Jose U. Periquet, Filipino, 58, Independent Director of Ayala Corporation since September 2010. He is the chairman of Campden Hill Group, Inc., and of BPI Asset Management and Trust Corporation. He also serves as an independent director of the Bank of the Philippine Islands, ABS-CBN Corporation, DMCI Holdings, The Max's Group of Companies, and Semirara Mining and Power Corporation, The Philippine Seven Corporation and the Albizia ASEAN Tenggara Fund. He is a trustee of Lyceum of the Philippines University and a member of the Dean's Global Advisory Council at the University of Virginia's Darden School of Business. Mr. Periquet holds an AB Economics degree from the Ateneo de Manila University, a Master of Science (Econ) degree from Oxford University, UK, and an MBA from the University of Virginia, USA. Nominees to the Board of Directors for election at the stockholders’ meeting All incumbent directors, except Mr. Ramon R. del Rosario, Jr., with the addition of Ms. Rizalina G. Mantaring are the nominees to the Board. Rizalina G. Mantaring, Filipino, 60, is a Director of Sun Life Grepa Financial, Inc. and an Independent Director of Ayala Land, Inc., First Philippine Holdings Corp. Inc., PHINMA Corp. Inc., FEU Alabang, East Asia Computer Center Inc., Roosevelt College Inc., and Microventures Foundation Inc. She is also a member of the Boards of Trustees of the Makati Business Club, and Philippine Business for Education. A recipient of the Asia Talent Management Award in the Asia Business Leaders Award organized by the global business news network CNBC. She has also been recognized by the International Association of Business Communicators (Philippines) with the CEO Excel award. She was named by Moneysense Magazine as one of the 12 Most Influential in Personal Finance. She was selected as one of the 100 Most Outstanding Alumni of the past century by the University of the Philippines College of Engineering, and was 2019 PAX awardee of St. Scholastica’s College Manila, the highest award given by the school to outstanding alumni. She holds a BS Electrical Engineering degree from the University of the Philippines where she graduated with honors in 1982. She obtained her MS degree in Computer Science from the State University of New York at Albany in 1993.
Ayala Group Management Committee Members / Senior Leadership Team
*/*** Jaime Augusto Zobel de Ayala Chairman and Chief Executive Officer */*** Fernando Zobel de Ayala Vice Chairman, President and Chief Operating Officer
*** Jose Rene Gregory D. Almendras
Senior Managing Director, President and CEO of AC Infrastructure Holdings Corporation, and President and CEO of Manila Water Company, Inc.
** Cezar P. Consing Senior Managing Director, President and CEO of Bank of the Philippine Islands
** Bernard Vincent O. Dy Senior Managing Director, President and CEO of Ayala Land, Inc. *** Jose Teodoro K. Limcaoco Senior Managing Director, Chief Finance Officer, Chief Risk Officer, Chief
Sustainability Officer, Finance Group Head, and President of AC Ventures Holding Corp.
** Arthur R. Tan Senior Managing Director, CEO of Integrated Micro-Electronics, Inc., and President and CEO of AC Industrial Technology Holdings, Inc.
** Ernest Lawrence L. Cu President and CEO of Globe Telecom, Inc. ** Alfredo I. Ayala Managing Director
*** Paolo Maximo F. Borromeo Managing Director, Corporate Strategy and Development Group Head, President and CEO of Ayala Healthcare Holdings, Inc.
*** John Eric T. Francia Managing Director, President and CEO of AC Energy, Inc. *** Solomon M. Hermosura Managing Director, Chief Legal Officer, Corporate Secretary, Chief
Compliance Officer, Data Protection Officer, and Corporate Governance Group Head
** Ruel T. Maranan Managing Director, President of Ayala Foundation, Inc. *** John Philip S. Orbeta Managing Director, Chief Human Resource Officer, and Corporate Resources
Group Head

S E C F O R M 1 7 - A 210
Catherine H. Ang Executive Director and Chief Audit Executive Estelito C. Biacora Executive Director and Treasurer Josephine G. De Asis Executive Director and Controller Dodjie D. Lagazo Assistant Corporate Secretary Joanne M. Lim Assistant Corporate Secretary
* Members of the Board of Directors. ** Ayala Group Management Committee members. *** Ayala Corporation Management Committee and Ayala Group Management Committee members
Jose Rene Gregory D. Almendras, Filipino, 59, concurrently serves as Senior Managing Director of Ayala Corporation (AC), President & Chief Executive Officer of Manila Water Company, Inc. (MWCI) and President & Chief Executive Officer of AC Infrastructure Holdings Corporation (AC Infra). He is also a member of the AC Management Committee, member of the Ayala Corporation Management Committee and the Ayala Group Management Committee since August 2016. Rene is the Chairman of the Executive Committee of MWCI and a Board of Director of the following companies within the Ayala Group: AF Payments Inc.; Light Rail Manila Holdings, Inc.; MCX Tollway Inc.; and AC Energy Philippines, Inc. He spent 13 years with the Citibank group where he started as a management trainee and landed his first CEO position as President of City Savings Bank of the Aboitiz Group at the age of 37. In 2011, he was recognized by the World Economic Forum as a Sustainability Champion for his efforts as President of MWCI. During his stint as MWCI President and Chief Operating Officer, the company received multiple awards and was recognized as one of the Best Managed Companies in Asia, Best in Corporate Governance, one of the Greenest Companies in the Philippines and hailed as the world’s Most Efficient Water Company. Under the Administration of President Benigno S. Aquino III, Rene served as a member of the Cabinet holding the position of Secretary of the Department of Energy, Office of the Cabinet Secretary and the Department of Foreign Affairs. In June 2016, he was acknowledged by the Administration for his remarkable performance in addressing the country’s urgent issues and was awarded the highest Presidential Award given to a civilian - Order of Lakandula, Rank of Gold Cross Bayani. Cezar P. Consing, Filipino, 60, is a Senior Managing Director of Ayala Corporation and has been a member of the Ayala Group Management Committee since April 2013. He has been the President and CEO of BPI, one of the Ayala Group’s publicly listed companies, since April 2013. He is an Independent Director of Jollibee Foods Corporation. His other significant positions are: President of Bancnet, Inc., Chairman of Philippine Dealing Systems Holdings Corp., and Director of LGU Guarantee Corporation, Filgifts.com., The Rohatyn Group, Sqreem Technologies and Endeavor Philippines. He is Chairman and President of the Bankers Association of the Philippines. He is also a Director of the US-Philippines Society, trustee of the Manila Golf Club Foundation, and a member of the Trilateral Commission. He served as an Independent Director of CIMB Group Holdings from 2006 to 2013 and First Gen Corporation from 2005 to 2013, and as Chairman of National Reinsurance Corporation from 2018 to 2019. Prior to being President of BPI, he first worked for BPI’s corporate planning and corporate banking divisions from 1980 - 1985. He worked for J.P. Morgan & Co. in Hong Kong and Singapore from 1985– 2004 and became the co-head of the firm's investment banking business in Asia Pacific from 1997 – 2004 and President of J.P. Morgan Securities (Asia Pacific) Ltd. As a senior Managing Director of J.P. Morgan, he served as a member of the firm's global investment banking management committee and its Asia Pacific management committee. He was a partner at The Rohatyn Group from 2004 – 2013, ran its Hong Kong office and its private investing business in Asia, and was a board director of its real estate, and energy and infrastructure private equity investing subsidiaries. He graduated with a degree of A.B (Accelerated Program) Economics (Magna Cum Laude) from De La Salle University in 1979 and M.A. Applied Economics from the University of Michigan, Ann Arbor, in 1980. Bernard Vincent O. Dy, Filipino, 56, is a Senior Managing Director of Ayala Corporation and has been a member of the Ayala Group Management Committee since April 2014. He is the President and Chief Executive Officer of Ayala Land (ALI). Prior to this post, he was the Head of the Residential Business, Commercial Business and Corporate Marketing and Sales of ALI. He also is also a Director of other publicly-listed Companies namely, Cebu Holdings, Inc., AyalaLand Logistics Holdings Corp., and MCT Bhd of Malaysia. His other significant positions include: Chairman of Alveo Land Corp., Ayala Property Management Corporation, Makati Development Corporation, Amaia Land Corporation, Avencosouth Corp., Bellavita Land Corporation, Ayagold Retailers, Inc., Station Square East Commercial Corporation, Aviana Development Corp., Cagayan De Oro Gateway Corp., BGSouth Properties, Inc., BGNorth Properties, Inc., BGWest Properties, Inc., Nuevocentro, Inc., Portico Land Corp. and Philippine Integrated Energy Solutions, Inc.; Vice Chairman of Ayala Greenfield Development Corporation and Alviera Country Club, Inc.; Director and President of Bonifacio Land Corporation, Emerging City Holdings, Inc., Columbus Holdings, Inc., Berkshires Holdings, Inc., Fort Bonifacio Development Corporation, Aurora Properties Incorporated, Vesta Property Holdings, Inc., Ceci Realty Inc., Alabang Commercial Corporation and Accendo Commercial Corp.; President of the Hero

S E C F O R M 1 7 - A 211
Foundation Incorporated and Bonifacio Art Foundation, Inc.; Director of Avida Land Corp., Amicassa Process Solutions, Inc., Whiteknight Holdings, Inc., AyalaLand Medical Facilities Leasing, Inc., Serendra, Inc., Alveo-Federal Land Communities, Inc., ALI Eton Property Development Corporation and AKL Properties, Inc.; Member of Ayala Foundation, Inc. and Ayala Group Club, Inc. In 2015, he was inducted as member of the Advisory Council of the National Advisory Group for the Police Transformation Development of the Philippine National Police. He earned a degree of B.B.A Accountancy from the University of Notre Dame in 1985, He also received his Master’s Degree in Business Administration in 1989 and in International Relations in 1995, both at the University of Chicago. Jose Teodoro K. Limcaoco, Filipino, 57, has been the Chief Finance Officer and Finance Group Head of Ayala Corporation since April 2015. He is also the Chief Risk Officer and Sustainability Officer of Ayala Corporation. He is a director of Bank of the Philippine Islands, Globe Telecom, Inc. and Integrated Micro-Electronics, Inc.; and an independent director of SSI Group, Inc, also a publicly listed company. He is the Chairman of Darong Agricultural and Development Corporation and Zapfam Inc. He is the President and CEO of AC Ventures Holding Corp., AYC Finance Limited, Bestfull Holdings Limited and Purefoods International Limited. He is the Vice Chairman of Lagdigan Land Corporation. He is the President of Liontide Holdings, Inc. and of Philwater Holdings Company, Inc. He is a Director of Ayala Hotels, Inc., AC Energy, Inc., Ayala Healthcare Holdings, Inc., AC Infrastructure Holdings Corporation, Ayala Aviation Corporation, AC Education, Inc., Asiacom Philippines, Inc., Ayala Group Legal, Michigan Holdings, Inc., AC Industrial Technology Holdings, Inc., A.C.S.T Business Holdings, Inc., LICA Management Inc., and Just For Kids, Inc. He is the Treasurer of Ayala Retirement Fund Holdings, Inc. He joined Ayala Corporation as a Managing Director in 1998. Prior to his appointment as CFO in April 2015, he held various responsibilities including President of BPI Family Savings Bank, President of BPI Capital Corporation, Officer-in-Charge for Ayala Life Assurance, Inc. and Ayala Plans, Inc., Trustee and Treasurer of Ayala Foundation, Inc., President of myAyala.com, and CFO of Azalea Technology Investments, Inc. He served as the President of the Chamber of Thrift Banks from 2013-1015. He was named as the ING-Finex CFO of the Year in 2017. He has held prior positions with JP Morgan & Co. and with BZW Asia. He graduated from Stanford University with a BS Mathematical Sciences (Honors Program) in 1984 and from the Wharton School of the University of Pennsylvania with an MBA (Finance and Investment Management) in 1988. Arthur R. Tan, Filipino, 60, has been a Senior Managing Director of Ayala Corporation since January 2007 and has been a member of the Ayala Group Management Committee since 2002. He has been the Chief Executive Officer of Integrated Micro-Electronics, Inc. (IMI), a publicly listed company, since April 2002 and was re-elected as its President effective January 1, 2020. He is also the Group President and Chief Executive Officer of AC Industrial Technology Holdings, Inc. Concurrently, he is also the Chairman of the Board and Chief Executive Officer of PSi Technologies Inc. and Merlin Solar Technologies (Phils.), Inc.; President and Chief Executive Officer of Speedy-Tech Electronics Ltd.; Chairman of the Board of Surface Technology International (STI), Ltd., Chairman of the Advisory Board of Via Optronics GmbH and MT Technologies GmbH. He was the President of IMI from July 1, 2001 to June 23, 2016. Prior to IMI, he was the Northeast Area Sales Manager and Acting Design Center Manager of American Microsystems Inc. (Massachusetts, USA), from 1994 to 1998, of which he became the Managing Director for Asia Pacific Region/Japan from 1998 to 2001. He graduated with B.S. in Electronics Communications Engineering degree from Mapua Institute of Technology in 1982 and attended post- graduate programs at the University of Idaho, Singapore Institute of Management, IMD and Harvard Business School. Ernest Lawrence L. Cu, Filipino, 59, has been a member of the Ayala Group Management Committee since January 2009. He is the President and Chief Executive Officer of Globe Telecom, Inc., a publicly listed company. He is a trustee of Ayala Foundation, Inc. and Hero Foundation, Inc. Prior to joining Globe, he was the President and CEO of SPI Technologies, Inc. In 2017, he was adjudged Best CEO by Finance Asia. A second for Cu, he first received the award in 2010. Also in 2017, for the fifth straight year, Cu was recognized as one of the 100 most influential telecom leaders worldwide by London-based Global-Telecoms Business Magazine Power 100. Frost & Sullivan Asia Pacific has also named him CEO of the Year twice, first in 2012, and again in 2017. He earned a degree in BS Industrial Management Engineering from De La Salle University in 1982 and took his Master’s Degree in Business Administration at the JL Kellogg Graduate School of Management in 1984. Alfredo I. Ayala, Filipino, 58, has been a Managing Director of Ayala Corporation and a member of the Ayala Group Management Committee since June 2006. He is the President, Chief Executive Officer and Director of LiveIt Investments Limited, Ayala Corporation’s holding company for its business processing outsourcing. He is also Director & Chief Operating Officer of iPeople, inc., Ayala Corporation’s investment in the education sector, in partnership with House of Investments, Inc. Currently, he also holds the following positions: Director of Affinity Express Holdings, Ltd., and Azalea

S E C F O R M 1 7 - A 212
International Venture Partners Limited.; Chairman and President of AC College of Enterprise and Technology, Inc., National Teachers College, and LINC Institute; Chairman of Affordable Private Education Center, Inc. and Newbridge International Investments Limited; Vice Chairman and Vice President of Affinity Express Philippines, Inc.; Chairman of University of Nueva Caceres; and Trustee of Ayala Foundation, Inc. He is also a Trustee of Philippine Business for Education (PBEd). He has an MBA from the Harvard Graduate School of Business Administration in 1987 and B.A. in Development Studies (Honors) and Economics from Brown University in 1982. Paolo Maximo F. Borromeo, Filipino, 42, has been a Managing Director since January 2016 and a member of the Ayala Corporation Management Committee and the Ayala Group Management Committee since September 2014. He has served as Group Head of Corporate Strategy and Development of the Company since September 2014. In his role, he oversees the overall corporate planning process, portfolio strategy, group-wide innovation projects and new business development initiatives. In addition, he leads Ayala Corporation’s healthcare businesses. He is currently the President and Chief Executive Officer of Ayala Healthcare Holdings, Inc. and of Zapfam, Inc., and the Vice Chairman of the Generika Group of Companies. He also sits on the board of AC Ventures Holding Corp., AC Industrial Technology Holdings Inc., HCX Technology Partners, Inc., Ayala International Holdings Limited, AG Holdings Limited and LiveIt Investments Limited. Prior to joining Ayala, he was a Principal at Booz & Company, a global strategy consulting firm, based in San Francisco, California, USA. He obtained his Bachelors of Science degree in Management Engineering from the Ateneo de Manila University and his Master’s in Business Administration with honors from the Wharton School at the University of Pennsylvania. John Eric T. Francia, Filipino, 48, has been a Managing Director and a member of the Ayala Corporation Management Committee and the Ayala Group Management Committee since January 2009. He is the President of AC Energy, Inc., President and Chief Executive Officer of AC Energy Philippines Inc., and Chairman, President and Chief Executive Officer of ACE Enexor, Inc. In his previous role as Head of Ayala’s Corporate Strategy and Development group, he led Ayala’s entry into the energy and transport infrastructure sectors in 2011. Under his leadership, Ayala invested in over 1,700MW of attributable capacity in the energy sector, and secured over $1bn worth of PPP projects in the transport infrastructure space. He is also a member of the Board of Directors of the following companies within the Ayala Group: Purefoods International Limited, Ayala Healthcare Holdings, Inc., AC Ventures Holding Corp., Ayala Aviation Corporation, Zapfam, Inc., Northwind Power Development Corporation, North Luzon Renewable Energy Corporation, Light Rail Manila Corporation, AC Infrastructure Holdings Corporation, Ayala Hotels, Inc., Michigan Holdings, Inc., and other various companies under the AC Energy Group. Prior to joining Ayala, he was a senior consultant and member of the management team of Monitor Group, a strategy consulting firm based in Cambridge, Massachusetts, USA. Prior to consulting, he spent a few years in the field of academe and media. He received his undergraduate degree in Humanities and Political Economy from the University of Asia & the Pacific, graduating magna cum laude in 1993. He then completed his Masters Degree in Management Studies at the University of Cambridge in the United Kingdom, graduating with First Class Honors in 1995. Solomon M. Hermosura, Filipino, 57, has served as Managing Director of Ayala Corporation since 1999 and a member of the Ayala Corporation Management Committee since 2009 and the Ayala Group Management Committee since 2010. He is also the Group Head of Corporate Governance, and the Chief Legal Officer, Chief Compliance Officer, Corporate Secretary and Data Protection Officer of Ayala Corporation. He is the CEO of Ayala Group Legal. He serves as the Corporate Secretary and Group General Counsel of Ayala Land, Inc., and Corporate Secretary of Globe Telecom, Inc., Manila Water Company, Inc., Integrated Micro-Electronics, Inc., AC Energy Philippines, Inc. and Ayala Foundation, Inc. He also serves as a Corporate Secretary and a member of the Board of Directors of a number of companies in the Ayala group. Mr. Hermosura is currently a member of the faculty of the College of Law of San Beda University. He graduated valedictorian with Bachelor of Laws degree from San Beda College in 1986 and placed third in the 1986 Bar Examinations. Ruel T. Maranan, Filipino, 57, has been a Managing Director of Ayala Corporation since January 2015. He has served as President of Ayala Foundation, Inc. since March 1, 2015. He is also a member of the board of directors of Asticom Technology, Inc., People's Management of the Philippines Foundation and Advisers of Natasha Goulbourn Foundation. He is also a member of the board of representatives of CIFAL Philippines. He was the Group Director of Manila Water Company, Inc. (MWC)’s Corporate Human Resources Group from 2004 to 2014. Before joining MWC, he was part of various organizations such as Globe Telecom, Inc., Vitarich Corporation, and Integrated Farm Management, among others. In MWC, he introduced numerous innovations in human resources management, rallying behind the company’s being the first Filipino company to win the prestigious Asian Human Capital Award in 2011, an award sponsored by the Singapore Ministry of Manpower, CNBC Asia-Pacific, and INSEAD. Through

S E C F O R M 1 7 - A 213
his leadership in human resources, MWC was vested the 2006 Outstanding Employer of the Year by the People Management Association of the Philippines. Mr. Maranan earned his AB Social Sciences degree from the Ateneo de Manila University and his law degree from the University of Santo Tomas. The latter institution has recently granted him the UST 2016 Outstanding Alumni Award under Private Sector. He has also completed the Leadership Management Program under Harvard. John Philip S. Orbeta, Filipino, 58, is currently the Managing Director, Chief Human Resources Officer and Group Head for Corporate Resources at Ayala Corporation, covering Strategic Human Resources, Information & Communications Technology, AC Synergy, Knowledge Management, and Corporate Support Services. He has served as a member of the Ayala Corporation Management Committee since May 2005 and the Ayala Group Management Committee since April 2009. He is currently the Chairman of Ayala Aviation Corporation, Ayala Group HR Council, Ayala Group Corporate Security Council and Ayala Business Clubs; Chairman and President of HCX Technology Partners, Inc.; and Vice Chairman of Ayala Group Club, Inc. Mr. Orbeta also serves as a Board Director of AG Counselors Corporation, AC Industrial Technology Holdings, Inc., Ayala Foundation Inc., Ayala Healthcare Holdings, Inc., Ayala Retirement Fund Holdings, Inc., ZapFam Inc., Generika Group of Companies, BPI Family Bank, Inc., ALFM Growth Fund, Inc., ALFM Money Market Fund, Inc., ALFM Peso Bond Fund, Inc., ALFM Dollar Bond Fund, Inc., ALFM Euro Bond Fund, Inc., ALFM Global Multi-Asset Income Fund, Inc., ALFM Retail Corporate Fixed Income Fund, Inc. and the Philippine Stock Index Fund Corporation. Mr. Orbeta previously served as the President and CEO of Ayala Automotive Holdings Corporation and Automobile Central Enterprise, Inc. (Philippine importer of Volkswagen) and the Chairman and CEO of Honda Cars Makati, Inc., Isuzu Automotive Dealership, Inc. and Iconic Dealership, Inc., and Board Director of Honda Cars Cebu, Inc and Isuzu Cebu Inc. Prior to joining Ayala Corporation, he was the Vice President and Global Practice Director of the Human Capital Consulting Group at Watson Wyatt Worldwide (now Willis Towers Watson), overseeing the firm’s practices in executive compensation, strategic rewards, data services and organization effectiveness around the world. He was also a member of Watson Wyatt’s Board of Directors. He graduated with a degree in A.B. Economics from the Ateneo de Manila University in 1982. Catherine H. Ang, Filipino, 49, has served as Executive Director and Chief Audit Executive of Ayala Corporation since July 2013. She joined the Company in February 2012 as Head for Risk Management and Sustainability. Currently, she also holds the following positions: Director of Technopark Land, Inc.; Audit and Risk Committee Member of Ayala Healthcare Holdings, Inc., AC Energy, Inc., AC Infrastructure Holdings Corporation, Affinity Express Holdings, Ltd., Ayala Multi-Purpose Cooperative and Entrego Fulfillment Solutions, Inc; Audit Committee Member of Light Rail Manila Corporation and AF Payments, Inc.; Audit Committee Chair of the Financial Executives Institute of the Philippines (FINEX); and a member of the Governance Committee of The Institute of Internal Auditors – Philippines (IIAP). She was also the 2017 - 2018 Audit Committee Chair and Good Governance Committee Vice Chairperson of FINEX, 2016 Finance Committee Chair of FINEX Foundation, 2015-2016 Institute of Corporate Directors’ Scorecard Circle Chair, 2014 Chair of the Board of Trustees, and a member of the Board of Directors from 2009 to 2013 of IIAP. Prior to joining Ayala Corporation, she was the Chief Audit Executive of Globe Telecom, Inc. where she started as an Internal Audit Manager in 1996 and rejoined the company in 2000. In 1998, she joined PricewaterhouseCoopers - Singapore as Manager for Operational and Systems Risk Management. She started her career at SGV & Co in 1991 as a financial and IT auditor. She is a Certified Public Accountant, a Fellow of the Institute of Corporate Directors, a qualified Crisis Communication Planner, and holds an Associate (Level 1) Certification from Global Innovation Management Institute (GIMI). She graduated magna cum laude from Saint Louis College in 1991 with a degree in Bachelor of Science in Commerce major in Accounting. Estelito C. Biacora, Filipino, 49, is the Executive Director and Treasurer of Ayala Corporation since November 2018. Currently, he also holds the following positions: Director and Treasurer of Michigan Holdings, Inc., Pameka Holdings, Inc. and Technopark Land, Inc.; Director of AYC Finance, Limited, AYC Holdings Limited, and Zapfam, Inc.; Director, Treasurer and Chief Finance Officer of Philwater Holdings Company, Inc.; Treasurer of AC Infrastructure Holdings Corporation, ACST Business Holdings, Inc., ASIACOM Philippines, Inc., AC Ventures Holding Corporation, Ayala Foundation, Inc., Azalea International Venture Partners, Ltd., Liontide Holdings, Inc., and PPI Prime Venture, Inc.; Chief Finance Officer and Treasurer of Ayala Group Club; and, member of Ayala Foundation Endowment Committee and Ayala Corporation Retirement Committee. Prior to joining Ayala, he served as Senior Vice President for Global Markets Group at the Bank of the Philippine Islands (BPI). His other previous senior assignments include Chief Investment Officer (CIO) for BPI Asset Management and Trust Group, and Senior Vice President and Head of BPI Private Banking. He also served as member of BPI Management Committee, and member of the board of BPI Forex Corporation and BPI International Finance Limited, Hong Kong. He served as the President and board member of ACI Philippines, the Financial Markets Association affiliated with Paris-based organization of global markets professionals. He also served as member of BAP-Capital Markets Development Committee. He has held prior

S E C F O R M 1 7 - A 214
positions with Far East Bank and Trust Company, and Banco Santander, Philippines. Mr. Biacora earned a Bachelor of Science degree in Commerce, major in Finance in 1990 and Masters in Business Administration in 1994, from De La Salle University. Josephine G. De Asis, Filipino, 48, has been the Controller of Ayala Corporation since August 2012. Currently, she also holds the following positions: Chairwoman of PPI Prime Venture, Inc.; Director and Chief Finance Officer of Pameka Holdings, Inc.; Director of Azalea International Venture Partner Ltd., Darong Agricultural & Development Corporation, Technopark Land, Inc., and Zapfam, Inc.; Chief Finance Officer of Michigan Holdings, Inc.; Treasurer and Chief Finance Officer of AG Counselors Corporation; and Audit and Risk Committee Member of AC Energy, Inc. and AC Infrastructure Holdings Corporation. Prior to joining Ayala Corporation, she served as the Head of Financial Control Division of Globe Telecom, Inc. from 2010 to 2012 and Controller of the Wireless Business of Globe Telecom, Inc. from 2005-2010. She is a Certified Public Accountant. She graduated with a degree in BS Accountancy (summa cum laude) from Polytechnic University of the Philippines in 1991 and attended an Executive Management Program from the University of California Los Angeles from 2004- 2005. Dodjie D. Lagazo, Filipino, 40, has served as Assistant Corporate Secretary of Ayala Corporation since April 2015. He is an Executive Director, the Head for Legal and Regulatory, and the Assistant Corporate Secretary, of AC Energy, Inc., the Ayala Group’s business arm in the energy sector. He also serves as the Corporate Secretary of various AC Energy subsidiaries and affiliates. Previously, he was a Director of Ayala Group Legal from January 2014 to July 2017, and prior to joining the Ayala Group, he was an associate at SyCip Salazar Hernandez & Gatmaitan. He received his undergraduate degree in Political Science from the University of the Philippines, Diliman, graduating magna cum laude. He then completed his Bachelor of Laws Degree in the College of Law of the University of the Philippines, Diliman, ranked sixth in the graduating class of 2003. He is a member in good standing of the Integrated Bar of the Philippines. Joanne M. Lim, Filipino, 37, has served as Assistant Corporate Secretary of Ayala Corporation since June 2016. She is also the Assistant Corporate Secretary of Integrated Micro-Electronics, Inc, Ayala Foundation, Inc., AC Industrial Technology Holdings, Inc., LiveIt Investments Limited and other companies within the Ayala Group to which she also provides other legal services. She is a Senior Counsel at Ayala Group Legal. Prior to joining Ayala Group Legal in 2015, she was a Project Legal Advisor for CFT Transaction Advisors. She served as Director of the Legal Affairs Office of the Department of Finance from 2011 to 2013 and was an Associate at SyCip, Salazar, Hernandez & Gatmaitan Law Offices from 2007 to 2010. She obtained her Bachelor of Laws degree in 2007 and her Bachelor of Arts degree in Broadcast Communication (magna cum laude) in 2003, both from the University of the Philippines, Diliman. She has a Master of Laws degree in Global Business Law from New York University and a Master of Laws degree in Corporate and Financial Services Law from National University of Singapore. She was admitted to the Philippine Bar in 2008 and to the New York State Bar in 2015. Employment Contracts and Termination of Employment and Change-in-Control Arrangements The above-named executive officers are covered by letters of appointment stating their respective job functionalities, among others. Significant Employees The Company attributes its continued success to the collective efforts of its employees, all of whom contribute significantly to the business in various ways. Family Relationships Jaime Augusto Zobel de Ayala, Chairman and Chief Executive Officer, and Fernando Zobel de Ayala, President and Chief Operating Officer, are brothers.
Except for the foregoing, there are no known family relationships between the current members of the Board and key officers. Ownership Structure and Parent Company As of February 29, 2020, Mermac, Inc. owns 56.85% of the outstanding voting shares of the Company. Involvement in Certain Legal Proceedings Please refer to Part I - Item 3. Legal Proceedings. Resignation of Directors/Management Committee members/Key Officers To date, no director has resigned from, or has declined to stand for re-election to the Board since the date of the 2019 annual meeting of stockholders due to any disagreement with the Company relative to its operations, policies and practices.

S E C F O R M 1 7 - A 215
Item 10. Executive Compensation
Name and Principal Position Year Salary Bonus Other Annual
Compensation
Jaime Augusto Zobel de Ayala
Chairman and CEO
Fernando Zobel de Ayala
President and Chief Operating Officer
Solomon M. Hermosura
Managing Director, Chief Legal Officer,
Corporate Secretary, Chief Compliance
Officer, Data Protection Officer, and
Corporate Governance Group Head
Jose Teodoro K. Limcaoco
Senior Managing Director, Chief
Finance Officer, Chief Risk Officer,
Chief Sustainability Officer, and Finance
Group Head
John Philip S. Orbeta
Managing Director, Chief Human
Resources Officer, and Corporate
Resources Group Head
CEO and Most Highly Compensated
Executive Officers
Actual 2018 ₱303.98M ₱243.29M ₱ 0
Actual 2019 ₱334.69M ₱280.07M ₱21.7M
Projected 2020 ₱358.12M ₱305.36M ₱ 0
All other officers** as a group unnamed Actual 2018 ₱730.62M ₱464.87M ₱ 0
Actual 2019 ₱827.10M ₱535.42M ₱59.6M
Projected 2020 ₱749.00M ₱529.25M ₱ 0
** Managers and up (including all above-named officers).
The total annual compensation consists of basic pay and other taxable income (guaranteed bonus and performance-based bonus). The Other Annual Compensation is a one-time bonus paid as part of the Company’s 185th year anniversary. The Company has no other arrangement with regard to the remuneration of its existing officers aside from the compensation received as herein stated. Warrants and options outstanding; repricing i. Since 1995, the Company has offered its officers options to acquire common shares under its
executive stock option plan (ESOP). In 2019, no options under ESOP was exercised by the above-named officers in Item 10, while there were options covering 89,611 shares exercised by the other officers of the Company, to wit:
Name No. of Availed
Shares Date of Grant Exercise Price Market Price at
Date of Grant
Various** 89,611 Various ₱ 415.27* ₱ 547.23*
* Average prices. **Managers and up ii. The Company adjusted the exercise price and market price of the options awarded to the above-
named officers due to the stock dividends declared by the Company in May 2004, June 2007, May 2008 and July 2011 and to the reverse stock split in May 2005.

S E C F O R M 1 7 - A 216
Compensation of Directors
Article IV, Section 20, of the By-laws provides: Section 20 - Each Director shall be entitled to receive from the Corporation, pursuant to a resolution of the Board of Directors, fees and other compensation for his services as Director. The Board of Directors shall have the sole authority to determine the amount, form and structure of the fees and other compensation of the Directors. In no case shall the total yearly compensation of Directors exceed one percent (1%) of the net income before income tax of the Corporation during the preceding year. The compensation and remuneration committee of the Board of Directors shall have the responsibility of recommending to the Board of Directors the fees and other compensation for directors. In discharging this duty, the committee shall be guided by the objective of ensuring that the level of compensation should fairly pay Directors for work required in a company of the Corporation’s size and scope. (As amended on 18 April 2011.) i. Standard arrangement
On April 21, 2017, the Board, upon the recommendation of its Personnel and Compensation Committee in order to make the level of remuneration more commensurate with their responsibilities, approved a resolution fixing the current remuneration of non-executive directors, as follows:
Retainer Fee: ₱ 3,000,000.00 Board Meeting Fee per meeting attended: ₱ 200,000.00 Committee Meeting Fee per meeting attended: ₱ 100,000.00
Directors who hold executive or management positions do not receive directors’ fees. The compensation of executive directors is included in the compensation table in Item 10 above.
ii. Other arrangement
None of the non-executive and independent directors who are paid fees as set forth above (Standard arrangement) is engaged and compensated by the Company for services other than those provided as a director. The Company has no other arrangement with regard to the remuneration of its existing non-executive directors aside from the compensation received as herein stated.
The Company’s Personnel and Compensation Committee is chaired by Mr. Del Rosario, Jr., an independent director, with Messrs. Lazaro and Matsunaga as members.

S E C F O R M 1 7 - A 217
Item 11. Security Ownership of Certain Beneficial Owners and Management Security ownership of certain record and beneficial owners (of more than 5%) as of February 29, 2020.
Title of class
of voting shares
Name and address of record owner and relationship with Issuer
Name of beneficial owner and
relationship with record owner
Citizenship No. of shares held
Percent of outstanding
voting shares
Common Mermac, Inc.3 3/F Makati Stock Exchange Building, Ayala Triangle, Ayala Avenue, Makati City
Mermac, Inc.4 Filipino 296,625,706 35.9241%
Voting Preferred
172,778,760 20.9251%
Common PCD Nominee Corporation (Non-Filipino)5 G/F MSE Bldg. Ayala Ave., Makati City
PCD participants acting for themselves or for their customers6
Various Non-Filipino
162,032,358 19.6236%
Common PCD Nominee Corporation (Filipino)8 G/F MSE Bldg. Ayala Ave., Makati City
PCD participants acting for themselves or for their customers9
Filipino 107,795,772 13.0551%
Common Mitsubishi Corporation7 3-1, Marunouchi 2- Chome, Chiyoda-ku, Tokyo 100-8086
Mitsubishi Corporation8
Japanese 37,771,896 4.5745%
Voting Preferred
19,545,678 2.3672%
Security ownership of directors and management as of February 29, 2020.
Title of class
of outstanding
shares
Name of beneficial owner Amount and nature of beneficial ownership
Citizenship Percent of total
outstanding shares
Directors
Common
Jaime Augusto Zobel de Ayala
392,806 (indirect)
Filipino
0.0448%
Preferred B Series 1
20,000 (indirect) 0.0023%
Voting Preferred
543,802 (direct) 0.0620%
Common
Fernando Zobel de Ayala
392,264 (direct & indirect)
Filipino
0.0447%
Voting Preferred
554,983 (direct) 0.0633%
Common
Delfin L. Lazaro
41,129 (direct & indirect)
Filipino
0.0047%
Voting Preferred
258,297 (direct) 0.0295%
Common Keiichi Matsunaga 1 (direct) Japanese 0.0000%
Common
Xavier P. Loinaz
126,614 (direct)
Filipino
0.0144%
Voting Preferred
65,517 (direct) 0.0075%
Common Antonio Jose U. Periquet 1,200 (direct) Filipino 0.0001%
Common Ramon R. Del Rosario, Jr. 1 (direct) Filipino 0.0000%
CEO and most highly compensated officers
Common
Jaime Augusto Zobel de Ayala
392,806 (direct & indirect)
Filipino
0.0448%
Preferred B Series 1
20,000 (indirect) 0.0023%
Voting Preferred
543,802 (direct) 0.0620%
Common Fernando Zobel de Ayala 392,264 (direct & indirect) Filipino 0.0447%
3 The Co-Vice Chairmen of Mermac, Inc. (“Mermac”), Jaime Augusto Zobel de Ayala and Fernando Zobel de Ayala, are the Chairman and Chief Executive Officer and President and Chief Operating Officer of the Company, respectively. Mr. Jaime Augusto Zobel de Ayala has been named and appointed to exercise the voting power of Mermac. 4 The Board of Directors of Mermac has the power to decide how the Ayala shares held by Mermac are to be voted. 5 PCD Nominee Corporation (PCD) is not related to the Company. 6 Each beneficial owner of shares through a PCD participant is the beneficial owner to the extent of the number of shares in his account with the PCD participant. Out of the 269,828,130 common shares registered in the name of PCD Nominee Corporation, 59,336,890 (7.1862% of the voting stock) and 44,008,911 (5.3299% of the voting stock) are for the accounts of Deutsche Bank Manila (DB) and The Hongkong and Shanghai Banking Corporation (HSBC), respectively. The Company has no record relating to the power to decide how the shares held by PCD are to be voted. As advised to the Company, none of DB, HSBC, or any of their customers beneficially owns more than 5% of the Company’s common shares. 7 Mitsubishi Corporation (“Mitsubishi”) is not related to the Company. 8 The Board of Directors of Mitsubishi has the power to decide how Mitsubishi’s shares in Ayala are to be voted. Mr. Keiichi Matsunaga has been named and appointed to exercise the voting power.

S E C F O R M 1 7 - A 218
Voting Preferred
554,983 (direct) 0.0633%
Common
Solomon M. Hermosura
121,960 (indirect)
Filipino
0.0139%
Voting Preferred
53,583 (direct) 0.0061%
Common Jose Teodoro K. Limcaoco 302,068 (indirect) Filipino 0.0345%
Common John Philip S. Orbeta 607,667 (indirect) Filipino 0.0693%
Other executive officers (Ayala group ManCom members/Senior Leadership Team)
Common Cezar P. Consing 107,926 (indirect) Filipino 0.0123%
Common Bernard Vincent O. Dy 21,681 (indirect) Filipino 0.0025%
Common Arthur R. Tan 359,743 (indirect) Filipino 0.0410%
Common Jose Rene Gregory D. Almendras
112,488 (direct & indirect) Filipino 0.0128%
Common Alfredo I. Ayala 174,777 (direct & indirect) Filipino 0.0199%
Common Paolo Maximo F. Borromeo 65,311 (indirect) Filipino 0.0074%
Common John Eric T. Francia 120,224 (indirect) Filipino 0.0137%
Common Ernest Lawrence L. Cu 133,502 (indirect) Filipino 0.0152%
Common Ruel T. Maranan 21,671 (indirect) Filipino 0.0025%
Common Estelito C. Biacora 2,712 Filipino 0.0003%
Common Josephine G. De Asis 26,984 (indirect) Filipino 0.0031%
Common
Catherine H. Ang
25,773 (indirect)
Filipino
0.0029%
Preferred B Series 2
2,000 (indirect) 0.0002%
Voting Preferred
5,290 (direct) 0.0006%
Common Dodjie D. Lagazo 0 Filipino 0.0000%
Common Joanne M. Lim 0 Filipino 0.0000%
All Directors and Officers as a group 4,661,974 0.5324%
No director or member of the Company’s management owns 2.0% or more of the outstanding capital stock of the Company. The Company knows of no person holding more than 5% of common shares under a voting trust or similar agreement. No change of control in the Company has occurred since the beginning of its last fiscal year. Item 12. Certain Relationships and Related Transactions The Company, in the regular conduct of business, has entered into transactions consisting of advances, loans and reimbursements of expenses, purchase, lease and sale of real estate properties, and administrative service agreements, with associates and other related parties. Sales and purchases of goods and services to and from related parties are made at arms-length basis fair, and inure to the interest of both parties. Material related party transactions are reviewed by the Risk Management and Related Party Transactions Committee of the Board and properly disclosed in the accompanying audited financial statements. Material transactions involving the Company or its associates and in which any of its directors and executive officers has a direct or indirect material interest are likewise reviewed by the Risk Management and Related Party Transactions Committee of the Board to ensure arms-length and fair terms. To date, there have been no complaints received by the Company regarding related-party transactions. None of the Company’s directors has entered into self-dealing and related party transactions in 2019. The Company, all publicly-listed companies and certain entities within the Group have approval requirements and limits on the amount and extent of related party transactions in compliance with the requirements under the Revised SRC Rule 68. Related party transactions are further discussed in the Note 32 of the Consolidated Financial Statements for December 31, 2019 which forms part of the Index of this SEC17A report. Transactions with Promoters There are no transactions with promoters within the past five (5) years.

S E C F O R M 1 7 - A 219
Awards and Recognitions 1. Jaime Augusto Zobel de Ayala was one of the eight recipients of the Best CEO of the Year Award.
The Asset Best CEO Award acknowledges the leadership qualities of a chief executive officer and rewards a range of skills and attributes including inspirational leadership, strategic thinking, team and relationship building, effective communication and change management
2. Ayala was one of thirteen grantees of the Best Investor Relations Team Award. The Award recognizes the importance of the Investor Relations Team in providing an efficient interface for the company with investors and analysts.
3. Ayala was one of the 23 Asian companies recognized for showing additional efforts and initiatives to achieve higher standards in ESG with the Platinum Award. The Asset ESG Corporate Awards offers a rigorous bench-marketing service for listed companies with regards to corporate sustainability. The criteria used to assess the companies include a range of metrics of financial performance, which are also a proxy for gauging management acumen. Companies are also evaluated according to the quality of their governance, social responsibility, environmental responsibility and investor relations. Companies that achieve the passing threshold score in all categories are recognized with the Titanium Award. Companies that show greater efforts and initiatives are granted Gold and Platinum Award.
4. Jose Teodoro K. Limcaoco was recognized as one of the 25 Most Influential DOers & Shakers in Purposeful Organizations. At the heart of The DO School lies Purposeful DOing. They believe that the businesses that thrive in the future will be those that lead with purpose and have a positive impact on our economy, our society and our environment. After dozens of interviews and collaboration with some of the greatest minds behind organizations, as well as a selection of dynamic impact entrepreneurs, The DO School has gotten the list of people who have effectively transformed an organization in a way that is meaningful to others. Innovative and forward-thinking DOers or organizations who find purpose in an authentic way.
5. Ma. Victoria Tan, Ayala Corporation’s Head of Group Risk Management and Sustainability was counted among Eco-Business’ most influential corporate sustainability leaders in Asia Pacific in 2019
6. Ayala was named one of Forbes’ “World’s Best Employees 2019”. In partnership with Statista, Forbes narrowed down 500 finalists from 2,000 of the world’s largest public companies, based on 1.4 million employment recommendations from a global poll and regional surveys
7. CSR WORKS – Ayala Corporation Head of Group Risk Management and Sustainability Ma. Victoria
Tan was included among Asia’s Top Sustainability Superwomen. CSR Works’ annual listing of exceptional female sustainability leaders in the region. Only 27 women from 11 countries were chosen out of 126 nominations from 20 countries across Asia.
8. Ayala was recognized as one of the top performing Philippine Publicly-Listed Companies (PLCs) overall under the ASEAN Corporate Scorecard (ACGS) in 2018. The ACGS serves to raise corporate governance standards and practices among ASEAN PLCs and thereby enhance their attractiveness to foreign investors and promote ASEAN as an asset class. Companies are evaluated on the following areas: rights of shareholders, equitable treatment of shareholders, role of stakeholders, disclosure and transparency and responsibilities of the board.
9. Ayala companies top FinanceAsia's 19th Best Companies in Asia Poll a. Three Ayala companies have been named among the top Philippine winners in FinanceAsia’s
19th Best Companies Poll, beating about 240 other entrants. Ayala Corporation (AC), Ayala Land (ALI), and Globe Telecom (Globe) have all received top citations in multiple categories.
b. Ayala Corporation placed first in Best Managed Company with Ayala Chairman & CEO Jaime Augusto Zobel de Ayala as Best CEO, and Ayala Chief Financial Officer Jose Teodoro K. Limcaoco as Best CFO. AC also ranked first in Best Growth Strategy, first in Best ESG (Environment, Social and Governance), and third in Best Investor Relations.

S E C F O R M 1 7 - A 220
Website and Social Media The Company’s official website is www.ayala.com.ph. Further details on the Company’s corporate information, background, activities, and other areas like governance initiatives is available at the website. Also as part of our stakeholder engagement, Ayala maintains the following social media accounts:
• Facebook.com/AyalaCorporation
• Twitter.com/Ayala_1834
• Instagram.com/Ayala_Corporation
• Linkedin.com/company/ayala-corporation
• Youtube.com/user/ayala1834. Events after the Reporting Period For detailed discussion of key transactions and information from December 31, 2019 up to issuance date of the 2019 consolidated financial statements, please refer to Note 39 of the Ayala Corporation’s Consolidated Financial Statements for December 31, 2019 which forms part of the Index of this SEC17A report. Other Information Other information about the Group are disclosed in appropriate notes in the accompanying Audited Consolidated Financial Statements for December 31, 2019 or discussed in previously filed SEC17Q and SEC17-C reports for 2019 (refer to Item 14. Exhibits and Schedules Reports on SEC Form 17-C). Also, the Company's Definitive Information Statement (DIS) report and Annual Report (AR) document are also sources of other information about Ayala group. These documents are available at the Company's website www.ayala.com.ph. In addition, the Group has the following major transactions and information from the issuance date of the 2019 consolidated financial statements to the issuance date of this SEC17A report: The Group In compliance with the SEC’s notice dated March 12, 2020, mandating publicly listed companies to apprise the investing public on the impact on business operations and measures being undertaken in connection with the COVID-19 pandemic, on March 16, 2020, Ayala informed that it has existing business continuity and crisis management plans in place to mitigate the adverse effect of the COVID-19 pandemic in its business operations. Ayala has a robust business continuity management system (BCMS), which provides a framework for building organizational resilience with the capability of an effective response that safeguards the interest of its key stakeholders, reputation, brand, and value-creating activities. The BCMS consists of incident and emergency response, business continuity planning, information technology disaster recovery planning, and crisis management which includes a pandemic preparedness plan. In particular, in view of the COVID-19 situation, Ayala institutionalized social distancing measures to ensure the safety of its workforce while ensuring continuity of its business operations across all its business units. The guidelines follow the recommendations of the Department of Health (DOH), Center for Disease Control, World Health Organization, and other local medical professional societies. To ensure the health and safety of our workforce, we have put in place policies on alternative work arrangements such as work-from-home and flexible workhours, restrictions on non-essential overseas travel for business and personal reasons, shift to teleconferencing and videoconferencing to minimize in-person business meetings, regular cleaning and disinfection of the workplace, and cancellation of official mass gatherings. The rising number of COVID-19 cases in the country has raised concerns on its effect on the Philippine economy, which can subsequently impact the outlook for Ayala's various business interests. Please refer to the disclosures of our publicly listed business units ALI, BPI, Globe, MWC, AC Energy Philippines Inc., IMI, and IPO for a report on the impact of the COVID-19 situation in their respective business operations.

S E C F O R M 1 7 - A 221
Meanwhile, Ayala's AC Energy Group develops, and operates several power projects in the Philippines and around the region using various technologies. It also participates in the Philippine wholesale electricity spot market (WESM) to the extent of uncontracted capacity that has to be bought from or sold to the spot market. WESM prices are dependent on the balance of power supply and demand. Restrictions on travel and businesses resulting from COVID-19 pandemic may adversely affect electricity consumption and may result in lower WESM prices. Further, AC Energy relies on imported fuel and equipment for some of its power projects. Strict quarantine measures imposed locally or abroad may result in delays in importation of such equipment and fuel. For its commercial operations, AC Energy: (a) maintains a balanced supply and demand portfolio to minimize merchant risk, and (b) maintains adequate fuel inventories to ensure continued operations. It also has catch-up plans in case of construction delays and liquidated delay damages are expected from contractors for such situations. For its international business, AC Energy has mandated to limit travel plans and has implemented a self-quarantine protocol and remote work arrangements following Ayala's overall preventive measures. The same principle is applied to those deployed outside the Philippines (in Vietnam, Myanmar, and Singapore). On the other hand, Ayala's wholly owned subsidiary AC Health continues to operate to provide healthcare services to the public and support the government in its efforts to contain the spread of COVID-19. With over 80 in combined clinic network in the Greater Metro Manila Area, FamilyDOC and Healthway continue to provide doctor consultations and basic diagnostics to patients. For suspected COVID-19 cases, FamilyDOC and Healthway strictly adhere to DOH guidelines and clinical protocols and where needed, refer patients to appropriate hospitals for further testing and management. AC Health's healthcare professionals are also equipped with the necessary protective equipment to ensure their safety. In addition, Generika’s over 800 branches will remain open to ensure access to quality affordable generic medicines, including wellness supplements for preventive care. AC Health's partner pharmaceutical importation and distribution companies, IE Medica and MedEthix, continue to source medicines and supplies, including face masks, to ensure availability at its pharmacies and clinics. Parent Company a) On October 30, 2019, the Parent Company clarified the news article titled, "6 Firms Bid for $10-B
Sangley Airport" posted on The Daily Tribune (internet edition) on same date, that its real estate subsidiary, ALI, has made general inquiries with the Cavite local government regarding the project.
b) On Februray 7, 2020, 33,751 common shares were exercised under the Parent Company’s ESOP.
c) On February 11, 2020, the Parent Company clarified that the shareholders agreement related to the subscription of shares of MWC by Trident Water will take effect after the closing of the subscription agreement, which will be after the annual stockholders' meeting of MWC on April 17, 2020 and after regulatory approvals have been obtained. This includes the SEC's approval of the denial of pre-emptive rights with respect to the issuance of shares to Trident Water. The closing of the subscription agreement is conditioned on the continuing effectivity of MWC's material contracts.
d) The Parent Company, pursuant to the share buyback program of ₱10.0 billion worth of shares approved by the BOD on December 5, 2019, made the following purchases of its common shares:
Date Number of Shares Price Per Share
February 11, 2020 78,310 ₱755.3192 February 13, 2020 210,000 752.5476 February 14, 2020 570,060 750.0000 February 17, 2020 157,840 749.0000 March 20, 2020 100,000 415.6000 March 23, 2020 150,000 408.0000
e) On March 12, 2020, the Parent Company’s BOD, at its regular meeting, ratified and approved the
amendment of our By-Laws, Board Charter and Corporate Governance Manual (CG Manual), as endorsed by the Corporate Governance and Nomination Committee. The amendments to the By-Laws are intended for alignment with the Revised Corporation Code and good corporate governance practices. Please refer to Part II - Item 5 (E) for the summary of approved changes. Given that the stockholders have delegated to the BOD the authority to amend the By-Laws, the amendments to the By-Laws will become effective upon approval by the SEC. This matter will be presented to the stockholders at their annual meeting on April 24, 2020 as part of the acts of Board for ratification.

S E C F O R M 1 7 - A 222
The revisions to the Board Charter include a more comprehensive enumeration of the responsibilities of the Board and the individual directors, statements pertaining to the Board diversity policy, new sections or independent directors, liability of directors, and performance assessment, discussion on the roles and responsibility of the Chairperson and an updated section of the Corporate Secretary. The CG Manual was amended to align with the revisions in the By-Laws and Board Charter.
ALI a) On February 20, 2020, the ALI BOD approved the declaration of cash dividends amounting to
₱0.268 per outstanding common share. This reflects a 3% increase from the cash dividends declared in the first half of 2019 amounting to ₱0.26 per share. These will be paid on March 20, 2020 to shareholders on record as of March 6, 2020.
b) On February 28, 2020, ALI purchased 1.2 million common shares at ₱39.10 pursuant to its share buyback program.
IMI a) In line with the government’s imposition of a Luzon-wide Enhanced Community Quarantine and
Stringent Social Distancing Measures from March 17, 2020 to April 13, 2020, IMI is implementing a partial shutdown of its facilities in the region since March 17, 2020. Given the Philippine government’s approval for export-oriented companies to remain operational, IMI is collaborating with units in the local and national levels to explore the ability to maintain the appropriate production levels within its factories. Currently, IMI has been deploying a skeletal workforce to support critical business operations in Luzon. In the international front, IMI China’s operations has improved in the month of March with substantial workforce capacity ranging from 85% - 98%. This covers the manufacturing plants in Pingshan, Kuichong, Jiaxing, Chengdu and Suzhou. IMI is also working with China local governments on possible incentives to support the business. On the other hand, IMI Mexico, which contributes 13% of global revenues, has partial shut down of operation until April 30, 2020 in line with Mexican government directives to broaden the shut down to “non essential activities”. Similar skeletal workforce is maintained. IMI will continue to ensure the health, safety and welfare of its employees and will abide by the guidelines mandated by government where IMI operates.
AC Energy a) On March 26, 2020, the Parent Company confirmed the new article titled “AC Energy, Vietnam firm
to expand wind project” published online on same day by Manila Times. AC Energy and Vietnamese partner, The Blue Circle Pte. Ltd., are proceeding with the expansion of the Mui Ne wind project with a second 40-megawatt (MW) phase to be commissioned in 2021 in Binh Thuan province in Vietnam.
Globe a) On February 3, 2020, the Globe BOD approved the declaration of the first quarter cash dividend of
₱27 per common share, payable to common stockholders of record as of February 17, 2020. Total dividends amounting to ₱3.6 billion will be payable on March 4, 2020.
BPI a) On January 24, 2020, BPI upsized its Bond Offer five-fold to ₱15.3 billion from an initial target size
of ₱3 billion, due to strong demand from both retail and institutional investors. The Bonds has been issued, and is now tradable on the Philippine Dealing & Exchange Corp. (PDEx). The issuance is BPI’s second peso bond transaction, following its landmark ₱25 billion bond issuance in 2018.The Bonds has an interest rate of 4.2423% p.a. payable quarterly, and a tenor of two (2) years. BPI Capital Corporation (BPI Capital) and Standard Chartered Bank, Philippine Branch (SCB), served as the joint lead arrangers of the bonds. BPI Capital was sole selling agent, while SCB was participating selling agent.
b) On March 27, 2020, BPI exceeded its initial target size of ₱5.0 billion for its latest Bond Offer by more than six-fold, reaching ₱33.9 billion due to strong demand from institutional investors as well as high-net-worth and retail clients. The Bonds has been issued, and are now tradable on the PDEx. The Bonds has an interest rate of 4.05% p.a. payable quarterly, and a tenor of one and a

S E C F O R M 1 7 - A 223
half (1½) years. BPI decided to close the offer period last March 6, 2020, 11 days ahead of the original schedule on March 17. This decision was based on the consolidated order book having reached over ₱42.0 billion despite being priced at the tightest end of the indicative pricing range. BPI Capital and ING Bank N.V., Manila Branch (ING), served as the joint lead arrangers of the bonds. BPI Capital was sole selling agent, while ING was participating selling agent.

S E C F O R M 1 7 - A 224
PART IV – CORPORATE GOVERNANCE AND SUSTAINABILITY
Item 13.A. Corporate Governance Please refer to Item 5.E. Corporate Governance of Part II Operational and Financial Information for some discussions as it applies to the Company. For the full details and discussion, please refer to the Definitive Information Sheet and Annual Corporate Governance Report posted in the Company’s Official Website www.ayala.com.ph. The detailed discussion of the Annual Corporate Governance Section deleted as per SEC Memorandum Circular No. 5, series of 2013, issued last March 20, 2013. Item 13.B. Sustainability Report Please refer to the Sustainability Report that will be posted in the Company’s Official Website with the following link: https://www.ayala.com.ph/investors/annual-reports on or before April 14, 2020. We will notify the SEC and the PSE once it is uploaded.

S E C F O R M 1 7 - A 225
PART V - EXHIBITS AND SCHEDULES Item 14. Exhibits and Reports on SEC Form 17-C (Current Report) (a) Exhibits - See accompanying Index to Financial Statements and Supplementary Schedules (b) Reports on SEC Form 17-C
Aside from compliance with periodic reporting requirements, Ayala promptly discloses major and market sensitive information such as dividend declarations, joint ventures and acquisitions, the sale and disposition of significant assets, and other information that may affect the decision of the investing public. The Company submitted SEC form 17-C and Press Statements to PSE, SEC, and PDEx on the following matters in 2019:
1. Attendance of Directors in 2018 Board of Directors Meetings 2. AC Energy’s acquisition of 51.48% stake in AC Energy Philippines, Inc. (formerly PHINMA
Energy Corporation) (“ACEPH”) 3. AC Energy’s launching of Maiden Green Bond 4. Asian Development Bank and International Finance Corporation investments in AC Energy
Green Bonds 5. AC Education Inc.’s and iPeople, inc’s execution of Plan and Articles of Merger 6. AC Energy signing of an investment agreement with PHINMA Corporation and Philippine
Investment Management, Inc. to acquire 51.48% stake in ACEPH 7. Notice and Agenda of the 2019 Stockholders’ Meeting 8. Philippine Competition Commission’s (“PCC’s”) approval of the sale by AC Energy of 49%
Voting Stake and 60% Economic Stake in AA Thermal Inc. to Aboitiz Power Corporation 9. Amendments to the Company’s Articles of Incorporation and By-Laws 10. AC Industrial’s acquisition of a controlling stake in C-Con Group 11. 2018 Financial and Operating Results 12. Ayala Healthcare’s purchase of additional stake in the Generika group of companies 13. Updated Notice and Agenda of the 2019 Stockholders' Meeting 14. PCC’s approval of AC Energy's acquisition of ACEPH 15. SEC’s approval of the Plan and Articles of Merger by and between AC Education and IPO 16. Results of the Annual Meeting of Stockholders' Meeting and Organizational Meeting of the
Board of Directors 17. AC Energy’s completion of the sale of 49% voting stake and 60% economic stake in AA
Thermal, Inc. to Aboitiz Power 18. Completion of the Merger of AC Education with iPeople, inc. 19. First Quarter 2019 Financial and Operating Results 20. Re-pricing of the dividend rate of Ayala Corporation's voting preferred shares 21. AC purchases common shares from Mitsubishi Corp 22. 2019 ESOWN Grant 23. PCC’s approval of Ayala Healthcare’s increase in stake in the Generika companies 24. AC Health’s investment in Fibronostics 25. Completion of acquisition of PHINMA Energy by AC Energy 26. Participation of directors and key officers in Ayala Group Integrated Summit and other
seminars on corporate governance 27. Issuance of new shares under Employee Stock Option Plan 28. Declaration of Cash Dividends to all outstanding shares 29. AC Energy's partner to take over Kauswagan coal plant 30. Resignation of an Officer 31. First-half 2019 Financial and Operating Results 32. Redemption of 27,000,000 Class B Preferred Shares (“ACPB2”) 33. Exercise of the option for redemption of the Class B Preferred Shares, Setting of Record
Date, Trading Suspension, and Redemption Guidelines 34. Notice on the Redemption of ACPB2 Shares 35. Updated Corporate Contact Details 36. Transactions of AC Energy with ACEPH 37. AC Energy partners with Yoma Strategic Holdings Ltd. 38. Ayala Corporation’s announcement of mandate to banks for US$ Fixed for Life (Non-
Deferrable) Senior Perpetual Notes 39. Ayala Corporation’s successful launch of US$400 million senior unsecured and guaranteed
fixed for life perpetual notes

S E C F O R M 1 7 - A 226
40. Revised RPT Policy 41. Third Quarter 2019 Financial and Operating Results 42. Special Analyst and Investor Briefing Conference Call 43. Ayala Corporation’s acquisition of 20% stake in Yoma Strategic Holdings, Inc. and another
20% stake in First Myanmar Investment Public Co. Ltd. 44. AC Energy’s announcement of mandate for notes offering 45. AC Energy’s successful launch of first ever Perpetual Fixed-for-life Green Bond 46. Results of the offer of new series of Class B Preferred Shares (“APB2R”) 47. Setting of 2020 Stockholders’ Meeting 48. AC Health’s acquisition of Healthway Philippines 49. AC’s buying of own issued shares from the market 50. AC’s clarification on Share Buyback Program 51. Notices of Analysts’ Briefing
Clarification of News Reports
1. Ayala Corp. 2019 capex set at P249.4 billion 2. Ayala Energy plans divestment of oil and gas part of PHINMA acquisition 3. Ayala on Track to Post P50B Profit 4. AC Energy, partner looking at wind-power project in Vietnam 5. Ayala launches $150M venture capital fund 6. AC Energy eyes Phinma Energy tender offer in Q2 7. AC Energy, UPC forms renewable energy venture 8. 6 Firms Bid for $10-B Sangley Airport 9. AC Energy has $1B war chest for expansion
Structured Reports submitted to SEC, PSE, and PDEx
1. Top 100 Stockholders Report 2. Public Ownership Reports 3. Statement of Changes in Beneficial Ownership of Securities of directors, officers, and 10%
owners 4. Quarterly Financial Reports 5. Annual Report

S E C F O R M 1 7 - A 227
SIGNATURES Pursuant to the requirements of Section 17 of the Securities Regulation Code and Section 141 of the Corporation Code, this report is signed on behalf of the registrant by the undersigned, thereunto duly authorized, in the City of Makati on April 8, 2020. AYALA CORPORATION By: _______________________________ _____________________________ Jaime Augusto Zobel de Ayala Fernando Zobel de Ayala Chairman of the Board and Vice Chairman, President and Chief Executive Officer Chief Operating Officer _______________________________ ________________________________ Jose Teodoro K. Limcaoco Solomon M. Hermosura Chief Finance Officer, Chief Risk Officer, Chief Legal Officer, Corporate Secretary, Chief Sustainability Officer, Chief Compliance Officer, Data Protection and Finance Group Head Officer, and Corporate Governance Group
Head _______________________________ Josephine G. de Asis Comptroller SUBSCRIBED AND SWORN to before me this ______________ at Makati City, affiants exhibiting to me their respective passports/driver’s license, to wit:
Doc. No. ________ Page No. ________ Book No. ________ Series of 2020
Name Passport No. Date and Place of Issue Jaime Augusto Zobel de Ayala P9640299A November 21, 2018 - DFA Manila Fernando Zobel de Ayala P0349883B January 22, 2019 - DFA Manila Jose Teodoro K. Limcaoco P6682433A April 5, 2018 - DFA Manila Solomon M. Hermosura P3081434B October 14, 2019 - DFA NCR East Josephine G. De Asis P0174919B January 9, 2019 - DFA Manila

S E C F O R M 1 7 - A 228
INDEX TO FINANCIAL STATEMENTS AND SUPPLEMENTARY SCHEDULES
I. 2019 Supplementary Schedules
1. Independent Auditors’ Opinion on Supplementary Schedules 2. Supplementary Schedules Details
A. Financial Assets B. Amounts Receivable from Directors, Officers, Employees, Related Parties and Principal
Stockholders (Other than Related Parties) C1. Amounts Receivable from Related Parties which are Eliminated during the Consolidation
of Financial Statements C2. Amounts Payable to Related Parties which are Eliminated during the Consolidation of
Financial Statements D. Long-term Debt E. Indebtedness to Related Parties (Long-term Loans from Related Parties) F. Guarantees of Securities of Other Issuers G. Capital Stock H. Reconciliation of Retained Earnings Available for Dividend Declaration I. Map of the Relationships of the Companies within the Group J. Financial Ratios
II. 2019 Consolidated Financial Statements of Registrant
1. Statement of Management’s Responsibility for Financial Statements 2. Ayala Corporation and Subsidiaries Consolidated Financial Statements
As of December 31, 2019 and 2018 and Years Ended December 31, 2019, 2018 and 2017 and Independent Auditors’ Report
III. 2019 Consolidated Financial Statements of Associate and Joint Venture
1. Bank of the Philippine Islands and Subsidiaries 2. Globe Telecom, Inc. and Subsidiaries
IV. 2019 Ayala Corporation and Subsidiaries Special Form for Financial Statements (SFFS)
1. SFFS Certification by CFO and Comptroller 2. Printed copy of SFFS 3. Diskette form (soft copy) of SFFS (for submission post-ECQ period)
V. 2019 Parent Company Financial Statements (with BIR ITR Filing Reference) and SFFS

S E C F O R M 1 7 - A 229
I. 2019 Supplementary Schedules

*SGVFS039491*
INDEPENDENT AUDITOR’S REPORTON SUPPLEMENTARY SCHEDULES
The Stockholders and the Board of DirectorsAyala Corporation32F-35F Tower One and Exchange PlazaAyala Triangle, Ayala Avenue, Makati City
We have audited, in accordance with Philippine Standards on Auditing, the consolidated financialstatements of Ayala Corporation and its subsidiaries (the Group) as at December 31, 2019 and 2018 andfor each of the three years in the period ended December 31, 2019, included in this Form 17-A, and haveissued our report thereon dated March 12, 2020. Our audits were made for the purpose of forming anopinion on the basic consolidated financial statements taken as a whole. The schedules listed in theIndex to the Consolidated Financial Statements and Supplementary Schedules are the responsibility ofthe Group’s management. These schedules are presented for purposes of complying with the RevisedSecurities Regulation Code Rule 68 and are not part of the basic consolidated financial statements.These schedules have been subjected to the auditing procedures applied in the audit of the basicconsolidated financial statements and, in our opinion, fairly state, in all material respects, the informationrequired to be set forth therein in relation to the basic consolidated financial statements taken as a whole.
SYCIP GORRES VELAYO & CO.
Lucy L. ChanPartnerCPA Certificate No. 88118SEC Accreditation No. 0114-AR-5 (Group A), November 16, 2018, valid until November 15, 2021Tax Identification No. 152-884-511BIR Accreditation No. 08-001998-46-2018, February 26, 2018, valid until February 25, 2021PTR No. 8125221, January 7, 2020, Makati City
March 12, 2020
SyCip Gorres Velayo & Co.6760 Ayala Avenue1226 Makati CityPhilippines
Tel: (632) 891 0307Fax: (632) 819 0872ey.com/ph
BOA/PRC Reg. No. 0001, October 4, 2018, valid until August 24, 2021SEC Accreditation No. 0012-FR-5 (Group A), November 6, 2018, valid until November 5, 2021
A member firm of Ernst & Young Global Limited

*SGVFS039491*
INDEPENDENT AUDITOR’S REPORT ONCOMPONENTS OF FINANCIAL SOUNDNESS INDICATORS
The Stockholders and the Board of DirectorsAyala Corporation32F-35F Tower One and Exchange PlazaAyala Triangle, Ayala Avenue, Makati City
We have audited, in accordance with Philippine Standards on Auditing, the consolidated financialstatements of Ayala Corporation and its subsidiaries (the Group) as at December 31, 2019 and 2018 andfor each of the three years in the period ended December 31, 2019, and have issued our report thereondated March 12, 2020. Our audits were made for the purpose of forming an opinion on the basicconsolidated financial statements taken as a whole. The Supplementary Schedule on FinancialSoundness Indicators, including their definitons, formulas, calculation, and their appropriateness orusefulness to the intended users, are the responsibility of the Group’s management. These financialsoundness indicators are not measures of operating performance defined by Philippine FinancialReporting Standards (PFRSs) and may not be comparable to similarly titled measures presented by othercompanies. This schedule is presented for the purpose of complying with the Revised SecuritiesRegulation Code Rule 68 issued by the Securities and Exchange Commission, and is not part of the basicconsolidated financial statements prepared in accordance with PFRSs. Except for Preferred shares onthe Common equity attributable to owners of the parent (average) and Price per share, components ofthese financial soundness indicators have been traced to the consolidated.financial statements as at andfor the year ended December 31, 2019 and no material exceptions were noted.
SYCIP GORRES VELAYO & CO.
Lucy L. ChanPartnerCPA Certificate No. 88118SEC Accreditation No. 0114-AR-5 (Group A), November 16, 2018, valid until November 15, 2021Tax Identification No. 152-884-511BIR Accreditation No. 08-001998-46-2018, February 26, 2018, valid until February 25, 2021PTR No. 8125221, January 7, 2020, Makati City
March 12, 2020
SyCip Gorres Velayo & Co.6760 Ayala Avenue1226 Makati CityPhilippines
Tel: (632) 891 0307Fax: (632) 819 0872ey.com/ph
BOA/PRC Reg. No. 0001, October 4, 2018, valid until August 24, 2021SEC Accreditation No. 0012-FR-5 (Group A), November 6, 2018, valid until November 5, 2021
A member firm of Ernst & Young Global Limited

*SGVFS039491*
INDEX TO THE CONSOLIDATED FINANCIAL STATEMENTS
A. Financial Assets
B. Amounts receivable from Directors, Officers, Employees, Related Parties and PrincipalStockholders (Other than Related Parties)
C. Amounts receivable from / payable to related parties which are eliminated during theconsolidation of financial statements
D. Long-term debt
E. Indebtedness to related parties (Long-term loans from Related Parties)
F. Guarantess of Securities of Other Issuers
G. Capital Stock
H. Reconciliation of retained earnings available for dividend declaration
I. Map of relationships of the companies within the Group,wherever located or registered
J. Financial Ratios

S E C F O R M 1 7 - A 230
AYALA CORPORATION AND SUBSIDIARIES Schedule A – Financial Assets As of December 31, 2019 (In Thousand Pesos)
Schedule B – Amounts Receivable from Directors, Officers, Employees, Related Parties and Principal Stockholders (Other than Related Parties)
As of December 31, 2019 (In Thousand Pesos)
A. Other Short-term Cash Investments 1/
Money Market Placements (Peso)
BPI 11,925,802
Various banks 4,996,029 *
16,921,831
Money Market Placements (FX)
BPI 648,002
Various banks 11,027,086 *
11,675,088
Time Deposits (FX)
Various banks 8,004,571 *
Time Deposits (Peso)
BPI 6,398,608
Various banks 1,541
6,400,149
Total 43,001,639 772,423
B. Short-term Investments 2/
Not applicable
C. Financial Assets at Fair Value Through Profit and Loss (FVTPL) 3/
Not applicable
D. Financial Assets at Fair Value Through
Other Comprehensive Income (FVOCI) 4/
Not applicable
* composed of deposits in various banks mainly held by AC, ALI and AC Energy business units.
2/ Money Market Placements with varying maturity periods of more than three months and up to six months amounting to
₱13,387,801k is 2.2% of the ₱609,285,431k Total Current Assets as of December 31, 2019. This is booked under the Short-term
Investments account.
3/ Financial Assets at FVTPL amounted to ₱9,726,080k and an amount of ₱80,864k is placed under BPI's UITF. The total FVTPL
account is shown under the Other Current Assets account and is 1.6% of the ₱609,285,431k Total Current Assets as of December
31, 2019.
4/ Financial Assets at FVOCI amounted to ₱8,208,898k is shown under Other Noncurrent Assets account and is 1.1% of the
₱736,000,527k Total Noncurrent Assets as of December 31, 2019.
Name of Issuing Entity & Association of Each
Issue
Amount Shown in the
Balance Sheet
Income Received &
Accrued
1/ Short-term highly liquid investments with varying periods up to three months shown as part of the Cash and Cash Equivalents
account in the Balance Sheet. Cash Equivalents is 7.1% of the ₱609,285,431k Total Current Assets as of December 31, 2019.
Account Type
Beginning
Balance Additions Deductions
Ending
Balance Current Non-current Payment Period
Advances to Employees 317,507 976,423 (673,421) 620,282 590,844 29,438 30 days to 1 year
Housing and Related Loan 506,689 251,052 (533,798) 223,943 (54,703) 278,646 1 year to 15 years
Car and Related Loan 184,997 257,098 (254,689) 181,636 107,598 74,038 1 year to 5 years
Others 488,804 134,629 (118,760) 479,449 317,603 161,846 6 months to 1 year
TOTAL* 1,497,997 1,619,202 (1,580,668) 1,505,310 961,342 543,968
* Please refer to Notes 7 and 32 in the 2019 Consolidated Audited Financial Statements for detailed account analysis and discussion.

S E C F O R M 1 7 - A 231
AYALA CORPORATION AND SUBSIDIARIES Schedule C1. – Amounts Receivable from Related Parties which are Eliminated during the
Consolidation of Financial Statements As of December 31, 2019 (In Thousand Pesos)
Schedule C2. – Amounts Payable to Related Parties which are Eliminated during the Consolidation
of Financial Statements As of December 31, 2019 (In Thousand Pesos)
Creditor
Creditor's
Relationship to the
Reporting Co. Account Type
Beginning
Balance Movement
Ending
Balance Nature of Accounts
AC Parent Dividends receivable 30,000 4,600 34,600 Dividends from AGCC and DADC
AC Parent Other receivable 123,249 118,848 242,097
Rental fees, with interest on overdue accounts; other
receivables
ACIFL Subsidiary Other receivable 33,251 (33,251) - Other receivables from AIVPL
AC Ventures Subsidiary Subscription receivable 96,889 (26,571) 70,318 Deposits on subscriptions, non-interest bearing
AGCC Subsidiary Trade receivable 31,884 10,283 42,167 Legal fees
ALI Subsidiary Accounts receivable 231,720 216,874 448,594
Advances, non-interest bearing and retention accounts
for construction projects
AYC Subsidiary Other receivable 27,486,063 8,874,017 36,360,081
Mainly non-interest bearing receivable from ACIFL (for
various investment)
IMI Subsidiary Other receivable 69,644 (47,366) 22,278 Advances, non-interest bearing
MWC Subsidiary Accounts receivable 4,627 97,412 102,038 Trade receivables
PFIL Subsidiary Other receivable 80,959 (2,995) 77,965 Other receivables from ACIFL
Others Subsidiary Other receivable 79,493 1,965,175 2,044,668 Reimbursement of expenses, etc.
TOTAL 28,267,781 11,216,564 39,484,345
Debtor
Debtor's
Relationship to the
Reporting Co. Account Type
Beginning
Balance Movement
Ending
Balance Nature of Accounts
AC Parent
Accounts &
Subscription payable 1,015,563 1,295,645 2,311,209
Deposits on subscriptions; advances, non-interest
bearing
ACI Subsidiary Accounts payable 77,751 (30,890) 46,861 Mainly rental fees, with interest on overdue accounts
AC Energy Subsidiary Accounts payable 7,674 (7,674) - Other payables to IMI
AC Health Subsidiary Accounts payable 30,643 (29,188) 1,455 Other payables to AC
ACIFL Subsidiary Accounts payable 26,727,931 9,632,150 36,360,081
Non-interest bearing payable to AYC (for various
investment)
ACIFL Subsidiary Accounts payable 80,959 (2,995) 77,965 Other payables to PFIL
AGCC Subsidiary Accounts payable 24,050 1,419 25,469 Rental fees, with interest on overdue accounts
AGCC Subsidiary Dividends payable 30,000 - 30,000 Dividends
AIVPL Subsidiary Other payables 33,251 (33,251) - Other payables to ACIFL
ALI Subsidiary Other payables 21,306 325,549 346,855 Advances, non-interest bearing
IMI Subsidiary Accounts payable 75,677 (75,677) - Other payables to AC
MWCI Subsidiary Retention payable 67,860 126,173 194,033 Mainly retention accounts for construction projects
Others Subsidiary Other payables 75,115 15,303 90,418 Reimbursement of expenses, etc.
TOTAL 28,267,781 11,216,564 39,484,345

S E C F O R M 1 7 - A 232
Schedule D – Long-term Debt As of December 31, 2019 (In Thousand Pesos)
TITLE OF ISSUE & TYPE OF OBLIGATION
AMOUNT
AUTHORIZED BY
INDENTURE
CURRENT NON-CURRENT TOTAL
PARENT COMPANY:
4,387,500₱ 21,445,641₱ 25,833,141₱
Bonds - 39,710,925 39,710,925
Due 2021 9,903,400₱ - 9,885,752 9,885,752
Due 2023 10,000,000₱ - 9,942,735 9,942,735
Due 2025 10,000,000₱ - 9,929,787 9,929,787
Due 2027 10,000,000₱ - 9,952,651 9,952,651
4,387,500 61,156,566 65,544,066
SUBSIDIARIES:
Loans from banks and other institutions:
1,443,015 14,114,064 15,557,079
IMI 1,419,699 5,791,931 7,211,630
ALI 3,062 6,331,185 6,334,247
AC Industrials 20,254 1,990,948 2,011,202
14,052,889 78,165,325 92,218,214
ALI 13,252,323 52,519,542 65,771,865
AC ENERGY 669,225 25,461,848 26,131,073
Others 131,341 183,935 315,276
15,495,904 92,279,389 107,775,293
Bonds:
Fixed for life notes 1,200,000$ - 60,544,798 60,544,798
Green bonds 410,000$ - 20,727,418 20,727,418
Due 2020 4,000,000₱ 3,995,321 - 3,995,321
Due 2021 14,000,000₱ - 13,934,766 13,934,766
Due 2022 12,650,000₱ - 12,614,111 12,614,111
Due 2023 15,000,000₱ - 14,887,529 14,887,529
Due 2024 18,000,000₱ - 17,915,811 17,915,811
Due 2025 15,000,000₱ - 14,908,645 14,908,645
Due 2026 16,000,000₱ - 15,856,414 15,856,414
Due 2027 8,000,000₱ - 7,924,640 7,924,640
Due 2028 10,000,000₱ - 9,896,154 9,896,154
Due 2033 2,000,000₱ - 1,985,276 1,985,276
3,995,321 191,195,562 195,190,883
Fixed Rate Corporate Notes (FXCNs) - 7,039,272 7,039,272
TOTAL 23,878,725₱ 351,670,789₱ 375,549,514₱
Bank loans - with fixed interest rates ranging from 5.3% to 6.0% and
floating interest rates based on applicable benchmark plus credit spread
ranging from 0.5% to 0.70% with varying maturity dates up to 2028
Foreign currency - with interest rates ranging from 0.87% to 6.88% in
2019
Philippine peso - with interest rates ranging from 3.75% to 9.00% in 2019

S E C F O R M 1 7 - A 233
AYALA CORPORATION AND SUBSIDIARIES Schedule E – Indebtedness to Related Parties (Long-term Loans from Related Parties) As of December 31, 2019 (In Thousand Pesos)
Schedule F – Guarantees of Securities of Other Issuers As of December 31, 2019 (In Thousand Pesos)
Name of Related Parties
Balance at Beginning
of Period
Balance at End of
Period
Bank of the Philippine Islands (BPI)* 25,468,930 30,259,087
*Amounts shown form part of the short-term and long-term debt payable to BPI per Note 32 of the 2019 Consolidated Audited
Financial Statements.
The increase in balance represents borrowings mainly of AC parent co., ALI and AC Energy for expansion projects.
Name of issuing entity of
securities guaranteed by the
company for which this
statement is filed
Title of issue of each
class of securities
guaranteed
Total amount
guaranteed and
outstanding
Amount owned by
person for which
statement is filed Nature of guaranty
AYC Finance Limited * Various * Total loan drawdowns
amounted to $1,700M
wherein $800M is
outstanding as of
December 31, 2019.*
None The Parent Company unconditionally
guarantees the due and punctual
payment of the loan drawdowns if, for
any reason AYCFL does not make
timely payment of the amount due. The
Parent Company waived all rights of
subrogation, contribution and claims of
prior exhaustion of remedies. The
Parent Company’s obligation as
guarantor will remain in full force until no
sum remains to be lent by the lenders,
and the lenders recover the outstanding
loan drawdowns.*
* Please refer to Note 36 of the 2019 Consolidated Audited Financial Statements for the detailed discussion.

S E C F O R M 1 7 - A 234
AYALA CORPORATION AND SUBSIDIARIES Schedule G – Capital Stock* As of December 31, 2019 (In Thousand Pesos)
Schedule H – Reconciliation of Retained Earnings Available for Dividend Declaration As of December 31, 2019 (In Thousand Pesos)
Common Stock issued & subscribed a/
900,000,000 629,034,590
Issued and subscribed on exercise of share
options 2,127,649
Treasury Shares reissuance/acquisition - (4,478,644)
Common shares outstanding 900,000,000 626,683,595 3,856,386
Preferred A shares b/
12,000,000 -
Preferred B shares c/
58,000,000 50,000,000 22,000
Preferred C shares 40,000,000 -
Voting Preferred shares d/
200,000,000 200,000,000 1,481,472
* Please refer to Note 21 of the 2019 Consolidated Audited Financial Statements for the related discussion.
d/ Cumulative, voting and redeemable at the option of Ayala Corporation with a par value of P1 per share and dividend
rate of 5.7730% per annum.
Refer to "Warrants and
options outstanding;
repricing" portion of Item
10 of the SEC17A report.
Refer to
"Security
ownership of
certain record
and beneficial
owners" portion
of Item 11 of the
SEC17A report.
a/ Ayala Corporation has stock option plans for the key officers (Executive Stock Option Plan-ESOP) and employees
(Employee Stock Ownership Plan - ESOWN) covering 3% of the Company's capital stock.
b/ Cumulative, nonvoting and redeemable with a par value of P100 per share and is listed and traded at the Philippine
Stock Exchange. It may be redeemed at the option of Ayala Corporation starting in the fifth year. The offering price is
P500 per share with a dividend rate of 8.88% per annum. This security was redeemed on Nov. 25, 2013.
c / Cumulative, nonvoting and redeemable with a par value of P100 per share. It is listed and traded at the Philippine Stock
Exchange and may be redeemed at the option of Ayala Corporation starting on the fifth year of issue date. The offering
price is P500 per share with a fixed quarterly dividend rate of 5.25% per annum for the Preferred B Series 1 and 5.575%
per annum for the Preferred B Series 2.
TITLE OF ISSUE
NUMBER OF
SHARES
AUTHORIZED
NUMBER OF SHARES
ISSUED AND
OUTSTANDING
NUMBER OF SHARES
RESERVED FOR
OPTIONS, WARRANTS,
CONVERSION & OTHER
RIGHTS
NUMBER OF
SHARES HELD
BY RELATED
PARTIES
DIRECTORS,
OFFICERS &
EMPLOYEES
Unappropriated retained earnings, as adjusted to available for
dividend distribution, beginning 34,034,851₱ 33,179,220₱
Add: Net income actually earned/realized during the period - Parent co. 22,382,508 6,321,047
Add (Less):
Dividend declarations during the period (6,464,228)₱ (5,618,475)₱
PFRS adjustments in retained earnings 18,962 141,513
Other adjustments - 11,546
Treasury shares (3,437,896) -
(9,883,162) (5,465,416)
TOTAL RETAINED EARNINGS, END AVAILABLE FOR DIVIDEND 46,534,197₱ 34,034,851₱
December 31, 2018December 31, 2019

S E C F O R M 1 7 - A 235
AYALA CORPORATION AND SUBSIDIARIES Schedule I – Map of Relationships of the Companies within the Group As of December 31, 2019
44.5% 35.1% 100% 100%
50% 100% 0.06% 30.9%
50%
40% 100% 30.85% 33.5%
60% 2.06% 20.1%
100% 100% 78.1% 100%
100% 100% 100% 100%
100% 78.8% 60% 100%
Legend:
% of ownership appearing outside the box - direct % of economic ownership
% of ownership appearing inside the box - effective % of economic ownership
47.33%
16.23% 52.03%
0.04%
100% 100% 100%
AYALA CORPORATION
MERMAC, INC.
AYALA LAND, INC.MANILA WATER
COMPANY, INC. (51.4%)
AC INDUSTRIAL TECHNOLOGY
HOLDINGS, INC.AC ENERGY, INC.
AYALA HOTELS, INC. (72.2%)
LAGDIGAN LAND CORPORATION (66.7%)
PHILWATER HOLDINGS COMPANY, INC.
MICHIGAN HOLDINGS, INC.
INTEGRATED MICROELECTRONICS,
INC. (52.1%)
AC INFRASTRUCTURE HOLDINGS CORPORATION
AYALA HEALTHCARE HOLDINGS, INC.
AC VENTURES HOLDING CORP.
BANK OF THE PHILIPPINE ISLANDS
(48.6%)
GLOBE TELECOM, INC.
iPEOPLE, INC.
LIONTIDE HOLDINGS INC.
AYALA AVIATION CORPORATION
AG COUNSELORS CORPORATION
HCX TECHNOLOGY PARTNERS, INC.
AZALEA INTERNATIONAL VENTURE PARTNERS
LIMITED
DARONG AGRICULTURAL AND DEVELOPMENT
CORPORATION
TECHNOPARK LAND, INC.
ASIACOM PHILIPPINES, INC.
BESTFULL HOLDINGS LIMITED
AC INTERNATIONALFINANCE LIMITED
AYC FINANCE LIMITEDPUREFOODS
INTERNATIONAL
LIMITED

S E C F O R M 1 7 - A 236
AYALA CORPORATION AND SUBSIDIARIES Schedule I – Map of Relationships of the Companies within the Group As of December 31, 2019
Ayala Land, Inc.
Alveo Land Corporation
(100%)
Serendra, Inc. (39%)
Solinea, Inc. (formerly
Bigfoot Palms, Inc.) (65%)
BGSouth Properties, Inc. (50%)
Portico Land Corp. (60%)
Alveo-Federal Land Communities, Inc.
(50%)
Serendra, Inc. (28%)
Amorsedia Development Corporation
(100%)
OLC Development Corporation
(100%)
Ayala Greenfield
Development Corp. (50%)
HLC Development Corporation
(100%)
Allysonia International
Ltd (100%)
Avida Land Corporation
(100%)
Buklod Bahayan
Realty and Development Corp. (100%)
Avida Sales Corp. (100%)
Amicassa Process
Solutions, Inc. (100%)
BGNorth Properties, Inc.
(50%)
Avenco South Corporation
(70%)
Buendia Landholdings,
Inc. (100%)
Ayala Land Sales, Inc.
(100%)
Amaia Land Co. (formerly First Realty
Communities, Inc.) (100%)
Amaia Southern
Properties, Inc. (65%)
Ayala Land International
Sales, Inc. (100%)
Ayalaland International
Marketing, Inc. (AIMI) (100%)
Ayala Land International (Singapore)
Pte. Ltd. (100%)
Ayalaland International
Marketing (Hong Kong)
Limited (100%)
Ayala Land International Marketing , SRL (100%)
Ayala Land International
Marketing London (100%)
Crans Montana
Holdings, Inc. (100%)
Crimson Field Enterprises, Inc. (100%)
Ecoholdings Company, Inc.
(100%)
NorthBeacon Commercial Corporation
(100%)
Red Creek Properties, Inc.
(100%)

S E C F O R M 1 7 - A 237
AYALA CORPORATION AND SUBSIDIARIES Schedule I – Map of Relationships of the Companies within the Group As of December 31, 2019
Ayala Land, Inc.
Regent Time
International, Limited
(100%)
Bonifacio Land Corp.
(5%)(An Associate of ALI Group)
Fort Bonifacio Development Corporation
(55%)
North Eastern Commercial
Corp. (formerly Asterion
Technopod, Incorporated)
(100%)
Westview Commercial
Ventures Corp (formerly
Crestview E-Office Corporation)
(100%)
North Ventures Commercial
Corp. (formerly Fairview Prime
Commercial Corp.)
(100%)
Hillsford Property
Corporation (100%)
Primavera Towncentr
e, Inc. (100%)
Summerhill E-Office
Corporation (100%)
Sunnyfield E-Office
Corporation (100%)
Subic Bay Town
Centre, Inc. (100%)
Regent Wise
Investments Limited (100%)
AyalaLand Real Estate
Investments Inc. (100%)
Rize-AyalaLand (Kingsway) GP Inc.,
(49%) (An Associate of ALI
Group)
AyalaLand Advisory
Broadway Inc. (100%)
AyalaLand Development (Canada) Inc.
(100%)
Tianjin Eco City Ayala Land
Development Co., Ltd. (40%)
(An Associate of ALI Group)
MCT Bhd. (66.25%)
Blue Horizons Holdings PTE,
Limited (100%)
AyalaLand OpenAsia
Holdings PTE, Ltd. (100%)
AyalaLand Commercial REIT, Inc.
(100%)
Arvo Commercial Corporation
(100%)
BellaVita Land
Corporation (100%)
ALO Prime Realty
Corporation (100%)
AyalaLand Offices, Inc. (ALO) (formerly ALI Property Partners Corp.
(APPCo)) (100%)
First Gateway Real Estate
Corp. (100%)
Glensworth Development,
Inc. (100%)
UP North Property
Holdings, Inc. (100%)
One Dela Rosa Property
Development, Inc. (100%)

S E C F O R M 1 7 - A 238
AYALA CORPORATION AND SUBSIDIARIES Schedule I – Map of Relationships of the Companies within the Group As of December 31, 2019
Ayala Land, Inc.
Aurora Properties, Incorporated (80%)
Soltea Commercial Corp. (20%)
Vesta Property Holdings, Inc.
(78%)
Station Square East Commercial
Corporation (69%)
Accendo Commercial Corp. (67%)
Avenco South Corporation (30%)
Aviana Development Corporation
(10%)
Cagayan de Oro Gateway Corp. (70%)
Ceci Realty, Inc. (60%)
Soltea Commercial Corp. (20%)
CMPI Holdings, Inc. (60%)
CMPI Land, Inc. (60%)
ALI-CII Development
Corporation (50%)
Roxas Land Corporation (50%)
Makati Development Corporation (100%)
MDC - Subic (100%)
MDC - Build Plus (100%)
MDC Equipment Solutions, Inc. (100%)
MDC Conqrete Inc. (100%)
MDBI Construction Corp. (67%)
Ayala Hotels, Inc. (50%)
AyalaLand Hotels and Resorts Corporation
(100%)
Enjay Hotels, Inc. (100%)
Cebu Insular Hotel Company, Inc. (63%)
Greenhaven Property Venture, Inc. (100%)
Bonifacio Hotel Ventures, Inc. (100%)
Southcrest Hotel Ventures, Inc. (67%)
Northgate Hotel Ventures, Inc. (70%)
North Triangle Hotel Ventures, Inc. (100%)
Ecosouth Hotel Ventures, Inc. (100%)
ALI Makati Hotels & Residences, Inc. (80%)
ALI Makati Hotel Property, Inc. (80%)
Regent Horizons Conservation Company, Inc. (formerly Asian Conservation Company, Inc.
(100%)
Ten Knots Phils, Inc. and Subsidiary (40%)
Ten Knots Development, Corp. and Subs (40%)Sentera Hotel Ventures
Inc. (100%)
Econorth Resorts Ventures, Inc. (100)
ALI Triangle Hotel Ventures, Inc. (100%)
ArcaSouth Hotel Ventures, Inc. (ASHVI) (100%)
Capitol Central Hotel Ventures, Inc. (CCHVI) (100%)
Circuit Makati Hotel Ventures, Inc. (CMHVI) (100%)
Sicogon Town Hotel, Inc. (100%)
Sicogon Island Tourism Estate, Corp. (100%)
Bay Area Hotel Ventures, Inc. (100%)
Makati North Hotel Ventures, Inc. (100%)
One Makati Hotel Ventures, Inc. (100%)
One Makati Residential Ventures, Inc. (100%)
Asiatown Hotel Ventures, Inc. (100%)
Lagdian Land Corporation (60%)

S E C F O R M 1 7 - A 239
AYALA CORPORATION AND SUBSIDIARIES Schedule I – Map of Relationships of the Companies within the Group As of December 31, 2019
Ayala Land, Inc.
Ten Knots Phils, Inc. (60%)
Bacuit Bay Development Corporation
(100%)
Paragua Eco-Resort Ventures Inc. (100%)
North Liberty Resort Ventures Inc. (100%)
Lio Resort Ventures Inc.
(100%)
Lio Tourism Estate Management Corp(100%)
Ten Knots Development Corp. (60%)
Chirica Resorts Corp. (100%)
Kingfisher Capital Resources Corp.
(100%)
Pangalusian Island Resort Corporation
(100%)
Ayala Property Management
Corporation (100%)
Prime Support Services, Inc. (100%)
Ayala Theatres Management, Inc.
(100%)Five Star Cinema,
Inc. (100%)
Leisure and Allied Industries
Philippines, Inc. (50%)
ALInet.com, Inc. (100%)
Cavite Commercial
Town Center, Inc. (100%)
First Longfield Investments Limited
(100%)
Green Horizons Holdings Limited (100%)
PCM Formosa Company Limited (50%)
Esta Galleria, Inc. (100%)
Horizon Wealth Holdings Limited (100%)
Aprisa Business Process
Solutions, Inc. (100%)
DirectPower Services, Inc.
(100%)Philippine Integrated Energy Solutions, Inc.
(100%)
ALI Capital Corp. (formerly Varejo
Corporation) (100%)
Airswift Transport, Inc. (formerly Island Transvoyager, Inc.)
(100%)
SIAL Specialty
Retailers, Inc. (50%)
(Joint Venture Entity of ALI group)
AyaGold Retailers, Inc. (50%) (Joint
Venture Entity of ALI group)
Integrated Eco-resort
Inc. (100%)
Adauge Commercial
Corporation (60%)
Ayalaland Estates, Inc. (formerly Southgateway Development Corp.) (100%)
Ayala Land, Inc.
Central Block Developers, Inc.. (45%)
AyalaLand Club Management, Inc. (100%)
North Triangle Depot Commercial Corporation
(73%)
Soltea Commercial Corp. (60%)
Cebu Holdings, Inc. (71%)
Taft Punta Engaño Property Inc. (55%)
Asian I-Office Properties, Inc. (100%)
Cebu Leisure Company, Inc. (100%)
CBP Theatre Management Inc.
(100%)
Cebu Insular Hotel Company, Inc. (37%)
Solinea, Inc. (formerly Bigfoot Palms, Inc.
(35%)
Amaia Southern Properties, Inc. (35%)
Cebu District Property Enterprise, Inc. (15%)
Southportal Properties, Inc. (35%)
Central Block Developers, Inc. (55%)
BGWest Properties, Inc. (50%)
Verde Golf Development
Corporation (100%)Alabang Commercial Corporation (50%)
South Innovative Theater Management,
Inc. (100%)
Whiteknight Holdings, Inc.
(100%)
Mercado General Hospital, Inc. (33%) (An Associate of ALI
Group)

S E C F O R M 1 7 - A 240
AYALA CORPORATION AND SUBSIDIARIES Schedule I – Map of Relationships of the Companies within the Group As of December 31, 2019
Ayala Land, Inc.
Next Urban Alliance
Development Corp. (100%)
Arca South Integrated
Transport System, Inc. (100%)
Nuevo Centro, Inc. (54%)
Alviera Country Club (93%)
Ayalaland MetroNorth, Inc. (100%)
Southportal Properties, Inc. (65%)
Arca South Commercial
Ventures Corp.(100%)
Bay City Commercial
Ventures Corp. (100%)
Capitol Central Commercial
Ventures Corp.(100%)
Aviana Development
Corporation (50%)
Ayala Land Malls, Inc.
(formerly Solerte, Inc.)(100%)
AyalaLand Malls Vismin, Inc. (100%)
AyalaLand Malls NorthEast, Inc.
(100%)
Ayalaland Medical Facilities Leasing
Inc. (100%)
Ayala Land, Inc.
Ayalaland Malls
Synergies, Inc. (100%)
Altaraza Prime Realty
Corporation (100%)
AyalaLand Premier,
Inc.(100%)
Makati Cornerstone Leasing Corp.(100%)
Anvaya Cove Golf and Sports Club, Inc. (76%)
Anvaya Cove Beach and Nature Club, Inc. (73%)
Ayalaland Logistics Holdings Corp. (71%)
Orion Land Inc. (100%)
Orion Property Development,
Inc. (100%)
Tutuban Properties, Inc. (100%)
TPI Holdings Corporation
(100%)
FLT Prime Insurance Corp. (78.77%)
Orion Solutions, Inc. (100%)
OE Holdings, Inc. (100%)
Orion Maxis Inc. (100%)
ZHI Holdings,
Inc. (100%)
Orion I Holdings
Philippines, Inc. (100%)
Lepanto Ceramics,
Inc. (100%)
Laguna Technopark, Inc.
(95%)
Ecozone Power Management, Inc.
(100%)
Unity Realty & Development Corp. (100%)
Prow Holdings Inc. (55%)
ALI Commercial Center, Inc. (100%)
AMC Japan Concepts, Inc.
(75%)

S E C F O R M 1 7 - A 241
AYALA CORPORATION AND SUBSIDIARIES Schedule I – Map of Relationships of the Companies within the Group As of December 31, 2019
Ayala Land, Inc.
Cebu District Property Enterprise,
Inc. (35%)
Emerging City Holdings, Inc. (50%)
Columbus Holdings, Inc. (70%)
Berkshires Holdings, Inc. (50%)
Columbus Holdings, Inc. (30%)
ALI Eton Property Development
Corporation (50%)
AKL Properties, Inc. (50%)
Ayala Land, Inc.
Bonifacio Land Corp. (5%)
(An Associate of the Group)
Fort Bonifacio Development Corp.
(55%)
Lagoon Development
Corporation (30%)
ALI Makati Hotels & Residences, Inc. (20%)
(Subsidiary of the Group)
ALI Makati Property, Inc. (20%) (Subsidiary
of the Group)
OCLP Holdings, Inc. (21%)
Ortigas and Company Limited
Partnership (99.5%)
Direct Investments in Joint Ventures Direct Investments in Associates

S E C F O R M 1 7 - A 242
AYALA CORPORATION AND SUBSIDIARIES Schedule I – Map of Relationships of the Companies within the Group As of December 31, 2019
AYALA
CORPORATION
Manila Water
Company, Inc.
(MWCI)
Manila Water
Philippine
Ventures, Inc.
(MWPVI)
100.00%
Manila Water
Total Solutions
Corp.
(MWTS)
100.00%
Calasiao Water
Company, Inc.
(Calasiao
Water)
90.00%
Leyte Water
Company, Inc.
(Leyte Water)
100.00%
Zamboanga
Water
Company, Inc.
(Zamboanga
Water)
70.00%
Davao del Norte
Water
Infrastructure
Company, Inc.
(Davao Water)
51.00%
Aqua Centro
MWPV Corp.
(Aqua Centro)
100.00%
EcoWater
MWPV Corp.
(EcoWater)
100.00%
Bulacan MWPV
Development
Corp.
(BMDC)
100.00%
Clark Water
Corporation
(Clark Water)
100.00%
Boracay Island
Water
Company, Inc.
(Boracay Water)
80.00%
Manila Water
Consortium,
Inc. (MW
Consortium)
57.22%
Laguna
AAAWater
Corporation
(Laguna Water)
70.00%
Manila Water
Technical
Ventures, Inc.
(MWTV)2
100.00%
Calbayog Water
Company, Inc.
(Calbayog
Water)
100.00%
Filipinas Water
Holdings, Corp.
(Filipinas
Water)
MWCI - 49.00%
MWPVI -
North Luzon
Water
Company, Inc.
(North Luzon
Water)
100.00%
Tagum Water
Company, Inc.
(Tagum Water)
90.00%
Cebu Manila
Water
Development,
Inc.
(Cebu Water)
70.58%
Obando Water
Company, Inc.
(Obando Water)
90.00%
Bulakan Water
Company, Inc.
(Bulakan Water)
90.00%
Metro Ilagan
Water
Company, Inc.
(Ilagan Water)
90.00%
MWPV South
Luzon Water
Corp.
(South Luzon
Water)
100.00%
Manila Water
Asia Pacific Pte.
Ltd.
(MWAP)
100.00%
Manila Water
South Asia
Holdings Pte.
Ltd.
(MWSAH)
100.00%
Thu Duc Water
Holdings Pte.
Ltd.
(TDWH)
100.00%
Kenh Dong
Water Holdings
Pte. Ltd.
(KDWH)
100.00%
Manila South
East Asia Water
Holdings Pte.
Ltd. (MSEA)
100.00%
Manila Water
Thailand
Holdings Pte.
Ltd. (MWTH)
100.00%
Cu Chi Water
Supply
Sewerage
Company
Limited
(Cu Chi Water)1
24.50%
Saigon Water
Infrastructure
Corporation
(Saigon Water)1
37.99%
Thu Duc Water
BOO
Corporation
(Thu Duc
Water)1
49.00%
Kenh Dong
Water Supply
Joint Stock
Company
(Kenh Dong
Water)1
47.35%
PT Manila
Water
Indonesia
(PT MWI)
100.00%
Manila Water
(Thailand) Co.,
Ltd.
(MWTC)
100.00%
PT Sarana Tirta
Ungaran
(PT STU)1
20.00%
Eastern Water
Resources
Development
and
Management
Public Company
Limited
(East Water)1
18.72%
1 Associates2 Previously, Manila Water International Solutions, Inc.

S E C F O R M 1 7 - A 243
AYALA CORPORATION AND SUBSIDIARIES Schedule I – Map of Relationships of the Companies within the Group As of December 31, 2019

S E C F O R M 1 7 - A 244
AYALA CORPORATION AND SUBSIDIARIES Schedule I – Map of Relationships of the Companies within the Group As of December 31, 2019

S E C F O R M 1 7 - A 245
AYALA CORPORATION AND SUBSIDIARIES Schedule I – Map of Relationships of the Companies within the Group As of December 31, 2019

S E C F O R M 1 7 - A 246
AYALA CORPORATION AND SUBSIDIARIES Schedule I – Map of Relationships of the Companies within the Group As of December 31, 2019
* In the process of l iquidation.
** Dormant
100
%
100
%
100
%
76.01%
100
%
100
%
100
%
100
%
100
%
100%
100
%
80
%
100%
100%
100%100%100%100%
100
%
Integrated Micro-Electronics,
Inc.
IMI International (Singapore)
Pte. Ltd.
IMI USA IMI JapanPSI
Technologies, Inc.
PSiTech Realty, Inc.
40%*IMI International
Regional
OperatingHeadquarter (“IMI
ROHQ”)
Speedy-Tech Electronics (HK) Limited (“STHK”)
IMI France SAS
IMI Microenerg
ia EOOD
Pacsem Realty, Inc.
64%*
60%
Speedy-Tech Electronics
Cooperatief IMI Europe U.A.
IMI Bulgaria EOOD
(IMI BG)
IMI Czech Republic
s.r.o (IMI CZ)
IMI MX, S.A.P.I. de
C.V.
(IMI MX)
100
%
100
%
100
%
100
%
100
%
100
%
100
%
100
%
100
%
Speedy-Tech (Philippines), Inc.
(“STPHIL”) **
100
%
Speedy-Tech Electronics
(Jiaxing) Co. Ltd.
(“STJX”)
IMI (Chengdu) Ltd. (IMI CD)
40%
40%
VIA Optronics AG
VIA Optronics GmbH
76.01%
VIA Optronics (Suzhuo) Co. Ltd. 76.01%
IMI Niš(Serbia)
100
%
IMI UK
STI Enterprises Ltd.
STI Limited 80%
STI Philippines Inc. 80%
STI Asia Ltd.*80%
STI Supplychain Ltd. * 80%
IMI Technology(SZ) Co. Ltd.
VIA Optronics LLC
76.01%
ST Intercept80%
100
%
VIA Optronics (Taiwan) Ltd.
76.01%
65
%
VTS Touchsensor
Co. Ltd.
49.40%
IMI Smart Technology
(Shenzhen) Co.,
Ltd.

S E C F O R M 1 7 - A 247
AYALA CORPORATION AND SUBSIDIARIES Schedule I – Map of Relationships of the Companies within the Group As of December 31, 2019
100%
100% 100% 100% 100% 52.03%
100% 100% 65% 100%
100% 66%
100%
99.20%
100%
75.10%
49%
75.10%
75.10%
75.10%
98.96%
100%
100%
66.66%
92.45%
Ayala Corporation
AC Industrial Technology Holdings, Inc.
Honda Cars
Makati,Inc.
AutomobileCentral
Enterprises, Inc.
AdventureCycle
Philippines, Inc.
IconicDealershi
p, Inc.
Isuzu AutomotiveDealership,
Inc.
Merlin Solar Technologie
s (Phils), Inc.
IntegratedMicro-
Electronics, Inc.
KTM Asia Motorcycle
Manufacturing, Inc.
Honda Cars
Cebu, Inc.
AC Automotive Business Services,
Inc.
AC Industrials
(Singapore) Pte Ltd.
Isuzu Cebu,Inc.
Isuzu Iloilo Corp.
Isuzu Benguet
Corporation
MT Technologie
s Gmbh
ACI SolarHoldings
(NA)
Merlin SolarTechnology Inc.
Merlin SolarTechnology
Inc. (Thailand)
Misslbeck Kunststoffzentrum Gmbh
C-CON Sondermaschinen GGmbh
C-CON Technology Gmbh
C-CON GESSELSCHAFT FUR PLANUNG ENTWICKLUNG UND REALISIERUNG IM
INDUSTRIELLEN BEREICH MBH
KP Motors Corporatio
n
C-CON Konstruktions GnbH fur Fahrzeugtechnik

S E C F O R M 1 7 - A 248
AYALA CORPORATION AND SUBSIDIARIES Schedule I – Map of Relationships of the Companies within the Group As of December 31, 2019
Ayala CorporationAyala
Healthcare Holdings, Inc.
Zapfam Inc.
Zodiac Prime Ventures Holdings, Inc.
AHCHI Pharma Ventures, Inc.
IE Medica, Inc.
Medethix, Inc.
Actimed Inc.
Erikagen Inc.
Pharm Gen Ventures Corporation.
Novelis Solutions Inc.
Wellbdrige Health Inc.
APPPPS Partners Inc.
Talentworks Asia Inc.
CNG Global Data Hub
Wireless Internet Sol, Inc.
Ayala Port, Inc.
Entities below are in the process of dissolution and liquidation
100%
100%
100%
100%
52.5%
52.5%
52.5%
52.5%
17%
24%
100%
18.03%
100%
50%
49%
20%

S E C F O R M 1 7 - A 249
AYALA CORPORATION AND SUBSIDIARIES Schedule I – Map of Relationships of the Companies within the Group As of December 31, 2019
100%
50%-1 50%-1 50%-1 100% 10% 80% 54.3% 60%
70% 100%
Legend:
% of ownership appearing outside the box - direct economic % of ownership
% of ownership appearing inside the box - effective % of economic ownership
100% 100%
43.9% 7.6%
20% 19% 100%
100%
AYALACORPORATION
AC VENTURES HOLDING CORP.
BF JADE E-SERVICES
GLOBE FINTECH INNOVATIONS, INC.
Azalea International Venture Partners Ltd
Ayala Corporation
Narra Venture Capital II, LP
Milestone Group PTY,
LiveIt Investments
Affinity Express
AC InfrastructureHoldings
Corporation
Ayala Corporation
Light Rail Manila
Holdings,
Light Rail Manila
Corporation(35%)
Light Rail Manila
Holdings 2,
Light Rail Manila
Holdings 6,
AA Infrastructure
Projects
AF Payments Inc.
MCX Tollway, Inc.
Entrego Fulfillment
Solutions Inc
Reliant Logistics Holdings
BedaconCorporation
(60%)

S E C F O R M 1 7 - A 250
AYALA CORPORATION AND SUBSIDIARIES Schedule J – Financial Ratios As of December 31, 2019
Ratio Formula December 2019 December 2018 December 2019 December 2018
In thousands
Liquidity Analysis Ratios
Liquidity Ratio Cash & Cash equivalents + Short-term investments 106,793,054 66,580,752 0.27 0.20
Current Liabilities 402,656,865 330,102,855
Cash & Cash equivalents 93,405,253 60,624,263
Short-term investments 13,387,801 5,956,489
Total 106,793,054 66,580,752
Current Ratio Current Assets 609,285,431 412,759,422 1.51 1.25
Current Liabilities 402,656,865 330,102,855
Quick Ratio Current Assets - Inventories - Prepayments 458,847,007 278,652,108 1.14 0.84
Current Liabilities 402,656,865 330,102,855
Current assets 609,285,431 412,759,422
Inventories (135,064,303) (120,560,493)
Prepayments (15,374,122) (13,546,821)
Quick assets 458,847,007 278,652,108
Solvency Ratio Total Assets 1,345,285,958 1,197,925,619 1.61 1.64
Total Liabilities 835,972,400 728,817,264
Financial Leverage Ratios
Assets- to-Equity Ratio Total Assets 1,345,285,958 1,197,925,619 2.64 2.55
Total Stockholders' Equity 509,313,558 469,108,355
Interest Rate Coverage Earnings Before Interest and Taxes (EBIT) 108,809,486 79,630,117 4.86 4.58
Interest and other financing charges 22,409,526 17,378,936
Income after income tax from continuing operations 72,415,823 48,883,980
Provision for income tax 13,984,137 13,367,201
Interest and other financing charges 22,409,526 17,378,936
EBIT 108,809,486 79,630,117
Debt Ratio Short-term debt + Long-term debt 405,338,157 412,261,632 0.30 0.34
Total Assets 1,345,285,958 1,197,925,619
Short-term debt 29,788,643 39,518,245
Long-term debt (current & noncurrent) 375,549,514 372,743,387
Total debt 405,338,157 412,261,632
Debt-to-Equity Ratio Short-term debt + Long-term debt 405,338,157 412,261,632 0.80 0.88
Total Stockholders' Equity 509,313,558 469,108,355

S E C F O R M 1 7 - A 251
AYALA CORPORATION AND SUBSIDIARIES Schedule J – Financial Ratios As of December 31, 2019
Ratio Formula December 2019 December 2018 December 2019 December 2018
In thousands
Profitability Ratios
Gross Profit Margin
Sale of goods & rendering of services - Cost of
sales & services 74,923,276 67,184,649 0.28 0.26
Sale of goods & rendering of services 264,906,534 256,891,287
Sale of goods & rendering of services 264,906,534 256,891,287
Cost of sales & services (189,983,258) (189,706,638)
Gross profit 74,923,276 67,184,649
Net Profit Margin Net Profit 42,810,461 41,227,921 0.16 0.16
Sale of goods & rendering of services 264,906,534 256,891,287
Gross profit 74,923,276 67,184,649
General and administrative expenses (32,112,815) (25,956,728)
Net Profit 42,810,461 41,227,921
Return on Equity Net Income to Owners of the Parent 35,279,330 31,817,721 6.9% 6.8%
Total Stockholders' Equity 509,313,558 469,108,355
Return on Common Equity Net Income to Owners of the Parent (Common) 34,019,574 30,532,706 11.9% 12.2%
Common Equity Attributable to Owners of the Parent
(Average) 285,499,690 249,959,898
Net income to owners of the Parent 35,279,330 31,817,721
Less: Dividends on preferred stock (1,259,756) (1,285,015)
NIAT to Common 34,019,574 30,532,706
December 2019 December 2018
Equity attributable to owners of the parent 328,807,265 290,607,469
Preferred shares (24,897,642) (23,517,712)
Common equity attributable to owners of the Parent 303,909,623 267,089,757
Average common equity attributable to owners of
the Parent 285,499,690
December 2018 December 2017
Equity attributable to owners of the parent 290,607,469 256,347,751
Preferred shares (23,517,712) (23,517,712)
Common equity attributable to owners of the Parent 267,089,757 232,830,040
Average common equity attributable to owners of
the Parent 249,959,898
Return on Assets Net Income 41,982,330 55,065,114 3.1% 4.6%
Total Assets 1,345,285,958 1,197,925,619
Price/Earnings Ratio Price Per Share 785.50 900.00 14.51 18.44
Earnings Per Common Share (Basic) 54.12 48.80

S E C F O R M 1 7 - A 252
II. 2019 Consolidated Financial Statements of Registrant

MAR 12 2020

*SGVFS039491*
C O V E R S H E E Tfor
AUDITED FINANCIAL STATEMENTS
SEC Registration Number
3 4 2 1 8
C O M P A N Y N A M E
A Y A L A C O R P O R A T I O N A N D S U B S I D I A
R I E S
PRINCIPAL OFFICE ( No. / Street / Barangay / City / Town / Province )
3 2 F - 3 5 F T o w e r O n e a n d E x c h a n g e
P l a z a , A y a l a T r i a n g l e , A y a l a A
v e n u e , M a k a t i C i t y
Form Type Department requiring the report Secondary License Type, If Applicable
A A C F S
C O M P A N Y I N F O R M A T I O N
Company’s Email Address Company’s Telephone Number Mobile Number
[email protected] 7908-3000
No. of Stockholders Annual Meeting (Month / Day) Fiscal Year (Month / Day)
7,353 April 24 December 31
CONTACT PERSON INFORMATION
The designated contact person MUST be an Officer of the Corporation
Name of Contact Person Email Address Telephone Number/s Mobile Number
Josephine G. De Asis [email protected] 7908-3000
CONTACT PERSON’s ADDRESS
33rd-35th Floor, Tower One and Exchange Plaza, Ayala Avenue, Makati City
NOTE 1 In case of death, resignation or cessation of office of the officer designated as contact person, such incident shall be reported to the Commission withinthirty (30) calendar days from the occurrence thereof with information and complete contact details of the new contact person designated.
2 All Boxes must be properly and completely filled-up. Failure to do so shall cause the delay in updating the corporation’s records with the Commissionand/or non-receipt of Notice of Deficiencies. Further, non-receipt of Notice of Deficiencies shall not excuse the corporation from liability for its deficiencies.

*SGVFS039491*
INDEPENDENT AUDITOR’S REPORT
The Stockholders and the Board of DirectorsAyala Corporation32F-35F Tower One and Exchange PlazaAyala Triangle, Ayala Avenue, Makati City
Opinion
We have audited the accompanying consolidated financial statements of Ayala Corporation and itssubsidiaries (the Group), which comprise the consolidated statements of financial position as atDecember 31, 2019 and 2018, and the consolidated statements of income, consolidated statements ofcomprehensive income, consolidated statements of changes in equity and consolidated statements ofcash flows for each of the three years in the period ended December 31, 2019, and notes to theconsolidated financial statements, including a summary of significant accounting policies.
In our opinion, the accompanying consolidated financial statements present fairly, in all material respects,the consolidated financial position of Ayala Corporation and its subsidiaries as at December 31, 2019 and2018, and its consolidated financial performance and its consolidated cash flows for each of the threeyears in the period ended December 31, 2019 in accordance with Philippine Financial ReportingStandards (PFRSs).
Basis for Opinion
We conducted our audits in accordance with Philippine Standards on Auditing (PSAs). Ourresponsibilities under those standards are further described in the Auditor’s Responsibilities for the Audit
of the Consolidated Financial Statements section of our report. We are independent of the Group in
accordance with the Code of Ethics for Professional Accountants in the Philippines (the Code of Ethics),
together with the ethical requirements that are relevant to our audit of the consolidated financial
statements in the Philippines, and we have fulfilled our other ethical responsibilities in accordance with
these requirements and the Code of Ethics. We believe that the audit evidence we have obtained is
sufficient and appropriate to provide a basis for our opinion.
Key Audit Matters
Key audit matters are those matters that, in our professional judgment, were of most significance in ouraudit of the consolidated financial statements of the current period. These matters were addressed in thecontext of our audit of the consolidated financial statements as a whole, and in forming our opinionthereon, and we do not provide a separate opinion on these matters. For each matter below, ourdescription of how our audit addressed the matter is provided in that context.
We have fulfilled the responsibilities described in the Auditor’s Responsibilities for the Audit of theConsolidated Financial Statements section of our report, including in relation to these matters.Accordingly, our audit included the performance of procedures designed to respond to our assessment ofthe risks of material misstatement of the consolidated financial statements. The results of our auditprocedures, including the procedures performed to address the matters below, provide the basis for ouraudit opinion on the accompanying consolidated financial statements.
SyCip Gorres Velayo & Co.6760 Ayala Avenue1226 Makati CityPhilippines
Tel: (632) 891 0307Fax: (632) 819 0872ey.com/ph
BOA/PRC Reg. No. 0001, October 4, 2018, valid until August 24, 2021SEC Accreditation No. 0012-FR-5 (Group A), November 6, 2018, valid until November 5, 2021
A member firm of Ernst & Young Global Limited

*SGVFS039491*
- 2 -
Accounting for Subsidiaries under PFRS 5, Noncurrent Assets Held for Sale and DiscontinuedOperations
As of December 31, 2019, the Group has investments in subsidiaries that were accounted for underPFRS 5. We consider this as a key audit matter because it requires management to exercise significantjudgment in determining (a) whether conditions are met for these subsidiaries to be classified underPFRS 5, (b) the fair value of these subsidiaries for purposes of determining any impairment loss uponinitial classification under PFRS 5, and (c) whether these subsidiaries qualify as discontinued operationsfor purposes of presentation in the consolidated statements of income.
Management’s disclosures on the subsidiaries classified under PFRS 5 are included in Note 25 to theconsolidated financial statements.
Audit Response
We evaluated management’s assessment whether these subsidiaries qualified as held for sale based onthe criteria set forth by PFRS 5 as of December 31, 2019. We inquired with management the basis oftheir assessment and reviewed the supporting agreements, such as term sheet and subscriptionagreement, as applicable, to determine whether the disposal will result in loss of control. We assessedthe fair value of the net assets of these subsidiaries with reference to the term sheet or subscriptionagreement and the requirements of PFRS 13, Fair value measurement. We test computed theimpairment loss by comparing the carrying amount of each of the subsidiaries with their respective fairvalues. We reviewed whether the amount recognized by the Group as assets held of sale and liabilitiesheld for sale as of December 31, 2019 represent the assets and liabilities, respectively, of theconsolidated subsidiaries that have been classified as held for sale as of that date. We also evaluated theGroup’s basis for classifying the disposal group as discontinued operations by reference to the respectivesegments they belong whether these represent separate major lines of businesses. We also reviewedthe Group’s disclosures about these subsidiaries classified under PFRS 5.
Impairment Testing of Goodwill and Non-financial Assets related to East Zone Concession
The Group has goodwill which is required to be tested for impairment at least annually. In addition, in2019, Manila Water Company Inc. (MWC)’s market capitalization as of December 31, 2019 significantlydeclined compared to its net book value, which decline was triggered by, among others, the ongoingdiscussion with the Metropolitan Waterworks and Sewerage System on the provisions of the ConcessionAgreement identified for renegotiation and amendment. This is an impairment indicator that requires anassessment of the recoverability of the Group’s non-financial assets related to the East Zone Concession,particularly its service concession assets and property and equipment. The impairment testing is a keyaudit matter because it requires management to make significant estimates and assumptions with respectto the estimated future cash flows of the related cash-generating units, revenue growth rate and thediscount rate used in calculating the present value of future cash flows. The valuation of the recoverableamount of East Zone’s non-financial assets, using fair value less cost to sell, requires the assistance ofan external appraiser whose calculations also depend on certain assumptions such as recent sales,offering prices or listing of comparable properties located within the vicinity of the subject assets,adjustments to sales prices based on internal and external factors, and deductions for physicaldeterioration and all other relevant forms of obsolescence.
Management's disclosures on property and equipment, service concession asset and goodwill areincluded in Notes 12, 13 and 14, respectively, to the consolidated financial statements.
A member firm of Ernst & Young Global Limited

*SGVFS039491*
- 3 -
Audit Response
We obtained an understanding of the Group’s impairment assessment process and the related controls.We involved our internal specialist in evaluating the methodologies and assumptions used in the value-in-use calculation. These assumptions include revenue growth rate, gross margin and discount rate. Wecompared the key assumptions used such as revenue growth rate against actual historical performanceof the cash generating unit and industry outlook and gross margin against historical rates. We tested theparameters used in the derivation of the discount rate against market data.
We also involved our internal specialist in evaluating the methodology and assumptions used in thevaluation of the non-financial assets of the East Zone Concession. For the market approach, theassumptions used include information supporting the comparability of the subject assets with identical orsimilar properties for which information is available, measures of value of comparable properties andadjustments made to the value of the comparable properties. We made inquiries with the management’sspecialist who appraised the assets about the methodology and assumptions used in the valuation of thesubject assets and we evaluated the specialist’s competence, capabilities, and objectivity by consideringtheir qualifications, experience and reporting responsibilities.
We also reviewed the Group’s disclosures about those assumptions to which the outcome of theimpairment test is more sensitive; specifically, those that have the most significant effect on thedetermination of the recoverable amount of these assets.
Adoption of PFRS 16, Leases
Effective January 1, 2019, the Group adopted PFRS 16, Leases, under the modified retrospectiveapproach which resulted in significant changes to the Group’s accounting policy for leases, specificallythose formerly classified as operating lease arrangements where the Group is the lessee. The Group’sadoption of PFRS 16 is significant to our audit because the Group has high volume of lease agreements,the recorded amounts are material to the consolidated financial statements, and the adoption involvesapplication of significant judgment and estimation in determining the lease term, including evaluatingwhether the extension option is enforceable and whether the Group is reasonably certain to exerciseoption to extend or terminate the lease, and in determining the incremental borrowing rate. This resultedin the recognition of right of use assets and lease liability amounting to P=18,533 million andP=21,564 million, respectively, as of January 1, 2019, and the recognition of depreciation expense andinterest expense of P=1,472 million and P=1,231 million, respectively, for the year endedDecember 31, 2019.
The disclosures in relation to the adoption of PFRS 16 are included in Notes 3 and 31 to the consolidatedfinancial statements.
Audit Response
We obtained an understanding of the Group’s process in implementing the new standard on leases,including the determination of the population of the lease contracts covered by PFRS 16, thedetermination of the incremental borrowing rate and lease term, the application of the short-term and low-value assets exemption, the selection of the transition approach and any election of available practicalexpedients.
A member firm of Ernst & Young Global Limited

*SGVFS039491*
- 4 -
To test the completeness of the population of the lease contracts, we obtained the list of leaseagreements in prior year where rent expense have been recognized. The list was reconciled to thecurrent year list. On a test basis, we inspected lease agreements (i.e., lease agreements existing prior tothe adoption of PFRS 16 and new lease agreements), identified their contractual terms and conditions,and traced these contractual terms and conditions to the lease calculation prepared by management,which covers the calculation of the financial impact of PFRS 16, including the transition adjustments.
For selected lease contracts with renewal and/or termination option, we reviewed the enforceability of theextension and/or termination option. We also reviewed the management’s assessment of whether it isreasonably certain that the Group will exercise the option to renew or not exercise the option to terminate.
We tested the parameters used in the determination of the incremental borrowing rate by reference tomarket data. We test computed the lease calculation prepared by management on a sample basis,including the transition adjustments.
We reviewed the disclosures related to the transition adjustments based on the requirements of PFRS 16and PAS 8, Accounting Policies, Changes in Accounting Estimates and Errors.
Accounting for Business Combinations
The Group had a number of acquisitions in 2019, including step acquisitions, which resulted in therecognition of property, plant and equipment, intangible assets and goodwill, among others, andremeasurement gain. We considered the accounting for these acquisitions as a key audit matter becausethese required significant management judgment and estimation in identifying the underlying acquiredassets and liabilities and in determining their fair values, specifically the acquired property, plant andequipment and intangible assets, and in determining the fair value of previously-held interest.
Further details of the acquisitions made by the Group are disclosed in Note 24 to the consolidatedfinancial statements.
Audit Response
We reviewed the purchase agreements covering the acquisitions, the consideration paid and theprovisional purchase price allocation as applicable. We reviewed the identification of the underlyingassets and liabilities based on our understanding of the businesses of the acquired entities andmanagement’s explanations on the rationale for the acquisitions. We assessed the competence,capabilities and objectivity of the external appraisers, as applicable, by considering their qualifications,experience and reporting responsibilities. We also involved our internal specialist in evaluating themethodologies and assumptions used in arriving at the fair values of the said underlying assets. Wecompared the key assumptions used such as discount rates, revenue and earnings forecast, royaltyrates, and energy supply contract rates, against historical information and relevant market data. Werecomputed the remeasurement gain of previously-held interest. We reviewed the presentation anddisclosures related to these business combinations in the consolidated financial statements.
Revenue Recognition from Real Estate and Water Infrastructure Services
The Ayala Land, Inc. and its subsidiaries’ (ALI Group) revenue recognition process, policies andprocedures are significant to our audit because these involve the application of significant judgment andestimation in the following areas: (1) assessment of the probability that the entity will collect theconsideration from the buyer; (2) application of the output method as the measure of progress indetermining real estate revenue; (3) determination of the actual costs incurred as cost of sales; and (4)recognition of cost to obtain a contract.
A member firm of Ernst & Young Global Limited

*SGVFS039491*
- 5 -
In evaluating whether collectability of the amount of consideration is probable, the ALI Group considersthe significance of the buyer's initial payments in relation to the total contract price (or buyer's equity).Collectability is also assessed by considering factors such as past history with buyers, age of residentialand office development receivables and pricing of the property. Management regularly evaluates thehistorical sales cancellations and back-outs if it would still support its current threshold of buyer's equitybefore commencing revenue recognition of real estate.
In measuring the progress of its performance obligation over time, the ALI Group uses the output method.This method measures progress based on physical proportion of work done on the real estate projectwhich requires technical determination by the ALI Group's specialists (project engineers). This is basedon the monthly project accomplishment report prepared by the third party surveyor as approved by theconstruction manager which integrates the surveys of performance to date of the construction activitiesfor both sub-contracted and those that are fulfilled by the ALI Group itself.
In determining the actual costs incurred to be recognized as cost of sales, the ALI Group estimates costsincurred on materials, labor and overhead which have not yet been billed by the contractor.
The ALI Group identifies sales commission after contract inception as the cost of obtaining the contract.For real estate contracts which qualified for revenue recognition, the ALI Group capitalizes the total salescommission due to sales agent as cost to obtain contract and recognizes the related commissionpayable. The ALI Group uses percentage of completion (POC) method in amortizing sales commissionconsistent with the Group's revenue recognition policy.
For MWC and its subsidiaries (MWC Group), its revenue recognition process for the East Zoneconcession area requires the processing of data from a large number of customers classified as eitherresidential, commercial, semi-business, or industrial. The amounts billed to customers consist of anumber of components, including basic charge, environmental charge and foreign currency differentialadjustment and where applicable, sewer charge. These tariffs depend on the customer type and aredetermined based on a formula as prescribed by the Metropolitan Waterworks and Sewerage SystemRegulatory Office (MWSS RO). This matter is significant to our audit because the revenue recognizeddepends on the completeness of capture of water consumption based on the meter readings taken onvarious dates over the concession area; the propriety of rates applied across customer types; and thereliability of the systems involved in processing the billing transactions.
The disclosures related to revenue are included in Notes 16 and 22 to the Consolidated FinancialStatements.
Audit Response
For the different revenue streams mentioned above, we obtained an understanding of the ALI Group'sand MWC Group's revenue recognition processes and performed the following procedures:
a. Real estate revenue and cost
· For the buyer's equity, we evaluated management's basis for the buyers' equity by comparing thisto the historical analysis of sales collections from buyers with accumulated payments above thecollection threshold.
· For the application of the output method, in recognizing real estate revenue, we obtained anunderstanding of the ALI Group's processes to determine the POC and performed tests of therelevant controls. We obtained the certified POC reports prepared by the project engineers andassessed their competence and objectivity by reference to their qualifications, experience andreporting responsibilities. For selected projects, we conducted ocular inspections, made relevantinquiries and obtained the supporting details of POC reports showing the stage of completion ofthe major activities of project construction.
A member firm of Ernst & Young Global Limited

*SGVFS039491*
- 6 -
· For the cost of sales, we obtained an understanding of the ALI Group's cost accumulationprocess and performed tests of the relevant controls. For selected projects, we traced theaccumulated costs, including costs incurred but not yet billed, to supporting documents such asinvoices and accomplishment reports from the contractors and official receipts.
· For the recognition of cost to obtain a contract, we obtained an understanding of the salescommission process. For selected contracts, we agreed the basis for calculating the salescommission capitalized and the portion recognized in profit or loss, particularly: (a) thepercentage of commission due against contracts with sales agents, (b) the total commissionableamount (i.e., net contract price) against the related contract to sell, and, (c) the POC used in thesales commission computation against the POC used in recognizing the related revenue fromreal estate sales.
b. Revenue from water and sewer services
· We obtained an understanding, evaluated the design and tested the controls over the read andbill process, which includes the capture of water consumption and calculation of billed fees,downloading of data from the billing system and uploading of data to MWC Group's financialreporting system.
· We involved our internal specialist in the testing of the related controls over the read and billprocesses.
· We performed test calculation of the billed amounts using the volume of water consumption andMWSS RO-approved rates and compared them with the amounts reflected in the billingstatements.
Amortization of MWC Group’s Service Concession Assets using the Units-of-production Method
The service concession assets (SCA) of MWC Group are related to its concession agreements. MWCGroup uses the units-of-production (UOP) method in amortizing its SCA based on the actual billedvolume over the estimated billable water volume for the remaining period of the concession agreement.The UOP amortization method is a key audit matter as the method involves significant managementjudgment and estimates, particularly in determining the total estimated billable water volume over theremaining periods of the concession agreements. It considers different factors such as population growth,supply and consumption, and service coverage, including ongoing and future expansions.
Relevant disclosures related to this matter are provided in Notes 3 and 13 to the consolidated financialstatements.
Audit Response
We obtained an understanding of MWC management’s processes and controls in the estimation ofbillable water volume. We evaluated the competence, capabilities, and objectivity of MWCmanagement’s specialist who estimated the total billable water volume. We also reviewed the report ofMWC management’s specialist and gained an understanding of the methodology and the basis of theforecasted volumes. Furthermore, we compared the estimated billable water volume for the year againstthe data generated from the billing system and recalculated the amortization expense for the year basedon the actual billed water volume.
A member firm of Ernst & Young Global Limited

*SGVFS039491*
- 7 -
Accounting for Investments in Associate and Joint Venture
The Group has effective ownership of 48.6% in Bank of the Philippine Islands and its subsidiaries (BPIGroup), an associate, and 30.9% in Globe Telecom, Inc. and its subsidiaries (Globe Group), a jointventure, as of December 31, 2019, which are both accounted for using the equity method. BPI Groupand Globe Group contributed P=13.57 billion and P=6.77 billion or 32% and 16%, respectively, to theGroup’s consolidated net income in 2019.
BPI Group’s net income is significantly affected by the level of impairment provisioning on its loans andreceivables which requires substantial management judgment and estimation. PFRS 9 requires theapplication of a forward-looking expected credit loss (ECL) model to assess impairment on debt financialassets not measured at fair value through profit or loss. Meanwhile, Globe Group’s net income is affectedby the propriety of the revenue recognized given the significant volume of transactions, the operationalcomplexity of the billing systems, the determination of the accounting for new products introduced duringthe year and its adoption of PFRS 16.
Relevant disclosures related to the Group’s investments in BPI Group and Globe Group are provided inNote 10 to the consolidated financial statements.
Audit Response
We sent instructions to the statutory auditors of BPI Group and Globe Group to perform an audit on therelevant financial information of BPI Group and Globe Group for the purpose of our audit of the Group’sconsolidated financial statements. These audit instructions contained a discussion of their scope of work,risk assessment procedures, audit strategy and reporting requirements. We discussed with the statutoryauditors of BPI Group and Globe Group about their identified key audit risk areas, including theirsignificant areas of estimation and judgment, planning and execution of audit procedures, and results oftheir work for the year ended December 31, 2019.
We reviewed their audit working papers and obtained relevant conclusion statements related to their auditprocedures. For BPI Group, we focused on the testing of its ECL model for its loans portfolio andtreasury products. We discussed with BPI Group’s statutory auditor the overall characteristics of the loanportfolio, changes during the year, rationale for the changes in impairment provisioning and testingprocedures for the relevant controls for staging of loan accounts and for the impairment calculations.
In the case of Globe Group, we obtained an understanding of the nature, timing and extent of their auditprocedures, reviewed their selected audit working papers and obtained relevant conclusion statementsrelated to their audit procedures. We involved our internal specialist in the assessment of the sufficiencyof Globe Group’s statutory auditor’s procedures in testing Globe Group’s IT general and applicationcontrols over the revenue recognition process and adoption of PFRS 16. We evaluated the sufficiency ofthe procedures performed on testing of Globe Group’s processes and controls over the identification ofthe performance obligations in their contracts with customers, the allocation of the transaction price to theperformance obligations based on the stand-alone selling prices, and the recognition of revenue at a pointin time or over time. We also reviewed the procedures performed on testing of Globe Group’s processesand controls over the adoption of PFRS 16, which includes the review of (i) the population of the leaseagreements covered by PFRS 16 and its underlying contractual terms and conditions, (ii) thedetermination of the lease term, including any renewal and termination option, (iii) the incrementalborrowing rate used, and (iv) lease calculation, including the transition adjustments.
We obtained the relevant financial information of BPI Group and Globe Group and recomputed theGroup’s share in the net income of BPI Group and Globe Group for the year endedDecember 31, 2019.
A member firm of Ernst & Young Global Limited

*SGVFS039491*
- 8 -
Consolidation Process
Ayala Corporation is the holding company of a multiple number of domestic and foreign subsidiaries withdiversified business portfolios. In preparing the consolidated financial statements, several factors areconsidered such as fair value adjustments arising from business combinations, the presence of non-controlling interests, numerous intercompany transactions, translation of subsidiaries’ foreign-currencydenominated financial information to Ayala Corporation’s functional currency, and other equityadjustments. Accordingly, we consider the consolidation process as a key audit matter due to thecomplexity involved in consolidating the financial information of domestic and foreign subsidiariescomprising the Group.
Note 2 to the consolidated financial statements provides the relevant disclosures on the Group’sinvestees.
Audit Response
We obtained an understanding of the consolidation process and relevant controls through which theconsolidated financial statements are prepared. We also obtained an understanding of the Group’sprocess for identifying related parties and related party transactions and the reconciliation ofintercompany transactions and balances. We tested significant consolidation adjustments, includingeliminations of intercompany transactions and balances, deferral and realization of intercompany profits,amortization/depreciation/reversal of fair value adjustments arising from business combinations, currencytranslation adjustments, and movements in non-controlling interests and other equity adjustments.
Other Information
Management is responsible for the other information. The other information comprises the informationincluded in the SEC Form 20 IS (Definitive Information Statement), SEC Form 17-A and Annual Reportfor the year ended December 31, 2019, but does not include the consolidated financial statements andour auditor’s report thereon. The SEC Form 20 IS (Definitive Information Statement), SEC Form 17-Aand Annual Report for the year ended December 31, 2019 are expected to be made available to us afterthe date of this auditor’s report.
Our opinion on the consolidated financial statements does not cover the other information and we will notexpress any form of assurance conclusion thereon.
In connection with our audits of the consolidated financial statements, our responsibility is to read theother information identified above when it becomes available and, in doing so, consider whether the otherinformation is materially inconsistent with the consolidated financial statements or our knowledgeobtained in the audits, or otherwise appears to be materially misstated.
Responsibilities of Management and Those Charged with Governance for the ConsolidatedFinancial Statements
Management is responsible for the preparation and fair presentation of these consolidated financialstatements in accordance with PFRSs, and for such internal control as management determines isnecessary to enable the preparation of consolidated financial statements that are free from materialmisstatement, whether due to fraud or error.
In preparing the consolidated financial statements, management is responsible for assessing the Group’sability to continue as a going concern, disclosing, as applicable, matters related to going concern andusing the going concern basis of accounting unless management either intends to liquidate the Group orto cease operations, or has no realistic alternative but to do so.
A member firm of Ernst & Young Global Limited

*SGVFS039491*
- 9 -
Those charged with governance are responsible for overseeing the Group’s financial reporting process.
Auditor’s Responsibilities for the Audit of the Consolidated Financial Statements
Our objectives are to obtain reasonable assurance about whether the consolidated financial statementsas a whole are free from material misstatement, whether due to fraud or error, and to issue an auditor’sreport that includes our opinion. Reasonable assurance is a high level of assurance, but is not aguarantee that an audit conducted in accordance with PSAs will always detect a material misstatementwhen it exists. Misstatements can arise from fraud or error and are considered material if, individually orin the aggregate, they could reasonably be expected to influence the economic decisions of users takenon the basis of these consolidated financial statements.
As part of an audit in accordance with PSAs, we exercise professional judgment and maintainprofessional skepticism throughout the audit. We also:
· Identify and assess the risks of material misstatement of the consolidated financial statements,
whether due to fraud or error, design and perform audit procedures responsive to those risks, and
obtain audit evidence that is sufficient and appropriate to provide a basis for our opinion. The risk of
not detecting a material misstatement resulting from fraud is higher than for one resulting from error,
as fraud may involve collusion, forgery, intentional omissions, misrepresentations, or the override of
internal control.
· Obtain an understanding of internal control relevant to the audit in order to design audit procedures
that are appropriate in the circumstances, but not for the purpose of expressing an opinion on the
effectiveness of the Group’s internal control.
· Evaluate the appropriateness of accounting policies used and the reasonableness of accountingestimates and related disclosures made by management.
· Conclude on the appropriateness of management’s use of the going concern basis of accounting and,based on the audit evidence obtained, whether a material uncertainty exists related to events orconditions that may cast significant doubt on the Group’s ability to continue as a going concern. If weconclude that a material uncertainty exists, we are required to draw attention in our auditor’s report tothe related disclosures in the consolidated financial statements or, if such disclosures are inadequate,to modify our opinion. Our conclusions are based on the audit evidence obtained up to the date ofour auditor’s report. However, future events or conditions may cause the Group to cease to continueas a going concern.
· Evaluate the overall presentation, structure and content of the consolidated financial statements,including the disclosures, and whether the consolidated financial statements represent the underlyingtransactions and events in a manner that achieves fair presentation.
· Obtain sufficient appropriate audit evidence regarding the financial information of the entities orbusiness activities within the Group to express an opinion on the consolidated financial statements.We are responsible for the direction, supervision and performance of the audit. We remain solelyresponsible for our audit opinion.
We communicate with those charged with governance regarding, among other matters, the plannedscope and timing of the audit and significant audit findings, including any significant deficiencies ininternal control that we identify during our audit.
A member firm of Ernst & Young Global Limited

*SGVFS039491*
- 10 -
We also provide those charged with governance with a statement that we have complied with relevantethical requirements regarding independence, and to communicate with them all relationships and othermatters that may reasonably be thought to bear on our independence, and where applicable, relatedsafeguards.
From the matters communicated with those charged with governance, we determine those matters thatwere of most significance in the audit of the consolidated financial statements of the current period andare therefore the key audit matters. We describe these matters in our auditor’s report unless law orregulation precludes public disclosure about the matter or when, in extremely rare circumstances, wedetermine that a matter should not be communicated in our report because the adverse consequences ofdoing so would reasonably be expected to outweigh the public interest benefits of such communication.
The engagement partner on the audit resulting in this independent auditor’s report is Lucy L. Chan.
SYCIP GORRES VELAYO & CO.
Lucy L. ChanPartnerCPA Certificate No. 88118SEC Accreditation No. 0114-AR-5 (Group A), November 16, 2018, valid until November 15, 2021Tax Identification No. 152-884-511BIR Accreditation No. 08-001998-46-2018, February 26, 2018, valid until February 25, 2021PTR No. 8125221, January 7, 2020, Makati City
March 12, 2020
A member firm of Ernst & Young Global Limited

*SGVFS039491*
AYALA CORPORATION AND SUBSIDIARIES
CONSOLIDATED STATEMENTS OF FINANCIAL POSITION(Amounts in Thousands)
December 31
2019
2018(As Restated -
see Note 3)
ASSETSCurrent AssetsCash and cash equivalents (Notes 5, 32, 33 and 34) P=93,405,253 P=60,624,263Short-term investments (Notes 6, 32, 33 and 34) 13,387,801 5,956,489Accounts and notes receivable (Notes 7, 32, 33 and 34) 130,868,711 153,991,583Contract assets (Note 16) 3,159,675 3,736,447Inventories (Note 8) 135,064,303 120,560,493Other current assets (Notes 9 and 33) 62,932,994 57,728,026Assets under PFRS 5 (Note 25) 170,466,694 10,162,121
Total Current Assets 609,285,431 412,759,422
Noncurrent AssetsNoncurrent accounts and notes receivable (Notes 7, 33 and 34) 55,720,290 41,803,297Noncurrent contract assets (Note 16) − 492,943Investments in associates and joint ventures (Note 10) 246,731,276 240,140,558Investment properties (Note 11) 246,732,338 227,645,548Property, plant and equipment (Note 12) 88,781,755 104,492,357Right-of-use assets (Note 31) 18,220,572 −Service concession assets (Note 13) 1,638,516 98,404,486Intangible assets (Note 14) 16,625,926 16,553,369Deferred tax assets - net (Note 26) 14,246,325 15,546,040Other noncurrent assets (Notes 15, 32, 33 and 34) 47,303,529 40,087,599
Total Noncurrent Assets 736,000,527 785,166,197
Total Assets P=1,345,285,958 P=1,197,925,619
LIABILITIES AND EQUITYCurrent LiabilitiesShort-term debt (Notes 19, 32, 33 and 34) P=29,788,643 P=39,518,245Accounts payable and accrued expenses (Notes 17, 32, 33 and 34) 195,416,247 204,758,244Contract liabilities (Note 16) 252,341 114,169Income tax payable 2,396,901 3,406,921Current portion of: Long-term debt (Notes 19, 31, 33 and 35) 23,878,725 48,480,559
Lease liabilities (Note 31) 1,028,067 − Service concession obligation (Notes 13, 33 and 34) 13,607 820,802Other current liabilities (Notes 18, 33 and 34) 28,394,709 31,928,643Liabilities under PFRS 5 (Note 25) 121,487,625 1,075,272
Total Current Liabilities 402,656,865 330,102,855
Noncurrent LiabilitiesLong-term debt - net of current portion (Notes 19, 32, 33 and 34) 351,670,789 324,262,828Lease liabilities - net of current portion (Note 31) 21,353,099 −Service concession obligation - net of current portion
(Notes 13, 33 and 34) 52,412 7,018,211Deferred tax liabilities - net (Note 26) 8,035,817 10,999,354Pension liabilities (Note 28) 3,756,048 2,589,852Other noncurrent liabilities (Notes 20, 33 and 34) 48,447,370 53,844,164
Total Noncurrent Liabilities 433,315,535 398,714,409
Total Liabilities 835,972,400 728,817,264
(Forward)

*SGVFS039491*
- 2 -
December 31
2019
2018(As Restated -
see Note 3)
EquityEquity attributable to owners of the parent company Paid-in capital (Note 21) P=84,876,225 P=83,361,675 Share-based payments (Note 29) 214,617 238,871
Remeasurement losses on defined benefit plans (Note 28) (3,117,329) (1,299,319) Fair value reserve of financial assets at fair value
through other comprehensive income (FVOCI) (Note 15) 66,917 (544,555) Cumulative translation adjustments 3,234,618 2,276,669 Equity reserve (Notes 2 and 24) 25,282,942 10,872,124
Equity conversion option (Note 19) − 1,087,015 Retained earnings (Note 21) 225,454,620 196,914,989 Treasury stock (Note 21) (5,737,896) (2,300,000)
Reserves under PFRS 5 (Note 25) (1,467,449) −328,807,265 290,607,469
Non-controlling interests (Note 2) 180,506,293 178,500,886
Total Equity 509,313,558 469,108,355
Total Liabilities and Equity P=1,345,285,958 P=1,197,925,619
See accompanying Notes to Consolidated Financial Statements.

*SGVFS039491*
AYALA CORPORATION AND SUBSIDIARIES
CONSOLIDATED STATEMENTS OF INCOME(Amounts in Thousands, Except Earnings Per Share Figures)
Years Ended December 31
2019
2018(As Restated -
see Note 25)
2017(As Restated -
see Note 25)
CONTINUING OPERATIONS
REVENUESale of goods and rendering of services (Notes 11, 22, 30
and 32) P=264,906,534 P=256,891,287 P=225,568,336Share in net profits of associates and joint ventures
(Notes 10 and 30) 22,344,352 19,760,662 18,037,250Interest income from real estate (Note 7) 7,890,972 7,042,078 5,409,944Dividend income 122,903 106,803 653,721
295,264,761 283,800,830 249,669,251
COSTS AND EXPENSESCosts of sales and services (Notes 8, 23 and 32) 189,983,258 189,706,638 168,671,311General and administrative expenses (Notes 23, 29
and 32) 32,112,815 25,956,728 21,644,500
222,096,073 215,663,366 190,315,811
OTHER INCOME (CHARGES) - NetInterest income (Note 32) 3,352,308 2,293,765 1,047,050Other income (Notes 23 and 24) 32,288,490 9,198,888 7,796,428Interest and other financing charges
(Notes 19, 23 and 32) (22,409,526) (17,378,936) (13,080,794)
13,231,272 (5,886,283) (4,237,316)
INCOME BEFORE INCOME TAX 86,399,960 62,251,181 55,116,124
PROVISION FOR INCOME TAX (Note 26)Current 13,717,739 14,297,198 12,742,201Deferred 266,398 (929,997) (2,162,983)
13,984,137 13,367,201 10,579,218
NET INCOME AFTER TAX 72,415,823 48,883,980 44,536,906
OPERATIONS OF THE SEGMENT UNDER PFRS 5 (Note 25)Net income (loss) after tax (30,433,493) 6,181,134 5,329,869
NET INCOME P=41,982,330 P=55,065,114 P=49,866,775
Net Income Attributable to: Owners of the Parent Company (Note 27) P=35,279,330 P=31,817,721 P=30,263,842 Non-controlling interests 6,703,000 23,247,393 19,602,933
P=41,982,330 P=55,065,114 P=49,866,775
EARNINGS PER SHARE BEFORE OPERATIONS OF SEGMENT UNDER PFRS 5 (Note 27)Basic P=79.37 P=43.74 P=42.35
Diluted P=79.12 P=43.31 P=41.69
EARNINGS PER SHARE (Note 27)Basic P=54.12 P=48.80 P=46.67
Diluted P=53.93 P=48.35 P=45.99
See accompanying Notes to Consolidated Financial Statements.

*SGVFS039491*
AYALA CORPORATION AND SUBSIDIARIES
CONSOLIDATED STATEMENTS OF COMPREHENSIVE INCOME(Amounts in Thousands)
Years Ended December 31
2019
2018(As Restated -
see Note 25)
2017(As Restated -
see Note 25)
NET INCOME P=41,982,330 P=55,065,114 P=49,866,775
OTHER COMPREHENSIVE INCOME (LOSS)Other comprehensive income (loss) to be reclassified to profit
or loss in subsequent periods:Exchange differences arising from translations of foreign investments 1,674,874 (560,840) 2,360,433Changes in fair values of available-for-sale
investment in equity securities (Note 15) – – (706,081)Other comprehensive income not to be reclassified to profit or
loss in subsequent periods:Remeasurement gains (losses) on defined benefit
plans (Note 28) (985,132) (252,675) 350,532Changes in fair values of financial assets at
FVOCI - net (Note 15) 13,564 (975,439) –Tax effect relating to components of other comprehensive income – (153,017) (51,063)
703,306 (1,941,971) 1,953,821
SHARE OF OTHER COMPREHENSIVE INCOMEOF ASSOCIATES AND JOINT VENTURES
Other comprehensive income (loss) to be reclassified to profitor loss in subsequent periods:Exchange differences arising from translations of foreign investments (2,121,987) 392,731 105,163Changes in fair values of available-for-sale
investment in equity securities (Note 15) – – 65,822Other comprehensive income (loss) not to be reclassified to
profit or loss in subsequent periods:Remeasurement gains (losses) on defined benefit plans (1,107,730) 307,648 53,422Changes in fair values of financial assets at
FVOCI - net (Note 15) 596,195 (56,073) –
(2,633,522) 644,306 224,407
TOTAL OTHER COMPREHENSIVE INCOME (LOSS), NET OF TAX (1,930,216) (1,297,665) 2,178,228
TOTAL COMPREHENSIVE INCOME P=40,052,114 P=53,767,449 P=52,045,003
Total Comprehensive Income Attributable to: Owners of the Parent Company P=35,111,130 P=30,606,268 P=31,247,213 Non-controlling interests 4,940,984 23,161,181 20,797,790
P=40,052,114 P=53,767,449 P=52,045,003
See accompanying Notes to Consolidated Financial Statements.

AYALA CORPORATION AND SUBSIDIARIES
CONSOLIDATED STATEMENTS OF CHANGES IN EQUITYFOR THE YEARS ENDED DECEMBER 31, 2019, 2018 AND 2017(Amounts in Thousands)
EQUITY ATTRIBUTABLE TO OWNERS OF THE PARENT COMPANY
Other Comprehensive Income
Remeasurement Fair ValueGains (Losses) Reserve of
on Defined Financial EquityPaid-in Share-based Benefit Assets at Cumulative Equity Conversion Reserves Retained Treasury Non-controllingCapital Payments Plans FVOCI Translation Reserve Option under PFRS 5 Earnings Stock Interests
(Note 21) (Note 29) (Note 28) (Note 15) Adjustments (Note 2) (Note 19) (Note 19) (Note 21) (Note 21) Total (Note 2) Total Equity
For the year ended December 31, 2019
As of January 1, 2019, as previously stated
P=83,361,675 P=238,871 (P=1,299,319) (P=544,555) P=2,276,669 P=10,872,124 P=1,087,015 P=– P=196,914,989 (P=2,300,000) P=290,607,469 P=178,500,886 P=469,108,355
Effect of adoption of new accounting standards (Note 3) – – – – – – – – (343,239) – (343,239) – (343,239)
Others – – – – – – – – 67,768 – 67,768 – 67,768
As of January 1, 2019 (Restated) 83,361,675 238,871 (1,299,319) (544,555) 2,276,669 10,872,124 1,087,015 – 196,639,518 (2,300,000) 290,331,998 178,500,886 468,832,884
Net income 35,279,330 35,279,330 6,703,000 41,982,330
Share in other comprehensive income(loss) of associates and joint ventures – – (1,107,730) 596,195 (2,121,987) – – – – – (2,633,522) – (2,633,522)
Other comprehensive income (loss) – – (758,325) 14,804 3,208,842 – – – – – 2,465,321 (1,762,016) 703,305
Reserves under PFRS 5 (Note 25) – – 48,045 473 (128,906) 1,547,837 – (1,467,449) – – – – –
Total comprehensive income (loss) – – (1,818,010) 611,472 957,949 1,547,837 – (1,467,449) 35,279,330 – 35,111,129 4,940,984 40,052,113
Redemption of Preferred B Series 2 shares
– – – – – – – – –(13,500,000) (13,500,000)
(13,500,000)
Re-issuance of redeemed Preferred B Series 2 shares
– – – – – – – – – 13,500,000 13,500,000 – 13,500,000
Issuance of additional Preferred B Series 2 shares
1,079,931 – – – – – – – – 300,000 1,379,931 1,379,931
Buy-back of common shares – – – – – – – – – (3,737,896) (3,737,896) (3,737,896)
Exercise of ESOP/ESOWN 434,619 (943) – – – – – – – – 433,676 – 433,676
Cost of share-based payments – (23,311) – – – – – – – – (23,311) – (23,311)Exercise of exchange option (Note 19) – – – – – 12,323,299 (1,087,015) – – – 11,236,284 3,901,950 15,138,234
Cash dividends – – – – – – – – (6,464,228) – (6,464,228) (5,820,296) (12,284,524)
Change in non-controlling interests – – – – – 539,682 – – – – 539,682 (1,017,231) (477,549)
At December 31, 2019 P=84,876,225 P=214,617 (P=3,117,329) P=66,917 P=3,234,618 P=25,282,942 P=– (P=1,467,449) P=225,454,620 (P=5,737,896) P=328,807,265 P=180,506,293 P=509,313,558
See accompanying Notes to Consolidated Financial Statements.

- 2 -
*SGVFS039491*
EQUITY ATTRIBUTABLE TO OWNERS OF THE PARENT COMPANY
Other Comprehensive Income
Remeasurement Fair ValueGains (Losses) Reserve of
on Defined Financial EquityPaid-in Share-based Benefit Assets at Cumulative Equity Conversion Retained Treasury Non-controllingCapital Payments Plans FVOCI Translation Reserve Option Earnings Stock Interests
(Note 21) (Note 29) (Note 28) (Note 15) Adjustments (Note 2) (Note 19) (Note 21) (Note 21) Total (Note 2) Total Equity
For the year ended December 31, 2018As of January 1, 2018 P=75,001,174 P=248,212 (P=1,303,288) P=153,233 P=2,794,303 P=11,600,281 P=1,113,003 P=170,715,742 (P=2,300,000) P=258,022,660 P=154,972,168 P=412,994,828Net income – – – – – – – 31,817,722 – 31,817,722 23,247,393 55,065,115Share in other comprehensive income (loss) of associatesand joint ventures – – 307,648 (56,073) 392,730 – – – – 644,305 – 644,305Other comprehensive income (loss) – – (303,679) (641,715) (910,364) – – – – (1,855,758) (86,213) (1,941,971)
Total comprehensive income (loss) – – 3,969 (697,788) (517,634) – – 31,817,722 – 30,606,269 23,161,180 53,767,449
Issuance of shares 8,056,257 – – – – – – – – 8,056,257 – 8,056,257Exercise of ESOP/ESOWN 304,244 (340) – – – – – – – 303,904 – 303,904Cost of share-based payments – (9,001) – – – – – – – (9,001) – (9,001)Exercise of exchange option (Note 19) – – – – – 288,161 (25,988) – – 262,173 77,840 340,013Cash dividends – – – – – – – (5,618,475) – (5,618,475) (5,664,158) (11,282,633)Change in non-controlling interests – – – – – (1,016,318) – – – (1,016,318) 5,953,892 4,937,574
At December 31, 2018 P=83,361,675 P=238,871 (P=1,299,319) (P=544,555) P=2,276,669 P=10,872,124 P=1,087,015 P=196,914,989 (P=2,300,000) P=290,607,469 P=178,500,886 P=469,108,355
EQUITY ATTRIBUTABLE TO OWNERS OF THE PARENT COMPANY
Other Comprehensive Income
Remeasurement Net UnrealizedGains (Losses) Gain (Loss) on
on Defined Available-for- EquityPaid-in Share-based Benefit Sale Financial Cumulative Equity Conversion Retained Treasury Non-controllingCapital Payments Plans Assets Translation Reserve Option Earnings Stock Interests
(Note 21) (Note 29) (Note 28) (Note 15) Adjustments (Note 2) (Note 19) (Note 21) (Note 21) Total (Note 2) Total Equity
For the year ended December 31, 2017As of January 1, 2017 P=74,379,760 P=495,759 (P=1,548,192) (P=466,676) P=1,414,550 P=12,211,275 P=1,113,745 P=145,622,311 (P=2,300,000) P=230,922,532 P=140,073,346 P=370,995,878Net income – – – – – – – 30,263,842 – 30,263,842 19,602,933 49,866,775Other comprehensive income (loss) – – 191,482 (707,108) 1,274,590 – – – – 758,964 1,194,857 1,953,821Share in other comprehensive income (loss) of associatesand joint ventures – – 53,422 65,822 105,163 – – – – 224,407 – 224,407
Total comprehensive income (loss) – – 244,904 (641,286) 1,379,753 – – 30,263,842 – 31,247,213 20,797,790 52,045,003
Exercise of ESOP/ESOWN 621,414 (247,043) – – – – – – – 374,371 – 374,371Cost of share-based payments – (504) – – – – – – – (504) – (504)Exercise of exchange option (Note 19) – – – – – 8,606 (742) – – 7,864 2,048 9,912Cash dividends – – – – – – – (5,584,125) – (5,584,125) (5,395,567) (10,979,692)Change in non-controlling interests – – – – – (619,600) – – – (619,600) (732,980) (1,352,580)
At December 31, 2017 P=75,001,174 P=248,212 (P=1,303,288) (P=1,107,962) P=2,794,303 P=11,600,281 P=1,113,003 P=170,302,028 (P=2,300,000) P=256,347,751 P=154,744,637 P=411,092,388
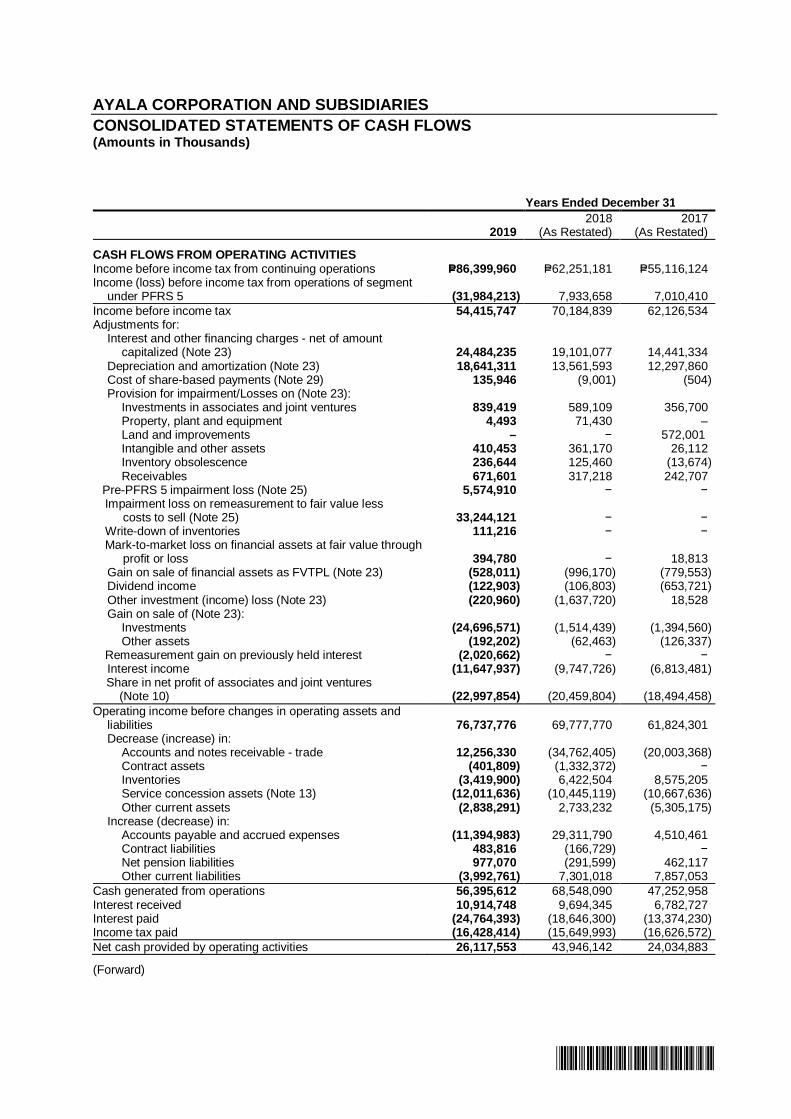
*SGVFS039491*
AYALA CORPORATION AND SUBSIDIARIES
CONSOLIDATED STATEMENTS OF CASH FLOWS(Amounts in Thousands)
Years Ended December 31
20192018
(As Restated)2017
(As Restated)
CASH FLOWS FROM OPERATING ACTIVITIESIncome before income tax from continuing operations P=86,399,960 P=62,251,181 P=55,116,124Income (loss) before income tax from operations of segment
under PFRS 5 (31,984,213) 7,933,658 7,010,410
Income before income tax 54,415,747 70,184,839 62,126,534Adjustments for: Interest and other financing charges - net of amount
capitalized (Note 23) 24,484,235 19,101,077 14,441,334 Depreciation and amortization (Note 23) 18,641,311 13,561,593 12,297,860 Cost of share-based payments (Note 29) 135,946 (9,001) (504) Provision for impairment/Losses on (Note 23): Investments in associates and joint ventures 839,419 589,109 356,700 Property, plant and equipment 4,493 71,430 – Land and improvements – − 572,001 Intangible and other assets 410,453 361,170 26,112
Inventory obsolescence 236,644 125,460 (13,674)Receivables 671,601 317,218 242,707
Pre-PFRS 5 impairment loss (Note 25) 5,574,910 − −Impairment loss on remeasurement to fair value less
costs to sell (Note 25) 33,244,121 − −Write-down of inventories 111,216 − −Mark-to-market loss on financial assets at fair value through
profit or loss 394,780 − 18,813 Gain on sale of financial assets as FVTPL (Note 23) (528,011) (996,170) (779,553) Dividend income (122,903) (106,803) (653,721) Other investment (income) loss (Note 23) (220,960) (1,637,720) 18,528 Gain on sale of (Note 23): Investments (24,696,571) (1,514,439) (1,394,560) Other assets (192,202) (62,463) (126,337)
Remeasurement gain on previously held interest (2,020,662) − − Interest income (11,647,937) (9,747,726) (6,813,481)
Share in net profit of associates and joint ventures(Note 10) (22,997,854) (20,459,804) (18,494,458)
Operating income before changes in operating assets andliabilities 76,737,776 69,777,770 61,824,301
Decrease (increase) in: Accounts and notes receivable - trade 12,256,330 (34,762,405) (20,003,368)
Contract assets (401,809) (1,332,372) − Inventories (3,419,900) 6,422,504 8,575,205 Service concession assets (Note 13) (12,011,636) (10,445,119) (10,667,636) Other current assets (2,838,291) 2,733,232 (5,305,175) Increase (decrease) in: Accounts payable and accrued expenses (11,394,983) 29,311,790 4,510,461
Contract liabilities 483,816 (166,729) − Net pension liabilities 977,070 (291,599) 462,117 Other current liabilities (3,992,761) 7,301,018 7,857,053
Cash generated from operations 56,395,612 68,548,090 47,252,958Interest received 10,914,748 9,694,345 6,782,727Interest paid (24,764,393) (18,646,300) (13,374,230)Income tax paid (16,428,414) (15,649,993) (16,626,572)
Net cash provided by operating activities 26,117,553 43,946,142 24,034,883
(Forward)

*SGVFS039491*
- 2 -
Years Ended December 31
20192018
(As Restated)2017
(As Restated)
CASH FLOWS FROM INVESTING ACTIVITIESProceeds from: Sale/maturities of financial assets FVOCI P=65,660 P=23,447 P=1,834,186 Sale/maturities of financial assets at FVTPL 765,763 71,690 3,408,555 Sale/redemptions of investments in associates and
joint ventures (Note 10) 30,353,702 1,106,080 944,104Disposals of: Property, plant and equipment (Note 12) 766,655 3,581,848 1,016,548 Investment properties (Note 11) 1,632,666 1,754,974 165 Land and improvements – 1,105,170 –Additions to short-term investments (7,540,567) (556,250) (4,391,533)Deductions/transfers (Additions) to: Service concession assets (Note 13) (29,525) (10,725) (26,290)
Investments in associates and joint ventures (11,898,192) (37,633,169) (11,779,429) Property, plant and equipment (Note 12) (20,965,834) (14,006,370) (25,189,980) Investment properties (Note 11) (29,306,538) (37,287,003) (33,358,785) Financial assets at FVTPL (1,435,128) (1,122,194) (1,555,243) Financial assets at FVOCI (3,137,883) (92,673) (799,529) Accounts and notes receivable - non trade (3,580,862) (11,265,591) (1,336,144) Intangible assets (Note 14) 849,934 (488,357) (492,057)Dividends received from associates, joint ventures and
investments in equity securities (Note 10) 9,004,700 7,478,203 8,953,251Acquisitions through business combinations - net of cash
acquired (Note 24) (1,143,592) (6,831,376) (5,322,990)Decrease (increase) in other noncurrent assets (14,448,144) (13,819,311) 5,775,538
Net cash used in investing activities (50,047,185) (107,991,607) (62,319,633)
CASH FLOWS FROM FINANCING ACTIVITIESProceeds from: Short-term and long-term debt 289,335,723 188,614,111 225,841,869 Issuance of preferred shares 15,000,000 − Issuance of common shares – 8,069,960 −Payments of short-term and long-term debt (202,331,063) (137,303,524) (172,070,751)Acquisition of treasury shares - common (3,737,896) − −Dividends paid (Note 21) (11,919,555) (10,769,921) (10,864,490)Redemption of preferred shares (13,500,000) −Payment of principal portion of lease liabilities (2,051,769) −Service concession obligation paid (Note 13) (838,286) (712,941) (778,819)Collections of subscriptions receivable 274,677 303,904 374,371Cost of issuance/reissuance of shares (120,327) (13,703) −Increase (decrease) in: Other noncurrent liabilities (749,827) 12,202,242 1,181,105 Non-controlling interests in consolidated subsidiaries
(Note 24) (3,692,798) 20,321 (1,362,580)
Net cash provided by financing activities 65,668,879 60,410,449 42,320,705
NET INCREASE (DECREASE) IN CASH ANDCASH EQUIVALENTS 41,739,248 (3,635,016) 4,035,955
CASH AND CASH EQUIVALENTS ATBEGINNING OF YEAR 60,624,263 64,259,279 60,223,324
CASH AND CASH EQUIVALENTS ATEND OF YEAR (Note 5) P=102,363,510* P=60,624,263 P=64,259,279
*Includes cash and cash equivalents of assets under PFRS 5.
See accompanying Notes to Consolidated Financial Statements

*SGVFS039491*
AYALA CORPORATION AND SUBSIDIARIES
NOTES TO CONSOLIDATED FINANCIAL STATEMENTS
1. Corporate Information
Ayala Corporation (the Parent Company) is incorporated in the Republic of the Philippines onJanuary 23, 1968. On April 15, 2016, during the annual meeting of its stockholders, the stockholdersratified the amendment of the Fourth Article of the Articles of Incorporation (AOI) to extend thecorporate term for 50 years from January 23, 2018. The amendment to the AOI was approved by theSecurities and Exchange Commission (SEC) on April 5, 2017. The Parent Company’s registeredoffice address and principal place of business is 32F-35F, Tower One and Exchange Plaza, AyalaTriangle, Ayala Avenue, Makati City. The Parent Company is a publicly listed company which is47.33% owned by Mermac, Inc. and the rest by the public.
The Parent Company is the holding company of the Ayala Group of Companies (the Group), withprincipal business interests in real estate and hotels, financial services and insurance,telecommunications, water infrastructure, electronics solutions and manufacturing, industrialtechnologies, automotive, power generation, infrastructure, international real estate, healthcare,education and technology ventures.
2. Group Information
The consolidated financial statements comprise the financial statements of the Parent Company andthe following subsidiaries of the Group:
Subsidiaries
% of Economic OwnershipInterest held by the Group
Nature of Business 2019 2018
AC Energy, Inc. (AC Energy/ACEI) Power 100.0 100.0AC Infrastructure Holdings Corporation
(AC Infra)Infrastructure 100.0 100.0
AC International Finance Limited (ACIFL)* Investment Holding 100.0 100.0AG Counselors Corporation (AGCC) Consulting Services 100.0 100.0AC Industrial Technology Holdings Inc. (AC
Industrial /ACI)Industrial Technology and
Automotive
100.0 100.0
Ayala Aviation Corporation (AAC) Air Charter 100.0 100.0AC Education, Inc. ( AC Education/AEI) Education − 100.0Ayala Land, Inc. (ALI) Real Estate and Hotels 44.5 47.0AYC Finance Ltd. (AYCFL)* Investment Holding 100.0 100.0Azalea International Venture Partners
Limited (AIVPL)**Business Process
Outsourcing100.0 100.0
Ayala Healthcare Holdings, Inc.(AC Health/AHHI)
Healthcare 100.0 100.0
Bestfull Holdings Limifted (BHL)*** Investment Holding – International 100.0 100.0Darong Agricultural and Development
Corporation (DADC)Agriculture 100.0 100.0
HCX Technology Partners, Inc. (HCX) Technology Services 100.0 100.0Integrated Microelectronics, Inc. (IMI) Industrial Technologies 52.1 52.1Manila Water Company, Inc. (MWC) Water 51.4 51.4Michigan Holdings, Inc. (MHI) Investment Holding 100.0 100.0Philwater Holdings Company, Inc.
(Philwater)Investment Holding 100.0 100.0
Purefoods International, Ltd. (PFIL)** Investment Holding 100.0 100.0Technopark Land, Inc. (TLI) Real Estate 78.8 78.8AC Ventures Holding Corporation (ACVHC) Investment Holding 100.0 100.0*Incorporated in Cayman Islands
**Incorporated in British Virgin Islands***Incorporated in Hong Kong

- 2 -
*SGVFS039491*
Unless otherwise indicated, the principal place of business and country of incorporation of the ParentCompany’s investments in subsidiaries, associates and joint ventures is the Philippines.
Except as discussed below, the voting rights held by the Parent Company in its investments insubsidiaries are in proportion to its ownership interest.
The following significant transactions affected the Parent Company’s investments in its subsidiaries:
Investment in ACEIOn May 2, 2019, ACEI completed the sale of a 49% voting interest and 60% economic interest in AAThermal, Inc. (AA Thermal) to Aboitiz Power Corporation (Aboitiz Power) which amounted toUS$574.19 million after applying the agreed adjustments pursuant to the Share Purchase Agreement(SPA) (see Note 25). The transaction resulted in a net gain on sale of US$448.96 million(P=23.6 billion) included under “Other Income” (see Note 23).
As of December 31, 2019, the Parent Company infused a total of P=5.1 billion additional capital for theAC Energy Philippines (ACEPH) acquisition and another 5.8 billion via subscription on ACEI’sredeemable preferred shares.
On June 24, 2019, ACEI completed the acquisition of ACEPH, formerly Phinma Energy Corporation(PHEN), resulting in an ownership interest of 66.34% (see Note 24). On July 10, 2019, SLTECbecame a subsidiary of ACEI pursuant to the acquisition of 20% interest from Axia Prime Holdings(Axia) (see Note 24). Prior to the acquisition, ACEI has direct 35% ownership interest in SLTEC and45% indirect ownership interest through ACEPH (see Notes 10 and 24). On October 11, 2019, theSEC approved the change in corporate name of PHEN to ACEPH.
On October 9, 2019, ACEI and ACEPH signed a Deed on Assignment of the 20% share of ACEI inSouth Luzon Thermal Energy Corp. (SLTEC) to ACEPH. On October 10, 2019, the BOD of ACEI hasapproved the contribution by ACEI of its ownership interest in certain of its Philippine operating anddevelopment subsidiaries and affiliates such as Monte Solar Energy, Inc. (Monte Solar),SLTEC,Philippine Wind Holdings Corporation (PWHC), and NorthWind Power Development Corp.(Northwind) (the ACEI Assets) to ACEPH under a share swap arrangement (the Share Swap), andACEI's subscription to 6,185,182,288 shares of stock in ACEPH at ₱2.37 per share in exchange forthe ACEI Assets, which price per share is within the share price range determined in the FairnessOpinion issued by FTI Consulting Philippines, Inc., an SEC-accredited and PSE-accreditedindependent financial valuation firm.
On November 12, 2019, ACEI and ACEPH executed a Deed of Assignment covering the share swap.
In relation to ACEPH's stock rights offering (which is subject to applicable regulatory approvals), theBOD of ACEI likewise approved its management's proposal to not exercise its preemptive rights inthe first round of the stock rights offering to enable the minority shareholders of ACEPH to recoverfrom the partial dilution arising from the share swap between ACEPH and ACEI, but that in the eventthere are any unsubscribed shares after the first round, ACEI will subscribe to its pro-rata share inthese unsubscribed shares.
On July 1, 2019, ACEI Group and Power Partners Ltd Co. (PP) executed a term sheet for theacquisition by PP of ACEI Group’s indirect partnership interest in GN Power Kauswagan Ltd. Co.(GNPK) subject to conditions precedent. The completion of the transaction will result to PP gainingcontrol over GNPK’s coal plant project. On September 30, 2019, the PCC approved the transaction.As a result of the sale agreement, GNPK assets and liabilities previously consolidated in the Group’sstatement of financial position are now reclassified to “Assets under PFRS 5” and “Liabilities underPFRS 5”, respectively. ACEI Group continues to take up the full profit and loss of GNPK untilDecember 31, 2019 because control is not yet transferred as of year-end (see Note 25).

- 3 -
*SGVFS039491*
On January 19, 2018, the Board of Directors (BOD) of ACEI approved the restructuring of ACEI asfollows:
· Effective January 29, 2018, ACE Mariveles Power Ltd. Co. (AMPLC), a wholly owned subsidiaryof ACEI, became the legal and registered owner of the limited partnership interest in GNPowerMariveles Coal Plant Ltd. Co (GMCP).
· On June 7, 2018, Ingrid Power Holdings, Inc., a wholly owned subsidiary of ACEI wasincorporated.
· On July 12, 2018, ACEI Group restructured Gigasol2, Inc. to transfer 100% ownership from ACLaguna Solar Inc., AC La Mesa Solar Inc., AC Subic Solar Inc., Gigasol1 Inc., Gigasol3 Inc.SolarAce1 Inc. and SolarAce2. These companies including Gigasol2 were 100%-owned byPresage Corporation (Presage), a wholly owned subsidiary of ACEI.
· On September 7, 2018, ACE Thermal, Inc., a wholly owned subsidiary of ACEI was incorporated.On September 20, 2018, AA Thermal, Inc. (AA Thermal), a wholly owned affiliate of ACEI wasincorporated.
· On September 24, 2018, ACEI transferred 100% of its limited partnership interest in each ofAMPLC and Dinginin Power Holdings Ltd. Co. (DPHLC) to AA Thermal. The transfer is part ofACEI Group’s restructuring plan for its thermal assets.
· On September 25, 2018, ACEI and Arlington Mariveles Netherlands Holdings B.V. (AMNHB), asubsidiary of ACEI, signed a subscription agreement for the purchase of shares of stock of AAThermal.
On various dates in 2018, ACEI acquired 100% ownership interest in Pagudpud Wind Power Corp.(Pagudpud Wind) and HDP Bulk Water Supply, Inc. (HDP) for P=2.5 million and P=110.1 million,respectively (see Note 24).
Investment in AC InfraOn various dates in 2019 and 2018, the Parent Company infused additional capital to AC Infraamounting to P=2,371.0 million and P=1,649.3 million, respectively. In 2019, the additional capital wasmainly for LRT 1 project (Cavite extension) and MCX ECC Facility projects. In 2018, the additionalcapital was used to fund the investments in Light Rail Manila Holdings, Inc., Entrego FulfilmentSolutions, Inc. (Entrego), AF Payments, Inc. (AFPI) and the operating and capital expenditures of ACInfra.
On August 6, 2018, AC Infra acquired 57.90% ownership interest in Entrego for a total amount ofP=158.86 million (see Note 24).
Investment in ACIFL
In May 2019, ACIFL repurchased its 110.0 million shares which were issued and registered in thename of the Parent Company, ACIFL’s sole shareholder. The repurchase price was at par ofUS$1.00 per share for a total amount of US$110.0 million. ACIFL remained a wholly ownedsubsidiary of the Parent Company after the transaction.
On various dates in 2019, ACIFL infused additional capital to AC Industrial (Singapore) Pte. Ltd. (ACI
Singapore), a wholly-owned subsidiary of AC Industrial, amounting to US$75.4 million to fund its
various investments particularly its subscription to redeemable cumulative preferred stock (RCPS) ofIMI Singapore amounting to US$60.0 million.
Investment in AC IndustrialOn January 17, 2019, KP Motor Corporations (KPMC), a wholly-owned subsidiary of AC Industrial,was incorporated. KPMC is primarily engaged to assemble, manufacture, construct, purchase,import, sell on wholesale basis, distribute, export, exchange, mortgage, pledge and otherwise disposeof, and generally to deal in or engage in any commerce relating to automobiles, cars, automobileproducts, and all kinds of component parts of Kia brand. On March 25, 2019, AC Industrial andRoadworthy Cars, Inc. (RCI) executed a subscription agreement for additional subscriptions in KPMCresulting in AITHI’s ownership at KPMC at 67.2% voting interest and 65% economic interest.

- 4 -
*SGVFS039491*
On January 30, 2019, AC Industrial relaunched the Kia brand in the Philippines wherein three (3) newvehicle models were introduced.
On March 13, 2019, AC Industrial through its subsidiary MT Technologies GmbH, has entered into anagreement with the shareholders of C-CON Group for the acquisition of a 75.1% stake in C-CONGroup for a total consideration of EURO 0.86 million (see Note 24).
In 2019, the Parent Company infused P=1.8 billion for AC Industrial’s acquisition of the Kiadistributorship business. In 2018, the Parent Company infused P=3.7 billion, respectively, to ACIndustrial Group to fund its operating expenses and various projects, subscription entitlement in IMI’sstock offering, planned business expansion and various investments.
In March 2018, AC Industrial completed its subscription to 208,187,173 proportionate andunsubscribed rights share in IMI’s stock rights offering (SRO), raising its ownership in IMI to 52.03%.
On February 24, 2018, AC Industrial completed its acquisition of a controlling stake in Merlin SolarTechnologies, Inc. (Merlin US) through its offshore subsidiary, ACI Solar Holdings NA, Inc. (ACISolar). AITHI had a previously held interest of 8.2% in Merlin US which it acquired in 2016. The2018 acquisition resulted to a total ownership interest of 98.96% in Merlin US (see Note 24).
On various dates in 2018, AC Industrial was appointed as distributor of KIA and Maxus vehicles in thePhilippines.
Investment in IMI
In 2019, IMI finalized the purchase price allocation of VTS-Touchsensor Co., Ltd. (VTS) with certainchanges to the provisional values based on additional information subsequently obtained (seeNote 24).
On January 30, 2018, IMI obtained the approval of the Philippines Stock Exchange (PSE) for a stockrights offer of up to 350 million new common shares to eligible shareholders in order to raise up toP=5.0 billion proceeds. Under the rights offer, each shareholder is entitled to subscribe to one rightsshare for every 5.3551 existing common shares held as of record date February 14, 2018. The offerprice was determined to be at P=14.28 per rights share which was based on the 30-day volume-
weighted average price of IMI common shares listed at PSE as of February 7, 2018 at a discount of25.3%. The listing of the shares was completed on March 2, 2018. As a result of the transaction, theownership interest of the Group increased from 50.7% to 52.1%
The fair value of the IMI shares held by the Group amounted to P=9.1 billion and P=12.2 billion as ofDecember 31, 2019 and 2018, respectively. The voting rights held by the Group in IMI is 52.1% and52.1% in 2019 and 2018, respectively.
Investment in AACOn various dates in 2019, the Parent Company infused additional capital to AAC amounting toP=119.4 million to fund its various expenditures.
Investment in AEIOctober 1, 2018, AEI and iPeople, Inc. (IPO) executed a memorandum of agreement (MOA) for themerger, with IPO as the surviving entity. On April 24, 2019, the Plan and Articles of Merger witheffectivity date of May 2, 2019 were approved by the SEC. Upon SEC approval, IPO issued295,329,976 common shares in exchange for 1,993,477,338 AEI shares, which constitutes 28.28% ofIPO. As a result of the transaction, the Group recognized a gain on disposal of P=865.2 millionincluded under “Other income” (see Note 23). Post-merger, the Parent Company acquired additional54,500,000 IPO common shares from existing House of Investments (HI) affiliates for a considerationof P=809.8 million, inclusive of directly-related fees, which resulted in an increase in ownership interestin IPO to 33.5% (see Note 10).

- 5 -
*SGVFS039491*
On February 8, 2018, AEI and most of the shareholders of National Teachers College (NTC)executed a SPA for the acquisition of shares in NTC subject to certain closing conditions. OnApril 30, 2018, AEI assumed ownership of approximately 96.0% of the voting shares of NTC for atotal consideration of P=1.2 billion (see Note 24).
On December 18, 2018, AEI purchased the rest of the non-controlling interest held by PearsonAffordable Learning Fund Limited (PALF) in Affordable Private Education Center, Inc. doing businessunder the name of APEC Schools (APEC), making APEC a wholly owned subsidiary of AEI(see Note 24).
On various dates in 2018, the Parent Company infused additional capital to AEI which amounted toP=2,597.0 million to fund its various investments.
Investment in ALI
On April 24, 2019, ALI's subsidiary, AREIT, Inc. (AREIT), announced its plan to publicly list as a RealEstate Investment Trust (REIT) under the current Implementing Rules and Regulations of the SEC onREITs. On February 7, 2020, AREIT filed its application for a REIT offering to the SEC (see Note 40).
ALI shares with carrying value of P=258.9 million as of December 31, 2019 and 2018 werecollateralized to secure the Parent Company’s loan facility. The fair value of ALI shares collateralizedamounted to P=15.4 billion and P=13.8 billion as of December 31, 2019 and 2018, respectively (seeNote 19).
On April 30, 2019, the outstanding balance of AYCFL’s guaranteed exchangeable bonds amountingto US$292.8 million was exchanged and converted into 377.5 million ALI common shares (see Note19). This resulted in a decrease in the Group’s ownership interest in ALI from 47.0% to 44.5% as ofDecember 31, 2019.
The BOD of ALI also approved the 2019 stock option program pursuant to their Employee StockOwnership Plan (ESOWN) (see Note 29).
The fair value of ALI shares held by the Parent Company amounted to P=297.8 billion andP=281.1 billion as of December 31, 2019 and 2018, respectively. The voting rights held by the ParentCompany in ALI is 67.3% and 68.7% as of December 31, 2019 and 2018.
Investment in AHHIIn, 2019, AHHI acquired additional stake in the Generika companies which increased its ownershipfrom 50% to 52.5% (see Notes 10 and 24).
On November 27, 2019, the BOD approved the incorporation of Vigos Ventures Inc. (VVI). OnJanuary 7, 2020, VVI was approved by the SEC for incorporation with an authorized capital stock of₱200 million. AHHI subscribed to 0.45 million common shares and 0.05 million common shares at asubscription price of ₱10 per share.
On various dates in 2019, the Parent Company infused P=1,666.7 million to AHHI for certain capitalexpenditure, clinic expansion and new business development. Outstanding subscription as ofDecember 31, 2019 amounted to P=1,959.7 million. In 2018, the Parent Company infusedP=389.8 million to fund AHHI’s various investments.
On December 6, 2018, AHHI entered into a share purchase agreement with Jasminum Corporationfor the acquisition of a 75% ownership stake in Negros Grace Pharmacy, Inc. (Negros Grace). As ofDecember 31, 2019, the purchase is still subject to the fulfillment of certain closing conditions,including any necessary regulatory approval. This transaction, once completed, will allow AHHI toexpand its portfolio in the pharma retail space, particularly in the Visayas region.

- 6 -
*SGVFS039491*
On October 14, 2019, AHCHI Pharma Ventures, Inc. (“APV”) was incorporated with a primarypurpose to acquire, hold, sell, exchange, deal and invest in the stocks, bonds or securities. AHHIsubscribed to 108,600,000 common shares equivalent to 100% interest in APV for a total subscriptionprice of ₱1.09 billion.
In November 2019, APV signed a Share Purchase Agreement (SPA) to purchase 490,000 shares ofI.E. Medica Inc., an importer of pharmaceutical products, amounting to ₱931 million equivalent to49% interest in the company with a call option to acquire an additional 2% of the outstanding capitalstock of the company. At the same date, APV signed another SPA to purchase 200,000 shares ofMedethix Inc., a pharmaceutical and cosmetics importer, amounting to ₱155 million equivalent to20% interest in the company with a call option to acquire an additional 14% of the outstanding capitalstock of the company.
Based on the SPA, APV will be liable for an earn-out in the event the net income after tax (NIAT) ofI.E. Medica Inc., for the years 2020 and 2021 as reflected in the audited financial statements of thecompany meet the target NIAT. This shall be paid on May 30, 2022. APV recognized an earn-outliability amounting to ₱250.23 million and incurred interest expense amounting to ₱2.86 million as ofDecember 31, 2019.
Investment in BHLIn November 2019, the Parent Company through BHL’s wholly-owned subsidiary, VIP InfrastructureHoldings Pte. Ltd. (VIP), signed definitive agreements to acquire 20% stake each in Yoma StrategicHoldings, Inc. (YSH) and First Myanmar Investment Public Co. (FMI). As of December 31, 2019, theVIP and YSH closed the first tranche of the placement shares, with VIP owning 14.9% of theoutstanding shares of YSH (see Note 10).
Investment in MWCOn February 3, 2020, MWC and Prime Metroline Holdings, Inc., on behalf of Trident Water, acompany to be incorporated, signed a subscription agreement for the acquisition of 25% ownershipinterest in MWC or 820.0 million newly issued common shares at P=13.00, subject to fulfillment ofconditions. Subsequently, the Parent Company will grant Trident Water its proxy rights over MWC’spreferred shares held through the Parent Company’s wholly-owned subsidiary, Philwater HoldingsCompany, Inc. Upon completion of the transaction which is expected to be within one year from thereporting period, Trident Water will have 51.00% voting interest and thus, obtain control over MWC.Accordingly, MWC qualified as a group held for deemed disposal as of December 31, 2019 (seeNote 25).
The fair value of the MWC shares held by the Group amounted to P=9.0 billion and P=23.1 billion as ofDecember 31, 2019 and 2018, respectively. The voting rights held by the Group in MWC is 80.2%and 80.3% as of December 31, 2019 and 2018.
In 2019, investment in MWC was reclassified to “Assets and liabilities and operations of segmentunder PFRS 5” (see Note 25).
Investment in ACVHCIn 2019, the Ayala Group established the Technology Innovation Venture Fund (Active Fund). ActiveFund will be the capital fund platform to understand disruptive trends and innovations which is key tostaying relevant and future-ready as a Group. The platform allows participation and activeinvolvement of business units within the Group. Active Fund will be managed by Kickstart Ventures,Inc. and with AC Ventures will be the largest investor. The Fund will be participated in by thefollowing subsidiaries of the Group (with their investment commitment): AC Ventures (US$100million), Globe (US$25 million), AC Energy (US$25 million), BPI (US$20 million), AC Industrials(US$20 million), ALI (US$15 million) and MWCI (US$5 million).

- 7 -
*SGVFS039491*
On July 12, 2019, the BOD of ACVHC approved the amount of P=63.75 million for a 25.5% ownershipin a joint venture with BPI Capital Corporation and Telly Systems, Inc. for the development of anintegrated payment exchange platform.
In 2018, the Parent Company infused a total of P=0.02 billion, to ACVHC to fund its variousinvestments in BF Jade E-Service Philippines, Inc. (BF Jade), the owner of Zalora Philippines(Zalora) and Globe Fintech Innovations, Inc. (GFI or Mynt) (see Note 10).
Material partly-owned subsidiaries with material economic ownership interest
The principal place of business of the subsidiaries are as follows:
ALIALI’s registered and principal place of business is 31st Floor, Tower One and Exchange Plaza, AyalaTriangle, Ayala Avenue, Makati City.
MWCThe principal place of business of MWC is at the MWSS Administration Building, 489 KatipunanRoad, Balara, Quezon City.
IMIThe registered office address of IMI is at North Science Avenue, Laguna Technopark-SpecialEconomic Zone (LT-SEZ), Bo. Biñan, Laguna.
Information of subsidiaries that have material non-controlling economic interests is provided below:
2019 ALI MWC IMI*
(In Thousands, except for %)Proportion of equity interests held by
non-controlling interest 55.5% 48.6% 47.9%Voting rights held by non-controlling interest 32.7% 19.8% 47.9%Accumulated balances of non-controlling
interest P=143,883,588 P=18,242,429 P=9,497,310Net income allocated to non-controlling
interest 21,626,556 (14,563,041) (428,312)
Comprehensive income allocated to materialnon-controlling interest 21,225,123 (15,298,621) (1,053,347)
Dividends paid to non-controlling interest 4,244,187 1,455,187 111,156*Translated using the exchange rate at the reporting date (US$1:P=50.64 on December 27, 2019).
2018 ALI MWC IMI*
(In Thousands, except for %)
Proportion of equity interests held bynon-controlling interest 53.0% 48.6% 47.9%
Voting rights held by non-controlling interest 31.3% 19.7% 47.9%
Accumulated balances of non-controllinginterest P=129,072,954 P=34,446,560 P=10,639,501
Net income allocated to non-controlling
interest 18,868,583 3,016,848 1,258,795Comprehensive income allocated to material
non-controlling interest 18,201,328 2,656,094 1,148,331
Dividends paid to non-controlling interest 3,996,386 1,407,921 248,175*Translated using the exchange rate at the reporting date (US$1:P= 52.58 on December 28, 2018).

- 8 -
*SGVFS039491*
The summarized financial information of these subsidiaries are provided below which are based onamounts before inter-company eliminations and PFRS 5 adjustments:
2019 ALI MWC IMI*
(In Thousands)Statement of financial position
Current assets P=295,434,250 P=14,405,614 P=34,125,320
Noncurrent assets 418,489,028 120,196,026 21,387,651Current liabilities 226,583,524 21,922,179 22,977,661Noncurrent liabilities 244,634,186 56,688,254 8,039,170
Statement of comprehensive income (loss)Revenue 166,705,332 21,949,770 63,312,278Profit (loss) attributable to:
Equity holders of the parent 33,188,399 5,495,509 (393,973)Non-controlling interests 4,326,632 143,916 (274,166)
Total comprehensive income (loss) attributable to:
Equity holders of the parent 32,449,920 4,360,850 (818,321)Non-controlling interests 4,326,632 144,849 (322,237)
Statement of cash flows
Operating activities 36,012,239 549,262 3,602,009Investing activities (42,572,063) (692,482) (2,947,608)Financing activities 3,753,175 (289,128) 1,590,130
Net increase (decrease) in cash andcash equivalents (P=2,806,649) (P=432,348) P=2,244,531
*Translated using the exchange rate at the reporting date (US$1:P=50.64 on December 27, 2019).
2018ALI
(As Restated) MWCIMI*
(As Restated)
(In Thousands)
Statement of financial positionCurrent assets P=302,829,898 P=13,448,541 P=36,290,341Noncurrent assets 365,990,584 109,084,776 20,348,690
Current liabilities 240,784,527 22,708,379 27,663,021Noncurrent liabilities 207,814,758 46,203,845 7,384,819
Statement of comprehensive income
Revenue 163,746,818 19,836,292 70,951,475Profit attributable to:
Equity holders of the parent 29,240,880 6,523,701 2,481,109
Non-controlling interests 3,975,709 111,332 83,864Total comprehensive income attributable to:
Equity holders of the parent 29,701,636 6,987,646 1,996,581
Non-controlling interests 3,978,318 112,862 10,103Statement of cash flows
Operating activities 11,767,917 3,297,588 (343,322)
Investing activities (2,978,246) (8,859,009) (4,730,716)Financing activities (6,264,296) 5,931,268 6,026,534
Net increase in cash and cash equivalents P=2,525,375 P=369,847 P=952,496
*Translated using the exchange rate at the reporting date (US$1:P=52.58 on December 28, 2018).
2017 ALI MWC IMI*
(In Thousands)
Statement of financial positionCurrent assets P=240,852,281 P=12,867,251 P=28,979,972Noncurrent assets 333,140,053 105,836,163 17,001,451
Current liabilities 184,623,237 11,738,570 22,585,772Noncurrent liabilities 197,105,739 43,650,182 9,585,282Statement of comprehensive income
Revenue 139,373,341 18,515,772 54,453,068Profit (loss) attributable to:
Equity holders of the parent 25,304,965 6,146,608 1,697,719
Non-controlling interests 2,860,694 (6,661) 22,007Total comprehensive income attributable to:
Equity holders of the parent 26,500,790 6,197,535 2,550,203
Non-controlling interests 2,860,694 (5,415) 39,025Statement of cash flows
Operating activities 24,233,585 (157,576) (915,611)
Investing activities (33,906,087) (2,371,079) (3,913,562)Financing activities 9,800,657 7,483,699 4,992,541
Net increase in cash and cash equivalents P=128,155 P=4,955,044 P=163,368
*Translated using the exchange rate at the reporting date (US$1:P=49.93 on December 28, 2017).

- 9 -
*SGVFS039491*
3. Summary of Significant Accounting Policies
Basis of PreparationThe accompanying consolidated financial statements of the Group have been prepared on a historicalcost basis, except for financial assets at fair value through profit or loss (FVTPL), financial assets atfair value through other comprehensive income (FVOCI), and derivative financial instruments thathave been measured at fair value. The consolidated financial statements are presented in PhilippinePeso (P=) and all values are rounded to the nearest thousand pesos (P=000) unless otherwiseindicated.
The consolidated financial statements provide comparative information in respect of the previousperiod.
Statement of ComplianceThe consolidated financial statements of the Group have been prepared in compliance with PhilippineFinancial Reporting Standards (PFRSs), which include the availment of the relief granted by the SECunder Memorandum Circular Nos. 14-2018 and 3-2019 for the following implementation issues ofPFRS 15 affecting the real estate industry:a. Exclusion of land and uninstalled materials in the determination of percentage of completion
(POC) discussed in PIC Q&A No. 2018-12-Eb. Accounting for significant financing component discussed in PIC Q&A No. 2018-12-Dc. Accounting for Common Usage Service Area (CUSA) Charges discussed in PIC Q&A No. 2018-
12-Hd. Adoption of PIC Q&A No. 2018-14: PFRS 15 - Accounting for Cancellation of Real Estate Sales
PFRSs include Philippine Financial Reporting Standards, Philippine Accounting Standards andInterpretations issued by the Philippine Interpretations Committee (PIC).
Basis of ConsolidationThe consolidated financial statements comprise the financial statements of the Group as ofDecember 31, 2019 and 2018 and for each of the three years in the period endedDecember 31, 2019.
Control is achieved when the Group is exposed, or has rights, to variable returns from its involvementwith the investee and has the ability to affect those returns through its power over the investee.Specifically, the Group controls an investee if and only if the Group has:a. Power over the investee (i.e. existing rights that give it the current ability to direct the relevant
activities of the investee);b. Exposure, or rights, to variable returns from its involvement with the investee, andc. The ability to use its power over the investee to affect its returns.
When the Group has less than a majority of the voting or similar rights of an investee, the Groupconsiders all relevant facts and circumstances in assessing whether it has power over an investee,including:
a. The contractual arrangement with the other vote holders of the investeeb. Rights arising from other contractual arrangementsc. The Group’s voting rights and potential voting rights
The Group re-assesses whether or not it controls an investee if facts and circumstances indicate thatthere are changes to one or more of the three elements of control.
In a business combination achieved in stages, the Group remeasures its previously held equityinterest in the acquiree at its acquisition date fair value and recognize gain or loss, if any in profit orloss (under other income).

- 10 -
*SGVFS039491*
Consolidation of a subsidiary begins when the Group obtains control over the subsidiary and ceaseswhen the Group loses control of the subsidiary. Assets, liabilities, income and expenses of asubsidiary acquired or disposed of during the year are included or excluded in the consolidatedfinancial statements from the date the Group gains control or until the date the Group ceases tocontrol the subsidiary.
The financial statements of the subsidiaries are prepared for the same reporting period as the ParentCompany, using consistent accounting policies. All intra-group balances, transactions, unrealizedgains and losses resulting from intra-group transactions and dividends are eliminated in full.
Non-controlling interests pertain to the equity in a subsidiary not attributable, directly or indirectly tothe Parent Company. Any equity instruments issued by a subsidiary that are not owned by theParent Company are non-controlling interests including preferred shares and options under share-based transactions. The portion of profit or loss and net assets in subsidiaries not wholly-owned arepresented separately in the consolidated statement of income, consolidated statements ofcomprehensive income, consolidated statements of changes in equity and consolidated statement offinancial position, separately from the Parent Company’s equity. Non-controlling interests are net ofany outstanding subscription receivable.
Losses within a subsidiary are attributed to the non-controlling interests even if that results in adeficit balance.
In accounting for call and put options over non-controlling interests, management determines whetherit has present access to the returns associated with the non-controlling interests. If the options givethe Group access to the returns over the non-controlling interests, the Group consolidates theacquiree as if it acquired a 100% interest.
If the options does not give the Group present access to the returns over the non-controlling interests,the Group takes the view that the non-controlling interests should be accounted for in accordancewith PFRS 10, Consolidated Financial Statements, and must be presented within equity separatefrom the equity of the Parent Company, until the option is exercised.
For the years ended December 31, 2019 and 2018, the call options are accounted for in accordancewith PFRS 9, Financial Instruments, as a derivative asset carried at fair value through profit or loss.
The financial liability for the put option is accounted for under PFRS 9 like any other written put optionon equity instruments. On initial recognition, the corresponding debit is made to a component ofequity attributable to the parent, not to the non-controlling interest. All subsequent changes in thecarrying amount of the financial liability that result from the remeasurement of the present valuepayable on exercise are recognized in profit or loss also attributable to the parent.
If the put option is exercised, the entity accounts for an increase in its ownership interest. At thesame time, the entity derecognizes the financial liability and reverses the component of equity thatwas reduced on initial recognition. If the put option expires unexercised, the financial liability isreclassified to the same component of equity that was reduced on initial recognition.
A change in the ownership interest of a subsidiary, without a loss of control, is accounted for as anequity transaction. Any difference between the amount by which the non-controlling interests areadjusted and the fair value of the consideration paid or received is recognized directly in equity as“Equity reserve” and attributed to the owners of the Parent Company.
If the Group loses control over a subsidiary, it derecognizes the related assets (including goodwill),liabilities, non-controlling interest and other components of equity, while the resulting gain or loss isrecognized in profit or loss. Any investment retained is recognized at fair value.

- 11 -
*SGVFS039491*
ReclassificationsOn September 27, 2019, the Philippine Interpretations Committee (PIC) issued a letter to the variousorganizations in the real estate industry to clarify certain issues in relation to the PFRS 15Implementation Issues and other accounting issues affecting real estate industry. The letter includesthe clarification on the conclusion of PIC Q&A 2018-12D Step 3 on the recording of contract asset forthe difference between the consideration received from the customer and the transferred goods orservices to a customer. In the letter, the PIC would allow for the meantime, the recording of thedifference between the consideration received from the customer and the transferred goods orservices to a customer as either a contract asset or unbilled receivable. If presented as contractasset, the disclosures required under PFRS 15 should be complied with. Otherwise, the disclosuresrequired under PFRS 9 should be followed.
As a result, ALI Group elected to record in 2019 the difference between the consideration receivedfrom the customer and the transferred goods or services to a customer as installment contractsreceivable which differs from the 2018 presentation where the difference was recognized as acontract asset.
Accordingly, the affected assets and liabilities accounts of ALI Group as of December 31, 2018 havebeen reclassified to conform with the 2019 presentation of accounts. Details as follows:
(In thousand pesos)As previously reported
December 31,2018 Reclassification
As restatedDecember 31,
2018
Current assetsAccounts and notes receivable P=78,245,866 P=48,473,011 P=126,718,877Contract assets 48,473,011 (48,473,011) −
Noncurrent assetsNoncurrent accounts and notes receivable 3,367,890 35,437,047 38,804,937Noncurrent contract assets 35,437,047 (35,437,047) −
Current liabilitiesDeposits and other current liabilities − 21,874,681 21,874,681Contract liabilities 21,874,681 (21,874,681) −
Noncurrent liabilitiesDeposits and other noncurrent liabilities − 8,630,235 8,630,235Contract liabilities - net of current portion 8,630,235 (8,630,235) −
P=196,028,730 P=− P=196,028,730
As the restatements have no significant impact on ALI Group’s total assets, total liabilities and totalequity as of January 1, 2018, management believes that the presentation of the consolidatedstatements of financial position as at beginning of the earliest period presented is not necessary.
The reclassification did not impact the consolidated statement of cash flows as of December 31,2018.
Changes in Accounting Policies and DisclosuresAdoption of New and Amended Accounting Standards and InterpretationsThe accounting policies adopted in the preparation of the consolidated financial statements areconsistent with those of the previous financial years except for the new PFRS, amended PFRS andimprovements to PFRS which were adopted beginning January 1, 2019. The nature and the impactof each new standard and amendment are described below:
· PFRS 16, Leases
PFRS 16 supersedes PAS 17, Leases, Philippine Interpretation IFRIC 4, Determining Whether anArrangement Contains a Lease, Philippine Interpretation SIC-15, Operating Leases-Incentivesand Philippine Interpretation SIC-27, Evaluating the Substance of Transactions Involving theLegal Form of a Lease. The standard sets out the principles for the recognition, measurement,presentation and disclosure of leases and requires lessees to recognize most leases on thebalance sheet.

- 12 -
*SGVFS039491*
Lessor accounting under PFRS 16 is substantially unchanged from today’s accounting underPAS 17. Lessors will continue to classify all leases using the same classification principle as inPAS 17 and distinguish between two types of leases: operating and finance leases. PFRS 16 didnot have an impact for leases where the Group is the lessor. Unlike lessors, the Group as lesseeis required to recognize right-of-use assets and lease liabilities.
As a lessee, the Group adopted PFRS 16 using the modified retrospective approach upon
adoption of PFRS 16 in 2019 and elected to apply the standard to contracts that were previously
identified as leases applying PAS 17 and Philippine Interpretation IFRIC-4. Under the modified
retrospective approach, the Group recognized right-of-use asset based on its carrying amount as
if PFRS 16 had always been applied while the lease liability is recognized at date of adoption,
January 1, 2019. The difference between the right-of-use asset and lease liability is recognized
in the beginning Retained Earnings as at January 1, 2019.
The Group has lease contracts for land, building, warehouses and various items of plant,
machinery, vehicles and other equipment. Before the adoption of PFRS 16, the Group classified
each of its leases (as lessee) at the inception date as either a finance lease or an operating
lease. Refer to the accounting policy for leases prior to January 1, 2019.
Except for short-term leases and leases of low-value assets, upon adoption of PFRS 16, the
Group applied a single recognition and measurement approach for all leases. The standard
provides specific transition requirements and practical expedients, which has been applied by the
Group.
The effect of the adoption of PFRS 16 to the consolidated statement of financial position as atJanuary 1, 2019 is as follows (in thousands):
Increase(decrease)
AssetsRight-of-use assets P=18,532,733Other current assets (135,463)Investment properties 888,774Investment in associate and joint venture 104,078Other noncurrent assets (862,479)Deferred tax assets 3,426,774
P=21,954,417
LiabilitiesLease liabilities P=21,564,084Accounts payable and accrued expenses (303,932)Other noncurrent liabilities (2,468,712)Deferred tax liabilities 3,506,216
22,297,656
EquityRetained earnings (343,239)
P=21,954,417
Lease previously classified as finance leases
The Group did not change the initial carrying amounts of recognized assets and liabilities at the
date of initial application for leases previously classified as finance leases (i.e., the right-of-use
assets and lease liabilities equal the lease assets and liabilities recognized under PAS 17). The
requirements of PFRS 16 were applied to these leases from January 1, 2019.

- 13 -
*SGVFS039491*
Leases previously accounted for as operating leases
The Group recognized right-of-use assets and lease liabilities for those leases previously
classified as operating leases, except for short-term leases and leases of low-value assets. The
right-of-use assets for most were recognized based on the carrying amount as if the standard had
always been applied, apart from the use of incremental borrowing rate at the date of initial
application. In some leases, the right-of-use assets were recognized based on the amount equal
to the lease liabilities, adjusted for any related prepaid and accrued lease payments previously
recognized. Lease liabilities were recognized based on the present value of the remaining lease
payments, discounted using the incremental borrowing rate at the date of initial application.
The Group also applied the available practical expedients wherein it:
· Used discount rates to a portfolio of leases with reasonably similar characteristics
· Relied on its assessment of whether leases are onerous immediately before the date of initialapplication
· Applied the short-term leases exemptions to leases with lease term that ends within12 months of the date of initial application
· Excluded the initial direct costs from the measurement of the right-of-use asset at the date ofinitial application
· Used hindsight in determining the lease term where the contract contained options to extendor terminate the lease
Based on the above, as at January 1, 2019:
· Right-of-use assets of P=18,532.73 million were recognized and presented separately in the
consolidated statement of financial position.
· Lease liabilities of P=21,564.08 million were recognized.
· Other current assets of P=135.46 million related to previous operating leases arising from
straight-lining under PAS 17 were derecognized.
· Leasehold rights and asset retirement obligation (ARO) asset under other noncurrent assets
of P=843.09 million and P=19.39 million, respectively, were derecognized.
· Construction in progress under investment properties of P=888.77 million was recognized
· Accrued expenses under accounts and other payables and other noncurrent liabilities of
P=303.93 million and P=2,468.71 million, respectively, related to previous operating leases
arising from straight-lining under PAS 17 were derecognized.
· Deferred tax assets and liabilities increased by P=3,426.77 million and P=3,506.22 million,
respectively, because of the deferred tax impact of the changes in assets and liabilities.
· The net effect of these adjustments had been adjusted to retained earnings (P=343.24 million)
The lease liability as at January 1, 2019 can be reconciled to the operating lease commitments as
of 31 December 2018 follows:
Operating lease commitments as at December 31, 2018 P=46,113,530Weighted average incremental borrowing rate at 1 January 2019 7.14%Discounted operating lease commitments at January 1, 2019 20,633,091Add: Commitments relating to lease previously classified as finance
lease 11,579Lease payments relating to renewal periods not included in operating
lease commitments as at December 31, 2018 924,112Less: Operating lease commitments as at December 31, 2018 (4,698)
Lease liabilities recognized at January 1, 2019 P=21,564,084
Due to the adoption of PFRS 16, the Group’s operating profit in 2019 has improved, while its
interest expense has increased. This is due to the change in the accounting for rent expense
related to leases that were classified as operating leases under PAS 17.

- 14 -
*SGVFS039491*
· Philippine Interpretation IFRIC-23, Uncertainty over Income Tax Treatments
The interpretation addresses the accounting for income taxes when tax treatments involveuncertainty that affects the application of PAS 12, Income Taxes, and does not apply to taxes orlevies outside the scope of PAS 12, nor does it specifically include requirements relating tointerest and penalties associated with uncertain tax treatments.
The interpretation specifically addresses the following:
§ Whether an entity considers uncertain tax treatments separately§ The assumptions an entity makes about the examination of tax treatments by taxation
authorities§ How an entity determines taxable profit (tax loss), tax bases, unused tax losses, unused tax
credits and tax rates§ How an entity considers changes in facts and circumstances
The entity is required to determine whether to consider each uncertain tax treatment separately ortogether with one or more other uncertain tax treatments and use the approach that betterpredicts the resolution of the uncertainty. The entity shall assume that the taxation authority willexamine amounts that it has a right to examine and have full knowledge of all related informationwhen making those examinations. If an entity concludes that it is not probable that the taxationauthority will accept an uncertain tax treatment, it shall reflect the effect of the uncertainty foreach uncertain tax treatment using the method the entity expects to better predict the resolutionof the uncertainty.
Upon adoption of the Interpretation, the Group has assessed whether it has any uncertain taxposition. The Group applies significant judgement in identifying uncertainties over its income taxtreatments. The Group determined, based on assessment, in consultation with its tax counsel,that it is probable that its income tax treatments will be accepted by the taxation authorities.Accordingly, the interpretation did not have an impact on the consolidated financial statements ofthe Group.
· Amendments to PFRS 9, Prepayment Features with Negative Compensation
Under PFRS 9, a debt instrument can be measured at amortized cost or at fair value throughother comprehensive income, provided that the contractual cash flows are ‘solely payments ofprincipal and interest (SPPI) on the principal amount outstanding’ (the SPPI criterion) and theinstrument is held within the appropriate business model for that classification. The amendmentsto PFRS 9 clarify that a financial asset passes the SPPI criterion regardless of the event orcircumstance that causes the early termination of the contract and irrespective of which partypays or receives reasonable compensation for the early termination of the contract.
These amendments had no impact on the consolidated financial statements of the Group.
· Amendments to PAS 19, Employee Benefits, Plan Amendment, Curtailment or Settlement
The amendments to PAS 19 address the accounting when a plan amendment, curtailment orsettlement occurs during a reporting period. The amendments specify that when a planamendment, curtailment or settlement occurs during the annual reporting period, an entity isrequired to:
§ Determine current service cost for the remainder of the period after the plan amendment,curtailment or settlement, using the actuarial assumptions used to remeasure the net definedbenefit liability (asset) reflecting the benefits offered under the plan and the plan assets afterthat event

- 15 -
*SGVFS039491*
§ Determine net interest for the remainder of the period after the plan amendment, curtailmentor settlement using: the net defined benefit liability (asset) reflecting the benefits offeredunder the plan and the plan assets after that event; and the discount rate used to remeasurethat net defined benefit liability (asset).
The amendments also clarify that an entity first determines any past service cost, or a gain or losson settlement, without considering the effect of the asset ceiling. This amount is recognized inprofit or loss. An entity then determines the effect of the asset ceiling after the plan amendment,curtailment or settlement. Any change in that effect, excluding amounts included in the netinterest, is recognized in other comprehensive income.
The amendments had no impact on the consolidated financial statements of the Group as it didnot have any plan amendments, curtailments, or settlements during the period.
· Amendments to PAS 28, Long-term Interests in Associates and Joint Ventures
The amendments clarify that an entity applies PFRS 9 to long-term interests in an associate orjoint venture to which the equity method is not applied but that, in substance, form part of the netinvestment in the associate or joint venture (long-term interests). This clarification is relevantbecause it implies that the expected credit loss model in PFRS 9 applies to such long-terminterests.
The amendments also clarified that, in applying PFRS 9, an entity does not take account of anylosses of the associate or joint venture, or any impairment losses on the net investment,recognized as adjustments to the net investment in the associate or joint venture that arise fromapplying PAS 28, Investments in Associates and Joint Ventures.
The amendments had no impact on the consolidated financial statements as the Group does not
have long-term interests in its associate and joint venture.
· Annual Improvements to PFRSs 2015-2017 Cycle
• Amendments to PFRS 3, Business Combinations, and PFRS 11, Joint Arrangements,Previously Held Interest in a Joint OperationThe amendments clarify that, when an entity obtains control of a business that is a jointoperation, it applies the requirements for a business combination achieved in stages, includingremeasuring previously held interests in the assets and liabilities of the joint operation at fairvalue. In doing so, the acquirer remeasures its entire previously held interest in the jointoperation.
A party that participates in, but does not have joint control of, a joint operation might obtainjoint control of the joint operation in which the activity of the joint operation constitutes abusiness as defined in PFRS 3. The amendments clarify that the previously held interests inthat joint operation are not remeasured.
An entity applies those amendments to business combinations for which the acquisition date ison or after the beginning of the first annual reporting period beginning on or after January 1,2019 and to transactions in which it obtains joint control on or after the beginning of the firstannual reporting period beginning on or after January 1, 2019, with early application permitted.
These amendments had no impact on the consolidated financial statements of the Group as
there is no transaction where joint control is obtained.

- 16 -
*SGVFS039491*
• Amendments to PAS 12, Income Tax Consequences of Payments on Financial InstrumentsClassified as EquityThe amendments clarify that the income tax consequences of dividends are linked moredirectly to past transactions or events that generated distributable profits than to distributionsto owners. Therefore, an entity recognizes the income tax consequences of dividends in profitor loss, other comprehensive income or equity according to where the entity originallyrecognized those past transactions or events.
An entity applies those amendments for annual reporting periods beginning on or afterJanuary 1, 2019, with early application is permitted. These amendments are not relevant tothe Group because dividends declared by the Group do not give rise to tax obligations underthe current tax laws.
• Amendments to PAS 23, Borrowing Costs, Borrowing Costs Eligible for Capitalization
The amendments clarify that an entity treats as part of general borrowings any borrowingoriginally made to develop a qualifying asset when substantially all of the activities necessaryto prepare that asset for its intended use or sale are complete.
An entity applies those amendments to borrowing costs incurred on or after the beginning ofthe annual reporting period in which the entity first applies those amendments. An entityapplies those amendments for annual reporting periods beginning on or after January 1, 2019,with early application permitted.
The Group does not expect any effect on its consolidated financial statements.
• IFRIC Agenda Decision on Over Time Transfer of Constructed Goods (PAS 23)
In March 2019, the Interpretations Committee of the IASB issued IFRIC Update summarizingthe decisions reached by the Committee in its public meetings. The March 2019 IFRICUpdate includes the Committee’s Agenda Decision on the capitalization of borrowing cost onover time transfer of constructed goods. The IFRIC Agenda Decision clarified whetherborrowing cost may be capitalized in relation to the construction of a residential multi-unit realestate development (building) which are sold to customers prior to start of construction orcompletion of the development. Under the March 2019 IFRIC Update, the Committee clarifiedthat the related assets that might be recognized in the Group’s financial statements (i.e.,installment contract receivable, contract asset, or inventory) will not qualify as a qualifyingasset and the corresponding borrowing cost may no longer capitalized.
On February 21, 2020 the SEC issued SEC Memorandum Circular No. 4, Series of 2020,which provides relief to the real estate industry by deferring the implementation of the IFRICAgenda Decision on Over Time Transfer of Constructed Goods (PAS 23 – Borrowing Cost)until December 31, 2020.
The Group does not expect any effect on its consolidated financial statements as they arealready aligned with the provisions of PAS 23.

- 17 -
*SGVFS039491*
New standards and interpretations that have been issued but are not yet effectivePronouncements issued but not yet effective are listed below. Unless otherwise indicated, the Groupdoes not expect the future adoption of the said pronouncements to have a significant impact on itsconsolidated financial statements. The Group intends to adopt the following pronouncements whenthey become effective.
Effective beginning on or after January 1, 2020
· Amendments to PFRS 3, Definition of a Business
The amendments to PFRS 3 clarify the minimum requirements to be a business, remove theassessment of a market participant’s ability to replace missing elements, and narrow thedefinition of outputs. The amendments also add guidance to assess whether an acquiredprocess is substantive and add illustrative examples. An optional fair value concentration test isintroduced which permits a simplified assessment of whether an acquired set of activities andassets is not a business.
An entity applies those amendments prospectively for annual reporting periods beginning on orafter January 1, 2020, with earlier application permitted.
These amendments will apply on future business combinations of the Group.
· Amendments to PAS 1, Presentation of Financial Statements, and PAS 8, Accounting Policies,Changes in Accounting Estimates and Errors, Definition of Material
The amendments refine the definition of material in PAS 1 and align the definitions used acrossPFRSs and other pronouncements. They are intended to improve the understanding of theexisting requirements rather than to significantly impact an entity’s materiality judgements.
An entity applies those amendments prospectively for annual reporting periods beginning on orafter January 1, 2020, with earlier application permitted.
Effective beginning on or after January 1, 2021
· PFRS 17, Insurance Contracts
PFRS 17 is a comprehensive new accounting standard for insurance contracts coveringrecognition and measurement, presentation and disclosure. Once effective, PFRS 17 will replacePFRS 4, Insurance Contracts. This new standard on insurance contracts applies to all types ofinsurance contracts (i.e., life, non-life, direct insurance and re-insurance), regardless of the typeof entities that issue them, as well as to certain guarantees and financial instruments withdiscretionary participation features. A few scope exceptions will apply.
The overall objective of PFRS 17 is to provide an accounting model for insurance contracts that ismore useful and consistent for insurers. In contrast to the requirements in PFRS 4, which arelargely based on grandfathering previous local accounting policies, PFRS 17 provides acomprehensive model for insurance contracts, covering all relevant accounting aspects. Thecore of PFRS 17 is the general model, supplemented by:
• A specific adaptation for contracts with direct participation features (the variable feeapproach)
• A simplified approach (the premium allocation approach) mainly for short-duration contractsPFRS 17 is effective for reporting periods beginning on or after January 1, 2021, withcomparative figures required. Early application is permitted.
The Group is assessing the quantitative impact of PFRS 17 as of reporting date.

- 18 -
*SGVFS039491*
Deferred Effectivity
· Amendments to PFRS 10, Consolidated Financial Statements, and PAS 28, Sale or Contributionof Assets between an Investor and its Associate or Joint Venture
The amendments address the conflict between PFRS 10 and PAS 28 in dealing with the loss ofcontrol of a subsidiary that is sold or contributed to an associate or joint venture. Theamendments clarify that a full gain or loss is recognized when a transfer to an associate or jointventure involves a business as defined in PFRS 3. Any gain or loss resulting from the sale orcontribution of assets that does not constitute a business, however, is recognized only to theextent of unrelated investors’ interests in the associate or joint venture.
On January 13, 2016, the Financial Reporting Standards Council deferred the original effectivedate of January 1, 2016 of the said amendments until the International Accounting StandardsBoard (IASB) completes its broader review of the research project on equity accounting that mayresult in the simplification of accounting for such transactions and of other aspects of accountingfor associates and joint ventures.
The Group is currently assessing the impact of adopting these amendments.
Current versus Noncurrent ClassificationThe Group presents assets and liabilities in the consolidated statement of financial position based ona current and noncurrent classification. An asset is current when it is:
· Expected to be realized or intended to be sold or consumed in normal operating cycle;
· Held primarily for the purpose of trading;
· Expected to be realized within twelve months after the reporting period; or,
· Cash or cash equivalent, unless restricted from being exchanged or used to settle a liability for atleast twelve months after the reporting period.
All other assets are classified as noncurrent.
A liability is current when:
· It is expected to be settled in normal operating cycle;
· It is held primarily for the purpose of trading;
· It is due to be settled within twelve months after the reporting period; or,
· There is no unconditional right to defer the settlement of the liability for at least twelve monthsafter the reporting period.
All other liabilities are classified as noncurrent.
Deferred tax assets and liabilities are classified as noncurrent assets and liabilities.
Cash and Cash EquivalentsCash includes cash on hand and in banks. Cash equivalents are short-term, highly liquid investmentsthat are readily convertible to known amounts of cash with original maturities of three months or lessfrom dates of acquisition and which are subject to an insignificant risk of changes in value.
Short-term InvestmentsShort-term investments are short-term placements with maturities of more than three months but lessthan one year from the date of acquisition. These earn interest at the respective short-terminvestment rates.

- 19 -
*SGVFS039491*
Financial InstrumentsFor all periods up to and including the year ended December 31, 2017, the Group accounted forfinancial instruments under PAS 39, Financial Instruments: Recognition and Measurement. For theyears ended December 31, 2019 and 2018, the Group accounted for financial instruments inaccordance with PFRS 9, Financial Instruments.
A financial instrument is any contract that gives rise to a financial asset of one entity and a financialliability or equity instrument of another entity.
Financial instruments prior to January 1, 2018Date of recognitionThe Group recognizes a financial asset or a financial liability in the consolidated statement of financialposition when it becomes a party to the contractual provisions of the instrument. Purchases or salesof financial assets that require delivery of assets within the time frame established by regulation orconvention in the marketplace are recognized on the settlement date. In the case of derivatives, theGroup follows trade date accounting.
Initial recognition of financial instrumentsAll financial assets and financial liabilities are recognized initially at fair value. Except for financialinstruments at FVTPL, the initial measurement of financial instruments includes transaction costs.The Group classifies its financial assets in the following categories: financial assets at FVTPL, loansand receivables, held-to-maturity (HTM) investments and AFS financial assets. The Group alsoclassifies its financial liabilities into financial liabilities at FVTPL and other financial liabilities. Theclassification depends on the purpose for which the investments were acquired and whether they arequoted in an active market.
The Group determines the classification of its financial instruments at initial recognition and, whereallowed and appropriate, re-evaluates such designation at every reporting date.
Financial instruments are classified as liability or equity in accordance with the substance of thecontractual arrangement. Interest, dividends, gains and losses relating to a financial instrument or acomponent that is a financial liability, are reported as expense or income. Distributions to holders offinancial instruments classified as equity are charged directly to equity, net of any related income taxbenefits.
‘Day 1’ differenceWhere the transaction price in a non-active market is different from the fair value from otherobservable current market transactions in the same instrument or based on a valuation techniquewhose variables include only data from observable market, the Group recognizes the differencebetween the transaction price and fair value (a ‘Day 1’ difference) in the consolidated statement ofincome under “Interest income” or “Interest and other financing charges” unless it qualifies forrecognition as some other type of asset or liability. In cases where use is made of data which is notobservable, the difference between the transaction price and model value is only recognized in theconsolidated statement of income when the inputs become observable or when the instrument isderecognized. For each transaction, the Group determines the appropriate method of recognizing the‘Day 1’ difference amount.
Financial assets and financial liabilities at FVTPLFinancial assets and financial liabilities at FVTPL include derivatives, financial assets and financialliabilities held for trading and financial assets and financial liabilities designated upon initialrecognition as at FVTPL.

- 20 -
*SGVFS039491*
Financial assets and financial liabilities are classified as held for trading if they are acquired for thepurpose of selling or repurchasing in the near term. Derivatives, including separated embeddedderivatives, are also classified as held for trading unless they are designated as effective hedginginstruments or a financial guarantee contract. Fair value gains or losses on investments held fortrading, net of interest income or expense accrued on these assets, are recognized in theconsolidated statement of income under “Other income” or “Other charges”. Interest earned orincurred is recorded in “Interest income” or “Interest and other financing charges” while dividendincome is recorded in “Other income” when the right to receive payment has been established.
Where a contract contains one or more embedded derivatives, the hybrid contract may be designatedas financial asset or financial liability at FVTPL, except where the embedded derivative does notsignificantly modify the cash flows or it is clear that separation of the embedded derivative isprohibited.
Financial assets and financial liabilities may be designated at initial recognition as at FVTPL if any ofthe following criteria are met:(i) the designation eliminates or significantly reduces the inconsistent treatment that would otherwise
arise from measuring the assets or liabilities or recognizing gains or losses on them on a differentbasis; or
(ii) the assets or liabilities are part of a group of financial assets, financial liabilities or both which aremanaged and their performance evaluated on a fair value basis, in accordance with adocumented risk management or investment strategy; or
(iii) the financial instrument contains an embedded derivative that would need to be separatelyrecorded.
The Group’s financial assets and financial liabilities at FVTPL pertain to government securities, otherinvestment securities, derivatives not designated as accounting hedges and embedded derivatives.Derivative instruments (including bifurcated embedded derivatives) are initially recognized at fairvalue on the date in which a derivative transaction is entered into or bifurcated, and are subsequentlyremeasured at fair value. Any gains or losses arising from changes in fair value of derivatives that donot qualify for hedge accounting are taken directly to the consolidated statement of income.Derivatives are carried as assets when the fair value is positive and as liabilities when the fair value isnegative.
The Group uses derivative instruments such as structured currency options and currency forwards tohedge its risks associated with foreign currency fluctuations. Such derivative instruments provideeconomic hedges under the Group’s policies but are not designated as accounting hedges.
An embedded derivative is separated from the host contract and accounted for as a derivative if all ofthe following conditions are met: a) the economic characteristics and risks of the embeddedderivative are not closely related to the economic characteristics and risks of the host contract; b) aseparate instrument with the same terms as the embedded derivative would meet the definition of aderivative; and c) the hybrid or combined instrument is not recognized at FVTPL.
The Group assesses whether embedded derivatives are required to be separated from the hostcontracts when the Group first becomes a party to the contract. Reassessment of embeddedderivatives is only done when there are changes in the contract that significantly modifies thecontractual cash flows that otherwise would be required under the contract.
Loans and receivablesLoans and receivables are non-derivative financial assets with fixed or determinable payments thatare not quoted in an active market. They are not entered into with the intention of immediate or short-term resale and are not designated as AFS financial assets or financial asset at FVTPL. Thisaccounting policy relates to the consolidated statement of financial position captions “Cash and cashequivalents”, “Short-term investments” and “Accounts and notes receivable” (except for Advances tocontractors and suppliers).

- 21 -
*SGVFS039491*
After initial measurement, loans and receivables are subsequently measured at amortized cost usingthe effective interest rate method, less any allowance for impairment losses. Amortized cost iscalculated by taking into account any discount or premium on acquisition and fees that are integralparts of the effective interest rate. Gains and losses are recognized in the consolidated statement ofincome when the loans and receivables are derecognized or impaired, as well as through theamortization process. The amortization is included in the “Interest income” account in theconsolidated statement of income. The losses arising from impairment of such loans and receivablesare recognized under “Provision for doubtful accounts” in the consolidated statement of income.
Loans and receivables are included in current assets if maturity is within 12 months or when theGroup expects to realize or collect within 12 months from the reporting date. Otherwise, they areclassified as noncurrent assets.
AFS financial assetsAFS financial assets are those which are designated as such or do not qualify to be classified asdesignated at FVTPL, HTM, or loans and receivables.
Financial assets may be designated at initial recognition as AFS if they are purchased and heldindefinitely, and may be sold in response to liquidity requirements or changes in market conditions.
After initial measurement, AFS financial assets are measured at fair value. The unrealized gains orlosses arising from the fair valuation of AFS financial assets are recognized in other comprehensiveincome and are reported as “Net unrealized gain (loss) on available-for-sale financial assets” (net oftax where applicable) in equity. The Group’s share in its associates’ or joint ventures’ net unrealizedgain (loss) on AFS is likewise included in this account.
When the security is disposed of, the cumulative gain or loss previously recognized in equity isrecognized in the consolidated statement of income under “Other income” or “Other charges”. Wherethe Group holds more than one investment in the same security, the cost is determined using theweighted average method. Interest earned on AFS financial assets is reported as interest incomeusing the effective interest rate. Dividends earned are recognized under “Other income” in theconsolidated statement of income when the right to receive payment is established. The lossesarising from impairment of such investments are recognized under “Provision for impairment losses”in the consolidated statement of income.
When the fair value of AFS financial assets cannot be measured reliably because of lack of reliableestimates of future cash flows and discount rates necessary to calculate the fair value of unquotedequity instruments, these investments are carried at cost, less any allowance for impairment losses.
The Group’s AFS financial assets pertain to investments in debt and equity securities included in“Investments in bonds and other securities” under “Other noncurrent assets” in the consolidatedstatement of financial position. AFS financial assets are included under “Other current assets” ifexpected to be realized within 12 months from reporting date.
Other financial liabilitiesIssued financial instruments or their components, which are not designated at FVTPL are classifiedas other financial liabilities where the substance of the contractual arrangement results in the Grouphaving an obligation either to deliver cash or another financial asset to the holder, or to satisfy theobligation other than by the exchange of a fixed amount of cash or another financial asset for a fixednumber of its own equity shares. The components of issued financial instruments that contain bothliability and equity elements are accounted for separately, with the equity component being assignedthe residual amount, after deducting from the instrument as a whole the amount separatelydetermined as the fair value of the liability component on the date of issue.

- 22 -
*SGVFS039491*
After initial measurement, other financial liabilities are subsequently measured at amortized costusing the effective interest rate method. Amortized cost is calculated by taking into account anydiscount or premium on the issue and fees that are an integral part of the effective interest rate. Anyeffects of restatement of foreign currency-denominated liabilities are recognized in the consolidatedstatement of income.
This accounting policy applies primarily to the Group’s short-term and long-term debt, accountspayable and accrued expenses, and other current and noncurrent liabilities and obligations that meetthe above definition (other than liabilities covered by other accounting standards, such as income taxpayable).
Other financial liabilities are included in current liabilities if maturity is within 12 months or when theGroup expects to realize or collect within 12 months from the reporting date. Otherwise, they areclassified as noncurrent liabilities.
Exchangeable bondsThe exchangeable bond is classified as a compound instrument and accounted for using splitaccounting. The value allocated to the equity component at initial recognition is the residual amountafter deducting the fair value of the liability component from the issue proceeds of the exchangeablebonds. Transaction costs incurred in relation to the issuance of the exchangeable bonds wasapportioned between the liability and equity component based on their values at initial recognition.
Subsequently, the liability component is carried at amortized cost using the effective interest ratemethod while the equity component is not revalued. When the conversion option is exercised, thecarrying amount of the liability and equity component is derecognizes and their balances transferredto equity. No gain or loss is recognized upon exercise of the conversion option.
The difference between the liability, the equity conversion option, and the non-controlling interest islodged under Equity Reserve.
Deposits, retentions payable and customers’ guaranty and other depositsDeposits, retentions payable and customers’ deposits and other deposits are initially measured at fairvalue. After initial recognition, these are subsequently measured at amortized cost using the effectiveinterest rate method. The difference between the cash received and its fair value is deferred(included in the “Deferred credits” account in the consolidated statement of financial position).Deposits are amortized using the straight-line method with the amortization included under the“Rendering of services” account in the consolidated statement of income while customers’ guarantyand other deposits are amortized over the remaining concession period with the amortization includedunder “Interest and other financing charges” in the consolidated statement of income.
Derecognition of Financial Assets and LiabilitiesFinancial assetA financial asset (or, where applicable, a part of a financial asset or part of a group of financialassets) is derecognized where:
· the rights to receive cash flows from the assets have expired;
· the Group retains the right to receive cash flows from the asset, but has assumed an obligation topay them in full without material delay to a third-party under a “pass-through” arrangement; or
· the Group has transferred its right to receive cash flows from the asset and either (a) hastransferred substantially all the risks and rewards of the asset, or (b) has neither transferred norretained the risks and rewards of the asset but has transferred control of the asset.
Where the Group has transferred its rights to receive cash flows from an asset or has entered into apass-through arrangement, and has neither transferred nor retained substantially all the risks andrewards of the asset nor transferred control of the asset, the asset is recognized to the extent of theGroup’s continuing involvement in the asset. Continuing involvement that takes the form of aguarantee over the transferred asset is measured at the lower of the original carrying amount of theasset and the maximum amount of consideration that the Group could be required to repay.

- 23 -
*SGVFS039491*
Financial liabilityA financial liability is derecognized when the obligation under the liability is discharged or cancelled orhas expired. Where an existing financial liability is replaced by another from the same lender onsubstantially different terms, or the terms of an existing liability are substantially modified, such anexchange or modification is treated as a derecognition of the original liability and the recognition of anew liability, and the difference in the respective carrying amounts is recognized in the consolidatedstatement of income.
Impairment of Financial AssetsThe Group assesses at each reporting date whether there is objective evidence that a financial assetor group of financial assets is impaired. A financial asset or a group of financial assets is deemed tobe impaired if, and only if, there is objective evidence of impairment as a result of one or more eventsthat has occurred after the initial recognition of the asset (an incurred ‘loss event’) and that loss event(or events) has an impact on the estimated future cash flows of the financial asset or the group offinancial assets that can be reliably estimated. Evidence of impairment may include indications thatthe borrower or a group of borrowers is experiencing significant financial difficulty, default ordelinquency in interest or principal payments, the probability that they will enter bankruptcy or otherfinancial reorganization and where observable data indicate that there is measurable decrease in theestimated future cash flows, such as changes in arrears or economic conditions that correlate withdefaults.
Loans and receivablesFor loans and receivables carried at amortized cost, the Group first assesses whether objectiveevidence of impairment exists individually for financial assets that are individually significant, orcollectively for financial assets that are not individually significant. If the Group determines that noobjective evidence of impairment exists for an individually assessed financial asset, whethersignificant or not, it includes the asset in a group of financial assets with similar credit riskcharacteristics and collectively assesses for impairment. Those characteristics are relevant to theestimation of future cash flows for groups of such assets by being indicative of the debtors’ ability topay all amounts due according to the contractual terms of the assets being evaluated. Assets thatare individually assessed for impairment and for which an impairment loss is, or continues to be,recognized are not included in a collective assessment for impairment.
If there is objective evidence that an impairment loss has been incurred, the amount of the loss ismeasured as the difference between the asset’s carrying amount and the present value of estimatedfuture cash flows (excluding future credit losses that have not been incurred) discounted at thefinancial asset’s original effective interest rate (i.e., the effective interest rate computed at initialrecognition). The carrying amount of the asset is reduced through the use of an allowance accountand the amount of the loss is charged to the consolidated statement of income under “Provision fordoubtful accounts”. Interest income continues to be recognized based on the original effectiveinterest rate of the asset. Loans and receivables, together with the associated allowance accounts,are written off when there is no realistic prospect of future recovery and all collateral has beenrealized. If, in a subsequent period, the amount of the estimated impairment loss decreases becauseof an event occurring after the impairment was recognized, the previously recognized impairment lossis reversed. Any subsequent reversal of an impairment loss is recognized in consolidated statementof income, to the extent that the carrying value of the asset does not exceed its amortized cost at thereversal date.
For the purpose of a collective evaluation of impairment, financial assets are grouped on the basis ofsuch credit risk characteristics such as customer type, payment history, past-due status and term.

- 24 -
*SGVFS039491*
Future cash flows in a group of financial assets that are collectively evaluated for impairment areestimated on the basis of historical loss experience for assets with credit risk characteristics similar tothose in the group. Historical loss experience is adjusted on the basis of current observable data toreflect the effects of current conditions that did not affect the period on which the historical lossexperience is based and to remove the effects of conditions in the historical period that do not existcurrently. The methodology and assumptions used for estimating future cash flows are reviewedregularly by the Group to reduce any differences between loss estimates and actual loss experience.
Financial assets carried at costIf there is an objective evidence that an impairment loss has been incurred on an unquoted equityinstrument that is not carried at fair value because its fair value cannot be reliably measured, or onderivative asset that is linked to and must be settled by delivery of such an unquoted equityinstrument, the amount of the loss is measured as the difference between the carrying amount andthe present value of estimated future cash flows discounted at the current market rate of return for asimilar financial asset.
AFS financial assetsIn the case of equity investments classified as AFS financial assets, impairment would include asignificant or prolonged decline in the fair value of the investments below its cost. “Significant” is tobe evaluated against the original cost of the investment and “prolonged” against the period in whichthe fair value has been below its original cost. Where there is evidence of impairment loss, thecumulative loss - measured as the difference between the acquisition cost and the current fair value,less any impairment loss on that financial asset previously recognized in the consolidated statementof income - is removed from other comprehensive income and recognized in the consolidatedstatement of income under “Other charges.” Impairment losses on equity investments are notreversed through the consolidated statement of income. Increases in fair value after impairment arerecognized directly in the consolidated statement of comprehensive income.
In the case of debt instruments classified as AFS, impairment is assessed based on the same criteriaas financial assets carried at amortized cost. Future interest income is based on the reduced carryingamount and is accrued using the rate of interest used to discount future cash flows for the purpose ofmeasuring impairment loss and is recorded as part of “Interest income” account in the consolidatedstatement of income. If, in a subsequent year, the fair value of a debt instrument increased and theincrease can be objectively related to an event occurring after the impairment loss was recognized inthe consolidated statement of income, the impairment loss is reversed through the consolidatedstatement of income.
Offsetting Financial InstrumentsFinancial assets and financial liabilities are offset and the net amount reported in the consolidatedstatement of financial position if, and only if, there is a currently enforceable legal right to offset therecognized amounts and there is an intention to settle on a net basis, or to realize the asset and settlethe liability simultaneously.
Financial instruments beginning January 1, 2018Initial recognition and measurementFinancial assets are classified, at initial recognition, as subsequently measured at amortized cost, fairvalue through other comprehensive income (OCI), and fair value through profit or loss.
The classification of financial assets at initial recognition depends on the financial asset’s contractualcash flow characteristics and the Group’s business model for managing them. With the exception oftrade receivables that do not contain a significant financing component or for which the Group hasapplied the practical expedient, the Group initially measures a financial asset at its fair value plus, inthe case of a financial asset not at fair value through profit or loss, transaction costs. Tradereceivables, except for installment contract receivables, are measured at the transaction pricedetermined under PFRS 15. Refer to the accounting policies under revenue from contracts withcustomers.

- 25 -
*SGVFS039491*
In order for a financial asset to be classified and measured at amortized cost or fair value throughOCI, it needs to give rise to cash flows that are ‘solely payments of principal and interest (SPPI)’ onthe principal amount outstanding. This assessment is referred to as the SPPI test and is performedat an instrument level.
The Group’s business model for managing financial assets refers to how it manages its financialassets in order to generate cash flows. The business model determines whether cash flows willresult from collecting contractual cash flows, selling the financial assets, or both.
Purchases or sales of financial assets that require delivery of assets within a time frame establishedby regulation or convention in the market place (regular way trades) are recognized on the trade date,i.e., the date that the Group commits to purchase or sell the asset.
Subsequent measurementFor purposes of subsequent measurement, financial assets are classified in four categories:
· Financial assets at amortized cost (debt instruments)
· Financial assets at fair value through OCI with recycling of cumulative gains and losses (debtinstruments)
· Financial assets designated at fair value through OCI with no recycling of cumulative gains andlosses upon derecognition (equity instruments)
· Financial assets at fair value through profit or loss
Financial assets at amortized cost (debt instruments)This category is the most relevant to the Group. The Group measures financial assets at amortizedcost if both of the following conditions are met:
· The financial asset is held within a business model with the objective to hold financial assets inorder to collect contractual cash flows; and
· The contractual terms of the financial asset give rise on specified dates to cash flows that aresolely payments of principal and interest on the principal amount outstanding.
Financial assets at amortized cost are subsequently measured using the effective interest (EIR)method and are subject to impairment. Gains and losses are recognized in profit or loss when theasset is derecognized, modified or impaired.
The Group’s financial assets at amortized cost includes cash and cash equivalents, short-terminvestments, and accounts and notes receivables (except advances to contractors and suppliers).
Financial assets at fair value through OCI (debt instruments)The Group measures debt instruments at fair value through OCI if both of the following conditions aremet:
· The financial asset is held within a business model with the objective of both holding to collectcontractual cash flows and selling; and
· The contractual terms of the financial asset give rise on specified dates to cash flows that aresolely payments of principal and interest on the principal amount outstanding.
For debt instruments at fair value through OCI, interest income, foreign exchange revaluation andimpairment losses or reversals are recognized in the consolidated statement of income and computedin the same manner as for financial assets measured at amortized cost. The remaining fair valuechanges are recognized in OCI. Upon derecognition the cumulative fair value change recognized inOCI is recycled to profit or loss.
As of December 31, 2019 and 2018, the Group does not have financial assets at fair value throughOCI (debt instrument).

- 26 -
*SGVFS039491*
Financial assets designated at fair value through OCI (equity instruments)Upon initial recognition, the Group can elect to classify irrevocably its equity investments as equityinstruments designated at fair value through OCI when they meet the definition of equity underPAS 32, Financial Instruments: Presentation and are not held for trading. The classification isdetermined on an instrument-by-instrument basis.
Gains and losses on these financial assets are never recycled to profit or loss. Dividends arerecognized as other income in the consolidated statement of income when the right of payment hasbeen established, except when the Group benefits from such proceeds as a recovery of part of thecost of the financial asset, in which case, such gains are recorded in OCI. Equity instrumentsdesignated at fair value through OCI are not subject to impairment assessment.
The Group elected to classify irrevocably its listed and unquoted equity investments under thiscategory.
Financial assets at fair value through profit or lossFinancial assets at fair value through profit or loss include financial assets held for trading, financialassets designated upon initial recognition at fair value through profit or loss, or financial assetsmandatorily required to be measured at fair value. Financial assets are classified as held for trading ifthey are acquired for the purpose of selling or repurchasing in the near term. Derivatives, includingseparated embedded derivatives, are also classified as held for trading unless they are designated aseffective hedging instruments. Financial assets with cash flows that are not solely payments ofprincipal and interest are classified and measured at fair value through profit or loss, irrespective ofthe business model. Notwithstanding the criteria for debt instruments to be classified at amortizedcost or at fair value through OCI, as described above, debt instruments may be designated at fairvalue through profit or loss on initial recognition if doing so eliminates, or significantly reduces, anaccounting mismatch.
Financial assets at FVTPL are carried in the consolidated statement of financial position at fair valuewith net changes in fair value recognized in the consolidated statement of income.
This category includes convertible bonds, derivative instruments and equity investments which theGroup had not irrevocably elected to classify at fair value through OCI. Dividends on equityinvestments are also recognized as other income in the consolidated statement of income when theright of payment has been established.
Return of capital is recorded as reduction against the investment account.A derivative embedded in a hybrid contract, with a financial liability or non-financial host, is separatedfrom the host and accounted for as a separate derivative if: the economic characteristics and risks arenot closely related to the host; a separate instrument with the same terms as the embeddedderivative would meet the definition of a derivative; and the hybrid contract is not measured at fairvalue through profit or loss. Embedded derivatives are measured at fair value with changes in fairvalue recognized in profit or loss. Reassessment only occurs if there is either a change in the termsof the contract that significantly modifies the cash flows that would otherwise be required or areclassification of a financial asset out of the fair value through profit or loss category.
A derivative embedded within a hybrid contract containing a financial asset host is not accounted forseparately. The financial asset host together with the embedded derivative is required to beclassified in its entirety as a financial asset at fair value through profit or loss.
DerecognitionA financial asset (or, where applicable, a part of a financial asset or part of a group of similar financialassets) is primarily derecognized (i.e., removed from the Group’s consolidated statement of financialposition) when:
· The rights to receive cash flows from the asset have expired; or

- 27 -
*SGVFS039491*
· The Group has transferred its rights to receive cash flows from the asset or has assumed anobligation to pay the received cash flows in full without material delay to a third party under a‘pass-through’ arrangement; and either (a) the Group has transferred substantially all the risksand rewards of the asset, or (b) the Group has neither transferred nor retained substantially allthe risks and rewards of the asset, but has transferred control of the asset.
When the Group has transferred its rights to receive cash flows from an asset or has entered into apass-through arrangement, it evaluates if, and to what extent, it has retained the risks and rewards ofownership. When it has neither transferred nor retained substantially all of the risks and rewards ofthe asset, nor transferred control of the asset, the Group continues to recognize the transferred assetto the extent of its continuing involvement. In that case, the Group also recognizes an associatedliability. The transferred asset and the associated liability are measured on a basis that reflects therights and obligations that the Group has retained.
Continuing involvement that takes the form of a guarantee over the transferred asset is measured atthe lower of the original carrying amount of the asset and the maximum amount of consideration thatthe Group could be required to repay.
Impairment of financial assetsThe Group recognizes an allowance for expected credit losses (ECLs) for all debt instruments notheld at fair value through profit or loss. ECLs are based on the difference between the contractualcash flows due in accordance with the contract and all the cash flows that the Group expects toreceive, discounted at an approximation of the original effective interest rate. The expected cashflows will include cash flows from the sale of collateral held or other credit enhancements that areintegral to the contractual terms.
For trade receivables, the Group applies a simplified approach in calculating ECLs. Therefore, theGroup does not track changes in credit risk, but instead recognizes a loss allowance based onlifetime ECLs at each reporting date. The Group has established a provision matrix for tradereceivables and a vintage analysis for residential and office development receivables that is based onhistorical credit loss experience, adjusted for forward-looking factors specific to the debtors and theeconomic environment.
For other financial assets such as accrued receivable, receivable from related parties, receivable fromofficers and employees, and advances to other companies, ECLs are recognized in two stages. Forcredit exposures for which there has not been a significant increase in credit risk since initialrecognition, ECLs are provided for credit losses that result from default events that are possible withinthe next 12-months (a 12-month ECL). For those credit exposures for which there has been asignificant increase in credit risk since initial recognition, a loss allowance is required for credit lossesexpected over the remaining life of the exposure, irrespective of the timing of the default (a lifetimeECL).
For cash and cash equivalents and short-term investments, the Group applies the low credit risksimplification. The probability of default and loss given defaults are publicly available and areconsidered to be low credit risk investments. It is the Group’s policy to measure ECLs on suchinstruments on a 12-month basis. However, when there has been a significant increase in credit risksince origination, the allowance will be based on the lifetime ECL. The Group uses the ratings fromStandard and Poor’s (S&P), Moody’s and Fitch to determine whether the debt instrument hassignificantly increased in credit risk and to estimate ECLs.
The Group considers a debt investment security to have low credit risk when its credit risk rating isequivalent to the globally understood definition of ‘investment grade’.
The key inputs in the model include the Group’s definition of default and historical data of three yearsfor the origination, maturity date and default date. The Group considers trade receivables in defaultwhen contractual payment are 90 days past due, except for certain circumstances when the reasonfor being past due is due to reconciliation with customers of payment records which are administrative

- 28 -
*SGVFS039491*
in nature which may extend the definition of default to 90 days and beyond. However, in certaincases, the Group may also consider a financial asset to be in default when internal or externalinformation indicates that the Group is unlikely to receive the outstanding contractual amounts in fullbefore taking into account any credit enhancements held by the Group.
Determining the stage for impairmentAt each reporting date, the Group assesses whether there has been a significant increase in creditrisk for financial assets since initial recognition by comparing the risk of default occurring over theexpected life between the reporting date and the date of initial recognition. The Group considersreasonable and supportable information that is relevant and available without undue cost or effort forthis purpose. This includes quantitative and qualitative information and forward-looking analysis. TheGroup considers that there has been a significant increase in credit risk when contractual paymentsare more than 90 days past due.
An exposure will migrate through the ECL stages as asset quality deteriorates. If, in a subsequentperiod, asset quality improves and also reverses any previously assessed significant increase incredit risk since origination, then the loss allowance measurement reverts from lifetime ECL to12-months ECL.
Financial liabilitiesInitial recognition and measurementFinancial liabilities are classified, at initial recognition, as financial liabilities at fair value through profitor loss, loans and borrowings, payables, or as derivatives designated as hedging instruments in aneffective hedge, as appropriate.
All financial liabilities are recognized initially at fair value and, in the case of loans and borrowings andpayables, net of directly attributable transaction costs.
The Group’s financial liabilities include accounts payable and accrued expenses, short-term debt,long-term debt, other current and non-current liabilities (other than liabilities accrued by otheraccounting standards such as income tax payable, provisions, etc.).
Subsequent measurementThe measurement of financial liabilities depends on their classification, as described below:
Financial liabilities at fair value through profit or lossFinancial liabilities at fair value through profit or loss include financial liabilities held for trading andfinancial liabilities designated upon initial recognition as at fair value through profit or loss.
Financial liabilities are classified as held for trading if they are incurred for the purposes ofrepurchasing in the near term. This category also includes derivative financial instruments enteredinto by the Group that are not designated as hedging instruments in hedge relationships as definedby PFRS 9. Separated embedded derivatives are also classified as held for trading unless they aredesignated as effective hedging instruments.
Gains or losses on liabilities held for trading are recognized in the consolidated statement of income.
Financial liabilities designated upon initial recognition at fair value through profit or loss aredesignated at the initial date of recognition, and only if the criteria in PFRS 9 are satisfied. The Grouphas not designated any financial liability as at fair value through profit or loss.
Loans and borrowingsThis is the category most relevant to the Group. After initial recognition, interest-bearing loans andborrowings are subsequently measured at amortized cost using the EIR method. Gains and lossesare recognized in profit or loss when the liabilities are derecognized as well as through the EIRamortization process.

- 29 -
*SGVFS039491*
Amortized cost is calculated by taking into account any discount or premium on acquisition and feesor costs that are an integral part of the EIR. The EIR amortization is included as interest and otherfinancing charges in the consolidated statement of income.
This category generally applies to interest-bearing loans and borrowings.
Other Financial LiabilitiesIssued financial instruments or their components, which are not designated at FVTPL, are classifiedas accounts payable and accrued expenses where the substance of the contractual arrangementresults in the Group having an obligation either to deliver cash or another financial asset to theholder, or to satisfy the obligation other than by the exchange of a fixed amount of cash or anotherfinancial asset for a fixed number of own equity shares. The components of issued financialinstruments that contain both liability and equity elements are accounted for separately, with theequity component being assigned the residual amount, after deducting from the instrument theamount separately determined as the fair value of the liability component on the date of issue.
After initial measurement, other financial liabilities are subsequently measured at amortized costusing the effective interest rate method. Amortized cost is calculated by taking into account anydiscount or premium on the issue and fees that are an integral part of the effective interest rate. Anyeffect of restatement of foreign currency-denominated liabilities is recognized in profit or loss.
This accounting policy applies to the Group’s accounts payable and accrued expenses, dividendspayables and subscriptions payable (other than liabilities covered by other accounting standards suchas pension liability and income tax payable).
DerecognitionA financial liability is derecognized when the obligation under the liability is discharged or cancelled orhas expired. When an existing financial liability is replaced by another from the same lender onsubstantially different terms, or the terms of an existing liability are substantially modified, such anexchange or modification is treated as the derecognition of the original liability and the recognition ofa new liability. The difference in the respective carrying amounts is recognized in the consolidatedstatement of income.
Offsetting of financial instrumentsFinancial assets and financial liabilities are offset and the net amount is reported in the consolidatedstatement of financial position if there is a currently enforceable legal right to offset the recognizedamounts and there is an intention to settle on a net basis, to realize the assets and settle the liabilitiessimultaneously.
Derivative financial instruments
Initial recognition and subsequent measurementThe Group uses derivative financial instruments, such as forward currency contracts, interest rateswaps and forward commodity contracts, to hedge its foreign currency risks, interest rate risks andcommodity price risks, respectively. Such derivative financial instruments are initially recognized atfair value on the date on which a derivative contract is entered into and are subsequently remeasuredat fair value. Derivatives are carried as financial assets when the fair value is positive and asfinancial liabilities when the fair value is negative.
Financial guarantee contractsFinancial guarantee contracts are recognized initially as a liability at fair value, adjusted fortransaction costs that are directly attributable to the issuance of the guarantee. Subsequent to initialrecognition, financial guarantees are measured at the higher of the amount of expected credit lossdetermined in accordance with the policy set out in Note 33 and the amount initially recognized less,when appropriate, the cumulative amount of income recognized over the period of the guarantee.

- 30 -
*SGVFS039491*
Exchangeable bondsThe exchangeable bond is classified as a compound instrument and accounted for using splitaccounting. The value allocated to the equity component at initial recognition is the residual amountafter deducting the fair value of the liability component from the issue proceeds of the exchangeablebonds. Transaction costs incurred in relation to the issuance of the exchangeable bonds wasapportioned between the liability and equity component based on their values at initial recognition.
Subsequently, the liability component is carried at amortized cost using the effective interest ratemethod while the equity component is not revalued. When the conversion option is exercised, thecarrying amount of the liability and equity component is derecognized and their balances transferredto equity. No gain or loss is recognized upon exercise of the conversion option. The differencebetween the liability, the equity conversion option, and the non-controlling interest is lodged underEquity Reserve.
Deposits, customers’ guaranty and other depositsDeposits, customers’ guaranty and other deposits are initially measured at fair value. After initialrecognition, these are subsequently measured at amortized cost using the effective interest ratemethod. The difference between the cash received and its fair value is deferred (included in the“Deferred credits” account in the consolidated statement of financial position). Deposits areamortized using the straight-line method with the amortization included under the “Costs of renderingof services” account in the consolidated statement of income while customers’ guaranty areamortized over the remaining concession period with the amortization included under “Interest andother financing charges” in the consolidated statement of income.
InventoriesInventories are carried at the lower of cost and net realizable value (NRV). Costs incurred in bringingeach product to its present location and conditions are generally accounted for as follows:
Real estate inventories
· Land cost
· Land improvement cost
· Amounts paid to contractors for construction and development
· Planning and design costs, costs of site preparation, professional fees, property transfer taxes,construction overheads and other related costs
Vehicles - purchase cost on specific identification basis.
Finished goods and work-in-process - determined on a moving average basis; cost includes directmaterials and labor and a proportion of manufacturing overhead costs based on normal operatingcapacity.
Parts and accessories, materials, supplies and others - purchase cost on a moving average basis.NRV for real estate inventories, vehicles, finished goods and work-in-process and parts andaccessories is the estimated selling price in the ordinary course of business, less estimated costs ofcompletion and estimated costs necessary to make the sale, while NRV for materials, supplies andothers represents the related replacement costs. In the event that NRV is lower than cost, the declineshall be recognized as an expense in the consolidated statement of income.
An allowance for inventory losses is provided for slow-moving, obsolete and defective inventoriesbased on management’s physical inspection and evaluation. When inventories are sold, the cost andrelated allowance is removed from the account and the difference is charged against operations.
Prepaid ExpensesPrepaid expenses are carried at cost less the amortized portion. These typically compriseprepayments for marketing fees and advertising and promotion, taxes and licenses, rentals andinsurance.

- 31 -
*SGVFS039491*
Creditable Withholding TaxThis pertains to the tax withheld at source by the Group’s customer and is creditable against theincome tax liability of the Group.
Value-Added Tax (VAT)Expenses and assets are recognized, net of the amount of VAT, except:
· When the VAT incurred on a purchase of assets or services is not recoverable from the taxationauthority, in which case, the VAT is recognized as part of the cost of acquisition of the asset or aspart of the expense item, as applicable.
· When receivables and payables are stated with the amount of VAT included.
The net amount of VAT recoverable from, or payable, to the taxation authority is included as part ofreceivables or payables in the consolidated statement of financial position.
Deposits in EscrowDeposits in escrow pertain to the proceeds from the sale of the Group’s projects that have only beengranted temporary License to Sell (LTS) as of reporting date. These proceeds are deposited in alocal bank and earn interest at prevailing bank deposit rates.
Advances to Contractors and SuppliersAdvances to other companies and advances to contractors and suppliers are carried at cost lessimpairment losses, if any. Prepayments for the construction of investment property and property andequipment are classified as non-current asset while the portion representing prepayments for theconstruction of real estate inventories are reclassified as other current assets.
Noncurrent Assets Held for Sale and Discontinued OperationsNoncurrent assets and disposal groups classified as held for sale are measured at the lower of theircarrying amount and fair value less costs to sell. Costs to sell are the incremental costs directlyattributable to the disposal of an asset (disposal group), excluding finance costs and income taxexpense. At reporting date, the Group classifies non-current assets and disposal groups as held forsale if their carrying amounts will be recovered principally through a sale transaction rather thanthrough continuing use. For this to be the case the asset or disposal group must be available forimmediate sale in its present condition subject only to terms that are usual and customary for sales ofsuch assets and its sale must be highly probable. Actions required to complete the sale shouldindicate that it is unlikely that significant changes to the sale will be made or that the decision to sellwill be withdrawn. Management must be committed to the plan to sell the asset and the sale expectedto be completed within one year from the date of the classification.
Assets and liabilities classified as held for sale are presented separately as current items in theconsolidated statement of financial position.
A disposal group qualifies as discontinued operation if it is a component of an entity that either hasbeen disposed of, or is classified as held for sale, and:
· Represents a separate major line of business or geographical area of operations
· Is part of a single co-ordinated plan to dispose of a separate major line of business orgeographical area of operations or
· Is a subsidiary acquired exclusively with a view to resale.
Discontinued operations are excluded from the results of continuing operations and are presented asa single amount as profit or loss after tax from discontinued operations in the consolidated statementof profit or loss.
The related results of operations of the disposal group that qualified as discontinued operation areseparated from continuing operations and prior years’ consolidated statements of income have beenrestated.

- 32 -
*SGVFS039491*
Investments in Associates and Joint VenturesAn associate is an entity over which the Group has significant influence. Significant influence is thepower to participate in the financial and operating policy decisions of the investee, but is not control orjoint control over those policies.
A joint venture is a type of joint arrangement whereby the parties that have joint control of thearrangement have rights to the net assets of the joint venture. Joint control is the contractuallyagreed sharing of control of an arrangement, which exists only when decisions about the relevantactivities require unanimous consent of the parties sharing control.
The considerations made in determining significant influence or joint control are similar to thosenecessary to determine control over subsidiaries.
The Group’s investments in associates and joint ventures are accounted for using the equity method.Under the equity method, the investment in associates or joint ventures is initially recognized at cost.The carrying amount of the investment is adjusted to recognize changes in the Group’s share of netassets of the associate or joint venture since the acquisition date. Goodwill relating to the associateor joint venture is included in the carrying amount of the investment and is neither amortized norindividually tested for impairment.
The consolidated statement of income reflects the Group’s share of the results of operations of theassociate or joint venture. Any change in OCI of these investees is presented as part of the Group’sOCI. In addition, when there has been a change recognized directly in the equity of the associate orjoint venture, the Group recognizes its share of any changes, when applicable, in the consolidatedstatement of changes in equity. Unrealized gains and losses resulting from transactions between theGroup and the associate or joint venture are eliminated to the extent of the interest in the associate orjoint venture.
If the Group’s share of losses of an associate or a joint venture equals or exceeds its interest in theassociate or joint venture, the Group discontinues recognizing its share of further losses. The interestin an associate or joint venture is the carrying amount of the investment or joint venture determinedusing the equity method together with any long-term interest that in substance forms part of theGroup’s net investment in associate or joint venture. After the Group’s interest is reduced to zero,additional losses are provided for, and a liability is recognized, only to the extent that the Group hasincurred legal or constructive obligation or made payments in behalf of the associate of joint venture.If the associate or joint venture subsequently reports profits, the Group resumes recognizing its shareof their profits only after its share of the profit equals the share of loss not recognized.
The aggregate of the Group’s share in net profits or loss of associates and joint ventures is shown onthe face of the consolidated statement of income and represents profit or loss after tax and non-controlling interests in the subsidiaries of the associate or joint venture.
The financial statements of the associate or joint venture are prepared for the same reporting periodas the Group. When necessary, adjustments are made to bring the accounting policies in line withthose of the Group.
After application of the equity method, the Group determines whether it is necessary to recognize animpairment loss on its investment in its associate or joint venture. At each reporting date, the Groupdetermines whether there is objective evidence that the investment in the associate or joint venture isimpaired. If there is such evidence, the Group calculates the amount of impairment as the differencebetween the recoverable amount of the associate or joint venture and its carrying value, thenrecognizes the loss as “Share in net profits of associates and joint ventures” in the consolidatedstatement of income.

- 33 -
*SGVFS039491*
Upon loss of significant influence over the associate or joint control over the joint venture, the Groupmeasures and recognizes any retained investment at its fair value. Any difference between thecarrying amount of the associate or joint venture upon loss of significant influence or joint control andthe fair value of the retained investment and proceeds from disposal is recognized in profit or loss.
Investment PropertiesInvestment properties comprise completed property and property under construction orre-development that are held to earn rentals and for capital appreciation, and are not occupied by thecompanies in the Group. The Group uses the cost model in measuring investment properties sincethis represents the historical value of the properties subsequent to initial recognition. Investmentproperties, except for land, are carried at cost less accumulated depreciation and amortization andany impairment in value. Land is carried at cost less any impairment in value.
Expenditures incurred after the investment property has been put in operation, such as repairs andmaintenance are normally charged against income in the period in which the costs are incurred.
Construction-in-progress (including borrowing cost) are carried at cost and transferred to the relatedinvestment property account when the construction and related activities to prepare the property forits intended use are complete, and the property is ready for occupation.
Depreciation and amortization are computed using the straight-line method over the estimated usefullives of the assets, regardless of utilization. The estimated useful lives and the depreciation andamortization method are reviewed periodically to ensure that the period and method of depreciationand amortization are consistent with the expected pattern of economic benefits from items ofinvestment properties.
The estimated useful lives of investment properties follow:
Land improvements 8 to 40 yearsBuildings 20 to 40 years
Investment properties are derecognized when either they have been disposed of or when theinvestment property is permanently withdrawn from use and no future economic benefit is expectedfrom its disposal. Any gain or loss on the retirement or disposal of an investment property isrecognized in the consolidated statement of income in the year of retirement or disposal.
Transfers are made to investment property when there is a change in use, evidenced by ending ofowner-occupation, commencement of an operating lease to another party or ending of construction ordevelopment. Transfers are made from investment property when, and only when, there is a changein use, evidenced by commencement of owner-occupation or commencement of development with aview to sale. Transfers between investment property, owner-occupied property and inventories donot change the carrying amount of the property transferred and they do not change the cost of theproperty for measurement or for disclosure purposes.
The Group discloses the fair values of its investment properties in accordance with PAS 40. TheGroup engaged independent valuation specialist to assess fair value as at December 31, 2019 and2018. The Group’s investment properties consist of land and building pertaining to land properties,retail (malls) and office properties. These were valued by reference to market-based evidence usingcomparable prices adjusted for specific market factors such as nature, location and condition of theproperty.
Property, Plant and EquipmentProperty, plant and equipment, except for land, are carried at cost less accumulated depreciation andamortization and any impairment in value. Land is carried at cost less any impairment in value. Theinitial cost of property, plant and equipment consists of its construction cost or purchase price and anydirectly attributable costs of bringing the property, plant and equipment to its working condition andlocation for its intended use.

- 34 -
*SGVFS039491*
Construction-in-progress is stated at cost. This includes cost of construction and other direct costs.Construction-in-progress is not depreciated or amortized until such time that the relevant assets arecompleted and put into operational use.
Major repairs are capitalized as part of property, plant and equipment only when it is probable thatfuture economic benefits associated with the item will flow to the Group and the cost of the items canbe measured reliably. All other repairs and maintenance are charged against current operations asincurred.
Depreciation and amortization of property, plant and equipment commences once the property, plantand equipment are available for use and computed on a straight-line basis over the estimated usefullives of the property, plant and equipment as follows:
Buildings and improvements 20 to 40 yearsPlant, machinery and equipment 5 to 25 yearsHotel property and equipment 20 to 50 yearsFurniture, fixtures and equipment 3 to 10 yearsTransportation equipment 3 to 5 years
The assets’ residual values, useful lives and depreciation and amortization methods are reviewedperiodically to ensure that the amounts, periods and method of depreciation and amortization areconsistent with the expected pattern of economic benefits from items of property, plant andequipment.
When property, plant and equipment are retired or otherwise disposed of, the cost and the relatedaccumulated depreciation and amortization and accumulated provision for impairment losses, if any,are removed from the accounts and any resulting gain or loss is credited to or charged againstcurrent operations.
Service Concession ArrangementsIntangible Asset ModelThe Group accounts for its concession arrangements with Department of Public Works and Highways(DPWH), Metropolitan Waterworks and Sewerage System (MWSS), Provincial Government ofLaguna (PGL), Tourism Infrastructure and Enterprise Zone Authority (TIEZA) and Clark DevelopmentCorporation (CDC), Obando Water District (OWD), and Calasiao Water District (CWD) under theIntangible Asset model as the Group receives the right (license) to charge users of public service.Under the Group’s concession agreements, the Group is granted the sole and exclusive right anddiscretion during the concession period to manage, occupy, operate, repair, maintain, decommissionand refurbish the identified facilities required to provide the public water services. The legal title tothese assets shall remain with DPWH, MWSS, PGL, TIEZA, CDC, OWD and CWD at the end of theconcession period.
The “Service concession assets” (SCA) pertain to the fair value of the service concession obligationsat drawdown date and construction costs related to the rehabilitation works performed by the Groupand other local component costs and cost overruns paid by the Group.
Amortization of SCA commences once the SCA are available for use and are calculated on a straight-line basis over the remaining concession period. Beginning May 1, 2017, the SCA of MWC, BoracayIsland Water Company (BIWC), Clark Water Corporation (CWC), and Laguna AAA Water Corporation(LAWC) are amortized using the units of production (UOP) method over the expected total billablevolume for the remaining concession period to better reflect the usage of the SCA, which is directlyrelated to its expected total billable volume and is aligned with industry practice. This change inmethod resulted to a P=554.0 million reduction of amortization expense from May 1 to December 31,2017.

- 35 -
*SGVFS039491*
In addition, the Parent Company, MWC, LAWC, BIWC, CWC, Obando Water Company, Inc. (ObandoWater), Calasiao Water Company, Inc. (Calasiao Water), Cebu Manila Water Development, Inc.(CMWDI), and Tagum Water Company, Inc. (TWC) recognize and measure revenue fromrehabilitation works in accordance with PAS 11, Construction Contracts, and PAS 18, Revenue, forthe services it performs. Recognition of revenue is by reference to the ‘stage of completion method,’also known as the ‘percentage of completion method’ as provided under PAS 11. Contract revenueand costs from rehabilitation works are recognized as “Revenue from rehabilitation works” and “Costof rehabilitation works,” respectively, in profit or loss in the period in which the work is performed.
The Parent Company recognizes its contractual obligations to restore certain parts of theinfrastructure to a specified level of condition in accordance with PAS 37, Provisions, ContingentLiabilities and Contingent Assets, as the obligations arise.
Financial Asset ModelOn the other hand, the concession arrangement with the Department of Transportation (DOTr),Provincial Government of Cebu (PGC) and Tagum Water District (TWD) are accounted for under theFinancial Asset model as it has an unconditional contractual right to receive cash or other financialasset for its construction services from or at the direction of the grantor. Under the concessionarrangement with PGC and TWD, Cebu Manila Water Development, Inc. (CMWD) and TWC, bothsubsidiaries of MWC, are awarded the right to deliver bulk water supply to the grantor for a specificperiod of time under the concession period. The concession agreement with DOTr qualifies underthe Financial Asset model as Arca South Integrated Terminal Inc. (ASITI), a subsidiary of ALI, has anunconditional contractual right to receive cash or other financial assets (i.e., the Annual GrantorPayment) for its construction, operating and maintenance services directly from DOTr.
Under this model, the operator recognizes a financial asset in its consolidated statement of financialposition in consideration for the services it provides (design, construction, etc.). Such financial assetsare recognized in the consolidated statement of financial position under “Other current assets” and“Other noncurrent assets” in an amount corresponding to the fair value of the infrastructure on firstrecognition and subsequently at amortized cost. The receivable is settled when payments from thegrantor are received. The financial income calculated on the basis of the effective interest rate isrecognized in profit or loss.
Intangible AssetsIntangible assets acquired separately are measured on initial recognition at cost. The cost ofintangible assets acquired in a business combination is the fair value as at the date of acquisition.Subsequently, intangible assets are measured at cost less accumulated amortization and provisionfor impairment loss, if any. Internally generated intangible assets, excluding capitalized developmentcosts, are not capitalized and expenditure is reflected in the consolidated statement of income in theyear in which the expenditure is incurred.
The estimated useful life of intangible assets is assessed as either finite or indefinite.
The estimated useful lives of intangible assets with finite lives are assessed at the individual assetlevel. Intangible assets with finite lives are amortized over their estimated useful lives on a straightline basis. Periods and method of amortization for intangible assets with finite useful lives arereviewed annually or earlier when an indicator of impairment exists.
The estimated useful lives of intangible assets follow:
Leasehold rights 20 to 23 yearsCustomer relationships 5 yearsUnpatented technology / intellectual properties 5 yearsDeveloped software 3 yearsLicenses 3 yearsTechnical service agreement 3 yearsTrademarks 3 to 5 years

- 36 -
*SGVFS039491*
Changes in the expected useful life or the expected pattern of consumption of future economicbenefits embodied in the asset is accounted for by changing the amortization period or method, asappropriate, and are treated as changes in accounting estimates. The amortization expense onintangible assets with finite lives is recognized in the consolidated statement of income in theexpense category consistent with the function of the intangible assets.
Intangible assets with indefinite useful lives are not amortized, but are tested for impairment annually,either individually or at the CGU level. The assessment of indefinite useful life is reviewed annually todetermine whether the indefinite useful life continues to be supportable. If not, the change in usefullife from indefinite to finite is made on a prospective basis.
A gain or loss arising from derecognition of an intangible asset is measured as the differencebetween the net disposal proceeds and the carrying amount of the intangible assets and isrecognized in the consolidated statement of income when the intangible asset is derecognized.
Research and development costsResearch costs are expensed as incurred. Development expenditures on an individual project arerecognized as an intangible asset under “Project Development Cost” when the Group candemonstrate:
· The technical feasibility of completing the intangible asset so that the asset will be available foruse or sale;
· Its intention to complete and its ability to use or sell the asset;
· How the asset will generate future economic benefits;
· The availability of resources to complete the asset;
· The ability to measure reliably the expenditure during development; and,
· The ability to use the intangible asset generated.
Following initial recognition of the development expenditure as an asset, the asset is carried at costless any accumulated amortization and accumulated impairment losses. Amortization of the assetbegins when development is complete and the asset is available for use. It is amortized over theperiod of expected future benefit. The estimated useful life of research and development costs is 5years. During the period of development, the asset is tested for impairment annually.
Leases effective January 1, 2019The Group assesses at contract inception whether a contract is, or contains, a lease. That is, if thecontract conveys the right to control the use of an identified asset for a period of time in exchange forconsideration.
Group as a lesseeExcept for short-term leases and leases of low-value assets, the Group applies a single recognitionand measurement approach for all leases. The Group recognises lease liabilities to make leasepayments and right-of-use assets representing the right to use the underlying assets.
i) Right-of-use assetsThe Group recognizes right-of-use assets at the commencement date of the lease (i.e., the date theunderlying asset is available for use). Right-of-use assets are measured at cost, less anyaccumulated depreciation and impairment losses, and adjusted for any remeasurement of leaseliabilities. The cost of right-of-use assets includes the amount of lease liabilities recognized, initialdirect costs incurred, and lease payments made at or before the commencement date less any leaseincentives received and estimate of costs to be incurred by the lessee in dismantling and removingthe underlying asset, restoring the site on which it is located or restoring the underlying asset to thecondition required by the terms and conditions of the lease, unless those costs are incurred toproduce inventories. Unless the Group is reasonably certain to obtain ownership of the leased asset

- 37 -
*SGVFS039491*
at the end of the lease term, the recognized right-of-use assets are depreciated on a straight-linebasis over the shorter of its estimated useful life and the lease term as follow:
Land, building and improvements 10-50 yearsTransportation equipment 3-10 yearsOthers 5 years
Right-of-use assets are subject to impairment. Refer to the accounting policies in Impairment of non-financial assets section.
ii) Lease liabilitiesAt the commencement date of the lease, the Group recognizes lease liabilities measured at thepresent value of lease payments to be made over the lease term. The lease payments include fixedpayments (including in-substance fixed payments) less any lease incentives receivable, variablelease payments that depend on an index or a rate, and amounts expected to be paid under residualvalue guarantees. The lease payments also include the exercise price of a purchase optionreasonably certain to be exercised by the Group and payments of penalties for terminating a lease, ifthe lease term reflects the Group exercising the option to terminate. The variable lease paymentsthat do not depend on an index or a rate are recognized as expense in the period on which the eventor condition that triggers the payment occurs.
In calculating the present value of lease payments, the Group uses the incremental borrowing rate atthe lease commencement date if the interest rate implicit in the lease is not readily determinable.After the commencement date, the amount of lease liabilities is increased to reflect the accretion ofinterest and reduced for the lease payments made. In addition, the carrying amount of lease liabilitiesis remeasured if there is a modification, a change in the lease term, a change in the in-substancefixed lease payments or a change in the assessment to purchase the underlying asset.
iii) Short-term leases and leases of low-value assetsThe Group applies the short-term lease recognition exemption to its short-term leases (i.e., thoseleases that have a lease term of 12 months or less from the commencement date and do not containa purchase option). It also applies the lease of low-value assets recognition exemption to leases thatare considered of low value as defined in the accounting policies of subsidiaries. Lease payments onshort-term leases and leases of low-value assets are recognized as expense on a straight-line basisover the lease term.
Group as a lessorLeases in which the Group does not transfer substantially all the risks and rewards incidental toownership of an asset are classified as operating leases. Rental income is accounted on a straightlinebasis over the lease term and is included in revenue in the consolidated statement of income due toits operating nature. Initial direct costs incurred in negotiating and arranging an operating lease areadded to the carrying amount of the leased asset and recognised over the lease term on the samebasis as rental income. Contingent rents are recognized as revenue in the period in which they areearned.
For the years ended December 31, 2018 and 2017, leases are accounted for as follows:
Leases prior to adoption of PFRS 16The determination of whether an arrangement is, or contains a lease is based on the substance of thearrangement at inception date of whether the fulfillment of the arrangement is dependent on the useof a specific asset or assets or the arrangement conveys a right to use the asset. A reassessment ismade after inception of the lease only if one of the following applies: (a) there is a change incontractual terms, other than a renewal or extension of the arrangement; (b) a renewal option isexercised or extension granted, unless the term of the renewal or extension was initially included inthe lease term; (c) there is a change in the determination of whether fulfillment is dependent on aspecified asset; or (d) there is a substantial change to the asset.

- 38 -
*SGVFS039491*
Where a reassessment is made, lease accounting shall commence or cease from the date when thechange in circumstances gave rise to the reassessment for scenarios (a), (c) or (d) and at the date ofrenewal or extension period for scenario (b).
Group as lesseeLeases where the lessor retains substantially all the risks and benefits of ownership of theconsolidated asset are classified as operating leases. Fixed lease payments are recognized as anexpense in the consolidated statement of income on a straight-line basis while the variable rent isrecognized as an expense based on terms of the lease contract.
Finance leases, which transfer substantially all the risks and benefits incidental to ownership of theleased item, are capitalized at the inception of the lease at the fair value of the leased property or, iflower, at the present value of the minimum lease payments. Lease payments are apportionedbetween the finance charges and reduction of the lease liability so as to achieve a constant rate ofinterest on the remaining balance of the liability. Finance charges are charged directly againstincome.
Capitalized leased assets are depreciated over the shorter of the estimated useful lives of the assetsor the respective lease terms.
Group as lessorLeases where the Group does not transfer substantially all the risks and benefits of ownership of theassets are classified as operating leases. Lease payments received are recognized as income in theconsolidated statement of income on a straight-line basis over the lease term. Initial direct costsincurred in negotiating operating leases are added to the carrying amount of the leased asset andrecognized over the lease term on the same basis as the rental income. Contingent rent isrecognized as revenue in the period in which it is earned.
Business Combinations and GoodwillBusiness combinations are accounted for using the acquisition method. The cost of an acquisition ismeasured as the aggregate of the consideration transferred, measured at acquisition date fair valueand the amount of any non-controlling interest in the acquiree. For each business combination, theacquirer measures the non-controlling interest in the acquiree either at fair value or at theproportionate share of the acquiree’s identifiable net assets. Acquisition costs are expensed asincurred.
When the Group acquires a business, it assesses the financial assets and liabilities assumed forappropriate classification and designation in accordance with the contractual terms, economiccircumstances and pertinent conditions as at the acquisition date. This includes the separation ofembedded derivatives in host contracts by the acquiree.
If the business combination is achieved in stages, the acquisition date fair value of the acquirer’spreviously held equity interest in the acquiree is remeasured to fair value at the acquisition date andincluded under “Remeasurement gain/loss arising from business combination” in the consolidatedstatement of income.
Any contingent consideration to be transferred by the acquirer will be recognized at fair value at theacquisition date. Subsequent changes to the fair value of the contingent consideration which isdeemed to be an asset or liability will be recognized in accordance with PAS 39 either in profit or lossor as a change to other comprehensive income. If the contingent consideration is classified as equity,it should not be remeasured until it is finally settled within equity.
Goodwill is initially measured at cost being the excess of the aggregate of the considerationtransferred and the amount recognized for non-controlling interest over the net identifiable assetsacquired and liabilities assumed. If this consideration is lower than the fair value of the net assets ofthe subsidiary acquired, the difference is recognized in profit or loss as bargain purchase gain. TheGroup reassess whether it has correctly identified all of the assets acquired and all of the liabilities

- 39 -
*SGVFS039491*
assumed and reviews the procedures used to measure amounts to be recognized at the acquisitiondate if the reassessment still results in an excess of the fair value of net assets acquired over theaggregate consideration transferred, then the gain is recognized in profit or loss.
After initial recognition, goodwill is measured at cost less any accumulated impairment loss. Goodwillis reviewed for impairment, annually or more frequently if events or changes in circumstancesindicate that the carrying value may be impaired. For purposes of impairment testing, goodwillacquired in a business combination is, from the acquisition date, allocated to each of the Group’scash-generating units (CGUs), or groups of CGUs, that are expected to benefit from the synergies ofthe combination, irrespective of whether other assets or liabilities of the Group are assigned to thoseunits or groups of units.
Each unit or group of units to which the goodwill is allocated should:
· represent the lowest level within the Group at which the goodwill is monitored for internalmanagement purposes; and
· not be larger than an operating segment determined in accordance with PFRS 8, OperatingSegments.
Impairment is determined by assessing the recoverable amount of the CGU (or group of CGUs), towhich the goodwill relates. Where the recoverable amount of the CGU (or group of CGUs) is lessthan the carrying amount, an impairment loss is recognized. Where goodwill forms part of a CGU (orgroup of CGUs) and part of the operation within that unit is disposed of, the goodwill associated withthe operation disposed of is included in the carrying amount of the operation when determining thegain or loss on disposal of the operation. Goodwill disposed of in these circumstances is measuredbased on the relative values of the operation disposed of and the portion of the CGU retained. If theacquirer’s interest in the net fair value of the identifiable assets, liabilities and contingent liabilitiesexceeds the cost of the business combination, the acquirer shall recognize immediately in theconsolidated statement of income any excess remaining after reassessment.
If the initial accounting for a business combination can be determined only provisionally by the end ofthe period in which the combination is effected because either the fair values to be assigned to theacquiree’s identifiable assets, liabilities or contingent liabilities or the cost of the combination can bedetermined only provisionally, the acquirer shall account for the combination using those provisionalvalues. The acquirer shall recognize any adjustments to those provisional values as a result ofcompleting the initial accounting within twelve months of the acquisition date as follows: (i) thecarrying amount of the identifiable asset, liability or contingent liability that is recognized or adjustedas a result of completing the initial accounting shall be calculated as if its fair value at the acquisitiondate had been recognized from that date; (ii) goodwill or any gain recognized shall be adjusted by anamount equal to the adjustment to the fair value at the acquisition date of the identifiable asset,liability or contingent liability being recognized or adjusted; and (iii) comparative information presentedfor the periods before the initial accounting for the combination is complete shall be presented as ifthe initial accounting has been completed from the acquisition date.
Combinations of Entities Under Common ControlBusiness combinations of entities under common control are accounted for using the pooling ofinterests method. The pooling of interests method generally involve the following:
· The assets and liabilities of the combining entities are reflected in the consolidated financialstatements at their carrying amounts. No adjustments are made to reflect fair values, orrecognize any new assets or liabilities, at the date of the combination. The only adjustments thatare made are those adjustments to harmonize accounting policies.
· No new goodwill is recognized as a result of the combination. The only goodwill that isrecognized is any existing goodwill relating to either of the combining entities. Any differencebetween the consideration paid or transferred and the equity acquired is reflected within equity.

- 40 -
*SGVFS039491*
· The consolidated statement of income reflects the results of the combining entities for the fullyear, irrespective of when the combination took place.
· Comparative financial information are presented as if the entities had always been combined.
The effects of any intercompany transactions are eliminated to the extent possible.
Asset AcquisitionsIf the assets acquired and liabilities assumed in an acquisition transaction do not constitute abusiness as defined under PFRS 3, the transaction is accounted for as an asset acquisition. TheGroup identifies and recognizes the individual identifiable assets acquired (including those assets thatmeet the definition of, and recognition criteria for, intangible assets) and liabilities assumed. Theacquisition cost is allocated to the individual identifiable assets and liabilities on the basis of theirrelative fair values at the date of purchase. Such transaction or event does not give rise to goodwill.Where the Group acquires a controlling interest in an entity that is not a business, but obtains lessthan 100% of the entity, after it has allocated the cost to the individual assets acquired, it notionallygrosses up those assets and recognizes the difference as non-controlling interests.
Water RightsWater rights are accounted for as an intangible asset with indefinite useful life. These pertain to thepermit acquired separately, and are recognized as an intangible asset as these were issued by theNational Water Resources Board (NWRB) without an explicit provision on the period of effectivity.Costs incurred for the acquisition of water rights are capitalized and measured on initial recognition atcost.
Presidential Decree No. 1067, also known as the Water Code, states that water permits shallcontinue to be valid as long as water is beneficially used. The rights may be suspended or revokedbased on certain grounds such as non-compliance with approved plans and specifications orschedules of water distribution, and use of water for a purpose other than that for which it wasgranted.
All water permits are subject to modification or cancellation by the NWRB, after due notice andhearing, in favor of a project of greater beneficial use or for multi-purpose development, and a waterpermittee who suffers thereby shall be duly compensated by the entity or person in whose favor thecancellation was made.
Impairment of Nonfinancial AssetsThe Group assesses at each reporting date whether there is an indication that an asset may beimpaired. If any such indication exists, or when annual impairment testing for an asset is required,the Group makes an estimate of the asset’s recoverable amount. An asset’s recoverable amount iscalculated as the higher of the asset’s or CGU’s fair value less costs to sell and its value in use and isdetermined for an individual asset, unless the asset does not generate cash inflows that are largelyindependent of those from other assets or groups of assets. Where the carrying amount of an assetexceeds its recoverable amount, the asset is considered impaired and is written down to itsrecoverable amount. In assessing value in use, the estimated future cash flows are discounted totheir present value using a pre-tax discount rate that reflects current market assessment of the timevalue of money and the risks specific to the asset. In determining fair value less cost to sell, anappropriate valuation model is used. These calculations are corroborated by valuation multiples orother fair value indicators. Impairment losses of continuing operations are recognized in theconsolidated statement of income in those expense categories consistent with the function of theimpaired asset.
For assets excluding goodwill, an assessment is made at each reporting date as to whether there isany indication that previously recognized impairment losses may no longer exist or may havedecreased. If such indication exists, the recoverable amount is estimated. A previously recognizedimpairment loss is reversed only if there has been a change in the estimates used to determine theasset’s recoverable amount since the last impairment loss was recognized. If that is the case, thecarrying amount of the asset is increased to its recoverable amount. That increased amount cannot

- 41 -
*SGVFS039491*
exceed the carrying amount that would have been determined, net of depreciation and amortization,had no impairment loss been recognized for the asset in prior years. Such reversal is recognized inthe consolidated statement of income unless the asset is carried at revalued amount, in which casethe reversal is treated as revaluation increase. After such a reversal, the depreciation andamortization charge is adjusted in future periods to allocate the asset’s revised carrying amount, lessany residual value, on a systematic basis over its remaining useful life.
Investments in associates and joint venturesAfter application of the equity method, the Group determines whether it is necessary to recognize anyadditional impairment loss with respect to the Group’s net investment in the investee company. TheGroup determines at each reporting date whether there is any objective evidence that the investmentin the investee company is impaired. If this is the case, the Group calculates the amount ofimpairment as being the difference between the recoverable amount of the investee company and thecarrying cost and recognizes the amount as a reduction of the “Share in net profits of associates andjoint ventures” account in the consolidated statement of income.
Fair Value MeasurementFair value is the price that would be received to sell an asset or paid to transfer a liability in an orderlytransaction between market participants at the measurement date. The fair value measurement isbased on the presumption that the transaction to sell the asset or transfer the liability takes placeeither:
· In the principal market for the asset or liability; or
· In the absence of a principal market, in the most advantageous market for the asset or liability.
The principal or the most advantageous market must be accessible to by the Group.
The fair value of an asset or a liability is measured using the assumptions that market participantswould use when pricing the asset or liability, assuming that market participants act in their economicbest interest.
The Group uses valuation techniques that are appropriate in the circumstances and for whichsufficient data are available to measure fair value, maximizing the use of relevant observable inputsand minimizing the use of unobservable inputs.
All assets and liabilities for which fair value is measured or disclosed in the consolidated financialstatements are categorized within the fair value hierarchy, described as follows, based on the lowestlevel input that is significant to the fair value measurement as a whole:
· Level 1 – Quoted (unadjusted) market prices in active markets for identical assets and liabilities.
· Level 2 – Valuation techniques for which the lowest level input that is significant to the fair valuemeasurement is directly or indirectly observable.
· Level 3 – Valuation techniques for which the lowest level input that is significant to the fair valuemeasurement is unobservable.
For assets and liabilities that are recognized in the consolidated financial statements on a recurringbasis, the Group determines whether transfers have occurred between Levels in the hierarchy byreassessing categorization (based on the lowest level input that is significant to the fair valuemeasurement as a whole) at the end of each reporting period.
For the purpose of fair value disclosures, the Group has determined classes of assets and liabilitieson the basis of the nature, characteristics and risks of the asset or liability and the level of the fairvalue hierarchy as explained above.

- 42 -
*SGVFS039491*
ProvisionsProvisions are recognized when the Group has a present obligation (legal or constructive) as a resultof a past event, it is probable that an outflow of resources embodying economic benefits will berequired to settle the obligations and a reliable estimate can be made of the amount of the obligation.
Where the Group expects a provision to be reimbursed, the reimbursement is recognized as aseparate asset but only when the reimbursement is virtually certain. If the effect of the time value ofmoney is material, provisions are determined by discounting the expected future cash flows at a pre-tax rate that reflects current market assessments of the time value of money and, where appropriate,the risks specific to the liability. Where discounting is used, the increase in the provision due to thepassage of time is recognized as interest expense. Provisions are reviewed at each reporting dateand adjusted to reflect the current best estimate.
EquityCapital stock is measured at par value for all shares subscribed, issued and outstanding. When theshares are sold at premium, the difference between the proceeds at the par value is credited to“Additional paid-in capital” (APIC) account. Direct costs incurred related to equity issuance arechargeable to APIC account. If APIC is not sufficient, the excess is charged against retainedearnings. When the Group issues more than one class of stock, a separate account is maintained foreach class of stock and the number of shares issued.
Subscriptions receivable pertains to the uncollected portion of the subscribed shares and is presentedas reduction from equity.
Retained earnings represent accumulated earnings of the Group less dividends declared.
Own equity instruments which are reacquired (treasury shares) are recognized at cost and deductedfrom equity. No gain or loss is recognized in the consolidated statement of income on the purchase,sale, issue or cancellation of the Group’s own equity instruments. Any difference between thecarrying amount and the consideration, if reissued, is recognized in additional paid-in capital. Votingrights related to treasury shares are nullified for the Group and no dividends are allocated to themrespectively. When the shares are retired, the capital stock account is reduced by its par value andthe excess of cost over par value upon retirement is debited to additional paid-in capital when theshares were issued and to retained earnings for the remaining balance.
For the Preferred A treasury shares, the amount reflected under treasury stock pertains to par value.
Revenue and Cost RecognitionFor all periods up to and including the year ended December 31, 2017, the Group accounted for itsrevenue in accordance with PAS 11, PAS 18 and related interpretations as follows:
Revenue is recognized to the extent that it is probable that the economic benefits will flow to theGroup and the revenue can be reliably measured, regardless of when payment is being made.Revenue is measured at the fair value of the consideration received or receivable, taking into accountcontractually defined terms of payment and excluding taxes or duty. The following specificrecognition criteria must also be met before revenue is recognized:
Real estate revenue and costsRevenue is recognized to the extent that it is probable that the economic benefits will flow to theGroup and the revenue can be reliably measured.
For real estate sales, the Group assesses whether it is probable that the economic benefits will flowto the Group when the sales prices are collectible. Collectability of the sales price is demonstrated bythe buyer’s commitment to pay, which in turn is supported by substantial initial and continuinginvestments that give the buyer a stake in the property sufficient that the risk of loss through defaultmotivates the buyer to honor its obligation to the seller. Collectability is also assessed by consideringfactors such as the credit standing of the buyer, age and location of the property.

- 43 -
*SGVFS039491*
Revenue from sales of completed real estate projects is accounted for using the full accrual method.In accordance with PIC Q&A No. 2006-01, the percentage-of-completion method is used to recognizeincome from sales of projects where the Group has material obligations under the sales contract tocomplete the project after the property is sold, the equitable interest has been transferred to thebuyer, construction is beyond preliminary stage (i.e., engineering, design work, construction contractsexecution, site clearance and preparation, excavation and the building foundation are finished), andthe costs incurred or to be incurred can be measured reliably. Under this method, revenue isrecognized as the related obligations are fulfilled, measured principally on the basis of the physicalproportion of contract work. The percentage of completion is determined by the Group’s projectengineers.
Any excess of collections over the recognized receivables are included in the “Deposits and othercurrent liabilities” account in the liabilities section of the consolidated statement of financial position.
If any of the criteria under the full accrual or percentage-of-completion method is not met, the depositmethod is applied until all the conditions for recording a sale are met. Pending recognition of sale,cash received from buyers are presented under the “Deposits and other current liabilities” account inthe liabilities section of the consolidated statement of financial position.
Cost of real estate sales is recognized consistent with the revenue recognition method applied and isdetermined with reference to the specific, including estimated costs, on the property allocated to soldarea. Cost of residential and commercial lots and units sold before the completion of thedevelopment is determined on the basis of the acquisition cost of the land plus its full developmentcosts, which include estimated costs for future development works, as determined by the Group’s in-house technical staff.
Estimated development costs include direct land development, shared development cost, buildingcost, external development cost, professional fees, post construction, contingency, miscellaneousand socialized housing. Miscellaneous costs include payments such as permits and licenses,business permits, development charges and claims from third parties which are attributable to theproject. Contingency includes fund reserved for unforeseen expenses and/ or cost adjustments.Revisions in estimated development costs brought about by increases in projected costs in excess ofthe original budgeted amounts are considered as special budget appropriations that are approved bymanagement and are made to form part of total project costs on a prospective basis and allocatedbetween costs of sales and real estate inventories.
Revenue from construction contracts included in the “Real estate” account in the consolidatedstatement of income is recognized using the percentage-of-completion method, based on thecompletion of a physical proportion of the contract work inclusive of the uninstalled goods andmaterials delivered to the site.
Contract costs include all direct materials and labor costs and those indirect costs related to contractperformance. Expected losses on contracts are recognized immediately when it is probable that thetotal contract costs will exceed total contract revenue. Changes in contract performance, contractconditions and estimated profitability, including those arising from contract penalty provisions, andfinal contract settlements which may result in revisions to estimated costs and gross margins arerecognized in the year in which the changes are determined.
Rental income under non-cancellable and cancellable leases on investment properties is recognizedin the consolidated statement of income on a straight-line basis over the lease term and the terms ofthe lease, respectively, or based on a certain percentage of the gross revenue of the tenants, asprovided under the terms of the lease contract.
Rooms revenue from hotel and resort operations is recognized when the services are rendered.
Revenue from banquets and other special events are recognized when the events take place.

- 44 -
*SGVFS039491*
Water and sewer revenueWater and sewer revenue are recognized when the related water and sewerage services arerendered. Water and sewerage are billed every month according to the bill cycles of the customers.As a result of bill cycle cut-off, monthly service revenue earned but not yet billed at end of the monthare estimated and accrued. These estimates are based on historical consumption of the customers.A certain percentage of water revenue is recognized as environmental charges. Other customerrelated fees such as reconnection and disconnection fees are recognized when these services havebeen rendered.
Supervision feesSupervision fees are recognized using the percentage of completion (POC) method of accounting,measured principally on the basis of the physical proportion of the contract work to the estimatedcompletion of a project.
Revenue from pipeworks and integrated used water servicesRevenue from pipeworks and integrated used water services is recognized when the related waterand wastewater network related services are rendered.
Distributors’ feeDistributors’ fee is recognized when significant risk and rewards of ownership of trade assets havebeen transferred to the distributor.
Revenue from packaged waterRevenue from packaged water and other water related products is recognized when the significantrisks and rewards of ownership have been transferred to the customer, recovery of the considerationis probable, the associated costs and possible return of goods can be estimated reliably, and there isno continuing management involvement with the goods where the discount is recognized as areduction of revenue as the sales are recognized.
The timing of transfers of risks and rewards varies depending on the individual terms of the contractof sale but usually occurs when the customer receives the product.
Operation and maintenance servicesService fee income is recognized when the operation, maintenance and management services havebeen rendered for water and waste water facilities of Bonifacio Water Corporation (BWC).
Performance feesPerformance fees are recognized when the non-revenue water reduction (NRW) has been recoveredbased on specific targets and schedule as agreed in the Non-revenue Water Reduction ServiceAgreement (NRWSA) with Zamboanga City Water District (ZCWD).
Service feesService fees for technical assistance extended to ZCWD are recognized when the related serviceshave been rendered.
Other operating incomeOther customer related fees such as connection, reconnection and disconnection fees, income fromcustomers late payments, sale of scrap materials, income from septic sludge disposal, and incomefrom bacteriological water analysis are recognized when these services have been rendered.
Revenue from rehabilitation worksRevenue from rehabilitation works is recognized and measured by the Group in accordance withPAS 11 for the construction and PAS 18 for the service. This includes revenue from rehabilitationworks which is equivalent to the related cost for the rehabilitation works covered by the serviceconcession arrangements which is recognized as part of SCA.

- 45 -
*SGVFS039491*
When the Group provides construction or upgrade services, the consideration received or receivableis recognized at its fair value. The Group accounts for revenue and costs relating to operationservices in accordance with PAS 18.
Toll revenuesRevenue from toll fees is recognized upon entry of vehicles in the toll road facility and receipt of cashpayment. Toll fees received in advance, through transponders or magnetic cards, are included under“Accounts Payable”.
Service RevenueService revenue arises from the provision of delivery services, which include document management,express parcel, freight forwarding and outbound courier services is recognized when the delivery iscompleted.
Revenue from sales of electronic products and vehicles and related parts and accessoriesRevenue from sales of electronic products and vehicles and related parts and accessories arerecognized when the significant risks and rewards of ownership of the goods have passed to thebuyer and the amount of revenue can be measured reliably. Revenue is measured at the fair value ofthe consideration received excluding discounts, returns, rebates and sales taxes.
Energy sales
Energy sales is recognized upon actual delivery of concerted electricity from the 51.9M NorthWind
Renewable Energy Plant (REP) at Bangui Farm and 18MW DC Solar Power Plant of Montesolar at
Bais, Negros Oriental.
The tariff on the generation of REP’s original twenty (20) turbines (Phases I & II) is a Feed-in-Tariff(FIT) rate specific to ACEI of P=5.76/kWh, as approved by the Energy Regulatory Commission (ERC)in its decision dated June 30, 2014. The FIT specific to ACEI is lower than the national FIT and isvalid for twenty (20) years, less the actual years of operation as provided for under the FIT Rules.
The tariff on the new six (6) turbines (Phase III) shall be the national FIT of P=8.53/kWh, subject tocompliance by ACEI of the requirements under the FIT System. Being a new plant and establishedunder the incentives granted under RA 9513, it shall have FIT period of twenty (20) years.
Revenue from sale of electricity through Retail Electricity Supply (RES) Contract is composed ofgeneration charge from monthly energy supply with various contestable customers and is recognizedmonthly based on the actual energy delivered. The basic energy charges for each billing period areinclusive of generation charge and retail supply charge.
Marketing and management feesMarketing fees, management fees from administrative and property management and revenue fromvehicle repairs are recognized when services are rendered.
Revenue from digitizing and document creation servicesRevenue from digitizing and document creation services are recognized when the service iscompleted and electronically sent to the customer. Provision for discounts and other adjustments areprovided for in the same period the related sales are recorded.
Tuition and other school feesTuition and other school fees are recognized over the period of instruction. Tuition and other schoolfees collected during the year that are applicable in the next school year are deferred and presentedunder the “Others” account in the Other Noncurrent Liabilities section of the consolidated statement offinancial position.
Interest incomeInterest income is recognized as it accrues using the effective interest method.

- 46 -
*SGVFS039491*
Dividend incomeDividend income is recognized when the right to receive payment is established.
For the years ended December 31, 2019 and 2018, the Group accounted for its revenue underPFRS 15, Revenue from Contracts with Customers, as follow:
ALI Group’s Revenue from Contracts with CustomersThe Group primarily derives its real estate revenue from the sale of vertical and horizontal real estateprojects. Revenue from contracts with customers is recognized when control of the goods or servicesare transferred to the customer at an amount that reflects the consideration to which the Groupexpects to be entitled in exchange for those goods or services. The Group has generally concludedthat it is the principal in its revenue arrangements, except for the provisioning of water, electricity,air-conditioning and common use service area in its mall retail spaces, wherein it is acting as agent.
The disclosures of significant accounting judgments, estimates and assumptions relating to revenuefrom contracts with customers are provided in Note 4.
Real estate salesThe Group derives its real estate revenue from sale of lots, house and lot and condominium units.Revenue from the sale of these real estate projects under pre-completion stage are recognized overtime during the construction period (or percentage of completion) since based on the terms andconditions of its contract with the buyers, the Group’s performance does not create an asset with analternative use and the Group has an enforceable right to payment for performance completed todate.
In measuring the progress of its performance obligation over time, the Group uses the output method.The Group recognizes revenue on the basis of direct measurements of the value to customers of thegoods or services transferred to date, relative to the remaining goods or services promised under thecontract. Progress is measured using survey of performance completed to date. This is based on themonthly project accomplishment report prepared by the project engineers as approved by theconstruction manager which integrates the surveys of performance to date of the constructionactivities for both sub-contracted and those that are fulfilled by the developer itself.
Any excess of progress of work over the right to an amount of consideration that is unconditional,recognized as trade receivables under residential and office development receivables account.Any excess of collections over the total of recognized trade receivables is included in the “customerdeposit” account in the liabilities section of the consolidated statement of financial position. Theimpact of the significant financing component on the transaction price has not been considered sincethe Group availed the relief granted by the SEC under Memorandum Circular Nos. 14-2018 as of2018 for the implementation issued of PFRS 15 affecting the real estate industry.
Cost recognitionThe Group recognizes costs relating to satisfied performance obligations as these are incurred takinginto consideration the contract fulfillment assets such as land and connection fees. These includecosts of land, land development costs, building costs, professional fees, depreciation, permits andlicenses and capitalized borrowing costs. These costs are allocated to the saleable area, with theportion allocable to the sold area being recognized as costs of sales while the portion allocable to theunsold area being recognized as part of real estate inventories.
In addition, the Group recognizes as an asset only costs that give rise to resources that will be usedin satisfying performance obligations in the future and that are expected to be recovered.
Rental income under non-cancellable and cancellable leases on investment properties is recognizedin the consolidated statement of income on a straight-line basis over the lease term and the terms ofthe lease, respectively, or based on a certain percentage of the gross revenue of the tenants, asprovided under the terms of the lease contract.

- 47 -
*SGVFS039491*
Marketing fees, management fees from administration and property management are recognizedover time as the customer receives and consumes the benefit from the performance of the services.
Hotel and resorts revenueALI Group recognizes room accommodation services over time since the guest simultaneouslyreceives and consumes the services provided by ALI Group. The Group considers whether there areother promises in the contract that are separate performance obligations to which a portion of thetransaction price needs to be allocated. Revenue from banquets and other special events arerecognized when the events take place.
Cost of hotel operationsCost of hotel operations pertains to expenses incurred in relation to sale of goods and rendering ofservices. These are recognized when a decrease in future economic benefits related to a decreasein an asset or an increase of a liability has arisen that can be measured reliably. These arerecognized when incurred and measured at the amount paid or payable.
Construction revenue and costRevenue from fixed price construction contracts are recognized over time using the milestone-basedrevenue recognition which is in reference to output method. The output method is determined basedon the start and completion of a task of the contract work inclusive of uninstalled goods and materialsdelivered to the site.
Contract costs include all direct materials and labor costs and those indirect costs related to contractperformance. Expected losses on contracts are recognized immediately when it is probable that thetotal contract costs will exceed total contract revenue. Changes in contract performance, contractconditions and estimated profitability, including those arising from contract penalty provisions, andfinal contract settlements which may result in revisions to estimated costs and gross margins arerecognized in the year in which the changes are determined.
MWC Group’s Revenue from Contracts with CustomersRevenue recognized over time using output method
· Water and sewer revenueWater and sewer revenue is recognized over time as the customer receives and consumes thebenefit from the performance of the related water and sewerage services. Water and sewerageare billed every month according to the bill cycles of the customers. As a result of bill cycle cut-off, monthly service revenue earned but not yet billed at end of the month are estimated andaccrued. These estimates are based on historical consumption of the customers. Also, twentypercent (20%) of water revenue is recognized by MWC as environmental charge.
· Operation and maintenance servicesRevenue from operation and maintenance services is recognized over time as the operation,maintenance, and management services are rendered for water and waste water facilities ofBonifacio Water Corporation (BWC).
· Performance feesPerformance fees are recognized as revenue over time as the NRW are recovered as agreed inthe NRWSA with ZCWD.
MWC Group recognizes revenue from water and sewer services, environmental charge, operationand maintenance services and performance fees over time using output method. As practicalexpedient allowed under PFRS 15, the Group recognizes revenue in the amount to which MWCGroup has a right to invoice since MWC Group bills a fixed amount for every cubic meter delivered orNRW recovered.
· Connection feesConnection fees are amounts paid by customers in exchange for the set-up of a connection fromthe customer’s establishment to MWC Group’s water or sewer network. Revenue from

- 48 -
*SGVFS039491*
connection fees is recognized over time, using output method based on time elapsed over theperiod when the related water and sewer services are expected to be provided.
· Supervision feesSupervision fees arise from MWPVI, Aqua Centro, EcoWater, and Laguna Water’s assurance ofpotable water and effective used water services for new developments, and performance ofcertain functions which includes, but is not limited to, the provision of design and projectmanagement services in the development of water and used water facilities. Revenue fromsupervision fees is recognized over time, using output method. Under this method, progress ismeasured using survey of performance completed to date and milestone reached. This is basedon the work accomplishment report prepared by the project contractor as approved and reviewedby the project management head.
· Revenue from pipeworks and integrated used water servicesRevenue from pipeworks and integrated used water services is recognized over time as the waterand wastewater network related services are rendered, using output method. Under this method,progress is measured using survey of performance completed to date and milestone reached.This is based on the work accomplishment report prepared by the project contractor as approvedby the project management head.
MWC Group has determined that the output method is the appropriate method in measuring progressof the connection services, project management services, and pipeworks and integrated used waterservices since this depicts MWC Group’s performance in managing and providing service connectionfrom water and used water facilities to the developments.
Revenue recognized over time using input method
· Revenue from rehabilitation works and Cost of rehabilitation worksRevenue from rehabilitation works is equivalent to the related cost for the rehabilitation workscovered by the service concession arrangements which is recognized as part of SCA orconcession financial receivables and pertain to revenue from construction or upgrade services.Revenue from rehabilitation works is recognized over time, using input method. Under thismethod, progress is measured by reference to the actual costs incurred to date.
· Construction revenueConstruction revenue arise from the NRWSA with ZCWD for the establishment of districtmetering areas. Revenue from construction services is recognized over time, using input method.Under this method, progress is measured based on actual costs incurred on materials, labor, andoverhead relative to the total project costs.
· Service feesService fees for technical assistance extended to ZCWD are recognized over time, using inputmethod, when the related services have been rendered to the ZCWD. Under this method,progress is measured based on actual costs incurred on manpower and overhead relative to thetotal project costs.
MWC Group determined that the input method is the appropriate method in measuring progress ofthe rehabilitation works, construction revenue and service fees because there is a direct relationshipbetween MWC Group’s effort (i.e., actual cost incurred incurred) and the transfer of service to thecustomer.
Revenue recognized at a point in time
· Distributors’ feeDistributors’ fee is recognized as revenue at a point in time when control of the trade assets havebeen transferred to the distributor, generally upon delivery of the related assets.

- 49 -
*SGVFS039491*
· Revenue from packaged waterRevenue from packaged water and other water related products is recognized at the point in timewhen control of the goods is transferred to the distributor, generally upon receipt of the relatedproduct.
· Other operating incomeOther customer related fees such as reconnection and disconnection fees, income fromcustomers late payments, income from septic sludge disposal, and income from bacteriologicalwater analysis are recognized at a point in time when the control over these good or serviceshave been transferred to the customer.
IMI Group’s Revenue from Contracts with CustomersIMI Group is in the business of providing electronic manufacturing and other related services tovarious customers. Revenue from contracts with customers is recognized when control of the goodsor services are transferred to the customer at an amount that reflects the consideration to which IMIGroup expects to be entitled in exchange for those goods or services. IMI Group has concluded thatit is the principal in its revenue arrangements because it controls the goods or services beforetransferring them to the customer.
Manufacturing servicesIMI Group provides manufacturing services in accordance with the customer’s specifications. IMIGroup promises to provide a combined performance obligation comprised of non-distinct goods orservices, which include issuance of materials to production, assembly, testing and packaging.
Contracts with customers are generally classified as turnkey or consignment. In a turnkey contract,IMI Group procures the materials and provides the assembly services to the customer. In aconsignment contract, IMI Group only provides assembly services to the customer.
For turnkey contracts, revenue is recognized over time since the products created have no alternativeuse to IMI Group and IMI Group has right to payment for performance completed to date including therelated profit margin, in case of termination for reasons other than IMI Group’s failure to perform aspromised.
For goods manufactured not covered by customer purchase orders or firm delivery schedule,revenues are recognized at a point in time, when control of the asset is transferred to the customer,generally when goods are shipped or goods are received by the customer, depending on thecorresponding agreement with the customer.
For consignment contracts, revenue is recognized over time as services are rendered since thecustomer simultaneously receives and consumes the benefits as IMI Group performs its obligation.
Revenue from optical bonding technology and metal mesh touch sensors (VIA and VTS)Revenue from contracts with customers is recognized when control of the goods or services aretransferred to the customer at an amount that reflects the consideration to which IMI Group expects tobe entitled in exchange for those goods or services. IMI Group has concluded that it is the principal inits revenue arrangements because it typically controls the goods or services before transferring the,to the customer.
Non-recurring engineering servicesNon-recurring engineering charges, tooling and other pre-production revenue stream (NREs) arerecognized at a point in time since the criteria for over time recognition is not met. This is based onthe assessment that while, in general, IMI Group has no alternative use for these NREs, either due tocustomization or restrictions by the customer, there is no assurance or relevant experience that IMIhas enforceable right to payment or can recover the cost, plus reasonable margin, in case of contracttermination. Point in time revenue recognition for NREs would mean revenue is recognized uponcustomer acceptance of the NREs (transfer of control).

- 50 -
*SGVFS039491*
IMI Group considers whether there are other promises in the contract that are separate performanceobligations to which a portion of the transaction price needs to be allocated (e.g., customer optionsthat provide material rights to customers, warranties). In determining the transaction price, IMI Groupconsiders the effects of variable consideration, the existence of significant financing components,noncash consideration and consideration payable to the customer, if any.
Variable considerationIf the consideration in a contract includes a variable amount, IMI Group estimates the amount ofconsideration to which it will be entitled in exchange for transferring the goods to the customer. Thevariable consideration is estimated at contract inception and constrained until it is highly probable thata significant revenue reversal in the amount of cumulative revenue recognized will not occur when theassociated uncertainty with the variable consideration is subsequently resolved.
Significant financing componentIMI Group’s contracts with its customers are short-term in nature. Using the practical expedient inPFRS 15, IMI Group does not adjust the promised amount of consideration of the effects of asignificant financing component if it expects, at contract inception, that the period between thetransfer of the promised good or service to the customer and when the customer pays for that good orservice will be one year or less.
IMI Group does not have significant separate performance obligations wherein the transaction priceneeds to be allocated as of December 31, 2019 and 2018.
Warranty obligationsIMI Group provides warranties for general repairs of defects that existed at the time of sale. Thewarranties provided are customary per industry practice. These assurance-type warranties areaccounted for under PAS 37, Provisions, Contingent Liabilities and Contingent Assets.
IMI Group does not provide warranty beyond fixing defects that existed at the time of sale or outsideof industry practice. After-sales repairs are arranged with customers separately and are accountedfor as any other manufacturing service contract with customers.
ACEI Group’s Revenue from Contracts with CustomersSale of ElectricitySale of electricity is consummated whenever the electricity generated by the ACEI Group istransmitted through the transmission line designated by the buyer, for a consideration. Revenue fromsale of electricity is based on sales price. Sales of electricity using bunker fuel are composed ofgeneration fees from spot sales to the WESM and supply agreements with third parties and arerecognized monthly based on the actual energy delivered.
Starting December 27, 2014, sales of electricity to the WESM using wind and solar are based on theFeed in Tariff (FIT) rate under the FIT System and are recognized monthly based on the actualenergy delivered. Meanwhile, revenue from sale of electricity through ancillary services to theNational Grid Corporation of the Philippines (NGCP) is recognized monthly based on the capacityscheduled and/or dispatched and provided. Revenue from sale of electricity through Retail SupplyContract is composed of generation charge from monthly energy supply with various contestablecustomers and is recognized monthly based on the actual energy delivered. The basic energycharges for each billing period are inclusive of generation charge and retail supply charge
Contract BalancesReceivablesA receivable represents the Group’s right to an amount of consideration that is unconditional (i.e.,only the passage of time is required before payment of the consideration is due).
Contract assetsA contract asset is the right to consideration in exchange for goods or services transferred to thecustomer. If the Group performs by transferring goods or services to a customer before the customer

- 51 -
*SGVFS039491*
pays consideration or before payment is due, a contract asset is recognized for the earnedconsideration that is conditional.
Contract liabilitiesA contract liability is the obligation to transfer goods or services to a customer for which the Grouphas received consideration (or an amount of consideration is due) from the customer. If a customerpays consideration before the Group transfers goods or services to the customer, a contract liability isrecognized when the payment is made or the payment is due (whichever is earlier). Contractliabilities are recognized as revenue when the Group performs under the contract.
The contract liabilities also include payments received by the Group from the customers for whichrevenue recognition has not yet commenced.
Costs to obtain contractThe incremental costs of obtaining a contract with a customer are recognized as an asset if the Groupexpects to recover them. The Group has determined that commissions paid to brokers and marketingagents on the sale of pre-completed real estate units are deferred when recovery is reasonablyexpected and are charged to expense in the period in which the related revenue is recognized asearned. Commission expense is included in the “Real estate costs and expenses” account in theconsolidated statement of income.
Costs incurred prior to obtaining contract with customer are not capitalized but are expensed asincurred.
Amortization, de-recognition and impairment of capitalized costs to obtain a contractThe Group amortizes capitalized costs to obtain a contract to cost of sales over the expectedconstruction period using percentage of completion following the pattern of real estate revenuerecognition. The amortization is included within cost of sales.
A capitalized cost to obtain a contract is derecognized either when it is disposed of or when no furthereconomic benefits are expected to flow from its use or disposal.
At each reporting date, the Group determines whether there is an indication that cost to obtain acontract may be impaired. If such indication exists, the Group makes an estimate by comparing thecarrying amount of the assets to the remaining amount of consideration that the Group expects toreceive less the costs that relate to providing services under the relevant contract. In determining theestimated amount of consideration, the Group uses the same principles as it does to determine thecontract transaction price, except that any constraints used to reduce the transaction price will beremoved for the impairment test.
Where the relevant costs or specific performance obligations are demonstrating marginal profitabilityor other indicators of impairment, judgement is required in ascertaining whether or not the futureeconomic benefits from these contracts are sufficient to recover these assets. In performing thisimpairment assessment, management is required to make an assessment of the costs to completethe contract. The ability to accurately forecast such costs involves estimates around cost savings tobe achieved over time, anticipated profitability of the contract, as well as future performance againstany contract-specific performance indicators that could trigger variable consideration, or servicecredits. Where a contract is anticipated to make a loss, their judgements are also relevant indetermining whether or not an onerous contract provision is required and how this is to be measured.
Assets and liabilities arising from rights of returnRight of return assetsRight of return asset represents the Group’s right to recover the goods expected to be returned bycustomers. The asset is measured at the former carrying amount of the inventory, less any expectedcosts to recover the goods, including any potential decreases in the value of the returned goods. TheGroup updates the measurement of the asset recorded for any revisions to its expected level ofreturns, as well as any additional decreases in the value of the returned products.

- 52 -
*SGVFS039491*
Refund liabilitiesA refund liability is the obligation to refund some or all of the consideration received (or receivable)from the customer and is measured at the amount the Group ultimately expects it will have to returnto the customer.
The Group updates its estimates of refund liabilities (and the corresponding change in the transactionprice) at the end of each reporting period. Refer to above accounting policy on variableconsideration.
Cost to obtain a contractThe Group pays sales commission to its employees for each contract that they obtain for bundledsales of equipment and installation services. The Group has elected to apply the optional practicalexpedient for costs to obtain a contract which allows the Group to immediately expense salescommissions (included under employee benefits and part of cost of sales) because the amortisationperiod of the asset that the Group otherwise would have used is one year or less.
ExpensesExpenses are recognized in the consolidated statement of income when decrease in future economicbenefit related to a decrease in an asset or an increase in a liability has arisen that can be measuredreliably.
Expenses are recognized in the consolidated statement of income:
· On the basis of a direct association between the costs incurred and the earning of specific items
of income;
· On the basis of systematic and rational allocation procedures when economic benefits are
expected to arise over several accounting periods and the association can only be broadly or
indirectly determined; or
· Immediately when expenditure produces no future economic benefits or when, and to the extent
that, future economic benefits do not qualify or cease to qualify, for recognition in the
consolidated statement of financial position as an asset.
Direct operating expenses and general and administrative expenses are recognized as they areincurred.
Borrowing CostsBorrowing costs directly attributable to the acquisition or construction of an asset that necessarilytakes a substantial period of time to get ready for its intended use or sale are capitalized as part ofthe cost of the respective assets (included in “Investment properties”, “Property, plant and equipment”and “Service concession assets” accounts in the consolidated statement of financial position). Allother borrowing costs are expensed in the period in which they occur. Borrowing costs consist ofinterest and other costs that an entity incurs in connection with the borrowing of funds.
The interest capitalized is calculated using the Group’s weighted average cost of borrowings afteradjusting for borrowings associated with specific developments. Where borrowings are associatedwith specific developments, the amounts capitalized is the gross interest incurred on thoseborrowings less any investment income arising on their temporary investment. Interest is capitalizedfrom the commencement of the development work until the date of practical completion. Thecapitalization of borrowing costs is suspended if there are prolonged periods when developmentactivity is interrupted. If the carrying amount of the asset exceeds its recoverable amount, animpairment loss is recorded.
Pension CostDefined benefit planThe net defined benefit liability or asset is the aggregate of the present value of the defined benefitobligation at the end of the reporting period reduced by the fair value of plan assets (if any), adjustedfor any effect of limiting a net defined benefit asset to the asset ceiling. The asset ceiling is the

- 53 -
*SGVFS039491*
present value of any economic benefits available in the form of refunds from the plan or reductions infuture contributions to the plan.
The cost of providing benefits under the defined benefit plans is actuarially determined using theprojected unit credit method. This method reflects services rendered by employees up to the date ofvaluation and incorporates assumptions concerning employees’ projected salaries. Actuarialvaluations are conducted with sufficient regularity, with the option to accelerate when significantchanges to underlying assumptions occur.
Defined benefit costs comprise the following:
· Service cost
· Net interest on the net defined benefit liability or asset
· Remeasurements of net defined benefit liability or asset
Service costs which include current service costs, past service costs and gains or losses on non-routine settlements are recognized as expense in profit or loss. Past service costs are recognizedwhen plan amendment or curtailment occurs.
Net interest on the net defined benefit liability or asset is the change during the period in the netdefined benefit liability or asset that arises from the passage of time which is determined by applyingthe discount rate based on government bonds to the net defined benefit liability or asset. Net intereston the net defined benefit liability or asset is recognized as expense or income in profit or loss.
Remeasurements comprising actuarial gains and losses, return on plan assets and any change in theeffect of the asset ceiling (excluding net interest on defined benefit liability) are recognizedimmediately in other comprehensive income in the period in which they arise. Remeasurements arenot reclassified to profit or loss in subsequent periods.
Pension liabilities are the aggregate of the present value of the defined benefit obligation at the end ofthe reporting period reduced by the fair value of plan assets, adjusted for any effect of limiting a netpension asset to the asset ceiling. The asset ceiling is the present value of any economic benefitsavailable in the form of refunds from the plan or reductions in future contributions to the plan.
Plan assets are assets that are held by a long-term employee benefit fund. Plan assets are notavailable to the creditors of the Group, nor can they be paid directly to the Group. Fair value of planassets is based on market price information. When no market price is available, the fair value of planassets is estimated by discounting expected future cash flows using a discount rate that reflects boththe risk associated with the plan assets and the maturity or expected disposal date of those assets(or, if they have no maturity, the expected period until the settlement of the related obligations). If thefair value of the plan assets is higher than the present value of the defined benefit obligation, themeasurement of the resulting defined benefit asset is limited to the present value of economicbenefits available in the form of refunds from the plan or reductions in future contributions to the plan.
Defined contribution planIMIIMI’s subsidiaries in Singapore, China and Hong Kong, Czech Republic, Mexico, Germany, and UKparticipate in the respective national retirement schemes defined by the laws of the countries in whichit has operations. These retirement schemes are considered as defined contribution plans. A definedcontribution plan is a plan under which the subsidiary pays fixed contributions. Each subsidiary hasno legal or constructive obligations to pay further contributions if the fund does not hold sufficientassets to pay all employees the benefits relating to employee service in the current and prior periods.The required contributions to the national retirement schemes are recognized as retirement expenseas accrued.

- 54 -
*SGVFS039491*
Termination benefitTermination benefits are employee benefits provided in exchange for the termination of anemployee’s employment as a result of either an entity’s decision to terminate an employee’semployment before the normal retirement date or an employee’s decision to accept an offer ofbenefits in exchange for the termination of employment.
A liability and expense for a termination benefit is recognized at the earlier of when the entity can nolonger withdraw the offer of those benefits and when the entity recognizes related restructuring costs.Initial recognition and subsequent changes to termination benefits are measured in accordance withthe nature of the employee benefit, as either post-employment benefits, short-term employeebenefits, or other long-term employee benefits.
Employee leave entitlementEmployee entitlements to annual leave are recognized as a liability when they are accrued to theemployees. The undiscounted liability for leave expected to be settled wholly before twelve monthsafter the end of the annual reporting period is recognized for services rendered by employees up tothe end of the reporting period.
Income TaxCurrent taxCurrent tax assets and liabilities for the current and prior periods are measured at the amountexpected to be recovered from or paid to the taxation authorities. The tax rates and tax laws used tocompute the amount are those that are enacted or substantively enacted as of reporting date.
Current tax relating to items recognized directly in equity is recognized in equity and not in profit orloss. The Group periodically evaluates positions taken in the tax returns with respect to situations inwhich applicable tax regulations are subject to interpretation and establishes provisions whereappropriate.
Deferred taxDeferred income tax is provided, using the liability method, on all temporary differences, with certainexceptions, at the reporting date between the tax bases of assets and liabilities and their carryingamounts for financial reporting purposes.
Deferred tax liabilities are recognized for all taxable temporary differences, with certain exceptions.Deferred tax assets are recognized for all deductible temporary differences, carryforward benefit ofunused tax credits from excess of minimum corporate income tax (MCIT) over the regular corporateincome tax and unused net operating loss carryover (NOLCO), to the extent that it is probable thattaxable income will be available against which the deductible temporary differences and carryforwardbenefits of MCIT and NOLCO can be utilized.
Deferred tax liabilities are not provided on nontaxable temporary differences associated withinvestments in domestic subsidiaries, associates and interests in joint ventures. With respect toinvestments in foreign subsidiaries, associates and interests in joint ventures, deferred tax liabilitiesare recognized except where the timing of the reversal of the temporary difference can be controlledand it is probable that the temporary difference will not reverse in the foreseeable future.
The carrying amount of deferred tax assets is reviewed at each reporting date and reduced to theextent that it is no longer probable that sufficient taxable income will be available to allow all as part ofthe deferred tax assets to be utilized. Unrecognized deferred tax assets are reassessed at eachreporting date and are recognized to the extent that it has become probable that future taxableincome will allow all as part of the deferred tax assets to be recovered.
Deferred tax assets and liabilities are measured at the tax rate that is expected to apply to the periodwhen the asset is realized or the liability is settled, based on tax rates and tax laws that have beenenacted or substantively enacted as at the end of the reporting period. Movements in the deferred

- 55 -
*SGVFS039491*
income tax assets and liabilities arising from changes in tax rates are charged or credited to incomefor the period.
Deferred tax assets and deferred tax liabilities are offset, if a legally enforceable right exists to set offcurrent tax assets against current tax liabilities and the deferred taxes relate to the same taxableentity and the same authority.
For periods where the income tax holiday (ITH) is in effect, no deferred taxes are recognized in theconsolidated financial statements as the ITH status of the subsidiary neither results in a deductibletemporary difference or temporary taxable difference. However, for temporary differences that areexpected to reverse beyond the ITH, deferred taxes are recognized.
Foreign Currency TransactionsThe functional and presentation currency of the Parent Company and its subsidiaries (except forAYCF, ACIFL, PFIL, BHL, AIVPL and IMI), is the Philippine Peso (P=). Each entity in the Groupdetermines its own functional currency and items included in the financial statements of each entityare measured using that functional currency. Transactions in foreign currencies are initially recordedin the functional currency rate ruling at the date of the transaction. Monetary assets and liabilitiesdenominated in foreign currencies are translated at the functional currency rate of exchange ruling atthe reporting date. All differences are taken to the consolidated statement of income with theexception of differences on foreign currency borrowings that provide a hedge against a netinvestment in a foreign entity. These are recognized in the consolidated statement of comprehensiveincome until the disposal of the net investment, at which time they are recognized in the consolidatedstatement of income. Tax charges and credits attributable to exchange differences on thoseborrowings are also dealt with in equity. Nonmonetary items that are measured in terms of historicalcost in a foreign currency are translated using the exchange rate as at the date of initial transaction.Nonmonetary items measured at fair value in a foreign currency are translated using the exchangerate at the date when the fair value was determined.
The functional currency of AYCF, ACIFL, PFIL, BHL, AIVPL and IMI is the US Dollar (US$). As of thereporting date, the assets and liabilities of these subsidiaries are translated into the presentationcurrency of the Parent Company (the Philippine Peso) at the closing rate as at the reporting date andtheir statement of income accounts are translated at the weighted average exchange rates for theyear. The exchange differences arising on the translation are recognized in the consolidatedstatement of comprehensive income and reported as a separate component of equity as “CumulativeTranslation Adjustments”. On disposal of a foreign entity, the deferred cumulative amount recognizedin the consolidated statement of comprehensive income relating to that particular foreign operationshall be recognized in the consolidated statement of income.
Exchange differences arising from elimination of intragroup balances and intragroup transactions arerecognized in profit or loss. As an exception, if the exchange differences arise from intragroupbalances that, in substance, forms part of an entity’s net investment in a foreign operation, theexchange differences are not to be recognized in profit or loss, but are recognized in OCI andaccumulated in a separate component of equity until the disposal of the foreign operation.
On disposal of a foreign entity, the deferred cumulative amount recognized in the consolidatedstatement of comprehensive income relating to that particular foreign operation shall be recognized inprofit or loss.
The Group’s share in the translation adjustments of associates and joint ventures are likewiseincluded under the “Cumulative Translation Adjustments” account in the consolidated statement ofcomprehensive income.

- 56 -
*SGVFS039491*
MWC GroupAs approved by the MWSS Board of Trustees (BOT) under Amendment No. 1 of the ConcessionAgreement with MWSS, the following will be recovered through billings to customers:
a. Restatement of foreign currency-denominated loans;b. Excess of actual concession fee payment over the amounts of concession fees translated using
the base exchange rate assumed in the business plan approved every rate rebasing exercise.The current base exchange rate is P=53.16:US$1.00 based on the latest rate rebasing exerciseeffective January 1, 2018;
c. Excess of actual interest payment translated at exchange spot rate on settlement date over theamount of interest translated at drawdown rate; and
d. Excess of actual payment of other financing charges relating to foreign currency-denominatedloans translated at exchange spot rate on settlement date over the amount of other financingcharges translated at drawdown rate.
In view of the automatic reimbursement mechanism, the MWC Group recognizes deferred foreigncurrency differential adjustment (FCDA) (included as part of “Other noncurrent assets” or “Othernoncurrent liabilities” in the consolidated statement of financial position) for both the realized andunrealized foreign exchange gains and losses. Other water revenue-FCDA is credited (debited) uponrecovery (refund) of realized foreign exchange losses (gains). The write-off or reversal of thedeferred FCDA pertaining to concession fees will be made upon determination of the rebased foreignexchange rate, which is assumed in the business plan approved by MWSS-Regulatory Office (RO)during the latest Rate Rebasing exercise, unless indication of impairment of the deferred FCDA wouldbe evident at an earlier date.
Share-based PaymentsThe Group has equity-settled, share-based compensation plans with its employees.
PFRS 2 OptionsFor options granted after November 7, 2002 that have not vested on or before January 1, 2005, thecost of equity-settled transactions with employees is measured by reference to the fair value at thedate on which they are granted. In valuing equity-settled transactions, vesting conditions, includingperformance conditions, other than market conditions (conditions linked to share prices), shall not betaken into account when estimating the fair value of the shares or share options at the measurementdate. Instead, vesting conditions are taken into account in estimating the number of equityinstruments that will ultimately vest. Fair value is determined by using the Binomial Tree and Black-Scholes model, further details of which are provided in Note 28 to the consolidated financialstatements.
The cost of equity-settled transactions is recognized, together with a corresponding increase inequity, over the period in which the performance conditions are fulfilled, ending on the date on whichthe relevant employees become fully entitled to the awards (‘vesting date’). The cumulative expenserecognized for equity-settled transactions at each reporting date until the vesting date reflects theextent to which the vesting period has expired and the Group’s best estimate of the number of equityinstruments that will ultimately vest. The income or expense for a period represents the movement incumulative expense recognized as of the beginning and end of that period.
No expense is recognized for awards that do not ultimately vest, except for awards where vesting isconditional upon a market condition, which are treated as vesting irrespective of whether or not themarket condition is satisfied, provided that all other performance conditions are satisfied.
Where the terms of an equity-settled award are modified, as a minimum, an expense is recognized asif the terms had not been modified. In addition, an expense is recognized for any increase in thevalue of the transaction as a result of the modification, as measured at the date of modification.

- 57 -
*SGVFS039491*
Where an equity-settled award is cancelled, it is treated as if it had vested on the date of cancellation,and any expense not yet recognized for the award is recognized immediately. However, if a newaward is substituted for the cancelled award, and designated as a replacement award on the datethat it is granted, the cancelled and new awards are treated as if they were a modification of theoriginal award, as described in the previous paragraph.
Pre-PFRS 2 OptionsFor options granted before November 7, 2002 that have vested before January 1, 2005, the intrinsicvalue of stock options determined as of grant date is recognized as expense over the vesting period.
The dilutive effect of outstanding options is reflected as additional share dilution in the computation ofdiluted earnings per share (see Note 27).
Employee share purchase plansThe Parent Company and certain subsidiaries have employee share purchase plans (ESOWN) whichallow the grantees to purchase the Parent Company’s and its respective subsidiaries’ shares oninstallment payment plan. The Group recognizes stock compensation expense over the holdingperiod. These are accounted for similar to the PFRS 2 options. Dividends paid on the awards thathave vested are deducted from equity and those paid on awards that are unvested are charged toprofit or loss. The Group treats its ESOWN plan as option exercisable within a given period. For themeasurement of the fair value of options at the grant date, the Parent Company uses a Binomial TreeModel. The assumptions and models used for estimating fair value for share-based paymenttransactions are disclosed in Note 28.
Earnings Per Share (EPS)Basic EPS is computed by dividing net income attributable to common equity owners of the ParentCompany by the weighted average number of common shares issued and outstanding during theyear. The net income attributable to common equity owners of the Parent Company is net ofdividends attributable to preferred equity holders.
Diluted EPS is computed by dividing net income attributable to common equity holders of the ParentCompany by the weighted average number of common shares issued and outstanding during theyear plus the weighted average number of common shares that would be issued on conversion of allthe dilutive potential common shares. Calculation of diluted EPS considers the potential ordinaryshares of subsidiaries, associates and joint ventures that have dilutive effect on the basic EPS of theParent Company. The calculation of diluted EPS does not assume conversion, exercise or otherissue of potential common shares that would have an antidilutive effect on earnings per share. Basicand diluted EPS are adjusted to give retroactive effect to any stock dividends declared during theperiod.
Assets Held in TrustAssets which are owned by MWSS, PGL, TIEZA and CDC but are operated by the MWC Groupunder the concession agreements are not reflected in the consolidated statement of financial positionbut are considered as Assets Held in Trust (see Note 37).
Operating SegmentsThe Group’s operating businesses are organized and managed separately according to the nature ofthe products and services provided, with each segment representing a strategic business unit thatoffers different products and serves different markets. Financial information on operating segments ispresented in Note 30 to the consolidated financial statements.
ContingenciesContingent liabilities are not recognized in the consolidated financial statements. These are disclosedunless the possibility of an outflow of resources embodying economic benefits is remote. Contingentassets are not recognized in the consolidated financial statements but disclosed when an inflow ofeconomic benefits is probable.

- 58 -
*SGVFS039491*
Events after the Reporting PeriodPost year-end events that provide additional information about the Group’s position at the reportingdate (adjusting events) are reflected in the consolidated financial statements. Post year-end eventsthat are not adjusting events are disclosed in the consolidated financial statements when material.
4. Significant Accounting Judgments, Assumptions and Estimates
The preparation of the accompanying consolidated financial statements in conformity with PFRSsrequires management to make estimates and assumptions that affect the amounts reported in theconsolidated financial statements and accompanying notes. The estimates and assumptions used inthe accompanying consolidated financial statements are based upon management’s evaluation ofrelevant facts and circumstances as of the date of the consolidated financial statements. Actualresults could differ from such estimates.
JudgmentsIn the process of applying the Group’s accounting policies, management has made the followingjudgments, apart from those involving estimations, which have the most significant effect on theamounts recognized in the consolidated financial statements:
Revenue from contracts with customersThe Group applied the following judgments that significantly affect the identification of a contract,determination of the performance obligation and amount as well as timing of revenue from contractswith customers.
ALI GroupExistence of a contractALI Group’s primary document for a contract with a customer is a signed contract to sell. It hasdetermined, however, that in cases wherein contract to sell are not signed by both parties, thecombination of its other signed documentation such as reservation agreement, official receipts,buyers’ computation sheets and invoices, would contain all the criteria to qualify as contract with thecustomer under PFRS 15.
In addition, part of the assessment process of ALI Group before revenue recognition is to assess theprobability that ALI Group will collect the consideration to which it will be entitled in exchange for thereal estate property that will be transferred to the customer. In evaluating whether collectability of anamount of consideration is probable, an entity considers the significance of the customer’s initialpayments in relation to the total contract price. Collectability is also assessed by considering factorssuch as past history with the customer, age and pricing of the property. Management regularlyevaluates the historical cancellations and back-outs if it would still support its current threshold ofcustomers’ equity before commencing revenue recognition.
Revenue recognition method and measure of progressALI Group concluded that revenue for real estate sales is to be recognized over time because: (a) ALIGroup’s performance does not create an asset with an alternative use and; (b) ALI Group has anenforceable right for performance completed to date. The promised property is specifically identifiedin the contract and the contractual restriction on ALI Group’s ability to direct the promised property foranother use is substantive. This is because the property promised to the customer is notinterchangeable with other properties without breaching the contract and without incurring significantcosts that otherwise would not have been incurred in relation to that contract. In addition, under thecurrent legal framework, the customer is contractually obliged to make payments to the developer upto the performance completed to date. In addition, ALI Group requires a certain percentage of buyer'spayments of total selling price (buyer's equity), to be collected as one of the criteria in order to initiaterevenue recognition. Reaching this level of collection is an indication of buyer’s continuingcommitment and the probability that economic benefits will flow to ALI Group. ALI Group considersthat the initial and continuing investments by the buyer of about 10% would demonstrate the buyer’scommitment to pay.

- 59 -
*SGVFS039491*
ALI Group has determined that output method used in measuring the progress of the performanceobligation faithfully depicts ALI Group’s performance in transferring control of real estate developmentto the customers.
Sale of real estate receivablesALI Group has entered into arrangements with banks wherein it discounted its real estate receivableswithout recourse. ALI Group believes that the sales transactions are not more than infrequent andthat the receivables discounted is insignificant in value both individually and in aggregate. The Groupcontinue with the objective of collecting contractual cash flows until maturity.
IMI GroupIdentifying contracts with customersGenerally, a valid and approved manufacturing service agreement (MSA), scheduling agreement(SA), customer accepted quote, customer forecast, and/or customer purchase order or firm deliveryschedule will be in place before IMI Group provides services or manufacture goods for the customers.IMI Group is not obligated to transfer any goods or provide services until the customer submits apurchase order or firm delivery schedule under the MSA or SA, respectively. The purchase order orfirm delivery schedule creates the enforceable rights and obligations and is therefore evaluatedtogether with the MSA or SA for revenue recognition in accordance with PFRS 15.
Determining the timing of revenue recognitionIMI Group assessed that revenue from manufacturing of goods shall be recognized over time or pointin time. For turnkey contracts wherein the products created have no alternative use to IMI Group andIMI Group has right to payment for performance completed to date including the related profit margin,in case of termination for reasons other than IMI Group’s failure to perform as promised, revenue isrecognized over time. For goods manufactured not covered by customer purchase orders or firmdelivery schedule, revenues are recognized at a point in time. For consignment contracts, revenue isrecognized over time as services are rendered since the customer simultaneously receives andconsumes the benefits as IMI Group performs.
Determining the method to measure of progress for revenue recognized over timeIMI Group measures progress towards complete satisfaction of the performance obligation using aninput method (i.e., costs incurred). Management believes that this method provides a faithful depictionof the transfer of goods or services to the customer because IMI Group provides integration service toproduce a combined output and each item in the combined output may not transfer an equal amountof value to the customer.
Water infrastructure services revenue recognized using the input and output methodMWC Group recognizes revenue from rehabilitation works, construction revenue, and service feesusing the input method while it recognizes supervision fees and revenue from pipeworks andintegrated used water services using the output method. The input or output method of recognizingrevenue over the period covered by the separate contracts with customers requires MWC Group tobase the level of transfer of control over these services based on MWC Group's review andconcurrence with work accomplishment reports prepared by project managers or submitted byindependent project contractors.
Definition of default and credit-impaired financial assetsALI Group defines a financial instrument as in default, which is fully aligned with the definition ofcredit-impaired, when it meets one or more of the following criteria:
Quantitative criterion - for residential, commercial and office development receivables, the customerreceived a notice of cancellation and does not continue the payments.

- 60 -
*SGVFS039491*
Qualitative criteriaThe customer meets unlikeliness to pay criteria, which indicates the customer is in significant financialdifficulty. These are instances where:a. The customer is experiencing financial difficulty or is insolventb. The customer is in breach of financial covenant(s)c. An active market for that financial assets has disappeared because of financial difficultiesd. Concessions have been granted by ALI Group, for economic or contractual reasons relating to
the customer’s financial difficultye. It is becoming probable that the customer will enter bankruptcy or other financial reorganization
The criteria above have been applied to the financial instruments held by ALI Group and areconsistent with the definition of default used for internal credit risk management purposes. Thedefault definition has been applied consistently to model the Probability of Default (PD), Loss GivenDefault (LGD) and Exposure at Default (EAD) throughout ALI Group’s expected loss calculation.
Incorporation of forward-looking informationALI Group incorporates forward-looking information into both its assessment of whether the credit riskof an instrument has increased significantly since its initial recognition and its measurement of ECL.
To do this, ALI Group considers a range of relevant forward-looking macro-economic assumptions forthe determination of unbiased general industry adjustments and any related specific industryadjustments that support the calculation of ECLs. Based on ALI Group’s evaluation and assessmentand after taking into consideration external actual and forecast information, ALI Group formulates a‘base case’ view of the future direction of relevant economic variables as well as a representativerange of other possible forecast scenarios. This process involves developing two or more additionaleconomic scenarios and considering the relative probabilities of each outcome. External informationincludes economic data and forecasts published by governmental bodies, monetary authorities andselected private-sector and academic institutions.
The base case represents a most-likely outcome and is aligned with information used by ALI Groupfor other purposes such as strategic planning and budgeting. The other scenarios represent moreoptimistic and more pessimistic outcomes. Periodically, ALI Group carries out stress testing of moreextreme shocks to calibrate its determination of these other representative scenarios.
ALI Group has identified and documented key drivers of credit risk and credit losses of each portfolioof financial instruments and, using an analysis of historical data, has estimated relationships betweenmacro-economic variables and credit risk and credit losses.
Significant increase in credit riskThe criteria for determining whether credit risk has increased significantly vary by portfolio andinclude quantitative changes in PDs and qualitative factors.
The Group’s cash and cash equivalents and short-term investments are graded in the top investmentcategory by globally recognized credit rating agencies such as S&P, Moody’s and Fitch and,therefore, are considered to be low credit risk investments. It is the Group’s policy to measure ECLson such instruments on a 12-month basis. However, when there has been a significant increase incredit risk since origination, the allowance will be based on the lifetime ECL. The Group uses theratings from these credit rating agencies both to determine whether the debt instrument hassignificantly increased in credit risk and to estimate ECLs.
Using its expert credit judgement and, where possible, relevant historical experience, the Group maydetermine that an exposure has undergone a significant increase in credit risk based on particularqualitative indicators that it considers are indicative of such and whose effect may not otherwise befully reflected in its quantitative analysis on a timely basis.

- 61 -
*SGVFS039491*
Investment in SubsidiariesThe Group determined that it has control over its subsidiaries (see Note 2) by considering, amongothers, its power over the investee, exposure or rights to variable returns from its involvement with theinvestee, and the ability to use its power over the investee to affect its returns. The following werealso considered:
· The contractual arrangement with the other vote holders of the investee
· Rights arising from other contractual agreements
· The Group’s voting rights and potential voting rights
Consolidation of entities in which the Group holds only 50% or less than majority of voting rightsThe Group determined that it controls certain entities even though it owns 50% or less than majorityof the voting rights. The factors considered include, among others, the size of its block of votingshares, the relative size and dispersion of holdings of other shareholders, and contractualagreements to direct the relevant activities of the entities.
Investment in AssociatesThe Group determined that it exercises significant influence over its associates (see Note 10) byconsidering, among others, its ownership interest, board representation and participation on boardsub-committees, and other contractual terms.
Investment in Joint VenturesThe Group’s investments in joint ventures (see Note 10) are structured in separate incorporatedentities. Even though the Group holds various percentage of ownership interest on thesearrangements, their respective joint arrangement agreements requires unanimous consent from allparties to the agreement for the relevant activities identified. The Group and the parties to theagreement only have rights to the net assets of the joint venture through the terms of the contractualarrangements.
Non-controlling interestsThe Group considers a subsidiary as a subsidiary with material NCI, an associate and a joint venturewith material interest if its net assets exceed 5% of its total consolidated net assets of the Group as ofreporting period and considers the relevance of the nature of activities of the subsidiary compared toother operations of the Group. There are no significant restrictions on the Parent Company’s ability touse assets and settle liabilities of the Group.
Product Development CostsThis includes capitalized costs arising from the development phase of certain projects which are stillundergoing qualification.
Intangible assets not yet available for use are tested for impairment following the value-in-useapproach. The recoverable amounts of these product development costs and related property, plantand equipment have been determined using cash flow projections from financial budgets approved bymanagement covering a 5-year period, which is within the expected life cycle of the projects. Thepretax discount rates applied to cash flow projections range from 13.79% to 16.67%.
Significant delay in the mass production of one project resulted to impairment of the relatedcapitalized development cost. Impairment loss amounting to $0.52 million (P=26.2 million) wasrecognized under “Miscellaneous income (loss)” account in 2017. The comparison of the recoverableamounts and the carrying amounts of the product development costs and related property, plant andequipment resulted to no additional impairment loss in 2019 and 2018. Research expenditurerecognized as expense amounted to $0.85 million (P=44.0 million), $2.37 million (P=124.9 million), and$3.56 million (P=184.3 million) in 2019, 2018 and 2017, respectively.
Service concession arrangementIn applying Philippine Interpretation IFRIC 12, Service Concession Arrangements, the Group hasmade a judgment that its concession agreements with DPWH, MWSS, PGL, TIEZA, CDC, OWD and

- 62 -
*SGVFS039491*
CWD qualify under the Intangible Asset model as it receives the right (license) to charge users ofpublic service.
On the other hand, the Group has made a judgment that the concession agreement with DOTr, PGCand TWD qualifies under the Financial Asset model as it has an unconditional contractual right toreceive cash or other financial assets for its construction services directly from the grantors.
The accounting policy on the Group’s SCA under the Intangible Asset and Financial model isdiscussed in Note 3.
Distinction of land between real estate inventories and investment propertiesThe Group determines whether a property will be classified as real estate inventories or investmentproperties. In making this judgment, the Group considers whether the property will be sold in thenormal operating cycle (real estate inventories). All other properties that are not yet determined to besold in the normal operating cycle are classified as investment properties.
Property acquisitions and business combinationsThe Group acquires subsidiaries that own real estate properties. At the time of acquisition, the Groupconsiders whether the acquisition represents the acquisition of a business. The Group accounts foran acquisition as a business combination where an integrated set of activities is acquired in additionto the property. More specifically, consideration is made with regard to the extent to which significantprocesses are acquired and, in particular, the extent of ancillary services provided by the Group (e.g.,maintenance, cleaning, security, bookkeeping, hotel services, etc.). The significance of any processis judged with reference to the guidance in PAS 40 on ancillary services.
When the acquisition of subsidiaries does not represent a business, it is accounted for as anacquisition of a group of assets and liabilities. The cost of the acquisition is allocated to the assetsand liabilities acquired based upon their relative fair values, and no goodwill or deferred tax isrecognized.
ContingenciesThe Group is currently involved in various legal proceedings in the ordinary conduct of business. Theestimate of the probable costs for the resolution of these claims has been developed in consultationwith internal and external counsel handling the defense in these matters and is based upon ananalysis of potential results.
The Group currently does not believe that these proceedings will have a material adverse effect onthe Group’s financial position and results of operations (see Note 36).
Classification of assets (liabilities) held for saleOn September 30, 2019, the acquisition of ACEI’s indirect partnership interest in GN PowerKauswagan Ltd. Co. (GNPK) by Power Partners Ltd. Co. was approved. As a result, GNPK assetsand liabilities previously consolidated in the Group’s consolidated statement of financial position arereclassified to “Assets under PFRS 5” and “Liabilities under PFRS 5”, respectively (see Note 25).
The Group classifies an asset as held for sale when the asset’s carrying amount will be recoveredprincipally through a sale transaction rather than through continuing use and the following criteria aremet as of the financial reporting date:
(a) The asset is available for immediate sale in its present condition subject only to terms that areusual and customary for sales of such assets; and(b) The sale must be highly probable.

- 63 -
*SGVFS039491*
Discontinued operationsMWC qualified as a group held for deemed disposal since the issuance of the primary shares toTrident Water by MWC and the assignment of portion of the preferred shares voting rights which isexpected to be completed within one year from the reporting date will result in the Parent Company’sloss of control over MWC (see Note 25).
The Group qualifies a disposal group as discontinued operation if it is a component of an entity thateither has been disposed of, or is classified as held for sale, and:
· Represents a separate major line of business or geographical area of operations;
· Is part of a single co-ordinated plan to dispose of a separate major line of business, orgeographical area of operations, or
· Is a subsidiary acquired exclusively with a view to resale.
Judgements effective January 1, 2019
Determination of lease term of contracts with renewal and termination options – Group as a lesseeALI Group determines the lease term as the non-cancellable term of the lease, together with anyperiods covered by an option to extend the lease if it is reasonably certain to be exercised, or anyperiods covered by an option to terminate the lease, if it is reasonably certain not to be exercised.
ALI Group has several lease contracts that include extension and termination options. ALI Groupapplies judgment in evaluating whether the provisions to renew or terminate the lease is enforceable.For leases where ALI Group has the unilateral option to renew or terminate, it then applies judgmenton whether it is reasonably certain or not to exercise the option. That is, it considers all relevantfactors that create an economic incentive for it to exercise either the renewal or termination. After thecommencement date, ALI Group reassesses the lease term if there is a significant event or change incircumstances that is within its control and affects its ability to exercise or not to exercise the option torenew or to terminate (e.g., construction of significant leasehold improvements or significantcustomisation to the leased asset).
Judgements made in determining taxable profit (tax loss), tax bases, unused tax losses, unused taxcredits and tax rates applying paragraph 122 of PAS 1, Presentation of Financial StatementsUpon adoption of the Interpretation, ALI Group has assessed whether it has any uncertain taxposition. ALI Group applies significant judgement in identifying uncertainties over its income taxtreatments. ALI Group determined, based on its assessment, in consultation with its tax counsel, thatit is probable that its uncertain income tax treatments (including those for the subsidiaries) will beaccepted by the taxation authorities. Accordingly, the interpretation did not have an impact on theconsolidated financial statements of ALI Group.
IMI Group establishes provisions, based on reasonable estimates, for possible consequences ofaudits by the tax authorities of the respective countries in which it operates. Uncertainties exist withrespect to the interpretation of complex tax regulations, changes in tax laws and the amount andtiming of future taxable profits. Given the wide range of international business relationships and thelong-term nature and complexity of existing contractual agreements, differences arising between theactual results and the assumptions made, or future changes to such assumptions, could necessitatefuture adjustments to tax income and expense already recorded. The amount of such provisions isbased on various factors, such as experience on previous tax audits and differing interpretations oftax regulations by the taxable entity and the responsible tax authority. Such differences ininterpretation may arise for a wide variety of issues depending on the conditions prevailing in therespective domicile of the entities within the Group.
Management’s Use of EstimatesThe key assumptions concerning the future and other sources of estimation uncertainty at thereporting date that have a significant risk of causing a material adjustment to the carrying amounts ofassets and liabilities within the next financial year are discussed below. Existing circumstances andassumptions about future developments, however, may change due to market changes or

- 64 -
*SGVFS039491*
circumstances arising that are beyond the control of the Group. Such changes are reflected in theassumptions when they occur.
Revenue recognition on real estate projectsALI Group’s revenue recognition policy require management to make use of estimates andassumptions that may affect the reported amounts of revenues. ALI Group’s revenue from real estateis recognized based on the percentage of completion and are measured principally on the basis ofthe estimated completion of a physical proportion of the contract work. Apart from involvingsignificant estimates in determining the quanitity of imports such as materials, labor and equipmentneeded, the assessment process for the POC is complex and the estimated project developmentcosts requires technical determination by management’s specialists (project engineers). ALI Groupalso includes land in the calculation of POC since ALI Group availed of the relief granted by the SECunder Memorandum Cirular No. 14-2018 as of 2018 for the implementation issues of PFRS 15affecting the real estate industry. See Notes 22 and 23 for the related balances.
Similarly, the commission is determined using the percentage of completion method.
Revenue and cost recognition - rehabilitation worksMWC Group measures revenue from rehabilitation works at the fair value of the considerationreceived or receivable. MWC Group’s revenue from rehabilitation works are recognized over time,using input method. Under this method, progress is measured by reference to the actual costsincurred to date. Revenue from rehabilitation works recognized by MWC Group is equivalent to thecosts of rehabilitation works incurred as these costs are recovered by MWC Group through its right tocharge the customers. As of December 31, 2019, 2018 and 2017, MWC Group’s revenue from andcost of rehabilitation works amounted to P=10,852.9 million, and P=9,662.0 and P=11,672.1 million,respectively.
Estimating the period over which control over services is transferred to the customerFor each group of similar customer contracts that result in revenues recognized over a period of thetime, the Group makes an estimate of such period over which the Group transfers the control of theservices provided to the customer. For revenue from rehabilitation works, construction revenue,service fees, supervision fees, and revenue from pipeworks and integrated used water services, theGroup has determined that the period of revenue recognition is the term of the customer contract.For connection fees revenue, the Group has estimated that the customer receives control over theremaining concession period or remaining customer contract term.
Accounting for business combinationWhere asset is acquired through the acquisition of corporate interests, management considers thesubstance of the assets and activities of the acquired entity in determining whether the acquisitionrepresents an acquisition of a business. The Group accounts for an acquisition as a businesscombination where an integrated set of activities is acquired in addition to the asset.
Where such acquisitions are not judged to be an acquisition of a business, they are not treated asbusiness combinations. Rather, the cost to acquire the corporate entity is allocated between theidentifiable assets and liabilities of the entity based on their relative fair values at the acquisition date.Otherwise, corporate acquisitions are accounted for as business combinations. The cost of theacquisition is allocated to the assets and liabilities acquired based upon their relative fair values, andno goodwill or deferred tax is recognized.
The acquisitions of the Group were accounted for as business combinations (see Note 24).
Fair value of the financial liabilities on put optionThe acquisition of VIA in 2016 and STI in 2017 included call and put options over the non-controllinginterests. These options are considered when determining whether the entity has obtained controlover the acquiree if in substance the entity already has access to the returns associated with thatownership interest. IMI management assessed that the options do not give IMI Group present accessto the returns associated with the non-controlling interests in subsidiary and, therefore, accounted for

- 65 -
*SGVFS039491*
the non-controlling interests under PFRS 10, while the financial liability was accounted for underPAS 39 measured at the present value of the redemption amount, with a debit to a component ofequity attributable to the parent.
IMI management assessed that the discounted, probability-weighted cash flow methodology is theappropriate model to derive the present value of the redemption amount. The key estimates andassumptions used in the valuation include the current equity value of the acquiree, forecasted interestrate and probability of trigger events occurring. The current equity value of VIA is determined usingthe discounted cash flow approach. The future cash flows are projected using the projected revenuegrowth rate of VIA. The discount rate represents the current market assessment of the risk specific tothe acquiree, taking into consideration the time value of money and individual risks of the underlyingassets that have not been incorporated in the cash flow estimates. The discount rate calculation isbased on the specific circumstances of the acquiree and is derived from its weighted average cost ofcapital. For STI, IMI management used the market approach by approximating the EBITDA multipletaken from comparable companies of STI that are engaged in providing electronic services solutionsto derive its current equity value. IMI management computed EBITDA as the difference of forecastedgross profit and selling and administrative expenses before depreciation and amortization.
Further details on the valuation of the put options are disclosed in Note 33.
Fair value of contingent consideration liabilityThe cost of acquisition of STI also includes contingent consideration that will depend on the actualnormalized EBITDA performance less adjustments in 2018 and 2019. IMI management assessedthat the probability-weighted average of payouts associated with each possible outcome is theappropriate model to derive the fair value as part of the consideration transferred. Valuing normalizedEBITDA requires management to make an estimate of the expected future cash flows of STI and anappropriate discount rate in order to calculate the fair value of the contingent consideration as ofacquisition date.
Further details on the valuation of the contingent consideration liability are disclosed in Note 33.
Provision for expected credit losses of trade receivables and contract assets
ALI GroupALI Group uses a provision matrix to calculate ECLs for trade receivables other than the residential,commercial and office development receivables. The provision rates are based on days past due forgroupings of various customer segments that have similar loss patterns.
The provision matrix is initially based on ALI Group’s historical observed default rates. ALI Group willcalibrate the matrix to adjust the historical credit loss experience with forward-looking informationsuch as inflation rate and Gross Domestic Product (GDP) growth rates. At every reporting date, thehistorical observed default rates are updated and changes in the forward-looking estimates areanalyzed.
ALI Group uses vintage analysis approach to calculate ECLs for residential, commercial and officedevelopment receivables. The vintage analysis accounts for expected losses by calculating thecumulative loss rates of a given loan pool. It derives the probability of default from the historical dataof a homogenous portfolio that share the same origination period. The information on the number ofdefaults during fixed time intervals of the accounts is utilized to create the PD model. It allows theevaluation of the loan activity from its origination period until the end of the contract period.
The assessment of the correlation between historical observed default rates, forecast economicconditions (inflation and interest rates) and ECLs is a significant estimate. The amount of ECLs issensitive to changes in circumstances and of forecast economic conditions. ALI Group’s historicalcredit loss experience and forecast of economic conditions may also not be representative ofcustomer’s actual default in the future.

- 66 -
*SGVFS039491*
Other trade receivables and contract assetsFor the other trade receivables and contract assets, the Group uses a provision matrix to calculateECLs for receivables. The provision rates are based on days past due for groupings of variouscustomer segments that have similar loss patterns.
The provision matrix is initially based on the Group’s historical observed default rates. The Group willcalibrate the matrix to adjust the historical credit loss experience with forward-looking information. .Atevery reporting date, the historical observed default rates are updated and changes in the forward-looking estimates are analyzed.
The assessment of the correlation between historical observed default rates, forecast economicconditions, and ECLs is a significant estimate. The amount of ECLs is sensitive to changes incircumstances and of forecast economic conditions. The Group’s historical credit loss experienceand forecast of economic conditions may also not be representative of customer’s actual default inthe future.
Although lifetime expected credit losses are determined collectively, trade receivables and contractassets are also assessed individually based on default or delinquencies and possibility of financialdifficulties or possibility of bankruptcy of the customers.
Further details are provided in Note 33.
Evaluation of net realizable value of inventoriesInventories are valued at the lower of cost and NRV. This requires the Group to make an estimate ofthe inventories’ and land and improvements’ estimated selling price in the ordinary course ofbusiness, cost of completion and costs necessary to make a sale to determine the NRV. For realestate inventories, the Group adjusts the cost of its real estate inventories to net realizable valuebased on its assessment of the recoverability of the real estate inventories. In determining therecoverability of the inventories and land and improvements, management considers whether thoseinventories are damaged or if their selling prices have declined. Likewise, management alsoconsiders whether the estimated costs of completion or the estimated costs to be incurred to makethe sale have increased.
In the event that NRV is lower than the cost, the decline is recognized as an expense. The amountand timing of recorded expenses for any period would differ if different judgments were made ordifferent estimates were utilized.
Further details on inventories are provided in Note 8.
Evaluation of impairment of nonfinancial assetsThe Group reviews investments in associates and joint ventures, investment properties, property,plant and equipment, right-of-use assets, service concession assets, goodwill and intangible assetsfor impairment of value. Impairment for goodwill is assessed at least annually. This includesconsidering certain indications of impairment such as significant changes in asset usage, significantdecline in assets’ market value, obsolescence or physical damage of an asset, significantunderperformance relative to expected historical or projected future operating results and significantnegative industry or economic trends.
The Group estimates the recoverable amount as the higher of the fair value less costs to sell andvalue in use. For investments in associates and joint ventures, fair value less costs to sell pertain toquoted prices (listed equities) and to fair values determined using discounted cash flows or othervaluation technique such as multiples. In determining the present value of estimated future cashflows expected to be generated from the continued use of the assets, the Group is required to makeestimates and assumptions that may affect investments in associates and joint ventures, investmentproperties, plant, property, and equipment, right-of-use assets, service concession assets andintangible assets.

- 67 -
*SGVFS039491*
For goodwill, this requires an estimation of the recoverable amount which is the fair value less coststo sell or value in use of the cash-generating units to which the goodwill is allocated. Estimating avalue in use amount requires management to make an estimate of the future cash flows for the cashgenerating unit and also to choose a suitable discount rate in order to calculate the present value ofcash flows.
Further details on investments in associates and joint ventures, investment properties, property, plantand equipment, service concession assets and intangible assets are provided inNotes 10, 11, 12, 13 and 14, respectively.
Determining the fair value of investment propertiesThe Group discloses the fair values of its investment properties. The Group engaged independentvaluation specialists to assess fair value as at December 31, 2019 and 2018. The Group’sinvestment properties consist of land and building pertaining to land properties, retail (malls) andoffice properties. These were valued by reference to market based evidence using comparableprices adjusted for specific market factors such as nature, location and condition of the property.
Further details on investment properties assets are provided in Note 11.
Estimating billable water volumeThe SCAs related to MWC Group’s concession agreements are amortized using the UOP methodbased on actual billed volume and total estimated billable volume for the remaining period of theconcession agreements. MWC Group considers factors such as population growth rate, supply andconsumption, and service coverage, including ongoing and future expansions in estimating the totalbillable water volume over the remaining periods of the concession agreements. For the years endedDecember 31, 2019 and 2018, SCA amortization expense based on the UOP method amounted toP=2,272.6 million and P=2,042.0 million, respectively (see Note 13).
Deferred FCDAUnder the concession agreements’ entered into by the MWC Group with MWSS and TIEZA, MWCand Boracay Island Water Company (BIWC) are entitled to recover (refund) foreign exchange losses(gains) arising from concession loans and any concessionaire loans. MWC and BIWC recognizeddeferred FCDA (included as part of “Other noncurrent assets” or “Other noncurrent liabilities” in theconsolidated statement of financial position) for both realized and unrealized foreign exchange gainsand losses. Deferred FCDA is set up as an asset for the realized and unrealized exchange lossessince this is a resource controlled by MWC and BIWC as a result of past events and from whichfuture economic benefits are expected to flow to MWC and BIWC. Realized and unrealized foreignexchange gains, on the other hand, which will be refunded to the customers, are presented asliability. . As of December 31, 2019 and 2018, MWC and BIWC’s deferred FCDA classified under“Other noncurrent assets” amounted to P=1,669.04 million and P=2,620.32 million (see Note 25).
The deferred FCDA of MWC and BIWC arises from a rate adjustment mechanism for the recovery orcompensation on a current basis, subject to quarterly review and adjustment by MWSS or TIEZA,when necessary, of accrued foreign exchange gains and losses, arising from MWSS or TIEZA loansand concession loans used for capital expenditures and concession fee payments.
Further details on deferred FCDA of MWC and BIWC are provided in Note 15.
Deferred tax assetsThe Group reviews the carrying amounts of deferred income taxes at each reporting date andreduces deferred tax assets to the extent that it is no longer probable that sufficient taxable incomewill be available to allow all or part of the deferred tax assets to be utilized. However, there is noassurance that the Group will generate sufficient taxable income to allow all or part of deferred taxassets to be utilized. The Group looks at its projected performance in assessing the sufficiency offuture taxable income.
Further details on deferred tax assets are provided in Note 26.

- 68 -
*SGVFS039491*
Recognition and measurement of taxesThe Group has exposure to taxes in numerous jurisdictions. Significant judgment is involved indetermining the group-wide provision for taxes including value-added tax, consumption tax andcustoms duty. There are certain transactions and computations for which the ultimate taxdetermination is uncertain during the ordinary course of business. The Group recognizes liabilities forexpected tax issues based on estimates of whether additional taxes are due. Where the final taxoutcome of these matters is different from the amounts that were initially recognized, such differenceswill impact profit or loss in the period in which such determination is made.
Further details on the carrying amount of the Group’s income taxes payable are provided inNote 26.
Share-based paymentsThe expected life of the options is based on the expected exercise behavior of the stock optionholders and is not necessarily indicative of the exercise patterns that may occur. The volatility isbased on the average historical price volatility which may be different from the expected volatility ofthe shares of stock of the Parent Company and certain subsidiaries.
Further details on the share-based payments recognized by the Group are provided in Note 28.
Defined benefit plans (pension benefits)The cost of defined benefit pension plans are determined using actuarial valuations. The actuarialvaluation involves making various assumptions. These include the determination of the discountrates, future salary increases, mortality rates and future pension increases. Due to the complexity ofthe valuation, the underlying assumptions and its long-term nature, defined benefit obligations arehighly sensitive to changes in these assumptions. All assumptions are reviewed at each reportingdate.
In determining the appropriate discount rate, the Group considers the interest rates of governmentbonds that are denominated in the currency in which the benefits will be paid, with extrapolatedmaturities corresponding to the expected duration of the defined benefit obligation.
The mortality rate is based on publicly available mortality tables for the specific country and ismodified accordingly with estimates of mortality improvements. Future salary increases and pensionincreases are based on expected future inflation rates for the specific country.
Further details about the assumptions used are provided in Note 27.
Fair value of financial instrumentsWhere the fair values of financial assets and financial liabilities recorded in the consolidatedstatement of financial position or disclosed in the notes to the consolidated financial statementscannot be derived from active markets, they are determined using internal valuation techniques usinggenerally accepted market valuation models. The inputs to these models are taken from observablemarkets where possible, but where this is not feasible, estimates are used in establishing fair values.These estimates may include considerations of liquidity, volatility, and correlation. Further detailsabout the fair value of financial instruments are provided in Note 33.
Estimates effective January 1, 2019Leases- Estimating the incremental borrowing rateThe Group uses its incremental borrowing rate (IBR) to measure liabilities because the interest rateimplicit in the lease is not readily determinable. The IBR is the rate of interest that the Group wouldhave to pay to borrow over a similar term, and with a similar security, the funds necessary to obtainan asset of a similar value to the right-of-use asset in a similar economic environment. The IBRtherefore reflects what the Group ‘would have to pay’, which requires estimation when no observablerates are available (such as for subsidiaries that do not enter into financing transactions) or when theyneed to be adjusted to reflect the terms and conditions of the lease (for example, when leases are notin the subsidiary’s functional currency). The Group estimates the IBR using observable inputs (such

- 69 -
*SGVFS039491*
as market interest rates) when available and is required to make certain entity-specific estimates(such as the subsidiary’s stand-alone credit rating).
The Group’s lease liabilities amounted to P=22.4 billion as of December 31, 2019.
5. Cash and Cash Equivalents
This account consists of the following:
2019 2018
(In Thousands)Cash on hand and in banks (Note 32) P=50,403,614 P=26,213,080Cash equivalents (Note 32) 43,001,639 34,411,183
P=93,405,253 P=60,624,263
Cash in banks earns interest at the prevailing bank deposit rates. Cash equivalents are short-term,highly liquid investments that are made for varying periods of up to three months depending on theimmediate cash requirements of the Group and earn interest at the prevailing short-term rates.
6. Short-term Investments
Short-term investments pertain to money market placements made for varying periods of more thanthree months but less than one year and earn interest ranging from 0.9% to 6.0% per annum in 2019and 1.8% to 4.6% per annum in 2018.
7. Accounts and Notes Receivable
This account consists of the following:
20192018
(As Restated)
(In Thousands)
Trade:
Real estate and hotels P=124,310,805 P=138,300,975
Electronics manufacturing 14,687,014 16,202,397
Power generation 4,689,762 1,072,345
Automotive 3,047,040 2,896,516
International and others 848,985 47,348
Information technology and Outsourcing 314,422 261,012
Water (Note 25) – 2,614,044
Advances to other companies 23,593,209 24,842,066
Receivable from related parties (Note 32) 14,491,228 8,964,594
Receivable from officers and employees (Note 32) 1,505,310 1,497,997
Dividend receivable (Note 32) 145,010 1,334,894
Receivable from BWC – 388,411
Others (Note 32) 1,384,578 388,518
189,017,363 198,811,117
Less allowance for expected credit losses 2,428,362 3,016,237
186,589,001 195,794,880
Less noncurrent portion 55,720,290 41,803,297
P=130,868,711 P=153,991,583

- 70 -
*SGVFS039491*
The classes of trade receivables of the Group follow:
Real estate and hotelsReal estate receivables consist of:
· Residential, commercial and office development - pertain to receivables from the sale of high-end, upper middle-income and affordable residential lots and units; economic and socializedhousing units and sale of commercial lots; sale of office units; and leisure communitydevelopments.
· Corporate business - pertain to lease receivables from office and factory buildings andreceivables from sale of industrial lots
· Shopping centers - pertain to lease receivables from retail spaces
· Construction contracts - pertain to receivables from third party construction projects
· Management fees - pertain to receivables from facilities management services
· Others - pertain to receivables from hotel operations and other support services
Residential, commercial and office development receivables are collectible in monthly installmentsover a period of one (1) to ten (10) years. These are carried at amortized cost using the effectiveinterest rate method with annual interest rates ranging from 6.3% to 13.5%. Titles to real estateproperties are transferred to the buyers only once full payment has been made.
Corporate business receivables are collectible on a monthly or quarterly basis depending on the termsof the lease contracts.
Receivables from shopping centers, construction contracts and management fees are due within30 days upon billing.
Receivables from hotel operations and other support services are normally due within 30 to 90 daysupon billing.
ALI Group sold real estate receivables on a without recourse basis to partner mortgage banks,which include BPI Family Savings Bank, a related party, totaling P=9,976.3 million in 2019 andP=12,867.2 million in 2018. These were sold at a discount with total proceeds of P=9,281.2 million andP=12,041.9 million, respectively. ALI Group recognized loss on sale amounting to P=775.2 million in2019 and P=825.3 million in 2018 (see Note 23).
Electronics manufacturingPertain to receivables arising from manufacturing and other related services for electronic productsand components and have credit terms averaging 80 days from invoice date.
Power generationPower generation receivables pertain to ACEI Group’s receivable from Philippine Electric MarketCorporation (PEMC), National Grid Corporation of the Philippines (NGCP), National TransmissionCorporation (TransCo) for the FIT and from the Group’s bilateral customers. It consists of bothnoninterest-bearing and interest-bearing receivables. The term is generally 30-to-60 days.
AutomotiveAutomotive receivables relate to sale of passenger cars, motorcycles and commercial vehicles andare collectible within 30 to 90 days from date of sale.
International and othersInternational and other receivables arose from investments in overseas property companies andprojects, charter services, agri-business and others and are generally on 30- to 60- day terms.
WaterWater receivables arise from water and sewer services rendered to residential, commercial, semi-business and industrial customers of MWC Group and are collectible within 30 days from billing date.

- 71 -
*SGVFS039491*
These receivables also include receivables from pipework services collectible within 12 months,receivables from distributors’ fees arising from the Exclusive Distributorship Agreement (EDA)entered into by Manila Water Total Solutions Corp. (MWTS), a wholly-owned subsidiary of MWC, withdistributors of its Healthy Family drinking water which are collectible within the period that is agreedwith the distributors and receivables arising from supervision fees on the development of water andused water facilities which are collectible within thirty (30) days from billing date.
OutsourcingOutsourcing receivables arise from venture capital for technology businesses; provision of value-added content for wireless services, online business-to-business and business-to-consumer services;electronic commerce; technology infrastructure sales and technology services; and onshore- andoffshore-ourtsourcing services and are normally collected within 30- to 60- days from invoice date.
The nature of the Group’s other receivables follows:
Advances to other companiesAdvances to other companies mainly pertain to ALI’s advances to joint venture partners that havebeen made in consideration of project costs and purchases of land that are still subject to completion.The documentation for these advances provides that these will be payable over a fixed term or ondemand in order to allow for repayment of the advances when closing does not occur.
Advances to other companies also includes receivables from MRT Development Corporation(MRTDC) shareholders which pertains to interest-bearing advances made by North Triangle DepotCommercial Corporation (NTDCC) to MRTDC equivalent to the Pre-2006 Development RightsPayment (DRP) Payables and the Residual Depot DRP which is due more than one year, in relationto the funding and repayment agreement. As of December 31, 2019 and 2018, receivables fromMRTDC shareholders amounted to P=422.3 million and P=436.7 million, respectively.
On December 17, 2014, NTDCC and MRTDC shareholders executed a “funding and repaymentagreement” wherein the latter agrees to repay NTDCC, for the account of MRTDC, its respective prorata share in the Total Depot DRP Advances (the Pre-2006 DRP Payables and the Residual DepotDRP, including 15% interest rate accrued on such DRP payables).
Commencing on January 1, 2015, the MRTDC Shareholders shall effect the repayment of theirrespective pro rata share in the Total Depot DRP Payables, through a set-off against their respectiveshare in the commercial center royalties to be received from ALI Group.
Set off shall be effective as of the beginning of every calendar month, commencing January 30, 2015and shall result in the settlement of the portion of the Total DRP Payables to the extent of the amountof the commercial center royalties then the balance will fall due to the relevant MRTDC Shareholders.
In 2019, AC Industrial extended a loan to RCI amounting to P=1.6 billion which bears interest at therate of 16% per annum and which accrue from, and shall be paid by RCI, beginning on the secondanniversary of the commencement of business of KPMC. For the succeeding years until therepayment date, interest on the principal amount of the loan shall accrue with respect to theoutstanding amount of the loan at the rate of 8% per annum and is payable for a period of 10 years.As of December 31, 2019, loans receivable from RCI amounted to P=1.7 billion.
Receivables from officers and employeesReceivable from officers and employees pertain to housing, car, salary and other loans granted to theGroup’s officers and employees which are collectible through salary deduction, are interest bearing(6.0% per annum) and have various maturity dates.
The Group entered into agreements with BPI Asset Management and Trust Corporation (BPI Trust)in 2019 and 2018 for the assignment of interest-bearing employee receivables amounting toP=108.9 million and P=11.3 million, respectively. The transactions were without recourse and did notresult to any gain or loss.

- 72 -
*SGVFS039491*
Receivables from BWCReceivables from BWC pertain to the assigned receivables from the share purchase agreementbetween MWC and Veolia Water Philippines, Inc. (VWPI) related to the acquisition of VWPI’s interestin Clark Water Corporation (CWC) in 2011.
The assigned receivable will be paid by BWC at an amount equal to 30% of the product consumed byall of BWC’s customers and the tariff imposed by MWC on its customers falling under thecorresponding classification pursuant to the Concession Agreement, and all amounts received byBWC as connection fees from customers, and any fee BWC may charge in relation to theinterconnection with the wastewater treatment plant of areas of developments outside the BWCservice area. The assigned receivable from BWC is interest bearing and MWC Group classifies ascurrent the portion of its gross receivable from BWC that is due within the next twelve (12) months inaccordance with the agreed terms.
On December 27, 2019, BWC and MWC entered into a Settlement Agreement for the pre-terminationof the assigned receivable on that date for P=334.89 million.
Interest income earned from receivable from BWC amounted to P=27.81 million, P=28.08 million, andP=34.64 million in 2019, 2018, and 2017, respectively (see Note 25).
OthersOther receivables include accrued interest receivable and other nontrade receivables from non-related entities which are non-interest bearing and are due and demandable. This also includesreceivable from the DPWH pertaining to the additional costs incurred by the Parent Company in theconstruction of the Daang Hari-South Luzon Expressway (SLEX) Link Road arising from thegovernment directive to revise the interconnection design of the road amounting to P=215.9 million(see Note 13).

- 73 -
*SGVFS039491*
Movements in the allowance for expected credit losses follow (amounts in thousands):
2019
Real Estate
and Hotels
Electronics
Manufacturing
Water
Infrastructure
Automotive
and Others Outsourcing
Power
Generation
Parent
Company Total
At January 1 P=872,268 P=105,908 P=1,239,761 P=77,783 P=176,552 P=367,369 P=176,597 P=3,016,238
Provisions during the year (Note 23) 675,923 14,998 111,532 31,647 22,369 147,675 4,660 1,008,804Write-offs (254,498) (1,534) – – (10,221) – – (266,253)
Reversals/Adjustments (Note 23) (107,148) − (50,651) (17,437) (102) (100,984) (276,322)Reclassification/Others (252) 779 – − 180 274,487 (28,657) 246,537
Reclassification to PFRS 5 (Note 25) − − (1,300,642) − − − − (1,300,642)
At December 31 P=1,186,293 P=120,151 P=− P=91,993 P=188,778 P=688,647 P=152,600 P=2,428,362
*Disclosure of individually and collectively impaired receivables is not required under PFRS 9.
2018
Real Estate
and Hotels
Electronics
Manufacturing
Water
Infrastructure
Automotive
and Others Outsourcing
Power
Generation
Parent
Company Total
At January 1 P=725,946 P=100,373 P=1,064,885 P=78,480 P=174,758 P=352,562 P=148,159 P=2,645,163
Provisions during the year (Note 23) 236,048 4,640 199,118 16 1,896 14,807 35,991 492,516Write-offs (652) (3,623) – – – – – (4,275)Reversals/Adjustments (Note 23) (89,074) – (24,242) (713) (102) – (11,323) (125,454)
Reclassification/Others – 4,518 – – – – 3,770 8,288
At December 31 P=872,268 P=105,908 P=1,239,761 P=77,783 P=176,552 P=367,369 P=176,597 P=3,016,238
*Disclosure of individually and collectively impaired receivables is not required under PFRS 9.

- 74 -
*SGVFS039491*
8. Inventories
This account consists of the following:
2019 2018
(In Thousands)At cost: Residential and condominium units and offices P=67,924,015 P=52,254,774 Residential and commercial lots 52,363,671 51,704,811 Materials and supplies 5,783,188 10,682,612 Vehicles 4,142,126 4,640,443 Work-in-process 832,632 681,059 Finished goods 282,823 106,041 Others 468,676 151,048
131,797,131 120,220,788
At NRV: Materials, supplies and others 2,616,629 307,610 Finished goods 268,639 2,888 Work-in-process 381,904 − Parts and accessories − 29,207
3,267,172 339,705
P=135,064,303 P=120,560,493
A summary of the movements of real estate inventories is set out below.
2019
Residential andCommercial Lots
Residential andCondominium
units and Offices Total
(In Thousands)Opening balances at January 1 P=52,116,837 P=52,254,774 P=104,371,611Land acquired during the year 7,598,083 − 7,598,083Construction/Development costs incurred 7,160,927 49,232,278 56,393,205Borrowing costs capitalized − 122,682 122,682Disposals (recognized as cost of sales) (15,772,399) (43,580,602) (59,353,001)Transfers from/to investment properties and
other assets 1,260,223 9,894,883 11,155,106
P=52,363,671 P=67,924,015 P=120,287,686
2018
Residential andCommercial Lots
Residential andCondominium
units and Offices Total
(In Thousands)Opening balances at January 1 P=44,106,425 P=46,739,183 P=90,845,608Land acquired during the year 6,694,113 540,324 7,234,437Acquisition through business combination – 13,620,873 13,620,873Construction/Development costs incurred 23,640,668 29,317,230 52,957,898Borrowing costs capitalized – 167,036 167,036Disposals (recognized as cost of sales) (29,520,948) (38,263,140) (67,784,088)Transfers from/to investment properties and
other assets 7,196,579 133,268 7,329,847
P=52,116,837 P=52,254,774 P=104,371,611
The Group recognized provision for inventory obsolescence amounting to P=236.6 million andP=125.5 million in 2019 and 2018, respectively and recorded a reversal of provision for inventoryobsolescence amounting to P=13.7 million in 2017. The provision is included under “General andadministrative expenses” in the consolidated statements of income (see Note 23).
The cost of the inventories carried at NRV amounted to P=2,370.1 million and P=348.8 million as ofDecember 31, 2019 and 2018, respectively.

- 75 -
*SGVFS039491*
Inventories recognized as cost of sales amounted to P=129.0 billion, P=134.4 billion and P=132.8 billionin 2019, 2018 and 2017, respectively, and were included under “Costs of sales” in the consolidatedstatements of income (see Note 23).
9. Other Current Assets
This account consists of the following:
2019 2018
(In Thousands)Input VAT P=15,877,481 P=15,694,759Prepaid expenses 15,374,122 13,546,821Advances to contractors 13,260,900 11,452,729Financial assets at FVTPL 9,726,080 9,236,804Creditable withholding tax 5,546,478 4,771,550Derivative assets (Notes 33 and 34) 338,612 65,788Deposits in escrow 239,526 322,666Concession financial receivable − 193,199Others 2,569,795 2,443,710
P=62,932,994 P=57,728,026
Input VATInput VAT is applied against output VAT. The remaining balance is recoverable in future periods.
Prepaid expensesPrepaid expenses mainly include prepayments for commissions, marketing fees, advertising andpromotions, taxes and licenses, rentals and insurance. ALI’s cost to obtain contracts which includesprepaid commissions and advances to brokers amounted to P=2,876.2 million and P=2,662.0 million in2019 and 2018, respectively. In line with ALI Group's accounting policy, if a contract or specificperformance obligation exhibited marginal profitability or other indicators of impairment, judgment wasapplied to ascertain whether or not the future economic benefits from these contracts were sufficientto recover these assets. In performing this impairment assessment, management is required to makean assessment of the costs to complete the contract. The ability to accurately forecast such costsinvolves estimates around cost savings to be achieved over time, anticipated profitability of thecontract, as well as future performance against any contract specific key performance indicators thatcould trigger variable consideration, or service credits (Note 15).
Advances to contractorsAdvances to contractors represents prepayments for the construction of inventories.
Financial Assets at FVTPLTRG InvestmentsFinancial assets at FVTPL includes the Group’s investment in the common and preferred shares ofThe Rohatyn Group (TRG) Allocation LLC and TRG Management LP (collectively TRG investments)amounting to US$21.7 million (P=1.1 billion) and US$5.7 million (P=292.9 million), respectively in 2019and US$37.8 million (P=1.9 billion) and US$5.4 million (P=283.9 million), respectively in 2018.
In 2019 and 2018, the Group made additional investment in TRG investments amounting toUS$0.2 million (P=10.1 million) and US$1.4 million (P=73.6 million), respectively, representing capitalcall for the year.
As of December 31, 2019 and 2018, the Group’s remaining capital commitment with the TRGInvestments amounted to US$0.1 million (P=5.0 million) and US$0.3 million (P=15.8 million),respectively.

- 76 -
*SGVFS039491*
Unit Investment Trust Fund (UITF) investmentsAs of December 31, 2019, ALI Group invested in BPI Money Market Fund (MMF) with a fair value ofP=80.9 million. The BPI MMF’s Net Asset Value (NAV) was at P=23,980.6 million with duration of131 days.
As of December 31, 2018, ALI Group invested in BPI MMF with a fair value of P=71.6 million. The BPIMMF’s NAV was at P=8,331.5 million with duration of 150 days.
As of December 31, 2019 and 2018, the carrying value of ALI Group’s UITF investments amounted toP=96.4 million and P=85.7 million, respectively.
ARCH FundIn 2007, the private equity fund, called ARCH Capital Asian Partners, L.P. (ARCH Fund I) wasestablished. The ARCH Fund I achieved its final closing, resulting in a total investor commitment ofUS$330.0 million in 2007. As of December 31, 2019 and 2018, the carrying amount of the BHLGroup’s investment in ARCH Fund I amounted to US$0.7 million (P=35.4 million) and US$1.1 million(P=57.8 million), respectively.
In 2019 and 2018, the ARCH Fund I returned capital amounting to US$0.9 million (P=45.6 million) andUS$1.2 million (P=63.1 million), respectively. The proceeds from the return of capital of ARCH Fund 1came from its real estate project called The Concordia. Phase 1 to 3 of The Concordia was fully soldand hand over of units to buyers have already started.
In 2011, BHL Group committed to invest US$50.0 million in ARCH Capital’s second real estate fund,ARCH Capital-TRG Asian Partners, L.P. (ARCH Fund II), which had its first closing on June 30, 2011.As of December 31, 2019 and 2018, the carrying amount of the ARCH Fund II amounted toUS$17.08 million (P=864.8 million) and US$16.2 million (P=851.8 million), respectively.
On various dates in 2019 and 2018, ARCH Fund II made capital calls where BHL Group’s shareamounted to US$0.3 million (P=15.2 million) and US$0.1 million (P=5.3 million), respectively. In 2019and 2018, the ARCH Fund II returned capital amounting to US$0.1 million (P=5.1 million) andUS$13.3 million (P=699.3 million), respectively.
On July 1, 2014, the Group committed to invest 10% of capital raised, capped at US$50.0 million inARCH Capital’s third real estate fund, ARCH Capital-TRG Asian Partners III, L.P. (ARCH Fund III).As of December 31, 2019 and 2018, the carrying amount of the investment in the ARCH Fund IIIamounted to US$65 million (P=3,291.3 million) and US$58.5 million (P=3,075.9 million), respectively.
On various dates in 2019 and 2018, the ARCH Fund III made capital calls where the Group’s shareamounted to US$2.6 million (P=131.7 million) and US$11.5 million (P=604.7 million), respectively. In2019, the ARCH Fund III returned capital amounting to US$1.1 million (P=55.7 million).
As of December 31, 2019 and 2018, the Group’s remaining capital commitment with the ARCH FundIII amounted to US$5.0 million (P=253.2 million) and US$6.0 million (P=315.5 million), respectively.
On August 18, 2018, the Group committed to invest US$20.0 million in ARCH Capital’s fourth realestate fund, ARCH Capital Asian Partners IV, L.P. (ARCH Fund IV). As of December 31, 2019 and2018, the carrying amount of the investment in the ARCH Fund IV amounted to US$10.7 million(P=541.7 million) and US$1.7 million (P=85.6 million), respectively.
On various dates in 2019 and 2018, the ARCH Fund IV made capital calls where the Group’s shareamounted to US$9.7 million (P=492.1 million) and US$1.8 million (P=91.1 million), respectively. In 2019and 2018, the ARCH Fund IV returned capital amounting to US$3.2 million (P=162.0 million) andUS$0.1 million (P=5.0 million), respectively.
As of December 31, 2019 and 2018, BHL’s remaining capital commitment with the ARCH Fund IVamounted to US$11.7 million (P=592.4 million) and US$1.7 million (P=85.6 million), respectively.

- 77 -
*SGVFS039491*
ALI Group’s investment in ARCH Capital Fund pertains to monetary interest in a fund in which themanagement takes the view that these are held for trading and it is a portfolio of identified propertyfunds invested and managed by professional managers.
As of December 31, 2019 and 2018, ALI Group’s investment in ARCH Fund amounted toP=389.0 million and P=390.5 million , respectively. Contributions and return of capital in 2019 amountedto P=30.1 million and P=24.4 million, respectively. In 2018, contributions and return of capital amountedto P=2.7 million and P=69.8million, respectively.
Maloekoe Capital Fund 2Maloekoe Capital Fund 2 is a venture capital fund which focuses on technology investments inIndonesia and Southeast Asia. In 2017, the Group committed to invest up to US$2.0 million. As ofDecember 31, 2019 and 2018, the Group has invested US$0.2 million (P=10.1 million) andUS$0.2 million (P=12.6 million), respectively, in Maloeke Capital Fund 2 representing 15.38% of theClass A shares of the fund.
AlibabaAlibaba Group's New Retail Strategic Opportunities Fund is a fund which aims to invest in traditionalbrick-and-mortar retail companies based in China and integrate them with Alibaba's e-commerceplatform, leveraging on Alibaba's consumer reach, data scale and technology.
On January 12, 2018, ACVHC, through Total Jade Group Ltd., a wholly-owned subsidiary of BHL,invested an additional US$0.8 million to Alibaba’s New Strategic Retail Opportunities Fund.
As of December 31, 2019 and 2018, the carrying amount of the investment in the Alibaba amountedto US$0.7 million (P=35.7 million) and US$0.8 million (P=43.1 million), respectively.
Arbor Venture Fund I L.P. (Arbor Fund I)The Arbor Fund I is a private equity fund which focuses on providing funding for new ventures in thefinancial technology and services space. The fund has investments in companies providing big datadecision making (credit scoring, identity verification), asset management, payments processing, andon-line credit linked to payment processing, HR services, and cloud based accounting. OnNovember 29, 2017, AIVPL and Total Jade Group Limited (Total Jade), a wholly-owned subsidiary ofBHL, entered into an assignment and assumption agreement whereby AIVPL transferred andassigned all its rights with respect to its investment in Arbor Fund I at carrying amount. Total Jadecommitted to invest US$2.0 million in Arbor Fund I and Total Jade’s remaining capital commitment toArbor Fund I amounted to US$0.08 million and US$0.4 million as of December 31, 2019 and 2018,respectively.
In 2019 and 2018, Arbor Fund I made capital calls where the Group’s share amounted toUS$0.06 million (P=3.0 million) and US$0.3 million (P=22.9 million), respectively.
As of December 31, 2019 and 2018, the carrying amount of the investment in Arbor Fund I amountedto US$2.8 million (P=141.0 million) and US$2.3 million (P=123.0 million), respectively. The Group’sremaining capital commitment amounted to US$0.2 million (P=10.5 million) in 2018.
Arbor Venture Fund GP II, L.P (Arbor Fund II)Arbor Fund II is a fund which focuses on Asian financial technology firms. Total Jade has committedto invest up to US$2.0 million and Total Jade’s remaining capital commitment to Arbor Fund IIamounted to US$1.12 million and US$1.5 million as of December 31, 2019 and 2018, respectively.
As of December 31, 2019 and 2018, the carrying amount of the investment in Arbor Fund II amountedto US$0.7 million (P=39.4 million) and US$0.5 million (P=20.0 million), respectively.
In 2019, the Arbor Fund II returned capital amounting to US$0.1 million (P=5.1 million).

- 78 -
*SGVFS039491*
Indies Pelago Investments, L.P. (Indies Pelago)Indies Pelago targets relatively more mature, growth stage technology companies in Southeast Asia,givind investors access to technology sector leaders without the venture capital risk associates withearlier stage funding. As of December 31, 2019, the carrying amount of the investment amounted toUS$1.2 million (P=61.6 million).
Total Jade has committed to invest up to US$2.0 million and Total Jade’s remaining capitalcommitment to Indies Pelago amounted to US$0.8 million as of December 31, 2019.
Ikhlas Capital Fund, L.P. (Ikhlas)Ikhlas is a ASEAN-focused private equity fund. On 2 April 2019, Total Jade has committed to investup to US$20.0 million. As of December 31, 2019, Total Jade’s remaining capital commitment toIkhlas amounted to US$18.9 million. The carrying amount of the investment in Ikhlas amounted toUS$1 million (P=54.2 million) as of December 31, 2019.
Promissory Notes issued by CLOUSE S.A-Class C ordinary shares in Ant International Co. Limited
Fine State Group Limited subscribed US$10.0 million of the Promissiory Notes with the aggregate
subscription price of US$10.0 million issued by CLOUSE S.A., acting for the account of its
Compartment 41 on May 24, 2018.
According to the Promissiory Notes Subscription Letter, the Issuer shall use the net proceeds
received from the issuance of the Promissory Notes to acquire a number of Class C ordinary shares
in Ant International Co., Limited, which may be exchanged for the H shares or the A shares.
Ant International Co., Ltd operates Alipay, the world’s largest mobile and online payments platform aswell as Yu’e Bao, the world’s largest money-market fund. It also runs Sesame Credit, a third-partycredit rating system.
TRG Global Opportunity Fund (GOF) and TRG Special Opportunity Fund (SOF)The GOF is a multi-strategy hedge fund which invests primarily in emerging markets securities. TheSOF focuses on less liquid assets in emerging markets (Latin America, Asia, Emerging Europe,Middle East and Africa) such as distressed debt, NPLs, corporate high yield, mid and small capstocks, real estate (debt and equity) and private equity. In 2019 and 2018, the Group received returnof capital and realized loss amounting to nil (see Note 23).
The aggregate carrying amount of GOF and SOF amounted to US$1.3 million (P=65.8 million) andUS$1.3 million (P=68.4 million) as of December 31, 2019 and 2018, respectively.
Sares-Regis InvestmentsThe Group is also invested in Sares-Regis Multifamily Value-add Fund II LP (SRG II) and Sares-Regis Multifamily Value-add Fund III LP (SRG III), real estate private equity funds managed by theSares-Regis Group (SRG) based in California, USA, focused on multifamily property developments inthe Western USA. In 2017, the Group also co-invested with SRG II for the acquisition of a 319-unitapartment community in Rancho Cucamonga, California, USA (SRG Co-Investment) amounting toUS$4.8 million (P=239.7 million).
In 2019 and 2018, SRG II, SRG III, and the SRG Co-Investment collectively returned capitalamounting to US$3.2 million (P=162.0 million) and US$0.1 million (P=5.3 million), respectively. As ofDecember 31, 2019 and 2018, the carrying amount of the total investment in SRG II, SRG III, and theSRG Co-Investment amounted to US$25.3 million (P=1,281.1 million) and US$25.0 million(P=1,314.5 million), respectively. In 2018, this investment was reclassified as FVTPL from AFSfinancial assets as a result of the Group’s adoption of PFRS 9 (see Note 3).
Renewable Energy Test Center, RETC LLCAs of December 31, 2019, and 2018, the carrying amount of the investment in RETC amounted toUS$4.43 million (P=224.3 million) and US$4.69 million (P=246.6 million), respectively.

- 79 -
*SGVFS039491*
Wave ComputingIn 2017 and 2018, the Group invested US$2.2 million (P=109.8 million) and US$2.0 million(P=105.2 million) in Wave Computing, a start-up specializing in hardware for artificial intelligence andmachine learning. In 2018, this investment was reclassified as FVTPL from AFS financial assets as aresult of the Group’s adoption of PFRS 9.
These investments are accounted for at FVTPL. There is no change in management’s intention tohold the investments for trading purpose.
FibronosticsAHHI, through its technology arm, Vigos, expanded its digital portfolio with a recent investment inFibronostics, a global US-based healthcare technology company focusing on non-invasive algorithm-based solutions for diagnostic testing. The agreement was signed on May 31, 2019 between AHHIand SPRIM, the bioscience R&D firm from which Fibronostics was spun off. As of December 31,2019, the carrying amount of the investment amounted to P=32.4 million.
Tikehau (TKS I, LP)During 2018, AHHI invested in TKS I, LP, a Singapore limited partnership investing globally inhealthcare and life sciences industries. As at December 31, 2019 and 2018, the carrying amount ofthe investment amounted to P=13.2 million and P=5.8 million, respectively.
These investments are accounted for at FVTPL. There is no change in management’s intention to
hold the investments for trading purpose. Net changes in fair value of financial assets at FVTPL
amounting to P=394.8 million loss, P=81.4 million gain and P=18.8 million loss in 2019, 2018 and 2017,
respectively, is included under “General and administrative expenses” in the consolidated statements
of income (see Note 23).
Creditable withholding taxThe Group will be able to apply the creditable withholding taxes against income tax payable.
Deposits in escrowDeposits in escrow pertain to the proceeds from the sale of ALI Group that have been only grantedwith a temporary License To Sell (LTS) by the Housing and Land Use Regulatory Board (HLURB).For projects with temporary LTS, all payments, inclusive of down payments, reservation, and monthlyamortization, among others, made by the buyer within the selling period shall be deposited in anescrow account.
Concession financial receivableConcession financial receivable is accounted for in accordance with IFRIC 12, arising from the bulkwater contract between CMWDI and Metropolitan Cebu Water District (MCWD) whereby the facilitiesconstructed by CMWDI shall be used for the delivery of potable and treated water to MCWD at anaggregate volume of 18,000 cubic meters per day for the first year and 35,000 cubic meters per dayfor the succeeding years up to twenty (20) years at P=24.59 per cubic meter.
In 2019 and 2018, CMWDI also invoked the force majeure clause due to high water turbidity whichresulted to intermittent delivery of the required 35.0 million liters of water to MCWD. As a result,MCWD recognized P=1.35 million and P=3.34 million impairment loss for the years endedDecember 31, 2019 and 2018, respectively.
As of December 31, 2019 and 2018, concession financial receivable from the Bulk Water SupplyAgreement of MCWD amounted to P=1,054.54 million and P=1,047.04 million, respectively (seeNote 25).

- 80 -
*SGVFS039491*
The breakdown of the concession financial receivable is as follows:
2019 2018
(In Thousands)Current P=238,983 P=193,199Noncurrent 815,556 853,335
1,054,539 1,046,534Reclassification to PFRS 5 (Note 25) (1,054,539) −
P=− P=1,046,534
OthersIn 2019, others mainly include deferred charges. In 2018, others include accrued liquidated damages
(see Notes 12 and 23). On January 5, 2018, the 33% share transfer related to the sale was approved
by the Chinese government (see Note 23). The net gain recognized from sale amounted toUS$19.1 million, net of employee relocation incentive (see Note 23).
10. Investments in Associates and Joint Ventures
This account consists of the following:
2019 2018
(In Thousands)Investment in stocks - cost
Balance at beginning of year P=183,766,711 P=158,766,616Additions 16,280,890 38,118,448
Acquisition through business combination (Note 24) 6,819,774 −Transfers/Others (2,681,308) −Acquisition of control (9,157,794) (6,376,975)Reclassification to PFRS 5 (13,509,012) (6,741,378)
Balance at end of year 181,519,261 183,766,711
Accumulated equity in net earnings: Balance at beginning of year 57,706,372 47,771,969
Impact of adoption of PFRS 16 104,078 −Others/Impact of adoption of PFRS 9 169,520 (248,674)
Balance at the beginning of the year (as restated) 57,979,970 47,523,295 Equity in net earnings of continued operations during
the year 22,344,352 19,760,662 Equity in net earnings of segment under PFRS 5
during the year 653,502 699,142 Dividend income (7,772,351) (7,553,088)
Acquisition of control (502,406) (1,094,148)
Transfers/Others (766,419) −Provision and others
Provision (net) (839,419) (602,022)Dilution gain 91,629 62,997
Reclassification to PFRS 5 (1,784,596) (1,090,466)
Balance at end of year 69,404,262 57,706,372
Other Comprehensive Income: Balance at beginning of year (1,332,525) (3,889,285)
Adjustment (PFRS 9 and 15) − 1,912,454
Balance at the beginning of the year (as restated) (1,332,525) (1,976,831) Additions (deductions) (2,633,522) 644,306
Reclassification to PFRS 5 (226,200) −Balance at end of year (4,192,247) (1,332,525)
P=246,731,276 P=240,140,558

- 81 -
*SGVFS039491*
Details of the Group’s investments in associates and joint ventures and the related percentages ofownership are shown below:
Percentage of Ownership Carrying Amounts
2019 2018 2019 2018
(In Millions)Domestic:
Bank of the Philippine Islands (BPI) 32.9 32.9 P=108,440 P=101,691Liontide Holdings, Inc. (LHI)* 78.1 78.1 49,266 45,291
Globe Telecom, Inc. (Globe)* 30.9 30.9 25,654 23,215OCLP Holdings, Inc. (OHI) 21.0 21.0 8,540 8,118AA Thermal, Inc. 40.0 – 5,349 –
Emerging City Holdings, Inc. (ECHI)* 50.0 50.0 4,076 3,911Light Rail Manila Holdings, Inc. (LRMHI) 50.0 50.0 4,595 3,417South Luzon Thermal Energy Corp. (SLTEC)* – 35.0 – 3,042
GNPower Mariveles Coal Plant Ltd. Co (GMCP)** – 20.4 – 2,781ALI-ETON Property Development Corporation* 50.0 50.0 3,295 2,109GNPower Dinginin Ltd. Co. (GNPD)** – 50.0 – 2,023
AKL Properties, Inc.* 50.0 50.0 2,274 1,943Berkshires Holdings, Inc. (BHI)* 50.0 50.0 2,003 1,933Cebu District Property Enterprise, Inc. (CDPEI)* 35.0 35.0 1,443 1,464
Bonifacio Land Corporation (BLC) 10.0 10.0 1,479 1,428iPeople, Inc. (IPO) 33.5 – 5,183 –Philippine Wind Holdings Corporation (PWHC)* 42.9 42.9 1,662 1,420
Asiacom Philippines, Inc. (Asiacom)* 60.0 60.0 1,427 1,308IE Medica, Inc. (IEM) 49.0 – 1,192 –BF Jade E-Services Philippines, Inc. (BF Jade) 44.7 44.7 762 930
Rize-Ayalaland (Kingsway) GP Inc. (Rize-Ayalaland) 49.0 49.0 451 794Alveo-Federal Land Communities, Inc.* 50.0 50.0 904 789Generika Group* – 50.0 – 474Foreign:
Star Energy Salak-Darajat B.V. (incorporated inIndonesia) 19.8 19.8 11,041 10,280
Eastern Water Resources Development andManagement Public Company Limited (EasternWater) (incorporated in Thailand)*** – 20.0 – 8,623
Thu Duc Water B.O.O. Corporation (TDW)(incorporated in Vietnam) *** – 49.0 – 3,074
Kenh Dong Water Supply Joint Stock Company
(KDW) (incorporated in Vietnam)*** – 47.4 – 2,721Saigon Water Infrastructure Joint Stock Company
(Saigon Water) (incorporated in Vietnam)*** – 38.0 – 1,172
UPC-AC Energy Australia Ltd. (incorporated inAustralia)* 50.0 50.0 1,327 1,462
Yoma Strategic Holdings, Inc. (YSH) (incorporated in
Myanmar) 14.9 – 5,498 –Others Various Various 870 4,728
P=246,731 P=240,141
*Joint ventures** In accordance with the share purchase agreement, the Group reclassified portion of its effective holdings in GMCP and
GNPD as asset held for sale as of December 31, 2018. The closing of the agreement, however, is subject to certainconditions precedent that have not yet materialized as of date. Accordingly, the effective ownership of the Groupremained unchanged as of December 31, 2018.
***MWCI accounts reclassified to PFRS 5
Unless otherwise indicated, the principal place of business and country of incorporation of theGroup’s associates and joint ventures is the Philippines.
Except as discussed in subsequent notes, the voting rights held by the Group in its investments inassociates and joint ventures are in proportion to their ownership interest.

- 82 -
*SGVFS039491*
Financial information on significant associates follows:
BPI 2019 2018
(In Millions, except earningsper share)
Total resources P=2,205,030 P=2,085,228Total liabilities 1,931,996 1,833,690
Equity 273,034 251,538Less: non-controlling interest 3,457 3,017
Equity attributable to the equity holders of BPI 269,577 248,521
Share in equity 88,715 81,869Notional goodwill 20,131 20,131Adjustments in goodwill (406) (309)
Carrying value of investment 108,440 101,691
Net interest income and other income 94,334 78,524Total expenses 65,251 55,195Net income 29,083 23,329Net income attributable to: Equity holders of BPI 28,803 23,078 Non-controlling interests 280 251Group’s share in net income for the year 9,571 7,685Other comprehensive loss 128 (1,289)Group’s share in other comprehensive loss 39 (387)Total comprehensive income 29,211 22,040Total comprehensive income attributable to: Equity holders of BPI 28,769 21,878 Non-controlling interests 442 162Group’s share in total comprehensive income 9,613 7,251Basic and diluted earnings per share 6.39 5.35Dividends received from BPI P=2,503 P=2,503
BLC 2019 2018
(In Millions)
Current assets P=10,997 P=5,037
Noncurrent assets 32,438 37,539
Current liabilities 3,066 3,799
Noncurrent liabilities 7,176 6,559
Equity 33,193 32,218
Less: noncontrolling interest 14,896 14,492
Equity attributable to Parent Company 18,297 17,726
Proportion of Group’s ownership 10.1% 10.1%
Group’s share in identifiable net assets 1,848 1,790
Carrying amount of the investment 1,479 1,428
Negative goodwill (369) (363)
Revenue 5,790 4,925
Cost and expenses (3,150) (2,907)
Net income (continuing operations) 2,640 2,018
Net loss attributable to minority interest (1,243) (945)
Net income attributable to parent 1,397 1,074
Group’s share in net income for the year 141 108Total comprehensive income attributable to equity holders
of the Parent Company 1,397 1,074
Group’s share in total comprehensive income for the year 141 108
Dividends received P=81 P=71

- 83 -
*SGVFS039491*
LRMHI 2019 2018
(In Millions)Current assets P=2,341 P=2,241Noncurrent assets 28,066 18,873Current liabilities 2,115 802Noncurrent liabilities 15,293 11,515
Equity 12,999 8,797
Revenue 3,451 3,464Cost and expenses 2,822 2,819Net income 629 645Group’s share in net income for the year 220 226Total comprehensive income 613 669Group’s share in total comprehensive income
for the year 214 234Dividends received from LRMHI P=– P=–
Salak Darajat 2019 2018
(In Millions)
Current assets US$250 US$216Noncurrent assets 2,494 2,492Current liabilities 115 121Noncurrent liabilities 1,592 1,612
Equity 1,037 975Share in equity 206 193Fair value adjustment on land 15 13
Carrying value of investment 221 206
Revenue 332 227Cost and expenses (247) (171)Net income 85 56Group’s share in net income for the year 17 11Total comprehensive income 64 73Group’s share in total comprehensive income
for the year 13 14Dividends received from Salak Darajat US$– US$–
Financial information on significant joint ventures (amounts in millions, except earnings per share
figures) follows:
LHI 2019 2018
(In Millions)Current assets, including cash and cash equivalents
amounting to P=1,447.7 million in 2019 and P=636.2million in 2018 P=1,448 P=1,454
Noncurrent assets 53,950 49,906Current liabilities 91 1,074Noncurrent liabilities 8,969 8,970
Equity 46,338 41,316
Share in equity 36,177 32,257Notional goodwill 12,988 12,988Adjustments in goodwill 101 46
Carrying value of investment 49,266 45,291
Revenue 5,779 4,634Interest income 43 27Costs and expenses 422Net income 5,235 4,239Group’s share in net income for the year 4,089 3,335Other comprehensive income (loss) – 641Group’s share in other comprehensive loss – 501Total comprehensive income 5,235 4,880Group’s share in total comprehensive income 4,089 3,836Dividends received from LHI P=82 P=393

- 84 -
*SGVFS039491*
Globe 2019 2018
(In Millions)Current assets, including cash and cash equivalents
amounting to P=8.3 billion in 2019 andP=23.2 billion in 2018 P=61,739 P=73,523
Noncurrent assets 242,551 225,974Current liabilities including financial liabilities* amounting
to P=12.9 billion in 2019 and P=16.8 billion in 2018 84,577 85,467Noncurrent liabilities, including financial liabilities*
amounting to P=122.9 billion in 2019 and P=131.5 billionin 2018 138,466 140,889
Equity 81,247 73,143Less: non-controlling interest 135 24
Equity attributable the equity holders of the Parent 81,112 73,119
Share in equity 21,745 19,298Notional goodwill 3,939 3,939Adjustments in goodwill (30) (23)
Carrying value of investment 25,654 23,215
Revenue 166,660 151,173Interest income 500 391Costs and expenses Depreciation and amortization (34,144) (30,422) Interest expense (6,803) (6,915) Provision for income tax (10,544) (8,987)Net income 22,284 18,626Net income attributable to: Equity holders of the Parent 22,269 18,641 Non-controlling interests 14 (15)Share in net income for the year 6,774 5,646Other comprehensive income (2,253) 1,094Share in other comprehensive income (loss) for the year (696) 338Total comprehensive income 20,031 19,720Share in total comprehensive income for the year 6,078 5,934Earnings per share: Basic 162.96 135.91 Diluted 162.20 135.40Dividends received from Globe P=3,745 P=3,745
*excluding trade and other payables and provisions
2018
SLTEC GMCP ECHI OHI
(In Millions)Current assets P=4,239 US$253 P=10,421 P=18,304Noncurrent assets 16,478 647 32,371 16,354Current liabilities 3,025 104 3,285 8,828Noncurrent liabilities 10,098 716 7,479 18,713Equity 7,954 80 32,028 7,117Revenue 6,625 447 5,315 9,279Cost and expenses 5,647 321 3,112 7,468Net income 978 126 2,203 1,811Group’s share in net income 338 22 398 382Total comprehensive income 980 130 798 1,811Group’s share in total comprehensive
income for the year 338 22 399 382Dividends received P=173 US$5 P=200 P=27
In 2019, SLTEC became a wholly-owned subsidiary of ACEI pursuant to the acquisition of 20%interest from Axia on July 10, 2019.
In 2019, GMCP, ECHI and OHI were classified as associate with immaterial interest.

- 85 -
*SGVFS039491*
In addition to the interest in associates and joint ventures discussed above, the Group also hasinterest in a number of individually immaterial associates and joint ventures. Below is a summary ofcertain financial information concerning these immaterial associates and joint ventures:
2019 2018
(In Millions)Carrying amount P=52,330 P=23,977 Share in net income 1,125 90
Share in other comprehensive income (loss) (912) 648Share in total comprehensive income P=213 738
The following significant transactions affected the Group’s investments in associates and jointventures:
Investment in BPIOn January 17, 2018, the BOD of BPI approved the offering for subscription of up to 567.0 millionshares of BPI by way of a SRO up to P=50.0 billion.
On April 25, 2018, BPI completed the SRO, issuing 558,659,210 new common shares at P=89.50 pershare. The issuance received strong support from domestic and foreign shareholders such that atotal of 683,258,317 shares were subscribed, representing an oversubscription of 22.4%. The Groupsubscribed to its proportionate and unsubscribed rights share which was very minimal, raising itseffective ownership in BPI to 48.6%.
Adoption of PFRS 16On adoption of PFRS 16, the BPI Group recognized lease liabilities and right-of-use assets in relationto leases which has previously been classified as operating leases under principles of PAS 17. Theseliabilities were measured at the present value of the remaining lease payments, discounted using thelessee’s incremental borrowing rate as of January 1, 2019. As at January 1, 2019, the BPI Grouprecognized lease liabilities amounting to P=8,644 million (see Note 3). The associated right-of-useasset for property leases were measured at the amount equal to lease liabilities adjusted by theamount of any prepaid or accrued lease payments. The amount of prepaid lease paymentsamounted to P=407 million.
Adoption of PFRS 9The adoption of PFRS 9 resulted in changes in accounting policies and adjustments to the amountspreviously recognized by BPI Group. Resulting adjustments to the carrying amounts of financialassets and liabilities at the date of transition were recognized in the opening balance of Surplus andReserves of BPI Group as of January 1, 2018.
The adoption of PFRS 9 has resulted in changes mainly in BPI Group’s accounting policies forrecognition, classification and measurement and impairment of financial assets using the ECLmethod. There were no changes in the classification of financial liabilities.
The changes in BPI Group’s classification and measurement and impairment of financial assetsresulted to an increase in BPI’s surplus by P=62.0 million and decrease in accumulated othercomprehensive loss by P=4,111.0 million as of January 1, 2018, of which the Group’s share amountedto P=31.4 million and P=1,912.4 respectively.
Adoption of PFRS 15The impact of PFRS 15 adoption did not result to a significant change in the revenue recognition ofBPI Group.
BPI spunoff its BPI Asset Management and Trust Group (BPI AMTG) to a newly-established Stand-Alone Trust Corporation (SATC) named BPI Asset Management and Trust Corp. (BPI AMTC). BPIAMTC officially commenced its operations on February 1, 2017.

- 86 -
*SGVFS039491*
The fair value of the BPI shares held by the Group amounted to P=130.4 billion and P=139.4 billion asof December 31, 2019 and 2018, respectively.
Investment in LHIIn July 2018, LHI completed its subscription to 112,191,314 proportionate and unsubscribed rightsshare in BPI’s SRO by securing from a local bank a P=10.0 billion loan bearing 5.9134% interest perannum and maturing on April 20, 2025.
As of December 31, 2017, LHI owns 618,338,612 common shares of BPI representing a directownership interest in BPI of 20.1%. The Parent Company and GIC Special Investments Pte. Ltd.(GICSI), as joint venture partners, agreed to vote their BPI shares based on the common positionreached jointly by them as shareholders. In January 2017, the SEC approved the reclassification of48,574,200 of LHI’s Common B shares into redeemable preferred shares (RPS). In March 2017,Arran Investment Pte Ltd, the holder of these RPS, issued a notice to LHI for a redemption in-kindinvolving 10,913,830 RPS shares for 45,627,477 shares of BPI held by LHI. The redemption in-kindhas a total consideration of US$90.9 million (P=4.6 billion) worth of BPI shares. The cross at the PSEwas executed on May 5, 2017.
As of December 31, 2019 and 2018, LHI owns 904.2 million common shares of BPI representing adirect ownership interest in BPI of 20.1%. The Parent Company and GIC Special Investments(GICSI) Pte Ltd., the entity controlling Arran Investments Pte. Ltd., as joint venture partners, agreedto vote its BPI shares based on the common position reached jointly by them as shareholders.
The fair value of BPI shares held by LHI amounted to P=79.5 billion and P=85.0 billion as ofDecember 31, 2019 and 2018, respectively. In 2019, the effective ownership in LHI is 78.0%.
Investment in GlobeIn July 22, 2019, Globe sold its interest in AFPI to Globe Fintech Innovations for a total considerationof ₱240 million.
On September 11, 2019, the BOD of Globe through its Executive Committee, approved theacquisition of 51% of Yondu Inc., equivalent to 22,950 shares for P=501 million from Xurpass Inc. andthe signing of the corresponding Deed of Sale of Shares and other related definitive agreements.The transaction is consistent with Globe’s strategic imperative of developing its ICT capabilitiesresponsive to the changing needs of its customers. Yondu’s strong IT core competencies combinedwith Globe’s digital expertise will strengthen the value proposition of products and services catered toenterprise clients.
On October 25, 2019, Globe acquired 77% equity interest in ECPay from Payment One, Inc. and TheAndresons Group, Inc. Globe bought 49.28 million shares in the firm priced at P=31.25 per share. Thetransaction will enable small business owners to offer more products and services which in turn willstimulate the e-commerce industry and the digital economy, bringing Globe closer to its vision of adigitally-enabled Philippines.
On November 5, 2018, the BOD of Globe approved the proposed change in the dividend policy from75% to 90% of prior year’s core net income to 60% to 75% of prior year’s core net income applied tothe 2019 dividend declaration. The amended policy provided Globe with increased flexibility withrespect to capital management. This adjustment will also ensure the sustainability of the operations inthis investment-heavy environment, while protecting future dividends, once planned expansion yieldsbeneficial results.

- 87 -
*SGVFS039491*
In 2019, Globe Group adopted PFRS 16. Prior to adoption of PFRS 16, the Globe Group recognizedrental expense on its operating leases on a straight line basis over the term of lease. In adoptingPFRS 16, the Globe Group used the modified retrospective approach wherein the cumulative effect ofthe initial application of the standards were recognized at January 1, 2019, and the comparativeperiods were not restated. The Globe Group also applied transitional reliefs and practical expedientsfor the measurements of leasel libialities and right of use assets arising from leases previouslyclassified as operating lease. As of January 1, 2019, the Globe Group recognized right-of-use assetsamounting to P=3,483.2 million and lease liabilities of P=3,443.3 million with a decrease on retainedearnings amounting to P=336.5 million.
In 2018, Globe Group adopted PFRS 9 and 15 and the resulting adjustments were recognized in theopening balance of retained earnings as of January 1, 2018.
The impact of the adoption of PFRS 15 and 9 on the Globe Group’s retained earnings as ofJanuary 1, 2018 is as follows:
a) PFRS 15 - increase in retained earnings as of January 1, 2018 by P=4.9 billion, of which theGroup’s share is P=1.5 billion, brought about by:
· Re-allocation of contract consideration between wireless communication services and thesale of handsets
· Capitalization of certain commissions and installation costs as deferred contract costs andamortized over the period when the performance obligations are satisfied
· Deferral of installation fees as contract liabilities and recognized as revenue on a straight-linebasis over the subscription contract
b) PFRS 9 - decrease in retained earnings as of January 1, 2018 by P=5.6 billion, of which theGroup’s share is P=1.7 billion, brought about by the recognition of additional impairment losses onsubscriber receivables under the ECL method.
On February 28, 2017, Globe and PLDT each subscribed to 2,760,000 new preferred shares to beissued out of the unissued portion of the existing authorized capital stock of Vega Telecom, Inc. (VTI),at a subscription price of P=4,000 per subscribed shares (inclusive of a premium over par of P=3,000per subscribed share) or a total subscription price of P=11,040 million (inclusive of a premium over parof P=8,280 million). Globe’s and PLDT’s assigned advances from San Miguel Corporation (SMC),which amounted to P=11,040 million, were treated as subscription for future stock subscription by VTIand applied subsequently as full payment of the subscription price.
Also, on the same date, Globe and PLDT each subscribed to 800,000 new preferred shares to beissued out of the unissued portion of the existing authorized capital stock of VTI, at a subscriptionprice of P=4,000 per subscribed share (inclusive of a premium over par of P=3,000 per subscribedshare), or a total subscription price of P=3,200 million (inclusive of a premium over par of P=2,400million). Globe and PLDT each paid P=148 million in cash for the subscribed shares. The remainingbalance of the subscription price shall be paid by Globe and PLDT upon call of the VTI BOD.
On February 17, 2017, Globe Telecom and its wholly-owned subsidiaries, GFI/Mynt and GlobeCapital Venture Holdings, lnc. (GCVHI) entered into an investment agreement with Alipay and theParent Company, for Alipay and the Parent Company to invest in the unissued common shares ofGFI/Mynt.
On September 27, 2017, following the approval from PCC, GFI/Mynt received the capital infusionfrom Alipay and the Parent Company through ACVHC amounting to P=2,784.60 million in exchange forGFI/Mynt’s 513 million common shares. The issuance of shares to Alipay and ACVHC dilutedGCVHI’s ownership interest to 45% and resulted in a loss of control over GFI/Mynt. Thereafter,investment in GFI/Mynt was accounted for as a joint venture under equity method since no singleparty controls the arrangement and approvals of all parties are required for business decisions. Thetransaction resulted in a gain on fair value of retained interest in Globe’s consolidated financialstatements amounting to P=1,889.9 million in 2017.

- 88 -
*SGVFS039491*
The fair value of Globe shares held by the Parent Company amounted to P=83.2 billion andP=78.2 billion as of December 31, 2019 and 2018. In 2019, the effective ownership in Globe is 30.9%.
The Parent Company also holds 60% ownership interest in Asiacom, which owns 158.5 million Globepreferred shares and 460.0 million AC preferred shares as of December 31, 2019 and 2018. TheParent Company does not exercise control over Asiacom and Globe since it is a joint venture withSingapore Telecommunications Limited (SingTel).
Investment in OHIOHI owns 99.5% interest in Ortigas & Company Limited Partnership (OCLP), an entity engaged inreal estate development and leasing businesses. In 2016, ALI acquired a 21.0% stake in OHIconsistent with its thrust of expanding its operations to other areas within and outside of Metro Manilathrough partnerships. The acquisition was made possible via the purchase of shares from existingOHI shareholders, and this was recorded under “Investments in associates and joint ventures”account for P=7,320.7 million. In 2017, the Group finalized the purchase price allocation of itsacquisition of OHI through business combination in March 2016. The final purchase price allocationresulted in gain from bargain purchase of P=148.0 million included under “Other income”(see Note 23).
Investment in AA ThermalOn February 28, 2019, the PCC approved the acquisition by Aboitiz Power Corporation (AboitizPower) of a 49% voting interest and 60% economic interest in AA Thermal. This follows the signingof a share purchase agreement on September 26, 2018 between Aboitiz Power and AMNHB (asubsidiary of ACEI). During the first half of 2019, ACEI completed the sale valued atUS$574.19 million (P=29,731.6 million).(see Note 25).
Investment in IPOOn October 1, 2018, AEI and IPO executed a memorandum of agreement (MOA) for the merger, withIPO as the surviving entity and with HI and the Parent Company owning 48.18% and 33.5%,respectively (see Note 10 for assets held for sale). The merger, which was approved by thestockholders of IPO and AEI on December 12, 2018 and December 5, 2018, respectively, wasapproved by the PCC on December 12, 2018. On January 31, 2019, AEI and IPO executed the Planand Articles of Merger, as approved by their respective boards of directors and stockholders.
Also on January 31, 2019, the Parent Company executed a share purchase agreement for 7.28% ofIPO with some of its stockholders, subject to the approval by the SEC of the merger and theeffectivity thereof.
The Plan and Articles of Merger were submitted to the SEC on February 8, 2019 and were approvedon April 24, 2019.
The merger involved combining AEI’s assets which included the APEC Schools, University of NuevaCaceres and National Teachers College and IPO’s assets which included the Mapua University,Malayan Colleges Laguna, Malayan Colleges Mindanao and Malayan High School of Science. Thevaluation of each school and asset under AEI and IPO was determined using standard net assetvalue and discounted cash flow methodologies.
On May 2, 2019, the merger became effective pursuant to the terms of the Plan of Merger. House ofInvestments, Inc. and its affiliates, and the Parent Company, now control 51.3% and 33.5%,respectively, of listed IPO. The transaction values the combined entity at approximately P=15.5 billion.
The Parent Company received approximately P=4.4 billion worth of primary IPO shares from themerger. Additionally, the Parent Company acquired P=0.8 billion worth of secondary IPO sharesresulting in a total cost of investment in IPO at P=5.2 billion.
The gain on the merger transaction amounted to P=0.8 billion and was recorded in the Group’sconsolidated Other Income (see Note 23).

- 89 -
*SGVFS039491*
Key assets of IPO, post-merger, consist mainly of land, property and equipment and intangibles.Notional goodwill on this new investment amounted to P=1.9 billion (see Note 24).
The fair value of IPO shares held by the Parent Company amounted to P=3,319.9 million as ofDecember 31, 2019.
Investment in ECHI, BHI and BLCALI’s 5.32% direct investment in BLC and 4.78% through Regent Time International, Limited (RegentTime) are accounted for using the equity method because ALI has significant influence over BLC.On April 17, 2003, the following transactions were consummated pursuant to the terms andconditions of the Assignment Agreement (Agreement), dated February 8, 2003, among ALI,Evergreen Holdings, Inc. (EHI), Greenfield Development Corporation and Larouge,B.V. (Larouge), as amended, and the Agreement, dated November 23, 2002, among ALI, EHIand Neo Oracle Holdings, Inc. ([formerly Metro Pacific Corporation (MPC)] as amended:
(a) The assignment to ALI and EHI of the rights and obligations of Larouge under the loanagreement between Larouge and MPC, pursuant to which, Larouge extended MPC a loan in theprincipal amount of US$90.0 million, together with all the rights, title and interests of Larouge inthe pledge constituted on 50.38% of the outstanding shares in BLC. The consideration paid byALI and EHI for such assignment was approximately US$90.0 million, subject in part to foreignexchange adjustment.
(b) The assignment to ALI and EHI [acting in this instance through the joint venture corporation,Columbus Holdings, Inc. (Columbus)] of the controlling interests in BLC representing 50.38% ofBLC’s outstanding capital stock. The assignment was effected by MPC under a dacion en pagoarrangement, and included an assignment of payables of BLC in the principal amount ofP=655.0 million together with its underlying security in the form of shares in Fort BonifacioDevelopment Corporation (FBDC) representing 5.6% of its outstanding capital stock.
The Agreement, as amended, also provides for the constitution of a pledge over 5% of BLC’sunencumbered shares as security for contingent liabilities and breach of representation andwarranties. The pledge lien over the 5% BLC shares shall continue to subsist until the thirdanniversary of the closing date.
ALI and EHI jointly hold the 50.38% equity interest in BLC through ECHI and BHI. ALI and EHIassigned the notes receivable from MPC to ECHI and BHI, which acquired the shares of stock ofColumbus. Columbus directly owns the 50.38% interest in BLC. BLC owns 55% interest in FBDC,the primary developer of certain areas in Fort Bonifacio Global City for residential, commercial andbusiness development.
Columbus accounted for the acquisition of the 50.38% interest in BLC using the purchase method,resulting in a negative goodwill of P=1.4 billion.
Subsequent to this, ALI and EHI acquired additional shares of BLC through a combination of directacquisition and through its associates at varying dates as follows:
On July 31, 2008, the Group acquired, through ALI, Regent and Columbus, additional 4,360,178shares of BLC from FBDC amounting to P=689.0 million, equivalent to 7.66% ownership in BLC. InJanuary and October 2009, a total of 2,295,207 BLC shares were acquired from Development Bankof the Philippines and MPC, pertaining to the pledged shares, through Columbus amounting toP=362.6 million. This resulted in an increase in the Group’s effective interest in BLC to 45.05% as ofDecember 31, 2009.
In 2011, BLC redeemed its 3,485,050 preferred shares with an aggregate redemption price ofP=500.0 million.

- 90 -
*SGVFS039491*
Investment in Light Rail Manila Holdings, Inc. (LRMHI)LRMHI was incorporated on June 23, 2014, as a holding company for the LRT 1 Cavite extensionproject. LRMHI holds 70% of the total equity of Light Rail Manila Corporation (LRMC), the projectcompany established for the construction, operation and maintenance of the LRT 1 Cavite extensionproject. AC Infra owns 50% of the shares of LRMHI that ultimately resulted to a 35% interest inLRMC.
As of December 31, 2019, the upgrade of propulsion, train control and management systems of theLRT 1 generation 2 trains were 93.3% and 85.0% complete, for the project management to on-siteinstallation and defect liability period and tuning phases, respectively. The rehabilitation of eleven(11) rectifier subs-stations and the design, supply and installation of CCTV, access control, andsecurity network systems were at 73.4% and 80.1% complete, respectively.
As of December 31, 2019 and 2018, AC Infra’s remaining equity investment commitment for theLRT 1 project amounted to P=2.9 billion and P=4.1 billion, respectively.
Investment in SLTECSLTEC is a 50-50 joint venture between ACEI and PHINMA Energy Corporation (PEC) incorporatedfor the construction and operation of the 135 MW power plant in Calaca, Batangas. The power plantemploys the environment-friendly Circulating Fluidized Bed boiler technology. SLTEC will operate asa base load plant to serve the anticipated demand for power in the Luzon grid. On April 24, 2015 andFebruary 26, 2016, Unit 1 and 2 have achieved Commercial Operations Date (COD), respectively.Upon COD, PEC entered into a 15-year power purchase agreement to purchase all of the generatedoutput of SLTEC.
On December 20, 2016, ACEI sold 5,374,537 common shares and 5,374,537 preferred shares inSLTEC to Axia Power Holdings Philippines Corp. (Axia Power), a subsidiary of Marubeni Corporation,which resulted in a net gain of P=1.2 billion. The transaction resulted in the decrease in ownershipinterest of ACEI in SLTEC from 50% to 35%.
SLTEC became a wholly-owned subsidiary of the ACEI pursuant to the acquisition of 20% interestfrom Axia on July 10, 2019 (see Notes 2 and 24).
Investment in GMCPOn August 29, 2017, GMCP signed a Notes Facility Agreement with certain lenders for an aggregateprincipal amount of US$800.0 million (the NFA). Financial Closing under the NFA was successfullyachieved on September 29, 2017 with the proceeds of the loan being used to refinance its existingloan obligations, return of capital to the partners, and for other general corporate purposes.
GMCP recognized loan breakage costs and accounting mark-to-market losses amounting toUS$45.8 million due to refinancing, which in turn reduced the equity earnings of ACEI byP=396.0 million as of December 31, 2017.
Following the return of capital to the project sponsors and owners last October 12, 2017, the sharingpercentage of ACEI (through its limited partnership interest) increased from 17.0246% to20.3372%, pursuant to the terms of the Second Amended and Restated Limited PartnershipAgreement for GMCP.
Effective January 29, 2018, AMPLC became the legal and registered owner of the limited partnershipinterest in GMCP.
On September 20, 2018, AA Thermal, a wholly owned affiliate of ACEI was incorporated.
On September 24, 2018, ACEI transferred 100% of its limited partnership interests in each of AMPLCand DPHLC to AA Thermal. The transfer is part of ACEI’s restructuring plan for its thermal assets.The AA Thermal platform will initially consist of ACEI’s limited partnership interests in GMCP, theowner and operator of an operating 2x316 MW coal plant in Mariveles, Bataan, and in GNPD, the

- 91 -
*SGVFS039491*
developer and owner of a 2x668 MW supercritical coal plant project in Dinginin, Bataan, which iscurrently under construction.
On September 25, 2018, ACEI and AMNHB signed a subscription agreement for the purchase ofshares of stock of AA Thermal.
On September 26, 2018, Aboitiz Power Corp. (Aboitiz Power) entered into a share purchaseagreement with ACEI Group for the acquisition of 12.20% effective interest in GMCP and 30.00%effective interest in GNPD. The closing of the sale transaction is subject to conditions precedent(including the approval by the PCC). The transaction was valued at US$579.2 million. After the sale,the Group’s effective ownership in GMCP and GNPD will be reduced to 8.13% and 20%, respectively.
Consequently, as a result of the share purchase agreement, the Group’s interest in GMCP andGNPD, in so far as it relates to the portion to be sold to Aboitiz Power is reclassified to noncurrentasset held for sale as of December 31, 2018 (see Note 9). ACEI Group also determined that theasset held for sale shall be carried at reclassification date at the carrying value of the two investmentsamounting to P=5,635.3 million since this is lower than the fair value less cost to sell of US$579.20million.
ALI-ETON Property Development Corporation (ALI-ETON)ALI-ETON Property Development Corporation was incorporated on March 13, 2016. ALI-ETON is ajoint venture between ALI and LT Group, Inc. The ALI and LT Group, Inc. entered into an agreementon January 21, 2016 to jointly develop a project along the C5 corridor. The project is envisioned to bea township development that spans portions of Pasig City and Quezon City.
In 2019 and 2018, ALI made additional equity infusions to ALI-Eton to fund the developmentrequirements of Parklinks amounting to P=1,195.0 million and P=1,534.0 million as of December 31,2019 and 2018 respectively.
Investment in GNPDGNPD achieved financial close for its first 2x600 MW plant and its second unit for 2x668 MW super-critical coal fired power plant, in Dinginin, Bataan on September 2, 2016 and December 12, 2017,respectively. The estimated project cost of the GNPD Project is US$1.7 billion with the debtcomponent to be provided by Philippine banks. The GNPD Project will support the increasingelectricity demand of Luzon and Visayas. Construction of the first unit is well underway, and istargeted for commercial operations by 2019, with the second unit scheduled for completion by 2020.As of December 31, 2019 and 2018, ACEI’s remaining total capital commitment on its investment inGNPD amounted to US$82.2 million.
Investment in AKLAKL Properties, Inc. is a 50:50 joint venture between Ayala Land, Inc. and Royal Asia Land, Inc., andis organized primarily for future mixed-use development in South Luzon area.
Investment in Cebu District Property Enterprise, Inc.Cebu District Property Enterprise, Inc. (CDPEI) was incorporated on February 20, 2014 and is a50:50 joint venture between ALI and Aboitiz Land, Inc. CDPEI’s main purpose is to create a mixed-use commercial and residential district with the 15.4 hectare property in Subangdaku, Mandaue. OnApril 11, 2014, ALI’s 50% equity was further broken down to 35% ALI, 10% CHI and 5% CPVDC.
Investment in PWHCIn 2014, the DOE issued a Certificate of Endorsement for FIT for the wind power project after it wascommissioned and started commercial operations (see Note 38).
On April 13, 2015, the wind power project received their Feed-in-Tariff Certificate of Compliance (FITCOC) from the Energy Regulatory Commission (ERC). This entitled the wind power project to a feed-in-tariff (FIT) of P=8.53 per kilowatt hour for a period of 20 years from November 11, 2014 toNovember 10, 2034.

- 92 -
*SGVFS039491*
Investment in IEMIn 2019, Ayala Healthcare Holdings, Inc, through its wholly-owned subsidiary AHCHI PharmaVentures, Inc. acquired 490,000 ordinary shares in IE Medica Inc. representing 49% of equityinterest. The acquisition cost of the investment amounted to P=931 million which includes a contingentconsideration amounting to P=250.2 million and a call option amounting to P=15.7 million. This resultedin AHCHI Pharma Ventures obtaining significant influence over IE Medica. The investment inassociate account includes a notional goodwill amounting to P=719.1 million arising from theacquisition. Share in net identifiable assets on the date of acquisition amounted to P=211.9 million.
The call options for both acquisitions was accounted for as a “Derivative asset” in the consolidatedfinancial statements.
Investment in BF JadeOn February 23, 2017, the Parent Company, ALI , BPI Capital Corporation (BPI Capital), andKickstart Ventures Inc. (Kickstart) signed an investment agreement to acquire ownership stakes in BFJade, subject to the fulfillment of certain closing conditions, including the approval of theacquisition by the PCC. BF Jade is the owner and operator of online fashion platform ZaloraPhilippines (Zalora). BPI Capital and Kickstart are wholly owned subsidiaries of BPI and Globe,respectively. The transaction will result in the following ownership interest by new investors over BFJade: Parent Company at 43.28%, while the rest at 1.91% each for a total of 49% for the AyalaGroup.
On August 14, 2017, certain conditions precedent to closing the transaction have been complied with,including the approval (or deemed approval) from the PCC.
On August 31, 2017, the parties completed the closing of the transaction and the new investorssubscribed to shares of BF Jade. The Parent Company and ALI assigned their rights to subscribe totheir wholly owned subsidiaries ACVHC and AMSI,Inc., respectively.
As of January 31, 2018, the parties, BF Jade, ACVHC, ALI Kickstart and BPI Capital, completedthe post-closing conditions of the acquisition of BF Jade and made their respective capitalcontributions to BF Jade. ACVHC paid P=334.7 million while AMSI, Inc., BPI Capital and Kickstartpaid P=14.8 million.
The valuation of BF Jade was based on enterprise value/sales multiples of similar e-commercefashion companies.
In 2018, the PPA for the above acquisition was finalized. ACVHC’s total investment amounted toP=1,113.9 million. As of December 31, 2019 and 2018, the fair values of the identifiable assets andliabilities acquired amounted to P=1,293.4 million and P=1,171.3 million, respectively. ACVHC’s share inthe net assets of BF Jade is P=53.0 million and corresponding notional goodwill on this investmentamounted to P=1,060.9 million which formed part of the carrying amount of the investment as ofDecember 31, 2018 and 2017. The goodwill recognized on the acquisition can be attributed toZalora’s brand and current workforce.
On October 4, 2018, ACVHC infused additional capital of P=151.9 million at the same valuation as thelast infusion. AMSI, Inc. BPI Capital and Kickstart waived their right to infuse additional capital. As aresult, ACVHC assumed their portion of the capital infusion, increasing the ownership stake of AVCHto 43.89% from 43.28%. Following AVCH’s infusion, Ayala Group’s combined ownership remained at49.00%.
Investment in Rize-AyalalandRize-Ayalaland (Kingsway) GP, Inc. was incorporated on January 25, 2013 under the laws of BritishColumbia, Canada. ALI’s effective ownership is 49% through its Vancouver-based subsidiary,AyalaLand Real Estate Investments Inc.

- 93 -
*SGVFS039491*
Investment in Alveo-Federal Land Communities, Inc. (AFLCI)Alveo signed a Joint Venture Agreement (JVA) with Federal Land, Inc. last April 29, 2015 for equalownership over AFLCI. The JV is for the development of Project Lexus located in Laguna nearNuvali.
Investment in Generika Group of CompaniesOn March 13, 2019, AHHI subscribed to an additional 2.5% stake in each of the Generika companiesnamely Actimed, Novelis, PharmGen and Erikagen with a total subscription price of P=78.0 million. OnJune 3, 2019, the proposed increase in stake was approved by PCC and on July 4, 2019, AHHIproceeded with the closing of the increase to 52.5% equity stake in Erikagen, Inc.
AHHI recognized a gain amounting to ₱281.91 million as a result of measuring at fair value its 50%equity interest in Generika held before the business combination (see Note 24).
Investment in AFPIAFPI was incorporated on February 10, 2014 and is engaged in the design, construction, installationand operation and maintenance of a contactless automated fare collection system for public utilitytransport facilities. AC Infra, Globe and BPI owns 10%, 20% and 20%, respectively of the totalshares and voting interest of AFPI.
In 2019 and 2018, AC Infra made P=35.0 million and P=30.0 million equity infusion, respectively, for thefull payment of preferred shares subscribed to in 2018 and subscription to additional 47.13 millionpreferred shares.
AFPI has incurred operating losses since the launch of its contactless smartcard for the stored valueridership and contactless medium technology as replacement of the old-magnetic-based ticketingsystem. The target growth turned significantly lower than actual and expectation has also beentempered by AFPI’s revenue generation forecasts. On this basis and following the key requirementsof PAS 36 wherein assets can be carried at no more than their recoverable amount, management hasrecognized impairment provisions of nil and P=78.4 million in 2019 and 2018, respectively. As ofDecember 31, 2019 and 2018, the net carrying value of the investment in AFPI amounted to nil.
As of December 31, 2019 and 2018, AC Infra’s remaining equity investment commitment for theproject amounted to P=90.0 million and P=125.0 million, respectively.
Investment in Isla BioOn March 20, 2018, ACEI through Presage and Zabaleta & Co. Inc. entered into a share purchaseagreement for the acquisition of 21,484 common shares in Negros Island Biomass Holdings (Isla Bio)which represents 42.97% interest in Isla Bio. Isla Bio is the entity that holds interests in the 3biomass plants in Negros - San Carlos BioPower, South Negros BioPower and North NegrosBioPower.
In 2019, the purchase price allocation for the above acquisition was finalized. ACEI Group’sinvestment amounted to P=154.66 million. As of December 31, 2019, the fair values of identifiableassets and liabilities acquired amounted to P=0.85 million and P=0.59 million, respectively. ACEIGroup’s share in net assets of IslaBio is P=0.11 million and corresponding notional goodwill on thisinvestment amounted to P=154.55 million which formed part of the carrying amount of the investmentas of December 31, 2019 and 2018. The goodwill recognized on the acquisition can be attributed tofuture earnings from the company’s investments in three biomass plants (1) San Carlos BioPower, (2)South Negros BioPower and (3) Negros BioPower which were still under construction uponacquisition of IslaBio.
Investment in Star Energy Salak-Darajat B.V. (Salak-Darajat)On March 31, 2017, ACEI, as part of an Indonesian consortium, completed the purchase andacquisition of Chevron’s geothermal assets and operations in Indonesia. The Indonesia consortiumconsists of ACEI (with significant influence as a result of its 19.8% economic stake), Star EnergyGroup Holdings Pte. Ltd., Star Energy Geothermal Pte. Ltd., and Electricity Generating Public

- 94 -
*SGVFS039491*
Company Ltd. and the acquisition was made through their joint venture company, Star EnergyGeothermal (Salak-Darajat) B.V. The Indonesia assets and operations include the Darajat and Salakgeothermal fields in West Java, Indonesia, with a combined capacity of 637MW of steam and power.
On July 24, 2017, ACEI together with Star Energy Geothermal Holdings, Pte. Ltd. entered intodefinitive agreements for the transfer of 99% of their consortium interests in ACEI-Star Holdings, Inc.(ACEI-Star) to AllFirst Equity Holdings, Inc. ACEI-Star is the special purpose company that signed ashare sale and purchase agreement with Chevron in December 2016 to acquire Chevron’s Philippinegeothermal assets subject to the satisfaction of certain conditions precedent, including the approval ofthe PCC.
In 2018, the purchase price allocation for the above acquisition was finalized. As of December 31,2018 and 2017, ACEI’s investment in Salak-Darajat amounted to US$168.5 million. The identifiableassets and liabilities acquired and goodwill arising from the transaction follows: Salak-Darajat’sassets and liabilities amounting to US$2,677.2 million and US$1,826.7 million, respectively. Assetsinclude developed and undeveloped geothermal intangible assets amounting to US$44.3 million andUS$1,196.2 million, respectively, which will not be amortized but will be subjected to impairmentassessment. ACEI’s corresponding notional goodwill on this investment amounted to US$0.1 millionand is included as part of the carrying value of the investment as of December 31, 2018 and 2017.
Investmen in YSHOn October 14, 2019, Yoma Strategic Holdings Ltd. (YSH) announced its decision to form apartnership with ACEI. YSH and ACEI are looking to establish a 50:50 joint venture that will see ACEIand YSH working together to drive the growth of Yoma Micro Power (S) Pte. Ltd. (Yoma MicroPower).
Both parties have signed a binding term sheet which envisages the joint venture investing at least$30 million into Yoma Micro Power. The new joint venture plans to invest in Yoma Micro Power andwill jointly explore developing around 200MW of additional renewable energy projects within Myanmarincluding participation in large utility scale renewable projects.
On November 8, 2019, the Parent Company signed definitive agreements to acquire a 20% stake inYSH and another 20% stake in First Myanmar Investment Public Co. (FMI). The total considerationfor the investment is US$237.5 million.
The investment in YSH, which total US$155 million, will be implemented in two-tranches – US$108.6million for 14.9% of the outstanding shares and US$46.4 million for 5.1% of the outstanding shares ofthe company. The completion of the YSH transaction is subject to the satisfaction of certainconditions precedent, including approvals by the Singapore Exchange of the listing of the YSH sharesto be subscribed.
VIP Infrastructure Holdings Pte Ltd, a subsidiary of Bestfull and YSH have closed the first tranche ofthe placement shares, with the Parent Company having been allotted shares equivalent to 14.9% ofthe outstanding shares of YSH and having paid the price therefore. The Singapore Exchange hasapproved the listing of the shares allotted to the Parent Company.
The investment in FMI will be via US$82.5 million convertible loan. The completion of the FMItransaction is subject to the satisfaction of certain conditions precedent, including approvals by theCentral Bank of Myanmar of the convertible loan.
Investment in UPC Renewables AustraliaOn May 23, 2018, ACEI participated in the Australian renewables market through a joint venture withinternational renewable energy developer, UPC Renewables Australia. ACEI has investedUS$30.0 million (P=1,519.1 million) for 50% ownership in UPC’s Australian business and is alsoproviding US$200.0 million facility to fund project equity.

- 95 -
*SGVFS039491*
UPC Renewables Australia is developing the 1,000 MW Robbins Island and Jims Plain projects inNorth West Tasmania and the 600 MW New England Solar Farm located near Uralla in New SouthWales. UPC Renewables Australia also has a further development portfolio of another 3,000 MW’slocated in NSW, Tasmania and Victoria
In 2019, the purchase price allocation for the above acquisition was finalized. As of December 31,2019, the fair values of identifiable assets and liabilities acquired amounted to US$3.48 million(P=176.2 million) and US$6.59 million (P=333.7 million), respectively. ACEI Group’s share in netliabilities of UPC Australia (HK) Ltd. is US$1.45 million and corresponding notional goodwill on thisinvestment amounted to US$31.45 (P=1,592.5) million which formed part of the carrying amount of theinvestment as of December 31, 2019 and 2018. The goodwill recognized on the acquisition can beattributed to the cost of pre-development of different renewable energy projects and the right toparticipate in wind and solar energy projects in Australia through the joint venture company.
Investments in UPC Sidrap HK Ltd. and UPC Renewables Asia III Ltd. (UPC III)On January 21, 2017, ACEI signed investment agreements with UPC Renewables Indonesia Ltd. forthe development, construction, and operation of a wind farm project in Sidrap, South Sulawesi,Indonesia (the Sidrap Project). The project will be developed through PT UPC Sidrap Bayu Energi(UPC Sidrap), a special purpose company based in Indonesia and 72%-owned by UPC RenewablesAsia III Ltd. The Sidrap Project, with generating capacity of 75 MW, started commercial operations inApril 2018 and is the first utility-scale wind farm project in Indonesia once completed. The investmentin UPC Sidrap HK Ltd. is comprised of 1,130 Redeemable Class B shares amounting to US$6.4million (P=334.0 million). In 2017, ACEI SG infused a total of US$23.7 million to UPC RenewablesAsia III Ltd. representing 51% ownership interest.
In 2018, the purchase price allocation for the above acquisition was finalized. The fair values of theidentifiable assets and liabilities acquired and goodwill arising from the transaction follows: net assetsand liabilities amounting US$0.2 million. Assets include certain project development assets. ACEI’scorresponding notional goodwill on this investment amounted to US$23.5 million is included as part ofthe carrying amount of the investment as of December 31, 2018 and 2017.
In 2019, ACEI Group made additional investment amounting to P=69.99 million.
Investment in MCTOn January 2, 2018, ALI Group through RWIL acquired an additional 17.24% share in MCT Bhd for atotal cost of RM202.5 million (P=2.6 billion) which brought ALI’s shareholding in MCT to 50.19% from32.95%. On February 19, 2018, as a result of the mandatory take-over offer, ALI Group’sshareholdings in MCT increased from 50.19% to 72.31% (see Note 24).
Investment in IPOOn October 1, 2018, AEI and IPO executed a memorandum of agreement (MOA) for the merger, withIPO as the surviving entity and with HI and the Parent Company owning 48.18% and 33.5%,respectively (see Note 10 for assets held for sale). The merger, which was approved by thestockholders of IPO and AEI on December 12, 2018 and December 5, 2018, respectively, wasapproved by the PCC on December 12, 2018. On January 31, 2019, AEI and IPO executed the Planand Articles of Merger, as approved by their respective boards of directors and stockholders.
Also on January 31, 2019, the Parent Company executed a share purchase agreement for 7.28% ofIPO with some of its stockholders, subject to the approval by the SEC of the merger and theeffectivity thereof.
The Plan and Articles of Merger were submitted to the SEC on February 8, 2019 and were approvedon April 24, 2019.

- 96 -
*SGVFS039491*
The merger involved combining AEI’s assets which included the APEC Schools, University of NuevaCaceres and National Teachers College and IPO’s assets which included the Mapua University,Malayan Colleges Laguna, Malayan Colleges Mindanao and Malayan High School of Science. Thevaluation of each school and asset under AEI and IPO was determined using standard net assetvalue and discounted cash flow methodologies.
On May 2, 2019, the merger became effective pursuant to the terms of the Plan of Merger. House ofInvestments, Inc. and its affiliates, and the Parent Company, now control 51.3% and 33.5%,respectively, of listed IPO. The transaction values the combined entity at approximately P=15.5 billion.
The Parent Company received approximately P=4.4 billion worth of primary IPO shares from themerger. Additionally, the Parent Company acquired P=0.8 billion worth of secondary IPO sharesresulting in a total cost of investment in IPO at P=5.2 billion.
The gain on the merger transaction amounted to P=0.8 billion and was recorded in “Other income” inthe Group’s consolidated statements of income (see Note 23).
Key assets of IPO, post-merger, consist mainly of land, property and equipment and intangibles.Notional goodwill on this new investment amounted to P=1.9 billion (see Note 24).
The fair value of IPO shares held by the Parent Company amounted to P=3,319.9 million as ofDecember 31, 2019.
OthersInvestment in Globe Fintech Innovations, Inc. (Mynt)On February 17, 2017, the Parent Company and Ant Financial Services Group (Ant Financial) signedan investment agreement, with closing conditions, to subscribe to new shares of Mynt, a holdingcompany for financial technology businesses operating under Globe Capital Venture Holdings, Inc.(GCVHI), a wholly-owned subsidiary of Globe. Through this transaction, the Parent Company will own10% of Mynt.
The PCC approved the transaction on August 23, 2017 paving the way for the deal closing where theParent Company (through ACVHC) and Ant Financial will subscribe to new shares of Mynt. OnSeptember 27, 2017, parties completed the closing of this transaction.
Standard valuation methodologies such as the use of comparable company multiples and discountedcash flows were used to determine fair value computations and in preparing the purchase priceallocation.
In 2018, the PPA for the above acquisition was finalized. ACVHC’s investment amounted toP=506.3 million. With Mynt’s assets and liabilities valued at P=4,975.7 million and P=1,805.2 million,respectively, ACVHC’s corresponding notional goodwill on this investment amounted toP=189.3 million and is included as part of the carrying amount of the investment as ofDecember 31, 2018 and 2017.
On December 16, 2019, Mynt issued new shares in exchange for additional capital infusion fromGCVHI and Ant Financial. The Parent Company (through ACVHC) did not participate in this capitalcall, leading to a dilution of the Parent Company’s ownership in Mynt to 7.6%.
As of and for the period ended December 31, 2019, the Parent Company has unrecognized share oflosses of Mynt amounting to P=353.9 million.

- 97 -
*SGVFS039491*
Investment in PT STUPT STU is incorporated in Indonesia with principal place of business in Semarang, Indonesia. OnMarch 6, 2018, MWC through its wholly-owned subsidiary PT Manila Water Indonesia (PTMWI),acquired 4,478 ordinary shares in PT STU to own twenty percent (20%) of the outstanding capitalstock. The acquisition cost of the investment amounted to P=37.0 million (IDR10.00 billion). Theinvestment in associate account includes a notional goodwill amounting to P=1.1 million arising fromthe acquisition of shares of stock in PT STU. Share in net identifiable assets on date of acquisitionamounted to P=35.9 million.
Investment in The Blue Circle Pte. Ltd. (TBC)On April 26, 2018, AC Energy International Pte Ltd. (ACEI SG), a wholly owned subsidiary of ACEI,and Jetfly Asia Pte. Ltd. executed a Share Sale Purchase Agreement for the acquisition of 25%interest in TBC. ACEI’s investment in TBC is US$1.9 million representing ownership of 489,227ordinary shares (SGD1.00 par value per share). TBC has a platform of wind projects in theSoutheast Asia.
In 2019, the purchase price allocation for the above acquisition was finalized. ACEI Group’sinvestment amounted to US$1.90 million (P=96.2 million). As of December 31, 2019, the fair values ofidentifiable assets and liabilities acquired amounted to US$4.29 million (P=217.22 million) andUS$6.40 million (P=324.1 million), respectively. ACEI Group’s share in net liabilities of TBC isUS$0.53 million (P=26.8 million) and corresponding notional goodwill on this investment amounted toUS$2.43 million (P=123.0 million) which formed part of the carrying amount of the investment as ofDecember 31, 2019 and 2018. The goodwill recognized on the acquisition can be attributed to cost ofpre-development of wind projects and the right to participate in wind projects in Southeast Asiathrough TBC.
On May 6, 2019, ACEI in partnership with TBC signed a Shareholders' Agreement to jointly construct,own and operate the Mui Ne Wind Farm located at the Binh Thuan province, Southeastern coast ofVietnam. Construction for the 40 MW first phase will commence immediately with an estimated costof US$92 million, to be financed by debt and equity. The Mui Ne Wind Farm has an expansionpotential of up to 170 MW. ACEI accounts for over 62% of the economic ownership including its 50%direct voting stake. Project completion of the first phase is expected in the first half of 2020, in time forthe new wind feedin-tariff deadline of November 2021.
SIAL CVS Retailers, Inc.,SIAL CVS Retailers, Inc., FamilyMart Co., Ltd., and ITOCHU Corporation have concluded thetransaction to sell 100% of the outstanding shares of Philippine FamilyMart CVS, Inc. (PFM) toP-H-O-E-N-I-X Petroleum Philippines, Inc. (PNX), further to a Memorandum of Agreement (MOA)entered into by the parties last October 30, 2017.
PFM is the official Area Franchisee of the Family Mart brand of convenience stores in the Philippineswith a current network of 67 company-owned and franchised stores all over the country. Prior to thistransaction, SIAL CVS Retailers, Inc., a 50-50 joint venture company between ALI Capital Corp. (a100% subsidiary of ALI) and SSI Group, Inc. (SSI), owned 60% of PFM, while Japanese companies,FamilyMart Co., Ltd. and ITOCHU Corporation, owned 37.6% and 2.4% respectively.
The transaction was approved by the PCC last January 3, 2018.
As of December 31, 2019 and 2018, the Group has no contingent liabilities in relation to itsinvestments in associates and joint ventures.
On certain investments in associates and joint ventures, the Group entered into shareholders’agreements with fellow shareholders.

- 98 -
*SGVFS039491*
11. Investment Properties
The movements in investment properties follow:
2019
Land BuildingConstruction-
in-Progress Total
(In Thousands)
CostBalance at beginning of the year P=84,568,399 P=119,517,201 P=55,415,158 P=259,500,758Additions 16,965,958 10,567,896 9,484,719 37,018,573
Exchange differences (93,531) (135,484) − (229,015)Disposals (1,350,405) (460,762) − (1,811,167)Transfers (10,920,160) (392,605) (353,335) (11,666,100)
Balance at end of year 89,170,261 129,096,246 64,546,542 282,813,049
Accumulated depreciation and
amortizationBalance at beginning of the year – 31,725,769 − 31,725,769Depreciation and amortization (Note 23) – 4,404,491 − 4,404,491
Disposals – (178,584) − (178,584)Exchange differences – (406) − (406)
Balance at end of year – 35,951,270 − 35,951,270
Accumulated impairment lossesBalance at beginning and end of year 129,441 – – 129,441
Net book value P=89,040,820 P=93,144,976 P=64,546,542 P=246,732,338
2018
Land BuildingConstruction-
in-Progress Total
(In Thousands)Cost
Balance at beginning of the year P=85,924,880 P=95,058,339 P=49,660,703 P=230,643,922Additions 6,346,917 16,744,741 13,781,075 36,872,733Acquisition through business
combination (Note 24) 1,223,498 4,489,137 − 5,712,635Exchange differences 209,538 107,665 − 317,203Disposals (1,642,908) (115,958) − (1,758,866)
Transfers (7,493,526) 3,233,277 (8,026,620) (12,286,869)
Balance at end of year 84,568,399 119,517,201 55,415,158 259,500,758
Accumulated depreciation and
amortizationBalance at beginning of the year – 27,641,070 – 27,641,070Depreciation and amortization (Note 23) – 4,068,284 – 4,068,284
Disposals – (3,892) – (3,892)Exchange differences – 20,307 – 20,307
Balance at end of year – 31,725,769 − 31,725,769
Accumulated impairment lossesBalance at beginning and end of year 129,441 − − 129,441
Net book value P=84,438,958 P=87,791,432 P=55,415,158 P=227,645,548
Certain parcels of land are leased to several individuals and corporations. Some of the leasecontracts provide, among others, that within a certain period from the expiration of the contracts, thelessee will have to demolish and remove all improvements (such as buildings) introduced or builtwithin the leased properties. Otherwise, the lessor will cause the demolition and removal thereof andcharge the cost to the lessee unless the lessor occupies and appropriates the same for its own useand benefit.
Construction in progress pertain to buildings under construction to be leased as retail and officespaces upon completion.

- 99 -
*SGVFS039491*
The aggregate fair value of the Group’s investment properties amounted to P=495.8 billion in 2019 andP=328.1 billion in 2018. The fair values of the investment properties were arrived at using the MarketData Approach and Income Approach for land and buildings, respectively, and were determined byindependent professionally qualified appraisers.
2019Fair value measurement using
Date of Valuation Total
Quoted pricesin activemarkets
(Level 1)
Significantobservable
inputs
(Level 2)
Significantunobservable
inputs
(Level 3)
(In Thousands)Land properties Various P=278,165,996 P=– P=– P=278,165,996
Retail properties Various 109,835,314 – – 109,835,314Office properties Various 106,628,343 – – 106,628,343Hospital properties Various 1,215,483 – – 1,215,483
2018Fair value measurement using
Date of Valuation Total
Quoted pricesin active
markets(Level 1)
Significantobservable
inputs(Level 2)
Significantunobservable
inputs(Level 3)
(In Thousands)
Land properties Various P=152,670,030 P=– P=– P=152,670,030Retail properties Various 73,034,911 – – 73,034,911Office properties Various 101,208,761 – – 101,208,761
Hospital properties Various 1,143,511 – – 1,143,511
The fair values of the land were arrived at using the Market Data Approach. Market Data Approachprovides an indication of value by comparing the subject asset with identical or similar assets forwhich price information is available. This approach was used for the land as it is commonly used inthe property market since inputs and data for this approach are available. For Market Data Approach,the higher the price per sqm., the higher the fair value.
The fair values of the buildings (retail, office, hospital) were arrived using the Income Approach.Income Approach provides an indication of value by converting future cash flow to a single currentvalue. Under the income approach, the value of an asset is determined by reference to the value ofincome, cash flow or cost saving generated by the asset.
The significant unobservable inputs to valuation of investment properties ranges fromP=1,500-P=278,000 per sqm.
Interest capitalized amounted to P=22.8 million, P=19.0 million and P=17.7 million in 2019, 2018 and2017, respectively. The capitalization rates are 4.41-7.00%, 2.00-7.65% and 2.50-4.75% in 2019,2018 and 2017, respectively.
Consolidated rental income from investment properties amounted to P=31.7 billion in 2019,P=28.5 billion in 2018 and P=24.3 billion in 2017. Consolidated direct operating expenses arising fromthe investment properties amounted to P=6.8 billion in 2019, P=5.9 billion in 2018 and P=4.7 billion in2017, respectively.
Depreciation and amortization expense pertaining to investment properties amounted to P=4.4 billionin 2019, P=4.1 billion in 2018 and P=3.5 billion in 2017 (see Note 23).

- 100 -
*SGVFS039491*
12. Property, Plant and Equipment
The movements in property, plant and equipment follow:
2019
Land,
Buildings and
Improvements
(Note 19)
Plant,
Machinery
and
Equipment
Hotel
Property and
Equipment
(Note 19)
Furniture,
Fixtures and
Equipment
Transportation
Equipment
Construction-
in-Progress Total
(In Thousands)
Cost
At January 1 P=27,212,611 P=29,176,676 P=14,441,262 P=12,920,124 P=6,005,215 P=44,914,550 P=134,670,438
Additions 3,045,218 2,985,108 4,525,214 2,485,320 557,831 4,955,680 18,554,371
Additions through business
combination (Note 24) 7,624,019 17,724,790 – 112,232 46,554 177,721 25,685,316
Disposals (213,484) (1,408,671) – (157,062) (269,378) – (2,048,595)
Transfers (248,250) 901,780 596,297 (76,562) 32,506 (1,136,676) 69,095
Exchange differences 506,909 (431,143) – 67,400 39,968 1,318,596 1,501,730
Others – 596,386 (876,748) 8,773 305,987 149,042 183,440
Reclassifications PFRS 5 (2,015,117) (3,335,393) – (2,512,959) (1,351,124) (48,493,248) (57,707,841)
At December 31 35,911,906 46,209,533 18,686,025 12,847,266 5,367,559 1,885,665 120,907,954
Accumulated depreciation
and amortization and
impairment loss
At January 1 7,656,712 10,228,292 2,610,552 7,041,478 2,641,047 – 30,178,081
Depreciation and amortization
for the year (Note 23) 1,669,430 5,347,140 516,270 1,251,158 732,936 – 9,516,934
Impairment loss 4,493 – – – – – 4,493
Transfers (60,295) (875) – – – – (61,170)
Disposals (172,042) (1,242,335) – (150,366) (201,240) – (1,765,983)
Exchange differences (94,871) (231,230) – (76,255) 1,314 – (401,042)
Others (224,569) (202,827) (286,588) 724,203 (319,672) – (309,453)
Reclassifications PFRS 5 (559,961) (1,436,497) – (2,253,592) (785,611) – (5,035,661)
At December 31 8,218,897 12,461,668 2,840,234 6,536,626 2,068,774 – 32,126,199
Net book value P=27,693,009 P=33,747,865 P=15,845,791 P=6,310,640 P=3,298,785 P=1,885,665 P=88,781,755
2018
Land,Buildings and
Improvements(Note 19)
PlantMachinery
andEquipment
HotelProperty and
Equipment(Note 19)
Furniture,Fixtures and
EquipmentTransportation
EquipmentConstruction-
in-Progress Total
(In Thousands)CostAt January 1 P=17,578,981 P=27,105,172 P=14,093,725 P=11,406,113 P=6,062,370 P=36,707,006 P=112,953,367Additions 3,723,434 2,670,054 287,562 2,080,723 384,562 4,765,699 13,912,034Additions through business
combination (Note 24) 3,943,696 1,609,365 – 129,198 35,883 – 5,718,142Disposals (2,414,111) (2,326,724) (361,871) (914,843) (382,406) (219) (6,400,174)Transfers 3,652,638 326,394 421,846 16,247 (10,324) – 4,406,801Exchange differences 731,626 (207,812) – 206,034 34,201 3,443,039 4,207,088Others (3,653) 227 – (3,348) (119,071) (975) (126,820)
At December 31 27,212,611 29,176,676 14,441,262 12,920,124 6,005,215 44,914,550 134,670,438
Accumulated depreciationand amortization andimpairment loss
At January 1 5,954,838 10,053,614 2,487,261 7,022,646 1,915,624 88,753 27,522,736Depreciation and amortization
for the year (Note 23) 1,932,429 1,599,308 466,319 287,926 974,078 – 5,260,060Impairment loss 25,159 46,271 – – – (88,753) (17,323)Disposals (426,976) (1,209,941) (343,028) (533,470) (304,911) – (2,818,326)Exchange differences 172,102 164,837 – 137,667 63,520 – 538,126Others (840) (425,797) – 126,709 (7,264) – (307,192)
At December 31 7,656,712 10,228,292 2,610,552 7,041,478 2,641,047 – 30,178,081
Net book value P=19,555,899 P=18,948,384 P=11,830,710 P=5,878,646 P=3,364,168 P=44,914,550 P=104,492,357
As of December 31, 2018, the carrying value of IMI Group’s pledged equipment with BNP Paribasamounted to US$1.4 million (P=71.0 million).
Construction in progress of ACEI Group pertains to the construction and development of GNPK, a
4x135 MW (net) coal-fired power generating facility and private port facility located in the Barangays
of Tacub and Libertad in the Municipality of Kauswagan, Province of Lanao del Norte. As of
December 31, 2019, this has been reclassified to assets under PFRS 5.

- 101 -
*SGVFS039491*
GNPK has the right to claim compensation due to the adjustment in construction schedule using therate of US$20,550 per day on the Onshore Engineering, Procurement and Construction (EPC) andUS$42,710 per day on the Offshore EPC or a total of US$63,260 per day rate. Unit 1’s completiondate was expected and contracted to be on December 1, 2017 which resulted in thirty (30) days ofadjustment. Total compensation in 2019 and 2018 amounted to US$38.6 million (P=1,960.2 million)and US$36.0 million (P=1,788.5 million). In 2019, part of the total compensation amounting toUS$16.3 million (P=803.2 million) pertains to cost recoveries from liquidated damages which wascharged against property, plant and equipment and the remaining US$22.3 (P=1,157.0 million) wasrecorded under “Other income” account (see Note 23).
Additions through business combination of land, building and improvements and plant, machinery andequipment of SLTEC and ACEPH amounting to P=489.8 million and P=13.3 million, respectively, wastransferred to right-of-use of asset.
Consolidated depreciation and amortization expense on property, plant and equipment amounted toP=9.5 billion in 2019, P=5.3 billion in 2018 and P=3.5 billion in 2017 (see Note 23).
13. Service Concession Assets and Obligations
Service Concession Assets (SCA)The movements in this account follow:
2019 2018
(In Thousands)CostAt January 1 P=132,606,673 P=122,151,008Additions during the year Construction and rehabilitation works 10,728,197 9,478,084 Concession fees 2,526,529 948,016 Local component cost 62,411 13,095 Transfers 2,578 16,649Retirements/Disposals − (179)Reclassification to PFRS 5 (143,761,128) −At December 31 2,165,260 132,606,673
Accumulated amortizationAt January 1 34,202,187 31,101,438Amortization (Note 23) 2,905,938 3,100,805Retirements/Disposals − (56)Impairment loss 5,207,000 −Reclassification to PFRS 5 (41,788,381) −At December 31 526,744 34,202,187
Net book value P=1,638,516 P=98,404,486
SCA consists of the present value of total estimated concession fee payments, including regulatorycosts and local component costs, of the Parent Company, MWC, Laguna Water, Boracay Water,Clark Water, Obando Water, Calasiao Water, Bulakan Water, South Luzon Water, and LambunaoWater, pursuant to the Group’s concession agreements and joint venture agreements; and therevenue from rehabilitation works which is equivalent to the related cost for the rehabilitation workscovered by the service concession arrangements and joint venture agreements.
The Parent Company has a concession agreement with the DPWH while the MWC Group hasconcession agreements with MWSS, PGL, TIEZA, CDC, OWD, CWD, PAGWAD, TnWD, and BuWD.These concession agreements set forth the rights and obligations of the Parent Company and MWCGroup throughout the concession period (see Note 37).

- 102 -
*SGVFS039491*
Contract assets arising from concession agreements consist of the cost of rehabilitation workscovered by the concession agreements of the Parent Company, MWC, Laguna Water, BoracayWater, Clark Water, Cebu Water, Obando Water, Bulakan Water, South Luzon Water, Tagum Waterand Calasiao Water.
Total interest and other borrowing costs capitalized as part of SCA amounted to P=980.92 million,P=1,018.3 million and P=713.3 million in 2019, 2018 and 2017, respectively. The capitalization ratesused range from 4.50% to 7.66% in 2019, 6.57% to 7.57% in 2018, and 5.12% to 9.15% in 2017.
MWC Water Supply ShortageIn March 2019, the large decline in La Mesa dam water levels caused water service availability in theEast Zone to drop significantly, reaching its lowest level at about 68.5 meters in April 2019. Inresponse to the effect of the water supply shortage to customers of the East Zone, on March 26,2019, MWC announced a voluntary one-time Bill Waiver Program to be implemented in April 2019 tohelp alleviate the inconvenience of all customers and to assist those severely affected by the watersupply shortage.
In April 2019, MWSS BOT (MWSS Resolution No. 2019-055-CO and MWSS Resolution No. 2019-056-CO) imposed a financial penalty of P=534.05 million on the Parent Company for its failure to meetits service obligation to provide 24/7 water supply to its customers (see Note 17). While thedevelopment of new water sources is, under the Concession Agreement, ultimately the responsibilityof MWSS, the Parent Company has abided by the decision of MWSS to pay the financial penalty ofP=534.05 million even as it assumes no liability on the basis of the penalty as the Parent Companywas not the root cause of the water supply shortage. Pursuant to the directive of the MWSS RO, theP=534.05 million financial penalty was distributed to the East Zone customers through rebates whereinall connections as of March 31, 2019 received a minimum rebate equivalent to their first 10 cubicmeters or P=153.93 each while identified severely affected accounts received an additional rebate ofP=2,197.94 each.
Supreme Court Decision in Relation to the Philippine Clean Water Act of 2004This case arose from a complaint filed by the OIC Regional Director Roberto D. Sheen of theEnvironmental Management Bureau-National Capital Region (EMB-NCR) before the PollutionAdjudication Board (PAB) against the Parent Company, Maynilad, and MWSS for alleged violation ofPhilippine Clean Water Act of 2004 (RA No. 9275, the “Clean Water Act”), particularly the five (5)-year deadline imposed in Section 8 thereof for connecting the existing sewage line found in allsubdivisions, condominiums, commercial centers, hotels, sports and recreational facilities, hospitals,market places, public buildings, industrial complex and other similar establishments includinghouseholds, to an available sewerage system. Two (2) similar complaints against Maynilad andMWSS were consolidated with this case.
On September 18, 2019, the Parent Company received a copy of the Decision of the Supreme Courton the case ‘Manila Water Company, Inc. vs. The Secretary of the Department of Environment andNatural Resources, et.al.’ with G.R. No. 206823 and promulgated on August 6, 2019. In the Decision,the Supreme Court found the Parent Company liable for fines in violation of Section 8 of the CleanWater Act in the following manner:a. The Parent Company shall be jointly and severally liable with MWSS for the total amount of
P=921.46 million covering the period starting from May 7, 2009 to the date of promulgation of theDecision, August 6, 2019, to be paid within fifteen (15) days from finality of the Decision.
b. b. From finality of the Decision until full payment of the P=921.46 million fine, the Parent Companyshall be fined in the initial amount of P=322,102.00 per day, subject to a further 10.00% increaseevery two (2) years as provided under Section 28 of the Clean Water Act, until full compliancewith Section 8 of the same law.
c. c. The total amount of fines imposed by the Decision shall earn legal interest of six percent(6.00%) per annum from finality and until full satisfaction thereof.

- 103 -
*SGVFS039491*
On October 2, 2019, the Parent Company filed a Motion for Reconsideration with the Supreme Court.As of December 31, 2019, the Parent Company has not received any resolution from the SupremeCourt.
Variation Order
On February 25, 2013, the DPWH sent a Variation Notice to Pertconsult International, the Project’s
Independent Consultant (IC), instructing the IC to advise the Parent Company to submit a request for
Prior Clearance and Variation Proposal in connection with TRB’s directive to include in the Project’s
design a provision for future expansion of SLEX to accommodate possible fifth lane for both
directions at the Filinvest to Susana Heights Section. IC, in its letter to the Project’s Management
Consultant dated March 4, 2013, effectively directed the Parent Company to comply with the DPWH
letter dated February 25, 2013.
Such proposal was made in accordance with the Concession Agreement which provides that in the
event the DPWH initiates a variation, the Parent Company as concessionaire, shall prepare a
proposal setting out the necessary details and additional cost estimates.
On April 10, 2014, the Parent Company submitted a variation proposal to the DPWH and sought for
approval of (1) Direct payment of the construction cost for the works related to the provisioning of the
SLEX future expansion amounting to P=251.2 million inclusive of VAT and (2) Extension of the
concession period by 3 ½ years due to the delays encountered as a result of the variation order.
DPWH, in its letter to IC dated February 6, 2015, advised the same that it has issued the approved
Prior Clearance/Authority to Issue Variation Order No. 1 with a cap of P=223.0 million.
On May 27, 2015, the DPWH approved the adjusted cost of the variation order in the amount of
P=223.0 million (which was rectified by the Bureau of Construction) variation proposal and endorsed it
to the National Economic and Development Authority (NEDA) for information and appropriate action.
Accordingly, the Parent Company reclassified the amount of P=223.0 million from service concession
account to receivables from the Government upon DPWH’s approval of the variation order.
NEDA in its meeting held on July 15, 2015 confirmed the recommendation of the variation order.
On May 31, 2016, variation order for the project amounting to P=16.6 million was reclassified to SCA
under investment in toll road. Also, various reimbursement for expenses incurred during the
acquisition of the right of way amounting to P=1.1 million was received from the DPWH under the
Reimbursement Agreement.
On November 21, 2016, the IC recommended to the DPWH that a Certificate of Final Completion beissued for the project. Subsequently, DPWH, in its letter dated December 21, 2016, issued thecertificate of completion. As of December 31, 2019 and 2018, the Parent Company’s otherreceivables includes receivable from DPWH amounting to P=215.9 million pertaining to variation orderand reimbursement of right-of-way acquisition claims.
Service Concession ObligationProvision for maintenance obligation of MCXProvision for maintenance obligation pertains to the present value of the estimated contractualobligations of the Parent Company to undertake the financing of the Project’s periodic maintenance,which includes renewal and restoration of toll roads and toll road facilities prior to turnover of theasset to DPWH, the grantor.
Under the Minimum Performance Standards and Specifications (MPSS), the Parent Company hasthe obligation to perform routine and periodic maintenance. Routine maintenance pertains to day-to-day activities to maintain the road infrastructures while periodic maintenance comprises of preventiveactivities against major defects and reconstruction. Moreover, the Parent Company is required toperform maintenance and repair work in a manner that complies with the MPSS once it hands the

- 104 -
*SGVFS039491*
asset back to the DPWH. The provision is a product of the best estimate of the expenditure requiredto settle the obligation based on the usage of the road during the operating phase. The amount isreduced by the actual obligations paid for heavy maintenance of the SCA.
The breakdown of service concession obligations follows:
2019 2018
(In Thousands)
Current P=13,607 P=820,802
Noncurrent 52,412 7,018,211
P=66,019 P=7,839,013
MWSS Concession FeesThe aggregate concession fees of MWC pursuant to the concession agreement are equal to the sumof the following:
a. 10% of the aggregate peso equivalent due under any MWSS loan which has been disbursed
prior to the Commencement Date, including MWSS loans for existing projects and the Umiray
Angat Transbasin Project (UATP), on the prescribed payment date;b. 10% of the aggregate peso equivalent due under any MWSS loan designated for the UATP which
has not been disbursed prior to the Commencement Date, on the prescribed payment date;c. 10% of the local component costs and cost overruns related to the UATP;d. 100% of the aggregate peso equivalent due under MWSS loans designated for existing projects,
which have not been disbursed prior to the Commencement Date and have been either awardedto third party bidders or elected by MWC for continuation; and
e. 100% of the local component costs and cost overruns related to existing projects;f. MWC’s share in the repayment of MWSS loan for the financing of new projects; andg. One-half of MWSS annual corporate budget.
In March 2010, MWSS entered into a loan agreement with The Export-Import Bank of China tofinance the Angat Water Utilization and Aqueduct Improvement Project Phase II (the Angat Project).Total loan facility amounted to US$116.6 million with maturity of twenty (20) years including a 5-yeargrace period. Interest rate is 3% per annum.
MWSS subsequently entered into a Memorandum of Agreement (MOA) with MWC and Maynilad toequally shoulder the repayment of the loan with such repayment to be part of the concession fees.
On May 12, 2015, MWSS entered into a MOA with the Parent Company and Maynilad for the AngatWater Transmission Improvement Project (Angat Transmission Project). The Angat TransmissionProject aims to improve the reliability and security of the raw water coming from the Angat Damthrough the rehabilitation of the transmission system from Ipo to La Mesa and the application of watersafety, risk and asset management plans. Subsequently, on May 27, 2016, MWSS entered into aloan agreement with Asian Development Bank to finance the Angat Transmission Project. The loanamounts to US$123.30 million with a maturity of twenty-five (25) years including a seven (7)-yeargrace period. As stipulated in the MOA, the Parent Company and Maynilad shall shoulder equally therepayment of the loan and all reasonable expenditures related to the Project with suchpayments to form part of the concession fees.
In 2016, MWC paid MWSS P=500.0 million as compensation for additional water allocation in theAngat reservoir. The payment made shall be part of the MWC’s business plan and shall beconsidered in the next rate rebasing exercise.
In 2016, MWSS entered into a MOA with the Parent Company and Maynilad which was subsequentlyamended in 2018 for the New Centennial Water Source - Kaliwa Dam Project (NCWS-KDP). TheNCWS-KDP aims to develop a new water source in order to meet the increasing water demand byconstructing a dam for MWSS service area’s domestic water supply.

- 105 -
*SGVFS039491*
To partially finance the NCWS-KDP, MWSS entered into a Preferential Buyer’s Credit LoanAgreement with The Export-Import Bank of China in 2018 amounting to US$211.21 million with amaturity of twenty (20) years including a seven (7)-year grace period. As stipulated in the MOA, theParent Company and Maynilad shall shoulder equally the repayment of the loan and all reasonableexpenditures related to the Project with such payments to form part of the concession fees.
The schedule of undiscounted future concession fee payments follows:
Year
Foreign Currency-Denominated
Loans(Translated to US$)
Peso Loans/Project Local
SupportTotal Peso
Equivalent*
2020 $9,778,143 P=593,572,360 P=1,088,688,6312021 7,123,623 395,714,907 756,419,5582022 6,800,857 395,714,907 740,076,3012023 7,555,420 395,714,907 778,283,5992024 7,358,799 395,714,907 768,327,6942025 onwards 58,318,436 4,748,578,881 7,701,532,888
$96,935,278 P=6,925,010,869 P=11,833,328,671
*Peso equivalent is translated using the PDEx closing rate as of December 31, 2018 amounting to P=52.58 to US$1.
PGL Concession FeesUnder LAWC’s concession agreement with PGL, LAWC is required to pay concession fees to PGLcomputed as a percentage of water sales as follows:
Operational PeriodPercentage of
Water Sales
Years 1 to 5 4.00%Years 6 to 10 3.00%
Seventy percent (70%) of the concession fees shall be applied against any advances made by LAWCto PGL. The remaining thirty percent (30%) of the concession fees shall be payable annually thirty(30) days after the submission of the audited financial statements by LAWC, starting on the firstoperational period, which begins upon the expiration of the transition period. Advances as ofDecember 31, 2019 and 2018 amounted to P=50.98 million P=84.4 million (see Note 25).
TIEZA Concession FeesThe aggregate concession fee pursuant to BIWC’s concession agreement with TIEZA is equal to thesum of the following:
a. Servicing the aggregate peso equivalent of all liabilities of BWSS as of commencement date;b. 5% of the monthly gross revenue of BIWC, inclusive of all applicable taxes which are for the
account of BIWC; andc. Payment of annual operating budget of the TIEZA Regulatory Office starting 2010. For 2010 and
2011, the amount shall not exceed P=15.0 million. For the year 2012 and beyond, BIWC shall paynot more than P=20.0 million, subject to annual CPI adjustments.
CDC Concession Fees
The aggregate concession fee pursuant to the CWC’s concession agreement with CDC is equal to
the sum of the following:
a. Annual franchise fee of P=1.5 million;
b. Semi-annual rental fees of P=2.8 million for leased facilities from CDC.
As a result of the extension of the Concession Agreement of CWC, payment of rental fees on the
CDC existing facilities was extended by an additional 15 years from October 1, 2025 to
October 1, 2040.

- 106 -
*SGVFS039491*
OWD Concession FeesThe aggregate concession fee pursuant to Obando Water’s concession agreement with OWD is equalto the sum of the following:
i. base concession fee which shall be used for operations of the OWD; andii. additional concession fee composed of amounts representing amortization payments for the
outstanding obligations of OWD and 2% of the gross annual receipts of Obando Water,representing franchise tax to be paid by the OWD.
On March 28, 2019, LWUA has approved a new loan repayment scheme of thirteen (13) years withOWD. Upon initial payment, which shall not be later than May 15, 2019, LWUA shall no longer collectinterest and penalties from OWD.
For the years ended December 31, 2019 and 2018, concession fees recognized as part of SCA andSCO arising form the concession agreement with OWD amounted to nil and P=470.9 million ,respectively.
CWD Concession FeesUnder Calasiao Water’s concession agreement with CWD, concession fees are based on a fixedschedule of annual payments over the twenty-five (25) year concession period.
BuWD Concession FeesThe aggregate concession fee pursuant to Bulakan Water’s concession agreement with BuWD isequal to the sum of the following:
i. base concession fee which shall be used for operations of the BuWD; andii. additional concession fees composed of:
· 2.00% of the gross monthly water sales of Bulakan Water,
· one-time expenditures and payables applicable only for Year 1 of the concession agreement,and
· an amount equivalent to the monthly consumption of BuWD under a bulk water supplyagreement with Luzon Clean Water Development Corporation, including any minimumguaranteed volume consumption.
Any loss or reduction in profit for any given year as a result of the operation of the facilities in theservice area of BuWD shall not in any way affect or reduce the payment of the base concession fee.
PAGWAD Revenue ShareUnder Laguna Water’s JVA with PAGWAD, Laguna Water is required to pay, on a calendar yearbasis, an annual revenue share, amounting to the higher of:i. P=10.50 million for a twelve (12)-month period or the proportionate amount for those years with
less than twelve (12) months (the “base revenue share”); orii. seven percent (7.00%) of the annual gross operating revenues for the immediately preceding
year based on the audited financial statements (the “variable revenue share”).
The revenue share shall be payable by LWC in advance at the start of the relevant year. The baserevenue share shall be payable within fifteen (15) calenday days from the start of the relevant year.In the event the variable revenue share is higher than the base revenue share, the differencebetween the variable revenue share and the base revenue share shall be payable to PAGWAD withinfifteen (15) calenday days after the approval of Laguna Water’s audited financial statements.
Subject to the provision of the JVA on EPA, Laguna Water shall increase the revenue share due toPAGWAD in case of a corresponding increase in the government-mandated salary and benefits thatmay be implemented during the period of the JVA.

- 107 -
*SGVFS039491*
TnWD FeesUnder South Luzon Water’s JVA with TnWD, South Luzon Water is required to pay, on a annualbasis, a revenue share, amounting to P=17.50 million subject to an increase of P=1.00 million every five(5) years, conditioned upon the approval by the TnWD BOD and LWUA on the increase in tariff ratesfor the relevant tariff adjustment year. The revenue share for the duration of the
Appointment Period Revenue Share
Years 1 to 5 P=17.50 millionYears 6 to 10 P=18.50 millionYears 11 to 25 P=19.50 millionYears 16 to 20 P=20.50 millionYear 21 to 25 P=21.50 million
LWD FeesUnder Aqua Centro’s JVA with LWD, Aqua Centro is required to pay, on a monthly basis, an annualrevenue share, amounting to P=15.75 million, conditioned upon the approval by the LWD BOD andLWUA on the increase in tariff rates for the relevant tariff adjustment year. The revenue share shallno longer be guaranteed and shall be subject to adjustment by mutual agreement and discussion ofAqua Centro and LWD if the tariff adjustment are not secured or obtained from LWUA. The revenueshare for the duration of the appointment period:
Appointment Period Revenue Share
Years 1 to 5 P=15.75 millionYears 6 to 10 P=17.50 millionYears 11 to 25 P=17.50 millionYears 16 to 20 P=17.50 millionYear 21 to 25 P=20.65 millionYears 26 to 30 P=25.75 millionYears 31 to 35 P=35.33 million
Subject to the provision of the JVA on EPA, Aqua Centro shall increase the revenue share due toLWD in case of a corresponding increase in the government-mandated salary and benefits that maybe implemented during the appointment period of the JVA.
CCWD Revenue ShareUnder Calbayog Water’s JVA with CCWD, Calbayog Water is required to pay, on a monthly basis, anannual revenue share, amounting to P=18.00 million subject to an increase of P=1.00 million every five(5) years, conditioned upon the approval by the CCWD BOD and LWUA on the increase in tariff ratesfor the relevant tariff adjustment year. The revenue share for the duration of the appointment period:
Appointment Period Revenue Share
Years 1 to 5 P=18.00 millionYears 6 to 10 P=19.00 millionYears 11 to 25 P=20.00 millionYears 16 to 20 P=21.00 millionYear 21 to 25 P=22.00 millionYears 26 to 30 P=25.75 millionYears 31 to 35 P=35.33 million
Subject to the provision of the JVA on EPA, Calbayog Water shall increase the revenue share due toCCWD in case of a corresponding increase in the government-mandated salary and benefits thatmay be implemented during the appointment period of the JVA.
MCWD Bulk Water Supply AgreementOn December 13, 2013, Cebu Water received a Notice of Award for the bulk supply of water to theMCWD. In relation to this, Cebu Water and MCWD signed a twenty (20)-year Bulk Water SupplyAgreement for the supply of eighteen (18) million liters per day of water for the first year and thirty-five(35) million liters per day of water for years two (2) up to twenty (20).

- 108 -
*SGVFS039491*
Concession financial receivable is accounted for in accordance with IFRIC 12, arising from the bulkwater contract between Cebu Water and MCWD, whereby the facilities constructed by Cebu Watershall be used for the delivery of potable and treated water to MCWD at an aggregate volume ofeighteen (18) million liters per day for the first year and thirty-five (35) million liters per day for thesucceeding years up to twenty (20) years at P=24.59 per cubic meter.
In 2019 and 2018, Cebu Water invoked the force majeure clause due to high water turbidity whichresulted to intermittent delivery of the required thirty-five (35) million liters of water to MCWD.
TWD Bulk Water Sales and Purchase AgreementThe concession financial receivable arising from the Bulk Water Sales and Purchase Agreement(Agreement) between Tagum Water and TWD is accounted for in accordance with IFRIC 12. Underthe Agreement, Tagum Water shall construct water treatment facilities which shall be used for thedelivery of potable water to TWD at an aggregate volume of twenty-six (26) million liters per day forthe 1st to 3rd years; thirty-two (32) million liters per day for the 4th to 6th years; and thirty-eight (38)million liters per day for the remaining years of the agreement. There shall be a tariff rate adjustmentof fifteen percent (15%) every three (3) years starting on the 4th year from the Operations Start Dateas defined in the Agreement.

- 109 -
*SGVFS039491*
14. Intangible Assets
The movements in intangible assets follow:
2019
GoodwillCustomer
Relationships
Unpatented
Technology/IntellectualProperties
DevelopedSoftware Licenses Trademarks
ProjectDevelopment
Cost
Leaseholdand Other
Rights Others Total
(In Thousands)
Cost
At January 1 P=11,129,654 P=1,039,867 P=1,535,868 P=919,296 P=757,238 P=122,354 P=1,186,946 P=5,298,751 P=131,318 P=22,121,292
Additions during the year − − 41,256 18,329 37,922 − 217,683 174,284 423 489,897
Additions through business combination (Note 24) 1,437,239 − − 28,865 − 777,430 − − 11,925 2,255,459
Exchange differences (273,716) (41,222) (42,431) − (33,856) (4,526) (32,113) − − (427,864)
Reclassification due to PFRS 16 − − − − − − (536,523) − (536,523)
Reclassification/Others (153,191) 122,576 (45,108) (102,762) (4) − (95,972) (442,956) (21,882) (739,299)
Reclassification to PFRS 5 (136,566) − − − − − − (174,284) − (310,850)
At December 31 12,003,420 1,121,221 1,489,585 863,728 761,300 895,258 1,276,544 4,319,272 121,784 22,852,112
Accumulated amortization and impairment loss
At January 1 2,103,416 1,036,283 274,810 795,588 453,777 7,284 175,605 707,818 13,342 5,567,923
Amortization (Note 23) − 27,827 89,201 (915) 90,971 − 122,084 13,251 (379) 342,040
Impairment Loss (Note 23) 367,910 − − − (20,396) − − 7,500 − 355,014
Exchange differences (13,426) (39,243) 48,984 − 1,446 8,146 (5,475) − − 432
Reclassification due to PFRS 16 − − − − − − − − −Reclassification/Others − 21,366 (20,268) 12,973 (506) − (1,021) (38,669) (5,598) (31,723)
Reclassification to PFRS 5 − − − − − − − (7,500) − (7,500)
At December 31 2,457,900 1,046,233 392,727 807,646 525,292 15,430 291,193 682,400 7,365 6,226,186
Net book value P=9,545,520 P=74,988 P=1,096,858 P=56,082 P=236,008 P=879,828 P=985,351 P=3,636,872 P=114,419 P=16,625,926
2018
GoodwillCustomer
Relationships
UnpatentedTechnology/IntellectualProperties
DevelopedSoftware Licenses Trademarks
ProjectDevelopment
Cost
Leasehold andOther
Rights Other Total
(In Thousands)Cost
At January 1 P=12,677,470 P=1,886,728 P=447,941 P=440,741 P=605,032 P=57,811 P=834,436 P=4,822,296 P=84,733 P=21,857,188Additions during the year − − − 8,125 − − 270,823 5,728 − 284,676Additions through business combination (Note 24) 326,686 38,802 894,083 − 482,091 121,237 − − − 1,862,899Exchange differences (649,812) 396,404 (19,125) − 56,863 1,117 30,424 − − (184,129)Reclassification/Others (1,224,690) (1,282,067) 212,969 470,430 (386,748) (57,811) 51,263 470,727 46,585 (1,699,342)
At December 31 11,129,654 1,039,867 1,535,868 919,296 757,238 122,354 1,186,946 5,298,751 131,318 22,121,292
Accumulated amortization and impairment loss
At January 1 1,981,708 1,830,072 113,920 373,054 372,648 46,166 51,520 298,367 84,733 5,152,188Amortization (Note 23) − 355,789 151,345 635 95,789 7,283 100,826 409,451 11,326 1,132,444Retirement/Disposals 361,170 − − − − − − − 361,170Exchange differences (239,462) (305,194) 9,545 − 28,145 − 23,259 − − (483,707)Reclassification/Others − (844,384) − 421,899 (42,805) (46,165) − − (82,717) (594,172)
At December 31 2,103,416 1,036,283 274,810 795,588 453,777 7,284 175,605 707,818 13,342 5,567,923
Net book value P=9,026,238 P=3,584 P=1,261,058 P=123,708 P=303,461 P=115,070 P=1,011,341 P=4,590,933 P=117,976 P=16,553,369

- 110 -
*SGVFS039491*
Goodwill pertains to the excess of the acquisition cost over the fair value of the identifiable assetsand liabilities of companies acquired by the Group.
Impairment Testing of Goodwill for the GroupThe Group’s goodwill are tested for impairment annually as follows:
IMI GroupGoodwill acquired through business combinations have been allocated to the particular CGUs of IMIfor impairment testing as follows (amounts in thousands):
2019 2018
In US$ In Php* In US$ In Php*
STI (Notes 2 and 25) US$56,628 P=2,867,334 US$54,965 P=2,890,060VIA 44,325 2,244,395 45,643 2,399,909Speedy Tech Electronics, Ltd. (STEL) 38,225 1,935,532 38,225 2,009,870IMI 1,098 55,586 1,098 57,733IMI CZ 506 25,611 520 27,342
US$140,782 P=7,128,458 US$140,451 P=7,384,914
*Translated using the PDEx closing exchange rate at the consolidated statement of financial position date (US$1:P=50.64 in2019 and US$1:P=52.58 in 2018).
STI, VIA, STEL Group and IMI CZThe recoverable amounts of these CGUs have been based on value-in-use calculations using cashflow projections from financial budgets approved by management covering a five-year period. Thepre-tax discount rates applied to cash flow projections follows:
2019 2018
VIA 12.78% 11.76%STEL 12.36% 14.25%STI 9.47% 11.83%IMI CZ 7.90% 10.15%
Cash flows beyond the five-year period are extrapolated using a steady growth rate of 1%, whichdoes not exceed the compound annual growth rate (CAGR) for the global electronic manufacturingservices (EMS) industry, specifically on automotive, industrial equipment, consumer electronics andtelecommunications segments.
Key assumptions used in value-in-use calculationsThe calculations of value-in-use for the CGUs are most sensitive to the following assumptions:
· Revenue - Revenue forecasts are management’s best estimates considering factors such asindustry CAGR, existing customer contracts and projections, historical experiences and othereconomic factors.
· Forecasted gross margins - Gross margins are based on the mix of business modelarrangements with the customers.
· Overhead and administrative expenses - estimates are based on applicable inflation rates in therespective countries of the cash generating units considering expected future cost efficienciesand production facilities rationalization.
· Pre-tax discount rates - Discount rates represent the current market assessment of the risksspecific to each CGU, taking into consideration the time value of money and individual risks ofthe underlying assets that have not been incorporated in the cash flow estimates. This is alsothe benchmark used by management to assess operating performance. The discount ratecalculation is based on the specific circumstances of IMI Group and its operating segments andis derived from its weighted average cost of capital.
No impairment loss was assessed for STI, VIA, VTS and IMI CZ in 2019, 2018 and 2017.

- 111 -
*SGVFS039491*
In 2019 and 2018, an impairment loss amountingnil and US$6.90 million, respectively wasrecognized for STEL (see Note 23).
Sensitivity to changes in assumptionsWith regard to the assessment of value-in-use of STI, VIA and IMI CZ, management believes that noreasonably possible change in any of the above key assumptions would cause the carrying value ofthese CGUs to exceed their recoverable amount.
IMIThe goodwill of IMI pertains to its acquisition of M. Hansson Consulting, Inc. (MHCI) in 2006 and IMIUSA in 2005. MHCI was subsequently merged to IMI as testing and development department. IMIUSA acts as direct support to IMI Group’s customers by providing program management, customerservice, engineering development and prototyping manufacturing services. IMI USA’s expertise inproduct design and development particularly on the flip chip technology is being used across IMIGroup in providing competitive solutions to customers. In 2018, the recoverable amount was basedon the market price of IMI’s shares at valuation date less estimated costs to sell. The fair value ofthe IMI’s shares represents the value of IMI Group. In 2019, given the volatile market, IMI Groupassessed the impairment based on value-in-use calculations using cash flow projections of IMI fromfinancial budgets approved by management covering a 5-year period.
The comparison of the recoverable amounts and the carrying amounts resulted to no impairment lossin 2019, 2018 and 2017.
MWC and PhilwaterGoodwill from the acquisition of MWC and Philwater amounted to P=367.1 million as ofDecember 31, 2019 and 2018. The recoverable amount in 2019 and 2018 was based on the marketprice of MWC shares at valuation date less estimated cost to sell. The comparison of therecoverable amount and the carrying amount resulted in full impairment loss in 2019.
CWCGoodwill from the acquisition of CWC amounted to P=130.3 million as of December 31, 2018. MWC’simpairment tests for goodwill from the acquisition of CWC is based on value in use calculations usinga discounted cash flow model. The 2018 cash flows for the next twenty-two (22) years assume asteady growth rate and is are derived from CWC’s latest business plan. The MWC Group used theremaining concession life of CWC when testing for impairment. The recoverable amount is mostsensitive to discount rate used for the discounted cash flow model. The post-tax discount rateapplied to cash flows projections is 10.43% and 12.48% in 2019 and 2018, respectively.
No impairment loss was recognized in 2018 as a result of the impairment testing performed. In 2019,goodwill has been fully impaired based on the recoverable amount (market price per share of MWC).
ACEI GroupGoodwill acquired through business combinations pertaining to the AC Energy DevCo. Inc. Groupand Wind Power CGU of ACEI for impairment testing aggregated to P=33.5 million and P=786.2 million,respectively.
The recoverable amount is based on value in use calculations using cash flow projections fromfinancial budgets approved by ACEI management covering the period the CGU is expected to beoperational. The post-tax discount rates applied to cash flow projections is 10% which is based onweighted average cost of capital of comparable entities. The value-in-use computation is mostsensitive to the discount rate and growth rate applied to the cash flow projections.
ACEI management believes that no reasonably possible change in any of the key assumptions wouldcause the carrying value of the CGUs to exceed its recoverable amount.
No impairment loss was recognized in 2019 and 2018.

- 112 -
*SGVFS039491*
The Group also performed impairment testing for all other goodwill and no impairment loss wasrecognized.
Customer relationshipsCustomer relationships pertain to STEL Group’s and IMI BG’s contractual agreements with certaincustomers which lay out the principal terms upon which the parties agree to undertake business.Customer relationships of STEL and IMI BG aggregating $19.7 million (P=995.99 million) were fullyamortized as of December 31, 2019, 2018 and 2017.
Unpatented TechnologyUnpatented technology is arising from STEL Group’s products which are technologically feasible, aswell as from Merlin Solar Technologies, Inc. (Merlin USA), a subsidiary of AC Industrials, which wasrecognized in 2018 after the completion of AC Industrial’s acquisition of Merlin USA. Thesetechnologies are also unique, difficult to design around, and meet the separability criteria.
The unpatented technology amounting to $0.01 million (P=0.5 million) was fully amortized as ofDecember 31, 2019, 2018 and 2017.
This also includes intellectual properties which relates to the acquisition of VIA and VTS. VIA’sintellectual properties pertain to display system optically bonded to a display region and enhancedliquid crystal display system and methods. The finalization of the purchase price allocation for theacquisition of VIA resulted to the measurement of intellectual properties at fair value amounting to$7.85 million.
As of December 31, 2019 and 2018, the carrying value of VIA and VTS’s intellectual propertiesamounted to $6.60 million and $4.32 million, respectively.
LicensesThis includes acquisitions of computer software, applications and modules.
Developed SoftwareDeveloped software includes the system application acquired by the AHHI to compile its electronicmedical records, as well as to facilitate online pharmacy and consultation. It also includes developedsoftware pertaining to HCXI.
TrademarksTrademarks pertain to the trademark recognized by AC Industrial upon its acquisition of Merlin USA,as well as from the acquisition of Generika Group by AC Health in 2019.
Project development costProject development cost includes cost arising from the development phase of certain projects of IMIwhich are still undergoing qualification amounting to P=692.5 million.
Project development cost also pertains to easement right of way (ROW) which is the privilegegranted to one person to pass across another’s land.
During the construction of Kauswagan Transmission Line Project and Mariveles Project, severalROW were acquired from local residents for the right to erect the transmission lines which will beused to connect to the National Grid Corporation of the Philippines. Easement right acquired fromlocal residents is for an indefinite period of time.
As of December 31, 2019 and 2018, project development cost pertaining to easement ROWamounted to P=233.5 million and P=311.1 million, respectively.

- 113 -
*SGVFS039491*
Leasehold and other rightsLeasehold rights consist of the following:
· Through the acquisition of POPI, ALI acquired leasehold rights arising from their leaseagreement with Philippine National Railways (PNR) (see Notes 24 and 30).
· TKPI’s leasehold rights pertains to the right to use the property in Apulit Island located in Taytay,Palawan expiring on December 31, 2029.
· NTDCC’s leasehold rigts refer to development rights on an 8.3-hectare portion of the MRTDevelopment Corporation, which is located on the North Triangle property, and enabled theGroup to develop and construct a commercial center.
· Through the acquisition of Solienda, ACEI acquired the absolute and irrevocable title, rights andinterests in the contract of lease, and the subsequent amendment agreements, of San JulioRealty, Inc. (SJRI) with San Carlos Sun Power, Inc. (SACASUN), San Carlos Solar Energy, Inc.(SACASOL) and San Carlos Biopower Inc. (SCBP) amounting to P=445.3 million and P=168.1million as of December 31, 2018 and 2017, respectively (see Note 24). The AssignmentAgreements were amended on December 26, 2016 to clarify that SJRI irrevocably assigns,transfers and conveys absolutely unto Solienda, Inc. all its rights, ownership and/or interest in50% of the total rental payments due under the Contracts of Lease. The parties undertake toprovide continuing support for the full implementation of the Agreements and shall perform ingood faith any and all facts necessary to implement the Agreements and its amendments.These leasehold rights were previously classified under “Other Noncurrent Assets” as ofDecember 31, 2017.
This account also includes MWC Group’s water banking rights pertaining to the rights to draw waterfrom the Luyang River, Pampanga River, Abacan River, Pasig-Potrero River and Agno River. OnAugust 22, 2012, the National Water Resources Board (NWRB) approved the assignment of WaterPermit No. 16241 from Central Equity Ventures Inc. (now Stateland Inc.) to MW Consortium whichMW Consortium allows CMWDI to use for its project. As of December 31, 2019 and 2018, CMWDI’swater banking right amounted to P=45.0 million.
In 2019 and 2018, MWPVI incurred costs to aquire conditional water permits form the NWRBamounting to P=108.49 million and P=5.73 million, respectively. A conditional water permit isnecessary prior to the issuance of the water permit by NWRB subject to submission of certainrequirements, including plans and specifications for the diversion works, pump structure, watermeasuring deivce and water distribution system, and environmental compliance certification by theDepartment of Environmental and Natural Resources, among others. In 2018, the NWRB grantedMWPVI the permits to use the water from the Pampanga River, Abacan River, and Pasig-PotreroRiver. These permits supersede the conditional water permits granted to MWPVI in 2017. OnAugust 27, 2019, the NWRB granted MWPVI the permit to use water from the Agno River whichsuperseded the conditional water permit granted on March 21, 2018. As of December 31, 2019,MWC Group believes that the remaining requirements for the Cagayan River are ministerial and iscertain that it will be able to comply with the conditions required.
15. Other Noncurrent Assets
This account consists of the following:
2019 2018
(In Thousands)
Advances to contractors P=13,664,137 P=10,272,615
Deferred charges 11,517,876 9,650,001
Investment in bonds and other securities 8,208,898 3,034,245
Deposits - others 3,330,646 2,478,582
Creditable withholding taxes 2,208,663 500,700
Deferred input VAT 2,045,667 6,907,123
(Forward)

- 114 -
*SGVFS039491*
2019 2018
(In Thousands)
Pension assets (Note 28) 80,596 82,005
Deferred FCDA – 2,620,320
Concession financial receivable (Note 9) – 853,335
Others 6,247,046 3,688,673
P=47,303,529 P=40,087,599
Advances to contractorsAdvances to contractors represents prepayments for the construction of investment properties,property and equipment and service concession assets.
Deferred chargesDeferred charges includes ALI’s project costs incurred for unlaunched projects of the group, advancerental payments, and noncurrent prepaid management fees. This also includes ALI’s noncurrentportion of cost to obtain contracts which includes prepaid commissions and advances to brokers,which amounted to P=442.4 million and P=261.0 million in 2019 and 2018, respectively.
Deferred charges also include IMI’s tooling items customized based on the specifications of thecustomers and to be repaid as part of the price of the manufactured items.
Deferred input VATDeferred input VAT pertains to unamortized VAT portion from purchases of capital goods.
Investments in Bonds and Other SecuritiesThis account consists of bonds and equity investments, which are classified as financial assets at fairvalue through OCI and financial assets at fair value through profit or loss, follows:
2019 2018
(In Thousands)
Financial assets at FVTPL
Investment in bonds P=2,305,402 P=–
Financial assets at FVOCI
Quoted equity investments 1,633,763 2,200,447
Unquoted equity investments 4,269,733 833,798
P= 8,208,898 P=3,034,245
Investment in BondsInvestment in bonds pertain to non-interest bearing bonds with a term of 36-months. The Grouprecorded the investment as financial asset at fair value through profit or loss. The fair value of theinvestment in bonds is determined using the binomial lattice approach. The fair value of theinvestment is categorized under Level 3.
Quoted Equity InvestmentsQuoted equity instruments consist mainly of investments in listed equity securities and golf clubshares. Investments in golf club shares wherein ALI Group does not exercise control or demonstratesignificant influence amounted to P=1,478.4 million and P=1,425.4 million as of December 31, 2019 and2018, respectively. It also includes the following quoted equity investment:
Ho Chi Minh City Infrastructure Investment Joint Stock Co. (CII)The Group, through BHL, has acquired a 10% ownership interest in CII for US$15.9 million in 2012.CII is listed on the Ho Chi Minh City Stock Exchange and is a leading player in the infrastructuresector in Vietnam. CII has a portfolio of strategic infrastructure assets, including water treatmentplants and toll roads serving Ho Chi Minh City and surrounding areas.

- 115 -
*SGVFS039491*
In 2018, BHL converted nil units of bonds. In 2018, a decrease in fair value of the investmentsamounting to US$1.5 million (P=78.9 million) was recognized directly in equity. BHL did not disposeany shares in 2018 (see Note 23).
In 2019, there is no disposal of shares. The carrying amount of the investment in CII amounted toUS$3.8 million (P=196.3 million) and US$4.5 million (P=236.6 million) as of December 31, 2019 and2018, respectively.
Unquoted Equity InvestmentsUnquoted equity investments include unlisted preferred shares in public utility companies which theGroup will continue to carry as part of the infrastructure that it provides for its real estatedevelopment projects, water utilities projects, and to its other operations. It also includes thefollowing unquoted equity investments:
Investments in Negros Island Solar Power, Inc. (ISLASOL) and San Carlos Solar Energy, Inc.(SACASOL)ACEI’s investments in ISLASOL and SACASOL P=336.5 million and P=260.9 million, respectively, areequity securities of domestic corporations whose shares are not listed in PSE. The investments arecarried at fair value following the finalization of the purchase price allocation of VRC in 2018 (seeNote 24).
As of January 1, 2018, the investments in Sares Regis and Wave Computing amounting toP=947.6 million and P=110.5 million, respectively, were reclassified to FVTPL as a result of the Group’sadoption of PFRS 9 (see Note 10).
The net fair value gain (loss) on financial assets at FVOCI as reflected in the equity section is brokendown as follows:
2019 2018
(In thousands)Net unrealized gain on financial assets at FVOCI of the Parent Company and its consolidated subsidiaries (P=1,181,953) (P=1,196,758)Share in the net unrealized loss on financial assets at FVOCI of associates and joint ventures 1,248,397 652,203Reserves under PFRS 5 473 –
P=66,917 (P=544,555)
The rollforward of unrealized gain (loss) on financial assets at FVOCI of the Parent Company and itsconsolidated subsidiaries is as follows:
2019 2018
(In thousands)
At January 1, as previously stated (P=1,196,758) P=96,215
Effect of adoption of PFRS 9 – (651,259)
At January 1, as restated (1,196,758) (555,044)
Changes in fair value recognized in equity 14,805 (641,714)
At December 31 (P=1,181,953) (P=1,196,758)
Deferred FCDADeferred FCDA refers to the net unrecovered amounts from (amounts for refund to) customers ofMWC Group for realized losses (gains) from payments of foreign loans based on the differencebetween the drawdown or rebased rate versus the closing rate at payment date. This account alsocovers the unrealized gains or losses from loan valuations.

- 116 -
*SGVFS039491*
Deposits - othersThis includes deposits and advances for projects which include escrow deposits and securitydeposits on land leases, electric and water meter deposits. In 2018, deposit for land acquisitionamounting to P=1,299.8 million which was outstanding as of December 31, 2017 was reclassified torehabilitation works under SCA (see Note 13).
OthersOthers pertain to prepayments for expenses that is amortized for more than one year. In 2019 and2018, this includes restricted cash which amounted to P=4.3 billion and P=2.4 billion, respectively, thatis not available for use by the Group (see Note 19).
16. Contract Balances and Cost to Obtain a Contract
The contract balances of the Group consist of the following:
20192018
(As Restated)
(In Thousands)Contract AssetsCurrent P=3,159,675 P=3,736,447Noncurrent − 492,943
Total Contract Assets P=3,159,675 P=4,229,390
Contract LiabilitiesCurrent P=252,341 P=114,169
Total Contract Liabilities P=252,341 P=114,169
Set out below is the nature of contract assets and liabilities of the Group:
IMI GroupContract assets and liabilitiesAs of December 31, 2019 and 2018, IMI Group’s contracts assets and contract liabilities consist of:
2019 2018
In US$ In P= In US$ In P=
(In Thousands) (In Thousands)Contract assets - current US$58,908 P=2,982,813 US$63,484 P=3,337,998Contract liabilities - current 4,742 240,120 1,831 96,277*Translated using the exchange rate at the reporting date (US$1:50.64 and US$1:P=52.58 on December 31, 2019 and 2018).
Contract assets are initially recognized for revenue earned from manufacturing of goods as receipt ofconsideration is conditional on successful completion of the services. When goods are shipped orgoods are received by the customer, depending on the corresponding agreement with the customers,the amounts recognized as contract assets are reclassified to trade receivables. Payments arereceived from customers depending on the credit terms.
Contract liabilities includes short-term advances received to render manufacturing services.
IMI Group applied the practical expedient in PFRS 15 on the disclosure of information about thetransaction price allocated to remaining performance obligations given the customer contracts haveoriginal expected duration of one year or less.

- 117 -
*SGVFS039491*
AC InfraContract assets amounting to P=171.9 million pertain to the unbilled delivery service revenuerecognized by AC Infra Group as of December 31, 2019. Upon issuance of the related serviceinvoices, these shall be recognized as trade receivables.
MWC GroupContract assetsAs of December 31, 2019 and 2018, contracts assets consists of:
2019 2018
(In Thousands)Contract assets from: Supervision fees P=323,470 P=262,202
Pipeworks and integrated used water services 188,642 –
NRWSA with ZCWD 64,762 66,475 Bulk Water Sales and Purchase Agreement
with TWD (Note 13) 46,563 69,770
Current portion 623,437 398,447
Bulk Water Sales and Purchase Agreement with TWD (Note 13) 570,126 415,679
NRWSA with ZCWD 229,823 77,264
Noncurrent portion 799,949 492,943
1,423,386 891,390Reclassification to PFRS 5 (Note 25) (1,423,386) (891,390)
P=− P=−
Contract assets from supervision fees are initially recognized for revenue earned arising from theprovision of design and project management services in the development of water and used waterfacilities. These contract assets are reclassified to “Accounts and notes receivables” uponacceptance and reaching certain construction milestones for the related water and used waterfacilities.
Contract assets from the NRWSA with ZCWD are initially recognized for revenue earned arising fromconstruction revenue and performance fees for NRW reduction services. These contract assets arereclassified to “Accounts and notes receivables” upon acceptance of and billing to the customer.
In March 2019, the City Government of Zamboanga City declared a state of calamity due to therecurrence of El Niño. This prompted the ZCWD to implement a service-wide water rationingscheme. Consequently, Zamboanga Water was constrained to suspend its NRW Reductionactivities due to the unstable supply caused by said water rationing.
Per Section 1.10 of the NRWRSA, a rebaseline is to be performed if there is a decrease in supplyresulting from El Niño. Per agreement with ZCWD Project Management Unit (PMU) in November2017, the computed NRW cu.m./day prior the rebaseline shall be used as basis for the “locked-in”performance computation. However, a supplemental agreement to formally recognize thecomputation and payment of “locked-in” performance has not been finalized as of December 31,2019.
As of December 31, 2019, Zamboanga Water has not billed locked in performance fees amounting toP=150.9 million.

- 118 -
*SGVFS039491*
Contract assets arising from the Bulk Water Sales and Purchase Agreement with TWD consist of thecost of rehabilitation works which will be reclassified to “Concession financial receivables” uponcompletion of construction of the related facilities. The rollforward of these contract assets follows:
2019 2018
(In Thousands)Balance at beginning of year P=485,450 P=–
Rehabilitation works 78,341 219,078Finance income (Note 23) 52,899 70,847Impact of adoption of PFRS 15 – 206,954Reclassification to concession financial receivables
(Note 10) – (11,429)
Balance at end of year P=616,690 P=485,450
17. Accounts Payable and Accrued Expenses
This account consists of the following:
2019 2018
(In Thousands)
Accounts payable P=104,887,772 P=120,312,117
Accrued expenses
Project costs 18,269,215 18,641,346
Personnel costs 8,615,806 9,078,336
Professional and management fees 4,303,302 5,422,587
Rental and utilities 3,665,886 3,741,150
Repairs and maintenance 2,059,901 3,093,319
Advertising and promotions 1,418,547 1,416,910
Various operating expenses 5,679,698 3,479,680
Taxes payable 23,436,569 20,688,048
Liability for purchased land 9,936,887 2,544,623
Dividends payable 4,496,286 4,131,317
Retentions payable (Note 20) 4,190,349 6,762,286
Interest payable (Note 31) 3,371,968 4,137,612
Related parties (Note 31) 1,084,061 1,072,551
DRP obligation – 236,362
P=195,416,247 P=204,758,244
Accounts payable and accrued expenses are non-interest bearing and are normally settled on 15- to60-day terms. Other payables are non-interest bearing and are normally settled within one year.
Accrued various operating expenses include accruals for supplies, commissions, transportation andtravel, insurance, representation, dues and fees and others.
Project costs represent accrual for direct costs associated with the commercial, residential andindustrial project development and construction like engineering, design works, contract cost of laborand direct materials.
Taxes payable consists of net output VAT, withholding taxes, business taxes, capital gains tax andother statutory payables, which are due within one year.
Retentions payable pertains to the amount withheld by ALI Group on contractor’s billings to bereleased after the guarantee period, usually one (1) year after the completion of the project or upondemand. The retention serves as a security from the contractor should there be defects in theproject.

- 119 -
*SGVFS039491*
Liability for purchased land pertains to the current portion of unpaid unsubdivided land acquiredpayable during the year. These are normally payable in quarterly or annual installment payments orupon demand.
Development Rights Payment (DRP) obligation pertains to the current portion of the liability arisingfrom the assignment agreement between ALI Group and MRTDC of the latter’s developmentrights. In consideration of the lease, ALI Group will be charged an annual rent related to the originalDRP obligation on the MRTDC and 5% of the rental income from ALI Group’s commercial centerbusiness. Of the 5% variable amount due, 2.42% shall be directly paid by ALI Group to the minorityshareholders of Monumento Rail Transit Corporation, 28.47% shall be paid directly to Metro GlobalHoldings Corporation and the remaining 69.11% shall be applied against receivables. This amounthas been reclassified in line with adoption of PFRS 16.
18. Other Current Liabilities
This account consists of:
2019
2018(Restated -see Note 3)
(In Thousands)Customer’s Deposits P=25,481,979 P=29,043,778Nontrade payables 1,075,740 1,490,379Financial liabilities on put option (Notes 24 and 33) 1,823,114 1,386,926Installment payable 13,876 7,560
P=28,394,709 P=31,928,643
Deposits pertain to security and customers’ deposits. Security deposits are equivalent to three (3) tosix (6) months’ rent of tenants with cancellable lease contracts and whose lease term will end in thesucceeding year. This will be refunded to the lessees at the end of the lease term or be applied tothe last months' rentals on the related contracts. Customers’ deposits consist of collections from realestate customers which have not reached the 10% threshold to qualify for revenue recognition andexcess of collections over the recognized receivables based on percentage of completion (seeNote 3). The amount of revenue recognized from amounts included in customers’ deposits at thebeginning of the year amounted to P=22,826.6 million and P=11,479.4 million in 2019 and 2018,respectively.
Nontrade payables pertain mainly to non-interest bearing real estate-related payables to contractorsand various non-trade suppliers which are due within one year.
Financial liabilities on put option relate to the acquisition of VIA, STI and C-CON. The put options ofVIA pertain to the right of the non-controlling shareholder to sell to IMI a portion of its shareholdingthat is approximately 5% of the issued and outstanding nominal share capital of VIA within the firstand third anniversary of the agreement (5% put option) and all remaining shares held by the non-controlling shareholder upon the happening of certain trigger events (exit put options). The 5% putoption is exercisable any time between the 1st and 3rd anniversary of the agreement or if prior to the3rd anniversary, the share capital of VIA is increased, the 5% put option may be exercised withinthree months from registration of the capital increase. The exit put options are exercisable whenthere is a termination for a cause of the service agreement or the share capital of VIA is increasedthat will dilute the holding of non-controlling interest to below 10%.
The put option of STI pertains to the right of the non-controlling shareholder to sell to IMI allnoncontrolling interests held upon the happening of certain trigger events as specified in theshareholders agreement. The put option of STI is exercisable during the period commencing uponthe earlier of: (1) No Fault Leaver Event (i.e., First Founder of STI ceases to be an employee of amember of the STI Group) occurring in respect of a Founder, (2) the aggregate relevant proportion of

- 120 -
*SGVFS039491*
the Founders falling to less than 5%, or (3) the fifth anniversary of the service agreement. Mark-to-market gains (loss) on put options included under “Other income” account amounted to $3.45 millionin 2019, ($5.37) million in 2018 and $2.30 million in 2017.
Minority shareholder of C-CON Group have the right to require MT Technologies to purchase andacquire all its shares. The option can be exercised after the holding period, which is defined as the8th anniversary year after the acquisition date, April 1, 2019. Based on the management's judgment,the put options will be exercise by the minority shareholders on April 1, 2027 or the 8th anniversaryyear after the acquisition date.
19. Short-term and Long-term Debt
Short-term debt consists of:
2019 2018
(In Thousands)Philippine peso debt - with interest rates ranging
from 5.30% to 6.70% per annum in 2019 and4.38% to 7.03% per annum in 2018 P=23,176,325 P=18,120,547
Foreign currency debt - with interest rates rangingfrom 2.45% to 4.98% in 2019 and 2.50% to6.04% in 2018 6,612,318 21,397,698
P=29,788,643 P=39,518,245
ALI GroupThe short-term debt of ALI Group amounting to P=18,032.8 million and P=14,386.7 million as ofDecember 31, 2019 and 2018, respectively, represents peso and foreign-currency denominated bankloans with various interest rates. Peso-denominated short term loans had a weighted average costof 4.98% and 5.00% per annum in 2019 and 2018.
In compliance with BSP rules on directors, officers, stockholders and related interests, certain short-term and long-term debt with a carrying value of P=24,416.9 million and P=14,170.3 million as ofDecember 31, 2019 and 2018 are secured by real estate mortgages dated September 2, 2014 andMarch 14, 2016 covering both land and building of the Greenbelt Mall. Net book value of theproperty amounted to P=2,451.2 million and P=2,618.9 million as of December 31, 2019 and 2018,respectively which is accounted as part of the “Investment properties” account.
MWC GroupOn March 5, 2018, MWTC entered into a one-year term facility agreement with Mizuho Bank, Ltd.,Bangkok Branch (Mizuho Bangkok), whereby Mizuho Bangkok extended credit to MWTC for THB5.3billion to finance MWTC’s acquisition of the shares in Eastern Water (see Note 11). The loan bearsinterest of BIBOR plus margin and is guaranteed by the MWC Group.
As of December 31, 2019 and 2018, the carrying value of the short-term debt amounted to nil andP=8,596.54 million, respectively.
AC Industrial GroupThe Philippine peso debt of AC Industrial Group pertains to short-term loans with various banks andinstitutions amounting to P=4.13 billion and P=4.5 billion as of December 31, 2019 and 2018,respectively. These loans are unsecured and bear interest rate of 5.20% to 7.48% per annum in2019 and 4.38% to 7.03% per annum in 2018.

- 121 -
*SGVFS039491*
AIVPL GroupThe peso-denominated and dollar-denominated debt of AIVPL Group through its subsidiary, AffinityExpress India Private Limited (AEIPL), pertains to short-term loans with various banks amounting toP=292.3 million and P=260.8 million as of December 31, 2019 and 2018, respectively. These loans areunsecured and bear interest rate at 4.85% to 5.85% in 2019 12.0% in 2018.
IMI GroupAs of December 31, 2019 and 2018, IMI Group has short-term loans aggregating to US$126.1 million(P=6,382.6 million) and US$136.3 million (P=7,168.7 million), respectively. These short-term loanshave maturities ranging from 30-180 days and bear fixed interest rates ranging from 2.45% to 2.95%in 2019 and 2.50% to 3.12% in 2018.
ACEI GroupOn April 20, 2018 and July 30, 2018, respectively, ACEI SG signed a short-term loan line andrevolving credit facility with Rizal Commercial Banking Corporation and Mizuho Bank Ltd. Singaporeamounting to US$65.0 million (P=3,511.3 million) and US$50.0 million (P=2,701.0 million), respectively.Proceeds of the loan are to be used to finance investments in power and power related projects andfor other general corporate purpose expenses.
As of December 31, 2018, outstanding drawdowns from the short-term loan line and revolving creditfacility amounted to US$35.0 million (P=1,890.7 million) and US$15.00 million (P=810.3 million),respectively.
In 2018, ACEI SG received additional loan drawdowns from different banks aggregating to US$86.0million (P=4,521.9 million) and made repayments amounting to US$50.0 million.
Long-term debt consists of:
2019 2018
(In Thousands)The Parent Company: Bank loans - with fixed interest rates ranging from
5.3% to 6.0% and floating interest rates basedon applicable benchmark plus credit spreadranging from 0.5% to 0.70% with varyingmaturity dates up to 2028 P=25,833,141 P=27,405,387
Bonds 39,710,925 39,762,594
65,544,066 67,167,981
Subsidiaries:
Loans from banks and other institutions: Foreign currency - with interest rates ranging
from 0.87% to 6.88% in 2019 and 1.39% to5% in 2018; 15,557,079 68,364,538
Philippine peso - with interest rates rangingfrom 3.75% to 9.00% in 2019 and 2.85% to9.00% in 2018 (Note 24) 92,218,214 76,558,056
Bonds:
Fixed for life notes 60,544,798 20,918,114
Green Bonds 20,727,418 − Exchangeable bonds due 2019 − 15,285,934
Due 2019 − 12,313,125
Due 2020 3,995,321 3,989,546
Due 2021 13,934,766 5,000,000
Due 2022 12,614,111 12,605,471
(Forward)

- 122 -
*SGVFS039491*
2019 2018
(In Thousands)
Due 2023 P=14,887,529 P=14,861,918
Due 2024 17,915,811 14,923,051
Due 2025 14,908,645 14,895,124
Due 2026 15,856,414 7,939,468
Due 2027 7,924,640 6,969,630
Due 2028 9,896,154 9,886,828
Due 2033 1,985,276 1,984,613
Fixed Rate Corporate Notes (FXCNs) 7,039,272 11,986,615
Short-dated notes − 7,093,375
310,005,448 305,575,406
375,549,514 372,743,387
Less current portion 23,878,725 48,480,559
P=351,670,789 P=324,262,828
Reconciliation of carrying amount against nominal amount follows:
2019 2018
(In Thousands)
Nominal amount P=377,185,582 P=374,143,753
Unamortized discount (1,636,068) (1,400,366)
P=375,549,514 P=372,743,387
The Parent CompanyGenerally, the Parent Company’s long-term loans are unsecured. Due to certain regulatoryconstraints in the local banking system regarding loans to directors, officers, stockholders and relatedinterest, some of the Parent Company’s credit facilities with a local bank are secured by shares ofstock of a subsidiary with a fair value of P=15.4 billion and P=14.0 billion as of December 31, 2019 and2018, respectively, in accordance with Bangko Sentral ng Pilipinas (BSP) regulations. All creditfacilities of the Parent Company outside of this local bank are unsecured, and their respective creditagreements provide for this exception.
The Parent Company positions its deals across various currencies, maturities and product types toprovide utmost flexibility in its financing transactions.
In November and December 2013, the Parent Company availed of a P=2.0 billion and a P=4.3 billionloan from various banks to mature in 2018 and 2020, respectively. The P=2.0 billion loan have interestrate per annum equal to the 3-month PDST-R2 plus a spread of 100 basis points (1%) per annum, orBSP overnight reverse repurchase (RRP) rate plus a spread of 25 basis points (0.25%), whichever ishigher. In February 2016 and November 2017, the Parent Company paid the first and secondprincipal payment for the P=2.0 billion loan which amounted to P=100.0 million each. InNovember 2018, the Parent Company paid the final principal payment which amounted toP=1.8 billion. The P=4.3 billion loan have interest rate per annum equal to the 6-month PDST-R1 plusa spread of thirty basis points (0.30%) for the first six months and 3-month PDST-R1 plus a spread ofsixty basis points (0.60%) thereafter. In December 2015, 2016, 2017, 2018 and 2019, the ParentCompany paid the five principal payments for the P=4.3 billion loan which amounted to P=42.5 millioneach.
In August 2015, the Parent Company availed of a 7-year loan from a local bank amounting toP=3.0 billion which bears fixed interest rate of 5.2883% per annum. Principal repayments amountingto P=30.0 million shall be made at the end of the third year until the sixth year and payment ofremaining principal balance amounting to P=2.9 billion at maturity date.

- 123 -
*SGVFS039491*
In December 2016, the Parent Company entered into a revolving term loan agreement amounting toP=10.0 billion. The first drawdown of the loan amounted to P=300.0 million on December 22, 2017 witha quarterly repricing rate and a tenor of three years. The P=300.0 million have interest rate equivalentto (i) the Benchmark Rate-Floating plus a margin of seventy basis points (0.70%) per annum or (ii)the 28-day BSP Deposit Facility Rate plus a margin of forty-five basis points (0.45%) per annum,whichever is higher. On February 23, 2018 and July 19, 2018, the Parent Company drew anadditional P=2.5 billion for three years and P=0.5 billion for four years, respectively. Both drawdownsare repriced quarterly similar to the terms of the initial drawdown. The Parent Company paid the firstprincipal payment for the P=300.0 million and P=0.5 billion drawdowns amounting to P=3.0 million andP=12.5 million, respectively, in 2018. In 2019, the Parent Company paid the final principal payments ofP=297.0 million for the first drawdown, P=2.5 billion for the second drawdown, and P=0.5 billion for thethird drawdown.
On November 4, 2019, the Parent Company drew down a 45-day P=10 billion loan from its revolvingterm loan agreement dated December 1, 2016. The principal and interest were fully paid onDecember 9, 2019.
On January 30, 2018, the Parent Company signed the following loan facilities with BPI that aresecured by collateral:
a. P=1.9 billion 10-year loan facility with ALI shares as collateral (70% of outstanding loan on 2:1collateral ratio). The loan have interest rate equivalent to (i) the Benchmark Rate-Floating plus amargin of sixty basis points (0.60%) per annum or (ii) the average of BSP Overnight DepositFacility (ODF) and BSP Term Deposit Auction Facility (TDF) Rate of the tenor nearest theinterest period, whichever is higher; and
b. P=10.0 billion 10-year loan facility with US$ deposits as collateral (1:1 ratio). The loan haveinterest rate equivalent to (i) the Benchmark Rate-Floating plus a margin of sixty basis points(0.60%) per annum or (ii) the average of BSP Overnight Deposit Facility (ODF) and BSP TermDeposit Auction Facility (TDF) Rate of the tenor nearest the interest period, whichever is higher.
On February 26, 2018, the Parent Company drew down the full amount of the P=1.9 billion loan withALI shares as collateral. In 2019 and 2018, the Parent Company paid four and three principalpayments, respectively for the P=1.9 billion loan amounting to P=23.8 million each.
On April 30, 2018, the Parent Company drew down P=6.0 billion from its P=10.0 billion 10-year loanfacility secured by an assignment of AYCFL’s deposits amounting to $115.7 million. In 2018, thecompany made two principal payments of P=75.0 million each, and pre-paid P=4.0 billion in October2018. In 2019, the Parent Company made one principal payment of P=75.0 million and threeprincipal payments of P=12.5 million each, and pre-paid P=812.5 million in January 2019.
On May 15, 2018, the Parent Company drew down P=0.5 billion from the same facility secured by anassignment of AYCFL’s deposits amounting to $9.6 million. The Parent Company made twoprincipal payments worth P=6.3 million each in 2018, and one principal payment of P=6.3 million in2019. The Parent Company pre-paid the remaining balance of P=481.3 million on January 30, 2019.
In January 2019, the Parent Company drew down P=3.5 billion from its P=10.0 billion 10-year loanfacility secured by an assignment of AYCFL’s deposits amounting to $67.2 million. In 2019, ParentCompany paid four principal payments amounting to P=43.8 million each.
In April 2018, the Parent Company signed an P=11 billion fixed term loan facility with a local bank witha tenor of 8 years. The loan shall have a fixed interest rate of 6.0043%, which was based on theprevailing PDST-R2 benchmark plus a spread of 65 basis points. The amount was fully drawn onApril 30, 2018.

- 124 -
*SGVFS039491*
Also in April 2018, the Parent Company signed a P=5.0 billion term loan facility with a local bank. TheParent Company drew down P=2.0 billion with a tenor of 5 years with fixed interest rate of 6.0043%,which was based on the prevailing PDST-R2 benchmark plus a spread of 65 basis points.
BondsBelow is the summary of the outstanding Peso bonds issued by the Parent Company:
Year
Issued Term
Interest
rate
Principal
Amount
(In thousands)
Carrying Value
(In thousands)
Features2019 2018
2011 10 years 6.80% 9,903,400 P=9,885,752 P=9,970,466
20% balance puttable on the 5th
anniversary of the issue date;
balance puttable on the 8th
anniversary issue date
2012 15 years 6.875% 10,000,000 9,952,651 9,946,221
Callable from the 10th anniversary
issue until every year thereafter
until the 14th anniversary issue
date
2016 7 years 3.92% 10,000,000 P=9,942,735 P=9,927,904
Callable from the 5.5th
anniversary issue until every
year thereafter until the 7th
anniversary issue date
2017 8 years 4.82% 10,000,000 9,929,787 9,918,003
Callable from the 6.5th
anniversary issue until every
year thereafter
P=39,903,400 P=39,710,925 P=39,762,594
The outstanding Peso bonds of the Parent Company have been rated “PRS Aaa” by PhilRatings.
Bonds due 2021In May 2019, the Parent Company paid P=96.6 million on the P=10.0 billion bonds issued in May 2011.
Bonds due 2025On February 10, 2017, the Parent Company issued P=10.0 billion, 4.82% bonds due in 2025. Thispertains to the second and final tranche of the P=20.0 billion fixed rate bonds program approved bythe BOD on March 10, 2016.
The long-term debt of the Parent Company provide for certain restrictions and requirements withrespect to maintenance of financial ratios at certain levels. These restrictions and requirements werecomplied with by the Parent Company as of December 31, 2019 and 2018.
Interest paid amounted to P=3.9 billion and P=3.3 billion in 2019 and 2018, respectively (see Note 18).
Subsidiaries
Foreign Currency Debt
AYCFLIn March 2016, AYCFL increased the existing Bilateral Term Loan Facility with The Bank of Tokyo-Mitsubishi UFJ, Ltd from US$100.0 million up to US$200.0 million with interest rates at certain basispoints over LIBOR and maturing in September 2022. The Bilateral Term Loan Facility has anavailability period of 5 years which offers the same flexibility as a Revolving Credit Facility. As ofDecember 31, 2019, AYCFL has withdrawn US$80.0 million from the loan facility.
Furthermore, AYCFL undertook the conversion of the US$200.0 million Club Term Loan facility intoRevolving Credit facility with Mizuho Bank, Ltd. and Sumitomo Mitsui Banking Corporation withinterest rates at certain basis points over LIBOR and maturing in March 2020. The loan facility isguaranteed by the Parent Company. As of December 31, 2019, AYCFL has withdrawn US$300.0million from the loan facility.

- 125 -
*SGVFS039491*
IMI GroupIMIThe long-term debts of IMI aggregating to US$135.8 million and US$180.0 million as ofDecember 31, 2019 and 2018, respectively, were obtained from Singapore-based and local bankswith terms of three to five years, subject to fixed annual interest rates ranging from 2.70% to 3.41% in2019 and 2.15% to 3.94% in 2018.
VIAVIA has a long-term debt from a Germany-based bank amounting to nil as of December 31, 2019and €0.1 million (US$0.1 million) as of December 31, 2018. The debt is unsecured and bears annualinterest of 5.35% and matured on June 30, 2019.
VIA also has a long-term loan with a Japanese bank with a face amount of JPY600.0 million ($4.44million) and JPY500.0 million ($5.78 million) as of December 31, 2019 and 2018, respectively. Theloans is payable monthly and bears interest of 1.67% and will mature in 2023.
IMI CZIMI CZ has term loan facility from Czech-based payable in 60 regular monthly installments and bearsinterest of 1-month EURIBOR plus spread ranging from 0.9% to 2.70% but is not to exceed 15% perannum. Outstanding balance as of December 31, 2019 and 2018 amounted to €1.9 million (US$2.1million) and €3.1 million (US$3.5 million), respectively.
CooperatiefCooperatief’s long-term debt aggregating to €14.3 million (US$20.4 million) as at July 29, 2011relates primarily to the acquisition of EPIQ shares and receivables of EPIQ NV from IMI EU/MXsubsidiaries. Based on the payment schedule in the SPA, this long-term debt will be settled from2013 to 2018, subject to interest rate of 1.60% plus 1.50%. The loan was fully paid in 2018.
IMI BGIMI BG has a long-term debt from European-based bank that relates to the term loan facility forfinancing the construction of a new warehouse with a term of five years and bears interest based on3-month EURIBOR plus 2.90%. The loan matured in December 2018. The warehouse wascompleted in 2013.
The credit facility with the bank is subject to the following collateral: Security of Transfer ofOwnership Title relating to office and factory equipment with a carrying value of US$1.4 million.
MWC GroupMWMP LoanOn October 2, 2012, MWC entered into a Subsidiary Loan Agreement with LBP under the MetroManila Wastewater Management Project (MWMP) with the World Bank. The loan has a term of 25years and was made available in US Dollars in the aggregated principal amount of US$137.5 millionvia semiannual installments after the 7-year grace period. MWC made four drawdowns in 2015aggregating to US$22.6 million (P=1,123.7 million) and three drawdowns in 2016 aggregating toUS$17.5 million (P=868.1 million). In 2017, MWC made an additional three drawdowns with a totalamount of US$22.4 million (P=1,118.4 million). In 2018, MWC made additional drawdown amountingto US$8.9 million (P=468.0 million). In 2019, the MWC made an additional four (4) drawdownsamounting to US$41.68 million (P=2,095.2 million). The carrying value of the MWMP loan as ofDecember 31, 2019 and 2018 is US$109.3 million (P=5,504.8 million) and US$70.9 million(P=3,727.9 million), respectively.
NEXI LoanOn October 21, 2010, MWC entered into a term loan agreement (NEXI Loan) amounting toUS$150.0 million to partially finance capital expenditures within the East Zone. The loan has a tenorof 10 years and is financed by a syndicate of four banks - ING N.V Tokyo, Mizuho Corporate Bank,Ltd., The Bank of Tokyo-Mitsubishi UFJ Ltd. and Sumitomo Mitsui Banking Corporation and isinsured by Nippon Export and Investment Insurance. First, second and third drawdowns of the loan

- 126 -
*SGVFS039491*
amounted to US$84.0 million, US$30.0 million and US$36.0 million, respectively. The carrying valueof this loan as of December 31, 2019 and 2018 amounted to US$19.0 million (P=937.3 million) andUS$37.0 million (P=1,945.5 million), respectively.
JPY40.0 billion loanOn September 30, 2015, MWC signed a 7-year JPY40.0 billion term loan facility with threeinternational banks: The Bank of Tokyo-Mitsubishi UFJ, Ltd., Mizuho Bank, Ltd., and SumitomoMitsui Banking Corporation to finance MWC’s capital expenditures. MWC made its first drawdownon March 9, 2016 amounting to JPY13.4 billion (P=5.7 billion). In 2017, MWC made two additionaldrawdowns totaling JPY 26.6 billion (P=11.7 billion). MWC did not make any drawdown in 2018. Theloan’s carrying value as of December 31, 2019 and 2018 is JPY20.5 billion (P=9,481.4 million) andJPY27.2 billion (P=12,931.8 million), respectively.
MSTP Loan
On October 20, 2005, MWC entered into a Subsidiary Loan Agreement with LBP to finance the
improvement of the sewerage and sanitation conditions in the East Zone. The loan has a term of
17 years and was made available in Japanese Yen in the aggregate principal amount of
JPY6.6 billion payable via semi-annual installments after the 5-year grace period.
MWC made its last drawdown on October 26, 2012. The total drawn amount for the loan is JPY4.0billion. As of December 31, 2019 and 2018, outstanding balance of the LBP loan amounted toJPY0.8 billion (P=391.7 million), and JPY1.2 billion (P=562.5 million), respectively.
MWTCTHB5.30 billion loanOn February 27, 2019, MWTC signed a THB5.30 billion, five (5)-year term loan facility with MizuhoBank Ltd. – Bangkok Branch and Bank of Ayudhya Public Company Limited to take out the previousbridge loan used to finance the acquisition of an 18.72% equity stake in East Water. This loan bearsinterest of BIBOR plus margin and is guaranteed by the MWC. The carrying value of the loan as ofDecember 31, 2019 amounted to THB5,271.3 million (P=8.861.3 million).
BOC LoanOn August 27, 2019, MWC entered into a syndicated loan agreement amounting to €250.00 millionto fund the capital investment program for 2019 to 2020. The loan will be prepaid in eight (8)installments starting April 2023 and is financed by a syndicate of two banks namely Bank of China(Hong Kong) Limited and Bank of China Limited, Manila Branch. MWC has made a drawdownamounting to €40.00 million in 2019. The carrying value of the loan as of December 31, 2019amounted to €39.41 million (P=2,221 million).
The long-term debt of MWC Group has been reclassified to liabilities under PFRS 5 as ofDecember 31, 2019.
ALI GroupIn October 2012, ALI executed and fully drawn a US$58.5 million long-term facility. The loan bears afloating interest rate based on a credit spread over the three-month US Dollar London InterbankOffered Rate (LIBOR), repriceable quarterly. The loan will mature on the third month succeeding thetenth anniversary of the initial drawdown date. Subsequently in March 2016, a US$30.0 million long-term facility was assigned by ALI Makati Hotel Property, Inc. (AMHPI) to ALI. The assigned loanbears a floating interest rate based on a credit spread over the three-month US Dollar LondonInterbank Offered Rate (LIBOR), repriceable quarterly and had a remaining term of 3 years and4 months from the time of assignment. ALI paid the remaining dollar-denominated loans onDecember 20, 2018.
In November 2019, ALI executed and had simultaneously drawn a US$125.0 million long-termfacility. The loan bears a floating interest rate based on a credit spread over the three-monthUS Dollar LIBOR, repriceable quarterly. The proceeds were onlent to MCT to refinance its existingloans. The loan will mature on the fifth anniversary of the initial drawdown date.
- 127 -
*SGVFS039491*
As of December 31, 2019 and 2018, the remaining aggregate balance of US Dollar-denominatedlong term loans amounted to P=6,329.4 million and nil, respectively.
ACEI GroupGNPKThe peso-denominated and dollar-denominated debt of GNPK pertains to a construction and termloan facility having an aggregate principal amount of P=1,700.0 million and US$605.0 million,respectively, with interests ranging from 6.88% to variable at LIBOR plus a margin of three and one-quarter of one percent (3.25%). The dollar-denominated debt is composed of the following: 1)Tranche A Loan US$375.0 million; 2) Tranche B Loan US$60.0 million; and 3) Tranche C LoanUS$170.0 million.
As of December 31, 2018, the assets of GNPK amounting to US$831.0 million are pledged ascollateral. The carrying value of the loans amounted to US$696.2 million as of December 31, 2018.
In 2019, all liabilities including loans payable of GNPK were reclassified under liabilities underPFRS 5.
Philippine Peso Debt
MWC GroupMWC Parent CompanyOn August 16, 2013, MWC entered into a Credit Facility Agreement with a local bank having a fixednominal rate of 4.42% and with a term of 7 year from the issue date which is payable annually. MWCmay repay the whole and not a part only of the loan starting on the 3rd anniversary of the drawdowndate of such loan or on any interest payment date thereafter. The carrying value of the loan as ofDecember 31, 2019 and 2018 amounted to P=4.8 billion and P=4.9 billion, respectively.
On May 11, 2018, MWC signed a P=5.0 billion, 10-year term loan facility with a local bank. The loanwill be used to finance general corporate requirements and capital investment programs in the ManilaConcession as well as to refinance existing concessionaire loans. The carrying value of the loan asof December 31, 2019 and 2018 amounted to P=4.3 billion and P=4.8 billion, respectively.
On April 8, 2011, MWC issued P=10.0 billion FXCN with P=5.0 billion having a term of five (5) years(Five-Year FXCN Note) from the issue date and the other P=5.0 billion with a term of ten (10) years(Ten-Year FXCN Note) from the issue date which is both payable quarterly. MWC may repay thewhole and not a part only of the Ten-Year FXCN Notes on the 7th anniversary of the drawdown dateof such FXCN Note or on any FXCN interest payment date thereafter.
On April 8, 2016, MWC prepaid the outstanding balance of the Five-Year FXCN Note. The carryingvalue of the FXCN as of December 31, 2019 and 2018 amounted to P=4.8 bilion.
On November 13, 2019, MWC signed a P=5.00 billion, five (5) year term, revolver loan facility withBDO Unibank with principal payable at bullet after sixty (60) months. The loan will be used for theexpansion and improvement of the water source, distribution and sewerage systems, and othergeneral corporate requirements as well as to refinance existing concessionaire loans. MWC hasmade two (2) drawdowns amounting to P=3,800 million in 2019. The carrying value of the loan as ofDecember 31, 2019 amounted to P=3,771.45 million.
On July 17, 2008, MWC, together with all of its Lenders signed an Omnibus Amendment Agreementand Intercreditor Agreement and these agreements became effective on September 30, 2008.
Prior to the execution of the Omnibus Amendment Agreement, the obligation of MWC to payamounts due and owing committed to be repaid to the lenders under the existing facilty agreementswere secured by Assignment of Interest by Way of Security executed by MWC in favor of a trusteeacting on behalf of the lenders. The Assignments were also subject to the provisions of the

- 128 -
*SGVFS039491*
Amended and Restated Intercreditor Agreement dated March 1, 2004 and its AmendatoryAgreement dated December 15, 2005 executed by MWC, the lenders and their appointed trustee.
Under the Omnibus Amendment Agreement, the lenders effectively released MWC from theassignment of its present and future fixed assets, receivables and present and future bank accounts,all the Project Documents (except for the Agreement, Technical Corrections Agreement and theDepartment of Finance Undertaking Letter), all insurance policies where MWC is the beneficiary andperformance bonds posted in its favor by contractors or suppliers.
In consideration for the release of the assignment of the above-mentioned assets, MWC agreed notto create, assume, incur, permit or suffer to exist, any mortgage, lien, pledge, security interest,charge, encumbrance or other preferential arrangement of any kind, upon or with respect to any of itsproperties or assets, whether now owned or hereafter acquired, or upon or with respect to any rightto receive income, subject only to some legal exceptions. The lenders shall continue to enjoy theirrights and privileges as Concessionaire Lenders (as defined under the Agreement), which include theright to appoint a qualified replacement operator and the right to receive payments and/or otherconsideration pursuant to the Agreement in case of a default of either MWC or MWSS. Currently, alllenders of MWC Group are considered Concessionaire Lenders and are on pari passu status withone another.
In November and December 2014, MWC Group signed Amendment Agreements to its loanagreements with its existing lenders. This effectively relaxed certain provisions in the loanagreements providing MWC Group more operational and financial flexibility. The loan amendmentsinclude the shift to the use of MWC Group from consolidated financial statements for the purposes ofcalculating the financial covenant ratios, the increase in maximum debt to equity ratio to 3:1 from 2:1and the standardization of the definition of debt service coverage ratio at a minimum of 1.2:1 acrossall loan agreements.
LAWCOn September 7, 2010, LAWC, entered into a loan agreement with two local banks for the financingof its construction, operation, maintenance and expansion of facilities in its servicing area. Pursuantto the loan agreement, the lenders have agreed to provide loans to LAWC up to P=500.0 million,principal payments of which will be made in 30 consecutive equal quarterly installments startingAugust 2013. The carrying value of this loan amounted to P=66.56 million and P=132.9 million as ofDecember 31, 2019 and 2018, respectively.
On April 29, 2013, LAWC entered into a loan agreement with Development Bank of the Philippines(DBP) to partially finance the modernization and expansion of the water network system and watersupply facilities in Biñan, Sta. Rosa and Cabuyao, Laguna. Under the agreement, the lender hasagreed to provide a loan to the borrower through the Philippine Water Revolving Fund (PWRF) in theaggregate principal amount of up to P=500.0 million bearing an effective interest rate of 7.29%. Thecarrying value of this loan as of December 31, 2019 and 2018 amounted to P=403.64 million andP=432.9 million, respectively.
On January 9, 2014, LAWC excercised its option to avail of the second tranche of its loan agreementwith DBP to finance its water network and supply projects, including the development of a well-fieldnetwork on the Biñan, Sta. Rosa area of Laguna. Under the expanded facility agreement, DBPprovided additional loans to LAWC in the aggregate principal amount of P=833.0 million. The carryingvalue of the loans amounted to P=692.82 million and P=743.1 million as of December 31, 2019 and2018, respectively.
On October 23, 2015, LAWC entered into a loan agreement with a local bank to finance themodernization and expansion of its water network system and water supply facilities throughout theprovince of Laguna. Under the loan agreement, the lender agreed to provide a loan to the borrowerin the aggregate principal amount of up to P=2.5 billion for an applicable fixed interest rate, asdetermined in respect of each drawdown. The carrying value of the loan amounted to P=2.1 billionand P=2.3 billion as of December 31, 2019 and 2018, respectively.

- 129 -
*SGVFS039491*
On March 29, 2017, LAWC entered into a loan agreement with Grand Challenges Canada to fundthe project during the period beginning on the effective date of the loan agreement and ending on theproject end date of March 31, 2018 for up to an aggregate principal amount of CA$0.87 million(P=34.7 million). The project supported by the loan is the “Bundling water and sanitation services forthe poor in informal urban communities.” As of December 31, 2019 and 2018, the carrying value ofthe loan amounted to CAD0.87 million.
On June 28, 2019, LWC signed a ten (10)-year term loan facility amounting to P=2.50 billion with theBank of the Philippine Islands. The loan will be used to partially finance LWC’s capital expenditureprogram. The first drawdown was made in July 2019 amounting to P=200.00 million bearing aneffective interest rate of 6.06%. The second drawdown was made in December 2019 amounting toP=500.00 million bearing effective interest rates of 6.05%. The carrying value of the loan amounted toP=696.44 million as of December 31, 2019.
BIWCOn July 29, 2011, BIWC, entered into an omnibus loan and security agreement with DBP and a localbank to finance the construction, operation, maintenance and expansion of facilities for the fulfillmentof certain service targets for water supply and waste water services for the Service Area under theConcession Agreement, as well as the operation and maintenance of the completed drainagesystem. The loan shall not exceed the principal amount of P=500.0 million and is payable in twenty(20) years inclusive of a three (3)-year grace period.
Sub-tranche 1The loan shall be available in three sub-tranches, as follows:
· Sub-tranche 1A, the loan in the amount of P=250.0 million to be provided by DBP and fundedthrough PWRF;
· Sub-tranche 1B, the loan in the amount of P=125.0 million to be provided by a local bank andfunded through PWRF; and
· Sub-tranche 1C, the loan in the amount of P=125.0 million to be provided by a local bank andfunded through its internally-generated funds.
The carrying value of the loan as of December 31, 2019 and 2018 amounted to P=355.6 million andP=371.8 million, respectively.
Sub-tranche 2The Agreement provided BIWC the option to borrow additional loans from the lenders. OnNovember 14, 2012, BIWC entered into the second omnibus loan and security agreement with DBPand a local bank. The agreed aggregate principal of the loan amounted to P=500.0 million which isavailable in three sub-tranches:
· Sub-tranche 2A, the loan in the amount of P=250.0 million to be provided by DBP and fundedthrough PWRF
· Sub-tranche 2B, the loan in the amount of P=125.0 million to be provided by a local bank andfunded through PWRF
· Sub-tranche 2C, the loan in the amount of P=125.0 million to be provided by a local bank andfunded through BIWC’s internally-generated funds.
The carrying value of the loan as of December 31, 2019 and 2018 amounted to P=353.9 million andP=397.7 million, respectively.
Sub-tranche 3On October 9, 2014, BIWC signed a Third Omnibus Loan and Security Agreement in the amount ofP=650.0 million with SBC to fund capital expenditures related to water and sewerage services in theconcession area of BIWC. The carrying value of loan as of December 31, 2019 and 2018 amoutedto P=630.1 million and P=642.7 million, respectively.

- 130 -
*SGVFS039491*
On December 20, 2017, BIWC signed a Fourth Omnibus Loan and Security Agreement in theamount of P=2.4 billion with the Bank of the Philippine Islands (BPI). The loan will be used to financethe general corporate and capital expenditures requirements of BIWC. BIWC made its firstdrawdown on April 30, 2018 amounting to P=250.0 million. The second drawdown was made onSeptember 25, 2018 amounting to P=250.0 million. The third drawdown was made on December 20,2018 amounting to P=100.0 million. The carrying value of loan as of December 31, 2019 and 2018amounted to P=596.0 million to P=595.6 million.
CWCOn April 10, 2015, CWC entered into a loan agreement with a local bank, whereby the bankextended credit to CWC for up to P=1.2 billion to partially finance its concession capital expendituresprogram. Under the agreement, the loan bears interest at a rate of 6.179% and principal paymentswill be made in forty eight (48) consecutive equal quarterly installments starting July 2018. Thecarrying value of the loan amounted to P=1.0 billion and P=1.1 billion as of December 31, 2019 and2018, respectively.
On December 13, 2018, CWC availed of a fifteen (15)-month term loan with RCBC amounting toP=100.0 million to finance its working capital requirements. Under the agreement, the loan bearsinterest at the rate of 7.55% payable monthly. The loan’s principal payment is due on March 13,2020. The carrying value of the loan amounted to nil and P=100.0 million as of December 31, 2019and 2018, respectively.
On March 11, 2019, CWC signed a term loan agreement amounting to P=535.00 million with theDevelopment Bank of the Philippines. The proceeds of the loan will be used to partially financeCWC’s capital expenditure programs. The first and second drawdowns on this loan were made onMarch 22, 2019 and December 20, 2019, amounting to P=100.00 million and P=80.00 million,respecively. The carrying value of the loan amounted to P=180.00 million as of December 31, 2019.
CMWDOn December 19, 2013, the CMWD entered into an omnibus loan and security agreement(the Agreement) with DBP to partially finance the construction works in relation to its bulk watersupply project in Cebu, Philippines. The lender has agreed to extend a loan facility in the aggregateprincipal amount of P=800.0 million or up to 70% of the total project cost whichever is lower. Principalpayments will be made in twenty (20) equal quarterly installments starting December 2017. Thecarrying value of the loan as of December 31, 2019 and 2018 amounted to P=612.19 million andP=655.8 million, respectively.
Zamboanga Water Company, Inc.(ZWC)On June 30, 2016, ZWC, a 70% joint venture company of MWC, signed a term loan agreement in theamount of P=85.00 million with DBP. The proceeds of the loan will be used to partially finance ZWC’scapital expenditures in relation to its NRW reduction and management program in Zamboanga City.The carrying value of the loan as of December 31, 2019 and 2018 amounted to P=79.60 million andP=84.7 million, respectively.
MWPVIOn October 5, 2016, MWPVI signed a 15-year fixed rate term loan facility amounting to P=4.0 billionwith various domestic banks. The terms of the loan include an option to increase the size of thefacility to a maximum of P=7.0 billion. The proceeds of the loan will be used to finance MWPVI’scapital expenditures, future acquisitions and other general corporate requirements.
On February 24, 2017, MWPVI made a bridge loan drawdown amounting to P=150.00 million eachfrom SBC and Metrobank. These bridge loans had a fixed rate of 2.75% and a 119-day term. OnJune 23, 2017, these bridge loans were rolled-over for additional 180 days with a rate of 2.90%,repriced monthly. On November 9, 2017, MWPVI repaid its P=300.0 million bridge loan and made thefirst drawdown on its loan facility amounting to P=450.00 million from each bank.

- 131 -
*SGVFS039491*
On October 5 and December 19, 2018, MWPVI made its subsequent drawdowns amounting toP=50.00 million and P=175.00 million from each bank, respectively. In 2019, MWPVI made additionaldrawdowns totaling to P=800.00 million from each bank. The carrying value of the loan as ofDecember 31, 2019 and 2018 amounted to P=2,928.52 million and P=1,340.97 million, respectively.
These loan drawdowns have a term of thirteen (13) to fifteen (15) years, with interest payable semi-annually and principal repayments starting on November 9, 2022.
TWCOn October 6, 2016, TWC signed an Omnibus Loan and Security Agreement in the amount ofP=450.0 million. The proceeds of the loan will be used to partially finance the construction works inrelation to Tagum Bulk Water Supply Project. Nominal interest is at 5.30% per annum, payablequarterly. Principal payments will be made in forty-eight (48) equal quarterly installments startingDecember 2020.
On September 25, 2017, April 18 and November 23, 2018, TWC made its subsequent drawdownsamounting to P=130.0 million, P=120.0 million and P=154.0 million, respectively. The carrying value ofthe loan as of December 31, 2019 and 2018 amounted to P=401.5 million and P=401.2 million,respectively.
The long-term debt of MWC Group has been reclassified to “Liabilities under PFRS 5” as ofDecember 31, 2019.
ALI GroupIn August to September 2015, ALI assumed an aggregate of P=15,442.3 million various long-termfacilities of some subsidiaries from various banks. The loans bear fixed interest rates ranging from4.5% to 4.7% per annum and terms ranging from 4.4 years to 10.5 years. As of December 31, 2019and 2018, the remaining balance of the assumed long-term facilities amounted to P=14,107.8 millionand P=14,503.2 million respectively.
In March 2017, ALI executed a P=10,000.0 million long-term facility with a domestic bank, of which ALIhad simultaneously drawn an initial P=5,000.0 million. The loan carries a fixed interest rate of 4.949%per annum and a term of 10 years. The balance of facility of P=5,000.0 million was drawn in April2017. In March 2018, ALI executed a P=5,000.0 million long-term facility with a domestic bank, ofwhich ALI had simultaneously drawn the entire facility amount. In March and April 2019, ALIexecuted and drew in two tranches a P=13.0 billion long-term facility. The loan which was drawn atP=6.5 billion each, carries a fixed interest rate at 6.2720% and 6.3070%, respectively. As ofDecember 31, 2019 and 2018, remaining balance of the Peso-denominated long-term loansamounted to P=41,885.1 million and P=29,465.7 million, respectively.
SubsidiariesThe Philippine Peso bank loans include ALI subsidiaries’ loans that will mature on various dates upto 2028. Peso-denominated loans bear various floating interest rates at 60 bps to 80 bps spreadover the benchmark 91-day PDST-R2 or and fixed interest rates ranging from 3.89% to 6.49% perannum Certain loans which are subject to floating interest rates are subject to floor floating interestrates equivalent to (i) 95.0% or par of the Overnight Reverse Repurchase Agreement Rate of theBangko Sentral ng Pilipinas (BSP Overnight Rate) or (ii) the BSP Overnight Rate plus a spread of 20bps to 75 bps per annum or (iii) the average of the Bangko Sentral ng Pilipinas Overnight DepositRate and Term Deposit Facility with a term closed to the 90-day interest period. The totaloutstanding balance of the subsidiaries’ loans as of December 31, 2019 and 2018 amounted toP=25,401.29 million and P=25,123.67 million loans, respectively.
ACEI GroupOn February 20, 2017, ACEI entered into an unsecured loan agreement with The PhilippineAmerican Life and General Insurance Company (PHILAM) amounting to P=1.0 billion payable in 10years from the date of drawdown with 6% fixed interest per annum. The loan shall be paid in onelump sum at the maturity date.

- 132 -
*SGVFS039491*
On April 27, 2017, ACEI entered in to an unsecured loan agreement with Philippine National Bank(PNB) amounting to P=7.0 billion. The loan is payable seven (7) years from initial the drawdown date.ACEI shall pay interest on the outstanding principal amount of the loan at the fixed rate of 5.75% perannum, with duration of three (3) months commencing on the drawdown date. All drawdown beyondMay 5, 2017, the relevant PDST-R2 benchmark rate will apply +1% per annum spread, with a floor of5.25% per annum. Repayment of the principal amount shall be 20% of the loan from 5th to 27thinterest period and the remaining 84% shall be paid lump sum at the end of 28th interest period.Drawdown of P=250.0 million was made by ACEI on May 3, 2017. On May 25, 2018, an additionaldrawdown of P=2.0 billion was made by ACEI. Principal repayment amounted to P=108.75 million andP=8.7 million in 2019 and 2018, respectively. As of December 31, 2019 and 2018, ACEI has undrawnloan amounted to P=4.8 billion. The outstanding balance as of December 31, 2019 is P=2.1 billion.
On June 22, 2017, ACEI entered into unsecured loan agreement with Security Bank Corporation(SBC) amounting to P=5.0 billion. The tenor of the loan agreement is seven (7) years from the initialdrawdown date, with grace period on principal payments of up to three (3) years, reckoned from theinitial drawdown. Repayment of the principal amount shall be 16% of the loan from the 12th to 27th
interest period and the remaining 84% of the loan will be paid lump sum on the 28th interest period.On June 29, 2017, ACEI drawn P=100.0 million from then facility. ACEI shall pay interest on theoutstanding principal amount of the loan at the fixed rate of 5.75% per annum for all drawdowns fromJune 2017 to June 2018. For all drawdowns beyond June 2018, the interest rate shall be based onthe relevant Peso Benchmark Rate PDST-R2 rate, plus credit spread, the fixed interest rate shallhave a floor rate of 5.00%. As of December 31, 2019, the outstanding balance is P=100.0 million.
SubsidiariesSLTECOn April 29, 2012, SLTEC entered into an omnibus loan and security agreement with BDO, SBC andRizal Banking Corporation to re-leverage and optimize the capital structure of SLTEC and fund itsgeneral corporate requirements. Tenor of the loan is 12 years from initial drawdown date. Interestrate ranges from 4.44% to 7.11%. The principal amount shall be paid on a semi-annual after the 3rdanniversary. SLTEC may, at its option, prepay the loan in part or in full on any interest payment datetogether with accrued interest thereon up to and including the date immediately preceding the date ofprepayment, subject to prepayment penalties ranging from 0.00% to 1.25%. As of December 31,2019, the outstanding balance of these loans is P=10.7 billion.
ACEI GroupOn February 20, 2017, ACEI entered into an unsecured loan agreement with The PhilippineAmerican Life and General Insurance Company (PHILAM) amounting to P=1.0 billion payable in 10years from the date of drawdown with 6% fixed interest per annum. The loan shall be paid in onelump sum at the maturity date.
On April 27, 2017, ACEI entered in to an unsecured loan agreement with Philippine National Bank(PNB) amounting to P=7.0 billion. The loan is payable seven (7) years from initial the drawdown date.ACEI shall pay interest on the outstanding principal amount of the loan at the fixed rate of 5.75% perannum, with duration of three (3) months commencing on the drawdown date. All drawdown beyondMay 5, 2017, the relevant PDST-R2 benchmark rate will apply +1% per annum spread, with a floor of5.25% per annum. Repayment of the principal amount shall be 20% of the loan from 5th to 27thinterest period and the remaining 84% shall be paid lump sum at the end of 28th interest period.Drawdown of P=250.0 million was made by ACEI on May 3, 2017. On May 25, 2018, an additionaldrawdown of P=2.0 billion was made by ACEI. Principal repayment amounted to P=108.75 million andP=8.7 million in 2019 and 2018, respectively. As of December 31, 2019 and 2018, ACEI has undrawnloan amounted to P=4.8 billion. The outstanding balance as of December 31, 2019 is P=2.1 billion.
On June 22, 2017, ACEI entered into unsecured loan agreement with Security Bank Corporation(SBC) amounting to P=5.0 billion. The tenor of the loan agreement is seven (7) years from the initialdrawdown date, with grace period on principal payments of up to three (3) years, reckoned from theinitial drawdown. Repayment of the principal amount shall be 16% of the loan from the 12th to 27th
interest period and the remaining 84% of the loan will be paid lump sum on the 28th interest period.

- 133 -
*SGVFS039491*
On June 29, 2017, ACEI drawn P=100.0 million from then facility. ACEI shall pay interest on theoutstanding principal amount of the loan at the fixed rate of 5.75% per annum for all drawdowns fromJune 2017 to June 2018. For all drawdowns beyond June 2018, the interest rate shall be based onthe relevant Peso Benchmark Rate PDST-R2 rate, plus credit spread, the fixed interest rate shallhave a floor rate of 5.00%. As of December 31, 2019, the outstanding balance is P=100.0 million.
SubsidiariesSLTECOn April 29, 2012, SLTEC entered into an omnibus loan and security agreement with BDO, SBC andRizal Banking Corporation to re-leverage and optimize the capital structure of SLTEC and fund itsgeneral corporate requirements. Tenor of the loan is 12 years from initial drawdown date. Interestrate ranges from 4.44% to 7.11%. The principal amount shall be paid on a semi-annual after the 3rdanniversary. SLTEC may, at its option, prepay the loan in part or in full on any interest payment datetogether with accrued interest thereon up to and including the date immediately preceding the date ofprepayment, subject to prepayment penalties ranging from 0.00% to 1.25%. As of December 31,2019, the outstanding balance of these loans is P=10.7 billion.
ACEPH
Description Interest Rate (per annum) Terms 2019
P=5.00 billion loan with
BDO
5.0505% per annum for the first 5
years; repricing for the succeeding5 years is the average of the 5-year BVAL, three (3) days prior to
Repricing Date, plus a margin ofninety basis points per annum(0.90%), with the sum divided by
0.95
Availed on November 15, 2019, payable
in semi-annual installment within10 years with final repayment onNovember 14, 2029; contains negative
pledge
P=4,957.72
P=1.50 billion loan withChina Banking
Corporation (CBC)
The higher of 7-year PDST-F atinterest rate setting date which is
one (1) banking day prior to issuedate plus a spread of 1.625% or5.675% for the first 7 years;
repricing for the last 3 years, thehigher of 3-year PDST-F plus aspread of 1.625% or initial interest
rate.
Availed on April 14, 2014, payable inquarterly installment within 10 years to
commence1 year after the first interest paymentdate with final repayment on April 10,
2024; contains negative pledge
P=1,358.73
P=1.18 billion loan withSBC
Fixed at a rate of 6.50% per annumwhich shall be payable at the end
of the interest period of six months
Availed on January 11, 2017 payable insemi-annual installments within 12.5
years to commence 6 months after theDrawdown Date and every 6 monthsthereafter with final repayment on July
11, 2029; contains negative pledge
904.02
P=1.18 billion loan withDBP
Fixed at a rate of 6.00% for the first7 years; repricing for the last 5.5
years, the higher of 5-year PDST-R2 plus a spread of 1.625% or6.25%
Availed on January 10, 2017 payable insemi-annual installments within 12.5
years to commence 6 months after theDrawdown Date and every 6 monthsthereafter with final repayment on July
10, 2029; contains negative pledge
904.00
P=0.50 billion loan withBanco De Oro
Unibank, Inc. (BDO)
The higher of 7Y PDST-F at interestrate setting date which is one (1)
banking day prior to issue dateplus a spread of 1.625% or5.675% for the first 7 years;
repricing for the last 3 years), thehigher of 3-year PDST-F plus aspread of 1.625% or initial interest
rate
Availed on April 30, 2014, payable inquarterly installments within 10 years
to commence 1 year after the firstinterest payment date with finalrepayment on January 30, 2024;
contains negative pledge
452.08
P=0.93 billion loan withSBC
The applicable peso benchmark(based on BVAL) plus minimum of
2.0% spread, with quarterlyrepricing, which shall be payablequarterly in arrears.
Availed on December 28, 2018 payableon June 28, 2020; up to 18 months
from drawdown date
–
Carrying value (net of unamortized debt issue costs and embedded derivatives ofP=58.26 million as of December 31, 2019)
P=8,576.55

- 134 -
*SGVFS039491*
In 2019, principal payments made relative to ACEPH’s loans amounted to P=1,094.1 million. ACEPHpaid P=43.0 million debt issue costs for the P=5,000.0 million additional loans availed in 2019
PHINMA RenewableOn December 18, 2013, PHINMA Renewable entered into a P=4,300.00 million Term Loan Facilitywith Security Bank Corporation (“SBC”) and Development Bank of the Philippines (“DBP”). The loanfacility is divided into two tranches amounting to P=2,150.00 million each - DBP as the Tranche Alender and SBC as the Tranche B lender.
Both tranches have a term of 15 years with semi-annual interest payments starting on the date onwhich the loan is made. The Tranche A’s interest is to be fixed at the higher of 10-year PDSTreasury Fixing (“PDST-F”) plus a spread of 1.625% or 6.25% for the first 10 years, to be repriced athigher of 5-year PDST-F plus a spread of 1.25% or 6.25% for the last 5 years. The Tranche B will befixed at higher of interpolated 15-year PDST-F plus a spread of 1.625% or 6.5%. The interest ratefloor on the loan is an embedded derivative that is required to be bifurcated. In 2013, the Group didnot recognize any derivative liability arising from the bifurcated interest floor rate since the fair valueis not significant.
The loan’s principal repayment is variable amount payable semi-annually; amount of principalrepayment to be determined during the due diligence stage based on the required debt servicecoverage ratio (“DSCR”) and financial projections using the Financial Model validated by anindependent financial model auditor. Any incremental revenue resulting from a subsequent increasein the applicable FIT rate shall be applied to principal repayment of the loan in the inverse order ofmaturity. Incremental revenue is the difference in the revenue based on existing FIT rate ofP=7.40/kwh and a new base rate as defined by the relevant government agency excluding annualadjustments to account for inflation and foreign exchange movements.
In 2019, PHINMA renewable paid P=27.78 million and P=28.48 million for Tranche A and Tranche B,respectively.
As of December 31, 2019, the carrying value of these loans amounted to P=1,504.5 million.
North Wind Power Development Corporation (NPDC)On May 31, 2012, Bank of the Philippines Islands (BPI) granted a P=1,000.00 million loan to NPDC, asubsidiary of ACEI.
On September 27, 2013, BPI granted a P=1,500.00 million long-term loan facility to NPDC to partlyfund the Phase III expansion project of NPDC. Total drawings from the loan facility amounted toP=1,280.00 million.
On October 26, 2016, NPDC and BPI signed an amendment to the loan agreement datedMay 31, 2012 and September 27, 2013 reducing the loan principal due by P=179.57 million.
The reduction in loan principal payment in those periods were spread over the remaining term of theloan. The remaining terms and conditions of the original loan agreements were not amended.
The interest rate on both loans from BPI is based on a floating rate equivalent to prevailing BangkoSentral ng Pilipinas Overnight Reverse Repurchase Rate (BSP RRP), plus 1.00% spread. Theinterest is payable semi-annually, computed based on the outstanding balance with paymentscommencing on the issue date and ending on the maturity date. Starting on the 5th or 7th year, theNPDC has the option of choosing between a floating rate and a fixed rate.
On June 27, 2018, BPI granted a P=1,000.00 million loan to NPDC to fully prepay the outstandingbalance of the loan from Union Bank of the Philippines and to finance its general fundingrequirements. The first principal repayment and interest is due on April 27, 2019. Interest rate isfixed for the initial period of five (5) years to be repriced after the fifth (5th) year anniversary at a rate

- 135 -
*SGVFS039491*
equivalent to (a) the Based Rate- Fixed plus a spread of 0.98%, or (b) 5.30% per annum, whicheveris higher. On June 27, 2018, NPDC fully paid its outstanding loan with UBP.
On May 6, 2014, NPDC signed a P=500.00 million long-term loan facility with Union Bank of thePhilippines (UBP) to partly fund the Phase III expansion project of NPDC and refinance a loan. The6.25% interest rate on the loan from UBP is fixed for the entire 10-year repayment period.
As of December 31, 2019, the outstanding balance of NPDC’s loans amounted to P=2.1 billion.
AACOn October 6, 2017, AAC secured a 5-year loan from a local bank amounting to P=450.00 million,bearing interest of 5.4% per annum. Proceeds was used to partially finance the acquisition of thenew aircraft. Principal repayments amounting to P=22.50 million are due every end of the quarterfrom the loan availment date. The total principal paid for the year ended December 31, 2019amounted to P=90 million, respectively. Interest expense recognized in the statements ofcomprehensive income amounted to P=17.05 million and P=15.77 million for the period endedDecember 31, 2019 and 2018, respectively. Accrued interest as of December 31, 2019 and 2018amounted to P=3.43 million and P=4.58 million, respectively.
In 2017, debt issuance cost representing documentary stamp tax which amounted to P=2.25 millionwas presented as a direct deduction to the carrying value of the loan. Amortization of the debtissuance cost amounted to P=0.58 million and P=0.73 million in 2019 and 2018, respectively.
Bonds2019 AYCFL US$400.0 Million Senior Unsecured and Guaranteed Fixed For Life Perpetual Notes(Fixed For Life)On October 23, 2019, the Parent Company announced that it had successfully set the terms of a USdollar-denominated fixed-for-life (non-deferrable) senior perpetual issuance at an aggregate principalamount of US$400 million (P=20,118.9 million) with a fixed coupon of 4.850% for life with no step-upand no reset, payable semi-annually. The bonds will be issued by AYCFL and will be unconditionallyand irrevocably guaranteed by the Parent Company. The bonds were priced at par with a re-offeryield of 4.850%, reflecting a 27.5 basis points compression from the initial price guidance. The finalorder book was over four times oversubscribed with the order book allocated predominantly to Asia,with the rest to Europe, reflecting the strong investors' confidence in the Ayala name. By investortype, more than half of the offering was allocated to fund managers, insurance companies andpension funds, around one-quarter to banks and financial institutions and the remainder to privatebanks. The transaction was settled on October 30, 2019.
2017 AYCFL US$400.0 Million Senior Unsecured and Guaranteed Fixed For Life Perpetual Notes(Fixed For Life)On September 7, 2017, the Parent Company announced that AYCFL had successfully set the termsof a US dollar-denominated fixed-for-life (non-deferrable) senior perpetual issuance at anaggregate principal amount of US$400 million (P=20,171.9 million) with an annual coupon of 5.125%for life with no step-up. The issuance is the first corporate fixed-for-life with no coupon step-up inSoutheast Asia and the first fixed-for-life with no step-up (and reset) deal in the Philippines. Theissuer, AYCFL, may redeem the Notes in whole but not in part on September 13, 2022 (firstredemption date) or any interest payment date falling after the first redemption date at 100% of theprincipal amount of the Notes plus any accrued but unpaid interest. The proceeds of the issuancewill be used to refinance the issuer’s US Dollar maturing obligations and to fund investments of theGuarantor (the Parent Company) or its offshore subsidiaries.
The pricing of the Notes reflected a 50-basis point compression from initial price guidance. Theoffering was more than five times oversubscribed, with investors’ confidence reflecting the highquality of the Ayala signature. 19% of the order book for the Notes was allocated to investors fromthe Philippines, 10% from Europe with the remaining 71% from rest of Asia. By investor type, the splitwas 67% to fund/asset managers, 12% to banks, 7% to insurance and pension funds, and the

- 136 -
*SGVFS039491*
remaining 14% to private banks and other investors. The Notes was settled on September 13, 2017and was listed in the Singapore Exchange Securities Trading Limited on September 14, 2017.
The Group accounts for this as liability, and, thus shown forming part of long-term debt as ofDecember 31, 2019 and 2018. The cost of issuance is at US$2.7 million resulting in net proceedsof US$397.3 million.
AYCFL Exchangeable BondsOn May 2, 2014, AYCFL issued at face US$300.0 million Exchangeable Bonds (the Bonds) due onMay 2, 2019 with a fixed coupon rate of 0.50% per annum, payable semi-annually. The Bonds areguaranteed by the Parent Company and constitute direct, unsubordinated, unconditional andunsecured obligations of AYCFL, ranking pari passu and without any preference or priority amongthemselves. The Bonds are listed in the Singapore Stock Exchange and include features such asexchange option, put option and early redemption options. The Bondholders have the right toexchange their Bonds for shares at any time during the exchange period. AYCFL shall lodgesufficient shares in its securities account to service Exchange Rights. In consideration for thereservation of the shares and by way of deposit for the exercise by the Bondholders of the ExchangeRight, AYCFL shall remit to the Parent Company from time to time such amount as may be agreedbetween them, as defined in the Exchange Protocol agreed between AC and AYCFL. The exchangeprice per principal amount to be exchanged, translated into at the fixed exchange rate ofP=44.31/US$1.00, is equal to 36.48, subject to anti-dilutive adjustments contingent on certain events.The exchange option was assessed to be an equity component of the Bonds at the consolidatedfinancial statements as the Bonds are denominated in the functional currency of AYCFL and to besettled by the Parent Company through issuance of a fixed number of ALI’s common shares.
The put option entitles the bondholders to require AYCFL to redeem, in whole or in part, the Bondson May 2, 2017 (put option date) at 100% of the principal amount together with accrued and unpaidinterest. Moreover, if a change of control event occurs (the change of control put) or in the event thatthe common shares of ALI are delisted or suspended from trading for a period of more than 20consecutive trading days (the delisting put), the bondholders may require AYCFL to redeem theBonds, in whole but not in part, at 100% of the principal amount together with accrued and unpaidinterest.
The early redemption option gives the right to AYCFL to redeem the Bonds, in whole but not in part,at any time after May 2, 2017 at 100% of the principal amount on the date fixed for such redemption,provided, however, that no such redemption may be made unless the closing price of the commonshares of ALI (translated into US$ at the prevailing average to US$ exchange rate as published bythe BSP) for any 30 consecutive trading days was at least 130% of the exchange price then in effect(translated into US$ at the fixed exchange rate of P=44.31/US$1.00). In addition, if at any time theaggregate principal amount of the Bonds outstanding is less than 10% of the aggregate principalamount originally issued or if a tax event occurs, AYCFL may redeem the Bonds, in whole but not inpart, at 100% of principal amount together with accrued and unpaid interest.
The put and early redemption options were assessed to be embedded derivatives that are clearlyand closely related to the host contract, therefore, not required to be bifurcated. As the Bonds weredetermined to be a compound instrument at the consolidated level, (i.e., it has a liability and anequity component which pertains to the exchange option), the Group applied split accounting. Thevalue allocated to the equity component at issue date amounted P=1.1 billion, being the residualamount after deducting the fair value of the liability component amounting to P=11.9 billion from theissue proceeds of the Bonds.
In 2018, an equivalent amount of US$7.2 million principal was exchanged and converted into a totalof 9,094,414 shares.
On April 30, 2019, the remaining AYCFL US$292.8 million guaranteed exchangeable bonds as ofDecember 31, 2018 were exchanged and converted into total of 377.5 million ALI ordinary commonshares. On May 2, 2019, the Bonds have zero outstanding balance.

- 137 -
*SGVFS039491*
The total cumulative exchanges of the Bonds into shares resulted in an overall gain of P=12.3 billionwhich was booked under Equity Reserve.
As of December 31, 2019 and 2018, the outstanding balance of the Bonds amounted to nil andP=15.3 billion, respectively.
The loan agreements on long-term debt of the Company and certain subsidiaries provide for certainrestrictions and requirements with respect to, among others, payment of dividends, incurrence ofadditional liabilities, investment and guaranties, mergers or consolidations or other material changesin their ownership, corporate set-up or management, acquisition of treasury stock, disposition andmortgage of assets and maintenance of financial ratios at certain levels. These restrictions andrequirements were complied with by the Group as of December 31, 2019 and 2018. The ParentCompany aims to maintain for its debt to equity ratio not to exceed 3:1 in compliance with loancovenants of AYCFL.
ALI GroupBelow is the summary of the outstanding Peso bonds issued by ALI Group:
YearIssued
Term(Years)
Interestrate
PrincipalAmount
(In thousands)
Carrying Value(In thousands)
Features2019 2018
2012 7.0 5.6250% P=9,350,000 P=− P=9,341,196 Fixed rate bond due 20192012 10.0 6.0000% 5,650,000 5,645,304 5,644,680 Fixed rate bond due 20222013 7.0 4.6250% 4,000,000 3,995,321 3,989,546 Fixed rate bond due 20202013 20.0 6.0000% 2,000,000 1,985,276 1,984,613 Fixed rate bond due 20332013 10.5 5.0000% 15,000,000 14,936,647 14,923,051 Fixed rate bond due 20242014 11.0 5.6250% 8,000,000 7,952,880 7,945,703 Fixed rate bond due 20252015 7.0 4.5000% 7,000,000 6,968,807 6,960,744 Fixed rate bond due 20222016 9.5 4.7500% 7,000,000 6,955,765 6,949,421 Fixed rate bond due 20252016 10.0 4.8500% 8,000,000 7,946,612 7,939,468 Fixed rate bond due 20262016 3.0 3.0000% 2,982,530 − 2,971,976 Homestarter Bond due 20192016 7.0 3.8915% 7,000,000 6,961,631 6,952,613 Fixed rate bond due 20232017 10.0 5.2624% 7,000,000 6,972,611 6,969,630 Fixed rate bond due 20272018 10.0 5.9203% 10,000,000 9,896,154 9,886,828 Fixed rate bond due 20282018 5.0 7.0239% 8,000,000 7,925,898 7,909,305 Fixed rate bond due 20232019 7.0 6.3690% 8,000,000 7,909,802 − Fixed rate bond due 20262019 5.0 4.7580% 3,000,000 2,979,164 − Fixed rate bond due 20242019 2.0 4.2463% 9,000,000 8,937,450 − Fixed rate bond due 20212019 7.25 4.9899% 1,000,000 952,029 − Fixed rate bond due 2027
Total P=108,921,351 P=100,368,774
Philippine Rating Services Corporation (PhilRatings) rated the ALI’s 2019 bond issue “PRS Aaa” witha stable outlook, and maintained the “PRS Aaa” rating with a stable outlook for all other outstandingbonds.
Philippine Peso 7-Year and 10-year Bonds due 2019 and 2022In April 2012, ALI issued a total of P=15,000.0 million bonds, broken down into aP=9,350.0 million bond due 2019 at a fixed rate equivalent to 5.6% p.a. and a P=5,650.0 million bonddue 2022 at a fixed rate equivalent to 6.0% p.a. Interest payments are protected by a large or by anexceptionally stable margin and principal is assured. While the various protective elements are likelyto change, such changes as can be visualized are most unlikely to impair the fundamentally strongposition of such issues. ALI fully paid the P=9,350.0 million bond in April 2019.
Philippine Peso 5-year and 10-year and 6-month Bonds due 2024In July 2013, ALI issued a total of P=15,000.0 million bonds due 2024 at a fixed rate equivalent to5.0% p.a. Credit Rating and Investors Services Philippines, Inc. (CRISP) assigned a "AAA" on thebonds indicating that it has a minimal credit risk owing to the Company’s capacity to repay its debtobligations. In 2019, ALI issued a total of P=3,000.0 million bonds due 2024 at a fixed rate equivalentto 4.758% p.a. under its new shelf registration.

- 138 -
*SGVFS039491*
Philippine Peso 7-Year and 20-year Bonds due 2020 and 2033In October 2013, ALI issued a total of P=6,000.0 million bonds, broken down into a P=4,000.0 millionbond due 2020 at a fixed rate equivalent to 4.6% p.a. and a P=2,000.0 million bond due 2033 at afixed rate equivalent to 6.0% p.a. CRISP assigned a "AAA" rating on the bonds indicating that it hasa minimal credit risk owing to ALI’s capacity to repay its debt obligations.Philippine Peso 11-year Bonds due 2025
In April 2014, ALI issued a total of P=8,000.0 million bonds due 2025 at a fixed rate equivalent to5.6% p.a.
Philippine Peso 7.0 Billion Fixed Rate Bonds due 2022In April 2015, ALI issued a total of P=7,000.0 million bonds due 2022 at a fixed rate equivalent to 4.5%p.a.
Philippine Peso 9-year and 6-month Bonds due 2025In April 2016, ALI issued a total of P=7,000.0 million bonds due 2025 at a fixed rate equivalent to4.75% p.a. The Bonds is the second tranche of the Fixed-rate Bonds Series under ALI's P=50,000.0million Debt Securities Program registered in the SEC.
Philippine Peso 7-year and 10-year Bonds due 2026In March 2016, ALI issued a total of P=8,000.0 million bonds due 2026 at a fixed rate equivalent to4.85% p.a. The Bonds is the first tranche of the Fixed-rate Bonds Series under ALI's P=50,000 millionDebt Securities Program registered in the SEC. In May 2019, ALI issued an P=8,000.0 million fixedrate bond due 2026 at a rate equivalent to 6.369% p.a. The Bonds represent the first tranche of debtsecurities issued under the Parent Company's new P=50,000.0 million Debt Securities Programregistered with the SEC, and listed on the PDEx.
Philippine Peso 3-Year Homestarter Bond due 2019 and 7-year Bonds due 2023In October 2016, ALI issued a total of P=10,000.0 million bonds, broken down into a P=3,000.0 millionHomestarter bond due 2019 at a fixed rate of 3.0% per annum and a P=7,000.0 million fixed rate bonddue 2023 at a rate equivalent to 3.8915% per annum The Bonds represent the first tranche ofHomestarter Bonds series and the third tranche of the Fixed-rate Bonds Series issued under ALI'sP=50,000.0 million Debt Securities Program registered with the SEC, and listed in the PDEx. In 2017,ALI paid P=9.1 million as an early down payment of the outstanding 3-Year Homestarter Bond. In2018, ALI paid P=8.4 million as an early down payment of the outstanding 3-Year Homestarter Bond.ALI fully paid the remaining Homestarter Bond on October 21 and December 23, 2019.
Philippine Peso 7-year and 3-month and 10-year Bonds due 2027In May 2017, ALI issued a P=7,000.0 million fixed rate bond due 2027 at a rate equivalent to 5.2624%p.a. The Bonds represent the fourth tranche of the Fixed-rate Bonds Series issued under the ALI'sP=50,000.0 million Debt Securities Program registered with the SEC, and listed in PDEx. InNovember 2019, ALI issued a P=1,000.0 million fixed rate bond due 2027 at a rate equivalent to4.9899 % p.a. This was the third tranche of bonds issued under the new P=50,000.0 million shelfregistration of ALI.
Philippine Peso 10-year Bonds due 2028In April 2018, ALI issued a P=10,000.0 million fixed rate bond due 2028 at a rate equivalent to5.9203% per annum and subject to repricing on 27 April 2023, the fifth anniversary of the Issue Date,at the higher of 5.9203% or the prevailing 5-year benchmark plus 75 bps. The Bonds represent thefifth tranche of the Fixed-rate Bonds Series issued under ALI's P=50,000.0 million Debt SecuritiesProgram registered with the SEC,and listed in the PDEx.
Philippine Peso 5-year Bonds due 2023In October 2018, ALI issued a P=8,000.0 million fixed rate bond due 2023 at a rate equivalent to7.0239% per annum The Bonds represent the sixth and final tranche of the Fixed-rate Bonds Seriesissued under ALI's P=50,000.0 million Debt Securities Program registered with the SEC, and listed inthe PDEx.

- 139 -
*SGVFS039491*
Philippine Peso 2-year Bonds due 2021On November 6, 2019, ALI issued a P=9.0 billion fixed rate bond due 2021 at a rate equivalent to4.2463% per annum. The Bonds form part of the third trance of debt securities issued under ALI’snew P=50. 0 billion Debt Securities Program registered with the SEC and listed on PDEx.
Philippine Peso 21-month Note due 2019In July 2017, ALI issued and listed on the Philippine Dealing & Exchange Corp. a P=4,300.0 millionCorporate Note. This Note issue is an SEC-registration exempt transaction under Section 10.1(l) ofthe Securities Regulation Code (SRC) and Section 10.1.3 of the 2015 Implementing Rules andRegulations of the SRC. Thus, the Note was offered on a limited basis to juridical persons or entitieswho, at the point of offer or sale, were Qualified Buyers. The Notes bear a fixed interest rate of2.75% per annum The Corporate Notes matured in April 2019.
Philippine Peso 15-month Note due 2019In November 2017, ALI issued and listed on the PDEx Corp. a P=3,100.0 million Corporate Note. ThisNote issue is an SEC-registration exempt transaction under Section 10.1(l) of the SecuritiesRegulation Code (SRC) and Section 10.1.3 of the 2015 Implementing Rules and Regulations of theSRC. Thus, the Note was offered on a limited basis to juridical persons or entities who, at the pointof offer or sale, were Qualified Buyers. The Notes bear a fixed interest rate of 3.25% per annumThe Corporate Notes matured in February 2019.
Philippine Peso 5-, 10-, 15-Year FXCN due on 2016, 2021 and 2026In January 2011, ALI issued P=10,000.0 million FXCNs to various financial institutions and retailinvestors. The notes will mature on various dates up to 2026. The FXCNs bear fixed interestrates ranging from 5.6% to 7.5% per annum depending on the term of the notes. ALI prepaidP=1,950.0 million of notes due in 2016 on January 19, 2013. In 2014, ALI paid P=43.0 million for thematured portion of the loan. In January 2016, ALI paid P=3,750 million notes for the matured portionof the loan. In 2017, ALI paid P=43.0 million for the matured portion of the loan. In 2018, ALI prepaidP=3,234.0 million notes and paid P=10.0 million for the matured portion of the loan. As of December 31,2019 and 2018, the remaining balance of the FXCN amounted to P=960.0 million and P=970.0 million,respectively.
Philippine Peso 10-year Note due 2023In December 2012, ALI executed a P=5.0 billion committed Corporate Note facility with a local bank, ofwhich an initial P=3.5 billion was drawn in 2012. The balance of P=1.5 billion was subsequently drawnin January 2013. The Corporate Notes currently bear a fixed interest rate of 4.50% and will matureon the third month succeeding the tenth anniversary of the initial drawdown date. In 2015, theP=50.0 million was prepaid by ALI. In 2017, another P=50.0 million was prepaid by ALI. In 2017, ALIpaid another P=50.0 million. In 2018, another P=50.0 million was prepaid by ALI. In 2019, ALI paidanother amortization in the amount of P=50.0 million. As of December 31, 2019 and 2018, theremaining balance of the note amounted to P=4,750.0 million and P=4,800.0 million, respectively.
Philippine Peso 5.0 Billion Fixed Rate Bonds due 2021In June 2014, CHI issued a total of P=5.0 billion bonds due 2021 at a fixed rate equivalent to 5.32%per annum
The loan agreements on long-term debt of the Parent Company and some subsidiaries provide forcertain restrictions and requirements with respect to, among others, payment of dividends,incurrence of additional liabilities, investment and guaranties, mergers or consolidations or othermaterial changes in their ownership, corporate set-up or management, acquisition of treasury stock,disposition and mortgage of assets and maintenance of financial ratios at certain levels. Theserestrictions and requirements were complied with by the Group as of December 31, 2019 and 2018.

- 140 -
*SGVFS039491*
ACEI GroupGreen BondsOn January 29, 2019, ACEI, through its wholly-owned subsidiary (ACEFIL issued US dollar-denominated senior Green Bonds (Bonds) at an aggregate principal amount of US$225 million with a5-year tenor and a coupon of 4.75% per annum, priced at 99.451. The Bonds were successfullylisted in the Singapore Exchange on January 30, 2019.
On February 12, 2019, International Finance Corporation (IFC) invested an additional US$75 millionin ACEI’s Bonds described above via a tap on the facility - bringing the total five-year issue size toUS$300 million. On the same date, ACEFIL also issued 10-year Bonds with a principal amount ofUS$110 million, with a coupon of 5.25% per annum, priced at 99.616. These were also listed on theSingapore Exchange.
The Bonds, now with an aggregate principal amount of US$ 410 million, were issued off a recentlyestablished US$1.00 billion Medium Term Note Programme and are guaranteed by ACEI.
FFL BondsOn November 27, 2019, the Group also issued US dollar-denominated fixed-for-life (FFL Bonds)through ACEFIL at an aggregate principal amount of US$400.00 million (P20,300.0 million) with afixed coupon of 5.65 % for life and with no step-up and no reset.
There is no property owned by the Group that was pledged as collateral to these loans.ACEI plans to deploy the funds for renewable energy expansion across the Asia Pacific region toinclude the Philippines, Indonesia, Vietnam, Myanmar, India and Australia, among others.
Interest capitalized by subsidiaries amounted to P=128.2 million and P=196.2 million in 2019 and 2018,respectively. The capitalization rates are 4.41% to 7.01% in 2019 and 2% to 7.65% in 2018.
Compliance with debt covenantsThe loan agreement on long-term debt of the Parent Company and some subsidiaries provide forcertain restrictions and requirements with respect to, among others, payment of dividends,incurrence of additional liabilities, investment and guaranties, mergers or consolidations or othermaterial changes in their ownership, corporate set-up or management, acquisition of treasury stock,disposition and mortgage of assets and maintenance of financial ratios at certain levels. Theserestrictions and requirements were complied with by the Group as of December 31, 2019 and 2018.
20. Other Noncurrent Liabilities
This account consists of the following:
2019
2018
(Restated)
(In Thousands)Deposits and deferred credits P=23,073,011 P=29,702,272Retentions payable 6,751,643 5,721,123Contractors payable 6,595,611 7,264,642Liability for purchased land 5,426,645 5,021,034Deferred output vat 1,721,402 1,923,754Subscriptions payable 498,687 802,702DRP obligation – 1,001,146Provisions (Note 36) – 569,893Others 4,380,371 1,837,598
P=48,447,370 P=53,844,164

- 141 -
*SGVFS039491*
Deposits and deferred creditsDeposits include security deposits from tenants of retail and office spaces and deferred creditsarising from sale of real estate properties. Security deposits are equivalent to three (3) to six (6)months’ rent of long-term tenants with noncancellable leases. This will be refunded to the lessees atthe end of the lease term or be applied to the last months' rentals on the related contracts. This alsoincludes customers’ deposits which consist of excess of collections over the recognized receivablesbased on percentage of completion. Deferred credits pertain to advances from buyers of real estateproperties to cover various processing fees including, but not limited to, fees related to transfer of titlesuch as registration fees, documentary taxes and transfer taxes. Payments made by ALI Group forthe processing of title are charged to this account.
Customers’ deposits consist of excess of collections over the recognized receivables based onpercentage of completion.
Contractors payableContractors payable represents accrued costs incurred for property development that are not yetbilled.
Retentions payableRetentions payable pertains to amount withheld by the Group from the contractors’ billings to bereleased after the guarantee period, usually one (1) year after the completion of the project or upondemand. The retention serves as a security from the contractor should there be defects in projectsrequiring rework.
Liability for purchased landLiability for purchased land pertains to the portion of unpaid unsubdivided land acquired during theyear. These are normally payable in quarterly or annual installment payments within three (3) or five(5) years.
Deferred output VATDeferred output VAT pertains to output VAT on receivables for which sales recognition has beendeferred based on sales collection threshold for VAT recognition purposes.
DRP obligationDRP obligation pertains to the liability arising from the assignment agreement between NTDCC, asubsidiary of ALI, and MRTDC of the latter’s development rights (see Note 36). In consideration ofthe lease, NTDCC will be charged an annual rent related to the original DRP obligation on MRTDCand 5% of the rental income from NTDCC’s commercial center business. This amount has beenreclassified in line with the adoption of PFRS 16.
Subscriptions payableSubscription payable mainly pertains to ALLHC’s investment in Cyber Bay.
On April 25, 1995, Central Bay, a wholly-owned subsidiary of Cyber Bay, entered into a Joint VentureAgreement with the Philippine Reclamation Authority (PRA; formerly Public Estates Authority) for thecomplete and entire reclamation and horizontal development of a portion of the Manila-CaviteCoastal Road and Reclamation Project (the Project) consisting of three partially reclaimed andsubstantially eroded islands (the Three Islands) along Emilio Aguinaldo Boulevard in Parañaque andLas Piñas, Metro Manila with a combined total area of 157.8 hectares, another area of 242.2hectares contiguous to the Three Islands and, at Central Bay’s option as approved by the PRA, anadditional 350 hectares more or less to regularize the configuration of the reclaimed area.
On March 30, 1999, the PRA and Central Bay executed an Amended Joint Venture Agreement(AJVA) to enhance the Philippine Government’s share and benefits from the Project which wasapproved by the Office of the President of the Philippines on May 28, 1999.

- 142 -
*SGVFS039491*
On July 9, 2002, the Supreme Court (SC) (in the case entitled “Francisco Chavez vs. Amari CoastalBay and Reclamation Corp.”) issued a ruling declaring the AJVA null and void. Accordingly, PRAand Central Bay were permanently enjoined from implementing the AJVA.
On July 26, 2002, Central Bay filed a Motion for Reconsideration (MR) of said SC decision. OnMay 6, 2003, the SC En Banc denied with finality Central Bay’s MR. On May 15, 2003, Central Bayfiled a Motion for Leave to Admit Second MR. In an En Banc Resolution of the SC datedJuly 8, 2003, the SC resolved to admit the Second MR of Central Bay.
On November 11, 2003, the SC rendered a 7-7 split decision on Central Bay’s Second MR. Becauseof the new issues raised in the SC’s latest resolution that were never tried or heard in the case,Central Bay was constrained to file on December 5, 2003 a Motion for Re-deliberation of the SC’slatest resolution which motion was denied with finality by the SC.
With the nullification of the AJVA, Central Bay has suspended all Project operations. On August 10,2007, in view of the failure by the PRA to comply with its obligations and representations under theAJVA, Cyber Bay and Central Bay have filed their claims for reimbursement of Project expenses inthe amount of P=10,200.0 million with the PRA. Cyber Bay and Central Bay provided the PRA withthe summary and details of their claims on September 5, 2007.
On July 15, 2008, Cyber Bay sent a follow-up letter to the PRA. The PRA, in its letter datedJuly 18, 2008, informed Cyber Bay that its claim is still being evaluated by the PRA. As ofDecember 31, 2019, the claim is still being evaluated by the PRA.
As of December 31, 2019 and 2018, ALI Group has unpaid subscription in Cyber Bay amounting toP=481.7 million. The investment in Cyber Bay under “Investment in bonds and other securities”amounted to P=513.6 million and P=548.3 million as of December 31, 2019 and 2018, respectively(see Note 15).
ProvisionsProvisions relate to pending unresolved claims and assessments.
On October 13, 2005, the Municipality of Norzagaray, Bulacan assessed the Parent Company andMaynilad Water Services, Inc. (jointly, the Concessionaires) real property taxes on certain commonpurpose facilities registered in the name of and owned by MWSS purportedly due from 1998 to 2005amounting to 357.11 million. On November 15, 2010, the local government of Quezon Citydemanded the payment of 302.71 million for deficiency real property taxes from MWSS on MWSSproperties within its territorial jurisdiction. The assessments from the municipality of Norzagaray andQuezon City have been questioned by the Concessionaires and MWSS and are pending resolutionbefore the Central Board of Assessment Appeals and Supreme Court, respectively. On November 7,2018, the Supreme Court issued its decision declaring that the real properties of the MWSS locatedin Quezon City are exempt from the real estate tax imposed by the local government of QuezonCity. Total provision for these assessments amounted to nil and 416.23 million as ofDecember 31, 2019 and 2018, respectively.
As of December 31, 2019 and 2018, the remaining provision for estimated probable losses pertainsto various legal proceedings and exposures arise in the ordinary course of business. Managementbelieves that any amount the Group may have to pay in connection with any of these matters will nothave a material adverse effect on the Group’s financial position or operating results
R.A. No. 9275 or the Philippine Clean Water Act of 2004 (the “Philippine Clean Water ActThe legal proceedings before the Supreme Court originated from a complaint filed by the RegionalDirector of the Environmental Management Bureau-National Capital Region (EMB-NCR) before thePollution Adjudication Board (“PAB”) against the MWC, Maynilad Water Services, Inc. (“Maynilad”)and MWSS for alleged violation of the Philippine Clean Water Act of 2004 (RA No.9275, the “CleanWater Act”), particularly the five (5)-year deadline imposed in Section 8 thereof for connecting theexisting sewage line found in all subdivisions, condominiums, commercial centers, hotels, sports and

- 143 -
*SGVFS039491*
recreational facilities, hospitals, market places, public buildings, industrial complex and other similarestablishments including households, to an available sewerage system. Two (2) similar complaintsagainst Maynilad and MWSS were consolidated with this case.
On September 18, 2019, MWC received a copy of the Decision of the Supreme Court on the case of‘Manila Water Company, Inc. vs. The Secretary of the Department of Environment and NaturalResources, et.al.’ with G.R. No. 206823 promulgated on August 6, 2019. In this Decision, theSupreme Court found MWC liable for fines in violation of Section 8 of the Clean Water in thefollowing manner:
a) MWC shall be jointly and severally liable with the MWSS for the total amount of ₱921.5 millioncovering the period starting from May 7, 2009 to the date of promulgation of the Decision, August6, 2019, to be paid within fifteen (15) days from finality of the Decision.
b) From finality of the Decision until full payment of the ₱921.5 fine, MWC shall be fined in the initialamount of ₱322,102.00 per day, subject to a further 10.0% increase every two (2) years asprovided under Section 28 of the Philippine Clean Water Act, until full compliance with Section 8of the same law.
c) The total amount of fines imposed by the Decision shall earn legal interest of 6% per annum fromfinality and until full satisfaction thereof.
On October 2, 2019, MWC filed a Motion for Reconsideration with the Supreme Court. As ofMarch 12, 2020, MWC has not received any resolution from the Supreme Court.The information usually required by PAS 37, Provisions, Contingent Liabilities and ContingentAssets, is not disclosed on the ground that it can be expected to prejudice the outcome of theseclaims and assessments (see Note 37).
The provision of MWC group amounted to ₱1,181.9 million has been reclassified to liabilities underPFRS 5.
OthersOthers include nontrade payables. In 2019, this includes liability for the unpaid acquisition cost byACEI Group to Axia for the 20% interest in SLTEC amounting to ₱2,040.0 million.
21. Equity
The details of the Parent Company’s preferred and common shares follow:
Preferred A shares Preferred B shares Preferred C sharesVoting Preferred
shares Common shares
2019 2018 2019 2018 2019 2018 2019 2018 2019 2018
(In Thousands, except par value per share)
Authorized shares 12,000 12,000 58,000 58,000 40,000 40,000 200,000 200,000 900,000 900,000Par value per share P=100 P=100 P=100 P=100 P=100 P=100 P=1 P=1 P=50 P=50Issued and subscribed
shares 12,000 12,000 58,000 58,000 – – 200,000 200,000 631,162 630,627Outstanding shares
At beginning of year – – 47,000 47,000 – – 200,000 200,000 630,627 621,292Issuance of shares – – – – – – – – – 8,810Issued shares on
exercise of shareoptions – – – – – – – – 19 7
Subscribed shares – – – – – – – – 516 518Treasury shares
Redemption – – (27,000) – – – – – – –Re-issuance – – 30,000 – – – – – – –Acquisition – – – – – – – – (4,479) –
At end of year – – 50,000 47,000 – – 200,000 200,000 626,683 630,627

- 144 -
*SGVFS039491*
Details of Preferred B shares as follows (in Thousands, except par value per share).
Series 1 Series 2 Total
Preferred B 2019 2018 2019 2018 2019 2018
Par value per share P=100 P=100 P=100 P=100Issued and subscribed
shares 28,000 28,000 30,000 30,000 58,000 58,000Treasury shares 8,000 8,000 – 3,000 8,000 11,000Outstanding shares 20,000 20,000 30,000 27,000 50,000 47,000Cost of treasury shares P=800,000 P=800,000 P=– P=300,000 P=800,000 P=1,100,000
Preferred SharesPreferred A sharesOn November 11, 2008, the Parent Company filed a primary offer in the Philippines of its Preferred Ashares at an offer price of P=500.00 per share to be listed and traded on the PSE.
Preferred A shares are cumulative, nonvoting and redeemable at the option of the Parent Companyunder such terms that the BOD may approve at the time of the issuance of shares and with adividend rate of 8.88% per annum. The Preferred A shares may be redeemed at the option of theParent Company starting on the fifth year.
On June 28, 2013, the BOD approved and authorized the exercise of call option on Preferred Ashares effective November 25, 2013 based on the dividend rate of 8.88% per annum. Theredemption of Preferred A shares is presented as part of treasury stock.
Preferred B sharesIn July 2006, the Parent Company filed a primary offer in the Philippines of its Preferred B shares atan offer price of P=100.00 per share to be listed and traded in the PSE. The Preferred B shares arecumulative, nonvoting and redeemable at the option of the Parent Company under such terms thatthe BOD may approve at the time of the issuance of shares and with dividend rate of 9.4578% perannum. The Preferred B shares may be redeemed at the option of the Parent Company starting onthe fifth year from the date of issuance.
On March 14, 2011, the BOD approved and authorized the exercise of call option on its Preferred Bshares effective July 21, 2011 based on the dividend rate of 9.5% per annum. The redemption ofPreferred B shares is presented as part of treasury stock.
Preferred B Series 1 sharesIn September 2013, the BOD approved and authorized the re-issuance and offering of 20.0 millionPreferred B Series 1 shares from its 58.0 million authorized Class “B” preferred treasury share capitalfor an aggregate amount of P=10.0 billion. The Preferred B Series 1 shares were offered at a price ofP=500.00 per share with a fixed quarterly dividend rate of 5.25% per annum.
Preferred B Series 2 sharesOn August 22, 2014, the BOD approved and authorized the re-issuance and offering of 27.0 millionPreferred B Series 2 shares, which comprise a second and separate series from the ParentCompany’s outstanding 5.25% Preferred B Series 1 shares, from its 58.0 million authorized Class “B”preferred treasury share capital, for an aggregate amount of P=13.5 billion. The Preferred B Series 2shares were offered at a price of P=500.00 per share with a dividend rate of 5.575%. The reissuanceresulted to the Parent Company recognizing P=10.7 billion additional paid-in capital net of directexpenses from re-issuance.
On September 13, 2019, the BOD approved and authorized the redemption by the Parent Companyof its 27.0 million Preferred B Series 2 shares representing all of the outstanding Preferred B Series 2shares shares at the redemption price equal to the issue price plus all accrued and unpaid dividendsuntil November 5, 2019 based on the dividend rate of 5.575% per annum. On the same date, theBOD also approved and authorized the re-issuance and offering of 30.0 million Preferred B Series 2shares for an offer price of P=500.00 per share with initial dividend rate of 4.8214% per annum which

- 145 -
*SGVFS039491*
will be applicable until its next dividend rate resetting date which is 5 years from issue date. The re-issuance resulted to the Parent Company recognizing P=1.1 billion additional paid-in capital net ofdirect expenses from re-issuance.
Preferred C shares.Preferred C shares are cumulative, non-participating, non-voting and redeemable at the option of theParent Company under such terms that the BOD may approve at the time of the issuance of theshares.
Voting Preferred sharesOn March 15, 2010, the BOD approved the reclassification of 4.0 million unissued common shareswith a par value of P=50.00 per share into 200.0 million Voting Preferred shares with a par value ofP=1.00 per share and the amendment of the Parent Company’s amended Articles of Incorporation toreflect the reclassification of the unissued common shares into new Voting Preferred shares.On April 16, 2010, the Parent Company’s stockholders ratified the reclassification.
On April 22, 2010, the SEC approved the amendments to the Parent Company’s Articles ofIncorporation embodying the reclassification of the unissued common shares to new Voting Preferredshares.
The Voting Preferred shares are cumulative, voting and redeemable at the option of the ParentCompany under such terms that the BOD of the Parent Company may approve at the time of theissuance of shares and with a dividend rate of 5.3% per annum. In 2016, the dividend rate wasrepriced to 3.6950%.On July 16, 2019, the BOD approved the re-pricing of dividend rate to 5.7730% per annum, which isequal to the 3-year PHP BVAL reference rate as of May 20, 2019 and will be applicable until May 20,2022, the next re-pricing date.
Common SharesThe common shares may be owned or subscribed by or transferred to any person, partnership,association or corporation regardless of nationality, provided that at any time at least 60% of theoutstanding capital stock shall be owned by citizens of the Philippines or by partnerships,associations or corporations with 60% of the voting stock or voting power of which is owned andcontrolled by citizens of the Philippines.
In July 2013, the SEC approved the amendments to the Parent Company’s Articles of Incorporationfor the exemption of 100 million common shares from the exercise of pre-emptive rights of holders ofcommon shares. These shares are allocated to support the financing activities of the ParentCompany.
On July 21, 2018, the Parent Company issued 8.8 million common shares at a price of P=916.0 pershare to an institutional investor and paid documentary stamp taxes and listing fee amounting toP=4.4 million and P=9.0 million, respectively.
On May 22, 2019, the Parent Company purchased its 3,805,644 common shares at P=838.00 fromMitsubishi Corporation ("Mitsubishi") pursuant to the share buyback program approved by the BODon September 10, 2007, June 2, 2010, and December 10, 2010.
On December 11, 2019, the Parent Company also purchased its 613,000 common shares atP=815.00 pursuant to the share buyback program of P=10.0 billion worth of shares approved by theBOD on December 5, 2019. The Company purchased another 60,000 common shares at P=752.00on December 16, 2019.
Treasury sharesAs of December 31, 2019, treasury shares include 12.0 million Preferred A shares amountingP=1.2 billion, 8.0 million Preferred B shares amounting to P=800.0 million and 4.5 million commonshares amounting to P=3.7 million.

- 146 -
*SGVFS039491*
As of December 31, 2018, treasury shares include 12.0 million Preferred A shares and 11.0 millionPreferred B shares amounting to P=1.2 billion and P=1.1 billion, respectively.
The details of the Parent Company’s paid-in capital follow:
2019
PreferredStock - A
PreferredStock - B
VotingPreferred
CommonStock Subscribed
AdditionalPaid-inCapital
SubscriptionsReceivable
TotalPaid-inCapital
TreasuryStock
(In Thousands)
At beginning of year P=1,200,000 P=5,800,000 P=200,000 P=31,340,717 P=190,658 P=46,156,018 (P=1,525,718) P=83,361,675 (P=2,300,000)
Redemption of Preferred B Series 2 shares – – – – – – – – (13,500,000)
Re-issuance of redeemed Preferred B Series 2 shares – – – – – – – – 13,500,000
Issuance of additional Preferred B Series 2 shares – – – – – 1,079,931 – 1,079,931 300,000
Exercise/Cancellation/ Subscription of ESOP/ ESOWN – – – 943 25,795 601,297 (468,093) 159,942 –Collection of subscription receivables – – – – – – 274,677 274,677 –
Buyback of common shares – – – – – – – – (3,737,896)
At end of year P=1,200,000 P=5,800,000 P=200,000 P=31,341,660 P=216,453 P=47,837,246 (P=1,719,134) P=84,876,225 (P=5,737,896)
2018
PreferredStock - A
PreferredStock - B
VotingPreferred
CommonStock Subscribed
AdditionalPaid-inCapital
SubscriptionsReceivable
TotalPaid-inCapital Treasury Stock
(In Thousands)
At beginning of year P=1,200,000 P=5,800,000 P=200,000 P=30,899,877 P=164,725 P=37,929,927 (P=1,193,355) P=75,001,174 (P=2,300,000)Issuance of new
shares – – – 440,500 − 7,615,757 − 8,056,257 –Exercise/Cancellation/
Subscription ofESOP/ESOWN – – – 340 25,933 610,334 (500,942) 135,665 –
Collection ofsubscription
receivables – – – − − − 168,579 168,579 –
At end of year P=1,200,000 P=5,800,000 P=200,000 P=31,340,717 P=190,658 P=46,156,018 (P=1,525,718) P=83,361,675 (P=2,300,000)
In accordance with Revised SRC Rule 68, Annex 68-K, below is a summary of the ParentCompany’s track record of registration of securities.
2019 2018
Number of sharesregistered Issue/offer price Date of approval
Number ofholders of
securities as ofDecember 31
Number ofholders of
securities as ofDecember 31
Common shares 200,000,000* P=1.00 par value**;P=4.21 issue price
July 1976 6,424 6,507
Preferred A shares*** 12,000,000 P=100 par value;P=500 issue price
November 2008 − −
Preferred B shares 8,000,000 P=100 par value;P=500 issue price
July 2006 − −
Preferred B shares-Series 1****
20,000,000 P=100 par value;P=500 issue price
October 2013 19 19
Preferred B shares-Series 2*****
30,000,000 P=100 par value;P=500 issue price
November 2019 2 −
27,000,000 P=100 par value;P=500 issue price
October 2014 − 10
Voting preferredshares
200,000,000 P=1 par value;P=1 issue price
March 2010 1,039 1,031
*Initial number of registered shares only.**Par value now is P=50.00***The Preferred A shares were fully redeemed on November 25, 2013.****The Preferred B- Series 1 shares were re-issued on November 15, 2013.*****The Preferred B-Series 2 share were re-issued on November 29, 2019.

- 147 -
*SGVFS039491*
Retained EarningsRetained earnings include the accumulated equity in undistributed net earnings of consolidatedsubsidiaries and associates and joint ventures accounted for under the equity method amounting toP=184,615.5 million, P=142,844.6 million and P=116,104.3 million as of December 31, 2019, 2018 and2017, respectively, which are not available for dividend declaration by the Parent Company untilthese are declared by the investee companies.
Retained earnings are further restricted for the payment of dividends to the extent of the cost of theshares held in treasury.
In accordance with the Revised SRC Rule 68, Annex 68-D, the Parent Company’s retained earningsavailable for dividend declaration as of December 31, 2019 and 2018 amounted to P=46.5 billion andP=34.0 billion, respectively.
Dividends consist of the following:
2019 2018 2017
(In Thousands, except dividends per share)Dividends to common shares Cash dividends declared
during the year P=5,204,472 P=4,333,459 P=4,299,109 Cash dividends per share 8.30 6.92 6.92Dividends to equity preferred shares
declared during the year Cash dividends to Preferred B
shares 1,248,210 1,277,625 1,277,625 Cash dividends to Voting Preferred
shares 11,546 7,390 7,390
Capital ManagementThe primary objective of the Parent Company’s capital management policy is to ensure that itmaintains a robust balance sheet in order to support its business and maximize shareholder value.
The Parent Company manages its capital structure and makes adjustments to it, in light of changesin economic conditions. To maintain or adjust the capital structure, the Parent Company may adjustthe dividend payment to shareholders or issue new shares. No changes were made in theobjectives, policies or processes for the years ended December 31, 2019, 2018 and 2017.
The Parent Company monitors capital using a gearing ratio of debt to equity and net debt to equity.Debt consists of short-term and long-term debt of the Group. Net debt includes short-term and long-term debt less cash and cash equivalents, short-term investments and restricted cash of the Group.The Parent Company considers as capital the total equity.
2019 2018
(In Thousands)Short-term debt P=29,788,643 P=39,518,245Long-term debt 375,549,514 372,743,387
Total debt 405,338,157 412,261,632Less: Cash and cash equivalents 93,405,253 60,624,263 Short-term investments 13,387,801 5,956,489 Restricted cash 4,261,796 2,365,311
Net debt P=294,283,307 P=343,315,569
Total equity P=509,313,558 P=469,108,355
Debt to equity 79.6% 87.9%
Net debt to equity 57.8% 73.2%

- 148 -
*SGVFS039491*
The loan agreements on long-term debt of the Parent Company and some subsidiaries provide forcertain restrictions and requirements with respect to, among others, payment of dividends,incurrence of additional liabilities, investment and guaranties, mergers or consolidations or othermaterial changes in their ownership, corporate set-up or management, acquisition of treasury stock,disposition and mortgage of assets and maintenance of financial ratios at certain levels. Theserestrictions and requirements were complied with by the Group as of December 31, 2019 and 2018.
Due to certain constraints in the local banking system regarding loans to directors, officers,stockholders and related interest (DOSRI), some of the Parent Company’s credit facilities with a localbank are secured by US dollar cash in accordance with BSP regulations. Any outstanding loanamount, as well as the interest, all other charges and expenses, shall be secured by an assignmentof US dollar denominated deposits (thru its financing arm AYCFL, see Note 19) and remain onholdout by the bank for as long as the loan is outstanding at a collateral to loan ratio of 1:1, which theborrower agrees to maintain at all times.The Parent Company also monitors capital through return-to-common equity ratio. For this ratio, theParent Company considers as capital the average amount of equity with the exclusion of accountspertaining to preferred shares and the non-controlling interests.
2019 2018
(In Thousands)Net income attributable to owners of the parent P=35,279,330 P=31,817,721Less: Dividends to equity preferred shares 1,259,756 1,285,015
P=34,019,574 P=30,532,706
Average common equity attributable to owners ofthe parent P=285,499,690 P=249,959,899
Return to common equity 11.9% 12.2%
22. Revenue
This account consists of
20192018
(As Restated)2017
(As Restated)
(In Thousand)Revenue from contracts with customers Real estate P=133,734,275 P=134,474,474 P=114,186,459 Manufacturing services 64,677,782 69,731,033 55,028,256 Others 34,807,402 24,163,360 32,032,305
233,219,459 228,368,867 201,247,020Rental income 31,687,075 28,522,420 24,321,316
Sale of goods and rendering services 264,906,534 256,891,287 225,568,336Share in net profits of associates and joint ventures 22,344,352 19,760,662 18,037,250Interest income from real estate 7,890,972 7,042,078 5,409,944Dividend income 122,903 106,803 653,721
Total P=295,264,761 P=283,800,830 P=249,669,251
Disaggregated revenue informationSet out below is the disaggregation of revenue from contracts with customers of the materialsubsidiaries of the Group:

- 149 -
*SGVFS039491*
ALI GroupRevenue from contracts with customers of ALI Group consists of:
2019 2018 2017
(In Thousands)Revenue from contracts with customers Residential development P=117,580,972 P=120,396,794 P=101,797,865 Hotels and resorts 7,624,159 6,386,896 5,621,164 Construction 3,076,549 2,393,683 1,559,430 Other 5,452,595 5,297,101 5,208,000
Total Revenue P=133,734,275 P=134,474,474 P=114,186,459
ALI Group derives revenue from the transfer of goods and services over time and at a point in time,in different product types. ALI Group’s disaggregation of each source of revenue from contracts withcustomers are presented below:
Residential development
2019 2018
(In thousands)Type of ProductMiddle Income Housing P=36,023,183 P=33,164,100Coremid 34,813,550 33,694,884Condominium 29,326,334 35,284,221Lot only 17,417,905 18,253,589
P=117,580,972 P=120,396,794
All of ALI Group’s real estate sales from residential development are revenue from contracts withcustomers recognized over time.
Hotels and resorts2019 2018
(In thousands)Type of ServicesRooms P=4,447,172 P=3,909,395Food and beverage 2,090,953 2,116,548Other operated department 761,712 296,049Others 324,322 64,904
P=7,624,159 P=6,386,896
ALI Group’s construction revenue pertains to transactions with related parties such as joint venturesand associates.
Set-out below is ALI’s reconciliation of contracts with customers with the amounts disclosed insegment information (in millions):
2019
ResidentialDevelopment International Construction
Hotels andResorts
PropertyManagement
and Others Total
Sales to external customer P=102,981 P=6,709P=3,076 P=7,624
P=5,453 P=125,843
Interest 7,891 − − − − 7,891
Total revenue from contracts
with customers P=110,872 P=6,709 P=3,076 P=7,624 P=5,453 P=133,734

- 150 -
*SGVFS039491*
2018
ResidentialDevelopment International Construction
Hotels andReosrts
Property
Managementand Others Total
Sales to external customer P=105,752 P=7,602 P=2,394 P=6,387 P=5,297 P=127,432Interest 7,042 − − − − 7,042
Total revenue from contracts
with customers P=112,794 P=7,602 P=2,394 P=6,387 P=5,297 P=134,474
Information about ALI Group’s performance obligations are summarized below:
Real estate salesALI Group entered into contracts to sell with one identified performance obligation which is the saleof the real estate unit together with the services to transfer the title to the buyer upon full payment ofcontract price. The amount of consideration indicated in the contract to sell is fixed and has novariable consideration.
The sale of real estate unit may cover the contract for either the (i) serviced lot; (ii) service lot andhouse, and (ii) condominium unit and ALI Group concluded that there is one performance obligationin each of these contracts. ALI Group recognizes revenue from the sale of these real estate projectsunder pre-completed contract over time during the course of the construction.
Payment commences upon signing of the contract to sell and the consideration is payable in cash orunder various financing schemes entered with the customer. The financing scheme would includepayment of 10% of the contract price spread over a certain period (e.g., one to two years) at a fixedmonthly payment with the remaining balance payable (a) in full at the end of the period either throughcash or external financing; or (b) through in-house financing which ranges from two (2) to ten (10)years with fixed monthly payment. The amount due for collection under the amortization schedule foreach of the customer does not necessarily coincide with the progress of construction, which resultsto either a contract asset or contract liability.
After the delivery of the completed real estate unit, ALI Group provides one year warranty to repairminor defects on the delivered serviced lot and house and condominium unit. This is assessed byALI Group as a quality assurance warranty and not treated as a separate performance obligation.
The transaction price allocated to the remaining performance obligations (unsatisfied or partiallysatisfied) as at December 31, 2019 and 2018 are as follows:
2019 2018
(In Thousands)Within one year P=180,244,187 P=47,937,926More than one year 36,483,661 55,328,212
P=216,727,848 P=103,266,138
The remaining performance obligations expected to be recognized within one year and in more thanone year relate to the continuous development of ALI Group’s real estate projects. ALI Group’scondominium units are completed within three years and five years, respectively, from start ofconstruction while serviced lots and serviced house and lots are expected to be completed within twoto three years from start of development.

- 151 -
*SGVFS039491*
IMI GroupThe following table presents revenue of IMI Group by type:
2019 2018
(Amounts in thousands)Manufacturing of goods P=64,399,776 P=69,509,283Non-recurring engineering services 278,006 221,750
Revenue from contracts with customers P=64,677,782 P=69,731,033Translated using the weighted average exchange rate for the year (US$1:P=51.78 in 2019 and $1:P= 52.32 in 2018).
The following table presents revenue per market segment:
2019 2018 2017
(In Thousands)Automotive P=31,011,316 P=28,351,717 P=22,502,867Industrial 16,310,945 17,509,064 11,172,810Consumer 6,584,754 9,218,063 9,514,040Telecommunication 4,907,555 7,015,392 6,130,972Aerospace/defense 2,737,345 2,973,384 1,258,732Medical 826,599 677,805 972,975Multiple market/others 2,299,268 3,985,608 3,475,860
P=64,677,782 P=69,731,033 P=55,028,256Translated using the weighted average exchange rate for the year(US$1:P=51.73 in 2019, $1:P= 52.32 in 2018, and US$1:P=50.40 in 2017).
Revenues from contracts with customers of IMI Group are also further disaggregated by customer’snationality and timing of revenue recognition, as management believes it best depicts how thenature, amount, timing and uncertainty of revenue and cash flows are affected by economic factors.
23. Costs and Expenses and Other Income (Charges)
Details of costs of sales and services included in the consolidated statements of income are asfollows:
20192018
(As Restated)2017
(As Restated)
(In Thousands)Cost of sales (Notes 8 and 31) P=129,029,980 P=138,365,033 P=132,774,423
Cost of services: Personnel costs (Notes 28 and 31) P=12,589,037 P=10,440,253 P=7,836,509 Depreciation and amortization
(Notes 11, 12, 13 and 14) 12,143,989 8,823,927 7,305,578
Professional fees, management feesand commissions 9,399,302 6,874,268 4,649,609
Rental, utilities and supplies 6,007,394 11,259,227 4,859,838 Taxes and licenses 4,076,513 3,076,684 2,953,846 Repairs and maintenance 3,334,893 2,256,489 1,016,457
Hotels and resorts operations 3,001,616 3,030,787 5,435,408 Contract labor 1,687,412 1,072,874 533,892
Transportation and travel 1,049,462 415,316 322,313 Insurance 570,397 406,645 226,635
Others 7,093,263 3,685,135 756,803
60,953,278 51,341,605 35,896,888
Costs of sales and services P=189,983,258 189,706,638 P=168,671,311

- 152 -
*SGVFS039491*
Cost of sales includes, among others, the cost of real estate inventories amounting toP=59.4 billion in 2019, P=67.8 billion in 2018 and P=59.9 billion in 2017; electronics goods amounting toP=45.0 billion in 2019, P=49.5 billion in 2018 and P=44.2 billion in 2017; and cost of vehicles, automotiveparts and accessories amounting to P=19.6 billion in 2019, P=19.7 billion in 2018 and P=28.4 billion in2017.
IMI’s subsidiaries, excluding PSi and IMI BG, participate in their respective national retirementschemes which are considered as defined contribution plans. The retirement expense of thesesubsidiaries which form part of IMI’s personnel cost is as follows:
US$ P=
(In thousands)2019 7,697 387,9342018 7,726 407,0732017 4,793 248,173
“Others” include various costs such as cost of energy sales, communication, dues and fees andmiscellaneous overhead, among others.
General and administrative expenses included in the consolidated statements of income are asfollows:
20192018
(As Restated)2017
(As Restated)
(In Thousands)Personnel costs (Notes 28 and 31) P=15,179,174 P=12,352,751 P=10,412,209Depreciation and amortization
(Notes 11, 12, 13 and 14) 2,882,734 1,946,638 1,582,792Professional fees 2,525,381 2,289,367 1,992,328Taxes and licenses 2,079,132 1,681,497 1,305,991Contract labor 1,472,599 1,046,312 805,684Advertising and promotions 973,506 892,869 818,644Transportation and travel 895,350 697,149 566,055Repairs and maintenance 764,658 736,212 550,594Rental and utilities 605,863 963,986 778,876Postal and communication 432,702 340,702 287,548Dues and fees 349,681 255,509 172,515Insurance 245,152 292,265 183,512Provision for impairment / Losses on: Investments in associates and joint ventures (Note 10) 839,419 589,109 356,700 Receivables (Note 7) 671,601 317,218 242,707 Intangible and other assets (Notes 14 and 24) 410,453 361,170 26,112 Mark-to-market loss (gain) on financial assets at FVTPL (Notes 9 and 32) 394,780 (81,376) 18,813
Inventories (Note 8) 236,644 125,460 (13,674)Property, plant and equipment
(Note 12) 4,493 − – Land and Improvements − − 572,001Supplies 244,714 264,112 155,179Donations and contributions 227,812 254,030 223,048Entertainment, amusement and recreation 140,979 149,592 151,179Write-down of inventories 111,216 − −Research and development 45,069 14,372 181,018Others 379,703 467,784 274,669
P=32,112,815 P=25,956,728 P=21,644,500
Personnel costs include IMI’s retirement expense amounting to US$1.2 million (P=59.5 million),US$72.6 million (P=72.7 million) and US$1.2 million (P=62.6 million) in 2019, 2018 and 2017.

- 153 -
*SGVFS039491*
“Others” include various expenses such as plant relocation costs, management fees, marketing,collection charges, sales commission, bank service charge, periodicals and miscellaneous operatingexpenses. In 2017, the plant relocation costs pertaining to the transfer of one of IMI’s operations inChina from Liantang, Luohu to Pingshan were also charged to certain general and administrativeexpenses. Such plant relocation is in line with the urban redevelopment projects of the ShenzhenCity government.
Depreciation and amortization expense included in the consolidated statements of income follows:
20192018
(As Restated)2017
(As Restated)
(In Thousands)Included in: Cost of sales and services P=12,143,989 P=8,823,927 P=7,305,578 General and administrative expenses 2,882,734 1,946,638 1,582,792
P=15,026,723 P=10,770,565 P=8,888,370
Personnel costs included in the consolidated statements of income follow:
20192018
(As Restated)2017
(As Restated)
(In Thousands)
Included in: Cost of sales and services P=12,589,037 P=10,440,253 P=7,836,509 General and administrative
expenses 15,179,174 12,352,751 10,412,209
P=27,768,211 P=22,793,004 P=18,248,718
Other income consists of:
20192018
As Restated2017
As Restated
(In Thousands)Gain on sale of investments (Notes 2, 10
and 24) P=24,696,571 P=1,514,439 P=1,394,560Remeasurement gain (loss) on
previously held interest (Note 24) 2,020,662 (1,968,599) –Revenue from management contracts 909,212 622,149 564,437Gain on sale of financial assets at FVTPL 528,011 996,170 779,553Collateral income on automotive sales 438,967 492,115 588,045Gain on sale of other assets 192,202 45,303 126,337Insurance claim 144,935 71,793 45,877Connection fees and engineering
services 23,603 – –Recoveries of accounts written off
(Note 7) 3,038 5,268 775,087Foreign exchange loss (Note 32) (258,223) (222,845) (21,344)Others 3,589,512 7,643,095 3,543,876
P=32,288,490 P=9,198,888 P=7,796,428
In 2019, “Gain on sale of investments” include net gain on ACEI’s sale of AA Thermal amounting toP=23.6 billion and gain on merger of AEI and iPeople amounting to P=865.2 million (see Note 2).
In 2018, gain on sale of investments includes gain from sale by STSN to Jinnuo Century Trading
Limited amounting to US$19.1 million (P=1.0 billion).

- 154 -
*SGVFS039491*
“Others” mainly pertain to income derived from ancillary services, other activities rendered for thecustomers not in the normal course of business and miscellaneous income of consolidatedsubsidiaries. In 2019, this includes gain on reversal of put option amounting to $3.45 million(P=178.0 million) (see Note 18), gain on reversal of contingent consideration amounting to $3.73million (P=193.0 million), insurance claims of P=489.0 million and liquidated damages amounting toP=1,157.0 million. In 2018, this includes, among others, gain on reversal of contingent considerationamounting to US$21.3 million (P=1.0 billion), liquidated damages amounting to US$36.0 million(P=1.8 billion), commission income amounting to P=827.2 million, marketing fees, integrated usedwater and other water services (e.g., sale of packaged water, septic sludge disposal andbacteriological water analysis); and income from sale of scrap. In 2017, this account consisted of ACEnergy Cayman’s commission income amounting to P=1.5 billion (see Note 36) and ALI’s reversal ofallowance for impairment in inventories of ALI amounting to P=1.3 billion (see Note 8). In 2017, ALIreversed its allowance for impairment in inventories due to higher fair value than its carrying amount.
Interest and other financing charges consist of:
2019 2018 2017
(In Thousands)Interest expense on:
Short-term debt P= 1,307,581 P=595,375 P=659,044Long-term debt 18,971,380 16,216,479 11,954,115
Accretion of lease liability 1,202,425 − −Amortization of discount on
long-term debt − 7,259 386,843Others 928,140 559,823 80,792
P=22,409,526 P=17,378,936 P=13,080,794
“Others” include, among others, various charges, such as pretermination costs, bond offering fees,and credit card charges.
24. Business Combinations and Transactions with Non-controlling Interests
2019 Acquisitions
ACEPH (Formerly: PHINMA Energy Corporation)On January 9, 2019, PHINMA Corporation approved and signed the Heads of Agreement for the saleof its shares in ACEPH, formerly Phinma Energy Corporation (PHEN), representing 26.25%ownership interest to ACEI subject to the execution of the appropriate definitive agreements.
Further to the transaction, ACEI Group acquired PHINMA Corporation’s and PHINMA Inc.’scombined 51.48% stake in ACEPH via secondary share sale for approximately P=3.40 billion, basedon the valuation date as of December 31, 2018. ACEI also subscribed to approximately 2.63 billionACEPH primary shares at par value.
On February 8, 2019, the parties signed the Investment Agreement. The PCC approval was issuedon April 11, 2019.
ACEI Group made a tender offer to the other ACEPH shareholders from May 20 to June 19, 2019.On June 24, 2019, ACEI Group completed its acquisition of ACEPH, making it a subsidiary of theformer. Subsequently, the ACEI Group divested a portion of its shareholdings at book value whichresulted in ACEI Group effectively owning 66.34% of ACEPH’s total outstanding shares of stock.

- 155 -
*SGVFS039491*
On October 11, 2019, the SEC approved the change in corporate name of PHEN to ACEPH.The provisional fair values of the identifiable assets and liabilities acquired and goodwill arising as atthe date of acquisition follow (amounts in thousands):
AssetsCash and cash equivalents P=3,600,845Receivables - net 2,731,875Investment in joint ventures and associates 6,819,774Property, plant and equipment 3,029,250Intangibles 135,172Input taxes 362,091Creditable withholding taxes 839,120Other assets 2,122,047
19,640,174
LiabilitiesAccounts payable and accrued expenses 2,804,425Loans and other noncurrent liabilities 7,785,492
10,589,917
Net assets P=9,050,257
Cost of acquisition P=6,301,353Less: Share in the fair value of net assets acquired 6,003,940
Provisional Goodwill P=297,413
Non-controlling interest P=3,046,317
Analysis of cash flows on acquisition:
In P=(In Thousands)
Cash consideration P=6,301,353Less: Cash acquired from the subsidiary 3,600,845
Net cash flow (included in cash flows frominvesting activities) P=2,700,508
From June 24 to December 31, 2019, the ACEI Group’s share in ACEPH’s revenue and net incomeamounted to P=4.73 billion and P=106.74 million, respectively. Had the combination taken place at thebeginning of 2019, the ACEI Group’s share in ACEPH’s revenue and net loss would have beenP=1.4 billion and P=0.5 million, respectively.
The non-controlling interest have been measured at the proportionate share of the value of the netidentifiable assets acquired and liabilities assumed.
The purchase price allocation for the acquisition of ACEPH has been prepared on a preliminary basisdue to unavailability of information to facilitate fair value computation. This includes informationnecessary for the valuation of assets related to certain bilateral contracts, and property plant andequipment. Reasonable changes are expected as additional information becomes available. Theaccounts that are subject to provisional accounting are receivables, property, plant and equipment,intangible assets, and other current and noncurrent assets. The PPA will be finalized within one yearfrom June 24, 2019, the acquisition date.
South Luzon Thermal Energy Corporation (SLTEC)On July 10, 2019, a SPA was signed between ACEI and Axia for the sale of the latter’s 20% interestin SLTEC. ACEI had a previously held interest of 35% in SLTEC and 45% indirect ownership interestthrough ACEPH. With the acquisition of 20% interest, SLTEC became a wholly-owned subsidiary ofACEI Group. PFRS 3, Business Combinations, provided that in a step acquisition, the previously heldequity interest is remeasured at fair value and the difference is recognized as a gain or loss in the

- 156 -
*SGVFS039491*
consolidated statement of comprehensive income. A gain on remeasurement of previously heldinterest amounting to P=1.73 billion was recorded under “Other income”.
The provisional fair values of the identifiable assets and liabilities acquired and goodwill arising as atthe date of acquisition follow (amounts in thousands):
AssetsCash and cash equivalents P=1,809,434Restricted cash 158,028Receivables-net 202,677Other current assets 1,190,240Property, plant and equipment 22,146,802Other noncurrent assets 396,431
25,903,612
LiabilitiesAccounts payable and accrued expenses 818,097Loans and other noncurrent liabilities 11,430,715
12,248,812
Net assets 13,654,800Less: Cost of acquisition (3,400,000)Fair value of previously held interest (10,923,840)
Provisional goodwill P=669,040
Fair value of previously held interest P=10,923,840Less: Carrying value of previously held interest 9,186,465
Remeasurement gain on previously held interest ₱1,737,375
Analysis of cash flows on acquisition:
In P=(In Thousands)
Cash consideration P=340,000Less: Cash acquired from the subsidiary 1,809,435
Net cash inflow (included in cash flows frominvesting activities) ₱1,469,435
Remeasurement gain on previously held interest amounting to P=1.74 billion is recorded under otherincome in the consolidated financial statements.
From July 10 to December 31, 2019, the ACEI’s share in SLTEC’s revenue and net loss amounted toP=2.42 billion and P=183.75 million, respectively. Had the combination taken place at the beginning of2019, the ACEI Group’s share in SLTEC’s revenue and net loss would have been P=4.74 billion andP=269.76 million, respectively.
The PPA for the acquisition of the control over SLTEC has been prepared on a preliminary basis dueto unavailability of information to facilitate fair value computation. This includes informationnecessary for the valuation of certain assets. Reasonable changes are expected as additionalinformation becomes available. The account is subject to provisional accounting is property, plantand equipment. The PPA will be finalized within one year from July 10, 2019.
Generika CompaniesOn March 13, 2019, AHHI signed conditional agreements to subscribe to an additional 2.5% stake ineach of the Generika companies namely Actimed, Inc. (Actimed), Novelis Solutions, Inc. (Novelis),Pharm Gen Ventures Corp. (PharmGen) and Erikagen, Inc. (Erikagen) which will result to AHHIhaving 52.5% ownership thereof. The total subscription of P=78.0 million was invested into theGenerika companies.

- 157 -
*SGVFS039491*
The Ferrer Group opted not to participate in this equity round. Generika’s Board approved the capitalcall and AHHI’s full take-up last February 28, 2019.
The conditions to the issuance of shares include, among others, the approval of the PCC and otherregulatory approvals. On June 3, 2019, AHHI received the approval of the PCC on its proposedincrease in ownership in Actimed, Novelis and Pharmgen. On June 28, Erickagen received approvalfrom SEC for its proposal to increase its authorized capital stock.
On July 4, 2019, following the completion of conditions precedent, AHHI proceeded with the closingof the increase to 52.5% in its equity stake in Erikagen, Inc.
The following are the fair values of the identifiable assets and liabilities assumed:
Actimed Novelis Erikagen PharmGen
(In Thousands)Cash and cash equivalents P=84,943 P=18,023 P=19,263 P=43,253Receivables 571,931 94,214 75,667 67,110Inventories 483,431 11,771 4,995 118,913Prepayments 14,434 2,682 767 5,909Other current assets 138,980 5,095 874 7,319Property and equipment 36,823 1,464 1,557 94,448Intangible assets 25,472 1,255 – 5,835Trademark 554,420 – 223,010 –Right-of-use Asset 23,649 – 13,252 132,397Deferred tax asset 9,675 1,459 1,196 –Other noncurrent assets – – 3,060 16,538
Total Assets 1,943,758 135,963 343,641 491,722
Accounts and other payables 657,962 53,823 49,055 139,598Tax payable 4,339 2,952 752 900Other current liability 184,542 11,124 14,375 257,725Lease liability 25,387 – 16,086 140,896Deferred tax liability 166,326 – 66,989 –Other noncurrent liability 249,503 26,266 1,013 632
Total Liabilities 1,288,059 94,165 148,270 539,751
Fair Value of Net Assets 655,699 41,799 195,370 (48,029)Non-controlling interest (47.5%) (311,457) (19,854) (92,801) 22,814Goodwill (Gain on Bargain
Purchase) 322,985 29,381 (37,521) 69,614
Cost of acquisition P=667,227 P=51,326 P=65,048 P=44,399
Cash paid P=7,065 P=1,559 P=31,578 P=37,796Gain on Remeasurement 217,563 17,765 20,085 27,874CV of Investment in Generika 442,599 32,002 13,385 (21,271)
P=667,227 P=51,326 P=65,048 P=44,399
AHHI recognized a gain of P=281.91 million as a result of measuring at fair value its 50% equityinterest in Generika held before the business combination. The gain is included in the Group’s OtherIncome.
The Generika name and house brand have been identified as intangible assets arising from thisacquisition. AHHI has performed an internal valuation to determine the fair value of these trademarksamounting to P=777.43 million.
AHHI also determined that the purchase price includes Goodwill amounting to P=421.98 million. Thegoodwill comprises the value of strengthening AC Health's market position in the affordable retailpharmacy sector in the Philippines and cost reduction synergies expected to arise from theacquisition. None of the goodwill recognized is expected to be deductible for income tax purposes.

- 158 -
*SGVFS039491*
Both the Trademark and the Goodwill were determined to have indefinite useful life and will besubjected to periodic impairment testing.
Analysis of cash flows on acquisition follows:
In P=(In Thousands)
Cash consideration P=78,000Less: Cash acquired from the subsidiary 165,482
Net cash flow (included in cash flows from investing activities) (P=87,482)
The fair value of the receivables approximates their carrying amounts. None of the receivables havebeen impaired and it is expected that the full contractual amounts can be collected.
The non-controlling interests have been measured at the proportionate share of the value of the netidentifiable assets acquired and liabilities assumed.
From the date of acquisition, AHHI’s share in Generika’s revenue and net loss amounted toP=2,300 million and P=9.96 million, respectively. If the combination had taken place at the beginning of2019, AC Health’s share in Generika’s revenue and net loss would have been P=2,346 million andP=9.96 million, respectively.
C-CON GroupOn March 13, 2019, AC Industrials through its subsidiary MT Technologies GmbH, has entered intoan agreement with the shareholders of C-CON Group for the acquisition of a 75.1% stake in C-CONGroup for a total consideration of EURO 0.86 million. The closing of the transaction transpired onApril 1, 2019. C-CON Group is a German engineering, design and manufacturing group catering tothe automotive, industrial and aerospace space industries. The acquisition is in line with the strategyto expand its business operations in auto industry. Beyond the envisioned complementary benefitsto MT, C-con also hold proprietary expertise in the production of carbon fiber reinforced polymer(CFRP) parts.
The MT group elected to measure the noncontrolling interest in the acquiree at the proportionateshare of its interest in the acquiree’s net assets acquired and liabilities assumed.
The value of the identifiable assets and liabilities acquired and goodwill arising as at the date ofacquisition follows (amounts in thousands)
In EURO In P=*
AssetsCash €159 P=9,397Receivables 3,308 195,548Inventories 3,550 209,873Property, plant and equipment 6,343 374,972Other noncurrent assets 849 50,189
14,209 839,979
LiabilitiesTrade accounts payable and accrued liabilities 2,874 169,885Loans payable 10,350 611,890
13,224 781,775
Net assets €985 P=58,204

- 159 -
*SGVFS039491*
In EURO In P=*
Cost of acquisition €1,429 P=84,471Non-controlling interest at fair value 245 14,493
1,674 98,964Less: Fair value of net assets acquired 985 58,204
Goodwill €689 P=40,760*Translated using the exchange rate at the date of the closing of the transaction (€1:P=59.1182 on April 1, 2019).
Analysis of cash flows on acquisition follows (amount in thousands)
In EURO In P=*
Initial purchase consideration €860 P=50,842Liabilities related to contingent consideration
recognized 569 33,629
Cost of acquisition €1,429 P=84,471
Purchase cash consideration 860 50,842Less: Cash acquired from the subsidiary 159 9,397
Net cash flow (included in cash flows frominvesting) €701 P=41,445
*Translated using the exchange rate at the date of the closing of the transaction (€1:P=59.1182 on April 1, 2019).
The initial purchase consideration of €860 thousand was paid in cash. The transaction purchaseprice also includes contingent consideration of €569 thousand payable to the previous shareholders,subject to certain conditions. It also includes put and call options on the non-controlling interest in C-con of 24.9%, the exercise of which are subject to certain conditions. The estimated fair value of thenet financial liability amounted to €1.739 million (P=102.8 million)
Acquisition-related costs, which consist of professional and legal fees, transaction costs and travelexpenses amounting to €0.6 million were recognized as expense in 2019.
The purchase price allocation has been prepared on a preliminary basis due to unavailability ofinformation to facilitate fair value computation. This include information necessary for the valuation ofassets such as property and equipment and other intangible assets.
The purchase price allocation has been prepared on a preliminary basis due to unavailability ofinformation to facilitate fair value computation. This includes information necessary for the valuationof assets such as property and equipment and other intangible assets.
From the date of acquisition, AC Industrial’s share in C-con’s revenue and net losses amounted to€15.7 million (P=902.9 million) and €2.2 million (P=124.3 million) respectively, covering nine monthsfrom April to December 2019. If the combination had taken place at the beginning of 2019, theAITHI’s share in C-con’s revenue and net losses would have been €20.9 million (P=1,216.2 million)and €3.0 million (P=174.1 million), respectively.
2018 Acquisitions
MCT Berhad (MCT)On January 2, 2018, ALI through its wholly-owned subsidiary, RWIL, signed a share purchaseagreement to acquire an additional 17.24% share in MCT, subject to completion of certain conditions.
On January 5, 2018, the transfer of shares was completed, increasing ALI’s shareholding in MCT to50.19% from 32.95%. RWIL also issued a notice of an unconditional mandatory take-over offer to theBOD of MCT, to acquire all remaining shares of MCT that are not already held by RWIL, following thecompletion of certain conditions to the share purchase agreement.

- 160 -
*SGVFS039491*
The mandatory take-over offer made in connection to the acquisition of additional shares in MCTclosed as of 5:00 p.m. (Malaysian time) February 19, 2018. Owners of 295,277,682 shares acceptedthe offer, equivalent to 22.12% of MCT’s total outstanding shares. As a result of the offer, ALI’sshareholdings in MCT increased from 50.19% to 72.31%. Total consideration paid is P=6.0 billion.ALI Group remeasured its previously held interest in MCT based on its acquisition-date fair valuewhich resulted to a remeasurement loss of P=1.8 billion.
ALI Group finalized the purchase price allocation of its acquisition of MCT through businesscombination in December 2018. The final purchase price allocation resulted in gain from bargainpurchase of P=1.8 billion. The net gain of P=60.0 million from the acquisition is presented under ‘Otherincome’ account in the consolidated statement of income.
The following are the fair values of the identifiable assets and liabilities assumed (amounts inthousands):
AssetsCash and cash equivalents P=1,078,224Trade and other receivables 2,833,560Inventories 13,620,873Investment properties 5,712,635Property, plant and equipment 4,599,423Other noncurrent assets 69,222
27,913,937
LiabilitiesAccounts and other payables 5,506,336Borrowings 2,752,114Income tax payable 128,551Deferred tax liabilities 2,287,772
10,674,773
Net assets P=17,239,164
Total net assets acquired (72.31%) 12,465,640
Negative goodwill (1,854,073)
Cost of acquisition P=10,611,567
Analysis of cash flows on acquisition:
In P=
Cash consideration P=10,611,567Previously held interest (4,849,007)Less: Cash acquired from the subsidiary (1,078,224)
Net cash flow (included in cash flows frominvesting activities) P=4,684,336
The fair value of the trade and other receivables approximate their carrying amounts since these areshort-term in nature. None of the trade receivables have been impaired and it is expected that thefull contractual amounts can be collected.
From January 8 to December 31, 2018, ALI Group’s share in MCT’s revenue and net incomeamounted to P=7.6 billion and P=1.3 billion.
National Teachers College (NTC)On February 8, 2018, AEI and shareholders of National Teachers College (NTC) executed a SPA forthe acquisition of shares in NTC subject to certain closing conditions. NTC is located atNepomuceno Street, Quiapo, Manila and was founded in 1928, as the first school in the country tooffer General Education leading to a Bachelor of Science in Education. NTC is one of the mostrecognized teacher education institutions in the Philippines. It also offers programs in business,

- 161 -
*SGVFS039491*
accountancy, psychology, hospitality and tourism management, and information technology. NTCoffers pre-school, elementary, secondary, tertiary and post-graduate courses. It has approximately12,000 students in all levels of education.
On April 30, 2018, AEI assumed ownership of approximately 96% of the voting shares of NTC for atotal consideration of P=1.16 billion. With NTC added to the existing AEI’s portfolio currentlycomposed of APEC Schools and University of Nueva Caceres (UNC), AEI’s combined studentpopulation is now approximately 38,000 students.
The values of the identifiable assets and liabilities acquired and goodwill arising as at the date ofacquisition follows (amounts in thousands):
AssetsCash P=53,719Trade and other receivables 54,222Other current assets 217Property, plant and equipment 865,325Intellectual property rights 422,243Student relationship 38,802Other noncurrent assets 21,033
1,455,561
LiabilitiesAccounts and other payables 36,587Tax liabilities 143,154Other payables 10,712
190,453
Net Assets P=1,265,108
Non-controlling interest (11.8%) (149,283)Goodwill 44,911
Cost of acquisition P=1,160,736
The fair value of the receivables approximate their carrying amounts. None of the receivables havebeen impaired and it is expected that the full contractual amounts can be collected.
The non-controlling interests have been measured at the proportionate share of the value of the netidentifiable assets acquired and liabilities assumed.
Acquisition-related costs, which consist of professional and legal fees, transaction costs, taxes,representation and travel expenses amounting to P=13.9 million were recognized as expensein 2018.
Analysis of cash flows on acquisition follows:
In P=
Cash consideration P=1,160,736Less: Cash acquired from the subsidiary (53,719)
Net cash flow (included in cash flows frominvesting activities) P=1,107,017
Merlin Solar Technology, Inc. (Merlin)On February 24, 2018, AC Industrial completed its acquisition of a controlling stake (additional inMerlin Solar Technologies, Inc. (Merlin USA). This transaction was done through AITHI’s subsidiary,ACI Solar, which had previously acquired an 8.2% stake in Merlin in 2016. The acquisition resultedin a total of 98.96% ownership interest in Merlin. PFRS 3, Business Combinations, provided that in astep acquisition, the previously held equity interest is remeasured at fair value and the difference isrecognized as a gain or loss in the consolidated statement of comprehensive income. A loss on

- 162 -
*SGVFS039491*
remeasurement of previously held equity interest in Merlin of US$3.2 million was recognized at theacquisition date.
The Group has elected to measure non-controlling interest in the acquiree at fair value. The fair valueof the non-controlling interest in Merlin USA, a non-listed company, has been estimated by applyinga discounted cash flow technique. The fair value measurement is based on significant inputs that arenot observable in the market. The fair value estimate is based on an assumed discount of 39.1% andterminal value exit multiple of 1.2x.
The value of the identifiable assets and liabilities acquired and goodwill arising as at the date ofacquisition follows (amounts in thousands):
In US$ In P=*
AssetsCash US$65 P=3,386Receivables 710 37,015Inventories 1,510 78,674Other current assets 469 24,010Property, plant and equipment 2,130 110,962Intangible assets - Intellectual Property and
Trademark 14,240 741,904Other noncurrent assets 1,507 78,530
20,631 1,074,481
LiabilitiesTrade accounts payable and accrued liabilities 4,272 222,218Loans payable 3,046 158,691
7,318 380,909
Net assets US$13,313 P=693,572
Goodwill $1,702 P=88,702Fair value of previously held interest (1,384) (72,119)Non-controlling interest at fair value (303) (15,788)Less: Fair value of net assets acquired 13,313 693,572
Cost of acquisition US$13,328 P=694,367*Translated using the exchange rate at the date of the closing of the transaction ($1:P=52.10 on February 26, 2018).
The deferred tax assets mainly comprise of the tax effect of the net operating loss carryover andtemporary differences between financial statement balance and tax balance of accruals and tangibleand intangible assets.
The goodwill recognized on the acquisition can be attributed to the automotive Tier 1 manufacturingcompetencies in modelling, cubing, tooling and plastic parts production that MT adds to AITHI’sportfolio, as well as expected synergies from cross-selling and organizational efficiencies with otherAITHI companies.
Analysis of cash flows on acquisition follows (amounts in thousands):
In US$ In P=*
Initial purchase consideration US$11,985 P=624,419Liabilities related to contingent consideration recognized 1,343 69,970
Cost of acquisition US$13,328 P=694,389
Purchase cash consideration US$11,985 P=624,419Less: Cash acquired from the subsidiary 65 3,387
Net cash flow (included in cash flows frominvesting) US$11,920 P=621,032
*Translated using the exchange rate at the date of the closing of the transaction ($1:P=52.10 on February 26, 2018).

- 163 -
*SGVFS039491*
The initial purchase consideration of US$12.0 million was paid in cash. The transaction purchase pricealso includes contingent consideration of US$1.3 million payable to the previous shareholders, subjectto certain conditions.
Acquisition-related costs, which consist of professional and legal fees, transaction costs and travelexpenses amounting to US$0.6 million were recognized as expense in 2018.
From the date of acquisition, AITHI’s share in Merlin’s revenue and net losses amounted toUS$3.0 million and US$11.3 million, respectively, covering 10 months from March to December2018. If the combination had taken place at the beginning of 2018, the AITHI’s share in Merlin’srevenue and net loss would have been US$3.1 million and US$15.0 million, respectively.
VTS-Touchsensor Co., Ltd. (VTS)On April 9, 2018, IMI, through its subsidiary, VIA Optronics GmbH (VIA), and Toppan Printing Co.,Ltd. (Toppan) entered into an agreement to serve the market for copper-based metal mesh touchsensors. The agreement provides that Toppan transfer 65% of its shares in VTS to VIA. VTS is anewly formed spin-off company of Toppan.
VTS develops and manufactures the metal mesh touch sensors in Japan on the existing premises ofToppan. The new setup strengthens VIA’s portfolio of differentiated and value-added sensortechnology for touch panels, touch-display modules, display head assemblies, and interactive displaysystems across multiple markets and segments.
IMI Group elected to measure the non-controlling interest in VTS at the proportionate share of itsinterest in the acquiree’s identifiable net assets.
The net assets recognized in December 31, 2018 financial statements were based on a provisionalassessment of their fair value. The valuation had not been completed by the date the 2018 financialstatements were approved for issue by the BOD.
In March 2019, the purchase price allocation was finalized. The fair value of the property, plant andequipment (PPE) and intangible asset increased by $7.16 million and $2.58 million, respectively.The increase in fair value of PPE arose from the assessment and valuation mainly of technicalequipment and machinery, buildings and improvements and other equipment, which was determinedusing current replacement cost method. The increase in intangible asset is due to the identificationand valuation of customer relationship as a separate asset with fair value determined using the MultiPeriod Excess Earnings Method (MEEM). PPE was depreciated using various useful lives rangingfrom 3-10 years while the customer relationship is amortized over a period of 5 years.
As a result, deferred tax liability on the increase in fair value of the property, plant and equipment andintangible asset was recognized amounting to $3.32 million. There was also correspondingrecognition of gain on a bargain purchase amounting to $2.41 million upon finalization and theprovisional goodwill amounting to $0.97 million was reversed. In addition, additional depreciationand amortization from increase in fair values of property and equipment and intangible assets net ofshare of non-controlling interest totaling to $0.73 million was recognized in 2019.
The impact of the finalization of the purchase price allocation is not material so prior year financialstatements was not restated.

- 164 -
*SGVFS039491*
The fair values of the identifiable assets and liabilities acquired follows (amounts in thousands):
Assets In US$ Fair Values
Receivables - net US$185 US$184Inventories 1,338 1,244Property, plant and equipment 7,253 97Intangible assets 7,835 5,258
US$16,611 US$6,783
LiabilitiesDeferred tax liabilities 3,322 –Other noncurrent liabilities 5,254 5,254
8,576 5,254
Net Assets 8,035 1,529
Non-controlling interest (35%) (US$4,066) (US$536)Goodwill (Gain on bargain purchase) (2,412) 970
Cost of Acquisition US$1,557 P=1,963
Analysis of cash flows on acquisition follows:In US$ In P=*
Cash consideration US$1,966 P=102,232Less: Cash acquired from the subsidiary – −Net cash flow (included in cash flows frominvesting activities) US$1,966 P=102,232
*Translated using the exchange rate at the closing date of transaction (US$1:P=52.00 on April 9, 2018).
The fair value of the receivables approximate their carrying amounts. None of the receivables havebeen impaired and it is expected that the full contractual amounts can be collected.
Acquisition-related costs, which consists of professional and legal fees, travel and recruitmentservices amounting to US$1.1 million were recognized as expense in 2018.
From the date of acquisition, VTS contributed US$26.5 million of revenue and US$0.9 million profitbefore tax to the Group. If the combination had taken place at the beginning of 2018, the IMI’s sharein VTS’ revenue and net income would have been US$35.3 million and US$1.3 million, respectively.
Entrego Fulfilment Solutions, Inc. (Entrego)On August 6, 2018, AC Infra acquired 54.33% ownership interest in Entrego for a total acquisitioncost of P=158.9 million by subscription to Entrego’s Class A Common shares, Class B Commonshares and Preferred shares. The shareholders’ agreement has been signed by the parties onAugust 17, 2018, the closing date of the transaction. The Investment Agreement, signed on February13, 2018, allowed ALI through its wholly-owned subsidiary AMSI, Inc., BPI through its wholly-ownedsubsidiary BPI Capital Corporation and Kickstart Ventures, Inc. to subscribe for up to 1.9% of theClass A Common Shares each, provided that the total equity interest of the Ayala Shareholder Groupin the common shares of the issuer shall amount to 60%.
This investment forms part of Ayala’s strategy to develop infrastructure that will result in betterefficiencies and improve the fulfillment goals of its existing businesses in real estate, banking,telecommunications, and e-commerce.
As of December 31, 2019, AC Infra has infused a total of P=453.4 million to this investment.

- 165 -
*SGVFS039491*
The values of the identifiable assets and liabilities acquired and goodwill arising as at the date ofacquisition follows (amounts in thousands):
AssetsCash and cash equivalents P=49,759Receivables 39,653Prepayments 4,951Other current assets 4,385Property and equipment 6,817Other noncurrent assets 2,045Subscription receivable 98,391
206,001
LiabilitiesAccounts and other payables 74,492Tax payable 4,992Other current liability 1,772
81,256
Net Assets P=124,745
Non-controlling interest 2,964Goodwill 31,155
Cost of acquisition P=158,864
Analysis of cash flows on acquisition follows:
In P=*
Cash consideration P=158,864Less: Cash acquired from the subsidiary (49,759)
Net cash flow (included in cash flows frominvesting activities) P=109,105
The fair value of the receivables and subscription receivable approximate their carrying amounts.None of the receivables and subscription receivable have been impaired and it is expected that thefull contractual amounts can be collected.
The non-controlling interests have been measured at the proportionate share of the value of the netidentifiable assets acquired, except subscription receivable, and liabilities assumed.
Acquisition-related costs, which consist of legal fees, travel and meeting expenses amounting toP=7.7 million were recognized as expense in 2018.
From the date of acquisition, AC Infra’s share in Entrego’s revenue and net loss amounted toP=73.5 million and P=73.0 million, respectively. If the combination had taken place at the beginning of2018, AC Infra’s share in Entrego’s revenue and net loss would have been P=99.7 million andP=91.7 million, respectively.
Pagudpud Wind Power Corp. (Pagudpud Wind or PWPC)On November 27, 2018, Presage entered into an Investment Framework Agreement andShareholders’ Agreement for the development and construction of a proposed Balaoi-Caunayan windfarm project in Ilocos Norte (Balaoi). As part of the transaction, Presage agreed to acquire 100%ownership of PWPC the majority shareholder of Bayog Wind Power Corp. (BWPC), the projectcompany for Balaoi.

- 166 -
*SGVFS039491*
The fair values of the identifiable assets and liabilities acquired and goodwill arising as at the date ofacquisition follows (amounts in thousands):
AssetsCash and cash equivalents P=875Prepayments and other current assets 530
1,405LiabilitiesAccounts payable and accrued expenses 1,497
Net assets (liabilities) (92)Goodwill 2,592
Cost of acquisition P=2,500
Analysis of cash flows on acquisition follows:
Cash consideration P=2,500Less: Cash acquired from the subsidiary (875)
Net cash flow (included in cash flows from investing activities) P=1,625
In 2019, ACEI Group finalized its purchase price allocation and there were no changes to the fairvalues of the assets acquired and liabilities assumed. The fair values of the assets and liabilitiesapproximate their carrying amounts since these are short-term in nature.
From November 27 to December 31, 2018, ACEI’s share in Pagudpud Wind’s revenue and net lossamounted to nil and P=0.1 million, respectively. If the combination had taken place at the beginning of2018, ACEI’s share in Pagudpud’s revenue and net loss would have been nil and P=0.1 million,respectively.
HDP Bulk Water Supply Inc. (HDP)On December 7, 2018, Presage entered into a SPA with Jose Maria Eduardo P. Zabaleta and JuanXavier P. Zabaleta for the purchase of one hundred percent (100%) of outstanding capital stock ofHDP Bulk Water Supply Inc. for a total consideration of P=110.1 million. The transaction was alsoclosed on the same day.
HDP is a domestic company that supplies water to San Carlos Bioenergy, Inc. (SCBI) under a WaterSupply Contract executed on October 31, 2006 (originally between SCBI and San Julio Realty Inc.(SJRI), which was later assigned by SJRI to San Carlos Land, Inc. (SCLand) on December 22, 2008,and then by SCLand to the HDP on December 11, 2017).
The fair values of the identifiable assets and liabilities acquired and goodwill arising as at the date ofacquisition follows (amounts in thousands):
AssetsCash and cash equivalents P=1,111Receivables 3,463Water supply contract 104,862Other current assets 13,086
122,522
LiabilitiesAccounts payable and accrued expenses 12,423
Net Assets 110,099
Goodwill −Cost of acquisition P=110,099

- 167 -
*SGVFS039491*
Analysis of cash flows on acquisition follows:
Cash consideration P=110,099Less: Cash acquired from the subsidiary (1,111)
Net cash flow (included in cash flows frominvesting activities) P=108,988
In 2019, the Group finalized its purchase price allocation resulting in the recognition of water supplycontract amounting to P=104.86 million and reduction in goodwill by the same amount. The priorperiod comparative information was not restated since impact is not material. The fair value ofreceivables, prepayment and other assets, and accounts payable and accrued expensesapproximate their carrying amounts since these are short-term in nature. The valuation techniqueadopted for the measurement of water supply contract is the discounted cash flow analysis whereinthe significant observable input is the discount rate. The fair value measurement using observabledate is based on Level 3 of the fair value technique.
From December 7 to 31, 2018, ACEI’s share in HDP’s revenue and net income amounted toP=1.65 million and P=1.58 million, respectively. If the combination had taken place at the beginning of2018, ACEI’s share in HDP’s revenue and net income would have been P=18.03 million andP=9.07 million, respectively.
Extraordinary Development Corporate Group (EDCG)On December 11, 2018, Aqua Centro, a wholly-owned subsidiary of MWC, entered into seven (7)APAs with EDCG’s subsidiaries to acquire the subsidiaries’ assets related to the provision of waterservice in ten (10) subdivisions in Imus, General Trias, and Naic in the province of Cavite. Thesesubsidiaries are Earth Aspire Corporation, First Advance Development Corporation, Ambition LandInc., Prosperity Builders Resources Inc., Tahanang Yaman Homes Corporation, ExtraordinaryDevelopment Corp., and Earth + Style Corporation.
On January 9, 2019, Aqua Centro paid 50% of the total contract price amounting to totalconsideration of P=24.7 million, while the balance was paid on November 28, 2019 after compliancewith all conditions precedent to its APAs.
In 2019, Aqua Centro took over the operations of three (3) additional subdivisions. Aqua Centro shalloperate the remaining one (1) subdivision once all the conditions precedent under the APAs havebeen fulfilled. As of December 31, 2019, Aqua Centro is operating nine (9) out of the ten (10subdivisions) covered by its APAs.
On December 11, 2018, LAWC entered into four (4) APAs with EDCG’s subsidiaries to acquire thesubsidiaries’ assets related to or used in its water service provision operations in Biñan, Laguna.The APAs are with the following EDCG subsidiaries, namely, Earth Aspire Corporation, EarthProsper Corporation, Earth and Style Corporation and Extraordinary Development Corp. OnDecember 20, 2018, LAWC paid 50% of the total acquisition cost amounting to P=20.46 million. Theremaining 50% was paid on September 6, 2019, after compliance wirh all conditions precedent toLAWC’s APAs.
MWC management assessed that the following acquisitions are considered as acquisition ofbusiness under PFRS 3 since: a) the assets purchased by MWC Group have the ability to create oroperate water services when one or more processes were applied; b) the business can be integratedto MWC Group’s operations; and c) revenues from the provision of water is considered an output thatMWC Group will benefit from as a result of the acquisition.

- 168 -
*SGVFS039491*
The fair values of the identifiable assets on these transactions as of the date of acquisition were asfollows (amounts in thousands):
Assets Acquired
(Property, Plant andEquipment) Acquisition Cost
Goodwill(Bargain Purchase)
Aqua CentroFirst Advance DevelopmentCorporation P=40,790 P=20,769 (P=20,021)
Earth Aspire Corporation 3,753 1,356 (2,397)Ambition Land Inc. 5,528 4,559 (968)Prosperity Builders Resources Inc. 11,604 12,475 871
Tahanang Yaman HomesCorporation 7,249 10,189 2,940
Earth + Style Corporation 15,143 7,160 (7,982)
Extraordinary Development Corp. 15,008 4,658 (10,350)Laguna Water
Earth Prosper Corporation 13,952 6,881 (7,071)
Earth + Style Corporation 23,303 17,338 (5,965)Extraordinary Development Corp. 5,753 81 (5,672)
Earth Aspire Corporation 18,278 16,619 (1,659)
No identifiable liabilities were assumed by Aqua Centro and LAWC in these acquisitions. The fairvalue of the property, plant and equipment acquired is P=30.2 million and P=111.4 million in 2019 and2018, respectively, which is in excess of the aggregate consideration of P=11.2 million in 2019 andP=67.6 million in 2018. Total gain on bargain purchase amounting to P=18.3 million and P=43.8 millionis presented as part of “Other income” in the 2019 consolidated statement of comprehensive income.
Cash outflow amounted to P=20.5 million and no cash was acquired in the transaction.
In 2018, the purchase price allocations of Aqua Centro and Laguna Water for the acquisitions areprovisional as the valuation of property, plant and equipment is yet to be finalized. The purchaseprice allocation of Aqua Centro and Laguna Water were finalized in 2019.
The rollforward of goodwill is as follows:
2019 2018
(In thousands)Balance at beginning of year P=136,566 P=132,755Additions from business combination − 3,811
Balance at end of year P=136,566 P=136,566
As of December 31, 2019 and 2018, the goodwill balance is attributable to acquisitions of thefollowing businesses:
Clark Water P=130,319Tahanang Yaman Homes Corporation 2,940San Vicente Homes 1,230Las Palmas Subdivisions Phases 1 to 7 1,206Prosperity Builders Resources Inc. 871,
Balance at end of year P=136,566
From the date of acquisition, Extraordinary Development Corporation Group contributed P=2.5 millionof revenue and P=1.4 million profit before tax to the Group.

- 169 -
*SGVFS039491*
2017 Acquisitions
AC Energy DevCo Inc. (AEDCI), Visayas Renewables Corp. (VRC) and Manapla Sun Power Dev’t.Corp.On March 16, 2017, ACEI signed definitive documents to acquire 100% ownership of BronzeoakClean Energy (Bronzeoak) and SCCE. With the acquisition, SCCE and Bronzeoak have beenrenamed as AC Energy DevCo Inc. and Visayas Renewables Corp. (VRC), respectively. In March2017, ACEI Group also acquired 66.22% ownership interest in Manapla Sun. Manapla Sun is thelandowner of and lessor for Islasol’s solar farm in Manapla, Negros Occidential.
The fair values of the identifiable assets and assumed acquired liabilities and goodwill arising as atthe date of acquisition follows (amounts in thousands):
AC Energy DevCo Inc. Group
AssetsCash and cash equivalents P=9,381Receivables 5,224Prepayments and other current assets 19,527Property, plant and equipment 2,447
36,579
LiabilitiesAccounts payable and accrued expenses 10,315
Net Assets 26,264
Cost of acquisition 812,527
Goodwill (Note 14) P=786,263
Cash consideration P=812,527Less: Cash acquired from the subsidiary 9,381
Net cash flow P=803,146
As of December 31, 2018, ACEI finalized its purchase price allocation and there were no changes tothe fair values of the assets acquired and liabilities assumed.
The goodwill arising from the acquisition of AEDCI is from the established capabilities of itsassembled workforce which includes:
a. Pre-development and development – which involves site acquisition, permitting and studies to
get the project to a shovel ready state
b. Construction – including sourcing of investors as well as managing the construction of the power
plants
c. Operations – covering management of the power plants in lieu of the investors for a fee
Further, the above acquisition included projects in its pipeline with a view of developing projects (newand from the pipeline) for ACEI Group. Through this acquisition, ACEI Group is able to have thecapability to develop projects end-to-end from permits and feasibility studies all the way toconstruction and operations.
Currently, the assembled workforce oversees the pre-development and development of severalpotential sites for its solar projects within the Philippines, as well as the construction of offshorerenewable power plants where ACEI Group co-invested with local partners.
From March 16 to December 31, 2017, ACEI’s share in AEDCI’s revenue and net income amountedto P=119.9 million and P=12.4 million, respectively. If the combination had taken place at the beginningof 2017, ACEI’s share in AEDCI’s revenue and net income would have been P=180.2 million andP=31.8 million, respectively.

- 170 -
*SGVFS039491*
Visayas Renewables Corp.
AssetsCash and cash equivalents P=6,226Prepayments and other current assets 21Equity investments at FVOCI 579,886
586,133
LiabilitiesAccounts payable and accrued expenses 107
Net Assets 586,026
Cost of acquisition 586,026
Goodwill P=−
Cash consideration P=586,026Less: Cash acquired from the subsidiary 6,226
Net cash flow P=579,800
As of December 31, 2018, ACEI Group finalized its purchase price allocation resulting in therecognition of equity investments at FVOCI amounting to P=579.9 million and reduction in goodwill bythe same amount. The prior period comparative information was not restated, instead theadjustment to the provisional goodwill recognized in 2017 was included under Reclassification/otheradjustments for 2018 in Note 14. The fair value of prepayments and other current assets andaccounts payable and accrued expenses approximate their carrying amounts since these are short-term in nature. The valuation technique adopted for equity instruments at fair value through othercomprehensive income dated March 16, 2017 is the discounted cash flow method. The fair valuemeasurement using unobservable data is based on Level 3 of the fair value hierarchy.
From March 16 to December 31, 2017, ACEI’s share in VRC’s revenue and net income amounted toP=11.6 million and P=11.3 million, respectively. If the combination had taken place at the beginning of2017, ACEI’s share in VRC’s revenue and net income would have been P=16.0 million andP=15.6 million, respectively.
Manapla Sun Power Dev’t. Corp.
The fair values of the identifiable assets and assumed acquired liabilities and goodwill arising as atthe date of acquisition follows (amounts in thousands):
AssetsCash and cash equivalents P=2,684Receivables 28,817Prepayments and other current assets 8,255Investment property 253,670
293,426
LiabilitiesAccounts payable and accrued expenses 49,440
Net Assets 243,986
Cost of acquisition 236,000Non-controlling Interest 7,986
Goodwill P=−
Cash consideration P=236,000Less: Cash acquired from the subsidiary 2,684
Net cash flow P=233,316

- 171 -
*SGVFS039491*
As of December 31, 2018, ACEI Group finalized its purchase price allocation resulting in therecognition of investment property amounting to P=253.7 million and reduction in goodwill by the sameamount. The prior period comparative information was not restated, instead the adjustment to theprovisional goodwill recognized in 2017 was included under Reclassification/other adjustments for2018 in Note 14. The fair value of receivables and accounts payable and accrued expensesapproximate their carrying amounts since these are short-term in nature. The valuation techniqueadopted for the measurement of investment property (i.e., land) fair value is the marketapproach. The market price per square meter of land amounts to P=680.00. The fair valuemeasurement using unobservable data is based on Level 3 of the fair value hierarchy.
From March 16 to December 31, 2017, ACEI’s share in Manapla Sun’s revenue and net incomeamounted to P=46.0 million and P=37.5 million, respectively. If the combination had taken place at thebeginning of 2017, ACEI’s share in Manapla Sun’s revenue and net income would have beenP=40.3 million and P=36.6 million, respectively.
SCC Bulk Water Supply, Inc. (SCC)On December 18, 2017, Presage acquired 100% interest in SCC Bulk Water.
The fair values of the identifiable assets and assumed acquired liabilities and goodwill arising as atthe date of acquisition follows (amounts in thousands):
AssetsCash and cash equivalents P=152Prepayments and other current assets 77Property, plant and equipment 18,281Water supply contract (Note 16) 127,476Other assets 243
146,229LiabilitiesAccounts payable and accrued expenses P=19,158
Net Assets 127,071Cost of acquisition 127,071
Goodwill P=−
Cash consideration P=127,071Less: Cash acquired from the subsidiary 152
Net cash flow P=126,919
As of December 31, 2018, ACEI Group finalized its purchase price allocation resulting in therecognition of water supply contract amounting to P=127.5 million and reduction in goodwill by thesame amount. The prior period comparative information was not restated, instead the adjustment tothe provisional goodwill recognized in 2017 was included under Reclassification/other adjustmentsfor 2018 in Note 14.
The fair value of prepayments and other current assets, other assets and accounts payable andaccrued expenses approximate their carrying amounts since these are short-term in nature. Thevaluation technique adopted for the measurement of property, plant and equipment and water supplycontract is the discounted cash flow method. The fair value measurement using unobservable data isbased on Level 3 of the fair value hierarchy.
From December 18 to 31, 2017, ACEI’s share in SSC Bulk Water’s revenue and net loss amountedto nil. If the combination had taken place at the beginning of 2017, ACEI’s share in SSC’s revenueand net loss would have been nil and P=0.50 million, respectively.

- 172 -
*SGVFS039491*
Solienda, IncorporatedOn December 28, 2017, Presage acquired 100% interest in Solienda.
The fair values of the identifiable assets and assumed acquired liabilities and goodwill arising as atthe date of acquisition follows (amounts in thousands):
AssetsCash and cash equivalents P=13,665Receivables 6,112Prepayments and other current assets 3Deferred tax assets 6,143Leasehold rights 470,727
LiabilitiesAccounts payable and accrued expenses P=148,965
Net Assets 347,685Cost of acquisition 347,685
Goodwill P=−
Cash consideration P=347,685Less: Cash acquired from the subsidiary 13,665
Net cash flow P=334,020
As of December 31, 2018, ACEI Group finalized its purchase price allocation resulting in therecognition of leasehold rights amounting to P=470.7 million and reduction in goodwill by the sameamount. The prior period comparative information was not restated, instead the the adjustment tothe provisional goodwill recognized in 2017 under Reclassification/other adjustments for 2018 inNote 14.
The fair value of receivables, prepayments and other current assets and accounts payable andaccrued expenses approximate their carrying amounts since these are short-term in nature. Thevaluation technique adopted for the measurement of leasehold rights is the discounted cash flowmethod. The fair value measurement using unobservable data is based on Level 3 of the fair valuehierarchy.
From December 28 to 31, 2017, ACEI’s share in Solienda’s revenue and net income amounted to nil.If the combination had taken place at the beginning of 2017, ACEI’s share in Solienda’s revenue andnet income would have been P=68.4 million and P=44.7 million, respectively.
Surface Technology International Enterprises Limited (STI)On April 6, 2017, IMI, through its subsidiary IMI UK, entered into an agreement with the shareholdersof STI for the acquisition of an 80% stake in STI, an electronics manufacturing services (EMS)company based in the United Kingdom, with factories in Hook and Poynton in the United Kingdomand Cebu, Philippines. The closing of the transaction transpired on May 16, 2017 upon completion ofpre-closing conditions and regulatory approvals.
In 2017, the purchase price allocation for the acquisition of STI has been prepared on a preliminarybasis due to unavailability of information to facilitate fair value computation.

- 173 -
*SGVFS039491*
IMI finalized the purchase price allocation with the following changes to the values based onadditional information subsequently obtained (amounts in thousands):
Assets In US$ InP=
Cash and cash equivalents US$4,046 P=201,005Receivables 11,195 556,168Inventories 14,116 701,283Other current assets 3,445 171,148Property, plant and equipment 5,963 296,242Intangible asset 1,438 71,440
US$40,203 P=1,997,286
LiabilitiesTrade payable and other current liabilities 25,404 1,262,071Short and long-term debt 15,108 750,565Other noncurrent liabilities 1,484 73,725
41,996 2,086,361
Net Liabilities (1,793) (89,075)
Non-controlling interest (20%) 358 17,785Goodwill 56,159 2,789,979
Cost of acquisition $54,724 P=2,718,689*Translated using the exchange rate at the closing date of transaction (US$1:P=49.68 on May 16, 2017).
The changes in the fair values pertain to the audited balances of STI as of acquisition date. The priorperiod comparative information was not restated since the audited fair values approximates theprovisional carrying values. Adjustment of the provisional goodwill recognized in 2017 was includedunder Reclassification/other adjustments for 2018 in Note 14. The goodwill recognized on theacquisition can be attributed to STI’s access to the UK market. Further, the partnership will allow IMIGroup’s entry into the aerospace, security and defense sectors. Management assessed that as acontract manufacturer, STI does not hold any intellectual property rights and that there are noexisting customer relationships. For fixed assets, there is no fair value adjustment required due tothe age and nature of equipment. The fair value of the receivables approximates their carryingamounts. None of the receivables have been impaired and is expected that the full contractualamounts can be collected.
The initial purchase consideration of £23.0 million (US$29.8 million) was paid in cash upon signing ofthe agreement. The contingent consideration is based on the actual normalized earnings beforeinterest, taxes, depreciation and amortization (EBITDA) performance less adjustments in 2018 and2019. The contingent consideration was recognized at its fair value as part of the considerationtransferred using the probability-weighted average of payouts associated with each possibleoutcome. Fair values of the contingent consideration amounted to £3.0 million (US$3.7 million) and£19.3 million (US$25.0 million) as of December 31, 2018 and 2017, respectively (see Note 9). Thegain from the reversal of contingent liability amounting to US$21.30 million was included under“Other Income” in the 2017 consolidated statement of income (see Note 23).Analysis of cash flows on acquisition:
In US$ In P=*
Initial purchase consideration US$29,750 P=1,477,980Contingent consideration 24,976 1,240,808
Cost of acquisition US$54,726 2,718,788
Cash consideration US$29,750 1,477,980Less: Cash acquired from the subsidiary 4,045 200,956
Net cash flow (included in cash flows frominvesting activities) US$25,705 P=1,277,024*Translated using the exchange rate at the reporting date (US$1:P=49.68 on December 31, 2017).

- 174 -
*SGVFS039491*
The agreement also provided details regarding the sale of additional shares from the non-controllinginterest through the grant of put and call options. The Group accounted for the call option as aderivative asset at nil value. The Group accounted for the put option as a financial liabilitymeasured at the present value of the redemption amount which amounted to US$10.4 million(P=546.8 million) and US$10.2 million (P=509.3 million) as of December 31, 2018 and 2017,respectively. Mark-to-market gains (losses) amounting to US$0.8 million (P=41.9 million) and US$2.6million (P=131.0 million) were recognized for the years ended December 31, 2018 and 2017,respectively, in the consolidated statements of income.
From the date of acquisition up to December 31, 2017, STI contributed US$45.5 million of revenueand US$0.3 million profit before tax to the Group. If the combination had taken place at the beginningof the year, STI would have contributed revenue amounting to US$64.8 million and loss before taxmounting to US$6.3 million.
Acquisition-related costs, which consist of professional and legal fees, financing and transactioncosts, taxes, representation and travel expenses amounting to US$1.4 million were recognized asexpense in the consolidated statements of income.
MT Misslbeck Technologies GmbH (MT)On June 1, 2017, AITHI, through its subsidiary ACI Singapore, has entered into an agreement withthe shareholders of MT for the acquisition by ACI Singapore of a 94.90% equity stake and variousshareholder and other loans in MT, a supplier of models, tools and plastic parts based in Ingolstadt,Germany. The said agreement became effective on June 2, 2017. The closing of the transactiontranspired on July 5, 2017 upon completion of pre-closing conditions and regulatory approval.
In 2017, the purchase price allocation for the acquisition of AITHI has been prepared on a preliminarybasis due to unavailability of information to facilitate fair value computation.
AC Industrial finalized the purchase price allocation in 2018 with the following changes to the fairvalues based on additional information subsequently obtained (amounts in thousands):
In EUR In P=*
AssetsCash €2 P=147Receivables 3,626 216,654Inventories 10,382 620,347Property, plant and equipment 24,994 1,493,389Other noncurrent assets 257 15,332
39,261 2,345,869
LiabilitiesTrade accounts payable 11,159 666,761Long-term debt 25,629 1,531,343
(Forward)In EUR In P=*
Other noncurrent liabilities 2,954 176,503
39,742 2,374,607
Net assets (€481) (P=28,738)
Non-controlling interest (5.10%) €0.001 P=0.06Goodwill 481 28,738
Cost of acquisition €0.001 P=0.06*Translated using the exchange rate at the date of the closing of the transaction (€1:P=50.60 on July 5, 2017).
AC Industrial has elected to measure non-controlling interest in the acquiree at the proportionateshare of the non-controlling interest in the recognized amounts of the acquiree’s identifiable netassets. The carrying amount of non-controlling interest changes due to allocation of profit or loss,changes in other comprehensive income and dividends declared for the reporting period.

- 175 -
*SGVFS039491*
The goodwill recognized on the acquisition can be attributed to the automotive Tier 1 manufacturingcompetencies in modelling, cubing, tooling and plastic parts production that MT adds to ACIndustrial’s portfolio, as well as expected synergies from cross-selling and organizational efficiencieswith other AITHI companies.
Analysis of cash flows on acquisition (amounts in thousands):
In EUR In P=*
Cost of acquisition €0.001 P=0.06Assumption of shareholder and other loans 21,897 1,308,346Less: Cash acquired with the subsidiary 2 147
Net cash flow (included in cash flows from investing activities) €21,895 P=1,308,199
*Translated using the exchange rate at the date of the closing of the transaction (€1:P=50.50 on July 5, 2017).
The initial purchase consideration of EUR1 upon signing of the agreement was paid in cash. Thetransaction also includes put and call options on the non-controlling interests in MT of 5.1%, theexercise of which are subject to certain conditions. The estimated fair value of the financial liabilityamounted to P=68.5 million.
Acquisition-related costs, which consist of professional and legal fees, transaction costs, taxes,representation and travel expenses amounting to EUR1.2 million were recognized as expense in2017.
From July 5 to December 31, 2017, AITHI’s share in MT’s revenue and net loss amounted to€19.3 million (P=1,147.3 million) and €3.2 million (P=190.3 million), respectively. If the combination hadtaken place at the beginning of 2017, the AITHI’s share in MT’s revenue and net loss would havebeen €32.7 million (P=1,919.8 million) and €4.4 million (P=265.8 million), respectively.
Renewable Energy Test Center, LLC (RETC)On September 15, 2017, AI North America (AINA), a wholly-owned subsidiary of BHL, fully acquiredRETC for a total consideration of US$13.1 million. The closing of the transactions is subject tocompletion conditions and regulatory approval. BHL Group previously held 15.75% equity interest inRETC indirectly through the Series A Preferred Interests in PFIL North America, Inc. As a result ofthe transaction, RETC became a wholly-owned subsidiary of the BHL Group.
On March 8, 2018, AINA, a wholly-owned subsidiary of BHL, through its subsidiary PFIL NorthAmerica, Inc. (PFIL NA), sold 70% interest of RETC for a total consideration of US$10.8 million toMarubeni Corporation (see Note 11). As a result of the transaction, BHL Group’s ownership interestin RETC decreased from 100% to 30% (see Note 11). The Group recognized gain on loss of controlamounting to P=2.2 million included under “Other income” (see Note 23).
Asian Land Strategies Corporation (Asian Land)On January 4, 2017, MWPVI entered into an Asset Purchase Agreement (APA) with Asian Land toacquire and operate the latter’s assets used in the water business operations in Asian Land’sdevelopments in the province of Bulacan. The intention of MWPVI was to assign the rights under theAPA to Bulacan MWPV Development Corp. (BMDC), MWC’s wholly owned subsidiary.
On July 31, 2017, MWPVI assigned all its rights and obligations on the APA to BMDC under a Deedof Assignment. On the same day, the Deed of Absolute Sale has also been executed between AsianLand and BMDC. Total consideration paid by BMDC to Asian Land amounted to P=54.0 million,inclusive of VAT.

- 176 -
*SGVFS039491*
Solar Resources, Inc. (Solar Resources)On July 26, 2017, BMDC entered into an APA with Solar Resources to acquire and operate thelatter’s assets used in the water business operations in Solar developments in the province ofBulacan. On July 31, 2017, Solar Resources executed a Deed of Assignment in relation to the APAand a Deed of Absolute Sale to sell and transfer its properties pertaining to water facilities and itsoperations in the Las Palmas Subdivisions Phases 1 to 7 to BMDC. Total consideration paid byBMDC to Solar Resources amounted to P=21.0 million, inclusive of VAT.
Borland Development Corporation (Borland)On December 14, 2017, Borland executed the APA, Deed of Assignment, and Deed of Absolute Saleto sell, assign, transfer, and convey its assets pertaining to water facilities and its operation in SanVicente Homes subdivision in Bulacan to BMDC. Total consideration paid by BMDC to Borlandamounted to P=7.3 million, exclusive of VAT.
The fair values of the identifiable assets on these transactions as of the date of acquisition were asfollows:
Asian LandSolar
Resources Borland
Assets acquiredProperty, plant and equipment P=103,122 P=17,544 P=6,050Acquisition cost 48,214 18,750 7,280
Goodwill (Bargain purchase) (P=54,908) P=1,206 P=1,230
No identifiable liabilities were acquired by BMDC in these acquisitions. The gain on bargainpurchase is presented as part of “Other income” in the 2017 consolidated statement of income.
Transactions with Non-controlling Interest
Parent CompanyOn May 2, 2014, AYCFL issued at face US$300.0 million Exchangeable Bonds (the Bonds) due onMay 2, 2019. The Bonds are guaranteed by the Parent Company and constitute direct,unsubordinated, unconditional and unsecured obligations of AYCFL, ranking pari passu and withoutany preference or priority among themselves. The Bonds were listed in the Singapore StockExchange and include features such as exchange option, put option and early redemption options.The Bondholders have the right to exchange their Bonds for shares at any time during the exchangeperiod.
On April 30, 2019, the remaining AYCFL US$292.8 million guaranteed exchangeable bonds as ofDecember 31, 2018 was exchanged and converted into total of 377.5 million ALI ordinary commonshares.
The total cumulative exchanges of the Bonds into shares resulted in an increase in equity reserve ofP=12.3 billion.
ALI GroupIn September 2019, ALI purchased additional 648,177 shares of VPHI for P=799.42 million increasingALI’s ownership to 78.41%.
On April 17, 2019, ALI acquired additional 14,913,200 common shares of CHI through open marketpurchases using the trading facilities of the Philippine Stock Exchange totaling P=88.7 million resultingin ALI’s ownership from 70.4% to 71.1%.

- 177 -
*SGVFS039491*
On April 30, 2018, ALI and AyalaLand Logistics Holdings Corp. (ALLHC), formerly Prime OrionPhilippines, Inc. (POPI), executed a Deed of Exchange where ALI will subscribe to 1,225,370,620common shares of ALLHC for an aggregate subscription price of P=3.0 billion in exchange for 30,186common shares of LTI. The subscription and exchange shall be subject to and deemed effective onlyupon the issuance by the SEC of the confirmation of valuation of the shares. The SEC issued itsapproval on February 28, 2019. This increased ALI’s ownership to 69.50%. This resulted in adecrease in equity reserve amounting to ₱664.9 million
On February 4, 2019, the Executive Committee of ALI approved the purchase of a 20% equityinterest owned by Mitsubishi Corporation in Laguna Technopark, Inc. (LTI), equivalent to 8,051common shares, with a total value of ₱800 million. On May 10, 2019, POPI changed its corporatename to ALLHC.
Subsequently on June 10, 2019, ALI sold to ALLHC its 20% equity interest or 8,051 LTI commonshares equivalent to P=800 million for additional shares of stock in ALLHC resulting to increase inALI’s ownership from 69.5% to 70.36%. On September 9, 2019, OLI sold through a special blocksale, 215,090,031 common shares of ALLHC to Avida Land Corporation, a wholly-owned subsidiaryof ALI, for a total consideration of P=628.1 million. Subsequently, these shares were acquired by ALIthrough a special block sale for a total consideration of P=628.1 million. This resulted in an increaseALI’s effective ownership in ALLHC from 70.36% to 71.46%
The transactions were accounted for as an equity transaction since there were no changes in control.The movements within equity are accounted for as follows:
2019
Consideration paid
Carrying value ofNon-controlling
interests acquired
Differencerecognized withinEquity as Equity
Reserve(In Thousands)
8.41% in VPHI P=799,420 P=68,916 P=730,5040.69% in CHI 88,734 73,977 14,7570.86% in ALLHC 800,000 825,447 (25,447)1.10% in ALLHC 628,100 1,033,335 (405,235)
P=2,316,254 P=2,001,675 P=314,579
In 2018, ALI acquired additional 59,631,200 common shares of CHI totaling to P=352.8 million.Further, an additional 77,742,516 shares was acquired as a result of swap of CPVDC shares for atotal consideration of P=229.3 million which brings ALI’s ownership to 70.4%.
In January 2018, ALI purchased additional 202,774,547 shares of POPI from Genez InvestmentCorporation for P=497.7 million increasing ALI’s ownership to 67%.
In December 2018, ALI acquired 8,051 common shares of LTI for P=800.0 million increasing itsownership to 95%.
The transactions were accounted for as an equity transaction since there were no changes in control.The movements within equity are accounted for as follows:
2018
Consideration paid
Carrying value ofNon-controlling
interests acquired
Differencerecognized within
Equity(In Thousands)
4.14% in POPI P=497,652 P=315,951 P=181,70120.00% in LTI 800,000 528,295 271,7051.53% net reduction in CHI 582,106 826,752 (244,646)
P=1,879,758 P=1,670,998 P=208,760

- 178 -
*SGVFS039491*
In March 2018, the Irredeemable Convertible Unsecured Loan Stock of Dato Sri Tong and Tan SriBarry Go, founders of MCT, were converted into 122,218,357 shares. This resulted in a 6.07%dilution of ALI’s stake in MCT as of date of share issuance. As such, the current ownership stake ofALI in MCT is 66.25%. This resulted in an increase in Equity reserve amounting to P=1,044.5 million.
In 2017, ALI purchased additional 97,763,900 common shares of CHI from BPI Securities Corporationtotaling P=575.0 million which brought up ALI’s ownership to 72% of the total outstanding capital stockof CHI.In February 2017, ALI purchased additional 631,000 common shares of POPI from BPI SecuritiesCorporation for P=1.26 million. ALI’s interest remains at 51% of the total POPI’s outstanding capitalstock.
In June 2017, Orion Land, Inc. (OLI), a subsidiary of POPI, acquired 512,480,671 common sharesequivalent to 11.69% ownership at P=2.45 share amounting to P=1,255.58 million. The acquisition ofPOPI shares by OLI was treated as an acquisition of non-controlling interest resulting to a debit toequity reserve of P=405.18 million. This increased ALI’s effective ownership to 63.05%.
The transactions were accounted for as an equity transaction since there were no changes in control.The movements within equity are accounted for as follows:
Consideration paid
Carrying value ofNon-controlling
interests acquired
Differencerecognized within
Equity(In Thousands)
5.09% in CHI P=574,994 P=394,907 P=180,08711.69% in POPI 1,258,579 852,656 405,923
P=1,833,573 P=1,247,563 P=586,010
In August 2017, AHRC entered into a memorandum of agreement with SIDECO and an individual todevelop Sicogon Island into a new leisure destination. The investment of SIDECO and an individualto Sicogon Island Tourism Estate Corp. (SITEC) changed the ownership interest of AHRC in SITECfrom 100% to 77% without a loss of control. The difference between the amount by whichnon-controlling interest of 23% are adjusted and the fair value of consideration paid is recognizeddirectly to equity amounting to P=134.0 million.
In 2016, ALI purchased additional 201,859,364 common shares of CHI for total consideration ofP=1,209.8 million which brought ALI’s ownership from 56.4% to 66.9%. The transaction wasaccounted for as an equity transaction since there was no change in control. The difference betweenthe fair value of the consideration paid and the amount of which the noncontrolling interest isadjusted amounting to P=461.0 million is recognized in equity under “Equity Reserve”.
From March 2016 to July 2016, LLHI subscribed to 18,150,931 common and 48,876,456 preferredshares of Nuevo Centro or equivalent to 45.0% stake of NCI’s total outstanding capital. Thistransaction resulted into lower ALI’s interest to 55.0% in NCI as of December 31, 2016. Thetransactions were accounted as an equity transaction since there was no change in control.
In 2015, ALI purchased additional shares from non–controlling interests of CHI, NTDCC, AuroraProperties Incorporated (API). The transactions were accounted as an equity transaction since therewas no change in control. The movements within equity are accounted for as follows:
Considerationpaid
Carrying value ofNon-controlling
interests
Differencerecognized within
Equity(In Thousands)
6.7% in CHI P=649,927 P=434,074 P=215,8539.4% in NTDCC 778,356 174,770 603,5861.9% in API 58,157 45,540 12,617
P=1,486,440 P=654,384 P=832,056

- 179 -
*SGVFS039491*
In 2014, ALI Group acquired additional shares from non-controlling interests of Philenergy (40.0%),NTDCC (14.5%) and CECI (0.40%) and were accounted as an equity transaction since there was nochange in control.
In 2013, ALI Group acquired additional 32% interest in APPCo and additional 40% interests in TKDCand TKPI increasing its ownership interest to 100%. The transactions were accounted as an equitytransaction since there was no change in control. Following is the schedule of the movement inequity reserves recorded within the equity:
Consideration paid
Carrying value ofNon-controlling
interests acquiredDifference recognized
within Equity(In Thousands)
6.7% in CHI P=3,520,000 P=797,411 P=2,722,5899.4% in NTDCC 2,000,000 1,413,960 586,040
P=5,520,000 P=2,211,371 P=3,308,629
IMI GroupSTELOn December 26, 2016, STEL acquired the remaining non-controlling interest in Shenzhen Speedy-Tech Electronics Co., Ltd. for a total consideration of US$0.4 million.
The details of the transaction are as follows (amounts in thousands):
In US$ In Php*
Non-controlling interest acquired US$190 P=9,447Consideration paid to the non-controlling shareholder (360) (17,899)
Total amount recognized in “Equity Reserves” accountwithin equity (US$170) (P=8,452)
*Translated using the exchange rate at the reporting date (US$1:P=49.72 on December 31, 2016).
25. Assets and Liabilities and Operations of Segment under PFRS 5
MWCOn February 3, 2020, MWC and Prime Metroline Holdings, Inc., on behalf of a company to beincorporated (Trident Water), signed a subscription agreement for the acquisition of 820.0 millioncommon shares of MWC at P=13.00 per share. On February 6, 2020, the Parent Company’sExecutive Committee approved the grant of proxy rights by Philwater to Trident Water over its4,000,000,000 preferred shares to enable the latter to achieve 51.00% voting interest in MWC,subject to the fulfillment of the conditions in the subscription agreement for the 24.96% share inMWC. Upon the grant of proxy rights to Trident Water, the Parent Company’s effective votinginterest in MWC will stand at 31.60%.
On February 7, 2020, MWC received a letter from Prime Metroline Holdings, Inc. that it hasannounced, through publication in a newspaper of general circulation, its intention to make amandatory offer for the shares of the MWC at an offer price of P=13.00 per share.
The issuance of the primary shares to Trident Water by MWC and the assignment of portion of thepreferred shares voting rights is expected to be completed within one year from the reporting dateand will result in the Parent Company’s loss of control over MWC. Accordingly, as at December 31,2019, MWC qualified as a group held for deemed disposal and since the operations of MWCrepresents the Group’s water infrastructure business segment, qualifies as a discontinued operation(presented as operation of segment under PFRS 5 in the statement of income).

- 180 -
*SGVFS039491*
The results of MWC for the years ended December 31, 2019, 2018 and 2017 are presented below:
2019 2018 2017
(In Thousands)Revenue from contracts with customer P=20,729,630 19,027,915 P=29,381,301Cost of Services (8,223,313) (6,900,923) (7,003,157)
Gross profit 12,506,317 12,126,992 22,378,144Operating expenses (4,805,302) (3,865,330) (15,240,737)Other income (expenses)-net (866,197) (328,003) (126,997)Pre-PFRS 5 impairment loss (Notes 13 and 14) (5,574,910) – –Impairment loss recognized on remeasurement to fair
value less costs to sell (33,244,121) – –
Income/ (Loss) before income tax (31,984,213) 7,933,659 7,010,410Provision for income taxRelated to income from ordinary activities for the
period (2,031,058) (1,752,524) (1,680,541)Related to pre-PFRS 5 impairment loss 1,301,750 – –Related to remeasurement to fair value less costs to
sell 2,280,028 – –
Net income/(loss) from operations of the Segmentunder PFRS 5 (P=30,433,493) P=6,181,135 P=5,329,869
In 2019, operating expenses include provision for impairment on receivables amounting toP=0.1 million and depreciation and amortization on property, plant and equipment, service concessionassets and right-of-use assets amounting to P=3,572.5 million.
Write-down of non-financial assetsImmediately before the classification of MWC under PFRS 5, the recoverable amount was estimated
for service concession assets and goodwill which resulted in impairment loss of P=5.2 billion and.
P=367.9 million, respectively.
Following the reclassification of the assets and liabilities of MWC to assets and liabilities underPFRS 5, the write-down of the following non-financial assets was made to remeasure the carryingamount of the group to fair value less costs to sell (amounts in thousands):
Service Concession Asset P=25,664,749Investments in associates and joint ventures 5,739,994Property, Plant and Equipment 1,701,516Goodwill 137,862
The loss was recorded under Operations of the segment under PFRS 5 in the consolidatedstatements of income. Fair value was determined based on the price at which the Company would bereceived to sell an asset or paid to transfer a liability in an orderly transaction between marketparticipants at the measurement date
The major classes of assets and liabilities of the MWC classified under PFRS 5 as at December 31,2019 are as follows:
2019
Assets under PFRS 5 (In thousands)Cash and cash equivalents P=8,339,714Short-term investments 727,798Receivables 1,871,875Concession financial receivables 1,054,538Contract assets 1,471,574Inventories 342,440
(Forward)

- 181 -
*SGVFS039491*
2019Investments in associates and joint ventures P=9,779,814Property, plant and equipment 2,867,910Service concession assets - net 76,307,998Right-of-use assets 295,675Deferred tax assets 1,846,449Other assets 4,856,350
Total assets under PFRS 5 P=109,762,135
Liabilities under PFRS 5Accounts and other payables P=8,573,299Contract liabilities 345,644Lease liabilities 308,482Service concession obligations 9,017,457Income tax payable 308,404Short-term and long-term debt 56,350,986Pension liabilities 194,194Deferred tax liabilities 543,777Other liabilities 2,960,143
Total liabilities under PFRS 5 P=78,602,386
The reserves under PFRS 5 pertain to MWC reserves as follows:
2019
Reserves under PFRS 5 (In thousands)Remeasurement losses on defined benefit plans 48,045Fair value reserve of financial assets at fair value through OCI 473Cumulative translation adjustments (128,906)Equity reserve 1,547,837
Total reserves under PFRS 5 P=1,467,449
The following are the disaggregation of MWC’s revenue from contracts with customers which formspart of the Group’s operations of the segment under PFRS 5 for the years ended December 31, 2019and 2018:
2019Manila Concession
and Head OfficeDomestic
SubsidiariesForeign
Subsidiaries Total
(In Thousands)
Revenue from contracts with customersWater P=12,380,830 P=2,975,888 P=– P=15,356,718
Sewer 257,247 314,853 – 572,100
Environmental charges 2,834,858 151,479 – 2,986,337 Other operating income 102,511 1,699,196 12,768 1,814,475
P=15,575,446 P=5,141,416 P=12,768 P=20,729,630
Timing of revenue recognition Revenue recognized over time P=15,552,473 P=4,871,953 P=– 20,424,426
Revenue recognized at a point in time 22,974 269,463 12,768 305,205
P=15,575,447 P=5,141,416 P=12,768 P=20,729,631
2018Manila Concession
and Head OfficeDomestic
SubsidiariesForeign
Subsidiaries Total
(In Thousands)
Revenue from contracts with customersWater P=12,332,399 P=2,264,888 P=– P=14,597,287
Sewer 246,598 273,803 – 520,401 Environmental charges 2,691,308 28,343 – 2,719,651 Other operating income 275,251 886,318 29,007 1,190,576
P=15,545,556 P=3,453,352 P=29,007 P=19,027,915

- 182 -
*SGVFS039491*
Manila Concessionand Head Office
DomesticSubsidiaries
ForeignSubsidiaries Total
(In Thousands)Timing of revenue recognition Revenue recognized over time P=15,298,057 P=3,089,330 P=– P=18,387,387
Revenue recognized at a point in time 247,499 364,022 P=29,007 640,528
P=15,545,556 P=3,453,352 P=29,007 P=19,027,915
The net cash flows of MWC are as follows:
2019 2018
(In Thousands)Operating P=549,262 P=3,297,589Investing (692,482) (8,859,009)Financing (289,128) 5,931,268
Net cash outflow/inflow (P=432,348) P=369,848
The net income attributable to owners of the Parent Company and NCI from continuing andoperations of segment under PFRS 5 are as follows:
2019 2018 2017
(In thousands)Net Income (Loss) Attributable to:Owners of the Parent Company (Note 27)From continuing operations P=51,149,782 P=28,653,435 P=27,581,428From operations of segment under PFRS 5 (15,870,452) 3,164,287 2,682,404Non-controlling interestFrom continuing operations 21,266,041 20,230,545 16,955,478From operations of segment under PFRS 5 (14,563,041) 3,016,848 2,647,465
Earnings per share 2019 2018 2017
(In Thousands)Basic, net income (loss) from operations of
segment under PFRS 5 (P=48.42) P=9.88 P=8.58Diluted, net income (loss) from operations of
segment under PFRS 5 (P=48.32) P=9.85 P=8.55
GNPKOn July 1, 2019, the ACEI and PP executed a term sheet for the acquisition by PP of the ACEIGroup’s indirect partnership interest in GNPK. The completion of the transaction will result to PPgaining control over GNPK’s coal plant project. The closing of the sale transaction is subject toconditions precedent, including the approval by the PCC that was obtained on September 30, 2019.
The major classes of assets and liabilities of the GNPK classified under PFRS 5 as at December 31,2019 are as follows:
2019(In Thousands)
Assets Held for SaleCash and cash equivalents P=4,990,109Receivables 2,378,369Input value-added taxes 3,839,980Property, plant and equipment 48,102,754Intangible assets 280,311Other assets 1,113,035
Total assets under PFRS 5 P=60,704,558
(Forward)

- 183 -
*SGVFS039491*
2019(In Thousands)
Liabilities under PFRS 5Accounts and other payables P=2,700,672Loans Payable 38,942,070Deferred tax liability - net 288,225Other liabilities 954,273
Total liabilities under PFRS 5 P=42,885,240
As of December 31, 2019, total reserves of GNPK amounted to P=208.6 million.
Merger of AEI and IPOOn January 8, 2018, the Group publicly announced the potential merger of AEI and IPO, the listedholding company for the education sector of House of Investments Inc., a member of the YuchengcoGroup of Companies (see Note 10). The parties agreed to an exclusivity period to complete duediligence, and to finalize the terms and conditions of the proposed merger within the first quarter of2018. As of December 31, 2018 and 2017, AEI was classified as a disposal group held for sale.
The major classes of assets and liabilities of AEI classified as held for sale as of December 31,2018are as follows (amounts in thousands):
2018
AssetsCash and cash equivalents P=1,464,681Accounts and other receivables 162,876Other current assets 68,996Investment property 1,490,005Property and equipment 556,294Other noncurrent assets 783,972
4,526,824
(Forward)
LiabilitiesAccounts and other payables P=410,660Loans payable 30,000Other noncurrent liabilities 634,612
P=1,075,272
Non-controlling interests P=358,427
The net cash flows incurred by AEI for the year are as follows:
Assets 2018
Operating P=399,453Investing (1,716,136)Financing 2,358,112
Net cash inflow P=1,041,429
AA ThermalOn February 28, 2019, the PCC approved the acquisition by Aboitiz Power Corporation (AboitizPower) of a 49% voting interest and 60% economic interest in AA Thermal. This follows the signingof a share purchase agreement on September 26, 2018 between Aboitiz Power and AMNHB (asubsidiary of ACEI). During the first half of 2019, ACEI completed the sale valued at US$574.19 million. The carrying value of ACEI Group’s investment in AA Thermal was US$125.23 million(P=6.68 billion). The transaction resulted to US$448.96 million (P=23.59 billion) gain on sale which ispresented under “Other Income” in the condensed consolidated statements of comprehensive

- 184 -
*SGVFS039491*
income (see Note 23). The proceeds of the sale were fully collected on May 17, 2019 (US$572.87million) and September 5, 2019 (US$1.31 million for the price adjustment). The remaining interest onAA Thermal is recorded under “Investments in associates and joint ventures”.
As of December 31, 2018, the portion sold to Aboitiz Power in 2019 amounting to P=5.64 billion wasclassified as “Assets held for sale” in the consolidated financial statements of the Group.
AA Thermal has ownership interest in the 2x300 MW coal-fired power plant in Mariveles, Bataan ownedby GNPower Mariveles Coal Plant Ltd. Co., which has been in operations since 2014, and in the 2x600MW supercritical coal-fired power plant in Dinginin, Bataan owned by GNPower Dinginin Ltd. Co.,which is currently under construction.
26. Income Tax
The components of the Group’s deferred taxes are as follows:
Net deferred tax assets
2019 2018
(In Thousands)Deferred tax assets on: Difference between tax and book basis of
accounting for real estate transactions P=9,549,758 P=10,531,049
Lease Liability 4,512,578 − Accrued expenses 1,057,660 605,405 MCIT 857,344 – Allowance for probable losses 677,677 649,222 Retirement benefits 675,029 470,937 NOLCO 286,175 813,314 Allowance for doubtful accounts 26,931 95,875 Allowance for inventory obsolescence 16,648 7,866 Advanced rental 11,366 32,537 Remeasurement loss 9,106 6,951 Fair value adjustment on property, plant and
equipment arising from business combination 3,978 – Service concession obligation – 1,449,136 Unrealized foreign exchange loss – 789,643 Fair value adjustments on long-term debt – 165,769 Contract asset – 1,668 Others 396,154 575,984
18,080,404 16,195,356
Deferred tax liabilities on: ROU asset (3,223,526) – Capitalized interest and other expenses (485,077) (434,023) Difference between amortization expense of SCA
per straight-line depreciation – (215,293)
Others (125,476) –(3,834,079) (649,316)
Net deferred tax assets P=14,246,325 P=15,546,040

- 185 -
*SGVFS039491*
Net deferred tax liabilities
2019 2018
(In Thousands)Deferred tax assets on:Lease liability P=339,392 P=–Accrued expenses 184,672 17,476 Difference between tax and book basis of
accounting for real estate transactions 92,021 43,621Allowance for probable losses 51,820 116,102Fair value adjustments on: Long-term debt − 88,852 AFS financial asset − 1,116NOLCO 3,871 52,616Retirement benefits 418 3,637MCIT − 9,051Advanced rental 10 –Unrealized foreign exchange loss 11,664 – Others 95,665 138,856
779,533 471,327
Deferred tax liabilities on:Fair value adjustment arising from business
combination (3,807,047) (4,093,238)Difference between tax and book basis of
accounting for real estate transactions (2,018,940) (1,006,586)ROU asset (1,010,026) –Difference between carrying amount of nonmonetary asset and their tax base (634,249) –Accrual of liquidated damage – (651,970) Capitalized interest and other expenses (297,873) (144,668) Acquisition of trademarks and patents (264,485) Unrealized foreign exchange gain (28,153) (2,486)Accrued receivables (17,466) (11,327)Contract asset (11,517) (37,282) Unrealized fair value gain less costs to sell of
biological assets (4,492) (6,909)Fair value adjustments arising from business
combination with MWC: Service concession assets – (3,683,544) Land and improvements – (625,490) Property, plant and equipment – (173,056)Unrealized lease income – (75,850)Concession finance receivable – (72,793)Depreciation – (38,577) Prepaid expenses – (21,381) Difference between amortization expense of
SCA per straight line method and per UOP – (433) Others (721,102) (825,091)
(8,815,350) (11,470,681)
Net deferred tax liabilities (P=8,035,817) (P=10,999,354)
In 2018, deferred tax related to remeasurement gain on defined benefit plans recognized in OCIamounted to P=93.6 million.

- 186 -
*SGVFS039491*
The Group has NOLCO amounting to P=18.9 billion and P=18.0 billion in 2019 and 2018, respectively,and MCIT amounting to P=203.2 million and P=181.6 million in 2019 and 2018, respectively. Deferredtax assets are recognized only to the extent that taxable income will be available against which thedeferred tax assets can be used. As of December 31, 2019, total unrecognized NOLCO and MCITamounted to P=15.4 billion and P=38.6 million, respectively. The subsidiaries will recognize apreviously unrecognized deferred tax asset to the extent that it has become probable that futuretaxable income will allow the deferred tax asset to be recovered.
As of December 31, 2019, NOLCO and MCIT that can be claimed as deduction from future taxableincome or used as deductions against income tax liabilities, respectively, are as follows:
Year incurred Expiry Date NOLCO MCIT
(In Thousands)2016 2019 5,835,744 23,1982017 2020 5,632,420 26,1322018 2021 6,555,855 132,2812019 2022 6,710,337 44,803
As of December 31, 2019 and 2018 deferred tax liabilities have not been recognized on theundistributed earnings and cumulative translation adjustment of foreign subsidiaries since the timingof the reversal of the temporary difference can be controlled by the Group and management does notexpect the reversal of the temporary differences in the foreseeable future. The undistributedearnings and cumulative translation adjustment amounted to P=22.4 billion and P=18.1 billion as ofDecember 31, 2019 and 2018, respectively.
The reconciliation between the statutory and the effective income tax rates follows:
2019 2018 2017
Statutory income tax rate 30.00% 30.00% 30.00%Tax effects of: Nontaxable share in net profits of
associates and joint ventures (12.68) (8.75) (8.93) Nondeductible expenses 17.12 0.44 1.45 Interest income and capital gains
subjected to lower rates (16.58) (1.28) (1.93) Income under income tax holiday (0.90) (0.59) (0.35) Others 5.89 1.72 (0.51)
Effective income tax rate 22.85% 21.54% 19.73%
The income tax on profits of overseas subsidiaries have been calculated at the rates of tax prevailingin the countries where such subsidiary operates, based on existing legislation, interpretations andpractices in respect thereof.
Revenue Regulations (RR) No. 16-2008RR No. 16-2008 provided the implementing guidelines for Section 34 of RA No. 9504 on the use ofthe OSD for corporations. The OSD allowed shall be an amount not exceeding 40% of the grossincome. Gross income earned refers to gross sales or gross revenue derived from any businessactivity, net of returns and allowances, less cost of sales or direct costs but before any deduction ismade for administrative expenses or incidental losses. This was applied by MWC Group for theyears ended December 31, 2019, 2018 and 2017.

- 187 -
*SGVFS039491*
The use of OSD as the method of computing tax deductible expenses affected the recognition ofseveral deferred tax assets and liabilities, such that no deferred tax assets and liabilities wererecognized on items of income and expenses that are not considered in determining gross incomefor income tax purposes. The MWC Group forecasts that it will continue to avail of the OSD, suchthat the manner by which it will recover or settle the underlying assets and liabilities, for which thedeferred tax assets and liabilities were initially recognized, would not result in any future taxconsequence under OSD.
The tax rate of 18% for the years in which OSD is projected to be utilized was used in computing thedeferred income taxes on the net service concession obligation starting 2008.
Deferred taxes on allowance for ECL and pension liability were not recognized by MWC. The netreduction in deferred tax assets from applying the 18% effective tax rate to the recognized deferredtaxes on net service obligation and the derecognition of the deferred taxes relating to the accountswith temporary differences which are not considered in determining gross income for income taxpurposes by MWC amounted to P=130.41 million and P=288.21 million as of December 31, 2019 and2018, respectively.
Registration with the PEZA and Board of Investments (BOI) IncentivesSome activities of certain local subsidiaries are registered with the PEZA and BOI. Under theregistration, these subsidiaries are entitled to certain tax and nontax incentives, which include, butare not limited to, income tax holiday (ITH) and duty-free importation of inventories and capitalequipment. Upon the expiration of the ITH, the subsidiaries will be liable for payment of a fivepercent (5%) tax on gross income earned from sources within the PEZA economic zone in lieu ofpayment of national and local taxes.
ALIALI was registered with PEZA last December 13, 2017 as a Developer/Operator of the SouthparkCorporate Center. In November 6, 2017, ALI was registered with PEZA as a Developer/Operator ofthe Vertis North IT Park.
The BOI issued certificates of registrations to ALI Group in accordance with the existing OmnibusInvestment Code. The projects have been granted an ITH for a fixed period from the date ofregistration or actual start of operations.
27. Earnings Per Share
The following table presents information necessary to calculate EPS on net income attributable toowners of the Parent Company:
20192018
(As Restated)2017
(As Restated)
(In Thousands, except EPS figures)Net income attributable to the owners of the Parent
CompanyContinuing operations P=51,149,782 P=28,653,435 P=27,581,438Segment under PFRS 5 (15,870,452) 3,164,287 2,682,404Less: Dividends on preferred stock (1,259,756) (1,285,015) (1,285,015)
34,019,574 30,532,707 28,978,827Less profit impact of assumed conversions of potential
ordinary shares of investees (51,642) (178,364) (319,184)
P=33,967,932 P=30,354,343 P=28,659,643
Weighted average number of common shares 628,558 625,644 620,928Dilutive shares arising from stock options 1,312 2,119 2,240
629,870 627,763 623,168
(Forward)

- 188 -
*SGVFS039491*
20192018
(As Restated)2017
(As Restated)
(In Thousands, except EPS figures)EPS before operations of segment under PFRS 5Basic P=79.37 P=43.74 P=42.35
Diluted P=79.12 P=43.31 P=41.69
EPSBasic P=54.12 P=48.80 P=46.67
Diluted P=53.93 P=48.35 P=45.99
28. Defined Benefit Plan
The Parent Company and certain subsidiaries have their respective funded, noncontributory tax-qualified defined benefit type of retirement plans covering substantially all of their employees. Thebenefits are based on defined formula with a certain minimum lump-sum guarantee of effectivesalary per year of service. The consolidated retirement costs charged to operations amounted toP=926.1 million, P=800.2 million and P=893.1 million in 2019, 2018 and 2017, respectively, net ofretirement costs of segment reclassified to PFRS 5 amounting to P=104.1 million, P=78.3 million andP=76.1 million in 2019, 2018 and 2017, respectively.
The Parent Company's pension fund is known as the AC Employees Welfare and Retirement Fund(ACEWRF). ACEWRF is a legal entity separate and distinct from the Parent Company, governed bya board of trustees appointed under a Trust Agreement between the Parent Company and the initialtrustees. It holds common and preferred shares of the Parent Company in its portfolio. All suchshares have voting rights under certain conditions, pursuant to law. ACEWRF's portfolio is managedby a committee appointed by the fund's trustees for that purpose. The members of the committeeinclude the Parent Company’s Chief Finance Officer, Group Head of Corporate Governance, GeneralCounsel, Corporate Secretary and Compliance Officer, Head for Strategic Human Resources,Treasurer and Comptroller. ACEWRF has not exercised voting rights over any shares of the ParentCompany that it owns.
For the subsidiaries, the funds are generally administered by a trustee bank under the supervision ofthe Board of Trustees of the plan for each subsidiary. The Board of Trustees is responsible forinvestment of the assets. It defines the investment strategy as often as necessary, at least annually,especially in the case of significant market developments or changes to the structure of the planparticipants. When defining the investment strategy, it takes account of the plans’ objectives, benefitobligations and risk capacity.
Existing regulatory framework in the Philippines requires a provision for retirement pay to qualifiedprivate sector employees in the absence of any retirement plan in the entity, provided however thatthe employee’s retirement benefits under any collective bargaining and other agreements shall notbe less than those provided under the law. The law does not require minimum funding of the plan.Some of the entities of the Group also provides additional post employment healthcare benefits tocertain senior employees in the Philippines.

- 189 -
*SGVFS039491*
The components of expense (included in personnel costs under “Cost of rendering services” and“General and administrative expenses”) in the consolidated statements of income follow:
20192018
(As Restated)2017
(As Restated)
(In Thousands)Current service cost P=875,495 P=763,607 P=787,865Past service cost − 10,563 549Net interest cost on benefit obligation 160,820 104,197 189,488Loss (gain) on curtailment and settlements (6,049) 84 (8,679)Reclassification to PFRS 5 (104,148) (78,273) (76,146)
Total pension expense P=926,118 P=800,178 P=893,077
The remeasurement effects recognized in other comprehensive income (included in Equity under“Remeasurement losses (gains) on defined benefit plans”) in the consolidated statements of financialposition follow:
2019 2018 2017
(In Thousands)Loss (gain) on plan assets (excluding amount
included in net interest) (P=261,290) P=699,513 (P=270,307)Actuarial gain due to liability assumption
changes - experience and demographicassumptions 389,358 102,522 (151,681)
Actuarial loss (gain) due to liability assumptionchanges - financial 947,590 (549,360) 71,456
Reclassification to PFRS 5 (90,526) – –
Remeasurements in other comprehensiveincome P=985,132 P=252,675 (P=350,532)
The funded status and amounts recognized in the consolidated statements of financial position forthe pension plan as of December 31, 2019 and 2018, as follows:
2019 2018
(In Thousands)Benefit obligations P=9,714,281 P=10,027,735Plan assets (5,958,233) (7,437,883)
Net pension liability position P=3,756,048 P=2,589,852
As of December 31, 2019 and 2018, pension assets (included under “Other Noncurrent Assets”)amounted to P=80.6 million and P=82.0 million (see Note 15), respectively, and pension liabilitiesamounted to P=3.8 billion and P=2.6 billion, respectively.

- 190 -
*SGVFS039491*
Changes in net defined benefit liability of funded funds in 2019 and 2018 are as follows:
2019Net benefit cost in consolidated statement of income Remeasurements in other comprehensive income
January 1
Current
service cost
PastService
Cost Net interest
Loss (gain)
onCurtailments
and
Settlements Subtotal
Benefits
paid
Returnon plan
assets*
Actuarialloss due
to liability
experience
Actuarialloss due
todemograhicassumption
changes
Actuarial
loss dueto financial
assumption
changes Subtotal
Transfer
payments
Contribution
by employer
Foreigncurrency
exchange
differences
Reclassi-fication to
PFRS 5 Settlements December 31
(In Thousands)
Present value of defined benefit obligation P=10,027,735 P=875,495 P=– P=698,392 (P=6,049) P=1,567,838 (P=2,116,363) P=– P=387,565 P=1,793 P=947,590 P= 1,336,948 (P=9,306) P=– (P=4,439) (P=1,073,160) (P=14,972) P=9,714,281Fair value of plan assets (7,437,883) – – (537,572) − (537,572) 2,157,149 (261,290) – – – (261,290) 7,502 (793,655) 9,288 878,965 19,263 (5,958,233)
Net defined benefit liability (asset) P=2,589,852 P=875,495 P=− P=160,820 (P=6,049) P=1,030,266 P=40,786 (P=261,290) P=387,565 P=1,793 P=947,590 P=1,075,658 (P=1,804) (P=793,655) P=4,849 (P=194,195) P=4,291 P=3,756,048
*Excluding amount included in net interest
2018
Net benefit cost in consolidated statement of incomeRemeasurements in
other comprehensive income
January 1Current
service cost
PastService
Cost Net interest
Loss (gain)on
Curtailmentsand
Settlements SubtotalBenefits
paid
Returnon planassets*
Actuarial
loss dueto liability
experience
Actuarialloss due
to liabilityassumption
changes SubtotalTransfer
paymentsContributionby employer
Foreign
currencyexchangedifferences
Reclassi-fications Settlements December 31
(In Thousands)Present value of defined benefit obligation P=10,035,831 P=763,607 P=10,563 P=505,571 P=84 P=1,279,825 (P=795,581) P=– (P=549,360) P=102,522 (P=446,838) (P=42,700) P=– P=– P=– (P=2,802) P=10,027,735Fair value of plan assets (7,533,027) – – (401,374) – (401,374) 357,789 699,513 – – 699,513 87,203 (650,789) – – 2,802 (7,437,883)
Net defined benefit liability (asset) P=2,502,804 P=763,607 P=10,563 P=104,197 P=84 P=878,451 (P=437,792) P=699,513 (P=549,360) P=102,522 P=252,675 P=44,503 (P=650,789) P=– P=– P=– P=2,589,852
*Excluding amount included in net interest

- 191 -
*SGVFS039491*
The following tables present the changes in the present value of defined benefit obligation and fairvalue of plan assets:
Present value of defined benefit obligation2019 2018
(In Thousands)Balance at beginning of year P=10,027,735 P=10,035,831Current service cost 875,495 763,607Interest cost 698,392 505,571Past service cost − 10,563Remeasurements in other comprehensive income: Actuarial changes arising from experience
adjustments and changes in demographic assumptions 389,358 102,522
Actuarial changes arising from changes in liability assumptions 947,590 (549,360)
Benefits paid from plan assets (2,116,363) (795,581)Settlements (14,972) (2,802)Transfer payments (9,306) (42,700)Foreign currency exchange difference (4,439) −Gain on curtailment and settlements (6,049) 84Reclassification to PFRS 5 (1,073,160) −
P=9,714,281 P=10,027,735
Fair value of plan assets2019 2018
(In Thousands)Balance at beginning of year P=7,437,883 P=7,533,027Contributions 793,655 650,789Interest income on plan assets 537,572 401,374Return on plan assets (excluding amount included in
net interest) 261,290 (699,513)Foreign currency exchange difference (9,288) −Benefits paid (2,157,149) (357,789)Transfer payments (7,502) (87,203)Settlements (19,263) (2,802)Reclassification to PFRS 5 (878,965) −
P=5,958,233 P=7,437,883
The fair value of plan assets by each classes as at the end of the reporting period are as follows:
2019 2018
(In Thousands)AssetsCash and cash equivalents P=30,672 P=33,714Debt investments 3,790,049 5,342,728Equity investments 2,400,021 2,039,884Other assets 580,538 100,009
6,801,280 7,516,335
LiabilitiesTrust fee payable (8,528) (45,804)
(8,528) (45,804)
Reclassifications to PFRS 5 (878,965) –
Net Asset Value* P=5,913,787 P=7,470,531*The difference of P=44.4 million and P=32.6 million in the fair value of plan assets as of December 31, 2019 and2018, respectively, pertains to movements after the valuation date.

- 192 -
*SGVFS039491*
All equity and debt instruments held have quoted prices in active market. The remaining plan assetsdo not have quoted market prices in active market.
The plan assets have diverse investments and do not have any concentration risk.
The cost of defined benefit pension plans and other post–employment medical benefits as well as thepresent value of the pension obligation are determined using actuarial valuations. The actuarialvaluation involves making various assumptions. The principal assumptions used in determiningpension and post-employment medical benefit obligations for the defined benefit plans are shownbelow:
2019 2018
Discount rates 0.4% to 7.6% 0.9% to 8.5%Future salary increases 4.0% to 7.5% 3.0% to 8.0%
There were no changes from the previous period in the methods and assumptions used in preparingsensitivity analysis.
The sensitivity analysis below has been determined based on reasonably possible changes of eachsignificant assumption on the defined benefit obligation as of the end of the reporting period,assuming if all other assumptions were held constant:
2019 2018
Increase (decrease) Net Pension Liabilities
(In Thousands)Discount rates 1% (P=528,235) (P=383,831)
(1%) 590,037 452,594
Future salary increases 1% 572,983 458,707(1%) (493,721) (394,987)
The management performed an Asset–Liability Matching Study (ALM) annually. The overallinvestment policy and strategy of the Group’s defined benefit plans is guided by the objective ofachieving an investment return which, together with contributions, ensures that there will be sufficientassets to pay pension benefits as they fall due while also mitigating the various risk of the plans. TheGroup’s current strategic investment strategy consists of 55.73% of debt instruments, 35.29% ofequity instruments and 8.54% other assets.
The Group expects to contribute P=854.8 million to the defined benefit pension plan in 2020.
The average duration of the defined benefit obligation at the end of the reporting period is3.95 to 24.0 years in 2019 and 4.05 to 26.1 years in 2018.
Shown below is the maturity analysis of the undiscounted benefit payments as of December 31, 2019(amounts in thousands):
2019 2018
Less than 1 year P=1,910,766 P=2,430,702More than 1 year to 5 years 3,945,150 26,453,265More than 5 years 52,658,759 118,301,970
P=58,514,675 P=147,185,937
As of December 31, 2019 and 2018, the plan assets include shares of stock of the Parent Companywith total fair value of P=327.7 million and P=341.1 million, respectively. The Parent Company gives thetrustee bank the discretion to exercise voting rights over the shares.

- 193 -
*SGVFS039491*
The fund includes investment in securities of its related parties. Details of the investment per type ofsecurity are as follows (amounts in thousands):
2019 Historical Cost Fair Value Unrealized Gain
(In Thousands)
Equity securities P=1,038,809 P=1,040,493 P=1,684
Debt securities 1,361,971 1,433,550 71,579
Unit investment trust funds 209,694 211,063 1,369
Others 13,387 13,461 74
P=2,623,861 P=2,698,567 P=74,706
2018 Historical Cost Fair Value
Unrealized Gains
(Losses)
(In Thousands)
Equity securities P=830,611 P=825,021 P=13,752
Debt securities 1,777,777 1,705,619 (24,934)
Unit investment trust funds 112,885 109,830 (3,055)
Others 73,307 74,285 978
P=2,794,580 P=2,714,755 (P=13,259)
The overall expected rate of return on assets is determined based on the market prices prevailing onthat date.
The Group’s transactions with the fund mainly pertain to contributions, benefit payments, settlementsand curtailments.
29. Stock Option Purchase Plans
The Parent Company has stock option plans for key officers (Executive Stock Option Plan - ESOP)and employees (ESOWN) covering 3.0% of the Parent Company’s authorized capital stock. Thegrantee is selected based on certain criteria like outstanding performance over a defined period oftime.
ESOPThe ESOP grantees may exercise in whole or in part the vested allocation in accordance with thevesting percentage and vesting schedule stated in the ESOP. Also, the grantee must be anemployee of the Parent Company or any of its subsidiaries during the 10-year option period. In casethe grantee retires, he/she is given 3 years to exercise his/her vested and unvested options. In casethe grantee resigns, he/she is given 90 days to exercise his/her vested options.
A summary of the Parent Company’s stock option activity and related information for the years endedDecember 31, 2019, 2018 and 2017 follows:
2019 2018 2017
Numberof Shares
WeightedAverage
Exercise PriceNumber
of Shares
WeightedAverage
Exercise PriceNumber
of Shares
WeightedAverage
Exercise Price
Outstanding, at beginning of year 1,024,067 P=287.82 1,032,703 P=287.32 1,201,738 P=295.27Exercised (89,611) 341.61 (8,636) 227.53 (169,035) 343.88
Outstanding, at end of year 934,456 P=282.66 1,024,067 P=287.82 1,032,703 P=287.32
The options have a contractual term of 10 years. As of December 31, 2019 and 2018, the weightedaverage remaining contractual life of options outstanding is 1.64 years and 2.53 years, respectively,and the exercise prices ranged from P=227.50 to P=500.00.

- 194 -
*SGVFS039491*
The fair value of each option is estimated on the date of grant using the Black-Scholes MertonFormula. The fair values of stock options granted under ESOP at each grant date and theassumptions used to determine the fair value of the stock options are as follows:
April 26, 2013 April 18, 2011 April 16, 2010
Weighted average share price P=640.00 P=352.08 P=303.70Exercise price P=500.00 P=264.06 P=227.53Expected volatility 42.40% 41.21% 41.31%Option life 10 years 10 years 10 yearsExpected dividends 0.54% 0.86% 0.92%Risk-free interest rate 3.04% 6.64% 8.56%
The expected volatility reflects the assumption that the historical volatility is indicative of future trends,which may also necessarily be the actual outcome.
ESOWNThe Parent Company also has ESOWN granted to qualified officers wherein grantees may subscribein full to the shares awarded to them based on the average market price determined by the Personneland Compensation Committee as the offer price set at grant date. For any share awardsunsubscribed, grantees still have the option to subscribe from the start of the fifth year but not laterthan on the start of the seventh year from date of grant.
To subscribe, the grantee must be an employee of the Parent Company or any of its subsidiariesduring the 10-year payment period. In case the grantee resigns, the unsubscribed shares arecancelled, while the subscription may be paid up to the percent of holding period completed andpayments may be converted into the equivalent number of shares. In case the grantee is separated,not for cause, but through retrenchment and redundancy, subscribed shares may be paid in full,unsubscribed shares may be subscribed, and payments may be converted into the equivalentnumber of shares. In case the grantee retires, the grantee may continue to subscribe to theunsubscribed shares anytime within the 10-year period. The plan does not allow sale or assignmentof the shares. All shares acquired through the plan are subject to the Parent Company’s Right toRepurchase.
In 2015, the Parent Company introduced a revised ESOWN plan wherein grantees are givenone (1) month from the time an allocation is awarded to subscribe in full, with any unsubscribedawards forfeited.
ESOWN grants totaling 515,904, 492,875 and 456,286 were subscribed in 2019, 2018 and 2017,respectively. Movements in the number of options outstanding under ESOWN as of December 31,2019, 2018 and 2017 follow:
2019 2018 2017
Number ofoptions
Weighted
averageexercise price
Number ofshares
Weighted
averageexercise price
Number ofshares
Weighted
averageexercise price
At January 1 P=− − P=− − P=−Granted 767,942 883.83 494,683 926.00 458,120 837.53Subscribed (515,904) (883.83) (492,875) (926.00) (456,286) (837.53)Expired (252,038) 883.83 (1,808) (926.00) (1,834) (837.53)
At December 31 − P=− − P=− − P=−
The ESOWN grants are effectively treated as options on shares exercisable within a given period,considering both the subscription period allowed to grantees and the subscription payment pattern.As such, the fair values of these options are estimated on the date of grant using the Black-ScholesMerton Formula and Binomial Tree Model, taking into account the terms and conditions upon whichthe options were granted. These models require six inputs to produce the stock option value, whichare namely: share price, exercise price, time to maturity, volatility rate, dividend yield, and risk-freerate.

- 195 -
*SGVFS039491*
The fair value of stock options granted under ESOWN at grant date and the assumptions used todetermine the fair value of the stock options follow:
April 26,2019
April 20, 2018
April 18,2017
December 16,2016
December 23,2015
April 11,2014
Number of unsubscribedshares – – – – – 8,344
Fair value of each option P=263.51 P=256.30 P=222.49 P=176.82 P=444.59 P=619.00Share price P=895.00 P=919.00 P=859.00 P=732.00 P=718.88 P=673.96Exercise price P=883.83 P=926.00 P=837.53 P=717.30 P=611.05 P=480.00Expected volatility 29.17% 30.28% 29.55% 30.31% 38.23% 42.13%
Dividend yield 0.78% 0.75% 0.61% 0.70% 0.67% 0.74%Interest rate 5.64% 3.68% 2.89% 1.46% 4.81% 4.38%
In 2019 and 2018, the Parent Company recognized P=135.9 million and P=126.3 million as share-basedpayments expense, respectively.
In 2017, the Parent Company recognized an adjustment of P=166.7 million reduction in the ESOWNcosts of share-based payments following the revised valuation methodology.
Subscriptions receivable from the stock option plans covering the Parent Company’s shares arepresented under equity.
ALIALI has stock option plans for key officers and employees covering 2.5% of ALI’s authorized capitalstock. The grantee is selected based on certain criteria like outstanding performance over a three-year period.
ESOPThe ESOP grantees may exercise in whole or in part the vested allocation in accordance with thevesting percentage and vesting schedule stated in the ESOP. Also, the grantee must be anemployee of ALI or any of its subsidiaries during the 10-year option period. In case the granteeretires, he is given 3 years to exercise his vested and unvested options. In case the grantee resigns,he is given 90 days to exercise his vested options.
ALI has no ESOP grant and availment during 2019, 2018 and 2017.
ESOWNIn November 2001, ALI offered all its ESOWN subscribers with outstanding ESOWN subscriptionsthe option to cancel the subscriptions within the 5-year holding period. In December 2001, theprogram for ESOWN was indefinitely suspended.
In 2005, ALI introduced a revised ESOWN Plan (the Plan) wherein grantees may subscribe in wholeor in part to the shares awarded to them based on a discounted market price that was determined bythe Compensation Committee of ALI as the offer price set at grant date. The grantees paid for theshares subscribed through installments over a maximum period of ten (10) years. The subscription issubject to a holding period stated in the plan. To subscribe, the grantee must be an employee of ALIor any of its subsidiaries during the ten (10)-year payment period. In case the grantee resigns,unsubscribed shares are cancelled, while the subscription may be paid up to the percent of holdingperiod completed and payments may be converted into the equivalent number of shares. In case thegrantee is separated, not for cause, but through retrenchment and redundancy, subscribed sharesmay be paid in full, unsubscribed shares may be subscribed, or payments may be converted into theequivalent number of shares. In case the grantee retires, the grantee may subscribe to theunsubscribed shares anytime within the ten (10)-year period. The plan does not allow sale orassignment of the shares. All shares acquired through the Plan are subject to ALI’s right torepurchase.

- 196 -
*SGVFS039491*
The subscribed shares are effectively treated as options exercisable within a given period which isthe same time as the grantee’s payment schedule. The fair values of stock options granted areestimated on the date of grant using the Black-Scholes Merton (BSM) Formula and Binomial TreeModel (BTM), taking into account the terms and conditions upon which the options were granted.The BSM Formula and BTM Model requires six inputs to produce an option stock value namely;market value of the share, book value of the share, time to maturity, volatility rate, dividend yield, andrisk free rate. The expected volatility was determined based on an independent valuation.
In 2019, the BOD of ALI approved the stock option program pursuant to their ESOWN. The programauthorizes the grant to qualified executives, in accordance with the terms of the ESOWN, stockoptions covering up to a total of 14,430,750 common shares at a subscription price of P=44.49 pershare, which is the average price of ALI common shares at the Philippine Stock Exchange over thelast 30-day trading as of February 26, 2019.
On April 30, 2019, 152 grantees of stock options under ESOWN subscribed to 10,073,389 commonshares at P=44.49 per share and became effective on the same day. As a result of the subscription ofthese grantees, ALI’s outstanding common shares increased to 14,734,581,724.
Movements in the number of options outstanding and weighted average exercise prices (WAEP)under ESOWN follow:
2019 WAEP 2018 WAEP 2017 WAEP
At January 1 5,601,470 P=32.71 5,150,628 P=19.31 7,288,035 P=19.95Granted 11,610,720 10,384,365 − 11,420,517 −Subscribed (10,453,766) 43.70 (9,933,523) 41.14 (12,264,970) 33.32Availment 487,585 96,516 − 113,541 −Cancelled (6,940,594) (96,516) − (1,406,495) −At December 31 304,415 P=35.94 5,601,470 P=32.71 5,150,628 P=19.31
The fair value of stock options granted under ESOWN at grant date and the assumptions used todetermine the fair value of the stock options follow:
Grant Date
March 21,2019
March 28,2018
March 01, 2017
April 05, 2016
March 20,2015
March 20,2014
March 18,2013
March 13,2012
Number of unsubscribedshares − − − 181,304 − 1,369,887 1,713,868 3,967,302
Fair value of each option(BTM) P=− P=− P=8.48 P=13.61 P=16.03 P=12.60 P=16.05 P=9.48
Fair value of each option(BSM) P=17.13 P=12.71 P=− P=18.21 P=20.63 P=12.16 P=11.85 P=6.23
Weighted average share price P=44.70 P=41.02 P=39.72 P=35.58 P=36.53 P=31.46 P=30.00 P=21.98Exercise price P=44.49 P=45.07 P=35.81 P=26.27 P=29.58 P=22.55 P=21.45 P=14.69Expected volatility 31.48% 34.04% 30.95% 32.03% 31.99% 33.50% 36.25% 33.00%Dividend yield 1.16% 1.22% 1.34% 1.27% 1.02% 1.42% 1.93% 0.9%Interest rate 5.57% 4.14% 4.41% 4.75% 4.11% 3.13% 2.78% 5.70%
Total expense (included under “General and administrative expenses”) recognized in 2019, 2018 and2017 in the consolidated statement of income arising from share–based payments of ALI amountedto P=142.86 million, P=98.5 million and P=153.8 million, respectively.
IMIIMI Group has an ESOWN, which is a privilege extended to IMI Group’s eligible managers and staffwhereby IMI Group allocates up to 10% of its authorized capital stock for subscription by saidpersonnel under certain terms and conditions stipulated in the ESOWN.

- 197 -
*SGVFS039491*
The key features of the plan are as follows:
· The subscription price per share shall be based on the average closing price at the PSE for 20consecutive trading days with a discount to be determined by the Compensation Committee ofIMI.
· Term of payment is eight years reckoned from the date of subscription with specified percentageof payment (i.e., 2.5% initial payment, 5.0% on 1st anniversary, 7.5% on 2nd anniversary, 10%on 3rd anniversary and balance over remaining years).
· Holding period: 40%, 30% and 30% after one (1), two (2) and three (3) years from subscriptondate, respectively.
Movements in the number of shares outstanding under ESOWN in 2019, 2018 and 2017 follow:
2019 2018 2017
Number ofShares
WeightedAverage
ExercisePrice
Number ofShares
WeightedAverage
ExercisePrice
Number ofShares
WeightedAverage
ExercisePrice
At beginning of year P=139,364,849 P=6.65 140,406,496 P=6.67 141,565,253 P=6.69Forfeitures (1,672,663) 9.39 (1,041,647) 9.40 (1,158,757) 8.66
At end of year P=137,692,186 P=6.65 P=139,364,849 P=6.65 P=140,406,496 P=6.67
Total expense arising from share-based payments of IMI (included under “General and administrativeexpenses”) in the consolidated statements of income amounted to nil, US$0.3 million (P=15.8 million),and US$0.26 million (P=13.0 million) in 2019, 2018 and 2017, respectively.
MWCExecutive Stock Option Plan (Executive SOP), Expanded Executive SOP and ESOWNThe subscribed shares are effectively treated as options exercisable within a given period which isthe same time as the grantee’s payment schedule.
For the unsubscribed shares of the ESOWN grants in 2013 and 2012, the employee still has theoption to subscribe within seven (7) years.
On March 6, 2018, the Remuneration Committee of MWC’s BOD approved the grants of ESOWNequivalent to 16,054,873 shares at the subscription price of P=27.31 per share. The subscription priceis equivalent to the average closing price of MWC’s common shares at the PSE for twenty (20)consecutive trading days ending March 6, 2018.
The fair values of stock options granted are estimated on the date of grant using the Binomial TreeModel and Black–Scholes Merton Formula, txaking into account the terms and conditions upon whichthe options were granted. The expected volatility was determined based on an independentvaluation.
The fair value of stock options granted under ESOWN at grant date and the assumptions used todetermine the fair value of the stock options follow:
Grant Dates
March 7, 2018February 10,
2015November 19,
2013 October 5, 2012
Number of shares granted 16,054,873 7,281,647 6,627,100 4,772,414Number of unsubscribed shares 5,161,140 884,873 351,680 460,000Fair value of each option P=5.74 P=11.58 P=10.58 P=11.76Weighted average share price P=26.55 P=21.35 P=23.00 P=26.24Exercise price P=27.31 P=26.00 P=22.92 P=24.07Expected volatility 24.92% 26.53% 24.90% 30.66%Dividend yield 2.80% 2.55% 3.47% 2.56%Risk-free interest rate 3.43% 3.79% 2.99% 4.57%Expected life of option 45 days 4 years 4 years 4 years

- 198 -
*SGVFS039491*
To enjoy the rights provided for in the ESOWN, the grantee should be with MWC at the time theholding period expires. The Holding Period of the ESOWN shares follows: 40%, 30% and 30% fromone year, two years and three years from subscription date, respectively.
For the 2013 and previous years’ grants, the ESOWN grantees were allowed to subscribe fully orpartially to whatever allocation may have been granted to them. In case of partial subscriptions, theemployees are still allowed to subscribe to the remaining unsubscribed shares granted to themprovided that this would be made at the start of Year 5 from grant date up to the end of Year 6. Anyadditional subscription made by the employee (after the initial subscription) will be subjected toanother three (3)-year holding period. For the 2018 and 2015 grants, unsubscribed shares wereforfeited.
Movements in the number of stock options outstanding under ESOWN are as follows:
2019
Weightedaverageexercise
price 2018
Weighted averageexercise
price
At January 1 131,600 P=23.49 231,980 P=23.49Cancelled (131,600) – (100,380) −At December 31 P=– P=23.49 131,600 P=23.49
Total expense arising from equity-settled share-based payment transactions of MWC (included under“General and administrative expenses”) in the consolidated statements of income amounted toP=20.2 million, P=24.0 million and P=12.2 million in 2019, 2018 and 2017, respectively.
The expected life of the options is based on management’s estimate and is not necessarily indicativeof exercise patterns that may occur. MWC’s expected volatility was used as an input in the valuationof the outstanding options. The expected volatility reflects the assumption that the historical volatilityis indicative of future trends, which may also not necessarily reflect the actual outcome.
No other features of the options granted were incorporated into the measurement of fair value.
30. Operating Segment Information
For management purposes, the Group is organized into the following business units:
· Parent Company - represents operations of the Parent Company including its financing entitiessuch as ACIFL, AYCFL, PFIL and MHI.
· Real estate and hotels - planning and development of large-scale fully integrated mixed-usedcommunities that become thriving economic centers in their respective regions. These includedevelopment and sale of residential, leisure and commercial lots and the development andleasing of retail and office space and land in these communities; construction and sale ofresidential condominiums and office buildings; development of industrial and business parks;development and sale of high-end, upper middle-income and affordable and economic housing;strategic land bank management; hotel, cinema and theater operations; and construction andproperty management.
· Financial services and insurance - commercial banking operations with expanded bankinglicense. These include diverse services such as deposit taking and cash management (savingsand time deposits in local and foreign currencies, payment services, card products, fundtransfers, international trade settlement and remittances from overseas workers); lending(corporate, consumer, mortgage, leasing and agri-business loans); asset management (portfoliomanagement, unit funds, trust administration and estate planning); securities brokerage (on-line

- 199 -
*SGVFS039491*
stock trading); foreign exchange and capital markets investments (securities dealing); corporateservices (corporate finance, consulting services); investment banking (trust and investmentservices); a fully integrated bancassurance operations (life, non-life, pre-need and reinsuranceservices); and other services (internet banking, foreign exchange and safety deposit facilities).
· Telecommunications (Telecoms) – provider of digital wireless communications services using afully digital network; domestic and international long distance communication services or carrierservices; broadband internet and wireline voice and data communication services; also licensedto establish, install, operate and maintain a nationwide local exchange carrier (LEC) service,particularly integrated local telephone service with public payphone facilities and public callingstations, and to render and provide international and domestic carrier and leased line services. Inrecent years, operations include developing, designing, administering, managing and operatingsoftware applications and systems, including systems designed for the operations of bill paymentand money remittance, payment facilities through various telecommunications systems operatedby telecommunications carriers in the Philippines and throughout the world and to supplysoftware and hardware facilities for such purposes.
· Water infrastructure – contractor to manage, operate, repair, decommission, and refurbish allfixed and movable assets (except certain retained assets) required to provide water delivery,sewerage and sanitation, distribution services, pipeworks, used water management andmanagement services. In 2016, a new business initiative was undertaken where the group willexclusively provide water and used water services and facilities to all property developmentprojects of major real estate companies.
In 2019, investment in MWC was reclassified to “Assets and liabilities and operations of segmentunder PFRS 5” (see Note 25).
· Electronics manufacturing – global provider of electronics manufacturing services (EMS) andpower semiconductor assembly and test services with manufacturing facilities in Asia, Europe,and North America. It serves diversified markets that include those in the automotive, industrial,medical, telecommunications infrastructure, storage device, and consumer electronics industries.Committed to cost-development to manufacturing and order fulfillment), the company'scomprehensive capabilities and global manufacturing presence allow it to take on specificoutsourcing needs.
· Power generation – unit that will build a portfolio of power generation assets using renewable andconventional technologies which in turn will operate business of generating, transmission ofelectricity, distribution of electricity and supply of electricity, including the provision of relatedservices.
· Automotive, Outsourcing and Others – includes operations of Automotive unit’s business onmanufacturing, distribution and sale and providing repairs and services for passenger cars andcommercial vehicles. In 2016, this unit launched initiatives to include industrial manufacturingactivity for long-term synergy and integration with automotive business. This segment alsoincludes outsourcing services unit (venture capital for technology businesses and emergingmarkets; onshore and offshore outsourcing services in the research, analytics, legal, electronicdiscovery, document management, finance and accounting, full-service creative and marketing,human capital management solutions, and full-service accounting); International unit (investmentsin overseas property companies and projects); Aviation (air-chartered services); consultancy,agri-business and other operating companies. This business segment group also includes thecompanies for Infrastructure (development arm for various types of infrastructure); education,human capital resource management and health services.

- 200 -
*SGVFS039491*
Management monitors the operating results of its business units separately for the purpose of makingdecisions about resource allocation and performance assessment. Segment performance isevaluated based on operating profit or loss and is measured consistently with operating profit or lossin the consolidated financial statements.
For the years ended December 31, 2019, 2018 and 2017, there were no revenue transactions with asingle external customer which accounted for 10% or more of the consolidated revenue from externalcustomers.
Intersegment transfers or transactions are entered into under the normal commercial terms andconditions that would also be available to unrelated third parties. Segment revenue, segmentexpense and segment results include transfers between operating segments. Those transfers areeliminated in consolidation.

- 201 -
*SGVFS039491*
The following tables regarding operating segments present assets and liabilities as of December 31, 2019 and 2018 and revenue and income information foreach of the three years in the period ended December 31, 2019 (amounts in millions):
2019
ParentCompany
Real Estateand Hotels
FinancialServices and
Insurance TelecomsElectronics
Manufacturing Power GenerationAutomotive and
Others
IntersegmentEliminations
and Others Consolidated
Revenue
Sales to external customers P=279 P=157,474 P=− P=− P=63,651 P=12,665 P=30,838 P=− P=264,907
Intersegment 155 375 − − 103 849 159 (1,641) −Share in net profits of associates and
joint ventures − 956 13,567 6,766 − 1,130 (75) − 22,344
Interest income − 7,891 − − − − − − 7,891
Dividend income 59 − − − − 64 − − 123
493 166,696 13,567 6,766 63,754 14,708 30,922 (1,641) 295,265
Costs and expenses
Costs of sales and services − 94,752 − − 58,530 11,441 26,188 (928) 189,983
General and administrative 4,097 9,518 − − 5,425 4,045 9,043 (15) 32,113
4,097 104,270 − − 63,955 15,486 35,231 (943) 222,096
Other income (charges)
Interest income 742 930 − − 52 1,564 70 (6) 3,352
Other income 1,792 1,186 − − 425 27,404 2,090 (608) 32,289
Interest and other financing charges (5,594) (13,694) − − (675) (2,267) (611) 432 (22,409)
Other charges − − − − − − − − −(3,060) (11,578) − − (198) 26,701 1,549 (182) 13,232
Net income (loss) before income tax (6,664) 50,848 13,567 6,766 (399) 25,923 (2,761) (881) 86,399Provision for (benefit from)
income tax 105 13,313 − − 100 566 (5) (95) 13,984
(6,769) 37,535 13,567 6,766 (499) 25,357 (2,756) (786) 72,415
Operations of the segment under PFRS 5 − − − − − − − (30,433) (30,433)
Net income (loss) (P=6,769) P=37,535 P=13,567 P=6,766 (P=499) P=25,357 (P=2,756) (P=31,219) P=41,982
Other information
Segment assets P=69,273 P=677,107 P=− P=− P=55,330 P=105,166 P=43,140 (P=36,175) P=913,841
Investments in associates and joint ventures 186,117 25,294 − − − 21,089 14,231 − 246,731
Deferred tax assets 83 11,528 − − 267 901 1,056 412 14,247
Assets under PFRS 5 − − − − − − 60,705 109,762 170,467
Total assets P=255,473 P=713,929 P=− P=− P=55,597 P=127,156 P=119,132 P=73,999 P=1,345,286
Segment liabilities P=149,684 P=465,090 P=− P=− P=30,922 P=77,621 P=19,961 (P=36,829) P=706,449
Deferred tax liabilities 82 6,091 − − 179 820 864 − 8,036
Liabilities under PFRS 5 − − − − − − 42,885 78,602 121,487
Total liabilities P=149,766 P=471,181 P=− P=− P=31,101 P=78,441 P=63,710 P=41,773 P=835,972
Segment additions to property, plant andequipment and investment properties P=116 P=35,852 P=− P=− P=1,936 P=49,811 P=1,811 (P=39,254) P=50,272
Depreciation and amortization P=270 P=9,281 P=− P=− P=2,567 P=1,503 P=1,258 P=3,762 P=18,641
Non-cash expenses other than depreciation
and amortization (P=100) P=151 P=− P=− P=249 P=450 P=832 P=17 P=1,599
Cash flows provided by (used in):Operating activities P=7,444 P=42,452 P=− P=− P=2,977 P=2,004 P=541 (P=29,300) P=26,118
Investing activities (P=6,887) (P=49,061) P=− P=− (P=3,014) (P=4,271) (P=17,219) P=30,405 (P=50,047)
Financing activities P=8,065 P=3,025 P=− P=− P=2,060 P=35,814 P=18,742 (P=2,037) P=65,669

- 202 -
*SGVFS039491*
2018 (as restated)
Parent
Company
Real Estate
and Hotels
FinancialServices and
Insurance Telecoms
Electronics
Manufacturing Power Generation
Automotive
and Others
Intersegment
Eliminations Consolidated
Revenue
Sales to external customers P=243 P=155,892 P=– P=– P=69,731 P=3,778 P=27,247 P=– P=256,891Intersegment 174 63 – – − 695 413 (1,345) −Share in net profits of associates and
joint ventures 51 740 10,906 5,646 − 2,730 (313) – 19,760
Interest income – 7,042 – – – – – – 7,042Dividend income 59 – – – − 21 27 – 107
527 163,737 10,906 5,646 69,731 7,224 27,374 (1,345) 283,800
Costs and expenses
Costs of sales and services – 100,879 – – 62,617 3,627 23,773 (1,189) 189,707General and administrative 3,940 9,367 – – 5,416 1,623 6,848 (1,237) 25,957
3,940 110,246 – – 68,033 5,250 30,621 (2,426) 215,664
Other income (charges)
Interest income 455 958 – – 53 769 58 − 2,293Other income 939 1,541 – – 1,861 2,802 3,054 (998) 9,199Interest and other financing charges (5,226) (10,799) – – (672) (397) (308) 23 (17,379)
Other charges – – – – – – – – −(3,832) (8,300) – – 1,242 3,174 2,804 (975) (5,887)
Net income (loss) before income tax (7,245) 45,191 10,906 5,646 2,940 5,148 (440) 106 62,252
Provision for (benefit from)income tax 53 11,984 – – 353 863 98 17 13,368
(7,298) 33,207 10,906 5,646 2,587 4,285 (538) 89 48,884
Operations of segment under PFRS 5 − − − − − − − 6,181 6,181
Net income (loss) (P=7,298) P=33,207 P=10,906 P=5,646 P=2,587 P=4,285 (P=538) P=6,270 P=55,065
Other information
Segment assets P=46,267 P=632,398 P=– P=– P=56,109 P=73,485 P=31,601 P=92,216 P=932,076Investments in associates and
joint ventures 168,203 23,376 – – − 25,252 7,315 15,995 240,141Deferred tax assets 80 13,041 – – 166 41 387 1,831 15,546Assets under PFRS 5 − − − − − 5,635 4,527 − 10,162
Total assets P=214,550 P=668,815 P=– P=– P=56,275 P=104,413 P=43,830 P=110,042 P=1,197,925
Segment liabilities P=140,318 P=442,705 P=– P=– P=34,705 P=49,908 P=10,444 P=38,663 P=716,743Deferred tax liabilities 80 5,895 – – 207 757 172 3,888 10,999Liabilities under PFRS 5 − − − − − − 1,075 − 1,075
Total liabilities P=140,398 P=448,600 P=– P=– P=34,912 P=50,665 P=11,691 42,551 P=728,817
Segment additions to property, plant andequipment and investment properties P=189 P=123,364 P=– P=– P=− P=− P=1,521 (P=73,781) P=51,293
Depreciation and amortization P=304 7,446 P=– P=– P=2,311 P=394 P=319 P=2,787 P=13,561
Non-cash expenses other than depreciationand amortization P=− P=66 P=– P=– P=499 P=20 P=153 P=327 P=1,065
Cash flows provided by (used in):Operating activities (P=5,811) P=11,767 P=– P=– (P=701) (P=5,034) (P=795) P=44,520 P=43,946
Investing activities P=15,296 (P=2,978) P=– P=– (P=4,373) (P=23,925) (P=8,233) (P=83,779) (P=107,992)Financing activities (P=164) (P=6,264) P=– P=– P=6,026 P=23,674 P=10,585 P=26,553 P=60,410

- 203 -
*SGVFS039491*
2017 (as restated)
Parent
Company
Real Estate
and Hotels
FinancialServices and
Insurance Telecoms
Electronics
Manufacturing Power Generation
Automotive
and Others
Intersegment
Eliminations Consolidated
Revenue
Sales to external customers P=254 P=133,161 P=– P=– P= 55,029 P=2,155 P=34,969 P=– P=225,568Intersegment 266 (63) – – – 262 845 (1,310) −Share in net profits of associates and
joint ventures – 861 10,772 4,559 – 1,778 67 – 18,037
Interest income – 5,410 – – – – – – 5,410Dividend income 61 2 – – – 390 201 – 654
581 139,371 10,772 4,559 55,029 4,585 36,083 (1,310) 249,669
Costs and expenses
Costs of sales and services 26 87,921 – – 48,405 1,563 31,885 (1,129) 168,671General and administrative 3,255 7,315 – – 4,618 1,313 5,360 (217) 21,644
3,281 95,236 – – 53,023 2,876 37,245 (1,346) 190,315
Other income (charges)
Interest income 449 578 – – 6 81 39 (106) 1,047Other income 1,055 2,344 – – 437 2,050 2,466 (556) 7,796Interest and other financing charges (3,838) (9,070) – – (345) (305) (205) 682 (13,081)
Other charges – – – – – – – – −(2,334) (6,148) – – 98 1,826 2,300 20 (4,238)
Net income (loss) before income tax (5,034) 37,987 10,772 4,559 2,104 3,535 1,137 56 55,116Provision for (benefit from)
income tax 169 9,825 – – 376 (56) 281 (16) 10,579
(P=5,203) P=28,162 P=10,772 P=4,559 P=1,728 P=3,591 P=856 P=72 P=44,537
Operations of segment under PFRS 5 5,330 5,330
Net income (loss) (P=5,203) P=28,162 P=10,772 P=4,559 P=1,728 P=3,591 P=856 P=5,402 P=49,867
Other information
Segment assets P=47,213 P=536,543 P=– P=– P=45,906 P=54,506 P=32,857 P=89,151 P=806,176Investments in associates and
joint ventures 139,054 26,796 – – – 24,562 3,974 8,263 202,649
Deferred tax assets 98 10,649 – – 60 116 176 1,622 12,721
Total assets P=186,365 P=573,988 P=– P=– P=45,966 P=79,184 P=37,007 P=99,054 P=1,021,546
Segment liabilities P=112,443 P=378,185 P=– P=– P=31,982 P=36,021 P=13,050 P=30,664 P=602,345Deferred tax liabilities 102 3,544 – – 127 170 105 4,060 8,108
Total liabilities P=112,545 P=381,729 P=– P=– P=32,109 P=36,191 P=13,155 P=34,724 P=610,453
Segment additions to property, plant andequipment and investment properties P=164 P=30,676 P=– P=– P=3,089 P=14,088 P=3,178 P=7,353 P=58,548
Depreciation and amortization P=324 P=6,420 P=– P=– P=1,443 P=323 P=498 P=3,290 P=12,298Non-cash expenses other than depreciation
and amortization P=207 P=612 P=– P=– P=24 P=54 P=271 P=634 P=1,802
Cash flows provided by (used in):
Operating activities (P=5,097) P=25,641 P=– P=– (P=140) (P=5,034) (P=795) P=9,460 P=24,035Investing activities P=7,951 (P=35,372) P=– P=– (P=4,737) (P=23,925) (P=8,233) P=1,996 (P=62,320)Financing activities (P=164) P=9,801 P=– P=– P=4,986 P=23,674 P=10,585 (P=6,561) P=42,321
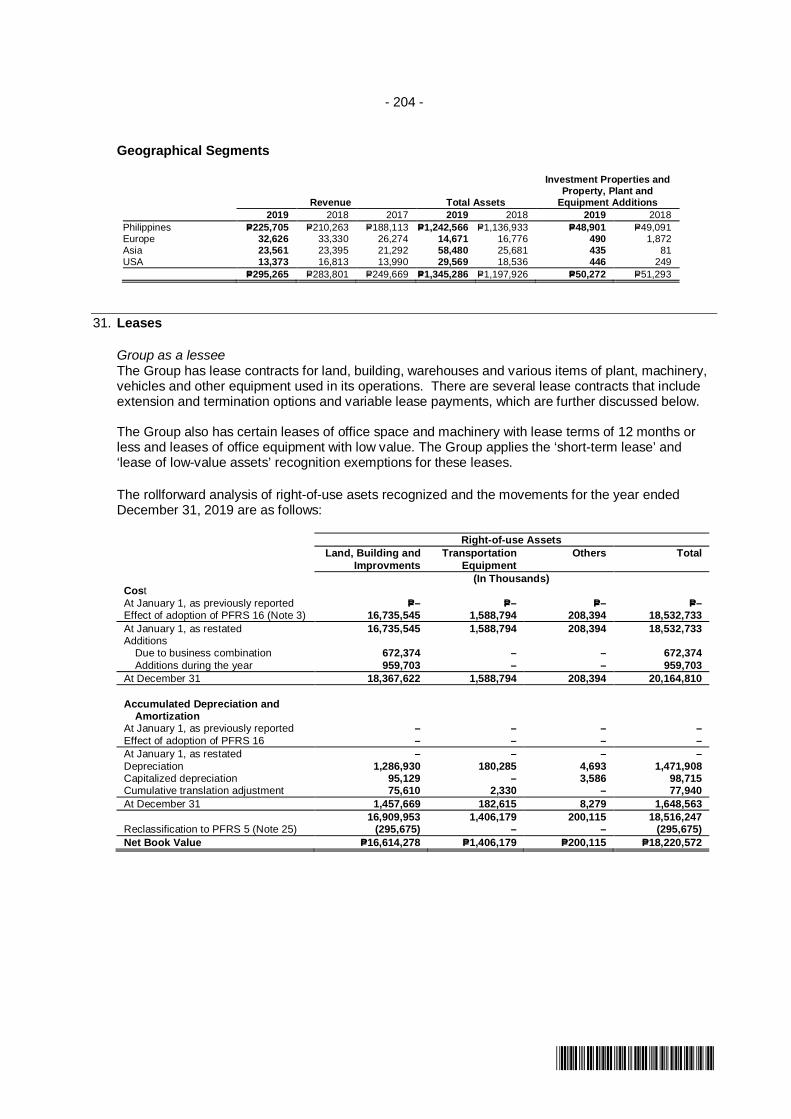
- 204 -
*SGVFS039491*
Geographical Segments
Revenue Total Assets
Investment Properties andProperty, Plant and
Equipment Additions
2019 2018 2017 2019 2018 2019 2018
Philippines P=225,705 P=210,263 P=188,113 P=1,242,566 P=1,136,933 P=48,901 P=49,091Europe 32,626 33,330 26,274 14,671 16,776 490 1,872Asia 23,561 23,395 21,292 58,480 25,681 435 81USA 13,373 16,813 13,990 29,569 18,536 446 249
P=295,265 P=283,801 P=249,669 P=1,345,286 P=1,197,926 P=50,272 P=51,293
31. Leases
Group as a lesseeThe Group has lease contracts for land, building, warehouses and various items of plant, machinery,vehicles and other equipment used in its operations. There are several lease contracts that includeextension and termination options and variable lease payments, which are further discussed below.
The Group also has certain leases of office space and machinery with lease terms of 12 months orless and leases of office equipment with low value. The Group applies the ‘short-term lease’ and‘lease of low-value assets’ recognition exemptions for these leases.
The rollforward analysis of right-of-use asets recognized and the movements for the year endedDecember 31, 2019 are as follows:
Right-of-use Assets
Land, Building and
Improvments
Transportation
Equipment
Others Total
(In Thousands)Cost
At January 1, as previously reported P=– P=– P=– P=–Effect of adoption of PFRS 16 (Note 3) 16,735,545 1,588,794 208,394 18,532,733
At January 1, as restated 16,735,545 1,588,794 208,394 18,532,733Additions
Due to business combination 672,374 – – 672,374
Additions during the year 959,703 – – 959,703
At December 31 18,367,622 1,588,794 208,394 20,164,810
Accumulated Depreciation andAmortization
At January 1, as previously reported – – – –
Effect of adoption of PFRS 16 – – – –
At January 1, as restated – – – –
Depreciation 1,286,930 180,285 4,693 1,471,908Capitalized depreciation 95,129 – 3,586 98,715Cumulative translation adjustment 75,610 2,330 – 77,940
At December 31 1,457,669 182,615 8,279 1,648,563
16,909,953 1,406,179 200,115 18,516,247Reclassification to PFRS 5 (Note 25) (295,675) – – (295,675)
Net Book Value P=16,614,278 P=1,406,179 P=200,115 P=18,220,572

- 205 -
*SGVFS039491*
The rollforward analysis of lease liabilities follows (in thousands):
2019
At January 1, as previously reported P=–Effect of adoption of PFRS 16 (Note 3) 21,564,084
At January 1, 2019, as restated 21,564,084Additions 1,711,468Accretion of interest expense 1,231,380Capitalized interest 388,242Payments (2,051,769)Foreign exchange gain (48,776)Cumulative translation adjustment (98,749)Disposals (6,232)
22,689,648Reclassification to PFRS 5 (Note 25) (308,482)
As at December 31 22,381,166Current lease liabilities (1,028,067)
Noncurrent lease liabilities P=21,353,099
The following are the amounts recognized in the consolidated statement of income (in thousands):
2019
Depreciation expense of right-of-use assets P=1,471,908Interest expense on lease liabilities 1,231,380Expense relating to short-term leases 401,745Expense relating to leases of low-value assets 1,013Variable lease payments 438,431
P=3,544,477
The Group had a total cash outflows for leases of P=2,051.77 million in 2019. The Group also hadnon-cash additions to right-of-use assets and lease liabilities of P=1,632.08 million and P=1,711.47million, respectively.
Shown below is the maturity analysis of the undiscounted lease payments (in thousands):
2019
Within one year P=1,635,474After one year but no more than five years 6,155,314More than five years 57,540,360
The significant leases entered into by the Group are as follow:
Parent CompanyOn December 15, 2014, Mermac, Inc. (the Lessor) and the Parent Company entered into a Contractof Lease. The Lessor leases, lets, and demises unto the Parent Company, an office spaceconstituting the Leased Premises, located at the 35th Floor, Tower One and Exchange Plaza, AyalaTriangle, Ayala Avenue, Makati City. The term of the lease shall be five (5) years, commencing onNovember 15, 2014 and ending on November 14, 2019. The lease is subject to annual escalationclause of 5% for the first 2 years and 10% for the next 2 years.
In 2019, the contract of lease was renewed with lease term of one year commencing onNovember 15, 2019.
ALI GroupALI Group entered into lease agreements with third parties covering real estate properties. Theseleases generally provide for either (a) fixed monthly rent, or (b) minimum rent or a certain percentageof gross revenue, whichever is higher.

- 206 -
*SGVFS039491*
ALI Group has lease contracts for land that contains variable payments based on certain percentageof gross rental income of the commercial centers. These terms are negotiated by management forcertain commercial spaces without steady customer demand. Mangement’s objective is to align thelease expense with the revenue earned. The following provides information on the ALI Group’svariable lease payments, including the magnitude in relation to fixed payments (in thousands):
Fixed PaymentsVariable
Payments Total
Fixed P=1,098,425 P=– P=1,098,425Variable rent with minimum
payment 151,221 159,229 310,450Variable rent only – 170,895 170,895
At December 31 P=1,249,646 P=330,124 P=1,579,770
ALIOn January 2017, ALI signed a Lease Agreement with Philippine Racing Club, Inc. for the lease ofland located in Circuit Makati, Brgy. Carmona, Makati City with an aggregate area of 12,793 sqm.The term of the lease shall be twenty-three (23) years and three (3) months commencing fromDelivery Date. The Lessee shall have the option to renew the lease under the same terms andconditions for another period of five years, provided that renewal period shall be mutually agreed bythe Parties. For the period commencing from delivery date until sixty-three (63) months thereafter,the Lessee shall pay the Lessor the rent amounting to P=100.00 million. Commencing on the sixtyfourth month from execution of the contract until the end of the lease term, the Lessee shall pay theLessor the rent equal to fifty percent (50%) of the Gross Income of the Lessee.
On September 2018, the ALI signed a Lease Agreement with Manila Seedling Bank Foundation, Inc.(MSBFI) for the lease of a 4.5-hectare portion of land located at the corner of EDSA and QuezonAvenue, Diliman, Quezon City. The term of the lease shall be coterminous with the Lessor’s usufructover the Leased Premises, or until September 20, 2027.
Bay CityOn September 2, 2014, ALI signed a Lease Agreement with D.M. Wenceslao & Associates Inc. forthe lease of several parcels of land along Asean Avenue and Macapagal Boulevard, Aseana City,Paranaque City with an aggregate area of 92,317 sqm. ALI signed a 45-year lease contract with anoption to renew for another 45 years subject to such terms and conditions as may be mutually agreedupon by the lessor and ALI.
ALI also signed the Air Rights and Basement Rights over the leased property with an aggregate areaof 1,686.48 sqm and 8,294 sqm, respectively, subject to the same terms and conditions as thecontract of lease dated September 2, 2014.
Ayalaland MetroNorth, Inc. (AMNI)On January 28, 2011, the Board of Regents of the University of the Philippines awarded to AMNI theP=4.0 billion development of a 7.4-hectare lot at the University of the Philippines’ Diliman EastCampus, also known as the UP Integrated School, along Katipunan Avenue, Quezon City. AMNIsigned a 25-year lease contract for the property last June 22, 2011, with an option to renew foranother 25 years subject to mutual agreement of the parties. The lease payments shall commenceas soon as sales are registered by the merchants.
A retail establishment with about 63,000 sqm of gross leasable area and an office/BPO building about8,000 sqm of gross leasable area shall be constructed on the property.
NTDCCThe Company entered into an assignment agreement with MRTDC wherein the latter has assignedits development rights to the Company in exchange for the Company's assumption of DRP obligationbeginning January 1, 2006. The DRP obligation is payable annually for 42 years from the date ofassumption, renewable upon expiration with escalation rate of 3% annually starting inception.

- 207 -
*SGVFS039491*
On October 29, 2015, the Company entered into a non-cancellable land lease agreement with GERIfor the lease of an aggregate of 10,994.86 square meters undivided portions of the North Avenue LotPad A and North Avenue Lot Pad B to which the latter is entitled to development rights. Theagreement shall be effective until August 8, 2047, subject to the extension of the development rightsperiod.
During 2016, the Company entered into non-cancellable land lease agreement with Anglo, DBH andAllante which shall be effective until August 8, 2047.
ALICAPIn December 2017, the ALICAP entered into 120-month lease agreement with NAC Aviation for abrand new ATR72-600 with MSN 1440 which will commence at the date of delivery. Commitment feeor refundable deposit required for the lease amounted to US$0.42 million. The ATR72-600 with MSN1440 was delivered to ALICAP in February 2018 and has started flight operations in March 2018.ALICAP, per lease contract, has the option to purchase the ATR72-600 with MSN 1440 at the end oflease term for US$14.16 million.
In June 2018, ALICAP entered into another 120-month lease agreement with NAC Aviation for abrand new ATR72-600 with MSN 1492 which will commence at the date of delivery. Commitment feeor refundable deposit required for the lease amounted to US$0.42 million. The ATR72-600 with MSN1492 was delivered to ALICAP on the same month and has started flight operations in August 2018.ALICAP, per lease contract, has the option to purchase the ATR72-600 with MSN 1440 at the end oflease term amounting to US$14.16 million.
AHRCOn January 30, 2018, the AHRC signed a Lease Agreement with Dunes & Eagle Land DevelopmentCorporation for the lease of ten parcels of land located at Barangay Mactan, Lapu-Lapu City, MactanIsland, Cebu with an aggregate area of 3,220 sqm. The term of the lease shall be for a period of fifty(50) years commencing from the date of execution of the agreement. Rent payment should be asfollows: (a) P=70 million per annum for the first 5 years (b) 5% of Gross Revenues or P=70 million perannum whichever is higher for the 6th year to the 30th year, and (c) 5.5%of Gross Revenues orP=70 million per annum whichever is higher for the 31st year to the 50th year.
On July 26, 2012, ALI entered into a renewable contract of lease with Province of Negros Occidentalfor 40,481 square meters area of land with a monthly lease of P=73.00 per square meter which shallbe escalated every five years by ten percent (10%) of the current rate of rent. The term of the leaseshall be for a period of fifty (50) years commencing from the date of delivery subject to renewal bymutual agreement of the parties under such terms and conditions as may be mutually acceptable.AHRC has assessed that the lease agreement is a non-cancellable lease. On December 23, 2014,ALI assigned its rights and obligations to Capitol Central Hotel Ventures, Inc. under the Contract ofLease Assignment over a portion on which Seda Capitol Central was constructed equivalent to anarea of 3,714.80 square meters. The agreement on lease assignment transfers and conveys theCompany to take over the lease of the assigned portion subject to the same terms and conditionscontained in the contract of lease.
Bonifacio Hotel Ventures, Inc. entered into a non-cancellable and renewable contract of lease withFort Bonifacio Development Corporation for the land on which Seda BGC Tower 1 was constructedwith initial term of twenty-five (25) years commencing from the date that the Hotel first commencesbusiness or start of commercial operation. The lease agreement provides for the payment of rentbased on 3% of the Hotel’s gross income for its 1st year of operation, 4% of the Hotel’s gross incomefor its 2nd year of operation, and 5% of the Hotel’s gross income for the succeeding years orP=350 per square meter for the 1st year, P=375 per square meter for the 2nd year and P=400 per squaremeter for the 3rd year, whichever is higher, and starting on the 4th year of operations, rent shall beescalated at a rate of 3% per year until the end of the lease period. The Company entered intoanother non-cancellable and renewable contract of lease with Fort Bonifacio DevelopmentCorporation for the land on which the Seda BGC Tower 2 was constructed with initial term of twenty-five (25) years commencing from the date that the Hotel first commences business or start of

- 208 -
*SGVFS039491*
commercial operation. The lease agreement provides for the payment of rent based on 3% of theHotel’s gross income for its 1st year of operation, 4% of the Hotel’s gross income for its 2nd year ofoperation, and 5% of the Hotel’s gross income for the succeeding years or P=575 per square meter forthe 1st year, P=616.06 per square meter for the 2nd year and P=657.15 per square meter for the 3rdyear, whichever is higher, and starting on the 4th year of operations, rent shall be escalated at a rateof 3% per year until the end of the lease period.
ALLHCOn August 28, 1990, the Company, through a Deed of Assignment, acquired all the rights, titles,interests and obligations of Gotesco Investment, Inc. in a contract of lease of the land owned by PNRfor the Tutuban Terminal. The contract provided for a payment of a guaranteed minimum annualrental plus a certain percentage of gross sales. The lease covers a period of 25 years until 2014 andis automatically renewable for another 25 years, subject to compliance with the terms and conditionsof the lease agreement. On December 22, 2009, ALLHC entered into an agreement with PNR for therenewal of its lease contract for another 25 years beginning September 5, 2014.
Station Square East Commercial Corporation (SSECC)ALI has an existing contract with Bases Conversion and Development Authority (BCDA) to develop,under a lease agreement signed on July 2000, a mall with an estimated gross leasable area of152,000 sqm on a 9.8-hectare lot inside Fort Bonifacio. Subsequently, ALI transferred its rights andobligations granted to or imposed under the lease agreement to SSECC, a subsidiary, in exchangefor equity. The lease agreement covers 25 years, renewable for another 25 years subject toreappraisal of the lot at market value. The annual fixed lease rental amounts to P=106.5 million whilethe variable rent ranges from 5% to 20% of gross revenues.
CapitolOn April 26, 2012 ALI signed a Lease Agreement with the Province of Negros Occidental for thelease of a parcel of land with an aggregate area of 40,481 sq. m. located along Gatuslao cor. Northand South Capitol Roads, Bacolod City, registered in the name of the Province of Negros Occidental.ALI signed a 50-year lease contract with an option to renew as may be mutually agreed upon by thelessor and the Company. ALI assigned the parcels of land to Capitol in December 2017.
Arvo Commercial Corporation (Arvo)On October 15, 2014, Arvo entered into a property lease agreement with Rotonda DevelopmentCorporation for the construction, development and operation of a commercial and mall center. Theterms of the lease shall be 42 years, with an option to renew for another 40 years subject to mutualagreement of the parties. The lease agreement provided rent-free period of 2 years and leasepayments shall commence thereafter. Lease payments shall be paid annually at P=60.00 per sqm,subject to an annual escalation of 4%.
IMI GroupIMI Group has various operating lease agreement in respect of plant facilities, office spaces and land.These lease agreements have terms ranging from 5 to 15 years, fixed payment subject to escalationclauses, renewal option and early termination penalties.
MWC GroupMWC Group leases office space and storage and plant facilities wherein it is the lessee. The terms ofthe lease range from one year or until the end of the concession period.
Operating leases - as lessor
Parent CompanyThe Parent Company is a party under various operating leases which have lease terms between oneto thirty years with an annual escalation rate of 4.5% to 10%.
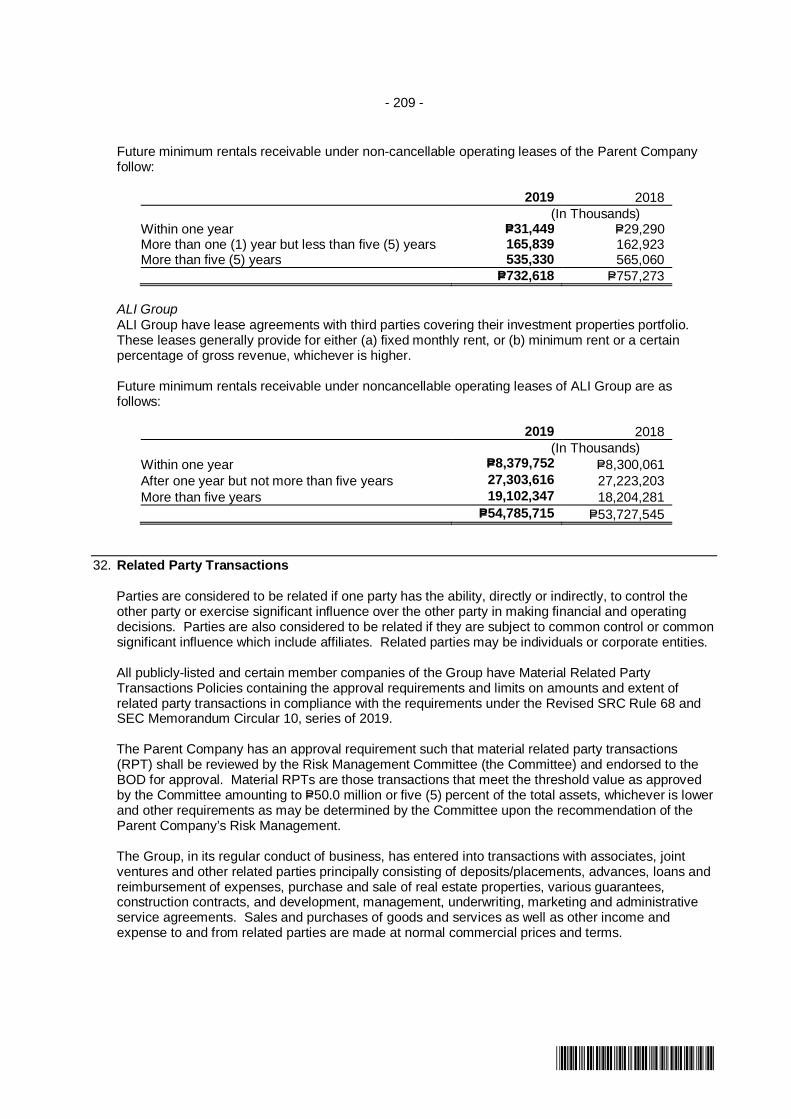
- 209 -
*SGVFS039491*
Future minimum rentals receivable under non-cancellable operating leases of the Parent Companyfollow:
2019 2018
(In Thousands)Within one year P=31,449 P=29,290More than one (1) year but less than five (5) years 165,839 162,923More than five (5) years 535,330 565,060
P=732,618 P=757,273
ALI GroupALI Group have lease agreements with third parties covering their investment properties portfolio.These leases generally provide for either (a) fixed monthly rent, or (b) minimum rent or a certainpercentage of gross revenue, whichever is higher.
Future minimum rentals receivable under noncancellable operating leases of ALI Group are asfollows:
2019 2018
(In Thousands)
Within one year P=8,379,752 P=8,300,061
After one year but not more than five years 27,303,616 27,223,203
More than five years 19,102,347 18,204,281
P=54,785,715 P=53,727,545
32. Related Party Transactions
Parties are considered to be related if one party has the ability, directly or indirectly, to control theother party or exercise significant influence over the other party in making financial and operatingdecisions. Parties are also considered to be related if they are subject to common control or commonsignificant influence which include affiliates. Related parties may be individuals or corporate entities.
All publicly-listed and certain member companies of the Group have Material Related PartyTransactions Policies containing the approval requirements and limits on amounts and extent ofrelated party transactions in compliance with the requirements under the Revised SRC Rule 68 andSEC Memorandum Circular 10, series of 2019.
The Parent Company has an approval requirement such that material related party transactions(RPT) shall be reviewed by the Risk Management Committee (the Committee) and endorsed to theBOD for approval. Material RPTs are those transactions that meet the threshold value as approvedby the Committee amounting to P=50.0 million or five (5) percent of the total assets, whichever is lowerand other requirements as may be determined by the Committee upon the recommendation of theParent Company’s Risk Management.
The Group, in its regular conduct of business, has entered into transactions with associates, jointventures and other related parties principally consisting of deposits/placements, advances, loans andreimbursement of expenses, purchase and sale of real estate properties, various guarantees,construction contracts, and development, management, underwriting, marketing and administrativeservice agreements. Sales and purchases of goods and services as well as other income andexpense to and from related parties are made at normal commercial prices and terms.

- 210 -
*SGVFS039491*
The transactions and balances of accounts with related parties follow:
a. Transactions with BPI, an associate
i. As of December 31, 2019 and 2018, the Group maintains current and savings account,money market placements and other short-term investments with BPI broken down as follows(amounts in thousands):
2019 2018
Cash in banks P=5,951,704 P=6,699,666Cash equivalents 18,972,412 19,542,962Short-term investments 247,739 2,838,388Financial assets at FVTPL 80,864 71,597Other noncurrent assets - others (Note 15) 4,261,796 2,365,311
ii. From the Group’s placements and short-term investments with BPI, the Group has accruedinterest receivable amounting to P=38.6 million and P=58.3 million as of December 31, 2019and 2018, respectively. Cash in banks earns interest at 0.01% to 0.75% per annum. Cashequivalents earn interest from 1.2% to 2.8% per annum. Investment in FVTPL pertain toMMF which earns interest depending on the duration of time invested in the fund with fairvalue of P=80.9 million and P=71.6 million, as of December 31, 2019 and 2018, respectively.Interest income earned from all the deposits, placements and investments amounted toP=713.4 million in 2018, P=476.0 million in 2018 and P=248.0 million in 2017.
The Group also has short-term and long-term debt payable to BPI aggregating toP=46.0 billion and P=32.3 billion as of December 31, 2019 and 2018, respectively. These short-term and long-term debts are interest bearing with varying rates ranging from 3.92% to4.70%, have various maturities starting 2019 and varying schedules of payments for interest.The Group has accrued interest payable pertaining to the outstanding balance of the short-term and long-term debt amounting to P=53.7 million and P=51.1 million as of December 31,2019 and 2018, respectively. Interest expense incurred from the debt amounted toP=578.6 million in 2019, P=785.2 million in 2018 and P=893.4 million in 2017.
Transactions with BPI will be settled in cash.
b. Outstanding balances of related party transactions follow (amounts in thousands):
Receivables Payables
2019 2018 2019 2018
Associates:BPI P=568,194 P=719,177 P=148,328 P=129,211Alveo-Federal Land Communities, Inc.
(Alveo-Federal Land) 154,836 359,993 − −CDPEI 136,242 75,378 629 69Honda Cars Philippines, Inc. (HCP) 102,215 105,695 269,294 247,580
Isuzu Philippines Corporation (IPC) 100,881 183,968 30,778 131,844BF Jade E-Services Philippines Inc. 57,522 35,304 89,905 45,830Bonifacio Land Corp. (BLC) 573 377 214,412 214,352
1,120,463 1,479,892 753,346 768,886
Joint ventures:
ALI ETON Property Development Corporation 3,267,222 2,190,605 3,942 14UPC Renewables Asia III Limited 1,434,560 1,149,829 − −The Blue Circle Pte. Ltd. (TBC) 903,243 − − −Yoma Strategic Investments Ltd. 476,590 − − −Globe 256,168 228,816 41,225 26,035UPC Renewables Asia I Limited P=− P=630,960 P=− P=−
6,337,783 4,200,210 45,167 26,049
(Forward)

- 211 -
*SGVFS039491*
Receivables Payables
2019 2018 2019 2018
Other related parties:
Asian Wind Power 1 HK Ltd. P=3,063,669 P=− P=− P=−UPC Renewables Asia Pacific Holdings 1,674,552 − − −FBDC 1,540,411 3,200,203 − −UPC Solar Asia Pacific Ltd. 304,464BIM Renewable 223,891 − − −AMI AC Renewables Corporation (formerly New
Energy Investments Corp.) 46,808 − − −Columbus Holdings, Inc. − − 267,355 267,355Others 179,187 84,289 18,193 10,261
7,032,982 3,284,492 285,548 277,616
P=14,491,228 P=8,964,594 P=1,084,061 P=1,072,551
i. Receivable from BPI includes trade receivables on vehicles sold and financing dealerincentives by AITHI group, dividends receivable and accrued interest receivables on short-term placements by the Group.
ii. Receivable from CDPEI pertains to development and construction related costs whileaccounts from Alveo-Federal Land mainly consist of marketing and management fees; andconstruction costs.
iii. Receivable from Globe includes trade receivables on vehicles sold and project managementand professional fees.
iv. Receivable from FBDC largely pertains to management fees which are included under“Other income” and billed and unbilled receivables of MDC Group for the construction ofFBDC’s projects.
v. Receivable from IPC and HCP pertains to marketing and sales incentives arising from thesale of vehicles.
vi. Receivable from BLC pertains to parcels and documents delivery by Entrego.vii. Receivable from ALI-ETON pertains to the sale of land by Alveo to ALI-ETON.viii. Receivable from UPC III relates to the contractual obligation of UPC Renewables Asia III to
redeem the preferred shares owned by ACEI Group at a determined amount through cashpayment at some future date.
ix. Receivable from TBC pertain to the interest-bearing loan agreement it has entered into withAC Energy to fund the development costs for the pipeline projects of TBC. The loan facilityhas an interest rate of 10% per annum. The loan and interest are payable on June 30, 2020.
x. Receivable from Yoma includes an interest-bearing loan facility to fund the development ofYoma Micro Power. The loan facility is drawable in tranches with interest of 4% per annum.The loan and interest are payable on October 17, 2020.
xi. Receivable from Asian Wind pertains to an interest-bearing loan agreement for thedevelopment, financing, and construction of Dai Phong Project. The loan facility has aninterest of 12% per annum. The loan and interest payable are payable on April 12, 2044.
xii. Receivable from UPC Renewables Asia Pacific pertains to an interest-bearing loanagreement to fund the development of renewable energy and energy storage projects. Theloan facility has an interest rate of 8% per annum. The loan and interest are payable onJanuary 31, 2023.
xiii. Receivable from UPC Solar pertains to the loan agreement it has entered into with ACEnergy Group to fund the development and construction of renewable energy assets in Asia.The loan facility has an interest rate of 9% per annum. The loan and interest are payable onAugust 9, 2024.
xiv. Other outstanding balances of receivable from related parties at year-end pertain mostly toadvances, including those for project development, logistics and reimbursement of operatingexpenses.
xv. All these are unsecured, interest free, will be settled in cash and are due and demandable,unless otherwise stated.
xvi. Payable to IPC and HCP consist of purchased parts and accessories and vehicles that aretrade in nature, interest-free, unsecured and are payable within 15 to 30 days.

- 212 -
*SGVFS039491*
xvii. Payable to BPI includes interest payable on Group’s borrowings payable at various paymentterms like monthly or quarterly and insurance premiums payable which are due in 30-60days.
xviii. Payable to BF Jade pertains to cash collections from customers with COD payment termcollected by Entrego to be remitted to BF Jade.
xix. The other outstanding balances of payable to related parties at year-end consist of payableto Columbus representing non-interest bearing advances for stock redemption. It alsopertains to advances, including those for development costs and land acquisitions, andexpenses incurred on utilities, professional services, logistics and other miscellaneousservices.
xx. Unless otherwise stated, all these are unsecured, interest free, will be settled in cash and aredue and demandable.
xxi. Allowance for doubtful accounts on amounts due from related parties amounted toP=9.9 million and P=83.5 million as of December 31, 2019 and 2018, respectively. Reversal ofprovision for doubtful accounts amounted to P=17.4 million in 2019 (see Note 7). Provision fordoubtful accounts amounted to P=50.4 million and P=0.7 million in 2018 and 2017,respectively (see Note 23).
c. Dividends receivable from related parties pertain to accrued dividend declarations from
associates and joint ventures. These are non-interest bearing and usually collectible within one
year. This amounted to P=145.0 million and P=1,334.9 million as of December 31, 2019 and 2018,
respectively (see Note 7).
d. Receivables from officers and employees amounting to P=1,505.3 million and P=1,498.0 million asof December 31, 2019 and 2018 pertain to housing, car, salary and other loans granted to theGroup’s officers and employees which are collectible through salary deduction, are interestbearing ranging from 6.0% to 10.0% per annum and have various maturity dates ranging from2019 to 2027 (see Note 7).
e. Revenue and expenses from related parties follow:
Revenue Costs and Expenses
2019 2018 2017 2019 2018 2017
(In Thousands)Associates:
BPI P=1,178,279 P=913,974 P=525,772 P=629,603 P=1,078,384 P=915,015BF Jade 171,662 59,733 − 10,288 − −Joint ventures:
Globe 320,500 355,957 193,426 301,542 233,742 169,884Alveo-Federal − 56,305 − − − −
1,670,441 1,385,969 719,198 941,433 1,312,126 1,084,899
Other related parties:
FBDC − P=188,747 P=− 13,890 P=2,182 P=−Others 42,424 20,148 65,552 59,343 21,321 23,889
42,424 208,895 65,552 73,233 23,503 23,889
P=1,712,865 P=1,594,864 P=784,750 P=1,014,666 P=1,335,629 P=1,108,788
Revenue recognized from related parties includes:i. Leasing and project development and management services rendered by ALI Group.ii. Water and sewerage services rendered by MWC.iii. Automotive sales and repair services rendered by AITHI Group.iv. Interest and miscellaneous income from cash deposits and money market placement as well
as financing dealer incentive from BPI and other entities.v. Others include various income such as interest and management fees.

- 213 -
*SGVFS039491*
Expenses recognized from related parties include:i. Interest expense from short-term and long-term debt and credit card and other bank charges
payable to BPI.ii. Purchases of communications software and billings for mobile phone charges and internet
connections with Globe.iii. Building rental, leased lines, internet connections and ATM connections with Innove,
subsidiary of Globe.iv. Others include miscellaneous operating expenses such as professional and management
services.
f. The Group’s compensation of key management personnel by benefit type follows:
2019 2018 2017
(In Thousands)Short-term employee benefits P=1,681,229 P=1,329,281 P=1,309,239Post-employment benefits 91,166 74,087 97,834Share-based payments 7,616 705 10,607
P=1,780,011 1,404,073 P=1,417,680
Key management personnel of the Group include all officers with position of vice president andup.
33. Financial Instruments
Financial Risk Management
GeneralLike any other risks, financial risks are inherent in the business activities and are typical of any largeholding company. The financial risk management of the Parent Company seeks to effectivelycontribute to better decision making, enhance performance, and satisfy compliance demands.
The Parent Company defines financial risks as risk that relates to the Parent Company’s ability tomeet financial obligations and mitigate funding risk, credit risk and exposure to broad market risks,including volatility in foreign currency exchange rates and interest rates. Funding risk refers to thepotential inability to meet contractual or contingent financial obligations as they arise and couldpotentially impact the Parent Company’s financial condition or overall financial position. Credit risk isthe risk of financial loss arising from a counterparty’s failure to meet its contractual obligations or non-payment of an investment. These exposures may result in unexpected losses and volatilities in theParent Company’s profit and loss accounts.
The Parent Company maintains a strong focus on its funding strategy to help provide access tosufficient funding to meet its business needs and financial obligations throughout business cycles.The Parent Company’s plans are established within the context of our annual strategic and financialplanning processes. The Parent Company also take into account capital allocations and growthobjectives, including dividend pay-out. As a holding company, the Parent Company generates cashprimarily on dividend payments of its subsidiaries, associates and joint ventures and other sources offunding.
The Parent Company also establishes credit policies in setting up limits for counterparties that arereviewed quarterly and monitoring of any changes in credit standing of counterparties.
The Parent Company has a formal foreign exchange and interest rate risk management policy. TheParent Company actively monitors foreign exchange exposure and interest rate changes. And inaddition, the Parent Company ensures that all loan covenants and regulatory requirements arecomplied with.

- 214 -
*SGVFS039491*
The Ayala Group continues to monitor and manage its financial risk exposures in accordance withBoard approved policies. The succeeding discussion focuses on Ayala Group’s financial riskmanagement.
Financial Risk Management Objectives and Policies
The Group’s principal financial instruments comprise financial assets at FVTPL and FVOCI, AFSfinancial assets, bank loans, corporate notes and bonds. The financial debt instruments were issuedprimarily to raise financing for the Group’s operations. The Group has various financial assets suchas cash and cash equivalents, short-term investments, accounts and notes receivables and accountspayable and accrued expenses which arise directly from its operations.
The Group’s main risks arising from the use of financial instruments are interest rate risk, foreignexchange risk, price risk, liquidity risk, and credit risk.
The Group also uses hedging instruments, the purpose of which is to manage the currency andinterest rate risks arising from its financial instruments.
The Group’s risk management policies relevant to financial risks are summarized below:
The Group’s exposure to market risk for changes in interest rates relates primarily to the ParentCompany’s and its subsidiaries’ obligations. The policy is to keep a certain level of the totalobligations as fixed to minimize earnings volatility due to fluctuation in interest rates.The following table demonstrates the sensitivity of the Group’s profit before tax and equity to areasonably possible change in interest rates as of December 31, 2019 and 2018, with all variablesheld constant.
Cash flow interest rate risk
Change in Effect on profit before tax
basis points 2019 2018
(In Thousands)
Parent Company - Floating rate Borrowings +100 (P=100,213) (P=275,133)
-100 100,213 275,133Subsidiaries - Floating rate Borrowings +100 (P=267,731) (P=269,880)
-100 P=267,731 269,880
There is no other impact on the Group’s equity other than those already affecting the net income.

- 215 -
*SGVFS039491*
The terms and maturity profile of the interest-bearing financial assets and liabilities, together with its corresponding nominal amounts and carrying values follows:(amounts in thousands):
December 31, 2019
Interest terms (per annum)Rate Fixing
PeriodNominalAmount < 1 year 1 to 5 years > 5 years Carrying Value
GroupCash and cash equivalents Fixed at the date of investment Various P=93,405,253 P=93,405,253 P=− P=− P=93,405,253
Short-term investmentsFixed at the date of investment or
revaluation cut-off Various 13,387,801 13,387,801 13,387,801Accounts and notes receivable Fixed at the date of sale or transaction Various 1,145,484 629,025 342,497 173,962 1,145,484Receivables from related parties Fixed at the date of transaction Various 6,409,885 1,376,766 1,974,765 3,058,354 6,409,885
P=114,348,423 P=108,798,845 P=2,317,262 P=3,232,316 P=114,348,423
Parent CompanyLong-term debt
FixedPeso Fixed at 6.0043% 8 years P=11,000,000 − 1,744,919 9,187,892 10,932,811
Peso Fixed at 6.875% 15 years 10,000,000 − − 9,952,651 9,952,651
Peso Fixed at 3.92% 7 years 10,000,000 − 9,942,735 − 9,942,735Peso Fixed at 4.82% 8 years 10,000,000 − − 9,929,787 9,929,787
Peso Fixed at 6.80% 10 years 9,903,400 − 9,885,752 9,885,752
Peso Fixed at 5.2883% 7 years 2,940,000 28,890 2,904,927 − 2,933,817
Peso Fixed at 6.0043 5 years 2,000,000 93,655 1,896,363 − 1,990,018
FloatingPeso
Variable at 0.60% to 0.70% over 3-month PDSTR2 or 0.45% over 28-day BSP TDF Rate 3 months 10,021,250 4,034,409 2,640,689 3,301,397 9,976,495
Subsidiaries
Short-term debt Ranging from 5.30% to 6.70% Monthly, quarterly 23,176,325 23,176,325 − − 23,176,325Ranging from 2.45% to 4.98% Monthly, quarterly 6,612,318 6,612,318 − − 6,612,318
Long-term debtFixed
Peso and foreign currency Fixed at 1.86% to 9.00%3,4,5,7,10 and
15 years 315,312,810 17,235,807 101,229,513 186,252,400 304,717,720Dollar
Floating
Variable3 months,
semi-annual 5,291,328 2,485,964 1,811,764 990,000 5,287,728
P=416,257,431 P=53,667,368 P=132,056,662 P=219,614,127 P=405,338,157

- 216 -
*SGVFS039491*
December 31, 2018
Interest terms (per annum)Rate Fixing
PeriodNominalAmount < 1 year 1 to 5 years > 5 years Carrying Value
GroupCash and cash equivalents Fixed at the date of investment Various P=60,624,263 P=60,624,263 P=− P=− P=60,624,263
Short-term investmentsFixed at the date of investment or revaluation cut-off Various 5,956,489 5,956,489 − − 5,956,489
Accounts and notes receivable Fixed at the date of sale or transaction Various 1,348,394 259,908 1,024,152 64,334 1,348,394 AFS financial asset - Quoted debt investments
Fixed at the date of investment or revaluation cut-off Various − − − − −
P=67,929,146 P=66,840,660 P=1,024,152 P=64,334 P=67,929,146
Parent CompanyLong-term debtFixed
Peso Fixed at 6.0043% 8 years P=11,000,000 P=− P=875,760 P=10,071,238 P=10,946,998Peso Fixed at 3.92% 7 years 10,000,000 − 9,927,904 − 9,927,904Peso Fixed at 4.82% 8 years 10,000,000 − − 9,918,003 9,918,003Peso Fixed at 6.80% 10 years 10,000,000 − 9,970,466 − 9,970,466Peso Fixed at 6.875% 15 years 10,000,000 − − 9,946,221 9,946,221Peso Fixed at 5.2883% 7 years 2,970,000 29,916 2,931,726 − 2,961,642Peso Fixed at 6.0043 5 years 2,000,000 − 2,017,241 − 2,017,241
FloatingPeso Variable at 0.60% to 0.70% over 3-month
PDST R2 or 0.45% over 28-day BSPTDF Rate 3 months 11,543,250 492,212 8,563,559 2,423,735 11,479,506
SubsidiariesShort-term debt Ranging from 2.50% to 6.04% Monthly, quarterly 21,397,698 21,397,698 − − 21,397,698
Ranging from 4.38% to 7.03% Monthly, quarterly 18,120,547 18,120,547 − − 18,120,547Exchangeable bond Fixed at 0.50% 5 years 15,285,934 15,285,934 − − 15,285,934
Long-term debt Fixed
Peso and foreign currency Fixed at 1.86% to 9.00%3,4,5,7,10 and
15 years 288,655,774 29,800,309 59,370,346 186,146,450 275,317,105
Floating Variable at 0.75% over 91-day PDST-R23 months,
semi-annual 14,972,366 2,872,188 7,193,900 4,906,279 14,972,367
P=425,945,569 P=87,998,804 P=100,850,902 P=223,411,926 P=412,261,632

- 217 -
*SGVFS039491*
Foreign exchange riskThe Group’s foreign exchange risk results primarily from movements of the PHP against othercurrencies. The Group’s consolidated statements of income can be affected significantly bymovements in the USD and other currencies versus the PHP. In 2019 and 2018, the Group enteredinto currency forward contract s to hedge its risks associated with foreign currency fluctuations.
IMI GroupThe IMI Group’s foreign exchange risk results primarily from movements of the functional currency ofeach legal entity against other currencies. As a result of significant transactions denominated in RMB,PHP and EUR the consolidated statements of income can be affected significantly by movements inthe USD versus these currencies. In 2019 and 2018, IMI entered into currency forward contracts tohedge its risks associated with foreign currency fluctuations.
IMI Group also has transactional currency exposures. Such exposure arises from sales or purchasesdenominated in other than IMI’s functional currency. Approximately 61% and 60% of IMI Group’ssales for the years ended December 31, 2019 and 2018, respectively, and 48% and 51% of costs forthe years ended December 31, 2019 and 2018, respectively, are denominated in currencies otherthan IMI’s functional currency.
IMI Group manages its foreign exchange exposure risk by matching, as far as possible, receipts andpayments in each individual currency. Foreign currency is converted into the relevant domesticcurrency as and when the management deems necessary. The unhedged exposure is reviewed andmonitored closely on an ongoing basis and management will consider hedging any material exposurewhere appropriate.
MWC GroupThe MWC Group’s foreign exchange risk results primarily from movements of the PHP against theUS$ and JPY. Majority of revenues are generated in PHP, and substantially all capital expendituresare also in PHP. Approximately 48.74% and 53.81% of debt as of December 31, 2019 and 2018,respectively, was denominated in foreign currency.
Information on the Group’s significant foreign currency-denominated monetary assets and liabilitiesand their Php equivalent follows:
December 31, 2019 December 31, 2018
US$ Php Equivalent* US$ Php Equivalent*
(In Thousands)AssetsCash and cash equivalents US$994,643 P=50,370,483 US$171,367 P=9,010,477Accounts and notes receivables 109,956 5,653,120 − −Other current assets 2,458 125,349 − −Investment in bonds & other securities − − 34,860 1,832,939Other noncurrent assets 380 19,242 − −Total assets 1,107,437 56,168,194 206,227 10,843,416
LiabilitiesAccounts payable and accrued
expenses 12,215 616,536 1,034 54,368Other current liabilities 906 45,900 − −Short-term debt 5,773 292,295 − −Long-term debt 252,903 12,805,733 193,842 10,192,212Other noncurrent liabilities 67,863 3,439,006 64,859 3,410,286
Total liabilities 339,660 17,199,470 259,735 13,656,866
Net foreign currency denominatedassets (liabilities) US$767,777 P=38,968,724 (US$53,508) (P=2,813,450)
*Translated using the exchange rate at the reporting date (US$1:P=50.64 on December 31, 2019 and US$1:P=52.58 on December 31, 2018).

- 218 -
*SGVFS039491*
December 31, 2019 December 31, 2018
JPY Php Equivalent* JPY Php Equivalent*
(In Thousands)AssetsCash and cash equivalents JPY329,343 P=152,323 JPY465,744 P=221,899Accounts and notes receivable 615,632 284,733 26,380 12,569Other noncurrent assets 2,398 1,109 2,675 1,274
Total assets 947,373 438,165 494,799 235,742
LiabilitiesAccounts payable and accrued expenses 841,612 389,250 583,933 278,209Other current liabilities 75,701 35,042 75,861 36,042Short-term debt 102,295 47,312 − −Long-term debt 21,686,410 10,038,498 28,402,974 13,494,253Other noncurrent liabilities 378,348 175,137 527,061 250,407
Total liabilities 23,084,366 10,685,239 29,589,829 14,058,911
Net foreign currency denominatedliabilities JPY(22,136,993) P=(10,247,074) (JPY29,095,030) (P=13,823,169)
*Translated using the exchange rate at the reporting date (JPY1:P=0.4619 on December 31, 2019 and JPY1:P=0.4738 on December 31, 2018).
December 31, 2019 December 31, 2018
RMB Php Equivalent* RMB Php Equivalent*
(In Thousands)AssetsCash and cash equivalents RMB 132,334 P=958,907 RMB154,278 P=1,181,951Accounts and notes receivables 597,898 4,332,427 665,668 5,099,778Other current assets − − 7,038 53,923
Total assets 730,232 5,291,334 826,984 6,335,652
LiabilitiesAccounts payable and accrued
expenses 498,772 3,614,149 478,697 3,667,373Short-term debt 127,692 925,271 113,245 867,591
Total liabilities 626,464 4,539,420 591,942 4,534,964
Net foreign currency denominatedassets RMB103,768 P=751,914 RMB235,042 P=1,800,688
*Translated using the exchange rate at the reporting date RMB1: P=7.2356 on December 31, 2019 and RMB1: P=7.66 on December 31, 2018).
December 31, 2019 December 31, 2018
EUR Php Equivalent* EUR Php Equivalent
(In Thousands)AssetsCash and cash equivalents EUR38,750 P=2,185,163 EUR21,745 P=1,310,743Accounts and notes receivable 79,216 4,465,576 68,957 4,156,544Other current assets 7,430 418,870 424 25,567Other noncurrent assets − 17 − −Total assets 125,396 7,069,626 91,126 5,492,854
LiabilitiesAccounts payable and accrued
expenses 35,726 2,014,524 45,110 2,719,101Other current liabilities 15,174 855,400 13,715 826,678Short term debt 14,055 792,299 13,212 796,393Long-term debt 40,413 2,277,344 1,933 116,538Other noncurrent liabilities 3,037 171,291 7,999 482,179
Total liabilities 108,405 6,110,858 81,969 4,940,889
Net foreign currency denominatedassets EUR16,991 P=958,768 EUR9,157 P=551,965
*Translated using the exchange rate at the reporting date (EUR1: P=56.2302 on December 31, 2019 and EUR1: P=60.15 on December 31, 2018)

- 219 -
*SGVFS039491*
December 31, 2019 December 31, 2018
VND Php Equivalent* VND Php Equivalent
(In Thousands)AssetsCash and cash equivalents VND15,702,138 P=34,309 VND1,121,738 P=2,566Other current assets 178,430 390 − −Other noncurrent assets 120,436 263 − −Total assets 16,001,004 34,962 1,121,738 2,566LiabilitiesAccounts payable and accrued
expenses 907,163 1,979 1,401,336 3,177
Net foreign currency denominatedassets VND15,093,841 P=32,983 (VND279,598) (P=611)
Translated using the exchange rate at the reporting date (VND1:P=0.0022 on December 31, 2019 and VND1:P= 0.0023 on December 31, 2018.
The following table demonstrates the sensitivity to a reasonably possible change in the exchangerate, with all variables held constant, of the Group’s profit before tax (due to changes in the fair valueof monetary assets and liabilities) and the Group’s equity (amounts in thousands).
Currency
Increase(decrease) in
Peso per foreigncurrency Increase (decrease) in profit before tax
2019 2018
US$ P=1.00 ₱767,777 (P=53,508)(1.00) (767,777) 53,508
JPY 1.00 (22,136,993) (29,095,030)(1.00) 22,136,993 29,095,030
RMB 1.00 103,768 235,042(1.00) (103,768) (235,042)
EUR 1.00 16,991 411,893(1.00) (16,991) (411,893)
VND 1.00 15,093,841 (279,598)(1.00) (15,093,841) 279,958
There is no other impact on the Group’s equity other than those already affecting net income.
Equity price riskFinancial assets at FVTPL and FVOCI are acquired at certain prices in the market. Such investmentsecurities are subject to price risk due to changes in market values of instruments arising either fromfactors specific to individual instruments or their issuers, or factors affecting all instruments traded inthe market. Depending on several factors such as interest rate movements, the country’s economicperformance, political stability, and domestic inflation rates, these prices change, reflecting howmarket participants view the developments. The Group’s investment policy requires it to managesuch risks by setting and monitoring objectives and constraints on investments; diversification plan;and limits on investment in each sector and market.

- 220 -
*SGVFS039491*
The analysis below demonstrates the sensitivity to a reasonably possible change of market index withall other variables held constant, of the Group’s equity arising from fair valuation of quoted financialassets at FVTPL and FVOCI (amounts in thousands):
Market IndexChange in Variables
Effect onEquity
Increase(decrease)
(In Thousands)2019 PSEi 5% P=31,922
(5%) (31,922)2018 PSEi 5% P=35,234
(5%) (35,234)
Liquidity riskLiquidity risk is defined by the Group as the risk of losses arising from funding difficulties due todeterioration in market conditions and/or the financial position of the Group that make it difficult toraise the necessary funds or that forces the Group to raise funds at significantly higher interest ratesthan usual.
This is also the possibility of experiencing losses due to the inability to sell or convert marketablesecurities into cash immediately or in instances where conversion to cash is possible but at loss dueto wider than normal bid-offer spreads.
The Group seeks to manage its liquidity profile to be able to service its maturing debts and to financecapital requirements. The Group maintains a level of cash and cash equivalents deemed sufficient tofinance operations. As part of its liquidity risk management, the Group regularly evaluates itsprojected and actual cash flows. It also continuously assesses conditions in the financial markets foropportunities to pursue fund-raising activities. Fund-raising activities may include bank loans andcapital market issues, both on-shore and off-shore.
ALI GroupALI Group employs scenario analysis and contingency planning to actively manage its liquidityposition and guarantee that all operating, investing and financing needs are met. ALI Group hascome up with a three-layered approach to liquidity through the prudent management of sufficient cashand cash equivalents, the potential sale of accounts receivables and the maintenance of short-termrevolving credit facilities.
Cash and cash equivalents are maintained at a level that will enable it to fund its general andadministrative expenses as well as to have additional funds as buffer for any opportunities oremergencies that may arise. Management develops viable funding alternatives through a continuousprogram for the sale of its receivables and ensures the availability of ample unused short-termrevolving credit facilities from both local and foreign banks as back-up liquidity.
IMI GroupIMI Group’s exposure to liquidity risk relates primarily to its short-term and long-term obligations. IMIGroup seeks to manage its liquidity profile to be able to finance its capital expenditures andoperations. IMI Group maintains a level of cash and cash equivalents deemed sufficient to finance itsoperations. As part of its liquidity risk management, IMI Group regularly evaluates its projected andactual cash flows. To cover financing requirements, IMI Group intends to use internally-generatedfunds and loan facilities with local and foreign banks. Surplus funds are placed with reputable banks.
MWC GroupMWC Group’s objective is to maintain a balance between continuity of funding and flexibility throughthe use of bank overdrafts, bank loans, and debentures. MWC Group’s policy is to maintain a level ofcash that is sufficient to fund its operating cash requirements for the next four (4) to six (6) monthsand any claim for refund of customers’ guaranty deposits. Capital expenditures are funded through

- 221 -
*SGVFS039491*
long-term debt, while operating expenses and working capital requirements are sufficiently fundedthrough internal cash generation.
The table summarizes the maturity profile of the Group’s financial liabilities as of December 31, 2019and 2018, based on contractual undiscounted payments.
December 31, 2019
< 1 year 1 to < 2 years 2 to < 3 years > 3 years Total
(In Thousands)Accounts payable and accrued expenses Accounts payable P=104,887,772 P=– P=– P=– P=104,887,772
Project costs 18,269,215 – – – 18,269,215 Accrued expenses 17,127,334 – – – 17,127,334 Personnel costs 8,615,806 – – – 8,615,806
Dividends payable 4,496,286 – – – 4,496,286 Retentions payable 4,190,439 6,751,643 – – 10,942,082 Related parties 1,084,061 – – – 1,084,061
Contractors payable – – – 6,595,611 6,595,611DRP obligation – – – – –Nontrade Payable 1,075,740 – – – 1,075,740
Subscription payable – 498,687 – – 498,687
Liability for purchased land 9,936,887 – – 5,426,645 15,363,532Financial liabilities on put option 1,823,114 – – – 1,823,114
Service concession obligation 13,607 – – 52,412 66,019Deposits and deferred credits 25,481,979 – – 23,073,011 48,554,990Short-term debt 29,788,643 – – – 29,788,643
Long-term debt 23,878,725 25,330,889 55,034,437 271,305,463 375,549,514Lease Liabilities 1,635,474 2,063,484 4,091,830 57,540,360 65,331,148Other liabilities 13,875 – – 4,380,371 4,394,246
Interest payable* 11,194,428 3,339,765 3,430,620 49,152,140 67,116,953
P=263,513,385 P=37,984,468 P=62,556,887 P=417,526,013 P=781,580,753
*includes future interest payments
December 31, 2018
< 1 year 1 to < 2 years 2 to < 3 years > 3 years Total
(In Thousands)Accounts payable and accrued expenses
Accounts payable P=120,312,117 P=– P=– P=– P=120,312,117 Project costs 18,641,346 – – – 18,641,346 Accrued expenses 17,153,646 – – – 17,153,646
Personnel costs 9,078,336 – – – 9,078,336 Dividends payable 4,131,317 – – – 4,131,317 Retentions payable 6,762,286 5,721,123 – – 12,483,409
Related parties 1,072,551 – – – 1,072,551Contractors payable – – – 7,264,642 7,264,642DRP obligation 236,362 – – 1,001,146 1,237,508
Nontrade Payable 1,490,379 – – 1,490,379Subscription payable – 802,702 – – 802,702Liability for purchased land 2,544,623 – – 5,021,034 7,565,657
Financial liabilities on put option 1,386,926 – – – 1,386,926Service concession obligation 820,802 – – 7,018,211 7,839,013Customers’ deposits 29,043,778 – – 29,069,683 58,113,461
Short-term debt 39,518,245 – – – 39,518,245Long-term debt 48,480,559 97,363,916 65,333,808 161,565,104 372,743,387Other liabilities 7,560 – – 1,837,598 1,845,158
Interest payable* 12,141,391 26,940,306 3,124,796 18,209,755 60,416,248
P=312,822,224 P=130,828,047 P=68,458,604 P=230,987,173 P=743,095,948
*includes future interest payments
Cash and cash equivalents, short–term investments and financial assets at FVTPL are used for theGroup’s liquidity requirements. Please refer to the terms and maturity profile of these financial assetsunder the maturity profile of the interest-bearing financial assets and liabilities disclosed in the interestrate risk section.

- 222 -
*SGVFS039491*
Credit riskCredit risk is the risk that the Group’s counterparties to its financial assets will fail to discharge theircontractual obligations. The Group’s holding of cash and cash equivalents and short-terminvestments and receivables from customers and other third parties exposes the Group to credit riskof the counterparty. Credit risk management involves dealing with institutions for which credit limitshave been established. The Treasury and Financial Policies of the individual subsidiaries set creditlimits for their counterparty. The Group trades only with recognized, creditworthy third parties andhas a well-defined credit policy and established credit procedures.
The Group considers the probability of default upon initial recognition of asset and whether there hasbeen a significant increase in credit risk on an ongoing basis throughout each reporting period.
The Group has determined the default event on a financial asset to be when the counterparty fails tomake contractual payments, within 90 days when they fall due, which are derived based on theGroup’s historical information.
The Group considers “low risk” to be an investment grade credit rating with at least one major ratingagency for those investments with credit rating. To assess whether there is a significant increase incredit risk, the Group compares the risk of a default occurring on the asset as at reporting date withthe risk of default as at the date of initial recognition.
Given the Group’s diverse base of counterparties, the Group is not exposed to large concentrations ofcredit risk.
The maximum exposure to credit risk for the components of the consolidated statement of financialposition is equal to the carrying values.
Part of the policies is the performance of impairment analysis for the credit accounts (see Note 3).
ALI GroupALI Group’s credit risks are primarily attributable to installments receivable, rental receivables andother financial assets. To manage credit risks, ALI Group maintains defined credit policies andmonitors its exposure to credit risks on a continuous basis.
In respect of installments receivable from the sale of properties, credit risk is managed primarilythrough credit reviews and an analysis of receivables on a continuous basis. ALI Group alsoundertakes supplemental credit review procedures for certain installment payment structures. ALIGroup’s stringent customer requirements and policies in place contribute to lower customer defaultthan its competitors. Customer payments are facilitated through various collection modes includingthe use of postdated checks and auto-debit arrangements. Exposure to bad debts is not significantas title to real estate properties are not transferred to the buyers until full payment has been madeand the requirement for remedial procedures is minimal given the profile of buyers.
Credit risk arising from rental income from leasing properties is primarily managed through a tenantselection process. Prospective tenants are evaluated on the basis of payment track record and othercredit information. In accordance with the provisions of the lease contracts, the lessees are requiredto deposit with ALI Group security deposits and advance rentals which helps reduce ALI Group’scredit risk exposure in case of defaults by the tenants. For existing tenants, ALI Group has put inplace a monitoring and follow-up system. Receivables are aged and analyzed on a continuous basisto minimize credit risk associated with these receivables. Regular meetings with tenants are alsoundertaken to provide opportunities for counseling and further assessment of paying capacity.
Other financial assets are comprised of cash and cash equivalents excluding cash on hand, short-term investments, financial assets at FVTPL and financial assets at FVOCI. ALI Group adheres tofixed limits and guidelines in its dealings with counterparty banks and its investment in financialinstruments. Bank limits are established on the basis of an internal rating system that principallycovers the areas of liquidity, capital adequacy and financial stability. The rating system likewise

- 223 -
*SGVFS039491*
makes use of available international credit ratings. Given the high credit standing of its accreditedcounterparty banks, management does not expect any of these financial institutions to fail in meetingtheir obligations. Nevertheless, ALI Group closely monitors developments over counterparty banksand adjusts its exposure accordingly while adhering to pre-set limits.
ALI Group’s maximum exposure to credit risk as of December 31, 2019 and 2018 is equal to thecarrying values of its financial assets.
Given ALI Group’s diverse base of counterparties, it is not exposed to large concentrations of creditrisk.
An impairment analysis is performed at each reporting date using a provision matrix to measureexpected credit losses. The provision rate is based on days past due of all customers as they havesimilar loss patterns. Generally, trade receivables are written off if past due for more than one yearand are not subject to enforcement activity. The security deposits and advance rental are consideredin the calculation of impairment as recoveries. As of December 31, 2019 and 2018, the exposure atdefault amounts to P=14,354.9 million and P=9,849.9 million, respectively. The expected credit loss rateis 5.3% and 3.5% that resulted in the ECL of P=1,186.3 million and P=872.3 million as of December 31,2019 and December 31, 2018, respectively.
IMI GroupThe credit evaluation reflects the customer’s overall credit strength based on key financial and creditcharacteristics such as financial stability, operations, focus market and trade references. Allcustomers who wish to trade on credit terms are subject to credit verification procedures. In addition,receivable balances are monitored on an ongoing basis with the result that IMI Group’s exposure tobad debts is not significant.
MWC GroupMWC Group is exposed to credit risk from its operating activities (primarily trade receivables) andfrom its financing activities, including deposits with banks and financial institutions, foreign exchangetransactions and other financial instruments.
Customer credit risk is managed by MWC Group’s established policy, procedures and control relatingto customer credit risk management. Credit risk for receivables from customers is managed primarilythrough credit reviews and an analysis of receivables on a continuous basis. MWC Group has nosignificant concentration of credit risk. Outstanding customer receivables and contract assets areregularly monitored and customer payments are facilitated through various collection modes includingthe use of postdated checks and auto-debit arrangements.
An impairment analysis is performed at each reporting date using a provision matrix to measureexpected credit losses. The provision rates are based on days past due for groupings of customersegments with similar loss patterns (i.e., by geographical region, and product type). The calculationreflects the probability-weighted outcome and reasonable and supportable information that isavailable at the reporting date about past events, current conditions and forecasts of future economicconditions.
The provision matrix is initially based on MWC Group’s historical observed default rates. MWC Groupwill calibrate the matrix to adjust the historical credit loss experience with forward-looking information.
Generally, trade receivables are written-off when deemed unrecoverable and are not subject toenforcement activity. The maximum exposure to credit risk at the reporting date is the carrying valueof each class of financial assets.

- 224 -
*SGVFS039491*
The aging analysis of accounts and notes receivables that are past due but not impaired follows:
December 31, 2019Neither Past
Due nor Past Due but not Impaired Individually
Impaired <30 days 31-60 days 61-90 days 91-120 days >120 days Total Impaired Total
(In Thousands)
Trade: Real estate and Hotels P=105,990,906 P=2,432,249 P=1,454,322 P=1,403,803 P=1,736,415 P=10,797,062 P=17,823,851 P=496,048 P=124,310,805 Electronics manufacturing 12,597,183 1,016,298 312,623 221,203 22,742 463,710 2,036,576 53,255 14,687,014
Automotive 1,099,742 174,526 591,992 348,421 236,626 516,170 1,867,735 79,563 3,047,040Power generation 4,641,254 − − − − − − 48,508 4,689,762
Outsourcing 199,940 65,007 10,080 4,853 7,062 27,480 114,482 − 314,422
International and others 789,038 29,503 3,876 6,306 − 20,262 59,947 − 848,985Advances to other companies 19,958,123 245,326 206,677 8,585 4,442 2,910,777 3,375,807 259,279 23,593,209Receivable from related parties 11,396,859 1,413,094 577,563 451,775 53,050 549,416 3,044,898 49,471 14,491,228
Receivable from officers and employees 1,378,632 4,153 3,886 4,684 6,712 105,355 124,790 1,888 1,505,310Dividend receivable 145,010 − − − − − − − 145,010Receivable from BWC − − − − − − − − −Others 1,384,578 − − − − − − − 1,384,578
Total P=159,581,265 P=5,380,156 P=3,161,019 P=2,449,630 P=2,067,049 P=15,390,232 P=28,448,086 P=988,012 P=189,017,363

- 225 -
*SGVFS039491*
December 31, 2018Neither Past
Due nor Past Due but not Impaired Individually
Impaired <30 days 31-60 days 61-90 days 91-120 days >120 days Total Impaired Total
(In Thousands)Trade: Real estate and hotels P=128,842,167 P=2,559,105 P=1,405,219 P=885,261 P=505,299 P=3,231,656 P=8,586,540 P=872,268 P=138,300,975
Electronics manufacturing 13,258,437 1,954,513 278,346 246,423 101,179 257,591 2,838,052 105,908 16,202,397 Automotive 1,085,224 612,365 355,860 247,375 146,904 371,005 1,733,509 77,783 2,896,516
Water infrastructure 1,374,283 – – – – – – 1,239,761 2,614,044
Power generation 611,919 – – – – – – 460,426 1,072,345 Outsourcing 84,460 – – – – – – 176,552 261,012 International and others 46,639 709 – – – – 709 – 47,348
Receivable from related parties 8,459,392 176,443 7,331 5,215 59,313 173,361 421,663 83,541 8,964,596Receivable from officers and employees 1,334,894 – – – – – – – 1,334,894Concession financial receivable 1,217,341 27,992 10,726 15,198 15,112 211,628 280,656 – 1,497,997
Dividend receivable 1,334,894 – – – – – – – 1,334,894Receivable from BWC 388,411 – – – – – – – 388,411Others 388,518 – – – – – – – 388,518
Total P=158,426,579 P=5,331,127 P=2,057,482 P=1,399,472 P=827,807 P=4,245,241 P=13,861,129 P=3,016,239 P=175,303,947

- 226 -
*SGVFS039491*
The table below shows the credit quality of the Group’s financial assets as of December 31, 2019 and 2018 (amounts in thousands):
December 31, 2019Neither past due nor impaired Past due but
High Grade Medium Grade Low Grade Total not impaired Impaired Total
Cash and cash equivalents excluding cash onhand P=93,405,253 P=− P=− P=93,405,253 P=− P=− P=93,405,253
Short-term investments 13,387,801 − − 13,387,801 − − 13,387,801Other current assets FVTPL financial assets − 12,031,482 − 12,031,482 − − 12,031,482
Derivative assets 338,612 − − 338,612 − − 338,612 Deposits in escrow 239,526 − − 239,526 − − 239,526Other noncurrent assets
Deposits -others 3,330,646 − − 3,330,646 − − 3,330,646 Others 4,261,796 − − 4,261,796 − − 4,261,796Accounts and notes receivables
Trade Real estate and hotels 93,860,536 8,172,503 3,957,867 105,990,906 17,823,851 496,048 124,310,805 Electronics manufacturing 663,401 11,933,782 − 12,597,183 2,037,256 52,575 14,687,014
Automotive 1,099,742 − − 1,099,742 1,867,735 79,556 3,047,033 Power generation 4,641,254 − − 4,641,254 − 48,508 4,689,762 Outsourcing 199,940 − − 199,940 114,482 − 314,422
International and others 789,038 − − 789,038 60,947 − 849,985Receivable from related parties 8,269,213 2,711,255 416,391 11,396,859 3,044,898 49,471 14,491,228Receivable from officers employees 1,183,632 179,128 15,872 1,378,632 124,790 1,888 1,505,310
Concession financial receivable − − − − − − −Dividend receivable 145,010 − − 145,010 − − 145,010Receivable from BWC − − − − − − −Other receivable 1,384,578 − − 1,384,578 − − 1,384,578Financial assets at FVOCI Quoted shares of stocks 1,633,763 − − 1,633,763 − − 1,633,763
Unquoted shares of stocks − 4,269,733 − 4,269,733 − − 4,269,733
P=228,833,741 P=39,297,883 P=4,390,130 P=272,521,754 P=25,073,959 P=728,046 P=298,323,759

- 227 -
*SGVFS039491*
December 31, 2018Neither past due nor impaired Past due but Individually
High Grade Medium Grade Low Grade Total not impaired Impaired Total
Cash and cash equivalents excluding cash on hand P=60,583,510 P=– P=– P=60,583,510 P=– P=– P=60,583,510Short–term investments 5,956,489 – – 5,956,489 – – 5,956,489
Other current assetsFVTPL financial assets – 9,236,804 – 9,236,804 – – 9,236,804Deposits in escrow 322,666 – – 322,666 – – 322,666
Derivative assets 65,788 – – 65,788 – – 65,788Other noncurrent assets
Deposits -others 2,478,582 – – 2,478,582 – – 2,478,582
Others 2,365,311 – – 2,365,311 – – 2,365,311Accounts and notes receivables Trade
Real estate and hotels 122,114,418 3,670,685 3,057,064 128,842,167 8,586,540 872,268 138,300,975 Electronics manufacturing 333,809 12,924,628 – 13,258,437 2,838,052 105,908 16,202,397 Automotive 63,965 1,011,595 9,664 1,085,224 1,733,509 77,783 2,896,516
Water infrastructure 666,684 707,599 – 1,374,283 – 1,239,761 2,614,044 Power generation 611,919 – – 611,919 – 460,426 1,072,345
Outsourcing 84,460 – – 84,460 – 176,552 261,012 International and others 45,510 1,129 – 46,639 709 – 47,348
Receivable from related parties 6,137,662 2,011,628 310,102 8,459,392 421,663 83,541 8,964,596Receivable from officers employees 1,045,275 157,637 14,429 1,217,341 280,656 – 1,497,997Concession financial receivable 1,046,534 – – 1,046,534 – – 1,046,534
Dividend receivable 1,334,894 – – 1,334,894 – – 1,334,894Receivable from BWC – 388,411 – 388,411 – – 388,411Other receivable 388,518 – – 388,518 – – 388,518
Financial assets at FVOCI Quoted shares of stocks 2,058,460 – – 2,058,460 – – 2,058,460
Unquoted shares of stocks – 975,785 – 975,785 – – 975,785
P=207,704,454 P=31,085,901 P=3,391,259 P=242,181,614 P=13,861,129 P=3,016,239 P=259,058,982

- 228 -
*SGVFS039491*
The credit quality of the financial assets was determined as follows:
Cash and cash equivalents, short–term investments, FVTPL financial assets, quoted financial assetsat FVOCI and investment in bonds classified as loans and receivable, advances to other companiesand related party receivables
High grade pertains to cash and cash equivalents and short-term investments, quoted financialassets, investment in bonds classified as loans and receivable, related party transactions andreceivables with high probability of collection.
Medium grade pertains to unquoted financial assets other than cash and cash equivalents andshort–term investments with nonrelated counterparties and receivables from counterparties withaverage capacity to meet their obligation.
Low grade pertains to financial assets with the probability to be impaired based on the nature of thecounterparty.
Trade receivablesReal estate, BPO and international and others - high grade pertains to receivables with no default inpayment; medium grade pertains to receivables with up to 3 defaults in payment in the past; and lowgrade pertains to receivables with more than 3 defaults in payment.
Electronics manufacturing - high grade pertains to receivable with favorable credit terms and can beoffered with a credit term of 15 to 45 days; medium grade pertains to receivable with normal creditterms and can be offered with a credit term of 15 to 30 days; and low grade pertains to receivablesunder advance payment or confirmed irrevocable Stand-by Letter of Credit and subjected to semi-annual or quarterly review for possible upgrade or transaction should be under advance payment orconfirmed and irrevocable Stand-By Letters of credit; subject to quarterly review for possible upgradeafter one year.
Water infrastructure – high grade pertains to receivables that are collectible within 7 days from billdelivery; medium grade pertains to receivables that are collectible from 11 to 30 days from billdelivery.
Automotive – high grade pertains to receivables from corporate accounts and medium grade forreceivables from noncorporate accounts.
Unquoted financial assets at FVOCI – the unquoted investments are unrated.
34. Fair Value Measurement and Derivative Instruments
Fair Value of Financial and Nonfinancial InstrumentsThe carrying amounts approximate fair values for the Group’s financial assets and liabilities due to itsshort-term maturities except for the following financial instruments as of December 31, 2019 and2018 (amounts in thousands):
2019 2018
Carrying Value Fair Value Carrying Value Fair Value
FINANCIAL ASSETS AT FVTPL
Held for trading P=9,726,080 P=9,726,080 P=9,236,804 P=9,236,804Investment in bonds 2,305,402 2,305,402 – –Derivative assets
Embedded − − 65,324 65,324Freestanding 338,612 338,612 464 464
Total financial assets at FVTPL 12,370,094 12,370,094 9,302,592 9,302,592
(Forward)

- 229 -
*SGVFS039491*
2019 2018
Carrying Value Fair Value Carrying Value Fair ValueAT AMORTIZED COST
Accounts and notes receivables Noncurrent trade receivables Real estate P=42,994,112 P=42,994,112 P=35,437,047 P=35,437,047
Nontrade receivablesReceivable from officers and
employees 1,505,311 1,443,659 1,497,998 1,488,987
Concession financial receivable − − 1,517,892 2,358,369
Total loans and receivables 44,499,423 44,437,771 38,452,937 39,284,403
FINANCIAL ASSETS AT FVOCI
Quoted equity investments 1,633,763 1,633,763 2,200,447 2,200,447Unquoted equity investments 4,269,733 4,269,733 833,798 833,798
Total Financial assets at FVOCI 5,903,496 5,903,496 3,034,245 3,034,245
OTHER FINANCIAL ASSETSDeposits 3,570,171 3,570,171 2,801,248 2,801,248
Total Other Financial Assets 3,570,171 3,570,171 2,801,248 2,801,248
Total financial assets P=66,343,184 P=66,281,532 P=53,591,022 P=54,422,488
FINANCIAL LIABILITIES AT FVTPLFinancial liabilities on put option P=1,823,114 P=1,823,144 P=1,386,926 P=1,386,926
Other noncurrent liabilities - Contingentconsideration − − 195,920 195,920
1,823,114 1,823,144 1,582,846 1,582,846
OTHER FINANCIAL LIABILITIES
Long–term debt 375,549,514 370,299,700 372,743,387 360,945,172Service concession obligation 66,020 66,020 7,839,013 8,693,080Deposits and other noncurrent liabilities 54,552,768 48,496,423 35,141,427 31,241,007
Total other financial liabilities 430,168,302 418,862,143 415,723,827 400,879,259
Total financial liabilities P=431,991,416 P=420,685,287 P=417,306,673 P=402,462,105
The following methods and assumptions were used to estimate the fair value of each class offinancial instrument for which it is practicable to estimate such value:
Financial assets at FVTPL – Fair values of investment securities are based on quoted prices as of thereporting date. For other investment securities such as FVTPL with no reliable measure of fair value,these are carried at its last transaction price. Fair value of the bonds is based on binomial latticeapproach.
The fair value of the investment in UITF is based on net asset values as of reporting dates.
The fair value of the investment in ARCH Capital Fund is determined using the discounted cash flow(DCF) method. Under the DCF method in fund fair valuation, it is estimated using assumptionsregarding the benefits and liabilities of ownership over the underlying asset’s life including an exit orterminal value. This method involves the projection of a series of cash flows on a real propertyinterest. To this projected cash flow series, a market-derived discount rate is applied to establish thepresent value of the income stream, associated with the underlying asset. The exit yield is normallyseparately determined and differs from the discount rate. Significant inputs considered were rental,growth and discount rates. The higher the rental and growth rates, the higher the fair value. Thehigher the discount rates, the lower the fair value.
The fair value of other unquoted financial assets at FVTPL is determined using Weighted AverageCost of Capital using market comparable. The rate used is 5% in 2019 and 2018.
Derivative instrument – The fair value of the freestanding currency forwards is based on counterpartyvaluation. Derivative asset – The fair value is estimated using a modified stock price binomial treemodel for convertible callable bonds.
Noncurrent trade and nontrade receivables – The fair values are based on the discounted value offuture cash flows using the applicable rates for similar types of instruments. The discount rates usedranged from 6.25% to 13.50% and 2.90% to 6.37% as of December 31, 2019 and 2018.

- 230 -
*SGVFS039491*
Financial assets at FVOCI quoted equity securities – fair values are based on quoted pricespublished in markets.
Financial assets at FVOCI unquoted equity securities – fair values are based on the latest sellingprice available.
Financial liabilities on put options – These pertain to the liabilities of IMI Group arising from the writtenput options over the non-controlling interest of VIA and STI. The fair value of the financial liabilities isestimated using the discounted, probability-weighted cash flow method. The future cash flows wereprojected using the equity forward pricing formula with reference to the current equity value of theacquiree and the forecasted interest rate which is the risk-free rate in Germany and UK. The risk-freerate used is 0.17% and 0.26% for VIA and 0.74% and 0.91% for STI for 2019 and 2018.Management applied weights on the estimated future cash flows, based on management’s judgmenton the chance that the trigger events for the put option will occur.
The current equity value of VIA is determined using the discounted cash flow approach. The futurecash flows are projected using the projected revenue growth rate of VIA. The discount rate representsthe current market assessment of the risk specific to the acquiree, taking into consideration the timevalue of money and individual risks of the underlying assets that have not been incorporated in thecash flow estimates. The discount rate calculation is based on the specific circumstances of theacquiree and is derived from its weighted average cost of capital.
For STI, management used the market approach by approximating the EBITDA multiple taken fromcomparable companies of STI that are engaged in providing electronics services solutions to deriveits current equity value. Management computed EBITDA as the difference of forecasted gross profitand selling and administrative expenses before depreciation and amortization. Another significantassumption is the probability of trigger event occurring within the put option period.
Other financial liabilities - noncurrent – The fair values are estimated using the discounted cash flowmethodology using the Group’s current incremental borrowing rates for similar borrowings withmaturities consistent with those remaining for the liability being valued. This also include thecontingent consideration related to the acquisition of STI determined based on the specificcircumstances of the acquiree and is derived from its weighted average cost of capital. The discountrate is based on the specific circumstances of the acquiree and is derived from its weighted averagecost of capital. The discount rates used for Peso-denominated loans were 3.18% to 7.02% in 2019and 7.28% to 8.79% in 2018 while the discount rates used for the foreign currency-denominatedloans ranged 3.02% to 7.42% in 2019 and 5.22% to 7.53% in 2018.
For variable rate loans that reprice every three months, the carrying value approximates the fair valuebecause of recent and regular repricing based on current market rates.
The following table shows the fair value hierarchy of the Group’s assets and liabilities as atDecember 31, 2019 and 2018 (amounts in thousands):
2019
Quoted Prices in
Active Markets (Level 1)
SignificantObservable
Inputs(Level 2)
SignificantUnobservable
Inputs(Level 3) Total
Recurring financial assets measuredat fair value
Financial assets at FVTPL P=– P=85,724 P=11,945,758 P=12,031,482
Derivative assetsEmbedded – – – –Freestanding – – 338,612 338,612
Total Financial assets at FVTPL – 85,724 12,284,370 12,370,094
Financial assets at FVOCIQuoted equity investments 1,114,880 518,883 – 1,633,763
Unquoted equity investments – – 4,269,733 4,269,733
P=1,114,880 P=605,607 P=16,554,103 P=18,273,590

- 231 -
*SGVFS039491*
Quoted Prices inActive Markets
(Level 1)
Significant
ObservableInputs
(Level 2)
Significant
UnobservableInputs
(Level 3) Total
Recurring financial assets measuredat fair value
Financial assets at FVTPL P=– P=85,724 P=11,945,758 P=12,031,482Derivative assetsEmbedded – – – –
Freestanding – – 338,612 338,612
Total Financial assets at FVTPL – 85,724 12,284,370 12,370,094
Financial assets at FVOCI
Quoted equity investments 1,114,880 518,883 – 1,633,763Unquoted equity investments – – 4,269,733 4,269,733
Recurring financial assets for which fairvalues are disclosed:
Noncurrent trade and nontrade receivables P=– P=– P=44,437,771 P=44,437,771
Deposits – – 3,570,171 3,570,171
P=– P=– P=48,007,942 P=48,007,942
Recurring financial liabilities measured atfair value
Financial liabilities on put option P=– P=– P=1,584,703 P=1,584,703Derivative liabilitiesFreestanding – 238,411 – 238,411
P=– P=238,411 P=1,584,703 P=1,823,114
Recurring financial liabilities for which fair
values are disclosed:Long–term debt P=– P=– P=370,299,700 P=370,299,700Service concession obligation – – 66,020 66,020
Deposits and other noncurrent liabilities – – 48,496,423 48,496,423
P=– P=– P=418,862,143 P=418,862,143
Nonfinancial assets for which fair valuesare disclosed:
Investment properties P=– P=– P=495,845,136 P=495,845,136Investments in associates and
joint ventures* 278,883,519 – – 278,883,519
P=278,883,519 P=– P=495,845,136 P=774,728,655
*Fair value of investments in listed associates and joint ventures for which there are published price quotations
2018
Quoted Prices in
Active Markets(Level 1)
SignificantObservable
Inputs(Level 2)
SignificantUnobservable
Inputs(Level 3) Total
Recurring financial assets measuredat fair value
Financial assets at FVTPL P=– P=85,724 P=9,151,080 P=9,236,804
Derivative assetsEmbedded – – 65,324 65,324Freestanding – – 464 464
Total Financial assets at FVTPL 85,724 9,216,868 9,302,592
Financial assets at FVOCIQuoted equity investments 2,200,447 – – 2,200,477
Unquoted equity investments – – 833,798 833,798
P=2,200,447 P=85,724 P=10,050,666 P=12,336,837
Recurring financial assets for which fairvalues are disclosed:
Trade and nontrade receivables P=– P=– P=36,926,034 P=36,926,034Concession financial receivable – – 2,358,369 2,358,369Deposits – – 2,801,248 2,801,248
P=– P=– P=42,085,651 P=42,085,651
Recurring financial liabilities measured at
fair valueFinancial liabilities on put option P=– P=– P=1,371,226 P=1,371,226Derivative liabilities
Freestanding 15,700 15,700Contingent consideration (noncurrent liability) – – 195,920 195,920
P=– – P=1,582,846 P=1,582,846

- 232 -
*SGVFS039491*
Quoted Prices inActive Markets
(Level 1)
Significant
ObservableInputs
(Level 2)
Significant
UnobservableInputs
(Level 3) Total
Recurring financial liabilities for which fairvalues are disclosed:
Long–term debt – – P=360,945,172 P=360,945,172
Service concession obligation – – 8,693,080 8,693,080Deposits and other noncurrent liabilities – – 31,241,007 31,241,007
P=– P=– P=400,879,259 P=400,879,259
Nonfinancial assets for which fair values
are disclosed:Investment properties P=– P=– P=495,845,136 P=495,845,136Investments in associates and
joint ventures* 296,311,034 – – 296,311,034
P=296,311,034 P=– P=495,845,136 P=792,156,170
*Fair value of investments in listed associates and joint ventures for which there are published price quotations
There was no change in the valuation techniques used by the Group in determining the fair marketvalue of the assets and liabilities.
There were no transfers between Level 1 and Level 2 fair value measurements, and no transfers intoand out of Level 3 fair value measurements.
The following table presents the valuation techniques and unobservable key inputs used to value theGroup’s financial assets and liabilities categorized as Level 3:
December 31, 2019
Valuation TechniqueUnobservable
inputsRange of
unobservable inputs Sensitivity of the input to the fair value
Financial assets atFVTPL
Market comparable Weighted averagecost of capital(WACC)
5% to 10% 5% increase / (decrease) in WACC wouldresult in increase / (decrease) in fair value
by US$5,200,723/
(US$5,200,723)
10% increase / (decrease) in WACC would
result in increase / (decrease) in fair valueby US$10,401,445/
(US$10,401,445)
Financial liabilitieson put options
Discounted,probability-weightedcash flow method
Growth rate 0% - 2% (1%) 1% increase in growth rate would result in anincrease in fair value by US$1.59 million.
Decrease in growth rate by 1% would result ina fair value decrease of US$1.25 million.
Discount rate 8% - 10% (9%) 1% increase in discount rate would result in adecrease in fair value by US$1.83 million.
Decrease in discount rate by 1% would resultin a fair value increase of US$2.31 million.
Probability of trigger
events occurring
1% - 10% (5%) Increase in the probability to 10% wouldresult in an increase in fair value by
US$0.77 million. Decrease in the probabilityto 1% would result in a decrease in fair value
by US$1.17 million.

- 233 -
*SGVFS039491*
December 31, 2018
Valuation Technique
Unobservable
inputs
Range of
unobservable inputs Sensitivity of the input to the fair value
Financial assets atFVTPL
Market comparable Weighted averagecost of capital
(WACC)
5% to 10% 5% increase / (decrease) in WACC wouldresult in increase / (decrease) in fair value
by US$5,200,723/(US$5,200,723)
10% increase / (decrease) in WACC would
result in increase / (decrease) in fair valueby US$10,401,445/
(US$10,401,445)
Financial liabilitieson put options
Discounted,probability-weighted
cash flow method
Growth rate 0% - 2% (1%) 1% increase in growth rate would result in anincrease in fair value by US$1.78 million.
Decrease in growth rate by 1% would result ina fair value decrease of US$1.40 million.
Discount rate 10% - 12% (11%) 1% increase in discount rate would result in adecrease in fair value by US$1.82 million.
Decrease in discount rate by 1% would resultin a fair value increase of US$2.32 million.
Probability of triggerevents occurring
1% - 10% (5%) Increase in the probability to 10% wouldresult in an increase in fair value by
US$0.71 million. Decrease in the probabilityto 1% would result in a decrease in fair value
by US$1.08 million.
Other noncurrent
liabilities(contingentconsideration)
Discounted,
probability-weightedpayout
Discount rate 7% - 9% (8%) 1% increase in growth rate for the remainingperiod of the contingent consideration wouldresult in an increase in contingent liability ofUS$1.87 million. Decrease in growth rate by1% would result to a decrease in contingent
liability of US$0.01 million.
Probability of pay-out
£0 to £23.3 million($0 to $30.20 million)
£0 to £2.9 million (US$0 to US$3.7 million)
ALI Group categorizes trade receivable, receivable from employees, long-term debt and deposits andother noncurrent liabilities under Level 3. The fair value of these financial instruments is determinedby discounting future cash flows using the applicable rates of similar types of instruments plus acertain spread. This spread is the unobservable input and the effect of changes to this is that thehigher the spread, the lower the fair value.
A reconciliation of the beginning and closing balances of Level 3 financial assets and liabilities atFVTPL are summarized below:
Financial Assets at FVTPL 2019 2018
At January 1 P=9,236,804 P=5,980,607Additions 3,132,039 4,939,944Recognized in consolidated statement of income 528,011 996,170Adoption of PFRS 9 – 1,087,593Disposals/redemptions/return of capital – (3,253,958)Exchange difference and others (865,372) (513,552)
At December 31 P=12,031,482 P=9,236,804
Financial Liabilities at FVTPL 2019 2018
At January 1 P=1,567,146 P=2,341,131Additions – −Recognized in consolidated statement of income 114,373 (837,144)Exchange difference and others (96,816) 63,159
At December 31 P=1,584,703 P=1,567,146

- 234 -
*SGVFS039491*
Derivatives
2019 2018
Derivative AssetsCall option of AC Industrial P=332,485 P=–Currency forward of AIVPL 5,857 –Forward contract of IMI 270 –Prepayment option of ACEI – 65,788
P=338,612 P=65,788
Derivative Liabilities Forward contract of ACEI P=238,411 P=15,700
Financial liabilities on put optionsThe acquisition of VIA in 2016 and STI in 2017 included call and put options over the non-controllinginterests. The put options resulted in a financial liability of US$22.4 million and US$26.1 million as ofDecember 31, 2019 and 2018, respectively.
Minority shareholder of C-CON Group have the right to require MT Technologies to purchase andacquire all its shares. The option can be exercised after the holding period, which is defined as the8th anniversary year after the acquisition date, April 1, 2019. Based on the management's judgment,the put options will be exercise by the minority shareholders on April 1, 2027 or the 8th anniversaryyear after the acquisition date.
Free standing derivativesAs of December 31, 2019, the outstanding forward contracts have a net fair value of $5,321. Thechanges in fair value of currency forwards recognized in 2019 amounted to $0.02 million. Thechanges in fair value of currency forwards are recognized in the consolidated statements of incomeunder “Foreign exchange gains (losses)” account.
AC Industrials call option – Majority shareholder of MT Technologies have the right to require C-CONHolding (Exit Call Option) to sell all of its shares if NCI is no longer member of the C-CONmanagement. Strike price is based on 6.0x of weighted average EBITDA less Net Debt (Cash)multiplied by the shareholding rate (25.1%). Based on the management's judgment, the earliest timethat MT can exercise its option is after 10 years or upon retirement of NCI.
Embedded derivativesBHLConvertible bondsIn June 2014, BHL invested VND113 billion (equivalent to USD5.3 million) in CII convertible bondsthrough its wholly owned subsidiary, VIP. These bonds have a maturity of 5 years, and a coupon rateof 5% per annum.
On June 23, 2016, the third bond conversion exercise, BHL Group converted 69,235 bonds into6,293,461 shares at a closing price of VND 26,500 per share. Based on the initial bond offeringsubmission made by CII, the conversion ratio would be 90.9:1 (1 convertible bond to 90.9 shares),where the number of converted shares will be rounded down to the next last whole number. Thisconversion increased the investment in CII shares by VND 166.6 billion (equivalent to US$7.5million).
BHL Group recognized a total gain of VND 37.9 million (US$1.7 million) on the conversion exercise,out of which VND 28.3 million (US$1.3 million) was the gain on the difference between the CII shareprice on the date of conversion and the carrying amount of convertible bond, and VND 9.6 million(US$ 0.4 million) was the gain on the realization of the valuation reserve previously recorded on theconvertible bonds (see Note 24).

- 235 -
*SGVFS039491*
In 2017, the last bond conversion exercise, BHL Group converted 43,755 bonds into 3,977,329shares at a closing price of VND 37,250 per share. Based on the initial bond offering submissionmade by CII, the conversion ratio would be 90.9:1 (1 convertible bond to 90.9 shares), where thenumber of converted shares will be rounded down to the next last whole number. This conversionincreased the investment in CII shares by VND 148.2 billion (equivalent to US$6.7 million). BHLGroup recognized a total gain of VND91.4 billion (US$4.0 million) on the conversion exercise, out ofwhich VND 35.7 billion (US$1.6 million) was the gain on the difference between the CII share price onthe date of conversion and the carrying amount of convertible bond, and VND 55.7 million (US$ 2.4million) was the gain on the realization of the valuation reserve previously recorded on the convertiblebonds (see Note 24).
ACEI
On January 31, 2017, the Group executed a five (5) year contract with SLPGC, which owns and
operates 2 x 150 MW coal-fired power generating plant in Calaca, Batangas. The contract is effective
from February 26, 2017 up to December 25, 2021 and covers contracted capacity of 50MW which
enables AC Energy to meet the electricity requirements of its retail customers. Under the contract,
the Group has the obligation to pay SLPGC the Exposure Adjustment and the Group or SLPGC, as
the case may be has the obligation to pay the Exposure Adjustment in accordance with the fee
computation formula agreed to by both parties.
On June 26, 2017, ACEI entered into a three (3) year contract with DirectPower Services Inc.
(“DPSI”) (an affiliate) effective from June 26, 2017 up to June 25, 2020. The contract enables DPSI
to meet the electricity requirements of its customers. Under the contract, the Parent Company or
DPSI, as the case may be has the obligation to pay the Exposure Fee in accordance with the fee
computation formula agreed to by both parties.
The contracts with SLPGC and DPSI resulted to a fair value losses in 2019 and 2018 amounting toP=222.7 million and P=15.7 million, respectively. The fair value of derivative liability as of December 31,2019 and 2018 amounted to P=238.4 million and P=15.70 million, respectively.
Fair Value Changes on DerivativesThe net movements in fair values of the Group’s derivative instruments as of December 31, 2019 and2018 follow (amounts in thousands):
Derivative Assets2019 2018
Balance at beginning of year P=65,324 P=85,347Additions during the year 365,273 −Fair value of currency forwards − −Net changes in fair value of derivatives 287,780 45,035
718,377 130,382Fair value of settled instruments − (65,058)Reclassification to PFRS 5 (379,765) −Balance at end of year P=338,612 P=65,324
Derivative Liabilities
2019 2018
Balance at beginning of year P=15,700 P=7,328Net changes in fair value of derivatives 222,711 15,700
238,411 23,028Fair value of settled instruments − (7,328)
Balance at end of year P=238,411 P=15,700
No other financial assets or liabilities are carried at fair value as of December 31, 2019 and 2018.

- 236 -
*SGVFS039491*
Net changes in fair value of derivative asets and liabilities was recognized in the consolidatedstatement of income under “Other Income”. However, the net changes in fair value of IMI Group’sfreestanding currency forward are recognized in the consolidated income under “Foreign exchangegains (losses)” (see Note 23).
35. Notes to Consolidated Statements of Cash Flows
Changes in liabilities arising from financing activities follow:
January 1,2019
CashFlows
Non-cashChanges
Foreign
ExchangeMovement
December 31,2019
Short-term debt andLong-term debt P=412,261,632 P=87,004,660 (P=37,737,749)* P=160,600 P=461,689,143
Dividends payable 4,131,317 (11,919,555) 12,284,524** − 4,496,286
Other noncurrent liabilities 53,844,163 (749,826) (4,646,967) − 48,447,370Lease liabilities – (2,051,769) 24,481,711*** (48,776) 22,381,166Service concession obligation 7,839,013 (838,286) (6,934,708)**** − 66,019
Total liabilities fromfinancing activities P=478,076,125 P=71,445,224 (P=12,553,189) P=111,824 P=537,079,984
*includes accounts of segments reclassified to PFRS 5 (GNPK and MWC), result of business combination (Generika Group, ACEPH and SLTEC)
and conversion of exchangeable bonds**Pertains to dividends declared by the Parent Company and by its subsidiaries to the non-controlling shareholders during the year
***includes adoption of PFRS 16 and additions during the year****Pertains to additions to service concession obligation and reclassification to PFRS 5
January 1,2018
CashFlows
Non-cashChanges
ForeignExchangeMovement
December 31,2018
Short-term debt andLong-term debt P=350,611,952 P=51,310,587 P=4,318,490 P=6,020,603 P=412,261,632
Dividends payable 3,618,607 (10,769,923) 11,282,633* − 4,131,317Other noncurrent liabilities 43,233,816 3,572,007 (1,591,894) − 45,213,929Service concession obligation 7,447,677 (955,120) 1,386,684 49,286 7,928,527
Total liabilities fromfinancing activities P=404,912,052 P=43,157,551 P=15,395,913 P=6,069,889 P=469,535,405
*This amount pertains to dividends declared by the Parent Company and by the subsidiaries to the non-controlling shareholders during the year.
The Group’s noncash investing and financing activities are as follows:
2019
· Recognition of right-of-use assets and lease liabilities amounting to P=18,532.7 million andP=21,564.1 million, respectively, upon adoption of PFRS 16
· Additions to right-of-use assets and lease liabilities during the year amounting to P=1,632.1 millionand P=1,711.5 million
· Conversion of $292.8 million bonds from AYCFL US$300.0 million guaranteed exchangeablebonds to 377,465,612 ALI ordinary shares (see Note 19)
· Reclassification of assets and liabilities of MWC and GNPK to PFRS 5 (see Note 25)
· Merger of AC Education, Inc. and iPeople, Inc. (see Notes 10 and 24)
· Transfer from investment properties to inventories amounting to P=11,830.0 million
· Transfer from inventories to investment properties amounting to P=674.9 million
· Transfer from investment properties to property and equipment amounting to P=644.1 million
· Transfer from property and equipment to investment properties amounting to P=133.1 million
· Transfer from right-of-use assets to investment properties amounting to 98.7 million
· Unpaid acquisition of investment properties amounting to P=7,392.2 million
2018
· Transfer from investment properties to inventories amounting to P=7,446.2 million.
· Transfer from inventories to investment properties amounting to P=116.4 million.
· Transfer from investment properties to property and equipment amounting to P=4,900.6 million.

- 237 -
*SGVFS039491*
· Transfer from investment properties to other noncurrent assets amounting to P=60.0 million.
· Acquisitions of property, plant and equipment amounting to P=346.2 million
· Acquisitions of SCA amounting to P=20.8 million.
· Capitalization of depreciation related to the development phase of certain projects amounting toP=80.4 million.
· Consolidation of previously held interest in MCT amounting to P=6.9 billion.
· Reclassification of investments in GMCP and GNPD to noncurrent asset held for sale amountingto P=5.6 billion.
2017
· Tansfer from land and improvements to inventories amounting to P=10,908.5 million.
· Transfer from inventories to investment properties amounting to P=2,454.9 million.
· Transfer from land and improvements to investment properties amounting to P=1,905.0 million.
· Transfer from investment properties to land and improvements amounting to P=646.2 million.
· Transfer from investment properties to property and equipment amounting to P=1,764.6 million.
· Transfer from investment properties to other current and noncurrent assets amounting toP=86.3 million and P=62.1 million, respectively.
· Transfer from advances to contractors to land and improvements amounting to P=1,581.2 million
· Capitalization of depreciation related to the development phase of certain projects amounting to P=57.4 million.
· Transfer from other noncurrent assets to intangible assets mounting to P=1,195.4 million.
· Conversion of BHL’s 69,235 investment in CII bonds to 6,293,461 shares.
36. Commitments
Parent CompanyThe Parent Company acted as guarantor to AYCFL’s term loans and credit facilities as follows:
Amount
drawn as of 2019 2018
Description of Facility Date Contracted
December 31,
2019 Outstanding balance
(In Thousands)
US$200 million Revolving
Credit Facility March 18, 2016 US$200,000 US$– US$10,000
US$200 million Transferrable
Loan Facility February 1, 2018 100,000 – 10,000
US$300,000 US$– US$20,000
On February 1, 2018, AYCFL entered a US$200.0 million revolving credit facility with an availabilityperiod of up to one (1) month prior to February 1, 2023. The first drawdown of the credit facilityamounted to US$10.0 million on September 6, 2018 with a quarterly repricing rate. The seconddrawdown of the credit facility amounting to US$30.0 million was made on February 22, 2019 and thethird drawdown amounting to US$60.0 million was made on March 7, 2019. The outstanding balanceof the credit facility were fully settled on various dates during the year.
On September 6, 2018, AYCFL drew down US$10.0 million with a quarterly repricing rate from itsUS$200 million revolving credit facility contracted on March 18, 2016. The second drawdown of thecredit facility amounting to US$100.0 million was made on April 2, 2019 and the third drawdownamounting to US$90.0 million was made on April 8, 2019. The outstanding balance of the creditfacility were fully settled on various dates during the year.
The Parent Company unconditionally guarantees the due and punctual payment of these loandrawdowns if, for any reason AYCFL does not make timely payment of the amount due. The ParentCompany waived all rights of subrogation, contribution, and claims of prior exhaustion of remedies.

- 238 -
*SGVFS039491*
The Parent Company’s obligation as guarantor will remain in full force until no sum remains to be lentby the lenders, and the lenders recover the outstanding loan drawdowns.
On May 2, 2014, AYCFL issued at face US$300.0 million Exchangeable Bonds (the Bonds) due onMay 2, 2019 with a fixed coupon rate of 0.50% per annum, payable semi-annually. The Bonds areguaranteed by the Parent Company and constitute direct, unsubordinated, unconditional andunsecured obligations of AYCFL, ranking pari passu and without any preference or priority amongthemselves. The Bonds were listed in the Singapore Stock Exchange and include features such asexchange option, put option and early redemption options. The Bondholders have the right toexchange their Bonds for shares at any time during the exchange period. AYCFL shall lodgesufficient shares in its securities account to service Exchange Rights. In consideration for thereservation of the shares and by way of deposit for the exercise by the Bondholders of the ExchangeRight, AYCFL shall remit to the Parent Company from time to time such amount as may be agreedbetween them, as defined in the Exchange Protocol agreed between AC and AYCFL.
On April 30, 2019, the remaining AYCFL US$292.8 million guaranteed exchangeable bonds as ofDecember 31, 2018 was exchanged and converted into total of 377.5 million ALI ordinary commonshares. On May 2, 2019, the Bonds has zero outstanding balance.
On September 7, 2017, the Parent Company announced that AYCFL had successfully set the termsof a US dollar-denominated fixed-for-life senior perpetual issuance at an aggregate principal amountof US$400 million with an annual coupon of 5.125% for life with no reset and step-up. The issuer,AYCFL, may redeem the Notes in whole but not in part on September 13, 2022 (first redemptiondate) or any interest payment date falling after the first redemption date at 100% of the principalamount of the Notes plus any accrued but unpaid interest. The Parent Company unconditionallyguarantees the due and punctual payment of this note if, for any reason AYCFL does not make timelypayment of the amount due.
On October 23, 2019, the Parent Company announced that it had successfully set the terms of a USdollar-denominated fixed-for-life (non-deferrable) senior perpetual issuance at an aggregate principalamount of US$400 million with a fixed coupon of 4.850% for life with no step-up and no reset,payable semi-annually. The bonds will be issued by AYCFL and will be unconditionally andirrevocably guaranteed by the Parent Company. The bonds were priced at par with a re-offer yield of4.850%, reflecting a 27.5 basis points compression from the initial price guidance. The final orderbook was over four times oversubscribed with the order book allocated predominantly to Asia, withthe rest to Europe, reflecting the strong investors' confidence in the Ayala name. By investor type,more than half of the offering was allocated to fund managers, insurance companies and pensionfunds, around one-quarter to banks and financial institutions and the remainder to private banks. Thetransaction was settled on October 30, 2019.
ALI GroupALI-NTDCCOn December 8, 2017, ALI assigned to NTDCC development rights on certain portions of the NorthTriangle lot pads covered by a Deed of Assignment and Encroachment Settlement Agreementamounting to P=631.2 million.
ALI-LT GroupALI and LT Group, Inc. (LTG) entered into an agreement on January 21, 2016 to jointly develop aproject along the C5 corridor. The project is envisioned to be a township development that spansportions of Pasig City and Quezon City. A new company named, ALI-ETON Property DevelopmentCorporation (ALI-ETON), was incorporated on March 13, 2016.
On January 15, 2018, the estate, named Parklinks was launched and is the greenest urban estate ofAyala Land in partnership with Eton Properties Inc. The first residential project of Ayala LandPremier, Parklinks North Tower was launched on the same year, while the Parklinks lifestyle mallbroke ground as well, expected to provide a new destination for residents and office workers withinthe area when it opens in 2023. With the brisk residential sales of ALP’s first project, the Parklinks

- 239 -
*SGVFS039491*
South tower was launched in 2019, together with Alveo’s first residential development “TheLattice”.
Also set to rise within the estate will be an iconic bridge that will conveniently connect the QC andPasig parcels, offering a new route that can help ease vehicular traffic in the north eastern andeastern portions of Metro Manila. The bridge is expected to be completed by early 2021.
ITS South ProjectOn August 11, 2015, ALI won the bid for the Integrated Transport System Project - South Terminal(the ITS South Project). ALI was awarded by the Department of Transportation and Communications(DOTC) with a 35-year concession agreement to build and operate the ITS South Project and willlikewise have the right to develop and operate commercial leasing facilities on the same 5.57 hectareFood Terminal Inc. property on which the future transport terminal will be built. The site of the ITSSouth Project is right next to ARCA South, where ALI is developing an integrated mixed-use estate.It is estimated that up to 4,000 buses and 160,000 passengers will feed into ITS South from SLEXevery day. Full blast construction of the terminal started in the 2nd half of 2018 and targeted to beoperational by 1st half of 2020.
SM-ALI Group ConsortiumOn June 30, 2015, ALI, through SM-ALI Group consortium (the Consortium), participated and won inthe bidding for Lot No. 8-B-1, containing an area of 263,384 square meters, which is portion of CebuCity-owned lot located at the South Road Properties, Cebu City covered by Transfer Certificate ofTitle No. 107-2011000963. The Consortium is a consortium among SM Prime Holdings, Inc.(SMPHI), ALI and CHI (collectively referred to as the ALI Group). Consistent with the agreedpayment schedule in the Deed of Absolute Sale, the ALI Group has paid P=3.8 billion, excluding taxes,as of August 1, 2017. The SM-ALI Group has finished with the joint masterplan and has secured thedevelopment permit last November 2019 from the Cebu City Council.
Assignment Agreement between Metro Rail Transit Corporation (Metro Rail) and MRTDCOn August 8, 1997, an Assignment Agreement was executed between Metro Rail whereby MRTDCagreed to be bound by all obligations in respect of the Development Rights and make payments toDOTC.
Assignment Agreement between MRTDC and NTDCCOn February 21, 2002, MRTDC and NTDCC entered into an assignment agreement wherein thedevelopment rights of MRTDC over an 8.3 hectare portion of the MRT Depot (inclusive of projectdevelopment costs incurred in relation thereto) was assigned to NTDCC in exchange for 32.6 millionshares of stock to be issued out of the increase in the authorized capital stock of NTDCC, each sharewith a par value of P=10, or an aggregate par value of P=326.0 million. The amount of developmentrights in excess of the aggregate par value of the shares subscribed was credited to additional paid-incapital.
On January 13, 2006, the deed of assignment between MRTDC and NTDCC was acknowledged byDOTC making MRTDC and NTDCC jointly and severally liable for the DRP and all other obligationsattached thereto. NTDCC has been paying rent to DOTC in behalf of MRTDC since January 1, 2006.The DRP obligation is payable annually for 42 years from the date of assumption, renewable uponexpiration. As of December 31, 2019 and 2018, the DRP obligation amounted to P=3,778.2 millionand P=1,001.1 million, respectively. Total DRP obligation paid amounted to P=236.4 million andP=229.8 million in 2019 and 2018, respectively. Total rent expense recognized in the statements ofcomprehensive income under the “Cost of sales” account included in direct operating expensesamounted to nil and P=318.0 million in 2019 and 2018, respectively.
Memorandum of Agreement between DOTC, NHA, MRTDC, NTDCCOn March 21, 2007, DOTC, National Housing Authority (NHA), MRTDC, and NTDCC entered into aMOA whereby DOTC assigns, transfers and conveys to NHA, its successors or assigns, the right todemand and collect the Depot DRP Payable and Depot DRP. In the MOA, DOTC authorizes

- 240 -
*SGVFS039491*
MRTDC/NTDCC to remit the Depot DRP Payable and the Depot DRP to NHA directly which shall becredited by DOTC in favour of MRTDC/ NTDCC as payment for the DRP.
Funding and Repayment Agreement between NTDCC, MRTDC and MRTDC ShareholdersOn December 17, 2014, NTDCC, MRTDC and MRTDC shareholders executed a “Funding andRepayment Agreement” wherein the latter agrees to repay NTDCC, for the account of MRTDC, itsrespective pro rata share in the Total Depot DRP Advances (the Pre-2006 DRP Payables and theResidual Depot DRP, including 15% interest rate accrued on such DRP payables).
Long-term Management Agreement between AHRC and Mandarin Oriental Hotel GroupOn June 4, 2014, AHRC, a wholly owned subsidiary of ALI has signed a long-term managementagreement with the Mandarin Oriental Hotel Group to develop and operate luxury hotel in Makati City.Set to open its doors by 2020, the new Mandarin Oriental Manila will be featuring 275 spacious roomscomplemented by an extensive range of modern amenities including premium selection of restaurantsand a signature spa. ALI Group is committed to pay US$5 million (P=223.6 million) to Manila MandarinHotel, Inc. upon the opening of the New Hotel or June 30, 2017, whichever is earlier. In 2017, ALIfully paid the said amount.
ALI-SPIOn May 12, 2014, ALI has signed the terms of reference with Sureste Properties, Inc. (SPI), a whollyowned subsidiary of Bloomberry Resorts Corp. (BLOOM) for the retail area to be opened in the newPhase 1-A of Solaire Resort & Casino. ALI will be the leasing and marketing agent of the said areawith gross leasable area of more than 5,000 sqm.
Concession AgreementsConcession Agreement between ASITI and DOTrOn January 26, 2016, ALI Group through ASITI entered into a Concession Agreement (CA) with theDepartment of Transportation (DOTr). The CA sets forth the rights and obligations of ASITI asconcessionaire, including the construction and operation of the South Integrated Transport SystemProject (the Project) of DOTr. During the concession period, DOTr will monitor and review theperformance of the concessionaire.
The concession will run for a period of 35 years from the start of the construction of the Project.Under the terms of the concession agreement, ASITI will design, engineer, construct, operate andmaintain a mass transportation intermodal terminal at the outskirts of Metro Manila. The operation ofthe Project includes the collection and remittance of terminal fees to DOTr of the concessionaireduring the concession period. In addition, ASITI will be permitted to develop and operate commercialleasing facilities.
Upon the start of the construction the Project, DOTr will give to ASITI the full, exclusive anduninterrupted use and possession of a 5.57 hectare property known as the Project Land. Ownershipof the Project Land shall remain with DOTr at all times while the possession, custody and risk of lossor deterioration of the Project and commercial assets shall vest in the concessionaire during theconcession period. ASITI shall transfer the Project and the related assets, free from any liens orencumbrances, to DOTr at the end of the concession period. ASITI will be entitled to annualpayments from DOTr amounting to P=277.9 million during the 35-year concession period, subject tomeeting benchmarks set for certain key performance indicators enumerated in the CA.
As of December 31, 2019, construction of the Project has not yet commenced.
Parent Company’s Concession AgreementIn 2012, the Parent Company entered into a concession agreement with the DPWH to finance,design, construct, operate and maintain the Daang Hari - SLEX Link Road, now known as theMuntinlupa-Cavite Expressway(MCX) [the Project]. Under the concession agreement, the ParentCompany will:a. Purchase the advance works on Segment I of the Project and finance and construct the
remaining works thereof;

- 241 -
*SGVFS039491*
b. Finance, design, and construct Segment II of the Project;c. Undertake the operations and maintenance of the Project;d. Impose and collect tolls from the users of the Project; ande. Grant business concessions and charge and collect fees for non-toll user related facilities and toll
user related facilities situated in the Project.
The Parent Company is authorized to adjust the toll rates once every two years in accordance with aprescribed computation as set out in the concession agreement and upon compliance with the rulesand regulations on toll rate implementation as issued or may be issued by the Toll Regulatory Board.
In the event that the Parent Company is disallowed from charging and collecting the authorizedamounts of the toll rates as prescribed in the concession agreement from the users of the Project, theParent Company shall be entitled to either of the following:
a. Compensation from the DPWH of the toll income forgone by the Parent Company which shall becalculated based on a prescribed computation under the concession agreement.
b. Extension of the concession period to compensate the Parent Company for the forgone tollincome which shall be mutually agreed by the Parent Company and the DPWH.
The Parent Company shall pay the DPWH an amount equal to 5% of all gross revenues arising fromnon-toll user and toll user related facilities situated within the Project.
The concession period shall commence on the date of the issuance of the Notice to Proceed withSegment II and shall end on the date that is 30 years thereafter, unless otherwise extended orterminated in accordance with the concession agreement. Any extension of the concession periodshall in no event be beyond 50 years after the date of the issuance of the Notice to Proceed withSegment II.
At the end of the Concession Period, the Project shall be turned over by the Parent Company to theDPWH in the condition required for turnover under the Concession Agreement.
In accordance with the Concession Agreement, the Parent Company shall have the right to imposeand collect toll fees (inclusive of value-added tax) from the users of the MCX at the following rates:
Vehicle Class Initial Toll Rate (flat rate)
Class 1: Light vehicles P=17.00Class 2: Medium-weight vehicles 34.00Class 3: Heavy vehicles 51.00
Periodic Toll AdjustmentOn September 27, 2016, the Parent Company has filed for a Petition for Approval of Periodic TollAdjustment. Under Section 13.2 of the Concession Agreement, Concessionaire is authorized toadjust the Toll Rate every two years. Since MCX commercially operated on July 24, 2015, the ParentCompany is entitled to adjust its toll for MCX effective July 24, 2017. However, under Section 3 of the2013 Revised Rules of Procedure of the Toll Regulatory Board (TRB), the petition has to be filed onor before 30 September. Thus, the Petition was filed knowing fully well that the effectivity of theadjusted toll rate will still be on July 24, 2017.
On June 19, 2017, TRB sent an order directing the publication of the full petition in a newspaper ofgeneral circulation, along with the notice to expressway users that they may file an opposition withinthe period provided for under the Rules. Accordingly, the full petition was published on July 25, 2017.On November 8, 2017, all TRB requirements for the approval of the toll rate increase were submitted.
On September 28, 2018, the second toll rate increase petition has been submitted to the TRB and theorder directing the publication of the full petition in a newspaper of general circulation, along with thenotice to expressway users that they may file an opposition within the period provided for under the

- 242 -
*SGVFS039491*
Rules, was sent by TRB on October 26, 2018. Accordingly, the petition was published onNovember 13, 2018. No opposition has been reported until the prescribed filing period.
On March 26, 2019, the approved resolution of the TRB on the petition with Application forProvisional Relief was received. The approved new toll rates are as follows.
Vehicle Class AdjustedToll Rate (flat rate)
Class 1: Light vehicles P=17.00Class 2: Medium-weight vehicles 35.00Class 3: Heavy vehicles 52.00
As indicated in the resolution, prior to TRB’s issuance of the Notice to Start Collection, the ParentCompany is directed to publish the approved new rates applicable to MCX Expressway (inaccordance with TRB rules) and to submit proof of such publication.
Interoperability AgreementOn July 21, 2015, the Parent Company, MCX Tollway, Inc. (MCXI) (an 80% owned subsidiary of ACInfra), South Luzon Tollway Corporation (SLTC), and Manila Toll Expressway Systems, Inc. (MATES)signed a Memorandum of Agreement on the Interoperability together with an Addendum thereto(“MOA on Interoperability”) of the Project and the SLEX. The MOA on Interoperability provides theframework that will govern the interface and integration of the technical operations and toll collectionsystems between the Project and SLEX, and to ensure seamless travel for road users.
On the same date, MATES and MCXI also executed a Toll Collection Services Agreement, underwhich, MATES was appointed as sub-contractor of MCXI for the provision of toll collection servicesfor the MCX toll plaza.
On September 15, 2017, the Parent Company and MCXI together with San Miguel HoldingsCorporation, Private Infra Development Corporation, Citra Metro Manila Tollways Corporation,Skyway O&M Corporation, Citra Central Expressway Corporation, Vertex Tollways DevelopmentIncorporated, SLTC, MATES, Star Infrastructure Development Corporation, Star Tollway Corporation,Metro Pacific Tollways Corporation, NLEX Corporation, Cavitex Infrastructure Corporation, MPCalaHoldings Inc., Bases and Conversion Development Authority, Department of Transportation,Department of Public Works and Highways, Land Transportation Office and Toll Regulatory Boardsigned the Memorandum of Agreement for Toll Collection Interoperability (MOA). The MOA aims for atimely, smoothly, and fairly implementation of the ETC Systems and Cash Payment Systems’interoperability of the covered expressways. As of December 31, 2019, discussions are ongoingamong and between the parties for the implementation of the MOA.
Operations and Maintenance ContractsThe Parent Company shall have the exclusive right and corresponding obligation to undertake theO&M of the Project. As such, on December 19, 2014, the Parent Company entered into anOperations and Maintenance Agreement (OMA) wit h MCXI for the operations and maintenance ofthe Project. The OMA has a term of seven (7) years, renewable for another seven (7) years, with theright of first offer in favor of MCXI. As compensation, the Parent Company shall pay an annualrecurring fee of P=77.6 million, exclusive of VAT, subject to yearly escalation using the Consumer PriceIndexation formula.
On the same date, MCXI signed two contracts with EGIS Projects Philippines, Inc. (Egis):
a. Operations Advisory Contract – to provide advice, among others, on the establishment andimplementation of procedures to enforce traffic regulations and safety measures in MCX; and
b. Maintenance Contract – to provide cleaning, inspection, repairs and maintenance on all parts ofMCX, its landscaping, traffic signs and others.

- 243 -
*SGVFS039491*
Both contracts have a term of seven (7) years and renewable for another seven (7) years. Theannual recurring fee for both contracts is P=18.2 million, exclusive of VAT, and P=40.9 million, exclusivefor VAT, respectively and subject to yearly escalation to the effect of changes in labor index rates andconsumer price index as provided by the Department of Labor and Employment.
In 2016, the Parent Company amended its existing O&M agreement with MCXI reducing the annualfee to P=29.52 million and novated the existing agreement among MCXI and Egis to include the ParentCompany as another party to the Operation Advisory Contract and Maintenance contract.
Non-Toll User Related FacilitiesOn October 24, 2016, the Parent Company entered into an agreement with Isuzu AutomotiveDealership, Inc. (the Lessee) for the lease of 15,000 square meters of the concession area. Thelease term is 20 years from October 1, 2016 to September 30, 2036, renewable for another period notexceeding June 28, 2045 upon mutual agreement. The fixed initial basic rent of the leasedconcession area shall be P=1,275,000, exclusive of VAT, per month. Basic rent shall escalate by 5% atthe start of the third year and every two years thereafter. The Lessee shall be given a rent freeconstruction period of 3 months from October 1, 2016 to December 31, 2016.
The leased concession area shall be used by the Lessee for the purpose of developing and operatinga dealership showroom and service center and to carry out other related retail, services and supportactivities incidental and complementary to its business and may be customary to the trade.
On February 2, 2017, the Parent Company entered into a lease agreement with Premier PetrolDistributors, Inc. (the Lessee) for the lease of an approximately 10,667 square meters of theconcession area. The lease term is 20 years from September 1, 2017 to August 31, 2037, renewablefor another period not exceeding June 28, 2045 upon mutual agreement. The fixed initial basic rentof the leased concession area shall be P=1.1 million, exclusive of VAT, per month. Basic rent shallescalate by 5% at the start of the second year and every year thereafter. As of December 31, 2019,the lease terms are being re-negotiated.
On July 6, 2017, the Parent Company signed the contract of lease with Globe Telecom, Inc.(the Lessee) for the use of the following locations:
a. Macro Site – 64 square meters of land within the concession areab. Small Cell (Easy Macro) Site – 7 lamp posts locationsc. Atom Cells’ Site – 4 locations in the tunnel underneath SLEX
The lease term shall be twenty-eight (28) years and eleven (11) months, commencing on August 1,2016 and continuing until June 28, 2045. The fixed initial basic rent of the leased concession areashall be P=31,400 per month, exclusive of VAT, subject to annual escalation of 4.5% starting at thebeginning of the second year.On November 13, 2018, the Parent Company and Pilipinas Shell Petroleum Corporation executed atwenty (20) years lease contract for an approximate area of 9,689 square meters. The lease contractwas effective July 15, 2018 and ending on July 14, 2038, renewable for another period not exceedingDecember 28, 2044 upon mutual agreement. The fixed initial monthly basic rent of the leasedconcession area shall be P=823,565, exclusive of VAT. Basic rent shall escalate by 5% at the start ofthe third year and every year thereafter.
For all non-toll user related agreements, including short-term advertising leases, concerning theconcession area, the Parent Company will remit, to the DPWH, 5% of its share on the gross revenuesin accordance with Section 12.6.b of the Concession Agreement.
MWC’s Concession Agreement (the “Agreement”)On February 21, 1997, MWC entered into a Concession Agreement (the Concession Agreement) withMWSS, a government corporation organized and existing pursuant to Republic Act (RA) No. 6234, asamended, with respect to the MWSS East Zone (East Zone). The Concession Agreement sets forththe rights and obligations of MWC throughout a 25-year concession period. MWSS Regulatory Office

- 244 -
*SGVFS039491*
(MWSS-RO) monitors and reviews the performance of each of the Concessionaires - MWC andMaynilad Water Services, Inc. (Maynilad), the West Zone Concessionaire.
Under the Concession Agreement, MWSS grants MWC (as contractor to perform certain functionsand as agent for the exercise of certain rights and powers under RA No. 6234) the sole right tomanage, operate, repair, decommission, and refurbish all fixed and movable assets (except certainretained assets) required to provide water delivery and sewerage services in the East Zone for aperiod of 25 years commencing on August 1, 1997 (the Commencement Date) up to May 6, 2022(the Expiration Date) or the early termination date as the case may be. While MWC has the right tomanage, operate, repair and refurbish specified MWSS facilities in the East Zone, legal title to theseassets remains with MWSS. The legal title to all fixed assets contributed to the existing MWSSsystem by MWC during the Concession remains with MWC until the Expiration Date (or until the earlytermination date) at which time all rights, titles and interest in such assets will automatically vest inMWSS.
On Commencement Date, MWC officially took over the operations of the East Zone and rehabilitationworks for the service area commenced immediately thereafter. As provided in MWC’s project plans,operational commercial capacity will be attained upon substantial completion of the rehabilitationwork.
Under the Agreement, MWC is entitled to the following rate adjustments:
a. Annual standard rate adjustment to compensate for increases in the consumer price index (CPI);b. Extraordinary price adjustment (EPA) to account for the financial consequences of the occurrence
of certain unforeseen events stipulated in the Concession Agreement;c. Foreign Currency Differential Adjustment (FCDA) to recover foreign exchange losses including
accruals and carrying costs thereof arising from MWSS loans and any Concessionaire loans usedfor capital expenditures and concession fee payments, in accordance with the provisions set forthin Amendment No. 1 of the Concession Agreement dated October 12; and
d. Rebasing Convergence Adjustment for the purposes of calculating the Rates Adjustment Limit foreach of the five Charging Years of the Rebasing Period determined based on the following:i. where the Rebasing Adjustment is found to be positive, the Rebasing Convergence
Adjustment for the first Charging Year of the Rate Rebasing Period shall be equal to theRebasing Adjustment, and the Rebasing Convergence Adjustment for each of the followingfour (4) Charging Years shall be zero; and
ii. where the Rebasing Adjustment is found to be negative, the Rebasing Adjustment for each ofthe five (5) Charging Years of the Rebasing Period shall be equal to the RebasingAdjustment divided by five (5).
These rate adjustments are subject to a rate adjustment limit which is equivalent to the sum of CPIpublished in the Philippines, EPA and Rebasing Convergence Adjustment as defined in theConcession Agreement. The Concession Agreement also provides a general rate setting policy forrates chargeable by MWC for water and sewerage services as follows:
1. For the period through the second Rate Rebasing date (January 1, 2008), the maximum rateschargeable by MWC (subject to interim adjustments) are set out in the Concession Agreement.
2. From and after the second Rate Rebasing date, the rates for water and sewerage services shallbe set at a level that will permit MWC to recover, over the 25-year term of the concession, itsinvestment including operating, capital maintenance and investment incurred, Philippine businesstaxes and payments corresponding to debt service on MWSS loans and MWC’s loans incurred tofinance such expenditures, and to earn a rate of return equal to the appropriate discount rate(ADR) on these expenditures for the remaining term of the concession.
The maximum rates chargeable for such water and sewerage services shall be subject to generaladjustment at five (5)-year intervals commencing on the second Rate Rebasing date, provided thatthe MWSS-RO may exercise its discretion to make a general adjustment of such rates.

- 245 -
*SGVFS039491*
On April 16, 2009, the MWSS Board of Trustees passed Resolution No. 2009-072 approving the15-year extension of the Concession Agreement (the Extension) from May 7, 2022 to May 6, 2037.This resolution was confirmed by the Department of Finance (DOF), by authority from the office of thePresident of the Republic of the Philippines, on October 23, 2009. The significant commitmentsunder the Extension follow:
a. To mitigate tariff increases such that there will be reduction of the balance of the approved 2008rebased tariff by 66%, zero increase of the rebased tariff in 2009 and a P=1.00 increase for years2010 to 2016, subject to CPI and FCDA adjustments.
b. To increase the share in the current operating budget support to MWSS by 100% as part of theconcession fees starting 2009.
c. To increase the total investments from the approved P=187.00 billion for the periods 2008 to 2022to P=450.00 billion for 2008 to 2037.
With the approval of the Extension, the recovery period for MWC’s investment is now extended byanother 15 years from 2022 to 2037.
On December 5, 2019, MWSS BOT issued Resolution No. 2019-201-CO revoking Resolution No.2009-072 dated April 16, 2009 pertaining to the Extension of the Concession Agreement of theParent Company from May 7, 2022 to May 6, 2037.
On December 20, 2019, MWSS released a press statement clarifying Resolution No. 2019-201-COand confirming that the action of MWSS BOT did not result in the rescission or outright cancellation ofthe Concession Agreement.On January 29, 2020, MWC received a response letter from the MWSS RO confirming that thetwenty-five (25)-year Concession Agreement from 1997 to 2022 and the Memorandum of Agreementand Confirmation between MWC and the MWSS providing for the fifteen (15)-year Extension from2022 to 2037 have not yet been cancelled.
Rate Rebasing Tariff AdjustmentsIn March 2012, MWC submitted to MWSS a business plan embodying its rate rebasing proposals forcharging year 2013. The rate rebasing activity is done every five (5) years. MWSS conducted areview of the proposal including MWC’s last five (5) years’ financial performance. The financialreview process extended up to the third quarter of 2013. On September 10, 2013, MWSS-RO issuedResolution No. 13-09-CA providing for a negative rate rebasing adjustment of 29.47% on MWC’s2012 average basic water rate of P=24.57 per cubic meter shall be implemented in 5 equal tranches ofnegative 5.894% per charging year. MWC objected to the MWSS’ Rate Rebasing determination andformally filed its Dispute Notice on September 24, 2013, before a duly-constituted Appeals Panel,commencing the arbitration process, as provided under Section 12 (in relation to Section 9.4 of theConcession Agreement).
On December 10, 2013, MWSS Board of Trustees, through MWSS-RO Resolution No. 13-012 CA,approved the implementation of a status quo for MWC’s Standard Rates including FCDA until suchtime that the Appeals Panel has rendered a final award on the 2013 Rate Rebasing determination.
On April 21, 2015, MWC received the final award of the Appeals Panel in the arbitration which finalaward included the following tariff component determination:
a. P=28.1 billion Opening Cash Position (OCP) which restored P=11.0 billion from the September 2013OCP determination of MWSS of P=17.1 billion;
b. P=199.6 billion capital expenditures and concession fees which restores P=29.5 billion from theSeptember 2013 future capital and concession fee expenditure of P=170.1 billion;
c. 7.61% Appropriate Discount Rate (ADR) which was an improvement of 79 bps from the post-taxADR of 6.82% in September 2013; and
d. Exclusion of corporate income tax from cash flows beginning January 1, 2013.

- 246 -
*SGVFS039491*
Consequently, the final award resulted in a rate rebasing adjustment for the period 2013 to 2017 ofnegative 11.05% on the 2012 basic average water charge of P=25.07 per cubic meter. Thisadjustment translates to a decrease of P=2.77 per cubic meter from the tariff during the interveningyears before the 2018 rate rebasing. Annual CPI adjustments and the quarterly FCDA will continueto be made consistent with the MWC Group’s Concession Agreement with MWSS.
On September 27, 2018, the MWSS BOT (MWSS Resolution No. 2018-145-RO) approved the MWCGroup’s Rebasing Adjustment for the Fifth Rate Rebasing Period (2018 to 2022) as recommended bythe MWSS-RO (MWSS-RO Resolution No. 2018-10-CA). To mitigate the impact on the tariff of itscustomers, MWC shall stagger its implementation over a five-year period. The first tranche tookeffect on October 16, 2018 amounting to P=1.46 per cubic meter or 5.70% of the pre-rebased 2017basic tariff. MWSS BOT also approved the implementation of the subsequent partial RebasingConvergence Adjustment on a staggered basis as scheduled below:
· P=2.00 on January 1, 2020
· P=2.00 on January 1, 2021
· P=0.76 on January 1, 2022
On December 13, 2018, MWSS BOT (MWSS Resolution No. 2018-190-RO) approved MWC’simplementation of the 5.70% CPI Adjustment to be applied to the 2018 average basic charge ofP=26.98 per cubic meter and the 2.62% FCDA to be applied to the 2019 average basic charge. Theseadjustments are recommended by MWSS-RO (MWSS-RO Resolution No. 2018-12-CA) and tookeffect on January 1, 2019.
Effective January 1, 2022, subject to the validation of MWSS RO of the feasibility and cost of WawaBulk Water Source to Calawis Project as MWC’s medium term water source, an additional partialRebasing Convergence Adjustment of up to P=0.28 per cubic meter on top of the basic partialRebasing Convergence Adjustment” of P=0.76 per cubic meter, as approved by MWSS BOT onSeptember 27, 2018.
Arbitration under the United Nations Commission on International Trade Law (UNCITRAL) Rules(1976)On April 23, 2015, the MWC served on the Republic of the Philippines (the “Republic”), through theDepartment of Finance, its Notice of Claim of even date demanding that the Republic indemnify MWCin accordance with the indemnity clauses in the Republic’s Letter Undertaking dated July 31, 1997and Letter Undertaking dated October 19, 2009.
On November 29, 2019, the MWC received from its legal counsel the Award (the “Award”) renderedby the Arbitral Tribunal (the “Tribunal”) in the arbitration proceedings between MWC and the Republicconstituted under the Permanent Court of Arbitration, with proceedings held in Singapore.
The Tribunal ruled that MWC has a right to indemnification for actual losses suffered by it on accountof the Republic’s breach of its obligation. The Tribunal ordered the Republic to indemnify MWC theamount of P=7.39 billion representing the actual losses it suffered from June 1, 2015 to November 22,2019 and to pay 100% of the amounts paid by MWC to the Permanent Court of Arbitration and 85%of the MWC’s other claimed costs.On December 11, 2019, during the meeting of the Committee on Good Government and PublicAccountability and the Committee on Public Accounts of the House of Representatives, the MWC’sPresident and Chief Executive Officer made the following pronouncements in deference to PresidentRodrigo Roa Duterte:
a. The Parent Company will not collect the P=7.39 billion Award rendered by the Tribunal in thearbitration proceedings between MWC and the Republic.
b. The MWC will defer implementation of the Approved Rate Adjustment effective January 1, 2020and has signed its intention to establish a suitable arrangement with the MWSS.
c. The MWC has agreed to and started discussions with the MWSS on the provisions of theConcession Agreement identified for renegotiation and amendment.

- 247 -
*SGVFS039491*
As of December 31, 2019, MWC has yet to received a copy of the proposed revisions to theConcesion Agreement.
Foreign Currency Diferrential Adjustment (FCDA)The MWSS Board of Trustees approves the FCDA adjustment quarterly. The FCDA has no impacton the net income of MWC, as the same is a recovery or refund mechanism of foreign exchangelosses or gains. During 2017 and 2016, the following FCDA adjustments and their related foreignexchange basis took effect in 2016 to 2018.
Approval Date Effective Date FCDA Foreign Exchange Rate Basis
March 10, 2016 April 1, 2016 P=0.26 per cubic meter USD1: P=47.51 / JPY1: P=0.40
June 14, 2016 July 1, 2016 P=0.25 per cubic meter USD1: P=46.29 / JPY1: P=0.42April 5, 2017 April 22, 2017 P=0.69 per cubic meter USD1: P=49.74 / JPY1: P=0.37
July 27, 2017 August 13, 2017 P=0.97 per cubic meter USD1: P=49.86 / JPY1: P=0.45
September 14, 2017 October 1, 2017 P=1.21 per cubic meter USD1: P=50.64 / JPY1: P=0.45December 13, 2017 January 1, 2018 P=0.63 per cubic meter USD1: P=51.34 / JPY1: P=0.45
March 13, 2018 April 1, 2018 P=0.59 per cubic meter USD1: P=50.51 / JPY1: P=0.46
June 14, 2018 July 1, 2018 P=1.58 per cubic meter USD1: P=52.10 / JPY1: P=0.48September 14, 2018 October 1, 2018 P=1.56 per cubic meter USD1: P=53.43 / JPY1: P=0.48December 14, 2018 January 1, 2019 P=0.75 per cubic meter USD1: P=53.94 / JPY1: P=0.48
There were no FCDA adjustments for the third and fourth quarters of 2016 and for the first quarter of2017 due to the vacancies in the MWSS BOT resulting in a lack of quorum necessary for the approvalof any MWSS-RO resolution, including the FCDA. Meanwhile, there were no FCDA adjustments forthe third quarter of 2019 as the MWSS BOT did not approve the adjustments until the fourth quarterof 2019.
The significant commitments of MWC under the Concession Agreement and Extension are asfollows:
a. To pay MWSS concession fees;
b. To post a performance bond, bank guarantee or other security acceptable to MWSS in favor ofMWSS as a bond for the full and prompt performance of the MWC Group’s obligations under theAgreement. The aggregate amounts drawable in one or more installments under suchperformance bond during the Rate Rebasing Period to which it relates are set out below.
Aggregate amount drawableunder performance bond
Rate Rebasing Period (in US$ millions)
First (August 1, 1997 - December 31, 2002) US$70.00Second (January 1, 2003 - December 31, 2007) 70.00Third (January 1, 2008 - December 31, 2012) 60.00Fourth (January 1, 2013 - December 31, 2017) 60.00Fifth (January 1, 2018 - December 31, 2022) 50.00
(Forward)
Sixth (January 1, 2023 - December 31, 2027) 50.00Seventh (January 1, 2028 - December 31, 2032) 50.00Eighth (January 1, 2033 - May 6, 2037) 50.00
Within 30 days from the commencement of each renewal date, MWC Company shall cause theperformance bond to be reinstated in the full amount set forth above as applicable for that year.With a minimum of 10-day written notice to MWC, MWSS may make one or more drawings underthe performance bond relating to a Rate Rebasing Period to cover amounts due to MWSS duringthat period; provided, however, that no such drawing shall be made in respect of any claim thathas been submitted to the Appeals Panel for adjudication until the Appeals Panel has handeddown its decision on the matter.

- 248 -
*SGVFS039491*
In the event that any amount payable to MWSS by MWC is not paid when due, such amount shallaccrue interest at a rate equal to that of a 364-day Treasury Bill for each day it remains unpaid;
c. With the Extension, MWC agreed to increase its annual share in MWSS operating budget by100% from P=100.0 million to P=395.0 million, subject to annual CPI;
d. To meet certain specific commitments in respect of the provision of water and sewerage servicesin the East Zone, unless deferred by MWSS-RO due to unforeseen circumstances or modified asa result of rate rebasing exercise;
e. To operate, maintain, renew and, as appropriate, decommission facilities in a manner consistentwith the National Building Standards and best industrial practices so that, at all times, the waterand sewerage system in the East Zone is capable of meeting the service obligations (as suchobligations may be revised from time to time by the MWSS-RO following consultation with MWC);
f. To repair and correct, on a priority basis, any defect in the facilities that could adversely affectpublic health or welfare, or cause damage to persons or third party property;
g. To ensure that at all times, MWC has sufficient financial, material and personnel resourcesavailable to meet its obligations under the Agreement; and
h. To ensure that no debt or liability that would mature after the life of the Agreement will be incurredunless with the approval of MWSS.
MWC is committed to perform its obligations under the Concession Agreement and Extension tosafeguard its continued right to operate the Concession.
LAWC’s Concession AgreementOn April 9, 2002, LAWC entered into a concession agreement (as amended on March 31, 2004, July22, 2009, and June 30, 2015) with PGL, a local government unit organized and existing underPhilippine Laws.
Under the terms of the concession agreement, the PGL grants LAWC (as contractor and as agent forthe exercise of certain rights in Laguna) the sole and exclusive right and discretion during theconcession period to manage, occupy, operate, repair, maintain, decommission and refurbish theidentified facilities required to provide water services to specific areas for an operational period of 25years which commenced on October 20, 2004.
While LAWC has the right to manage, occupy, operate, repair, maintain, decommission and refurbishspecified PGL facilities, legal title to these assets remains with PGL. Legal title to all assets procuredby LAWC in the performance of its obligations under the agreement remains with LAWC and shall notpass to PGL until the end of the concession period at which time, LAWC will transfer, or if theownership is vested in another person, cause the transfer to PGL. LAWC has the exclusive rights toprovide water services in the service areas specified in the concession agreement. Concession feesset forth in the concession agreement are computed as a percentage of revenue from water services.
Seventy percent (70%) of the concession fees are applied against any advances made by LAWC toPGL. The remaining thirty percent (30%) of the concession fees are payable annually 30 days afterthe submission of the audited financial statements by LAWC, from the start of the operational period.
On June 30, 2015, LAWC and the PGL signed an amendment to the concession agreement whichexpands the concession area to cover all cities and municipalities in the province of Laguna, as wellas the service obligation to include the provision of wastewater services and the establishment of anintegrated sewage and septage system in the province.

- 249 -
*SGVFS039491*
In connection with the amendment to the concession agreement, the Sangguniang Bayan of themunicipality of Calauan, Laguna approved the resolution allowing LAWC to provide water andwastewater services to the municipality of Calauan. The provision of services by LAWC in themunicipality of Calauan is being implemented in phases, with full coverage of the area targeted by thefirst quarter of 2020.
Furthermore, the concession period’s commencement date was amended to mean the later of either:(i) three (3) years from the takeover date (i.e., October 20, 2004); or (ii) availment by at least 25,000customers of the services (i.e., September 30, 2010). The concession period is deemed to havecommenced on September 30, 2010 and shall end on September 30, 2035.
On August 23, 2017, the Sangguniang Bayan of Victoria, Laguna, has approved the inclusion of itsmunicipality within the service area of Laguna Water.
On May 3, 2018, the concession agreement was amended to include the approval of EnvironmentalCharge amounting to twenty percent (20%) of the water tariff for wastewater services, desludgingservices, and other environmental-related costs which was implemented on September 22, 2018.
Laguna Water implemented a tariff adjustment of 10% on December 1, 2018.
The significant commitments of LAWC under its concession agreement with PGL are as follows:
a. To pay PGL concession fees;b. To manage, occupy, operate, repair, maintain, decommission, and refurbish the transferred
facilities;c. To design, construct and commission the new facilities during the cooperation period;d. To provide and manage the services;e. To bill and collect payment from the customer for all services;f. To extract raw water exclusively from all sources of raw water; andg. To negotiate in good faith with PGL any amendment or supplement to the concession agreement
to establish, operate and maintain wastewater facilities if doing such is financially andeconomically feasible.
Simultaneous to the signing of the amendment to the joint venture agreement between PGL andMWPVI on June 30, 2015, and consequent to the amendment of the joint venture agreement ofLAWC, LAWC signed an amendment to its concession agreement with the PGL which includes thefollowing:
a) Expansion of its concession area to cover all cities and municipalities in the PGL; andb) Inclusion in the service obligations of LAWC the provision of wastewater services and the
establishment of an integrated sewage and septage system in the province.
BIWC’s Concession AgreementOn December 17, 2009, BIWC entered into a concession agreement with TIEZA, formerly PhilippineTourism Authority (PTA). The concession agreement sets forth the rights and obligations of BIWC asconcessionaire throughout the 25-year concession period. The TIEZA Regulatory Office will monitorand review the performance of the concessionaire throughout the concession period.
Under the concession agreement, TIEZA grants BIWC the sole right to manage, operate, repair,decommission, and refurbish all fixed and movable assets (except certain retained assets) required toprovide water delivery and sewerage services in the entire Boracay Island. The legal title to all fixedassets contributed to the existing TIEZA system by BIWC during the concession remains with BIWCuntil the expiration date (or the early termination date) at which time all rights, titles and interest insuch assets will automatically vest in TIEZA.

- 250 -
*SGVFS039491*
On January 1, 2010, BIWC officially took over the operations of the service area. Rehabilitationworks for the service area commenced immediately thereafter. As provided in BIWC’s project plans,operational commercial capacity will be attained upon completion of the rehabilitation works.Under its concession agreement, BIWC is entitled to the following rate adjustments:
a. Annual standard rate adjustment to compensate for increases in the consumer CPI;b. EPA to account for the financial consequences of the occurrence of certain unforeseen events
stipulated in the concession agreement; andc. FCDA to recover foreign exchange losses including accruals and carrying costs thereof arising
from TIEZA loans and any loans used for capital expenditures and concession fee payments.
These rate adjustments are subject to a rate adjustment limit which is equivalent to the sum of CPIpublished in the Philippines, EPA and Rebasing Convergence adjustment as defined in BIWC’sconcession agreement.
The rate rebasing date is set every 5 years starting January 1, 2011. Hence, the first rate rebasingperiod commenced on January 1, 2010 and ended on December 31, 2010 and, in the case ofsubsequent rate rebasing periods, the period commencing on the last rate rebasing date and endingon December 31 of the fifth year thereafter.
In January 2016, BIWC implemented an increase of 8.18% comprising of rate rebasing adjustment of6.97% and CPI of 1.21%. The downward FCDA adjustment of 14.34% was continuouslyimplemented throughout the year.
On June 7, 2017, TIEZA approved the new water rates of BIWC which is equivalent to an increase of57.83% from its existing rate to be implemented on a staggered basis for a period of three (3) yearswith an increase of 30.14%, 11.99% and 10.79% in 2017, 2018 and 2019, respectively. The firsttranche of tariff increase was implemented on July 1, 2017.On December 15, 2017, TIEZA approved Boracay Water’s implementation of the second tranche oftariff increase of 15.53% effective January 1, 2018.
On August 1, 2018, TIEZA-RO approved the suspension of the 14.34% downward adjustment, whichresulted to the implementation of 0.00% FCDA effective August 17, 2018.
On December 4, 2018, TIEZA approved Boracay Water’s implementation of the third tranche of tariffincrease equivalent to 18.08% of the basic water and sewer charge, inclusive of CPI, arising from its2017 rate rebasing. Furthermore, a 3.00% increase shall be applied to the basic water and sewercharge to account for FCDA. The new rates shall take effect on January 1, 2019.
BIWC’s concession agreement also provides a general rate setting policy for rates chargeable byBIWC for water and sewerage services as follows:
a. For the period through the second rate rebasing date (January 1, 2016), the maximum rateschargeable by BIWC (subject to interim adjustments) are set out in the Agreement; and
b. From and after the second rate rebasing date, the rates for water and sewerage services shall beset at a level that will permit BIWC to recover, over the 25-year term of its concession, itsinvestment including operating expenses, capital maintenance and investment incurred,Philippine business taxes and payments corresponding to debt service on the TIEZA loansincurred to finance such expenditures, and to earn a rate of return on these expenditures for theremaining term of the concession in line with the rates of return being allowed from time to time tooperators of long-term infrastructure concession arrangements in other countries having a creditstanding similar to that of the Philippines.
The maximum rates chargeable for such water and sewerage services shall be subject to generaladjustment at five-year intervals commencing on the second rate rebasing date, provided that theTIEZA may exercise its discretion to make a general adjustment of such rates.

- 251 -
*SGVFS039491*
Also part of the concession agreement, BIWC assumed certain property and equipment of BIWCSewerage System (BWSS), as well as its outstanding loan from Japan International CooperationAgency (JICA), considered as part of its TIEZA loans under the concession agreement, andregulatory costs.
As a result of the above terms of the concession agreement, BIWC recognized a total ofP=986.9 million service concession assets on commencement date. It includes the JICA loanassumed by BIWC, regulatory costs, construction costs for the improvement and expansion of thewater and wastewater facilities and the advanced concession fees.
The significant commitments of BIWC under its concession agreement with TIEZA are as follows:
a. To meet certain specific commitments in respect of the provision of water and sewerage servicesin the service area, unless deferred by the TIEZA Regulatory Office (TIEZA-RO) due tounforeseen circumstances or modified as a result of rate rebasing exercise;
b. To pay concession fees, subject to the following provisions:
i. Assumption of all liabilities of the BWSS as of commencement date and service suchliabilities as they fall due. BWSS has jurisdiction, supervision and control over all waterworksand sewerage systems within Boracay Island prior to commencement date. The servicing ofsuch liabilities shall be applied to the concession fees;
ii. Payment of an amount equivalent to 5% of the monthly gross revenue of BIWC, inclusive ofall applicable taxes. Such payments shall be subject to adjustment based on the grossrevenue of BIWC as reflected in its separate financial statements;
iii. Provision of the amount of the TIEZA BOD’s approved budget in 2012, payable semi-annually and not exceeding:
Month Maximum Amount
January P=10,000,000July 10,000,000
iv. Provision of the annual operating budget of the TIEZA-RO, payable in 2 equal tranches inJanuary and July and not exceeding:
Year Maximum Amount
2011 P=15,000,0002012 20,000,0002013 and beyond Previous year, subject to
annual CPI adjustment
c. To establish, at Boracay Island, a TIEZA-RO building with staff house, the cost of which shouldbe reasonable and prudent;
d. To pay an incentive fee pegged at P=1.00 per tourist, local and foreign, entering the service area;
e. To raise financing for the improvement and expansion of the BWSS water and wastewaterfacilities;
f. To operate, maintain, repair, improve, renew and, as appropriate, decommission facilities, as wellas to operate and maintain the drainage system upon its completion, in a manner consistent withthe National Building Standards and best industrial practices so that, at all times, the water andsewerage system in the service area is capable of meeting the service obligations (as suchobligations may be revised from time to time by the TIEZA-RO following consultation with BIWC);

- 252 -
*SGVFS039491*
g. To repair and correct, on a priority basis, any defect in the facilities that could adversely affectpublic health or welfare, or cause damage to persons or third party property; and
h. To ensure that at all times, BIWC has sufficient financial, material and personnel resourcesavailable to meet its obligations under the concession agreement.
In addition, MWC, as the main proponent of BIWC shall post a bank security in the amount ofUS$2.50 million to secure MWC’s and BIWC’s performance of their respective obligations under theagreement. The amount of the performance security shall be reduced by MWC following theschedule below:
Amount ofPerformance Security
Rate Rebasing Period (in US$ millions)
First US$2.50Second 2.50Third 1.10Fourth 1.10Fifth 1.10
On or before the start of each year, BIWC shall cause the performance security to be reinstated in thefull amount set forth as applicable for that year.
With a minimum of ten (10) days written notice period to BIWC, TIEZA may take one or moredrawings under the performance security relating to a Rate Rebasing Period to cover amounts due toTIEZA during that period; provided, however, that no such drawing shall be made in respect of anyclaim that has been submitted to the Arbitration Panel for adjudication until the Arbitration Panel hashanded its decision on the matter.In the event that any amount payable to TIEZA by BIWC is not paid when due, such amount shallaccrue interest at a rate equal to that of a 364-day Treasury Bill for each day it remains unpaid.
Failure of BIWC to perform any of its obligations that is deemed material by TIEZA-RO may cause theconcession agreement to be terminated.
CWC’s Concession AgreementOn March 16, 2000, Vivendi Water Philippines, Inc., which subsequently changed its name to VeoliaWater Philippines, Inc (VWPI), entered into a concession agreement with CDC, a governmentcorporation organized and existing under Executive Order No. 80, series of 1993. The concessionagreement sets out the terms and conditions under which VWPI will finance, design, construct,operate and maintain the water and sewerage system inside the Clark Freeport Zone (CFZ)commencing on October 1, 2000 and ending on the date falling 25 years thereafter or as may beextended by the terms of the concession agreement. As the implementing arm of the BasesConversion Development Authority and the regulatory and development body for the CFZ, CDC hasthe power and authority to regulate and monitor the performance and compliance of VWPI, or itsassignee, with its obligations under the concession agreement.
On September 1, 2000, in accordance with the terms of the concession agreement, VWPI assignedits rights and obligations under the concession agreement to CWC by virtue of an assignment andassumption agreement between VWPI and CWC. As consideration for the grant of the concessionand franchise to develop, operate and maintain the water and sewerage system within the CFZ, CWCpays CDC an annual franchise fee of P=1.50 million. Any new construction, change, alteration,addition or improvement on the facilities is permitted to the extent allowed under the agreement withCDC or with the prior written consent of CDC. Legal title, free of all liens and encumbrances, toimprovements made or introduced by CWC on the facilities as well as title to new facilities procuredby CWC in the performance of its obligations under the concession agreement shall automatically

- 253 -
*SGVFS039491*
pass to CDC on the date when the concession period expires or the date of receipt of a validly servedtermination notice, in the latter case, subject to payment of the amount due as termination paymentsas defined in the concession agreement.
On September 29, 2000, CDC leased in favor of CWC the existing facilities in compliance with thecondition precedent to the effectivity of and the respective obligations of CWC and CDC under theconcession agreement. Under the lease agreement, CWC was required to make a rental depositamounting to P=2.8 million equivalent to six months lease rental and a performance securityamounting to P=6.7 million to ensure the faithful compliance of CWC with the terms and conditions ofthe lease agreement. CWC pays semi-annual rental fees of P=2.8 million amounting to a total ofP=138.3 million for the entire concession period. The lease term shall be co-terminus with theconcession period unless sooner terminated for any of the reasons specified in the concessionagreement.
On August 15, 2014, the CWC and CDC signed an amendment agreement to the concessionagreement dated March 16, 2000. The Amendment provides for the following:
a. Extension of the original concession period for another 15 years up to October 1, 2040;
b. Additional investment of P=4.0 billion provided under the amended concession agreement to bespent for further improvement and expansion water and waste water services in the area.Investment requirement under the original concession agreement amounted to P=3.0 billion andthe amended concession agreement required an additional investment of P=2.0 billion. Totalinvestment prior to the amendment of the concession agreement amounted to P=1.0 billion;
c. Introduction of rate rebasing mechanism for every four years starting 2014;
d. Reduction in tariff rates by 3.9% (from P=25.63/m3 to P=24.63/m3) effective September 1, 2014,subject to the Extraordinary Price Adjustment; and
e. Increase in tariff rates by:
· P=0.41/m3 (from P=24.63/m3 to P=25.04/m3) in 2018
· P=0.42/m3 (from P=25.04/m3 to P=25.45/m3) in 2019
· P=0.42/m3 (from P=25.45/m3 to P=25.87/m3) in 2020
· P=0.43/m3 (from P=25.87/m3 to P=26.30/ m3) in 2021
As a result of the extension of the concession period, service concession assets and serviceconcession obligation as of August 15, 2014 increased by P=56.6 million. Further, the recovery periodof the CWC’s investment is now extended by another 15 years from 2025 to 2040.
On May 26, 2017, CWC submitted its proposed 2018 rate rebasing plan following the four (4)-yearrebasing period stated in the concession agreement. As of December 31, 2019, the rate rebasing isstill ongoing.
The significant commitments of CWC under its concession agreement with CDC are follows:
a. To pay franchise and rental fees of CDC;
b. Finance, design, and construct new facilities - defined as any improvement and extension worksto (i) all existing facilities - defined as all fixed and movable assets specifically listed in theconcession agreement; (ii) construction work - defined as the scope of construction work set outin the concession agreement; and (iii) other new works that do not constitute refurbishment orrepair of existing facilities undertaken after commencement date;

- 254 -
*SGVFS039491*
c. Manage, exclusively possess, occupy, operate, repair, maintain, decommission and refurbish theexisting facilities, except for the private deep wells set out in the concession agreement, thenegotiations for the acquisition and control of which shall be the sole responsibility and for theaccount of the CWC; and manage, own, operate, repair, maintain, decommission and refurbishthe new facilities;
d. Treat raw water and wastewater in CSEZ;
e. Provide and manage all water and wastewater related services like assisting locator of relocatingof pipes and assess internal leaks;
f. Bill and collect payment from the customers for the services (with the exception of SM City Clark).SM City Clark has been carved out by virtue of Republic Act 9400 effective 2007 even if it islocated within the franchise area; and
g. Extract raw water exclusively from all sources of raw water including all catchment areas,watersheds, springs, wells and reservoirs in CFZ free of charge by CDC.
MW Consortium Agreement with PGCOn March 21, 2012, MW Consortium signed a joint investment agreement with the PGC for theformation of a joint venture company with 51% and 49% equity participation for MW Consortium andthe PGC, respectively. Under the joint investment agreement, the parties agreed to develop andoperate a bulk water supply system that will supply 35.0 million liters of water per day to target areasin the province of Cebu with the joint venture company serving as a bulk water supplier. The term ofthe agreement is 30 years starting March 2012 and renewable for another 25 years. MW Consortiumand the PGC incorporated Cebu Manila Water Development, Inc. (CMWDI), with an ownership of51% and 49%, respectively, pursuant to the joint investment agreement.
On December 13, 2013, CMWDI received a Notice of Award for the bulk supply of water to theMCWD. On December 18, 2013, CMWDI and MCWD signed a 20-year Bulk Water Supply Contractfor the supply of 18.0 million liters per day of water for the first year and 35.00 million liters per day ofwater for years 2 up to 20. CMWDI delivered its initial 18.0 million liters per day bulk water supply toMCWD on January 5, 2015. CMWDI will increase its bulk water delivery to 35.0 million liters per dayin 2016.
On August 29, 2019, MW Consortium received a Notice of Breach/Default of the JIA from the PGC.On December 10, 2019, PGC issued a Notice of Termination of the JIA. Pursuant to the JIA, MWConsortium issued a Notice of Existence of a Dispute on PGC on December 12, 2019, whichtriggered the dispute resolution mechanism under the JIA, and prevented the termination from takingeffect.
On February 3, 2020, MW Consortium and the PGC signed the Terms of Reference for the interimprotocol between both parties pending Settlement with Finality of the Dispute between MWConsortium and PGC.
Bulk Water Supply Agreement with MCWDOn December 18, 2013, CMWD entered into a bulk water supply agreement with MCWD. Thesignificant commitments of CMWD under its agreement with MCWD are as follows:
a. Provide potable and treated water at an aggregate volume of 18,000 cubic meters per day for thefirst year and 35,000 cubic meters per day for the succeeding years up to 20 years at P=24.59 percubic meter;
b. Ensure that the source shall be sustainable and 100% reliable at any day the duration of theagreement; and
c. Construct a facility capable of delivering a production capacity of 35,000 cubic meters per dayand maintain the same on its account.

- 255 -
*SGVFS039491*
ZWC’s Concession ArrangementOn December 19, 2014, the MWC Group received a notice from the ZCWD awarding the project forNRW reduction in Zamboanga City, Zamboanga. On January 30, 2015, the MWC Group and ZCWDsigned and executed a JVA in relation to the NRW reduction project in Zamboanga City. On April 10,2015, the MWC Group and ZCWD incorporated ZWC to implement the NRW project.
On June 2, 2015, ZWC entered into a NRWSA with ZCWD. Under the NRWSA, ZCWD grants ZWCthe right to implement Network Restructuring and NRW Reduction Programs for ZCWD’s waterdistribution system.
In October 2019, Zamboanga Water and ZCWD jointly formed a Technical Working Group tonegotiate and resolve all the pending issues or disputes arising during the implementation of theNRW Reduction Project.
The NRWSA sets forth the rights and obligations of the ZWC throughout the ten (10)-year period.The significant provisions under the agreement with ZCWD consist of:
a. ZWC is required to implement Network Restructuring and NRW Reduction Programs for ZCWD’swater distribution system; and
b. ZWC has the right to restructure and maintain the facilities in the ZCWD service area but legaltitle to these assets remains with ZCWD. The legal title to all fixed assets contributed to theexisting ZCWD system by ZWC during the project tenure remains with ZWC until the expirationdate (or an early termination date) at which time all rights, titles and interest in such assets willautomatically vest in ZCWD.
Bulk Water Supply Agreements between Davao Water and Tagum Water District (TWD)On July 28, 2015, the TWD awarded the Tagum City Bulk Water Supply Project to Davao del NorteWater Infrastructure Company, Inc. (Davao Water), the joint venture company of MWC and iWater,Inc.
On October 15, 2015, Davao Water has signed and executed a Joint Venture Agreement (JVA) withTWD. The JVA governs the relationship of Davao Water and TWD as joint venture partners in theTagum Bulk Water Project. Pursuant to the JVA, Davao Water and the TWD caused theincorporation of a joint venture company, namely, TWC, which shall implement the Tagum Bulk WaterProject for fifteen (15) years from the Operations Start Date as defined in the JVA.
On February 26, 2016, Tagum Water and TWD signed and executed a Bulk Water Sales andPurchase Agreement for the supply of bulk water to TWD for a period of fifteen (15) years, subject torenewal upon mutual agreement by both parties. Tagum Water shall supply treated water exclusivelyto TWD. The quantity of treated water to be supplied to TWD will be 26.00 million liters of water perday for the first year, 32.00 million liters of water per day for years 4 to 6, and 38.00 million liters ofwater per day for years 7 to 15.
On June 26, 2019, TWD approved a 120-day construction period extension requested by TagumWater due to delays caused by unforeseen conditions in the project site which was discovered onlyafter construction had already commence.
On July 17, 2019, Tagum Water issued to TWD the Certificate of Substantial Completion of the WaterTreatment plant to begin the pre-commissioning period. On August 27, 2019, Tagum Water startedthe commissioning period with 5.00 to 8.00 million liters per day of treated water delivery to TWD.
On September 9, 2019, Tagum Water BOD ratified the implementation of the design, supply ofmaterials, installation of equipment and construction of two (2) units 300mm shallow wells in TagumCity, Davao del Norte. On October 28, 2019, Tagum Water informed TWD of the completion of thetwo (2) wells and the results of the water quality analysis.

- 256 -
*SGVFS039491*
On December 11, 2019, Tagum Water commenced the extension of the commissioning period for120-days with the consent of TWD BOD.
TWC will have the sole and exclusive right and responsibility during the term of the agreement to:
a. Develop raw surface water sources in Hijo River;b. Plan, develop, design, build and test the facilities;c. Implement the Project;d. Manage, use, occupy, operate, repair, maintain, upgrade and develop the facilities; ande. Supply treated water to TWD for distribution to its network.
Facilities and any and all assets, equipment and properties used by TWC to implement the bulk waterproject will be owned by TWC even after the expiration of the BWSPA.
MWPVI’s Memorandum of Agreement (MOA) with ALI GroupOn January 15, 2016, MWPVI entered into a MOA with ALI Group, whereby MWPVI shall exclusivelyprovide water and used water services and facilities to all property development projects of the ALIGroup.
MWPVI Memorandum of Agreement (MOA) with SM GroupOn December 8, 2016, MWPVI entered into a similar MOA with each of SM Prime Holdings Inc.’s andthe latter’s affiliates and subsidiaries, SM Development Corporation and SM Residences Corp.(collectively, the SM Group). Pursuant to the MOA, MWPVI will provide the water and/or used waterservices and facilities to the property development projects of the SM Group identified in each of theMOA.
On October 5, 2017, Aqua Centro was incorporated to handle property development projects, otherthan those within the ALI Group, by engaging in the development, improvement, maintenance, andexpansion of water, sewerage, wastewater, and drainage facilities, and provide services necessary orincidental thereto.
On December 28, 2017, MWPVI entered into a Novation Agreement with the SM Group and AquaCentro to transfer its rights, duties and obligations to provide water and/or used water services andfacilities to the property development projects of the SM Group to Aqua Centro, effective from theinception of the MOA.
As of December 31, 2019 and 2018, Aqua Centro has eight (8) and six (6) signed MOAs with the SMGroup, respectively. MWPVI has one (1) signed MOA with SM Group as of December 31, 2019 and2018.
Calasiao Water’s Concession Agreement with CWDOn December 9, 2016, MWC received a Notice of Award from the CWD for the implementation of thejoint venture project for the design, construction, rehabilitation, maintenance, operation, financing,expansion and management of the water supply system of the CWD in Calasiao, Pangasinan.On June 19, 2017, MWC signed a JVA with CWD which will govern the relationship of the two inundertaking the joint venture project. Under the JVA, MWC and CWD shall cause the incorporationof a joint venture company where MWC and CWD shall own 90.00% and 10.00%, respectively, of theoutstanding capital stock.
On August 2, 2017, the SEC approved the incorporation of Calasiao Water Company, Inc.
On October 23, 2017, Calasiao Water and CWD signed and executed a concession agreement.Under the concession agreement, the CWD grants Calasiao Water, (as contractor to perform certainfunctions and as agent for the exercise of certain rights and powers under Presidential Decree No.564) the sole right to develop, manage, operate, maintain, repair, decommission, and refurbish allfixed and movable assets (except certain retained assets) required to provide water delivery in theentire Municipality of Calasiao for a period of twenty five (25) years commencing on December 29,

- 257 -
*SGVFS039491*
2017 (the Commencement Date) until December 29, 2042 (the Expiration Date) or the earlytermination date as the case may be. While Calasiao Water has the right to manage, operate, repair,and refurbish specified CWD facilities in the service area, legal title to these assets remains with theCWD. The legal title to all fixed assets contributed to the existing CWD system by Calasiao Waterduring the concession remains with Calasiao Water until the Expiration Date (or the early terminationdate) at which time all rights, titles and interest in such assets will automatically vest in CWD.
Under the concession agreement, in the event that one or more grounds for EPA has occurred or isexpected to occur, an appropriate price adjustment to be applied to the tariff or an appropriateadjustment to the service obligations of the concessionaire will be determined by the CWD.
The ground for EPA means any of the following circumstances:
a. change in law or change in the interpretation of the terms of the concession agreement;b. extraordinary cost incurred due to prolonged force majeure;c. a material change has been made to the basis of calculation or definition of the CPI or
replacement index agreed; ord. the concessionaire has incurred significant additional costs as a result of an event of force
majeure which are not covered by insurance.
The significant commitments of Calasiao Water under its concession agreement with CWD are asfollows:
a. To finance, design, engineer, and construct new facilities for water and sanitation;b. To upgrade existing water and sanitation facilities;c. To operate, manage, and maintain water and sanitation facilities and services; andd. To bill and collect tariff for water and sanitation services.
MWPVI APA with Asian Land and Incorporation of Bulacan MWPV Development Corp. (BMDC)On January 4, 2017, MWPVI entered into an APA with Asian Land to acquire and operate the latter’sassets used in the water business operations in Asian Land’s developments in the province ofBulacan. The intention of MWPVI was to assign the rights under the APA to its wholly ownedsubsidiary upon its incorporation.On April 11, 2017, BMDC was incorporated to design, construct, rehabilitate, maintain, operate,finance, expand, and manage water supply system and sanitation facilities. BMDC is the ultimateentity that will own and operate the assets acquired from Asian Land.
On July 31, 2017, MWPVI assigned all its rights and obligations on the APA to BMDC, a wholly-owned subsidiary of MWPVI, under a Deed of Assignment. On the same day, the Deed of AbsoluteSale was also executed between Asian Land and BMDC.
Obando Water’s Concession Agreement with the OWDOn January 24, 2017, the consortium of MWC and MWPVI received the Notice of Award from theOWD for the implementation of the joint venture project for the design, construction, rehabilitation,maintenance, operation, financing, expansion, and management of the water supply system andsanitation facilities of the OWD in Obando, Bulacan.
On February 2, 2017, Obando Water Consortium Holdings Corp. was registered with the SEC.Obando Water Holdings is the consortium between MWC and MWPVI with an equity share of 49.00%and 51.00%, respectively. The primary purpose of Obando Water Holdings is to engage in thebusiness of a holding company without acting as stockbroker or dealer in securities.
On July 26, 2017, Filipinas Water signed and executed a JVA with OWD. The JVA governs therelationship of Filipinas Water and OWD as joint venture partners in the Obando Water ConcessionProject (the “Obando Concession Project”). On October 10, 2017, Obando Water was incorporated.Obando Water is 90% and 10% owned by Filipinas Water and OWD, respectively.

- 258 -
*SGVFS039491*
For the implementation of the Obando Concession Project, OWD and the joint venture company shallexecute a concession agreement. On October 10, 2017, the SEC approved the incorporationObando Water Company, Inc.
On October 12, 2017, Obando Water and OWD signed and executed a concession agreementwithout the necessity for another bidding and subject to mutual agreement by Obando Water and theOWD. Under the concession agreement, OWD grants Obando Water, (as contractor to performcertain functions and as agent for the exercise of certain rights and powers under Presidential DecreeNo. 564), the sole right to manage, operate, maintain, repair, refurbish, and expand the fixed andmovable assets required to provide water and sanitation services in the entire Municipality of Obandofor a period of twenty five (25) years commencing on January 1, 2018 (the Commencement Date)until January 1, 2043 (the Expiration Date) or the early termination date, as the case may be.
The initial water tariff, exclusive of value-added tax (VAT) and/or any applicable tax, to be charged tothe customers for the first three (3) years of the concession agreeement shall be based on the 2005Local Water Utilities Administration (LWUA) approved tariff table of OWD. Under the concessionagreement, in the event that one or more grounds for EPA has occurred or is expected to occur, anappropriate price adjustment to be applied to the tariff or an appropriate adjustment to the serviceobligations of the concessionaire will be determined by OWD.
The grounds for EPA means any of the following circumstances:
a. change in law or change in the interpretation of the terms of the concession agreement;b. extraordinary cost incurred due to prolonged force majeure;c. a material change has been made to the basis of calculation or definition of the CPI or
replacement index agreed;d. change in assumptions at the time of the execution of the concession agreement; ore. the concessionaire has incurred significant additional costs as a result of an event of force
majeure which are not covered by insurance.
On March 28, 2019, LWUA has approved a new loan repayment scheme of thirteen (13) years withOWD. Upon initial payment, which shall not be later than May 15, 2019, LWUA shall no longer collectinterests and penalties from OWD.
The significant commitments of Obando Water under its concession agreement with OWD are asfollows:
a. To finance, design, engineer, and construct new facilities for water and sanitation;b. To upgrade existing water and sanitation facilities;c. To operate, manage, and maintain water and sanitation facilities and services; andd. To bill and collect tariff for water and sanitation services.
BMDC APA with Solar ResourcesOn July 26, 2017, BMDC entered into an APA with Solar Resources to acquire and operate thelatter’s assets used in the water business operations in Solar Resources developments in theprovince of Bulacan.
On July 31, 2017, Solar Resources executed a Deed of Absolute Sale to sell and transfer itsproperties pertaining to water facilities and its operations in the Las Palmas Subdivisions Phases 1 to7 to BMDC.
BMDC APA with BorlandOn December 14, 2017, BMDC and Borland executed the APA, Deed of Assignment, and Deed ofAbsolute Sale between the parties for the sale, assignment, transfer, and conveyance of Borland’sassets pertaining to water facilities and its operation in San Vicente Homes subdivision in Bulacan toBMDC.

- 259 -
*SGVFS039491*
Notice of Award from the Leyte Metropolitan Water District (LMWD)On December 6, 2017, MWC received the Notice of Award from the LMWD for the implementation ofthe joint venture project (the “Leyte Project”) for the design, construction, rehabilitation, maintenance,operation, financing, expansion, and management of the water supply and sanitation facilities andservices of LMWD in the Province of Leyte.
The conditions precedent specified in the Notice of Award include the incorporation of a specialpurpose vehile (SPV) which will implement the Leyte Project under a contractual joint venture with theLMWD.
Upon completion of the conditions precedent specified in the Notice of Award, the SPV and theLMWD shall enter into a joint venture agreement that will grant the SPV, as contractor to performcertain functions and as agent for the exercise of, the sole and exclusive right to manage, operate,maintain, repair, refurbish and improve, expand and as appropriate, decommission, the facilities ofLMWD in its Service Area, including the right to bill and collect tariff for the provision of water supplyand sanitation services in the Service Area of LMWD.
LMWD’s service area covers the City of Tacloban and seven other municipalities namely Palo,Tanauan, Dagami, Tolosa, Pastrana, TabonTabon, and Santa Fe.
On February 20, 2019, the Parent Company wrote to the LMWD, now represented by the City-Appointed BOD, and requested the LMWD to honor the Notice of Award.
On April 12, 2019, the LMWD advised that it had already rescinded/terminated the JVA negotiationswith the Parent Company.
In June 21 2019, the Parent Company initiated available legal course of action to compel the LMWDto honor the Notice of Award granted to the Parent Company.
As of December 31, 2019, the case remains pending with the Supreme Court.MWPVI JVA with Tubig Pilipinas Group, Inc. (TPGI)On December 11, 2017, the Municipality of Malasiqui granted a franchise to MWPVI and TPGI for theimplementation of a joint venture project to establish, construct, operate, manage, repair, andmaintain water supply and wastewater system and facilities in the municipality of Malasiqui,Pangasinan. The franchise has a term of twenty-five (25) years from the commencement date.
On February 20, 2018, the BOD of MWPVI approved the creation of a SPV for this project.
On November 16, 2018, MWPVI has signed and executed a JVA with TPGI. Under the agreement,MWPVI and TPGI shall incorporate a joint venture company, with 50% and 50% ownership,respectively, which shall implement the project.
MWPVI Lease Agreement with the Philippine Economic Zone Authority (PEZA)On December 18, 2017, MWPVI entered into a Lease Agreement for the Operations andManagement of the Water and Used Water Facilities of PEZA in Cavite Economic Zone (CEZ),whereby MWPVI agrees to lease, operate, and maintain the existing water and used water facilities inthe CEZ for the provision of water and used water services to the locators therein. The leaseagreement has a term of twenty-five (25) years from signing of the contract and shall be effective onits commencement date on February 1, 2018.
MWPVI’s MOA with LTIOn April 16, 2016, the MWPVI entered into a MOA with LTI, whereby through its division, EstateWater, MWPVI shall exclusively provide water and used water services to LTI’s Cavite Technopark tobe located in Barangay Sabang, Naic, Cavite, and in pursuit of this objective, to construct, develop,finance, and own the water facilities and used water facilities under the terms and conditions set outin the MOA.

- 260 -
*SGVFS039491*
For and in consideration of the construction and development of the water facilities and used waterfacilities and the rendition of the services by MWPVI, LTI shall pay a capacity charge. Capacitycharge, included under “Supervision fees,” amounted to P=4.99 million and P=5.12 million in 2019 and2018, respectively
Asset Purchase Agreement with LTIOn December 23, 2013, LAWC entered into an asset purchase agreement with LTI to acquire andoperate its water operations division in Laguna. The significant commitments of LAWC under itsagreement with LTI follow:
a. Offer water supply and sewerage services to all current or future locators in the LagunaTechnopark, including future area(s) of expansion;
b. Ensure the availability of an uninterrupted 24-hour supply of water to all current and futurelocators, subject to interruptions resulting from the temporary failure of items of the WaterFacilities (where LAWC acts promptly to remedy such failure) or required for the repair of theconstruction of the Water Facilities where such repairs or construction cannot be performedwithout interruption to the supply of water;
c. Upon request from a current or future locator in the LTI for a connection to a water main, makesuch a connection as soon as reasonably practicable, upon payment of reasonable connectionfees as determined by LAWC;
d. Ensure at all times that the water supplied to current and future locators in LTI complies withPhilippine National Standards for Drinking Water as published by the Department of Health (orsuccessor entity responsible for such standards) and prevailing at such time and shall observeany requirement regarding sampling, record keeping or reporting as may be specified by law;
e. Make available an adequate supply of water for firefighting and other public purposes as themunicipality and/or barangay in which LTI may reasonably request. LAWC shall not assess forsuch water used for firefighting purposes but may charge for all other water used for publicpurposes; and
f. LAWC shall make a supply of water available to current and future locators in LTI, including theareas of expansion in the future.
Notice of Award from Ilagan City Water District (ICWD) and JVA with ICWDOn January 26, 2018, the MWC Group and MWPVI (collectively the "Consortium") received theNotice of Award from ICWD for the implementation of the joint venture project for the development,financing, operation and management of a raw water source, provision of bulk water supply withsystem expansion, and the development of septage management in Ilagan City, Isabela (the “IlaganProject”).
On November 16, 2018, the Consortium signed and executed a JVA with the ICWD. Under the JVA,the Consortium and ICWD shall incorporate a joint venture company, with 90.00% and 10.00%ownership, respectively, which shall implement the Ilagan Project.
Upon completion of conditions precedent set out in the JVA, the joint venture company willconsequently enter into a Bulk Water Sales and Purchase Agreement and Septage ManagementAgreement with ICWD for the implementation of the Ilagan Project for twenty five (25) years from thecommencement date.
On February 15, 2019, Ilagan Water was incorporated and registered with the Philippine SEC toimplement the Ilagan Project.
On March 18, 2019, Ilagan Water’s BOD approved the execution of a Bulk Water Sales and PurchaseAgreement and Septage Management Agreement with CIWD.

- 261 -
*SGVFS039491*
Notice of Award from Balagtas Water District (BWD)On April 25, 2018, the MWC Group and MWPVI (collectively the "Consortium") received the Notice ofAward from BWD for the implementation of a joint venture project for the design, construction,rehabilitation, maintenance, operation, financing, expansion and management of the water supplysystem and sanitation facilities of BWD in the municipality of Balagtas, Bulacan.
Notice of Award from Bulacan Water District (BuWD) and JVA with BuWDOn April 26, 2018, the MWC Group and MWPVI (collectively the "Consortium") received the Notice ofAward from BuWD for the implementation of a joint venture project for the design, construction,rehabilitation, maintenance, operation, financing, expansion and management of the water supplysystem and sanitation facilities of the BuWD in the Municipality of Bulacan in Bulacan.
On August 16, 2018, Filipinas Water signed and executed a JVA with the BuWD for theimplementation of the project. Under the JVA, Filipinas Water and BuWD shall incorporate a jointventure company, with 90.00% and 10.00% ownership, respectively, which shall be granted aconcession by BuWD. On October 16, 2018, the joint venture company, Bulakan Water, wasincorporated and was registered with the SEC.
On June 14, 2019, Bulakan Water and the BuWD signed and executed a concession agreement forthe design, construction, rehabilitation, operation, maintenance, financing, expansion, andmanagement of water facilities and the provision of water and sanitation services in the Municipalityof Bulakan for a period of twenty-five (25) years from the commencement date.
Notice of Award from Pagsanjan Water District (PAGWAD)On July 12, 2018, Laguna Water received the Notice of Award from PAGWAD for the implementationof the contractual joint venture project for the design, improvement, upgrade, rehabilitation, andexpansion of water supply and sanitation facilities including the financing and construction of suchfacilities and infrastructure in the service area of the PAGWAD, and the management, operation, andmaintenance of such water supply and sanitation facilities and the provision of the services necessaryor incidental thereto in the PAGWAD’s service area.
On January 21, 2019, Laguna Water signed and executed a contractual JVA with PAGWAD. Underthe agreement, Laguna Water shall serve as the contractor or agent of PAGWAD tasked with theoperations, management, and maintenance as well as the design, improvement, upgrade,rehabilitation, and expansion of water supply and sanitation facilities within the service area ofPAGWAD in Pagsanjan, Laguna. Upon completion of conditions precedents in the JVA, LagunaWater and PAGWAD shall execute the project for a period of sixteen (16) years until September 30,2035. The agreement was executed on March 1, 2019.
Incorporation of EcoWaterOn July 27, 2018, MWPVI incorporated EcoWater MWPV Corp. which will eventually handle theLease Agreement for the Operations and Management of the Water and Used Water Facilities ofPEZA in Cavite Economic Zone (CEZ).
Notice of Award from Tanauan Water DistrictOn October 12, 2018, MWC and MWPVI (collectively, the “Consortium”) received the Notice of Awardfrom TnWD for the implementation of the joint venture project for the design, construction,rehabilitation, maintenance, operation, financing, expansion, and management of the water supplyand sanitation facilities and services in the service area of TnWD in Tanauan City, Batangas.
On February 4, 2019, the Consortium signed and executed a JVA with the TnWD for theimplementation of the project. Upon completion of the conditions precedent set out in the JVA, theConsortium, through an SPV, and the TnWD shall execute the Tanauan Project for a period oftwenty-five (25) years from the commencement date.
On May 20, 2019, MWPV South Luzon Water Corp. (South Luzon Water), the joint venture company,was incorporated to execute the Tanauan Project.

- 262 -
*SGVFS039491*
On September 30, 2019, South Luzon Water’s BOD approved to accept the assignment by MWC andMWPVI of their respective rights and obligations under their JVA with the TnWD.
Notice of Award from Lambunao Water DistrictOn November 27, 2018, the MWC Group received a Notice of Award from Lambunao Water Districtfor a joint venture for the design, construction, rehabilitation, maintenance, operation, financing,expansion, and management of the water supply system of Lambunao Water District in theMunicipality of Lambunao, Iloilo.
Upon completion of conditions precedent specified in the notice, MWC and LWD shall enter into aJVA, the implementation of the joint venture activity of which shall be undertaken by Aqua Centro.
On July 3, 2019, the MWC and LWD entered into a JVA to implement the design, improvement,upgrade, rehabilitation, and expansion of water supply including the financing and construction ofsuch facilities and infrastructure in the service area of LWD, and the management, operation andmaintenance of such water supply and the provision of the services necessary or incidental thereto inthe service area.
On August 8, 2019, MWC’s BOD ratified its Executive Committee’s approval of the assignment toAqua Centro of the implementation of the concession project awarded by LWD to MWC.
On August 30, 2019, MWC formally notified LWD of the designation of Aqua Centro as the ProjectCompany to implement and carry out the concession project.
On September 1, 2019, Aqua Centro officially commenced operations on the joint venture activity.On the same date, Aqua Centro’s BOD approved the Deed of Accession between MWC and LWD.
On September 18, 2019, LWD gave its consent to, and confirmation of, the designation of AquaCentro as the project company for the implementation of the project pursuant to the JVA.
On December 11, 2019, LWD signed the Deed of Accession between MWC and Aqua Centro.
Notice of Award from Calinog Water DistrictOn November 27, 2018, the MWC Group received a Notice of Award from Calinog Water District for ajoint venture for the design, construction, rehabilitation, maintenance, operation, financing, expansion,and management of the water supply system of Calinog Water District in the Municipality of Calinog,Iloilo.
Upon completion of conditions precedent specified in the notice, the MWC Group and Calinog WaterDistrict shall enter into a JVA, the implementation of the joint venture activity of which shall beundertaken by Aqua Centro.
On June 10, 2019, the Executive Committee of the MWC approved the joint venture with the CalinogWater District. It also approved the assignment to Aqua Centro of the joint venture with CalinogWater District.
Aqua Centro and Laguna Water APAs with Extraordinary Development Corporate Group (EDCG)On December 11, 2018, Aqua Centro entered into seven (7) APAs with EDCG’s subsidiaries toacquire the subsidiaries’ assets related to the provision of water service in ten (10) subdivisions inImus, General Trias, and Naic in the province of Cavite. These subsidiaries are Earth AspireCorporation, First Advance Development Corporation, Ambition Land Inc., Prosperity BuildersResources Inc., Tahanang Yaman Homes Corporation, Extraordinary Development Corp., and Earth+ Style Corporation.

- 263 -
*SGVFS039491*
On December 11, 2018, Laguna Water entered into four (4) APAs with EDCG’s subsidiaries toacquire the subsidiaries’ assets related to or used in its water service provision operations in Biñan,Laguna. The APAs are with the following EDCG subsidiaries, namely, Earth Aspire Corporation,Earth Prosper Corporation, Earth and Style Corporation and Extraordinary Development Corp.
As of December 31, 2019 and 2018, Aqua Centro has already started operations in nine (9) and six(6) out of the ten (10) subdivisions. As of December 31, 2019, Aqua Centro shall operate the one (1)remaining subdivision once all the conditions precedent under the APAs have been fulfilled.
Notice of Award from San Jose City Water DistrictOn December 21, 2018, the consortium of MWPVI and TPGI received a Notice of Award from SanJose City Water District (SJCWD) for the implementation of the joint venture project for the design,construction, improvement, upgrade, rehabilitation, maintenance, operation, financing, expansion,and management of the water supply system and the provision of water and sanitation services ofSJCWD in San Jose City, Nueva Ecija.
Upon the completion of the conditions precedent specified in the Notice of Award, the consortium andSJCWD shall enter into a JVA for the implementation of the joint venture project. As of December 31,2019, the consortium and SJCWD have not yet signed the JVA.
Notice of Award from Calbayog City Water DistrictOn December 27, 2018, the MWC Group received the Notice of Award from Calbayog City WaterDistrict for the implementation of the joint venture project for the design, construction, rehabilitation,maintenance, operation, financing, expansion, and management of the water and wastewatersystems of Calbayog City Water District in the Calbayog City, as well as other areas which mayeventually form part of the service coverage of the Calbayog City Water District in the Province ofSamar.
Upon completion of the conditions precedent specified in the notice, the MWC Group shall enter intoa JVA with the Calbayog City Water District for the implementation of the joint venture project over atwenty five (25) year contract period.
On April 17, 2019, Calbayog Water was incorporated to engage in the development, construction,improvement, upgrade, rehabilitation, expansion, management, operation and maintenance of watersupply and wastewater facilities, and to provide services necessary or incidental thereto.
On June 10, 2019, the Executive Committee MWC approved the joint venture with the CCWD. It alsoapproved the assignment to Calbayog Water of the joint venture with CCWD.
On July 3, 2019, the MWC signed and executed a joint venture agreement with the CCWD for thedesign, construction, rehabilitation, maintenance, operation, financing, expansion, and managementof the water and wastewater system of CCWD in the City of Calbayog.
North Luzon Water’s MOAs with the Municipalities of Sta. Barbara, San Fabian, and Manaoag inPangasinanOn April 27, 2018, MWPVI was granted a franchise by the Municipality of Sta. Barbara, Pangasinanfor the provision of water supply and the improvement, operation, maintenance, management,financing, and expansion of water supply facilities, and the provision of septage management in Sta.Barbara, Pangasinan. The franchise has a term of twenty-five (25) years from the commencementdate.
On June 11, 2018, MWPVI received a Notice to Proceed from the Municipality of Sta. Barbara for theimplementation of the project.

- 264 -
*SGVFS039491*
On August 13, 2018, MWPVI was granted a franchise by the Municipality of San Fabian, Pangasinanto establish, construct, operate, manage, repair, and maintain a water supply system and facilities,and the provision of septage management in the municipality of San Fabian, Pangasinan. Thefranchise has a term of twenty-five (25) years from the commencement date.
On December 3, 2018, MWPVI was granted a franchise by the Municipality of Manaoag, Pangasinanto establish, construct, operate, manage, repair, and maintain a water supply system and facilities,and the provision of septage management in the municipality of Manaoag, Pangasinan. Thefranchise has a term of twenty-five (25) years from the commencement date.
On January 25, 2019, MWPVI received a notice to proceed for the implementation of the said project.
In 2019, MWPVI signed each of the MOAs with the Municipalities of Sta. Barbara, San Fabian, andManaoag.
On September 16, 2019, MWPVI incorporated North Luzon Water to operate the franchises grantedin Sta. Barbara, San Fabian, and Manaoag in Pangasinan.
MWPVI’s Grant of Franchise from Sangguniang Panlungsod of IloiloOn March 26, 2019, the Sangguniang Panlungsod of Iloilo City granted a non-exclusive franchise tothe joint venture between MWPVI and TPGI to construct, establish, commission, operate andmaintain a water supply system to service the population of the Iloilo City.
The frachise granted to MWPVI shall be for a term of twenty-five (25) years, covering all thebarangays under the governance and jurisdiction of Iloilo City.
Aqua Centro and Laguna Water MOAs with Raemulan Lands, Inc (RLI)On July 10, 2019, Aqua Centro and Laguna Water entered into three (3) MOAs with RaemulanLands, Inc. (RLI) for the construction, operation, and management of water distribution facilities inPasinaya North and Tradizo Enclaves in Cavite and Jubilation Enclave in Laguna.
Aqua Centro and Laguna Water have started operations in 2019.
MWTS’s Integrated Waste Management Facility with the City of MarikinaOn July 31, 2019, MWTS received the Certificate of Acceptance and Grant of Original ProponentStatus from the Office of the Mayor of the City of Marikina to build and operate an Integrated WasteManagement Facility to treat and process the city solid waste of Marikina City. The Certificateauthorizes the commencement of detailed negotiations with respect to the terms and conditions of theproject.
Raw Water Supply Offtake Agreement among the Parent Company, MWSS, and WawaJVCo, Inc.On August 6, 2019, MWSS along with the Parent Company signed a thirty (30)-year Raw WaterSupply Offtake Agreement with WawaJVCo, Inc., a joint venture company formed between PrimeMetroline Infrastructure Holdings Corporation and San Lorenzo Builders and Developers Corporation.This will involve the supply of 518 million liters per day of raw water from the Wawa and Tayabasanrivers and is among the medium-term water supply augmentation measures identified to providewater security and sustainability to the consumers of the East Service Area. The effectivity of theagreement shall be subject to the fulfillment of conditions precedent including the approval of theMWSS RO.

- 265 -
*SGVFS039491*
ACEIFeed-in-Tariff (FIT)On June 10, 2015, San Lorenzo Wind Project (SLWP) was issued a Certificate of Endorsement forFeed-In Tariff Eligibility by the DOE. On December 1, 2015, PHINMA Renewable received itsCertificate of Compliance from the ERC which entitles PHINMA Renewable to recognize its FIT at anapproved rate of P=7.40, with a retroactive period beginning December 27, 2014, for a guaranteedperiod of twenty (20) years until December 26, 2034. Outstanding receivable under the FIT Systemamounted to P=129.97 million and P=190.89 million as at December 31, 2019 and December 31, 2018,respectively.
Power Supply Agreement with MERALCOBaseload DemandOn September 9, 2019, the bid submitted by ACEPH was declared as one of the best bids ofMERALCO’s 1200 MW. ACEPH will supply MERALCO a baseload demand of 200MW fromDecember 26, 2019 until December 25, 2029 subject to the approval of the Energy RegulatoryCommission (ERC).
Mid-merit SupplyOn September 11, 2019, the bid submitted by ACEPH was declared as one of the best bids ofMERALCO’s 500 MW. ACEPH will supply MERALCO a baseload demand of 110MW fromDecember 26, 2019 until December 25, 2024 subject to the approval of the ERC. Power PurchaseAgreement / Contract to Purchase Generated Electricity ACEPH entered into contracts with MGI andthird parties where ACEPH will purchase the entire or a portion of the net electricity output of thepower plants for a period ranging from three (3) to twenty (20) years at an agreed price, subject tocertain adjustments.
Power Administration and Management Agreement (PAMA)ACEPH entered into PAMA with its subsidiaries PHINMA Power, CIPP and One Subic Power. Underthe terms of PAMA, ACEPH will administer and manage the entire generation output of the plants andwill pay for all electricity delivered by the power plant based on a formula as set forth in PAMA andshall be payable monthly. PAMAs with PHINMA Power and CIPP are valid for ten (10) years and aresubject to regular review, while PAMA with One Subic Power is valid throughout the life of the relatedFacilities Lease Agreement with SBMA.On January 12, 2018, PAMAs with CIPP and PHINMA Power were amended, providing for certaincapacity rates based on nominated capacity and billing of fuel recovery and utilization fee. The newPAMAs became effective starting March 26, 2018 and valid for 10 years and are subject to regularreview.Ancillary Services Procurement Agreements (ASPA) with NGCPACEPH and certain subsidiaries executed ASPAs with NGCP. Under the ASPA, the power plants willprovide contingency and dispatchable reserves to NGCP to ensure reliability in the operation of thetransmission system and the electricity supply in the Luzon Grid for five (5) years upon the effectivityof the provisional approval or final approval issued by the ERC. ERC’s provisional approval isextended every year.
Other Electricity Supply Agreements (ESA) / Contract for the Sale of Electricity (CSE) with customersACEPH signed contracts to supply the energy requirements of various bilateral and RES contestablecustomers with a duration ranging from one (1) to fifteen (15) years.
SC 14 (North Matinloc)ACEPH holds a 6.103% participating interest in SC 14 Block B-1 which hosts the North Matinloc-2(NM-2) production well. The well is produced on cyclical mode with rest period longer than the flowphase, to enable the reservoir to build up enough pressure to push the crude to surface. In 2016, thewell produced a total of 9,123 barrels of crude oil for an average 760 barrels monthly production.

- 266 -
*SGVFS039491*
Solar Energy Service Contract (SESC) (Bugallon, Pangasinan)On May 22, 2017, the DOE awarded a SESC to the ACEPH which grants ACEPH the exclusive rightto explore, develop and utilize the solar energy resource in a 648-hectare area in the Municipality ofBugallon, Province of Pangasinan. Pre-development activities, such as, yield assessment,environmental impact study and system impact study are underway and are expected to becompleted within the year. ACEPH hopes to construct a 45MW ground mount fixed-tilt grid tied solarPV plant in the service contract area. The term of the service contract is twenty-five (25) years,extendable for another 25 years. As at November 13, 2019, all costs of the Bugallon Solar projectwere not capitalized as these were costs incurred prior to exploration and development activities.
Solar Energy Service Contract (Lipa City and Padre Garcia, Batangas)On July 18, 2017, the DOE awarded a SESC to the ACEPH, which grants ACEPH the exclusive rightto explore, develop and utilize the solar energy resource in a 486 hectare area in the City of Lipa andMunicipality of Padre Garcia, Province of Batangas. ACEPH hopes to construct a 45MW groundmount fixed-tilt grid connected solar plant in the service contract area. All technical studies werecompleted and necessary permits were secured such as the ECC as well as local governmentendorsement. The term of the service contract is twenty-five (25) years, extendable for another 25years. As at November 13, 2019, all costs of the Lipa and Padre Garcia Solar project were notcapitalized as these were costs incurred prior to exploration and development activities.
On August 11, 2016, ACEI executed a Fee Agreement with Blackstone Capital Partners (Cayman) VIL.P. (Blackstone) to perform certain services and undertake certain obligations in relation toBlackstone’s investments in the Philippines. Pursuant to the Fee Agreement, the Group entered into aTrust Agreement with BPI to administer the release of the fee. On June 18, 2018, the Trusteereleased a total of US$10.83 million (or P579.02 million). Consequently, the Group recognizedincome the same amount as Other revenue in the consolidated statement of comprehensive income.
On December 22, 2016, ACEI SG and AC Energy Cayman, a wholly-owned subsidiary of ACEI,executed an Assignment Agreement whereby the former assigned all its rights, titles and interestunder the Fee Agreement to the latter. Since the assignment was made in relation to the GNPDproject, where Blackstone was an investor, ACEI SG and AC Energy Cayman agreed that the releaseof the fee (under the Fee Agreement) to AC Energy Cayman shall be made based on the agreedmilestone.
ACEI SG and AC Energy Cayman also agreed to cause Blackstone to deposit the fee to a trust
account with a trust bank that would administer the release of the fee.
On December 23, 2016, ACEI SG entered into a Trust Agreement with BPI Trust. As the trustee, BPITrust has the sole power and authority to manage the fund and operate the trust account (i.e. invest,reinvest or lend the fund). The amount deposited in the trust account amounted to US$41.7 millionas of December 31, 2016.
On September 15, 2017, ACEI SG signed an Amended and Restated Trust Agreement with BPIto revise the mechanics for the release of the fee.
On September 18, 2017, BPI Asset Management Trust Corp., as Trustee under the Trust Agreement,released a total of US$14.1 million to AC Energy Cayman in consideration for the achievement of theGNPD loan drawdown milestone per the Trust Agreement. Consequently, AC Energy Caymanrecognized income of the same amount equivalent to P=1.5 billion.
On June 18, 2018 and December 20, 2018, the Trustee released a total of US$10.8 million(P=579.0 million) and US$4.7 million (P=248.2 million), respectively to AC Energy Cayman inconsideration for the achievement of the GNPD loan drawdown milestone per the Trust Agreement(see Note 19).

- 267 -
*SGVFS039491*
Investment in Star Energy Salak-Darajat B.V.On December 22, 2016, ACEI, as part of an Indonesian and a Philippine consortium, signed theshare Sale and Purchase Agreements with Chevron Global Energy, Inc., Union Oil Company ofCalifornia, and their relevant affiliates for the purchase of its geothermal operations in Indonesia andPhilippines.
The Indonesian consortium consists of ACEI, Star Energy Group Holdings Pte. Ltd. Star, Star EnergyGeothermal Pte. Ltd., DGA SEG BV and Electricity Generating Public Co. Ltd. The acquisition wasmade through the consortium’s company, namely Star Energy Geothermal (Salak-Darajat) B.V.,which is 19.8%-owned by ACEI, subject to the satisfaction of certain agreed conditions.
On March 31, 2017, ACEI completed the purchase and acquisition of Chevron’s geothermal assetsand operations in Indonesia amounting to US$170.18 million (or P=8,536.43 million). The Indonesiaassets and operations include the Darajat and Salak geothermal fields in West Java, Indonesia, witha combined capacity of 637MW of steam and power.
On July 24, 2017, ACEI together with Star Energy Geothermal Holdings Pte. Ltd., entered intodefinitive agreements for the transfer of 99% of their consortium interests in ACEI-STAR Holdings,Inc. to AllFirst Equity Hodings, Inc. (AllFirst). AllFirst is Chevron’s current partner, and directly holds a60% ownership interest in Philippine Geothermal Production Company.
In 2018, ACEI earned management fees from Salak Darajat amounting to P=21.99 million (nil in 2017).
AC InfraOn September 12, 2015, LRMC took over the operations of LRT Line 1. In December 2015, LRMCstarted its rehabilitation of the existing line. On June 28, 2019, the Structural Restoration Project,which includes the parapets, faulty concrete and repair of river bridges, of the existing line wascompleted. As of December 31, 2019, the Engineering, Procurement and Construction (EPC) Worksrelated to the Existing System Rehabilitation, the Re-engineering Project, the RSS RehabilitationProject and the Security Network Systems Project are 55.4%, 93.3% (project management to on-siteinstallation) and 85.0% (defect liability period and tuning phases), 73.4%, 80.1% complete,respectively.
Construction of the Cavite extension is expected to commence once right of way is delivered by theGrantors and is targeted to complete four years thereafter. On May 30, 2017, LRMC received thePermit to Enter certificate from the Grantors allowing LRMC to enter the concerned properties andcommence the construction of Cavite extension. As of December 31, 2019, the EPC Works relatedto the Cavite Extension Works is 33.9% complete.
On February 12, 2018, the NAIA Consortium composed of Aboitiz InfraCapital, Inc., AC InfrastructureHoldings Corporation, Alliance Global Group Inc., Asia’s Emerging Dragon Corporation, ChangiAirport International Capital Pte. Ltd., Filinvest Development Corporation, JG Summit Holdings, Inc.and Metro Pacific Investments Corporation submitted its unsolicited proposal for the rehabilitation,upgrade, expansion, operation, and maintenance of the Ninoy Aquino International Airport.
AITHI GroupOn December 5, 2018, AITHI signed a Distributorship Agreement with Kia Motors Corporation (KMC)to distribute the Kia brand in the Philippines. A joint venture company, with AITHI as majoritystockholder, will be established in collaboration with Columbian Autocar Corporation (CAC) toundertake this new business and re-establish the Kia brand in the Philippines. KMC wasincorporated on January 17, 2019.
On September 28, 2018, SAIC MAXUS Automotive Co., Ltd. (Maxus) has appointed AITHI as theofficial distributor of Maxus vehicles in the Philippines. Maxus is a wholly-owned subsidiary of SAICMotor Corporation Limited, with an emerging portfolio focused on light commercial vehicles.

- 268 -
*SGVFS039491*
37. Contingencies
The Group has various contingent liabilities arising in the ordinary conduct of business which areeither pending decision by the courts or being contested, the outcome of which are not presentlydeterminable.
In the opinion of the Group’s management and its legal counsel, the eventual liability under theselawsuits or claims, if any, will not have a material or adverse effect on the Group’s financial positionand results of operations.
MWCReal Property Tax AssessmentOn October 13, 2005, the Municipality of Norzagaray, Bulacan assessed MWC and Maynilad WaterServices, Inc. (jointly, the Concessionaires) real property taxes on certain common purpose facilitiesregistered in the name of and owned by MWSS purportedly due from 1998 to 2005 amounting toP=357.1 million. On November 15, 2010, the local government of Quezon City demanded thepayment of P=302.7 million for deficiency real property taxes from MWSS on MWSS properties withinits territorial jurisdiction. The assessments from the municipality of Norzagaray and Quezon Cityhave been questioned by the Concessionaires and MWSS, and are pending resolution before theCentral Board of Assessment Appeals and Supreme Court, respectively. On November 7, 2018, theSupreme Court issued its decision declaring that the real properties of the MWSS located in QuezonCity are exempt from the real estate tax imposed by the local government of Quezon City. Totalprovision for these assessments amounted to nil and P=416.2 as of December 31, 2019 and 2018 (seeNote 13).
38. Assets Held in Trust
MWSSMWC was granted the right to operate, maintain in good working order, repair, decommission andrefurbish the movable property required to provide the water and sewerage services under theAgreement. The legal title to all movable property in existence at the Commencement Date,however, shall be retained by MWSS and upon expiration of the useful life of any such movableproperty as may be determined by MWC, such movable property shall be returned to MWSS in itsthen-current condition at no charge to MWSS or MWC.
The Agreement also provides for the Concessionaires to have equal access to MWSS facilitiesinvolved in the provision of water supply and sewerage services in both East and West Zonesincluding, but not limited to, the MWSS management information system, billing system, telemetrysystem, central control room and central records.
The net book value of the facilities transferred to MWC on Commencement Date based on MWSS’closing audit report amounted to P=4.6 billion with a sound value of P=10.4 billion.
In 2019, MWC engaged the services of Royal Asia Appraisal Corporation to conduct a re-appraisal ofthe assets managed by MWC as of December 31, 2019. Total appraised value as of December 31,2019 amounted to P=28.1 billion.
MWSS’ corporate headquarters is made available to the Concessionaires starting August 1, 1997,subject to periodic renewal by mutual agreement of the parties. On August 28, 2012, additional officespace was leased by MWC. The lease was last renewed on July 8, 2019. In 2019, MWC madepayments amounting to P=36.0 million recorded as deduction to lease liabilities. In 2018 and 2017,total rent payments amounted to P=32.3 million and P=27.8 million, respectively, which are includedunder “General and administrative expenses” in the consolidated statements of comprehensiveincome.

- 269 -
*SGVFS039491*
In March 2015, MWC and MWSS entered into an agreement for the lease of a portion of the SanJuan Reservoir and Aqueduct Complex being utilized by MWC as stockyard for its pipes and othermaterials. The lease agreement shall continue to be in effect until the termination of the ConcessionAgreement. Rent payments made from 2017 to 2019 amounted to P=16.2 million each year which isrecorded in 2019 as deduction to lease liabilities and included under “General and administrativeexpenses” in the consolidated statement of comprehensive income.
PGLLAWC was granted the right to manage, occupy, operate, repair, maintain, decommission andrefurbish the property required to provide water services under its concession agreement with PGL.The legal title of all property in existence at the commencement date shall be retained by PGL. Uponexpiration of the useful life of any such property as may be determined by LAWC, such property shallbe returned to PGL in its then condition at no charge to PGL or LAWC.
In 2014, LAWC engaged the services of Cuervo Appraisers to conduct a re-appraisal of PGL assetson record as of December 31, 2013. Total replacement cost as of December 31, 2013 amounted toP=2.1 billion with a sound value of P=1.6 billion.
TIEZABIWC was granted the right to operate, maintain in good working order, repair, decommission andrefurbish all fixed and movable property (except retained assets) required to provide the water andsewerage services under its concession agreement with TIEZA. The legal title to all theses assets inexistence at the commencement date, however, shall be retained by TIEZA and upon expiration ofthe useful life of any such assets as may be determined by BIWC, such assets shall be returned toTIEZA in its then-current condition at no charge to TIEZA or BIWC.
The net book value of the facilities transferred to MWC on commencement date based on TIEZA’sclosing audit report amounted to P=618.2 million.
In 2015, BIWC engaged the services of Cuervo Appraisers, Inc. to conduct an appraisal of its assetsas of August 18 to 20, 2015. Total replacement cost as of December 31, 2015 amounted toP=1.1 billion with a sound value of P=793. 4 million.
CDCClark Water was granted the right to finance, design and construct new facilities and to manage,exclusively possess, occupy, operate, repair, maintain, decommission, and refurbish all facilities,except private deepwells, to provide and manage the water and wastewater-related services in theCFZ.
OWDOn October 12, 2017, Obando Water was granted the right to manage, operate, maintain, repair,refurbish and improve, expand and as appropriate, decommission all fixed and movable assets,including movable property but excluding retained assets, required to provide water delivery andsanitation services in the Municipality of Obando. Legal title to all facilities (including any fixed assetsresulting from the exercise of rights and powers), other than new assets contributed by ObandoWater, shall remain with OWD.
CWDOn October 23, 2017, Calasiao was granted the right to develop, manage, operate, maintain, repair,refurbish and improve, expand and as appropriate, decommission all fixed and movable assets,including movable property but excluding retained assets, required to provide water delivery andsanitation services in the Municipality of Calasiao. Legal title to all facilities (including any fixedassets resulting from the exercise of rights and powers), other than new assets contributed byCalasiao Water, shall remain with CWD.

- 270 -
*SGVFS039491*
PAGWADOn January 21, 2019, Laguna Water was granted the right to operate, finance, maintain, repair,improve, expand, renew, and as appropriate, decommission all fixed and movable assets, includingmovable property but excluding retained assets, required and exclusively used to provide waterdelivery and sanitation services in the service area of PAGWAD.
TnWDOn February 4, 2019, South Luzon Water was granted the right to operate, maintain, repair, improve,expand, renew, and as appropriate, decommission all fixed and movable assets, including movableproperty but excluding retained assets, required to provide water supply and sanitation services in theservice area of TnWD.
BuWDOn June 14, 2019, BuWD was granted the right to operate, maintain, repair, improve, expand, renew,and as appropriate, decommission all fixed and movable assets, including movable property butexcluding retained assets, required to provide water delivery and sanitation services in the servicearea of BuWD.
LWD On July 3, 2019, Aqua Centro was granted the right to operate, maintain, repair, improve,expand, renew, and as appropriate, decommission all fixed and movable assets, including movableproperty but excluding retained assets, required to provide water supply in the service area of LWD.
CCWDOn July 3, 2019, CCWD was granted the right to operate, maintain, repair, improve, expand, renew,and as appropriate, decommission all fixed and movable assets, including movable property butexcluding retained assets, required to provide water supply and sanitation services in the service areaof CCWD.
39. Renewable Energy Act of 2008
Republic Act No. 9513, An Act Promoting the Development, Utilization and Commercialization ofRenewable Energy Resources and for Other Purposes, which shall be known as the “RenewableEnergy Act of 2008” (the Act), became effective on January 30, 2009. The Act aims to: (a) acceleratethe exploration and development of renewable energy resources such as, but not limited to, biomass,solar, wind, hydro, geothermal and ocean energy sources, including hybrid systems, to achieveenergy self-reliance, through the adoption of sustainable energy development strategies to reduce thecountry’s dependence on fossil fuels and thereby minimize the country’s exposure to pricefluctuations in the international markets, the effects of which spiral down to almost all sectors of theeconomy; (b) increase the utilization of renewable energy by institutionalizing the development ofnational and local capabilities in the use of renewable energy systems,and promoting its efficient andcost-effective commercial application by providing fiscal and non-fiscal incentives; (c) encourage thedevelopment and utilization of renewable energy resources as tools to effectively prevent or reduceharmful emissions and thereby balance the goals of economic growth and development with theprotection of health and environment; (d) establish the necessary infrastructure and mechanism tocarry out mandates specified in the Act and other laws.
As provided for in the Act, Renewable Energy (RE) developers of RE facilities, including hybridsystems, in proportion to and to the extent of the RE component, for both power and non-powerapplications, as duly certified by the DOE, in consultation with the Board of Investments, shall beentitled to the following incentives, among others:
i. Income Tax Holiday (ITH) – For the first seven (7) years of its commercial operations, the dulyregistered RE developer shall be exempt from income taxes levied by the National Government;

- 271 -
*SGVFS039491*
ii. Duty-free Importation of RE Machinery, Equipment and Materials – Within the first ten (10) yearsupon issuance of a certification of an RE developer, the importation of machinery and equipment,and materials and parts thereof, including control and communication equipment, shall not besubject to tariff duties;
iii. Special Realty Tax Rates on Equipment and Machinery – Any law to the contrarynotwithstanding, realty and other taxes on civil works, equipment, machinery, and otherimprovements of a registered RE developer actually and exclusively used for RE facilities shallnot exceed 1.5% of their original cost less accumulated normal depreciation or net book value;
iv. NOLCO – the NOLCO of the RE developer during the first three (3) years from the start ofcommercial operation which had not been previously offset as deduction from gross income shallbe carried over as deduction from gross income for the next seven (7) consecutive taxable yearsimmediately following the year of such loss;
v. Corporate Tax Rate – After seven (7) years of ITH, all RE developers shall pay a corporate tax of10% on its net taxable income as defined in the National Internal RevenueCode of 1997, as amended by Republic Act No. 9337;
vi. Accelerated Depreciation – If, and only if, an RE project fails to receive an ITH before fulloperation, it may apply for accelerated depreciation in its tax books and be taxed based on such;
vii. Zero Percent VAT Rate – The sale of fuel or power generated from renewable sources of energyshall be subject to 0% VAT;
viii. Cash Incentive of RE Developers for Missionary Electrification – An RE developer, establishedafter the effectivity of the Act, shall be entitled to a cash generation-based incentive per kilowatt-hour rate generated, equivalent to 50% of the universal charge for power needed to servicemissionary areas where it operates the same;
ix. Tax Exemption of Carbon Credits – All proceeds from the sale of carbon emission credits shall beexempt from any and all taxes; and
Tax Credit on Domestic Capital Equipment and Services – A tax credit equivalent to 100% of thevalue of the value-added tax and customs duties that would have been paid on the REmachinery, equipment, materials and parts had these items been imported shall be given to anRE operating contract holder who purchases machinery, equipment, materials, and parts from adomestic manufacturer for purposes set forth in the Act.
In addition, to accelerate the development of emerging renewable energy resources, a feed-intariff system for electricity produced from wind, solar, ocean, run-of-river hydropower andbiomass will be promulgated which shall include, but not limited to, the following:
a. Priority connections to the grid for electricity generated from emerging renewable energyresources;
b. The priority purchase and transmission of, and payment for, such electricity by the gridsystem operators; and
c. Determine the fixed tariff to be paid to electricity produced from each type of emergingrenewable energy and the mandated number of years for the application of these rates,which shall not be less than twelve (12) years.
The feed-in tariff to be set shall be applied to the emerging renewable energy to be used incompliance with the renewable portfolio standard as provided for in the Act and in accordance withthe feed-in-tariff rules to be promulgated by the Energy Regulatory Commission (ERC) inconsultations with the National Renewable Energy Board. On July 27, 2012, ERC approved the feed-in tariff of 8.53 kilowatt per hour (kWh) for wind renewable energy resource. The approved subsidy

- 272 -
*SGVFS039491*
will be reviewed and readjusted, if necessary, after its three-year initial implementation or when thetarget installed capacity for each renewable resource set by the DOE has been met.
RE developers and local manufacturers, fabricators and suppliers of locally-produced RE equipmentshall register with the DOE, through the Renewable Energy Management Bureau (REMB). Uponregistration, a certification shall be issued to each RE developer and local manufacturer, fabricatorand supplier of locally-produced renewable energy equipment to serve as the basis of theirentitlement to the incentives provided for in the Act. All certifications required to qualify REdevelopers to avail of the incentives provided for under the Act shall be issued by the DOE throughthe REMB.
Within six (6) months from the effectivity of the Act, the DOE shall, in consultation with the Senateand House of Representatives Committee on Energy, relevant government agencies and REstakeholders, promulgate the Implementing Rules and Regulations of the Act. On May 25, 2009, theDOE issued the Implementing Rules and Regulations of the Act which became effective on June 12,2009.
ACEI and its subsidiaries expect that the Act will impact their future operations and financial results.The impact of the Act will be disclosed as the need arises.
NorthwindOn January 18, 2010, Northwind filed its intent with the REMB for the conversion of its NegotiatedCommercial Contract into Wind Energy Service Contract and Registration as RE Developer asprovided for under the Act. On November 9, 2010, the DOE issued a Provisional Certificate ofRegistration as an RE Developer in favor of Northwind, subject to negotiation and execution of aWind Energy Service Contract to replace the Negotiated Commercial Contract.
On April 6, 2011, Northwind filed with the ERC an application for a Feed-In Tariff (FiT). The FiT willprovide for a fixed rate per kilowatt of electricity produced over a period of fifteen years. On June 6,2011, the ERC granted Northwind a provisional FiT rate of P=9.30 per kilowatt hour which shall beeffective and collected only upon the final approval of the FiT for emerging renewable energytechnologies, specifically for wind energy.
On October 10, 2014, the DOE granted Northwind a Certificate of Endorsement for Feed-In Tariff(FIT) Eligibility (COE-FIT No. 2014-10-001) for its Phase III expansion project. The endorsementqualifies the Phase III expansion under the FIT System and accordingly, will be granted the nationalFIT for wind projects amounting to 8.53/kWh. The endorsement shall be the basis for the EnergyRegulatory Commission (ERC) to issue a FIT Certificate of Compliance.
On November 11, 2014, commercial operations of the wind farm projects started in accordance withthe COE. On April 13, 2015, the FIT COC was subsequently issued for both the 19-MW wind farmexpansion in Bangui under Northwind and the 81-MW wind farm in Caparispisan, Pagudpud underNLREC for a period of 20 years. The FIT rate covers the period October 10, 2014 to October 9, 2034for Northwind’s 19MW Phase III wind farm and November 11, 2014 to November 10, 2034 forNLREC’s 81MW project.
For the period from November 11, 2014 to December 31, 2014, the Northwind generated 30.07million kilowatt-hours of electricity from the Wind Farm Project which was entirely sold to WESM.Such generation resulted to revenue (earned from WESM) amounting to P=75.21 million (Ph2.50/kWh)from November 11 to December 31, 2014. The Actual FIT Differential amounted to P=183.02 million.
On June 5, 2015, Northwind and NLREC collected the first FIT differential payment from Transco.Monte SolarOn June 13, 2016, the DOE, through its issuance of the Certificate of Endorsement, certified theMontesolar’s Solar Farm Project as an eligible project under the FiT system. On July 4, 2016, theERC issued a provisional authority to operate until January 31, 2017. On December 28,2016, Montesolar received another provisional authority to operate by the ERC dated December 8,

- 273 -
*SGVFS039491*
2016 but this time, as a renewable energy generation company, which allows Monte Solar to beentitled to a FiT rate of P=8.69/Kwh for a period of twenty (20) years from March 13, 2016.
On August 8, 2017, Montesolar collected the first FIT differential payment from Transco.
As of December 31, 2017, Montesolar recognized FIT differential totalling P=233.3 millioncovering the period March to August 2016 and January to September 2017.
Last February 2018, Northwind received FIT adjustment from P=5.76 to P=5.96 applied from billingperiods July 25, 2015 to January 25, 2018.
40. Events after the Reporting Period
Parent Companya) On January 7, 2020, 9,716 common shares were exercised under the Parent Company’s ESOP.
b) On January 15, 2020, the Parent Company has fully utilized the proceeds from the reissuance ofPreferred B Series 2 shares.
c) In January 2020, AC Parent made capital infusion to AC Industrials amounting to P=206.5 millionto support its automotive business unit’s operations.
d) On February 7, 2020, 33,751 common shares were exercised under the Parent Company’sESOP.
e) In February 2020, the Parent Company purchased its 1,016,210 common shares pursuant to theshare buyback program of ₱10.0 billion worth of shares approved by the BOD onDecember 5, 2019.
f) On various dates in January to March 2020, the Parent Company made a capital infusion to AHHI
amounting to P=1,929.5 million mainly to support new businesses as follows: Healthway(P=1,478.1 million), Zapfam (P=121.4 million), Vigos Ventures, Inc. (P=104 million) and ZodiacZodiac Prime Ventures Holdings, Inc. (P=87 million).
g) On March 12, 2020, the Parent Company’s BOD approved an additional funding of up toP=600.0 million to fund investment of AC Infra in Entrego.
h) On March 12, 2020, the Parent Company’s BOD approved the consolidation of ACEI’sinternational and Philippine assets under an asset-for-share swap of ACEPH shares to Presageshares (common and redeemable preferred shares) subject to certain conditions and terms. Thiswill result in transfer of direct ownership of Presage from ACEI to ACEPH. Certain renewablesassets and business of ACEI are under Presage.
ALIa) On February 7, 2020, ALI’s subsidiary, AREIT, Inc., filed its application for a REIT offering to the
SEC, following the release of the Revised Implementing Rules and Regulations (IRR) of RepublicAct (RA) No. 9856, or the Real Estate Investment Trust Act of 2009 last January 20, 2020.
ALI seeks to do an Initial Public Offering (IPO) of AREIT, Inc. after receiving the regulatoryapprovals from the SEC and PSE.
b) On February 20, 2020, the BOD approved the raising of up to P=10 billion through the issuance ofretail bonds under its current Shelf Registration program and will be listed on the PDEx to partiallyfinance general corporate requirements and to refinance maturing loans.

- 274 -
*SGVFS039491*
c) The BOD also approved the increase of additional P=25 billion to ALI’s current share buybackprogram bringing the available balance to P=26.1 billion. The program will be implemented throughopen market purchases executed via the trading facilities of the Philippine Stock Exchange.
AHHIa) On December 6, 2019, AHHI signed a binding agreement to acquire a 100% stake in Healthway
Philipines, Inc. (Healthway) from Healthway Asia Ltd. Healthway Philippines, Inc. owns, throughits wholly-owned subsidiary HMC, Inc., the Healthway chain of clinics that comprises of 7 mall-based specialty clinics and 40 corporate clinics in the country.
On January 15, 2020, AHHI and Healthway Asia Ltd. completed the transaction, making AHHI thenew sole owner of Healthway Philippines, Inc. As of March 12, 2020, the acquisition-date fairvalue is still incomplete.
b) On various dates in January to March 2020, the Parent Company made a capital infusion to AHHIamounting to P=1,929.5 million mainly to support new businesses as follows:Healthway (P=1,478.1 million), Zapfam, Inc. (P=121.4 million), Vigos Ventures, Inc. (P=104 million)and Zodiac Prime Ventures Holdings, Inc. (P=87 million).
AC Infraa) On January 24, 2020, AC Infra made a capital infusion of P=100.0 million into Entrego for the
subscription to additional 100.0 million preferred shares at P=1.00 per share.
b) On January 28, 2020, AC Infra Group received capital infusion from the Parent Companyamounting to P=362.5 million for the issuance of 362,500 common shares. The shares are issuedat a subscription price of P=1,000.00 per share, P=900.00 per share in excess of par, resulting toP=326.25 million APIC.
c) On January 30, 2020, AC Infra made a capital infusion of P=262.50 million into LRMHI for thesubscription to 131,250,000 additional common shares at P=2.00 per share, P=1.00 per share inexcess of par. The infusion is proportionate to its equity share in LRMHI.
d) On March 12, 2020, the Parent Company’s BOD approved an additional funding of up toP=600 million to fund investment of AC Infra in Entrego.
MWCa) On January 29, 2020, MWC received a response letter from the MWSS RO confirming that the
twenty-five (25)-year Concession Agreement from 1997 to 2022 and the Memorandum ofAgreement and Confirmation between MWC and MWSS providing for the fifteen (15)-yearextension from 2022 to 2037 have not yet been cancelled.
b) On January 31, 2020, the BOD approved the amendment of the Seventh Article of the Articles ofIncorporation to increase the authorized capital stock from P=3.5 billion to P=4.4 billion, whichincrease will consist of an additional 900.0 million common shares. The BOD also approved theincrease in the carved-out shares from 300.0 million to 900.0 million unissued common sharesand to allow the issuance of the carved-out shares “for cash, properties or assets to carry out” thecorporate purposes” of MWC as approved by the BOD.
c) On February 1, 2020, MWC and Prime Metroline Holdings, Inc., on behalf of a company to beincorporated (to be named Trident Water), signed a subscription agreement for the acquisition of820.0 million common shares (equivalent to 24.96% economic rights) of MWC at P=13.00 pershare.
On February 6, 2020, the Parent Company, as part of the shareholder agreement to be executedamong itself, its wholly owned subsidiary Philwater and Trident Water, Ayala’s ExecutiveCommittee approved the grant of proxy rights by Philwater to Trident Water over its 4.0 billionpreferred shares to enable the latter to achieve 51.0% voting interest in MWC, subject to the

- 275 -
*SGVFS039491*
fulfillment of the conditions set forth in the subscription agreement. Upon the grant of proxy rightsto Trident Water, the Parent Company’s effective voting interest in MWC will stand at 31.60%.This arrangement aims to strategically rationalize the economic and voting stakes between theParent Company and Trident Water as strategic partners in MWC.On February 7, 2020, MWC received a letter from Prime Metroline Holdings, Inc. that it hasannounced through publication in a newspaper of general circulation, its intention to make amandatory offer for the shares of MWC at an offer price of P=13.00 per share.
The subscription agreement will become effective after certain conditions precedent are met,including relevant third party consents and regulatory approvals.
d) On February 3, 2020, MW Consortium and the PGC signed the Terms of Reference for theinterim protocol between both parties pending Settlement with Finality of the Dispute betweenMW Consortium and PGC.
e) On February 17, 2020, the BOD of MWPVI approved the extension of Zamboanga Water’sshareholder loan amounting to P=76.0 million which will be used by Zamboanga Water for theprepayment in 2020 of its outstanding loan with DBP.
IMIa) In January 2020, the outbreak of Coronavirus Disease 2019 (COVID-19) in China caused
delayed resumptions of work in all China manufacturing facilities in conformance with localgovernment notices.
As at reporting date, all subsidiaries in China were operational at different levels of capacity.
The IMI Group will monitor the developments of the COVID-19 situation closely and continue toassess its impact on the 2020 financial position and performance of the Group. However, the IMIGroup does not expect that this will have significant impact on the 2019 judgments andestimates.
b) On February 24, 2020, the BOD of IMI authorized and approved the execution of a shareholders’agreement among Coöperatief IMI Europe U.A. (Cooperatief), the noncontrolling shareholder ofVIA, and VIA Optronics AG to extend the exercise period of the noncontrolling shareholder’s 5%put option right, subject to, among others, Cooperatief having a right of first refusal over said non-controlling shareholder’s shares including those transferred to his immediate family.
ACEIa) On September 16, 2019, ACEPH signed a baseload Power Purchase Agreement (“PSA”) and a
midmerit PSA both with MERALCO for the supply of 200MW baseload and 110MW mid-meritscapacity, respectively, to MERALCO. The baseload PSA and the mid-merit PSA have beenapplied for approval with the Energy Regulatory Commission (“ERC”), the review of which is on-going. On December 10, 2019, the ERC issued provisional authorities for the two (2) PSAs, whilehearings for the issuance of final authority is on-going. On February 7 2020, ACEPH filed motionsfor reconsideration with the ERC to ask for a re-evaluation of the provisional authorities and anincrease in the provisionally approved rates.
b) On November 14, 2019, ACEPH signed a First Amended and Restated Share PurchaseAgreement with the investors of the Philippine Investment Alliance for Infrastructure (PINAI) forthe acquisition of PINAI's indirect ownership interest in NLR. PINAI is a fund composed ofMacquarie Infrastructure Holdings (Philippines) Pte. Limited, the Government Service InsuranceSystem, and Langoer Investments Holding, B.V. It has a 31% preferred equity ownership and15% common equity ownership in NLR. The acquisition is subject to certain conditions precedentincluding the approval by the PCC. PCC approval was obtained on February 4, 2020. Theacquisition was thereafter completed on February 27, 2020, with GIGA ACE 1, ACEPH’sdesignated affiliate as buyer, purchasing PINAI’s ownership interest in NLR.

- 276 -
*SGVFS039491*
c) On December 2, 2019, ACEPH signed a Share Purchase Agreement with PINAI for theacquisition of PINAI's ownership interest in Sacasol. PINAI is a fund composed of MacquarieInfrastructure Holdings (Philippines) Pte. Ltd., the Government Service Insurance System, andLangoer Investments Holding, B.V. PINAI has a 96% economic interest in Sacasol. Theacquisition is subject to certain conditions precedent including the approval by PCC. PCCapproval was obtained on February 18, 2020.
On December 2, 2019, ACEPH signed a Share Purchase Agreement with the PINAI for theacquisition of PINAI's ownership interest in Islasol. PINAI is a fund composed of MacquarieInfrastructure Holdings (Philippines) Pte. Ltd., the Government Service Insurance System, andLangoer Investments Holding, B.V. PINAI has a 98% economic interest in Islasol. The acquisitionis subject to certain conditions precedent including the approval by PCC. PCC approval wasobtained on February 28, 2020
d) On March 12, 2020, the Parent Company’s BOD approved the consolidation of ACEI’sinternational and Philippine assets under an asset-for-share swap of ACEPH shares to PresagePresage shares (common and redeemable preferred shares) subject to certain conditions andterms. This will result in transfer of direct ownership of Presage from ACEI to ACEPH. Certainrenewables assets and business of ACEI are under Presage.
AC Industriala) In January 2020, the Parent Company made a capital infusion to AC Industrials amounting to
P=206.5 million to support its automotive business unit’s operations.
BHLa) On January 23, 2020, VIP infrastructure Holdings Pte. Ltd., disbursed US$82.5 million into FMI
via a convertible loan facility. This represents the second tranche of investment after completionof the conditions precedent for disbursement, including approval by the Central Bank of Myanmarof the convertible loan. The transaction forms part of the VIP’s $237.5 million investment in YomaGroup.
Globea) On January 17, 2020, Globe Telecom, Dito Telecommunity and Smart Communications
incorporated a joint venture company, Telecommunications Connectivity, Inc. (TCI) in line withthe new mobile number portability initiative of the government under RA 11202 also known as the"Mobile Number Portability Act" ("the MNP Act").
TCI is expected to bring in the technical infrastructure to fulfill its primary function as aclearinghouse for the three mobile operators to ensure the smooth implementation of numberporting services.
41. Approval of the Consolidated Financial Statements
The consolidated financial statements of Ayala Corporation and Subsidiaries (the Group) as ofDecember 31, 2019 and 2018 and for each of the three years in the period endedDecember 31, 2019 were endorsed for approval by the Audit Committee on March 6, 2020and authorized for issue by the BOD on March 12, 2020.

S E C F O R M 1 7 - A 253
III. 2019 Consolidated Financial Statements of Associate and Joint Venture


BANK OF THE PHILIPPINE ISLANDS
STATEMENTS OF CONDITION DECEMBER 31, 2019 and 2018
(In Millions of Pesos)
Consolidated Parent
Notes 2019 2018 2019 2018
A S S E T S
CASH AND OTHER CASH ITEMS 4 47,256 43,536 45,982 42,419
DUE FROM BANGKO SENTRAL NG PILIPINAS 4 207,845 225,907 181,815 202,487
DUE FROM OTHER BANKS 4 22,356 12,477 18,356 8,615
INTERBANK LOANS RECEIVABLE AND SECURITIES PURCHASED UNDER AGREEMENTS TO RESELL 4,5 22,570 34,323 18,364 22,659
FINANCIAL ASSETS AT FAIR VALUE THROUGH PROFIT OR LOSS 6,7 24,105 16,721 17,688 10,346
FINANCIAL ASSETS AT FAIR VALUE THROUGH OTHER COMPREHENSIVE INCOME 8 53,905 37,206 48,320 30,583
INVESTMENT SECURITIES AT AMORTIZED COST, net 9 275,105 287,571 252,006 267,497
LOANS AND ADVANCES, net 10 1,475,336 1,354,896 1,231,776 1,125,956
ASSETS HELD FOR SALE, net
3,155 3,363 342 455
BANK PREMISES, FURNITURE, FIXTURES AND EQUIPMENT, net 11 23,748 16,252 16,595 10,146
INVESTMENTS IN SUBSIDIARIES AND ASSOCIATES, net 12 6,746 5,659 10,031 9,942
ASSETS ATTRIBUTABLE TO INSURANCE OPERATIONS 2,4 17,790 16,582 - -
DEFERRED INCOME TAX ASSETS, net 13 9,706 8,536 6,653 5,723
OTHER ASSETS, net 14 15,407 22,199 9,910 16,313
Total assets 2,205,030 2,085,228 1,857,838 1,753,141
(forward)

BANK OF THE PHILIPPINE ISLANDS
STATEMENTS OF CONDITION DECEMBER 31, 2019 and 2018
(In Millions of Pesos)
Consolidated Parent
Notes 2019 2018 2019 2018
LIABILITIES AND CAPITAL FUNDS
DEPOSIT LIABILITIES 15 1,695,343 1,585,746 1,456,458 1,347,207
DERIVATIVE FINANCIAL LIABILITIES 7 2,877 3,891 2,877 3,888
BILLS PAYABLE AND OTHER BORROWED FUNDS 16 150,837 166,901 126,529 150,880
DUE TO BANGKO SENTRAL NG PILIPINAS AND OTHER BANKS
2,946 3,988 2,946 3,988
MANAGER’S CHECKS AND DEMAND DRAFTS OUTSTANDING
8,299 6,931 6,421 5,354
ACCRUED TAXES, INTEREST AND OTHER EXPENSES
9,865 9,057 7,418 6,875
LIABILITIES ATTRIBUTABLE TO INSURANCE OPERATIONS 2 14,061 14,056 - -
DEFERRED CREDITS AND OTHER LIABILITIES 17 47,768 43,120 38,939 35,793
Total liabilities 1,931,996 1,833,690 1,641,588 1,553,985
CAPITAL FUNDS ATTRIBUTABLE TO THE EQUITY HOLDERS OF BPI 18 Share capital
44,999 44,961 44,999 44,961
Share premium
74,449 74,181 74,449 74,181 Reserves
5,108 4,096 4,892 3,977
Surplus
147,460 127,459 94,226 76,958 Accumulated other comprehensive loss (2,439) (2,176) (2,316) (921)
269,577 248,521 216,250 199,156 NON-CONTROLLING INTERESTS 3,457 3,017 - -
Total capital funds 273,034 251,538 216,250 199,156
Total liabilities and capital funds 2,205,030 2,085,228 1,857,838 1,753,141
(The notes on pages 1 to 109 are an integral part of these financial statements.)

BANK OF THE PHILIPPINE ISLANDS
STATEMENTS OF INCOME FOR EACH OF THE THREE YEARS IN THE PERIOD ENDED DECEMBER 31, 2019
(In Millions of Pesos, Except Per Share Amounts)
Consolidated Parent
Notes 2019 2018 2017 2019 2018 2017
INTEREST INCOME On loans and advances 87,151 69,401 54,615 67,895 51,901 38,752 On investment securities 12,709 9,616 9,185 11,776 8,942 8,403 On deposits with BSP and other banks 1,723 1,173 2,049 808 548 977
101,583 80,190 65,849 80,479 61,391 48,132
INTEREST EXPENSE On deposits 15 28,874 21,255 16,660 21,476 15,645 11,413 On bills payable and other borrowed
funds 16 6,764 3,092 1,150 6,031 2,588 885
35,638 24,347 17,810 27,507 18,233 12,298
NET INTEREST INCOME 65,945 55,843 48,039 52,972 43,158 35,834 PROVISION FOR CREDIT AND
IMPAIRMENT LOSSES 5,9,10,14 5,822 4,923 3,795 4,666 4,279 3,519
NET INTEREST INCOME AFTER PROVISION FOR CREDIT AND IMPAIRMENT LOSSES 60,123 50,920 44,244 48,306 38,879 32,315
OTHER INCOME Fees and commissions 9,062 8,224 7,716 8,502 7,219 6,224 Income from foreign exchange trading 2,102 2,128 2,136 1,930 1,831 1,798 Income attributable to insurance
operations 2 1,223 1,223 1,413 - - - Securities trading gain 4,010 719 923 3,678 258 754 Other operating income 19 11,992 10,387 10,793 10,487 5,919 14,171
28,389 22,681 22,981 24,597 15,227 22,947
OTHER EXPENSES Compensation and fringe benefits 21 17,487 15,315 13,897 13,479 11,834 10,691 Occupancy and equipment-related
expenses 11,20 16,123 13,146 11,344 12,943 10,570 9,062 Other operating expenses 21 16,467 15,141 13,292 12,058 11,257 9,626
50,077 43,602 38,533 38,480 33,661 29,379
PROFIT BEFORE INCOME TAX 38,435 29,999 28,692 34,423 20,445 25,883
INCOME TAX EXPENSE 22 Current 10,037 7,404 6,418 8,788 5,793 4,248 Deferred 13 (685) (734) (462) (583) (776) (462)
9,352 6,670 5,956 8,205 5,017 3,786
NET INCOME FOR THE YEAR 29,083 23,329 22,736 26,218 15,428 22,097
Attributable to:
Equity holders of BPI 28,803 23,078 22,416 26,218 15,428 22,097 Non-controlling interests 280 251 320 - - -
29,083 23,329 22,736 26,218 15,428 22,097
Earnings per share for net income attributable to the equity holders of BPI
during the year: Basic and diluted 18 6.39 5.35 5.69 5.82 3.57 5.61
(The notes on pages 1 to 109 are an integral part of these financial statements.)

BANK OF THE PHILIPPINE ISLANDS
STATEMENTS OF COMPREHENSIVE INCOME FOR EACH OF THE THREE YEARS IN THE PERIOD ENDED DECEMBER 31, 2019
(In Millions of Pesos)
Consolidated Parent
Note 2019 2018 2017 2019 2018 2017
NET INCOME FOR THE YEAR 29,083 23,329 22,736 26,218 15,428 22,097
OTHER COMPREHENSIVE (LOSS) INCOME 18 Items that may be subsequently reclassified
to profit or loss Share in other comprehensive income (loss) of
associates 1,286 (1,281) (252) - - - Net change in fair value reserve on
investments in debt instruments measured at FVOCI, net of tax effect 262 (771) - 249 (461) -
Fair value reserve on investments of insurance subsidiaries, net of tax effect 545 (400) 196 - - -
Currency translation differences and others (202) (26) 126 (124) - - Net change in fair value reserve on AFS, net
of tax effect - - 713 - - 449 Items that will not be reclassified to profit or
loss Remeasurements of defined benefit obligation (1,418) 612 (272) (1,141) 431 (338) Share in other comprehensive (loss) income
of associates (32) 596 (528) - - - Net change in fair value reserve on
investments in equity instruments measured at FVOCI, net of tax effect (313) (19) - (379) 320 -
Total other comprehensive (loss) income, net of tax effect 128 (1,289) (17) (1,395) 290 111
TOTAL COMPREHENSIVE INCOME FOR THE YEAR 29,211 22,040 22,719 24,823 15,718 22,208
Attributable to:
Equity holders of BPI 28,769 21,878 22,406 24,823 15,718 22,208 Non-controlling interests 442 162 313 - - -
29,211 22,040 22,719 24,823 15,718 22,208
(The notes on pages 1 to 109 are an integral part of these financial statements.)

BANK OF THE PHILIPPINE ISLANDS
STATEMENTS OF CHANGES IN EQUITY FOR EACH OF THE THREE YEARS IN THE PERIOD ENDED DECEMBER 31, 2019
(In Millions of Pesos)
Consolidated
Attributable to equity holders of BPI (Note 18)
Share capital
Share premium Reserves Surplus
Accumulated other
comprehensive income (loss) Total
Non-controlling interests
Total equity
Balance, January 1, 2017 39,308 29,591 2,711 98,602 (5,078) 165,134 2,550 167,684
Comprehensive income Net income for the year - - - 22,416 - 22,416 320 22,736 Other comprehensive loss for the
year - - - - (10) (10) (7) (17)
Total comprehensive income (loss) for the year - - - 22,416 (10) 22,406 313 22,719
Transactions with owners Exercise of stock option plans 28 180 31 - - 239 - 239 Cash dividends - - - (7,091) - (7,091) - (7,091)
Total transactions with owners 28 180 31 (7,091) - (6,852) - (6,852)
Transfer from surplus to reserves - - 90 (90) - - - - Transfer from reserves to surplus - - (2,578) 2,578 - - - -
- - (2,488) 2,488 - - - -
Balance, December 31, 2017 39,336 29,771 254 116,415 (5,088) 180,688 2,863 183,551 Impact of PFRS 9
adoption - - - (62) 4,111 4,049 (8) 4,041
Restated balance, January 1, 2018 39,336 29,771 254 116,353 (977) 184,737 2,855 187,592
Comprehensive income Net income for the year - - - 23,078 - 23,078 251 23,329 Other comprehensive loss for the
year - - - - (1,200) (1,200) (89) (1,289)
Total comprehensive income (loss) for the year - - - 23,078 (1,200) 21,878 162 22,040
Transactions with owners Proceeds from stock rights offering 5,587 44,120 - - - 49,707 - 49,707 Exercise of stock option plans 38 290 (25) - - 303 - 303 Cash dividends - - - (8,104) - (8,104) - (8,104)
Total transactions with owners 5,625 44,410 (25) (8,104) - 41,906 - 41,906
Transfer from surplus to reserves - - 3,867 (3,867) - - - - Other movements - - - (1) 1 - - -
- - 3,867 (3,868) 1 - - -
Balance, December 31, 2018 44,961 74,181 4,096 127,459 (2,176) 248,521 3,017 251,538
Comprehensive income Net income for the year - - - 28,803 - 28,803 280 29,083 Other comprehensive loss for the
year - - - - (34) (34) 162 128
Total comprehensive income (loss) for the year - - - 28,803 (34) 28,769 442 29,211
Transactions with owners Exercise of stock option pans 38 268 30 - - 336 - 336 Cash dividends - - - (8,113) - (8,113) - (8,113)
Total transactions with owners 38 268 30 (8,113) - (7,777) - (7,777)
Transfer from surplus to reserves - - 2,002 (2,002) - - - - Transfer from reserves to surplus - - (1,020) 1,020 - - - - Other movements - - - 293 (229) 64 (2) 62
- - 982 (689) (229) 64 (2) 62
Balance, December 31, 2019 44,999 74,449 5,108 147,460 (2,439) 269,577 3,457 273,034
(The notes on pages 1 to 109 are an integral part of these financial statements.)

BANK OF THE PHILIPPINE ISLANDS
STATEMENTS OF CHANGES IN EQUITY FOR EACH OF THE THREE YEARS IN THE PERIOD ENDED DECEMBER 31, 2019
(In Millions of Pesos)
Parent (Note 18)
Share capital
Share premium Reserves Surplus
Accumulated other
comprehensive income (loss) Total
Balance, January 1, 2017 39,308 29,591 2,695 56,095 (4,807) 122,882
Comprehensive income Net income for the year - - - 22,097 - 22,097 Other comprehensive income for the year - - - - 111 111
Total comprehensive income for the year - - - 22,097 111 22,208
Transactions with owners Exercise of stock option plans 28 180 25 - - 233 Cash dividends - - - (7,091) - (7,091)
Total transactions with owners 28 180 25 (7,091) - (6,858)
Transfer from reserves to surplus - - (2,578) 2,578 - -
Balance, December 31, 2017 39,336 29,771 142 73,679 (4,696) 138,232 Impact of PFRS 9 adoption - - - (178) 3,485 3,307
Restated balance, January 1, 2018 39,336 29,771 142 73,501 (1,211) 141,539
Comprehensive income Net income for the year - - - 15,428 - 15,428 Other comprehensive income for the year - - - - 290 290
Total comprehensive income for the year - - - 15,428 290 15,718
Transactions with owners Proceeds from stock rights offering 5,587 44,120 - - - 49,707 Exercise of stock option plans 38 290 (32) - - 296 Cash dividends - - - (8,104) - (8,104)
Total transactions with owners 5,625 44,410 (32) (8,104) - 41,899
Transfer from surplus to reserves - - 3,867 (3,867) - -
Balance, December 31, 2018 44,961 74,181 3,977 76,958 (921) 199,156
Comprehensive income Net income for the year - - - 26,218 - 26,218 Other comprehensive loss for the year - - - - (1,395) (1,395)
Total comprehensive income for the year - - - 26,218 (1,395) 24,823
Transactions with owners Exercise of stock option plans 38 268 43 - - 349 Cash dividends - - - (8,113) - (8,113)
Total transactions with owners 38 268 43 (8,113) - (7,764)
Transfer from surplus to reserves - - 1,892 (1,892) - - Transfer from reserves to surplus - - (1,020) 1,020 - - Other movements - - - 35 - 35
- - 872 (837) - 35
Balance, December 31, 2019 44,999 74,449 4,892 94,226 (2,316) 216,250
(The notes on pages 1 to 109 are an integral part of these financial statements.)

BANK OF THE PHILIPPINE ISLANDS
STATEMENTS OF CASH FLOWS FOR EACH OF THE THREE YEARS IN THE PERIOD ENDED DECEMBER 31, 2019
(In Millions of Pesos)
Consolidated Parent
Notes 2019 2018 2017 2019 2018 2017
CASH FLOWS FROM OPERATING ACTIVITIES
Profit before income tax 38,435 29,999 28,692 34,423 20,445 25,883 Adjustments for:
Impairment losses 5,9,10,14 5,822 4,923 3,795 4,666 4,271 3,519 Depreciation and amortization 11,14 7,132 4,797 4,255 4,767 2,916 2,783 Share in net income of associates 12 (372) (700) (772) - - - Dividend and other income 19 (77) (76) (68) (3,794) (904) (9,492) Share-based compensation 18 30 (25) 31 42 (32) 25 Interest income (101,583) (80,190) (68,053) (83,279) (61,391) (49,783) Interest received 100,293 77,715 66,816 83,294 59,960 48,753 Interest expense 35,638 24,347 17,810 27,507 18,233 12,298 Interest paid (35,300) (23,440) (17,495) (27,375) (17,494) (11,901) (Increase) decrease in:
Interbank loans receivable and securities purchased under agreements to resell 1,898 (821) 595 1,895 (966) (353)
Financial assets at fair value through profit or loss (8,472) (2,257) 9,272 (8,469) (236) 6,498
Loans and advances, net (125,028) (154,077) (164,957) (109,711) (140,860) (168,485) Assets held for sale 400 655 313 353 509 447 Assets attributable to insurance
operations 287 465 (944) - - - Other assets 5,611 (8,096) (3,940) 5,702 (3,761) (6,745)
Increase (decrease) in: Deposit liabilities 109,598 23,546 130,900 109,252 23,244 139,485 Due to Bangko Sentral ng Pilipinas and
other banks (1,041) 2,770 548 (1,041) 2,770 548 Manager’s checks and demand drafts
outstanding 1,368 (91) (557) 1,067 (408) (131) Accrued taxes, interest and other
expenses 303 1,033 (51) 411 562 (252) Liabilities attributable to insurance
operations 5 (457) 146 - - - Derivative financial instruments (38) 52 (311) (28) 45 (306) Deferred credits and other liabilities 7,335 2,493 7,550 6,094 2,506 6,037
Net cash from (used in) operations 42,244 (97,435) 13,575 45,776 (90,591) (1,172) Income taxes paid (10,363) (7,115) (6,505) (9,135) (5,560) (4,395)
Net cash from (used in) operating activities 31,881 (104,550) 7,070 36,641 (96,151) (5,567)
(forward)

BANK OF THE PHILIPPINE ISLANDS
STATEMENTS OF CASH FLOWS FOR EACH OF THE THREE YEARS IN THE PERIOD ENDED DECEMBER 31, 2019
(In Millions of Pesos)
Consolidated Parent
Notes 2019 2018 2017 2019 2018 2017
CASH FLOWS FROM INVESTING ACTIVITIES
(Increase) decrease in: Investment securities, net 8,9 (4,343) (25,828) (7,029) (3,574) (31,400) 727 Bank premises, furniture, fixtures and
equipment, net 11 (13,400) (5,048) (4,191) (10,285) (2,518) (2,018) Investment properties, net 14 (57) 1 - (55) 12 - Investment in subsidiaries and associates, net 12 933 305 745 (89) (899) (95) Assets attributable to insurance operations (1,368) 364 58 - - -
Dividends received 18 77 76 68 3,794 904 9,492
Net cash (used in) from investing activities (18,158) (30,130) (10,349) (10,209) (33,901) 8,106
CASH FLOWS FROM FINANCING ACTIVITIES
Cash dividends paid 17,18 (12,167) (7,598) (7,089) (12,165) (7,598) (7,089) Proceeds from share issuance 18 306 50,035 207 306 50,035 207 (Decrease) increase in bills payable and other
borrowed funds 16 (16,064) 83,384 21,544 (24,351) 80,158 18,466
Net cash (used in) from financing activities (27,925) 125,821 14,662 (36,210) 122,595 11,584
NET (DECREASE) INCREASE IN CASH AND CASH EQUIVALENTS (14,202) (8,859) 11,383 (9,778) (7,457) 14,123
CASH AND CASH EQUIVALENTS January 1 4,5 313,270 322,129 310,746 273,122 280,579 266,456
December 31 299,068 313,270 322,129 263,344 273,122 280,579
(The notes on pages 1 to 109 are an integral part of these financial statements.)

BANK OF THE PHILIPPINE ISLANDS NOTES TO FINANCIAL STATEMENTS AS AT DECEMBER 31, 2019 and 2018 AND FOR EACH OF THE THREE YEARS IN THE PERIOD ENDED DECEMBER 31, 2019 Note 1 - General Information Bank of the Philippine Islands (“BPI” or the “Parent Bank”) is a domestic commercial bank with an expanded banking license and was registered with the Securities and Exchange Commission (SEC) on January 4, 1943. The Parent Bank’s license was extended for another 50 years on January 4, 1993. In 2019, the Bank’s office address, which also serves as its principal place of business, was transferred to Ayala North Exchange, Ayala Avenue corner Salcedo Street, Legaspi Village, Makati City. Prior to 2019, BPI’s registered office address and principal place of business were both located at BPI Building, Ayala Avenue corner Paseo de Roxas, Makati City. BPI and its subsidiaries (collectively referred to as the “BPI Group”) offer a whole breadth of financial services that include corporate banking, consumer banking, investment banking, asset management, corporate finance, securities distribution, and insurance services. At December 31, 2019, the BPI Group has 21,429 employees (2018 - 18,911 employees) and operates 1,167 branches (2018 - 1,056 branches) and 2,822 ATMs (2018 - 3,034 ATMs) to support its delivery of services. The BPI Group also serves its customers through alternative electronic banking channels such as telephone, mobile phone and the internet. The Parent Bank is considered a public company under Rule 3.1 of Implementing Rules and Regulations of the Securities Regulation Code, which, among others, defines a public company as any corporation with a class of equity securities listed on an exchange, or with assets of at least P50 million and having 200 or more shareholders, each of which holds at least 100 shares of its equity securities. These financial statements have been approved and authorized for issuance by the Board of Directors (BOD) of the Parent Bank on February 19, 2020. There are no material events that occurred subsequent to February 19, 2020 until February 26, 2020.

(2)
The consolidated financial statements comprise the financial statements of the Parent Bank and the following subsidiaries:
Subsidiaries Country of
incorporation Principal activities
% of ownership
2019 2018
BPI Family Savings Bank, Inc. Philippines Banking 100 100
BPI Capital Corporation Philippines Investment house 100 100
BPI Direct BanKo, Inc., A Savings Bank Philippines Banking 100 100
BPI Asset Management and Trust Corporation Philippines Asset management 100 100
BPI International Finance Limited Hong Kong Financing 100 100
BPI Europe Plc. England and Wales Banking (deposit) 100 100
BPI Securities Corp. Philippines Securities dealer 100 100
BPI Payments Holdings Inc. Philippines Financing 100 100
Filinvest Algo Financial Corp. Philippines Financing 100 100
BPI Investment Management, Inc. Philippines Investment management 100 100
Santiago Land Development Corporation Philippines Land holding 100 100
BPI Operations Management Corp. Philippines Operations management 100 100
BPI Computer Systems Corp. Philippines Business systems service 100 100
BPI Forex Corp. Philippines Foreign exchange 100 100
BPI Express Remittance Corp. USA USA Remittance 100 100
BPI Remittance Centre (HK) Ltd. Hong Kong Remittance 100 100
Green Enterprises S. R. L. in Liquidation Italy Remittance 100 100
First Far - East Development Corporation Philippines Real estate 100 100
FEB Stock Brokers, Inc. Philippines Securities dealer 100 100
BPI Express Remittance Spain S.A Spain Remittance 100 100
FEB Speed International Philippines Remittance 100 100
Ayala Plans, Inc. Philippines Pre-need 98.93 98.67
FGU Insurance Corporation Philippines Non-life insurance 94.62 94.62
BPI Century Tokyo Lease and Finance Corporation Philippines Leasing 51 51
BPI Century Tokyo Rental Corporation Philippines Rental 51 51
CityTrust Securities Corporation Philippines Securities dealer 51 51
BPI/MS Insurance Corporation Philippines Non-life insurance 50.85 50.85
Note 2 - Assets and Liabilities Attributable to Insurance Operations Details of assets and liabilities attributable to insurance operations at December 31 are as follows:
2019 2018
(In Millions of Pesos) Assets Cash and cash equivalents (Note 4) 217 89 Insurance balances receivable, net 5,010 5,596 Investment securities
Financial assets at fair value through profit or loss 5,382 1,788 Financial assets at fair value through other comprehensive income (OCI) 4,344 6,522 Financial assets at amortized cost 153 202
Investment in associates 167 167 Accounts receivable and other assets, net 2,320 2,106 Land, building and equipment 197 112
17,790 16,582

(3)
2019 2018
(In Millions of Pesos) Liabilities Reserves and other balances 12,544 12,909 Accounts payable, accrued expenses and other payables 1,517 1,147
14,061 14,056
Details of income attributable to insurance operations before income tax and minority interest for the years ended December 31 are as follows:
2019 2018 2017
(In Millions of Pesos) Premiums earned and related income 3,841 3,750 3,624 Investment and other income 712 755 864
4,553 4,505 4,488
Benefits, claims and maturities 1,942 2,049 2,006 Decrease in actuarial reserve liabilities (412) (379) (524) Commissions 938 800 789 Management and general expenses 838 799 791 Other expenses 24 13 13
3,330 3,282 3,075
Income before income tax and minority interest 1,223 1,223 1,413
Note 3 - Business Segments Operating segments are reported in accordance with the internal reporting provided to the Chief Executive Officer (CEO), who is responsible for allocating resources to the reportable segments and assessing their performance. All operating segments used by the BPI Group individually meet the definition of a reportable segment under Philippine Financial Reporting Standards (PFRS) 8, Operating Segments. The BPI Group has determined the operating segments based on the nature of the services provided and the different clients/markets served representing a strategic business unit. The BPI Group’s main operating business segments follow:
• Consumer banking - this segment serves the individual and retail markets. Services cover deposit taking and servicing, consumer lending such as home mortgages, auto loans and credit card finance as well as the remittance business. The segment also includes the entire transaction processing and service delivery infrastructure consisting of network of branches and ATMs as well as phone and internet-based banking platforms.
• Corporate banking - this segment caters both high-end corporations and middle market clients. Services offered include deposit taking and servicing, loan facilities, leasing, trade and cash management for corporate and institutional customers.
• Investment banking - this segment includes the various business groups operating in the investment markets and dealing in activities other than lending and deposit taking. These services cover corporate finance, securities distribution, asset management, trust and fiduciary services as well as proprietary trading and investment activities.
The performance of the Parent Bank is assessed as a single unit using financial information presented in the separate or Parent only financial statements. Likewise, the CEO assesses the performance of the insurance business as a standalone business segment separate from the banking and allied financial undertakings. Information on the assets, liabilities and results of operations of the insurance business is fully disclosed in Note 2.

(4)
The BPI Group and the Parent Bank mainly derive revenue (more than 90%) within the Philippines, accordingly, no geographical segment is presented. The segment report forms part of management’s assessment of the performance of the segment, among other performance indicators. There were no changes in the reportable segments during the year. Transactions between the business segments are carried out at arm’s length. Funds are ordinarily allocated between segments, resulting in funding cost transfers disclosed in inter-segment net interest income. Interest charged for these funds is based on the BPI Group’s cost of capital. Internal charges and transfer pricing adjustments have been reflected in the performance of each business. Revenue-sharing agreements are used to allocate external customer revenues to a business segment on a reasonable basis. Inter-segment revenues however, are deemed insignificant for financial reporting purposes, thus, not reported in segment analysis below. The BPI Group’s management reporting is based on a measure of operating profit comprising net interest income, impairment charge, fees and commission income, other income and operating expenses. Segment assets and liabilities comprise majority of operating assets and liabilities, measured in a manner consistent with that shown in the statements of condition, but exclude items such as taxation. The segment assets, liabilities and results of operations of the reportable segments of the BPI Group as at and for the years ended December 31 are as follows:
2019
Consumer
banking Corporate banking
Investment banking
Total per management
reporting
(In Millions of Pesos) Net interest income 41,494 17,168 11,860 70,522 Provision for credit and impairment losses 3,489 2,328 5 5,822
Net interest income after provision for credit and impairment losses 38,005 14,840 11,855 64,700
Fees, commissions and other income, net 14,313 4,020 8,329 26,662
Total income 52,318 18,860 20,184 91,362
Compensation and fringe benefits 14,373 2,598 1,108 18,079 Occupancy and equipment-related expenses 10,147 2,126 314 12,587 Other operating expenses 15,057 3,389 1,721 20,167
Total other expenses 39,577 8,113 3,143 50,833
Operating profit 12,741 10,747 17,041 40,529
Share in net income of associates 563 Income tax expense 9,352
Total assets 539,093 1,208,553 427,571 2,175,217 Total liabilities 1,211,212 552,549 145,398 1,909,159

(5)
2018
Consumer
banking Corporate banking
Investment banking
Total per management
reporting
(In Millions of Pesos) Net interest income 33,973 11,019 16,148 61,140 Provision for credit and impairment losses 1,712 3,206 6 4,924
Net interest income after provision for credit and impairment losses 32,261 7,813 16,142 56,216
Fees, commissions and other income, net 12,292 3,260 5,280 20,832
Total income 44,553 11,073 21,422 77,048
Compensation and fringe benefits 12,554 2,132 1,002 15,688 Occupancy and equipment-related expenses 8,570 1,977 231 10,778 Other operating expenses 14,484 3,006 1,716 19,206
Total other expenses 35,608 7,115 2,949 45,672
Operating profit 8,945 3,958 18,473 31,376
Share in net income of associates 700 Income tax expense 6,670
Total assets 534,234 1,113,367 409,797 2,057,398 Total liabilities 1,124,800 552,969 137,872 1,815,641
2017
Consumer
banking Corporate banking
Investment banking
Total per management
reporting
(In Millions of Pesos) Net interest income 28,083 10,195 13,384 51,662 Provision for credit and impairment losses 2,085 1,710 5 3,800
Net interest income after provision for credit and impairment losses 25,998 8,485 13,379 47,862
Fees, commissions and other income, net 12,148 2,657 6,694 21,499
Total income 38,146 11,142 20,073 69,361
Compensation and fringe benefits 9,311 1,335 1,020 11,666 Occupancy and equipment-related expenses 4,242 1,210 125 5,577 Other operating expenses 13,512 2,706 1,652 17,870
Total other expenses 27,065 5,251 2,797 35,113
Operating profit 11,081 5,891 17,276 34,248
Share in net income of associates 772 Income tax expense 5,956
Total assets 476,749 1,007,058 389,085 1,872,892 Total liabilities 1,063,069 550,367 85,946 1,699,382

(6)
Reconciliation of segment results to consolidated results of operations:
2019
Total per management
reporting
Consolidation adjustments/
Others
Total per consolidated
financial statements
(In Millions of Pesos) Net interest income 70,522 (4,577) 65,945 Provision for credit and impairment losses 5,822 - 5,822
Net interest income after provision for credit and impairment losses 64,700 (4,577) 60,123
Fees, commissions and other income, net 26,662 1,727 28,389
Total income 91,362 (2,850) 88,512
Compensation and fringe benefits 18,079 (592) 17,487 Occupancy and equipment-related expenses 12,587 3,536 16,123 Other operating expenses 20,167 (3,700) 16,467
Total other expenses 50,833 (756) 50,077
Operating profit 40,529 (2,094) 38,435
Share in net income of associates (included in Other income) 563 563 Income tax expense 9,352 9,352
Total assets 2,175,217 29,813 2,205,030 Total liabilities 1,909,159 22,837 1,931,996
2018
Total per management
reporting
Consolidation adjustments/
Others
Total per consolidated
financial statements
(In Millions of Pesos) Net interest income 61,140 (5,297) 55,843 Impairment charge 4,924 (1) 4,923
Net interest income after impairment charge 56,216 (5,296) 50,920 Fees, commissions and other income, net 20,832 1,849 22,681
Total income 77,048 (3,447) 73,601
Compensation and fringe benefits 15,688 (373) 15,315 Occupancy and equipment - related expenses 10,778 2,368 13,146 Other operating expenses 19,206 (4,065) 15,141
Total operating expenses 45,672 (2,070) 43,602
Operating profit 31,376 (1,377) 29,999
Share in net income of associates (included in Other income) 700 - 700 Income tax expense 6,670 - 6,670
Total assets 2,057,398 27,830 2,085,228 Total liabilities 1,815,641 18,049 1,833,690

(7)
2017
Total per management
reporting
Consolidation adjustments/
Others
Total per consolidated
financial statements
(In Millions of Pesos) Net interest income 51,662 (3,623) 48,039 Provision for credit and impairment losses 3,800 (5) 3,795
Net interest income after provision for credit and impairment losses 47,862 (3,618) 44,244
Fees, commissions and other income, net 21,499 1,482 22,981
Total income 69,361 (2,136) 67,225
Compensation and fringe benefits 11,666 2,231 13,897 Occupancy and equipment-related expenses 5,577 5,767 11,344 Other operating expenses 17,870 (4,578) 13,292
Total other expenses 35,113 3,420 38,533
Operating profit 34,248 (5,556) 28,692
Share in net income of associates (included in Other income) 772 - 772 Income tax expense 5,956 - 5,956
Total assets 1,872,892 31,013 1,903,905 Total liabilities 1,699,382 20,972 1,720,354
“Consolidation adjustments/Others” pertain to amounts of insurance operations, support units and inter-segment elimination in accordance with the BPI Group’s internal reporting. Note 4 - Cash and Cash Equivalents The account at December 31 consists of:
Consolidated Parent
2019 2018 2019 2018
(In Millions of Pesos) Cash and other cash items 47,256 43,536 45,982 42,419 Due from Bangko Sentral ng Pilipinas (BSP) 207,845 225,907 181,815 202,487
Due from other banks 22,356 12,477 18,356 8,615 Interbank loans receivable and securities purchased under agreements
to resell (Note 5) 21,394 31,261 17,191 19,601 Cash and cash equivalents attributable to insurance operations (Note 2) 217 89 - -
299,068 313,270 263,344 273,122

(8)
Note 5 - Interbank Loans Receivable and Securities Purchased under Agreements to Resell (SPAR) The account at December 31 consists of transactions with:
Consolidated Parent
2019 2018 2019 2018
(In Millions of Pesos) BSP 20,306 24,791 16,947 14,000 Other banks 2,293 9,552 1,451 8,686
22,599 34,343 18,398 22,686 Accrued interest receivable 11 30 6 23
22,610 34,373 18,404 22,709 Allowance for impairment (40) (50) (40) (50)
22,570 34,323 18,364 22,659
As at December 31, 2019, Interbank loans receivable and SPAR maturing within 90 days from the date of acquisition amounting to P21,394 million (2018 - P31,261 million) for BPI Group and P17,191 million (2018 - P19,601 million) for the Parent Bank are classified as cash equivalents in the statements of cash flows (Note 4). Government bonds are pledged by the BSP as collateral under reverse repurchase agreements. The aggregate face value of securities pledged approximates the total balance of outstanding placements as at reporting date.
The range of average interest rates (%) of interbank loans receivable and SPAR for the years ended December 31 are as follows:
Consolidated Parent
2019 2018 2019 2018
Peso-denominated 3.49 - 5.74 2.65 - 5.40 4.33 - 10.48 3.12 - 7.37 US dollar-denominated 1.55 - 2.62 1.50 - 2.34 1.55 - 2.62 1.50 - 2.34
Note 6 - Financial Assets at Fair Value through Profit or Loss (FVTPL) The account at December 31 consists of:
Consolidated Parent
Note 2019 2018 2019 2018
(In Millions of Pesos) Debt securities
Government securities 17,017 8,953 14,482 5,515 Commercial papers of private companies 4,082 3,497 283 800
Listed equity securities 73 238 - - Derivative financial assets 7 2,933 4,033 2,923 4,031
24,105 16,721 17,688 10,346

(9)
Note 7 - Derivative Financial Instruments
Derivatives held by the BPI Group consist mainly of the following:
• Foreign exchange forwards represent commitments to purchase or sell one currency against another at an agreed forward rate on a specified date in the future. Settlement can be made via full delivery of forward proceeds or via payment of the difference (non-deliverable forward) between the contracted forward rate and the prevailing market rate at maturity.
• Foreign exchange swaps refer to spot purchase or sale of one currency against another with an offsetting agreement to sell or purchase the same currency at an agreed forward rate in the future.
• Interest rate swaps refer to agreement to exchange fixed rate versus floating interest payments (or vice versa) on a reference notional amount over an agreed period.
• Cross currency swaps refer to an exchange of notional amounts on two currencies at a given exchange rate where the parties on the transaction agree to pay a stated interest rate on the received notional amount and accept a stated interest rate on the delivered notional amount, payable and receivable or net settled (non-deliverable swaps) periodically over the term of the transaction.
The BPI Group’s credit risk represents the potential cost to replace the swap contracts if counterparties fail to fulfill their obligation. This risk is monitored on an ongoing basis with reference to the current fair value, a proportion of the notional amount of the contracts and the liquidity of the market. To control the level of credit risk taken, the BPI Group assesses counterparties using the same techniques as for its lending activities. The notional amounts and fair values of derivative financial instruments as at December 31 are set out below: Consolidated
Fair Values
Assets Liabilities
2019 2018 2019 2018
(In Millions of Pesos) Held for trading Foreign exchange derivatives Currency swaps 630 1,077 950 830 Currency forwards 436 250 450 219 Interest rate derivatives Interest rate swap 1,856 2,702 1,414 2,839 Interest rate futures - - - 3 Warrants 2 4 - - Equity option 9 - - - Held for hedging Cross currency swap - - 63 -
2,933 4,033 2,877 3,891

(10)
Parent
Fair Values
Assets Liabilities
2019 2018 2019 2018
Held for trading Foreign exchange derivatives Currency swaps 630 1,077 950 827 Currency forwards 436 250 450 219 Interest rate derivatives Interest rate swap 1,855 2,702 1,414 2,839 Interest rate futures - - - 3 Warrants 2 2 - - Held for hedging Cross currency swap - - 63 -
2,923 4,031 2,877 3,888
Cash flow hedge of foreign currency-denominated bond Consistent with its established risk management framework and asset liability management strategies, the Parent Bank decided to hedge the foreign currency exposure arising from the CHF-denominated debt (hedged item) issued in 2019 (Note 16). The Parent Bank aims to minimize or reduce the volatility in the overall portfolio brought about by the movement of CHF against the US Dollar through a hedging instrument - cross currency interest rate swap (CCIRS). Under the terms of the CCIRS, the Parent Bank agrees to receive CHF in exchange for US Dollar at settlement date which coincides with the maturity date of the hedged item. The volatility arising from movement of US Dollar against the functional currency (Philippine Peso), however, is managed in conjunction with the Parent Bank’s overall foreign currency risk management. The hedge ratio of 1:1 is observed so as not to create an imbalance that would create hedge ineffectiveness. The hedge has been assessed to be effective as of reporting date. Critical accounting estimate - Determination of fair value of derivatives and other financial instruments The fair values of financial instruments that are not quoted in active markets are determined by using generally accepted valuation techniques. Where valuation techniques (for example, discounted cash flow models) are used to determine fair values, they are validated and periodically reviewed by qualified personnel independent of the area that created them. Inputs used in these models are from observable data and quoted market prices in respect of similar financial instruments. All models are approved by the BOD before they are used, and models are calibrated to ensure that outputs reflect actual data and comparative market prices. Changes in assumptions about these factors could affect reported fair value of financial instruments. The BPI Group considers that it is impracticable, however, to disclose with sufficient reliability the possible effects of sensitivities surrounding the fair value of financial instruments that are not quoted in active markets.

(11)
Note 8 - Financial Assets at Fair Value through Other Comprehensive Income (FVOCI) Details of the account at December 31 are as follows:
Consolidated Parent
2019 2018 2019 2018
(In Millions of Pesos) Debt securities
Government securities 39,751 32,718 36,409 27,814 Commercial papers of private companies 10,624 2,695 9,914 2,090
50,375 35,413 46,323 29,904 Accrued interest receivable 704 118 686 89
51,079 35,531 47,009 29,993
Equity securities Listed 1,738 1,129 972 406 Unlisted 1,088 546 339 184
2,826 1,675 1,311 590
53,905 37,206 48,320 30,583
The range of average effective interest rates (%) of financial assets at FVOCI for the years ended December 31 follows:
Consolidated Parent
2019 2018 2019 2018
Peso-denominated 4.09 - 5.40 1.18 - 4.20 4.42 - 5.75 1.65 - 5.43 Foreign currency-denominated 2.14 - 2.94 2.09 - 2.85 2.14 - 2.94 2.33 - 2.85
Interest income from debt instruments recognized in the statement of income for the year ended December 31, 2019 amounts to P1,937 million (2018 - P278 million; 2017 - P200 million) and P1,871 million (2018 - P160 million; 2017 - P323 million) for the BPI Group and Parent Bank, respectively. Dividend income from equity instruments recognized in the statement of income for the year ended December 31, 2019 amounts to P76 million (2018 - P64 million; 2017 - P53 million) and P48 million (2018 - P41 million; 2017 - P26 million) for the BPI Group and Parent Bank, respectively. Note 9 - Investment Securities at Amortized cost, net Details of the account at December 31 are as follows:
Consolidated Parent
2019 2018 2019 2018
(In Millions of Pesos) Government securities 190,773 196,957 170,366 180,044 Commercial papers of private companies 80,644 86,826 78,285 83,964
271,417 283,783 248,651 264,008 Accrued interest receivable 3,688 3,790 3,355 3,491
275,105 287,573 252,006 267,499 Allowance for impairment - (2) - (2)
275,105 287,571 252,006 267,497

(12)
The range of average effective interest rates (%) for the years ended December 31 follows:
Consolidated Parent
2019 2018 2019 2018
Peso-denominated 3.62 - 4.03 3.53 - 3.90 3.64 - 4.05 3.55 - 3.93 Foreign currency-denominated 3.08 - 4.69 2.80 - 3.16 3.11 - 4.83 2.84 - 3.19
Interest income from these investment securities recognized in the statements of income for the year ended December 31, 2019 amounts to P10,318 million (2018 - P9,035 million; 2017 - P8,631 million) and P9,675 million (2018 - P8,514 million; 2017 - P7,912 million) for the BPI Group and the Parent Bank, respectively. Investment securities are expected to be realized as follows:
Consolidated Parent
2019 2018 2019 2018
(In Millions of Pesos) Current (within 12 months) 15,165 30,159 10,686 28,038 Non-current (over 12 months) 259,940 257,414 241,320 239,461
275,105 287,573 252,006 267,499
Critical accounting judgment- Classification of investment securities at amortized cost The BPI Group classifies its financial assets at initial recognition as to whether it will be subsequently measured at fair value through other comprehensive income, at amortized cost, or at fair value through profit or loss. The BPI Group determines the classification based on the contractual cash flow characteristics of the financial assets and on the business model it uses to manage these financial assets. The BPI Group determines whether the contractual cash flows associated with the financial asset are solely payments of principal and interest (the “SPPI”). If the instrument fails the SPPI test, it will be measured at fair value through profit or loss. Note 10 - Loans and Advances, net
Details of this account at December 31 are as follows:
Consolidated Parent
2019 2018 2019 2018
Corporate loans (In Millions of Pesos) Large corporate customers 1,147,643 1,043,855 1,121,050 1,019,626 Small and medium enterprise 73,357 87,998 54,553 62,058 Retail loans Credit cards 75,100 60,843 72,785 59,228 Real estate mortgages 137,380 126,088 11 12 Auto loans 53,789 51,845 - - Others 11,421 5,145 499 14
1,498,690 1,375,774 1,248,898 1,140,938 Accrued interest receivable 9,660 8,454 6,958 5,963 Unearned discount/income (7,040) (6,430) (5,475) (4,978)
1,501,310 1,377,798 1,250,381 1,141,923 Allowance for impairment (25,974) (22,902) (18,605) (15,967)
1,475,336 1,354,896 1,231,776 1,125,956
Loans and advances aggregating P19,628 million (2017 - P31,520 million) are used as security for bills payable of the Parent Bank (Note 16). Loans and advances include amounts due from related parties (Note 25).

(13)
Loans and advances are expected to be realized as follows:
Consolidated Parent
2019 2018 2019 2018
(In Millions of Pesos) Within 12 months (Current) 552,190 554,183 517,516 515,723 Over 12 months (Non-current) 949,120 823,615 732,865 626,200
1,501,310 1,377,798 1,250,381 1,141,923
Finance lease operations (the BPI Group as the lessor) The BPI Group, through BPI Century Tokyo Lease and Finance Corporation, is engaged in the leasing out of transportation equipment under various finance lease arrangements which typically run for a non-cancellable period of five years. The lease contracts generally include an option for the lessee to purchase the leased asset after the lease period at a price that approximates to about 5% to 40% of the fair value of the asset at the inception of the lease. Likewise, the lease contract requires the lessee to put up a guarantee deposit equivalent to the residual value of the leased asset at the end of lease term. In the event that the residual value of the leased asset exceeds the guaranteed deposit liability at the end of the lease term, the BPI Group receives additional payment from the lessee prior to the transfer of the leased asset. Details of finance lease receivables (included in “Corporate loans” category above) arising from lease contracts are as follows:
Consolidated
2019 2018
(In Millions of Pesos) Total future minimum lease collections 12,666 11,203 Unearned finance income (1,395) (1,321)
Present value of future minimum lease collections 11,271 9,882 Allowance for credit losses (628) (304)
10,643 9,578
Details of future gross minimum lease payments receivable follow:
Consolidated
2019 2018
(In Millions of Pesos) Not later than one year 1,532 4,299 Later than one year but not later than five years 10,373 6,270 More than five years 761 634
12,666 11,203 Unearned finance income (1,395) (1,321)
11,271 9,882
There are no contingent rents arising from lease contracts outstanding at December 31, 2019 and 2018.
The range of average interest rates (%) of loans and advances for the years ended December 31 follows:
Consolidated Parent
2019 2018 2019 2018
Commercial loans Peso-denominated loans 5.00 - 5.95 4.11 - 5.52 5.24 - 5.88 3.98 - 5.44 Foreign currency-denominated loans 4.18 - 4.91 3.61 - 4.86 4.18 - 4.91 3.61 - 4.86 Real estate mortgages 7.30 - 7.74 6.61 - 6.97 0.10 - 4.26 7.04 - 8.00 Auto loans 8.31 - 10.69 7.46 - 10.93 - -

(14)
Details of the loans and advances portfolio at December 31 as to collateral (amounts net of unearned discounts and exclusive of accrued interest receivable) are as follows:
Consolidated Parent
2019 2018 2019 2018
(In Millions of Pesos) Secured loans Real estate mortgage 278,099 220,587 138,607 97,170 Chattel mortgage 57,037 54,731 10 9 Others 148,385 172,503 146,038 168,260
483,521 447,821 284,655 265,439 Unsecured loans 1,008,129 921,523 958,768 870,521
1,491,650 1,369,344 1,243,423 1,135,960
Other collaterals include hold-out deposits, mortgage trust indentures, government and corporate securities and bonds, quedan/warehouse receipts, standby letters of credit, trust receipts, and deposit substitutes. Note 11 - Bank Premises, Furniture, Fixtures and Equipment, net The details of and movements in the account are summarized below: Consolidated
2019
Note Land
Buildings and leasehold
improvements
Furniture and
equipment Equipment for lease Total
(In Millions of Pesos) Cost
January 1, 2019, as previously reported 3,028 10,889 16,496 5,580 35,993 Impact of adoption of PFRS 16 20,29 - 9,051 - - 9,051
January 1, 2019, as restated 3,028 19,940 16,496 5,580 45,044 Additions - 2,607 1,326 1,570 5,503 Disposals (9) (224) (707) (1,019) (1,959) Transfers - (367) (92) - (459)
December 31, 2019 3,019 21,956 17,023 6,131 48,129
Accumulated depreciation January 1, 2019 - 5,511 13,040 1,190 19,741 Depreciation and amortization - 2,829 1,712 1,364 5,905 Disposals - (141) (383) (687) (1,211) Transfers - (20) (12) (22) (54)
December 31, 2019 - 8,179 14,357 1,845 24,381
Net book value, December 31, 2019 3,019 13,777 2,666 4,286 23,748

(15)
2018
Land
Buildings and leasehold
improvements
Furniture and
equipment Equipment for lease Total
(In Millions of Pesos) Cost
January 1, 2018 3,023 9,591 15,278 5,502 33,394 Additions - 1,443 2,052 1,875 5,370 Disposals (1) (145) (840) (1,765) (2,751) Transfers 6 - 6 (32) (20)
December 31, 2018 3,028 10,889 16,496 5,580 35,993
Accumulated depreciation January 1, 2018 - 4,849 11,749 1,739 18,337 Depreciation and amortization - 755 1,831 1,269 3,855 Disposals - (93) (541) (1,800) (2,434) Transfers - - 1 (18) (17)
December 31, 2018 - 5,511 13,040 1,190 19,741
Net book value, December 31, 2018 3,028 5,378 3,456 4,390 16,252
Parent
2019
Note Land
Buildings and leasehold
improvements
Furniture and
equipment Total
(In Millions of Pesos) (In Millions of Pesos) Cost
January 1, 2019, as previously reported 2,677 9,615 14,708 27,000 Impact of adoption of PFRS 16 20,29 - 7,900 - 7,900
January 1, 2019, as restated 2,677 17,515 14,708 34,900 Additions - 1,767 1,036 2,803 Disposals (9) (223) (567) (799) Transfers - (103) - (103)
December 31, 2019 2,668 18,956 15,177 36,801
Accumulated depreciation January 1, 2019 - 5,040 11,814 16,854 Depreciation and amortization - 2,352 1,484 3,836 Disposals - (141) (324) (465) Transfers - (19) - (19)
December 31, 2019 - 7,232 12,974 20,206
Net book value, December 31, 2019 2,668 11,724 2,203 16,595

(16)
2018
Land
Buildings and leasehold
improvements
Furniture and
equipment Total
(In Millions of Pesos) Cost January 1, 2018 2,661 8,582 13,850 25,093 Additions (1) 1,178 1,590 2,767 Disposals - (145) (732) (877) Transfers 17 - - 17
December 31, 2018 2,677 9,615 14,708 27,000
Accumulated depreciation January 1, 2018 - 4,492 10,696 15,188 Depreciation and amortization - 642 1,634 2,276 Disposals - (94) (516) (610)
December 31, 2018 - 5,040 11,814 16,854
Net book value, December 31, 2018 2,677 4,575 2,894 10,146
Depreciation and amortization charges are included in “Occupancy and equipment-related expenses” category in the statements of income. In 2019, the Parent Bank realized a gain of P855 million (2018 - P969 million) (Note 19) from disposal of certain properties. Critical accounting estimate - Useful lives of bank premises, furniture, fixtures and equipment The BPI Group determines the estimated useful lives of its bank premises, furniture, fixtures and equipment based on the period over which the assets are expected to be available for use. The BPI Group annually reviews the estimated useful lives of bank premises, furniture, fixtures and equipment based on factors that include asset utilization, internal technical evaluation, technological changes, environmental and anticipated use of assets tempered by related industry benchmark information. It is possible that future results of operations could be materially affected by changes in these estimates brought about by changes in the factors mentioned. The BPI Group considers that it is impracticable to disclose with sufficient reliability the possible effects of sensitivities surrounding the carrying values of bank premises, furniture, fixtures and equipment.

(17)
Note 12 - Investments in Subsidiaries and Associates, net This account at December 31 consists of investments in shares of stock as follows:
Consolidated Parent
2019 2018 2019 2018
(In Millions of Pesos) Carrying value (net of impairment)
Investments at equity method 6,746 5,659 - - Investments at cost method - - 10,031 9,942
6,746 5,659 10,031 9,942
Investments in associates accounted for using the equity method in the consolidated statements of condition are as follows:
Place of business/
country of incorporation
Percentage of ownership interest
Acquisition cost
Name of entity 2019 2018 2019 2018
(in %) (In Millions of
Pesos) BPI-Philamlife Assurance Corporation (BPLAC) Philippines 47.96 47.67 389 371 AF Payments, Inc. (AFPI) Philippines 20.00 20.00 820 750 National Reinsurance Corporation of the
Philippines* Philippines 13.69 13.69 204 204 Beacon Property Ventures, Inc. Philippines 20.00 20.00 72 72 CityTrust Realty Corporation Philippines 40.00 40.00 2 2 Global Payments Asia-Pacific Philippines,
Incorporated Philippines 49.00 49.00
1,342 1,342
2,829 2,741 *The Parent Bank has a significant influence due to its representation in the governing body of National Reinsurance Corporation of the Philippines
The movements in investments in associates accounted for using the equity method in the consolidated financial statements are summarized as follows:
2019 2018
(In Millions of Pesos) Acquisition cost
At January 1 2,741 2,681 Additions during the year 88 60
At December 31 2,829 2,741
Accumulated equity in net income At January 1 3,264 3,239 Share in net income for the year 372 700 Dividends received (629) (675)
At December 31 3,007 3,264
Accumulated share in other comprehensive income (loss) At January 1 (206) 466 Share in other comprehensive income (loss) for the year 1,256 (672)
At December 31 1,050 (206)
Allowance for impairment (140) (140)
6,746 5,659

(18)
No associate is deemed individually significant for financial reporting purposes. Accordingly, the relevant unaudited financial information of associates as at and for the years ended December 31 has been aggregated as follows:
2019 2018
(In Millions of Pesos) Total assets 132,126 122,616 Total liabilities 113,282 105,960 Total revenues 25,911 18,618 Total net income 2,007 1,425
The details of equity investments accounted for using the cost method in the separate financial statements of the Parent Bank follow:
Acquisition cost
Allowance for impairment Carrying value
2019 2018 2019 2018 2019 2018
(In Millions of Pesos) Subsidiaries
BPI Europe Plc. 1,910 1,910 - - 1,910 1,910 BPI Asset Management and Trust Corporation
(BPI AMTC) 1,502 1,502 - - 1,502 1,502 BPI Direct BanKo, Inc., A Savings Bank 1,009 1,009 - - 1,009 1,009 Ayala Plans, Inc. (API) 864 863 - - 864 863 BPI Capital Corporation 623 623 - - 623 623 BPI Payments Holdings Inc. 573 503 (299) (299) 274 204 BPI Century Tokyo Lease and Finance
Corporation 329 329 - - 329 329 FGU Insurance Corporation 303 303 - - 303 303 BPI Forex Corp. 195 195 - - 195 195 BPI Express Remittance Corp. USA 191 191 - - 191 191 BPI Family Savings Bank, Inc. 150 150 - - 150 150 BPI Remittance Centre (HK) Ltd. (BERC HK) 132 132 - - 132 132 First Far-East Development Corporation 91 91 - - 91 91 Green Enterprises S.R.L. in Liquidation 54 54 - - 54 54 FEB Stock Brokers, Inc. 25 25 - - 25 25 BPI Computer Systems Corp. 23 23 - - 23 23 BPI Express Remittance Spain S.A 26 26 - - 26 26 Others 321 321 - - 321 321
Associates 2,009 1,991 - - 2,009 1,991
10,330 10,241 (299) (299) 10,031 9,942
No non-controlling interest arising from investments in subsidiaries is deemed material to the BPI Group. In 2019, the Parent Bank made an additional capital infusion to BPHI amounting to P70 million (2018 - P60 million). Likewise, the Parent Bank in 2018, recognized impairment loss of P299 million on its investment in BPHI due financial losses incurred by BPHI’s associate, AFPI, as disclosed above. On November 21, 2018, BPI International Finance Limited (included in “Others” subsidiaries in the table above) distributed its shares in BERC HK valued at P132 million as a property dividend to the Parent Bank. BERC HK became an immediate subsidiary of the Parent Bank following the property dividend declaration. On October 17, 2018, the Parent Bank made additional investment to BPI AMTC via transfer of contractual customer relationships (included in “Intangible assets” in Note 14) valued at P902 million.

(19)
Note 13 - Deferred Income Taxes Details of deferred income tax assets and liabilities at December 31 are as follows:
Consolidated Parent
2019 2018 2019 2018
(In Millions of Pesos) Deferred income tax assets
Allowance for credit and impairment losses 8,345 7,833 5,644 5,329 Pension liability 1,129 661 897 454 Provisions 394 329 313 248 Others 354 225 263 195
Total deferred income tax assets 10,222 9,048 7,117 6,226
Deferred income tax liabilities Unrealized gain on property appraisal (483) (491) (483) (491) Others (33) (21) 19 (12)
Total deferred income tax liabilities (516) (512) (464) (503)
Deferred income tax assets, net 9,706 8,536 6,653 5,723
Movements in net deferred income tax assets are summarized as follows:
Consolidated Parent
2019 2018 2019 2018
(In Millions of Pesos) At January 1 8,536 8,091 5,723 5,180 Amounts recognized in statements of income 685 734 583 776 Amounts recognized in other comprehensive income 485 (289) 347 (233)
At December 31 9,706 8,536 6,653 5,723
Details of deferred income tax items recognized in the statements of income are as follows:
Consolidated Parent
2019 2018 2017 2019 2018 2017
(In Millions of Pesos) Allowance for impairment (946) (547) (443) (718) (593) (563) Provisions - (1) (27) - 6 (9) Pension 18 68 174 9 9 (65) NOLCO 83 129 (66) - - - Others 160 (383) (100) 126 (198) 175
(685) (734) (462) (583) (776) (462)
Critical accounting judgment - Realization of deferred income tax assets Management reviews at each reporting date the carrying amounts of deferred tax assets. The carrying amount of deferred tax assets is reduced to the extent that the related tax assets cannot be utilized due to insufficient taxable profit against which the deferred tax assets will be applied. Management believes that sufficient taxable profit will be generated to allow all or part of the deferred income tax assets to be utilized.

(20)
Note 14 - Other Assets, net The account at December 31 consists of the following:
Consolidated Parent
2019 2018 2019 2018
(In Millions of Pesos) Intangible assets 2,797 3,070 2,435 2,416 Accounts receivable 2,358 2,761 2,218 2,509 Residual value of equipment for lease 2,781 2,601 - - Sundry debits 1,663 3,392 1,518 3,292 Prepaid expenses 944 1,343 578 1,007 Accrued trust and other fees 747 540 338 131 Rental deposits 734 671 623 573 Creditable withholding tax 503 408 107 79 Investment properties 156 129 143 118 Miscellaneous assets 3,239 8,108 2,260 6,853
15,922 23,023 10,220 16,978
Allowance for impairment (515) (824) (310) (665)
15,407 22,199 9,910 16,313
Sundry debits are float items caused by timing differences in recording of transactions. These float items are normally cleared within seven days.
Miscellaneous assets include prepaid expenses, postage stamps, stationery and supplies.
The allowance for impairment as at December 31, 2019 and 2018 mainly pertains to accounts receivable. The reconciliation of the allowance for impairment at December 31 is summarized as follows:
Consolidated Parent
2019 2018 2019 2018
(In Millions of Pesos) At January 1 825 848 665 701 Provision for (reversal of) impairment losses 54 89 5 (69) Transfer/reallocation (38) (34) (36) 110 Write-off (326) (79) (324) (77)
At December 31 515 824 310 665

(21)
Other assets are expected to be realized as follows:
Consolidated Parent
2019 2018 2019 2018
(in millions of pesos) Current (within 12 months) 10,089 17,143 7,632 14,434 Non-current (over 12 months) 5,833 5,880 2,588 2,544
15,922 23,023 10,220 16,978
Note 15 - Deposit Liabilities The account at December 31 consists of:
Consolidated Parent
2019 2018 2019 2018
(In Millions of Pesos) Demand 272,020 256,279 262,149 245,620 Savings 899,181 883,650 795,936 778,246 Time 524,142 445,817 398,373 323,341
1,695,343 1,585,746 1,456,458 1,347,207
Deposit liabilities include amounts due to related parties (Note 25). Deposit liabilities are expected to be settled as follows:
Consolidated Parent
2019 2018 2019 2018
(in millions of pesos) Current (within 12 months) 796,447 602,031 711,910 534,119 Non-current (over 12 months) 898,896 983,715 744,548 813,088
1,695,343 1,585,746 1,456,458 1,347,207
In 2019, the Parent Bank issued the first tranche of long-term negotiable certificates of deposit (LTNCD) amounting to P3 billion out of the established P50-billion LTNCD program approved by the BSP. The LTNCDs pay interest on a quarterly basis at a rate 4% per annum and carry a tenor of 5.5 years maturing on April 25, 2025. The proceeds from the LTNCD issuance are included in “Time deposits” category Related interest expense on deposit liabilities is presented below:
Consolidated Parent
2019 2018 2017 2019 2018 2017
(In Millions of Pesos) Demand 628 687 616 574 630 557 Savings 6,738 7,384 6,723 5,541 6,061 5,489 Time 21,508 13,184 9,321 15,361 8,954 5,367
28,874 21,255 16,660 21,476 15,645 11,413
BSP reserve requirement The Parent Bank and its bank and non-bank subsidiaries with quasi-banking functions should comply with a minimum reserve requirement on deposit and deposit substitute liabilities in local currency. In 2018, the reserve ratio decreased to 18% from 20% following the BSP’s decision to reduce the requirements. In 2019, the BSP approved further reductions in reserves which brought the requirement down to 14% effective December 6, 2019 by virtue of BSP Circular 1063. Further, the BSP requires a 4% reserve requirement for LTNCDs.

(22)
Reserves must be set aside in deposits with the BSP. As at December 31, 2019, the reserves (included in Due from BSP) amounted to P178,591 million (2018 - P214,196 million) for the BPI Group and P169,303 million (2018 - P195,883 million) for the Parent Bank. The BPI Group is in full compliance with the reserve requirement as at December 31, 2019 and 2018. Note 16 - Bills Payable and Other Borrowed Funds The account at December 31 consists of:
Consolidated Parent
2019 2018 2019 2018
(In Millions of Pesos) Bills payable
Local banks 34,364 58,810 21,810 46,761 Foreign banks 31,417 51,813 29,255 47,841
Other borrowed funds 85,056 56,278 75,464 56,278
150,837 166,901 126,529 150,880
Bills payable Bills payable include mainly funds borrowed from various banking institutions which were lent out to customers of the BPI Group in accordance with the agreed financing programs. Loans and advances arising from these financing programs serve as collateral for this liability (Note 10). The average payment term of these bills payable is 0.90 years (2018 - 0.39 years). The range of average interest rates (%) of bills payable for the years ended December 31 follows:
Consolidated Parent
2019 2018 2019 2018
Private firms and local banks - Peso-denominated 2.20 - 6.67 2.75 - 7.35 2.25 - 6.25 2.75 - 5.06 Foreign banks - Foreign currency-denominated 0.63 - 4.20 1.32 - 4.20 1.45 - 3.66 1.32 - 3.26
Other borrowed funds This represents funds raised via debt issuance programs as follows: a) Peso Bond and Commercial Paper Program In 2018, the Parent Bank established a Peso Bond and Commercial Paper Program in the aggregate amount of up to P50,000 million, out of which a total of P25,000 million notes were issued with a coupon of 6.7970% per annum, payable quarterly to mature on March 6, 2020. Last 20 November 2019, BPI's Board of Directors approved the issuance of peso-denominated bonds and commercial papers of up to Php 100Bn, in one or more tranches, under an updated Bank Bond Issuance Program. Likewise, on October 31, 2019, the BOD of BPI Family Savings Bank, Inc. (BPI Family), a subsidiary, approved the establishment of a Peso Bond Program in the aggregate amount of P35,000 million. In line with the said program, on December 16, 2019, BPI Family issued P9,600 million with a coupon of 4.30% per annum, payable quarterly to mature on June 16, 2022.

(23)
b) Medium-Term Note (MTN) Program On June 21, 2018, the BOD of the Parent Bank approved the establishment of the MTN Program in the aggregate amount of up to US$2,000 million with drawdowns as follows:
Description of instrument Date of drawdown Interest
rate Maturity Amount
(In Millions of Pesos)
US$ 600 million, 5-year senior unsecured Bonds September 4, 2018 4.25% September 4, 2023 32,000 US$ 300 million, 5-year senior unsecured Green Bonds September 10, 2019 2.5% September 10, 2024 15,572 CHF 100 million, 2-year senior unsecured Green Bonds September 24, 2019 - September 24, 2021 5,250
The CH₣-denominated bonds are designated as hedged items in a cash flow hedge initiated by the Parent Bank in 2019. See Note 7 for the related disclosures. Interest expense for the years ended December 31 is summarized as follows:
Consolidated Parent
2019 2018 2017 2019 2018 2017
(In Millions of Pesos) Bills payable 3,549 2,517 1,150 2,834 2,013 885 Other borrowed funds 3,215 575 - 3,197 575 -
6,764 3,092 1,150 6,031 2,588 885
The movements in bills payable and other borrowed funds are summarized as follows:
Consolidated Parent
2019 2018 2019 2018
(In Millions of Pesos) At January 1 166,901 83,517 150,880 70,722 Additions 374,332 706,779 291,585 651,065 Maturities (387,343) (623,196) (313,027) (570,594) Amortization of discount (17) 121 (19) 120 Exchange differences (3,036) (320) (2,890) (433)
At December 31 150,837 166,901 126,529 150,880
Bills payable and other borrowed funds are expected to be settled as follows:
Consolidated Parent
2019 2018 2019 2018
(In Millions of Pesos) Current (within 12 months) 48,291 99,381 35,948 84,086 Non-current (over 12 months) 102,546 67,520 90,581 66,794
150,837 166,901 126,529 150,880

(24)
Note 17 - Deferred Credits and Other Liabilities The account at December 31 consists of the following:
Consolidated Parent
Notes 2019 2018 2019 2018
(In Millions of Pesos) Bills purchased - contra 15,301 12,872 15,299 12,862 Lease liabilities 20,29 7,856 - 6,739 - Accounts payable 4,738 8,096 3,078 5,635 Outstanding acceptances 3,855 2,394 3,855 2,394 Deposits on lease contracts 2,639 2,438 - - Other deferred credits 1,576 810 323 67 Withholding tax payable 1,062 674 892 514 Due to the Treasurer of the Philippines 947 650 827 575 Vouchers payable 51 - 51 - Dividends payable - 4,053 - 4,052 Miscellaneous liabilities 9,743 11,133 7,875 9,694
47,768 43,120 38,939 35,793
Bills purchased - contra represents liabilities arising from the outright purchases of checks due for clearing as a means of immediate financing offered by the BPI Group to its clients. Miscellaneous liabilities include pension liability, insurance, allowance for credit losses for undrawn committed credit facilities and other employee-related payables. The account is expected to be settled as follows:
Consolidated Parent
2019 2018 2019 2018
(In Millions of Pesos) Current (within 12 months) 36,818 41,343 36,455 34,753 Non-current (over 12 months) 10,950 1,777 2,484 1,040
47,768 43,120 38,939 35,793
Note 18 - Capital Funds a) Share capital Details of authorized share capital of the Parent Bank follow:
2019 2018 2017 (In Millions of Pesos,
except par value per share) Authorized capital (at P10 par value per share) Common shares 49,000 49,000 49,000 Preferred A shares 600 600 600
49,600 49,600 49,600

(25)
Details of outstanding common shares are as follows:
2019 2018 2017
(In Number of Shares) Issued common shares At January 1 4,502,449,501 3,939,412,661 3,937,043,603 Issuance of shares during the year 4,622,143 563,036,840 2,369,058
At December 31 4,507,071,644 4,502,449,501 3,939,412,661
Subscribed common shares 7,163,739 6,341,738 5,785,721
The BPI common shares are listed and traded in the PSE since October 12, 1971. On February 10, 2014, additional 370,370,370 common shares were listed as a result of the stock rights offer. Likewise, on April 25, 2018, BPI completed its P50 billion stock rights offer, which paved the way for the issuance of 558,659,210 new common shares at P89.50 per share. The new shares were issued to shareholders as of record date April 6, 2018, at a ratio of 1:7.0594, or 1 new common share for every 7 shares held, or 14.2% of BPI’s outstanding common shares. These new shares were listed on the Philippine Stock Exchange (PSE) on May 4, 2018. As at December 31, 2019, 2018 and 2017, the Parent Bank has 12,396, 12,588, and 11,488 common shareholders, respectively. There are no preferred shares issued and outstanding at December 31, 2019, 2018 and 2017. b) Reserves The account consists of:
Consolidated Parent
2019 2018 2017 2019 2018 2017
(In Millions of Pesos) General loan loss provision 4,739 3,867 - 4,739 3,867 - Reserve for trust business 199 90 90 - - - Executive stock option plan amortization 136 105 130 119 76 108 Reserve for self-insurance 34 34 34 34 34 34
5,108 4,096 254 4,892 3,977 142
General loan loss provision (GLLP) In 2018, the BSP issued Circular 1011 which mandates among others, banks to set up GLLP equal to 1% of all outstanding “Stage 1” on-balance sheet loans, except for accounts considered as credit risk-free under existing regulations. Under the said Circular, if the PFRS 9 “Stage 1” loan loss provision is lower than the required GLLP, the deficiency shall be recognized as an appropriation of retained earnings or surplus. Accordingly, the BPI Group appropriated P4,739 million at December 31, 2019 (2018 - P3,867 million) representing the excess of GLLP over PFRS 9 loan loss provision out of surplus earnings to meet the requirement of the BSP. Reserve for trust business In compliance with existing BSP regulations, 10% of BPI AMTC’s income from trust business is appropriated to surplus reserve. This yearly appropriation is required until the surplus reserve for trust business reaches 20% of the authorized capital of BPI AMTC. Reserve for self-insurance Reserve for self-insurance represents the amount set aside to cover losses due to fire, defalcation by and other unlawful acts of personnel and third parties.

(26)
Share-based compensation plan The BOD of the Parent Bank approved to grant the Executive Stock Option Plan (ESOP) and Executive Stock Purchase Plan (ESPP) to qualified beneficiaries/participants up to the following number of shares for future distribution:
Date Approved ESOP shares Approved ESPP shares
December 11, 2019 4,035,000 9,100,000 December 11, 2018 4,168,000 11,500,000 December 13, 2017 3,560,000 7,500,000 December 14, 2016 3,560,000 4,500,000 December 18, 2015 3,575,000 8,000,000
The ESOP has a three-year vesting period from grant date while the ESPP has a five-year payment period. The exercise price for ESOP is equal to the volume weighted average of BPI share price for the 30-trading days immediately prior to the grant date. The weighted average fair value of options granted determined using the Black-Scholes valuation model was P6.50 and P17.41 for the years ended December 31, 2018 and 2017 respectively. Movements in the number of share options under the ESOP are summarized as follows:
2019 2018 2017
At January 1 11,773,334 11,338,333 9,100,000 Granted 4,000,000 3,480,000 3,485,000 Exercised (1,116,666) (2,786,665) (746,667) Cancelled (691,667) (258,334) (500,000)
At December 31 13,965,001 11,773,334 11,338,333
Exercisable 6,733,334 5,120,000 6,745,000
The impact of ESOP is not considered material to the financial statements; thus, the disclosures were limited only to the information mentioned above. The subscription price for ESPP is equivalent to 15% below the volume weighted average of BPI share price for the 30-trading days immediately prior to the grant date. The subscription dates for ESPP were on February 4, 2020, January 7, 2019 and February 15, 2017.

(27)
c) Accumulated other comprehensive loss Details of and movements in the account are as follows:
Consolidated Parent
2019 2018 2017 2019 2018 2017
(In Millions of Pesos) Fair value reserve on available-for-sale
securities
At January 1 - (3,125) (3,838) - (3,275) (3,724) Effect of PFRS 9 adoption - 3,125 - - 3,275 - Unrealized fair value loss before tax - - 264 - - 23 Amount recycled to profit or loss - - 447 - - 424 Deferred income tax effect - - 2 - - 2
At December 31 - - (3,125) - - (3,275)
Fair value reserve on financial assets at FVOCI At January 1 (33) - - 69 - - Unrealized fair value loss before tax (424) (364) - (94) (12) - Amount recycled to profit or loss 387 (390) - (32) (128) - Effect of PFRS 9 adoption - 757 - - 210 - Deferred income tax effect (14) (36) - (4) (1) -
At December 31 (84) (33) - (61) 69 -
Share in other comprehensive income (loss) of insurance subsidiaries At January 1 (36) 45 (158) - - - Share in other comprehensive income
(loss) for the year, before tax 389 (316) 175 - - - Effect of PFRS 9 adoption (229) 229 - - - - Deferred income tax effect (6) 6 28 - - -
At December 31 118 (36) 45 - - -
Share in other comprehensive income (loss) of associates At January 1 (206) 479 1,259 - - - Share in other comprehensive income
(loss) for the year 1,254 (685) (780) - - -
At December 31 1,048 (206) 479 - - -
Translation adjustment on foreign operations At January 1 (704) (678) (804) - - - Translation differences and others (202) (26) 126 (124) - -
At December 31 (906) (704) (678) (124) - -
Remeasurements of defined benefit obligation, net At January 1 (1,197) (1,809) (1,537) (990) (1,421) (1,083) Actuarial (losses) gains for the year (1,851) 877 (387) (1,508) 616 (358) Deferred income tax effect 433 (265) 115 367 (185) 20
At December 31 (2,615) (1,197) (1,809) (2,131) (990) (1,421)
(2,439) (2,176) (5,088) (2,316) (921) (4,696)

(28)
d) Dividend declarations Cash dividends declared by the BOD of the Parent Bank are as follows:
Date declared
Amount of dividends
Per share Total
(In Millions of Pesos)
For the year ended December 31, 2019 May 15, 2019 0.90 4,056 November 20, 2019 0.90 4,057
8,113
For the year ended December 31, 2018 June 20, 2018 0.90 4,052 December 19, 2018 0.90 4,052
8,104
For the year ended December 31, 2017 June 15, 2017 0.90 3,545 December 15, 2017 0.90 3,546
7,091
e) Earnings per share (EPS) EPS is calculated as follows:
Consolidated Parent
2019 2018 2017 2019 2018 2017
(In Millions of Pesos, except earnings per share amounts) a) Net income attributable to equity holders
of the Parent Bank 28,803 23,078 22,416 26,218 15,428 22,097 b) Weighted average number of common
shares outstanding during the year 4,507 4,316 3,939 4,507 4,316 3,939 c) Basic EPS (a/b) 6.39 5.35 5.69 5.82 3.57 5.61
The basic and diluted EPS are the same for the years presented as the impact of stock options outstanding is not significant to the calculation of weighted average number of common shares. Note 19 - Other Operating Income Details of other operating income are as follows:
Consolidated Parent
2019 2018 2017 2019 2018 2017
(In Millions of Pesos) Credit card income 3,525 3,197 2,953 3,423 3,126 2,894 Trust and asset management fees 2,868 2,818 3,516 4 - 190 Rental income 2,047 1,898 1,672 267 254 219 Gain on sale of assets 1,165 1,243 1,204 898 658 302 Dividend income 77 76 68 3,794 904 9,492 Miscellaneous income 2,310 1,155 1,380 2,101 977 1,074
11,992 10,387 10,793 10,487 5,919 14,171
Dividend income recognized by the Parent Bank substantially pertains to dividend distributions of subsidiaries. Miscellaneous income includes recoveries on charged-off assets and fees arising from service arrangements with customers and related parties.

(29)
Note 20 - Leases The BPI Group (as lessee) has various lease agreements which mainly pertain to branch premises and equipment that are renewable under certain terms and conditions. Rental contracts are typically made for fixed periods of 4 to 6 years. The balances arising from these leases are presented below: a) Right-of-use assets and lease liabilities (PFRS 16) On January 1, 2019, the BPI Group adopted PFRS 16, Leases which requires recognition of both right-of-use assets and lease liability arising from long-term leases. The impact of initial adoption of PFRS 16 are summarized in Note 29. Details of right-of-use assets and lease liabilities at December 31, 2019 are as follows:
Note Consolidated Parent
(In Millions of Pesos) Right-of-use assets 11
Buildings and leasehold improvements 7,787 6,733
Lease liabilities (included in “Deferred credits and other liabilities”) 17 Current 1,485 1,251 Non-current 6,371 5,488
7,856 6,739
Additions to the right-of-use assets (Note 11) in 2019 aggregated P669 million and P442 million for BPI Group and BPI Parent, respectively. Total cash outflow for leases in 2019 amounted to P1,869 million and P1,466 million for BPI Group and BPI Parent, respectively. Amounts recognized in the statement of income relating to leases:
Note Consolidated Parent
(In Millions of Pesos) Depreciation expense 11 Buildings and leasehold improvements 1,933 1,609
Interest expense (included in “Interest expense”) 398 315 Expense relating to short-term leases (included in “Occupancy and
equipment-related expenses”)
228 203 Expense relating to leases of low-value assets that are not shown
above as short-term leases (included in “Occupancy and equipment-related expenses”)
55 43
2,614 2,170
Critical accounting judgment - Determining the lease term In determining the lease term, the BPI Group considers all facts and circumstances that create an economic incentive to exercise an extension option, or not exercise a termination option. Extension options (or periods after termination options) are only included in the lease term if the lease is reasonably certain to be extended (or not terminated). Critical accounting judgment - Determining the incremental borrowing rate To determine the incremental borrowing rate, each entity within the BPI Group:
• where possible, uses recent third-party financing received as a starting point, adjusted to reflect changes in financing conditions since third party financing was received; or
• uses a build-up approach that starts with a risk-free interest rate adjusted for credit risk for leases held which do not have recent third-party financing, and
• makes adjustments specific to the lease, (e.g. term, currency and security).

(30)
The BPI Group’s weighted average incremental borrowing rates applied to the lease liabilities ranged from 6.6% to 6.9%. The rates were determined in reference to the borrowing rates arising from the most recent debt issuances of the Parent Bank. b) Operating leases (PAS 17) Prior to January 1, 2019, the BPI Group’s lease contracts were accounted for as operating leases following the provisions of PAS 17. The rentals pertaining to branch premises (included in Occupancy and equipment-related expenses) under these lease contracts were as follows:
Consolidated Parent
(In Millions of Pesos) 2018 1,809 1,503 2017 1,495 1,211
The future minimum lease payments under non-cancellable operating leases of the BPI Group as of December 31, 2018 are as follows:
Amount
No later than 1 year 107 Later than 1 year but no later than 5 years 214 More than 5 years 57
378
Note 21 - Operating Expenses Details of compensation and fringe benefits expenses are as follows:
Consolidated Parent
2019 2018 2017 2019 2018 2017
(In Millions of Pesos) Salaries and wages 14,613 12,624 11,642 11,231 9,702 8,891 Retirement expense (Note 23) 631 755 720 536 608 574 Other employee benefit expenses 2,243 1,936 1,535 1,712 1,524 1,226
17,487 15,315 13,897 13,479 11,834 10,691
Details of other operating expenses are as follows:
Consolidated Parent
2019 2018 2017 2019 2018 2017
(In Millions of Pesos) Insurance 4,162 4,105 3,940 2,861 2,789 2,448 Advertising 1,492 1,310 1,215 1,316 1,123 1,002 Travel and communication 1,203 1,002 902 974 825 748 Management and other
professional fees 506 606 501 388 626 419 Supervision and examination fees 653 587 542 506 441 401 Litigation expenses 558 526 598 308 255 348 Taxes and licenses 492 791 714 657 539 491 Office supplies 480 592 328 389 490 267 Amortization expense 311 293 296 30 11 289 Shared expenses - - - 39 26 16 Others 6,610 5,329 4,256 4,590 4,132 3,197
16,467 15,141 13,292 12,058 11,257 9,626

(31)
Other expenses mainly include fees and incentives paid to agents, outsourcing fees, freight charges and other business expense such as those incurred in staff meetings, donations, periodicals and magazines. Note 22 - Income Taxes The reconciliation between the income tax expense at the statutory tax rate and the effective income tax for the years ended December 31 is shown below:
Consolidated
2019 2018 2017
Amount Rate (%) Amount
Rate (%) Amount
Rate (%)
(In Millions of Pesos) Statutory income tax 11,531 30.00 9,000 30.00 8,608 30.00 Effect of items not subject to statutory tax rate: Income subjected to lower tax rates (1,553) (4.04) (517) (1.72) (696) (2.42)
Tax-exempt income (2,926) (7.61) (1,582) (5.27) (4,350) (15.16) Others, net 2,300 5.98 (231) (0.77) 2,394 8.34
Effective income tax 9,352 24.33 6,670 22.24 5,956 20.76
Parent
2019 2018 2017
Amount Rate (%) Amount
Rate (%) Amount
Rate (%)
(In Millions of Pesos)
Statutory income tax 10,327 30.00 6,134 30.00 7,765 30.00 Effect of items not subject to statutory tax rate: Income subjected to lower tax rates (1,445) (4.20) (519) (2.54) (606) (2.34)
Tax-exempt income (1,637) (4.76) (495) (2.42) (2,907) (11.23)
Others, net 960 2.79 (103) (0.50) (466) (1.80)
Effective income tax 8,205 23.83 5,017 24.54 3,786 14.63
Note 23 - Retirement Plans The BPI Group maintains both defined benefit and defined contribution retirement plans. Assets of both retirement plans are held in trust and governed by local regulations and practices in the Philippines. The key terms of these pension plans are discussed below. a) Defined benefit retirement plan BPI Group (excluding insurance operations) BPI has a unified plan which covers all subsidiaries except insurance entities. Under this plan, the normal retirement age is 60 years. Normal retirement benefit consists of a lump sum benefit equivalent to 200% of the basic monthly salary of the employee at the time of his retirement for each year of service, if he has rendered at least 10 years of service, or to 150% of his basic monthly salary, if he has rendered less than 10 years of service. For voluntary retirement, the benefit is equivalent to 112.50% of the employee’s basic monthly salary for a minimum of 10 years of service with the rate factor progressing to a maximum of 200% of basic monthly salary for service years of 25 or more. Death or disability benefit, on the other hand, shall be determined on the same basis as in voluntary retirement. The net defined benefit cost and contributions to be paid by the entities within the BPI Group are determined by an independent actuary.

(32)
Non-life insurance subsidiary BPI/MS has a separate trusteed defined benefit plan. Under the plan, the normal retirement age is 60 years. Normal retirement benefit consists of a lump sum benefit equivalent to 175% of the basic monthly salary of the employee at the time of his retirement for each year of service, if he has rendered as least 10 years of service, or to 150% of his basic monthly salary, if he has rendered less than 10 years of service. Death or disability benefit for all employees of the non-life insurance subsidiary shall be determined on the same basis as in normal or voluntary retirement as the case may be. Following are the amounts recognized based on recent actuarial valuations: (a) Pension liability as at December 31 recognized in the statements of condition
Consolidated Parent
2019 2018 2019 2018
(In Millions of Pesos) Present value of defined benefit obligation 14,892 10,892 12,545 9,171 Fair value of plan assets (12,172) (9,851) (10,130) (8,195)
Pension liability recognized in the statements of condition 2,720 1,041 2,415 976
Effect of asset ceiling 46 - - -
2,766 1,041 2,415 976
Pension liability is shown as part of “Miscellaneous liabilities” within Deferred credits and other liabilities (Note 17). The movements in plan assets are summarized as follows:
Consolidated Parent
2019 2018 2019 2018
(In Millions of Pesos) At January 1 9,851 10,710 8,195 9,003 Contributions 861 781 715 627 Interest income 648 616 535 513 Benefit payments (1,187) (1,206) (985) (1,072) Remeasurement - return on plan assets 1,999 (1,050) 1,665 (876) Transfer to defined contribution plan - - 5 -
At December 31 12,172 9,851 10,130 8,195
The carrying values of the plan assets represent their fair value as at December 31, 2019 and 2018. The plan assets are comprised of the following:
Consolidated Parent
2019 2018 2019 2018
(In Millions of Pesos) Debt securities 3,773 3,054 3,140 2,540 Equity securities 5,721 4,630 4,761 3,852 Others 2,678 2,167 2,229 1,803
12,172 9,851 10,130 8,195
The plan assets of the unified retirement plan include investment in BPI’s common shares with aggregate fair value of P421 million at December 31, 2019 (2018 - P451 million). An officer of the Parent Bank exercises the voting rights over the plan’s investment in BPI’s common shares.

(33)
The movements in the present value of defined benefit obligation are summarized as follows:
Consolidated Parent
2019 2018 2019 2018
(In Millions of Pesos) At January 1 10,892 12,718 9,171 10,508 Interest cost 944 712 795 582 Current service cost 545 659 456 539 Remeasurement - change in assumptions
and experience adjustment 3,698 (1,991) 3,096 (1,386) Benefit payments (1,187) (1,206) (985) (1,072) Transfers to defined contribution plan - - 12 -
At December 31 14,892 10,892 12,545 9,171
The BPI Group has no other transactions with the plan other than the regular funding contributions. (b) Expense recognized in the statements of income
Consolidated Parent
2019 2018 2017 2019 2018 2017
(In Millions of Pesos) Current service cost 545 659 619 456 539 507 Net interest cost 86 96 82 80 69 56 Settlement loss - - 9 - - 9 Past service cost - - (5) - - (5)
631 755 705 536 608 567
The principal assumptions used for the actuarial valuations of the unified plan are as follows:
Consolidated Parent
2019 2018 2019 2018
Discount rate 5.57% 8.66% 5.57% 8.66% Future salary increases 5.00% 5.00% 5.00% 5.00%
Assumptions regarding future mortality and disability experience are based on published statistics generally used for local actuarial valuation purposes.
The defined benefit plan typically exposes the BPI Group to a number of risks such as investment risk, interest rate risk and salary risk. The most significant of which relate to investment and interest rate risk. The present value of the defined benefit obligation is determined by discounting the estimated future cash outflows using interest rates of government bonds that are denominated in the currency in which the benefits will be paid, and that have terms to maturity approximating the terms of the related pension liability. A decrease in government bond yields will increase the defined benefit obligation although this will also be partially offset by an increase in the value of the plan’s fixed income holdings. Hence, the present value of defined benefit obligation is directly affected by the discount rate to be applied by the BPI Group. However, the BPI Group believes that due to the long-term nature of the pension liability and the strength of the BPI Group itself, the mix of debt and equity securities holdings of the plan is an appropriate element of the BPI Group’s long-term strategy to manage the plan efficiently. The BPI Group ensures that the investment positions are managed within an asset-liability matching framework that has been developed to achieve long-term investments that are in line with the obligations under the plan. The BPI Group’s main objective is to match assets to the defined benefit obligation by investing primarily in long-term debt securities with maturities that match the benefit payments as they fall due. The asset-liability matching is being monitored on a regular basis and potential change in investment mix is being discussed with the trustor, as necessary to better ensure the appropriate asset-liability matching.

(34)
The BPI Group contributes to the plan depending on the suggested funding contribution as calculated by an independent actuary engaged by management. The expected contributions for the year ending December 31, 2019 for the BPI Group and the Parent Bank amount to P1,001 million and P836 million, (2018 - P659 million and P539 million, respectively) respectively. The weighted average duration of the defined benefit obligation under the BPI unified retirement plan as at December 31, 2019 is 9.65 years (2018 - 8 years). The projected maturity analysis of retirement benefit payments as at December 31 are as follows:
Consolidated Parent
2019 2018 2019 2018
(In Millions of Pesos) Up to one year 1,135 1,310 873 1,076 More than 1 year to 5 years 3,967 3,632 3,470 3,036 More than 5 years to 10 years 8,200 7,437 6,923 6,388 More than 10 years to 15 years 11,617 11,116 9,765 9,310 More than 15 years to 20 years 6,825 8,014 5,853 6,869 Over 20 years 25,238 27,103 19,527 21,193
The sensitivity of the defined benefit obligation as at December 31 to changes in the weighted principal assumptions follows: Consolidated 2019
Impact on defined benefit obligation
Change in assumption
Increase in assumption Decrease in assumption
Discount rate 0.5% Decrease by 4.60% Increase by 5.00% Salary growth rate 1.0% Increase by 10.40% Decrease by 9.10%
2018
Impact on defined benefit obligation
Change in assumption
Increase in assumption Decrease in assumption
Discount rate 0.5% Decrease by 3.34% Increase by 3.57% Salary growth rate 1.0% Increase by 7.59% Decrease by 6.73%
Parent 2019
Impact on defined benefit obligation
Change in assumption
Increase in assumption Decrease in assumption
Discount rate 0.5% Decrease by 4.60% Increase by 5.00% Salary growth rate 1.0% Increase by 10.30% Decrease by 9.00%
2018
Impact on defined benefit obligation
Change in assumption
Increase in assumption Decrease in assumption
Discount rate 0.5% Decrease by 3.90% Increase by 4.17% Salary growth rate 1.0% Increase by 8.86% Decrease by 7.86%

(35)
The above sensitivity analyses are based on a change in an assumption while holding all other assumptions constant. In practice, this is unlikely to occur, and changes in some of the assumptions may be correlated. When calculating the sensitivity of the defined benefit obligation to significant actuarial assumptions, the same method (present value of the defined benefit obligation calculated with the projected unit credit method at the end of the reporting period) has been applied as when calculating the retirement liability recognized within the statements of condition. b) Defined contribution retirement plan All non-unionized employees hired on or after the January 1, 2016 are automatically under the new defined contribution plan. Employees hired prior to the effective date shall have the option to elect to become members of the new defined contribution plan. Under the normal or late retirement, employees are entitled to a benefit equal to the total of the following amounts:
• The higher between (a) cumulative fund balance equivalent to 8% of the basic monthly salary and (b) the minimum legal retirement benefit under the Labor Code
• Employee contributions fund The defined contribution retirement plan has a defined benefit minimum guarantee equivalent to a certain percentage of the monthly salary payable to an employee at normal retirement age with the required credited years of service based on the provisions of Republic Act (“RA”) No. 7641. Accordingly, the liability for the defined benefit minimum guarantee is actuarially calculated similar to the defined benefit plan. The funding status of the defined contribution plan is shown below:
Consolidated Parent
2019 2018 2019 2018
(In Millions of Pesos) Fair value of plan assets 1,748 1,254 1,325 930 Present value of defined benefit obligation (811) (298) (604) (219)
937 956 721 711 Effect of asset ceiling 945 956 721 711
(8) - - -
The movements in the present value of the defined benefit obligation follow:
Consolidated Parent
2019 2018 2019 2018
(In Millions of Pesos) At January 1 298 239 219 172 Interest cost 27 15 20 10 Current service cost 59 48 40 31 Benefit payments (56) (20) (41) (18) Remeasurement - change in assumptions and
experience adjustment 483 16 366 24
At December 31 811 298 604 219

(36)
The movements in the fair value of plan assets follow:
Consolidated Parent
2019 2018 2019 2018
(In Millions of Pesos) At January 1 1,254 916 930 707 Contribution paid by employer 237 183 163 139 Interest income 114 62 88 48 Benefit payments (56) (20) (41) (18) Transfer to the plan - - 2 54 Remeasurement - return on plan assets 199 113 183 -
At December 31 1,748 1,254 1,325 930
Total retirement expense for the year ended December 31, 2019 under the defined contribution plan for the BPI Group and Parent Bank is P142 million (2018 - P43 million) and P98 million (2018 - P27 million). The components of plan assets of the defined contributions as at December 31, 2019 are as follows:
Consolidated Parent
2019 2018 2019 2018
(In Millions of Pesos) Debt securities 663 966 506 716 Equity securities 962 213 730 214 Others 123 75 89 -
1,748 1,254 1,325 930
The weighted average duration of the defined contribution retirement plan for the BPI Group and Parent Bank is 20.83 years (2018 - 19 years). Critical accounting estimate – Calculation of defined benefit obligation The BPI Group estimates its pension benefit obligation and expense for defined benefit pension plans based on the selection of certain assumptions used by actuaries in calculating such amounts. Those assumptions include, among others, the discount rate and future salary increases. The BPI Group determines the appropriate discount rate at the end of each year. This is the interest rate that should be used to determine the present value of estimated future cash outflows expected to be required to settle the retirement obligations. The present value of the defined benefit obligations of the BPI Group at December 31, 2019 and 2018 are determined using the market yields on Philippine government bonds with terms consistent with the expected payments of employee benefits. Plan assets are invested in either equity securities, debt securities or other forms of investments. Equity markets may experience volatility, which could affect the value of pension plan assets. This volatility may make it difficult to estimate the long-term rate of return on plan assets. Actual results that differ from the BPI Group’s assumptions are reflected as remeasurements in other comprehensive income. The BPI Group’s assumptions are based on actual historical experience and external data regarding compensation and discount rate trends. Note 24 - Asset Management Business At December 31, 2019, the net asset value of trust and fund assets managed by the BPI Group through BPI AMTC amounts to P731 billion (2018 - P591 billion). As required by the General Banking Act, BPI AMTC has deposited government securities with the BSP valued at P377 million (2018 - P349 million).

(37)
Note 25 - Related Party Transactions In the normal course of business, the Parent Bank transacts with related parties consisting of its subsidiaries and associates. Likewise, the BPI Group has transactions with Ayala Corporation (AC) and subsidiaries (Ayala Group), on an arm's length basis. AC is a significant stockholder of BPI as at reporting date. The Parent Bank has a Board-level Related Party Transaction Committee that vets and endorses all significant related party transactions, including those involving directors, officers, stockholders and their related interests (DOSRI), for which the latter shall require final Board approval. The Committee consists of three directors, majority of whom are independent directors including the Chairman, and two non-voting members from management, namely, the Chief Audit Executive and the Chief Compliance Officer. Transactions with related parties have terms and conditions that are generally comparable to those offered to non-related parties or to similar transactions in the market.

(38)
A summary of significant related party transactions and outstanding balances as at and for the years ended December 31 is shown below (transactions with subsidiaries have been eliminated in the consolidated financial statements): Consolidated
2019
Transactions for the year
Outstanding balances
Terms and conditions
(In Millions of Pesos) Loans and advances from:
Subsidiaries 5 58 These are loans and advances granted to related parties that are generally secured with interest rates ranging from 4.18% to 10.69% (including those pertaining to foreign currency-denominated loans) and with maturity periods ranging from 5 days to 15 years. Additional information on DOSRI loans are discussed below.
Associates (38) 350
Ayala Group 27,306 59,885
Other related parties 275 736
27,548 61,029
Deposits from: Subsidiaries 1,024 9,746 These are demand, savings and time
deposits bearing the following average interest rates: Demand - 0.22% to 0.27% Savings - 0.59% to 0.62% Time - 3.61% to 5.15%
Associates 1,486 1,903 Ayala Group (3,517) 13,287 Key management personnel 694 1,238
(313) 26,174
2018
Transactions for the year
Outstanding balances
Terms and conditions
(In Millions of Pesos) Loans and advances from:
Subsidiaries (81) 53 These are loans and advances granted to related parties that are generally secured with interest rates ranging from 3.87% to 8.25% (including those pertaining to foreign currency-denominated loans) and with maturity periods ranging from 5 days to 15 years. Additional information on DOSRI loans are discussed below.
Associates 190 387
Ayala Group 5,026 32,579
Other related parties 159 461
5,294 33,480
Deposits from: Subsidiaries 373 8,722 These are demand, savings and time
deposits bearing the following average interest rates: Demand - 0.22% to 0.31% Savings - 0.62% to 0.68% Time - 2.61% to 4.37%
Associates 38 417 Ayala Group 12,263 16,804 Key management personnel 162 543
12,836 26,486

(39)
2017
Transactions for the year
Outstanding balances
Terms and conditions
(In Millions of Pesos) Loans and advances from:
Subsidiaries 59 134 These are loans and advances granted to related parties that are generally secured with interest rates ranging from 1.37% to 7.64% (including those pertaining to foreign currency-denominated loans) and with maturity periods ranging from 4 days to 14 years. Additional information on DOSRI loans are discussed below.
Associates 152 197
Ayala Group (609) 27,553
Key management personnel - -
Other related parties (592) 302
(990) 28,186
Deposits from: Subsidiaries 1,111 8,349 These are demand, savings and time
deposits bearing the following average interest rates: Demand - 0.23% to 0.25% Savings - 0.70% to 0.79% Time - 2.15% to 2.22%
Associates (469) 379 Ayala Group (7,665) 4,541 Key management personnel (959) 381
(7,982) 13,650
Parent
2019
Transactions for the year
Outstanding balances
Terms and conditions
(In Millions of Pesos) Loans and advances from:
Subsidiaries 5 58 These are loans and advances granted to related parties that are generally secured with interest rates ranging from 0.10% to 5.88% (including those pertaining to foreign currency-denominated loans) and with maturity periods ranging from 5 days to 15 years. Additional information on DOSRI loans are discussed below.
Associates (38) 350
Ayala Group 27,306 59,885
Other related parties 275 736
27,548 61,029
Deposits from: Subsidiaries 1,083 9,715 These are demand, savings and time
deposits bearing the following average interest rates: Demand - 0.21% to 0.26% Savings - 0.55% to 0.58% Time - 3.27% to 5.41%
Associates 1,473 1,887 Ayala Group (2,053) 12,921 Key management personnel 642 1,105
1,145 25,628

(40)
2018
Transactions for the year
Outstanding balances
Terms and conditions
(In Millions of Pesos) Loans and advances from:
Subsidiaries (81) 53 These are loans and advances granted to related parties that are generally secured with interest rates ranging from 3.87% to 8.25% (including those pertaining to foreign currency-denominated loans) and with maturity periods ranging from 5 days to 15 years. Additional information on DOSRI loans are discussed below.
Associates 190 387
Ayala Group 5,026 32,579
Key management personnel - -
Other related parties 159 461
5,294 33,480
Deposits from: Subsidiaries 388 8,631 These are demand, savings and time
deposits bearing the following average interest rates: Demand - 0.21% to 0.30% Savings - 0.58% to 0.64% Time - 2.33 to 4.67%
Associates 55 414 Ayala Group 10,446 14,974 Key management personnel 103 463
10,992 24,482
2017
Transactions for the year
Outstanding balances
Terms and conditions
(In Millions of Pesos) Loans and advances from:
Subsidiaries 59 134 These are loans and advances granted to related parties that are generally secured with interest rates ranging from 1.37% to 7.64% (including those pertaining to foreign currency-denominated loans) and with maturity periods ranging from 4 days to 14 years. Additional information on DOSRI loans are discussed below.
Associates 152 197
Ayala Group (609) 27,553
Key management personnel - -
Other related parties (592) 302
(990) 28,186
Deposits from: Subsidiaries 1,098 8,243 These are demand, savings and time
deposits bearing the following average interest rates: Demand - 0.21% to 0.24% Savings - 0.66% to 0.75% Time - 1.68% to 1.80%
Associates (482) 359 Ayala Group (7,452) 4,528 Key management personnel (772) 360
(7,608) 13,490

(41)
The aggregate amounts included in the determination of income before income tax (prior to elimination) that resulted from transactions with each class of related parties are as follows: Consolidated
2019 2018 2017
(In Millions of Pesos) Interest income
Subsidiaries 99 84 39 Associates 21 14 - Ayala Group 2,867 1,346 966 Other related parties 44 20 15
3,031 1,464 1,020
Other income Subsidiaries 2,260 1,801 1,485 Associates 1,511 1,222 977 Ayala Group 580 203 247
4,351 3,226 2,709
Interest expense Subsidiaries 99 84 38 Associates 3 2 1 Ayala Group 128 119 21 Key management personnel 9 3 1
239 208 61
Other expenses Subsidiaries 2,148 1,698 1,371 Associates 22 51 34 Ayala Group 435 501 319
2,605 2,250 1,724
Retirement benefits Key management personnel 51 47 44
Salaries, allowances and other short-term benefits Key management personnel 871 800 744 Directors’ remuneration 121 93 87

(42)
Parent
2019 2018 2017
(In Millions of Pesos) Interest income
Subsidiaries - 1 3 Associates 21 14 - Ayala Group 2,867 1,346 966 Other related parties 44 20 15
2,932 1,381 984
Other income Subsidiaries 2,157 1,620 1,433 Associates 1,272 1,035 977 Ayala Group 372 137 155
3,801 2,792 2,565
Interest expense Subsidiaries 99 84 34 Associates 3 2 1 Ayala Group 123 98 20 Key management personnel 5 3 1
230 187 56
Other expenses Subsidiaries 28 145 27 Ayala Group 435 501 319
463 646 346
Retirement benefits Key management personnel 44 40 37
Salaries, allowances and other short-term benefits Key management personnel 751 697 629 Directors’ remuneration 92 77 73
Other income mainly consists of rental income and revenue from service arrangements with related parties. Other expenses mainly consist of rental expenses and management fees. Details of DOSRI loans are as follows:
Consolidated Parent
2019 2018 2019 2018
(In Millions of Pesos) Outstanding DOSRI loans 10,026 8,248 10,024 8,248
As at December 31, 2019, allowance for credit losses amounting to P10 million (2018 - P40 million) have been recognized against receivables from related parties. Note 26 - Financial Risk Management The BOD carries out its risk management function through the Risk Management Committee (RMC). The RMC is tasked with nurturing a culture of risk management across the enterprise. The RMC sets the risk appetite; proposes and approves risk management policies, frameworks, and guidelines; and regularly reviews risk management structures, metrics, limits, and issues across the BPI Group, in order to meet and comply with regulatory and international standards on risk measurement and management.

(43)
At the management level, the Risk Management Office (RMO) is headed by the Chief Risk Officer (CRO). The CRO is ultimately responsible in leading the formulation of risk management policies and methodologies in alignment with the overall business strategy of BPI, ensuring that risks are prudently and rationally undertaken and within its risk appetite, as well as commensurate and disciplined to maximize returns on shareholders' capital. Risk management is carried out by a dedicated team of skilled risk managers and senior officers who have extensive prior operational experience. BPI’s risk managers regularly monitor key risk indicators and report exposures against carefully established financial and business risk metrics and limits approved by the RMC. Finally, independent reviews are regularly conducted by the Internal Audit group and regulatory examiners to ensure that risk controls and mitigants are in place and functioning effectively as intended. The possibility of incurring losses is, however, compensated by the possibility of earning more than expected income. Risk-taking is, therefore, not entirely negative to be avoided. Risk-taking actions present opportunities if risks are fully identified and accounted, deliberately taken, and are kept within prudent and rationalized limits. The most important financial risks that the BPI Group manages are credit risk, liquidity risk and market risk. 26.1 Credit risk The BPI Group takes on exposure to credit risk, which is the risk that may arise if a borrower or counterparty fails to meet its obligations in accordance with agreed terms. Credit risk is the single largest risk for the BPI Group’s business; management therefore carefully manages its exposure to credit risk as governed by relevant regulatory requirements and international benchmarks. Credit risk may also arise due to substantial exposures to a particular counterparty which the BPI Group manages by adopting proper risk controls and diversification strategies to prevent undue risk concentrations from excessive exposures to particular counterparties, industries, countries or regions. The most evident source of credit risk is loans and advances; however, other sources of credit risk exist throughout the activities of the BPI Group, including in credit-related activities recorded in the banking, investment securities in the trading books and off-balance sheet transactions. 26.1.1 Credit risk management The Credit Policy and Risk Management (CPRM) division is responsible for the overall management of the Bank’s credit risk. CPRM supports the senior management in coordination with various business lending and operations units in identifying, measuring and managing credit risk. The BPI Group employs a range of policies and practices to mitigate credit risk. The BPI Group monitors its portfolio based on different segmentation to reflect the acceptable level of diversification and concentration. Concentration risk in credit portfolios is inherent in banking and cannot be totally eliminated. However, said risk may be reduced by adopting proper risk control and diversification strategies to prevent undue risk concentrations from excessive exposures to particular counterparties, industries, countries or regions. The BPI Group structures the levels of credit risk it undertakes by placing limits on the amount of risk accepted in relation to one borrower, or group of borrowers, and to geographical and industry segments. Such risks are monitored on a regular basis and subjected to annual or more frequent review, when deemed necessary. Limits on large exposures and credit concentration are approved by the BOD through the RMC. The exposure to any one borrower is further restricted by sub-limits covering on- and off-balance sheet exposures. Actual exposures against limits are monitored regularly. Methodologies for measuring credit risk vary depending on several factors, including type of asset, risk measurement parameters and risk management and collection processes. Credit risk measurement is based on the probability of default of an obligor or counterparty, the loss severity given a default event and the exposure at default. A rigorous control framework is applied in the determination of expected credit loss (ECL) models. The BPI Group has policies and procedures that govern the calculation of ECL. All ECL models are regularly reviewed by the Risk Management Office to ensure that necessary controls are in place and the models are applied accordingly.

(44)
The review and validation of ECL models are performed by groups that are independent of the team that prepares the calculations, e.g., Risk Models Validation and Internal Auditors. Expert judgments on measurement methodologies and assumptions are reviewed by a group of internal experts from various functions. Credit loss estimates are based on estimates of the probability of default (PD) and loss severity given a default. The probability of default is the likelihood that a borrower will default on its obligation; the loss given default (LGD) is the estimated loss on the loan that would be realized upon the default and takes into consideration collateral and structural support for each credit facility. The estimation process includes assigning risk ratings to each borrower and credit facility to differentiate risk within the portfolio. These risk ratings are reviewed regularly by Credit Risk Management and revised as needed to reflect the borrower’s current financial position, risk profile and related collateral. The calculations and assumptions are based on both internal and external historical experience and management judgment and are reviewed regularly. Settlement risk arises in any situation where a payment in cash, securities, foreign exchange currencies, or equities is made in the expectation of a corresponding receipt in cash, securities, foreign exchange currencies, or equities. Daily settlement limits are established for each counterparty to cover the aggregate of all settlement risk arising from the BPI Group’s market transactions on any single day. For certain securities, the introduction of the delivery versus payment facility in the local market has brought down settlement risk significantly. The BPI Group employs specific control and risk mitigation measures, some of which are outlined below: (a) Collateral or guarantees
One of the most traditional and common practice in mitigating credit risk is requiring security particularly for loans and advances. The BPI Group implements guidelines on the acceptability of specific classes of collateral for credit risk mitigation. The BPI Group assesses the valuation of the collateral obtained as part of the loan origination process. This assessment is reviewed periodically. The common collateral types for loans and advances are:
• Mortgages over physical properties (e.g., real estate and personal);
• Mortgages over financial assets (e.g., guarantees); and
• Margin agreement for derivatives, for which the BPI Group has also entered into master netting agreements In order to minimize credit loss, the BPI Group seeks additional collateral from the counterparty when impairment indicators are observed for the relevant individual loans and advances. The BPI Group’s policies regarding obtaining collateral have not significantly changed during the reporting period and there has been no significant change in the overall quality of the collaterals held by the BPI Group since the prior period. (b) Market Limits
The BPI Group maintains market limits on net open derivative positions (i.e., the difference between purchase and sale contracts). Credit risk is limited to the net current fair value of instruments, which in relation to derivatives is only a portion of the contract, or notional values used to express the volume of instruments outstanding. This credit risk exposure is managed as part of the overall lending limits with customers, together with potential exposures from market movements. Collateral or other security is not usually obtained for credit risk exposures on these instruments (except where the BPI Group requires margin deposits from counterparties).

(45)
(c) Master netting arrangements The BPI Group further restricts its exposure to credit losses by entering into master netting arrangements with certain counterparties with which it undertakes a significant volume of transactions. Master netting arrangements do not generally result in an offset of balance sheet assets and liabilities, as transactions are usually settled on a gross basis. However, the credit risk associated with favorable contracts (asset position) is reduced by a master netting arrangement to the extent that if a default occurs, all amounts with the counterparty are terminated and settled on a net basis. The BPI Group’s overall exposure to credit risk on derivative instruments subject to master netting arrangements can change substantially within a short period, as it is affected by each transaction subject to the arrangement.
(d) Credit-related commitments Documentary and commercial letters of credit - which are written undertakings by the BPI Group on behalf of a customer authorizing a third party to draw drafts on the BPI Group up to a stipulated amount under specific terms and conditions - are collateralized by the underlying shipments of goods and therefore carry less risk than a direct loan. 26.1.2 Credit risk rating The BPI Group uses internal credit risk gradings that reflect its assessment of the probability of default of individual counterparties. The BPI Group uses its internal credit risk rating system, credit models or external ratings from reputable credit rating agencies. Specific data about the borrower and loan are collected at the time of application (such as disposable income, and level of collateral for retail exposures; and turnover and industry type for wholesale exposures) and are fed into the internal credit scoring models. In addition, the internal models allow expert judgment from the Credit Risk Rating Committee and consideration of other data inputs not captured into the model in the determination of the final internal credit score for each loan. The BPI Group has adopted a credit classification system that aims to identify deteriorating exposures on a timely basis. Exposures are classified into each of the following categories:
• Standard monitoring - This category includes accounts which do not have a greater-than-normal risk and do not possess the characteristics of special monitoring and defaulted loans. The counterparty has the ability to satisfy the obligation in full and therefore minimal loss, if any, is anticipated.
• Special monitoring - This category includes accounts which need closer and frequent monitoring to prevent any further credit deterioration. The counterparty is assessed to be vulnerable to highly vulnerable and its capacity to meet its financial obligations is dependent upon favorable business, financial, and economic conditions.
• Default - This category includes accounts which exhibit probable to severe weaknesses wherein probability of non-repayment of loan obligation is ranging from high to extremely high.
i. Corporate (including cross-border loans) and SMEs loans
The BPI Group’s internal credit risk rating system comprises a 22-scale rating with eighteen (18) ‘pass’ rating levels for large corporate accounts; 14-scale rating system with ten (10) ‘pass’ rating grades for SME; and 26-scale rating system with thirteen (13) pass ratings for cross-border accounts mapped based on reputable external rating agency. The BPI Group uses the following set of classifications:

(46)
Classifications Large corporate Cross-border SME
Standard monitoring
AAA to B- or unrated and based on prescribed days past due (dpd) threshold
Investment grade (IG) or Non-IG with no SICR; or based on prescribed dpd threshold
AAA to B- or unrated and based on prescribed dpd threshold
Special monitoring CCC to C or based on prescribed dpd threshold
Non-IG with SICR but assessed to be non-impaired; based on prescribed dpd threshold
CCC to C or based on prescribed dpd threshold
Default Adversely classified accounts (ACA) or based on prescribed dpd threshold or Item in litigation (IL)
Default, with objective evidence of impairment; or based on prescribed dpd threshold
ACA or based on prescribed dpd threshold or IL
ii. Retail loans
The BPI Group uses automated scoring models to assess the level of risk for retail accounts. Behavioral indicators are considered in conjunction with other forward-looking information (e.g., industry forecast) to assess the level of risk of a loan. After the date of initial recognition, the payment behavior of the borrower is monitored on a periodic basis to develop a behavioral score which is mapped to a probability of default (PD).
Classifications Credit cards Personal, auto and housing SEME*
Standard monitoring Current to 29 dpd Current to 30 dpd Current to 7 dpd
Special monitoring 30 to 89 dpd 31 to 90 dpd Not applicable
Default 90 dpd and up or IL >90, IL, Loss 8 dpd and up
*Self-employed micro-entrepreneurs
iii. Treasury and other investment debt securities Investments in high grade securities and bills are viewed as a way to gain better credit quality mix and at the same time, maintain a readily available source to meet funding requirements. The level of credit risk for treasury and other investment debt securities and their associated PD are determined using reputable external ratings and/or available and reliable qualitative and quantitative information. In the absence of credit ratings, a comparable issuer or guarantor rating is used. Should there be a change in the credit rating of the chosen comparable, evaluation is made to ascertain whether the rating change is applicable to the security being assessed for impairment.
Classifications Credit risk grade following S&P or its equivalent
Standard monitoring IG (AAA to BBB-)
Special monitoring Non-IG (BB+ to C)
Default Default (D)
iv. Other financial assets at amortized cost
For other financial assets (non-credit receivables), the BPI Group applies the PFRS 9 simplified approach to measuring expected credit losses which uses a lifetime expected credit loss methodology. These financial assets are grouped based on shared risk characteristics and aging profile. For some of these, impairment is assessed individually at a counterparty level.

(47)
26.1.3 Maximum exposure to credit risk 26.1.3.1 Loans and advances Credit risk exposures relating to on-balance sheet loans and advances are as follows:
Consolidated Parent
2019 2018 2019 2018
(In Millions of Pesos) Corporate and SME loans, net 1,204,950 1,122,610 1,167,582 1,074,782 Retail loans, net 270,386 232,286 64,194 51,174
1,475,336 1,354,896 1,231,776 1,125,956
The carrying amount of loans and advances above also represents the BPI Group’s maximum exposure to credit risk. Credit quality of loans and advances, net The following tables contain an analysis of the credit risk exposure of each financial instrument for which an ECL allowance is recognized. Consolidated Corporate and SME loans
2019 2018
Stage 1 12-month
ECL
Stage 2 Lifetime
ECL
Stage 3 Lifetime
ECL Total
Stage 1 12-month
ECL
Stage 2 Lifetime
ECL
Stage 3 Lifetime
ECL Total
(In Millions of Pesos) Credit grade Standard monitoring 1,091,916 28,701 - 1,120,617 1,034,673 23,243 - 1,057,916 Special monitoring 45,963 41,416 - 87,379 48,392 16,077 - 64,469 Default - - 13,091 13,091 - - 13,564 13,564
Gross carrying amount 1,137,879 70,117 13,091 1,221,087 1,083,065 39,320 13,564 1,135,949 Loss allowance (6,870) (3,110) (6,157) (16,137) (5,768) (1,843) (5,728) (13,339)
Carrying amount 1,131,009 67,007 6,934 1,204,950 1,077,297 37,477 7,836 1,122,610
Retail loans
2019 2018
Stage 1 12-month
ECL
Stage 2 Lifetime
ECL
Stage 3 Lifetime
ECL Total
Stage 1 12-month
ECL
Stage 2 Lifetime
ECL
Stage 3 Lifetime
ECL Total
(In Millions of Pesos) Credit grade Standard monitoring 251,736 10,638 - 262,374 217,645 8,531 - 226,176 Special monitoring 322 6,764 - 7,086 1,002 5,727 - 6,729 Default - - 10,763 10,763 - - 8,944 8,944
Gross carrying amount 252,058 17,402 10,763 280,223 218,647 14,258 8,944 241,849 Loss allowance (3,236) (1,780) (4,821) (9,837) (4,114) (1,405) (4,044) (9,563)
Carrying amount 248,822 15,622 5,942 270,386 214,533 12,853 4,900 232,286

(48)
Parent Corporate and SME loans
2019 2018
Stage 1 12-month
ECL
Stage 2 Lifetime
ECL
Stage 3 Lifetime
ECL Total
Stage 1 12-month
ECL
Stage 2 Lifetime
ECL
Stage 3 Lifetime
ECL Total
(In Millions of Pesos) Credit grade Standard monitoring 1,064,720 25,034 - 1,089,754 995,540 22,727 - 1,018,267 Special monitoring 42,297 39,478 - 81,775 43,147 14,737 - 57,884 Default - - 9,824 9,824 - - 9,772 9,772
Gross carrying amount 1,107,017 64,512 9,824 1,181,353 1,038,687 37,464 9,772 1,085,923 Loss allowance (5,972) (2,990) (4,809) (13,771) (5,108) (1,734) (4,299) (11,141)
Carrying amount 1,101,045 61,522 5,015 1,167,582 1,033,579 35,730 5,473 1,074,782
Retail loans
2019 2018
Stage 1 12-month
ECL
Stage 2 Lifetime
ECL
Stage 3 Lifetime
ECL Total
Stage 1 12-month
ECL
Stage 2 Lifetime
ECL
Stage 3 Lifetime
ECL Total
(In Millions of Pesos) Credit grade Standard monitoring 59,732 4,277 - 64,009 51,886 338 - 52,224 Special monitoring 183 1,323 - 1,506 203 935 - 1,138 Default - - 3,513 3,513 - - 2,638 2,638
Gross carrying amount 59,915 5,600 3,513 69,028 52,089 1,273 2,638 56,000 Loss allowance (808) (941) (3,085) (4,834) (1,839) (482) (2,505) (4,826)
Carrying amount 59,107 4,659 428 64,194 50,250 791 133 51,174

(49)
The tables below present the gross amount of “Stage 2” loans and advances by age category. Consolidated
2019 2018
Corporate and SME
loans Retail loans Total
Corporate and SME
loans Retail loans Total
(In Millions of Pesos) (In Millions of Pesos) Current 68,517 5,999 74,516 35,632 5,697 41,329 Past due up to 30 days 505 4,749 5,254 175 2,834 3,009 Past due 31 - 90 days 1,095 6,654 7,749 3,513 5,727 9,240 Past due 91 - 180 days - - - - - - Over 180 days - - - - - -
70,117 17,402 87,519 39,320 14,258 53,578
Parent
2019 2018
Corporate and SME
loans Retail loans Total
Corporate and SME
loans Retail loans Total
(In Millions of Pesos) (In Millions of Pesos) Current 63,673 3,494 67,167 34,696 241 34,937 Past due up to 30 days 400 783 1,183 47 97 144 Past due 31 - 90 days 439 1,323 1,762 2,721 935 3,656 Past due 91 - 180 days - - - - - - Over 180 days - - - - - -
64,512 5,600 70,112 37,464 1,273 38,737
26.1.3.2 Treasury and other investment securities Credit risk exposures arising from treasury and other investment securities are as follows:
Consolidated Parent
2019 2018 2019 2018
(In Millions of Pesos) Due from BSP 207,845 225,907 181,815 202,487 Due from other banks 22,356 12,477 18,356 8,615 Interbank loans receivable and SPAR 22,570 34,323 18,364 22,659 Financial assets at FVTPL 24,032 16,483 17,688 10,346 Financial assets at FVOCI 51,079 35,531 47,009 29,993 Investment securities at amortized cost 275,105 287,571 252,006 267,497
602,987 612,292 535,238 541,597

(50)
Credit quality of treasury and other investment securities Consolidated
2019 2018
Stage 1 12-month
ECL
Stage 2 Lifetime
ECL
Stage 3 Lifetime
ECL Total
Stage 1 12-month
ECL
Stage 2 Lifetime
ECL
Stage 3 Lifetime
ECL Total
(In Millions of Pesos) Credit grade Standard monitoring Due from BSP 207,845 - - 207,845 225,907 - - 225,907 Due from other banks 22,356 - - 22,356 12,480 - - 12,480 Interbank loans receivable and SPAR 22,561 - - 22,561 34,306 - - 34,306
Financial assets at FVTPL 24,032 - - 24,032 16,483 - - 16,483
Financial assets at FVOCI 51,079 - - 51,079 35,531 - - 35,531
Investment securities at amortized cost 275,105 - - 275,105 287,573 - - 287,573
Default Interbank loans receivable and SPAR - - 49 49 - - 67 67
Gross carrying amount 602,978 - 49 603,027 612,280 - 67 612,347 Loss allowance - - (40) (40) (5) - (50) (55)
Carrying amount 602,978 - 9 602,987 612,275 - 17 612,292
Parent
2019 2018
Stage 1 12-month
ECL
Stage 2 Lifetime
ECL
Stage 3 Lifetime
ECL Total
Stage 1 12-month
ECL
Stage 2 Lifetime
ECL
Stage 3 Lifetime
ECL Total
(In Millions of Pesos) Credit grade Standard monitoring Due from BSP 181,815 - - 181,815 202,487 - - 202,487 Due from other banks 18,356 - - 18,356 8,615 - - 8,615 Interbank loans receivable and SPAR 18,355 - - 18,355 22,642 - - 22,642
Financial assets at FVTPL 17,688 - - 17,688 10,346 - - 10,346
Financial assets at FVOCI 47,009 - - 47,009 29,993 - - 29,993
Investment securities at amortized cost 252,006 - - 252,006 267,499 - - 267,499
Default Interbank loans receivable and SPAR - - 49 49 - - 67 67
Gross carrying amount 535,229 - 49 535,278 541,582 - 67 541,649 Loss allowance - - (40) (40) (2) - (50) (52)
Carrying amount 535,229 - 9 535,238 541,580 - 17 541,597

(51)
26.1.3.3 Other financial assets at amortized cost Other financial assets at amortized cost that are exposed to credit risk are as follows:
Consolidated Parent
2019 2018 2019 2018
(In Millions of Pesos) Accounts receivable, net 1,509 1,916 1,785 1,315 Other accrued interest and fees receivable 264 671 209 573 Rental deposits 734 360 623 131 Sales contracts receivable, net - 541 - 360 Others, net 84 2,179 150 2,047
2,591 5,667 2,767 4,426
The carrying amounts of the above financial assets represent the BPI Group’s maximum exposure to credit risk. The BPI Group’s other financial assets at amortized cost (shown under Other assets, net) generally arise from transactions with various unrated counterparties with good credit standing. The BPI Group applies the PFRS 9 simplified approach to measuring expected credit losses which uses a lifetime expected loss methodology for other financial assets. 26.1.3.4 Loan commitments Credit risk exposures arising from undrawn loan commitments are as follows: Consolidated
2019 2018
Stage 1 12-month
ECL
Stage 2 Lifetime
ECL
Stage 3 Lifetime
ECL Total
Stage 1 12-month
ECL
Stage 2 Lifetime
ECL
Stage 3 Lifetime
ECL Total
(In Millions of Pesos) Credit grade Standard monitoring 389,148 3,608 - 392,756 232,257 74 - 232,331 Special monitoring 11,417 - - 11,417 3,246 264 - 3,510 Default - - 411 411 - - 63 63
Gross carrying amount 400,565 3,608 411 404,584 235,503 338 63 235,904 Loss allowance* (506) (104) (40) (650) (710) (30) (13) (753)
Carrying amount 400,059 3,504 371 403,934 234,793 308 50 235,151
*Included in “Miscellaneous liabilities” in Note 17
Parent
2019 2018
Stage 1 12-month
ECL
Stage 2 Lifetime
ECL
Stage 3 Lifetime
ECL Total
Stage 1 12-month
ECL
Stage 2 Lifetime
ECL
Stage 3 Lifetime
ECL Total
(In Millions of Pesos) Credit grade Standard monitoring 382,750 3,374 - 386,124 229,849 69 - 229,918 Special monitoring 11,417 - - 11,417 3,242 258 - 3,500 Default - - 408 408 - - 63 63
Gross carrying amount 394,167 3,374 408 397,949 233,091 327 63 233,481 Loss allowance* (488) (92) (39) (619) (682) (28) (13) (723)
Carrying amount 393,679 3,282 369 397,330 232,409 299 50 232,758
*Included in “Miscellaneous liabilities” in Note 17

(52)
26.1.4 Credit impaired loans and advances The BPI Group closely monitors collaterals held for financial assets considered to be credit-impaired (Stage 3), as it becomes more likely that the BPI Group will take possession of collateral to mitigate potential credit losses. Loans and advances that are credit-impaired and related collateral held in order to mitigate potential losses are shown below: Consolidated
2019 2018
Gross
exposure Impairment allowance
Net carrying amount
Gross exposure
Impairment allowance
Net carrying amount
(In Millions of Pesos) Credit-impaired assets Corporate and SME loans 13,091 6,157 6,934 13,564 5,728 7,836 Retail loans 10,763 4,821 5,942 8,944 4,044 4,900
Total credit-impaired assets 23,854 10,978 12,876 22,508 9,772 12,736
Fair value of collateral 11,662 12,611
Parent
2019 2018
Gross exposure
Impairment allowance
Carrying amount
Gross exposure
Impairment allowance
Carrying amount
(In Millions of Pesos) Credit-impaired assets Corporate and SME loans 9,824 4,809 5,015 9,772 4,299 5,473 Retail loans 3,513 3,085 428 2,638 2,505 133
Total credit-impaired assets 13,337 7,894 5,443 12,410 6,804 5,606
Fair value of collateral 6,354 7,704
The BPI Group acquires assets by taking possession of collaterals held as security for loans and advances. As at December 31, 2019, the BPI Group’s foreclosed collaterals have carrying amount of P3,155 million (2018 - P3,363 million). The related foreclosed collaterals have aggregate fair value of P9,583 million (2018 - P9,859 million). Foreclosed collaterals include real estate (land, building, and improvements), auto and chattel. Repossessed properties are sold as soon as practicable and are classified as Assets held for sale in the statements of condition. 26.1.5 Loss allowance The loss allowance recognized in the period is impacted by a variety of factors, as described below:
• Transfers between Stage 1 and Stages 2 or 3 due to financial instruments experiencing significant increases (or decreases) of credit risk or becoming credit-impaired in the period, and the consequent “step up” (or “step down”) between 12-month and lifetime ECL;
• Additional allowances for new financial instruments recognized during the period and releases for financial instruments de-recognized in the period;
• Write-offs of allowances related to assets that were written off during the period; • Impact on the measurement of ECL due to changes in PDs, EADs and LGDs in the period;
• Impacts on the measurement of ECL due to changes made to models and assumptions; and
• Foreign exchange translations for assets denominated in foreign currencies and other movements.

(53)
The following tables summarize the changes in the loss allowance for loans and advances between the beginning and the end of the annual period. No movement analysis of allowance for impairment is presented for treasury and other investment debt securities and other financial assets subject to impairment as the related loss allowance is deemed insignificant for financial reporting purposes.
Consolidated
Stage 1 Stage 2 Stage 3
Corporate and SME loans 12-month
ECL Lifetime ECL Lifetime
ECL Total
(In Millions of Pesos) Loss allowance, at January 1, 2019 5,768 1,843 5,728 13,339
Provision for credit losses for the year Transfers:
Transfer from Stage 1 (2,072) 2,707 1,691 2,326 Transfer from Stage 2 6 (680) 291 (383) Transfer from Stage 3 10 2 (177) (165)
New financial assets originated 3,688 - - 3,688 Financial assets derecognized during the period (1,959) (295) (1,203) (3,457) Changes in assumptions and other movements
in provision 1,521 (508) 70 1,083
1,194 1,226 672 3,092
Write-offs and other movements (92) 41 (243) (294)
Loss allowance, at December 31, 2019 6,870 3,110 6,157 16,137
Stage 1 Stage 2 Stage 3
Retail loans 12-month
ECL Lifetime ECL Lifetime
ECL Total
(In Millions of Pesos) Loss allowance, at January 1, 2019 4,114 1,405 4,044 9,563
Provision for credit losses for the year Transfers:
Transfer from Stage 1 (1,031) 1,418 2,456 2,843 Transfer from Stage 2 33 (716) 559 (124) Transfer from Stage 3 3 33 (161) (125)
New financial assets originated 1,070 - - 1,070 Financial assets derecognized during the period (308) (115) (339) (762) Changes in assumptions and other movements
in provision (613) (190) 882 79
(846) 430 3,397 2,981
Write-offs and other movements (32) (55) (2,620) (2,707)
Loss allowance, at December 31, 2019 3,236 1,780 4,821 9,837

(54)
Parent
Stage 1 Stage 2 Stage 3
Corporate and SME loans 12-month
ECL Lifetime ECL Lifetime
ECL Total
(In Millions of Pesos) Loss allowance, at January 1, 2019 5,108 1,734 4,299 11,141
Provision for credit losses for the year Transfers:
Transfer from Stage 1 (1,846) 2,614 1,360 2,128 Transfer from Stage 2 3 (658) 251 (404) Transfer from Stage 3 6 1 (88) (81)
New financial assets originated 3,450 - - 3,450 Financial assets derecognized during the period (1,844) (279) (842) (2,965) Changes in assumptions and other movements
in provision 1,205 (469) 23 759
974 1,209 704 2,887
Write-offs and other movements (110) 47 (194) (257)
Loss allowance, at December 31, 2019 5,972 2,990 4,809 13,771
Stage 1 Stage 2 Stage 3
Retail loans 12-month
ECL Lifetime ECL Lifetime
ECL Total
(In Millions of Pesos) Loss allowance, at January 1, 2019 1,839 482 2,505 4,826
Provision for credit losses for the year Transfers:
Transfer from Stage 1 (558) 877 1,749 2,068 Transfer from Stage 2 11 (286) 350 75 Transfer from Stage 3 - 1 (9) (8)
New financial assets originated 217 - - 217 Financial assets derecognized during the period (36) (41) (205) (282) Changes in assumptions and other movements
in provision (667) (41) 762 54
(1,033) 510 2,647 2,124
Write-offs and other movements 2 (51) (2,067) (2,116)
Loss allowance, at December 31, 2019 808 941 3,085 4,834
Consolidated
Stage 1 Stage 2 Stage 3
Corporate and SME loans 12-month
ECL Lifetime ECL Lifetime
ECL Total
(In Millions of Pesos) Loss allowance, at January 1, 2018 6,905 1,136 4,372 12,413
Provision for credit losses for the year Transfers:
Transfer in (out of) Stage 1 (1,344) 1,661 1,701 2,018 Transfer in (out of) Stage 2 161 (661) 161 (339) Transfer in (out of) Stage 3 - - (3) (3)
New financial assets originated 3,761 - - 3,761 Financial assets derecognized during the period (1,951) (250) (515) (2,716) Changes in assumptions and other movements
in provision (1,782) (49) 331 (1,500)
(1,155) 701 1,675 1,221
Write-offs and other movements 18 6 (319) (295)
Loss allowance, at December 31, 2018 5,768 1,843 5,728 13,339

(55)
Stage 1 Stage 2 Stage 3
Retail loans 12-month
ECL Lifetime ECL Lifetime
ECL Total
(In Millions of Pesos) Loss allowance, at January 1, 2018 3,148 1,188 3,925 8,261
Provision for credit losses for the year Transfers:
Transfer in (out of) Stage 1 (686) 983 1,866 2,163 Transfer in (out of) Stage 2 36 (509) 392 (81) Transfer in (out of) Stage 3 18 42 (337) (277)
New financial assets originated 861 - - 861 Financial assets derecognized during the period (145) (95) (661) (901) Changes in assumptions and other movements
in provision 1,085 (210) 643 1,518
1,169 211 1,903 3,283
Write-offs and other movements (203) 6 (1,784) (1,981)
Loss allowance, at December 31, 2018 4,114 1,405 4,044 9,563
Parent
Stage 1 Stage 2 Stage 3
Corporate and SME loans 12-month
ECL Lifetime ECL Lifetime
ECL Total
(In Millions of Pesos) Loss allowance, at January 1, 2018 6,332 1,029 3,128 10,489
Provision for credit losses for the year Transfers:
Transfer in (out of) Stage 1 (1,053) 1,575 1,223 1,745 Transfer in (out of) Stage 2 133 (621) 104 (384) Transfer in (out of) Stage 3 - - - -
New financial assets originated 3,286 - - 3,286 Financial assets derecognized during the period (1,824) (213) (311) (2,348) Changes in assumptions and other movements
in provision (1,783) (42) 388 (1,437)
(1,241) 699 1,404 862
Write-offs and other movements 17 6 (233) (210)
Loss allowance, at December 31, 2018 5,108 1,734 4,299 11,141
Stage 1 Stage 2 Stage 3
Retail loans 12-month
ECL Lifetime ECL Lifetime
ECL Total
(In Millions of Pesos) Loss allowance, at January 1, 2018 929 205 2,290 3,424
Provision for credit losses for the year Transfers:
Transfer in (out of) Stage 1 (309) 413 1,255 1,359 Transfer in (out of) Stage 2 16 (119) 194 91 Transfer in (out of) Stage 3 1 1 (22) (20)
New financial assets originated 137 - - 137 Financial assets derecognized during the period (41) (20) (496) (557) Changes in assumptions and other movements
in provision 1,106 2 686 1,794
910 277 1,617 2,804
Write-offs and other movements - - (1,402) (1,402)
Loss allowance, at December 31, 2018 1,839 482 2,505 4,826

(56)
Critical accounting estimate - Measurement of expected credit loss for loans and advances The measurement of the expected credit loss (ECL) for loans and advances is an area that requires the use of complex models and significant assumptions about future economic conditions and credit behavior (e.g. the likelihood of customers defaulting and the resulting losses). A number of significant judgments are also required in applying the accounting requirements for measuring ECL, such as:
• Determining criteria for significant increase in credit risk;
• Choosing appropriate models and assumptions for the measurement of ECL; • Establishing the number and relative weightings of forward-looking scenarios for each type of product and the
associated ECL; and
• Establishing groups of similar financial assets for the purposes of measuring ECL. Forward-looking scenarios Three distinct macroeconomic scenarios (baseline, upside and downside) are considered in the BPI Group’s estimation of expected credit losses in Stage 1 and Stage 2. These scenarios are based on assumptions supported by economic theories and historical experience. The downside scenario reflects a negative macroeconomic event occurring within the first 12 months, with conditions deteriorating for up to two years, followed by a recovery for the remainder of the period. This scenario is grounded in historical experience and assumes a monetary policy response that returns the economy to a long-run, sustainable growth rate within the forecast period. The probability of each scenario is determined using expert judgment and recession probability tools provided by reputable external service providers. The baseline case incorporates the BPI Group’s outlook both for the domestic and global economy. The best- and worst-case scenarios take into account certain adjustments that will lead to a more positive or negative economic outcome. Other forward-looking considerations not otherwise incorporated within the above scenarios, such as the impact of any regulatory, legislative or political changes is likewise considered, if material. The most significant period-end assumptions used for the ECL estimate are set out below. The scenarios “base”, “upside” and “downside” were used for all portfolios. At December 31, 2019
Base Scenario Upside Scenario Downside Scenario
Next 12 Months
2 to 5 years (Average)
Next 12 Months
2 to 5 years (Average)
Next 12 Months
2 to 5 years (Average)
Real GDP growth (%) 6.3 6.6 6.6 7.2 0.0 4.2 Inflation rate (%) 3.0 3.1 2.7 2.4 11.0 5.9 BVAL 5Y (%) 4.5 4.7 4.0 4.3 11.2 10.3 US Treasury 5Y (%) 2.5 2.5 2.8 3.4 1.4 1.3 Exchange rate 52.300 54.874 51.550 52.856 56.970 62.653
At December 31, 2018
Base Scenario Upside Scenario Downside Scenario
Next 12 Months
2 to 5 years (Average)
Next 12 Months
2 to 5 years (Average)
Next 12 Months
2 to 5 years (Average)
Real GDP growth (%) 7.0 6.4 7.3 7.3 4.1 (1.2) Inflation rate (%) 4.1 3.2 3.5 2.7 6.1 8.8 PDST-R2 5Y (%) 7.0 6.7 6.7 6.4 8.1 10.7 US Treasury 5Y (%) 3.2 2.4 2.7 2.2 6.0 3.7 Exchange rate 54.638 57.796 53.620 52.812 55.829 66.661
Sensitivity analysis The loan portfolios have different sensitivities to movements in macroeconomic variables, so the above three scenarios have varying impact on the expected credit losses of BPI Group’s portfolios. The allowance for impairment is calculated as the weighted average of expected credit losses under the baseline, upside and downside scenarios. The impact of weighting these multiple scenarios was an increase in the allowance for impairment by P554 million as at December 31, 2019 from the baseline scenario (2018 - P1,850 million).

(57)
Transfers between stages Transfers from Stage 1 and Stage 2 are based on the assessment of significant increase in credit risk (‘SICR’) from initial recognition. The impact of moving from 12 months expected credit losses to lifetime expected credit losses, or vice versa, varies by product and is dependent on the expected remaining life at the date of the transfer. Stage transfers may result in significant fluctuations in expected credit losses. Assuming all Stage 2 accounts are considered as Stage 1, allowance for impairment would have decreased by P1,312 million as at December 31, 2019 (2018 - P1,436 million). 26.1.6 Concentrations of risks of financial assets with credit risk exposure The BPI Group’s main credit exposure at their carrying amounts, as categorized by industry sectors follow: Consolidated (December 31, 2019)
Financial
institutions Consumer Manufacturing Real estate Others Less -
allowance Total
(In Millions of Pesos) Due from BSP 207,845 - - - - - 207,845 Due from other banks 22,356 - - - - - 22,356 Interbank loans receivable
and SPAR 22,610 - - - - (40) 22,570 Financial assets at FVTPL 6,620 27 1 6 17,378 - 24,032 Financial assets at FVOCI 5,034 - - 258 45,787 - 51,079 Investment securities at
amortized cost, net 58,564 1,258 4,595 3,189 207,499 - 275,105 Loans and advances, net 162,335 124,841 229,745 365,874 618,515 (25,974) 1,475,336 Other financial assets - - - - 3,423 (832) 2,591
At December 31, 2019 485,364 126,126 234,341 369,327 892,602 (26,846) 2,080,914

(58)
Consolidated (December 31, 2018)
Financial
institutions Consumer Manufacturing Real estate Others Less -
allowance Total
(In Millions of Pesos) Due from BSP 225,907 - - - - - 225,907 Due from other banks 12,480 - - - - (3) 12,477 Interbank loans receivable
and SPAR 34,373 - - - - (50) 34,323 Financial assets at FVTPL 4,682 99 3 3 11,696 - 16,483 Financial assets at FVOCI 2,411 - 52 - 33,068 - 35,531 Investment securities at
amortized cost, net 65,164 680 4,714 1,777 215,238 (2) 287,571 Loans and advances, net 85,441 110,627 226,604 317,595 637,531 (22,902) 1,354,896 Other financial assets - - - - 6,225 (558) 5,667
At December 31, 2018 430,458 111,406 231,373 319,375 903,758 (23,515) 1,972,855
Parent (December 31, 2019)
Financial
institutions Consumer Manufacturing Real estate Others Less -
allowance Total
(In Millions of Pesos) Due from BSP 181,815 - - - - - 181,815 Due from other banks 18,356 - - - - - 18,356 Interbank loans receivable
and SPAR 18,404 - - - - (40) 18,364 Financial assets at FVTPL 3,041 110 56 - 14,481 - 17,688 Financial assets at FVOCI 4,714 - - 258 42,037 - 47,009 Investment securities at
amortized cost, net 56,942 585 4,595 3,189 186,695 - 252,006 Loans and advances, net 161,348 68,302 226,235 222,217 572,279 (18,605) 1,231,776 Other financial assets - - - - 3,076 (309) 2,767
At December 31, 2019 444,620 68,997 230,886 225,664 818,568 (18,954) 1,769,781
Parent (December 31, 2018)
Financial
institutions Consumer Manufacturing Real estate Others Less -
allowance Total
(In Millions of Pesos) Due from BSP 202,487 - - - - - 202,487 Due from other banks 8,615 - - - - - 8,615 Interbank loans receivable
and SPAR 22,709 - - - - (50) 22,659 Financial assets at FVTPL 4,679 99 2 - 5,566 - 10,346 Financial assets at FVOCI 1,952 - 52 - 27,989 - 29,993 Investment securities at amortized cost, net 63,541 - 4,487 1,777 197,694 (2) 267,497 Loans and advances, net 83,098 57,991 219,927 182,685 598,222 (15,967) 1,125,956 Other financial assets - - - - 4,816 (390) 4,426
At December 31, 2018 387,081 58,090 224,468 184,462 834,287 (16,409) 1,671,979

(59)
26.2 Market risk The BPI Group is exposed to market risk - the risk that the fair value or future cash flows of a financial instrument will fluctuate because of changes in market prices. Market risk is managed by the RMO guided by policies and procedures approved by the RMC and confirmed by the Executive Committee/BOD. Market risk management is incumbent on the BOD through the RMC. Market risk management in BPI covers managing exposures to trading risk, foreign exchange risk, counterparty credit risk, interest rate risk of the banking book and liquidity risk. At the management level, the BPI Group’s market risk exposures are managed by the RMO, headed by the Parent Bank’s CRO who reports directly to the RMC. In addition, the Internal Audit is responsible for the independent review of risk assessment measures and procedures and the control environment. The BPI Group reviews and controls market risk exposures of both its trading and non-trading portfolios. Trading portfolios include those positions arising from the BPI Group’s market-making transactions. Non-trading portfolios primarily arise from the interest rate management of the BPI Group’s retail and commercial banking assets and liabilities. The BPI Group has exposures in interest rate swaps, currency swaps and structured notes as part of its trading and position taking activities. Most derivatives while used to hedge open exposures to mitigate price risk inherent in the BPI Group's portfolios do not qualify as accounting hedges. Value-at-Risk (VaR) measurement is an integral part of the BPI Group’s market risk control system. This metric estimates, at 99% confidence level, the maximum loss that a trading portfolio may incur over a trading day. This metric indicates as well that there is 1% statistical probability that the trading portfolios’ actual loss would be greater than the computed VaR. In order to ensure model soundness, the VaR is periodically subject to model validation and back testing. VaR is supplemented by other risk metrics and measurements that would provide preliminary signals to Treasury and to the management to assess the vulnerability of Bank’s positions. To control the risk, the RMC sets risk limits for trading portfolios which are consistent with the BPI Group’s goals, objectives, risk appetite, and strategies. Stress tests indicate the potential losses that could arise in extreme conditions that would have detrimental effect to the Bank’s positions. The Bank periodically performs stress testing (price risk and liquidity risk) to assess the Bank’s condition on assumed stress scenarios. Contingency plans are frequently reviewed to ensure the Bank’s preparedness in the event of real stress. Results of stress tests are reviewed by Senior Management and by the RMC. The average daily VaR for the trading portfolios are as follows:
Consolidated Parent
2019 2018 2019 2018
(In Millions of Pesos) Local fixed-income 92 33 91 25 Foreign fixed-income 127 168 120 154 Foreign exchange 45 44 10 9 Derivatives 127 95 127 95 Equity securities 30 28 - - Mutual fund 5 7 - -
426 375 348 283

(60)
26.2.1 Foreign exchange risk Foreign exchange risk is the risk that the fair value or future cash flows of financial instrument will fluctuate because of changes in foreign exchange rates. It arises on financial instruments that are denominated in a foreign currency. As at reporting date, the BPI Group is mainly exposed to movements of US Dollar (USD) against the Philippine Peso (PhP). Volatilities caused by movement of USD against PhP are regularly monitored in line with the limits established internally. The table below summarizes the BPI Group’s exposure to foreign currency exchange rate risk at December 31. Consolidated
2019 2018
USD Others* Total USD Others* Total
(In Millions of Pesos) Financial Assets Cash and other cash items 3,060 285 3,345 2,742 752 3,494 Due from other banks 16,126 1,583 17,709 6,749 2,620 9,369 Interbank loans receivable and
SPAR 813 132 945 6,639 146 6,785 Financial assets at FVTPL 9,149 178 9,327 8,491 119 8,610 Financial assets at FVOCI -
debt securities 16,977 - 16,977 25,385 172 25,557 Investment securities at amortized cost 127,442 1,414 128,856 127,260 1,507 128,767
Loans and advances, net 149,012 7,621 156,633 145,995 4,970 150,965 Others financial assets 13,746 1,697 15,443 1,230 106 1,336
Total financial assets 336,325 12,910 349,235 324,491 10,392 334,883
Financial Liabilities Deposit liabilities 228,362 6,130 234,492 241,547 6,692 248,239 Derivative financial liabilities 1,438 75 1,513 1,967 118 2,085 Bills payable 80,817 482 81,299 82,692 458 83,150 Due to BSP and other banks 942 - 942 1,250 - 1,250 Manager’s checks and demand
drafts outstanding 316 10 326 87 61 148 Other financial liabilities 17,749 1,668 19,417 Accounts payable 129 13 142 119 3 122
Total financial liabilities 329,753 8,378 338,131 327,662 7,332 334,994
Net on-balance sheet position 6,572 4,532 11,104 (3,171) 3,060 (111)
*Others category includes financial instruments denominated in JPY, EUR and GBP.

(61)
Parent
2019 2018
USD Others* Total USD Others* Total
(In Millions of Pesos) Financial Assets Cash and other cash items 2,858 284 3,142 2,552 751 3,303 Due from other banks 14,556 1,553 16,109 4,874 2,269 7,143 Interbank loans receivable and
SPAR - - - 5,260 - 5,260 Financial assets at FVTPL 6,807 78 6,885 5,144 119 5,263 Financial assets at FVOCI -
debt securities 15,030 - 15,030 25,132 172 25,304 Investment securities at amortized cost 117,006 145 117,151 117,143 220 117,363
Loans and advances, net 147,803 7,148 154,951 144,486 4,787 149,273 Others financial assets 13,445 1,566 15,011 1,220 90 1,310
Total financial assets 317,505 10,774 328,279 305,811 8,408 314,219
Financial Liabilities Deposit liabilities 214,389 5,965 220,354 227,621 6,442 234,063 Derivative financial liabilities 1,438 75 1,513 1,967 115 2,082 Bills payable 77,749 - 77,749 79,178 - 79,178 Due to BSP and other banks 942 - 942 1,250 - 1,250 Manager’s checks and demand
drafts outstanding 314 10 324 81 61 142 Other financial liabilities 17,817 1,588 19,405 20,947 1,500 22,447 Accounts payable 121 12 133 117 2 119
Total financial liabilities 312,770 7,650 320,420 331,161 8,120 339,281
Net on-balance sheet position 4,735 3,124 7,859 (25,350) 288 (25,062)
*Others category includes financial instruments denominated in JPY, EUR and GBP.
Presented below is a sensitivity analysis demonstrating the impact on pre-tax income of reasonably possible change in the exchange rate between US Dollar and Philippine Peso. The fluctuation rate is based on the historical movement of US Dollar against the Philippine Peso year on year.
Year Change in currency
Effect on pre-tax income
Consolidated Parent
(In millions of Pesos) 2019 +/- 1.24% -/+ 81 -/+ 59 2018 +/- 1.92% -/+ 71 -/+ 95
26.2.2 Interest rate risk Interest rate risk is the risk that cash flows or fair value of a financial instrument will fluctuate due to movements in market interest rates. Interest rate risk in the banking book arises from the BPI Group’s core banking activities. The BPI Group is subject to re-pricing risk arising from financial assets and liabilities that have different maturities and are re-priced taking into account the prevailing market interest rates. The BPI Group employs two methods to measure the potential impact of interest rate risk: (i) one that focuses on the economic value of the banking book, and (ii) one that focuses on net interest earnings. The RMC sets limits on the two interest rate risk metrics which are monitored monthly by the Market Risk Division of the RMO.

(62)
Interest rate risk in the banking book Interest rate risk in the banking book (IRRBB) is the current and prospective risk to the Bank's capital and earnings arising from the adverse movements in interest rates that affect its banking book positions. Excessive levels of interest rate risks in the banking book can pose a significant threat to the Bank's earnings and capital base. The Bank has established comprehensive risk management policies, procedures, risk limits structures and employs risk measurement models supported by a robust risk management system. Interest rate exposures from core banking activities are measured using the following earnings-based and economic value-based models: (a) Earnings-at-Risk (EaR) measures the potential deterioration in net interest income over the next 12 months due to adverse movements in interest rates, and (b) Balance Sheet Value-at-Risk (BS VaR) measures the impact on the economic value of the future cash flows in the banking book due to changes in interest rates. Earnings-at-Risk (EaR) The EaR is built on repricing profile of the Bank and considers principal payments only. The Bank projects interest inflows from its financial assets and interest outflows from its financial liabilities in the next 12 months as earnings are affected when interest rate moved against the Bank’s position. As of December 31, 2019, the net interest income impact of movement in interest rates amounts to P2,424 million (2018 - P806 million) for the whole BPI Group and P1,986 million (2018 - P715 million) for the Parent Bank. Balance Sheet Value-at-Risk (BSVaR) The BS VaR model is also built on repricing gap or the difference between the amount of rate-sensitive financial assets and liabilities which considers both principal and interest payments. It is the present value of the Bank’s expected net cash flows based on the current interest rates. As at December 31, the average BSVaR, computed on a monthly basis, for the banking book stood at P13,754 million (2018 - P15,507 million) for the whole BPI Group and P9,530 million (2018 - P13,483 million) for the Parent Bank. The IRRBB levels are closely monitored against RMC-approved limits and results are reported and discussed regularly at the Management level through the ALCO and at the Board level through the Risk Management Committee (RMC). The BPI Group manages interest rate exposures related to its assets and liabilities through a transfer-pricing system administered by Treasury. Investment securities and interest rate derivatives are also used to hedge interest rate risk and manage repricing gaps in the balance sheet. The BPI Group also conducts price stress tests in the banking book and EaR stress tests for a variety of interest rate shock scenarios to identify the impact of adverse movements in interest rates on the Bank's economic value and earnings. The design of the price and EaR stress tests include steepening and flattening yield curves, parallel up/down and short rate up/down shocks. The interest rate shocks applied is calibrated for all major currencies in which the Bank has significant positions. The results of the stress test are reported to the RMC and Senior Management and are integrated into the overall risk management framework of the BPI Group. The risk management process, including its various components, is subject to periodic independent review (i.e. internal audit and model validation) and consistently calibrated to ensure accuracy, relevance, propriety and timeliness of data and assumptions employed. The assumptions and parameters used in building these metrics are properly documented. Any changes in the methodology and assumptions used are duly approved by the Chief Risk Officer and noted by the RMC.

(63)
The table below summarizes the BPI Group’s exposure to interest rate risk, categorized by the earlier of contractual repricing or maturity dates. Consolidated (December 31, 2019)
Repricing
Up to 1
year Over 1 up to
3 years Over 3 years Non-
repricing
Total
(In Millions of Pesos) As at December 31, 2019 Financial Assets Cash and other cash items - - - 47,256 47,256 Due from BSP - - - 207,845 207,845 Due from other banks - - - 22,356 22,356 Interbank loans receivable and SPAR - - - 22,570 22,570 Financial assets at FVTPL 334 472 1,050 22,176 24,032 Financial assets at FVOCI - - - 51,079 51,079 Investment securities at amortized cost - - - 275,105 275,105 Loans and advances, net 890,934 136,779 311,924 135,699 1,475,336 Other financial assets - - - 2,591 2,591
Total financial assets 891,268 137,251 312,974 786,677 2,128,170
Financial Liabilities Deposit liabilities 796,447 359,265 539,631 - 1,695,343 Derivative financial liabilities 81 397 936 1,463 2,877 Bills payable and other borrowed funds - 15,415 - 135,422 150,837 Due to BSP and other banks - - - 1,288 1,288 Manager’s checks and demand drafts
outstanding - - - 8,299 8,299 Other financial liabilities - - - 9,392 9,392
Total financial liabilities 796,528 375,077 540,567 155,864 1,868,036
Total interest gap 94,740 (237,826) (227,593) 630,813 260,134

(64)
Consolidated (December 31, 2018)
Repricing
Up to 1
year Over 1 up to
3 years Over 3 years Non-
repricing
Total
(In Millions of Pesos) As at December 31, 2018 Financial Assets Cash and other cash items - - - 43,536 43,536 Due from BSP - - - 225,907 225,907 Due from other banks - - - 12,477 12,477 Interbank loans receivable and SPAR - - - 34,323 34,323 Financial assets at FVTPL 70 1,172 1,125 14,116 16,483 Financial assets at FVOCI - - - 35,531 35,531 Investment securities at amortized cost - 1 - 287,570 287,571 Loans and advances, net 828,847 130,082 270,105 125,862 1,354,896 Other financial assets - - - 5,667 5,667
Total financial assets 828,917 131,255 271,230 784,989 2,016,391
Financial Liabilities Deposit liabilities 602,032 831,505 152,209 - 1,585,746 Derivative financial liabilities 43 1,204 1,279 1,365 3,891 Bills payable and other borrowed funds 20,915 10,516 - 135,470 166,901 Due to BSP and other banks - - - 3,988 3,988 Manager’s checks and demand drafts
outstanding - - - 6,931 6,931 Other financial liabilities - - - 19,313 19,313
Total financial liabilities 622,990 843,225 153,488 167,067 1,786,770
Total interest gap 205,927 (711,970) 117,742 617,922 229,621

(65)
Parent (December 31, 2019)
Repricing
Up to 1 year
Over 1 up to 3 years
Over 3 years
Non-repricing
Total
(In Millions of Pesos) As at December 31, 2019 Financial Assets Cash and other cash items - - - 45,982 45,982 Due from BSP - - - 181,815 181,815 Due from other banks - - - 18,356 18,356 Interbank loans receivable and SPAR - - - 18,364 18,364 Financial assets at FVTPL 334 472 1,050 15,832 17,688 Financial assets at FVOCI - - - 47,009 47,009 Investment securities at amortized cost - - - 252,006 252,006 Loans and advances, net 824,718 90,806 257,603 58,649 1,231,776 Other financial assets - - - 2,767 2,767
Total financial assets 825,052 91,278 258,653 640,780 1,815,763
Financial Liabilities Deposit liabilities 711,910 301,381 443,167 - 1,456,458 Derivative financial liabilities 81 397 936 1,463 2,877 Bills payable and other borrowed funds - 15,118 - 111,411 126,529 Due to BSP and other banks - - - 1,288 1,288 Manager’s checks and demand drafts
outstanding - - - 6,421 6,421 Other financial liabilities - - - 4,801 4,801
Total financial liabilities 711,991 316,896 444,103 125,384 1,598,374
Total interest gap 113,061 (225,618) (185,450) 515,396 217,389

(66)
Parent (December 31, 2018)
Repricing
Up to 1 year
Over 1 up to 3 years
Over 3 years
Non-repricing
Total
(In Millions of Pesos) As at December 31, 2018 Financial Assets Cash and other cash items - - - 42,419 42,419 Due from BSP - - - 202,487 202,487 Due from other banks - - - 8,615 8,615 Interbank loans receivable and SPAR - - - 22,659 22,659 Financial assets at FVTPL 70 1,172 1,125 7,979 10,346 Financial assets at FVOCI - - - 29,993 29,993 Investment securities at amortized cost - 1 - 267,496 267,497 Loans and advances, net 757,320 81,133 224,477 63,026 1,125,956 Other financial assets - - - 4,426 4,426
Total financial assets 757,390 82,306 225,602 649,100 1,714,398
Financial Liabilities Deposit liabilities 534,119 708,636 104,452 - 1,347,207 Derivative financial liabilities 43 1,204 1,279 1,362 3,888 Bills payable and other borrowed funds 20,915 10,516 - 119,449 150,880 Due to BSP and other banks - - - 3,988 3,988 Manager’s checks and demand drafts
outstanding - - - 5,354 5,354 Other financial liabilities - - - 13,408 13,408
Total financial liabilities 555,077 720,356 105,731 143,561 1,524,725
Total interest gap 202,313 (638,050) 119,871 505,539 189,673
26.3 Liquidity risk Liquidity risk is the risk that the BPI Group will be unable to meet its payment obligations associated with its financial liabilities when they fall due, and to replace funds when they are withdrawn. The consequence may be the failure to meet obligations to repay depositors and fulfill commitments to lend. The BPI Group’s liquidity profile is observed and monitored through its metric, the Minimum Cumulative Liquidity Gap (MCLG). The MCLG is the smallest net cumulative cash inflow (if positive) or the largest net cumulative cash outflow (if negative) over the next three (3) months. The MCLG indicates the biggest funding requirement in the short term and the degree of liquidity risk present in the current cash flow profile of the BPI Group. A red flag is immediately raised and reported to management and the RMC when the MCLG level projected over the next 3 months is about to breach the RMC-prescribed MCLG limit. 26.3.1 Liquidity risk management process The BPI Group’s liquidity management process, as carried out within the BPI Group and monitored by the RMC includes:
• Day-to-day funding managed by monitoring future cash flows to ensure that requirements can be met. This includes replenishment of funds as they mature or as borrowed by customers;
• Maintaining a portfolio of highly marketable assets that can easily be liquidated as protection against any unforeseen interruption to cash flow;
• Monitoring liquidity gaps against internal and regulatory requirements;
• Managing the concentration and profile of debt maturities; and
• Performing periodic liquidity stress testing on the BPI Group’s liquidity position by assuming a faster rate of withdrawals in its deposit base.

(67)
Monitoring and reporting take the form of cash flow measurement and projections for the next day, week and month as these are key periods for liquidity management. The starting point for these projections is an analysis of the contractual maturity of the financial liabilities and the expected collection date of the financial assets. Sources of liquidity are regularly reviewed by the BPI Group to maintain a wide diversification by currency, geography, counterparty, product and term. The BPI Group also monitors unmatched medium-term assets, the level and type of undrawn lending commitments, the usage of overdraft facilities and the impact of contingent liabilities such as standby letters of credit. Liquidity Coverage Ratio (LCR) Pursuant to BSP Circular No. 905 issued in 2016, the Parent Bank is required to hold and maintain an adequate level of unencumbered High Quality Liquid Assets (HQLA) that are sufficient to meet its estimated total cash outflows over a 30 calendar-day period of liquidity stress. The LCR is the ratio of HQLAs to total net cash outflows which should be no lower than 100% on a daily basis. It is designed to promote short-term resilience of the BPI Group’s liquidity risk profile to withstand significant liquidity shocks that may last over 30 calendar days. HQLA represents the Parent Bank’s stock of liquid assets that qualify for inclusion in the LCR which consists mainly of cash, regulatory reserves and unencumbered high-quality liquid securities. HQLAs therefore, serve as defense against potential stress events. The main drivers of the Parent Bank’s LCR comprise the changes in the total stock of HQLA as well as changes in net cash outflows related to deposits, unsecured borrowings, commitment facilities, derivatives cash flows and cash inflows from maturing corporate, business and retail loans, among others. Cash outflows from derivatives contracts are effectively offset by derivatives cash inflows. These two are accorded 100% outflow and inflow factors, respectively. Net Stable Funding Ratio (NSFR) On January 1, 2019, the Parent Bank adopted BSP Circular No. 1007 issued in 2018 regarding the NSFR requirement. The NSFR is aimed at strengthening the Parent Bank’s long-term resilience by maintaining a stable funding in relation to its assets and off-balance sheet items as well as to limit the maturity transformation risk of the BPI Group. The NSFR is expressed as the ratio of available stable funding and the required stable funding and complements the LCR as it takes a longer view of the BPI Group’s liquidity risk profile. The BPI Group’s capital, retail deposits and long-term debt are considered as stable funding sources whereas the BPI Group’s assets including, but not limited to, performing and non-performing loans and receivables, HQLA and non-HQLA securities as well as off-balance items form part of the required stable funding. The Parent Bank’s solo and consolidated NSFRs are well-above the regulatory minimum of 100%. The Parent Bank maintains a well-diversified funding base and has a substantial amount of core deposits, thereby avoiding undue concentrations by counterparty, maturity, and currency. The Parent Bank manages its liquidity position through asset-liability management activities supported by a well-developed funds management practice as well as a sound risk management system. As part of risk oversight, the Parent Bank monitors its liquidity risk on a daily basis, in terms of single currency and significant currencies, to ensure it is operating within the risk appetite set by the BOD and to assess ongoing compliance with the minimum requirement of the liquidity ratios. Furthermore, the Parent Bank has a set of policies and escalation procedures in place that govern its day-to-day risk monitoring and reporting processes. The table below shows the actual liquidity metrics of the BPI Group and the Parent Bank:
Consolidated Parent
2019 2018 2019 2018
Liquidity ratio 167.06% 160.92% 168.13% 160.10% Net stable funding ratio 130.74% 141.99% 122.65% 139.81% Leverage ratio 10.70% 10.43% 10.06% 9.79% Total exposure measure 2,224,550 2,120,270 1,887,364 1,795,947
The improvement in the Parent Bank’s LCR in 2019 was attained due to growing portfolio of government securities while cash, reserves and claims on the BSP make up on average 53% of the total stock of HQLA.

(68)
26.3.2 Maturity profile - Non-derivative financial instruments The tables below present the maturity profile of non-derivative financial instruments based on undiscounted cash flows (inclusive of interest) which the BPI Group uses to manage the inherent liquidity risk. The maturity analysis is based on the remaining period from the end of the reporting period to the contractual maturity date or, if earlier, the expected date the financial asset will be realized or the financial liability will be settled. Consolidated (December 31, 2019)
Up to 1 year Over 1 up to
3 years
Over 3 years
Total
(In Millions of Pesos) As at December 31, 2019 Financial Assets Cash and other cash items 47,256 - - 47,256 Due from BSP 207,845 - - 207,845 Due from other banks 22,356 - - 22,356 Interbank loans receivable and SPAR 22,551 17 114 22,682 Financial assets at FVTPL 6,862 1,558 16,756 25,176 Financial assets at FVOCI 10,575 8,161 47,820 66,556 Investment securities at amortized cost 46,278 84,560 221,296 352,134 Loans and advances, net 656,088 267,511 581,062 1,504,661 Other financial assets 2,591 - - 2,591
Total financial assets 1,022,402 361,807 867,048 2,251,257
Financial Liabilities Deposit liabilities 796,447 359,265 539,631 1,695,343 Bills payable and other borrowed
funds 49,564 57,590 46,207 153,361 Due to BSP and other banks 1,288 - - 1,288 Manager’s checks and demand drafts
outstanding 8,299 - - 8,299 Other financial liabilities 9,392 - - 9,392
Total financial liabilities 864,990 416,855 585,838 1,867,683
Total maturity gap 157,412 (55,048) 281,210 383,574

(69)
Consolidated (December 31, 2018)
Up to 1 year Over 1 up to
3 years
Over 3 years
Total
(In Millions of Pesos) As at December 31, 2018 Financial Assets Cash and other cash items 43,536 - - 43,536 Due from BSP 225,923 - - 225,923 Due from other banks 12,477 - - 12,477 Interbank loans receivable and SPAR 35,028 12 135 35,175 Financial assets at FVTPL 8,740 1,231 4,170 14,141 Financial assets at FVOCI 29,154 1,601 7,730 38,485 Investment securities at amortized cost 42,442 59,550 251,643 353,635 Loans and advances, net 580,825 205,331 604,684 1,390,840 Other financial assets 5,667 - - 5,667
Total financial assets 983,792 267,725 868,362 2,119,879
Financial Liabilities Deposit liabilities 923,895 878,739 195,585 1,998,219 Bills payable and other borrowed
funds 97,507 77,117 475 175,099 Due to BSP and other banks 3,988 - - 3,988 Manager’s checks and demand drafts
outstanding 6,931 - - 6,931 Other financial liabilities 19,313 - - 19,313
Total financial liabilities 1,051,634 955,856 196,060 2,203,550
Total maturity gap (67,842) (688,131) 672,302 (83,671)
Parent (December 31, 2019)
Up to 1 year
Over 1 up to 3 years
Over 3 years
Total
(In Millions of Pesos) As at December 31, 2019 Financial Assets Cash and other cash items 45,982 - - 45,982 Due from BSP 181,815 - - 181,815 Due from other banks 18,356 - - 18,356 Interbank loans receivable and SPAR 18,245 17 114 18,376 Financial assets at FVTPL 926 1,522 15,612 18,060 Financial assets at FVOCI 5,023 8,074 45,980 59,077 Investment securities at amortized cost 25,347 76,282 209,930 311,559 Loans and advances, net 605,833 196,549 449,524 1,251,906 Other financial assets, net 2,767 - - 2,767
Total financial assets 904,294 282,444 721,160 1,907,898
Financial Liabilities Deposit liabilities 711,910 301,381 443,167 1,456,458 Bills payable and other borrowed
funds 36,025 45,421 45,988 127,434 Due to BSP and other banks 1,288 - - 1,288 Manager’s checks and demand drafts
outstanding 6,421 - - 6,421 Other financial liabilities 4,801 - - 4,801
Total financial liabilities 760,445 346,802 489,155 1,596,402
Total maturity gap 143,849 (64,358) 232,005 311,496

(70)
Parent (December 31, 2018)
Up to 1 year
Over 1 up to 3 years
Over 3 years
Total
(In Millions of Pesos) As at December 31, 2018 Financial Assets Cash and other cash items 42,419 - - 42,419 Due from BSP 202,487 - - 202,487 Due from other banks 8,615 - - 8,615 Interbank loans receivable and SPAR 22,705 12 135 22,852 Financial assets at FVTPL 2,530 1,229 4,169 7,928 Financial assets at FVOCI 23,926 1,392 7,390 32,708 Investment securities at amortized cost 39,473 50,821 239,775 330,069 Loans and advances, net 520,744 145,807 479,908 1,146,459 Other financial assets, net 4,426 - - 4,426
Total financial assets 867,325 199,261 731,377 1,797,963
Financial Liabilities Deposit liabilities 814,358 726,595 116,373 1,657,326 Bills payable and other borrowed
funds 85,037 76,747 - 161,784 Due to BSP and other banks 3,988 - - 3,988 Manager’s checks and demand drafts
outstanding 5,354 - - 5,354 Other financial liabilities 13,408 - - 13,408
Total financial liabilities 922,145 803,342 116,373 1,841,860
Total maturity gap (54,820) (604,081) 615,004 (43,897)
26.3.3 Maturity profile - Derivative instruments
(a) Derivatives settled on a net basis
The BPI Group’s derivatives that are settled on a net basis consist of interest rate swaps, non-deliverable forwards and non-deliverable swaps. The table below presents the contractual undiscounted cash flows of interest rate swaps based on the remaining period from December 31 to the contractual maturity dates that are subject to offsetting, enforceable master netting arrangements and similar agreements.
Consolidated and Parent
Up to 1 year Over 1 up to
3 years Over 3 years
Total
2019 (In Millions of Pesos) Interest rate swap contracts - held for trading
- Inflow 334 472 1,050 1,856 - Outflow (81) (397) (936) (1,414)
- Net inflow 253 75 114 442
Non-deliverable forwards and swaps - held for trading - Inflow 22 - - 22 - Outflow (107) (484) (356) (947)
- Net outflow (85) (484) (356) (925)

(71)
Up to 1 year Over 1 up to
3 years Over 3 years
Total
2018 (In Millions of Pesos) Interest rate swap contracts - held for trading
- Inflow 99 1,285 1,317 2,701 - Outflow (59) (1,296) (1,485) (2,840)
- Net inflow 40 (11) (168) (139)
Non-deliverable forwards and swaps - held for trading - Inflow 36,071 2,103 3,680 41,854 - Outflow (35,972) (2,120) (3,680) (41,772)
- Net inflow (outflow) 99 (17) - 82
(a) Derivatives settled on a gross basis
The BPI Group’s derivatives that are settled on a gross basis include foreign exchange derivatives mainly currency forwards and currency swaps. The table below presents the contractual undiscounted cash flows of foreign exchange derivatives based on the remaining period from reporting date to the contractual maturity dates. Consolidated and Parent
Up to 1 year
Over 1 up to 3 years
Over 3 years Total
(In Millions of Pesos) Foreign exchange derivatives - held for trading
2019 - Inflow 527 509 11 1,047 - Outflow (451) (66) - (517)
- Net inflow (outflow) 76 443 11 530
2018 - Inflow 127,002 4,184 - 131,186 - Outflow (127,082) (4,136) - (131,218)
- Net inflow (outflow) (80) 48 - (32)
Foreign exchange derivatives - held for hedging - Inflow - 5,174 - 5,174 - Outflow - (5,316) - (5,316)
- Net (outflow) - (142) - (142)

(72)
26.4 Fair value measurement
The following tables present the carrying value of assets and liabilities and the level of fair value hierarchy within which the fair value measurements are categorized: 26.4.1 Assets and liabilities measured at fair value on a recurring or non-recurring basis Consolidated (December 31, 2019)
Carrying Amount
Fair value
Level 1 Level 2 Total
Recurring measurements: (In Millions of Pesos) Financial assets
Financial assets at FVTPL Derivative financial assets 2,933 - 2,933 2,933 Trading assets - Debt securities 21,099 17,562 3,537 21,099 - Equity securities 73 73 - 73
Financial assets at FVOCI - Debt securities 51,079 50,995 84 51,079 - Equity securities 2,826 1,738 1,088 2,826
78,010 70,368 7,642 78,010
Financial liabilities Derivative financial liabilities 2,877 - 2,877 2,877
Non-recurring measurements: Assets held for sale, net 3,155 - 9,583 9,583
Consolidated (December 31, 2018)
Carrying Amount
Fair value
Level 1 Level 2 Total
Recurring measurements (In Millions of Pesos) Financial assets Financial assets at FVTPL Derivative financial assets 4,033 - 4,033 4,033 Trading assets - Debt securities 12,450 11,656 794 12,450 - Equity securities 238 238 - 238
Financial assets at FVOCI - Debt securities 35,531 35,089 442 35,531 - Equity securities 1,675 1,129 546 1,675
53,927 48,112 5,815 53,927
Financial liabilities Derivative financial liabilities 3,891 - 3,891 3,891
Non-recurring measurements Assets held for sale, net 3,363 - 9,859 9,859

(73)
Parent Bank (December 31, 2019)
Carrying Amount
Fair value
Level 1 Level 2 Total
Recurring measurements (In Millions of Pesos) Financial assets Financial assets at FVTPL Derivative financial assets 2,923 - 2,923 2,923 Trading securities - debt securities 14,765 14,765 - 14,765
Financial assets at FVOCI - Debt securities 47,009 47,009 - 47,009 - Equity securities 1,311 972 339 1,311
66,008 62,746 3,262 66,008
Financial liabilities Derivative financial liabilities 2,877 - 2,877 2,877
Non-recurring measurements Assets held for sale, net 342 - 3,296 3,296
Parent Bank (December 31, 2018)
Carrying Amount
Fair value
Level 1 Level 2 Total
Recurring measurements (In Millions of Pesos) Financial assets Financial assets at FVTPL Derivative financial assets 4,031 - 4,031 4,031 Trading securities - debt securities 6,315 5,528 787 6,315
Financial assets at FVOCI - Debt securities 29,993 29,838 155 29,993 - Equity securities 590 406 184 590
40,929 35,772 5,157 40,929
Financial liabilities Derivative financial liabilities 3,888 - 3,888 3,888
Non-recurring measurements Assets held for sale, net 455 - 3,496 3,496
There are no assets and liabilities whose fair values fall under the Level 3 category as at December 31, 2019 and 2018. Likewise, there were no transfers between Level 1 and Level 2 during the years ended December 31, 2019 and 2018.

(74)
26.4.2 Fair value disclosures of assets and liabilities not measured at fair value Consolidated (December 31, 2019)
Carrying Amount
Fair value
Level 1 Level 2 Total
Financial assets Cash and other cash items 47,256 - 47,256 47,256 Due from BSP 207,845 - 207,845 207,845 Due from other banks 22,356 - 22,356 22,356 Interbank loans receivable and SPAR 22,570 - 22,610 22,610 Investment securities at amortized cost 275,105 276,454 - 276,454 Loans and advances, net 1,475,336 - 1,480,074 1,480,074 Other financial assets 2,591 - 2,591 2,591
Financial liabilities Deposit liabilities 1,695,343 - 1,678,607 1,678,607 Bills payable and other borrowed funds 150,837 84,973 65,461 150,434 Due to BSP and other banks 2,946 - 2,946 2,946 Manager’s checks and demand drafts
outstanding
8,299 - 8,299 8,299 Other financial liabilities 9,392 - 9,392 9,392
Non-financial assets Investment properties 155 638 638
Consolidated (December 31, 2018)
Carrying Amount
Fair value
Level 1 Level 2 Total
Financial assets Cash and other cash items 43,536 - 43,536 43,536 Due from BSP 225,907 - 225,907 225,907 Due from other banks 12,477 - 12,480 12,480 Interbank loans receivable and SPAR 34,323 - 34,373 34,373 Investment securities at amortized cost 287,571 254,850 3,802 258,652 Loans and advances, net 1,354,896 - 1,362,803 1,362,803 Other financial assets 5,667 - 5,667 5,667
Financial liabilities Deposit liabilities 1,585,746 - 1,585,746 1,585,746 Bills payable and other borrowed funds 166,901 - 163,545 163,545 Due to BSP and other banks 3,988 - 3,988 3,988 Manager’s checks and demand drafts
outstanding 6,931 - 6,931 6,931 Other financial liabilities 19,313 - 19,313 19,313
Non-financial assets Investment properties 129 - 1,786 1,786

(75)
Parent Bank (December 31, 2019)
Carrying Amount
Fair value
Level 1 Level 2 Total
Financial assets Cash and other cash items 45,982 - 45,982 45,982 Due from BSP 181,815 - 181,815 181,815 Due from other banks 18,356 - 18,356 18,356 Interbank loans receivable and SPAR 18,346 - 18,405 18,405 Investment securities at amortized cost 252,006 252,964 - 252,964 Loans and advances, net 1,231,776 - 1,230,551 1,230,551 Other financial assets 2,767 - 2,767 2,767
Financial liabilities Deposit liabilities 1,456,458 - 1,450,164 1,450,164 Bills payable and other borrowed funds 126,529 75,463 50,663 126,126 Due to BSP and other banks 1,288 - 1,288 1,288 Manager’s checks and demand drafts
outstanding
6,421 -
6,421
6,421 Other financial liabilities 4,801 - 4,801 4,801
Non-financial assets Investment properties 143 638 638
Parent Bank (December 31, 2018)
Carrying Amount
Fair value
Level 1 Level 2 Total
Fair values disclosed (In Millions of Pesos) Financial assets
Cash and other cash items 42,419 - 42,419 42,419 Due from BSP 202,487 - 202,487 202,487 Due from other banks 8,615 - 8,615 8,615 Interbank loans receivable and SPAR 22,659 - 22,709 22,709 Investment securities at amortized cost 267,497 236,113 3,775 239,888 Loans and advances, net 1,125,956 - 1,144,903 1,144,903 Other financial assets 4,426 - 4,426 4,426
Financial liabilities Deposit liabilities 1,347,207 - 1,347,207 1,347,207 Bills payable and other borrowed funds 150,880 - 150,533 150,533 Due to BSP and other banks 3,988 - 3,988 3,988 Manager’s checks and demand drafts
outstanding 5,354
- 5,354 5,354 Other financial liabilities 13,408 - 13,408 13,408
Non-financial assets Investment properties 118 - 1,786 1,786

(76)
26.5 Insurance risk management The non-life insurance entities decide on the retention, or the absolute amount that they are ready to assume insurance risk from one event. The retention amount is a function of capital, experience, actuarial study and risk appetite or aversion. In excess of the retention, these entities arrange reinsurances either thru treaties or facultative placements. They also accredit reinsurers based on certain criteria and set limits as to what can be reinsured. The reinsurance treaties and the accreditation of reinsurers require BOD’s approval.
Note 27 - Capital management
Capital management is understood to be a facet of risk management. The primary objective of the BPI Group is the generation of recurring acceptable returns to shareholders’ capital. To this end, the BPI Group’s policies, business strategies and activities are directed towards the generation of cash flows that are in excess of its fiduciary and contractual obligations to its depositors, and to its various funders and stakeholders. Cognizant of its exposure to risks, the BPI Group maintains sufficient capital to absorb unexpected losses, stay in business for the long haul, and satisfy regulatory requirements. The BPI Group further understands that its performance, as well as the performance of its various units, should be measured in terms of returns generated vis-à-vis allocated capital and the amount of risk borne in the conduct of business. Effective January 1, 2014, the BSP, through its Circular 781, requires each bank and its financial affiliated subsidiaries to adopt new capital requirements in accordance with the provisions of Basel III. The new guidelines are meant to strengthen the composition of the bank's capital by increasing the level of core capital and regulatory capital. The Circular sets out minimum Common Equity (CET1) ratio and Tier 1 Capital ratios of 6% and 7.5%, respectively. A capital conservation buffer of 2.5%, comprised of CET1 capital, was likewise imposed. The minimum required capital adequacy ratio remains at 10% which includes the capital conservation buffer. Information on the regulatory capital is summarized below:
Consolidated Parent
2019 2018 2019 2018
(In Millions of Pesos) Tier 1 capital 262,873 244,276 262,239 243,519 Tier 2 capital 14,079 13,116 11,500 10,795
Gross qualifying capital 276,952 257,392 273,739 254,314 Less: Regulatory adjustments/required deductions 24,810 23,152 72,400 68,491
Total qualifying capital 252,142 234,240 201,339 185,823
Risk weighted assets 1,568,855 1,455,746 1,347,976 1,252,790 CAR (%) 16.07 16.09 14.94 14.83 CET1 (%) 15.17 15.19 14.08 13.97
The BPI Group has fully complied with the CAR requirement of the BSP.
Likewise, regulatory capital structures of certain subsidiaries on a standalone basis are managed to meet the requirements of the relevant regulatory bodies (i.e. Insurance Commission, SEC, PSE etc.). These subsidiaries have fully complied with the applicable regulatory capital requirements. As part of the reforms of the PSE to expand capital market and improve transparency among listed firms, PSE requires listed entities to maintain a minimum of ten percent (10%) of their issued and outstanding shares, exclusive of any treasury shares, held by the public. The Parent Bank is likewise fully compliant with this requirement.

(77)
Note 28 - Commitments and Contingencies
At present, there are lawsuits, claims and tax assessments pending against the BPI Group. In the opinion of management, after reviewing all actions and proceedings and court decisions with legal counsels, the aggregate liability or loss, if any, arising therefrom will not have a material effect on the BPI Group’s financial position or financial performance.
BPI and some of its subsidiaries are defendants in legal actions arising from normal business activities. Management believes that these actions are without merit or that the ultimate liability, if any, resulting from them will not materially affect the financial statements. In the normal course of business, the BPI Group makes various commitments that are not presented in the financial statements. The BPI Group does not anticipate any material losses from these commitments. Note 29 - Summary of Significant Accounting Policies The principal accounting policies applied in the preparation of these financial statements are set out below. These policies have been consistently applied to all the years presented, unless otherwise stated. 29.1 Basis of preparation The financial statements of the BPI Group have been prepared in accordance with Philippine Financial Reporting Standards (PFRS). The term PFRS in general includes all applicable PFRS, Philippine Accounting Standards (PAS), and interpretations of the Philippine Interpretations Committee (PIC), Standing Interpretations Committee (SIC) and International Financial Reporting Interpretations Committee (IFRIC) which have been approved by the Financial Reporting Standards Council (FRSC) and adopted by the SEC. As allowed by the SEC, the pre-need subsidiary of the Parent Bank continues to follow the provisions of the Pre-Need Uniform Chart of Accounts (PNUCA) prescribed by the SEC and adopted by the Insurance Commission. The financial statements comprise the statements of condition, statements of income and statements of comprehensive income shown as two statements, statements of changes in capital funds, statements of cash flows and the notes. These financial statements have been prepared under the historical cost convention, as modified by the revaluation of financial assets at FVTPL, financial assets at FVOCI, and plan assets of the BPI Group’s defined benefit plans. The preparation of financial statements in conformity with PFRS requires the use of certain critical accounting estimates. It also requires management to exercise its judgment in the process of applying the BPI Group’s accounting policies. Changes in assumptions may have a significant impact on the financial statements in the period the assumptions changed. Management believes that the underlying assumptions are appropriate and that the financial statements therefore fairly present the financial position and results of the BPI Group. The areas involving a higher degree of judgment or complexity, or areas where assumptions and estimates are significant to the financial statements are shown below Critical accounting estimates
• Fair value of derivatives and other financial instruments (Note 7)
• Calculation of defined benefit obligation (Note 23)
• Useful lives of bank premises, furniture, fixtures and equipment (Note 11) • Impairment of investments subsidiaries and associates (Note 12) Critical accounting judgments
• Classification of investment securities at amortized cost (Note 9)
• Realization of deferred income tax assets (Note 13)

(78)
29.2 Changes in accounting policy and disclosures
(a) New standards adopted by the BPI Group The BPI Group has adopted the following standards effective January 1, 2019: PFRS 16, ‘Leases’ PFRS 16 replaces the guidance of PAS 17 that relate to the accounting by lessees and the recognition of almost all leases in the balance sheet. PFRS 16 removes the current distinction between operating and financing leases and requires recognition of an asset (the right-of-use asset) and a lease liability to pay rentals for virtually all lease contracts. Under PFRS 16, a contract is, or contains, a lease if the contract conveys the right to control the use of an identified asset for a period of time in exchange for consideration. On adoption of PFRS 16, the BPI Group recognized lease liabilities and right-of-use assets in relation to leases which had previously been classified as ‘operating leases’ under the principles of PAS 17. These liabilities were measured at the present value of the remaining lease payments, discounted using the lessee’s incremental borrowing rate as of January 1, 2019. The weighted average lessee’s incremental borrowing rate applied to the lease liabilities on January 1, 2019 was 6.87% and 4.25% for the Subsidiaries and BPI Parent, respectively. The reconciliation between the operating lease commitments under PAS 17 at December 31, 2018 discounted using the BPI Group’s incremental borrowing rate and the lease liability recognized as at January 1, 2019 is as follows:
Consolidated Parent
(In Millions of Pesos) Operating lease commitments, December 31, 2018 11,896 10,161
Discounted amount using the incremental borrowing rate 8,926 7,696 Add: Finance lease liabilities recognized at December 31, 2018 - - Less: Short-term leases recognized on a straight-line basis as expense 228 203 Low-value leases and contracts reassessed as service agreements 54 44
Lease liability, January 1, 2019 8,644 7,449
The associated right-of-use assets for property leases were measured at the amount equal to the lease liability, adjusted by the amount of any prepaid or accrued lease payments relating to that lease recognized in the statements of condition as at December 31, 2018. The amount of prepaid lease payments amount to P452 million and P451 million for BPI Group and Parent Bank, respectively. In applying PFRS 16 for the first time, the BPI Group has used the following practical expedients permitted by the standard:
• the accounting for operating leases with a remaining lease term of less than 12 months as at January 1, 2019 as short-term leases
• the exclusion of initial direct costs for the measurement of the right-of-use asset at the date of initial application
• the use of hindsight in determining the lease term where the contract contains options to extend or terminate the lease
• apply the provisions of PFRS 16 to contracts that were previously identified as leases applying PAS 7, ‘Statement of cash flows’ and IFRIC 4, ‘Determining whether an arrangement contains a lease’.
Philippine Interpretation IFRIC 23, Uncertainty over Income Tax Treatments (effective for annual periods beginning on or after January 1, 2019) It has been clarified previously that PAS 12, not PAS 37, Provisions, Contingent Liabilities and Contingent Assets, applies to accounting for uncertain income tax treatments. IFRIC 23 explains how to recognize and measure deferred and current income tax assets and liabilities where there is uncertainty over a tax treatment.

(79)
An uncertain tax treatment is any tax treatment applied by an entity where there is uncertainty over whether that treatment will be accepted by the tax authority. For example, a decision to claim a deduction for a specific expense or not to include a specific item of income in a tax return is an uncertain tax treatment if its acceptability is uncertain under tax law. IFRIC 23 applies to all aspects of income tax accounting where there is an uncertainty regarding the treatment of an item, including taxable profit or loss, the tax bases of assets and liabilities, tax losses and credits and tax rates. The adoption of the above interpretation did not have a material impact on the financial statements of the BPI Group. (b) New standards, amendments and interpretations not yet adopted by the BPI Group The following new accounting standards and interpretations are not mandatory for December 31, 2019 reporting period and have not been early adopted by the BPI Group: PFRS 17, Insurance Contracts (effective for annual periods beginning on or after January 1, 2022) PFRS 17 was issued in May 2017 as replacement for PFRS 4, Insurance Contracts. PFRS 17 represents a fundamental change in the accounting framework for insurance contracts requiring liabilities to be measured at a current fulfilment value and provides a more uniform measurement and presentation approach for all insurance contracts. It requires a current measurement model where estimates are re-measured each reporting period. Contracts are measured using the building blocks of (1) discounted probability-weighted cash flows, (2) an explicit risk adjustment, and (3) a contractual service margin (“CSM”) representing the unearned profit of the contract which is recognized as revenue over the coverage period. The standard allows a choice between recognizing changes in discount rates either in the income statement or directly in other comprehensive income. The choice is likely to reflect how insurers account for their financial assets under PFRS 9. An optional, simplified premium allocation approach is permitted for the liability for the remaining coverage for short duration contracts, which are often written by non-life insurers. The new rules will affect the financial statements and key performance indicators of all entities that issue insurance contracts or investment contracts with discretionary participation features. The Insurance Commission, in coordination with Philippine Insurers and Reinsurers Association, is currently reviewing the impact of PFRS 17 across the entire industry and has established a project team to manage the implementation approach. The BPI Group is assessing the quantitative impact of PFRS 17 as of reporting date. Likewise, the following amendments are not mandatory for December 31, 2019 reporting period and have not been early adopted by the BPI Group:
• Amendments to PAS 1, Presentation of Financial Statements and PAS 8, Accounting Policies, Changes in Accounting Estimates and Errors
• Amendments to PFRS 3, Business Combinations
• Amendments to PAS 28, Long-term Interests in Associates and Joint Ventures
• Revised Conceptual Framework for Financial Reporting The adoption of the above amendments is not expected to have a material impact on the financial statements of the BPI Group. 29.3 Financial instruments A financial instrument is any contract that gives rise to a financial asset of one entity and a financial liability or equity instrument of another entity. The BPI Group recognizes a financial instrument in the statements of condition when, and only when, the BPI Group becomes a party to the contractual provisions of the instrument.

(80)
29.3.1 Measurement methods Amortized cost and effective interest rate The amortized cost is the amount at which the financial asset or financial liability is measured at initial recognition minus the principal repayments, plus or minus the cumulative amortization using the effective interest method of any difference between that initial amount and the maturity amount and, for financial assets, adjusted for any loss allowance. The effective interest rate is the rate that exactly discounts estimated future cash payments or receipts through the expected life of the financial asset or financial liability to the gross carrying amount of a financial asset (i.e. its amortized cost before any impairment allowance) or to the amortized cost of a financial liability. The calculation does not consider expected credit losses and includes transaction costs, premiums or discounts and fees and points paid or received that are integral to the effective interest rate, such as origination fees. For purchased or originated credit-impaired (‘POCI’) financial assets – assets that are credit-impaired (see definition on Note 29.3.2.2) at initial recognition - the BPI Group calculates the credit-adjusted effective interest rate, which is calculated based on the amortized cost of the financial asset instead of its gross carrying amount and incorporates the impact of expected credit losses in estimated future cash flows. When the BPI Group revises the estimates of future cash flows, the carrying amount of the respective financial assets or financial liability is adjusted to reflect the new estimate discounted using the original effective interest rate. Any changes are recognized in profit or loss. Interest income Interest income is calculated by applying the effective interest rate to the gross carrying amount of financial assets, except for:
• POCI financial assets, for which the original credit-adjusted effective interest rate is applied to the amortized cost of the financial asset.
• Financial assets that are not ‘POCI’ but have subsequently become credit-impaired (or ‘Stage 3’), for which interest revenue is calculated by applying the effective interest rate to their amortized cost (i.e. net of the expected credit loss provision).
Initial recognition and measurement Financial assets and financial liabilities are recognized when the entity becomes a party to the contractual provisions of the instrument. Regular way purchases and sales of financial assets are recognized on trade-date, the date on which the BPI Group commits to purchase or sell the asset. At initial recognition, the BPI Group measures a financial asset or financial liability at its fair value plus or minus, in the case of a financial asset or financial liability not at fair value through profit or loss, transaction costs that are incremental and directly attributable to the acquisition or issue of the financial asset or financial liability, such as fees and commissions. Transaction costs of financial assets and financial liabilities carried at fair value through profit or loss are expensed in profit or loss. Immediately after initial recognition, an expected credit loss allowance (ECL) is recognized for financial assets measured at amortized cost and investments in debt instruments measured at FVOCI, as described in Note 29.3.2.1 below, which results in the loss provision being recognized in profit or loss when an asset is newly originated. When the fair value of financial assets and liabilities differs from the transaction price on initial recognition, the BPI Group recognizes the difference as follows:
• When the fair value is evidenced by a quoted price in an active market for an identical asset or liability (i.e. a Level 1 input) or based on a valuation technique that uses only data from observable markets, the difference is recognized as a gain or loss.
• In all other cases, the difference is deferred and the timing of recognition of deferred day one profit or loss is determined individually. It is either amortized over the life of the instrument, deferred until the instrument’s fair value can be determined using market observable inputs, or realized through settlement.

(81)
29.3.2 Financial assets 29.3.2.1 Classification and subsequent measurement The BPI Group classifies its financial assets in the following measurement categories: at fair value through profit or loss, fair value through other comprehensive income and at amortized cost. The classification requirements for debt and equity instruments are described below: Debt instruments Debt instruments are those instruments that meet the definition of a financial liability from the issuer’s perspective, such as loans and advances, due from BSP and other banks, government and corporate bonds and other financial receivables. Classification and subsequent measurement of debt instruments depend on the BPI Group’s business model for managing the asset and the cash flow characteristics of the asset. Based on these factors, the BPI Group classifies its debt instruments into one of the following three measurement categories:
• Amortized cost Assets that are held for collection of contractual cash flows where those cash flows represent solely payments of principal and interest (‘SPPI’), and that are not designated at fair value through profit or loss, are measured at amortized cost. The carrying amount of these assets is adjusted by any expected credit loss allowance recognized and measured. Interest income from these financial assets is included in ‘Interest income’ using the effective interest rate method. Amortized cost financial assets include cash and other cash items, due from BSP, due from other banks, interbank loans receivables and SPAR, loans and advances, and other financial assets.
• Fair value through other comprehensive income (FVOCI) Financial assets that are held for collection of contractual cash flows and for selling the assets, where the assets’ cash flows represent solely payments of principal and interest, and that are not designated at FVTPL, are measured at fair value through other comprehensive income (FVOCI). Movements in the carrying amount are taken through other comprehensive income, except for the recognition of impairment gains or losses, interest revenue and foreign exchange gains and losses on the instrument’s amortized cost which are recognized in the statements of income. When the financial asset is derecognized, the cumulative gain or loss previously recognized in other comprehensive income is reclassified from equity to profit or loss. Interest income from these financial assets is included in ‘Interest income’ using the effective interest rate method.
• Fair value through profit or loss (FVTPL) Assets that do not meet the criteria for amortized cost or FVOCI are measured at fair value through profit or loss. A gain or loss on a debt investment that is subsequently measured at fair value through profit or loss and is not part of a hedging relationship is recognized in profit or loss and presented in the statements of income within ‘Trading gain on securities’ in the period in which it arises, unless it arises from debt instruments that were designated at fair value or which are not held for trading, in which case they are presented separately.
Business model The business model reflects how the BPI Group manages the assets in order to generate cash flows. That is, whether the BPI Group’s objective is solely to collect the contractual cash flows from the assets or is to collect both the contractual cash flows and cash flows arising from the sale of assets. If neither of these is applicable, then the financial assets are classified and measured at fair value through profit or loss. Factors considered by the BPI Group in determining the business model for a group of assets include past experience on how the cash flows for these assets were collected, how the asset’s performance is evaluated and reported to key management personnel, how risks are assessed and managed and how managers are compensated.

(82)
Solely Payment of Principal and Interest (SPPI) Where the business model is to hold assets to collect contractual cash flows or to collect contractual cash flows and sell, the BPI Group assesses whether the financial instruments’ cash flows represent solely payments of principal and interest (the ‘SPPI test’). In making this assessment, the BPI Group considers whether the contractual cash flows are consistent with a basic lending arrangement i.e. interest includes only consideration for the time value of money, credit risk, other basic lending risks and a profit margin that is consistent with a basic lending arrangement. Where the contractual terms introduce exposure to risk or volatility that are inconsistent with a basic lending arrangement, the related financial asset is classified and measured at fair value through profit or loss. The BPI Group reclassifies debt investments when and only when its business model for managing those assets changes. The reclassification takes place from the start of the first reporting period following the change. Such changes are expected to be very infrequent and none occurred during the period. Equity instruments Equity instruments are instruments that meet the definition of equity from the issuer’s perspective; that is, instruments that do not contain a contractual obligation to pay and that evidence a residual interest in the issuer’s net assets. The BPI Group subsequently measures all equity investments at fair value through profit or loss, except where the BPI Group’s management has elected, at initial recognition, to irrevocably designate an equity investment at fair value through other comprehensive income. The BPI Group’s policy is to designate equity investments as FVOCI when those investments are held for purposes other than to generate investment returns. When this election is used, fair value gains and losses are recognized in other comprehensive income and are not subsequently reclassified to profit or loss, even on disposal. Impairment losses (and reversal of impairment losses) are not reported separately from other changes in fair value. Dividends, when representing a return on such investments, continue to be recognized in profit or loss as ‘Other income’ when the BPI Group’s right to receive payments is established. Gains and losses on equity investments at fair value through profit or loss are included in the ‘Trading gain on securities’ in the statements of income. 29.3.2.2 Impairment of amortized cost and FVOCI financial assets The BPI Group assesses impairment as follows:
• individually for loans that exceed specified thresholds. Where there is objective evidence of impairment, individually assessed provisions will be recognized; and
• collectively for loans below the specified thresholds noted above or if there is no objective evidence of impairment. These loans are included in a group of loans with similar risk characteristics and collectively assessed for impairment. If there is objective evidence that the group of loans is collectively impaired, collectively assessed provisions will be recognized.

(83)
Expected credit losses The BPI Group assesses on a forward-looking basis the ECL associated with its debt instrument assets carried at amortized cost and FVOCI and with the exposure arising from loan commitments. The BPI Group recognizes a loss allowance for such losses at each reporting date. The measurement of ECL reflects:
• an unbiased and probability-weighted amount that is determined by evaluating a range of possible outcomes;
• the time value of money; and • reasonable and supportable information that is available without undue cost or effort at the reporting date
about past events, current conditions and forecasts of future economic conditions. PFRS 9 outlines a ‘three-stage’ model for impairment based on changes in credit quality since initial recognition as summarized below:
• A financial instrument that is not credit-impaired on initial recognition is classified in “Stage 1” and has its credit risk continuously monitored by the BPI Group.
• If a significant increase in credit risk since initial recognition is identified, the financial instrument is moved to “Stage 2” but is not yet deemed to be credit-impaired. The BPI Group determines SICR based on prescribed benchmarks approved by the Board of the Directors.
• If the financial instrument is credit-impaired, the financial instrument is then moved to “Stage 3”.
• Financial instruments in Stage 1 have their ECL measured at an amount equal to the portion of lifetime expected credit losses that results from default events possible within the next 12 months. Instruments in Stages 2 or 3 have their ECL measured based on expected credit losses on a lifetime basis.
• A pervasive concept in measuring ECL in accordance with PFRS 9 is that it should consider forward-looking information.
• POCI financial assets are those financial assets that are credit impaired on initial recognition. Their ECL is always measured on a lifetime basis (Stage 3). The BPI Group has no POCI as at December 31, 2019 and 2018.
For expected credit loss provisions modelled on a collective basis, a grouping of exposures is performed on the basis of shared risk characteristics, such that risk exposures within a group are homogeneous. Determination of significant increase in credit risk (SICR) The BPI Group compares the probabilities of default occurring over its expected life as at the reporting date with the probability of default occurring over its expected life on the date of initial recognition to determine significant increase in credit risk. Since comparison is made between forward-looking information at reporting date against initial recognition, the deterioration in credit risk may be triggered by the following factors:
• substantial deterioration in credit quality as measured by the applicable internal or external ratings or credit score or the shift from investment grade category to non-investment grade category;
• adverse changes in business, financial and/or economic conditions of the borrower;
• early warning signs of worsening credit where the ability of the counterparty to honor his obligation is dependent upon the business or economic condition;
• the account has become past due beyond 30 days where an account is classified under special monitoring category (refer to Note 26.1.2 for the description of special monitoring); and
• expert judgment for the other quantitative and qualitative factors which may result to SICR as defined by the BPI Group.

(84)
Measuring ECL -Inputs, assumptions and estimation techniques The ECL is measured on either a 12-month or lifetime basis depending on whether a significant increase in credit risk has occurred since initial recognition or whether an asset is considered to be credit-impaired. Expected credit losses are the discounted product of the PD, EAD and LGD, defined as follows:
• The PD represents the likelihood that the borrower will default (as per “Definition of default and credit-impaired” above), either over the next 12 months (12M PD), or over the remaining life (lifetime PD) of the asset.
• EAD is based on the amounts the BPI Group expects to be owed at the time of default, over the next 12 months (12M EAD) or over the remaining life (lifetime EAD). For example, for a revolving commitment, the BPI Group includes the current drawn balance plus any further amount that is expected to be drawn up to the current contractual limit by the time of default, should it occur.
The 12-month and lifetime EADs are determined based on the expected payment profile, which varies by product type.
- For amortizing products and bullet repayment loans, this is based on the contractual repayments owed by
the borrower over a 12-month or lifetime basis. - For committed credit lines, the exposure at default is predicted by taking current drawn balance and
adding a “credit conversion factor” which allows for the expected drawdown of the remaining limit by the time of default.
• LGD represents the BPI Group’s expectation of the extent of loss on a defaulted exposure. LGD varies by type of counterparty, type and seniority of claim and availability of collateral or other credit support. LGD is expressed as a percentage loss per unit of exposure at the time of default. The LGDs are determined based on the factors which impact the recoveries made post-default.
- For secured products, this is primarily based on collateral type and projected collateral values, historical
discounts to market/book values due to forced sales, time to repossession and recovery costs observed. - For unsecured products, LGDs are typically set at product level due to the limited differentiation in
recoveries achieved across different borrowers. These LGDs are influenced by collection strategies and historical recoveries.
The ECL is determined by multiplying the PD, LGD and EAD together for each individual exposure or collective segment. This effectively calculates an ECL for each future year, which is then discounted back to the reporting date and summed. The discount rate used in the ECL calculation is the original effective interest rate or an approximation thereof. The lifetime PD is developed by applying a maturity profile to the current 12M PD. The maturity profile looks at how defaults develop on a portfolio from the point of initial recognition throughout the life of the loans. The maturity profile is based on historical observed data and is assumed to be the same across all assets within a portfolio and credit grade band. Forward-looking economic information is also included in determining the 12-month and lifetime PD. These assumptions vary by product type. The assumptions underlying the ECL calculation—such as how the maturity profile of the PDs and how collateral values change—are monitored and reviewed regularly. There have been no significant changes in estimation techniques or significant assumptions made during the reporting period from the time of the adoption of PFRS 9 on January 1, 2018 to the reporting date.

(85)
Forward-looking information incorporated in the ECL models The BPI Group incorporates historical and current information, and forecasts forward-looking events and key economic variables that are assessed to impact credit risk and expected credit losses for each portfolio. Macroeconomic variables that affect a specific portfolio’s non-performing loan rate(s) are determined through statistical modelling and the application of expert judgment. The BPI Group’s economics team establishes possible global and domestic economic scenarios. With the use of economic theories and conventions, expert judgment and external forecasts, the economics team develops assumptions to be used in forecasting variables in the next five (5) years, subsequently reverting to long run-averages. The probability-weighted ECL is calculated by running each scenario through the relevant ECL models and multiplying it by the appropriate scenario weighting. The estimation and application of forward-looking information requires significant judgment. As with any economic forecasts, the projections and likelihood of occurrences are subject to a high degree of inherent uncertainty and therefore the actual outcomes may be significantly different to those projected. The scenarios and their attributes are reassessed at each reporting date. Information regarding the forward-looking economic variables and the relevant sensitivity analysis is disclosed in Note 26. Financial assets with low credit risk Loss allowance for financial assets at amortized cost and FVOCI that have low credit risk is limited to 12-month expected credit losses. Management considers “low credit risk” for listed government bonds to be an investment grade credit rating with at least one major rating agency. Other debt instruments are considered to be low credit risk when they have a low risk of default and the issuer has a strong capacity to meet its contractual cash flow obligations in the near term. Definition of default and credit-impaired assets The BPI Group considers a financial instrument in default or credit-impaired, when it meets one or more of the following criteria: Quantitative criteria The borrower is more than 90 days past due on its contractual payments (with the exception of credit cards and micro-finance loans where a borrower is required to be 90 days past due and over 7 days past due, respectively, to be considered in default). Qualitative criteria The counterparty is experiencing significant financial difficulty which may lead to non-payment of loan as may be indicated by any or combination of the following events:
• The counterparty is in long-term forbearance;
• The counterparty is insolvent; • The counterparty is in breach of major financial covenant(s) which lead(s) to event of default;
• An active market for the security has disappeared;
• Granting of concession that would not be otherwise considered due to economic or contractual reasons relating to the counterparty’s financial difficulty;
• It is becoming probable that the counterparty will enter bankruptcy or other financial reorganization; and
• Financial assets are purchased or originated at a deep discount that reflects the incurred credit losses. The criteria above have been applied to all financial instruments held by the BPI Group and are consistent with the definition of default used for internal credit risk management purposes. The default definition has been applied consistently to model the probability of default, exposure at default (EAD), and loss given default (LGD) throughout the BPI Group’s expected credit loss calculations.

(86)
The BPI Group’s definition of default is substantially consistent with non-performing loan definition of the BSP. For cross-border, treasury and debt securities, these are classified as defaulted based on combination of BSP and external credit rating agency definitions. 29.3.3 Modification of loans The BPI Group sometimes renegotiates or otherwise modifies the contractual cash flows of loans to customers. When this happens, the BPI Group assesses whether or not the new terms are substantially different to the original terms. The BPI Group does this by considering, among others, the following factors:
• If the borrower is in financial difficulty, whether the modification merely reduces the contractual cash flows to amounts the borrower is expected to be able to pay.
• Significant extension of the loan term when the borrower is not in financial difficulty.
• Significant change in the interest rate.
• Change in the currency the loan is denominated in.
• Insertion of collateral, other security or credit enhancements that significantly affect the credit risk associated with the loan.
If the terms are substantially different, the BPI Group derecognizes the original financial asset and recognizes a ‘new’ asset at fair value and recalculates a new effective interest rate for the asset. The date of renegotiation is consequently considered to be the date of initial recognition for impairment calculation purposes, including for the purpose of determining whether a significant increase in credit risk has occurred. However, the BPI Group also assesses whether the new financial asset recognized is deemed to be credit-impaired at initial recognition, especially in circumstances where the renegotiation was driven by the debtor being unable to make the originally agreed payments. Differences in the carrying amount are also recognized in the statements of income as a gain or loss on derecognition. 29.3.4 Derecognition of financial assets other than modification Financial assets, or a portion thereof, are derecognized when the contractual rights to receive the cash flows from the assets have expired, or when they have been transferred and either (i) the BPI Group transfers substantially all the risks and rewards of ownership, or (ii) the BPI Group neither transfers nor retains substantially all the risks and rewards of ownership and the BPI Group has not retained control. The BPI Group enters into transactions where it retains the contractual rights to receive cash flows from assets but assumes a contractual obligation to pay those cash flows to other entities and transfers substantially all of the risks and rewards. These transactions are accounted for as ‘pass through’ transfers that result in derecognition if the BPI Group:
• Has no obligation to make payments unless it collects equivalent amounts from the assets;
• Is prohibited from selling or pledging the assets; and
• Has an obligation to remit any cash it collects from the assets without material delay.
Collateral (shares and bonds) furnished by the BPI Group under standard repurchase agreements and securities lending and borrowing transactions are not derecognized because the BPI Group retains substantially all the risks and rewards on the basis of the predetermined repurchase price, and the criteria for derecognition are therefore not met. 29.3.5 Write-off of financial assets The BPI Group writes off financial assets when it has exhausted all practical recovery efforts and has concluded there is no reasonable expectation of recovery. Indicators that there is no reasonable expectation of recovery include (i) ceasing enforcement activity and (ii) where the BPI Group’s recovery method is foreclosing on collateral and the value of the collateral is such that there is no reasonable expectation of recovering in full. The BPI Group may write-off financial assets that are still subject to enforcement activity. The write-off of loans is approved by the BOD in compliance with the BSP requirements. Loans written-off are fully covered with allowance.

(87)
29.3.6 Financial liabilities
29.3.6.1 Classification of financial liabilities The BPI Group classifies its financial liabilities in the following categories: financial liabilities at fair value through profit or loss and financial liabilities at amortized cost. (a) Financial liabilities at fair value through profit or loss This category comprises two sub-categories: financial liabilities classified as held for trading, and financial liabilities designated by the BPI Group as at fair value through profit or loss upon initial recognition. A financial liability is classified as held for trading if it is acquired or incurred principally for the purpose of selling or repurchasing it in the near term or if it is part of a portfolio of identified financial instruments that are managed together and for which there is evidence of a recent actual pattern of short-term profit-taking. Derivatives are also categorized as held for trading unless they are designated and effective as hedging instruments. Gains and losses arising from changes in fair value of financial liabilities classified as held for trading are included in the statements of income and are reported as “Trading gains/losses on securities”. The BPI Group has no financial liabilities that are designated at fair value through profit loss. (b) Other liabilities measured at amortized cost Financial liabilities that are not classified as at fair value through profit or loss fall into this category and are measured at amortized cost. Financial liabilities measured at amortized cost include deposits from customers and banks, bills payable, amounts due to BSP and other banks, manager’s checks and demand drafts outstanding, subordinated notes and other financial liabilities under deferred credits and other liabilities. 29.3.6.2 Subsequent measurement and derecognition
Financial liabilities at fair value through profit or loss are subsequently carried at fair value. Other liabilities are measured at amortized cost using the effective interest method. Financial liabilities are derecognized when they have been redeemed or otherwise extinguished (i.e. when the obligation is discharged or is cancelled or has expired). Collateral (shares and bonds) furnished by the BPI Group under standard repurchase agreements and securities lending and borrowing transactions is not derecognized because the BPI Group retains substantially all the risks and rewards on the basis of the predetermined repurchase price, and the criteria for derecognition are therefore not met. 29.3.7 Loan commitments Loan commitments are contracts in which the BPI Group is required to provide loans with pre-specified terms to customers. These contracts, which are not issued at below-market interest rates, and are not settled net in cash or by delivering or issuing another financial instrument, are not recorded in the statements of condition. 29.3.8 Derivative financial instruments A derivative instrument is initially recognized at fair value on the date a derivative contract is entered into, and is subsequently remeasured to its fair value at the end of each reporting period. The accounting for subsequent changes in fair value depends on whether the derivative is designated as a hedging instrument or is held for trading. Changes in the fair value of any derivative instrument that does not qualify for hedge accounting (and therefore, held for trading) are recognized immediately in profit or loss and are included in “Trading gain on securities”.

(88)
Hedge accounting The BPI Group designates derivatives as either:
• hedges of the fair value of recognized assets or liabilities or a firm commitment (fair value hedges)
• hedges of a particular risk associated with the cash flows of recognized assets and liabilities and highly probable forecast transactions (cash flow hedges), or
• hedges of a net investment in a foreign operation (net investment hedges). At inception of the hedge relationship, the BPI Group documents the economic relationship between hedging instruments and hedged items, including whether changes in the cash flows of the hedging instruments are expected to offset changes in the cash flows of hedged items. The BPI Group documents its risk management objective and strategy for undertaking its hedge transactions. As disclosed in Note 7, the BPI Group has existing cash flow hedge activity. There are no fair value hedges or net investment hedges as of reporting date. Cash flow hedges that qualify for hedge accounting The effective portion of changes in the fair value of derivatives that are designated and qualify as cash flow hedges is recognized in the “Cash flow hedge reserve” within equity. The gain or loss relating to the ineffective portion is recognized immediately in profit or loss, within “Other operating income”. When the group excludes the forward element of a forward contract and foreign currency basis spread of financial instruments in the hedge designation, the fair value change of the forward element and currency basis spread that relates to the hedged item (‘aligned forward element/currency basis spread’) is recognized within OCI in the costs of hedging reserve within equity. If the group designates the full change in fair value of the derivative (including forward points and currency basis spreads) the gains or losses relating to the effective portion of the change in fair value of the entire derivative are recognized in the cash flow hedge reserve within equity. Amounts accumulated in equity are reclassified to profit or loss within other operating income in the same periods during which the hedged future cash flows affect profit or loss. However, if the amount is a loss and the BPI Group expects that all or a portion of that loss will not be recovered in one or more future periods, the amount that is not expected to be recovered shall immediately be reclassified to profit or loss. When a hedging instrument expires, or is sold or terminated, or when a hedge no longer meets the criteria for hedge accounting, any cumulative deferred gain or loss and deferred costs of hedging in equity at that time shall be reclassified to profit or loss in the same periods during which the future cash flows affect profit or loss. When the future cash flows are no longer expected to occur, the cumulative gain or loss and deferred costs of hedging that were reported in equity are immediately reclassified to profit or loss. 29.3.8.1 Embedded derivatives Certain derivatives are embedded in hybrid contracts, such as the conversion option in a convertible bond. If the hybrid contract contains a host that is a financial asset, then the BPI Group assesses the entire contract for classification and measurement in accordance with the policy outlined in Note 29.3.2 above. Otherwise, the embedded derivatives are treated as separate derivatives when:
• Their economic characteristics and risks are not closely related to those of the host contract;
• A separate instrument with the same terms would meet the definition of a derivative; and
• The hybrid contract is not measured at fair value through profit or loss. These embedded derivatives are separately accounted for at fair value, with changes in fair value recognized in the statements of income unless the BPI Group chooses to designate the hybrid contracts at fair value through profit or loss.

(89)
29.3.9 Fair value measurement Fair value is the price that would be received to sell an asset or paid to transfer a liability in an orderly transaction between market participants at the measurement date. The fair value of a non-financial asset is measured based on its highest and best use. The asset’s current use is presumed to be its highest and best use. The fair value of financial and non-financial liabilities takes into account non-performance risk, which is the risk that the entity will not fulfill an obligation. The BPI Group classifies its fair value measurements using a fair value hierarchy that reflects the significance of the inputs used in making the measurements. The fair value hierarchy has the following levels:
• Level 1 - Quoted prices (unadjusted) in active markets for identical assets or liabilities. This level includes listed equity securities and debt instruments on exchanges (for example, PSE, Philippine Dealing and Exchange Corp., etc.).
• Level 2 - Inputs other than quoted prices included within Level 1 that are observable for the asset or liability, either directly (that is, as prices) or indirectly (that is, derived from prices). This level includes the majority of the over-the-counter (OTC) derivative contracts. The primary source of input parameters like LIBOR yield curve or counterparty credit risk is Bloomberg.
• Level 3 - Inputs for the asset or liability that are not based on observable market data (unobservable inputs). This level includes equity investments and debt instruments with significant unobservable components. This hierarchy requires the use of observable market data when available. The BPI Group considers relevant and observable market prices in its valuations where possible. The BPI Group has no assets or liabilities classified under Level 3 as at December 31, 2019 and 2018.
29.3.10 Interest income and expense Interest income and expense are recognized in profit or loss for all interest-bearing financial instruments using the effective interest method. The effective interest method is a method of calculating the amortized cost of a financial asset or a financial liability and of allocating the interest income or interest expense over the relevant period. The effective interest rate is the rate that exactly discounts estimated future cash payments or receipts through the expected life of the financial instrument or, when appropriate, a shorter period to the net carrying amount of the financial asset or financial liability. When calculating the effective interest rate, the BPI Group estimates cash flows considering all contractual terms of the financial instrument but does not consider future credit losses. The calculation includes all fees paid or received between parties to the contract that are an integral part of the effective interest rate, transaction costs, and all other premiums or discounts. Once a financial asset or a group of similar financial assets have been written down as a result of an impairment loss, interest income is recognized using the rate of interest used to discount the future cash flows for the purpose of measuring impairment loss. 29.3.11 Dividend income Dividend income is recognized in profit or loss when the BPI Group’s right to receive payment is established. 29.3.12 Offsetting of financial instruments Financial assets and liabilities are offset and the net amount reported in the statements of condition when there is a legally enforceable right to offset the recognized amounts and there is an intention to settle on a net basis, or realize the asset and settle the liability simultaneously.

(90)
As at December 31, 2019 and 2018, there are no financial assets and liabilities presented at net amounts due to offsetting. 29.3.13 Cash and cash equivalents Cash and cash equivalents consist of Cash and other cash items, Due from BSP, Due from other banks, and Interbank loans receivable and securities purchased under agreements to resell with maturities of less than three months from the date of acquisition and that are subject to insignificant risk of changes in value. 29.3.14 Repurchase and reverse repurchase agreements Securities sold subject to repurchase agreements (‘repos’) are reclassified in the financial statements as pledged assets when the transferee has the right by contract or custom to sell or repledge the collateral; the counterparty liability is included in deposits from banks or deposits from customers, as appropriate. The difference between sale and repurchase price is treated as interest and accrued over the life of the agreements using the effective interest method. Securities purchased under agreements to resell (‘reverse repos’) are recorded as loans and advances to other banks and customers and included in the statements of condition under “Interbank loans receivable and securities purchased under agreements to resell”. Securities lent to counterparties are also retained in the financial statements. 29.4 Consolidation The subsidiaries financial statements are prepared for the same reporting year as the consolidated financial statements. Refer to Note 1 for the list of the Parent Bank’s subsidiaries. (a) Subsidiaries Subsidiaries are all entities over which the BPI Group has control. The BPI Group controls an entity when it is exposed to, or has rights to, variable returns from its involvement with the entity and has the ability to affect those returns through its power over the entity. The BPI Group also assesses existence of control where it does not have more than 50% of the voting power but is able to govern the financial and operating policies by virtue of de-facto control. De-facto control may arise in circumstances where the size of the BPI Group’s voting rights relative to the size and dispersion of holdings of other shareholders give the BPI Group the power to govern the financial and operating policies. Subsidiaries are fully consolidated from the date on which control is transferred to the BPI Group. They are de-consolidated from the date that control ceases. The BPI Group applies the acquisition method of accounting to account for business combinations. The consideration transferred for the acquisition of a subsidiary is the fair values of the assets transferred, the liabilities incurred to the former owners of the acquiree and the equity interests issued by the BPI Group. The consideration transferred includes the fair value of any asset or liability resulting from a contingent consideration arrangement. Acquisition-related costs are expensed as incurred. Identifiable assets acquired and liabilities and contingent liabilities assumed in a business combination are measured initially at their fair values at the acquisition date. On an acquisition-by-acquisition basis, the BPI Group recognizes any non-controlling interest in the acquiree either at fair value or at the non-controlling interest’s proportionate share of the acquiree’s identifiable net assets. If the business combination is achieved in stages, the acquisition date carrying value of the acquirer’s previously held equity interest in the acquiree is remeasured to fair value at the acquisition date through profit or loss. Any contingent consideration to be transferred by the BPI Group is recognized at fair value at the acquisition date. Subsequent changes to the fair value of the contingent consideration that is deemed to be an asset or liability is recognized in accordance with PFRS 9 either in profit or loss or as a change to other comprehensive income. Contingent consideration that is classified as equity is not re-measured, and its subsequent settlement is not accounted for within equity.

(91)
The excess of the aggregate of the consideration transferred, the amount of any non-controlling interest in the acquiree and the acquisition-date fair value of any previous equity interest in the acquiree over the fair value of the BPI Group’s share of the identifiable net assets acquired is recorded as goodwill. If the total of consideration transferred, non-controlling interest recognized and previously held interest measured is less than the fair value of the net assets of the subsidiary acquired in the case of a bargain purchase, the difference is recognized directly in profit or loss. Inter-company transactions, balances and unrealized gains on transactions between group companies are eliminated. Unrealized losses are also eliminated. Accounting policies of subsidiaries have been changed where necessary to ensure consistency with the policies adopted by the BPI Group, except for the pre-need subsidiary which follows the provisions of the PNUCA as allowed by the SEC. When the BPI Group ceases to have control, any retained interest in the entity is re-measured to its fair value at the date when control is lost, with the change in carrying amount recognized in profit or loss. The fair value is the initial carrying amount for purposes of subsequently accounting for the retained interest as an associate, joint venture or financial asset. In addition, any amounts previously recognized in other comprehensive income in respect of that entity are accounted for as if the BPI Group had directly disposed of the related assets or liabilities. This may mean that amounts previously recognized in other comprehensive income are reclassified to profit or loss. (b) Transactions with non-controlling interests Transactions with non-controlling interests that do not result in loss of control are accounted for as equity transactions - that is, as transactions with the owners in their capacity as owners. For purchases from non-controlling interests, the difference between any consideration paid and the relevant share acquired of the carrying value of net assets of the subsidiary is recorded in equity. Gains or losses on disposals to non-controlling interests are also recorded in equity. Interests in the equity of subsidiaries not attributable to the Parent Bank are reported in consolidated equity as non-controlling interests. Profits or losses attributable to non-controlling interests are reported in the statements of income as net income (loss) attributable to non-controlling interests. (c) Associates Associates are all entities over which the BPI Group has significant influence but not control, generally accompanying a shareholding of between 20% and 50% of the voting rights. Investments in associates in the consolidated financial statements are accounted for using the equity method of accounting. Under the equity method, the investment is initially recognized at cost and the carrying amount is increased or decreased to recognize the investor’s share of the profit or loss of the investee after the date of acquisition. The BPI Group’s investment in associates includes goodwill identified on acquisition (net of any accumulated impairment loss). If the ownership interest in an associate is reduced but significant influence is retained, a proportionate share of the amounts previously recognized in other comprehensive income is reclassified to profit or loss where appropriate. The BPI Group’s share of its associates’ post-acquisition profits or losses is recognized in profit or loss, and its share of post-acquisition movements in reserves is recognized in other comprehensive income. The cumulative post-acquisition movements are adjusted against the carrying amount of the investment. When the BPI Group’s share of losses in an associate equals or exceeds its interest in the associate, including any other unsecured receivables, the BPI Group does not recognize further losses, unless it has incurred legal or constructive obligations or made payments on behalf of the associate.

(92)
The BPI Group determines at each reporting date whether there is any objective evidence that the investment in the associate is impaired. If this is the case, the BPI Group calculates the amount of impairment as the difference between the recoverable amount of the associate and its carrying value and recognizes the amount adjacent to ‘share of profit (loss) of an associate’ in profit or loss. Unrealized gains on transactions between the BPI Group and its associates are eliminated to the extent of the BPI Group’s interest in the associates. Unrealized losses are also eliminated unless the transaction provides evidence of an impairment of the asset transferred. Accounting policies of associates have been changed where necessary to ensure consistency with the policies adopted by the BPI Group. 29.5 Investments in subsidiaries and associates Investments in subsidiaries and associates in the Parent Bank’s separate financial statements are accounted for using the cost method in accordance with PAS 27. Under this method, income from investment is recognized in profit or loss only to the extent that the investor receives distributions from accumulated profits of the investee arising after the acquisition date. Distributions received in excess of such profits are regarded as a recovery of investment and are recognized as reduction of the cost of the investment. The Parent Bank recognizes a dividend from a subsidiary or associate in profit or loss in its separate financial statements when its right to receive the dividend is established. The Parent Bank determines at each reporting date whether there is any indicator of impairment that the investment in the subsidiary or associate is impaired. If this is the case, the Parent Bank calculates the amount of impairment as the difference between the recoverable amount and carrying value and the difference is recognized in profit or loss. Investments in subsidiaries and associates are derecognized upon disposal or when no future economic benefits are expected to be derived from the subsidiaries and associates at which time the cost and the related accumulated impairment loss are removed in the statements of condition. Any gains and losses on disposal is determined by comparing the proceeds with the carrying amount of the investment and recognized in profit or loss. 29.6 Segment reporting Operating segments are reported in a manner consistent with the internal reporting provided to the chief executive officer who allocates resources to, and assesses the performance of the operating segments of the BPI Group. All transactions between business segments are conducted on an arm’s length basis, with intra-segment revenue and costs being eliminated upon consolidation. Income and expenses directly associated with each segment are included in determining business segment performance. In accordance with PFRS 8, the BPI Group has the following main banking business segments: consumer banking, corporate banking and investment banking. Its insurance business is assessed separately from these banking business segments (Note 3). 29.7 Bank premises, furniture, fixtures and equipment Land and buildings comprise mainly of branches and offices. All bank premises, furniture, fixtures and equipment are stated at historical cost less accumulated depreciation. Historical cost includes expenditure that is directly attributable to the acquisition of an asset which comprises its purchase price, import duties and any directly attributable costs of bringing the asset to its working condition and location for its intended use. Subsequent costs are included in the asset’s carrying amount or are recognized as a separate asset, as appropriate, only when it is probable that future economic benefits associated with the item will flow to the BPI Group and the cost of the item can be measured reliably. All other repairs and maintenance are charged to profit or loss during the year in which they are incurred.

(93)
Land is not depreciated. Depreciation for buildings and furniture and equipment is calculated using the straight-line method to allocate cost or residual values over the estimated useful lives of the assets, as follows:
Building 25-50 years Furniture and equipment 3-5 years Equipment for lease 2-8 years
Leasehold improvements are depreciated over the shorter of the lease term (ranges from 5 to 10 years) and the useful life of the related improvement (ranges from 5 to 10 years). Major renovations are depreciated over the remaining useful life of the related asset. The assets’ residual values and useful lives are reviewed, and adjusted if appropriate, at each reporting date. Assets are reviewed for impairment whenever events or changes in circumstances indicate that the carrying amount may not be recoverable. An asset’s carrying amount is written down immediately to its recoverable amount if the asset’s carrying amount is greater than its estimated recoverable amount. The recoverable amount is the higher of an asset’s fair value less costs to sell and value in use. There are no bank premises, furniture, fixtures and equipment that are fully impaired as at December 31, 2019 and 2018. An item of Bank premises, furniture, fixtures and equipment is derecognized upon disposal or when no future economic benefits are expected to arise from the continued use of the asset. Any gain or loss arising on derecognition of the asset (calculated as the difference between the net disposal proceeds and the carrying amount of the item) is included in profit or loss in the period the item is derecognized. 29.8 Investment properties Properties that are held either to earn rental income or for capital appreciation or both, and that are not significantly occupied by the BPI Group are classified as investment properties. Transfers to, and from, investment property are made when, and only when, there is a change in use, evidenced by: (a) Commencement of owner-occupation, for a transfer from investment property to owner-occupied property; (b) Commencement of development with a view of sale, for a transfer from investment property to real properties
held-for-sale and development; (c) End of owner occupation, for a transfer from owner-occupied property to investment property; or (d) Commencement of an operating lease to another party, for a transfer from real properties held-for-sale and
development to investment property. Transfers to and from investment property do not result in gain or loss. Investment properties comprise land and building. Investment properties are measured initially at cost, including transaction costs. Subsequent to initial recognition, investment properties are stated at cost less accumulated depreciation and impairment losses, if any. Depreciation on investment property is determined using the same policy as applied to Bank premises, furniture, fixtures, and equipment. Impairment test is conducted when there is an indication that the carrying amount of the asset may not be recovered. An impairment loss is recognized for the amount by which the property’s carrying amount exceeds its recoverable amount, which is the higher of the property’s fair value less costs to sell and value in use. An item of investment property is derecognized upon disposal or when no future economic benefits are expected to arise from the continued use of the asset. Any gains and losses arising on derecognition of the asset (calculated as the difference between the net disposal proceeds and the carrying amount of the item) is included in profit or loss in the period the item is derecognized.

(94)
29.9 Foreclosed assets Assets foreclosed shown as Assets held for sale in the statements of condition are accounted for at the lower of cost and fair value less cost to sell similar to the principles of PFRS 5. The cost of assets foreclosed includes the carrying amount of the related loan. Impairment loss is recognized for any subsequent write-down of the asset to fair value less cost to sell. Foreclosed assets not classified as Assets held for sale are accounted for in any of the following classification using the measurement basis appropriate to the asset as follows: (a) Investment property is accounted for using the cost model under PAS 40; (b) Bank-occupied property is accounted for using the cost model under PAS 16; and (c) Financial assets are accounted for under PFRS 9.
29.10 Intangible assets (a) Goodwill Goodwill represents the excess of the cost of an acquisition over the fair value of the BPI Group’s share in the net identifiable assets of the acquired subsidiary/associate at the date of acquisition. Goodwill on acquisitions of subsidiaries is included under Other assets, net in the statements of condition. Goodwill on acquisitions of associates is included in Investments in subsidiaries and associates. Separately recognized goodwill is carried at cost less accumulated impairment losses. Gains and losses on the disposal of a subsidiary/associate include carrying amount of goodwill relating to the subsidiary/associate sold. Goodwill is an indefinite-lived intangible asset and hence not subject to amortization. Goodwill is allocated to cash-generating units for the purpose of impairment testing. Each cash-generating unit is represented by each primary reporting segment. Goodwill impairment reviews are undertaken annually or more frequently if events or changes in circumstances indicate a potential impairment. The carrying value of goodwill is compared to the recoverable amount, which is the higher of value in use and the fair value less costs to sell. Any impairment is recognized immediately as an expense and is not subsequently reversed. (b) Contractual customer relationships Contractual customer relationships acquired in a business combination are recognized at fair value at the acquisition date. The contractual customer relationships have finite useful lives of ten years and are carried at cost less accumulated amortization. Amortization is calculated using the straight-line method over the expected life of the customer relationship. Contractual customer relationships are included under Other assets, net in the statements of condition. (c) Computer software Acquired computer software licenses are capitalized on the basis of the costs incurred to acquire and bring to use the specific software. These costs are amortized on a straight-line basis over the expected useful lives (three to five years). Computer software is included under Other assets, net in the statements of condition.

(95)
Costs associated with maintaining computer software programs are recognized as an expense as incurred. Development costs that are directly attributable to the design and testing of identifiable and unique software products controlled by the BPI Group are recognized as intangible assets when the following criteria are met:
• it is technically feasible to complete the software product so that it will be available for use;
• management intends to complete the software product and use or sell it; • there is an ability to use or sell the software product;
• it can be demonstrated how the software product will generate probable future economic benefits;
• adequate technical, financial and other assets to complete the development and to use or sell the software product are available; and
• the expenditure attributable to the software product during its development can be reliably measured.
Directly attributable costs that are capitalized as part of the software product include the software development employee costs and an appropriate portion of relevant overheads. Other development expenditures that do not meet these criteria are recognized as an expense when incurred. Development costs previously recognized as an expense are not recognized as an asset in a subsequent period. 29.11 Impairment of non-financial assets Assets that have indefinite useful lives - for example, goodwill or intangible assets not ready for use - are not subject to amortization and are tested annually for impairment and more frequently if there are indicators of impairment. Assets that have definite useful lives are subject to amortization and are reviewed for impairment whenever events or changes in circumstances indicate that the carrying amount may not be recoverable. An impairment loss is recognized for the amount by which the asset’s carrying amount exceeds its recoverable amount. The recoverable amount is the higher of an asset’s fair value less costs to sell and value in use. For purposes of assessing impairment, assets are grouped at the lowest levels for which there are separately identifiable cash flows (cash-generating units). Non-financial assets other than goodwill that suffered impairment are reviewed for possible reversal of impairment at each reporting date. 29.12 Borrowings and borrowing costs The BPI Group’s borrowings consist mainly of bills payable and other borrowed funds. Borrowings are recognized initially at fair value, which is the issue proceeds, net of transaction costs incurred. Borrowings are subsequently carried at amortized cost; any difference between the proceeds (net of transaction costs) and the redemption value is recognized in profit or loss over the period of the borrowings using the effective interest method. Borrowing costs that are directly attributable to the acquisition, construction, or production of a qualifying asset are capitalized as part of the cost of the asset. All other borrowing costs are expensed as incurred. The BPI Group has no qualifying asset as at December 31, 2019 and 2018. Borrowings derecognized when the obligation specified in the contract is discharged, cancelled, or expired. The difference between the carrying amount of a financial liability that has been extinguished or transferred to another party and the consideration paid, including any non-cash assets transferred or liabilities assumed, is recognized in the Statements of Income as other income. 29.13 Fees and commission income The BPI Group has applied PFRS 15 where revenue is recognized when (or as) The BPI Group satisfies a performance obligation by transferring a promised good or service to a customer (i.e. an asset). An asset is transferred when (or as) the customer obtains control of that asset. The recognition of revenue can be either over time or at a point in time depending on when the performance obligation is satisfied.

(96)
When control of a good or service is transferred over time, that is, when the customer simultaneously receives and consumes the benefits, the BPI Group satisfies the performance obligation and recognizes revenue over time. Otherwise, revenue is recognized at the point in time at the point of transfer control of the good or service to the customer. Variable consideration is measured using either the expected value method or the most likely amount method depending on which method the BPI Group expects to better predict the amount of consideration to which it will be entitled. This is the estimated amount of variable consideration, or the portion, if any, of that amount for which it is highly probable that a significant reversal in the amount of cumulative revenue recognized will not occur. Where there is a single performance obligation, the transaction price is allocated in its entirety to that performance obligation. Where there are multiple performance obligations, the transaction price is allocated to the performance obligation to which it relates based on stand-alone selling prices. The BPI Group recognizes revenue based on the price specified in the contract, net of the estimated rebates/discounts and include variable consideration, if there is any. Accumulated experience is used to estimate and provide for the discounts and revenue is only recognized to the extent that it is highly probable that a significant reversal will not occur. The BPI Group does not expect to have any contracts where the period between the transfer of the promised goods or services to the customer and payment by the customer exceeds one year. As a consequence, the BPI Group does not adjust any of the transaction prices for the time value of money. There are no warranties and other similar obligation and refunds agreed with customers. Commission and fees arising from negotiating or participating in the negotiation of a transaction for a third party (i.e. the arrangement of the acquisition of shares or other securities, or the purchase or sale of businesses) are recognized on completion of underlying transactions. Portfolio and other management advisory and service fees are recognized based on the applicable service contracts, usually on a time-proportionate basis. Asset management fees related to investment funds are recognized ratably over the period in which the service is provided. 29.14 Credit card income Credit card arrangements involve numerous contracts between various parties. The BPI Group has determined that the more significant contracts within the scope of PFRS 15 are (1) the contract between the BPI Group and the credit card holder (‘Cardholder Agreement’) under which the BPI Group earn miscellaneous fees (e.g., annual membership fees, late payment fees, foreign exchange fees, etc.) and (2) an implied contract between the BPI Group and merchants who accept the credit cards in connection with the purchase of their goods and/or services (‘Merchant Agreement’) under which the BPI Group earn interchange fees. The Cardholder Agreement obligates the BPI Group, as the card issuer, to perform activities such as process redemption of loyalty points by providing goods, services, or other benefits to the cardholder; provide ancillary services such as concierge services, travel insurance, airport lounge access and the like; process late payments; provide foreign exchange services and others. The amount of fees stated in the contract represents the transaction price for that performance obligation. The implied contract between the BPI Group and the merchant results in the BPI Group receiving an interchange fee from the merchant. The interchange fee represents the transaction price associated with the implied contract between the BPI Group and the merchant because it represents the amount of consideration to which the BPI Group expects to be entitled in exchange for transferring the promised service (i.e., purchase approval and payment remittance) to the merchant. The performance obligation associated with the implied contract between the BPI Group and the merchant is satisfied upon performance and simultaneous consumption by the customer of the underlying service. Therefore, a portion of the interchange fee is allocated to the performance obligations based on stand-alone transaction price and revenue is recognized when these performance obligations are satisfied.

(97)
29.15 Foreign currency translation (a) Functional and presentation currency Items in the financial statements of each entity in the BPI Group are measured using the currency of the primary economic environment in which the entity operates (the “functional currency”). The financial statements are presented in Philippine Peso, which is the Parent Bank’s functional and presentation currency. (b) Transactions and balances Foreign currency transactions are translated into the functional currency using the exchange rates prevailing at the dates of the transactions or valuation where items are remeasured. Foreign exchange gains and losses resulting from the settlement of such transactions and from the translation at year-end exchange rates of monetary assets and liabilities denominated in foreign currencies are recognized in profit or loss. Non-monetary items measured at historical cost denominated in a foreign currency are translated at exchange rates as at the date of initial recognition. Non-monetary items in a foreign currency that are measured at fair value are translated using the exchange rates at the date when the fair value is determined. Changes in the fair value of monetary securities denominated in foreign currency classified as financial assets at FVOCI are analyzed between translation differences resulting from changes in the amortized cost of the security, and other changes in the carrying amount of the security. Translation differences are recognized in profit or loss, and other changes in carrying amount are recognized in other comprehensive income. Translation differences on non-monetary financial instruments, such as equities held at fair value through profit or loss, are reported as part of the fair value gain or loss recognized under “Trading gain/loss on securities” in the statements of income. Translation differences on non-monetary financial instruments, such as equities classified as financial assets at FVOCI, are included in Accumulated other comprehensive income (loss) in the capital funds. (c) Foreign subsidiaries The results and financial position of BPI’s foreign subsidiaries (none of which has the currency of a hyperinflationary economy) that have a functional currency different from the presentation currency are translated into the presentation currency as follows:
• assets and liabilities are translated at the closing rate at reporting date;
• income and expenses are translated at average exchange rates (unless this average is not a reasonable approximation of the cumulative effect of the rates prevailing on the transaction dates, in which case income and expenses are translated at the dates of the transactions); and
• all resulting exchange differences are recognized as a separate component (Currency translation differences) of Accumulated other comprehensive income (loss) in the capital funds. When a foreign operation is sold, such exchange differences are recognized in profit or loss as part of the gain or loss on sale.
29.16 Accrued expenses and other liabilities Accrued expenses and other liabilities are recognized in the period in which the related money, goods or services are received or when a legally enforceable claim against the BPI Group is established. 29.17 Provisions for legal or contractual obligations Provisions are recognized when all of the following conditions are met: (i) the BPI Group has a present legal or constructive obligation as a result of past events; (ii) it is probable that an outflow of resources will be required to settle the obligation; and (iii) the amount has been reliably estimated. Provisions are not recognized for future operating losses. Where there are a number of similar obligations, the likelihood that an outflow will be required in settlement is determined by considering the class of obligations as a whole. A provision is recognized even if the likelihood of an outflow with respect to any one item is included in the same class of obligations may be small.

(98)
Provisions are measured at the present value of the expenditures expected to be required to settle the obligation using a pre-tax rate that reflects the current market assessments of the time value of money and the risk specific to the obligation. The increase in the provision due to the passage of time is recognized as interest expense. 29.18 Income taxes (a) Current income tax Income tax payable is calculated on the basis of the applicable tax law in the respective jurisdiction and is recognized as an expense for the year except to the extent that current tax is related to items (for example, current tax on financial assets at FVOCI) that are charged or credited in other comprehensive income or directly to capital funds. The BPI Group has substantial income from its investment in government securities subject to final withholding tax. Such income is presented at its gross amount and the final tax paid or withheld is included in Provision for income tax - Current. (b) Deferred income tax
Deferred income tax is recognized on temporary differences arising between the tax bases of assets and liabilities and their carrying amounts in the financial statements. The deferred income tax is not accounted for if it arises from initial recognition of an asset or liability in a transaction, other than a business combination, that at the time of the transaction affects neither accounting nor taxable profit or loss. Deferred income tax is determined using tax rates (and laws) that have been enacted or substantively enacted at the reporting date and are expected to apply when the related deferred income tax asset is realized or the deferred income tax liability is settled. Deferred income tax assets are recognized for all deductible temporary differences, carry-forward of unused tax losses (net operating loss carryover or NOLCO) and unused tax credits (excess minimum corporate income tax or MCIT) to the extent that it is probable that future taxable profit will be available against which the temporary differences, unused tax losses and unused tax credits can be utilized. Deferred income tax liabilities are recognized in full for all taxable temporary differences except to the extent that the deferred tax liability arises from the initial recognition of goodwill. The BPI Group reassesses at each reporting date the need to recognize a previously unrecognized deferred income tax asset. Deferred income tax assets are recognized on deductible temporary differences arising from investments in subsidiaries, and associates and joint arrangements only to the extent that it is probable the temporary difference will reverse in the future and there is sufficient taxable profit available against which the temporary difference can be utilized. Deferred income tax liabilities are provided on taxable temporary differences arising from investments in subsidiaries, and associates and joint arrangements, except for deferred income tax liability where the timing of the reversal of the temporary difference is controlled by the BPI Group and it is probable that the temporary difference will not reverse in the foreseeable future. Generally, the BPI Group is unable to control the reversal of the temporary difference for associates except when there is an agreement in place that gives the BPI Group the ability to control the reversal of the temporary difference. Deferred income tax assets and liabilities are offset when there is a legally enforceable right to offset current tax assets against current tax liabilities and when the deferred income taxes assets and liabilities relate to income taxes levied by the same taxation authority on either the taxable entity or different taxable entities where there is an intention to settle the balances on a net basis.

(99)
29.19 Employee benefits (a) Short-term benefits The BPI Group recognizes a liability net of amount already paid and an expense for services rendered by employees during the accounting period. Short-term benefits given by to its employees include salaries and wages, social security contributions, short-term compensated absences and bonuses, and non-monetary benefits. Short-term employee benefit obligations are measured on an undiscounted basis and are expensed as the related service is provided. (b) Defined benefit retirement plan The BPI Group has a defined benefit plan that shares risks among entities within the group. A defined benefit plan is a pension plan that defines an amount of pension benefit that an employee will receive on retirement, usually dependent on one or more factors such as age, years of service and compensation. The liability recognized in the statements of condition in respect of defined benefit pension plan is the present value of the defined benefit obligation at the reporting date less the fair value of plan assets. The defined benefit obligation is calculated annually by independent actuaries using the projected unit credit method. The present value of the defined benefit obligation is determined by discounting the estimated future cash outflows using interest rates of government bonds that are denominated in the currency in which the benefits will be paid, and that have terms to maturity approximating the terms of the related pension liability. Defined benefit costs comprise of service cost, net interest on the net defined benefit liability or asset and remeasurements of net defined liability or asset. Service costs which include current service costs, past service costs and gains or losses on non-routine settlements are recognized as expense in the statements of income. Past service costs are recognized when the plan amendment or curtailment occurs. Net interest on the net defined benefit liability or asset is the change during the period in the net defined benefit liability or asset that arises from the passage of time which is determined by applying the discount rate based on government bonds to the net defined benefit liability or asset. Net interest on the net defined benefit liability or asset is recognized as interest income or expense in the statements of income. Actuarial gains and losses arising from experience adjustments and changes in actuarial assumptions are charged or credited to equity in other comprehensive income in the period in which they arise. For individual financial reporting purposes, the unified plan assets are allocated among the BPI Group entities based on the level of the defined benefit obligation attributable to each entity to arrive at the net liability or asset that should be recognized in the individual financial statements. (c) Defined contribution retirement plan The BPI Group also maintains a defined contribution plan that covers certain full-time employees. Under its defined contribution plan, the BPI Group pays fixed contributions based on the employees’ monthly salaries. The BPI Group, however, is covered under RA No. 7641, otherwise known as The Philippine Retirement Pay Law, which provides for its qualified employees a defined benefit minimum guarantee. The defined benefit minimum guarantee is equivalent to a certain percentage of the monthly salary payable to an employee at normal retirement age with the required credited years of service based on the provisions of RA No. 7641. Accordingly, the BPI Group accounts for its retirement obligation under the higher of the defined benefit obligation relating to the minimum guarantee and the obligation arising from the defined contribution plan.

(100)
For the defined benefit minimum guarantee plan, the liability is determined based on the present value of the excess of the projected defined benefit obligation over the projected defined contribution obligation at the end of the reporting period. The defined benefit obligation is calculated annually by a qualified independent actuary using the projected unit credit method. The BPI Group and Parent Bank determine the net interest expense (income) on the net defined benefit liability (asset) for the period by applying the discount rate used to measure the defined benefit obligation at the beginning of the annual period to the net defined benefit liability (asset) then, taking into account any changes in the net defined benefit liability (asset) during the period as a result of contributions and benefit payments. Net interest and other expenses related to the defined benefit plan are recognized in the statements of income. The defined contribution liability is measured at the fair value of the defined contribution assets upon which the defined contribution benefits depend, with an adjustment for margin on asset returns, if any, where this is reflected in the defined contribution benefits. Actuarial gains and losses arising from the remeasurements of the net defined contribution liability are recognized immediately in the other comprehensive income. (d) Share-based compensation The BPI Group engages in equity-settled share-based payment transactions in respect of services received from certain employees. The fair value of the services received is measured by reference to the fair value of the shares or share options granted on the date of the grant. The cost of employee services received in respect of the shares or share options granted is recognized in profit or loss (with a corresponding increase in reserve in capital funds) over the period that the services are received, which is the vesting period. The fair value of the options granted is determined using option pricing models which take into account the exercise price of the option, the current share price, the risk-free interest rate, the expected volatility of the share price over the life of the option and other relevant factors. When the stock options are exercised, the proceeds received, net of any directly attributable transaction costs, are credited to share capital (par value) and share premium for the excess of exercise price over par value. (e) Profit sharing and bonus plans The BPI Group recognizes a liability and an expense for bonuses and profit-sharing, based on a formula that takes into consideration the profit attributable to the Parent Bank’s shareholders after certain adjustments. The BPI Group recognizes a provision where contractually obliged or where there is a past practice that has created a constructive obligation. 29.20 Capital funds Share capital consists of common shares which are instruments that meet the definition of “equity”. Share premium includes any premiums or consideration received in excess of the total par value of the common shares issued. Incremental costs directly attributable to the issue of new shares are treated as a deduction from the share issuance proceeds.

(101)
29.21 Earnings per share (EPS) Basic EPS is calculated by dividing income applicable to common shares by the weighted average number of common shares outstanding during the year with retroactive adjustments for stock dividends. In case of a rights issue, an adjustment factor is being considered for the weighted average number of shares outstanding for all periods before the rights issue. Diluted EPS is computed in the same manner as basic EPS, however, net income attributable to common shares and the weighted average number of shares outstanding are adjusted for the effects of all dilutive potential common shares. 29.22 Dividends on common shares Dividends on common shares are recognized as a liability in the BPI Group’s financial statements in the period in which the dividends are approved by the BOD. 29.23 Fiduciary activities The BPI Group commonly acts as trustee and in other fiduciary capacities that result in the holding or placing of assets on behalf of individuals, trusts, retirement benefit plans and other institutions. These assets and income arising thereon are excluded from these financial statements, as they are not assets of the BPI Group (Note 24). 29.24 Leases 29.24.1 BPI Group is the lessee Until December 31, 2018, leases of bank premises, furniture and fixtures and equipment were classified as either finance leases or operating leases. From January 1, 2019, the BPI Group recognizes leases as a right-of-use asset and a corresponding liability at the date at which the leased asset is available for use. From January 1, 2019 (PFRS 16) Assets and liabilities arising from a lease are initially measured on a present value basis. The interest expense is recognized in the statements of income over the lease period so as to produce a constant periodic rate of interest on the remaining balance of the liability for each period. The right-of-use asset is depreciated over the shorter of the asset's useful life and the lease term on a straight-line basis. Measurement of lease liabilities Lease liabilities include the net present value of the following lease payments:
• fixed payments (including in-substance fixed payments), less any lease incentives receivable
• variable lease payment that are based on an index or a rate • amounts expected to be payable by the lessee under residual value guarantees
• the exercise price of a purchase option if the lessee is reasonably certain to exercise that option
• payments of penalties for terminating the lease, if the lease term reflects the lessee exercising that option Lease payments to be made under reasonably certain extension options are also included in the measurement of the liability. The lease payments are discounted using the interest rate implicit in the lease. If that rate cannot be readily determined, which is generally the case for leases in the BPI Group, the lessee’s incremental borrowing rate is used, being the rate that the individual lessee would have to pay to borrow the funds necessary to obtain an asset of similar value to the right-of-use asset in a similar economic environment with similar terms, security and conditions.

(102)
To determine the incremental borrowing rate, the BPI Group:
• where possible, uses recent third-party financing received by the individual lessee as a starting point, adjusted to reflect changes in financing conditions since third party financing was received,
• uses a build-up approach that starts with a risk-free interest rate adjusted for credit risk for leases held for entities which do not have recent third party financing, and
• makes adjustments specific to the lease (i.e. term, currency and security). Lease payments are allocated between principal and interest expense. The interest expense is charged to profit or loss over the lease period so as to produce a constant periodic rate of interest on the remaining balance of the liability for each period. Measurement of right-of-use assets Right-of-use assets are measured at cost comprising the following:
• the amount of the initial measurement of lease liability, • any lease payments made at or before the commencement date less any lease incentives received,
• any initial direct costs, and
• restoration costs. Right-of-use assets are generally depreciated over the shorter of the asset's useful life and the lease term on a straight-line basis. If the BPI Group is reasonably certain to exercise a purchase option, the right-of-use asset is depreciated over the underlying asset’s useful life. Extension and termination options In determining the lease term, management considers all facts and circumstances that create an economic incentive to exercise an extension option, or not exercise a termination option. Extension options (or periods after termination options) are only included in the lease term if the lease is reasonably certain to be extended (or not terminated). The lease term is reassessed if an option is actually exercised (or not exercised) or the BPI Group becomes obliged to exercise (or not exercise) it. The assessment of reasonable certainty is revised only if a significant event or a significant change in circumstances occurs, which affects this assessment, and that is within the control of the lessee. Short-term leases and leases of low-value assets Payments associated with short-term leases and leases of low-value assets are recognized on a straight-line basis as an expense in the statements of income. Short-term leases are leases with a lease term of 12 months or less. Low-value assets comprise IT-equipment and small items of office furniture.

(103)
Accounting policies prior to January 1, 2019 (PAS 17) Operating lease Leases in which a significant portion of the risks and rewards of ownership are retained by another party, the lessor, are classified as operating leases. Payments, including prepayments, made under operating leases (net of any incentives received from the lessor) are charged to “Occupancy and equipment-related expenses” in the statements of income on a straight-line basis over the period of the lease. When an operating lease is terminated before the lease period has expired, any payment required to be made to the lessor by way of penalty is recognized as an expense in the period in which the termination takes place.
Finance lease Leases of assets, where the BPI Group has substantially all the risks and rewards of ownership, are classified as finance leases. Finance leases are capitalized at the commencement of the lease at the lower of the fair value of the leased property and the present value of the minimum lease payments. Each lease payment is allocated between the liability and finance charges so as to achieve a constant rate on the finance balance outstanding. The interest element of the finance cost is charged to profit or loss over the lease period so as to produce a constant periodic rate of interest on the remaining balance of the liability for each period.
29.24.2 BPI Group is the lessor PFRS 16 substantially carries forward the lessor accounting requirements in PAS 17. Accordingly, the BPI Group (as a lessor) continues to classify its leases as operating leases or finance leases. Operating lease Properties (land and building) leased out under operating leases are included in “Investment properties” in the statements of condition. Rental income under operating leases is recognized in profit or loss on a straight-line basis over the period of the lease. Finance lease When assets are leased out under a finance lease, the present value of the lease payments is recognized as a receivable. The difference between the gross receivable and the present value of the receivable is recognized as unearned finance income. Lease income under finance lease is recognized over the term of the lease using the net investment method before tax, which reflects a constant periodic rate of return. 29.25 Insurance and pre-need operations (a) Non-life insurance The more significant accounting policies observed by the non-life insurance subsidiaries follow: (a) gross premiums written from short-term insurance contracts are recognized at the inception date of the risks underwritten and are earned over the period of cover in accordance with the incidence of risk using the 24th method; (b) acquisition costs are deferred and charged to expense in proportion to the premium revenue recognized; reinsurance commissions are deferred and deducted from the applicable deferred acquisition costs, subject to the same amortization method as the related acquisition costs; (c) a liability adequacy test is performed which compares the subsidiaries’ reported insurance contract liabilities against current best estimates of all contractual future cash flows and claims handling, and policy administration expenses as well as investment income backing up such liabilities, with any deficiency immediately charged to profit or loss; (d) amounts recoverable from reinsurers and loss adjustment expenses are classified as assets, with an allowance for estimated uncollectible amounts; and (e) financial assets and liabilities are measured following the classification and valuation provisions of PFRS 9.

(104)
(b) Pre-need The more significant provisions of the PNUCA as applied by the pre-need subsidiary follow: (a) premium income from sale of pre-need plans is recognized as earned when collected; (b) costs of contracts issued and other direct costs and expenses are recognized as expense when incurred; (c) pre-need reserves which represent the accrued net liabilities of the subsidiary to its plan holders are actuarially computed based on standards and guidelines set forth by the Insurance Commission; the increase or decrease in the account is charged or credited to other costs of contracts issued in profit or loss; and (d) insurance premium reserves which represent the amount that must be set aside by the subsidiary to pay for premiums for insurance coverage of fully paid plan holders, are actuarially computed based on standards and guidelines set forth by the Insurance Commission. 29.26 Related party relationships and transactions Related party relationship exists when one party has the ability to control, directly, or indirectly through one or more intermediaries, the other party or exercises significant influence over the other party in making financial and operating decisions. Such relationship also exists between and/or among entities which are under common control with the reporting enterprise, or between and/or among the reporting enterprise and its key management personnel, directors, or its shareholders. In considering each possible related party relationship, attention is directed to the substance of the relationship, and not merely the legal form. 29.27 Comparatives Except when a standard or an interpretation permits or requires otherwise, all amounts are reported or disclosed with comparative information. Where PAS 8 applies, comparative figures have been adjusted to conform with changes in presentation in the current year. There were no changes to the presentation made during the year. 29.28 Subsequent events (or Events after the reporting date) Post year-end events that provide additional information about the BPI Group’s financial position at the reporting date (adjusting events) are reflected in the financial statements. Post year-end events that are not adjusting events are disclosed in the notes to financial statements when material.

(105)
Note 30 - Supplementary information required under BSP Circular No. 1074 Presented below are the additional information required by BSP Circular No. 1074 issued on January 8, 2020. This information is presented for BSP reporting purposes and is not required in the basic financial statements. (i) Basic Quantitative Indicators of Financial Performance The key financial performance indicators follow (in %):
Consolidated Parent
2019 2018 2019 2018
Return on average equity - Daily average1 10.97 10.21 12.51 8.50 - Simple average2 11.12 10.75 12.62 9.15
Return on average assets - Daily average3 1.38 1.20 1.50 0.96 - Simple average4 1.34 1.16 1.45 0.92
Net interest margin - Daily average5 3.35 3.11 3.18 2.87 - Simple average6 3.26 2.96 3.08 2.72
1Net income divided by average total equity for the period indicated. Average equity is based on the daily average balance of equity for the years ended December 31, 2019 and 2018. 2Net income divided by average total equity for the period indicated. Average total equity is based on the year-on-year balance of equity for the years ended December 31, 2019 and 2018. 3Net income divided by average total assets as at period indicated. Average total assets is based on the daily average balance of total assets as at December 31, 2019 and 2018. 4Net income divided by average total assets as at period indicated. Average total assets is based on the year-on-year balance of total assets as at December 31, 2019 and 2018. 5Net interest income divided by average interest-earning assets. Average interest earning assets is based on the daily average balance of interest earning assets as at December 31, 2019 and 2018. 6Net interest income divided by average interest-earning assets. Average interest earning assets is based on the year-on-year balance of interest earning assets as at December 31, 2019 and 2018.
(ii) Description of Capital Instrument Issued The Bank considers its common shares as capital instrument for purposes of calculating its capital adequacy ratio as at December 31, 2019 and 2018. (iii) Significant Credit Exposures Details of the loans and advances portfolio as to concentration as to industry/economic sector (in %) at December 31 are as follows:
Consolidated Parent
2019 2018 2019 2018
Real estate, renting and other related activities 24.37 23.08 17.77 16.00 Manufacturing 15.30 16.28 18.09 19.26 Wholesale and retail trade 11.35 12.56 12.61 14.16 Consumer 8.32 8.16 5.46 5.08 Financial institutions 10.81 6.09 12.90 7.28 Agriculture and forestry 2.87 2.74 3.40 3.26 Others 26.98 31.09 29.77 34.96
100.00 100.00 100.00 100.00

(106)
(iv) Breakdown of Total Loans Details of the loans and advances portfolio at December 31 as to collateral (amounts net of unearned discounts and exclusive of accrued interest receivable) are as follows:
Consolidated Parent
2019 2018 2019 2018
(In Millions of Pesos) Secured loans Real estate mortgage 278,099 220,587 138,607 97,170 Chattel mortgage 57,037 54,731 10 9 Others 148,385 172,503 146,038 168,260
483,521 447,821 284,655 265,439 Unsecured loans 1,008,129 921,523 958,768 870,521
1,491,650 1,369,344 1,243,423 1,135,960
Other collaterals include hold-out deposits, mortgage trust indentures, government and corporate securities and bonds, quedan/warehouse receipts, standby letters of credit, trust receipts, and deposit substitutes. Breakdown of performing and non-performing loans net of allowance for credit losses are as follows:
Consolidated Parent
2019 2018 2019 2018
(In Millions of Pesos) Performing loans 1,389,937 1,301,712 1,166,932 1,090,776 Non-performing loans (NPL) 24,835 25,391 12,174 12,985
1,414,772 1,327,103 1,179,106 1,103,761
Allowance attributable to performing loans (10,106) (9,882) (6,780) (6,947) Allowance attributable to NPL (15,304) (12,597) (11,685) (8,861)
(25,410) (22,479) (18,465) (15,808)
Net carrying amount 1,389,362 1,304,624 1,160,641 1,087,953
BSP Circular 941, Amendments to Regulations on Past Due and Non-Performing Loans, states that loans, investments, receivables, or any financial asset shall be considered non-performing, even without any missed contractual payments, when it is considered impaired under existing accounting standards, classified as doubtful or loss, in litigation, and if there is an evidence that full repayment of principal and interest is unlikely without foreclosure of collateral. All other loans, even if not considered impaired, shall be considered non-performing if any principal and/or interest are unpaid for more than ninety (90) days from contractual due date, or accrued interests for more than ninety (90) days have been capitalized, refinanced, or delayed by agreement. Microfinance and other small loans with similar credit characteristics shall be considered non-performing after contractual due date or after they have become past due. Restructured loans shall be considered non-performing. However, if prior to restructuring, the loans were categorized as performing, such classification shall be retained.

(107)
(v) Information on Related Party Loans Details of DOSRI loans are as follows:
Consolidated Parent
2019 2018 2019 2018
(In Millions of Pesos) Outstanding DOSRI loans 10,026 8,248 10,024 8,248
In percentages (%)
Consolidated Parent
2019 2018 2019 2018
% to total outstanding loans and advances 0.67 0.60 0.81 0.73 % to total outstanding DOSRI loans Unsecured DOSRI loans 17.30 21.51 17.30 21.51 Past due DOSRI loans 0.01 - 0.01 - Non-performing DOSRI loans - - - -
The BPI Group is in full compliance with the General Banking Act and the BSP regulations on DOSRI loans. At December 31, 2019 and 2018. (vi) Secured Liabilities and Assets Pledged as Security The Bank’s Bills payable (Note 16) include mainly funds borrowed from various banking institutions which were lent out to customers of the BPI Group in accordance with the agreed financing programs. Loans and advances arising from these financing programs serve as collateral for this liability (Note 10). (vii) Contingencies and commitments arising from off-balance sheet items Credit risk exposures arising from off-balance sheet items, which are mainly composed of undrawn loan commitments and unused letters of credit, are as follows:
Consolidated Parent
2019 2018 2019 2018
(In Millions of Pesos) Gross carrying amount 404,584 235,904 397,949 233,481 Loss allowance* (650) (753) (619) (723)
Carrying amount 403,934 235,151 397,330 232,758
*Included in “Miscellaneous liabilities” in Note 17

(108)
Note 31 - Supplementary information required by the Bureau of Internal Revenue On December 28, 2010, Revenue Regulations (RR) No. 15-2010 became effective and amended certain provisions of RR No. 21-2002 prescribing the manner of compliance with any documentary and/or procedural requirements in connection with the preparation and submission of financial statements and income tax returns. Section 2 of RR No. 21-2002 was further amended to include in the Notes to Financial Statements information on taxes, duties and license fees paid or accrued during the year in addition to what is mandated by PFRS. Below is the additional information required by RR No. 15-2010 that is relevant to the Parent Bank. This information is presented for purposes of filing with the Bureau of Internal Revenue (BIR) and is not a required part of the basic financial statements. (i) Documentary stamp tax
Documentary stamp taxes paid through the Electronic Documentary Stamp Tax System for the year ended December 31, 2019 consist of:
(In Millions of Pesos) Amount
Deposit and loan documents 7,208 Trade finance documents 584 Mortgage documents 432 Shares of stocks - Others 6
8,230
(ii) Withholding taxes
Withholding taxes paid/accrued and/or withheld for the year ended December 31, 2019 consist of:
(In Millions of Pesos)
Amount
Paid Accrued Total
Income taxes withheld on compensation 1,751 205 1,956 Withholding tax on withdrawal from decedent’s account 10 2 12 Final income taxes withheld on interest on deposits and yield on
deposit substitutes 3,435 252 3,687 Final income taxes withheld on income payment 642 374 1,016 Creditable income taxes withheld (expanded) 460 44 504 Fringe benefit tax 121 29 150 VAT withholding tax 39 5 44
6,458 911 7,369

(109)
(iii) All other local and national taxes
All other local and national taxes paid/accrued for the year ended December 31, 2019 consist of:
(In Millions of Pesos)
Amount
Paid Accrued Total
Gross receipts tax 3,711 382 4,093 Real property tax 119 - 119 Municipal taxes 209 - 209 Others 9 - 9
4,048 382 4,430
Local and national taxes imposed by the government which are incurred under the normal courses of business are part of “Taxes and Licenses” within Other Operating Expense (Note 21).
(iv) Tax cases and assessments As at reporting date, the Parent Bank has pending cases filed in courts, with the tax authorities contesting certain tax assessments, and for various claims for tax refund. Management is of the opinion that the ultimate outcome of the said cases will not have a material impact on the financial statements of the Parent Bank.

�������������
���� �����$M�&��$�"#�M"� �"$M
%1-M#E>+61>7,-BDM(<,ME1-M �>(B,M>/M �2B-+E>CDM�����$��������$ ��$%1-M�8>*-M%>J-B�M ����� #EC--EM+>B<-CM ���� �I-<G-M�><2/(+3>M�>*(7M�4EL�M $(0G40M�4ELM
�����!$��$!��$�"��!$ ��$!��$ ��� �����!��$ ���������$�!�!����! $
��������
#+U+JJG[�BH/J[�[�G[��N3[ >GGJ[ #/N[";C+[%>+Z+[�N3[�V/DS/[-GLF/K[��O3[(PJ//Q[�GE40+-<G[!?G,+@[�5QY�[)+1T61[����[&3=A7HI8E/M[
*/>�[ ���[���[���[� [ +X�[���[���[���[����[W./@G9RN/-GC�H3[
�$��%'�['/2[#G[ �[(��[�--J/.:N+N9GE[ #G�[ �� '��[
'-M 1(I-M(G,2E-,M E1-M+><D>94,(E-,M /2<(<+4(9MDE(E-:-<EDM >/M�7>*-M%-7-+>;�M �<+�M (<,M#G*D4,2(C4-DM�E1-M ��8>*-M �C>G?��M J14+1M +>;?B2D-M E1-M +><D>82,(E-,M DE(E-:-<EDM >/M /2<(<+2(7M ?>D4E2><M )DM (EM�-+-:*-BM � �M �� �M (<,M �� ��M (<,M E1-M +><D>72,(E-,M DE(E-:-<EDM >/M +>:?B-1-<D4I-M 2<+>;-�M+><D>82,(E-,MDE(E-;-<EDM>/M+1(<0-DM2<M-AG4ELM(<,M+><D>82,(E-,MDE(E-:-<EDM>/M+(D1M/7>JDM/>CM-(+1M>/M E1-ME1C--ML-(CDM4<ME1-M?-C4>,M-<,-,M�-+-:*-CM � �M �� ��M (<,ME1-M<>E-DM E>ME1-M+><D>74,(E-,M/4<(<+2(7MDE(E-:-<ED�M 2<+7G,4<0M(MDG;:(CLM>/MD40<4/4+(<EM(++>G<E4<0M?>84+2-DM
�<M>GCM>?4<2><�M E1-M(++>:?(<L2<0M+><D>74,(E-,M/4<(<+2(8MDE(E-:-<EDM?B-D-<EM/(4C8L�M 4<M(77M:(E-C4(7MC-D?-+ED�M E1-M/4<(<+2(7M?>D2E4><M >/ME1-M�7>*-M�B>G?M(DM (EM�-+-:*-CM� �M �� �M(<,M�� ��M (=,M 2EDM/2<(<+4(7M ?-C/>B;(<+-�M (<,M +(D1M /8>JDM />BM -(+1M >/M E1-M E1C--M L-(BDM 2<M E1-M ?-C4>,M -<,-,M�-+-;*-BM� �M �� ��M 2<M(++>C,(<+-MJ4E1M 1284??2<-M�2<(<+2(7M"-?>BE2<0M#E(<,(B,DM � �"#D�M
���������������
'-M +><,G+E-,M >GBM (G,2EDM 2<M (++>C,(<+-M J4E1M 1272??2<-DM #E(<,(B,DM ><M �G,2E4<0M �!#��M�GBMC-D?><D2*474E2-DMG<,-CME1>D-MDE(<,(C,DM(C-M/GBE1-CM ,-D+B2*-,M2<M E1-M�G,2E>BD�M"-D?><D4*272E2-DM/>BME1-M�G,2EM>/ME1-M�><D>84,(E-,M�2<(<+2(8M#E(E-;-<EDMD-+E4><M>/M>GBMC-?>BEM '-M(B-M4<,-?-=,-<EM>/M E1-M �8>*-M �B>G?M 2<M(++>C,(<+-MJ2E1M E1-M �>,-M >/M �E12+DM />CM B>/-DD2><(7M�++>G<E(<EDM 4<M E1-M 1474??4<-DM ��>,-M>/M �E14+D�M E>0-E1-CMJ2E1M-E12+(7MB-AH4B-:-<EDME1(EM(C-MC-7-I(<EME>M>GCM(G,4EM>/ME1-M +><D>74,(E-,M /2<(<+2(7MDE(E-:-<EDM 4<M E1-M 1474??4<-D�M (<,MJ-M1(I-M /G7/288-,M>GCM>E1-CM-F12+(9MB-D?><D4*274E4-DM 2<M(++>B,(<+-MJ4E1M E1-D-MC-AG4B-;-<EDM)<,M E1-M�>,-M>/M�E14+D�M '-M*-72-I.ME1(EME1-M (G,4EM -I2,-<+-M J-M 1(I-M >*E(2<-,M 2DM DG//4+2-<EM (<,M (??B>?B4(E-M E>M ?C>I4,-M (M *(D4DM />BM >GCM>?2<4><�M
�#$�"��!$��!!�� $
�-LM (G,2EM :(EE-BDM (B-M E1>D-M ;(EE-CDM E1(E�M 2<M >GBM ?C>/-DD4><(7M 5G,0:-<E�M J-B-M >/M :>DEMD20<2/2+(<+-M 4<M >GBM (G,4EM >/M E1-M +><D>82,(E-,M /2<(<+2(7M DE(E-:-<EDM >/M E1-M +GBB-<EM ?.B4>,M$1-D-M :(EE-BDM J-C-M (,,B-DD-,M 4<M E1-M +><E-KEM >/M >GCM (G,2EM >/M E1-M +><D>74,(E-,M /4<)<+2(7MDE(E-;-<EDM (DM (MJ1>8-�M (<,M 4<M />B:2<0M >GCM >?4<4><M E1-B-><�M (<,MJ-M ,>M <>EM ?B>I2,-M (M D-@(C(E-M>?2<2><M><ME1-D-M;(EE-CDM
���������� � ������ ����������������������������������� ��������������������������������������������������������������������������������������

�%M -#%7@.'/%#M@*%M'9349G-7)M2%JM�C#.@M6�@@%>?�M
�������� ���������
�%D%7C%M >%!9)[email protected]�M �?.#%M '>96M �%-7)M �7M-7*%>%7@M -7#C?@>JM>.?2�M *�?M �%%7M -#%7@-'-%#M�?M�M2%JM�C#-@M6�@@%>M=>.6�>-3JM#C%M@9M@*%M?-)7.'.!�7@MD94C6%M 9'M @>�7?�!@-97?M =>9!%??%#M @*>9C)*MD�>-9C?M ?J?@%6?�M *%�DJM >%4.�7!%M 97M �C@96�@%#M=>9!%??%?M �7#M !97@>94?M 9D%>M >%!9>#-7)M 9'M@>�7?�[email protected]?M�7#M!96=4%I-@JM9'M@*%M 9=%>�@-97M9'M�/34.7)M ?J?@%6?MC?%#�M
�*%M #.?!39?C>%?M 97M @*%M �!!9C7@-7)M '9>M >%D%7C%M>%!9)7.@-97M -7M �!!9>#�7!%M G-@*M ����M � �M��������� �� � ��������� ����� ����� ������ �>%M.7!4C#%#M -7M �9@%M ��� �M �������� ������������ @9M@*%M!97?94-#�@%#M'-7�7!.�3M?@�@%6%7@?�M
���� ���� ���� ��������������������������
�7M @*%M !9C>?%M 9'M 9C>M �C#.@M 9'M @*%M �39 %M �>9C=�?M!97?93-#�@%#M '/7�7!.�4M ?@�@%6%7@?�M G%M *�D%M=%>'9>6%#�M �697)M 9@*%>?�M @*%M '9439H.7)M �C#-@M=>9!%#C>%?M .7M >%?=97?%M @9M @*%M >%D%7C%M>%!9)[email protected]�M
L �%M9�@�/7%#M�7MC7#%>?@�7#-7)M9'M @+%M >%D%7C%>%!9)[email protected] =94-!JM -7M �!!9>#�7!%MG-@,M ����M � �7#M @*%M >%3�@%#M �C?.7%??M =>9!%??%?�M -7!4C#-7)�7M C7#%>?@�7#.7)M 9'M @*%M >%4�@%#M �8'9>6�@.97�%!*7939)JM ����M %7D->976%7@
L �%M %D�4C�@%#M @*%M #%?-)7M �7#M 9=%>�@.7)%''%[email protected]%7%??M 9'M @*%M �%7%>�4M �8'9>6�@/97�%!*7949)JM�97@>93?�M �?MG%44M�?M@*%M�==4-!�@-97!97@>94?M 9'M @*%M >%4�@%#M ��M ?J?@%6?�M 9D%>M @*%!�=@C>%M �7#M >%!9>#.7)M 9'M @*%M >%D%7C%@>�7?�!@-97?�M �7M #9-7)M ?9�M G%M -7D95E%#M 9C>M ��M?=%!.�3-?@?M @9M �??.?@M .7M @*%M �C#-@M 9'M �C@96�@%#!97@>94?�M -7!3C#.7)M .7@%>'�!%M !97@>95?M �%@G%%7��M�==3-!�@/97?�
L �%M %D�3C�@%#M@*%M�C?-7%??M =>9!%??M !97@>93?M /7=4�!%M 9D%>M @*%M -7.@.�@-97M �7#M �C@*:>.K�@-97M 9'M>�@%M !*�7)%?�M @*%M .7@>9#C!@-97M 9'M 7%GM =4�7?M�7#M .7=C@M 9'M @*-?M /7'9>6�@.97M .7@9M @*%M �.34.7)?J?@%6?�
L �%M =%>'9>6%#M @%?@M 97M @*%M �"!C>�!JM 9'!C?@96%>M �-44?M 97M �M ?�6=4%M ��?-?M (;>M %I-?@-7)=>9#C!@?M �?M G%44M �?M '9>M 7%GM =>9#C!@?M-7@>9#C!%#M-7M@*%MJ%�>
L �?M=�>@M9'M@*%M ?C�?@�7@-D%M@%?@?�MG%M @%?@%#M2%J>%!97!.3-�@.97M C?%#M �JM 6�7�)%6%7AM @9M �??%??@*%M !96=4%@%7%??M �7#M �!!C>�!JM <'M >%D%7C%'>96M�C?-7%??M ?C==9>@M ?J?@%6?M @9MB*%M)%7%>�44%#)%>
L �%M =%>'9>6%#M �7�3J@.!�3M >%D.%GM 9F%>M =>%=�-#�7#M =9?@=�.#M >%D%7C%?M ��?%#M 97M C7#%>4J-7)#�@�M �7#M !%>@�-7M >%4�@.97?*-=?M �?M G%34M �?@%?@/7)�M 97M �M ?�6=4%M ��?.?�M @*%M �!!C>�!JM 9'�#0C?@6%7@?M 97M >%D%7C%?M %�>7%$M -7!4C#.7)@*9?%M '>96M!�>>.%>?M�7#M!97@%7@M=>:D.#%>?M�?M�>%?C3@M9'M 7%)9@.�@.97?�
L �%M=>9'.3%#M @*%M6�7C�3M19C>7�3M %7B>.%?M =9?@%#@9M >%D%7C%M �!!9C7@?M �7#M @%?@%#M ?C==9>@-7)%D.#%7!%M@9M -#%7@.'JM�7JMC7C?C�4M .@&6?
� ������������������������������������������������������������ ������������������ ��� ������������������ ���������� �������

��������"��"��� " ���"������
#-*J�28'*J�<8A:J-%>J%)8:?*)J �!"J ��J ��� � �%*++*(?.C*J �%6A%<GJ �J �� ��J D-/(-J <*:2%(*)J ?-*J -/2.::/6*J �((8A6?/6,J "?%6)%<)>J ��J ��� � �%#-*J %)8:?/86J 8+J �!"J �J <*;A/<*>J :83/(GJ*2*(?/86>J.6(2A).6,J?-*J)*?*<4/6%?/86J8+J>:*(/+.(J%>>A4:?/86>J %6)J 1*GJ 0A),*4*6?>J %6)J*>?.4%?*>J <*2%?/6,J ?8�J %486,J 8?-*<>�J)*?*<4.6%?/86J8+J?-*J>(8:*J8+J �!"J ��J)A<%?.86J8+J ?-*J 3*%>*>�J 2*%>*J :%G4*6?>J %6)J )/>(8A6?J<%?*>�J #-*J%>>*>>4*6?J8+J?-*J/4:%(?J8+J?-*J6*DJ>?%6)%<)J/>J>.,6.+.(%6?J?8J8A<J%A).?�J �86>/)*</6,J?-*J %'8C*�J %>J D*22J %>J >.6(*J ?-*J �38'*J �<8A:J%)8:?*)J ?-*J >?%6)%<)J +8<J ?-*J :A<:8>*J 8+J ?-*J:<*:%<%?.86J 8+J ?-*J (86>83/)%?*)J +/6%6(/%2J>?%?*4*6?>J +8<J ?-*J +/<>?J ?.4*�J ?-*J.4:3*4*6?%?.86J8+J �!"J �JD%>J (86>.)*<*)J %>J%J1*GJ%A)/?J4%??*<�J
�6J %)8:?/6,J �!"J ��J ?-*J �38'*J �<8A:�>J�%6%,*4*6?J )*(.)*)J ?8J A>*J ?-*J 48)/+/*)J<*?<8>:*(?/C*J%::<8%(-J
#-*J ).>(28>A<*>J <*2%?*)J ?8J ?-*J .4:%(?J 8+J ?-*J.6.?.%2J %::2/(%?/86J 8+J �!"J �J %<*J /6(2A)*)J /6J�8?*J �� �J ���!���% ��% ����% ���% ��� � �%�����!�#�% ��"��$%��% �����% %6)J ?-*J )/>(38>A<*>J<*3%?*)J ?8J <.,-?�8+�A>*J %>>*?>J %6)J 2*%>*J3.%'/2/?.*>J %<*J /6(2A)*)J /6J �8?*J ��J ��� �%����!���! �% ?8J ?-*J (86>82.)%?*)J +/6%6(.%3J>?%?*5*6?>J
#-*J )/>(28>A<*>J 86J %((8A6?/6,J :82.(/*>J <*2%?*)J?8J ?-*J %::3.(%?.86J 8+J �!"J �J /6(3A)/6,J 1*GJ0A),*4*6?>J %6)J 1*GJ *>?/4%?*>J %<*J /6(2A)*)J .6J�8?*J����J ��� � �% ?8J ?-*J(86>82/)%?*)J+/6%6(/%2J>?%?*4*6?>J
��!"���"������"!��"���������"��" � �" � ���"
�6J ?-*J (8A<>*J 8+J 8A<J %A).?J 8+J ?-*J �38'*J �<8A:�>J(86>82.)%?*)J +.6%6(/%2J >?%?*4*6?>�J D*J -%C*J:*<+8<4*)�J %486,J 8?-*<>�J ?-*J +8228E.6,J %A).?J:<8(*)A<*>J /6J <*>:86>*J ?8J ?-*J %)8:?/86J 8+J �!"J ��J
I $*J 8'?%/6*)J%6J A6)*<>?%6).6,J %6)J *C%3A%?*)�38'*J �<8A:�>J %)8:?/86J %6)J /4:2*5*6?%?/86:<8(*>>J%>JD*23J%>J>*3*(?.86J%6)J%::2/(%?/86J 8+%((8A6?/6,J:<.6(/:3*>J.6J%((8<)%6(*J D/?-J �!" ��J .6(3A)/6,J %6J A6)*<>?%6)/6,J %6)%>>*>>4*6?J8+J?-*J1*GJ(86?<82>J/6J ?-/>J<*>:*(?
I $*J *C%2A%?*)J 4%6%,*4*6?J 0A),*5*6?>J %6)*>?.4%?*>�J >:*(/+/(%22GJ ?-*J %>>*>>4*6?J 8+J ?-*>(8:*J8+J(86?<%(?>J>A'0*(?J?8J%((8A6?.6,JA6)*< �!"J ��J )*?*<5/6%?.86J 8+J ?-*J )A<%?.86J 8+J2*%>*>J %6)J <*2%?*)J 3*%>*J :%G4*6?>�J ).>(8A6?<%?*>J%6)J%::2/*)J:<%(?.(%2J*F:*).*6?>�
I $*J:*<+8<4*)J ?*>?J8+J?-*J<*3%?*)J �#J>G>?*4J/6<*2%?/86J?8J%((8A6?.6,J+8<J(86?<%(?>JB6)*<J �!" �
I $*J :*<+8<4*)J ?*>?J 8+J )*?%/2>J ?8J C*</+GJ ?-*%((A<%(GJ 8+J:%<%4*?*<>J A>*)J %6)J &((A<%(GJ /6?-*J(%2(A2%?/86J8+J 3*%>*J3/%'/3.?/*>J%6)J</,-?�8+HA>*J%>>*?>
I $*J :*<+8<4*)J ?*>?J 8+J (84:2*?*6*>>J 8+/)*6?/+.(%?.86J8+J (86?<%(?>J /6J>(8:*J 9+J �!"J �
����������" ����" ����" ���" ������������" ���������" ���������" ���" � �������" ������"�������"
�%6%,*4*6?J />J <*>:86>.'2*J +8<J ?-*J 8?-*<J /6+8<4%?/86J #-*J 8?-*<J .6+8<4%?/86J (84:</>*>J ?-*J.6+8<4%?/86J/6(3A)*)J/6J ?-*J"*(A</?.*>J%6)J�F(-%6,*J�844/>>/86J �"���J �8<4J����"J ��*+/6.?/C*J�6+8<4%?.86J "?%?*4*6?��J "��J �8<4J ���J %6)J �66A%2J !*:8<?J +8<J ?-*J G*%<J *7)*)J�*(*4'*<J� �J�� ��J'A?J)8*>J68?J/6(3A)*J?-*J(86>82/)%?*)J+/6%6(.%3J>?%?*4*6?>J%6)J8A<J%A).?8<>�J<*:8<?J?-*<*86�J#-*J "��J �8<4J ����"J ��*+.6/?/C*J �6+8<4%?/86J"?%?*4*6?��J "��J �8<4J ���J %6)J�66A%3J !*:8<?J +8<J ?-*J G*%<J *6)*)J�*(*4'*<J � �J �� �J%<*J*F:*(?*)J ?8J '*J %C%.2%'3*J ?8J A>J %+?*<J?-*J)%?*J8+J?-/>J%A).?8<>�J<*:8<?J
�A<J 8:.6/86J86J ?-*J(86>82.)%?*)J +.6%6(.%3J >?%?*4*6?>J)8*>J68?J(8C*<J ?-/>J8?-*<J .6+8<4%?/86J%6)JD*J)8J68?J*F:<*>>J%6GJ +8<4J8+J%>>A<%6(*J(86(3A>/86J?-*<*86�J
�6J (866*(?/86J D/?-J 8A<J %A).?>J 8+J ?-*J (86>82.)%?*)J +.6%6(.%2J >?%?*4*6?>�J 8A<J <*>:86>/'/2/?GJ .>J ?8J<*%)J?-*J8?-*<J.6+8<4%?/86J.)*6?/+.*)J%'8C*JD-*6J/?J'*(84*>J%C%/3%'2*J%6)�J /6J)8/6,J>8�J (86>/)*<JD-*?-*<J ?-*J 8?-*<J /6+8<4%?/86J .>J 4%?*<.%22GJ /6(86>/>?*6?J D/?-J ?-*J (86>83/)%?*)J +.6%6(.%2J>?%?*4*6?>J 8<J 8A<J 168D2*),*J 8'?%.6*)J /6J ?-*J %A)/?�J 8<J 8?-*<D.>*J %::*%<>J ?8J '*J 4%?*=/%33GJ4/>>?%?*)�J �+�J '%>*)J86J?-*J86J?-*JD8<1JD*J-%C*J:*<+8<4*)�JD*J(86(3A)*J?-%?J?-*<*J.>J%J4%@*<.%2J4/>>?%?*5*6?J8+J?-/>J8?-*<J/6+8<4%?/86�JD*J%<*J<*;A.<*)J?8J<*:8<?J?-%?J +%(?J$*J -%C*J68?-/7,J?8J<*:8<?J.6J?-/>J <*,%<)�J
� ����������� ��������������������������������������������� ����� ���������� ��������������� ������� ����� ������� ����

����������������" ��" ��������" � " ����" ����� " !���" �� ������" ���" ���"������� �� " �������"���������"
��1�#�.�1;G &9G 8�96519'�+�G 58G ;%�G 68�6�8�;'51G �1�G �'8G 68�9�1;�;&51G 5 G ;%�9�G �5195+&��;��G '1�1�'�+G 9;�;�.�1;9G '1G ���58��1��G A';%G ���9�G �1�G 58G 9?�%G &1;�81�,G �51;85,G �9G .�1�#�/�1;G��;�8.'1�9G&9G1���99�8DG;5G �1��,�G;%�G68�6�8�;'51G5 G�5195,'��;��G &1�1�'�,G9;�;�.�1;9G;%�;G�8�G 8��G 85.G.�;�8'�,G.&99;�;�.�1;�G A%�;%�8G�?�G;5G 8�?�G58G�8858�G
1G68�6�8'1#G;%�G�5195+&��;��G '1�1�'�,G9;�;�.�1;9�G .�1�#�.�1;G'9G8�96519&�-�G 58G�99�99'1$G ;%�G�,5��G �85?6�9G ��&+';DG ;5G �51;&1?�G �9G �G #5&1#G �51��81�G �'9�+59'1#�G �9G �66+'���+��G .�;;�89G 8�+�;��G;5G #5'1#G�51��81G �1�G ?9'1#G ;%�G #5'1#G�51��81G��9&9G 5 G ���5?1;&1#G ?1+�99G.�1�#�.�1;G�';%�8G'1;�1�9G;5G+&7?&��;�G;%�G�+5��G�85?6G58G;5G���9�G56�8�;&519�G58G%�9G15G8��,&9;&�G�+;�81�;'@�G�?;G;5G�5G95�G
�%59�G �%�8#��G A';%G #5@�81�1��G �8�G 8�96519'�+�G 58G 5@�89��'1#G ;%�G �+5��G �85?6�9G &1�1�&�,G8�658;&1#G685��99�G
�� ������" ����������������"���"���"�� ��"��"���"������� �� " �������"���������"
�?8G 5�(��;&@�9G �8�G ;5G 5�;�'1G 8��951��+�G �99?8�1��G ��5?;G A%�;%�8G ;%�G �5195,'��;��G &1�1�'�,G9;�;�.�1;9G�9G�GA%5+�G�8�G 8��G 85.G.�;�8'�,G.'99;�;�.�1;�G A%�;%�8G�?�G;5G 8�?�G58G �8858�G �1�G;5G '99?�G�1G �?�';589�G8�658;G ;%�;G '1�+?��9G5?8G 56&1&51�G ���951��+�G�99?8�1��G &9G �G %'#%G ,�@�,G 5 G�99?8�1���G �?;G '9G15;G �G#?�8�1;��G ;%�;G�1G �?�&;G �51�?�;��G &1G���58��1��GA';%G ���9G A&,+G �+B�D9G��;��;G�G.�;�8&�+G.&99;�;�.�1;GA%�1G&;G�C&9;9�G �'99;�;�/�1;9G��1G�8'9�G 85.G 8�?�G58G �8858G �1�G�8�G �519&��8��G.�;�8'�+G ' �G '1�'@'�?�,,DG 58G &1G ;%�G �##8�#�;��G ;%�DG �5?+�G8��951��,DG��G �C6��;��G;5G '1 +?�1��G;%�G ��515.&�G���'9'519G5 G?9�89G ;�*�1G51G ;%�G ��9&9G5 G ;%�9�G�5195,'��;��G &1�1�&�+G9;�;�.�1;9�G
�9G 6�8;G 5 G �1G �?�';G '1G ���58��1��G A';%G ����G A�G �C�8�'9�G 685 �99'51�,G )?�#.�1;G �1�G .�'2;�'1G685 �99&51�,G9*�6;&�'9.G;%85?#%5?;G;%�G�?�&;�G ��G�,95�G
F ��1;' DG �1�G �99�99G ;%�G 8&9*9G 5 G .�;�8'�+G .'99;�;�.�1;G 5 G ;%�G �5195+'��;��G &1�1�&�,9;�;�.�1;9�GA%�;%�8G�?�G ;5G 8�?�G58G�8858�G��9'#1G�1�G6�8 58.G�?�&;G685���?8�9G8�96519'@�;5G;%59�G8'9*9�G �1�G5�;�'1G�?�&;G�@'��1��G;%�;G&9G9? &�&�1;G�1�G�668568'�;�G;5G685@&��G�G ��9'9 58G 5?8G 56'1'51�G �%�G 8'9*G 5 G 15;G ��;��;&1#G �G .�;�8&�+G .&99;�;�.�1;G 8�9?,;'1#G 85.G 8�?�G &9%'#%�8G;%�1G 58G51�G 8�9?+;&1#G 85.G�8858�G �9G 8�?�G.�DG &1@5,@�G�5,,?9'51�G 58#�8D�G &1;�1;'51�,5.'99'519�G.&98�68�9�1;�;'519�G58G ;%�G5@�88'��G5 G &1;�81�+G�51;85,�
F ��;�'1G �1G ?1��89;�1�&1#G 5 G &1;�81�+G �51;85,G 8�+�@�1;G ;5G ;%�G �?�';G '1G 58��8G ;5G ��9G �?�';685���?8�9G ;%�;G�8�G�668568&�;�G'1G;%�G�&8�?.9;�1��9�G �?;G15;G 58G;%�G6?8659�G5 G�C68�:9'1#�1G56'1&51G51G;%�G� ��;&@�1�99G5 G;%�G�,5��G�85?6�9G'1;�81�+G �51;85+�
F @�+?�;�G ;%�G �668568&�;�1�99G 5 G ���5?1;'1#G 65,&�'�9G ?9��G �1�G ;%�G 8��951��,�1�:9G 5 G���5?1;'1#G�9;&.�;�9G�1�G 8�+�;��G �&9�+59?8�9G.���G�DG.�1�#�.�1;�
F �51�+?��G 51G ;%�G �668568'�;�1�99G 5 G /�1�#�/�1;�9G ?9�G 5 G ;%�G #5'1#G �51��81G ��9'9G 5 G���5?1;&1#G�1��G ��9��G51G;%�G�?�&;G�@&��1��G5�;�'1���G A%�;%�8G�G.�;�8'�+G?1��8;�'1;DG�C'9;98�+�;��G;5G�@�1;9G58G�51�';&519G;%�;G.�DG��9;G9'#1& &��1;G �5?�;G51G;%�G�,5��G�85?6�9G��&+&;D;5G �51;'1?�G �9G �G#5&1#G�51��81�G GA�G �51�,?��G ;%�;G�G .�;�8'�+G ?1��8;�&1;DG �C&9;9�G A�G �8�8�7?'8��G ;5G �8�AG �;;�1;'51G &1G 5?8G �?�';58�9G 8�658>G ;5G ;%�G 8�,�;��G �&9�,59?8�9G '4G ;%�G�5195,'��;��G '1�1�&�,G 9;�;�.�1;9G 58�G ' G 9?�%G �'9�,59?8�9G �8�G '1���7?�;��G ;5G .5�' EG 5?8G56&1'51�G �?8G �51�+?9&519G �8�G ��9��G 51G ;%�G �?�';G �@&��1��G 5�;�&1��G ?6G ;5G ;%�G ��;�G 5!G 5?8�?�';589�G 8�658;�G �5A�@�8�G ?;?8�G�@�1;9G58G �51�';&519G.�DG��?9�G ;%�G �+5��G�85?6G ;5G ���9�;5G�51;'1?�G�9G�G#5'1#G�51��81�
F @�+?�;�G ;%�G 5@�8�++G 68�9�1;�;&51�G 9;8?�;?8�G �1�G �51;�1;G 5 G ;%�G �5195,&��;��G &1�1�'�+9;�;�.�1;9�G &1�+?�'1$G ;%�G �'9�+59?8�9�G �1�G A%�;%�8G ;%�G �5195+&��;��G '1�1�&�,G 9;�;�0�1;98�68�9�1;G;%�G?1��8-D&1#G;8�19��;&519G�1�G�@�1;9G'1G�G.�11�8G;%�;G��%'�@�9G �'8G68�9�1<�;'51�
F ��;�'1G9? &�&�1;G�668568&�;�G�?�&;G�@'��1��G8�#�8�&1#G;%�G &1�1�&�,G&1 58.�;&51G5 G;%�G�3;&;'�958G �?9'1�99G ��;'@';'�9G A&;%&1G ;%�G �,5��G �85?6G ;5G �C68�99G �1G 56&1'51G 51G ;%�G �5195+'��;�� '1�1�&�,G 9;�;�.�1;9�G ��G �8�G 8�96519&�+�G 58G ;%�G �&8��;&51�G 9?6�8@'9&51G�1�G6�8 58/�4��G5 ;%�G#85?6G�?�';�G ��G8�.�'1G95,�+DG8�96519'�,�G 58G5?8G�?�';G56'1&51�
��G �5..?1'��;�G A';%G ;%59�G �%�8#��G A&;%G #5@�81�1��G 8�#�8�'1#�G �.51#G 5;%�8G .�=;�89�G;%�G6+�11��G9�56�G�1�G;'.&1#G5 G;%�G�?�&;G�1�G9' '��1;G�?�&;G '1�&1#9�G &1�,?�'1#G�1DG9'$1'"'��1;G�� &�&�1�'�9G'1G&1;�81�+G �51;85+G;%�;GA�G&��1;& DG�?8'1#G5?8G�?�&;9�G
�������������������� ����������� ����������� ��������������������� ���������������������������������������������������� �� �����

05]1BOI]JLIS<45] P:IO5] 3:1M954] T=P:] 9IS5LH1H35]T<P:] 1] OP1P5F5HP] P:1P]T5] :1S5] 3IFJC=54] T=P:]L5C5S1HP] 5P:=31D] L5KR=L5F5HPO] L591L4=H9] =H45J5H45H35�] 1H4] PI] 3IFFRH<31P5] T=P:] P:5G] 1CB]L5E1P=IHO:=JO]1H4]IP:5L]F1PP5MO]P:1P]F1V]L51OIH12CV]25] P:IR9:P] PI]251M]IH] IRM] =H45J5H45H35�]1H4]T:5L5] 1JJB<312C5�] L5B1P54]O1659R1M4O�]!MIF] P:5] F1PP5LO] 3IFFRH=31P54] T<P:] P:IO5] 3:1L954] T=P:] 9IS5MH1H35�] T5] 45P5LF<H5] P;IO5]F1PP5LO] P:1P] T5L5]I6]FIOP] O<9H=6<31H35] <H] P:5] 1R4<P] I6] P:5] 3IHOIC<41P54] 6=H1H3<1C] OP1P5F5HQO]I6]P:5] 3RMM5HP] J5L=I4] 1H4] 1L5] P:5M56IL5] P:5] A5V] 1R4=P] F1PP5MO�] 05] 45O3M=25] P:5O5] F1PP5LO] <H] IRL]1R4<PILO�] M5JILP] RHC5OO] B1T] IL] L59RC1P<IH] JM53CR45O] JR2B=3] 4=O3BIORL5] 12IRP] P:5]F1PP5L] IM] T;5H�]=H] 5UPL5F5CV] L1L5] 3=L3RFOP1H35O�] T5] 45P5LF<H5] P:1P] 1]F1PP5L] O:IRC4] HIP] 25] 3IFFRH>31P54] =H]IRM] L5JILP] 2531RO5] P:5] 14S5MO5] 3IHO5KR5H35O] I6] 4I<H9] OI] TIRB4] L51OIH12BV] 25] 5UJ53P54] PI]IRPT5=9:] P:5]JR2B=3] =HP5L5OP] 25H56<PO]I6]OR3:]3IFFRH=31P<IH�].:5] 5H9195F5HP] J1LPH5L] IH] P:5] 1R4=P] M5ORBP<H9] ?H] P:<O] =H45J5H45HP] 1R4=PIMO�] M5JILP] =O]'L�]0=C6L54I]��] �1BP1W1L�]
(1S1LLI]�FJ5L]�]�I�]�*�],59?OPL1P<IH](I�]�����] S1C=4]6MIF])IS5F25M]���] ����]PI]%REV]���]����]- �]�33L54=P1P=IH](I]�����",���]<OOR54]IH]%1HR1N]���]�����] 56753P<S5]RHP=C]%1HR1LV]���]�����] #LIRJ]�]/$(]���������]
�V�]
�]@]�]8X] �]]Y]0<C6Z4I]��] �1CP�[L] \]+1MPH5L]�+�] &<35HO5](I�]�������]- �]��)�] ������,���] =OOR54]IH]�R9ROP]���] �����] 56653P<S5]RHP=E]�R9ROP]���] �����] #LIRJ]�]/$(]���������]�$,] ��) ] ������������������] =OOR54]IH]%RH5]��] �����]56653P=S5]RHP=C]%RH5]��] ����]+/,](I�]����������] <OOR54]IH] %1HR1LV]��] �����] .19R<9]�=PV]
/19R=9] �=PV�] +:<C=JJ=H5O]"52LR1MV]��] ����]
� ������ ����� ����� ����� ����� ����� ����� ��������������� ��������������� ���������� ���������� ������� ����� ������������

�����������������03/��
&�5�(�$�7�(���:�2�1�'�(�5�)�8�/���
GLOBE TELECOM, INC. AND SUBSIDIARIES CONSOLIDATED STATEMENTS OF FINANCIAL POSITION
December 31
Notes 2019 2018
(In Thousand Pesos)
ASSETS
Current Assets Cash and cash equivalents 5 8,298,092 23,226,386 Trade receivables – net 6 21,138,950 20,652,532 Contract assets and deferred contract costs – net 7 8,339,219 8,471,550 Inventories and supplies – net 9 4,713,572 4,854,939 Derivative assets – current 8 301,624 63,180 Prepayments and other current assets 10 18,948,015 16,254,796
61,739,472 73,523,383
Noncurrent Assets Property and equipment – net 11 182,662,528 169,393,768 Intangible assets and goodwill – net 12 15,553,097 13,698,269 Right of use assets – net 13 3,566,280 - Investments in associates and joint ventures 15 34,473,865 34,426,776 Deferred income tax assets – net 30 1,866,591 2,075,065 Derivative assets – net of current portion 8 125,331 2,300,186 Deferred contract costs – net of current portion 7 289,663 315,673 Other noncurrent assets 16 4,013,910 3,764,989
242,551,265 225,974,726
TOTAL ASSETS 304,290,737 299,498,109
LIABILITIES AND EQUITY
Current Liabilities Trade payables and accrued expenses 17 56,979,315 56,219,366 Contract liabilities and deferred revenues – current 7 8,764,803 8,044,308 Loans payable – current 19 12,919,898 16,758,196 Derivative liabilities – current 8 547,046 285,751 Lease liabilities - current 13 981,817 - Provisions 18 2,622,318 2,549,387 Income tax payable 30 1,761,984 1,608,646
84,577,181 85,465,654
Noncurrent Liabilities Loans payable – net of current portion 19 122,942,837 131,523,701 Contract liabilities – net of current portion 7 49,869 53,642 Deferred income tax liabilities – net 30 5,057,641 3,918,493 Derivative liabilities – net of current portion 8 291,270 25,903 Lease liabilities – non current 13 2,681,800 - Other long-term liabilities 20 7,443,142 5,367,209
138,466,559 140,888,948
Total Liabilities 223,043,740 226,354,602
Equity Capital Stock 22 8,452,995 8,445,238 Additional paid in capital 22 36,808,776 36,528,251 Cost of share-based payments 29 447,656 417,345 Other reserves 22.6 (1,766,610) 561,103 Retained earnings 22.5 37,169,604 27,167,398
Equity attributable to equity holders of the Parent 81,112,421 73,119,335 Non-controlling interest 134,576 24,172
Total Equity 81,246,997 73,143,507
TOTAL LIABILITIES AND EQUITY 304,290,737 299,498,109
See accompanying Notes to Consolidated Financial Statements.
e Globe

�/30������������������
&�5�(�$�7�(���:�2�1�'�(�5�)�8�/���
GLOBE TELECOM, INC. AND SUBSIDIARIES CONSOLIDATED STATEMENTS OF COMPREHENSIVE INCOME
For the Years Ended December 31
Notes 2019 2018 2017
(In Thousand Pesos, Except Per Share Figures)
REVENUES Service revenues 149,009,963 132,875,310 127,905,853 Nonservice revenues 17,650,374 18,297,496 7,374,878
34 166,660,337 151,172,806 135,280,731
INCOME (LOSSES) Equity share in net losses of associates and joint ventures 15 (2,554,782) (1,249,603) (846,177) Interest income 23 500,437 391,030 139,581 Gain on disposal of property and equipment – net 43,012 73,088 38,455 Gain on fair value of retained interest 15 - - 1,889,901 Other income – net 24 1,047,007 695,405 701,653
(964,326) (90,080) 1,923,413
COSTS AND EXPENSES General, selling and administrative expenses 25 64,471,409 57,742,131 56,608,922 Depreciation and amortization 26 34,143,541 30,421,721 27,512,689 Cost of inventories sold 9, 34 18,554,814 18,645,314 13,013,437 Interconnect costs 35 3,982,873 5,677,375 7,852,336 Financing costs 27 6,802,861 6,195,225 5,251,692 Impairment and other losses 28 4,913,137 4,787,644 5,423,366
132,868,635 123,469,410 115,662,442
INCOME BEFORE INCOME TAX 32,827,376 27,613,316 21,541,702
PROVISIONS FOR INCOME TAX Current 8,488,595 7,259,985 6,005,420 Deferred 2,055,024 1,727,388 452,069
30 10,543,619 8,987,373 6,457,489
NET INCOME 22,283,757 18,625,943 15,084,213
OTHER COMPREHENSIVE INCOME (LOSS)
Items that will be reclassified into profit or loss in subsequent periods:
Transactions on cash flow hedges – net (1,213,355) 863,715 139,412 Exchange differences arising from translations of
foreign investments (106,988) 28,524 (23,140) Changes in fair value of available-for-sale
investment in equity securities - - 26,000 22.6 (1,320,343) 892,239 142,272
Item that will not be reclassified into profit or loss in subsequent periods:
Changes in fair value of financial assets at fair value through other comprehensive income 440,349 151,974 -
Remeasurement gain on defined benefit plan (1,373,043) 49,709 399,993
22.6 (932,694) 201,683 399,993
TOTAL OTHER COMPREHENSIVE INCOME (2,253,037) 1,093,922 542,265
TOTAL COMPREHENSIVE INCOME 20,030,720 19,719,865 15,626,478
(Forward)
C Globe

�����������������03/��
&�5�(�$�7�(���:�2�1�'�(�5�)�8�/���
GLOBE TELECOM, INC. AND SUBSIDIARIES CONSOLIDATED STATEMENTS OF COMPREHENSIVE INCOME
For the Years Ended December 31
Notes 2019 2018 2017
(In Thousand Pesos, Except Per Share Figures)
Total net income attributable to: Equity holders of the Parent 22,269,340 18,640,740 15,065,779 Non-controlling interest 14,417 (14,797) 18,434
22,283,757 18,625,943 15,084,213
Total comprehensive income attributable to: Equity holders of the Parent 20,016,303 19,734,662 15,608,044 Non-controlling interest 14,417 (14,797) 18,434
20,030,720 19,719,865 15,626,478
Earnings Per Share Basic 31 162.96 135.91 109.22
Diluted 31 162.20 135.40 109.01
Cash dividends declared per common share 22.3 91.00 91.00 91.00
See accompanying Notes to Consolidated Financial Statements.
rt) Globe

�����������������03/��
&�5�(�$�7�(���:�2�1�'�(�5�)�8�/���
GLOBE TELECOM, INC. AND SUBSIDIARIES CONSOLIDATED STATEMENTS OF CHANGES IN EQUITY
For the Year Ended December 31, 2019
Notes
Capital Stock
(Note 22.2)
Additional Paid-in Capital
Cost of Share-Based
Payments
Other Reserves
(Note 22.6) Retained Earnings
Total Equity Attributable
to Parent Non-controlling
Interest Total
(In Thousand Pesos)
As of January 1, 2019, as previously stated 8,445,238 36,528,251 417,345 561,103 27,167,398 73,119,335 24,172 73,143,507
Adjustment on initial application of PFRS 16, net of tax 3.2 - - - - 336,464 336,464 505 336,969
As of January 1, 2019, as restated 8,445,238 36,528,251 417,345 561,103 27,503,862 73,455,799 24,677 73,480,476 Total comprehensive income for the period - - - (2,253,037) 22,269,340 20,016,303 14,417 20,030,720 Dividends on: 22.3
Common Stock - - - - (12,118,071) (12,118,071) - (12,118,071)Preferred Stock - voting - - - - (50,027) (50,027) - (50,027)
Preferred Stock – non-voting - - - - (520,060) (520,060) - (520,060)
Share-based compensation 29 - - 325,160 - - 325,160 - 325,160Exercise of stock options 22.2 499 11,354 (4,300) - - 7,553 - 7,553 Issue of shares under share-based
compensation plan 22.2 7,258 269,171 (276,429) - - - - - Forfeiture of stock option - - (14,120) - 9,884 (4,236) - (4,236)Reclassification of accumulated share in an
associate’s other comprehensive income 22.6 - - 1,101 (1,101)- -
Reclassification of fair value gain on investment in equity securities at FVOCI 22.6 - - - (75,777) 75,777 - - -
Minority buyout from subsidiary - - - - - - (536) (536) Non-controlling interest arising from
business combination - - - - - - 96,018 96,018
As of December 31, 2019 8,452,995 36,808,776 447,656 (1,766,610) 37,169,604 81,112,421 134,576 81,246,997
(Forward)
O Globe

�/30������������������
&�5�(�$�7�(���:�2�1�'�(�5�)�8�/���
GLOBE TELECOM, INC. AND SUBSIDIARIES CONSOLIDATED STATEMENTS OF CHANGES IN EQUITY
For the Year Ended December 31, 2018
Notes
Capital Stock
(Note 22)
Additional Paid-in Capital
Cost of Share-Based
Payments
Other Reserves
(Note 22.6) Retained Earnings
Total Equity Attributable
to Parent Non-controlling
Interest Total (In Thousand Pesos)
As of January 1, 2018, as previously stated 8,438,404 36,319,449 401,543 (352,375) 21,708,003 66,515,024 42,713 66,557,737 Adjustment on initial application of
PFRS 15, net of tax 3.4 - - - - 4,880,805 4,880,805 954 4,881,759 Adjustment on initial application of
PFRS 9, net of tax 3.4 - - - - (5,581,683) (5,581,683) (4,843) (5,586,526) As of January 1, 2018, as restated 8,438,404 36,319,449 401,543 (352,375) 21,007,125 65,814,146 38,824 65,852,970 Total comprehensive income for the year - - - 1,093,922 18,640,740 19,734,662 (14,797) 19,719,865 Dividends on: 22.3
Common Stock - - - - (12,104,579) (12,104,579) - (12,104,579)Preferred Stock – voting - - - - (41,752) (41,752) - (41,752)Preferred Stock – non-voting - - - - (520,060) (520,060) - (520,060)
Share-based compensation 29 - - 236,714 - - 236,714 - 236,714Issue of shares under share-based
compensation plan 22.2 6,463 202,629 (208,221) - - 871 - 871 Exercise of stock options 22.2 371 6,173 (4,862) - - 1,682 - 1,682 Forfeiture of stock options - - (7,829) - 5,480 (2,349) - (2,349) Reclassification remeasurement gains
(losses) on defined benefit plans 22.6 - - - (180,444) 180,444 - - - Non-controlling interest arising from
business combination - - - - - - 145 145
As of December 31, 2018 8,445,238 36,528,251 417,345 561,103 27,167,398 73,119,335 24,172 73,143,507 (Forward)
O Globe

�����������������03/��
&�5�(�$�7�(���:�2�1�'�(�5�)�8�/���
GLOBE TELECOM, INC. AND SUBSIDIARIES CONSOLIDATED STATEMENTS OF CHANGES IN EQUITY
For the Year Ended December 31, 2017
Notes
Capital Stock
(Note 22)
Additional Paid-in Capital
Cost of Share-Based
Payments
Other Reserves
(Note 22.6) Retained Earnings
Total Equity Attributable
to Parent Non-controlling
Interest Total
(In Thousand Pesos)
As of January 1, 2017 8,430,504 36,075,199 584,586 (1,072,925) 19,422,402 63,439,766 36,536 63,476,302 Total comprehensive income for the year - - - 542,265 15,065,779 15,608,044 18,434 15,626,478 Dividends on: 22.3
Common Stock - - - - (12,091,736) (12,091,736) - (12,091,736)Preferred Stock – voting - - - - (33,731) (33,731) - (33,731)Preferred Stock – non-voting - - - - (520,060) (520,060) - (520,060)
Share-based compensation 29 - - 104,828 - - 104,828 - 104,828Issue of shares under share-based
compensation plan 7,000 224,298 (231,298) - - - - - Exercise of stock options 900 19,952 (12,939) - - 7,913 - 7,913 Forfeiture of stock options - - (43,634) - 43,634 - - - Reclassification remeasurement gains
(losses) on defined benefit plans 22.6 - - - 178,285 (178,285) - - - Non-controlling interest adjustment arising
from subscription - - - - - - (223) (223) Non-controlling interest arising from
business combination - - - - - - (12,034) (12,034)
As of December 31, 2017 8,438,404 36,319,449 401,543 (352,375) 21,708,003 66,515,024 42,713 66,557,737
See accompanying Notes to Consolidated Financial Statements.
O Globe

�����������������03/��
&�5�(�$�7�(���:�2�1�'�(�5�)�8�/���
GLOBE TELECOM, INC. AND SUBSIDIARIES CONSOLIDATED STATEMENTS OF CASH FLOWS
For the Years Ended December 31
Notes 2019 2018 2017
CASH FLOWS FROM OPERATING ACTIVITIES (In Thousand Pesos)
Income before income tax 32,827,376 27,613,316 21,541,702 Adjustments for:
Depreciation and amortization 26 34,143,541 30,421,721 27,512,689 Impairment and other losses 28 4,913,137 4,787,644 5,423,366 Financing cost 27 6,802,861 6,195,225 5,251,692 Equity share in net losses of associates and joint ventures 15 2,554,782 1,249,603 846,177 Pension expense 29 1,161,213 593,326 621,316 Foreign exchange losses (gains) – net 24 (848,394) 900,430 (214,191) (Gain) loss on derivative instruments 24 809,540 (1,004,171) 127,708 Interest income 23 (500,437) (391,030) (139,581) Share-based compensation 29 325,160 236,714 104,828 Gain on disposal of investment in associate 15,24 (240,000) - - Gain on disposal of property and equipment (43,012) (73,088) (38,455) (Gain) loss on settlement and remeasurement of ARO 20, 24 (5,769) (27,894) 4,371 Gain on fair value of retained interest 15 - - (1,889,901)
Operating income before working capital changes 81,899,998 70,501,796 59,151,721 Changes in operating assets and liabilities:
Decrease (Increase) in: Trade Receivables – net (2,424,629) (5,791,841) (4,865,124) Inventories and supplies (572,350) (1,990,025) 914,923 Contract Assets 158,341 (784,314) - Prepayments and other current assets (5,301,967) (2,327,349) (3,386,918) Other noncurrent assets (258,528) (147,569) (1,177,991)
Increase (Decrease) in: Trade payables and accrued expenses 6,715,399 2,092,554 6,565,097 Other long-term liabilities (780,892) (1,127,092) (1,717,582) Contract Liabilities and deferred revenues 697,416 2,199,814 419,351
Cash generated from operations 80,132,788 62,625,974 55,903,477 Income taxes paid (6,090,569) (4,775,445) (5,599,215)
Net cash flows from operating activities 74,042,219 57,850,529 50,304,262
CASH FLOWS FROM INVESTING ACTIVITIES
Additions to: Property and equipment 11, 34 (50,975,224) (42,768,194) (42,121,307) Investment in joint ventures 15 (3,305,000) (111,200) (12,234,212) Intangible assets 12 (48,532) (490,569) (419,920)
Net cash outflow from acquisition of subsidiaries, net cash acquired 14 (1,563,649) - - Collections of loans receivable from related party 70,000 180,000 243,780 Proceeds from sale of property and equipment 101,463 171,638 118,117 Interest received 544,739 352,302 145,234 Dividends received 21,368 13,852 93,258 Proceeds from disposal of an investment in equity securities 124,056 418 - Net cash outflow from deconsolidation 15 - - (1,246,965)
Net cash flows used in investing activities (55,030,779) (42,651,753) (55,422,015)
(Forward)
it) Globe

�/30������������������
&�5�(�$�7�(���:�2�1�'�(�5�)�8�/���
GLOBE TELECOM, INC. AND SUBSIDIARIES CONSOLIDATED STATEMENTS OF CASH FLOWS
For the Years Ended December 31
Notes 2019 2018 2017
(In Thousand Pesos)
CASH FLOWS FROM FINANCING ACTIVITIES Proceeds from borrowings:
Long-term 5,000,000 24,156,000 36,430,730 Short-term - - 4,600,000
Repayments of borrowings: Long-term (16,745,816) (8,319,604) (5,953,717) Short-term (300,000) - (9,100,000)
Payments of dividends to stockholders: 22.3 Common (12,118,071) (12,104,579) (12,091,736)Preferred (570,087) (561,812) (553,791)
Exercise of stock options 7,553 2,553 7,913 Payments of lease liabilities (1,298,341) - - Interest paid (7,232,591) (6,607,604) (5,525,049)
Net cash provided by (used in) financing activities (33,257,353) (3,435,046) 7,814,350
NET INCREASE (DECREASE) IN CASH AND CASH EQUIVALENTS (14,245,913) 11,763,730 2,696,597
NET FOREIGN EXCHANGE DIFFERENCE ON CASH AND CASH EQUIVALENTS (682,381) 240,436 (107,229)
CASH AND CASH EQUIVALENTS AT THE BEGINNING OF YEAR 23,226,386 11,222,220 8,632,852
CASH AND CASH EQUIVALENTS AT THE END OF YEAR 5 8,298,092 23,226,386 11,222,220
See accompanying Notes to Consolidated Financial Statements.
C Globe

�����������������03/��
&�5�(�$�7�(���:�2�1�'�(�5�)�8�/��� ��
GLOBE TELECOM, INC. AND SUBSIDIARIES NOTES TO CONSOLIDATED FINANCIAL STATEMENTS
1� Corporate Information
1.1 Globe Telecom, Inc.
Globe Telecom, Inc. (hereafter referred to as “Globe Telecom” or The “Parent Company”) is a stock corporation organized under the laws of the Philippines on January 16, 1935, and enfranchised under Republic Act (RA) No. 7229 and its related laws to render any and all types of domestic and international telecommunications services. Globe Telecom is one of the leading providers of digital wireless communications services in the Philippines under the Globe Postpaid and Prepaid, and Touch Mobile (TM) using a fully digital network. It also offers domestic and international long distance communication services or carrier services. Globe Telecom’s head office is located at The Globe Tower, 32nd Street corner 7th Avenue, Bonifacio Global City, Taguig, Metropolitan Manila, Philippines. Globe Telecom is listed in the Philippine Stock Exchange (PSE) and has been included in the PSE composite index since September 17, 2001. Major stockholders of Globe Telecom include Ayala Corporation (AC), Singapore Telecom International Pte Ltd. (Singtel) and Asiacom Philippines, Inc. None of these companies exercise control over Globe Telecom.
1.2 Innove Communications, Inc. (Innove)
Globe Telecom owns 100% of Innove, a stock corporation organized under the laws of the Philippines and enfranchised under RA No. 7372 and its related laws to render any and all types of domestic and international telecommunications services. Innove holds a license to provide digital wireless communication services in the Philippines. Innove also has a license to establish, install, operate and maintain a nationwide local exchange carrier (LEC) service, particularly integrated local telephone service with public payphone facilities and public calling stations, and to render and provide international and domestic carrier and leased line services.
On November 2, 2015, Innove and Techzone Philippines incorporated TechGlobal Data Center, Inc. (TechGlobal), a joint venture company formed for the purpose of operating and managing all kinds of data centers, and providing information technology-enabled, knowledge-based and computer-enabled support services. Innove and Techzone hold ownership interest of 49% and 51%, respectively. TechGlobal started commercial operations in August 2017.
On December 14, 2018, the President of the Philippines signed House Bill No. 5556 into RA No. 11151, renewing the franchise granted to Innove for another 25 years. RA No. 11151 was published in the Official Gazette on December 27, 2018 and shall take effect 15 days after said date.
C Globe
�����������������03/��
&�5�(�$�7�(���:�2�1�'�(�5�)�8�/��� ��
1.3 GTI Business Holdings, Inc. (GTI) and Subsidiaries
Globe Telecom owns 100% of GTI. GTI was incorporated and registered under the laws of the Philippines, on November 25, 2008, as a holding company.
GTI Corporation (GTIC)
In July 2009, GTI incorporated a wholly owned subsidiary, GTIC, a company organized under the General Corporation Law of the United States of America, State of Delaware as a wireless and data communication services provider.
Globe Telecom HK Limited (GTHK)
In December 2011, GTI incorporated a wholly owned subsidiary, GTHK, a limited company organized under the Companies Ordinance of Hong Kong as a marketing and distribution company. On March 17, 2015, GTHK applied for a services-based operator license (SBO) with the Office of the Communications Authority in Hong Kong (OFCA) which was subsequently approved on May 7, 2015. GTHK is engaged in the marketing and selling of telecommunication products and services in the international market, except the United States of America and the Philippines, under a distributor arrangement.
Globetel European Limited (GTEU) and Subsidiaries
On May 10, 2013, GTI incorporated a wholly owned subsidiary, GTEU as holding company for the operating companies of the Globe Group located in the United Kingdom, Spain and Italy.
In 2013, GTEU incorporated its wholly owned subsidiaries, UK Globetel Limited (UKGT), Globe Mobilé Italy S.r.l. (GMI), and Globetel Internacional European España, S.L. (GIEE), for the purpose of establishing operations in Europe by marketing and selling mobile telecommunications services to Filipino individuals and businesses located in the United Kingdom, Spain and Italy.
On June 2, 2016, the BOD approved the cessation of the operations of UKGT, GMI and GIEE effective July 31, 2016. UKGT and GMI completed the liquidation process in 2018. On July 30, 2019, GIEE completed its regulatory requirements for liquidation.
Globetel Singapore Pte. Ltd. (GTSG)
On November 12, 2014, GTI incorporated GTSG, a wholly owned subsidiary, for the purpose of offering full range of international data services in Singapore under a facilities-based operations license (FBO) with Infocomm Media and Development Authority (IMDA) in Singapore which was granted on January 7, 2015.
1.4 Kickstart Ventures, Inc. (Kickstart) and a Subsidiary
On March 28, 2012, Globe Telecom incorporated Kickstart, a stock corporation organized under the laws of the Philippines and formed primarily for the purpose of investing in individual, corporate, or start-up businesses, and to do research, technology development and commercializing of new business ventures.
In February 2014, Kickstart acquired 40% equity interest in Flipside Publishing Services, Inc. (FPSI). Since Kickstart was able to demonstrate control over FPSI despite having less than 50% ownership interest, FPSI was assessed to be a subsidiary of Kickstart and is included in the consolidation of Globe Group. FPSI is engaged in acquiring publishing rights to produce, publish, market, and sell printed and electronic books (e-books) and other electronic documents and content for international and domestic sales. FPSI ceased operations in July 2016. FPSI remains a dormant company as of reporting date.
fb G1obe

�����������������03/��
&�5�(�$�7�(���:�2�1�'�(�5�)�8�/��� ��
1.5 Asticom Technology, Inc. (Asticom)
On June 3, 2014, Globe Telecom signed an agreement with Azalea Technology Investments Inc. (ASTI) and SCS Computer Systems, Pte. Ltd. acquiring 100% ownership stake in Asticom. Asticom is primarily engaged in providing business process and shared service support, as well as IT system integration and consultancy services.
1.6 Globe Capital Venture Holdings Inc. (GCVHI)
On June 29, 2015, Globe Telecom incorporated its wholly owned subsidiary, GCVHI as an investing and holding company primarily engaged in purchasing, subscribing, owning, holding, assigning real and personal property, shares of stock and other securities. In August 2019, GCVHI was rebranded to “917 Ventures” and will house Globe Telecom’s non-telco incubated products.
On October 13, 2015, GCVHI incorporated its wholly owned subsidiary Adspark Holdings, Inc. (AHI), a holding company established for the acquisition of additional investment in Globe Telecom’s non-core business. AHI holds 100% of Adspark Inc. (AI), an advertising company. On January 29, 2016, AI acquired 70% of the outstanding shares of Socialytics Inc. (Socialytics), a social media marketing firm.
GCVHI holds 46.30% ownership interest in Globe Fintech Innovations, Inc. (GFI) and 50% ownership interest in Global Telehealth, Inc. (GTHI).
1.7 Bayan Telecommunications Inc. (BTI)
On July 2, 2015, BTI issued additional shares to Globe Telecom following the approval of National Telecommunications Commission (NTC) on the conversion of BTI’s Tranche A convertible debt to equity. The conversion increased the ownership of Globe Telecom on BTI’s outstanding shares from 38% to 54% controlling interest. On July 20, 2015, Globe Telecom acquired additional voting shares of BTI, which further increased its controlling interest to 99%. BTI is a facilities-based provider of data services and fixed-line telecommunications.
BTI’s subsidiaries are: Radio Communications of the Philippines, Inc. (RCPI), Telecoms Infrastructure Corp. of the Philippines (Telicphil), Sky Internet, Incorporated (Sky Internet), GlobeTel Japan (formerly BTI Global Communications Japan, Inc.), and NDTN Land, Inc. (NLI), (herein collectively referred to as “BTI Group”).
On May 30, 2017, the Management Committee, with representation of at least 67% of the total voting interest, approved the termination of the Agreement on the Construction, Operation and Maintenance of the National Digital Transmission Network dated November 28, 1996, as well as the dissolution of Telicphil and NLI.
On December 11, 2019, the House of Representatives received House Bill No. 5797, an act to renew and amend the franchise granted to BTI. The proposed law seeks to extend BTI’s legislative franchise for another 25 years. The House Committee on Legislative franchises is yet to schedule the bill for public hearing as of February 3, 2020.
1.8 TaoDharma Inc. (Tao)
In March 2013, Globe Telecom entered into a Shareholders’ Agreement with four other entities to incorporate Tao. Globe Telecom subscribed to 25% preferred shares of Tao. Tao was established to operate and maintain retail stores in strategic locations within the Philippines that will sell telecommunications or internet-related services, and devices, gadgets and accessories.
On November 4, 2016, Globe Telecom increased its ownership interest on Tao from 25% to 67% controlling interest. The transaction was accounted for as an acquisition of a subsidiary.
f) Globe

�/30������������������
&�5�(�$�7�(���:�2�1�'�(�5�)�8�/��� ��
1.9 GTowers Inc (GTowers)
On August 17, 2018, GTowers was incorporated as a wholly owned subsidiary of Globe Telecom. GTowers is still under pre-operating stage as of reporting date.
1.10 Yondu, Inc.
Yondu is engaged in the development and creation of wireless products and services accessible
through mobile devices or other forms of communication devices. It also provides internet and
mobile value-added services, information technology and technical services including software
development and related services. Yondu is registered with the Department of Transportation
and Communication (DOTC) as a content provider.
As of December 31, 2018, Yondu was 51% owned by Xurpas Inc. (Xurpas) and 49% owned by
Globe Telecom. On September 11, 2019, the BOD of Globe Telecom approved the acquisition of
51% of the outstanding shares of Yondu, equivalent to 22,950 shares. The acquisition increased
Globe Telecom’s ownership interest from 49% to 100% and was accounted for as an acquisition of
a subsidiary.
Yondu holds 100% of Rocket Search, Inc. (formerly Yondu Software Labs, Inc.), a company primarily engaged in providing information technology (IT) products and services and engaged in IT placement services.
1.11 Electronic Commerce Payments, Inc. (EC Pay)
On October 25, 2019, Globe Telecom signed and executed an agreement with third parties to complete its transaction to acquire 77% ownership of EC Pay. EC Pay is primarily engaged in the business of providing IT and e-commerce solutions, including, but not limited to, prepaid phone and internet products, bills payments and others.
2� Summary of Significant Accounting Policies
2.1 Basis of Preparation and Presentation
The consolidated financial statements of Globe Telecom, Inc. and its subsidiaries, collectively referred to as the “Globe Group”, have been prepared under the historical cost convention method, except for:
� certain financial instruments carried at fair value;� certain financial instruments and lease liabilities carried at amortized cost;� inventories carried at net realizable value;� investments in associates and joint ventures in which equity method of accounting is applied;
and,� retirement benefit obligation measured at the present value of the defined benefit obligation
net of the fair value of the plan assets.
The consolidated financial statements of the Globe Group are presented in Philippine Peso (), which is Globe Telecom’s functional currency, and rounded to the nearest thousands, except when otherwise indicated.
On February 3, 2020, the BOD approved and authorized the release of the consolidated financial statements of Globe Telecom, Inc. and its subsidiaries as of December 31, 2019 and 2018 and for each of the three years in the period ended December 31, 2019. 2.2 Statement of Compliance
The consolidated financial statements of the Globe Group have been prepared in accordance
fb G1obe

�����������������03/��
&�5�(�$�7�(���:�2�1�'�(�5�)�8�/��� ��
with Philippine Financial Reporting Standards (PFRS), which includes all applicable PFRS, Philippine Accounting Standards (PAS), and Interpretations issued by the International Financial Reporting Interpretations Committee (IFRIC), Philippine Interpretations Committee (PIC), and Standing Interpretations Committee (SIC) as approved by the Financial Reporting Standards Council (FRSC) and the Board of Accountancy, and adopted by the Securities and Exchange Commission (SEC).
2.3 Composition of the Group
The accompanying consolidated financial statements include the accounts of Globe Telecom and the following subsidiaries:
Parent Company’s Percentage of Ownership
Name of Subsidiary
Place of
Incorporation Principal Activity 2019 2018
Innove Philippines Wireline voice and data communication services 100% 100%
GTI Philippines Holding company 100% 100% GTIC United States Wireless and data communication services 100% 100%
GTHK Hong Kong Marketing and distributing company 100% 100%
GTSG Singapore Wireless and data communication services 100% 100%
GTEU United Kingdom Holding company 100% 100%
UKGT3 United Kingdom Wireless and data communication services - -
GMI3 Italy Wireless and data communication services - -
GIEE2 Spain Wireless and data communication services - 100%
KVI Philippines Venture capital company 100% 100%
FPSI1 Philippines E-book solutions 40% 40%
Asticom Philippines Support and shared services provider 100% 100%
GCVHI Philippines Holding Company 100% 100%
GFI4 Philippines Holding company 46% 45%
Fuse4 Philippines Lending company 46% 45%
GXI4 Philippines Fintech Company 46% 45%
AHI Philippines Holding company 100% 100%
AI Philippines Advertising company 100% 100%
Socialytics Philippines Advertising company 70% 70%
BTI Philippines Wireline voice and data communication services 99% 99%
RCPI Philippines Wireline communication services 91% 91%
Telicphil1 Philippines Telco equipment administration and maintenance 58% 58%
Sky Internet Philippines Data communication services 100% 100%
GlobeTel Japan Japan Wireless and data communication services 100% 100%
NLI Philippines Land holding company 70% 70%
Tao Philippines Distributing company 67% 67%
G Towers, Inc.5 Philippines Tower company 100% 100%
Yondu6 Philippines Information technology and software development 100% 49%
EC Pay6 Philippines Information technology and electronic services 77% -
1Ceased operations 2Liquidated in 2019 3Liquidated in 2018 4Deconsolidated in 2017 due to loss of control 5Incorporated in 2018 6 Consolidated in 2019
O Globe

�����������������03/��
&�5�(�$�7�(���:�2�1�'�(�5�)�8�/��� ��
2.4 Business Combination and Goodwill
Acquisitions of businesses are accounted for using the purchase method. The consideration transferred in a business combination is measured at fair value, which is calculated as the sum of the acquisition-date fair values of the assets transferred by the Globe Group, liabilities incurred by the Globe Group to the former owners of the acquiree and the equity interest issued by the Globe Group in exchange for control of the acquiree. Acquisition related costs are generally recognized in profit or loss as incurred.
At the acquisition date, the identifiable assets acquired and the liabilities assumed are recognized at their fair value except that:
� deferred tax assets or liabilities, and assets or liabilities related to employee benefitarrangements are recognized and measured in accordance with PAS 12, Income Taxes andPAS 19, Employee Benefits, respectively;
� liabilities and equity instruments related to share-based payment arrangements of theacquiree or share-based payment arrangement of the Globe Group entered into to replaceshare-based payment arrangements of the acquiree are measured in accordance with PFRS 2,Share-based Payment, at the acquisition date; and
� assets (or disposal groups) that are classified as held for sale in accordance with PFRS 5, Non-current assets Held for Sale and Discontinued Operations are measured in accordance withthat Standard.
Goodwill is measured as the excess of the sum of the consideration transferred, the amount of any non-controlling interest in the acquiree, and the fair value of the acquirer’s previously held equity interest in the acquiree (if any) over the net of the acquisition-date amounts of the identifiable assets acquired and the liabilities assumed. If, after reassessment, the net of the acquisition-date amounts of the identifiable assets acquired and liabilities assumed exceeds the sum of the consideration transferred, the amount of any non-controlling interests in the acquiree and the fair value of the acquirer’s previously held interest in the acquiree (if any), the excess is recognized immediately in the consolidated profit or loss as bargain purchase gain.
Goodwill is not amortized but is reviewed for impairment at least annually. For purposes of impairment testing, goodwill is allocated to each of the Globe Group’s cash-generating units that are expected to benefit from the synergies of the combination.
Non-controlling interests that are present ownership interests and entitle their holders to a proportionate share of the entity’s net assets in the event of liquidation may be initially measured either at fair value or at the non-controlling interests’ proportionate share of the recognized amounts of the acquiree’s identifiable net assets. The choice of measurement basis is made on a transaction-by-transaction basis. Other types of non-controlling interest are measured at fair value or, when applicable, on the basis specified in another PFRS.
When the consideration transferred by the Globe Group in a business combination includes assets or liabilities resulting from a contingent consideration arrangement, the contingent consideration is measured at its acquisition-date fair value and included as part of the consideration transferred in a business combination. Changes in the fair value of the contingent consideration that qualify as measurement period adjustments are adjusted retrospectively, with corresponding adjustments against goodwill. Measurement period adjustments are adjustments that arise from additional information obtained during the measurement period (which cannot exceed one year from acquisition date) about facts and circumstances that existed at the acquisition date.
O Globe

�����������������03/��
&�5�(�$�7�(���:�2�1�'�(�5�)�8�/��� ��
The subsequent accounting for the changes in fair value of the contingent consideration that do not qualify as measurement period adjustments depends on how the contingent consideration is classified. Contingent consideration that is classified as equity is not measured at subsequent reporting dates and its subsequent settlement is accounted for within equity. Contingent consideration that is classified as an asset or a liability is remeasured at subsequent reporting dates in accordance with PFRS 9, Financial Instruments, or PAS 37, Provisions, Contingent Liabilities and Contingent Assets, as appropriate, with the corresponding gain or loss being recognized in profit or loss.
When a business combination is achieved in stages, the Globe Group’s previously held equity interest in the acquiree is remeasured to its acquisition-date fair value and the resulting gain or loss, if any, is recognized in profit or loss. Amount arising from interests in the acquiree prior to the acquisition date that have previously been recognized in other comprehensive income are reclassified to profit or loss where such treatment would be appropriate if that interest were disposed of.
If the initial accounting for a business combination is incomplete by the end of the reporting period in which the combination occurs, the Globe Group reports provisional amounts for the items for which the accounting is incomplete. Those provisional amounts are adjusted during the measurement period, or additional assets or liabilities are recognized, to reflect new information obtained about facts and circumstances that existed at the acquisition date that, if known, would have affected the amounts recognized at that date.
2.4.1 Consolidation procedures
The assets, liabilities, income and expense of subsidiaries are consolidated from the date on which control is transferred to the Parent Company and ceases to be consolidated from the date on which control is transferred out of the Parent Company.
The financial statements of the subsidiaries are prepared for the same reporting year as the Parent Company as well as accounting policies for like transactions and other events in similar circumstances. When necessary, adjustments are made to the financial statements of the subsidiaries to bring their accounting policies in line with the Globe Group’s accounting policies.
All significant intercompany balances and transactions, including intercompany profits and losses, were eliminated in full during consolidation.
For the purposes of presenting these consolidated financial statements, the assets and liabilities of the Globe Group’s foreign operations are translated into Philippine Peso using exchange rates prevailing at the end of each reporting period. Income and expense items are translated at the average exchange rates for the period. Exchange differences arising from the translation, if any, are recognized in other comprehensive income and accumulated in other equity reserves.
On the disposal of a foreign operation, all of the exchange differences accumulated in equity reserves in respect of that operation attributable to the owners of the Company are reclassified to profit or loss.
2.4.2 Determination of control
The Parent Company controls an investee if and only if the Parent Company has:
� power over the investee (i.e., existing rights that give it the current ability to direct the relevantactivities of the investee);
� exposure, or rights, to variable returns from its involvement with the investee; and� the ability to use its power over the investee to affect its returns.
e Globe

�/30������������������
&�5�(�$�7�(���:�2�1�'�(�5�)�8�/��� ��
When the Parent Company has less than a majority of the voting or similar rights of an investee, the Parent Company considers all relevant facts and circumstances in assessing whether it has power over an investee, including:
� the contractual arrangement with the other vote holders of the investee;� rights arising from other contractual arrangements; and� the Parent Company’s voting rights and potential voting rights.
The Globe Group re-assesses whether or not it controls an investee if facts and circumstances indicate that there are changes to one or more of the three elements of control.
2.4.3 Non-controlling interest
Non-controlling interests pertain to the equity in a subsidiary not attributable, directly or indirectly to the Globe Group. Non-controlling interests represent the portion of profit or loss and net assets in subsidiaries not wholly-owned and are presented in the consolidated statements of comprehensive income, consolidated statements of changes in equity and consolidated statements of financial position, separately from the equity attributable to the Parent Company.
Profit or loss and each component of other comprehensive income (OCI) are attributed to the equity holders of the Parent Company and to the non-controlling interests, even if this results in the non-controlling interests having deficit balance.
2.4.4 Changes in ownership without loss of control
A change in the ownership interest of a subsidiary, without a loss of control, is accounted for as an equity transaction. The carrying amounts of the Globe Group’s interests and the non-controlling interests are adjusted to reflect the changes in their relative interest in the subsidiaries. Any difference between the amount by which the non-controlling interest are adjusted and the fair value of the consideration paid or received is recognized directly in equity and attributed to the equity holders of the Parent Company.
2.4.5 Changes in ownership with loss of control
If the Globe Group loses control over a subsidiary, it derecognizes the related assets (including goodwill), liabilities, non-controlling interest and other components of equity while any resulting gain or loss is recognized in profit or loss. Any investment retained is recognized at fair value.
C Globe

�����������������03/��
&�5�(�$�7�(���:�2�1�'�(�5�)�8�/��� ��
2.5 Financial Instruments
2.5.1 Initial Recognition
Financial instruments are recognized in the Globe Group’s consolidated statements of financial position when the Globe Group becomes a party to the contractual provisions of the instrument.
Purchases or sales of financial assets that require delivery of assets within the time frame established by regulation or convention in the marketplace are recognized on the trade date, i.e., the date that the Globe Group commits to purchase or sell the asset.
Financial instruments are recognized initially at fair value. Transaction costs are included in the initial measurement of the Group’s financial instruments, except for financial instruments classified at fair value through profit or loss (FVPL).
2.5.2 Classification and Subsequent Measurement of Financial Assets
The Globe Group classifies its financial assets into the following categories: financial assets at FVPL, financial assets at amortized cost and financial assets at fair value through other comprehensive income (FVOCI).
2.5.2.1 Financial assets at FVPL
The Globe Group classifies the following investments as financial assets at FVPL:
� investments in equity securities unless irrevocably elected at initial recognition to bemeasured at FVOCI;
� investments in debt instruments held within a business model whose objective is to sellprior to maturity or has contractual terms that does not give rise on specified dates to cashflows that are solely payments of principal and interest on the principal amountoutstanding, unless designated as effective hedging instruments under a cash flow hedge;
� investments that contain embedded derivatives; and� investment in debt instruments designated as financial assets at FVPL at initial recognition.
Financial assets at FVPL are carried at fair value at the end of each reporting period with any resultant gain or loss recognized in profit or loss.
Financial assets classified under this category are disclosed in Note 33.1.
2.5.2.2 Financial assets at amortized cost
Investments in debt instrument, loans, trade and other receivables that are held within a business model whose objective is to collect the contractual cash flows and has contractual cash flows that are solely payments of principal and interest on the principal amount outstanding are classified as financial assets at amortized cost, unless the asset is designated at FVPL under the fair value option.
Subsequent to initial recognition, financial assets classified under this category are measured at amortized cost using effective interest method, less any impairment.
The effective interest method is a method of calculating the amortized cost of a debt instrument and of allocating interest income over the relevant period. The effective interest rate is the rate that exactly discounts estimated future cash receipts through the expected life of the debt instrument or, when appropriate, a shorter period, to the net carrying amount on initial recognition.
Interest income is recognized by applying the effective interest rate, except for short -term receivables when the effect of discounting is not material.
C Globe

�����������������03/��
&�5�(�$�7�(���:�2�1�'�(�5�)�8�/��� ��
Financial assets classified under this category are disclosed in Note 33.1.
2.5.2.3 Financial assets at fair value through other comprehensive income
The Globe Group classifies the following investments as financial assets at FVOCI:
� Investments in debt instrument that is held within a business model whose objective isachieved both by collecting contractual cash flows and selling financial assets and hascontractual terms that give rise on specified dates to cash flows that are solely payments ofprincipal and interest on the principal amount outstanding, unless the asset is designatedat FVPL under the fair value option;
� Investments in equity securities irrevocably elected to be measured at FVOCI; and� Derivative designated as effective hedging instruments under cash flow hedges.
Financial assets at FVOCI are carried at fair value at the end of each reporting period. Changes in the carrying amount financial assets at FVOCI arising from movements in fair value are recognized in other comprehensive income and accumulated in other equity reserves. When the investment is disposed of, the cumulative gain or loss previously accumulated in equity reserves is reclassified directly to retained earnings.
Financial assets classified under this category are disclosed in Notes 33.1.
2.5.3 Impairment of Financial Assets at amortized cost
The Globe Group assesses at end of the reporting date whether a financial asset or group of financial assets is impaired.
The Globe Group recognizes a loss allowance for expected credit losses on investments in debt instruments that are measured at amortized cost, loans, trade receivables and contract assets. The amount of expected credit losses is updated at each reporting date to reflect changes in credit risk since initial recognition of the respective financial instrument.
The Globe Group applies the simplified ECL approach and always recognizes lifetime ECL for trade receivables and contract assets. The expected credit losses on these financial assets are estimated based on the characteristics of the product and payment behavior of the subscriber at the reporting date.
For all other financial instruments, the Globe Group recognizes lifetime ECL when there has been a significant increase in credit risk since initial recognition. However, if the credit risk on the financial instrument has not increased significantly since initial recognition, the Globe Group measures the loss allowance for that financial instrument at an amount equal to 12 ‑month ECL.
Lifetime ECL represents the expected credit losses that will result from all possible default events over the expected life of a financial instrument. In contrast, 12‑month ECL represents the portion of lifetime ECL that is expected to result from default events on a financial instrument that are possible within 12 months after the reporting date.
The Globe Group measures ECL on an individual basis, or on a collective basis for portfolios of receivables that share similar economic risk characteristics.
O Globe

�����������������03/��
&�5�(�$�7�(���:�2�1�'�(�5�)�8�/��� ��
Significant increase in credit risk
In assessing whether the credit risk on non-trade receivables has increased significantly since initial recognition, the Globe Group compares the risk of a default occurring on the financial instrument at the reporting date with the risk of a default occurring on the financial instrument at the date of initial recognition. In making this assessment, the Globe Group considers both quantitative and qualitative information that is reasonable and supportable, including histo rical experience and forward‑looking information that is available without undue cost or effort. The forward‑looking information considered includes the future prospects of the industries in which the Group’s debtors operate.
In particular, the following information is taken into account when assessing whether credit risk
has increased significantly since initial recognition:
� an actual or expected significant deterioration in the financial instrument’s credit rating;� significant deterioration in external market indicators of credit risk for a particular financial
instrument;� existing or forecast adverse changes in business, financial or economic conditions that are
expected to cause a significant decrease in the debtor’s ability to meet its debt obligations;� an actual or expected significant deterioration in the operating results of the debtor;� significant increases in credit risk on other financial instruments of the same debtor;� an actual or expected significant adverse change in the regulatory, economic, or
technological environment of the debtor that results in a significant decrease in the debtor’sability to meet its debt obligations.
Irrespective of the outcome of the above assessment, the Globe Group presumes that the credit risk on non-trade receivables has increased significantly since initial recognition when contractual payments are more than 30 days past due unless the Globe Group has reasonable and supportable information that demonstrates otherwise.
Despite the foregoing, the Globe Group assumes that the credit risk on non-trade receivables has not increased significantly since initial recognition if the instrument is determined to have low credit risk at the reporting date. The Globe Group considers a financial asset to have low credit risk when the counterparty has a strong financial position and there is no past due amounts. An instrument is determined to have low credit risk if:
� The financial instrument has a low risk of default,� The debtor has a strong capacity to meet its contractual cash flow obligations in the near
term, and� Adverse changes in economic and business conditions in the longer term may, but will not
necessarily, reduce the ability of the borrower to fulfil its contractual cash flow obligations.
The Globe Group regularly monitors the effectiveness of the criteria used to identify whether there has been a significant increase in credit risk and revises them as appropriate to ensure that the criteria are capable of identifying significant increase in credit risk before the amount becomes past due.
O Globe

�����������������03/��
&�5�(�$�7�(���:�2�1�'�(�5�)�8�/��� ��
Definition of default
For subscribers receivable and contract assets, the Globe Group considers that default has occurred when the subscriber has been permanently disconnected.
For all other receivables, The Globe Group considers the following as constituting an event of default as historical experience indicates that financial assets that meet either of the following criteria are generally not recoverable:
� when there is a breach of financial covenants by the debtor; or� information developed internally or obtained from external sources indicates that the
debtor is unlikely to pay its creditors, including the Globe Group, in full (without taking intoaccount any collateral held by the Group).
Irrespective of the above analysis, the Globe Group considers that default has occurred when a financial asset is more than 90 days past due unless the Globe Group has reasonable and supportable information to demonstrate that a more lagging default criterion is more appropriate.
Credit‑impaired financial assets
A financial asset is credit‑impaired when one or more events that have a detrimental impact on the estimated future cash flows of that financial asset have occurred. Evidence that a financial asset is credit‑impaired includes observable data about the following events:
� significant financial difficulty of the issuer or the borrower;� a breach of contract, such as a default or past due event;� the lender(s) of the borrower, for economic or contractual reasons relating to the borrower’s
financial difficulty, having granted to the borrower a concession(s) that the lender(s) wouldnot otherwise consider;
� it is becoming probable that the borrower will enter bankruptcy or other financialreorganisation; or
� the disappearance of an active market for that financial asset because of financialdifficulties.
Write‑off policy
The Group writes off a financial asset when there is information indicating that the debtor is in severe financial difficulty and there is no realistic prospect of recovery, (e.g. when the debtor has been placed under liquidation or has entered into bankruptcy proceedings, or when the Group has effectively exhausted all collection efforts). Financial assets written off may still be subject to enforcement activities under the Globe Group’s recovery procedures, taking into account legal advice where appropriate. Any recoveries made are recognized in profit or loss.
Measurement and recognition of expected credit losses
The measurement of expected credit losses is a function of the probability of default, loss given default (i.e. the magnitude of the loss if there is a default) and the exposure at default. The assessment of the probability of default and loss given default is based on historical data adjusted by forward‑looking information as described above.
As for the exposure at default, this is represented by the assets’ gross carrying amount at the reporting date.
The expected credit loss is estimated as the difference between all contractual cash flows that are due to the Globe Group in accordance with the contract and all the cash flows that the Globe Group expects to receive, discounted at the original effective interest rate.
O Globe

�����������������03/��
&�5�(�$�7�(���:�2�1�'�(�5�)�8�/��� ��
If the Globe Group has measured the loss allowance for a financial instrument at an amount equal to lifetime ECL in the previous reporting period, but determines at the current reporting date that the conditions for lifetime ECL are no longer met, the Globe Group measures the loss allowance at an amount equal to 12‑month ECL at the current reporting date, except for assets such as trade receivables and contract assets for which simplified approach was used.
The Globe Group recognizes an impairment gain or loss in profit or loss for all financial instruments with a corresponding adjustment to their carrying amount through a loss allowance account.
2.5.4 Classification of financial liabilities and equity
Debt and equity instruments are classified as either financial liabilities or as equity in accordance with the substance of the contractual arrangements and the definitions of a financial liability and equity instrument.
2.5.4.1 Classification and Subsequent Measurement of Financial liabilities
The Globe Group further classifies its financial liabilities into financial liabilities at FVPL and financial liabilities at amortized cost. The classification depends on the nature and purpose of
the financial liability and is determined at the time of initial recognition.
2.5.4.1.1 Financial liabilities at FVPL
This category consists of financial liabilities that were designated by management as FVPL on initial recognition and derivative financial liabilities not designated as effective hedging instruments under cash flow hedges.
Financial liabilities at FVPL are carried in the consolidated statements of financial position at fair value, with changes in fair value recognized in profit or loss.
Financial liabilities classified under this category are disclosed in Note 33.
2.5.4.1.2 Financial liabilities at amortized cost
Loans, trade and other payables which are not designated as financial liabilities at FVPL are classified as financial liabilities at amortized cost. Financial liabilities classified under this category are subsequently measured at amortized cost using the effective rate method ( see Note 2.5.2.2). Financial liabilities classified under this category is disclosed in Note 33.
2.5.4.1.3 Equity instruments
Capital Stock
Capital stock is recognized as issued when the stock is paid for or subscribed under a binding subscription agreement and is measured at par value. The transaction costs incurred as a necessary part of completing an equity transaction are accounted for as part of that transaction and are deducted from additional paid-in capital, net of related income tax benefits.
Additional Paid-in Capital
Additional paid-in capital includes any premium received in excess of par value on the issuance of capital stock.
Retained Earnings
Retained earnings represent accumulated profit attributable to equity holders of the Parent Company after deducting dividends declared. Retained earnings may also include effect of changes in accounting policy as may be required by the standard’s transitional provisions.
e Globe

�����������������03/��
&�5�(�$�7�(���:�2�1�'�(�5�)�8�/��� ��
2.5.5 Derivative Instruments
Derivative financial instruments are initially recognized at fair value on the date on which a derivative contract is entered into and are subsequently measured at fair value. Derivatives are carried as financial assets when the fair value is positive and as financial liabilities when the fair value is negative.
The method of recognizing the resulting gain or loss depends on whether the derivative is designated as a hedge of an identified risk and qualifies for hedge accounting treatment. The objective of hedge accounting is to match the impact of the hedged item and the hedging instrument in the consolidated profit or loss. To qualify for hedge accounting, the hedging relationship must comply with requirements such as the designation of the derivative as a hedge of an identified risk exposure, hedge documentation, probability of occurrence of the forecasted transaction in a cash flow hedge, assessment (both prospective and retrospective bases) and measurement of hedge effectiveness, and reliability of the measurement bases of the derivative instruments.
Upon inception of the hedge, the Globe Group documents the relationship between the hedging instrument and the hedged item, its risk management objective and strategy for undertaking various hedge transactions, and the details of the hedging instrument and the hedged item. The Globe Group also documents its hedge effectiveness assessment methodology, both at the hedge inception and on an ongoing basis, as to whether the derivatives that are used in hedging transactions are highly effective in offsetting changes in fair values or cash flows of hedged items.
Hedge effectiveness is likewise measured, with any ineffectiveness being reported immediately in the consolidated profit or loss.
2.5.5.1 Types of Hedges
The Globe Group designates derivatives which qualify as accounting hedges as either:
� a hedge of the fair value of a recognized fixed rate asset, liability or unrecognized firmcommitment (fair value hedge); or
� a hedge of the cash flow variability of recognized floating rate asset and liability orforecasted sales transaction (cash flow hedge).
Fair Value Hedges
Fair value hedges are hedges of the exposure to variability in the fair value of recognized assets, liabilities or unrecognized firm commitments. The gain or loss on a derivative instrument designated as a fair value hedge, as well as the offsetting loss or gain on the hedged item attributable to the hedged risk, are recognized in the consolidated profit or loss in the same accounting period. Hedge effectiveness is determined based on the hedge ratio of the fair value changes of the hedging instrument and the underlying hedged item. When the hedge ceases to be highly effective, hedge accounting is discontinued.
C Globe

�����������������03/��
&�5�(�$�7�(���:�2�1�'�(�5�)�8�/��� ��
Cash Flow Hedges
A cash flow hedge is a hedge of the exposure to variability in future cash flows related to a recognized asset, liability or a forecasted sales transaction. Changes in the fair value of a hedging instrument that qualifies as a highly effective cash flow hedge are recognized in other comprehensive income and accumulated in other equity reserves. Any hedge ineffectiveness is immediately recognized in the consolidated profit or loss.
If the hedged cash flow results in the recognition of a nonfinancial asset or liability, gains and losses previously recognized in other comprehensive income are transferred from equity and included in the initial measurement of the cost or carrying value of the asset or liability. Otherwise, for all other cash flow hedges, gains and losses initially recognized in equity are transferred to consolidated profit or loss in the same period or periods during which the hedged forecasted transaction or recognized asset or liability affect earnings.
Hedge accounting is discontinued prospectively when the hedge ceases to be highly effective. When hedge accounting is discontinued, the cumulative gains or losses on the hedging instrument that has been recognized in OCI is retained in other equity reserves until the hedged transaction impacts consolidated profit or loss. When the forecasted transaction is no longer expected to occur, any net cumulative gains or losses previously recognized in other equity reserves is immediately reclassified in the consolidated profit or loss.
2.5.6 Other Derivative Instruments Not Accounted for as Accounting Hedges
Certain freestanding derivative instruments that provide economic hedges under the Globe Group’s policies either do not qualify for hedge accounting or are not designated as accounting hedges. Changes in the fair values of derivative instruments not designated as hedges are recognized immediately in the consolidated profit or loss.
2.5.7 Offsetting
Financial assets and financial liabilities are offset and the net amount is reported in the consolidated statements of financial position if, and only if, there is a currently enforceable legal right to offset the recognized amounts and there is an intention to settle on a net basis, or to realize the asset and settle the liability simultaneously.
2.5.8 Derecognition of Financial Instruments
2.5.8.1 Financial Asset
The Globe Group derecognizes a financial asset only when the contractual rights to the cash flows from the asset expire or when the Globe Group transfers the financial asset and substantially all the risks and rewards of ownership of the asset to another entity. If the Globe Group neither transfers nor retains substantially all the risks and rewards of ownership and continues to control the transferred asset, the Globe Group recognizes its retained interest in the asset and an associated liability for amounts it may have to pay. If the Globe Group retains substantially all the risks and rewards of ownership of a transferred financial asset, the Globe Group continues to recognize the financial asset and also recognizes a collateralized borrowing for the proceeds received.
On derecognition of financial asset in its entirety, the difference between the asset’s carrying amount and the sum of the consideration received and receivable are recognized in the consolidated profit or loss.
O Globe

�/30������������������
&�5�(�$�7�(���:�2�1�'�(�5�)�8�/��� ��
2.5.8.2 Financial Liability
A financial liability is derecognized when the obligation under the liability is discharged, cancelled or expired. On derecognition of financial liabilities, the difference between the carrying amount of the financial liability derecognized and the sum of consideration paid and payable is recognized in the consolidated profit or loss.
2.6 Inventories
Inventories are initially measured at cost. Subsequently, inventories are stated at the lower of cost and net realizable value. The costs of inventories are calculated using the moving average method. Net realizable value represents the estimated selling price less all estimated costs of completion and costs necessary to make the sale.
When the net realizable value of the inventories is lower than the cost, the Globe Group provides for an allowance for the decline in the value of the inventory and recognizes the write-down as an expense in the consolidated profit or loss. The amount of any reversal of any write-down of inventories, arising from an increase in net realizable value, is recognized as a reduction in the amount of inventories recognized as an expense in the period in which the reversal occurs.
When inventories are sold, the carrying amount of those inventories is recognized as an expense in the period in which the related revenue is recognized.
2.7 Prepayments
Prepayments represent expenses not yet incurred but already paid in cash. Prepayments are initially recorded as assets and measured at the amount of cash paid. Subsequently, these are charged to profit or loss as they are consumed in operations or expire with the passage of time.
Prepayments are classified in the consolidated statement of financial position as current assets when the cost of goods or services related to the prepayments are expected to be incurred within one year. Otherwise, prepayments are classified as non-current assets.
2.8 Value Added Tax (VAT)
Input VAT is recognized when the Globe Group purchases goods or services from a VAT registered supplier or vendor. This account is offset against any output VAT previously recognized. Input VAT on capital goods exceeding 1 million and input VAT from purchases of goods and services which remain unpaid at each reporting date are recognized as “Deferred input VAT” presented under “Prepayments and Other Current Assets”.
2.9 Property and Equipment
Property and equipment are initially measured at cost. The cost of an item of property and equipment comprises:
� its purchase price, including import duties and non-refundable purchase taxes, afterdeducting trade discounts and rebates;
� any costs directly attributable to bringing the asset to the location and condition necessaryfor it to be capable of operating in the manner intended by management; and
� the initial estimate of the future costs of dismantling and removing the item and restoring thesite on which it is located.
The cost of self-constructed assets includes the cost of materials and direct labor, any other costs directly attributable to bringing the assets to a working condition for their intended use, the costs of dismantling and removing the items and restoring the site on which they are located, and borrowing costs on qualifying assets.
Major spare parts and stand-by equipment qualify as property and equipment when the Globe
e Globe

�����������������03/��
&�5�(�$�7�(���:�2�1�'�(�5�)�8�/��� ��
Group expects to use them during more than one period. Similarly, if the spare parts and servicing equipment can be used only in connection with an item of property and equipment, they are accounted for as property and equipment.
At the end of each reporting period, items of property and equipment are carried at cost less any
subsequent accumulated depreciation and impairment losses.
Subsequent expenditures relating to an item of property and equipment that have already been recognized are added to the carrying amount of the asset when it is probable that future economic benefits, in excess of the originally assessed standard of performance of the existing asset, will flow to the Globe Group. All other subsequent expenditures are recognized as expenses in the period in which those are incurred.
Depreciation is computed on the straight-line method based on the estimated useful lives (EUL) of the assets as follows:
Years
Telecommunications equipment:
Tower 20
Switch 7-10
Outside plant, cellsite structures and improvements 10-20
Distribution dropwires and other wireline asset 2-10
Cellular equipment and others 3-10
Buildings 20
Cable systems 5-20
Office equipment 3-7
Transportation equipment 3-5
Leasehold improvements are amortized over the shorter of their EUL of 5 years or the corresponding lease terms.
The EUL of property and equipment are reviewed annually based on expected asset utilization of expected future technological developments and market behavior.
Assets in the course of construction are carried at cost, less any recognized impairment loss. These are transferred to the related property and equipment account when the construction or installation and the related activities necessary to prepare the property and equipment for their intended use are complete, and the property and equipment are ready for service. Depreciation of these assets, on the same basis as other property and equipment, commences at the time the assets are ready for their intended use.
An item of property and equipment is derecognized upon disposal or when no future economic benefits are expected to arise from the continued use of the asset. Gain or loss arising on the disposal or retirement of an asset is determined as the difference between the sales proceeds and the carrying amount of the asset and is recognized in the consolidated profit or loss.
O Globe

�/30������������������
&�5�(�$�7�(���:�2�1�'�(�5�)�8�/��� ��
2.10 Intangible Assets
Intangible assets acquired separately
Intangible assets with finite useful lives that are acquired separately are initially recognized at cost. Subsequent to initial recognition, intangible assets with finite useful lives are carried at cost less accumulated amortization and accumulated impairment losses. Amortization is recognized on a straight-line basis over their EUL. The EUL and amortization method are reviewed at the end of each reporting period, with the effect of any changes in estimate being accounted for on a prospective basis.
Internally-generated intangible assets
An internally-generated intangible asset arising from development (or from the development phase of an internal project) is recognized if, and only if, all of the following conditions have been demonstrated:
� technical feasibility of completing the intangible asset so that it will be available for use or sale;� intention to complete the intangible asset and use or sell it;� ability to use or sell the intangible asset;� how the intangible asset will generate probable future economic benefits;� availability of adequate technical, financial and other resources to complete the development and
to use or sell the intangible asset; and� ability to measure reliably the expenditure attributable to the intangible asset during its
development.
The amount initially recognized for internally-generated intangible assets is the sum of the expenditure incurred from the date when the intangible asset first meets the recognition criteria listed above. Where no internally-generated intangible asset can be recognized, development expenditure is recognized in the consolidated profit or loss in the period in which it is incurred.
Subsequent to initial recognition, internally-generated intangible assets are reported at cost less accumulated amortization and accumulated impairment losses, on the same basis as intangible assets that are acquired separately.
Intangible assets acquired in a business combination
Intangible assets acquired in a business combination and recognized separately from goodwill are recognized initially at their fair value at the acquisition date (which is regarded as their cost).
Subsequent to initial recognition, intangible assets acquired in a business combination are reported at cost less accumulated amortization and accumulated impairment losses, on the same basis as intangible assets that are acquired separately.
Amortization of intangible asset is computed based on the EUL of the assets below:
Years
Software 3-10
Spectrum and franchise 10
Customer contracts 4
Merchant networks 4-21
O Globe

�����������������03/��
&�5�(�$�7�(���:�2�1�'�(�5�)�8�/��� ��
Derecognition of Intangible assets
Intangible assets are derecognized upon disposal or when no future economic benefits are expected to arise from the continued use of the asset. Gain or loss arising on the disposal or retirement of an asset is determined as the difference between the sales proceeds and the carrying amount of the asset and is recognized in the consolidated profit or loss.
2.11 Investments in Associate and Joint Venture
An associate is an entity over which the Globe Group has significant influence. Significant influence is the power to participate in the financial and operating policy decisions of the investee, but is not control or joint control over those policies.
A joint venture (JV) is a type of joint arrangement whereby the parties that have joint control of
the arrangement have rights to the net assets of the joint venture. Joint control is the
contractually agreed sharing of control of an arrangement, which exists only when decisions about
the relevant activities require unanimous consent of the parties sharing control.
The considerations made in determining significant influence or joint control are similar to those necessary to determine control over subsidiaries.
Investments in associate or JV are measured initially at cost. Subsequent to initial recognition, the Globe Group’s investments in its associate and JV are accounted for using the equity method. Under the equity method, the investments in an associate and JV are carried in the consolidated statements of financial position at cost plus post-acquisition changes in the Globe Group’s share in net assets of the associate and JV, less any allowance for impairment losses. The consolidated profit or loss includes the Globe Group’s share in the results of operations of its associate or JV. Any change in OCI of those investees is presented as part of the Globe Group’s OCI. In addition, where there has been a change recognized directly in the equity of the associate or JV, the Globe Group recognizes its share of any changes and discloses this, when applicable, directly in equity.
When the share of losses recognized under the equity method has reduced the investment to zero, the Globe Group shall discontinue recognizing its share of further losses and apply it to other interests that, in substance, form part of the Globe Group’s net investment in the associate or JV. If the associate or JV subsequently reports profits, the Globe Group will resume recognizing its share of those profits only after its share of the profits equal the share in losses not recognized.
The financial statements of the associate or joint venture are prepared for the same reporting period as the Globe Group.
Upon loss of significant influence over the associate or joint control over the joint venture, the Globe Group measures and recognizes any retained investment at its fair value. Any difference between the carrying amount of the associate or joint venture upon loss of significant influence or joint control and the fair value of the retained investment and proceeds from disposal is recognized in the consolidated profit or loss.
O Globe

�����������������03/��
&�5�(�$�7�(���:�2�1�'�(�5�)�8�/��� ��
2.12 Impairment of Nonfinancial Assets
At the end of each reporting period, the Globe Group assesses whether there is any indication that any of its tangible and intangible assets with finite useful lives may have suffered an impairment loss. If any such indication exists, the recoverable amount of the asset is estimated in order to determine the extent of the impairment loss, if any. When it is not possible to estimate the recoverable amount of an individual asset, the Group estimates the recoverable amount of the cash-generating unit to which the asset belongs. When a reasonable and consistent basis of allocation can be identified, assets are also allocated to individual cash-generating units, or otherwise they are allocated to the smallest group of cash-generating units for which a reasonable and consistent allocation basis can be identified.
Intangible assets with indefinite useful lives and intangible assets not yet available for use are tested for impairment annually and whenever there is an indication that the asset may be impaired.
Recoverable amount is the higher of fair value less costs to sell and value-in-use. In assessing value-in-use, the estimated future cash flows are discounted to their present value using a pre-tax discount rate that reflects current market assessments of the time value of money and the risks specific to the asset for which the estimates of future cash flows have not been adjusted.
If the recoverable amount of an asset or cash-generating unit is estimated to be less than its carrying amount, the carrying amount of the asset (or cash-generating unit) is reduced to its recoverable amount. An impairment loss is recognized as an expense. Impairment losses recognized in respect of CGUs are allocated first to reduce the carrying amount of any goodwill allocated to the units, and then to reduce the carrying amounts of the other assets in the unit (group of units) on a pro rata basis.
Impairment losses recognized in prior periods are assessed at the end of each reporting period for any indications that the loss has decreased or no longer exists. An impairment loss is reversed if there has been a change in the estimates used to determine the recoverable amount. An impairment loss is reversed only to the extent that the asset’s carrying amount does not exceed the carrying amount that would have been determined, net of depreciation or amortization, if no impairment loss had been recognized. A reversal of an impairment loss is recognized as income. Impairment losses relating to goodwill cannot be reversed in future periods.
2.13 Provisions
Provisions are recognized when the Globe Group has a present obligation, either legal or constructive, as a result of a past event and it is probable that the Globe Group will be required to settle the obligation through an outflow of resources embodying economic benefits, and the amount of the obligation can be estimated reliably.
The amount of the provision recognized is the best estimate of the consideration required to settle the present obligation at the end of each reporting period, taking into account the risks and uncertainties surrounding the obligation. A provision is measured using the cash flows estimated to settle the present obligation; its carrying amount is the present value of those cash flows.
When some or all of the economic benefits required to settle a provision are expected to be recovered from a third party, the receivable is recognized as an asset if it is virtually certain that reimbursement will be received and the amount of the receivable can be measured reliably.
Provisions are reviewed at end of each reporting period and adjusted to reflect the current best estimate.
If it is no longer probable that a transfer of economic benefits will be required to settle the obligation, the provision should be reversed.
O Globe

�����������������03/��
&�5�(�$�7�(���:�2�1�'�(�5�)�8�/��� ��
2.13.1 Asset Retirement Obligation (ARO)
The net present value of legal obligations associated with the retirement of an item of property and equipment that resulted from the acquisition, construction or development and the normal operation of property and equipment is recognized in the period in which it is incurred. The retirement obligation is initially measured at the present value of the estimated future dismantlement or restoration cost using current market borrowing rates. Subsequently, the discount is amortized as interest expense.
Changes in Existing Decommissioning, Restoration and Similar Liabilities
Changes in the measurement of an existing decommissioning, restoration and similar liability that result from changes in the estimated timing or amount of the outflow of resources embodying economic benefits required to settle the obligation, are accounted as follows;
� changes in the liability are added to, or deducted from, the cost of the related asset in thecurrent period, except that the amount deducted from the cost of the asset must not exceedits carrying amount. If a decrease in the liability exceeds the carrying amount of the asset, theexcess is recognized immediately in the consolidated profit or loss; and
� if the adjustment results in an addition to the cost of an asset, the entity should considerwhether this may indicate that the new carrying amount of the asset may not be fullyrecoverable. If so, the asset should be tested for impairment.
2.14 Contingent liabilities and contingent assets
Contingent liabilities and assets are not recognized because their existence will be confirmed only by the occurrence or non-occurrence of one or more uncertain future events not wholly within the control of the Globe Group.
Contingent liabilities are disclosed, unless the possibility of an outflow of resources embodying economic benefits is remote.
Contingent assets are disclosed only if an inflow of economic benefits is probable.
2.15 Revenue Recognition
Revenue is measured based on the consideration specified in an arrangement with the customer, net of any amounts collected on behalf of third parties. The Globe Group recognizes revenue upon transfer of control of a product or service to a customer.
In arrangements where another party is involved in providing the services, the Globe Group assesses whether the nature of its promise in the arrangement is to provide the specified services itself or arrange for those services to be provided by the other party. If the promise in an arrangement is to provide the services itself, the Globe Group recognizes the service revenue at gross amount of consideration, with the amount remitted to the other party being recognized as expense. However, if the promise is to simply arrange for those services to be provided by the other party, the Globe Group recognizes service revenues equivalent only to the extent of fees or commission to which it expects to be entitled in exchange for arranging the services.
C Globe

�/30������������������
&�5�(�$�7�(���:�2�1�'�(�5�)�8�/��� ��
The Globe Group recognizes revenues from the following sources:
� Mobile services provided to subscribers at prepaid or postpaid arrangements such as ShortMessaging Services (SMS), voice, data communication, and other value added services(Note 2.15.1);
� Wireline services provided to subscribers under subscription arrangements such as, voice,corporate communication, and home broadband internet (Note 2.15.1);
� Inbound traffic originating from other telecommunications providers that terminates atGlobe Group’s network (Note 2.15.2);
� Inbound roaming due from foreign carriers (Note 2.15.3);� Postpaid wireless communication services bundled with sale of handsets and other devices
(Note 2.15.4);� Postpaid wireline communication services bundled with equipment installation services
(Note 2.15.5);� Leases, interests and management fees (Note 2.15.7).
2.15.1 Mobile and wireline services
Monthly service fees from mobile and wireline services under postpaid subscriptions are recognized as service revenues throughout the subscription period.
Proceeds from over-the-air reloading channels and sale of prepaid cards are initially recognized as deferred revenues. These are eventually charged as service revenues upon actual usage of load value. Any unused remaining load value after the prescribed validity period are immediately recognized as service revenue.
Subscription to promotional offer of SMS, voice, data communication, broadband internet, and other services, are recognized as service revenue over the promotional period.
2.15.2 Inbound traffic
Inbound traffic originating from other telecommunications providers that terminates at the Globe Group’s network are recognized as service revenues in the period the inbound traffic occurred based on agreed rates with the other telecommunication providers.
2.15.3 Inbound roaming services
Service revenues from foreign carriers for inbound roaming transactions at the Globe Group’s network are recognized in the period the inbound roaming connection is provided.
2.15.4 Postpaid mobile services and sale of mobile handsets and other devices
The Globe Group provides postpaid wireless communication services which are bundled with sale of mobile handsets and other devices. The postpaid wireless communication services and the sale of devices are considered two separate performance obligations which are capable of being distinct and separately identifiable. The Globe Group allocates the contract consideration between the two performance obligations based on their corresponding relative stand-alone selling prices (SSP). The stand-alone selling prices are determined based on the expected cost plus margin or adjusted market approach. The amount allocated to the postpaid wireless communication service is recognized as service revenue over the period of subscription. Any amount allocated to the sale of device is immediately recognized as non-service revenue upon delivery of the item. Contract assets are recognized for the unbilled portion of the consideration allocated to the sale of devices which are subsequently reduced as the monthly service fees are billed to the subscribers.
C Globe

�/30������������������
&�5�(�$�7�(���:�2�1�'�(�5�)�8�/��� ��
The Globe Group does not make any adjustments for the significant financing component on contract assets since it expects that the period between the delivery of the handset up to the date of its full settlement will not exceed one year from the contract inception.
2.15.5 Postpaid subscription to wireline services and equipment installation services
The Globe Group provides equipment installation services which are bundled with postpaid wireline services. The promise to install the equipment is not considered as a distinct service from the postpaid wireline service since the subscriber may not be able to benefit from the installation services without the availability of the postpaid wireline services. Accordingly, the two services are deemed as one performance obligation.
Service revenues from the equipment installation and postpaid wireline services are recognized over time throughout the period of subscription. Outright payments received from the installation services are initially recognized as contract liabilities and subsequently charged as service revenues over the period of subscription.
2.15.6 Globe Rewards
The Globe Group operates Globe Rewards Program through which subscribers accumulate points upon purchase of certain products and services. The Globe Rewards points may be redeemed in the form of mobile promos, bill rebates, gadgets and gift certificates, or use the earned points as cash at partner stores. The promise to provide free products and rebates to the subscribers give rise to a performance obligation that is distinct and separately identifiable. Accordingly, the Globe Group allocates a portion of the transaction price from its service revenues to Globe Rewards points awarded to subscribers based on its relative stand-alone selling price. The stand-alone selling price per point is estimated based on the discount or free products to be given when the points are redeemed by the subscriber. Amounts allocated to Globe Rewards points are initially recognized as deferred revenues and subsequently charged as service revenues either upon redemption of points or upon expiration.
2.15.7 Other income
2.15.7.1 Interest
Interest income is recognized as it accrues using the effective interest rate method.
2.15.7.2 Lease
Lease income from operating lease is recognized on a straight-line basis over the lease term.
In a finance lease arrangement, the present value of the aggregate of the minimum lease receivable and any unguaranteed residual value accruing to the Globe Group are immediately recognized as income.
2.15.7.3 Management fees
Management fee is recognized when services are provided.
2.15.8 Deferred contract costs
Costs to obtain contracts with customers that would not have been incurred if the contracts were not obtained are recognized as deferred contract costs. Deferred contract costs are subsequently recognized as expense on a straight-line basis over the contract period.
Costs to obtain contracts with customers that would have been incurred irrespective of whether the contract were obtained are immediately recognized as expense.
O Globe

�����������������03/��
&�5�(�$�7�(���:�2�1�'�(�5�)�8�/��� ��
Costs incurred to fulfill a contract are capitalized as deferred contract costs if all of the following conditions are met:
� The costs relate directly to a contract or to an anticipated contract that the Globe Group canspecifically identify;
� The costs generate or enhance resources of the Globe Group that will be used in satisfyingperformance obligation in the future; and
� The costs are expected to be recovered.
2.16 Expense recognition
Expenses are recognized in the consolidated profit or loss when decrease in future economic benefit related to a decrease in an asset or an increase in a liability has arisen that can be measured reliably. Expenses are recognized in the consolidated profit or loss on the basis of: (i) a direct association between the costs incurred and the earning of specific items of income; (ii) systematic and rational allocation procedures when economic benefits are expected to arise over several accounting periods and the association with income can only be broadly or indirectly determined; or (iii) immediately when an expenditure produces no future economic benefits or when, and to the extent that, future economic benefits do not qualify, or cease to qualify, for recognition in the consolidated statements of financial position as an asset.
Expenses in the consolidated statements of comprehensive income are presented using the nature of expense method.
2.17 Staff Costs
2.17.1 Short-term benefits
The Globe Group recognizes a liability net of amounts already paid and an expense for services rendered by employees during the accounting period. A liability is also recognized for the amount expected to be paid under short-term cash bonus or profit sharing plans if the Globe Group has a present legal or constructive obligation to pay this amount as a result of past service provided by the employee and the obligation can be estimated reliably.
Short-term employee benefit obligations are measured on an undiscounted basis and are expensed as the related service is provided.
2.17.2 Post Employee benefits
The Globe Group has a funded non-contributory defined benefit retirement plan. For the defined benefit retirement plan, the cost of providing benefits is determined using the projected unit credit method, with actuarial valuations being carried out at the end of each annual reporting period. Remeasurements, comprising actuarial gains and losses, the effect of the changes to the asset ceiling (if applicable) and the return on plan assets (excluding interest), is reflected immediately in the consolidated statements of financial position with a charge or credit recognized in other comprehensive income in the period in which they occur. Past service cost is recognized in the consolidated profit or loss in the period of a plan amendment. Net interest is calculated by applying the discount rate at the beginning of the period to the net defined benefit liability or asset.
C Globe

�����������������03/��
&�5�(�$�7�(���:�2�1�'�(�5�)�8�/��� � ��
Defined benefit costs are categorized as follows:
�� Service cost (including current service cost, past service cost, as well as gains and losses on curtailments and settlements)
�� Net interest expense or income �� Remeasurement
The Globe Group presents service cost and interest in the consolidated profit or loss in the line item pension costs and finance cost, respectively. Curtailment gains and losses are accounted for as past service costs.
The retirement benefit obligation recognized in the consolidated statements of financial position represents the present value of the defined benefit obligation as reduced by the fair value of plan assets.
Plan assets are assets held by a long-term employee benefit fund. Plan assets are not available to the creditors of the Globe Group, nor can they be paid directly to the Globe Group. Fair value of plan assets is based on market price information.
2.18 Share-based Payment Transactions
The cost of equity-settled transactions with employees and directors is measured by reference to the fair value at the date at which they are granted. In valuing equity-settled transactions, vesting conditions, including performance conditions, other than market conditions (conditions linked to share prices), shall not be taken into account when estimating the fair value of the shares or share options at the measurement date. Instead, vesting conditions are taken into account in estimating the number of equity instruments that will vest.
The cost of equity-settled transactions is recognized in the consolidated profit or loss, together with a corresponding increase in equity, over the period in which the service conditions are fulfilled, ending on the date on which the relevant employees become fully entitled to the award (‘vesting date’). The cumulative expense recognized for equity-settled transactions at each reporting date until the vesting date reflects the extent to which the vesting period has expired and the number of awards that, in the opinion of the management of the Globe Group at that date, based on the best available estimate of the number of equity instruments, will ultimately vest. Costs of exercised awards plus the corresponding strike amount are reclassified to the appropriate capital accounts.
No expense is recognized for awards that do not ultimately vest, except for awards where vesting is conditional upon a market condition, which are treated as vesting irrespective of whether or not the market condition is satisfied, provided that all other performance conditions are satisfied.
Where the terms of an equity-settled award are modified, as a minimum, an expense is recognized as if the terms had not been modified. In addition, an expense is recognized for any increase in the value of the transaction as a result of the modification, measured at the date of modification. Where an equity-settled award is cancelled, it is treated as if it had vested on the date of cancellation, and any expense not yet recognized for the award is recognized immediately. However, if a new award is substituted for the cancelled award, and designated as a replacement award on the date that it is granted, the cancelled and new awards are treated as if they were a modification of the original award, as described in the previous paragraph. The dilutive effect of outstanding options is reflected as additional share dilution in the computation of earnings per share (EPS).
O Globe

�/30������������������
&�5�(�$�7�(���:�2�1�'�(�5�)�8�/��� ��
2.19 Borrowing Costs
Borrowing costs are capitalized if these are directly attributable to the acquisition, construction or production of a qualifying asset. Capitalization of borrowing costs commences when the activities for the asset’s intended use are in progress and expenditures and borrowing costs are being incurred. Borrowing costs are capitalized until the assets are ready for their intended use. Borrowing costs include interest charges and other related financing charges incurred in connection with the borrowing of funds, as well as exchange differences arising from foreign currency borrowings used to finance these projects to the extent that they are regarded as an adjustment to interest costs.
Other borrowing costs are recognized as expense in the period in which these are incurred.
2.20 Leases
2.20.1 Globe Group as Lessee
The Globe Group assesses whether a contract is or contains a lease, at inception of the contract. The Group recognizes a right of use asset and a corresponding lease liability with respect to all lease arrangements in which it is the lessee, except for short-term leases (defined as leases with a lease term of 12 months or less) and leases of low value assets.
Short-term leases and leases of low value assets
For short-term leases and leases of low value assets, the Globe Group recognizes the lease payments as an operating expense on a straight-line basis over the term of the lease unless another systematic basis is more representative of the time pattern in which economic benefits from the leased assets are consumed.
In identifying the lease term, the Globe Group takes into account the non-cancellable period for which it has the right to use the underlying asset, together with all of the following:
x the periods covered by an enforceable option to extend the lease (if the Globe Group isreasonably certain to exercise that option); and
x the periods covered by an enforceable option to terminate the lease (if the Globe Group isreasonably certain not to exercise that option).
The lease terms in arrangements wherein both the lessor and the lessee has the right to terminate the lease without incurring significant amount of penalty are excluded as part of the non-cancellable period of the lease.
Lease Liabilities
The lease liability is initially measured at the present value of the lease payments that are not paid at the commencement date, discounted using the Globe Group’s incremental borrowing rate.
Lease payments included in the measurement of the lease liability comprise:
x Fixed lease payments (including in-substance fixed payments), less any lease incentivesreceivable;
x Variable lease payments that depend on an index or rate, initially measured using the index orrate at the commencement date;
x The amount expected to be payable by the lessee under residual value guarantees;
x The exercise price of purchase options, if the lessee is reasonably certain to exercise theoptions; and
x Payments of penalties for terminating the lease, if the lease term reflects the exercise of anoption to terminate the lease.
C Globe

�����������������03/��
&�5�(�$�7�(���:�2�1�'�(�5�)�8�/��� ��
The lease liability is presented as a separate line in the consolidated statement of financial position. The lease liability is subsequently measured by increasing the carrying amount to reflect interest on the lease liability (using the effective interest method) and by reducing the carrying amount to reflect the lease payments made.
The Globe Group remeasures the lease liability (and makes a corresponding adjustment to the related right of use asset) whenever:
x The lease term has changed or there is a significant event or change in circumstancesresulting in a change in the assessment of exercise of a purchase option, in which case thelease liability is remeasured by discounting the revised lease payments using a reviseddiscount rate.
x The lease payments change due to changes in an index or rate or a change in expectedpayment under a guaranteed residual value, in which cases the lease liability is remeasuredby discounting the revised lease payments using an unchanged discount rate (unless thelease payments change is due to a change in a floating interest rate, in which case a reviseddiscount rate is used).
x A lease contract is modified and the lease modification is not accounted for as a separatelease, in which case the lease liability is remeasured based on the lease term of the modifiedlease by discounting the revised lease payments using a revised discount rate at the effectivedate of the modification.
The Group did not make any such adjustments during the periods presented.
Right of Use Assets
The right of use assets comprise the initial measurement of the corresponding lease liability, lease payments made at or before the commencement day, less any lease incentives received and any initial direct costs. They are subsequently measured at cost less accumulated depreciation and impairment losses.
Right of use assets are depreciated over the shorter period of lease term and useful life of the underlying asset. The depreciation starts at the commencement date of the lease.
The right of use assets are presented as a separate line in the consolidated statement of financial position.
The Globe Group applies its accounting policy on impairment of non-financial assets in determining whether a right of use asset is impaired and in accounting for any identified impairment loss.
2.21 Foreign Currency Transactions
Transactions in currencies other than functional currency of the entities included in the Globe Group are recorded at the rates of exchange prevailing on the dates of the transactions. At the end of each reporting period, monetary assets and liabilities that are denominated in currencies other than the functional currencies of the entities in the Globe Group are retranslated at the rates prevailing at the end of the reporting period. Gains and losses arising on retranslation are included in the consolidated profit or loss for the year. Non-monetary assets and liabilities that are measured in terms of historical cost in a foreign currency are not retranslated.
2.22 Income Tax
Income tax expense represents the sum of the current tax expense and deferred tax.
e Globe

�����������������03/��
&�5�(�$�7�(���:�2�1�'�(�5�)�8�/��� ��
Current Income Tax
The current tax expense is based on taxable profit for the year. Taxable profit differs from net profit as reported in the consolidated statements of comprehensive income because it excludes items of income or expense that are taxable or deductible in other years and it further excludes items that are never taxable or deductible.
2.22.1 Deferred Income Tax
Deferred tax is recognized on temporary differences between the carrying amounts of assets and liabilities in the consolidated financial statements and the corresponding tax bases used in the computation of taxable profit. Deferred tax liabilities are generally recognized for all taxable temporary differences. Deferred tax assets are generally recognized for all deductible temporary differences to the extent that it is probable that taxable profits will be available against which those deductible temporary differences can be utilized. Such deferred tax assets and liabilities are not recognized if the temporary difference arises from the initial recognition (other than in a business combination) of assets and liabilities in a transaction that affects neither the taxable profit nor the accounting profit. In addition, deferred tax liabilities are not recognized if the temporary difference arises from the initial recognition of goodwill.
Deferred tax liabilities are recognized for taxable temporary differences associated with investments in subsidiaries and associates, and interests in joint ventures, except where the Group is able to control the reversal of the temporary difference and it is probable that the temporary difference will not reverse in the foreseeable future. Deferred tax assets arising from deductible temporary differences associated with such investments and interests are only recognized to the extent that it is probable that there will be sufficient taxable profits against which to utilize the benefits of the temporary differences and they are expected to reverse in the foreseeable future.
The carrying amount of deferred tax assets is reviewed at the end of each reporting period and reduced to the extent that it is no longer probable that sufficient taxable profits will be available to allow all or part of the asset to be recovered.
Deferred tax liabilities and assets are measured at the tax rates that are expected to apply in the period in which the liability is settled or the asset realized, based on tax rates (and tax laws) that have been enacted or substantively enacted by the end of the reporting period.
Current tax and deferred tax for the year are recognized in the consolidated profit or loss, except when they relate to items that are recognized in other comprehensive income or directly in equity, in which case, the current and deferred tax are also recognized in other comprehensive income or directly in equity respectively. Where current tax or deferred tax arises from the initial accounting for a business combination, the tax effect is included in the accounting for the business combination.
@ Globe

�����������������03/��
&�5�(�$�7�(���:�2�1�'�(�5�)�8�/��� ��
2.23 EPS
Basic EPS is computed by dividing net income attributable to common stock by the weighted average number of common shares outstanding, after giving retroactive effect for any stock dividends, stock splits or reverse stock splits during the period.
Diluted EPS is computed by dividing net income attributable to common shareholders by the weighted average number of common shares outstanding during the period, after giving retroactive effect for any stock dividends, stock splits or reverse stock splits during the period, and adjusted for the effect of dilutive options and dilutive convertible preferred shares. Outstanding stock options will have a dilutive effect under the treasury stock method only when the average market price of the underlying common share during the period exceeds the exercise price of the option. If the required dividends to be declared on convertible preferred shares divided by the number of equivalent common shares, assuming such shares are converted, would decrease the basic EPS, then such convertible preferred shares would be deemed dilutive. Where the effect of the assumed conversion of the preferred shares and the exercise of all outstanding options have anti-dilutive effect, basic and diluted EPS are stated at the same amount.
2.24 Fair Value Measurement
Fair value is the price that would be received to sell an asset or paid to transfer a liability in an orderly transaction between market participants at the measurement date. The fair value measurement is based on the presumption that the transaction to sell the asset or transfer the liability takes place either:
� In the principal market for the asset or liability, or� In the absence of a principal market, in the most advantageous market for the asset or
liability.
The principal or the most advantageous market must be accessible to the Globe Group.
The fair value of an asset or a liability is measured using the assumptions that market participants would use when pricing the asset or liability, assuming that market participants act in their economic best interest.
A fair value measurement of a non-financial asset takes into account a market participant’s ability to generate economic benefits by using the asset in its highest and best use or by selling it to another market participant that would use the asset in its highest and best use.
The Globe Group uses valuation techniques that are appropriate in the circumstances and for which sufficient data are available to measure fair value, maximizing the use of relevant observable inputs and minimizing the use of unobservable inputs.
All assets and liabilities for which fair value is measured or disclosed in the financial statements are categorized within the fair value hierarchy, described as follows, based on the lowest level input that is significant to the fair value measurement as a whole:
� Level 1 - Quoted (unadjusted) market prices in active markets for identical assets or liabilities� Level 2 - Valuation techniques for which the lowest level input that is significant to the fair
value measurement is directly or indirectly observable� Level 3 - Valuation techniques for which the lowest level input that is significant to the fair
value measurement is unobservable
For the purpose of fair value disclosures, the Globe Group has determined classes of assets and liabilities on the basis of the nature, characteristics and risks of the asset or liability and the level of the fair value hierarchy as explained above (see Note 33.3).
O Globe

�/30������������������
&�5�(�$�7�(���:�2�1�'�(�5�)�8�/��� ��
2.25 Operating Segment
The Globe Group’s major operating business units are the basis upon which the Globe Group reports its primary segment information. The Globe Group’s business segments consist of: (1) mobile communication services and (2) wireline communication services.
All operating segments’ operating results are reviewed regularly by the Group’s Chief Operating Decision Maker (CODM) to make decisions about resources to be allocated to the segment and assess its performance, and for which discrete financial information is available. The Globe Group generally accounts for intersegment revenues and expenses at agreed transfer prices.
2.26 Events after the Reporting Period
Any post period-end event up to the date of approval of the BOD of the consolidated financial statements that provides additional information about the Globe Group’s position at the end of reporting period (adjusting event) is reflected in the consolidated financial statements. Any post period-end event that is not an adjusting event is disclosed in the consolidated financial statements when material.
3� Adoption of New Standards, Amendments to Standards and Interpretations
The accounting policies adopted in the preparation and presentation of the consolidated financial statements are consistent with prior years, except for the effects of the adoption of new and revised accounting standards set out below.
3.1 Adoption of PFRS 16, Leases Effective January 1, 2019
Prior to adoption of PFRS 16, the Globe Group recognizes rental expense on its operating leases on a straight line basis over the term of the lease. Upon adoption of PFRS 16 on January 1, 2019, the Globe Group recognizes right of use asset and lease liabilities in the consolidated statements of financial position which are initially measured at the present value of future lease payments of the non-cancellable periods of the lease. Right of use assets are subsequently depreciated on a straight line basis over the lease term. Lease liabilities are subsequently measured at amortized cost using effective interest method. The cash paid to settle the lease liabilities are presented as part of the Globe Group’s financing activity in the consolidated statements of cash flows.
For leases with terms of 12 months or less and leases of low value assets, the Globe Group opted to recognize lease expense on a straight-line basis as a practical expedient permitted under PFRS 16.
In identifying the lease term, the Globe Group takes into account the non-cancellable period for which it has the right to use the underlying asset, together with all of the following:
x the periods covered by an enforceable option to extend the lease (if the Globe Group isreasonably certain to exercise that option); and
x the periods covered by an enforceable option to terminate the lease (if the Globe Groupis reasonably certain not to exercise that option).
The lease terms in arrangements wherein both the lessor and the lessee has the right to terminate the lease without incurring significant amount of penalty are excluded as part of the non-cancellable period of the lease.
fb G1obe

�����������������03/��
&�5�(�$�7�(���:�2�1�'�(�5�)�8�/��� ��
In adopting PFRS 16, the Globe Group used the modified retrospective approach wherein the cumulative effect of the initial application of the standards were recognized at January 1, 2019, and the comparative periods were not restated. The Globe Group also applied transitional reliefs and practical expedients for the measurements of lease liabilities and right of use assets arising from leases previously classified as operating lease.
The following table shows the individual line items affected by the adjustments from the adoption
of PFRS 16. Accounts not affected by the new standards are excluded in the presentation.
December 31, 2018
Effect of PFRS 16
January 1, 2019
ASSETS (In Thousand Pesos) Prepayments and other current assets 16,254,796 (39,915) 16,214,881 Right of use – net - 3,483,205 3,483,205
LIABILITIES AND EQUITY
Liabilities Other long-term liabilities 5,367,209 (481,115) 4,886,094 Deferred income tax liabilities – net 3,918,493 144,146 4,062,639 Lease liabilities - 3,443,290 3,443,290
Equity Retained earnings 27,167,398 336,464 27,503,862 Non-controlling interest 24,172 505 24,677
Operating lease for which the lease term ends within 12 months
As a practical expedient, the Globe Group did not recognize right of use assets and lease liabilities in respect of leases previously classified as operating lease for which the lease term ends within 12 months from the date of initial application. Instead, these leases were accounted for in the same way as short-term leases.
Lease liabilities
Lease liabilities amounting to 3,443.29 million in respect of leases previously classified as operating leases were recognized in the consolidated statement of financial position at transition date. The transition lease liabilities were measured using the present value of future lease payments of the non-cancellable periods of the lease, discounted using the Globe Group’s incremental borrowing rate at transition date.
Right of use assets
Right of use assets amounting to 3,483.21 million in respect of leases previously classified as operating leases were recognized in the consolidated statement of financial position at transition date. The right of use assets at transition date were measured at an amount equal to the lease liability, adjusted by the prepaid rentals relating to those leases that remained outstanding in the consolidated statement of financial position immediately before the date of initial application. Total prepaid rentals reclassified to right of use assets at transition date amounted 39.92 million.
O Globe

�����������������03/��
&�5�(�$�7�(���:�2�1�'�(�5�)�8�/��� ��
Accrued long-term leases
Accrued long-term leases amounting 481.12 million at transition date arising from the straight-line recognition of lease expense in respect of leases previously classified as operating leases were derecognized in the statement of financial position with corresponding net of tax adjustment to retained earnings and non-controlling interest amounting to 336.46 million and 0.51 million, respectively.
The lease liabilities as at January 1, 2019 can be reconciled to the operating lease commitments as
of 31 December 2018, as follows:
Operating lease commitments as of December 31, 2018 5,328,989 Weighted average incremental borrowing rate as at January 1, 2019 7.91%
Discounted operating lease commitments as at January 1, 2019 4,578,501 Commitments relating to short-term lease and low value assets (1,135,211)
Lease liabilities as of January 1, 2019 3,443,290
3.2 Adoption of Standards Effective January 1, 2019 With No Material Impact
In the current year, the Globe Group has applied a number of amendments to PFRS and interpretation issued by IASB that are effective for annual period that begins on January 1, 2019. The adoption has not had any material impact on the disclosures or on the amounts reported in the consolidated financial statements.
3.2.1 PFRS 9 - Prepayment Features with Negative Compensation
The amendments to PFRS 9 clarified that for the purpose of assessing whether a prepayment feature meets the Solely Payments of Principal and Interest (SPPI) condition, the party exercising the option may pay or receive reasonable compensation for the prepayment irrespective of the reason for prepayment. In other words, prepayment features with negative compensation do not automatically fail SPPI.
3.2.2 PAS 28 - Long-term Interests in Associates and Joint Ventures
The amendment clarifies that PFRS 9, including its impairment requirements, applies to long‑term interests. Furthermore, in applying PFRS 9 to long‑term interests, an entity does not take into account adjustments to their carrying amount required by PAS 28 (i.e., adjustments to the carrying amount of long‑term interests arising from the allocation of losses of the investee or assessment of impairment in accordance with PAS 28).
3.2.3 PAS 19 - Employee Benefits, Plan Amendment, Curtailment or Settlement
The amendments require entities to use updated actuarial assumptions to determine current service cost and net interest for the remainder of the annual reporting period after such an event. The amendments also clarify how the requirements for accounting for a plan amendment, curtailment or settlement affect the asset ceiling requirements. The amendments do not address the accounting for ‘significant market fluctuations’ in the absence of a plan amendment, curtailment or settlement.
O Globe

�����������������03/��
&�5�(�$�7�(���:�2�1�'�(�5�)�8�/��� ��
3.2.4 PFRS 3 - Business Combinations
The amendments to PFRS 3 clarified that when an entity obtains control of a business that is a joint operation, the entity applies the requirements for a business combination achieved in stages, including remeasuring its previously held interest (PHI) in the joint operation at fair value. The PHI to be remeasured includes any unrecognized assets, liabilities and goodwill relating to the joint operation.
3.2.5 Amendments to PFRS 11 - Joint Arrangements
The amendments to PFRS 11 clarified that when a party that participates in, but does not have joint control of, a joint operation that is a business obtains joint control of such a joint operation, the entity does not remeasure its PHI in the joint operation.
3.2.6 PAS 12 - Income Tax Consequences of Payments on Financial Instruments Classified as Equity
The amendments clarified that an entity should recognize the income tax consequences of dividends in profit or loss, other comprehensive income or equity according to where the entity originally recognized the transactions that generated the distributable profits. This is the case irrespective of whether different tax rates apply to distributed and undistributed profits.
3.2.7 PAS 23 - Borrowing Costs Eligible for Capitalization The amendments clarified that if any specific borrowing remains outstanding after the related asset is ready for its intended use or sale, that borrowing becomes part of the funds that an entity borrows generally when calculating the capitalization rate on general borrowings.
3.2.8 IFRIC 23 - Uncertainty over Income Tax Treatments
IFRIC 23 sets out how to determine the accounting tax position when there is uncertainty over income tax treatments. The interpretation requires an entity to:
� determine whether uncertain tax positions are assessed separately or as a group; and� assess whether it is probable that a tax authority will accept an uncertain tax treatment used,
or proposed to be used, by an entity in its income tax filings;� If yes, the entity should determine its accounting tax position consistently with the tax
treatment used or planned to be used in its income tax filings.� If no, the entity should reflect the effect of uncertainty in determining its accounting tax
position.
3.3 New and Revised Standards Not Yet Effective
At the date of authorization of these consolidated financial statements, the Globe Group has not applied the following new and revised PFRS that have been issued but are not yet effective. The Globe Group anticipates that the application of these new and revised standards will not have a material impact on the Globe Group's consolidated financial statements in future periods.
O Globe

�����������������03/��
&�5�(�$�7�(���:�2�1�'�(�5�)�8�/��� ��
3.3.1 PFRS 10 and PAS 28 (amendments) Sale or Contribution of Assets between an Investor and its Associate or Joint Venture
The amendments to PFRS 10 and PAS 28 deal with situations where there is a sale or contribution of assets between an investor and its associate or joint venture. Specifically, the amendments state that gains or losses resulting from the loss of control of a subsidiary that does not contain a business in a transaction with an associate or a joint venture that is accounted for using the equity method, are recognized in the parent’s profit or loss only to the extent of the unrelated investors’ interests in that associate or joint venture. Similarly, gains and losses resulting from the remeasurement of investments retained in any former subsidiary (that has become an associate or a joint venture that is accounted for using the equity method) to fair value are recognized in the former parent’s profit or loss only to the extent of the unrelated investors’ interests in the new associate or joint venture.
The effective date of the amendments has yet to be set by the IASB; however, earlier application of the amendments is permitted.
3.3.2 Amendments to IFRS 3 Definition of a Business
The amendments clarify that while businesses usually have outputs, outputs are not required for an integrated set of activities and assets to qualify as a business. To be considered a business an acquired set of activities and assets must include, at a minimum, an input and a substantive process that together significantly contribute to the ability to create outputs.
Additional guidance is provided that helps to determine whether a substantive process has been acquired.
The amendments introduce an optional concentration test that permits a simplified assessment of whether an acquired set of activities and assets is not a business. Under the optional concentration test, the acquired set of activities and assets is not a business if substantially all of the fair value of the gross assets acquired is concentrated in a single identifiable asset or group of similar assets.
The amendments are applied prospectively to all business combinations and asset acquisitions for which the acquisition date is on or after the first annual reporting period beginning on or after January 1, 2020, with early application permitted.
3.3.3 Amendments to PAS 1 and PAS 8 Definition of Material
The amendments are intended to make the definition of material in PAS 1 easier to understand and are not intended to alter the underlying concept of materiality in PFRS. The concept of ‘obscuring’ material information with immaterial information has been included as part of the new definition.
The threshold for materiality influencing users has been changed from ‘could influence’ to ‘could reasonably be expected to influence’.
The definition of material in PAS 8 has been replaced by a reference to the definition of material in PAS 1. In addition, the IASB amended other Standards and the Conceptual Framework that contain a definition of material or refer to the term ‘material’ to ensure consistency.
The amendments are applied prospectively for annual periods beginning on or after January 1, 2020, with earlier application permitted.
C Globe

�����������������03/��
&�5�(�$�7�(���:�2�1�'�(�5�)�8�/��� ��
3.3.4 Amendments to References to the Conceptual Framework in IFRS Standards
Together with the revised Conceptual Framework, which became effective upon publication on March 28, 2018, the IASB has also issued Amendments to References to the Conceptual Framework in PFRS Standards. The document contains amendments to PFRS 2, PFRS 3, PFRS 6, PFRS 14, PAS 1, PAS 8, PAS 34, PAS 37, PAS 38, IFRIC 12, IFRIC 19, IFRIC 20, IFRIC 22, and SIC-32.
Not all amendments, however, update those pronouncements with regard to references to and quotes from the framework so that they refer to the revised Conceptual Framework. Some pronouncements are only updated to indicate which version of the Framework they are referencing to (the IASC Framework adopted by the IASB in 2001, the IASB Framework of 2010, or the new revised Framework of 2018) or to indicate that definitions in the Standard have not been updated with the new definitions developed in the revised Conceptual Framework.
The amendments, where they actually are updates, are effective for annual periods beginning on or after January 1, 2020, with early application permitted.
3.4 Adoption of Standards Effective January 1, 2018
The Globe Group adopted PFRS 9 and 15 when they became effective on January 1, 2018.
The adoption of expected credit loss method of impairment under PFRS 9 resulted in recognition of additional allowance for doubtful debts on subscribers’ receivables at transition date.
In adopting PFRS 15, the Globe Group identified all performance obligations from its contracts with subscribers and assessed whether they are separately identifiable and capable of being distinct. For each identified distinct performance obligation, the Globe Group performed re-allocation of contract consideration based on their relative stand-alone selling prices. These resulted in recognition of contract assets and contract liabilities at transition date. The Globe Group also capitalized certain costs that were identified to be incremental in obtaining and fulfilling its contracts with subscribers which resulted in the recognition of deferred contract costs at transition date.
In adopting PFRS 9 and 15, the Globe Group used the modified retrospective approach wherein the cumulative effect of the initial application of the standards were recognized at January 1, 2018, and the comparative periods were not restated.
O Globe

�����������������03/��
&�5�(�$�7�(���:�2�1�'�(�5�)�8�/��� ��
The following table shows the individual line items affected by the adjustments from the adoption of PFRS 15 and 9. Accounts not affected by the new standards are excluded in the presentation.
December 31, 2017
Effect of PFRS 9
Effect of PFRS 15
January 1, 2018
ASSETS (In Thousand Pesos) Trade receivables – net 27,304,288 (7,980,751) (640,605) 18,682,932 Contract assets and deferred
contract costs-net - - 8,002,909 8,002,909 Deferred income tax assets – net 2,761,626 390,432 (276,284) 2,875,774
LIABILITIES AND EQUITY
Liabilities Unearned revenues 5,509,773 - (5,509,773) - Contract liabilities and deferred
revenues - - 5,898,136 5,898,136 Deferred income tax liabilities – net 2,748,826 (2,003,793) 1,815,898 2,560,931
Equity Retained earnings 21,708,003 (5,581,683) 4,880,805 21,007,125 Non-controlling interest 42,713 (4,843) 954 38,824
4� Managementʼs Significant Accounting Judgments and Use of Estimates and Assumptions
The preparation of the consolidated financial statements in conformity with PFRS requires management to make judgments, estimates and assumptions that affect the amounts reported in the consolidated financial statements and accompanying notes. The judgments, estimates and assumptions used in the consolidated financial statements are based upon management’s evaluation of relevant facts and circumstances as of the date of the consolidated financial statements. Actual results could differ from such judgments, estimates and assumptions.
Judgments, estimates and assumptions are continually evaluated and are based on historical experience and other factors, including expectations of future events that are believed to be reasonable under the circumstances.
4.1 Critical Accounting Judgments
4.1.1 Allocation of Goodwill and Investments in Joint Ventures to Cash-Generating Units
For the purpose of performing annual impairment review, the Globe Group allocates the carrying amount of goodwill from acquisition of BTI and investment in VTI, BAHC and BHC to the CGU of mobile communications services or wireless segment. The Globe Group believes that CGUs represent the lowest level within the Globe Group at which the goodwill is monitored for internal management reporting purposes and not larger than an operating segment determined in accordance with PFRS 8.
O Globe

�����������������03/��
&�5�(�$�7�(���:�2�1�'�(�5�)�8�/��� ��
4.1.2 Contact Assets on Bundled Products
The Globe Group provides wireless communication services to subscribers which are bundled with handset sales. Based on the Globe Group’s assessment, the performance obligations from the wireless communication services and the sale of handsets are both capable of being distinct and separately identifiable. Accordingly, the Globe Group allocates the total contract consideration to the two performance obligations based on their corresponding relative SSP. Contract asset is recognized for any unbilled amount allocated to the revenue from handset sales.
4.1.3 Contract Liabilities on Installation Services
The Globe Group provides equipment installation services bundled together with wireline communication services. Based on the Globe Group’s assessment, the installation services is not distinct from the wireline communication services and thus, deemed as one performance obligation. Accordingly, revenues from the installation and wireline communication services are recognized over time throughout the period of the subscription contract.
4.1.4 Deferred Contract Costs
The Globe Group incurs certain commissions and installation costs in relation to the service provided to its subscribers. Based on the Globe Group’s assessment, these costs are incremental in obtaining and fulfilling its performance obligations. Accordingly, the Globe Group recognizes deferred contracts costs which are amortized as expense throughout the period of the subscription contract.
4.1.5 Determination of SSP in arrangements with multiple performance obligations
In revenue arrangements involving multiple performance obligations, the transaction price are allocated to each separate performance obligation based on the relative SSP of the goods or services being provided to the customer. The best evidence of SSP is the price an entity charges for that good or service when the entity sells it separately in similar circumstances to similar customers. However, goods or services are not always sold separately. In such case, the SSP need to be estimated or derived by other means.
The Globe Group maximized the use of all available observable inputs and applied the expected cost plus margin or adjusted market approach as the estimation method in determining the SSP of the goods and services in arrangements with multiple performance obligations.
4.1.6 Determination of Whether the Globe Group is Acting as a Principal or an Agent
The Globe Group’s VAS offers a full range of downloadable content covering multiple topics including news, information, and entertainment wherein another party is involved in providing such services. In such case, the Globe Group assesses each arrangement and determines whether the nature of its promise is to provide the specified services itself or arrange for those services to be provided by the other party.
If the promise in an arrangement is to provide the services itself, the Globe Group recognizes the service revenue at gross amount of consideration. Otherwise, the Globe Group recognizes service revenues equivalent only to the extent of fees or commission to which it expects to be entitled in exchange for arranging the services.
C Globe

�/30������������������
&�5�(�$�7�(���:�2�1�'�(�5�)�8�/��� ��
4.1.7 Financial Asset Business Model Assessment
Classification and measurement of financial assets depends on the results of the SPPI and the business model test. The Globe Group determines the business model at a level that reflects how groups of financial assets are managed together to achieve a particular business objective. This assessment includes judgement reflecting all relevant evidence including how the performance of the assets is evaluated and their performance measured, the risks that affect the performance of the assets and how these are managed and how the managers of the assets are compensated.
Except for the derivative instruments, the Globe Group classified all of its non-equity instrument financial assets as financial assets at amortized cost in accordance with the SPPI and business model test requirements of PFRS 9.
4.2 Key Estimation Uncertainties
4.2.1 Deferred Revenues on Globe Rewards
The Globe Group allocates a portion of the transaction price of its service revenues to Globe Rewards points and recognizes the corresponding deferred revenues. The allocation is based on its relative SSP per point which is determined based on the expected discount or free products that will be availed when the points are redeemed by the subscriber. The Globe Group uses historical data and trends in estimating the SSP of rewards points. The amounts and timing of recording revenues would be affected by changes in circumstances and trends. An increase in the estimated SSP per point would increase the recognized deferred revenues and decrease the revenues for the period.
As of December 31, 2019 and 2018, the estimated liability for unredeemed points included in deferred revenues in the consolidated statements of financial position amounted to 1,431.10 million and 1,542.58 million, respectively (See Note 7.2).
4.2.2 ECL Impairment on Subscribers Receivables and Contract Assets
When measuring ECL the Globe Group uses reasonable and supportable forward looking information, which is based on assumptions for the future movement of different economic drivers and how these drivers will affect each other. Loss given default is an estimate of the loss arising on default. It is based on the difference between the contractual cash flows due and those that the lender would expect to receive, taking into account cash flows from collateral and integral credit enhancements.
Probability of default constitutes a key input in measuring ECL. Probability of default is an estimate of the likelihood of default over a given time horizon, the calculation of which includes historical data, assumptions and expectations of future conditions.
An increase in ECL rates on subscribers receivables and contract assets would increase the loss allowance recognized in the consolidated profit or loss.
Impairment loss recognized using ECL in 2019 and 2018 on subscribers receivable amounted to 3,147.13 million and 2,955.27 million, and contract assets amounted to 256.90 million and 457.66 million, respectively (see Note 28).
C Globe

�����������������03/��
&�5�(�$�7�(���:�2�1�'�(�5�)�8�/��� ��
4.2.3 Inventory Obsolescence and Market Decline
The Globe Group, in determining the NRV, considers any adjustment necessary for obsolescence which is generally provided for nonmoving items after a certain period. The Globe Group adjusts the cost of inventory to the recoverable value at a level considered adequate to reflect market decline in the value of the recorded inventories. The Globe Group reviews the classification of the inventories and generally provides adjustments for recoverable values of new, actively sold and slow-moving inventories by reference to prevailing values of the same inventories in the market.
The amount and timing of recorded expenses for any period would differ if different estimates were utilized. An increase in allowance for inventory obsolescence and market decline would decrease the profit for the period, and decrease current assets.
Inventory obsolescence and market decline in 2019, 2018 and 2017 amounted to 713.72 million, 377.78 million and 403.04 million, respectively (see Note 9 and 28).
Inventories and supplies, net of allowances, amounted to 4,713.57 million and 4,854.94 million as of December 31, 2019 and 2018, respectively (see Note 9).
4.2.4 ARO
The Globe Group recognizes ARO in relation to its obligations to bear the costs of dismantling the constructed assets in leased properties and to restore such properties to the original condition at the end of the lease period. The recognition of ARO requires the Globe Group to estimate the future restoration and dismantling costs and determine the appropriate discount rate to be applied in the present value calculation. The amount and timing of recorded expenses for any period would differ if different inputs in the estimates were utilized. An increase in ARO would increase recorded expenses and increase noncurrent liabilities.
As of December 31, 2019 and 2018, ARO amounted to 2,742.63 million and 2,523.94 million, respectively (see Note 20).
4.2.5 EUL of Property and Equipment, Intangible Assets and Right of Use Assets
The useful life of each of the item of property and equipment, intangible assets and right of use assets with finite useful lives is estimated based on the period over which the asset is expected to be available for use. Such estimation is based on a collective assessment of industry practice, internal technical evaluation and experience with similar assets and expected asset utilization based on future technological developments and market behavior.
It is possible that future results of operations could be materially affected by changes in these estimates brought about by changes in the factors mentioned. A reduction in the EUL of property and equipment, intangible assets and right of use assets would increase the recorded depreciation and amortization expense and decrease noncurrent assets.
The carrying amounts of property and equipment with finite useful lives amounted to 180,387.74 million and 167,118.98 million, as of December 31, 2019 and 2018, respectively (see Note 11).
The carrying amounts of intangible assets with finite useful lives amounted to 12,653.78 million and 12,558.02 million, as of December 31, 2019 and 2018, respectively (see Note 12).
The carrying amounts of right of use assets amounted to 3,556.28 million as of December 31, 2019 (see Note 13).
C Globe

�����������������03/��
&�5�(�$�7�(���:�2�1�'�(�5�)�8�/��� ��
4.2.6 Impairment of Nonfinancial Assets Other Than Goodwill
The Globe Group performs an impairment review when certain impairment indicators are present.
Determining the recoverable amounts of property and equipment, intangible assets, right of use assets and investments in associates and joint ventures requires the Globe Group to make estimates and assumptions on the cash flows expected to be generated from those assets. While the Globe Group believes that the assumptions are appropriate and reasonable, significant changes in the assumptions may materially affect the assessment of recoverable values and may lead to impairment charges. Any resulting impairment loss could have a material adverse impact on the financial position and results of operations.
The aggregate carrying value of property and equipment, intangible assets (excluding goodwill), right of use assets and investments amounted to 233,356.45 million and 216,378.57 million as of December 31, 2019 and 2018, respectively (see Notes 11, 12, 13 and 15).
Impairment loss recognized on property and equipment amounted to 59.16 million, 61.74 million and 28.32 million in 2019, 2018 and 2017, respectively (see Note 28).
Impairment loss recognized on investment in associate amounted to QLO in 2019 and 2018, and 286.04 million in 2017, respectively (Note 28).
4.2.7 Impairment of Goodwill
The Globe Group’s impairment test for goodwill is based on value in use calculations that use a discounted cash flow model. The cash flows of the CGU are derived from the business plan for the next five years and do not include restructuring activities that the Globe Group is not yet committed to or significant future investments that will enhance the asset base of the CGU being tested. The recoverable amount is most sensitive to the discount rate used for the discounted cash flow model as well as the expected future cash inflows and the growth rate used for extrapolation purposes. As of December 31, 2019 and 2018, the carrying value of goodwill amounted to 2,899.32 million and 1,140.25 million, respectively (see Note 12).
In 2018, management determined that the recoverable amount of goodwill related to the acquisition of TAO and Socialytics are less than its carrying value. Accordingly, the Globe Group recognized impairment loss amounting to 140.40 million and 2.39 million, respectively (see Notes 12 and 28). No impairment loss on goodwill was recognized in 2019 and 2017.
4.2.8 Deferred Income Tax Assets
The carrying amounts of deferred income tax assets are reviewed at each reporting date and reduced to the extent that it is no longer probable that sufficient taxable income will be available to allow all or part of the deferred income tax assets to be utilized.
As of December 31, 2019 and 2018, the combined gross deferred tax assets of the Globe Group amounted to 10,178.55 million and 10,437.19 million, respectively (see Note 30).
C Globe

�����������������03/��
&�5�(�$�7�(���:�2�1�'�(�5�)�8�/��� ��
4.2.9 Pension Benefits
The determination of the retirement obligation cost and retirement benefits is dependent on the selection of certain assumptions used by independent actuaries in calculating such amounts. Those assumptions include among others, discount rates and rates of compensation increase. Actual results that differ from the assumptions are charged to other comprehensive income and therefore, generally affect the equity and recorded obligation. While the Globe Group believes that the assumptions are reasonable and appropriate, significant differences in the actual experience or significant changes in the assumptions may materially affect the pension and other retirement obligations.
The net pension liability as of December 31, 2019 and 2018 amounted to 3,738.43 million and 1,459.46 million, respectively. Further details are provided in Note 29.2.
4.2.10 Share-based Compensation
The Globe Group also determines the cost of equity-settled transactions using assumptions on the appropriate pricing model. Significant assumptions for the cost of share-based payments include, among others, share price, exercise price, option life, expected dividend and expected volatility rate. While the Globe Group believes that the assumptions are reasonable and appropriate, significant differences in the assumptions may materially affect the recognized expense and equity.
Cost of share-based payments in 2019, 2018 and 2017 amounted to 325.16 million, 236.71 million and 104.83 million, respectively (see Note 29).
4.2.11 Fair Values of Identifiable Assets and Liabilities in a Business Combination
When a business combination occurs, the fair values of the identifiable assets and liabilities assumed, including intangible assets, are recognized in the consolidated statement of financial position.
The determination of the fair values of acquired assets and liabilities is based, to a considerable extent, on management’s judgment and estimates. The Globe Group selects the most appropriate valuation methodologies which may include the net present value techniques, comparison to similar assets for which market observable prices exist and other relevant valuation models. If the purchase consideration exceeds the fair value of the net assets acquired then the difference is recognized as goodwill. If the purchase price consideration is lower than the fair value of the assets acquired then a gain is recognized in the consolidated profit or loss.
The final fair values of the net assets of Yondu at the time of acquisition amounted to 462.56 million (see Note 14.1).
The final fair values of the net assets of EC Pay at the time of acquisition amounted to 417.47 million (see Note 14.2).
4.2.12 Fair Values of Unquoted Equity Securities
When the fair value of an investment in equity security is required to be measured at fair value and the fair value cannot be derived from active markets, the Globe Group uses valuation techniques including the discounted cash flow analysis and other relevant valuation models to determine the fair value of the instrument. The inputs to these models are taken from observable markets where possible, but where this is not feasible, a degree of judgment is required in establishing fair values. Changes in assumptions about these factors could affect the reported fair value of the instrument and may also affect the consolidated profit or loss.
O Globe

�����������������03/��
&�5�(�$�7�(���:�2�1�'�(�5�)�8�/��� ��
The fair value of the Globe Group’s investments in unquoted equity instruments classified as financial assets at FVOCI amounted to 2,137.78 million and 1,442.94 million as of December 31, 2019 and 2018, respectively (see Note 16).
4.2.13 Provisions and Contingencies
The Globe Group is currently involved in various legal proceedings. The estimate of the probable costs for the resolution of these claims has been developed in consultation with internal and external counsel handling the Globe Group’s defense in these matters and is based upon an analysis of potential results. The Globe Group currently does not believe that these proceedings will have a material adverse effect on the consolidated statements of financial position and financial performance. It is possible, however, that future financial performance could be materially affected by changes in the estimates or in the effectiveness of the strategies relating to these proceedings (see Note 18).
The Globe Group’s provision as of December 31, 2019 and 2018 amount to 2,622.32 million and 2,549.39 million, respectively (see Note 18).
5� Cash and Cash Equivalents
Cash equivalents are short term highly liquid investments with insignificant risk of changes in value. The cash and cash equivalents account consists of the following as of December 31:
2019 2018
(In Thousand Pesos) Cash on hand and in banks 3,728,294 2,018,910 Short-term money market placements 4,569,798 21,207,476
8,298,092 23,226,386
Cash in banks earn interest at respective bank deposit rates.
Interest income from cash and cash equivalents are as follows (see Note 23):
2019 2018 2017
(In Thousand Pesos) Short-term money market placements 440,402 332,525 71,876 Cash on hand and in banks 17,158 12,353 18,007
457,560 344,878 89,883
The ranges of interest rates of the above placements are as follows:
2019 2018 2017
Placements: PHP 0.175% to 7.00% 0.375% to 6.00% 0.10% to 3.70% USD 0.50% to 2.60% 0.10% to 2.75% 0.05% to 1.75%
O Globe

�����������������03/��
&�5�(�$�7�(���:�2�1�'�(�5�)�8�/��� ��
The principal noncash transactions are as follows:
Notes 2019 2018 2017
(In Thousand Pesos) Unpaid purchase consideration from
acquisition of EC Pay 14.2 76,329 - - Movements in liabilities related to the
acquisition of property and equipment (6,514,835) (7,800,727) 8,076,049 Capitalized ARO 20 38,997 9,831 97,079 Uncollected proceeds from sale of AFPI 15.2 240,000 - -
Cash flows from financing activities include non-cash change arising from foreign exchange gains or losses and amortization of debt issue cost and others amounting to 1,269.98 million and 926.20 million in 2019 and 2018, respectively.
Unpaid cash dividends declared related to non-voting preferred stock amounted to 260.03�PLOOLRQ�DV�DW�December 31, 2019 and 2018�(see Note 22.3).
6� Trade receivables - net
This account consists of receivables from:
Notes 2019 2018
(In Thousand Pesos) Subscribers 23,554,867 27,798,284 Traffic settlements - net 33.2, 35.1 1,904,982 2,868,396 Dealers 1,935,236 1,527,340 Others 3,161,346 981,399
30,556,431 33,175,419
Less allowance for impairment losses: Subscribers 8,618,104 11,932,762 Traffic settlements and others 799,377 590,125
9,417,481 12,522,887
21,138,950 20,652,532
Trade receivables are noninterest-bearing and are generally due within twelve months.
Subscriber receivables arise from wireless and wireline voice, data communications and broadband internet services provided by the Globe Group under postpaid arrangements.
Traffic settlement receivables are presented net of traffic settlement payables from the same carrier (see Notes 33.2 and 35.1).
Others include trade receivables of non-telco subsidiaries and receivables from credit card companies.
O Globe

�����������������03/��
&�5�(�$�7�(���:�2�1�'�(�5�)�8�/��� ��
The following is a reconciliation of the changes in the allowance for impairment losses for trade receivables as of December 31:
Consumer Key Corporate
Accounts
Other
Corporations and SME
Traffic Settlements and Others Total
(In Thousand Pesos)
2019 December 31, 2018 7,292,652 3,261,130 1,378,980 590,125 12,522,887 Charges for the period (Note 28) 2,332,884 593,716 220,534 193,022 3,340,156 Arising from acquisition of a subsidiary - - - 7,178 7,178 Recoveries and write-offs – net (5,385,716) (323,906) (752,170) 9,052 (6,452,740)
December 31, 2019 4,239,820 3,530,940 847,344 799,377 9,417,481
2018 December 31, 2017 5,475,745 1,934,247 1,108,220 613,399 9,131,611 Transition adjustment (Note 3.4) 6,085,336 990,360 905,055 - 7,980,751January 1, 2018 11,561,081 2,924,607 2,013,275 613,399 17,112,362 Charges for the period (Note 28) 2,244,503 458,421 252,343 17,078 2,972,345 Recoveries and write-offs – net (6,512,932) (121,898) (886,638) (40,352) (7,561,820)
December 31, 2018 7,292,652 3,261,130 1,378,980 590,125 12,522,887
7� Contracts with Customers
7.1 Contract Assets and Deferred Contract Costs – net
The following table provides the components of contract assets and deferred contract costs as of December 31:
2019 2018
(In Thousand Pesos)�
Contract assets 7,045,794 7,124,332�Deferred contract costs 1,583,088 1,662,891
8,628,882 8,787,223 Less current portion of deferred contract costs 8,339,219 8,471,550
Noncurrent portion 289,663 315,673
O Globe

�����������������03/��
&�5�(�$�7�(���:�2�1�'�(�5�)�8�/��� ��
7.1.1 Contract Assets
The following table provides information about contract assets with customers:
Notes 2019 2018
(In Thousand Pesos) Contract assets Balance at beginning of the year 8,672,121 - Transition adjustment 3.4 - 7,479,169Additions during the year 8,717,202 9,273,004Reductions during the year (8,538,842) (8,080,052) Write-off (889,209) -
Balance at end of year 7,961,272 8,672,121 Allowance for impairment loss Balance at beginning of the year (1,547,789) - Transition adjustment 3.4 - (1,090,132)Impairment loss 28 (256,898) (457,657)Write-off 889,209 -
Balance at end of year (915,478) (1,547,789)
Contract assets - net 7,045,794 7,124,332
The Globe Group provides wireless communication services to subscribers which are bundled with sale of handsets and other devices. The Globe Group allocates the revenue based on the SSP of each performance obligation. Contract assets are recognized for the unbilled portion of revenue allocated to the sale of handset and other devices which will be reduced as the monthly service fees are billed to the subscribers.
7.1.2 Deferred Contract Costs
Deferred contract costs pertain to incremental costs incurred in the effort to obtain and fulfill the contract with subscribers. Details are as follows:
2019 2018
(In Thousand Pesos) Cost to obtain contracts with customers: Commissions 1,039,265 1,140,838
Cost to fulfill contracts with customers Installation costs 543,823 522,053
1,583,088 1,662,891
O Globe

�/30������������������
&�5�(�$�7�(���:�2�1�'�(�5�)�8�/��� ��
Deferred contract costs are capitalized and subsequently amortized on a straight-line basis over the term of the subscription contract. Movements in the deferred contract costs for the period are as follows:
Note 2019 2018
(In Thousand Pesos) Balance at beginning of the year 1,662,891 ��Transition adjustment 3.4 - 1,613,872 Amounts capitalized during the period 2,051,580 2,088,422 Amounts recognized as expense (2,131,383) (2,039,403)
Balance at the end of the year 1,583,088 1,662,891
7.2 Contract Liabilities and Other Deferred Revenues
The following table provides information about the contract liabilities and other deferred revenues:
2019 2018
(In Thousand Pesos) Current Deferred revenue from wireless subscribers under
prepaid arrangements 4,094,957 3,280,864 Advance monthly service fees 2,937,868 2,903,529 Deferred revenue rewards 1,431,103 1,542,584 Contract liability from wireline services 241,419 307,101 Others 59,456 10,230
8,764,803 8,044,308
Noncurrent Contract liability from wireline services 49,869 53,642
8,814,672 8,097,950
The following table shows the roll forward analysis of contract liabilities:
Note 2019 2018
(In Thousand Pesos) Contract liabilities Balance at beginning of the year 360,743 ��Transition adjustment 3.4 - 388,363 Additions during the year 469,329 563,016 Recognized as revenue during the year (538,784) (590,636)
Balance at end of year 291,288 360,743
Deferred revenues from wireless subscribers under prepaid arrangements are recognized as revenues upon actual usage of airtime value, consumption of prepaid subscription fees or upon expiration of the unused load value prepaid credit.
Advance monthly service fees represent advance collections from postpaid subscribers.
Deferred revenue rewards represent unredeemed customer award credit under customer loyalty program.
Contract liability from wireline services represents collected upfront fees for equipment installation for which revenues are recognized over the subscription period.
O Globe

�����������������03/��
&�5�(�$�7�(���:�2�1�'�(�5�)�8�/��� ��
8� Derivative Financial Instruments
The Globe Group’s freestanding and embedded derivative financial instruments are accounted for as hedges or transactions not designated as hedges. The table below sets out information about the Globe Group’s derivative financial instruments and the related fair values as of December 31:
2019
USD Notional Amount
PHP Notional Amount
Derivative Assets
Derivative Liabilities
(In Thousands) Derivative instruments designated as hedges Cash flow hedges
Cross currency swaps* $298,450 - 205,290 679,628 Principal only swaps** 97,700 - 217,622 53,016 Interest rate swaps 77,700 - 2,784 34,714
Derivative instruments not designated as hedges Freestandng
Deliverable forwards* 82,000 - 1,259 13,273 Nondeliverable forwards* 30,000 - - 57,685
Net 426,955 838,316
2018
USD Notional Amount
PHP Notional Amount
Derivative Assets
Derivative Liabilities
(In Thousands) Derivative instruments designated as hedges Cash flow hedges
Cross currency swaps* $300,000 - 1,787,777 203,983 Principal only swaps** 86,400 - 528,297 32,010 Interest rate swaps 61,400 - 47,292 -
Derivative instruments not designated as hedges Freestandng
Deliverable forwards 80,000 - - 75,661
Net 2,363,366 311,654
*Pay-fixed rate 4.15%-6.68%, received floating rate USD LIBOR+(0.60%-1.00%) ** Pay-fixed rate 1.31%-2.3%
The subsequent sections will discuss the Globe Group’s derivative financial instruments according to the type of financial risk being managed and the details of derivative financial instruments that are categorized into those accounted for as hedges and those that are not designated as hedges.
C Globe

�����������������03/��
&�5�(�$�7�(���:�2�1�'�(�5�)�8�/��� ��
8.1 Derivative Instruments Accounted for as Hedges
The following sections discuss in detail the derivative instruments accounted for as cash flow hedges.
x Currency Swaps and Cross Currency Swaps
The Globe Group entered into cross currency swap contracts and principal only swaps contract to hedge the foreign exchange and interest rate risk on dollar loans. The cross currency swaps have a notional amount of USD298.45 million and USD300.00 million as of December 31, 2019 and 2018, respectively. Principal only swaps have a notional amount of USD97.70 million and USD86.4 million as of December 31, 2019 and 2018, respectively. The fair values of the currency swaps as of December 31, 2019 and 2018 amounted to net liability of 309.73 million and net asset of 2,080.08 million, respectively, of which 242.09 million and 915.81 million (net of tax), respectively is included in “Other reserves” in the equity section of the consolidated statements of financial position (see Note 22.6).
x Interest Rate Swaps
As of December 31, 2019 and 2018, the Globe Group has USD77.70 million and USD61.40 million in notional amount of USD interest rate swap that have been designated as cash flow hedge of interest rate risk from USD loans. The interest rate swap effectively fixed the benchmark rate of the hedged USD loan at 2% over the duration of the agreement, which involves quarterly payment intervals up to April 2020 and October 2020 and semi-annual payment intervals up to April 2020.
As of December 31, 2019 and 2018, the fair value of the outstanding swap amounted to a net liability of 31.93 million and a net asset of 47.29 million, respectively, of which 22.35 million and 33.10 million (net of tax), respectively, is included in “Other reserves” in the equity section of the consolidated statements of financial position (see Note 22.6).
Swap costs arising from both cross currency and interest rate swaps recognized as financing cost amounted to 366.95 million, 220.06 million, and 208.74 million in 2019, 2018 and 2017, respectively (see Note 27)
8.2 Free Standing Derivatives
Freestanding derivatives that are not designated as hedges consist of currency forwards entered into by the Globe Group. Fair value changes on these instruments are accounted for directly in consolidated profit or loss.
As of December 31, 2019 and 2018, the Globe Group has USD112.00 million and USD80.00 million deliverable and non-deliverable currency forward contracts not designated as hedges, respectively.
8.3 Hedge Effectiveness Results
As of December 31, 2019 and 2018, the effective fair value changes on the Globe Group’s cash flow hedges that were deferred in equity amounted to gains of 264.44 million and 948.92 million, net of tax, respectively. Derivatives designated as cash flow hedges for the years ended December 31, 2019, 2018 and 2017 are fully effective. Accordingly, no hedge ineffectiveness was recognized in the consolidated profit or loss.
The distinction of the results of hedge accounting into “Effective” or “Ineffective” represent designations based on PFRS 9 and are not necessarily reflective of the economic effectiveness of the instruments.
C Globe

�����������������03/��
&�5�(�$�7�(���:�2�1�'�(�5�)�8�/��� ��
8.4 Fair Value Changes on Derivatives
The net movements in fair value changes of all derivative instruments are as follows:
2019 2018
(In Thousand Pesos) At beginning of year 2,051,712 735,341 Net changes in fair value of derivatives: Designated as cash flow hedges (Note 22.6) (2,835,986) 1,178,226 Not designated as cash flow hedges (73,870) 839,763
(858,144) 2,753,330 Fair value of settled instruments 446,783 (701,618)
At end of period (411,361) 2,051,712
Details of amounts reclassified from cash flow hedge reserve to profit or loss in relation to hedge accounting transactions are shown below.
Notes 2019 2018
(In Thousand Pesos) Gain (loss) on derivative instruments – net (735,670) 164,408 Swap costs 27 (366,952) (220,061)
22.6� (1,102,622) (55,653)
9� Inventories and Supplies - net
This account consists of:
2019 2018
(In Thousand Pesos) Handsets, devices and accessories 2,761,286 2,977,904 Modem and accessories 844,518 972,523 Nomadic broadband device 498,380 371,976 Spare parts and supplies 420,142 357,161 SIM cards and SIM packs 133,530 156,940 Call cards and others 55,716 18,435
4,713,572 4,854,939
Breakdown of cost of inventories recognized as expense are as follows:
Note 2019 2018 2017
(In Thousand Pesos) Cost of inventories sold 18,554,814 18,645,314 13,013,437 Inventory obsolescence 28 713,717 377,775 403,037
19,268,531 19,023,089 13,416,474
O Globe

�����������������03/��
&�5�(�$�7�(���:�2�1�'�(�5�)�8�/��� ��
Cost of inventories sold consists of:
2019 2018 2017
(In Thousand Pesos) Handsets, devices and accessories 16,212,378 16,132,844 10,752,145 Nomadic broadband device 1,458,295 1,686,459 1,289,983 SIM cards and SIM packs 529,248 651,342 623,013 Call cards and others 224,598 147,267 329,651 Modems and accessories 116,026 20,637 13,787 Spare parts and supplies 14,269 6,765 4,858
18,554,814 18,645,314 13,013,437
10� Prepayment and Other Current Assets
This account consists of:
Notes 2019 2018
(In Thousand Pesos) Advance payments to suppliers and contractors 35.2 10,449,595 9,459,239 Prepayments 2,740,940 2,209,300 Non-trade receivables – net 2,292,367 1,458,503 Deferred input VAT 1,162,679 937,233 Creditable withholding tax 976,295 888,971 Input VAT – net 720,307 517,810 Others 605,832 783,740
18,948,015 16,254,796
The “Prepayments” account includes prepaid insurance, rent, maintenance, and licenses fees among others.
Non-trade receivables – net consists of:
Notes 2019 2018
(In Thousand Pesos) Current portion of loans to related parties 21 656,620 - Due from related parties 21 631,490 562,550 Advances to employees 192,219 313,308 Others 900,931 713,726
2,381,260 1,589,584 Allowance for impairment loss (88,893) (131,081)
2,292,367 1,458,503
Impairment loss related to non-trade receivable amounted to QLO�LQ����� DQG�2018, and 37.47 million in 2017 (see Note 28).
C Globe

�����������������03/��
&�5�(�$�7�(���:�2�1�'�(�5�)�8�/��� ��
Deferred input VAT pertains to VAT various purchases of goods and services which cannot be claimed yet as credits against output VAT liabilities, pursuant to the existing VAT rules and regulations. Deferred input VAT can be applied against future output VAT liabilities. Details are as follows:
Note 2019 2018
(In Thousand Pesos) Due for credits within 12 months 1,162,679 937,233 Due for credits beyond 12 months 16 194,352 247,543
1,357,031 1,184,776
O Globe

�����������������03/��
&�5�(�$�7�(���:�2�1�'�(�5�)�8�/��� ���
11� Property and Equipment – net
The rollforward analysis of this account follows:
2019
Telecommunication Equipment
Buildings and Leasehold
Improvement Cable System Office
Equipment Transportation
Equipment Land Assets Under Construction Total
(In Thousand Pesos) Cost At January 1 271,677,263 57,423,228 26,682,217 15,780,704 2,975,487 2,276,709 23,987,705 400,803,313 Additions 739,310 22,367 - 58,048 448,380 - 44,482,801 45,750,906 Acquired on acquisition of a subsidiary (Note 14) 27,873 50,443 - 137,027 3,371 - - 218,714 Retirements/disposals (748,425) (12,325) (13,403) (82,592) (242,367) - (19,869) (1,118,981) Reclassifications (Note 12) 31,454,170 5,385,020 (6,676) 848,549 - - (43,033,546) (5,352,483) ARO Remeasurements 25,096 - - - - - - 25,096
At December 31 303,175,287 62,868,733 26,662,138 16,741,736 3,184,871 2,276,709 25,417,091 440,326,565
Accumulated Depreciation and Amortization At January 1 170,812,209 27,467,103 16,283,949 13,028,408 1,975,468 - - 229,567,137 Acquired on acquisition of a subsidiary (Note 14) 17,631 30,602 - 59,712 2,067 - - 110,012 Depreciation and amortization (Note 26) 21,383,867 2,871,545 1,009,119 1,531,348 387,422 - - 27,183,301 Retirements/disposals (661,258) (7,573) (3,623) (73,257) (225,737) - - (971,448) ARO Remeasurements (17,728) - - - - - - (17,728)
At December 31 191,534,721 30,361,677 17,289,445 14,546,211 2,139,220 - - 255,871,274
Impairment Losses At January 1 1,219,011 23,252 - - 9,860 1,921 588,364 1,842,408 Additions (Note 28) - - - - - - 59,157 59,157 Write-off/adjustments - (9,860) - - (9,860) - (89,082) (108,802)
At December 31 1,219,011 13,392 - - - 1,921 558,439 1,792,763
Carrying amount at December 31 110,421,555 32,493,664 9,372,693 2,195,525 1,045,651 2,274,788 24,858,652 182,662,528
O Globe

�����������������03/��
&�5�(�$�7�(���:�2�1�'�(�5�)�8�/��� ���
2018
Telecommunication Equipment
Buildings and Leasehold
Improvement Cable System Office Equipment Transportation
Equipment Land Assets Under Construction Total
(In Thousand Pesos) Cost At January 1 246,755,268 53,507,948 26,526,807 15,068,540 2,916,558 2,278,343 23,842,575 370,896,039 Additions 967,774 14,230 4,465 192,462 434,795 108 34,210,495 35,824,329 Retirements/disposals (405,081) (13,078) (25,305) (1,136,701) (378,226) (1,742) - (1,960,133)Reclassifications (Note 12) 24,379,791 3,914,128 176,250 1,656,403 2,360 - (34,065,365) (3,936,433)ARO Remeasurements (20,489) - - - - - - (20,489)
At December 31 271,677,263 57,423,228 26,682,217 15,780,704 2,975,487 2,276,709 23,987,705 400,803,313
Accumulated Depreciation and Amortization At January 1 152,241,256 24,775,778 15,177,625 12,345,783 1,965,727 - - 206,506,169 Depreciation and amortization (Note 26) 18,979,929 2,671,290 1,112,247 1,762,866 369,117 - - 24,895,449 Retirements/disposals (364,430) (784) (5,923) (1,135,459) (359,376) - - (1,865,972) Reclassifications (Note 12) (25,037) 20,819 - 55,218 - - - 51,000 ARO Remeasurements (19,509) (19,509)
At December 31 170,812,209 27,467,103 16,283,949 13,028,408 1,975,468 - - 229,567,137
Impairment Losses At January 1 1,219,011 23,252 - - 9,860 - 535,101 1,787,224 Additions (Note 28) - - - - - 1,921 59,818 61,739 Write-off/adjustments - - - - - - (6,555) (6,555)
At December 31 1,219,011 23,252 - - 9,860 1,921 588,364 1,842,408
Carrying amount at December 31 99,646,043 29,932,873 10,398,268 2,752,296 990,159 2,274,788 23,399,341 169,393,768
O Globe

�����������������03/��
&�5�(�$�7�(���:�2�1�'�(�5�)�8�/� ����
Assets under construction include intangible components of a network system which are reclassified to depreciable intangible assets only when assets become available for use (see Note 12).
Investments in cable systems include the cost of the Globe Group’s ownership share in the capacity of certain cable systems under a joint venture or a consortium or private cable set-up and indefeasible rights of use (IRUs) of circuits in various cable systems. It also includes the cost of cable landing station and transmission facilities where the Globe Group is the landing party.
The costs of fully depreciated property and equipment that are still being used as of December 31, 2019 and 2018 amounted to 130,754.39 million and 105,431.91 million, respectively.
The Globe Group uses its borrowed funds to finance the acquisition of self-constructed property and equipment. Borrowing costs incurred relating to these acquisitions were included in the cost of property and equipment using 5.20% and 4.69% capitalization rates in 2019 and 2018, respectively. The Globe Group’s total capitalized borrowing costs amounted to 1,251.52 million and 846.92 million in 2019 and 2018, respectively (see Note19),
Pursuant to the Amended Rehabilitation Plan (ARP) and Master Restructuring Agreement (MRA), the remaining outstanding restructured debt of BTI to creditors other than Globe Telecom amounting to USD1.7 million (Note 19.1) will be secured by a real estate mortgage on identified real property assets. The processing of the real properties to be mortgaged is still ongoing as of December 31, 2019.
12� Intangible Assets and Goodwill - net
The rollforward analysis of this account follows:
2019
Application Software and
Licenses Goodwill
Other Intangible
Assets
Total Intangible Assets and
Goodwill
(In Thousand Pesos)
Cost
At January 1 35,541,741 1,140,248 2,174,325 38,856,314 Additions 48,532 - - 48,532 Acquired on acquisition of a subsidiary (Note 14) 48,478 1,759,071 453,040 2,260,589 Reclassifications (Note 11) 5,352,483 - - 5,352,483 At December 31 40,991,234 2,899,319 2,627,365 46,517,918 Accumulated Amortization
At January 1 24,174,859 - 983,186 25,158,045 Amortization (Note 26) 5,549,460 - 241,690 5,791,150 Acquired on acquisition of a subsidiary (Note 14) 15,626 - 15,626At December 31 29,739,945 - 1,224,876 30,964,821 Carrying Amount at December 31 11,251,289 2,899,319 1,402,489 15,553,097
@ Globe

�/30������������������
&�5�(�$�7�(���:�2�1�'�(�5�)�8�/� ����
2018
Application Software and
Licenses Goodwill
Other Intangible
Assets
Total Intangible
Assets and Goodwill
(In Thousand Pesos)
Cost
At January 1 31,119,839 1,283,042 2,324,649 34,727,530 Additions 490,569 - - 490,569 Retirements/disposals (5,100) - (150,324) (155,424) Impairment (Note 28) (142,794) - (142,794)Reclassifications (Note 11) 3,936,433 - - 3,936,433
At December 31 35,541,741 1,140,248 2,174,325 38,856,314
Accumulated Amortization At January 1 19,013,510 - 830,314 19,843,824 Amortization (Note 26) 5,213,058 - 303,196 5,516,254 Retirements/disposals (709) - (150,324) (151,033) Reclassifications (Note 11) (51,000) - - (51,000)
At December 31 24,174,859 - 983,186 25,158,045
Carrying Amount at December 31 11,366,882 1,140,248 1,191,139 13,698,269
Other intangible assets consist of customer contracts, franchise, spectrum and merchant networks.
The Globe Group’s goodwill were recognized from acquisition of subsidiaries. Details of the Globe Group’s goodwill are as follows:
2019 2018 2017
(In Thousand Pesos) BTI 1,140,248 1,140,248 1,140,248 EC Pay 1,218,548 - - Yondu 540,523 - - TAO - - 140,403 Socialytics - - 2,391
2,899,319 1,140,248 1,283,042
The Globe Group conducts its annual impairment test of goodwill in the third fiscal quarter of each year. The Globe Group considers the relationship between its market capitalization and its book value, among other factors, when reviewing for indicators of impairment.
For impairment testing purposes, the Globe Group allocated the carrying amount of goodwill arising from the acquisition of BTI to CGU of mobile communications services or wireless segment. The recoverable amount of the CGU is determined based on value-in-use calculations using cash flow projections from business plans covering a five-year period. The pre-tax discount rate applied to cash flow projections was 8.7% in 2019 and cash flows beyond the five-year period are extrapolated using a 2% long-term growth rate in 2019. No impairment loss on goodwill from acquisition of BTI was recognized in 2019 and 2018.
O Globe

�����������������03/��
&�5�(�$�7�(���:�2�1�'�(�5�)�8�/� ����
The Globe Group has determined that the recoverable amount calculations are most sensitive to changes in assumptions on gross margins, discount rates, market share, and growth rates.
In 2018, management determined that the recoverable amount of goodwill related to the acquisition of TAO and Socialytics are less than its carrying value. Accordingly, the Globe Group recognized impairment loss amounting to 140.40 million and 2.39 million, respectively (see Note 28).
No impairment loss on intangible assets was recognized in 2019. The management believes that any reasonable possible change in the key assumptions on which recoverable amount is based would not cause the aggregate carrying amount to exceed the aggregate recoverable amount of the CGU.
13� Lease Commitments
13.1 Right of use assets – net
The rollforward analysis of this account follows:
Network Sites
Transportation Equipment
Corporate Office Stores
Leased lines Total
Cost (In Thousand Pesos)
Transition adjustment (Note 3.1) 2,261,738 584,297 552,803 81,701 2,666 3,483,205 Additions 631,497 371,640 118,264 144,381 - 1,265,782Pre-terminations (4,070) (19,454) - - - (23,524)
At December 31 2,889,165 936,483 671,067 226,082 2,666 4,725,463
Accumulated Depreciation Depreciation (Note 26) 544,228 342,694 196,849 78,273 1,447 1,163,491 Pre-terminations (1,180) (3,128) - - - (4,308)
At December 31 543,048 339,566 196,849 78,273 1,447 1,159,183
Carrying Amount at December 31 2,346,117 596,917 474,218 147,809 1,219 3,566,280
13.2 Lease liabilities
The following table provides the lease liabilities in relation to leased assets:
2019
(In Thousand Pesos) Network sites 2,408,958 Transportation Equipment 610,316 Corporate Office 489,194 Stores 153,843 Leased lines 1,306
3,663,617
Less current portion 981,817
2,681,800
Interest expense on lease liabilities amounted to 272.17 million for the year ended December 31, 2019 (see Note 27).
O Globe

�����������������03/��
&�5�(�$�7�(���:�2�1�'�(�5�)�8�/� ����
The table below presents the maturity profile of the Globe Group’s lease liabilities using undiscounted cash flows of future lease payments.
1 year
More than 1 year but not more than
5 years More than
5 years Total
(In Thousand Pesos)
Network Sites 597,545 1,795,895 747,639 3,141,079 Transportation equipment 357,698 297,738 - 655,436Corporate office 240,989 289,157 3,088 533,234Stores 96,761 ]67,924 10,397 175,082Leased lines 1,122 211 - 1,333
1,294,115 2,450,925 761,124 4,506,164
Short-term leases and leases of low-value assets charged as operating expenses in the consolidated profit or loss amounted to 5,793.30 (see Note 25). Payments of lease liabilities for the year ended December 31, 2019 amounted to 1,298.34 million.
14� Business Combinations
14.1 Investment in Yondu
On September 11, 2019, Globe Telecom reacquired 51% of the outstanding shares of Yondu, which increased its controlling interest to 100%, for a total amount of 501.25 million. Globe Telecom remeasured its previously held interest in Yondu based on its acquisition-date fair value which resulted to a remeasurement loss of 470.65 million (see Notes 21.4 and 28)� The transaction was accounted for as an acquisition of a subsidiary. Globe Telecom’s acquisition of Yondu is in line with its strategy to expand its business operations in the mobile business industry.
Prior to the reacquisition, investment in Yondu was accounted for as an associate (see Note 15.1).
Details of the fair values upon acquisition of Yondu in 2019 follows:
Amounts recognized on
acquisition
(In Thousand Pesos) ASSETS
Current assets 681,644
Property and equipment (Note 11) 90,682
Application software and licenses (Note 12) 244
Other noncurrent assets 36,897
809,467
LIABILITIES
Current Liabilities 346,905
Net assets acquired and liabilities assumed 462,562
Purchase consideration transferred 501,252
Acquisition-date fair value of previously held interest 501,833
Net assets acquired and liabilities assumed (462,562)
Goodwill arising on acquisition (Note 12) 540,523
O Globe

�����������������03/��
&�5�(�$�7�(���:�2�1�'�(�5�)�8�/� ����
Net cash outflow from the acquisition is as follows (in thousand pesos):
Total cash paid on acquisition �501,252) Cash and cash equivalents acquired from Yondu 114,494
Net cash outflow on acquisition �386,758)
14.2 Investment in EC Pay
On October 25, 2019, Globe Telecom acquired 77% of equity interest in EC Pay for a total amount of 1,540.00 million. EC Pay is a company engaged in the provision of information technology and electronic commerce related solutions, and operates a multi-tiered platform that offers secure electronic solutions for various transactions such as load purchases. The transaction was accounted for as an acquisition of a subsidiary. The Globe Group elected to measure the non-controlling interest in the acquiree at the proportionate share of its interest in the acquiree’s net assets acquired and liabilities assumed.
Globe’s acquisition of EC Pay will add value to Globe’s distribution channels, enabling them to offer a suite of mobile communication products and services via a single platform bringing the company a step closer to its vision of a digitally-enabled Philippines. The platform would enable small business owners to offer more mobile communication products and services which in turn would stimulate the e-commerce industry and the digital economy.
Details of the fair values upon acquisition of EC Pay in 2019 follows:
Amount recognized
on acquisition
(In Thousand Pesos) ASSETS
Current assets 1,180,885
Property and equipment (Note 11) 18,021
Application and software (Note 12) 603
Other noncurrent assets 4,155
1,203,664
LIABILITIES
Current Liabilities 1,125,725
Total net assets at fair value 77,939
Intangible assets arising on acquisition (Note 12)
Contractual merchant network 176,190
Non-contractual merchant network 276,850
Platform 32,005 485,045
Deferred tax liabilities (145,514)
Net assets acquired and liabilities assumed 417,470
Purchase consideration transferred 1,540,000
Net assets acquired and liabilities assumed (417,470)
Non-controlling interest measured at proportionate share of its interest 96,018
Goodwill arising on acquisition (Note 12) 1,218,548
O Globe

�����������������03/��
&�5�(�$�7�(���:�2�1�'�(�5�)�8�/� ����
Net cash outflow from the acquisition is as follows (in thousand pesos):
Total purchase consideration �1,540,000) Unpaid purchase consideration (Note 5) 76,329 Cash and cash equivalents acquired from ECPay 286,780
Net cash outflow on acquisition �1,176,891)
The goodwill comprises the fair value of expected synergies arising from the acquisition and presented under Goodwill and other intangible assets in the statements of the financial position (see Note 12). None of the goodwill recognized is expected to be deductible for income tax purposes.
The fair value of the identifiable intangible assets is based on valuations performed by an independent appraiser using acceptable valuation techniques within the industry. The application of a different set of assumptions or technique could have a significant effect on the resulting fair value estimates.
15� Investments in associates and joint ventures
This account consists of the following as of December 31:
2019 2018
(In Thousand Pesos) Investments in associates:
Yondu - 940,236 Investments in joint ventures:
VTI, BAHC and BHC 32,755,463 32,481,947 GFI/Mynt 1,563,980 862,130 TechGlobal 90,893 89,702 Bridge Mobile Pte. Ltd (BMPL) 51,926 50,440 Konsulta 11,603 2,321
34,473,865 34,426,776
O Globe

�����������������03/��
&�5�(�$�7�(���:�2�1�'�(�5�)�8�/� ����
Details of the Globe Group’s investments in associate and joint ventures and the related percentages of ownership as of December 31, 2019 and 2018 are shown below:
Country of Incorporation Principal Activities 2019 2018
Associates Yondu** Philippines Mobile content and application
development services 100% 49% AFPI Philippines Construction and establishment
of systems, infrastructure - 20%
Joint Ventures VTI Philippines Telecommunications 50% 50% BAHC Philippines Holding company 50% 50% BHC Philippines Holding company 50% 50% Konsulta Philippines Health hotline facility 50% 50% TechGlobal Philippines Installation and management of
data centers 49% 49% GFI/Mynt* Philippines Holding company 46% 45% BMPL Singapore Mobile technology infrastructure
and common service 10% 10% *A subsidiary of Globe Telecom through GCVHI until September 2017 (see Note 15.4) **An associate of Globe Telecom until September 2019 (Note 14.1)
Equity share in net loss from investment in associates and joint ventures are as follows:
2019 2018 2017
(In Thousand Pesos) Investments in associates:
AFPI - (115,745) (129,495) Yondu 32,250 38,258 56,238
Investments in joint ventures: GFI/Mynt (2,590,650) (1,179,871) (236,304) VTI, BAHC and BHC 2,105 18,760 (511,692) Konsulta (3,218) (9,583) (9,570) TechGlobal 1,191 (3,478) (22,146) BMPL 3,540 2,056 6,792
(2,554,782) (1,249,603) (846,177)
Investment in associates and joint ventures share in other comprehensive income are as follows:
2019 2018 2017
(In Thousand Pesos) Investments in associate:
AFPI - - 790 Investments in joint ventures:
VTI, BAHC and BHC 271,411 - - BMPL (2,054) 2,089 81
269,357 2,089 871
@ Globe

�����������������03/��
&�5�(�$�7�(���:�2�1�'�(�5�)�8�/� ����
The movement in investments in joint ventures and associates are as follows:
Notes 2019 2018
(In Thousand Pesos) Costs At January 1 37,608,176 37,536,885 Additional capital contributions during the year Investment in GFI/Mynt 15.4 3,292,500 -
Investment in Konsulta 15.7 12,500 - Investment in VTI 15.3 - 51,200 Investment in AFPI 15.2 - 60,000
Disposal (1,532,061) - Return on investment 15.1 - (39,909)
At December 31 39,381,115 37,608,176
Accumulated Equity in Net Losses At January 1 (2,921,697) (1,672,094) Equity share in net losses (2,554,782) (1,249,603) Disposal 272,438 -
At December 31 (5,204,041) (2,921,697)
Other Comprehensive Income At January 1 26,333 24,244 Equity share in currency translation adjustment 22.6 (2,054) 2,089 Equity share in investment in equity securities 22.6 275,325 - Equity share in retirement obligation 22.6 (3,914) - Disposal 22.6 1,101 -
At December 31 296,791 26,333
Impairment Losses At January 1 (286,036) (286,036) Disposal 15.2 286,036 -
At December 31 - (286,036)
Carrying Value at December 31 34,473,865 34,426,776
C Globe

�����������������03/��
&�5�(�$�7�(���:�2�1�'�(�5�)�8�/� ����
The table below presents the summarized financial information lifted from the unaudited statutory financial statements of the Globe Group’s investments in associate and joint ventures:
Yondu AFPI VTI, BAHC
and BHC GFI/Mynt TechGlobal BMPL Konsulta
(In Thousand Pesos)
2019 Statements of Financial Position: Current assets 681,643 644,964 3,622,452 5,823,136 96,739 614,083 53,321 Noncurrent assets 127,823 918,555 5,514,863 1,285,411 197,704 12,294 1,531 Current liabilities 346,904 418,396 2,793,061 6,161,631 80,136 106,914 31,342 Noncurrent liabilities - 267,873 448,702 61,241 28,811 203 304 Equity 462,562 877,250 5,895,552 885,675 185,496 519,260 23,206
Statements of Comprehensive Income: Revenue 89,200 65,129 3,338,561 5,341,656 58,836 297,243 77,770 Costs and expenses (18,027) (797,468) (2,011,962) (10,909,848) (55,260) (261,843) (83,939) Income before tax 71,173 (732,339) 1,326,599 (5,568,192) 3,576 35,400 (6,169) Income tax (5,356) - (460,328) (54,747) (1,146) - (267)
Profit (Loss) for the period 65,817 (732,339) 866,271 (5,622,939) 2,430 35,400 (6,436)
2018 Statements of Financial Position: Current assets 551,384 585,163 3,082,664 2,664,868 74,229 608,627 36,141 Noncurrent assets 71,581 1,450,681 4,050,389 931,800 217,996 22,076 517 Current liabilities 220,181 367,113 2,515,135 3,397,668 109,159 129,883 31,980 Noncurrent liabilities 5,871 267,042 659,097 173,057 - - 38 Equity 396,913 1,401,689 3,958,821 25,943 183,066 500,820 4,640
Statements of Comprehensive Income: Revenue 821,322 52,558 2,754,717 1,134,839 43,407 316,640 58,274 Costs and expenses (711,836) (659,777) (1,567,580) (3,800,622) (53,475) (296,078) (77,440) Income before tax 109,486 (607,219) 1,187,137 (2,665,783) (10,068) 20,562 (19,166) Income tax (31,409) - (367,505) 43,847 2,970 - -
Profit (Loss) for the period 78,077 (607,219) 819,632 (2,621,936) (7,098) 20,562 (19,166)
Investment in Associates
15.1 Investment in Yondu
Yondu is an associate of Globe Telecom and is engaged in the development and creation of wireless products and services accessible through mobile devices or other forms of communication devices. It also provides internet and mobile value added services, information technology and technical services including software development and related services. Yondu is registered with the Department of Transportation and Communication (DOTC) as a content provider.
On September 11, 2019, Globe Telecom reacquired 51% of the outstanding shares of Yondu, which increased its controlling interest to 100% (see Note 14.1).
Dividend from Yondu amounted to QLO and 39.90 million in 2019 and 2018, respectively. Dividends receivable as of December 31, 2018 amounted to 61.02 million.
O Globe

�����������������03/��
&�5�(�$�7�(���:�2�1�'�(�5�)�8�/� ����
15.2 Investment in AFPI (formerly Automated Fare Collection Service Inc. (AFCS))
On January 30, 2014, following a competitive bidding process, the Department of Transportation and Communication awarded to AF Consortium, composed of AC Infrastructure Holdings Corp., BPI Card Finance Corp., Globe Telecom, Inc., Meralco Financial Services, Inc., Metro Pacific Investments Corp., and Smart Communications, Inc. the rights to design, build and operate the 1.72 billion automated fare collection system. This is a public-private partnership project intended to upgrade and consolidate the fare collection systems of the three urban rail transit systems which presently serve Metro Manila.
On February 10, 2014, AF Consortium incorporated AFCS, a special purpose company, which will assume the rights and obligations of the concessionaire. These rights and obligations include the construction and establishment of systems, infrastructure including implementation, test, acceptance and maintenance plans, and operate the urban transit system for a period of 10 years.
On March 11, 2015, AFCS amended its corporate name to AFPI.
In 2019 and 2018, Globe Telecom infused additional capital amounting to QLO and 60.00 million, respectively.
In 2017, management determined that the recoverable amount of the investment in AFPI is less than the carrying value. Accordingly, the Globe Group recognized as impairment loss as the difference in the investment’s recoverable amount and carrying value amounting to 286.04 million (see Note 28). No impairment loss was recognized in 2018 and 2019.
On July 22, 2019, Globe Telecom sold its interest in AFPI to Globe Fintech Innovations (GFI) for a total consideration of 240.00 million which remained outstanding to date (see Note 5). Accordingly, gain on sale from investment was recognized as other income (see Note 24). The Globe Group’s share in other comprehensive income previously accumulated in other reserves account amounting to 1.1 million was also reclassified to retained earnings (see Note 22.6).
The Globe Group has no share in any contingent liabilities of any associates as of December 31, 2019 and 2018.
Investment in Joint Ventures
15.3 Investment in VTI, BAHC and BHC
On May 30, 2016, Globe Telecom’s BOD, through its Executive Committee, approved the signing of a Sale and Purchase Agreement (SPA) and other related definitive agreements for acquisition of 50% equity interest in the telecommunications business of San Miguel Corporation (SMC), Schutzengel Telecom, Inc. and Grace Patricia W. Vilchez-Custodio (the “Sellers”; SMC being the major seller) through their respective subsidiaries namely, VTI, BAHC and BHC, respectively (the Acquirees). The remaining 50% equity stake in VTI, BAHC and BHC was acquired by Philippine Long Distance Telephone Company (PLDT) under similar definitive agreements.
VTI owns an equity stake in Liberty Telecom Holdings, Inc. (LIB), a publicly-listed company in the Philippine Stock Exchange. It also owns, directly and indirectly, equity stakes in various enfranchised companies, including Bell Telecommunication Philippines, Inc. (Bell Tel), Eastern Telecom Philippines, Inc. (Eastern Telecom), Cobaltpoint Telecommunication, Inc (formerly Express Telecom, Inc.), and Tori Spectrum Telecom, Inc., among others.
O Globe

�����������������03/��
&�5�(�$�7�(���:�2�1�'�(�5�)�8�/� ����
The acquisition provided Globe Telecom an access to certain frequencies assigned to Bell Tel in the 700 Mhz, 900 Mhz, 1800 Mhz, 2300 Mhz and 2500 Mhz bands through a co-use arrangement approved by the NTC on May 27, 2016. NTC's approval is subject to the fulfillment of certain conditions including roll-out of telecom infrastructure covering at least 90% of the cities and municipalities in three years to address the growing demand for broadband infrastructure and internet access.
The memorandum of agreement between Globe and PLDT provides for both parties to pool resources and share in the profits and losses of the companies on a 50%-50% basis with a view to being financially self-sufficient and able to operate or borrow funds without recourse to the parties.
The Globe Group invested 51.2 million of additional capital in 2018.
15.4 Investment in GFI/Mynt
Prior to September 27, 2017, GCVHI holds 100% ownership interest in GFI and accordingly, GFI’s financial position and financial performance are included in the Globe Group’s consolidated financial statements. GFI/Mynt is engaged in purchasing, subscribing, owning, holding and assigning real and personal property, shares of stock and other securities. GFI has a wholly-owned subsidiary, Fuse, which operates as a lending company.
Loss of control on investment in GFI/Mynt
As disclosed in Note 1, on February 17, 2017, Globe Telecom and its wholly-owned subsidiaries, GFI and GCVHI entered into an investment agreement with Alipay and Ayala for Alipay and Ayala to invest in the unissued common shares of GFI. PCC released through a memo its affirmative decision on the Alipay acquisition of GFI shares, resulting in the dilution of GCVHI ownership in GFI.
On September 27, 2017, following the approval from PCC, GFI/Mynt received the capital infusion from Alipay and Ayala amounting to 2,784.60 million in exchange for GFI/Mynt’s 513.00 million common shares. The issuance of shares to Alipay and Ayala diluted GCVHI’s ownership interest to 45% and resulted in a loss of control in GFI/Mynt. Thereafter, investment in GFI/Mynt was accounted for as a joint arrangement since no single party controls the arrangement and approvals of all parties are required for business decisions.
Total net assets of GFI/Mynt as of the date of loss of control amounted to 388.40 million. The fair value of the retained interest in GFI/Mynt held by GCVHI amounted to 2,278.30 million at the date of loss of control. The gain on fair value of retained equity interest in GFI/Mynt amounting to 1,889.90 million, was presented as “Gain on fair value of retained interest” in the consolidated profit or loss in 2017. Net cash outflow from deconsolidation amounted to 1,246.97 million.
In 2019, the Globe Group made an additional investment to GFI/ Mynt amounting to 3,292.50 million.
15.5 Investment in TechGlobal
On November 2, 2015, Innove and Techzone Philippines incorporated TechGlobal, a Joint Venture Company, formed to install, own, operate, maintain and manage all kinds of data centers and to provide information technology-enabled services and computer-enabled support services. Innove and Techzone hold ownership interest of 49% and 51%, respectively. TechGlobal started commercial operations in August 2017.
O Globe

�/30������������������
&�5�(�$�7�(���:�2�1�'�(�5�)�8�/� ����
15.6 Investment in BMPL
Globe Telecom and other leading Asia Pacific mobile operators (JV partners) signed an Agreement in 2004 (JV Agreement) to form a regional mobile alliance, which will operate through a Singapore-incorporated company, BMPL. The JV company is a commercial vehicle for the JV partners to build and establish a regional mobile infrastructure and common service platform and deliver different regional mobile services to their subscribers.
15.7 Investment in Konsulta
On October 23, 2014, Yondu and Salud Interactiva (SI) signed a shareholder’s agreement to enter into a joint venture through a Philippine corporation. The Joint Venture (JV) Company was registered with the Securities and Exchange Commission on June 3, 2015 under the name GTHI as a stock corporation with 50% foreign equity formed to establish, operate, manage and provide a health hotline facility, including ancillary Information Technology services with intent to operate as a domestic market enterprise. GTHI started commercial operations in July 2015.
The Globe Group infused 12.5 million of additional capital in 2019.
16� Other Noncurrent Assets
This account consists of:
Notes 2019 2018
(In Thousand Pesos)
Investment in equity securities 2,137,781 1,442,940 Security deposits 1,261,620 1,113,465 Loans receivable from related parties 21 - 726,620Deferred input VAT 10 194,352 247,543Others 420,157 234,421
4,013,910 3,764,989
Others include investment properties with carrying amount of 19.92 million and 25.8 million as of December 31, 2019 and 2018, respectively. Investment properties consist of building and improvements which are held to earn rentals. Depreciation and amortization of investment properties amounted to 5.60 million, 10.02 million and 11.52 million in 2019, 2018 and 2017, respectively (see Note 26).
Fair value gain from investment in equity securities recognized in consolidated OCI amounted to 188.49 million, 170.65 million and 36.08 million in 2019, 2018 and 2017, respectively (see Note 22.6).
O Globe
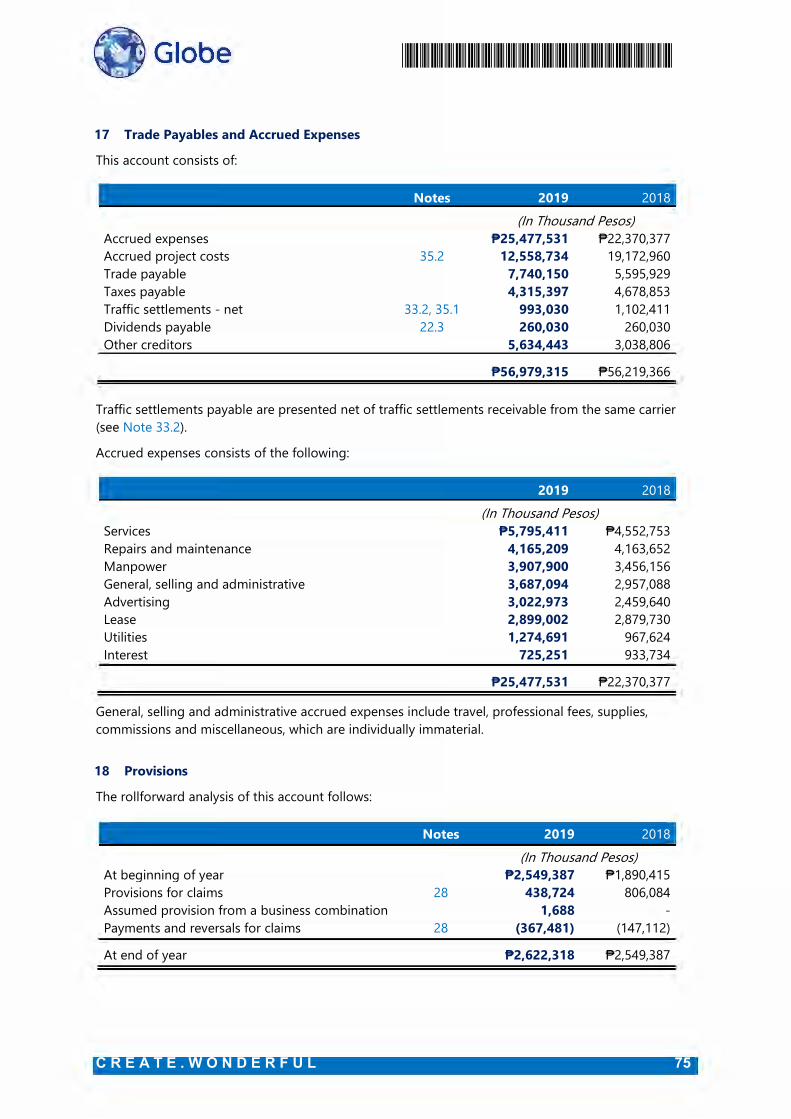
�����������������03/��
&�5�(�$�7�(���:�2�1�'�(�5�)�8�/� ����
17� Trade Payables and Accrued Expenses
This account consists of:
Notes 2019 2018
(In Thousand Pesos) Accrued expenses 25,477,531 22,370,377 Accrued project costs 35.2 12,558,734 19,172,960 Trade payable 7,740,150 5,595,929 Taxes payable 4,315,397 4,678,853 Traffic settlements - net 33.2, 35.1 993,030 1,102,411 Dividends payable 22.3 260,030 260,030 Other creditors 5,634,443 3,038,806
56,979,315 56,219,366
Traffic settlements payable are presented net of traffic settlements receivable from the same carrier (see Note 33.2).
Accrued expenses consists of the following:
2019 2018
(In Thousand Pesos) Services 5,795,411 4,552,753 Repairs and maintenance 4,165,209 4,163,652 Manpower 3,907,900 3,456,156 General, selling and administrative 3,687,094 2,957,088 Advertising 3,022,973 2,459,640 Lease 2,899,002 2,879,730 Utilities 1,274,691 967,624 Interest 725,251 933,734
25,477,531 22,370,377
General, selling and administrative accrued expenses include travel, professional fees, supplies, commissions and miscellaneous, which are individually immaterial.
18� Provisions
The rollforward analysis of this account follows:
Notes 2019 2018
(In Thousand Pesos) At beginning of year 2,549,387 1,890,415 Provisions for claims 28 438,724 806,084 Assumed provision from a business combination 1,688 - Payments and reversals for claims 28 (367,481) (147,112)
At end of year 2,622,318 2,549,387
C Globe

�����������������03/��
&�5�(�$�7�(���:�2�1�'�(�5�)�8�/� ����
Provisions pertain to assumed liabilities related to the acquired interest in VTI, BAHC and BHC and various pending unresolved claims over the Globe Group’s businesses such as provision for taxes, employee benefits, onerous contracts and various labor cases. As of December 31, 2019 and 2018, Globe Telecom’s share in the total assumed liabilities related to the acquired interest in VTI, BAHC and BHC amounts to 92.98 million.
The information usually required by PAS 37, Provisions, Contingent Liabilities and Contingent Assets, is not disclosed as it may prejudice the outcome of these on-going claims and assessments. As of December 31, 2019, the remaining claims are still being resolved.
19� Loans Payable
The table below shows the Globe Group’s short term credit facilities (in millions).
2019 2018 Uncommitted
Peso 16,350 14,000 Dollar USD 93.9 USD 119
Committed Peso 3,000 3,000
As of December 31, 2019 and 2018, the Globe Group has no long term credit facilities.
The Globe Group’s long-term debt consists of the following:
2019 2018
(In Thousand Pesos) Term Loans:
Peso 106,697,990 112,287,753 Dollar 22,200,060 23,556,854
128,898,050 135,844,607 Retail bonds 6,964,685 12,437,290
135,862,735 148,281,897 Less current portion (12,919,898) (16,758,196)
Net of current portion 122,942,837 131,523,701
The maturities of long-term debt at nominal values as of December 31, 2019 follow (in thousands):
Due in: 2020 12,951,649 2021 7,822,680 2022 14,835,657 2023 17,903,968 2024 and thereafter 82,896,115
136,410,069
O Globe

�����������������03/��
&�5�(�$�7�(���:�2�1�'�(�5�)�8�/� ����
The interest rates and maturities of the above debts are as follows:
Maturities Interest Rates
Term Loans: Peso 2020-2031 3.70% to 7.91% in 2019
2019-2031 2.96% to 7.11% in 2018
Dollar 2020-2027 2.51% to 6.00% in 2019 2019-2027 2.08% to 5.00% in 2018
Retail bonds 2020-2023 4.89% to 6.00% in 2019 2019-2023 4.89% to 6.00% in 2018
Unamortized debt issuance costs included in the above long-term debt as of December 31, 2019 and 2018 amounted to 547.33 million and 657.76 million, respectively.
Total interest expense recognized in the consolidated profit or loss related to long-term debt amounted to 5,937.70 million, 5,748.85 million and 4,776.24 million in 2019, 2018 and 2017, respectively (see Note 27).
Total interest expenses capitalized as part of property and equipment amounted to 1,251.52 million and 846.92 million in 2019 and 2018, respectively (see Note 11).
19.1 Term Loans and Corporate Notes
Globe Telecom has unsecured term loans and corporate notes, which consist of fixed and floating rate notes and dollar and peso-denominated term loans. The term loans bear interest at stipulated and prevailing market rates. Globe Group also has a secured debt amounting to USD1.7 million as of December 31, 2019 arising from its acquisition of BTI (see Note 11).
The loan agreements with banks and other financial institutions provide for certain restrictions and requirements with respect to, among others, maintenance of financial ratios and percentage of ownership of specific shareholders, incurrence of additional long-term indebtedness or guarantees and creation of property encumbrances.
The financial tests under Globe Group’s loan agreements include compliance with the following ratios:
� Total debt* to equity not exceeding 3.0:1,� Total debt* to EBITDA not exceeding 3.5:1;� Debt service coverage exceeding 1.3 times; and� Secured debt ratio not exceeding 0.2 times.
*Composed of notes payable, current portion long term debt, long term debt and net derivative liabilities.
In December 2018, the loan agreements with Non-bank Financial Institutions were amended to adjust the debt to equity ratio from 2.5:1 to 3:1 and adjust the debt to EBITDA ratio from 3:1 to 3.5:1.
In December 2018, the loan agreements with Financial Institutions were amended to adjust the debt to EBITDA ratio from 3:1 to 3.5:1.
As of December 31, 2019 and 2018, the Globe Group is not in breach of any loan covenants.
C Globe

�/30������������������
&�5�(�$�7�(���:�2�1�'�(�5�)�8�/� ����
19.2 Retail Bonds
On June 1, 2012, Globe Telecom issued 10,000.00 million fixed rate bonds. The amount comprises 4,500.00 million and 5,500.00 million fixed rate bonds due in 2017 and 2019, with interest rate of 5.75% and 6.00%, respectively. The net proceeds of the issue were used to partially finance Globe Telecom’s capital expenditure requirements in 2012.
The five-year and seven-year retail bonds may be redeemed in whole, but not in part only, starting two years before maturity date and on the anniversary thereafter at a price equal to 101.00% and 100.50%, respectively, of the principal amount of the bonds and all accrued interest to the date of the redemption. In 2017, Globe Telecom fully redeemed its 4,500.00 million retail bonds. In June 2019, Globe Telecom fully redeemed its 5,500 million retail bonds.
On July 17, 2013, Globe Telecom issued 7,000.00 million fixed rate bond. The amount comprises 4,000.00 million and 3,000.00 million bonds due in 2020 and 2023, with interest rate of 4.8875% and 5.2792%, respectively. The net proceeds of the issue were used to partially finance Globe Telecom’s capital expenditure requirements in 2013.
The seven-year and ten-year retail bonds may be redeemed in whole, but not in part only, starting two years for the seven-year bonds and three years for the ten-year bonds before the maturity date and on the anniversary thereafter at a price ranging from 101.0% to 100.5% and 102.0% to 100.5%, respectively, of the principal amount of the bonds and all accrued interest depending on the year of redemption.
In August 2016, the Bond Trust Indentures were amended to adjust the maximum debt-to-equity ratio from 2:1 to 2.5:1.
In October 2018, the Bond Trust Indentures were amended to adjust the maximum debt to equity ratio from 2:5:1 to 3:0:1.
As of December 31, 2019, the Globe Group is not in breach of any bond covenants.
20� Other Long-term Liabilities
This account consists of:
Notes 2019 2018
(In Thousand Pesos) Asset retirement obligation (ARO) 2,742,633 2,523,939 Accrued pension 29.2 3,738,430 1,459,463 Others 962,079 1,383,807
7,443,142 5,367,209
i:t) Globe

�����������������03/��
&�5�(�$�7�(���:�2�1�'�(�5�)�8�/� ����
ARO represents Globe Group’s obligation to restore leased properties to their original condition and estimated dismantling cost of property and equipment. The rollforward analysis of the Globe Group’s ARO follows:
Notes 2019 2018
(In Thousand Pesos) At beginning of year 2,523,939 2,420,224 Accretion expense during the year 27 155,674 140,457 Capitalized to property and equipment during the year 5 38,997 9,831 Settlements and reversals (17,205) (11,607) Remeasurements 41,228 (34,966)
At end of year 2,742,633 2,523,939
Gain (loss) on settlement and remeasurement of ARO recognized in consolidated profit or loss amounted to 5.77 million, 27.89 million and (4.37 million) in 2019, 2018 and 2017, respectively (see Note 24).
21� Related Party Transactions
Parties are considered to be related to the Globe Group if they have the ability, directly or indirectly, to control the Globe Group or exercise significant influence over the Globe Group in making financial and operating decisions, or vice versa, or where the Globe Group and the party are subject to common control or common significant influence. Related parties may be individuals (being members of key management personnel, significant shareholders and/or their close family members) or entities and include entities which are under the significant influence of related parties of the Globe Group where those parties are individuals, and post-employment benefit plan which are for the benefit of employees of the Globe Group or of any entity that is a related party of the Globe Group.
The Globe Group, in their regular conduct of business, enter into transactions with their major stockholders, AC and Singtel, associates, joint ventures and certain related parties.
O Globe

�����������������03/��
&�5�(�$�7�(���:�2�1�'�(�5�)�8�/� ���
The summary of balances arising from related party transactions for the relevant financial year follows (in thousands): 2019
Amount of transaction Outstanding Balance
Note
Revenue and Other
Income
Costs and Expenses
charged to Profit or Loss
Cost and Expenses
capitalized as Asset
Cash and Cash
Equivalents (Note 31)
Amounts Owed by
Related Parties
Amounts Owed to
Related Parties Terms Conditions
Entities with joint control over the Company Singtel 21.1 466,404 333,714 - - 117,433 55,876 Interest-free, settlement in cash Unsecured, no impairment AC 21.1 14,413 64,367 - - 1,175 2,754 Interest-free, settlement in cash Unsecured, no impairment
Jointly controlled entities BMPL 21.2 - 21,459 - - - 1,384 Interest-free, settlement in cash Unsecured, no impairment GFI/Mynt 21.2 51,786 322,045 - - 550,141 53,346 Interest-free, settlement in cash Unsecured, no impairment
Other related parties
GGRP 21.3 31,093 - - - 548,000 -
3 years, 5.5%, settlement in cash
Unsecured, no impairment
BHI 21.3 6,473 - - - 108,620 - 3 years, 5.75%, settlement incash
The 250.00 million is covered by a pledge agreement while the 45.00 million is fully
secured by chattel mortgage agreement.
BEAM 21.3 - 175,604 - - - - - - Altimax 21.3 - 11,765 - - - - - - Key management personnel 21.6 - 470,000 - - - - - - Others 21.5 458,457 357,164 56,898 3,714,646 225,042 38,604 Interest-free excluding cash
and cash equivalents, settlement in cash
Unsecured, no impairment
1,028,626 1,756,118 56,898 3,714,646 1,550,411 151,964
O Globe

�����������������03/��
&�5�(�$�7�(���:�2�1�'�(�5�)�8�/� ���
2018
Amount of transaction Outstanding Balance
Note Revenue and
Other Income
Costs and Expenses
charged to Profit or Loss
Cost and Expenses
capitalized as Asset
Cash and Cash
Equivalents (Note 31)
Amounts Owed by
Related Parties
Amounts Owed to Related
Parties Terms Conditions
Entities with joint control over the Company Singtel 21.1 639,399 348,836 - - 255,535 123,518 Interest-free, settlement in cash Unsecured, no impairment AC 21.1 31,363 86,604 - - 15,515 85 Interest-free, settlement in cash Unsecured, no impairment
Jointly controlled entities BMPL 21.2 - 20,703 - - - 348 Interest-free, settlement in cash Unsecured, no impairment GFI/Mynt 21.2 51,786 432,145 - 511,632 52,413 Interest-free, settlement in cash Unsecured, no impairment
Associate Yondu 21.4 (46,340) 438,368 90,181 - 68,867 255,343 Interest-free, settlement in cash Unsecured, no impairment
Other related parties
GGRP 15 36,366 - - - 598,000 -
3 years, 5.5%, settlement in cash
Unsecured, no impairment
BHI 15 7,498 - - - 128,620 - 3 years, 5.75%, settlement incash
The 250.00 million is covered by a pledge agreement while the 45.00 million is fully
secured by chattel mortgage agreement.
BEAM 21.3 - 190,000 - - - - - - Altimax 21.3 - 55,000 - - - - - - Key management personnel 21.6 - 383,900 - - - - - - Others 21.5
606,884 359,767 102,882 1,704,573 - 279,726
Interest-free excluding cash and cash equivalents,
settlement in cash
Unsecured, no impairment
1,326,956 2,315,323 193,063 1,704,573 1,578,169 711,433
O Globe

�����������������03/��
&�5�(�$�7�(���:�2�1�'�(�5�)�8�/��� ���
Amounts owed by related parties are presented in the statement of financial position as follows:
Notes 2019 2018
(In Thousand Pesos) Trade receivables – net 262,301 288,999 Due from related parties 10 631,490 562,550 Loans to related parties 10, 16 656,620 726,620
1,550,411 1,578,169
Amounts owed to related parties are presented in the statement of financial position as part of trade payable ands and accrued expenses.
21.1 Entities with Joint Control over Globe Group - AC and Singtel
Globe Telecom has interconnection agreements with Singtel. Interconnection revenues and costs recognized from the agreements with Singtel are as follows:
2019 2018 2017
(In Thousand Pesos) Service revenues 466,404 639,399 695,985 Interconnection costs 42,184 61,423 67,867
Globe Telecom and Singtel have a technical assistance agreement whereby Singtel will provide consultancy and advisory services, including those with respect to the construction and operation of Globe Telecom’s networks and communication services, equipment procurement and personnel services. In addition, Globe Telecom has software development, supply, license and support arrangements, and maintenance cost transactions with Singtel.
The details of fees incurred under these agreements are as follows:
2019 2018 2017
(In Thousand Pesos) Maintenance costs 119,336 83,497 150,521 Technical assistance fee 132,576 158,117 174,285 Software development, supply, license and support 39,618 45,799 65,735
291,530 287,413 390,541
The outstanding balances due to Singtel arising from these transactions amounted to 55.88 million and 123.52 million as of December 31, 2019 and 2018, respectively.
Globe Telecom, Innove and BTI earn subscriber revenues from AC. Service revenues recognized from AC amounted to 14.41 million, 31.36 million and 25.58 million in 2019, 2018 and 2017, respectively.
Globe Telecom reimburses AC for certain operating expenses. Total expense recognized by the Globe Group from the transaction amounted to 64.37 million, 86.60 million and 37.35 million in 2019, 2018 and 2017, respectively.
it) Globe

�����������������03/��
&�5�(�$�7�(���:�2�1�'�(�5�)�8�/� ���
Joint Ventures in which the Globe Group is a venturer
BMPL
Globe Telecom has preferred roaming service contract with BMPL. Under this contract, Globe Telecom will pay BMPL for services rendered by the latter which include, among others, coordination and facilitation of preferred roaming arrangement among JV partners, and procurement and maintenance of telecommunications equipment necessary for delivery of seamless roaming experience to customers. Globe Telecom also incurs commission from BMPL for regional top-up service provided by the JV partners. The net outstanding liabilities to BMPL related to these transactions amounted to 1.38 million and 0.35 million as of December 31, 2019 and 2018, respectively. Total expenses recognized related to these transactions amounted to 21.46 million, 20.70 million and 20.71 million in 2019, 2018, and 2017, respectively.
GFI/Mynt
The Globe Group renders certain management support services to GXI. The management services also include the use of the Globe Group’s network and facilities to conduct GXI’s operations. Management fee income amounted to 51.79 million in 2019 and 2018 (see Note 24).
The Globe Group also has a VAS sharing agreement with GXI. Under the agreement, GXI shall perform the following services and shall be entitled to a certain percentage of data revenues arising from GCash transactions:
(1) provide an e-commerce system (the application that drives the service) through which mobilewallets get updated for each cash-in and cash-out transaction;
(2) provide cash-in and cash-out distribution channels for the remittance business through its partners(which may include Globe Stores); and
(3) provide customer support.
GXI is also entitled to a certain percentage share for the airtime load purchased by the Globe Group’s subscribers and Application Processing Interface (API) fees for the usage of GCash system in continuing service of the various products and services of the Globe Group.
Total amount charged to consolidated profit and loss amounted to 322.05 million and 432.15 million in 2019 and 2018, respectively.
21.2 Transactions with the GGRP
The Globe Group granted various loans to the GGRP at an interest rate of 5.00%, which matured on September 11, 2017. Upon maturity, the loan was extended until September 11, 2020 with the interest rate increased to 5.50% per annum. Interest income amounted to 31.09 million, 36.37 million and 38.24 million in 2019, 2018 and 2017, respectively (see Note 23). As of December 31, 2019 and 2018, the outstanding balance of loan receivable from GGRP amounted to 548.00 million and 598.00 million, respectively (see Note 10 and 16).
The retirement plan utilized the loan to fund its investments in BHI, a domestic corporation organized to invest in media ventures. BHI has controlling interest in Altimax Broadcasting Co., Inc. (Altimax) and Broadcast Enterprises and Affiliated Media Inc. (BEAM), respectively.
O Globe

�����������������03/��
&�5�(�$�7�(���:�2�1�'�(�5�)�8�/��� ���
The�Globe Group granted loans amounting to 250.00 million and 45.00 million to BHI at 5% interest which matured on August 14, 2017. The 250.00 million loan is covered by a pledge agreement whereby in the event of default, the Globe Group shall be entitled to offset whatever amount is due to BHI from any unpaid fees to BEAM from the Globe Group. The 45.00 million loan is fully secured by a chattel mortgage agreement dated December 21, 2009 between Globe Group and BEAM. Upon maturity, the loan was extended until August 14, 2020 with the interest rate increased to 5.75% per annum.
As of December 31, 2019 and 2018, the outstanding balance of loan receivable from BHI amounted to 108.62 million and 128.62 million, respectively. (Note 10 and 16). Interest income amounted to 6.47 million, 7.50 million and 7.84 million in 2019, 2018, and 2017, respectively (see Note 23).
On February 1, 2009, the Globe Group entered into a memorandum of agreement (MOA) with BEAM for the latter to render mobile television broadcast service to Globe subscribers using the mobile TV service. The Globe Group recognized expense amounting to 175.60 million in 2019 and 190.00 million in 2018 and 2017.
On October 1, 2009, the Globe Group entered into a MOA with Altimax for the Globe Group’s co-use of specific frequencies of Altimax’s for the rollout of broadband wireless access to the Globe Group’s subscribers. The Globe Group recognized expense amounting to 11.77 million in 2019 and 55.00 million in 2018 and 2017.
21.3 Transactions with Yondu
The Globe Group has a VAS sharing agreement with Yondu. Under the agreement, Yondu is entitled to a 30% share on revenue for providing mobile contents to Globe and TM subscribers. The Globe Group’s payout to Yondu on mobile content transactions in 2018 amounted to 46.34 million.
Yondu also provides various enterprise solutions-based services to the Globe Group for network, platform and applications development under its BPO and mobile content. The Globe Group’s related expenses in 2018 amounted to 528.55 million out of which 90.18 million was capitalized as part of property and equipment.
On September 11, 2019, Globe Telecom reacquired 51% of the outstanding shares of Yondu, which increased its controlling interest to 100%.
21.4 Transactions with other related parties
The Globe Group earns service revenues, maintains money market placements and cash in bank balances, acquires transportation equipment and incurs general, selling and administrative expenses such as rentals, utilities and customer contract services, from entities which are either controlled, jointly controlled or significantly influenced by AC.
21.5 Transactions with key management personnel of the Globe Group
The Globe Group’s compensation of key management personnel by benefit type are as follows:
Note 2019 2018
(In Thousand Pesos) Short-term employee benefits 29 275,400 238,500 Share-based payments 29 181,600 128,900 Post-employment benefits 29 13,000 16,500
470,000 383,900
O Globe

�/30������������������
&�5�(�$�7�(���:�2�1�'�(�5�)�8�/� ���
There are no agreements between the Globe Group and any of its directors and key officers providing for benefits upon termination of employment, except for such benefits to which they may be entitled under the Globe Group’s retirement plans.
22� Equity and Other Comprehensive Income
Globe Telecom’s authorized capital stock as of December 31, 2019 and 2018 consists of (amounts in thousand pesos and number of shares):
Shares Amount
Voting preferred stock - 5 per share 160,000 800,000 Non-voting preferred stock - 50 per share 40,000 2,000,000 Common stock - 50 per share 148,934 7,446,719
Globe Telecom’s issued, subscribed and fully paid capital stock consists of:
2019 2018
Shares Amount Shares Amount
(In Thousand Pesos and Number of Shares) Voting preferred stock 158,515 792,575 158,515 792,575 Non-voting preferred stock 20,000 1,000,000 20,000 1,000,000 Common stock 133,208 6,660,420 133,053 6,652,663
Total capital stock 8,452,995 8,445,238
Below is the summary of the Globe Telecom’s track record of registration of securities:
Number of shares registered
Issue/offer price
Date of approval
(In Thousands, Except for Issue/Offer price) Voting preferred stock 158,515 5.00 June 2001 Non-voting preferred stock 20,000 500.00 August 11, 2014 Common stock* 30,000 0.50 August 11, 1975 *Initial number of registered shares only
22.1 Preferred Stock
Non-Voting Preferred Stock
On February 10, 2014, Globe Telecom’s BOD approved the amendment of Articles of Incorporation (AOI) to reclassify 31 million of unissued common shares with par value of 50 per share and 90 million of unissued voting preferred shares with par value of 5 per share into a new class of 40 million non-voting preferred shares with par value of 50 per share.
On April 8, 2014, the stockholders approved the issuance, offer and listing of up to 20 million non-voting preferred shares, with an issue volume of up to 10 billion. The preferred shares shall be redeemable, non-convertible, non-voting, cumulative and may be issued in series.
On June 5, 2014, the SEC approved the amendment of AOI to implement the foregoing reclassification of shares.
e Globe

�����������������03/��
&�5�(�$�7�(���:�2�1�'�(�5�)�8�/� ���
On August 8, 2014, the SEC approved the offer of non-voting preferred perpetual shares and on August 15, 2014, the 20 million non-voting preferred shares were fully subscribed and issued. Subsequently, the shares were listed at the Philippines Stock Exchange (PSE) on August 22, 2014.
Non-voting preferred stock has the following features:
� Issued at 50 par;� Dividend rate to be determined by the BOD at the time of issue;� Redemption - at Globe Telecom‘s option at such times and price(s) as may be determined by the
BOD at the time of issue, which price may not be less than the par value thereof plus accrueddividends;
� Eligibility of investors - Any person, partnership, association or corporation regardless ofnationality wherein at least 60% of the outstanding capital stock shall be owned by Filipino;
� No voting rights;� Cumulative and non-participating;� No pre-emptive rights over any sale or issuance of any share in Globe Telecom’s capital stock; and� Stocks shall rank ahead of the common shares and equally with the voting preferred stocks in the
event of liquidation.
Voting Preferred Stock
Voting preferred stock has the following features:
� Issued at 5 par;� Dividend rate to be determined by the BOD at the time of issue;� One preferred share is convertible to one common share starting at the end of the 10th year of
the issue date at a price to be determined by Globe Telecom’s BOD at the time of issue whichshall not be less than the market price of the common share less the par value of the preferredshare;
� Call option - Exercisable any time by Globe Telecom starting at the end of the 5th year from issuedate at a price to be determined by the BOD at the time of issue;
� Eligibility of investors - Only Filipino citizens or corporations or partnerships wherein 60% of thevoting stock or voting power is owned by Filipino;
� With voting rights;� Cumulative and non-participating;� Preference as to dividends and in the event of liquidation; and� No pre-emptive right to any share issue of Globe Telecom, and subject to yield protection in case
of change in tax laws.
The dividends for preferred stocks are declared upon the sole discretion of Globe Telecom’s BOD.
e Globe

�/30������������������
&�5�(�$�7�(���:�2�1�'�(�5�)�8�/� ���
22.2 Common Stock
The rollforward of outstanding common shares follows:
2019 2018
Shares Amount Shares Amount
(In Thousand Pesos and Number of Shares) At beginning of year 133,053 6,652,663 132,917 6,645,829 Exercise of stock options 10 499 7 371 Issuance of shares under share-
based compensation plan and exercise of stock options 145 7,258 129 6,463
At end of year 133,208 6,660,420 133,053 6,652,663
Holders of fully paid common stock are entitled to voting and dividends rights.
22.3 Cash Dividends
Information on the Globe Telecom’s BOD declaration of cash dividends follows:
Date
Per Share Amount Record Payment
(In Thousand Pesos, Except Per Share Figures) Dividends on Voting Preferred stock:
November 3, 2017 0.21 33,731 November 17, 2017 December 1, 2017 November 5, 2018 0.26 41,752 November 19, 2018 December 5, 2018 December 10, 2019 0.32 50,027 December 26, 2019 December 27, 2019
Dividends on Non-voting Preferred stock: May 9, 2017 13.00 260,030 August 10, 2017 August 22, 2017 December 5, 2017 13.00 260,030 January 26, 2018 February 22, 2018 May 4, 2018 13.00 260,030 August 10, 2018 August 22, 2018 December 6, 2018 13.00 260,030 January 28, 2019 February 22, 2019 May 3, 2019 13.00 260,030 July 26, 2019 August 22, 2019 December 10, 2019 13.00 260,030 January 29, 2020 February 24, 2020
Dividends on Common stock: February 7, 2017 22.75 3,020,280 February 21, 2017 March 8, 2017 May 9, 2017 22.75 3,023,806 May 23, 2017 June 7, 2017 August 7, 2017 22.75 3,023,806 August 22, 2017 September 6, 2017 November 3, 2017 22.75 3,023,844 November 17, 2017 December 1, 2017 February 5, 2018 22.75 3,023,852 February 20, 2018 March 5, 2018 May 7, 2018 22.75 3,026,804 May 21, 2018 June 1, 2018 August 7, 2018 22.75 3,026,962 August 24, 2018 September 6, 2018 November 5, 2018 22.75 3,026,961 November 19, 2018 December 5, 2018 February 11, 2019 22.75 3,026,961 February 26, 2019 March 13, 2019 May 3, 2019 22.75 3,030,303 May 20, 2019 May 31, 2019 August 2, 2019 22.75 3,030,316 August 19, 2019 August 30, 2019 November 6, 2019 22.75 3,030,491 November 20, 2019 December 6, 2019
Unpaid cash dividends declared related to non-voting preferred stock amounted to 260.03 million as of December 31, 2019 and 2018 (see Note 17).
O Globe

�����������������03/��
&�5�(�$�7�(���:�2�1�'�(�5�)�8�/� ���
22.4 Common Stock Dividend
The dividend policy of Globe Telecom as approved by the BOD is to declare cash dividends to its common stockholders on a regular basis as may be determined by the BOD. On November 8, 2011, the BOD approved the current dividend policy of Globe Telecom to distribute cash dividends at the rate of 75% to 90% of prior year's core net income. On August 6, 2013, the BOD further approved the change in distribution from semi-annual dividend payments to quarterly dividend distributions.
On November 5, 2018, the BOD approved the change in the dividend policy from 75% to 90% of prior year’s core net income to 60% to 75% of prior year’s core net income, to be applied to the 2019 dividend declaration.
The dividend distribution policy is reviewed annually and subsequently each quarter of the year, taking into account Globe Telecom's operating results, cash flows, debt covenants, capital expenditure levels and liquidity.
22.5 Retained Earnings Available for Dividend Declaration
The total unrestricted retained earnings available for dividend declaration amounted to 18,281.94 million as of December 31, 2019. This amount excludes the undistributed net earnings of consolidated subsidiaries, accumulated equity in net earnings of joint ventures accounted for under the equity method, and unrealized gains recognized on asset and liability, currency translations and unrealized gains on fair value adjustments. The Globe Group is also subject to loan covenants that restrict its ability to pay dividends (see Note 19).
22.6 Other Comprehensive Income
Other Reserves
2019
Cash flow hedges
Investment in equity securities
Currency translation adjustment
Remeasurement on defined
benefit plan (Note 29.2) Total
(In Thousand Pesos) As of January 1 948,919 293,848 44,365 (726,029) 561,103 Other comprehensive income for the
year: Fair value changes (2,835,986) 188,486 - - (2,647,500) Remeasurement loss on defined
benefit plan - - - (1,956,549) (1,956,549) Transferred to profit or loss 1,102,622 - - - 1,102,622 Exchange differences - - (105,292) - (105,292)Share in OCI from investment in
associate (Note 15) - 275,325 (2,054) (3,914) 269,357 Income tax effect 520,009 (23,462) 358 587,420 1,084,325
(1,213,355) 440,349 (106,988) (1,373,043) (2,253,037) Reclassification of accumulated share
in an associateʼs OCI - 1,891 - (790) 1,101 Reclassification of fair value gain on
investment in equity securities at
FVOCI - (75,777) - - (75,777)
As of December 31 (264,436) 660,311 (62,623) (2,099,862) (1,766,610)
O Globe

�����������������03/��
&�5�(�$�7�(���:�2�1�'�(�5�)�8�/� ���
2018
Cash flow hedges
Investment in equity
securities
Currency translation
adjustment
Remeasurement on defined
benefit plan (Note 29.2) Total
(In Thousand Pesos) As of January 1 85,204 141,874 15,841 (595,294) (352,375) Other comprehensive income for the
year: Fair value changes 1,178,226 170,645 - - 1,348,871 Remeasurement gain on defined benefit
plan - - - 71,013 71,013 Transferred to profit or loss 55,653 - - - 55,653 Exchange differences - - 38,061 - 38,061Share in OCI from investment in
associate (Note 15) - - 2,089 - 2,089Income tax effect (370,164) (18,671) (11,626) (21,304) (421,765)
863,715 151,974 28,524 49,709 1,093,922 Reclassification of remeasurement
losses on defined benefit plans - - - (180,444) (180,444)
As of December 31 948,919 293,848 44,365 (726,029) 561,103
2017
Cash flow hedges
Investment in equity
securities (Note 16)
Currency translation
adjustment
Remeasurement on defined
benefit plan (Note 29.2) Total
(In Thousand Pesos) As of January 1 (54,208) 115,874 38,981 (1,173,572) (1,072,925) Other comprehensive income for
the year: Fair value changes (173,001) 36,076 - - (136,925) Remeasurement gain on defined
benefit plan - - - 570,289 570,289 Transferred to profit or loss 372,161 - - - 372,161 Income tax effect (59,748) (10,076) - (171,087) (240,911) Share in OCI from investment in
associate - - 80 791 871 Exchange differences - - (23,220) - (23,220)
139,412 26,000 (23,140) 399,993 542,265 Reclassification of remeasurement
gains on defined benefit plans - - - 178,285 178,285
As of December 31 85,204 141,874 15,841 (595,294) (352,375)
O Globe

�����������������03/��
&�5�(�$�7�(���:�2�1�'�(�5�)�8�/� ���
23� Interest Income
Interest income is earned from the following sources:
Notes 2019 2018 2017
(In Thousand Pesos) Short-term placements 5 440,402 332,525 71,876 Loans receivable:
GGRP 21.3 31,093 36,366 38,244 BHI 21.3 6,473 7,498 7,842
Cash in banks 5 17,158 12,353 18,007 Others 5,311 2,288 3,612
500,437 391,030 139,581
24� Other Income - net
This account consists of:
Notes 2019 2018 2017
(In Thousand Pesos) Gain (loss) on derivatives
instruments – net ���809,540) 1,004,171 (127,708) Foreign exchange gain (loss) - net 848,394 (900,430) 214,191 Gain on sale of Investment in
associate 15.2 240,000 - - Management fees 21.2 51,786 51,786 12,946 Rent 23,604 65,302 52,511 Gain (loss) on settlement and
remeasurement of ARO 20 5,769 27,894 (4,371) Others 686,994 446,682 554,084
1,047,007 695,405 701,653
25� General, Selling and Administrative Expenses
This account consists of:
Notes 2019 2018 2017
(In Thousand Pesos) Staff costs 29 15,479,606 13,271,175 12,238,114 Professional and other contracted services 13,127,917 11,028,251 9,844,780 Repairs and maintenance 8,493,916 7,944,057 7,822,818 Utilities, supplies and other administrative expenses 6,576,249 5,957,642 5,215,693 Selling, advertising and promotions 6,448,214 5,620,077 9,009,306 Lease 13 5,793,299 6,535,147 6,471,461 Taxes and licenses 3,844,761 3,106,915 1,951,490 Courier, delivery and miscellaneous expenses 1,830,987 1,684,540 1,737,609 Insurance and security services 1,764,324 1,607,072 1,685,518 Others 1,112,136 987,255 632,133
64,471,409 57,742,131 56,608,922
f, Globe

�����������������03/��
&�5�(�$�7�(���:�2�1�'�(�5�)�8�/� ���
26� Depreciation and amortization
The account consists of:
Notes 2019 2018 2017
(In Thousand Pesos) Property and equipment 11 27,183,301 24,895,449 22,825,049 Intangible assets 12 5,791,150 5,516,254 4,676,122 Right of use - net 13 1,163,491 - - Investment properties 16 5,599 10,018 11,518
34,143,541 30,421,721 27,512,689
27� Financing Costs
This account consists of:
Notes 2019 2018 2017
(In Thousand Pesos) Loans payable 19 5,937,695 5,748,853 4,776,242 Swap costs 8.1 366,952 220,061 208,740 Lease liabilities 13.2 272,171 - - Accretion expense 20 155,674 140,457 117,188 Pension cost 29.2 66,690 84,837 145,663 Others 3,679 1,017 3,859
6,802,861 6,195,225 5,251,692 *This account is net of the amount capitalized borrowing costs (see Notes 11 and 19).
28� Impairment and other losses
This account consists of:
Notes 2019 2018 2017
(In Thousand Pesos) Impairment loss on
Trade receivables 6 3,340,156 2,972,345 4,041,510 Remeasurement of
investment in associate 14.1 470,653 - - Contract assets 7.1.1 256,898 457,657 - Property and equipment 11 59,157 61,739 28,319 Other assets 1,313 116,362 69,926 Goodwill 12 - 142,794 - Non-trade receivables 10 - - 37,467 Investment in associate 15.2 - - 286,036
Provisions for (reversal of): Inventory obsolescence 9 713,717 377,775 403,037 Other probable losses - net 18 71,243 658,972 557,071
4,913,137 4,787,644 5,423,366
e Globe

�����������������03/��
&�5�(�$�7�(���:�2�1�'�(�5�)�8�/� ���
29� Staff Cost
This account consist of:
2019 2018 2017
(In Thousand Pesos) Short-term 13,993,233 12,441,135 11,511,970 Share based compensation 325,160 236,714 104,828 Pension 1,161,213 593,326 621,316
15,479,606 13,271,175 12,238,114
29.1 Stock Plans
The Globe Telecom has stock plans for its employees. The number of shares allocated under these plans shall not exceed the aggregate equivalent of 6% of the authorized capital stock.
29.1.1 Executive Stock Option Plan
The following are the stock option grants to key executives and senior management personnel of the Globe Group under the ESOP from 2006 to 2009:
Date of Grant
Number of
Optionsor
Grants Exercise Price Exercise Dates
Fair Value of Each
Option or Grants
Fair Value Measurement
May 17, 2007
604,000 1,270.50 per share
50% of the options become exercisable from May 17, 2009 to May 16, 2017, the remaining 50% become exercisable from May 17, 2010 to May 16, 2017
375.89 Trinomial option pricing
model
August 1, 2008
635,750 1,064.00 per share
50% of the options become exercisable from August 1, 2010 to July 31, 2018, the remaining 50% become exercisable from August 1, 2011 to July 31, 2018
305.03 Trinomial option pricing
model
October 1, 2009
298,950 993.75 per share
50% of the options become exercisable from October 1,
2011 to September 30, 2019, the remaining 50% become exercisable from October 1, 2012 to September 30, 2019
346.79 Trinomial option pricing
model
The exercise price is based on the average quoted market price for the last 20 trading days preceding the approval date of the stock option grant.
e Globe

�����������������03/��
&�5�(�$�7�(���:�2�1�'�(�5�)�8�/� ���
A summary of the Globe Group’s ESOP activity and related information follows:
2019 2018
Number of Shares
Weighted Average Exercise
Price Number of
Shares
Weighted Average Exercise
Price
(In Thousand Number of Shares Except per Share Figures) Outstanding, at beginning of year 33 1,059.55 93 1,038.36 Exercised (12) 993.75 (16) 993.75Expired/forfeited (21) 993.75 (44) 1,064.00
Outstanding and exercisable, at end of year - - 33 1,059.55
The average share prices at dates of exercise of the stock options in 2019, 2018 and 2017 amounted to 1,928.40, 1,704.96 and 1,014.42, respectively.
The following assumptions were used to determine the fair value of the stock options at effective grant dates:
October 1, August 1, May 17,
2009 2008 2007
Share price 995.00 1,130.00 1,340.00 Exercise price 993.75 1,064.00 1,270.50 Expected volatility 48.49% 31.73% 38.14% Option life 10 years 10 years 10 years Expected dividends 6.43% 6.64% 4.93% Risk-free interest rate 8.08% 9.62% 7.04%
The expected volatility measured at the standard deviation of expected share price returns was based on analysis of share prices for the past 365 days.
29.1.2 Long-Term Incentive Plan
In November 2014, the Globe Group obtained approval from the BOD to implement a Long-Term Incentive Plan (LTIP) also called a Performance Share Plan (PSP) covering key executives and senior management. Under the PSP, the grantees are awarded a specific number of shares at the start of the performance period which vest over a specified performance period and contingent upon the achievement of specified long-term goals.
O Globe

�����������������03/��
&�5�(�$�7�(���:�2�1�'�(�5�)�8�/� ���
The following are the stock grants to key executives and senior management personnel of the Globe Group under the LTIP:
Date of Grant
Number of Grants at Grant Date Settlement Dates
Fair Value of Each Grants
Fair Value Measurement
January 1, 2014 106,293 100% after 3 years subject to attainment of plan targets and
subject to stock ownership requirements
1,630.35 Market price
January 1, 2015 114,392 100% after 3 years subject to attainment of plan targets and
subject to stock ownership requirements
1,738.30 Market price
January 1, 2016 107,365 100% after 3 years subject to attainment of plan targets and
subject to stock ownership requirements
1,904.95 Market price
January 1, 2017 158,687 100% after 3 years subject to attainment of plan targets and
subject to stock ownership requirements
1,428.85 Market price
January 1, 2018 146,040 100% after 3 years subject to attainment of plan targets and
subject to stock ownership requirements
1,782.80 Market price
July 31, 2019 289,650 100% after 3 years subject to attainment of plan targets and
subject to stock ownership requirements
1,997.35 Market price
The fair value is based on the average quoted market price for the last 20 trading days preceding the approval date of the stock option grant.
Cost of share-based payments in 2019, 2018 and 2017 amounted to 325.16 million, 236.71 million and 104.83 million, respectively.
29.2 Pension Plan
The Globe Group has a funded, noncontributory, defined benefit pension plans (“the Plan”) covering substantially all of its regular employees. The benefits are based on years of service and compensation on the last year of employment.
The group retirement plan covering Globe Telecom and Innove is managed and administered by a Board of Trustees (BOT) whose members are unanimously appointed by the Globe Group acting through its BOD. The BOT are authorized to appoint one or more fund managers to hold, invest and reinvest the assets of the Plan and execute an Investment Agreement with the said fund managers.
O Globe

�����������������03/��
&�5�(�$�7�(���:�2�1�'�(�5�)�8�/� ���
The BOT sets the investment policies and limits of the Plan, and appoints fund managers to assist in the investment management of the Plan. The objective of the portfolio is capital preservation by earning higher than regular deposit rates over a long period given a small degree of risk on principal interest.
Asset - liability matching strategies
The investment policy in managing liquidity is to have sufficient liquidity at all times to meet the Plan’s maturing liabilities, including benefit payments to qualified employees who are expected to avail of their retirement benefits when due, without incurring unnecessary funding costs. The investment policy is also geared towards maintaining highly saleable government securities as a significant part of the plan investment portfolio even as other private securities and unquoted securities provided higher yields.
The Plan’s liquidity risk is managed on a daily basis by the Plan’s investment managers in accordance with the policies and procedures duly approved by the BOT. The Plan’s overall liquidity position for the year is monitored on a regular basis by the BOT.
Funding policy
The plan should have at least 100% solvency all levels at all times. If a solvency deficiency exists, the deficit must be immediately funded.
Risks associated with the Plan
The retirement plan typically expose the participants to actuarial risks such as investment risk, interest rate risk, longevity risk and salary risk.
Investment risk
The present value of the defined benefit plan liability is calculated using a discount rate determined by reference to government bond yields; if the return on plan asset is below this rate, it will create a plan deficit.
Interest rate risk
A decrease in the government bond interest rate will increase the plan liability; however, this will be partially offset by an increase in the return on the plan’s debt investments.
Longevity risk
The present value of the defined benefit plan liability is calculated by reference to the best estimate of the mortality of plan participants both during and after their employment. An increase in the life expectancy of the plan participants will increase the plan’s liability.
Salary risk
The present value of the defined benefit plan liability is calculated by reference to the future salaries of plan participants. As such, an increase in the salary of the plan participants will increase the plan’s liability.
The most recent actuarial valuation of the plan assets and the present value of the defined benefit obligation were carried out at December 31, 2019 by an Independent Actuary. The present value of the defined benefit obligation, and the related current service cost and past service cost, were measured using the projected unit credit method.
fb G1obe

�����������������03/��
&�5�(�$�7�(���:�2�1�'�(�5�)�8�/� ���
The components of pension expense (included in staff costs under “General, selling and administrative expenses” account) in the consolidated statements of comprehensive income are as follows:
2019 2018 2017 (In Thousand Pesos)
Current service cost 523,152 593,326 621,316 Past service cost 638,061 - - Net interest expense (Note 27) 66,690 84,837 145,663
Components of defined benefit costs recognized in profit or loss 1,227,903 678,163 766,979
Remeasurement on the net defined benefit liability: Return on plan assets (excluding amounts included in net interest expense) (312,149) 515,908 2,337 Actuarial gains and losses:
from changes in assumptions 1,796,723 (892,818) (420,029) from experience adjustments 471,975 305,897 (152,597)
Components of defined benefit costs recognized in other comprehensive income (Note 22.6) 1,956,549 (71,013) (570,289)
3,184,452 607,150 196,690
The accrued pension is as follows:
Note 2019 2018
(In Thousand Pesos) Present value of benefit obligation 10,308,731 6,693,681 Fair value of plan assets (6,570,301) (5,234,216)
Accrued pension 20 3,738,430 1,459,465
The following tables present the changes in the present value of defined benefit obligation and fair value of plan assets:
Present value of defined benefit obligation
2019 2018
(In Thousand Pesos) Balance at beginning of year 6,693,681 6,635,722 Current service cost 523,152 593,326 Interest cost 489,592 369,988 Benefits paid (318,966) (318,434) Remeasurements in other comprehensive income:
Actuarial gains and losses arising from changes in assumptions 1,796,723 (892,818) Actuarial gains and losses arising from experience adjustments 471,975 305,897
Plan changes/ amendments 638,061 - Effects of business combinations 14,513 -
Balance at end of year 10,308,731 6,693,681
e Globe

�/30������������������
&�5�(�$�7�(���:�2�1�'�(�5�)�8�/� ���
Fair value of plan assets
2019 2018
(In Thousand Pesos)
Balance at beginning of year 5,234,216 4,534,407 Remeasurement (gains)/losses:
Return on plan assets (excluding amounts included in net interest expense) 312,149 (515,908)
Contributions from the employer 920,000 1,249,000 Interest income 422,902 285,151 Benefits paid (318,966) (318,434)
Balance at end of year 6,570,301 5,234,216
Actual return on plan assets 735,051 230,758
The recommended contribution for the Globe Group retirement fund for the year 2020 amounted to 1,758.98 million. This amount is based on the Globe Group’s actuarial valuation report as of December 31, 2019.
The allocation of the fair value of the plan assets of the Globe Group as of December 31 is as follows:
2019 2018
(In Thousand Pesos) Cash and cash equivalents 279,237 248,624 Investment in debt securities 2,507,227 1,725,721 Investment quoted in equity shares 2,783,837 2,259,612 Investment in unquoted in equity shares 1,000,000 1,000,259
6,570,301 5,234,216
The assumptions used to determine pension benefits for the Globe Group are as follows:
2019 2018
Discount rate 5.00% 7.50% Salary rate increase 4.50% 4.50%
The assumptions regarding future mortality rates which are based on the 2017 Philippine Intercompany Mortality Table which is based on a recent study by the Actuarial Society of the Philippines.
In 2019 and 2018, the Globe Group applied a single weighted average discount rate that reflects the estimated timing and amount of benefit payments.
C Globe

�����������������03/��
&�5�(�$�7�(���:�2�1�'�(�5�)�8�/� ���
The sensitivity analysis below has been determined based on reasonably possible changes of each significant assumption on the defined benefit obligation as of December 31, 2019 and 2018, assuming all other assumptions were held constant (in thousand pesos):
December 31, 2019
Increase (decrease) in basis points
Increase (decrease) on defined benefit
obligation
Discount rates +0.50% (458,311) -0.50% 585,889
Future salary increases +0.50% 585,889 -0.50% (462,432)
Rate of return +10.00% 1,030 -10.00% (1,026)
December 31, 2018
Increase (decrease) in basis points
Increase (decrease) on defined benefit
obligation
Discount rates +0.50% (177,138) -0.50% 217,914
Future salary increases +0.50% 223,930 -0.50% (182,486)
Rate of return +10.00% 2,005 -10.00% (2,005)
There were no changes from the previous period in the methods and assumptions used in preparing sensitivity analysis.
The objective of the plan’s portfolio is capital preservation by earning higher than regular deposit rates over a long period given a small degree of risk on principal and interest. Asset purchases and sales are determined by the plan’s investment managers, who have been given discretionary authority to manage the distribution of assets to achieve the plan’s investment objectives. The compliance with target asset allocations and composition of the investment portfolio is monitored by the BOT on a regular basis.
The sensitivity analysis presented above may not be representative of the actual change in the defined benefit obligation as it is unlikely that the changes in assumptions would occur in isolation of one another as some of the assumptions may be correlated.
In presenting the above sensitivity analysis, the present value of the defined benefit obligation has been calculated using the Projected Unit Credit Method at the end of the reporting period, which is the same as that applied in calculating the defined benefit obligation recognized in the consolidated statement of financial position.
The plan contributions are based on the actuarial present value of accumulated plan benefits and fair value of plan assets are determined using an independent actuarial valuation.
The average duration of the defined benefit obligation at the end of the reporting period is 16.73 years and 15.17 years in 2019 and 2018, respectively.
O Globe

�����������������03/��
&�5�(�$�7�(���:�2�1�'�(�5�)�8�/� ���
Shown below is the maturity analysis of the undiscounted benefit payments as of December 31:
2019 2018
(In Thousand Pesos) Within 1 year 397,936 323,327 More than 1 year to 5 years 2,355,474 1,795,285 More than 5 years 4,689,956 3,521,929
7,443,366 5,640,541
30� Income Tax
Net deferred tax assets and liabilities presented in the consolidated statements of financial position on a net basis by entity are as follows:
2019 2018
(In Thousand Pesos) Net deferred income tax assets* 1,866,591 2,075,065 Net deferred income tax liabilities (Globe, GCVH, GTI and KVI) (5,057,641) (3,918,493)
Net deferred income tax (liabilities) assets (3,191,050) �1,843,428) *2019 consist of Innove, BTI, GCVH, Yondu and GTowers *2018 consist of Innove, BTI and Asticom
The significant components of the deferred income tax assets and liabilities of the Globe Group represent the deferred income tax effects of the following:
2019
Movements
2018
Acquired from a
business combination
Profit or Loss
Other Comprehensive
Income Other equity
item 2019
Deferred tax assets Allowance for impairment
losses on receivables 3,711,267 5,591 (864,865) - - 2,851,993 Unearned revenues and
advances already subjected to income tax 1,967,076 - 75,345 - - 2,042,421
Accrued manpower cost 1,123,845 - 178,529 - - 1,302,374 Accrued pension 814,264 (2,158) 147,475 587,420 - 1,547,001Unrealized foreign
exchange losses 810,409 7 (308,266) - - 502,150ARO 701,327 - 66,346 - - 767,673 Provision for claims and
assessment 505,719 - (12,981) - - 492,738 Cost of share-based
payments 174,360 - 18,154 - (4,236) 188,278 Accumulated impairment
losses on property and - equipment 159,442 - (8,977) - - 150,465 (forward)
C Globe

�����������������03/��
&�5�(�$�7�(���:�2�1�'�(�5�)�8�/� ����
2019 Movements
2018
Acquired from a
business combination
Profit or Loss
Other Comprehensive
Income Other equity
item 2019 Deferred tax assets
Inventory obsolescence and market decline 158,722 - 348 - - 159,070
Accrued rent expense under PAS 17 144,298 - (144,145) - - 153
Contract liabilities 108,223 - (20,835) - - 87,388 Lease liabilities net of ROU - - 173,346 - (144,145) 29,200 MCIT 21,258 - (20,460) - - 798 NOLCO 556 - (463) - - 93 Others 36,427 (83,843) 104,168 - - 56,752
10,437,193 (80,403) (617,281) 587,420 (148,381) 10,178,547
Deferred tax liabilities Excess of accumulated
depreciation and amortization of Globe Telecom equipment for (a) tax reporting over (b) financial reporting (7,921,353) (145,514) (1,448,069) - - (9,514,936)
Undepreciated capitalized borrowing costs already claimed as deduction for tax reporting (1,076,544) - (98,667) - - (1,175,211)
Contract asset (2,330,482) - 32,922 - - (2,297,560) Unrealized gain on
derivative transaction (615,513) - 218,912 520,009 - 123,408Unrealized foreign
exchange gain (12,207) (1,759) (14,604) - - (28,570) Unamortized discount on
noninterest bearing liability (11,113) - (195) - - (11,308)
Others (313,408) (866) (128,042) (23,104) - (465,420)
(12,280,620) (148,139) (1,437,743) 496,905 - (13,369,597)
Net deferred income tax assets (liabilities) (1,843,427) (228,542) (2,055,024) 1,084,325 (148,381) (3,191,050)
O Globe

�����������������03/��
&�5�(�$�7�(���:�2�1�'�(�5�)�8�/� ����
2018
Movements
2017 Profit or
Loss
Other Comprehensive
Income Other equity
item 2018
Deferred tax assets Allowance for impairment losses on
receivables 2,718,940 (1,401,898) - 2,394,225 3,711,267�Unearned revenues and advances
already subjected to income tax 1,504,476 462,600 - - 1,967,076 Accrued manpower cost 780,993 342,852 - - 1,123,845 Accrued pension 845,211 (9,643) (21,304) - 814,264Unrealized foreign exchange losses 541,975 268,434 - - 810,409ARO 661,388 39,939 - - 701,327Provision for claims and assessment 314,759 190,960 - - 505,719Cost of share-based payments 120,463 56,246 - (2,349) 174,360Accumulated impairment losses on
property and equipment 141,496 17,946 - - 159,442Inventory obsolescence and market
decline 184,780 (26,058) � � 158,722Accrued rent expense under PAS 17 158,915 (14,617) � � 144,298Contract liabilities - (8,286) � 116,509 108,223MCIT - 21,258 � � 21,258NOLCO 62,339 (61,783) � � 556 Others 74,686 (31,490) � (6,769) 36,427
8,110,421 (153,540) (21,304) 2,501,616 10,437,193
Deferred tax liabilities Excess of accumulated depreciation and
amortization of Globe Telecom equipment for (a) tax reporting over (b) financial reporting (6,478,641) (1,442,712) � � (7,921,353)
Undepreciated capitalized borrowing costs already claimed as deduction for tax reporting (1,231,218) 154,674 � � (1,076,544)
Contract asset - (121,791) � (2,208,691) (2,330,482) Unrealized gain on derivative transaction (220,602) (24,747) (370,164) � (615,513)Unrealized foreign exchange gain (7,329) (4,878) � � (12,207) Unamortized discount on noninterest
bearing liability - (11,113) � � (11,113) Others (159,831) (123,281) (30,297) � (313,409)
(8,097,621) (1,573,848) (400,461) (2,208,691) (12,280,621)
Net deferred income tax assets (liabilities) 12,800 (1,727,388) (421,765) 292,925 (1,843,428)
O Globe

�/30������������������
&�5�(�$�7�(���:�2�1�'�(�5�)�8�/� ����
The reconciliation of the provision for income tax at statutory tax rate and the actual current and deferred provision for income tax follows:
2019 2018 2017
(In Thousand Pesos) Provision at statutory income tax rate 9,848,213 8,283,995 6,462,511 Add (deduct) tax effects of:
Equity in net losses of associates and joint ventures 766,435 374,881 253,853 Impairment loss on goodwill - 42,838 - Deferred tax on unexercised stock options and
basis differences on deductible and reported stock compensation expense (2,168) (1,561) 12,752
Recognition of deferred income tax asset - 78,586 61,806 Income subjected to lower tax rates (128,585) (71,985) (489,235) Others 59,724 280,619 155,802
Actual provision for income tax 10,543,619 8,987,373 6,457,489
The current provision for income tax includes the following:
2019 2018 2017
(In Thousand Pesos) RCIT or MCIT, whichever is higher 8,335,287 7,151,614 5,942,221 Final tax 153,308 108,371 63,199
8,488,595 7,259,985 6,005,420
Deferred tax assets of BTI on the following deductible temporary differences were not recognized since Management believes that it will not be utilized for future taxable income:
2019 2018
(In Thousand Pesos) Deferred tax assets on:
Allowance for impairment of assets 605,282 605,282
Provision for probable loss 251,668 236,298
856,950 841,580
@ Globe

�����������������03/��
&�5�(�$�7�(���:�2�1�'�(�5�)�8�/� ����
31� Earnings Per Share
The Globe Group’s earnings per share amounts were computed as follows:
2019 2018 2017
(In Thousand Pesos and Number of Shares Except per Share Figures)
Net income attributable to common shareholders 22,269,340 18,640,740 15,065,779 Less dividends on preferred shares:
Non-voting preferred shares 520,060 520,060 520,060 Convertible voting preferred shares 50,027 41,752 33,731
Net income attributable to common shareholders for basic earnings per share (a) 21,699,253 18,078,928 14,511,988
Add dividends on convertible voting preferred shares 50,027 41,752 33,731
Net income attributable to common shareholders for diluted earnings per share (b) 21,749,280 18,120,680 14,545,719
Common shares outstanding, beginning 133,053 132,917 132,759 Add Weighted average number of exercised shares for
stock options 101 101 105
Weighted average number of shares for basic earnings per share (c) 133,154 133,018 132,864
Add Dilutive shares arising from: Convertible preferred shares 399 431 400 Share based compensation plans 535 371 103
Stock options - 15 67
Adjusted weighted average number of common shares for diluted earnings per share (d) 134,087 133,835 133,434
Basic earnings per share (a/c) 162.96 135.91 109.22
Diluted earnings per share (b/d) 162.20 135.40 109.01
32� Capital and Financial Risk Management and Financial Instruments
The Globe Group adopts an expanded corporate governance approach in managing its business risks. An Enterprise Risk Management Policy was developed to systematically view the risks and to provide a better understanding of the different risks that could threaten the achievement of the Globe Group’s mission, vision, strategies, and goals, and to provide emphasis on how management and employees play a vital role in achieving the Globe Group’s mission of transforming and enriching lives through communications.
The policies are not intended to eliminate risk but to manage it in such a way that opportunities to create value for the stakeholders are achieved. The Globe Group risk management takes place in the context of the normal business processes such as strategic planning, business planning, operational and support processes.
The application of these policies is the responsibility of the BOD through the Chief Executive Officer. The Chief Finance Officer and concurrent Chief Risk Officer champion oversees the entire risk management function. Risk owners have been identified for each risk and they are responsible for coordinating and continuously improving risk strategies, processes and measures on an enterprise-wide basis in accordance with established business objectives.
t, Globe

�/30������������������
&�5�(�$�7�(���:�2�1�'�(�5�)�8�/� ����
The risks are managed through the delegation of management and financial authority and individual accountability as documented in employment contracts, consultancy contracts, letters of authority, letters of appointment, performance planning and evaluation forms, key result areas, terms of reference and other policies that provide guidelines for managing specific risks arising from the Globe Group’s business operations and environment.
The Globe Group continues to monitor and manage its financial risk exposures according to its BOD approved policies.
The succeeding discussion focuses on Globe Group’s capital and financial risk management.
32.1 Capital Risk Management Objectives and Policies
Capital represents equity attributable to equity holders of the Parent Company.
The primary objective of the Globe Group’s capital management is to ensure that it maintains a strong credit rating and healthy capital ratios in order to support its business and maximize shareholder value.
The Globe Group monitors its use of capital using leverage ratios, such as debt to total capitalization and makes adjustments to it in light of changes in economic conditions and its financial position. The ratio of debt to total capitalization for the years ended December 31, 2019 and 2018 was at 67% and 66%, respectively.
The Globe Group is not subject to regulatory imposed capital requirements.
The Globe Group’s loan agreements include compliance with certain ratios (see Note 19).
32.2 Financial Risk Management Objectives and Policies
The Globe Group’s main risks arising from the use of financial instruments are market risk, credit risk and liquidity risk. Globe Telecom’s BOD is ultimately responsible for reviewing and approving the policies for managing each of these risks. The Globe Group’s risk management policies are summarized below:
32.2.1 Market Risk
Market risk is the risk that the fair value of future cash flows of a financial instrument will fluctuate because of changes in market prices. The Globe Group is mainly exposed to two types of market risk: interest rate risk and currency risk.
The Group seeks to minimize the effects of these risks by using derivative financial instruments to hedge these risk exposures. The Globe Group uses a combination of natural hedges and derivative hedging to manage its foreign exchange exposure as discussed in Note 8. It uses interest rate derivatives to reduce earnings volatility related to interest rate movements, and principal only swaps to hedge the foreign exchange risk exposure to principal repayments on USD debt.
It is the Globe Group’s policy to ensure that capabilities exist for active but conservative management of its foreign exchange and interest rate risks. The Globe Group does not engage in any speculative derivative transactions. Authorized derivative instruments include currency forward contracts, currency swap contracts, interest rate swap contracts and currency option contracts.
The sensitivity analyses in the following sections relate to the position as of December 31, 2019 and 2018. The analyses exclude the impact of movements in market variables on the carrying value of pension, provisions and on the non-financial assets and liabilities of foreign operation
e Globe

�/30������������������
&�5�(�$�7�(���:�2�1�'�(�5�)�8�/��� ����
The following assumptions have been made in calculating the sensitivity analyses:
� The sensitivity of the relevant profit or loss item is the effect of the assumed changes in respectivemarket risks. This is based on the financial assets and financial liabilities held as of December 31,2019 and 2018 including the effect of hedge accounting.
� The sensitivity of equity is calculated by considering the effect of any associated cash flow hedgesfor the effects of the assumed changes in the underlying.
� The assumed changes in market rates applied in the sensitivity analyses were based on historicalinformation and may not necessarily reflect the actual movements that may occur in the futureperiods.
32.2.1.1 Interest Rate Risk
The Globe Group’s exposure to market risk from changes in interest rates relates primarily to the Globe Group’s long-term debt obligations.
Globe Group’s policy is to manage its interest cost using a mix of fixed and variable rate debt, targeting a ratio of between 31%-62% fixed rate USD debt to total USD debt, and between 44%-88% fixed rate PHP debt to total PHP debt. To manage this mix in a cost-efficient manner, the Globe Group enters into interest rate swaps, in which Globe Group agrees to exchange, at specified intervals, the difference between fixed and variable interest amounts calculated by reference to an agreed-upon notional principal amount.
After taking into account the effect of interest rate swaps, the ratio of loans with fixed interest rates to total loans are as follows:
2019 2018
USD fixed rate loans 57% 42%
PHP fixed rate loans 85% 87%
The loans receivable from related parties are subject to fixed interest rates and therefore not exposed to market interest rate risk.
Due the short term maturities of cash and cash equivalents, its exposure to interest rate risk is not considered to be significant.
C Globe

�����������������03/��
&�5�(�$�7�(���:�2�1�'�(�5�)�8�/��� ����
The following tables demonstrate the sensitivity of income before tax to and equity a reasonably possible change in interest rates after the impact of hedge accounting, with all other variables held constant.
Increase/ Decrease in basis Points
Effect on income before income tax
Increase (Decrease) Effect on equity
Increase (Decrease)
(In Thousand Pesos)
2019
USD +50bps 6,547 (372) -50bps (6,547) 372
PHP +120bps 87,957 7,438 -120bps (87,957) (7,443)
2018
USD +75bps (24,787) (731) -75bps 24,787 731
PHP +150bps 11,130 9,821 -150bps (11,130) (9,830)
32.2.1.2 Foreign Exchange Risk
The Globe Group’s foreign exchange risk results primarily from movements of the PHP against the USD with respect to USD-denominated financial assets, USD-denominated financial liabilities and certain USD-denominated revenues. Majority of revenues are generated in PHP, while substantially all of capital expenditures are in USD. In addition, 16.33% and 15.88% of debt as of December 31, 2019 and 2018, respectively, are denominated in USD before taking into account any swap and hedges.
Information on the Globe Group’s foreign currency-denominated monetary assets and liabilities and their PHP equivalents are as follows:
2019 2018
US Dollar
Peso Equivalent
US Dollar
Peso Equivalent
(In Thousand Pesos) Assets Cash and cash equivalents $68,305 3,470,052 $95,989 5,045,457 Trade Receivables 83,492 4,241,541 100,211 5,267,417
151,797 7,711,593 196,200 10,312,874
Liabilities
Trade payable and accrued expenses 463,249 23,533,959 413,556 21,737,770 Loans payable 437,734 22,237,758 442,569 23,262,732
900,983 45,771,717 856,125 45,000,502
Net foreign currency - denominated liabilities $749,186 38,060,124 $659,925 34,687,628
it) Globe

�����������������03/��
&�5�(�$�7�(���:�2�1�'�(�5�)�8�/��� ����
The following table demonstrates the sensitivity to a reasonably possible change in the PHP to USD exchange rate, with all other variables held constant, of the Globe Group’s income before tax (due to changes in the fair value of foreign currency-denominated assets and liabilities).
Increase/Decrease in Peso to
US Dollar exchange rate
Effect on income before income tax
Increase (Decrease) Effect on equity
Increase (Decrease)
(In Thousand Pesos)
2019 +.60 (401,161) 241,255 -.60 401,161 (241,255)
2018 +.40 (231,977) 157,469 -.40 231,977 (157,469)
The movement in equity arises from changes in the fair values of derivative financial instruments designated as cash flow hedges.
The Globe Group’s foreign exchange risk management policy is to maintain a hedged financial position, after taking into account expected USD flows from operations and financing transactions. The Globe Group enters into short-term foreign currency forwards and long-term foreign currency swap contracts in order to achieve this target.
32.2.2 Credit Risk
Credit Risk Exposure
The table below details the Globe Group’s exposure to credit risk:
2019 2018
(In Thousand Pesos) Cash and cash equivalents 8,298,092 23,226,386 Trade receivables – net 21,138,950 20,652,532 Contract assets – net 7,045,794 7,124,332 Derivative assets 426,955 2,363,366 Loans receivable from related parties 656,620 726,620 Non-trade receivables* 1,635,747 1,458,503
39,202,158 55,551,739 *2019 figure for non-trade receivable does not include current portion of loans receivable from related party.
The Globe Group has not executed any credit guarantees in favor of other parties.
O Globe

�����������������03/��
&�5�(�$�7�(���:�2�1�'�(�5�)�8�/� ����
Credit Risk Management
Credit exposures from subscribers are managed closely by the Credit, Billing and Risk Management of the Globe Group. Applications for postpaid service are subjected to standard credit evaluation and verification procedures. The Credit, Billing and Risk Management of the Globe Group continuously reviews credit policies and processes and implements various credit actions, depending on assessed risks, to minimize credit exposure. Receivable balances of postpaid subscribers are being monitored on a regular basis and appropriate credit treatments are applied at various stages of delinquency. Likewise, net receivable balances from carriers of traffic are also being monitored and subjected to appropriate actions to manage credit risk.
The Globe Group analyzes its subscribers’ receivables and contract assets based on internal credit risk rating. The table below shows the analysis of the Globe Group’s subscribers’ receivables and contract assets as of December 31, 2019 and 2018.
High
Quality
Medium
Quality
Low
Quality
Terminated
Accounts Total
(In Thousand Pesos)
2019
Wireless subscribers receivables:
Consumer 4,308,644 1,337,781 771,013 2,255,493 8,672,931
Key corporate accounts 418,062 80,521 54,425 1,162,158 1,715,166
Other corporations and SMEs 495,137 73,159 3,143 151,044 722,483
5,221,843 1,491,461 828,581 3,568,695 11,110,580
Wireline subscribers receivables:
Consumer 687,389 539,126 287,567 2,359,190 3,873,272
Key corporate accounts 3,919,246 849,667 518,313 2,185,751 7,472,977
Other corporations and SMEs 150,774 164,219 48,307 734,738 1,098,038
4,757,409 1,553,012 854,187 5,279,679 12,444,287
Total subscribers' receivables 9,979,252 3,044,473 1,682,768 8,848,374 23,554,867
Wireless contract assets
Consumer 4,907,241 1,342,050 273,103 97,684 6,620,078
Key corporate accounts 460,551 75,944 2,926 13,958 553,379
Other corporations and SMEs 697,806 58,551 18,069 13,389 787,815
6,065,598 1,476,545 294,098 125,031 7,961,272
Total subscribers' receivables and contracts assets 16,044,850 4,521,018 1,976,866 8,973,405 31,516,139
O Globe

�����������������03/��
&�5�(�$�7�(���:�2�1�'�(�5�)�8�/� ����
High
Quality
Medium
Quality
Low
Quality
Terminated
Accounts Total
(In Thousand Pesos)
2018
Wireless subscribers receivables:
Consumer 3,867,223 1,318,821 863,317 5,708,844 11,758,205
Key corporate accounts 398,964 145,801 13,828 457,431 1,016,024
Other corporations and SMEs 1,592,325 262,086 258,407 1,200,103 3,312,921
5,858,512 1,726,708 1,135,552 7,366,378 16,087,150
Wireline subscribers receivables: Consumer 114,172 147,503 76,908 2,359,190 3,873,272
Key corporate accounts 3,847,729 608,622 321,906 1,866,643 6,644,900
Other corporations and SMEs 107,829 130,825 78,924 734,738 1,098,038
4,069,730 886,950 477,738 5,279,679 12,444,287
Total subscribers' receivables 9,928,242 2,613,658 1,613,290 8,848,374 23,554,867
Wireless contract assets
Consumer 4,323,538 2,015,704 239,176 686,339 7,264,757
Key corporate accounts 669,418 137,343 15,574 16,542 838,877
Other corporations and SMEs 374,298 141,618 4,416 48,155 568,487
5,367,254 2,294,665 259,166 751,036 8,672,121
Total subscribers' receivables and contracts assets 15,295,496 4,908,323 1,872,456 8,973,405 31,516,139
The Globe Group’s credit risk rating comprises the following categories:
x High quality accounts are accounts considered to be of good quality, have consistently exhibitedgood paying habits, and are unlikely to miss payments. High quality accounts primarilyinclude strong corporate and consumer accounts with whom the Globe Group has excellentpayment experience.
x Medium quality accounts are accounts that exhibited good paying habits but may require minimalmonitoring with the objective of moving accounts to high quality rating. Medium quality accountsprimarily include subscribers whose creditworthiness can be moderately affected by adversechanges in economic and financial conditions, but will not necessarily, reduce the ability of thesubscriber to fulfill its obligations. It includes customers with whom the Globe Group has limitedexperience and therefore, creditworthiness needs to be further established over time.
x Low quality accounts are accounts which exhibit characteristics that are identified to haveincreased likelihood to miss payments. Low quality accounts are subject to closer monitoring andscrutiny with the objective of managing risk and moving accounts to improved rating category. Itprimarily includes mass consumer, corporate and SME customers whose creditworthiness areeasily affected by adverse changes in economic and financial conditions.
x Terminated accounts are accounts in cancelled status. Although there is a possibility thatterminated accounts may still be collected by exhausting collection efforts, the probability ofrecovery has significantly deteriorated.
O Globe

�����������������03/��
&�5�(�$�7�(���:�2�1�'�(�5�)�8�/��� ����
For traffic settlements and other trade receivables, the Globe Group uses delinquency and past due information to analyze the credit risk. The tables below show the aging analysis of the Globe Group’s traffic settlements and other trade receivables as of December 31, 2019 and 2018.
2019
Current
Less than 30 days
past due
31 to 60 days past
due
61 to 90 days past
due
Over 90 days
past due Total
(In Thousand Pesos)
Traffic receivables: Foreign 765,314 - 193,377 166,732 502,133 1,627,556 Local 50,017 7,622 5,675 5,389 208,723 277,426
815,331 7,622 199,052 172,121 710,856 1,904,982 Other trade receivables 3,379,480 530,089 311,039 121,312 754,662 5,096,582
Total 4,194,811 537,711 510,091 293,433 1,465,518 7,001,564
2018
Current
Less than 30 days
past due
31 to 60 days past
due
61 to 90 days past
due
Over 90 days
past due Total
(In Thousand Pesos)
Traffic receivables: Foreign 1,141,976 28 206,240 320,262 764,916 2,433,422 Local 171,717 29,229 19,026 3,137 211,865 434,974
1,313,693 29,257 225,266 323,399 976,781 2,868,396 Other trade receivables 1,284,369 187,629 197,197 92,384 747,160 2,508,739
Total 2,598,062 216,886 422,463 415,783 1,723,941 5,377,135
With respect to receivables from related parties, the exposure to credit risk is managed on a group basis.
For investments with banks and other counterparties, the Globe Group has a risk management policy which allocates investment limits based on counterparty credit rating and credit risk profile. The Globe Group makes a quarterly assessment of the credit standing of its investment counterparties, and allocates investment limits based on size, liquidity, profitability, and asset quality. The usage of limits is regularly monitored.
For its derivative counterparties, the Globe Group deals only with counterparty banks with investment grade ratings and large local banks. Credit ratings of derivative counterparties are reviewed quarterly.
Following are the Globe Group exposures with its investment counterparties for time deposits as of December 31:
2019 2018 2017
Local bank deposits 100% 59% 43% Onshore foreign bank - 31% 47% Offshore bank deposit - 10% 10%
O Globe

�/30������������������
&�5�(�$�7�(���:�2�1�'�(�5�)�8�/� ����
32.2.3 Liquidity Risk
The Globe Group seeks to manage its liquidity profile to be able to finance capital expenditures and service maturing debts. To cover its financing requirements, the Globe Group intends to use internally generated funds and available long-term and short-term credit facilities.
The following table shows the Globe Group’s available credit facilities (in millions):
2019 2018
Long-term committed - - Short term
Committed 3,000 3,000 Uncommitted
USD $93.9 $119 PHP 16,350 14,000
As part of its liquidity risk management, the Globe Group regularly evaluates its projected and actual cash flows. It also continuously assesses conditions in the financial markets for opportunities to pursue fund raising activities, in case any requirements arise. Fund raising activities may include bank loans, export credit agency facilities, and capital market issues.
The following tables show comparative information about the Globe Group’s financial instruments as of December 31 that are exposed to liquidity risk and interest rate risk and presented by maturity profile including forecasted interest payments for the next five years from December 31 figures.
Loans Payable
2019
Less than 1 year 1 to 3 years Over 3 years (In Thousands)
Loans Payable Fixed Rate USD notes $454 $1,266 $- Philippine peso 6,157,500 26,005,000 63,187,500 Floating rate USD notes $129,150 $150,250 $157,250 Philippine peso 210,000 6,860,000 11,720,000 Interest payable* PHP debt 6,014,003 15,105,917 13,598,501
USD debt $11,147 $21,454 $8,900 *Used month-end USD LIBOR and Philippine Dealing and Exchange Corporation (PDEX) rates.
O Globe

�����������������03/��
&�5�(�$�7�(���:�2�1�'�(�5�)�8�/� ����
2018
Less than 1 year 1 to 3 years Over 3 years Loans Payable (In Thousands) Fixed Rate USD notes $410 $1,493 $227 Philippine peso 11,110,000 22,922,500 72,427,500 Floating rate USD notes $11,150 $235,850 $200,800 Philippine peso 5,040,000 630,000 13,160,000 Interest payable* PHP debt 6,523,381 16,834,502 18,179,506
USD debt $16,484 $34,623.00 $18,914 *Used month-end USD LIBOR and Philippine Dealing and Exchange Corporation (PDEX) rates.
The following tables present the maturity profile of the Globe Group’s other liabilities and derivative instruments (undiscounted cash flows including swap costs payments/receipts except for other long-term liabilities) as of December 31, 2019 and 2018.
2019
Other Financial Liabilities
Less than 1 year 1 to 5 years Over 5 years Total
Trade payables and accrued expenses* 52,663,918 - - 52,663,918
Other long-term liabilities - - 962,079 962,079
52,663,918 - 962,079 53,625,997 *Excludes taxes payable which is not a financial instrument.
Derivative Instrument
Less than 1 year 1 to 3 years Over 3 years
Receive Pay Receive Pay Receive Pay
Projected Swap Coupons:
Interest Rate Swaps-USD 63,489 67,811 46,945 ������ - -
Cross Currency Swaps 355,228 657,151 719,408 1,585,458 446,786 805,836
Principal Only Swaps 583,719 76,245 1,167,439 80,912 -� -�
Less than 1 year 1 to 3 years Over 3 years
Receive Pay Receive Pay Receive Pay
Projected Principal Exchanges:
FX Swap, Buys USD Forward $112,000 5,766,580� ��� �� $- -�Cross Currency Swaps- PHP - 4,589,271 � 2,666,662 - 8,050,948
Cross Currency Swaps- USD $90,550 $- $50,650 �- $157,250 $-
Principal Only Swaps- PHP -� 1,795,721� �� 2,986,508� -� -�Principal Only Swaps- USD �37,700 �� �60,000 �� $-� $-�
O Globe

�����������������03/��
&�5�(�$�7�(���:�2�1�'�(�5�)�8�/� ����
2018
Other Financial Liabilities
Less than 1 year 1 to 5 years Over 5 years Total
Trade payables and accrued expenses* 51,540,513 - - 51,540,513 Other long-term liabilities - - 865,354 865,354
51,540,513 - 865,354 52,405,867 *Excludes taxes payable which is not a financial instrument.
Derivative Instrument
Less than 1 year 1 to 3 years Over 3 years
Receive Pay Receive Pay Receive Pay
Projected Swap Coupons:
Interest Rate Swaps-USD 89,644 54,151 79,146 59,574 - -
Cross Currency Swaps 583,720 808,957 1,103,598 1,742,079 953,765 1,324,365
Principal Only Swaps - 73,732 - 93,982 -� -�
Less than 1 year 1 to 3 years Over 3 years
Receive Pay Receive Pay Receive Pay
Projected Principal Exchanges:
FX Swap, Buys USD Forward $80,000 4,283,050� ��� �� $- -�Cross Currency Swaps- PHP - 79,221 � 4,957,711 - 10,349,168
Cross Currency Swaps- USD $1,550 $- $97,650 �- $200,800 $-
Principal Only Swaps- PHP -� 410,241� �� 3,742,229� -� -�Principal Only Swaps- USD �8,700 �� �77,700 �� $-� $-�
O Globe

�/30������������������
&�5�(�$�7�(���:�2�1�'�(�5�)�8�/��� ����
33� Financial Assets and Liabilities
33.1 Categories of Financial Assets and Financial Liabilities
The table below presents the carrying value of Globe Group’s financial instruments by category as of December 31 based on the classification requirements of PFRS 9:
2019 2018
(In Thousand Pesos) Financial Assets Derivative assets:
Derivative assets designated as cash flow hedges (FVOCI) 425,696 2,363,366 Derivative assets not designated as hedges (FVPL) 1,259 -
Financial assets at FVOCI: Investment in equity securities - net 2,137,781 1,442,940
Financial assets at amortized cost Cash and cash equivalents 8,298,092 23,226,386 Trade receivables – net 21,138,950 20,652,532 Contract assets – net 7,045,794 7,124,331 Non-trade receivables 1,635,747 1,458,503 Loans receivable from related parties 656,620 726,620
41,339,939 56,994,678
Financial Liabilities: Derivative liabilities
Derivative liabilities designated as cash flow hedges (FVOCI) 767,358 235,993 Derivative liabilities not designated as hedges (FVPL) 70,958 75,661�
Financial liabilities at amortized cost Trade payables and accrued expenses* 52,663,918 51,540,513 Loans payable 135,862,735 148,281,897 Other long term liabilities** 962,079 1,383,807
190,327,048 201,517,871
*Trade payables and accrued expenses do not include taxes payables which are not considered financial liabilities. **Other long term liabilities do not include ARO and accrued pension which are not considered financial liabilities.
33.2 Offsetting Financial Assets and Financial Liabilities
The Globe Group has derivative financial instruments that have offsetting arrangements as follows:
Gross amounts
Amounts offset under
PAS 32
Reported amounts in
the consolidated statements of
financial position
Amounts offset under master netting
arrangements or other similar contracts Net exposure
(In Thousand Pesos)
December 31, 2019 Derivative assets 426,955 - 426,955 (168,291) 258,664 Derivative liabilities 838,316 - 838,316 (168,291) 670,025 Traffic settlements
receivable (Note 6) 2,948,547 (1,043,565) 1,904,982 - 1,904,982Traffic settlements
payable (Note 14) 2,036,595 (1,043,565) 993,030 - 993,030
December 31, 2018 Derivative assets 2,363,366 - 2,363,366 (204,606) 2,158,760 Derivative liabilities 311,654 - 311,654 (204,606) 107,048 Traffic settlements
receivable (Note 6) 3,661,635 (793,239) 2,868,396 - 2,868,396Traffic settlements
payable (Note 14) 1,895,650 (793,239) 1,102,411 - 1,102,411
O Globe

�����������������03/��
&�5�(�$�7�(���:�2�1�'�(�5�)�8�/� ����
The Globe Group makes use of master netting agreements with counterparties with whom a significant volume of transactions are undertaken. Such arrangements provide for single net settlement of all financial instruments covered by the agreements in the event of default on any one contract. Master netting arrangements do not normally result in an offset of balance sheet assets and liabilities unless certain conditions for offsetting under PAS 32 apply.
Although master netting arrangements may significantly reduce credit risk, it should be noted that:
x Credit risk is eliminated only to the extent that amounts due to the same counterparty will besettled after the assets are realized; and
x The extent to which overall credit risk is reduced may change substantially within a short periodbecause the exposure is affected by each transaction subject to the arrangement and fluctuationsin market factors.
33.3 Fair Values of Financial Assets and Financial Liabilities
The table below presents a comparison of carrying amounts and estimated fair values of all the Globe Group’s financial instruments as of December 31:
2019 2018
Carrying Value
Fair Value
Carrying Value
Fair Value
(In Thousand Pesos) Financial Assets Derivative assets1 426,955 426,955 2,363,366 2,363,366 Investment in equity securities1 2,137,781 2,137,781 1,442,940 1,442,940
2,564,736 2,564,736 3,806,306 3,806,306
Financial Liabilities Derivative liabilities1 838,316 838,316 311,654 311,654 Loans payables 2 135,862,735 145,473,115 148,281,897 137,834,270
136,701,051 146,311,431 148,593,551 138,145,924 1 Measured at fair value on a recurring basis 2 Fair value is disclosed only in the Notes to Financial Statements
The following discussions are methods and assumptions used to estimate the fair value of each class of financial instrument for which it is practicable to estimate such value.
33.3.1 Non-Derivative Financial Instrument
The fair value of loans receivable from related parties was estimated based on the present value of all future cash flows discounted using the prevailing market rate of interest for a similar instrument. The resulting fair value of loans receivable from related parties approximates the carrying amount.
The fair value of investments in equity securities are based on quoted prices of similar instruments.
For variable rate financial instruments that reprice every three months, the carrying value approximates the fair value because of recent and regular repricing based on current market rates.
For variable rate financial instruments that reprice every six months, the fair value is determined by discounting the principal amount plus the next interest payment using the prevailing market rate for the period up to the next repricing date. The discount rate used is 1.9302% for USD floating loans.
For noninterest bearing obligations, the fair value was estimated as the present value of all future cash flows discounted using the prevailing market rate of interest for a similar instrument.
e Globe

�����������������03/��
&�5�(�$�7�(���:�2�1�'�(�5�)�8�/��� ����
33.3.2 Derivative Instrument
The fair value of freestanding and embedded forward exchange contracts is calculated by using the interest rate parity concept.
The fair values of interest rate swaps and cross currency swap transactions are determined using valuation techniques with inputs and assumptions that are based on market observable data and conditions and reflect appropriate risk adjustments that market participants would make for credit and liquidity risks existing at the end each of reporting period. The fair value of interest rate swap transactions is the net present value of the estimated future cash flows. The fair values of currency and cross currency swap transactions are determined based on changes in the term structure of interest rates of each currency and the spot rate.
The fair values were tested to determine the impact of credit valuation adjustments. However, the impact is immaterial given that the Globe Group deals its derivatives with large foreign and local banks with very minimal risk of default.
33.3.3 Fair Value Hierarchy
The following tables provide the fair value measurement hierarchy of the Globe Group’s assets and liabilities:
Fair value measurement using
Level 1) Level 2 Level 3 Total
2019
Financial Assets (In Thousand Pesos) Derivative assets:
Cross currency swaps - 205,290 - 205,290 Principal only swaps - 217,622 - 217,622Interest rate swaps - 2,784 - 2,784 Deliverable forwards - 1,259 1,259 Investment in equity securities 402,200 1,735,581 - 2,137,781
Financial Liabilities Derivative liabilities:
Cross currency swaps - 679,628 - 679,628Principal only swaps - 53,016 - 53,016Interest rate swaps - 34,714 - 34,714Non deliverable forwards - 57,685 - 57,685Deliverable forwards - 13,273 - 13,273
Loans payable - 145,473,115 - 145,473,115
O Globe

�����������������03/��
&�5�(�$�7�(���:�2�1�'�(�5�)�8�/��� ����
Fair value measurement using
Level 11) Level 2 Level 3 Total
2018
Financial Assets (In Thousand Pesos) Derivative assets:
Cross currency swaps - 1,787,777 - 1,787,777 Principal only swaps - 528,297 - 528,297Interest rate swaps - 47,292 - 47,292Investment in equity securities 357,200 1,085,740 - 1,442,940
Financial Liabilities Derivative liabilities:
Cross currency swaps - 203,983 - 203,983Principal only swaps - 32,010 - 32,010Deliverable forwards - 75,661 - 75,661
Loans payable - 137,834,270 - 137,834,270
There were no transfers from Level 1 and Level 2 fair value measurements for the years ended December 31, 2019 and 2018. The Globe Group has no financial instruments classified under Level 3.
34� Operating Segment Information
The Globe Group’s reportable segments consist of: (1) mobile communications services; and (2) wireline communication services; which the Globe Group operates and manages as strategicbusiness units and organize by products and services. The Globe Group presents its various operatingsegments based on segment net income.
Intersegment transfers or transactions are entered into under the normal commercial terms and conditions that would also be available to unrelated third parties. Segment revenue, segment expense and segment result include transfers between business segments. Those transfers are eliminated in consolidation.
Most of the Globe Group’s revenues are derived from operations within the Philippines, hence, the Globe Group does not present geographical information required by PFRS 8, Operating Segments. The Globe Group does not have a single customer that will meet the 10% reporting criteria.
The Globe Group also presents the different product types that are included in the report that is regularly reviewed by the chief operating decision maker in assessing the operating segments performance.
Segment assets and liabilities are not measures used by the chief operating decision maker since the assets and liabilities are managed on a group basis.
O Globe

�����������������03/��
&�5�(�$�7�(���:�2�1�'�(�5�)�8�/��� ����
The Globe Group’s segment information is as follows (in thousand pesos):
2019
Mobile
Communications
Services
Wireline
Communications
Services Consolidated
(In Thousand Pesos)
REVENUES:
Service revenues:
External customers:
Data 71,801,472 12,827,652 84,629,124
Voice 24,275,585 2,668,413 26,943,998
SMS 15,690,309 - 15,690,309
Broadband - 21,746,532 21,746,532
111,767,366 37,242,597 149,009,963
Nonservice revenues:
External customers 17,256,871 393,503 17,650,374
Segment revenues 129,024,237 37,636,100 166,660,337
EBITDA 63,935,268 12,096,165 76,031,433
Depreciation and amortization (21,554,284) (12,589,257) (34,143,541)
EBIT 42,380,984 (493,092) 41,887,892
NET INCOME (LOSS) BEFORE TAX2 33,255,371 (427,995) 32,827,376
Provision for income tax (7,774,908) (2,768,711) (10,543,619)
NET INCOME (LOSS) 25,480,463 (3,196,706) 22,283,757
Core net income after tax 22,450,847
Intersegment revenues (4,359,314) �1,541,929) (5,901,243)
Interest income 261,238 239,199 500,437
Financing costs (6,702,880) (99,981) (6,802,861)
Equity in net losses of associates and joint ventures (2,554,782) - (2,554,782)
Impairment losses and others 3,111,133 1,802,004 4,913,137
Total additions to property and equipment and
intangible assets 36,603,944 9,195,494 45,799,438
Cost of inventories sold (18,122,606) (432,208) (18,554,814) Operating expenses (43,109,543) (24,981,725) (68,091,268)
Cash Flows
Net cash from (used in):
Operating activities 64,828,975 9,213,244 74,042,219 Investing activities (46,034,742) (8,996,037) (55,030,779) Financing activities (28,273,799) (4,983,554) (33,257,353)
O Globe

�����������������03/��
&�5�(�$�7�(���:�2�1�'�(�5�)�8�/��� ����
2018
Mobile
Communications
Services
Wireline
Communications
Services Consolidated
(In Thousand Pesos)
REVENUES:
Service revenues:
External customers:
Data 50,960,555 11,761,929 62,581,757
Voice 28,407,830 2,977,017 31,496,677
SMS 20,162,343 - 20,191,240
Broadband - 18,605,636 18,605,636
99,530,728 33,344,582 132,875,310
Nonservice revenues:
External customers 17,905,545 391,951 18,297,496
Segment revenues 117,436,273 33,736,533 151,172,806
EBITDA 54,813,431 10,313,684 65,127,115
Depreciation and amortization (18,515,035) (11,906,686) (30,421,721)
EBIT 36,298,396 (1,593,002) 34,705,394
NET INCOME (LOSS) BEFORE TAX 28,329,140 (715,824) 27,613,316
Provision for income tax (6,105,079) (2,882,294) (8,987,373)
NET INCOME (LOSS) 22,224,061 (3,598,118) 18,625,943
Core net income after tax 18,734,587
Intersegment revenues (4,101,948) (1,697,538) (5,799,486)
Interest income 265,706 125,324 391,030
Financing cost (6,178,927) (16,298) (6,195,225)
Equity in net losses of associates and joint ventures (1,249,603) - (1,249,603)
Impairment losses and others 3,126,709 1,660,935 4,787,644
Total additions to property and equipment and
intangible assets 26,601,407 9,713,380 36,314,787
Cost of inventories sold (18,142,817) (502,497) (18,645,314)
Operating expenses (44,480,026) (22,920,353) (67,400,379)
Cash Flows
Net cash from (used in):
Operating activities 41,727,279 16,123,250 57,850,529 Investing activities (33,616,425) (9,035,328) (42,651,753) Financing activities 752,364 (4,187,410) (3,435,046)
O Globe

�����������������03/��
&�5�(�$�7�(���:�2�1�'�(�5�)�8�/��� ����
2017
Mobile Communications
Services
Wireline Communications
Services Consolidated
(In Thousand Pesos)
REVENUES: Service revenues:
External customers: Data 43,058,894 10,287,868 53,346,762 Voice 32,274,474 3,490,350 35,764,824 SMS 23,149,293 - 23,149,293Broadband - 15,644,974 15,644,974
98,482,661 29,423,192 127,905,853 Nonservice revenues:
External customers 7,103,490 271,388 7,374,878
Segment revenues 105,586,151 29,694,580 135,280,731
EBITDA 46,412,954 6,912,717 53,325,671 Depreciation and amortization (14,719,797) (12,792,892) (27,512,689)
EBIT 31,693,157 (5,880,175) 25,812,982 NET INCOME (LOSS) BEFORE TAX 27,495,220 (5,953,518) 21,541,702 Provision for income tax (4,965,817) (1,491,672) (6,457,489)
NET INCOME (LOSS) 22,529,403 (7,445,190) 15,084,213
Core net income after tax 13,546,018
Intersegment revenues (3,796,463) (1,678,432) (5,474,895) Interest income 112,222 27,359 139,581 Financing cost (5,234,518) (17,174) (5,251,992) Equity in net losses of associates and joint ventures (846,177) - (846,177)Impairment losses and others (5,326,363) (97,003) (5,423,366)
Total additions to property and equipment and intangible assets 39,553,734 11,878,600 51,432,334
Cost of inventories sold (12,625,881) (387,556) (13,013,437) Operating expenses (46,567,834) (22,373,725) (68,941,559)
Cash Flows Net cash from (used in):
Operating activities 34,396,520 15,907,742 50,304,262 Investing activities (55,344,717) (77,298) (55,422,015) Financing activities 7,814,350 - 7,814,350
e Globe

�/30������������������
&�5�(�$�7�(���:�2�1�'�(�5�)�8�/��� ����
The reconciliation of the EBITDA to income before income tax presented in the consolidated statements of comprehensive income is shown below:
Notes 2019 2018 2017
(In Thousand Pesos) EBITDA 76,031,433 65,127,115 53,325,671 Depreciation and amortization 26 (34,143,541) (30,421,721) (27,512,689) Financing costs 27 (6,802,861) (6,195,225) (5,251,692) Equity in net losses of associates and joint ventures 15 (2,554,782) (1,249,603) (846,177) Foreign exchange gain (loss) - net 24 848,394 (900,430) 214,191 Gain (loss) on derivative instruments 24 (809,540) 1,004,171 (127,708) Interest income 23 500,437 391,030 139,581 Remeasurement loss on investment in associate 28 (470,653) - - Gain on sale of Investment in associate 24 240,000 - - Gain on disposal of property and equipment - net 43,012 73,088 38,455 Impairment of goodwill 28 - (140,403) - Gain on fair value of retained interest - - 1,889,901 Other items (54,523) (74,706) (327,831)
Income before income tax 32,827,376 27,613,316 21,541,702
The reconciliation of core net income after tax (core NIAT) to NIAT is shown below:
2019 2018 2017
(In Thousand Pesos)
Core NIAT 22,450,847 18,734,587 13,546,018 Gain (loss) on derivatives instruments (566,678) 702,919 (89,396) Foreign exchange gains (losses) 593,876 (630,301) 149,934 Remeasurement loss on investment in associate (432,975) - - Gain on sale of Investment in associate 240,000 - - Impairment of goodwill - (140,403) - Gain on fair value of retained interest - - 1,794,237 Others (1,313) (40,859) (316,580)
NIAT 22,283,757 18,625,943 15,084,213
34.1 Mobile Communications Services
This reporting segment is made up of digital cellular telecommunications services that allow subscribers to make and receive local, domestic long distance and international long distance calls, international roaming calls and other value added services (VAS) in any place within the coverage areas.
O Globe

�����������������03/��
&�5�(�$�7�(���:�2�1�'�(�5�)�8�/��� ����
34.1.1 Mobile communication voice net service revenues include the following:
� Pro-rated monthly service fees on postpaid plans;
� Charges for intra-network and outbound calls in excess of the consumable minutes for variousGlobe Postpaid plans, including currency exchange rate adjustments (CERA) net of loyaltydiscounts credited to subscriber billings;
� Airtime fees for intra-network and outbound calls recognized upon the earlier of actual usageof the airtime value or expiration of the unused value of the prepaid reload denomination (forGlobe Prepaid and TM) which occurs 365 days after activation of prepaid load credit net of(i) bonus credits and (ii) prepaid reload discounts;
� Revenues generated from inbound international and national long distance calls andinternational roaming calls; and
� Mobile service revenues of GTI.
34.1.2 Mobile SMS service revenues consist of local and international revenues from VAS such as inbound and outbound SMS and MMS, and infotext, subscription fees on unlimited and bucket prepaid SMS services, net of any payouts to content providers.
34.1.3 Mobile communication data net service revenues consist of local and international revenues from value-added services such as mobile internet browsing and content downloading, mobile commerce services, other add-on VAS net of payouts to content providers.
34.1.4 Globe Telecom offers its wireless communications services to consumers, corporate and small and medium enterprise (SME) clients through the following three (3) brands: Globe Postpaid, Globe Prepaid and Touch Mobile.
34.2 Wireline Communications Services
This reporting segment is made up of fixed line telecommunications services which offer subscribers local, domestic long distance and international long distance voice services in addition to broadband and a number of VAS in various areas covered by the Certificate of Public Convenience and Necessity (CPCN) granted by the NTC.
34.2.1 Wireline voice service revenues consist of the following:
� Monthly service fees including CERA of voice-only subscriptions;
� Revenues from local, international and national long distance calls made by postpaid andprepaid wireline subscribers, as well as broadband customers who have subscribed to datapackages bundled with a voice service. Revenues are net of prepaid call card discounts;
� Revenues from inbound local, international and national long distance calls from other carriersterminating on Globe Telecom’s network;
� Revenues from additional landline features such as caller ID, call waiting, call forwarding, multi -calling, voice mail, duplex and hotline numbers and other value-added features;
� Installation charges and other one-time fees associated with the establishment of the service;and
� Revenues from DUO and SUPERDUO (fixed line portion) service consisting of monthly servicefees for postpaid and subscription fees for prepaid.
O Globe

�����������������03/��
&�5�(�$�7�(���:�2�1�'�(�5�)�8�/��� ����
34.2.2 Wireline data service revenues consist of the following:
� Monthly service fees from international and domestic leased lines;
� Other wholesale transport services;
� Revenues from value-added services; and
� One-time connection charges associated with the establishment of service.
34.2.3 Broadband service revenues consist of the following:
� Monthly service fees of wired, fixed wireless and bundled voice and data subscriptions;
� Browsing revenues from all postpaid and prepaid wired, fixed wireless in excess of allocatedfree browsing minutes and expiration of unused value of prepaid load credits;
� Value-added services such as games; and
� Installation charges and other one-time fees associated with the service.
34.2.4 The Globe Group provides wireline voice communications (local, national and international long distance), data and broadband and data services to consumers, corporate and SME clients in the Philippines.
x Consumers - the Globe Group’s postpaid voice service provides basic landline services includingtoll-free NDD calls to other Globe landline subscribers for a fixed monthly fee. For wiredbroadband, consumers can choose between broadband services bundled with a voice line, or abroadband data-only service. The Globe Group offers broadband packages bundled with voice,or broadband data-only service. For subscribers who require full mobility, Globe Broadbandservice come in postpaid and prepaid packages and allow them to access the internet via LTE, 3Gwith HSDPA, Enhanced Datarate for GSM Evolution (EDGE), General Packet Radio Service (GPRS)or WiFi at hotspots located nationwide.
x Corporate/SME clients - for corporate and SME enterprise clients wireline voice communicationneeds, the Globe Group offers postpaid service bundles which come with a business landline andunlimited dial-up internet access. The Globe Group also provides a full suite of telephonyservices from basic direct lines to Integrated Services Digital Network (ISDN) services, 1-800numbers, International Direct Dialing (IDD) and National Direct Dialing (NDD) access as well asmanaged voice solutions such as Voice Over Internet Protocol (VOIP) and managed InternetProtocol (IP) communications. Value-priced, high speed data services, wholesale and corporateinternet access, data center services and segment-specific solutions customized to the needs ofvertical industries.
O Globe

�����������������03/��
&�5�(�$�7�(���:�2�1�'�(�5�)�8�/��� ����
35� Agreements and Commitments
35.1 Agreements and Commitments with Other Carriers
Globe Telecom, Innove and BTI have existing international telecommunications service agreements with various foreign administrations and interconnection agreements with local telecommunications companies for their various services. Globe Telecom also has international roaming agreements with other foreign operators, which allow its subscribers access to foreign networks. The agreements provide for sharing of toll revenues derived from the mutual use of telecommunication networks.
The interconnect costs for the period 2019, 2018 and 2017 amounted to 3.982.87 million, 5,677.38 million and 7,852.34 million, respectively.
Net traffic settlement receivables amounted to 1,904.98 million and 2,868.40 million while net traffic settlement payables amounted to 993.03 million and 1,102.41 million as of December 31, 2019 and 2018, respectively (see Notes 6 and 17).
35.2 Arrangements and Commitments with Suppliers
The Globe Group has entered into agreements with various suppliers for the development or construction, delivery and installation of property and equipment. Under the terms of these agreements, advance payments and down payments are made to suppliers upon submission of required documentation. While the development or construction is in progress, project costs are accrued based on the project status. Billings are based on the progress of the development or construction and advance payments are being applied proportionately to the milestone billings. When development or construction and installation are completed and the property and equipment is ready for service, the value of unbilled but delivered goods or services from the related purchase orders is accrued.
The accrued project costs as of December 31, 2019 and 2018 included in the “Trade payables and accrued expenses” account in the consolidated statements of financial position amounted to 12,558.73 million and 19,172.96 million , respectively (see Note 17). The settlement of these liabilities is dependent on the payment terms and project milestones agreed with the suppliers and contractors. As of December 31, 2019 and 2018, the unapplied advances made to suppliers and contractors relating to purchase orders issued amounted to 10,449.60 million and 9,459.24 million, respectively (see Note 10).
35.3 Network Sharing Arrangement with ABS-CBN Convergence Inc.
On May 27, 2013, Globe Telecom, Innove and ABS-CBN Convergence Inc. (ABS-C) entered into a network sharing arrangement to provide capacity and coverage for new mobile telephony, data and value-added services to be offered by ABS-C nationwide to its subscribers using shared network and interconnect assets of the parties.
This arrangement will enable Globe Telecom, Innove and ABS-C to improve public service by enhancing utility, capacity, inter-operability and quality of mobile and local exchange telephone and data services to the public and allow ABS-C to modernize its existing service and expand to a retail base on top of its existing subscriber base.
On May 31, 2013, NTC approved the network sharing agreement and co-use of the number blocks assigned to Globe Telecom.
On November 30, 2018, ABS-C discontinued its mobile phone services business and terminated the mobile network sharing arrangement with Globe Telecom.
i:S) Globe

�����������������03/��
&�5�(�$�7�(���:�2�1�'�(�5�)�8�/��� ����
35.4 Agreements with Huawei International, Pte. Ltd., Huawei Technology Co. Ltd and Huawei Technology Phils.
In 2014, Globe Telecom and Innove engaged Huawei for a period of ten (10) years to perform the design, engineering, manufacture, assembly and delivery of certain equipment and all its ancillary equipment and related software and documentation, and to provide services, including subsequent training and technical support, in an end-to-end full-turn key outcome based technical solution. Globe Telecom’s payments to Huawei as of December 31, 2019 totaled 37,646.36 million for the services and 1,214.57 million and USD1,311.68 million for the equipment.
35.5 Agreements with Premium Content Providers
The Globe Group has entered into various content and license distribution agreements with various developers for periods ranging from 2 to 5 years. Under the agreements, the developers granted the Globe Group the right to market, reproduce and distribute the premium content in the form of portable music streaming, videos, movies or other forms of content to its subscribers. The agreement also provides for the Globe Group to provide advertising and/or promotions support at certain agreed amounts.
In consideration of the agreements, Globe agreed to pay royalty or service fees based on its net revenues or active subscribers.
36� Contingencies
The Globe Group is contingently liable for various claims arising in the ordinary conduct of business and certain tax assessments which are either pending decision by the courts or are being contested, the outcome of which are not presently determinable. In the opinion of management and legal counsel, the possibility of outflow of economic resources to settle the contingent liability is remote.
Interconnection Charge for Short Messaging Service
On October 10, 2011, the NTC issued Memorandum Circular (MC) No. 02-10-2011 titled Interconnection Charge for Short Messaging Service requiring all public telecommunication entities to reduce their interconnection charge to each other from 0.35 to 0.15 per text, which Globe Telecom complied as early as November 2011. On December 11, 2011, the NTC One Stop Public Assistance Center (OSPAC) filed a complaint against Globe Telecom, Smart and Digitel alleging violation of the said MC No. 02-10-2011 and asking for the reduction of SMS off-net retail price from P1.00 to P0.80 per text. Globe Telecom filed its response maintaining the position that the reduction of the SMS interconnection charges does not automatically translate to a reduction in the SMS retail charge per text.
On November 20, 2012, the NTC rendered a decision directing Globe Telecom to:
� Reduce its regular SMS retail rate from P1.00 to not more than 0.80;� Refund/reimburse its subscribers the excess charge of 0.20; and� Pay a fine of 200.00 per day from December 1, 2011 until date of compliance.
On May 7, 2014, NTC denied the Motion for Reconsideration (MR) filed by Globe Telecom last December 5, 2012 in relation to the November 20, 2012 decision. Globe Telecom’s assessment is that Globe Telecom is in compliance with the NTC Memorandum Circular No. 02-10-2011. On June 9, 2014, Globe Telecom filed petition for review of the NTC decision and resolution with the Court of Appeals (CA).
The CA granted the petition in a resolution dated September 3, 2014 by issuing a 60-day temporary restraining order on the implementation of Memorandum Circular 02-10-2011 by the NTC. On October 15, 2014, Globe Telecom posted a surety bond to compensate for possible damages as directed by the CA.
i:t) Globe

�����������������03/��
&�5�(�$�7�(���:�2�1�'�(�5�)�8�/��� ����
On June 27, 2016, the CA rendered a decision reversing the NTC’s abovementioned decision and resolution requiring telecommunications companies to cut their SMS rates and return the excess amount paid by subscribers. The CA said that the NTC order was baseless as there is no showing that the reduction in the SMS rate is mandated under MC No. 02-10-2011; there is no showing, either that the present P1.00 per text rate is unreasonable and unjust, as this was not mandated under the memorandum. Moreover, under the NTC’s own MC No. 02-05-2008, SMS is a value added service (VAS) whose rates are deregulated. The respective motions for reconsideration filed by NTC and that of intervenor Bayan Muna Party List (Bayan Muna) Representatives Neri Javier Colmenares and Carlos Isagani Zarate were both denied.
The NTC thus elevated the CA’s ruling to the Supreme Court (SC) via a Petition for Review on Certiorari dated September 15, 2017.
For its part, Bayan Muna filed its own Petition for Review on Certiorari of the CA’s Decision. On January 4, 2018, Globe received a copy of the SC’s Resolution dated November 6, 2017, requiring it to comment on said petition of Bayan Muna. Subsequently, on February 21, 2018, Globe received a copy of the SC’s Resolution dated December 13, 2017 consolidating the Petitions for Review filed by Bayan Muna and NTC, and requiring Globe to file its comment on the petition for review filed by NTC. Thus, on April 2, 2018, Globe filed its Consolidated Comment on both Bayan Muna and the NTC’s petitions for review. On September 18, 2018, Globe received a copy of Bayan Muna’s Consolidated Reply to Globe’s Consolidated Comment and Digitel and Smart’s Comment.
Globe Telecom believes that it did not violate NTC MC No. 02-10-2011 when it did not reduce its SMS retail rate from Php 1.00 to Php 0.80 per text, and hence, would not be obligated to refund its subscribers. However, if it is ultimately decided by the Supreme Court (in case an appeal is taken thereto by the NTC from the adverse resolution of the CA) that Globe Telecom is not compliant with said circular, Globe may be contingently liable to refund to its subscribers the 0.20 difference (between 1.00 and 0.80 per text) reckoned from November 20, 2012 until said decision by the SC becomes final and executory. Management does not have an estimate of the potential claims currently.
Guidelines on Unit of Billing of Mobile Voice Service
On July 23, 2009, the NTC issued NTC MC No. 05-07-2009 (Guidelines on Unit of Billing of Mobile Voice Service). The MC provides that the maximum unit of billing for the Cellular Mobile Telephone System (CMTS) whether postpaid or prepaid shall be six (6) seconds per pulse. The rate for the first two (2) pulses, or equivalent if lower period per pulse is used, may be higher than the succeeding pulses to recover the cost of the call set-up. Subscribers may still opt to be billed on a one (1) minute per pulse basis or to subscribe to unlimited service offerings or any service offerings if they actively and knowingly enroll in the scheme.
On December 28, 2010, the Court of Appeals (CA) rendered its decision declaring null and void and reversing the decisions of the NTC in the rates applications cases for having been issued in violation of Globe Telecom and the other carriers’ constitutional and statutory right to due process. However, while the decision is in Globe Telecom’s favor, there is a provision in the decision that NTC did not violate the right of petitioners to due process when it declared via circular that the per pulse billing scheme shall be the default.
On January 21, 2011, Globe Telecom and two other telecom carriers, filed their respective Motions for Partial Reconsideration (MPR) on the pronouncement that “the Per Pulse Billing Scheme shall be the default”. The petitioners and the NTC filed their respective Motion for Reconsideration, which were all denied by the CA on January 19, 2012.
fb G1obe

�/30������������������
&�5�(�$�7�(���:�2�1�'�(�5�)�8�/��� ����
On March 12, 2012, Globe and Innove elevated to the SC the questioned portions of the Decision and Resolution of the CA dated December 28, 2010 and its Resolution dated January 19, 2012. The other service providers, as well as the NTC, filed their own petitions for review. The adverse parties have filed their comments on each other’s petitions, as well as their replies to each other’s comments. Parties were required to file their respective Memoranda and Globe filed its Memorandum on May 25, 2018. The case is now submitted for resolution.
Right of Innove to Render Services and Build Telecommunications Infrastructure in BGC
x PLDT and its affiliate, Bonifacio Communications Corporation (BCC) and Innove and Globe Telecomare in litigation over the right of Innove to render services and build telecommunications infrastructurein the Bonifacio Global City (BGC). In the case filed by Innove before the NTC against BCC, PLDT andthe Fort Bonifacio Development Corporation (FBDC), the NTC has issued a Cease and Desist Orderpreventing BCC from performing further acts to interfere with Innove’s installations in the BGC.
On January 21, 2011, BCC and PLDT filed with the CA a Petition for Certiorari and Prohibition againstthe NTC, et al. seeking to annul the Order of the NTC dated October 28, 2008 directing BCC, PLDT andFBDC to comply with the provisions of NTC MC 05-05-02 and to cease and desist from performingfurther acts that will prevent Innove from implementing and providing telecommunications services inthe Fort Bonifacio Global City pursuant to the authorization granted by the NTC. On April 25, 2011,Innove Communications, filed its comment on the Petition.
On August 16, 2011, the CA ruled that the petition against Innove and the NTC lacked merit, holdingthat neither BCC nor PLDT could claim the exclusive right to install telecommunications infrastructureand providing telecommunications services within the BGC. Thus, the CA denied the petition anddismissed the case. PLDT and BCC filed their motions for reconsideration thereto, which the CAdenied.
On July 6, 2012, PLDT and BCC assailed the CA’s rulings via a petition for review on certiorari with theSupreme Court. Innove and Globe filed their comment on said petition on January 14, 2013, to whichsaid petitioners filed their reply on May 21, 2013. The case remains pending with the SC.
� In a case filed by BCC against FBDC, Globe Telecom, and Innove before the RTC of Pasig, which casesought to enjoin Innove from making any further installations in the BGC and claimed damages fromall the parties for the breach of the exclusivity of BCC in the area, the court did not issue a TRO and hasinstead scheduled several hearings on the case. The defendants filed their respective motions todismiss the complaint on the grounds of forum shopping and lack of jurisdiction, among others. OnMarch 30, 2012, the RTC of Pasig, as prayed for, dismissed the complaint on the aforesaid grounds.The motion for reconsideration filed by BCC on July 20, 2012 remains pending with the trial court.
Acquisition by Globe Telecom and PLDT of the Entire Issued and Outstanding Shares of VTI
In a letter dated June 7, 2016 issued by Philippine Competition Commission (PCC) to Globe Telecom, PLDT, SMC and VTI regarding the Joint Notice filed by the aforementioned parties on May 30, 2016, disclosing the acquisition by Globe Telecom and PLDT of the entire issued and outstanding shares of VTI, the PCC claims that the Notice was deficient in form and substance and concludes that the acquisition cannot be claimed to be deemed approved.
fb G1obe

�����������������03/��
&�5�(�$�7�(���:�2�1�'�(�5�)�8�/��� ����
On June 10, 2016, Globe Telecom formally responded to the letter reiterating that the Notice, which sets forth the salient terms and conditions of the transaction, was filed pursuant to and in accordance with MC No. l6-002 issued by the PCC. MC No. 16-002 provides that before the implementing rules and regulations for RA No. 10667 (the Philippine Competition Act of 2015) come into full force and effect, upon filing with the PCC of a notice in which the salient terms and conditions of an acquisition are set forth, the transaction is deemed approved by the PCC and as such, it may no longer be challenged. Further, Globe Telecom clarified in its letter that the supposed deficiency in form and substance of the Notice is not a ground to prevent the transaction from being deemed approved. The only exception to the rule that a transaction is deemed approved is when a notice contains false material information. In this regard, Globe Telecom stated that the Notice does not contain any false information.
On June 17, 2016, Globe Telecom received a copy of the second letter issued by PCC stating that notwithstanding the position of Globe Telecom, it was ruling that the transaction was still subject for review.
On July 12, 2016, Globe Telecom asked the CA to stop the government's anti-trust body from reviewing the acquisition of SMC's telecommunications business. Globe Telecom maintains the position that the deal was approved after Globe Telecom notified the PCC of the transaction and that the anti-trust body violated its own rules by insisting on a review. On the same day, Globe Telecom filed a Petition for Mandamus, Certiorari and Prohibition against the PCC, docketed as CA-G.R. SP No. 146538. On July 25, 2016, the CA, through its 6th Division issued a resolution denying Globe Telecom’s application for TRO and injunction against PCC’s review of the transaction. In the same resolution, however, the CA required the PCC to comment on Globe Telecom's petition for certiorari and mandamus within 10 days from receipt thereof. The PCC filed said comment on August 8, 2016. In said comment, the PCC prayed that the 70.00 billion deal between PLDT-Globe Telecom and San Miguel be declared void for PLDT and Globe Telecom’s alleged failure to comply with the requirements of the Philippine Competition Act of 2015. The PCC also prayed that the CA direct Globe Telecom to: cease and desist from further implementing its co-acquisition of the San Miguel telecommunications assets; undo all acts consummated pursuant to said acquisition; and pay the appropriate administrative penalties that may be imposed by the PCC under the Philippine Competition Act for the illegal consummation of the subject acquisition. The case remains pending with the CA.
Meanwhile, PLDT filed a similar petition with the CA, docketed as CA G.R. SP No. 146528, which was raffled off to its 12th Division. On August 26, 2016, PLDT secured a TRO from said court. Thereafter, Globe Telecom’s petition was consolidated with that of PLDT, before the 12th Division. The consolidation effectively extended the benefit of PLDT’s TRO to Globe Telecom. The parties were required to submit their respective Memoranda, after which, the case shall be deemed submitted for resolution.
On February 17, 2017, the CA issued a Resolution denying PCC’s Motion for Reconsideration dated September 14, 2016 for lack of merit. In the same Resolution, the Court granted PLDT’s Urgent Motion for the Issuance of a Gag Order and ordered the PCC to remove the offending publication from its website and also to obey the sub judice rule and refrain from making any further public pronouncements regarding the transaction while the case remains pending. The Court also reminded the other parties, PLDT and Globe, to likewise observe the sub judice rule. For this purpose, the Court issued its gag order admonishing all the parties “to refrain, cease and desist from issuing public comments and statements that would violate the sub judice rule and subject them to indirect contempt of court. The parties were also required to comment within ten days from receipt of the Resolution, on the Motion for Leave to Intervene, and Admit the Petition-in Intervention dated February 7, 2017 filed by Citizenwatch, a non-stock and non-profit association.
C Globe

�����������������03/��
&�5�(�$�7�(���:�2�1�'�(�5�)�8�/��� ����
On April 18, 2017, PCC filed a petition before the SC docketed as G.R. No. 230798, to lift the CA's order that has prevented the review of the sale of San Miguel Corp.'s telecommunications unit to PLDT Inc. and Globe Telecom. On April 25, 2017, Globe filed before the SC a Motion for Intervention with Motion to Dismiss the petition filed by the PCC.
As of June 30, 2017, the SC did not issue any TRO on the PCC's petition to lift the injunction issued by the CA. Hence, the PCC remains barred from reviewing the SMC deal.
On July 26, 2017, Globe received the SC en banc Resolution granting Globe's Extremely Urgent Motion to Intervene. In the same Resolution, the Supreme Court treated as Comment, Globe's Motion to Dismiss with Opposition Ad Cautelam to PCC's Application for the Issuance of a Writ of Preliminary Injunction and/or TRO.
On August 31, 2017, Globe received another Resolution of the SC en banc, requiring the PCC to file a Consolidated Reply to the Comments respectively filed by Globe and PLDT, within ten (10) days from notice. Globe has yet to receive the Consolidated Reply of PCC since the latter requested for extension of time to file the same.
In the meantime, in a Decision dated October 18, 2017, the CA, in CA-G.R. SP No. 146528 and CA-G.R. SP No. 146538, granted Globe and PLDTs Petition to permanently enjoin and prohibiting PCC from reviewing the acquisition and compelling the PCC to recognize the same as deemed approved. PCC elevated the case to the SC via Petition for Review on Certiorari.
Co-use of frequencies by PLDT/Smart and Globe Telecom as a result of the acquisition of controlling shares in VTI
On January 21, 2019, Globe filed its Comment to a petition filed by lawyers Joseph Lemuel Baligod and Ferdinand Tecson before the Supreme Court, against the NTC, PCC, Liberty Broadcasting Network, Inc., (LBNI), Bell Telecommunications Inc. (BellTel), Globe, PLDT and Smart, docketed as G.R. No. 242353. The petition sought to, among others, enjoin PLDT/Smart and Globe from co-using the frequencies assigned to LBII and BellTel in view of alleged irregularities in NTC’s assignment of these frequencies to these entities. In its Comment, Globe argued that the frequencies were assigned in accordance with existing procedures prescribed by law and that to prevent the use of the frequencies will only result to its being idle and unutilized. Moreover, in view of the substantial investments made by Globe, for the use of these frequencies, enjoining its use will cause grave and irreparable injury not only to Globe but to subscribers who will be deprived of the benefits of fast and reliable telecommunications services. The other Respondents have likewise filed their respective Comments to the petition.
37� NTC Regulation
On February 8, 2019, the RA 11202 or the “Mobile Number Portability Act” was signed into law. The act allows subscribers to change their subscription plans or service providers and still keep their current mobile numbers. Moreover, no interconnection fee or charge shall be imposed for domestic calls and SMS made by a subscriber. This act shall take effect fifteen days after its publication in the Official Gazette or in any newspaper of general circulation.
Within ninety (90) days from the effectivity of the act, NTC shall coordinate with the Department of Information and Communications Technology, The National Privacy Commission, the Philippine Competition Commission, and other concerned agencies, and promulgate rules and regulations and other issuances to ensure the effective implementation of the Act. Within six (6) months from the promulgation of the rules and regulations, service providers shall comply with the provisions of the act and set up a mechanism for the purpose of implementing nationwide.
O Globe

�����������������03/��
&�5�(�$�7�(���:�2�1�'�(�5�)�8�/��� ����
38� Events After Reporting Period
On February 3, 2020, the BOD approved the declaration of the first quarter cash dividend of 27 per common share, payable to common stockholders of record as of February 17, 2020. Total dividends amounting to 3.6 billion will be payable on March 4, 2020.
On January 17, 2020, Globe Telecom, Dito Telecommunity and Smart Communications incorporated a joint venture company, Telecommunications Connectivity, Inc. (TCI) in line with the new mobile number portability initiative of the government under RA 11202 also known as the "Mobile Number Portability Act" ("the MNP Act").
TCI is expected to bring in the technical infrastructure to fulfill its primary function as a clearinghouse for the three mobile operators to ensure the smooth implementation of number porting services.
@ Globe

S E C F O R M 1 7 - A 254
IV. 2019 Ayala Corporation and Subsidiaries Special Form for Financial Statements (SFFS)

Certification
I, Josephine G. de Asis, Comptroller, a duly authorized representative of Ayala Corporation (Company) with SEC registration number 34218 with principal office at 32F to 35F, Tower One and Exchange Plaza, Ayala Triangle, Ayala Avenue, Makati City, do hereby certify and state that:
1) In compliance with the guidelines issued by the Securities and Exchange Commission (SEC) for the filing of structured and current reports by publicly listed companies with the SEC in light of the imposition of an Enhanced Community Quarantine and Stringent Social Distancing Measures over the entire region of Luzon to prevent the spread of the 2019 Coronavirus Disease (COVID-2019), the Company is timely filing its SEC Form PFHS dated April 8, 2020 by uploading the same through the PSE EDGE in accordance with the relevant PSE rules and procedures.
2) The information contained in SEC Form PHFS dated April 8, 2020 is true and correct
to the best of my knowledge.
3) On behalf of the Company, I hereby undertake to a) submit hard or physical copies of SEC Form PHFS dated April 8, 2020 with proper notarization and certification, b) pay the filing fees (where applicable) c) pay the penalties due (where applicable) d) other impositions (where applicable), within ten (10) calendar days from the date of the lifting of the Enhanced Community Quarantine period and resumption of SEC’s normal working hours.
4) I am fully aware that non-submission of hard/physical copies of reports as well as
certification that they refer to one and the same document submitted online, within ten (10) calendar days from the lifting of the Enhanced Community Quarantine period and resumption of SEC’s normal working hours, shall invalidate the reports, applications, compliance, requests and other documents submitted via email. Hence, the corresponding penalties under existing rules and regulations of the Commission shall apply without prejudice to the imposition of penalties under Section 54 of the Securities Regulation Code and other applicable existing rules and regulations for failure to comply with the orders of the Commission.
5) I am executing this certification this April 8, 2020 to attest to the truthfulness of the
foregoing facts and for whatever legal purpose it may serve.
Josephine G. de Asis
Comptroller
Passport No. P0174919B

CERTIFICATION This certifies that Ayala Corporation, with principal office at 32/F to 35/F Tower One and Exchange Plaza, Ayala Triangle, Ayala Avenue, Makati City, and with Securities and Exchange Commission (SEC) Registration Number 34218, hereby undertakes to submit to SEC the Ayala Corporation and Subsidiaries’ (Ayala Group) Special Form for Financial Statements of Publicly-Held and Investment Companies in diskette form (SFFS Form) in compliance with Section 27 of RA 8792 otherwise known as the “Electronic Commerce Act” and Sec. 37 of its Implementing Rules and Regulations within ten (10) calendar days from the date of the lifting of the Enhanced Community Quarantine period and resumption of SEC’s normal working hours following the guidelines on alternative filing dated March 30, 2020. The SFFS Form in printed pdf form uploaded to the PSE Edge/sent by electronic mail to SEC contains the basic and material data in the financial statements submitted to the SEC for the calendar year 2019.
AYALA CORPORATION By: _______________________________ ________________________________ Jose Teodoro K. Limcaoco Josephine G. de Asis Chief Finance Officer, Chief Risk Officer Comptroller Chief Sustainability Officer and Finance Group Head SUBSCRIBED AND SWORN to before me this ______________ at Makati City, affiants exhibiting to me their respective passports/driver’s license, to wit:
Doc. No. ________ Page No. ________ Book No. ________ Series of 2020
Name Passport No. Date and Place of Issue Jose Teodoro K. Limcaoco P6682433A April 5, 2018 - DFA Manila Josephine G. De Asis P0174919B January 9, 2019 - DFA Manila

PHFS (rev 2006)
FAX NO.:
PSIC:
2019 2018 (as restated)( in P'000 ) ( in P'000 )
A. 1,345,285,958 1,197,925,619
609,285,431 412,759,422
93,405,253 60,624,263
275,281 98,645
47,727,767 50,028,280
45,402,205 10,497,338
134,028,386 157,728,030
115,903,209 138,814,212
A.1.2.1.1 85,443,929 105,292,183
A.1.2.1.2 13,110,555 6,322,396
A.1.2.1.3 19,380,789 29,523,840
A.1.2.1.3.
1
3,159,675 3,736,447
A.1.2.1.3.
2
16,221,114 25,787,393
A.1.2.1.4 (2,032,064) (2,324,207)
18,125,177 18,913,818
A.1.2.2.1 16,212,899 18,098,561
A.1.2.2.2 1,380,673 5,288
A.1.2.2.3 696,420 915,876
A.1.2.2.4 (164,815) (105,907)
135,064,303 120,560,493
8,399,817 10,990,222
1,214,536 681,059
551,462 108,929
- -
- -
124,898,488 108,780,283
A.1.3.6.1 120,287,686 103,959,585
A.1.3.6.2 4,142,126 4,669,650
A.1.3.6.3 468,676 151,048
13,387,801 5,956,489
- -
A.1.4.1.1A.1.4.1.2A.1.4.1.3A.1.4.1.4 - - A.1.4.1.5
- -
A.1.4.2.1 - -
A.1.4.2.2
A.1.4.2.3
A.1.4.2.4
A.1.4.2.5
Control No.:
Form Type:
SPECIAL FORM FOR FINANCIAL STATEMENTS OF PUBLICLY-HELD AND INVESTMENT COMPANIESNAME OF CORPORATION: AYALA CORPORATION AND SUBSIDIARIES
COMPANY TYPE : Holding Company
If these are based on consolidated financial statements, please so indicate in the caption.
Table 1. Balance Sheet
CURRENT ADDRESS: 32/F to 35/F Tower One and Exchange Plaza, Ayala Triangle, Ayala Avenue, Makati City
TEL. NO.: (632) 908-3000 (632) 848-5846
A.1.1 Cash and cash equivalents (A.1.1.1 + A.1.1.2 + A.1.1.3)
A.1.1.1 On hand
F I N A N C I A L D A T A
ASSETS (A.1 + A.2 + A.3 + A.4 + A.5 + A.6 + A.7 + A.8 + A.9 + A.10)
A.1 Current Assets (A.1.1 + A.1.2 + A.1.3 + A.1.4 + A.1.5)
A.1.2 Trade and Other Receivables (A.1.2.1 + A.1.2.2)
A.1.2.1 Due from domestic entities (A.1.2.1.1 + A.1.2.1.2 + A.1.2.1.3 + A.1.2.1.4)
A.1.1.2 In domestic entities
A.1.1.3 In foreign banks/entities
Advances, dividends and other receivable
Allowance for doubtful accounts (negative entry)
A.1.2.2 Due from foreign entities, specify
(A.1.2.2.1 + A.1.2.2.2 + A.1.2.2.3 + A.1.2.2.4)
Due from customers (trade)
Due from related parties
Others
Contract assets
A.1.3 Inventories (A.1.3.1 + A.1.3.2 + A.1.3.3 + A.1.3.4 + A.1.3.5 + A.1.3.6)
A.1.3.1 Raw materials and supplies
Due from customers (trade)
Due from related parties
Other receivables
Allowance for doubtful accounts (negative entry)
A.1.3.4 Merchandise/Goods in transit
A.1.3.5 Unbilled Services (in case of service providers)
A.1.3.2 Goods in process (including unfinished goods, growing crops, unfinished seeds)
A.1.3.3 Finished goods
A.1.4 Financial Assets other than Cash/Receivables/Equity investments (A.1.4.1 +
A.1.4.2 + A.1.4.3 + A.1.4.4 + A.1.4.5 + A.1.4.6) A.1.4.1 Financial Assets at Fair Value through Profit or Loss - issued by domestic
entities:
A.1.3.6 Others, specify (A.1.3.6.1 + A.1.3.6.2 + A.A.3.6.3)Real Estate (Residential, commercial lots, condominium units and offices)
Others
Vehicles, Parts and Accessories
Private Non-Financial Institutions A.1.4.2 Held to Maturity Investments - issued by domestic entities:
(A.1.4.2.1 + A.1.4.2.2 + A.1.4.2.3 + A.1.4.2.4 + A.1.4.2.5)National Government
National GovernmentPublic Financial InstitutionsPublic Non-Financial InstitutionsPrivate Financial Institutions
NOTE:
This special form is applicable to Investment Companies and Publicly-held Companies (enumerated in Section 17.2 of the Securities
Regulation Code (SRC), except banks and insurance companies). As a supplemental form to PHFS, it shall be used for reporting Consolidated
Financial Statements of Parent corporations and their subsidiaries.
Domestic corporations are those which are incorporated under Philippine laws or branches/subsidiaries of foreign corporations that are
licensed to do business in the Philippines where the center of economic interest or activity is within the Philippines. On the other hand, foreign
corporations are those that are incorporated abroad, including branches of Philippine corporations operating abroad.
Financial Institutions are corporations principally engaged in financial intermediation, facilitating financial intermediation, or auxiliary financial
services. Non-Financial institutions refer to corporations that are primarily engaged in the production of market goods and non-financial services.
Public Financial Institutions
Public Non-Financial Institutions
Private Financial Institutions
Private Non-Financial Institutions

PHFS (rev 2006)
FAX NO.:
PSIC:
2019 2018 (as restated)( in P'000 ) ( in P'000 )
A.1.4.3 13,387,801 5,956,489
A.1.4.3.1A.1.4.3.2A.1.4.3.3A.1.4.3.4 13,387,801 5,956,489 A.1.4.3.5
A.1.4.4
A.1.4.4.1A.1.4.4.2A.1.4.4.3A.1.4.4.4A.1.4.4.5
A.1.4.5 - - A.1.4.5.1 - - A.1.4.5.2A.1.4.5.3A.1.4.5.4 - -
233,399,688 67,890,147 A.1.5.1 15,877,481 15,694,759 A.1.5.2 15,374,122 13,546,821 A.1.5.3 13,260,900 11,452,729 A.1.5.4 Financial assets at FVTPL 9,726,080 9,236,804 A.1.5.5 Creditable withholding tax 5,546,478 4,771,550 A.1.5.6 Derivative assets and Deposits in escrow 578,138 388,454 A.1.5.7 Assets under PFRS 5 170,466,694 10,162,121 A.1.5.8 2,569,795 2,636,909
88,781,755 104,492,357
- -
35,911,906 27,212,611 46,209,533 29,176,676 5,367,559 6,005,215
33,418,956 72,275,936 A..2.5.1 Construction in progress 1,885,665 44,914,550 A..2.5.2 Hotel property and equipment 18,686,025 14,441,262 A..2.5.3 12,847,266 12,920,124 A..2.5.4A..2.5.5
A..2.6.1A..2.6.2A..2.6.3A..2.6.4A..2.6.5
(32,126,199) (30,178,081) A.2.8 Impairment Loss or Reversal (if loss, negative entry)
246,731,276 240,140,558 228,865,481 208,999,434 17,865,795 31,141,124
A.3.3.1A.3.3.2A.3.3.3A.3.3.4A.3.3.5
Investment in bonds and other securities 8,208,898 3,034,245 Investment Property and Land and Improvements 246,732,338 227,645,548 Intangible Assets 16,625,926 16,553,369
15,500,609 16,193,031 A.6.1.1 9,545,520 9,026,238 A.6.1.2 1,096,858 1,261,058 A.6.1.3 Project Development Cost 985,351 1,011,341 A.6.1.4 Leasehold and other rights 3,636,872 4,590,933 A.6.1.5 Licenses 236,008 303,461 Others, specify (A.6.2.1 + A.6.2.2) 1,125,317 360,338 A.6.2.1 879,828 115,070 A.6.2.2 245,489 245,268
A.7 1,638,516 98,404,486 A.8
Table 1. Balance Sheet
TEL. NO.:
Control No.:
Form Type:
SPECIAL FORM FOR FINANCIAL STATEMENTS OF PUBLICLY-HELD AND INVESTMENT COMPANIESNAME OF CORPORATION: AYALA CORPORATION AND SUBSIDIARIES
CURRENT ADDRESS: 32/F to 35/F Tower One and Exchange Plaza, Ayala Triangle, Ayala Avenue, Makati City
(632) 908-3000 (632) 848-5846
COMPANY TYPE : Holding CompanyIf these are based on consolidated financial statements, please so indicate in the caption.
Public Non-Financial InstitutionsPrivate Financial InstitutionsPrivate Non-Financial Institutions
Available-for-sale financial assets - issued by domestic entities:
(A.1.4.4.1 + A.1.4.4.2 + A.1.4.4.3 + A.1.4.4.4 + A.1.4.4.5)
F I N A N C I A L D A T A
Loans and Receivables - issued by domestic entities:
(A.1.4.3.1 + A.1.4.3.2 + A.1.4.3.3 + A.1.4.3.4 + A.1.4.3.5)National GovernmentPublic Financial Institutions
Private Non-Financial InstitutionsFinancial Assets issued by foreign entities:
Financial Assets at fair value through profit or lossHeld-to-maturity investments
National GovernmentPublic Financial InstitutionsPublic Non-Financial InstitutionsPrivate Financial Institutions
Loans and ReceivablesAvailable-for-sale financial assets
A.1.4.6 Allowance for decline in market value (negative entry) A.1.5 Other Current Assets (state separately material items) (A.1.5.1 + A.1.5.2 + A.1.5.3)
Prepaid expensesAdvances to contractors
Input VAT
Others (including Concession financial receivable)
A.2.4 Transportation/motor vehicles, automotive equipment, autos and trucks, and
A.2 Property, plant, and equipment (A.2.1 + A.2.2 + A.2.3 + A.2.4 + A.2.5 + A.2.6 + A.2.7+ A.2.8)
A.2.1 Land
A.2.5 Others, specify (A.2.5.1 + A.2.5.2 + A.2.5.3 + A.2.5.4 + A.2.5.5)
A.2.2 Land, buildings and improvements including leasehold improvementA.2.3 Machinery and equipment (on hand and in transit)
A.2.6 Appraisal increase, specify (A.2.6.1 + A.2.6.2 + A.2.6.3 + A.2.6.4 + A.2.6.5)
Furniture and fixtures
A.2.7 Accumulated Depreciation (negative entry)
A.3 Investments accounted for using the equity method (A.3.1 + A.3.2 + A.3.3 + A.3.4)
A.3.3 Others, specify (A.3.3.1 + A.3.3.2 + A.3.3.3 + A.3.3.4 + A.3.3.5)
A.3.1 Equity in domestic subsidiaries/affiliatesA.3.2 Equity in foreign subsidiaries/affiliates
A.4A.5A.6
A.6.1
TrademarksDeveloped software, customer relationships and others
Service Concession AssetsAssets included in Disposal Groups Classified as Held for Sale
Major item/s, specify (A.6.1.1 + A.6.1.2)GoodwillUnpatented Technology/ Intellectual Properties
A.6.2

PHFS (rev 2006)
FAX NO.:PSIC:
2019 2018 (as restated)
( in P'000 ) ( in P'000 )
Long-term receivables (net of current portion) (A.9.1 + A.9.2 + A.9.3) 55,720,290 42,296,240 50,909,088 42,488,482
A.9.1.1 46,241,200 38,003,893 A.9.1.2 - 492,943 A.9.1.3 4,667,888 3,991,646
5,042,685 393,881 A.9.2.1 5,042,685 393,881 A.9.2.2A.9.2.3
Allowance for doubtful accounts, net of current portion (negative entry) (231,483) (586,123) Other Assets (A.10.1 + A.10.2 + A.10.3 + A.10.4 + A.10.5) 71,561,528 52,599,394
14,246,325 15,546,040 13,664,137 10,272,615 11,517,876 9,650,001 32,133,190 17,130,738
A.10.4.1 18,220,572 - A.10.4.2 3,330,646 2,478,582 A.10.4.3 2,208,663 500,700 A.10.4.4 2,045,667 6,907,123 A.10.4.5 6,327,642 7,244,333
B. 835,972,400 728,817,264
402,656,865 330,102,855
167,681,567 184,125,450
B.1.1.1 Loans/Notes Payables B.1.1.2 Trade Payables 104,887,772 120,312,117
B.1.1.3 Payables to Related Parties 1,084,061 1,072,551 B.1.1.4 Advances from Directors, Officers, Employees and Principal Stockholders B.1.1.5 Accruals, specify material items (B.1.1.5.1 + B.1.1.5.2 + B.1.1.5.3) 47,582,498 53,197,511
B.1.1.5.1 20,773,961 28,371,851 B.1.1.5.2 23,436,569 20,688,048 B.1.1.5.3 3,371,968 4,137,612
B.1.1.6 14,127,236 9,543,271 B.1.1.6.1 9,936,887 2,544,623 B.1.1.6.2 4,190,349 6,762,286 B.1.1.6.3 - 236,362
23,238,394 16,501,477 B.1.2.1 23,238,394 16,501,477 B.1.2.2B.1.2.3
30,040,984 39,632,414
B.1.4.1 29,788,643 39,518,245 B.1.4.2 Estimated liabilities for land and property development B.1.4.3 Cumulative redeembale preferred shares-current B.1.4.4 B.1.4.5 252,341 114,169
B.1.5 2,396,901 3,406,921 B.1.6 13,607 820,802
179,285,412 85,615,791
B.1.7.1 Dividends declared and not paid at balance sheet date 4,496,286 4,131,317 B.1.7.2 Acceptances Payable - - B.1.7.3 Liabilities under Trust Receipts/ Lease liabilities 1,028,067 - B.1.7.4 Portion of Long-term Debt Due within one year 23,878,725 48,480,559 B.1.7.5 Deferred Income/ Liabilities under PFRS 5 121,487,625 1,075,272 B.1.7.6 28,394,709 31,928,643
B.1.7.6.1 25,481,979 29,043,778 B.1.7.6.2 Financial liabilities on put option 1,823,114 1,386,926 B.1.7.6.3 1,089,616 1,497,939
TEL. NO.: (632) 908-3000 (632) 848-5846
Control No.: Form Type:
SPECIAL FORM FOR CONSOLIDATED FINANCIAL STATEMENTS OF PUBLICLY-HELD AND INVESTMENT NAME OF CORPORATION: AYALA CORPORATION AND SUBSIDIARIES
CURRENT ADDRESS: 32/F to 35/F Tower One and Exchange Plaza, Ayala Triangle, Ayala Avenue, Makati City
F I N A N C I A L D A T A
A.9A.9.1 From domestic entities, specify (A.9.1.1 + A.9.1.2 + A.9.1.3)
COMPANY TYPE : Holding CompanyIf these are based on consolidated financial statements, please so indicate in the caption.
Table 1. Balance Sheet
Related parties and Other receivables
A.9.3
Trade ReceivablesNoncurrent contract assetsRelated parties and Other receivables
A.9.2 From foreign entities, specify (A.9.2.1 + A.9.2.2 + A.9.2.3)
A.10.3 Deferred chargesA.10.4 Others, specify (A.10.4.1 + A.10.4.2 + A.10.4.3 + A.10.4.4+A.10.4.5)
A.10A.10.1 Deferred Tax AssetsA.10.2 Advances to contractors
Others (incl. Pension, Deferred FCDA and Concession financial receivables)A.10.5 Allowance for write-down of deferred charges/bad accounts (negative entry)
LIABILITIES (B.1 + B.2 + B.3 + B.4 + B.5)
Right-of-use assetsDeposits - others Creditable withholding taxesDeferred input VAT
Accrued expenses (project, personnel cost, etc.)Taxes payableInterest payable
Others, specify (B.1.1.6.1 + B.1.1.6.2 + B.1.1.6.3)
B.1 Current Liabilities (B.1.1 + B.1.2 + B.1.3 + B.1.4 + B.1.5 + B.1.6 + B.1.7)B.1.1 Trade and Other Payables to Domestic/Foreign Entities
(B.1.1.1 + B.1.1.2 + B.1.1.3 + B.1.1.4 + B.1.1.5 + B.1.1.6)
Liability for purchase of landRetention payableDRP obligation
B.1.2 Trade and Other Payables to Foreign Entities (specify) (B.1.2.1 + B.1.2.2 + B.1.2.3)
Accounts payable and accrued expenses
B.1.3 Provisions
Other liabilities
Service concession obligation
Any other current liability in excess of 5% of Total Current Liabiilities,
B.1.4 Financial Liabilities (excluding Trade and Other Payables and Provisions)
(B.1.4.1 + B.1.4.2 + B.1.4.3 + B.1.4.4 + B.1.4.5)Short-term debt
Customers' deposits
B.1.7 Others, specify (If material, state separately; indicate if the item is payable to
public/private or financial/non-financial institutions) (B.1.7.1 + B.1.7.2 + B.1.7.3
Unealized gain on real estate salesContract liabilities
Income tax payable

PHFS (rev 2006)
FAX NO.:PSIC:
2019 2018 (as restated)( in P'000 ) ( in P'000 )
351,670,789 324,262,828
307,907,853 305,807,467
43,762,936 18,455,361
Indebtedness to Affiliates and Related Parties (Non-Current)
B.4
B.5 52,412 7,018,211
Other Liabilities (B.5.1 + B.5.2) 81,592,334 67,433,370
8,035,817 10,999,354
73,556,517 56,434,016 B.6.2.1 21,353,099 - B.6.2.2 23,073,011 29,702,272 B.6.2.3 6,751,643 5,721,123 B.6.2.4 6,595,611 7,264,642 B.6.2.5 15,783,153 13,745,979
509,313,558 469,108,355
Common shares 45,000,000 45,000,000
1,200,000 1,200,000
5,800,000 5,800,000
4,000,000 4,000,000
Voting Preferred Shares 200,000 200,000
Subscribed Capital Stock (no. of shares, par value and total value) (C.2.1 + C.2.2 + C.2.3) 36,534,180 36,431,375
31,334,180 31,531,375
- -
5,000,000 4,700,000
Voting Preferred Shares 200,000 200,000
Paid-up Capital Stock (C.3.1 + C.3.2 + C.3.3 + C.3.4) 37,038,979 37,205,657
Common shares 29,838,979 30,005,657
Preferred Shares A 1,200,000 1,200,000
Preferred Shares B 5,800,000 5,800,000
Voting Preferred Shares 200,000 200,000
Additional Paid-in Capital / Capital in excess of par value / Paid-in Surplus 47,837,246 46,156,018
Minority Interest 180,506,293 178,500,886
Others, specify (C.6.1 + C.6.2 + C.6.3) 24,214,316 12,630,805
214,617 238,871
184,206 432,795
25,282,942 11,959,139
Reserves under PFRS 5 (1,467,449) -
Appraisal Surplus/Revaluation Increment in Property/Revaluation Surplus - -
Retained Earnings (C.8.1 + C.8.2) 225,454,620 196,914,989
Appropriated - -
Unappropriated 225,454,620 196,914,989
Head / Home Office Account (for Foreign Branches only) - -
Cost of Stocks Held in Treasury/Preferred shares held by a subsdiary (negative entry) (5,737,896) (2,300,000) 1,345,285,958 1,197,925,619
C.6.3 Equity reserve / Equity conversion option
C.9
C.6.4
C.1.3
(200,000,000 x P1 par value in 2019 and 2018)
C.1.4 Preferred Shares C (40,000,000 x P100 par value in 2019 and 2018)
(200,000,000 x P1 par value in 2019 and 2018)
C.2.2 Preferred Shares A (12,000,000* x P100 par value; *all are in Treasury shares)
C.2.3
C.6.2
TOTAL LIABILITIES AND EQUITY (B + C)
C.7
C.8
C.8.1
C.8.2
C.10
Other Comprehensive Income (CTA, FV reserve of financial assets at FVOCI and Remeasurement
C.3
C.3.2
(50,000,000* x P100 par value in 2019); (47,000,000* x P100 par value in 2018) *net of Treasury shares
Share-based payments
C.4
C.5
C.3.3
C.3.4
C.6
C.3.1
C.6.1
Preferred Shares B (58,000,000 x P100 par value in 2019 and 2018)
Lease liabilities - net of current portion
Deposits and deferred credits
Retentions payable
EQUITY (C.3 + C.4 + C.5 + C.6 + C.7 + C.8 + C.9+C.10)
C.1 Authorized Capital Stock (no. of shares, par value and total value; show details) (C.1.1+C.1.2+C.1.3)
Contractors payable
Other liabilities (including pension, liability for purchase of land, DRP obligation, deferred
C.1.2 Preferred Shares A (12,000,000 x P100 par value in 2019 and 2018)
C.1.1 (900,000,000 x P50 par value in 2019 and 2018)
B.6.2 Others, specify (B.5.2.1 + B.5.2.2 + B.5.2.3 + B.5.2.4 + B.5.2.5)
B.2.1 Domestic Public Financial Institutions
B.6.1 Deferred Tax Liabilities
Service concession obligation - net of current portion
B.2.2 Domestic Public Non-Financial Institutions
B.2.3 Domestic Private Financial/Non-Financial Institutions
B.2.4 Domestic Private Non-Financial Institutions
B.2.5 Foreign Financial Institutions
B.3
Holding Company
Table 1. Balance Sheet
F I N A N C I A L D A T A
B.6
Liabilities Included in the Disposal Groups Classified as Held for Sale
Control No.: Form Type:
SPECIAL FORM FOR FINANCIAL STATEMENTS OF PUBLICLY-HELD AND INVESTMENT COMPANIESNAME OF CORPORATION: AYALA CORPORATION AND SUBSIDIARIES
CURRENT ADDRESS: 32/F to 35/F Tower One and Exchange Plaza, Ayala Triangle, Ayala Avenue, Makati City
C.1.5
C.2.4
C.2
C.2.1 Common shares (626,683,595 x P50 par value in 2019); (630,627,482 x P50 par value in 2018)
Preferred Shares B
B.2 Long-term Debt - Non-current Interest-bearing Liabilities (B.2.1 + B.2.2 + B.2.3 + B.2.4 + B.2.5)
If these are based on consolidated financial statements, please so indicate in the caption.
TEL. NO.: (632) 908-3000 (632) 848-5846
COMPANY TYPE :

PHFS (rev 2006)
FAX NO.:
PSIC:
2019 2018 (as restated) 2017 (as restated)
( in P'000 ) ( in P'000 ) ( in P'000 )
A. 330,905,559 295,293,483 258,512,729
233,219,459 228,368,867 201,247,020
22,344,352 19,760,662 18,037,250 39,700,950 35,671,301 30,384,981 31,687,075 28,522,420 24,321,316
- - - - - - - - -
8,013,875 7,148,881 6,063,665
A.3.5.1 7,890,972 7,042,078 5,409,944 A.3.5.2 122,903 106,803 653,721 A.3.5.3A.3.5.4A.3.5.5A.3.5.6A.3.5.7A.3.5.8
35,640,798 11,492,653 8,843,478 3,352,308 2,293,765 1,047,050
25,416,784 2,573,072 2,300,450
A.4.3.1 24,696,571 1,514,439 1,394,560 A.4.3.2 528,011 996,170 779,553 A.4.3.3 192,202 62,463 126,337 A.4.3.4
6,871,706 6,625,816 5,495,978
A.4.4.1 (258,223) (222,845) (126,365) A.4.4.2 2,020,662 (1,968,599) - A.4.4.3 909,212 622,149 960,851 A.4.4.4 4,200,055 8,195,111 4,661,492
B.
- - - - - - - - - - - - - - - - - -
- - -
C. 189,983,258 189,706,638 168,671,311
189,983,258 189,706,638 168,671,311
- - -
- - -
D. 140,922,301 105,586,845 89,841,418
Interest income from real estate
Finished Goods, End (negative entry)
GROSS PROFIT (A - B - C)
C.2 Merchandise Inventory, Beginning
C.3 Merchandise Inventory, End (negative entry)
COST OF SALES (C.1 + C.2 + C.3)
Cost of Goods Manufactured (B.1.1 + B.1.2 + B.1.3 + B.1.4 + B.1.5)
B.1.1 Direct Material Used
C.1 Purchases/ Cost of sales and rendering of services
B.1.3 Other Manufacturing Cost / Overhead
B.3
COST OF GOODS SOLD (B.1 + B.2 + B.3)B.1
B.1.4 Goods in Process, BeginningB.1.5
B.1.2 Direct Labor
Goods in Process, End (negative entry)
A.4.4 Others, specify
(A.4.4.1 + A.4.4.2 + A.4.4.3 + A.4.4.4)
B.2 Finished Goods, Beginning
Revenue from management contractsOthers
Gain / (Loss) on Foreign ExchangeRemeasurement gain (loss) on previously held interest
Dividend IncomeA.4.3 Gain / (Loss) from selling of Assets, specify
(A.4.3.1 + A.4.3.2 + A.4.3.3 + A.4.3.4)
Gain on sale of other assetsGain on sale of financial assets at FVTPLGain on sale of investments
A.4.2
A.4 Other Income (non-operating) (A.4.1 + A.4.2 + A.4.3 + A.4.4)A.4.1 Interest Income
A.3.1 Rental Income
A.3.3 Sale of Real Estate or other Property and EquipmentA.3.4 Royalties, Franchise Fees, Copyrights (books, films, A.3.5 Others, specify (A.3.5.1 + A.3.5.2 + A.3.5.3 + A.3.5.4 +
A.3.5.5 + A.3.5.6 + A.3.5.7 + A.3.5.8)
A.3.2 Receipts from Sale of Merchandise (trading) (from Secondary Activity)
Dividend income
Share in the Profit or Loss of Associates and Joint Ventures A.3
TEL. NO.: (632) 908-3000 (632) 848-5846
COMPANY TYPE : Holding Company
If these are based on consolidated financial statements, please so indicate in the caption.
Table 2. Income Statement
F I N A N C I A L D A T A
REVENUE / INCOME (A.1 + A.2 + A.3)
A.1 Net Sales or Revenue / Receipts from Operations
(manufacturing, mining,utilities, trade, services, etc.) (from
Primary Activity)
Other Revenue (A.3.1 + A.3.2 + A.3.3 + A.3.4 + A.3.5)A.2
CURRENT ADDRESS: 32/F to 35/F Tower One and Exchange Plaza, Ayala Triangle, Ayala Avenue, Makati City
Control No.:
Form Type:
SPECIAL FORM FOR FINANCIAL STATEMENTS OF PUBLICLY-HELD AND INVESTMENT COMPANIES
NAME OF CORPORATION: AYALA CORPORATION AND SUBSIDIARIES

PHFS (rev 2006)
FAX NO.:
PSIC:
2019 2018 (as restated) 2017 (as restated)( in P'000 ) ( in P'000 ) ( in P'000 )
E. 32,112,815 25,956,728 21,644,500
E.1 Selling or Marketing Expenses
E.2 Administrative Expenses
E.3 General Expenses 32,112,815 25,956,728 21,644,500
E.4 - - -
E.4.1
E.4.2
E.4.3
E.4.4
E.4.5
E.4.6
E.4.7
E.4.8
E.4.9
E.4.10
F. 22,409,526 17,378,936 13,080,794
F.1 1,307,581 595,375 659,044
F.2 18,971,380 16,216,479 11,954,115
F.3 - - -
F.4 - 7,259 386,843
F.5 2,130,565 559,823 80,792
F.5.1 1,202,425 - -
F.5.2 928,140 559,823 80,792
F.5.3
F.5.4
G. 86,399,960 62,251,181 55,116,124
H. INCOME TAX EXPENSE (negative entry) (13,984,137) (13,367,201) (10,579,218)
I. 72,415,823 48,883,980 44,536,906
J. (30,433,493) 6,181,134 5,329,869
J.1 (30,433,493) 6,181,134 5,329,869
J.2
K. 6,703,000 23,247,393 19,602,933
L 35,279,330 31,817,721 30,263,842
M.
M.1 54.12 48.80 46.67
M.2 53.93 48.35 45.99
Control No.:
Form Type:
SPECIAL FORM FOR FINANCIAL STATEMENTS OF PUBLICLY-HELD AND INVESTMENT COMPANIES
NAME OF CORPORATION: AYALA CORPORATION AND SUBSIDIARIES
COMPANY TYPE : Holding Company
If these are based on consolidated financial statements, please so indicate in the caption.
CURRENT ADDRESS: 32/F to 35/F Tower One and Exchange Plaza, Ayala Triangle, Ayala Avenue, Makati City
TEL. NO.: (632) 908-3000 (632) 848-5846
Table 2. Income Statement
F I N A N C I A L D A T A
OPERATING EXPENSES (E.1 + E.2 + E.3 + E.4)
Other Expenses, specify (E.4.1 + E.4.2 + E.4.3 + E.4.4 + E.4.5
+ E.4.6 + E.4.7 + E.4.8 + E.4.9 + E.4.10)
FINANCE COSTS (F.1 + F.2 + F.3 + F.4 + F.5)
Interest on Short-term Promissory Notes/Short-term debt
Others
NET INCOME (LOSS) BEFORE TAX (D - E - F)
Interest on Long-term Promissory Notes/Long-term debt
Interest on bonds, mortgages and other long-term loans
Amortization of discount on long-term debt
Accretion of lease liability
Other interests, specify (F.5.1 + F.5.2 + F.5.3 + F.5.4 + F.5.5)
INCOME(LOSS) AFTER TAX
Amount of (i) Post-Tax Profit or Loss of Discontinued
Operations; and (ii) Post-Tax Gain or Loss Recognized on
theMeasurement of Fair Value less Cost to Sell or on the
Disposal of the Assets or Disposal Group(s) constituting the Operations of the segment under PFRS 5
Basic
Diluted
PROFIT OR LOSS ATTRIBUTABLE TO MINORITY INTERESTPROFIT OR LOSS ATTRIBUTABLE TO EQUITY HOLDERS OF THE PARENT
EARNINGS (LOSS) PER SHARE

PHFS (rev 2006)
FAX NO.:PSIC:
2019 2018 (as restated) 2017 (as restated)
( in P'000 ) ( in P'000 ) ( in P'000 )
54,415,747 70,184,839 62,126,534
18,641,311 13,561,593 12,297,860 Amortization, specify: - - - Others, specify: 135,946 (9,001) (504)
24,484,235 19,101,077 14,441,334 41,092,857 1,464,387 1,183,846
(133,231) (996,170) (760,740)
(122,903) (106,803) (653,721) Other income (220,960) (1,637,720) 18,528
(24,888,773) (1,576,902) (1,520,897) (2,020,662) - -
Interest Income (11,647,937) (9,747,726) (6,813,481) (22,997,854) (20,459,804) (18,494,458)
Decrease (Increase) in:Accounts and notes receivable – trade 12,256,330 (34,762,405) (20,003,368) Inventories (3,419,900) 6,422,504 8,575,205 Service Concession Asset (12,011,636) (10,445,119) (10,667,636) Others, specify: (401,809) (1,332,372) -
(2,838,291) 2,733,232 (9,028,474)
Increase (Decrease) in:Accounts payable and accrued expenses (11,394,983) 29,311,790 5,305,175 Income and Other Taxes PayableOthers, specify: 483,816 (166,729) -
977,070 (291,599) 462,117 (3,992,761) 7,301,018 7,857,053
Net cash provided by operating activities associated with noncurrent assets held for sale26,117,553 43,946,142 21,106,298
Sale/maturities of financial assets FVOCI 65,660 23,447 1,834,186 Sale/maturities of financial assets at FVTPL 765,763 71,690 3,408,555
30,353,702 1,106,080 944,104
Disposal of property, plant and equipment and intangible assets 766,655 4,687,018 1,016,548 Disposal of investment properties 1,632,666 1,754,974 165 Maturities of (additions to) short-term investments (7,540,567) (556,250) (4,391,533) Additions to:
(11,898,192) (37,633,169) (11,779,429) (20,965,834) (14,006,370) (25,189,980)
Investment properties (29,306,538) (37,287,003) (30,430,200) Accounts and notes receivable - nontrade (3,580,862) (11,265,591) (1,336,144)
(1,435,128) (1,122,194) (1,555,243) Financial assets at FVOCI (3,137,883) (92,673) (799,529)
(29,525) (10,725) (26,290) 849,934 (488,357) (492,057)
9,004,700 7,478,203 8,953,251 (1,143,592) (6,831,376) (5,322,990)
Decrease (increase) in other noncurrent assets (14,448,144) (13,819,311) 5,775,538
(50,047,185) (107,991,607) (59,391,048)
LoansLong-term debt and short-term debt 289,335,723 188,614,111 225,841,869 Issuance of preferred shares 15,000,000 - - Issuance of common shares - 8,069,960 - Others, specify: 274,677 303,904 374,371
Dividends paid (11,919,555) (10,769,921) (10,864,490) Long-term debt and short-term debt (202,331,063) (137,303,524) (172,070,751) Cost of issuance of shares (120,327) (13,703) - Service concession obligation paid (838,286) (712,941) (778,819)
Other noncurrent liabilities (749,826) 12,202,242 1,181,105 Non-controlling interests in consolidated subsidiaries (3,692,798) 20,321 (1,362,580)
Net cash used in financing activities assoicated with noncurrent assets held for sale65,668,880 60,410,449 42,320,705 41,739,248 (3,635,016) 4,035,955
60,624,262 64,259,279 60,223,324 102,363,510 60,624,263 64,259,279
Control No.:
Form Type:
SPECIAL FORM FOR FINANCIAL STATEMENTS OF PUBLICLY-HELD AND INVESTMENT COMPANIESNAME OF CORPORATION: AYALA CORPORATION AND SUBSIDIARIES
Cost of share-based paymentsInterest & other financing charges-net of amount capitalized
Net cash provided by (used in ) investing activities associated with noncurrent assets held for sale, including cash balance
Collections of (additions to) subscriptions receivable
Contract assets
Investments in associates and joint ventures
Service concession assets
Dividends received from associates and joint venturesAcquisitions through business combinations - net of cash acquired
Remeasurement gain on previously held interest
Proceeds from:
Property, plant and equipment
Other current assets
Contact liabilities
CURRENT ADDRESS: 32/F to 35/F Tower One and Exchange Plaza, Ayala Triangle, Ayala Avenue, Makati City
Adjustments to Reconcile Net Income to Net Cash Provided by Operating ActivitiesDepreciation and Amortization
Amortization of discount on long-term debt-net
TEL. NO.: (632) 908-3000 (632) 848-5846
CASH FLOWS FROM OPERATING ACTIVITIESNet Income (Loss) Before Tax and Extraordinary Items
F I N A N C I A L D A T A
If these are based on consolidated financial statements, please so indicate in the caption.
Table 3. Cash Flow Statements
COMPANY TYPE Holding Company
Net pension liabilitiesOther current liabilities
End of year
C. Net Cash Provided by (Used in) Financing Activities (sum of above rows)NET INCREASE IN CASH AND CASH EQUIVALENTS (A + B + C)
Cash and Cash Equivalents
Increase in:
Beginning of year
Payments of:
B. Net Cash Provided by (Used in) Investing Activities (sum of above rows)CASH FLOWS FROM FINANCING ACTIVITIES
Proceeds from:
A. Net Cash Provided by (Used in) Operating Activities (sum of above rows)CASH FLOWS FROM INVESTING ACTIVITIES
Provision for impairment/ losses/ write-downs
Dividend income
Sale/redemptions of investments in associates and joint ventures
Financial assets at FVTPL
Intangible assets
Mark to market gain on financial assets at FVTPL and gain on sale
of financial assets at FVTPL
Share of profit of associates and joint ventures
Gain on sale of investments and other assets
Changes in Assets and Liabilities:Write-down of Property, Plant, and Equipment

GFFS (rev 2006)
FAX NO.:
PSIC:
Capital Stock Subscribed Additional Paid-in
Capital
Subscriptions
receivable
Share-based
Payments
Cumulative
Translation Adj Retained Earnings
Remeasurement Gain
(Loss) on Defined
Benefit Plans/Net
Unrealized Gain (Loss)
on Available-for-Sale
Financial Assets/Fair
Value Reserve of
Financial Assets at
FVOCI
Other Reserves Reserves under
PFRS 5 Treasury Stock Minority Interest TOTAL
A. Balance, 38,039,021 172,209 36,928,326 (759,796) 495,759 1,414,550 145,622,311 (2,014,868) 13,325,020 - (2,300,000) 140,073,346 370,995,878
- - - - - - - - - - - - -
- - - - - - - - - - - - -
- - - - - - - - - - - - -
B. Restated Balance 38,039,021 172,209 36,928,326 (759,796) 495,759 1,414,550 145,622,311 (2,014,868) 13,325,020 - (2,300,000) 140,073,346 370,995,878
C. - - - - - - - - - - - -
- - - - - - - - - - - - -
- - - - - - - - - - - - -
- - - - - 1,379,753 - - - - - - 1,379,753
- - - - - - - - - - - - -
C.4.1 - - - - - - - - - - - - -
C.4.2 - - - - - - 30,263,842 - - - - 19,602,933 49,866,775
C.4.3 - - - - - - - (396,382) - - - 1,194,857 798,475
C.4.4 - - - - - - - - - - - - -
C.4.5 - - - - - - - - - - - - -
C.4.6 - - - - (504) - - - - - - - (504)
C.4.7 - - - - - - - - 7,864 - - 2,048 9,912
C.4.8 - - - - - - - - (619,600) - - (732,980) (1,352,580)
D. - - - - - - (5,584,125) - - - - (5,395,567) (10,979,692)
E. - - - - - - - - - - - -
- - - - - - - - - - - -
- - - - - - - - - - - -
- - - - - - - - - - - -
- - - - - - - - - - - -
- - - - - - - - - - - -
F. - - - - - - - - - - - -
F.1 - - - - - - - - - - - - -
F.2 - - - - - - - - - - - - -
F.3 55,377 (55,377) - 374,485 - - - - - - - - 374,485
F.4 5,479 47,893 1,001,601 (808,044) (247,043) - - - - - - - (114)
F.5 Redemption of preferred shares - - - - - - - - - - - - -
G. 38,099,877 164,725 37,929,927 (1,193,355) 248,212 2,794,303 170,302,028 (2,411,250) 12,713,284 - (2,300,000) 154,744,637 411,092,388
- - - - - - - - - - - - -
- - - - - - - - - - - - -
- - - - - - 413,714 1,261,195 - - - 227,531 1,902,440
H. Restated Balance 38,099,877 164,725 37,929,927 (1,193,355) 248,212 2,794,303 170,715,742 (1,150,055) 12,713,284 - (2,300,000) 154,972,168 412,994,828
I. - - - - - - - - - - - - -
- - - - - - - - - - - - -
- - - - - - - - - - - - -
- - - - - (517,634) - - - - - - (517,634)
- - - - - - - - - - - - -
I.4.1 - - - - - - - - - - - - -
I.4.2 - - - - - - 31,817,721 - - - - 23,247,393 55,065,114
I.4.3 - - - - - - - (693,819) - - - (86,212) (780,031)
I.4.4 - - - - - - - - - - - - -
I.4.5 - - - - - - - - - - - - -
I.4.6 - - - - (9,001) - - - - - - - (9,001)
I.4.7 - - - - - - - - 262,173 - - 77,840 340,013
I.4.8 - - - - - - - - (1,016,318) - - 5,953,856 4,937,538
J. - - - - - - (5,618,474) - - - - (5,664,159) (11,282,633)
K. - - - - - - - - - - - -
- - - - - - - - - - - -
- - - - - - - - - - - -
- - - - - - - - - - - -
- - - - - - - - - - - -
A.3 Effect of adoption of Philippine Interpretation IFRIC 12
Other comprehensive income
E.1
G.3
E.2
Increase in minority interests
Effect of adoption of new accounting standards
Cost of share-based payments of Ayala Cororation
Equity-conversion option
Net Income
Dividends (negative entry)
Appropriation for (specify) others
Preferred Stock
Exercise/cancellation of ESOP/ESOWN
Balance, At December 31, 2017
E.5
I.2
G.2
Other Surplus (specify)
Surplus (Deficit) on Revaluation of Investments
K.3
Net unrealized gains for the year recognized in equity
Currency Translation Differences
Change in non-controlling interests
I.3
K.2
I.4
(632) 848-5846
COMPANY TYPE : Holding Company
If these are based on consolidated financial statements, please so indicate in the caption.
Table 4. Statement of Changes in Equity
Changes in fair value of available-for-sale financial
A.2 Effect of adoption of new and revised accounting standards
G.1 Correction of Error (s)
Surplus (Deficit) on Revaluation of Properties
Issuance of Capital Stock
Common Stock
E.3
E.4
I.1 Surplus (Deficit) on Revaluation of Properties
Effect of adoption of Pre-need Rule 31
NAME OF CORPORATION:
C.2 Surplus (Deficit) on Revaluation of Investments
C.3
Net unrealized gains for the year recognized in equity
Currency Translation Differences
Control No.:
Form Type:
AYALA CORPORATION AND SUBSIDIARIES
SPECIAL FORM FOR FINANCIAL STATEMENTS OF PUBLICLY-HELD AND INVESTMENT COMPANIES
(Amount in P'000)
CURRENT ADDRESS:
TEL. NO.:
32/F to 35/F Tower One and Exchange Plaza, Ayala Triangle, Ayala Avenue, Makati City
(632) 908-3000
C.4 Other Surplus (specify)
F I N A N C I A L D A T A
At January 1, 2017
A.1 Correction of Error(s)
Surplus
C.1
Surplus
K.4
Dividends (negative entry)
Increase in minority interests
Changes in fair value of available-for-sale financial
Cost of share-based payments
Equity-conversion option
Net Income
Other comprehensive income
Appropriation for (specify)
K.1
Change in non-controlling interests
Collection of subscription receivables

GFFS (rev 2006)
FAX NO.:
PSIC:
Capital Stock Subscribed Additional Paid-in
Capital
Subscriptions
receivable
Share-based
Payments
Cumulative
Translation Adj Retained Earnings
Remeasurement Gain
(Loss) on Defined
Benefit Plans/Net
Unrealized Gain (Loss)
on Available-for-Sale
Financial Assets/Fair
Value Reserve of
Financial Assets at
FVOCI
Other Reserves Reserves under
PFRS 5 Treasury Stock Minority Interest TOTAL
(632) 848-5846
COMPANY TYPE : Holding Company
If these are based on consolidated financial statements, please so indicate in the caption.
Table 4. Statement of Changes in Equity
NAME OF CORPORATION:
Control No.:
Form Type:
AYALA CORPORATION AND SUBSIDIARIES
SPECIAL FORM FOR FINANCIAL STATEMENTS OF PUBLICLY-HELD AND INVESTMENT COMPANIES
(Amount in P'000)
CURRENT ADDRESS:
TEL. NO.:
32/F to 35/F Tower One and Exchange Plaza, Ayala Triangle, Ayala Avenue, Makati City
(632) 908-3000
F I N A N C I A L D A T A
- - - - - - - - - - - -
L. - - - - - - - - - - -
L.1 8,056,257 - - - - - - - - - - - 8,056,257
L.2 - - - - - - - - - - - - -
L.3 - - - - - - - - - - - - -
L.4 304,244 - - - (340) - - - - - - - 303,904
L.5 - - - - - - - - - - - -
M. 46,460,378 164,725 37,929,927 (1,193,355) 238,871 2,276,669 196,914,989 (1,843,874) 11,959,139 - (2,300,000) 178,500,886 469,108,355
- - - - - - - - - - - - -
- - - - - - - - - - - - -
- - - - - - (275,471) - - - - - (275,471)
N. Restated Balance 46,460,378 164,725 37,929,927 (1,193,355) 238,871 2,276,669 196,639,518 (1,843,874) 11,959,139 - (2,300,000) 178,500,886 468,832,884
O. - - - - - - - - - - - - -
- - - - - - - - - - - - -
- - - - - - - - - - - - -
- - - - - 1,086,855 - - - - - - 1,086,855
- - - - - - - - - - - - -
O.4.1 - - - - - - - - - - - - -
O.4.2 - - - - - - 35,279,330 - - - - 6,703,000 41,982,330
O.4.3 - - - - - - - (1,255,056) - - - (1,762,016) (3,017,072)
O.4.4 - - - - - - - - - - - - -
O.4.5 - - - - - - - - - - - - -
O.4.6 - - - - (23,311) - - - - - - - (23,311)
O.4.7 - - - - - - - - 11,236,284 - - 3,901,950 15,138,234
O.4.8 - - - - - - - - 539,682 - - (1,017,231) (477,549)
P. - - - - - - (6,464,228) - - - - (5,820,296) (12,284,524)
Q. - - - - - - - - - - - - -
- - - - - (128,906) - 48,518 1,547,837 (1,467,449) - - -
- - - - - - - - - - - - -
- - - - - - - - - - - - -
- - - - - - - - - - - - -
- - - - - - - - - - - - -
R. - - - - - - - - - - - - -
R.1 - - - - - - - - - - - - -
R.2 1,079,931 - - - - - - - - - 13,800,000 - 14,879,931
R.3 - - - - - - - - - - - - -
R.4 434,619 - - - (943) - - - - - - - 433,676
R.5 - - - - - - - - - - (3,737,896) - (3,737,896)
R.6 - - - - - - - - - - (13,500,000) - (13,500,000)
S. 47,974,928 164,725 37,929,927 (1,193,355) 214,617 3,234,618 225,454,620 (3,050,412) 25,282,942 (1,467,449) (5,737,896) 180,506,293 509,313,558
Exercise/cancellation of ESOP/ESOWN
Change in non-controlling interests
Redemption of preferred shares
Cost of share-based payments
Exercise of exchange option
O.2
Surplus (Deficit) on Revaluation of Properties
Effect of adoption of Pre-need Rule 31
Issuance of Capital Stock
K.5
Issuance of Capital Stock
Issuance of preferred stock
Surplus (Deficit) on Revaluation of Investments
O.3 Currency Translation Differences
O.1
Changes in fair value of available-for-sale financial
O.4
O.5 Net unrealized gains for the year recognized in equity
Q.1 Reserves under PFRS 5
Q.2
Q.5
Q.4
Common Stock
Preferred Stock
Balance, At December 31, 2018
Exercise/cancellation of ESOP/ESOWN
Collection of subscription receivables
Balance, At December 31, 2019
Buy-back of common shares
Issuance of common shares
Redemption of preferred shares
Collection of subscription receivables
M.1 Correction of Error (s)
M.2
Appropriation for (specify)
Q.3
M.3 Effect of adoption of new accounting standards
Surplus
Other Surplus (specify)
Dividends (negative entry)
Net Income
Other comprehensive income
Increase in minority interests

PHFS (rev 2006)
FAX NO.:PSIC:
2019 2018 (as restated) 2017 (as restated)
( in P'000 ) ( in P'000 ) ( in P'000 )
A. 330,905,559 295,293,483 258,512,729 264,906,534 256,891,287 225,568,336
A.1.1 222,229,365 187,752,446 166,590,849
A.1.2 42,677,169 69,138,841 58,977,487
65,999,025 38,402,196 32,944,393
A.2.1 39,115,194 34,667,235 30,862,884
A.2.2
26,883,831 3,734,961 2,081,509
A.2.2.1 23,764,032 775,155 1,009,542
A.2.2.2
826,525 - -
A.2.2.3 269,687 826,768 372,143
A.2.2.4 1,095,430 93,737 29,331
A.2.2.5 607,031 996,170 379,154
A.2.2.6 214,403 482,282 316,435
A.2.2.7 (311,317) (559,317) (25,097)
A.2.2.8 Rental 418,040 1,120,166 -
A.2.2.9
A.2.2.1
B. 244,505,599 233,042,302 203,396,605 173,791,569 156,857,296 148,967,119
70,714,030 76,185,006 54,429,486
B.2.8
B.2.9
B.2.1
B.2.1
Interest income
Mark to market gain on financial assets at FVPL
Forex gain (loss)
EXPENSES (B.1 + B.2)B.1 Domestic
B.2 Foreign, specify
(B.2.1+B.2.2+B.2.3+B.2.4+B.2.5+B.2.6+B.2.7+B.2.8+B.2.9+B.2.10
Gain on marked to market financial assets
Foreign, specify (A.2.2.1+A.2.2.2+ A.2.2.3+ A.2.2.4+
A.2.2.5+ A.2.2.6+ A.2.2.7+ A.2.2.8+A.2.2.9+A.2.2.10)
Gain on sale of shares/assets
Share of profit (loss) of associates and joint
ventures
Other income
If these are based on consolidated financial statements, please so indicate in the caption.
Table 5. Details of Income and Expenses, by source
(applicable to corporations transacting with foreign corporations/entities)
F I N A N C I A L D A T A
REVENUE / INCOME (A.1 + A.2)A.1 Net Sales or Revenue / Receipts from Operations
(manufacturing, mining,utilities, trade, services, etc.) (from
Domestic
Foreign
A.2 Other Revenue (A.2.1 +A.2.2)
Domestic
TEL. NO.: (632) 908-3000 (632) 848-5846
COMPANY TYPE : Holding Compnay
CURRENT ADDRESS: 32/F to 35/F Tower One and Exchange Plaza, Ayala Triangle, Ayala Avenue, Makati City
Control No.:
Form Type:
SPECIAL FORM FOR FINANCIAL STATEMENTS OF PUBLICLY-HELD AND INVESTMENT COMPANIESNAME OF CORPORATION: AYALA CORPORATION AND SUBSIDIARIES

S E C F O R M 1 7 - A 255
V. 2019 Parent Company Financial Statements (with BIR ITR Filing Reference) and SFFS


*SGVFS039490*
INDEPENDENT AUDITOR’S REPORT
The Stockholders and the Board of Directors
Ayala Corporation
32F-35F Tower One, Ayala Triangle
Ayala Avenue, Makati City
Report on the Audit of the Parent Company Financial Statements
Opinion
We have audited the parent company financial statements of Ayala Corporation (the Parent Company),
which comprise the parent company statements of financial position as at December 31, 2019 and 2018,
and the parent company statements of income, parent company statements of comprehensive income,
parent company statements of changes in equity and parent company statements of cash flows for the
years then ended, and notes to the parent company financial statements, including a summary of
significant accounting policies.
In our opinion, the accompanying parent company financial statements present fairly, in all materialrespects, the financial position of the Parent Company as at December 31, 2019 and 2018, and itsfinancial performance and its cash flows for the years then ended in accordance with Philippine FinancialReporting Standards (PFRSs).
Basis for Opinion
We conducted our audits in accordance with Philippine Standards on Auditing (PSAs). Our
responsibilities under those standards are further described in the Auditor’s Responsibilities for the Audit
of the Parent Company Financial Statements section of our report. We are independent of the Parent
Company in accordance with the Code of Ethics for Professional Accountants in the Philippines (Code of
Ethics) together with the ethical requirements that are relevant to our audit of the parent company
financial statements in the Philippines, and we have fulfilled our other ethical responsibilities in
accordance with these requirements and the Code of Ethics. We believe that the audit evidence we have
obtained is sufficient and appropriate to provide a basis for our opinion.
Responsibilities of Management and Those Charged with Governance for the Parent CompanyFinancial Statements
Management is responsible for the preparation and fair presentation of the parent company financialstatements in accordance with PFRSs, and for such internal control as management determines isnecessary to enable the preparation of parent company financial statements that are free from materialmisstatement, whether due to fraud or error.
In preparing the parent company financial statements, management is responsible for assessing theParent Company’s ability to continue as a going concern, disclosing, as applicable, matters related togoing concern and using the going concern basis of accounting unless management either intends toliquidate the Parent Company or to cease operations, or has no realistic alternative but to do so.
Those charged with governance are responsible for overseeing the Parent Company’s financial reportingprocess.
SyCip Gorres Velayo & Co.6760 Ayala Avenue1226 Makati CityPhilippines
Tel: (632) 891 0307Fax: (632) 819 0872ey.com/ph
BOA/PRC Reg. No. 0001, October 4, 2018, valid until August 24, 2021SEC Accreditation No. 0012-FR-5 (Group A), November 6, 2018, valid until November 5, 2021
A member firm of Ernst & Young Global Limited

*SGVFS039490*
- 2 -
Auditor’s Responsibilities for the Audit of the Parent Company Financial Statements
Our objectives are to obtain reasonable assurance about whether the parent company financial
statements as a whole are free from material misstatement, whether due to fraud or error, and to issue an
auditor’s report that includes our opinion. Reasonable assurance is a high level of assurance, but is not a
guarantee that an audit conducted in accordance with PSAs will always detect a material misstatement
when it exists. Misstatements can arise from fraud or error and are considered material if, individually or
in the aggregate, they could reasonably be expected to influence the economic decisions of users taken
on the basis of these parent company financial statements.
As part of an audit in accordance with PSAs, we exercise professional judgment and maintain
professional skepticism throughout the audit. We also:
· Identify and assess the risks of material misstatement of the parent company financial statements,whether due to fraud or error, design and perform audit procedures responsive to those risks, andobtain audit evidence that is sufficient and appropriate to provide a basis for our opinion. The risk ofnot detecting a material misstatement resulting from fraud is higher than for one resulting from error,as fraud may involve collusion, forgery, intentional omissions, misrepresentations, or the override ofinternal control.
· Obtain an understanding of internal control relevant to the audit in order to design audit proceduresthat are appropriate in the circumstances, but not for the purpose of expressing an opinion on theeffectiveness of the Parent Company’s internal control.
· Evaluate the appropriateness of accounting policies used and the reasonableness of accountingestimates and related disclosures made by management.
· Conclude on the appropriateness of management’s use of the going concern basis of accounting and,based on the audit evidence obtained, whether a material uncertainty exists related to events orconditions that may cast significant doubt on the Parent Company’s ability to continue as a goingconcern. If we conclude that a material uncertainty exists, we are required to draw attention in ourauditor’s report to the related disclosures in the parent company financial statements or, if suchdisclosures are inadequate, to modify our opinion. Our conclusions are based on the audit evidenceobtained up to the date of our auditor’s report. However, future events or conditions may cause theParent Company to cease to continue as a going concern.
· Evaluate the overall presentation, structure and content of the parent company financial statements,including the disclosures, and whether the parent company financial statements represent theunderlying transactions and events in a manner that achieves fair presentation.
We communicate with those charged with governance regarding, among other matters, the plannedscope and timing of the audit and significant audit findings, including any significant deficiencies ininternal control that we identify during our audit.
We also provide those charged with governance with a statement that we have complied with relevantethical requirements regarding independence, and to communicate with them all relationships and othermatters that may reasonably be thought to bear on our independence, and where applicable, relatedsafeguards.
A member firm of Ernst & Young Global Limited

*SGVFS039490*
- 3 -
Report on the Supplementary Information Required Under Revenue Regulations 15-2010
Our audits were conducted for the purpose of forming an opinion on the parent company financialstatements taken as a whole. The supplementary information required under Revenue Regulations15-2010 in Note 31 to the parent company financial statements is presented for purposes of filing with theBureau of Internal Revenue and is not a required part of the basic parent company financial statements.Such information is the responsibility of the management of Ayala Corporation. The information has beensubjected to the auditing procedures applied in our audit of the basic parent company financialstatements. In our opinion, the information is fairly stated, in all material respects, in relation to the basicparent company financial statements taken as a whole.
The engagement partner on the audit resulting in this independent auditor’s report is Lucy L. Chan.
SYCIP GORRES VELAYO & CO.
Lucy L. ChanPartnerCPA Certificate No. 88118SEC Accreditation No. 0114-AR-5 (Group A), November 16, 2018, valid until November 15, 2021Tax Identification No. 152-884-511BIR Accreditation No. 08-001998-46-2018, February 26, 2018, valid until February 25, 2021
PTR No. 8125221, January 7, 2020, Makati City
March 12, 2020
A member firm of Ernst & Young Global Limited

*SGVFS039490*
AYALA CORPORATION
PARENT COMPANY STATEMENTS OF FINANCIAL POSITION(Amounts in Thousands)
December 31
2019 2018
ASSETS
Current AssetsCash and cash equivalents (Notes 4, 21 and 24) P=7,252,450 P=3,537,096Short-term investments (Notes 4, 21 and 24) 25,318 25,844Accounts and notes receivable (Notes 5, 21 and 24) 343,393 1,616,874Other current assets (Note 6) 5,859 8,032
Total Current Assets 7,627,020 5,187,846
Noncurrent AssetsNoncurrent accounts and notes receivable (Notes 5 and 24) 428,515 411,435Investments in subsidiaries, associates and joint ventures (Note 7) 193,377,477 183,652,654Investment properties (Note 8) 1,109,980 1,130,861Financial assets at fair value through other comprehensive income
(OCI) (Notes 9 and 24) 534,470 508,211Service concession assets (Note 10) 1,740,561 1,817,474Property and equipment (Note 11) 283,931 352,760Other noncurrent assets (Note 6) 929,734 718,507
Total Noncurrent Assets 198,404,668 188,591,902
P=206,031,688 P=193,779,748
LIABILITIES AND EQUITY
Current LiabilitiesAccounts payable and accrued expenses (Notes 13, 21 and 24) P=2,345,335 P=3,148,918Dividends payable (Notes 16 and 21) 3,860,742 3,466,986Current portion of:
Long-term debt (Notes 15, 21 and 24) 4,387,500 525,500Provision for maintenance obligation (Note 12) 13,606 11,396
Income tax payable (Note 19) 15,307 10,764Other current liabilities (Notes 14, 21 and 24) 2,081,269 1,797,592
Total Current Liabilities 12,703,759 8,961,156
Noncurrent LiabilitiesLong-term debt (Notes 15, 21 and 24) 61,156,566 66,642,481Pension liability (Note 22) 836,848 437,153Provision for maintenance obligation - net of current portion (Note 12) 52,413 35,455
Total Noncurrent Liabilities 62,045,827 67,115,089
74,749,586 76,076,245
EquityPaid-in capital (Note 16) 84,876,225 83,361,675Share-based payments (Note 23) 214,617 238,871Remeasurement gains and losses arising on defined benefit pension
plan (Note 22) (648,611) (214,619)Fair value reserve of financial assets through OCI (Note 9) 305,675 282,726Retained earnings (Note 16) 52,272,092 36,334,850Treasury stock (Note 16) (5,737,896) (2,300,000)
Total Equity 131,282,102 117,703,503
P=206,031,688 P=193,779,748
See accompanying Notes to Parent Company Financial Statements.

*SGVFS039490*
AYALA CORPORATION
PARENT COMPANY STATEMENTS OF INCOME(Amounts in Thousands)
Years Ended December 31
2019 2018
REVENUE
Revenue from contracts with customers (Note 18) P=945,675 P=915,963
Dividends (Note 21) 13,570,687 11,621,993
14,516,362 12,537,956
COSTS AND EXPENSES
General and administrative (Note 17) 5,763,347 3,115,185
Depreciation and amortization (Notes 8, 10 and 11) 260,941 294,844
6,024,288 3,410,029
OTHER INCOME (EXPENSE)
Other income (Note 17) 17,542,411 691,461
Interest and other financing charges (Notes 12, 15, 17 and 21) (4,008,126) (3,663,101)
Interest income (Notes 4, 5, 17 and 21) 493,991 212,988
Other expenses (Notes 7, 10 and 18) (30,756) (6,931)
13,997,520 (2,765,583)
INCOME BEFORE INCOME TAX 22,489,594 6,362,344
PROVISION FOR INCOME TAX (Note 19) 107,086 41,297
NET INCOME P=22,382,508 P=6,321,047
EARNINGS PER SHARE (Note 20)
Basic P=33.61 P=8.05
Diluted P=33.54 P=8.02
See accompanying Notes to Parent Company Financial Statements.

*SGVFS039490*
AYALA CORPORATION
PARENT COMPANY STATEMENTS OF COMPREHENSIVE INCOME(Amounts in Thousands)
Years Ended December 31
2019 2018
NET INCOME P=22,382,508 P=6,321,047
OTHER COMPREHENSIVE INCOME
Items that will not be reclassified to profit or loss: Remeasurement loss arising on defined benefit
pension plans (Note 22) (433,992) (251,502) Unrealized fair value gains on financial assets at fair value
through OCI (Note 9) 41,911 81,812
(392,081) (169,690)
TOTAL COMPREHENSIVE INCOME P=21,990,427 P=6,151,357
See accompanying Notes to Parent Company Financial Statements.
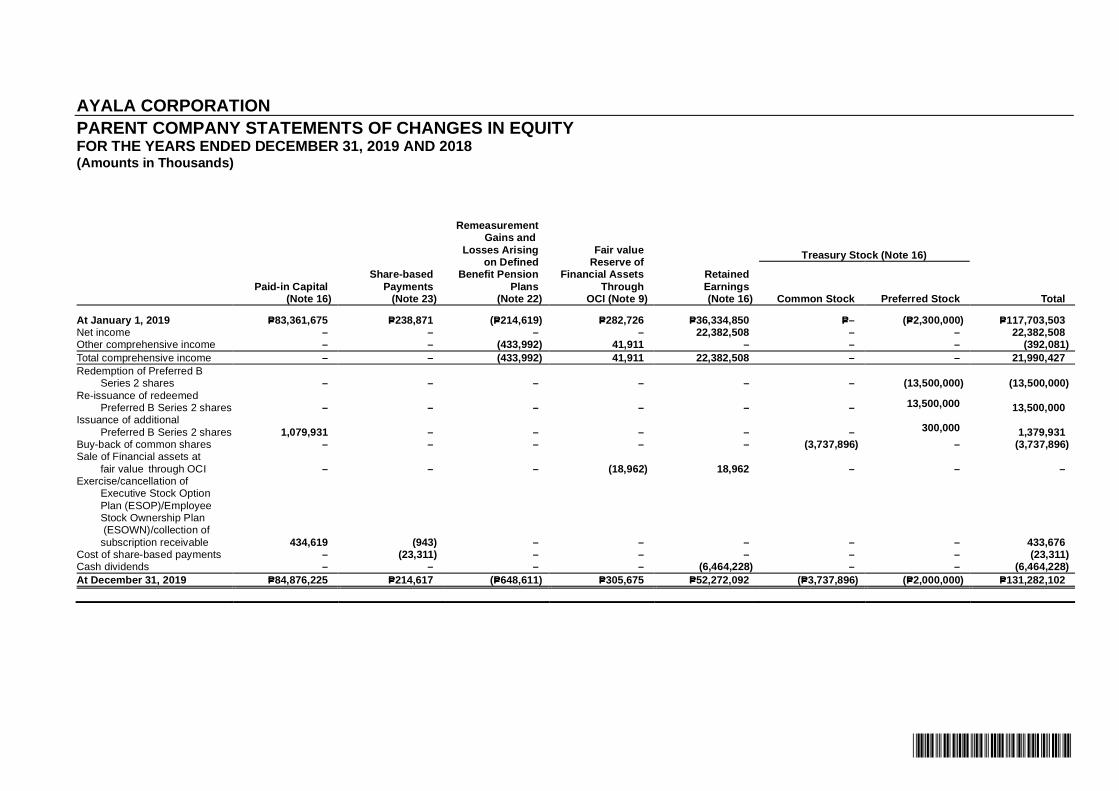
*SGVFS039490*
AYALA CORPORATION
PARENT COMPANY STATEMENTS OF CHANGES IN EQUITYFOR THE YEARS ENDED DECEMBER 31, 2019 AND 2018(Amounts in Thousands)
Paid-in Capital(Note 16)
Share-based
Payments(Note 23)
RemeasurementGains and
Losses Arisingon Defined
Benefit Pension
Plans(Note 22)
Fair valueReserve of
Financial Assets
Through OCI (Note 9)
Retained
Earnings(Note 16)
Treasury Stock (Note 16)
TotalCommon Stock Preferred Stock
At January 1, 2019 P=83,361,675 P=238,871 (P=214,619) P=282,726 P=36,334,850 P=– (P=2,300,000) P=117,703,503Net income – – – – 22,382,508 – – 22,382,508Other comprehensive income – – (433,992) 41,911 – – – (392,081)
Total comprehensive income – – (433,992) 41,911 22,382,508 – – 21,990,427
Redemption of Preferred BSeries 2 shares – – – – – – (13,500,000) (13,500,000)
Re-issuance of redeemedPreferred B Series 2 shares – – – – – – 13,500,000 13,500,000
Issuance of additional
Preferred B Series 2 shares 1,079,931 – – – – – 300,000 1,379,931Buy-back of common shares – – – – – (3,737,896) – (3,737,896)Sale of Financial assets at
fair value through OCI – – – (18,962) 18,962 – – –Exercise/cancellation of
Executive Stock Option
Plan (ESOP)/EmployeeStock Ownership Plan (ESOWN)/collection of
subscription receivable 434,619 (943) – – – – – 433,676Cost of share-based payments – (23,311) – – – – – (23,311)Cash dividends – – – – (6,464,228) – – (6,464,228)
At December 31, 2019 P=84,876,225 P=214,617 (P=648,611) P=305,675 P=52,272,092 (P=3,737,896) (P=2,000,000) P=131,282,102

*SGVFS039490*
- 2-
Paid-in Capital
(Note 16)
Share-basedPayments
(Note 23)
RemeasurementGains and
Losses Arising
on DefinedBenefit Pension
Plans
(Note 22)
Fair value
Reserve ofFinancial Assets
Through
OCI (Note 9)
RetainedEarnings
(Note 16)
TreasuryStock
(Note 16) Total
For the year ended December 31, 2018
As of January 1, 2018 P=75,001,174 P=248,212 P=36,883 P=212,460 P=35,620,731 (P=2,300,000) P=108,819,460Net income – – – – 6,321,047 – 6,321,047Other comprehensive income – – (251,502) 81,812 – – (169,690)
Total comprehensive income – – (251,502) 81,812 6,321,047 – 6,151,357
Issuance of new shares 8,056,257 – – – – – 8,056,257Sale of Financial assets at fair value through OCI – – – (11,546) 11,546 – –
Exercise/cancellation of Executive Stock OptionPlan (ESOP)/Employee Stock OwnershipPlan (ESOWN) 304,244 (340) – – – – 303,904
Cost of share-based payments – (9,001) – – – – (9,001)Cash dividends – – – – (5,618,474) – (5,618,474)
At December 31, 2018 P=83,361,675 P=238,871 (P=214,619) P=282,726 P=36,334,850 (P=2,300,000) P=117,703,503
See accompanying Notes to Parent Company Financial Statements.

*SGVFS039490*
AYALA CORPORATION
PARENT COMPANY STATEMENTS OF CASH FLOWS(Amounts in Thousands)
Years Ended December 31
2019 2018
CASH FLOWS FROM OPERATING ACTIVITIESIncome before income tax P=22,489,594 P=6,362,344Adjustments for: Dividend income (Note 21) (13,570,687) (11,621,993) Interest expense (Note 18) 3,994,476 3,654,648 Depreciation and amortization (Notes 8, 10 and 11) 260,941 294,844 Pension expense (Note 22) 209,835 224,557
Expected maintenance expense on service concession(Note 12) 16,538 15,139
Provision for impairment losses on subsidiaries, associates andjoint ventures (Notes 7 and 18) 2,503,000 –
Interest income (Note 18) (493,991) (212,988) Loss on retirement of property and equipment (Note 11) – 511 Loss on retirement of service concession assets (Note 10) – 121 Loss (gain) on sale/return of: Investments in subsidiaries, associates and joint venture - net (Notes 7 and 18) (17,035,763) (386,088) Investment properties (Notes 8 and 18) (290,826) (100,940) Property and equipment (Notes 11 and 18) (3,372) (4,793) Share-based payments (Notes 18, 21 and 23) 135,946 126,324
Operating loss before changes in working capital (1,784,309) (1,648,314)Changes in working capital: Decrease (increase) in: Accounts and notes receivable 167,125 (196,994) Other current and noncurrent assets (200,152) (58,615) Decrease in accounts and other payables (49,844) (267,103)
Net cash used in operations (2,625,312) (2,563,858)Interest received 488,314 211,283Interest paid (3,941,400) (3,309,660)Income tax paid (102,543) (44,876)Contribution to pension fund (Note 22) (214,492) (174,086)
Net cash used in operating activities (5,637,301) (5,488,365)
CASH FLOWS FROM INVESTING ACTIVITIESDividends received from subsidiaries, associates and joint ventures 14,817,565 11,465,173Proceeds from:
Disposal of shares of subsidiaries (Note 7) 16,256,299 –Partial return of capital from subsidiaries (Note 7) 5,784,900 –Sale of investment properties (Note 8) 149,892 100,940Sale of property and equipment (Note 11) 18,445 21,939Disposal of financial assets at FVOCI (Note 9) 16,739 11,655Short-term investments (Note 4) 526 2,864
(Forward)

*SGVFS039490*
- 2 -
Years Ended December 31
2019 2018
Additions to:
Investments in subsidiaries, associates and
joint ventures (Note 7) (P=17,707,714) (P=27,205,052)
Property and equipment (Note 11) (88,425) (79,699)
Service concession assets (Notes 10 and 28) (29,571) (6,931)
Financial assets at FVOCI (Note 9) (3,473) –
Net cash provided (used in) by investing activities 19,215,183 (15,689,111)
CASH FLOWS FROM FINANCING ACTIVITIES
Proceeds from:
Re-issuance of preferred shares (Note 15) 15,000,000 –
Availment of long-term debt (Note 15) 13,440,090 24,193,948
Collections of subscription receivable (Note 16) 274,677 168,579
Issuance of common shares (Note 16) – 8,069,960
Payment of long-term debt (15,148,600) (6,109,250)
Redemption of preferred shares (13,500,000) –
Cash dividends paid (6,070,472) (5,407,797)
Purchase of common shares (3,737,896) –
Costs of issuance of shares (120,327) (13,703)
Net cash provided by (used in) financing activities (9,862,528) 20,901,737
NET INCREASE (DECREASE) IN CASH AND CASHEQUIVALENTS 3,715,354 (275,739)
CASH AND CASH EQUIVALENTS AT BEGINNING OF YEAR 3,537,096 3,812,835
CASH AND CASH EQUIVALENTS AT END OF YEAR (Note 4) P=7,252,450 P=3,537,096
See accompanying Notes to Parent Company Financial Statements.

*SGVFS039490*
AYALA CORPORATION
NOTES TO PARENT COMPANY FINANCIAL STATEMENTS
1. Corporate Information
Ayala Corporation (the Parent Company) is incorporated in the Republic of the Philippines onJanuary 23, 1968. On April 15, 2016, during the annual meeting of its stockholders, the stockholdersratified the amendment of the Fourth Article of the Articles of Incorporation (AOI) to extend thecorporate term for 50 years from January 23, 2018. The amendment to the AOI was approved by theSecurities and Exchange Commission (SEC) on April 5, 2017. The Parent Company’s registeredoffice address and principal place of business is 32F-35F, Tower One and Exchange Plaza, AyalaTriangle, Ayala Avenue, Makati City. The Parent Company is a publicly listed company which is47.33% owned by Mermac, Inc. and the rest by the public.
The Parent Company is the holding company of the Ayala Group of Companies (the Group), withprincipal business interests in real estate and hotels, financial services and insurance,telecommunications, water infrastructure, electronics solutions and manufacturing, industrialtechnologies, automotive, transport infrastructure, power generation, education, healthcare,international real estate and others.
The parent company financial statements were endorsed for approval by the audit committee onMarch 6, 2020 and authorized for issue by the Board of Directors (BOD) on March 12, 2020.
2. Summary of Significant Accounting Policies
Basis of PreparationThe accompanying parent company financial statements have been prepared on a historical costbasis, except for financial assets at fair value through OCI that have been measured at fair value.The parent company financial statements are presented in Philippine Peso (P=), which is the ParentCompany’s functional currency and all values are rounded to the nearest thousand pesos (P=000)unless otherwise indicated.
Statement of ComplianceThe financial statements of the Parent Company, which are prepared for submission to the PhilippineSEC and the Bureau of Internal Revenue (BIR), have been prepared in compliance with PhilippineFinancial Reporting Standards (PFRSs). PFRSs include Philippine Financial Reporting Standards,Philippine Accounting Standards and Interpretations issued by the Philippine InterpretationsCommittee (PIC). The Parent Company also prepares and issues consolidated financial statementspresented in compliance with PFRSs, which include the availment of the relief granted by the SECunder Memorandum Circular Nos. 14-2018 and 3-2019 as of 2018 for the following implementationissues of PFRS 15 affecting the real estate industry:a. Exclusion of land in the determination of percentage of completion (POC) discussed in PIC Q&A
No. 2018-12-Eb. Accounting for significant financing component discussed in PIC Q&A No. 2018-12-Dc. Accounting to Common Usage Service Area (CUSA) Charges discussed in PIC Q&A No. 2018-
12-Hd. Adoption of PIC Q&A No. 2018-14: PFRS 15 – Accounting for Cancellation of Real Estate Sales
PFRSs include Philippine Financial Reporting Standards, Philippine Accounting Standards andInterpretations issued by the Philippine Interpretations Committee (PIC).
Changes in Accounting Policies and DisclosuresAdoption of New and Amended Accounting Standards and InterpretationsThe accounting policies adopted in the preparation of the parent company financial statements areconsistent with those of the previous financial years except for the new PFRS, amended PFRS and

- 2 -
*SGVFS039490*
improvements to PFRS which were adopted beginning January 1, 2019. The nature and the impactof each new standards and amendments is described below:
PFRS 16, LeasesPFRS 16 supersedes PAS 17, Leases, IFRIC 4, Determining whether an Arrangement contains aLease, SIC-15, Operating Leases-Incentives and SIC-27, Evaluating the Substance of TransactionInvolving the Legal Form of a Lease. The standard sets out the principles for the recognition,measurement, presentation and disclosure of leases and requires lessees to recognize most leaseson the balance sheet.Lessor accounting under PFRS 16 is substantially unchanged from PAS 17. Lessors will continue toclassify leases as either operating of finance leases using similar principles in PAS 17. Therefore,PFRS 16 does not have an impact for leases where the Parent Company is the lessor.
The Parent Company adopted PFRS 16, with the date of initial application of January 1, 2019. TheParent Company elected to use the recognition exemptions for lease contracts that, at thecommencement date, have a lease term of 12 months or less and do not contain a purchase option(short-term leases).
Upon adoption, there are no material impact on the Parent Company’s financial statements as alllease contracts in which the Parent Company is the lessee are all short-term leases and do notcontain purchase options.
Philippine Interpretation IFRIC-23, Uncertainty over Income Tax TreatmentsThe interpretation addresses the accounting for income taxes when tax treatments involve uncertaintythat affects the application of PAS 12, Income Taxes. It does not apply to taxes or levies outside thescope of PAS 12, nor does it specifically include requirements relating to interest and penaltiesassociated with uncertain tax treatments. The interpretation specifically addresses the following:
· Whether an entity considers uncertain tax treatments separately
· The assumptions an entity makes about the examination of tax treatments by taxation authorities
· How an entity determines taxable profit (tax loss), tax bases, unused tax losses, unused taxcredits and tax rates
· How an entity considers changes in the facts and circumstances
The Parent Company determines whether to consider each uncertain tax treatment separately ortogether with one or more other uncertain tax treatments and uses the approach that better predictsthe resolution of the uncertainty.
Upon adoption of the interpretation, the Parent Company considered whether it has any uncertain taxpositions, particularly those relating to gain on sale of investments. The Parent Company obtained alegal tax opinion and filed for the BIR ruling confirming the non-recognition of gain or loss on themerger pursuant to the provisions of Section 40(c)(2) and Section 199(m) of the Philippine Tax Code.Based on these, the Parent Company determined that it is probable that its tax treatments will beaccepted by the taxation authorities. The interpretation did not have an impact on the financialstatements of the Parent Company.
Amendments to PFRS 9, Prepayment Features with Negative CompensationUnder PFRS 9, a debt instrument can be measured at amortized cost or at fair value through OCIprovided that the contractual cash flows are ‘solely payments of principal and interest on the principalamount outstanding’ (the SPPI criterion) and the instrument is held within the appropriate businessmodel for that classification. The amendments to PFRS 9 clarify that a financial asset passes theSPPI criterion regardless of the event or circumstance that causes the early termination of thecontract and irrespective of which party pays or receives reasonable compensation for the earlytermination of the contract.
These amendments had no impact on the financial statements of the Parent Company.

- 3 -
*SGVFS039490*
Amendments to PAS 19, Employee Benefits, Plan Amendment, Curtailment or SettlementThe amendments to PAS 19 address the accounting when a plan amendment, curtailment orsettlement occurs during a reporting period. The amendments specify that when a plan amendment,curtailment or settlement occurs during the annual reporting period, an entity is required to:
· Determine current service cost for the remainder of the period after the plan amendment,curtailment or settlement, using the actuarial assumptions used to remeasure the net definedbenefit liability (asset) reflecting the benefits offered under the plan and the plan assets after thatevent
· Determine net interest for the remainder of the period after the plan amendment, curtailment orsettlement using: the net defined benefit liability (asset) reflecting the benefits offered under theplan and the plan assets after that event; and the discount rate used to remeasure that netdefined benefit liability (asset).
The amendments also clarify that an entity first determines any past service cost, or a gain or loss onsettlement, without considering the effect of the asset ceiling. This amount is recognized in profit orloss. An entity then determines the effect of the asset ceiling after the plan amendment, curtailmentor settlement. Any change in that effect, excluding amounts included in the net interest, is recognizedin OCI.
The amendments had no impact on the financial statements of the Parent Company as it did not haveany plan amendments, curtailments, or settlements during the period.
Amendments to PAS 28, Long-term Interests in Associates and Joint VenturesThe amendments clarify that an entity applies PFRS 9 to long-term interests in an associate or jointventure to which the equity method is not applied but that, in substance, form part of the netinvestment in the associate or joint venture (long-term interests). This clarification is relevant becauseit implies that the expected credit loss model in PFRS 9 applies to such long-term interests.
The amendments also clarified that, in applying PFRS 9, an entity does not take account of anylosses of the associate or joint venture, or any impairment losses on the net investment, recognizedas adjustments to the net investment in the associate or joint venture that arise from applyingPAS 28, Investments in Associates and Joint Ventures.
These amendments had no impact on the financial statements as the Parent Company does not havelong-term interests in its associate and joint venture.
Annual Improvements to PFRSs 2015-2017 Cycle
· Amendments to PFRS 3, Business Combinations, and PFRS 11, Joint Arrangements, PreviouslyHeld Interest in a Joint OperationThe amendments clarify that, when an entity obtains control of a business that is a jointoperation, it applies the requirements for a business combination achieved in stages, includingremeasuring previously held interests in the assets and liabilities of the joint operation at fairvalue. In doing so, the acquirer remeasures its entire previously held interest in the jointoperation.
A party that participates in, but does not have joint control of, a joint operation might obtain jointcontrol of the joint operation in which the activity of the joint operation constitutes a business asdefined in PFRS 3. The amendments clarify that the previously held interests in that jointoperation are not remeasured.
· An entity applies those amendments to business combinations for which the acquisition date is onor after the beginning of the first annual reporting period beginning on or afterJanuary 1, 2019 and to transactions in which it obtains joint control on or after the beginning ofthe first annual reporting period beginning on or after January 1, 2019, with early application

- 4 -
*SGVFS039490*
permitted. These amendments had no impact on the financial statements of the Parent Companyas there is no transaction where joint control is obtained.
· Amendments to PAS 12, Income Tax Consequences of Payments on Financial InstrumentsClassified as EquityThe amendments clarify that the income tax consequences of dividends are linked more directlyto past transactions or events that generated distributable profits than to distributions to owners.Therefore, an entity recognizes the income tax consequences of dividends in profit or loss, othercomprehensive income or equity according to where the entity originally recognized those pasttransactions or events.An entity applies those amendments for annual reporting periods beginning on or after January 1,2019, with early application is permitted. These amendments had no impact on the financialstatements of the Parent Company because dividends declared by the Parent Company do notgive rise to tax obligations under the current tax laws.
· Amendments to PAS 23, Borrowing Costs, Borrowing Costs Eligible for CapitalizationThe amendments clarify that an entity treats as part of general borrowings any borrowingoriginally made to develop a qualifying asset when substantially all of the activities necessary toprepare that asset for its intended use or sale are complete.
An entity applies those amendments to borrowing costs incurred on or after the beginning of theannual reporting period in which the entity first applies those amendments. An entity appliesthose amendments for annual reporting periods beginning on or after January 1, 2019, with earlyapplication permitted.
Since the Parent Company has no qualifying assets, they had no impact on the financialstatements of the Parent Company.
Standards and Interpretation Issued but not yet Effective
Effective beginning on or after January 1, 2020
· Amendments to PFRS 3, Definition of a BusinessThe amendments to PFRS 3 clarify the minimum requirements to be a business, remove theassessment of a market participant’s ability to replace missing elements, and narrow thedefinition of outputs. The amendments also add guidance to assess whether an acquiredprocess is substantive and add illustrative examples. An optional fair value concentration test isintroduced which permits a simplified assessment of whether an acquired set of activities andassets is not a business.
An entity applies those amendments prospectively for annual reporting periods beginning on orafter January 1, 2020, with earlier application permitted.
These amendments will apply on future business combinations of the Parent Company.
· Amendments to PAS 1, Presentation of Financial Statements, and PAS 8, Accounting Policies,Changes in Accounting Estimates and Errors, Definition of MaterialThe amendments refine the definition of material in PAS 1 and align the definitions used acrossPFRSs and other pronouncements. They are intended to improve the understanding of theexisting requirements rather than to significantly impact an entity’s materiality judgements.
An entity applies those amendments prospectively for annual reporting periods beginning on orafter January 1, 2020, with earlier application permitted.

- 5 -
*SGVFS039490*
Effective beginning on or after January 1, 2021
· PFRS 17, Insurance ContractsPFRS 17 is a comprehensive new accounting standard for insurance contracts coveringrecognition and measurement, presentation and disclosure. Once effective, PFRS 17 will replacePFRS 4, Insurance Contracts. This new standard on insurance contracts applies to all types ofinsurance contracts (i.e., life, non-life, direct insurance and re-insurance), regardless of the typeof entities that issue them, as well as to certain guarantees and financial instruments withdiscretionary participation features. A few scope exceptions will apply.
The overall objective of PFRS 17 is to provide an accounting model for insurance contracts that ismore useful and consistent for insurers. In contrast to the requirements in PFRS 4, which arelargely based on grandfathering previous local accounting policies, PFRS 17 provides acomprehensive model for insurance contracts, covering all relevant accounting aspects. The coreof PFRS 17 is the general model, supplemented by:
· A specific adaptation for contracts with direct participation features (the variable feeapproach)
· A simplified approach (the premium allocation approach) mainly for short-duration contracts
PFRS 17 is effective for reporting periods beginning on or after January 1, 2021, withcomparative figures required. Early application is permitted. These amendments will have noimpact on the Parent Company’s financial statements as the Parent Company does not haveinsurance contracts.
Deferred effectivity
· Amendments to PFRS 10, Consolidated Financial Statements, and PAS 28, Sale or Contributionof Assets between an Investor and its Associate or Joint VentureThe amendments address the conflict between PFRS 10 and PAS 28 in dealing with the loss ofcontrol of a subsidiary that is sold or contributed to an associate or joint venture. Theamendments clarify that a full gain or loss is recognized when a transfer to an associate or jointventure involves a business as defined in PFRS 3. Any gain or loss resulting from the sale orcontribution of assets that does not constitute a business, however, is recognized only to theextent of unrelated investors’ interests in the associate or joint venture.
On January 13, 2016, the Financial Reporting Standards Council deferred the original effectivedate of January 1, 2016 of the said amendments until the International Accounting StandardsBoard (IASB) completes its broader review of the research project on equity accounting that mayresult in the simplification of accounting for such transactions and of other aspects of accountingfor associates and joint ventures.
Significant Accounting PoliciesThe significant accounting policies that have been used in the preparation of the parent companyfinancial statements are summarized below. These policies have been consistently applied to all theyears presented, unless otherwise stated.
Current versus Noncurrent ClassificationThe Parent Company presents assets and liabilities in the parent company statement of financialposition based on a current and noncurrent classification. An asset is current when it is:
· Expected to be realized or intended to be sold or consumed in normal operating cycle;
· Held primarily for the purpose of trading;
· Expected to be realized within twelve months after the reporting period; or,
· Cash or cash equivalent, unless restricted from being exchanged or used to settle a liability for atleast twelve months after the reporting period.
All other assets are classified as noncurrent.

- 6 -
*SGVFS039490*
A liability is current when:
· It is expected to be settled in normal operating cycle;
· It is held primarily for the purpose of trading;
· It is due to be settled within twelve months after the reporting period; or,
· There is no unconditional right to defer the settlement of the liability for at least twelve monthsafter the reporting period.
All other liabilities are classified as noncurrent.Deferred tax assets and liabilities are classified as noncurrent assets and liabilities.
Cash and Cash EquivalentsCash includes cash on hand and in banks. Cash equivalents are short-term, highly liquid investmentsthat are readily convertible to known amounts of cash with original maturities of three months or lessfrom dates of acquisition and which are subject to an insignificant risk of change in value.
Short-term InvestmentsShort-term investments are short-term placements with maturities of more than three months but lessthan one year from the date of acquisition. These earn interest at the respective short-terminvestment rates.
Financial InstrumentsA financial instrument is any contract that gives rise to a financial asset of one entity and a financialliability or equity instrument of another entity.
Initial recognition and measurementFinancial assets are classified, at initial recognition, as amortised cost, fair value through OCI, andFVPL.
The classification of financial assets at initial recognition depends on the financial asset’s contractualcash flow characteristics and the Parent Company’s business model for managing them. With theexception of trade receivables that do not contain a significant financing component or for which theParent Company has applied the practical expedient, the Parent Company initially measures afinancial asset at its fair value plus, in the case of a financial asset not at fair value through profit orloss, transaction costs. Trade receivables that do not contain a significant financing component or forwhich the Parent Company has applied the practical expedient are measured at the transaction pricedetermined under PFRS 15. Refer to the accounting policies under revenue from contracts withcustomers.
In order for a financial asset to be classified and measured at amortised cost or fair value throughOCI, it needs to give rise to cash flows that are SPPI on the principal amount outstanding. Thisassessment is referred to as the SPPI test and is performed at an instrument level.
The Parent Company’s business model for managing financial assets refers to how it manages itsfinancial assets in order to generate cash flows. The business model determines whether cash flowswill result from collecting contractual cash flows, selling the financial assets, or both.
Purchases or sales of financial assets that require delivery of assets within a time frame establishedby regulation or convention in the market place (regular way trades) are recognized on the trade date,i.e., the date that the Parent Company commits to purchase or sell the asset.
Subsequent measurementFor purposes of subsequent measurement, financial assets are classified in four categories:
· Financial asets at amortised cost (debt instruments)
· Financial assets at fair value through OCI with recycling of cumulative gains and losses (debtinstruments)

- 7 -
*SGVFS039490*
· Financial assets designated at fair value through OCI with no recycling of cumulative gains andlosses upon derecognition (equity instruments)
· Financial assets at fair value through profit or loss (FVPL)
Financial assets at amortised cost (debt instruments)This category is the most relevant to the Parent Company. The Parent Company measures financialassets at amortised cost if both of the following conditions are met:
· The financial asset is held within a business model with the objective to hold financial assets inorder to collect contractual cash flows; and
· The contractual terms of the financial asset give rise on specified dates to cash flows that areSPPI on the principal amount outstanding.
Financial assets at amortised cost are subsequently measured using the effective interest (EIR)method and are subject to impairment. Gains and losses are recognized in profit or loss when theasset is derecognized, modified or impaired.
The Parent Company’s financial assets at amortised cost includes cash and cash equivalents, short-term investments, and accounts and notes receivable.
Financial assets at fair value through OCI (debt instruments)The Parent Company measures debt instruments at fair value through OCI if both of the followingconditions are met:
· The financial asset is held within a business model with the objective of both holding to collectcontractual cash flows and selling; and
· The contractual terms of the financial asset give rise on specified dates to cash flows that areSPPI on the principal amount outstanding.
For debt instruments at fair value through OCI, interest income, foreign exchange revaluation andimpairment losses or reversals are recognized in the parent company statement of income andcomputed in the same manner as for financial assets measured at amortised cost. The remaining fairvalue changes are recognized in OCI. Upon derecognition, the cumulative fair value changesrecognized in OCI are recycled to profit or loss.
The Parent Company does not have any financial assets under this category.
Financial assets designated at fair value through OCI (equity instruments)Upon initial recognition, the Parent Company can elect to classify irrevocably its equity investmentsas equity instruments designated at fair value through OCI when they meet the definition of equityunder PAS 32, Financial Instruments: Presentation and are not held for trading. The classification isdetermined on an instrument-by-instrument basis.
Gains and losses on these financial assets are never recycled to profit or loss. Dividends arerecognized as revenue from others in the parent company statement of income when the right ofpayment has been established, except when the Parent Company benefits from such proceeds as arecovery of part of the cost of the financial asset, in which case, such gains are recorded in OCI.Equity instruments designated at fair value through OCI are not subject to impairment assessment.
The Parent Company elected to classify irrevocably its listed and unquoted equity investments underthis category.
Financial assets at FVPLFinancial assets at FVPL include financial assets held for trading, financial assets designated uponinitial recognition at FVPL, or financial assets mandatorily required to be measured at fair value.Financial assets are classified as held for trading if they are acquired for the purpose of selling orrepurchasing in the near term. Derivatives, including separated embedded derivatives, are alsoclassified as held for trading unless they are designated as effective hedging instruments. Financialassets with cash flows that are not SPPI are classified and measured at FVPL, irrespective of the

- 8 -
*SGVFS039490*
business model. Notwithstanding the criteria for debt instruments to be classified at amortised cost orat fair value through OCI, as described above, debt instruments may be designated at FVPL on initialrecognition if doing so eliminates, or significantly reduces, an accounting mismatch.
Financial assets at FVPL are carried in the parent company statement of financial position at fairvalue with net changes in fair value recognized in the parent company statement of income.
The Parent Company does not have any financial assets carried at FVPL.
A derivative embedded in a hybrid contract, with a financial liability or non-financial host, is separatedfrom the host and accounted for as a separate derivative if: the economic characteristics and risks arenot closely related to the host; a separate instrument with the same terms as the embeddedderivative would meet the definition of a derivative; and the hybrid contract is not measured at FVPL.Embedded derivatives are measured at fair value with changes in fair value recognised in profit orloss. Reassessment only occurs if there is either a change in the terms of the contract thatsignificantly modifies the cash flows that would otherwise be required or a reclassification of afinancial asset out of the FVPL category.
A derivative embedded within a hybrid contract containing a financial asset host is not accounted forseparately. The financial asset host together with the embedded derivative is required to beclassified in its entirety as a financial asset at FVPL.
DerecognitionA financial asset (or, where applicable, a part of a financial asset or part of a group of similar financialassets) is primarily derecognized (i.e., removed from the parent company statement of financialposition) when:
· The rights to receive cash flows from the asset have expired; or
· The Parent Company has transferred its rights to receive cash flows from the asset or hasassumed an obligation to pay the received cash flows in full without material delay to a third partyunder a ‘pass-through’ arrangement; and either (a) the Parent Company has transferredsubstantially all the risks and rewards of the asset, or (b) the Parent Company has neithertransferred nor retained substantially all the risks and rewards of the asset, but has transferredcontrol of the asset.
When the Parent Company has transferred its rights to receive cash flows from an asset or hasentered into a pass-through arrangement, it evaluates if, and to what extent, it has retained the risksand rewards of ownership. When it has neither transferred nor retained substantially all of the risksand rewards of the asset, nor transferred control of the asset, the Parent Company continues torecognise the transferred asset to the extent of its continuing involvement. In that case, the ParentCompany also recognises an associated liability. The transferred asset and the associated liabilityare measured on a basis that reflects the rights and obligations that the Parent Company hasretained.
Continuing involvement that takes the form of a guarantee over the transferred asset is measured atthe lower of the original carrying amount of the asset and the maximum amount of consideration thatthe Parent Company could be required to repay.
Impairment of financial assetsFurther disclosures relating to impairment of financial assets are also provided in the following notes:
· Disclosures for significant assumptions (see Note 3)
· Equity instruments at fair value through OCI (see Note 9)
· Trade receivables (see Note 5)
For non-trade receivables, estimated credit losses (ECLs) are recognised in two stages. For creditexposures for which there has not been a significant increase in credit risk since initial recognition,ECLs are provided for credit losses that result from default events that are possible within the next12-months (a 12-month ECL). For those credit exposures for which there has been a significant

- 9 -
*SGVFS039490*
increase in credit risk since initial recognition, a loss allowance is required for credit losses expectedover the remaining life of the exposure, irrespective of the timing of the default (a lifetime ECL).
The Parent Company’s cash and cash equivalents and short-term investments with banks are gradedin the top investment category by Moody’s Investors Service and Fitch Ratings, Inc. and, therefore,are considered to be low credit risk investments. It is the Parent Company’s policy to measure ECLson such instruments on a 12-month basis. However, when there has been a significant increase incredit risk since origination, the allowance will be based on the lifetime ECL. The Parent Companyuses the ratings from the Moody’s Investors Service and Fitch Ratings, Inc. to determine whether thecash and cash equivalents and short-term investments with banks has significantly increased in creditrisk and to estimate ECLs.
For trade receivables, the Parent Company applies a simplified approach in calculating ECLs.Therefore, the Parent Company does not track changes in credit risk, but instead recognises a lossallowance based on lifetime ECLs at each reporting date. The Parent Company has established aprovision matrix that is based on its historical credit loss experience, adjusted for forward-lookingfactors specific to the debtors and the economic environment.
The Parent Company considers a financial asset in default when contractual payments are 90 dayspast due. However, in certain cases, the Parent Company may also consider a financial asset to bein default when internal or external information indicates that the Parent Company is unlikely toreceive the outstanding contractual amounts in full before taking into account any creditenhancements held by the Parent Company. A financial asset is written off when there is noreasonable expectation of recovering the contractual cash flows.
In assessing whether the credit risk on a financial instrument has increased significantly since initialrecognition, the Parent Company compares the risk of a default occurring on the financial instrumentas at the reporting date with the risk of a default occurring on the financial instrument as at the date ofinitial recognition. In making this assessment, the Parent Company considers both quantitative andqualitative information that is reasonable and supportable, including historical experience andforward-looking information that is available without undue cost or effort. Forward-looking informationconsidered includes the future prospects of the industries in which the Parent Company debtorsoperate, information obtained from economic expert reports, financial analysts, governmental bodies,relevant think-tanks and other similar organizations, as well as consideration of various externalsources of actual and forecast economic information that relate to the Parent Company coreoperations, which revolves on various industry fields.
In particular, the following information is taken into account when assessing whether credit risk hasincreased significantly since initial recognition:
· an actual or expected significant deterioration in the financial instrument’s external (if available) or
internal credit rating;
· existing or forecast adverse changes in business, financial or economic conditions that are
expected to cause a significant decrease in the debtor’s ability to meet its debt obligations;
· an actual or expected significant deterioration in the operating results of the debtor;
· an actual or expected significant adverse change in the regulatory, economic, or technological
environment of the debtor that results in a significant decrease in the debtor’s ability to meet its
debt obligations.
Irrespective of the outcome of the above assessment, the Parent Company presumes that the creditrisk on a financial asset has increased significantly since initial recognition when contractualpayments are more than 90 days past due, unless the Parent Company has reasonable andsupportable information that demonstrates otherwise.
The Parent Company regularly monitors the effectiveness of the criteria used to identify whether therehas been a significant increase in credit risk and revises them as appropriate to ensure that the

- 10 -
*SGVFS039490*
criteria are capable of identifying significant increase in credit risk before the amount becomes pastdue.
Financial liabilitiesInitial recognition and measurementFinancial liabilities are classified, at initial recognition, as financial liabilities at FVPL, loans andborrowings, payables, or as derivatives designated as hedging instruments in an effective hedge, asappropriate.
All financial liabilities are recognised initially at fair value and, in the case of loans and borrowings andpayables, net of directly attributable transaction costs.
The Parent Company’s financial liabilities include accounts payable and accrued expenses (otherthan output VAT payable), dividends payable, subscription payable, long term debt and financialguarantee obligation.
Subsequent measurementThe measurement of financial liabilities depends on their classification, as described below:
Financial liablities at FVPLFinancial liabilities at FVPL include financial liabilities held for trading and financial liabilitiesdesignated upon initial recognition as at FVPL.
Financial liabilities are classified as held for trading if they are incurred for the purposes ofrepurchasing in the near term. This category also includes derivative financial instruments enteredinto by the Parent Company that are not designated as hedging instruments in hedge relationships asdefined by PFRS 9. Separated embedded derivatives are also classified as held for trading unlessthey are designated as effective hedging instruments.
Gains or losses on liabilities held for trading are recognized in the parent company statement ofincome.
Financial liabilities designated upon initial recognition at FVPL are designated at the initial date ofrecognition, and only if the criteria in PFRS 9 are satisfied. The Parent Company has not designatedany financial liability as at FVPL.
Loans and borrowingsThis is the category most relevant to the Parent Company. After initial recognition, interest-bearingloans and borrowings are subsequently measured at amortised cost using the EIR method. Gainsand losses are recognised in profit or loss when the liabilities are derecognised as well as through theEIR amortisation process.
Amortised cost is calculated by taking into account any discount or premium on acquisition and feesor costs that are an integral part of the EIR. The EIR amortisation is included as interest and otherfinancing charges in the parent company statement of income.
This category generally applies to interest-bearing loans and borrowings. For more information, referto Note 15.
Other Financial LiabilitiesIssued financial instruments or their components, which are not designated at FVPL, are classified asaccounts payable and accrued expenses where the substance of the contractual arrangement resultsin the Parent Company having an obligation either to deliver cash or another financial asset to theholder, or to satisfy the obligation other than by the exchange of a fixed amount of cash or anotherfinancial asset for a fixed number of own equity shares. The components of issued financialinstruments that contain both liability and equity elements are accounted for separately, with the

- 11 -
*SGVFS039490*
equity component being assigned the residual amount, after deducting from the instrument theamount separately determined as the fair value of the liability component on the date of issue.
After initial measurement, other financial liabilities are subsequently measured at amortized costusing the effective interest rate method. Amortized cost is calculated by taking into account anydiscount or premium on the issue and fees that are an integral part of the effective interest rate. Anyeffect of restatement of foreign currency-denominated liabilities is recognized in profit or loss.
This accounting policy applies to the Parent Company’s accounts payable and accrued expenses,dividends payables and subscriptions payable (other than liabilities covered by other accountingstandards such as pension liability and income tax payable).
DerecognitionA financial liability is derecognised when the obligation under the liability is discharged or cancelled orexpires. When an existing financial liability is replaced by another from the same lender onsubstantially different terms, or the terms of an existing liability are substantially modified, such anexchange or modification is treated as the derecognition of the original liability and the recognition ofa new liability. The difference in the respective carrying amounts is recognised in the parent companystatement of income.
Financial guarantee contractsFinancial guarantee contracts are recognized initially as a liability at fair value, adjusted fortransaction costs that are directly attributable to the issuance of the guarantee. Subsequent to initialrecognition, financial guarantees are measured at the higher of the amount of ECL determined inaccordance with the policy set out in Note 25 and the amount initially recognised less, whenappropriate, the cumulative amount of income recognised over the period of the guarantee.
Offsetting Financial InstrumentsFinancial assets and financial liabilities are offset and the net amount reported in the parent companystatement of financial position if, and only if, there is a currently enforceable legal right to offset therecognized amounts and there is an intention to settle on a net basis, or to realize the asset and settlethe liability simultaneously. The Parent Company assesses that it has a currently enforceable right ofoffset if the right is not contingent on a future event, and is legally enforceable in the normal course ofbusiness, event of default, and event of insolvency or bankruptcy of the Parent Company and all ofthe counterparties.
Investments in Subsidiaries, Associates and Joint VenturesThe Parent Company’s investments in subsidiaries, associates and joint ventures are accounted forunder the cost method less accumulated provision for impairment losses, if any.
A subsidiary is an entity in which the Parent Company exercises control over the company. Control isachieved when the Parent Company is exposed, or has rights, to variable returns from its involvementwith the investee and has the ability to affect those returns through its power over the investee.Specifically, the Parent Company controls an investee if and only if the Parent Company has:a. Power over the investee (i.e. existing rights that give it the current ability to direct the relevant
activities of the investee)b. Exposure, or rights, to variable returns from its involvement with the investee, andc. The ability to use its power over the investee to affect its returns
When the Parent Company has less than a majority of the voting or similar rights of an investee, theParent Company considers all relevant facts and circumstances in assessing whether it has powerover an investee, including:a. The contractual arrangement with the other vote holders of the investeeb. Rights arising from other contractual arrangementsc. The Parent Company’s voting rights and potential voting rights

- 12 -
*SGVFS039490*
An associate is an entity over which the Parent Company has significant influence. Significantinfluence is the power to participate in the financial and operating policy decisions of the investee, buthas no control or joint control over those policies. A joint venture is a type of joint arrangementwhereby the parties that have joint control of the arrangement have rights to the net assets of the jointventure.
Joint control is the contractually agreed sharing of control of an arrangement, which exists only whendecisions about the relevant activities require unanimous consent of the parties sharing control. Theconsiderations made in determining significant influence or joint control is similar to those necessaryto determine control over subsidiaries.
On acquisition of the investment, the excess of the cost of investment over the investor’s share in thenet fair value of the investee’s identifiable assets, liabilities and contingent liabilities is included in thecarrying amount of the investment and not amortized.
The Parent Company recognizes income from the investment only to the extent that the ParentCompany receives distributions from accumulated profits of the investee arising after the date ofacquisition. Distributions received in excess of such profits are regarded as a recovery of investmentand are recognized as a reduction of the cost of the investment.
The Parent Company reduces the carrying value of its investment based on average acquisition costper share (historical cost) when the Parent Company disposes the investment or the investeereacquires its own equity instruments from the Parent Company.
Investment PropertiesInvestment properties consist of properties that are held to earn rentals or for capital appreciation orfor both and are not occupied by the Parent Company. Investment properties, except for land, arecarried at cost less accumulated depreciation and amortization and any impairment in value. Land iscarried at cost less any impairment in value. Depreciation and amortization on building andimprovements are computed on a straight-line basis over a 25-year period.
Additions, renewals and betterments are capitalized while minor expenditures for repairs andmaintenance are directly charged to operations.
Investment properties are derecognized when either they have been disposed of or when theinvestment property is permanently withdrawn from use on which no future economic benefit isexpected from its disposal. Any gain or loss on the retirement or disposal of an investment propertyis recognized in profit or loss in the year of retirement or disposal.
Transfers are made to investment property when there is a change in use, evidenced by ending ofowner-occupation, commencement of an operating lease to another party. Transfers are made frominvestment property when, and only when, there is a change in use, evidenced by commencement ofowner-occupation or commencement of development with a view to sell. Transfers amonginvestment properties, owner-occupied properties and inventories do not change the carrying amountof the property transferred and they do not change the cost of the property for measurement or fordisclosure purposes.
Property and EquipmentProperty and equipment are carried at cost less accumulated depreciation and any impairment invalue. The initial cost of an item of property and equipment consists of its construction cost orpurchase price and any directly attributable costs of bringing the item of property and equipment to itsworking condition and location for its intended use.
Construction in progress are carried at cost and transferred to the related property and equipmentaccount when the construction and related activities to prepare the property for its intended use arecomplete, and the property is ready for occupation or use.

- 13 -
*SGVFS039490*
Major repairs are capitalized as part of property and equipment only when it is probable that futureeconomic benefits associated with the item will flow to the Parent Company and the cost of the itemscan be measured reliably. All other repairs and maintenance are charged against current operationsas incurred.
Depreciation of property and equipment commences once the property and equipment are availablefor use and is computed using the straight-line basis over the estimated useful lives of the propertyand equipment as follows:
Years
Condominium units 25Condominium improvements 5Furniture, fixtures and equipment 3-5Transportation equipment 5
The useful life and depreciation method are reviewed periodically to ensure that the period andmethod of depreciation are consistent with the expected pattern of economic benefits from items ofproperty and equipment.
When property and equipment are retired or otherwise disposed of, the cost and the relatedaccumulated depreciation and accumulated impairment losses, if any, are removed from the accountsand any resulting gain or loss is credited to or charged against current operations.
Service Concession ArrangementThe Parent Company accounts for its service concession arrangement with the Department of PublicWorks and Highway (DPWH) under the intangible asset model as it receives the right (license) tocharge users of the public service. The concession agreement sets out the terms and conditionunder which the Parent Company will finance, design, construct, operate and maintain the entireinfrastructure as an open-system tolled expressway. The legal title to these assets shall remain withthe DPWH at the end of the concession period.
The Parent Company recognizes and measures revenue and cost from construction works inaccordance with IFRIC 12 for the services it performs. When the Parent Company providesconstruction or upgrade services, the consideration received or receivable by the Parent Company isrecognized at its fair value.
The Parent Company recognizes its contractual obligations to restore certain parts of theinfrastructure to a specified level of condition in accordance with PAS 37, Provisions, ContingentLiabilities and Contingent Assets, as the obligations arise.
Service Concession AssetThe “Service Concession Asset” (SCA) includes the MCX business of the Parent Company which isrecognized initially at the fair value of the works performed by the Parent Company. Following initialrecognition, the SCA is carried at cost less accumulated amortization and any impairment in value.
Amortization of SCA commences once the SCA are available for use and is computed using thestraight-line basis over the estimated useful lives of the SCA as follows:
Years
Road 30Building 25Furniture, fixtures and equipment 5Computer hardware and software 3
The amortization period and method is reviewed at each financial year-end to ensure that the periodand method of depreciation are consistent with the expected pattern of economic benefits. Changesin the expected useful life or the expected pattern of consumption of future economic benefits

- 14 -
*SGVFS039490*
embodied in the SCA is accounted for as changes in accounting estimates. Regular repairs andmaintenance incurred on the SCA is charged against current operation as incurred. The ParentCompany appoints a facility operator and engages a maintenance and operations advisor to carry outthe Operation and Maintenance (O&M) of the MCX in accordance with the Concession Agreement.The Parent Company shall pay the recurring annual fees, subject to yearly fee escalations. O&Mcost is included in the “General and administrative expense” account in the parent companystatements of income (see Notes 10 and 18).
The SCA will be derecognized upon turnover to the DPWH. No gain or loss will be recognized uponderecognition since the SCA is expected to be fully amortized at the end of the concession period.
Impairment of Nonfinancial AssetsThe Parent Company assesses at each reporting date whether there is an indication that itsnonfinancial assets (e.g. investment properties, SCAs, property and equipment, and investments insubsidiaries, associates and joint ventures) may be impaired. If any such indication exists, or whenannual impairment testing for an asset is required, the Parent Company makes an estimate of theasset’s recoverable amount. An asset’s recoverable amount is calculated as the higher of the asset’sor cash-generating unit’s fair value less costs to sell and its value in use and is determined for anindividual asset, unless the asset does not generate cash inflows that are largely independent ofthose from other assets or groups of assets. Where the carrying amount of an asset exceeds itsrecoverable amount, the asset is considered impaired and is written down to its recoverable amount.In assessing value in use, the estimated future cash flows are discounted to their present value usinga pre-tax discount rate that reflects current market assessments of the time value of money and therisks specific to the asset. Impairment losses are recognized in profit or loss in those expensecategories consistent with the function of the impaired asset.
An assessment is made at each reporting date as to whether there is an indication that previouslyrecognized impairment losses may no longer exist or may have decreased. If such indication exists,the recoverable amount is estimated. A previously recognized impairment loss is reversed only ifthere has been a change in the estimates used to determine the asset’s recoverable amount sincethe last impairment loss was recognized. If that is the case, the carrying amount of the asset isincreased to its recoverable amount. That increased amount cannot exceed the carrying amount thatwould have been determined, net of depreciation and amortization, had no impairment loss beenrecognized for the asset in prior years. Such reversal is recognized in the parent company statementof income unless the asset is carried at revalued amount, in which case the reversal is treated asrevaluation increase. After such a reversal, the depreciation and amortization charge is adjusted infuture periods to allocate the asset’s revised carrying amount, less any residual value, on asystematic basis over its remaining useful life.
Investments in subsidiaries, associates and joint venturesThe Parent Company determines at each end of the reporting period whether there is any objectiveevidence that the investment in the investee company is impaired. If this is the case, the ParentCompany calculates the amount of impairment as being the difference between the recoverableamount of the investee company and the carrying cost and recognizes the amount in profit or loss.
Creditable withholding taxesCWTs are carried at the amount withheld by the customers for services provided by the ParentCompany. CWTs are recognized when payments are received from customers and the relatedwithholding taxes were made. CWTs can be utilized as credits against the Parent Company’s incometax liability provided that these are properly supported by certificates of creditable tax withheld atsource subject to the rules on Philippine income taxation and may also be reduced by impairmentlosses, if any. CWTs, which are expected to be utilized as payment for income taxes within 12months, are classified as “other current assets”. Otherwise, these are classified as noncurrentassets.

- 15 -
*SGVFS039490*
Value-added Tax (VAT)The Parent Company recognizes revenues, expenses, and assets are recognized net of the amountof VAT, if applicable.
When VAT from sales of goods and/or services (output VAT) exceeds VAT passed on frompurchases of goods or services (input VAT), the excess is recognized as payable in the parentcompany statement of financial position under “other current liabilities”. When VAT passed on frompurchases of goods or services (input VAT) exceeds VAT from sales of goods and/or services (outputVAT), the excess is recognized as an asset in the parent company statement of financial position tothe extent of the recoverable amount under “other current assets”.
Fair Value MeasurementThe Parent Company measures financial instruments such as derivatives and financial assets atFVOCI at each reporting date. Also, fair values of financial instruments measured at amortized costand nonfinancial assets such as investment properties are disclosed in Note 25 and 8, respectively,to the parent company financial statements.
Fair value is the price that would be received to sell an asset or paid to transfer a liability in an orderlytransaction between market participants at the measurement date. The fair value measurement isbased on the presumption that the transaction to sell the asset or transfer the liability takes placeeither:
· In the principal market for the asset or liability; or
· In the absence of a principal market, in the most advantageous market for the asset or liability.
The principal or the most advantageous market must be accessible to by the Parent Company.
The fair value of an asset or a liability is measured using the assumptions that market participantswould use when pricing the asset or liability, assuming that market participants act in their economicbest interest.
A fair value measurement of a non-financial asset takes into account a market participant's ability togenerate economic benefits by using the asset in its highest and best use or by selling it to anothermarket participant that would use the asset in its highest and best use.
The Parent Company uses valuation techniques that are appropriate in the circumstances and forwhich sufficient data are available to measure fair value, maximizing the use of relevant observableinputs and minimizing the use of unobservable inputs.
All assets and liabilities for which fair value is measured or disclosed in the financial statements arecategorized within the fair value hierarchy, described as follows, based on the lowest level input thatis significant to the fair value measurement as a whole:
· Level 1 - Quoted (unadjusted) market prices in active markets for identical assets and liabilities.
· Level 2 - Valuation techniques for which the lowest level input that is significant to the fair valuemeasurement is directly or indirectly observable.
· Level 3 - Valuation techniques for which the lowest level input that is significant to the fair valuemeasurement is unobservable.
For assets and liabilities that are recognized in the parent company financial statements on arecurring basis, the Parent Company determines whether transfers have occurred between levels inthe hierarchy by reassessing categorization (based on the lowest level input that is significant to thefair value measurement as a whole) at the end of each reporting period.
For the purpose of fair value disclosures, the Parent Company has determined classes of assets andliabilities on the basis of the nature, characteristics and risks of the asset or liability and the level ofthe fair value hierarchy as explained above.

- 16 -
*SGVFS039490*
EquityCapital stock is measured at par value for all shares subscribed, issued and outstanding. When theshares are sold at premium, the difference between the proceeds and the par value is credited to“Additional paid-in capital” account. Direct costs incurred related to equity issuance are deductedfrom additional paid-in capital. If additional paid-in capital is not sufficient, the excess is chargedagainst retained earnings. When the Parent Company issues more than one class of stock, aseparate account is maintained for each class of stock and the number of shares issued.
Subscriptions receivable pertains to the uncollected portion of the subscribed shares and arepresented as deduction from equity.
Retained earnings represent accumulated earnings of the Parent Company less dividends declared.
Own equity instruments which are reacquired (treasury stocks) are recognized at cost and deductedfrom equity. No gain or loss is recognized in the parent company statement of income on thepurchase, sale, issue or cancellation of the Parent Company’s own equity instruments. Anydifference between the carrying amount and the consideration, if reissued, is recognized in additionalpaid-in capital. Voting rights related to treasury shares are nullified for the Parent Company and nodividends are allocated to them. When the shares are retired, the capital stock account is reduced byits par value and the excess of cost over par value upon retirement is debited to additional paid-incapital to the extent of the specific or average additional paid-in capital when the shares were issuedand to retained earnings for the remaining balance.
For the Preferred A treasury shares, the amount reflected under treasury stock pertains to par value.
Share-based PaymentsThe Parent Company has equity-settled, share-based compensation plans with its employees.
PFRS 2 OptionsFor options granted after November 7, 2002 that have not vested on January 1, 2005, the cost ofequity-settled transactions with employees is measured by reference to the fair value at the date onwhich they are granted. In valuing equity-settled transactions, vesting conditions, includingperformance conditions, other than market conditions (conditions linked to share prices), shall not betaken into account when estimating the fair value of the shares or share options at the measurementdate. Instead, vesting conditions are taken into account in estimating the number of equityinstruments that will ultimately vest. The fair value is determined by using the Black-Scholes model,further details of which are provided in Note 23 to the parent company financial statements.
The cost of equity-settled transactions is recognized, together with a corresponding increase inequity, over the period in which the performance conditions are fulfilled, ending on the date on whichthe relevant employees become fully entitled to the award (‘vesting date’). The cumulative expenserecognized for equity-settled transactions at each reporting date until the vesting date reflects theextent to which the vesting period has expired and the Parent Company’s best estimate of thenumber of equity instruments that will ultimately vest. The income or expense for a period representsthe movement in cumulative expense recognized as at the beginning and end of that period.
No expense is recognized for awards that do not ultimately vest, except for awards where vesting isconditional upon a market condition, which are treated as vesting irrespective of whether or not themarket condition is satisfied, provided that all other performance conditions are satisfied.
Where the terms of an equity-settled award are modified, at a minimum, an expense is recognized asif the terms had not been modified. In addition, an expense is recognized for any increase in thevalue of the transaction as a result of the modification, as measured at the date of modification.
Where an equity-settled award is cancelled, it is treated as if it had vested on the date of cancellation,and any expense not yet recognized for the award is recognized immediately. However, if a newaward is substituted for the cancelled award, and designated as a replacement award on the date

- 17 -
*SGVFS039490*
that it is granted, the cancelled and new awards are treated as if they were a modification of theoriginal award, as described in the previous paragraph.
The exercise of the options will result in the issuance of the corresponding number of common shareswith an increase in “Paid-in capital” and a decrease in “Share-based payments” accounts.
Pre-PFRS 2 OptionsFor options granted before November 7, 2002 that have vested before January 1, 2005, the intrinsicvalue of stock options determined as of grant date is recognized as expense over the vesting period.
Employee Share Purchase PlansThe Parent Company has employee share purchase plans (ESOWN) which allow the grantees topurchase the Parent Company’s shares. The Parent Company recognizes stock compensationexpense over the holding period. Dividends paid on the awards that have vested are deducted fromequity and those paid on awards that are unvested are charged to profit or loss. The Parent Companytreats its ESOWN plan as option exercisable within a given period. For the measurement of the fairvalue of options at the grant date, the Parent Company uses a Black-Scholes Merton Formula andBinomial Tree Model. The assumptions and models used for estimating fair value for share-basedpayment transactions are disclosed in Note 23.
RevenueRevenue from contracts with customersThe Parent Company is the holding company of the Ayala Group of Companies (see Note 1).Revenue from contracts with customers is recognized when control of the goods or services aretransferred to the customer at an amount that reflects the consideration to which the Parent Companyexpects to be entitled in exchange for those goods or services. The Parent Company has generallyconcluded that it is the principal in its revenue arrangements.
The disclosures of significant accounting judgements, estimates and assumptions relating to revenuefrom contracts with customers are provided in Note 3.
Management fees for services rendered are recognized over time since its customers simultaneouslyreceives and consumes the benefits provided by the Parent Company’s performance as the ParentCompany performs.
Toll revenue is recognized upon entry of vehicles in the toll road facility and receipt of cash payment.
Contract balancesContract assetsA contract asset is the right to consideration in exchange of goods or services transferred to thecustomer. If the Parent Company performs by transferring goods or services to a customer beforethe customer pays consideration or before payment is due, a contract asset is recognized for theearned consideration that is conditional.
Trade receivablesA receivable represents the Parent Company’s right to an amount of consideration that isunconditional (i.e., only the passage of time is required before payment of consideration is due).
Contract liabilitiesA contract liability is the obligation to transfer goods or services to a customer for which the ParentCompany has received consideration (or an amount of consideration is due) from the customer. If acustomer pays consideration before the Parent Company transfers goods or services to thecustomer, a contract liability is recognized when the payment is made or the payment is due(whichever is earlier). Contract liabilities are recognized as revenue when the Parent Companyperforms under the contract. As at December 31, 2019 and 2018, the Parent Company does nothave any contract liabilities.

- 18 -
*SGVFS039490*
DividendsDividend income is recognized when the Parent Company’s right to receive payment is established.
Other incomeRental incomeRental income from investment properties is recognized on a straight-line basis over the lease term,or based on a certain percentage of the net sales of the tenants, as provided under the terms of thelease contract.
Construction revenueConstruction revenue is recognized and measured by the Parent Company in accordance withPhilippine Interpretations IFRIC 12 for the services it performs and is recognized as part of SCA. Therecognized Construction revenue is equal to the related costs.
OthersGain on sale of other assets is computed as the excess of proceeds of the disposal over its carryingamount.
Gain on sale of investment in shares of stock is recognized in profit or loss if the Parent Companydisposes some of its investment in a subsidiary, associate or joint venture. Gain as recognized by theParent Company is the excess of the selling price over the average cost of the shares sold and is netof direct expenses.
Interest incomeInterest income is recognized as it accrues using the EIR method.
Expense RecognitionExpenses are recognized in the parent company statement of income when decrease in futureeconomic benefit related to a decrease in an asset or an increase in a liability has arisen that can bemeasured reliably.
Expenses are recognized in the parent company statement of income:
· On the basis of a direct association between the costs incurred and the earning of specific itemsof income;
· On the basis of systematic and rational allocation procedures when economic benefits areexpected to arise over several accounting periods and the association can only be broadly orindirectly determined; or
· Immediately when expenditure produces no future economic benefits or when, and to the extentthat, future economic benefits do not qualify or cease to qualify, for recognition in the parentcompany statement of financial position as an asset.
Direct operating expenses and general and administrative expenses are recognized as they areincurred.
Pension CostDefined benefit planThe net defined benefit liability or asset is the aggregate of the present value of the defined benefitobligation at the end of the reporting period reduced by the fair value of plan assets, adjusted for anyeffect of limiting a net defined benefit asset to the asset ceiling. The asset ceiling is the present valueof any economic benefits available in the form of refunds from the plan or reductions in futurecontributions to the plan.
The cost of providing benefits under the defined benefit plans is actuarially determined using theprojected unit credit method.

- 19 -
*SGVFS039490*
Defined benefit costs comprise the following:- Service cost- Net interest on the net defined benefit liability or asset- Remeasurements of net defined benefit liability or asset
Service costs which include current service costs, past service costs and gains or losses on non-routine settlements are recognized as expense in profit or loss. Past service costs are recognizedwhen plan amendment or curtailment occurs. These amounts are calculated periodically byindependent qualified actuaries.
Net interest on the net defined benefit liability or asset is the change during the period in the netdefined benefit liability or asset that arises from the passage of time which is determined by applyingthe discount rate based on government bonds to the net defined benefit liability or asset. Net intereston the net defined benefit liability or asset is recognized as expense or income in profit or loss.
Remeasurements comprising actuarial gains and losses, return on plan assets and any change in theeffect of the asset ceiling (excluding net interest on defined benefit liability) are recognizedimmediately in OCI in the period in which they arise. Remeasurements are not reclassified to profit orloss in subsequent periods.
Plan assets are assets that are held by a long-term employee benefit fund or qualifying insurancepolicies. Plan assets are not available to the creditors of the Parent Company, nor can they be paiddirectly to the Parent Company. Fair value of plan assets is based on market price information.When no market price is available, the fair value of plan assets is estimated by discounting expectedfuture cash flows using a discount rate that reflects both the risk associated with the plan assets andthe maturity or expected disposal date of those assets (or, if they have no maturity, the expectedperiod until the settlement of the related obligations). If the fair value of the plan assets is higher thanthe present value of the defined benefit obligation, the measurement of the resulting defined benefitasset is limited to the present value of economic benefits available in the form of refunds from theplan or reductions in future contributions to the plan.
The Parent Company’s right to be reimbursed of some or all of the expenditure required to settle adefined benefit obligation is recognized as a separate asset at fair value when and only whenreimbursement is virtually certain.
Termination benefitTermination benefits are employee benefits provided in exchange for the termination of anemployee’s employment as a result of either an entity’s decision to terminate an employee’semployment before the normal retirement date or an employee’s decision to accept an offer ofbenefits in exchange for the termination of employment.
A liability and expense for a termination benefit is recognized at the earlier of when the entity can nolonger withdraw the offer of those benefits and when the entity recognizes related restructuring costs.Initial recognition and subsequent changes to termination benefits are measured in accordance withthe nature of the employee benefit, as either post-employment benefits, short-term employeebenefits, or other long-term employee benefits.
Employee leave entitlementEmployee entitlements to annual leave are recognized as a liability when they are accrued to theemployees. The undiscounted liability for leave expected to be settled wholly before twelve monthsafter the end of the annual reporting period is recognized for services rendered by employees up tothe end of the reporting period.

- 20 -
*SGVFS039490*
Income TaxCurrent taxCurrent tax assets and liabilities for the current and prior periods are measured at the amountexpected to be recovered from or paid to the taxation authorities. The tax rates and tax laws used tocompute the amount are those that are enacted or substantively enacted at the reporting date.
Deferred taxDeferred tax is provided, using the liability method, on all temporary differences, with certainexceptions, at the reporting date between the tax bases of assets and liabilities and their carryingamounts for financial reporting purposes.
Deferred tax liabilities are recognized for all taxable temporary differences, with certain exceptions.Deferred tax assets are recognized for all deductible temporary differences, carryforward benefit ofunused tax credits from excess of minimum corporate income tax (MCIT) over the regular corporateincome tax and unused net operating loss carryover (NOLCO), to the extent that it is probable thattaxable income will be available against which the deductible temporary differences and carryforwardbenefits of MCIT and NOLCO can be utilized.
Deferred tax liabilities are not provided on nontaxable temporary differences associated withinvestment in domestic subsidiaries, associates and interests in joint ventures.
The carrying amount of deferred tax assets is reviewed at the reporting date and reduced to theextent that it is no longer probable that sufficient taxable income will be available to allow all or part ofthe deferred tax assets to be utilized. Unrecognized deferred tax assets are reassessed at the end ofeach reporting period and are recognized to the extent that it has become probable that future taxableincome will allow all or part of the deferred tax assets to be recovered.
Deferred tax assets and liabilities are measured at the tax rate that is expected to apply in the periodwhen the asset is realized or the liability is settled, based on tax rates and tax laws that have beenenacted or substantively enacted at the reporting date. Movements in the deferred income tax assetsand liabilities arising from changes in tax rates are charged or credited to income for the period.
Deferred tax assets and deferred tax liabilities are offset, if a legally enforceable right exists to set offcurrent tax assets against current tax liabilities and the deferred taxes relate to the same taxableentity and the same taxation authority.
Leases effective January 1, 2019The Parent Company assesses at contract inception whether a contract is, or contains, a lease. Thatis, if the contract coveys right to control the use of an identified asset for a period of time in exchangefor consideration.
Parent Company as a lesseeThe Parent Company applies a single recognition and measurement approach for all leases, exceptfor short-term leases and leases of low-value assets. The Parent Company recognizes leaseliabilities to make lease payments and right-of-use of assets representing the right to use theunderlying assets.
Short-term leasesThe Parent Company applies the short-term lease recognition exemption to its short-term leases ofoffice area (i.e., those leases that have a lease term of 12 months or less from the commencementdate and do not contain a purchase option). Lease payments on short-term leases are recognized asexpense on a straight-line basis over the lease term.
Parent Company as a lessorLeases in which the Parent Company does not transfer substantially all the risk and rewardsincidental to ownership of an asset are classified as operating leases. Rental income arising isaccounted for on a straight-line basis over the lease term, or based on a certain percentage of the net

- 21 -
*SGVFS039490*
sales of the tenants, as provided under the terms of the lease contract and included in revenue in thestatement of comprehensive income due to its operating nature. Initial direct costs incurred innegotiating and arranging operating lease are added to the carrying amount of the leased asset andrecognized over the lease term on the same basis as rental income.
Leases prior to January 1, 2019The determination of whether an arrangement is, or contains, a lease is based on the substance ofthe arrangement at inception date whether the fulfillment of the arrangement is dependent on the useof a specific asset or assets or the arrangement conveys a right to use the asset. A reassessment ismade after inception of the lease only if one of the following applies:
(a) There is a change in contractual terms, other than a renewal or extension of the arrangement;(b) A renewal option is exercised or extension granted, unless the term of the renewal or extension
was initially included in the lease term;(c) There is a change in the determination of whether fulfillment is dependent on a specified asset; or(d) There is substantial change to the asset.
Where a reassessment is made, lease accounting shall commence or cease from the date when thechange in circumstances gave rise to the reassessment for scenarios (a), (c), or (d) and at the date ofrenewal or extension period for scenario (b).
Parent Company as lesseeLeases where the lessor retains substantially all the risks and benefits of ownership of the asset areclassified as operating leases. Fixed lease payments are recognized as an expense in thestatements of comprehensive income on a straight-line basis while the variable rent is recognized asan expense based on terms of the lease contract.
Parent Company as lessorLeases where the Parent Company does not transfer substantially all the risk and benefits ofownership of the assets are classified as operating leases. Lease payments received are recognizedas an income in the statements of comprehensive income on a straight-line basis over the lease term.Initial direct costs incurred in negotiating operating leases are added to the carrying amount of theleased asset and recognized over the lease term on the same basis as the rental income. Contingentrents are recognized as revenue in the period in which they are earned.
Foreign Currency TransactionsTransactions denominated in foreign currencies are initially recorded in Philippine Peso at theexchange rate based on the Bankers Association of the Philippines (BAP) rate at the date oftransaction. Foreign currency-denominated monetary assets and liabilities are retranslated at theclosing BAP rate at reporting date. Exchange gains or losses arising from foreign currencytransactions are recognized in parent company statement of income.
ProvisionsProvisions are recognized when the Parent Company has a present obligation (legal or constructive)as a result of a past event, when it is probable that an outflow of resources embodying economicbenefits will be required to settle the obligation, and when a reliable estimate can be made of theamount of the obligation. Where the Parent Company expects a provision to be reimbursed, thereimbursement is recognized as a separate asset but only when the reimbursement is virtuallycertain. Provisions are reviewed at each reporting and adjusted to reflect the current best estimate.
Provision for Maintenance ObligationProvision for maintenance obligation pertains to the Parent Company’s obligation to perform routineand periodic maintenance under the concession agreement. Routine maintenance pertains to day-to-day activities to maintain the road infrastructures while periodic maintenance comprises of preventiveactivities against major defects and reconstruction. Moreover, the Parent Company is required toperform maintenance and repair work in a manner that complies with the Minimum PerformanceStandards and Specifications (MPSS) once it hands the asset back to the Grantor. The provision is a

- 22 -
*SGVFS039490*
product of the best estimate of the expenditure required to settle the obligation based on the usage ofthe road during the operating phase. The amount is reduced by the actual obligations paid for heavymaintenance of the SCA.
ContingenciesContingent liabilities are not recognized in the parent company financial statements. These aredisclosed unless the possibility of an outflow of resources embodying economic benefits is remote.Contingent assets are not recognized in the parent company financial statements but disclosed whenan inflow of economic benefits is probable.
Events after the Reporting PeriodPost year-end events that provide additional information about the Parent Company’s position at thereporting date (adjusting events) are reflected in parent company financial statements. Post year-endevents that are not adjusting events are disclosed in the parent company financial statements whenmaterial.
3. Significant Accounting Judgments and Estimates
The preparation of the accompanying parent company financial statements in conformity with PFRSrequires management to make estimates and assumptions that affect the amounts reported in theparent company financial statements and accompanying notes. The estimates and assumptionsused in the accompanying parent company financial statements are based upon management’sevaluation of relevant facts and circumstances as of the date of the financial statements. Actualresults could differ from such estimates.
JudgmentsIn the process of applying the Parent Company’s accounting policies, management has made thefollowing judgments, apart from those involving estimations, which have the most significant effect onthe amounts recognized in the parent company financial statements:
Business model assessmentClassification and measurement of financial assets depends on the results of the business model testand SPPI model. The Parent Company determines the business model at a level that reflects how thefinancial assets are managed to achieve a particular business objective. This assessment includesjudgment reflecting all relevant evidence including how the performance of the asset is evaluated andtheir performance measured and the risks that affect the performance of the assets.
The Parent Company classified all of its financial assets as amortized cost, except for equityinstruments, as the Parent Company has determined that the financial assets are held in order tocollect contractual cash flows.
Determining the stage for impairmentAt each reporting date, the Parent Company assesses whether there has been a significant increasein credit risk for financial assets since initial recognition by comparing the risk of default occurringover the expected life between the reporting date and the date of initial recognition. The ParentCompany considers reasonable and supportable information that is relevant and available withoutundue cost or effort for this purpose. This includes quantitative and qualitative information andforward-looking analysis. Quantitative criteria may include downgrade in investment grade, defaultedassets, counterparties with objective evidence of impairment. A significant increase in credit risk isalso presumed if a debtor is more than 90 days past due in making a contractual payment.Qualitative criteria may include significant adverse changes in business, financial or economicconditions in which the counterparty operates, actual or expected restructuring.
Exposures that have not deteriorated significantly since origination, or where the deteriorationremains within the Parent Company’s investment grade criteria are considered to have a low creditrisk. The provision for credit losses for these financial assets is based on a 12-month ECL.

- 23 -
*SGVFS039490*
An exposure will migrate through the ECL stages as asset quality deteriorates. If, in a subsequentperiod, asset quality improves and also reverses any previously assessed significant increase incredit risk since origination, then the loss allowance measurement reverts from lifetime ECL to12-months ECL.
For cash and cash equivalents and short-term investments, the Parent Company assessed that thesefinancial instruments have low credit risk. As such, expected loss is measured on a 12-month ECL.
The Parent Company has determined that its credit risk on its non-trade receivable has notsignificantly increased since origination as of December 31, 2019.
Incorporation of Forward-looking InformationThe Parent Company incorporates forward-looking information into both its assessment of whetherthe credit risk of an instrument has increased significantly since its initial recognition and itsmeasurement of ECL. The Parent Company has identified and documented key drivers of credit riskand credit losses of each financial instruments and, using an analysis of historical data, has estimatedrelationships between macro-economic variables identified and credit risk and credit losses. Predictedrelationship between the key indicators and default and loss rates on financial assets have beendeveloped based on analyzing historical data.
Definition of defaultThe Parent Company defines a financial instrument as in default based on quantitative and qualitativecriteria. When the debtor is more than 90 days past due on its contractual payment, the ParentCompany considers the debtor to be in default. The Parent Company also applied qualitative criteria,such as the debtor being insolvent, an active market for the financial asset has disappeared, it isbecoming probable that the debtor will enter bankruptcy or other financial reorganization.
These criteria have been applied to all financial assets held by the Parent Company and consistentlythroughout to model the PD, LGD and EAD throughout the ECL calculations.
Service concession arrangementIn applying Philippine Interpretation IFRIC 12, the Parent Company has made a judgment that itsservice concession agreements qualify under the Intangible Asset model. The accounting policy onthe Parent Company’s SCAs under the Intangible Asset model is discussed in Note 2 to the parentcompany financial statements.
The Parent Company also recognizes its contractual obligations to restore its service concessionasset to a specified level of serviceability. The Company recognizes a provision following PAS 37.Further details on provision for maintenance obligation are given in Note 12.
Receivable from DPWHA receivable is recognized if an amount of consideration that is unconditional is due from thecustomer or third-party (i.e., only the passage of time is required before payment of the considerationis due). Estimated value of the receivable from DPWH as of reporting period is being madedepending on the expected recovery period of the receivable and the time value of money. TheParent Company has assessed that the receivable from DPWH will qualify as a financial asset atamortized cost as this will give rise to cash flows that are ‘solely payments of principal and interest’ onthe principal amount outstanding.
Financial Guarantee ObligationThe Parent Company has guaranteed AYCFL’s exchangeable bonds, undated notes payable andrevolving credit facility (“the Facility”). The accounting policy on the Parent Company’s financialguarantee obligation is discussed in Note 2 to the parent company financial statements. The ParentCompany has assessed whether the arrangement meets the definition of financial guarantee underPFRS 9. In making the assessment, the Parent Company determined the value of the financialguarantee based on the level of credit risk in the instrument if issued with or without the financialguarantee. The value is driven mainly by the issuer’s capacity to pay the Facility based on expected

- 24 -
*SGVFS039490*
return and payback cash flows from several investments. It also considers the individual and jointcredit risk assessment of the issuer and the guarantor.
ContingenciesThe Parent Company is currently involved in various legal proceedings. The estimate of the probablecosts for the resolution of these claims has been developed in consultation with internal and externalcounsel handling the defense in these matters and is based upon an analysis of potential results.The Parent Company currently does not believe that these proceedings will have a material effect onthe Parent Company’s financial position. It is possible, however, that future results of operationscould be materially affected by changes in the estimates or in the effectiveness of the strategiesrelating to these proceedings.
Management’s Use of EstimatesThe key assumptions concerning the future and other key sources of estimation uncertainty at thereporting date, that have a significant risk of causing a material adjustment to the carrying amounts ofassets and liabilities within the next financial year, are discussed below.
Provision for ECLCash and Cash Equivalents, Short-term Investments and Non-trade ReceivablesThe Parent Company measures its ECL on cash and cash equivalents, short-term investments, andnon-trade receivables in a way that reflects an unbiased and probability-weighted amount determinedby evaluating a range of possible outcomes and the time value of money. In measuring ECL, theParent Company consider whether there is a significant increase in credit risk. The Parent Companyuses an ECL model that considers the PD, LGD and EAD. In estimating the ECL, the ParentCompany uses all available information in measuring ECL, such as available credit rating of theinstruments and the debtor, default assessment on the debtor, and history of experience with thedebtor. A forward-looking information, such as interest rate, inflation rate and changes in the grossdomestic product, is incorporated and its relationship with the credit loss is analyzed at each reportingdate.
The correlation of forecast economic conditions and ECL is a significant estimate. The amount ofECLs is sensitive to changes in circumstances and of forecast economic conditions. The ParentCompany’s forecast of economic conditions may also not be representative of the debtor’s actualdefault in the future.
For cash and cash equivalents and short-term investments, the Parent Company assessed that thesefinancial instruments have low credit risk. As such, expected loss is measured on a 12-month ECL.
Trade receivablesThe Parent Company uses a provision matrix to calculate ECLs for trade receivables. The provisionrates are based on the individual loss patterns for each nature of receivables.
The provision matrix is initially based on the Parent Company’s historical observed default rates. TheParent Company will calibrate the matrix to adjust the historical credit loss experience with forward-looking information. For instance, if the interest rates, change percentage in gross domestic productand inflation rates are expected to deteriorate over the next year which can lead to an increasednumber of defaults to the companies, the historical default rates are adjusted. At every reportingdate, the historical observed default rates are updated and changes in the forward-looking estimatesare analyzed.
The Parent Company considers a financial asset in default when internal or external informationindicates that the Parent Company is unlikely to receive the outstanding contractual amounts in fullbefore taking into account any credit enhancements held by the Parent Company. A financial asset iswritten off when there is no reasonable expectation of recovering the contractual cash flows.
The assessment of the correlation between historical observed default rates, forecast economicconditions and ECLs is a significant estimate. The amount of ECLs is sensitive to changes incircumstances and of forecast economic conditions. The Parent Company’s historical credit loss

- 25 -
*SGVFS039490*
experience and forecast of economic conditions may also not be representative of customer’s actualdefault in the future. The information about the ECLs on the Parent Company’s trade receivables isdisclosed in Note 5.
Evaluation of asset impairment and recoveriesThe Parent Company reviews investments in subsidiaries, associates and joint ventures, investmentproperties, SCAs and property and equipment for impairment of value. This includes consideringcertain indicators of impairment such as significant changes in asset usage, significant decline inassets’ market value, obsolescence or physical damage of an asset, significant underperformancerelative to expected historical or projected future operating results and significant negative industry oreconomic trends.
The Parent Company estimates the recoverable amount as the higher of the net selling price andvalue in use. In determining the present value of estimated future cash flows expected to begenerated from the continued use of the assets, the Parent Company is required to make estimatesand assumptions that may affect investments in subsidiaries, associates and joint ventures,investment properties, SCAs and property and equipment.
Impairment losses recognized on investments in subsidiaries, associates and joint venturesamounted to P=7,425.0 million and nil in 2019 and 2018, respectively. Recoverable amounts ofinvestments in subsidiaries, associates and joint ventures that have been determined to haveimpairment indicators as of December 31, 2019 were based on its value in use with discount ratesranging from 9% to 15%, revenue growth rates ranging from 1.5% to 10% and terminal values.Recoverable amounts as of December 31, 2018 were based on fair value less cost to sell withreference to market prices and dividend yields. Impairment losses previously recognized oninvestments in subsidiaries, associates and joint ventures amounting to P=4,922.0 million in 2019(see Notes 7 and 18) was reversed as a result of return of investment received during the year.
Further details on investments in subsidiaries, associates and joint ventures, investment properties,SCAs and property and equipment are given in Notes 7, 8, 10 and 11.
Share-based paymentsThe expected life of the options is based on the expected exercise behavior of the stock optionholders and is not necessarily indicative of the exercise patterns that may occur. The volatility isbased on the average historical price volatility which may be different from the expected volatility ofthe shares of stock of the Parent Company.
Further details on share-based payments are given in Note 23.
Estimating pension obligationThe cost of defined benefit pension plans and the present value of the pension obligation aredetermined using actuarial valuations. The actuarial valuation involves making various assumptions.These include the determination of the discount rates, future salary increases, mortality rates andfuture pension increases. Due to the complexity of the valuation, the underlying assumptions and itslong-term nature, defined benefit obligations are highly sensitive to changes in these assumptions.All assumptions are reviewed at each reporting date.
In determining the appropriate discount rate, management considers the interest rates of governmentbonds that are denominated in the currency in which the benefits will be paid, with extrapolatedmaturities corresponding to the expected duration of the defined benefit obligation.

- 26 -
*SGVFS039490*
The mortality rate is based on publicly available mortality tables for the specific country and ismodified accordingly with estimates of mortality improvements. Future salary increases and pensionincreases are based on expected future inflation rates for the specific country.
Further details about the pension obligation and the assumptions used are given in Note 22.
Estimating provision for maintenance obligationThe Parent Company’s obligations under the SCA include the financing of the MCX’s periodicmaintenance, which includes the renewal and restoration of toll roads and toll road facilities prior tothe turnover of the asset to DPWH. In determining the fair value of the provision, assumptions andestimates are made in relation to discount rates, management’s best estimate of the expenditure tosettle the obligation based on the usage of the road during the operating phase, and the expectedtiming of the cost. The carrying amount of the provision as at December 31, 2019 and 2018 amountsto P=66.0 million and P=46.9 million, respectively (see Note 10).
Fair value of financial instrumentsWhere the fair values of financial assets and financial liabilities recorded in the parent companystatement of financial position or disclosed in the notes to the parent company financial statementscannot be derived from active markets, they are determined using internal valuation techniques usinggenerally accepted market valuation models. The inputs to these models are taken from observablemarkets where possible, but where this is not feasible, estimates are used in establishing fair values.These estimates may include considerations of liquidity, volatility, and correlation. Further detailsabout the fair value of financial instruments are provided in Note 24.
4. Cash and Cash Equivalents and Short-term Investments
Cash and Cash equivalents
This account consists of:
2019 2018
(In Thousands)
Cash on hand and in banks (Note 21) P=184,772 P=187,855Cash equivalents (Note 21) 7,067,678 3,349,241
P=7,252,450 P=3,537,096
Cash in banks earn interest at the respective bank deposit rates. Cash equivalents pertain to short-term, highly liquid investments that are made for varying periods of up to three months depending onthe immediate cash requirements of the Parent Company, and earn interest ranging from 0.20% to6.25% and 0.38% to 6.7% in 2019 and 2018, respectively.
Short-term investmentsShort-term investments pertain to money market placements and short-term notes with varyingperiods of more than three months but less than one year and earn interest ranging from 2.00% to5.88% and 1.88% to 5.75% in 2019 and 2018, respectively.
Interest income earned from cash in banks, cash equivalents and short-term investments amountedto P=482.2 million and P=200.4 million in 2019 and 2018, respectively (see Note 18).

- 27 -
*SGVFS039490*
5. Accounts and Notes Receivable
This account consists of:
2019 2018
(In Thousands)
Notes receivable (Notes 21 and 24) P=244,221 P=235,189Receivables from related parties (Note 21) 221,070 227,294Dividends receivable (Note 21) 34,600 1,281,478Receivable from other companies 25,378 34,963Rent receivable (Note 21) 22,775 27,874Interest receivable (Note 21) 10,203 4,525Other receivables (Note 10) 219,055 222,380
777,302 2,033,703Less allowance for credit losses 5,394 5,394
771,908 2,028,309Less noncurrent portion 428,515 411,435
P=343,393 P=1,616,874
The classes of receivables of the Parent Company are as follows:
Notes receivablePertains to housing, car, salary and other loans granted by the Parent Company to its officers andemployees which are collectible through salary deduction and bears interest rate of 5.0% to 6.0% perannum and has various maturity dates from 2020 to 2033.
As of December 31, 2019 and 2018, notes receivable with nominal amounts of P=234.9 million andP=225.5 million, respectively, were recorded initially at fair value. The fair value of the notesreceivable was obtained by discounting future cash flows using the applicable rate of similarinstruments. The unamortized net premium amounted to P=9.2 million and P=9.6 million as ofDecember 31, 2019 and 2018, respectively.
Interest income net of amortization and accretion amounted to P=11.1 million and P=8.6 million in 2019and 2018, respectively (see Note 18). This is included as part of “Interest income” in the parentcompany statements of income.
Receivables from related partiesPertain to the unpaid management fees of the Parent Company’s various related parties which arenon-interest bearing and are due and demandable.
Dividends receivablePertains to dividends receivable from subsidiaries, associates and joint ventures. These receivablesare non-interest bearing and collectible within one year.
Receivable from other companiesPertains to receivable from non-related parties. These receivables are non-interest bearing.
Rent receivablePertains to accrued rent on investment properties of the Parent Company which are non-interestbearing and collectible within one year.

- 28 -
*SGVFS039490*
Interest receivablePertains to accrued interest on cash in banks, cash equivalents and short-term investments.
Other receivablesPertains to the Parent Company’s receivable from the DPWH pertaining to the additional costsincurred in the construction of the Muntinlupa-Cavite Expressway (MCX) arising from the DPWH’sdirective to revise the interconnection design of the toll road (see Note 10).
Allowance for credit lossesReceivables amounting to P=5.4 million as of December 31, 2019 and 2018 was impaired and fullyprovided for.
6. Other Assets
This account consists of:
2019 2018
(In Thousands)
Creditable withholding taxes (CWTs) P=1,021,800 P=825,487Deferred charges 41,338 32,437Refundable deposits 10,367 10,174Others − (3,647)
1,073,505 864,451Less allowance for impairment 137,912 137,912
935,593 726,539Less noncurrent portion 929,734 718,507
P=5,859 P=8,032
CWTs pertain to taxes withheld by third parties. CWTs can be utilized as payments for income taxesprovided that these are properly supported by certificates of CWTs at source subject to the rules ofincome taxation.
Deferred charges pertain to the commitment fees on the undrawn loan with a local bank. Thecommitment fees are recognized over loan commitment period on a straight-line basis.
Refundable deposits pertain to deposit paid for the installation of electric wirings to an electriccompany. These will be refunded after the termination of the subscription period of the ParentCompany.
Input VAT pertain to VAT imposed on the Parent Company for the acquisition of goods from suppliersas required by Philippine taxation laws and regulations, net of output VAT.
Allowance for impairment pertains to the Parent Company’s assessment of uncollectible CWTs. Theimpairment loss recognized in 2019 and 2018 amounted to nil. (see Note 18).

- 29 -
*SGVFS039490*
7. Investments in Subsidiaries, Associates and Joint Ventures
The Parent Company’s investees and the corresponding direct percentages of ownership are shownbelow:
Nature of Business
Percentage ofOwnership Amounts
2019 2018 2019 2018
Percentage (%) (In Thousands)
Subsidiaries:
AC Energy, Inc. (ACEI) Power 100.0 100.0 P=33,537,221 P=24,374,721AC Industrial Technology Holdings, Inc.
(AITHI)Industrial Technology
and Automotive100.0 100.0 15,007,473 13,167,173
AC International Finance Limited(ACIFL)*
Investment Holding 100.0 100.0 12,303,985 18,018,134
Manila Water Company, Inc. (MWC) Water 35.1 35.1 7,255,118 7,255,118
Ayala Healthcare Holdings, Inc. (AHHI) Healthcare 100.0 100.0 6,485,165 2,860,165AC Infrastructure Holdings Corporation
(AC Infra)Transport and
Infrastructure100.0 100.0 6,406,745 4,035,744
Ayala Land, Inc. (ALI) Real Estate and Hotels 44.5 47.0 6,207,584 6,495,401Azalea International Venture
Partners, Ltd. (AIVPL)**Business Process
Outsourcing (BPO)100.0 100.0 5,840,484 5,840,484
Michigan Holdings, Inc. (MHI) Investment Holding 100.0 100.0 4,400,691 4,400,691
Bestfull Holdings, Ltd. (BHL)*** Investment Holding-International
100.0 100.0 1,908,013 1,908,013
AC Ventures Holding Corp. (AVHC)
(formerly Water Capital Works, Inc).
Investment Holding 100.0 100.0 1,893,640 1,893,640
Philwater Holdings, Inc. (Philwater) Investment Holding 100.0 100.0 1,884,099 1,884,099Ayala Aviation Corporation (AAC) Air Charter 100.0 100.0 1,663,790 1,504,990
AYC Finance Ltd. (AYCFL)* Investment Holding 100.0 100.0 704,460 704,460Ayala International Pte. Ltd. (AIPL)**** International 100.0 100.0 555,570 555,570HCX Technology Partners, Inc. (HCX) HR Technology
Services
100.0 100.0 142,500 142,500
Purefoods International Limited (PFIL)** Investment Holding 100.0 100.0 107,348 107,348Technopark Land, Inc. (TLI) Real Estate 78.8 78.8 97,983 97,983
AG Counselors Corporation (AGCC) Consultancy Services 100.0 100.0 21,000 21,000Darong Agricultural Development
Corporation (DADC)Agriculture 100.0 100.0 7,141 7,141
Integrated Microelectronics, Inc. (IMI) Industrial Technologies 0.1 0.1 3,384 3,384AC Education, Inc. (AEI) (formerly Ayala
Education Inc.)Education − 100.0 − 4,144,300
Associates:Bank of the Philippine Islands (BPI) Banking 30.9 30.9 63,292,974 63,292,974iPeople, Inc. (IPO) Education 33.5 − 5,192,488 −Ayala Hotels, Inc. (AHI) Real Estate
and Hospitality50.0 50.0 258,024 258,024
Lagdigan Land Corporation (LLC) Real Estate 40.0 40.0 66,000 42,000
Joint Ventures:Liontide Holdings Inc. (LHI) Investment Holding 78.1 78.1 29,021,473 29,021,473Globe Telecom, Inc. (Globe) Telecommunications 30.9 30.9 13,101,397 13,101,397
Asiacom Philippines, Inc. (Asiacom) Investment Holding 60.0 60.0 397,977 397,977
217,763,727 205,535,904Less allowance for impairment losses 24,386,250 21,883,250
P=193,377,477 P=183,652,654
*Incorporated in Cayman Island
**Incorporated in British Virgin Islands***Incorporated in Hong Kong
****Incorporated in Singapore
Unless otherwise indicated, the principal place of business and country of incorporation of the ParentCompany’s investments in subsidiaries, associates and joint ventures is the Philippines.
Except as discussed below, the voting rights held by the Parent Company in its investments insubsidiaries, associates and joint ventures are in proportion to its ownership interest. The followingsignificant transactions affected the Parent Company’s investments in investee companies:

- 30 -
*SGVFS039490*
Investment in ACEIOn January 19, 2018, the BOD of the Parent Company approved the restructuring of ACEI as follows:
On June 7, 2018, Ingrid Power Holdings, Inc., a wholly owned subsidiary of ACEI was incorporated.
On July 12, 2018, ACEI restructured Gigasol2, Inc. to include AC Laguna Solar, Inc., AC La MesaSolar, Inc., AC Subic Solar, Inc., Gigasol1, Inc., Gigasol3, Inc., SolarAce1, Inc. and SolarAce2.These companies were previously owned by Presage Corporation.
On September 7, 2018, ACE Thermal, Inc., a wholly owned subsidiary of ACEI was incorporated.
On September 20, 2018, AA Thermal, Inc., a wholly owned affiliate of ACEI was incorporated.
On September 24, 2018, ACEI, Inc. transferred 100% of its limited partnership interest in each ofACE Mariveles Power Ltd. Co. and Dinginin Power Holdings Ltd. Co. to AA Thermal, Inc. Thetransfer is part of the ACEI Group’s restructuring plan for its thermal assets.
On September 26, 2018, Aboitiz Power Corporation (Aboitiz Power) entered into a share purchaseagreement with Arlington Mariveles Netherlands Holding BV, an affiliate of ACEI, and a shareholders’agreement with ACEI, a wholly-owned subsidiary of the Parent Company, for the proposedacquisition of a 49% voting stake and 60% economic stake in AA Thermal, Inc.
On May 2, 2019, ACEI completed the AA Thermal Transaction valued at US$572.9 million afterapplying the agreed adjustments pursuant to the Share Purchase Agreement (SPA).
As of December 31, 2019, the Parent Company infused a total of P=5.1 billion additional capital for theacquisition of AC Energy Philippines, Inc. (ACEPH) (formerly Phinma Energy Corporation) whichincluded a payment of prior year outstanding subscription of P=1.7 billion. The Parent Company alsoinfused another P=5.8 billion via subscription on ACEI’s redeemable preferred shares.
Investment in AITHIOn various dates in 2018 and 2017, the Parent Company infused P=3.7 billion and P=7.8 billion toAITHI, respectively, to fund the following:i. Subscription to entitlement in IMI’s stock offering; andii. Planned business expansion and various investments.
On September 28, 2018, SAIC MAXUS Automotive Co., Ltd. (Maxus) has appointed AITHI as theofficial distributor of Maxus vehicles in the Philippines. Maxus is a wholly-owned subsidiary of SAICMotor Corporation Limited, with an emerging portfolio focused on light commercial vehicles.
On December 5, 2018, AITHI signed a Distributorship Agreement with Kia Motors Corporation (KMC)to distribute the Kia brand in the Philippines. A joint venture company, with AITHI as majoritystockholder, will be established in collaboration with Columbian Autocar Corporation (CAC) toundertake this new business and re-establish the Kia brand in the Philippines.
On January 17, 2019, KP Motor Corporations (KPMC), a wholly-owned subsidiary of AITHI, wasincorporated. KPMC is primarily engaged to assemble, manufacture, construct, purchase, import, sellon wholesale basis, distribute, export, exchange, mortgage, pledge and otherwise dispose of, andgenerally to deal in or engage in any commerce relating to automobiles, cars, automobile products,and all kinds of component parts of Kia brand.
On January 30, 2019, AITHI relaunched the Kia brand in the Philippines wherein three (3) newvehicle models were introduced. In 2019, the Parent Company infused capital which amounted toP=1.8 billion for AITHI’s acquisition of the Kia distributorship business.

- 31 -
*SGVFS039490*
Investment in ACIFL
In May 2019, ACIFL repurchased its 110.0 million shares which were issued and registered in thename of the Parent Company, ACIFL’s sole shareholder. The repurchase price was at par ofUS$1.00 per share for a total amount of US$110.0 million. ACIFL remained a wholly ownedsubsidiary of the Parent Company after the transaction.
On various dates in 2019, ACIFL infused additional capital to ACI Singapore amounting toUS$115.4 million to fund its various investments particularly its subscription to redeemablecumulative preferred stock (RCPS) of IMI Singapore.
Investment in MWCOn April 24, 2019, Metropolitan Waterworks and Sewerage System (MWSS) imposed a financialpenalty of P=534.05 million on MWC for its failure to meet its service obligation to provide 24/7 watersupply to its customers. The financial penalty would be distributed to MWC’s customers throughrebates.
On September 18, 2019, MWC received a copy of the Decision of the Supreme Court on the case of‘Manila Water Company, Inc. vs. The Secretary of the Department of Environment and NaturalResourses, et.al.’ with G.R. No. 206823 promulgated on August 6, 2019. The Supreme Court foundMWC liable for fines which earn legal interest of 6% per annum from finality and until full satisfactionthereof. On October 2, 2019, MWC filed a Motion for Reconsideration with the Supreme Court. As ofDecember 31, 2019, MWC has not received any resolution from the Supreme Court.
On February 3, 2020, MWC and Prime Metroline Holdings, Inc., on behalf of Trident Water, acompany to be incorporated, signed a subscription agreement for the acquisition of 25% ownershipinterest in MWC or 820.0 million newly issued common shares at P=13.00, subject to fulfillment ofconditions. Subsequently, the Parent Company will grant Trident Water its proxy rights over MWC’spreferred shares held through the Parent Company’s wholly-owned subsidiary, Philwater HoldingsCompany, Inc. Upon completion of the transaction which is expected to be within one year from thereporting period, Trident Water will have 51.00% voting interest and thus, obtain control over MWC.Accordingly, MWC qualified as a group held for deemed disposal as of December 31, 2019 in theconsolidated financial statements of the Parent Company.
As of December 31, 2019 and 2018, ownership interest of the Parent Company in MWC is at 35.1%.The fair value of the MWC shares held by the Parent Company amounted to P=9.0 billion andP=23.1 billion as of December 31, 2019 and 2018, respectively. The voting rights held by the ParentCompany and Philwater in MWC is 80.2% and 80.3% as of December 31, 2019 and 2018,respectively.
Investment in AHHIIn April 2019, AHHI subscribed to additional 5,126 common shares to be issued out of the increase inauthorized capital stock of Medgrocer with a total subscription price of ₱5.13 million at ₱1,000 pershare.
In June 2019, AHHI agreed to convert the loan advances provided to Medgrocer amounting to₱1.3 million in exchange for 1,300 common shares to be issued out of the increase in the authorizedcapital stock of Medgrocer, each share with a par value of ₱1,000 per share.
On June 3, 2019, AHHI received the approval of the PCC on its proposed increase in stake in theGenerika companies which increased AHHI’s ownership from 50% to 52.5%.
On November 27, 2019, the BOD approved the incorporation of Vigos Ventures Inc. (VVI). OnJanuary 7, 2020 VVI was approved by the SEC for incorporation with an authorized capital stock₱200 million. AC Health subscribed to 0.45 million common shares and 0.05 common shares at asubscription price of ₱10 per share.

- 32 -
*SGVFS039490*
AHHI, through its technology arm, Vigos, expanded its digital portfolio with a recent investment inFibronostics, a global US-based healthcare technology company focusing on non-invasive algorithm-based solutions for diagnostic testing. The agreement was signed on May 31, 2019 between AHHIand SPRIM, the bioscience R&D firm from which Fibronostics was spun off.
On various dates in 2019, the Parent Company infused P=1,666.7 million to AHHI for certain capitalexpenditure, clinic expansion and new business development. Outstanding subscription as ofDecember 31, 2019 amounted to P=1,959.7 million. In 2018, the Parent Company infusedP=389.8 million to fund AHHI’s various investments.
Investment in AC InfraOn various dates in 2019 and 2018, the Parent Company infused additional capital to AC Infraamounting to P=2,371.0 million and P=1,649.3 million, respectively. The additional capital was used forthe following:i. Operating and capital expenditures of AC Infra;ii. Investment in Light Rail Manila Holdings, Inc.;iii. Rehabilitation project of Ninoy Aquino International Airport;iv. Funding for E-commerce center; andv. Funding for Entrego, a company to be engaged in logistics business.
Investment in ALIOn April 24, 2019, ALI's subsidiary, AyalaLand REIT, Inc. (AREIT), announced its plan to publicly listas a Real Estate Investment Trust (REIT) under the current Implementing Rules and Regulations ofthe SEC on REITs and following the minimum public ownership requirement of 67%.
On June 20, 2019, ALI sold its 20% equity interest or 8,051 common shares in Laguna Technopark,Inc. (LTI) to AyalaLand Logistics Holdings Corp. (ALLHC) for a consideration of P=800 million.
On September 9, 2019, Orion Land, Inc, (OLI) sold through a special block sale, 215,090,031common shares of ALLHC to Avida Land Corporation for a total consideration of P=628.1 million.Subsequently, these shares were acquired by ALI through a special block sale for a totalconsideration of P=628.1 million. This resulted to increasing ALI’s effective ownership in ALLHC to71.46%.
ALI shares with carrying value of P=258.9 million as of December 31, 2019 and 2018 werecollateralized to secure the Parent Company’s loan facility. The fair value of ALI shares collateralizedamounted to P=15.4 billion and P=14.0 billion as of December 31, 2019 and 2018, respectively.
On various dates in 2019 and 2018, the holders of AYCFL’s US$300.0 million guaranteedexchangeable bonds claimed the option to convert $292.8 million bonds to 377,465,612 ALI ordinaryshares, and $7.0 million bonds to 8,844,704 ALI ordinary shares, respectively. In 2019 and 2018, ALIshares were sold for a total settlement amount of P=17,014.4 million, P=758.1 million of which wasreceived as deposits in prior years and P=392.8 million, which was also received as deposits in prioryears, respectively, resulting to a gain on sale of investment in shares of stock amounting toP=16.7 billion and P=386.1 million, respectively, recognized as other income in the Parent Companyfinancial statements (see Notes 18 and 26).
The fair value of the ALI shares held by the Parent Company amounted to P=297.8 billion andP=281.1 billion as of December 31, 2019 and 2018, respectively. The voting rights held by the ParentCompany in ALI is 67.3% and 68.7% as of December 31, 2019 and 2018, respectively.
Investment in MHIOn June 30, 2018, the BOD of MHI approved and authorized the increase in the authorized capitalstock from P=350.0 million divided into 350.0 million shares with a par value of P=1.0 per share toP=388.1 million divided into 388.1 million shares with a par value of P=1.0 per share.

- 33 -
*SGVFS039490*
In 2018, the Parent Company subscribed to MHI shares for P=1.03 billion to fund its entitlement forBPI’s stock offering.
On May 27, 2019, the Securities and Exchange Commission (SEC) approved the increase in theauthorized capital stock of MHI.
Investment in BHLIn November 2019, the Parent Company through BHL’s wholly-owned subsidiary, VIP InfrastructureHoldings Pte. Ltd. (VIP), signed definitive agreements to acquire 20% stake each in Yoma StrategicHoldings, Inc. (YSH) and First Myanmar Investment Public Co. (FMI). As of December 31, 2019, VIPand YSH closed the first tranche of the placement shares, with VIP owning 14.9% of the outstandingshares of YSH.
Investment in AVHCIn 2018, the Parent Company infused a total of P=18.6 million to AVHC for its additional investment inBF Jade.
On July 12, 2019, the BOD of AVHC approved the amount of P=63.75 million for a 25.5% ownership ina joint venture with BPI Capital Corporation and Telly Systems, Inc. for the development of anintegrated payment exchange platform.
In 2019, the Parent Company, through AC Ventures, established the Technology Innovation VentureFund (Active Fund). Active Fund will be the capital fund platform to understand disruptive trends andinnovations which is key to staying relevant and future-ready as a Group. The platform allowsparticipation and active involvement of business units within the Group. Active Fund will be managedby AC Ventures and will be participated in by the following subsidiaries of the Group (with theirinvestment commitment): AC Ventures (US$100 million), Globe (US$25 million), AC Energy(US$25 million), BPI (US$20 million), AC Industrials (US$20 million), ALI (US$15 million) and MWCI(US$5 million).
Investment in AACOn various dates in 2019, the Parent Company infused P=119.4 million to AAC to fund its variousexpenditures.
Investment in IMIThe fair value of the IMI common shares held by the Parent Company amounted to P=10.9 million andP=14.9 million as of December 31, 2019 and 2018, respectively. The voting rights held by the ParentCompany in IMI, directly and indirectly, through AITHI, is 52.3% and 52.1% as of December 31, 2019and 2018, respectively.
Investment in AEIIn 2018, the Parent Company infused additional capital to AEI amounting to P=2,597 million to fund thefollowing:i. Merger of IPO and AEI with IPO as the surviving corporation;ii. AEI’s purchase of National Teacher’s College amounting to P=1,231.9 million; andiii. Affordable Private Education Canter (APEC) funding needs for school year 2018 - 2019.
On October 1, 2018, AEI and IPO executed a memorandum of agreement (MOA) for the merger, withIPO as the surviving entity and with House of Investments (HI) and the Parent Company owning48.18% and 33.5%, respectively. The merger, which was approved by the stockholders of IPO andAEI on December 12, 2018 and December 5, 2018, respectively, was approved by the PCC onDecember 12, 2018. On January 31, 2019, AEI and IPO executed the Plan and Articles of merger,as approved by their respective BOD and stockholders. The Plan and Articles of Merger weresubmitted to the SEC on February 8, 2019 and were approved by the SEC on April 24, 2019 witheffectivity date of May 2, 2019.

- 34 -
*SGVFS039490*
Upon SEC approval, IPO issued 295,329,976 common shares in exchange for 1,993,477,338 AEIshares, which constitutes 28.28% of IPO. This transaction resulted to the Parent Companyrecognizing P=238.4 million gain on disposal of AEI shares. Post-merger, the Parent Companyacquired additional 54,500,000 IPO common shares from existing HI affiliates for a consideration ofP=809.8 million, inclusive of directly-related fees.
The fair value of IPO shares held by the Parent Company amounted to P=3,319.9 million as ofDecember 31, 2019.
Investment in BPIOn January 17, 2018, the BOD of BPI approved the offering for subscription of up to 567.0 millionshares of BPI by way of a stock rights offering (SRO) up to P=50.0 billion. The rights offered involvedthe issuance of 14.2% of BPI outstanding shares to shareholders on record as of April 6, 2018. TheParent Company subscribed to 190.7 million shares amounting to P=17.2 billion which resulted in aminimal increase in ownership of BPI from 30.5% to 30.9%.
The fair value of the BPI shares held by the Parent Company amounted to P=122.2 billion andP=130.7 billion as of December 31, 2019 and 2018, respectively.
Investment in LLCIn May 2019, the Parent Company infused P=24.0 million to LLC for construction works. The ParentCompany’s ownership of LLC remained at 40% after the transaction.
Investment in LHIIn May 2018, LHI completed the subscription to 112.2 million shares proportionate and unsubscribedrights share in BPI’s SRO.
As of December 31, 2019 and 2018, LHI owns 904.2 million common shares of BPI representing adirect ownership interest in BPI of 20.1%. The Parent Company and GIC Special Investments(GICSI) Pte Ltd., the entity controlling Arran Investments Pte. Ltd., as joint venture partners, agreedto vote its BPI shares based on the common position reached jointly by them as shareholders.The fair value of BPI shares held by LHI amounted to P=79.5 billion and P=85.0 billion as ofDecember 31, 2019 and 2018, respectively.
Investment in GlobeThe fair value of the Globe shares held by the Parent Company amounted to P=83.2 billion andP=78.2 billion as of December 31, 2019 and 2018, respectively.
Allowance for probable impairment lossMovements in Allowance for probable impairment losses on investments in subsidiaries, associatesand joint ventures follow:
2019 2018
(In Thousands)
At January 1 P=21,883,250 P=21,883,250Provision (Note 18) 7,425,040 –Reversals (Note 18) (4,922,040) –
At December 31 P=24,386,250 P=21,883,250
In 2019, the Parent Company reversed impairment loss of P=4,922.0 million which resulted from areturn of capital at cost for which an allowance for impairment was previously provided for.
Also in 2019, the Parent Company recognized additional impairment losses on certain investmentswhere the carrying amount exceeded the recoverable amount (see Note 18). Recoverable amountsof investments in subsidiaries, associates and joint ventures that have been determined to haveimpairment indicators as of December 31, 2019 were based on value in use with discount rates of 9%

- 35 -
*SGVFS039490*
to 15%, revenue growth rates ranging from 1.5% to 10%, and terminal values. Recoverable amountsas of December 31, 2018 were based on fair value less cost to sell with reference to market pricesand dividend yields.
8. Investment Properties
The movements in investment properties follow:
2019
LandBuildings andImprovements
Constructionin progress Total
(In Thousands)
CostAt January 1 P=1,035,433 P=457,072 P=44,643 P=1,537,148Disposal (8,605) − − (8,605)
At December 31 1,026,828 457,072 44,643 1,528,543
Accumulated depreciation andimpairment losses
At January 1 26,616 379,671 − 406,287Depreciation and provisions − 12,276 − 12,276
At December 31 26,616 391,947 − 418,563
Net Book Value P=1,000,212 P=65,125 P=44,643 P=1,109,980
2018
LandBuildings and
ImprovementsConstruction
in progress Total
(In Thousands)
CostAt January 1 P=1,035,433 P=457,072 P=44,643 P=1,537,148Additions – – – –Disposal – – – –
At December 31 1,035,433 457,072 44,643 1,537,148
Accumulated depreciation andimpairment losses
At January 1 26,616 364,640 – 391,256Depreciation and provisions – 15,031 – 15,031
At December 31 26,616 379,671 – 406,287
Net Book Value P=1,008,817 P=77,401 P=44,643 P=1,130,861
The construction in progress pertains to the construction of the Philippine Cerebral Palsy Buildinglocated at Sacred Heart Street, San Antonio Village, Makati City, Philippines.
Certain parcels of land and buildings are leased to related parties (see Note 21). Rental frominvestment is based on a certain percentage of the gross revenue of the tenants, as provided underthe terms of the lease contract.
Rental income from investment properties included under “Other income’ in the parent companystatements of income amounted to P=179.9 million and P=185.1 million in 2019 and 2018, respectively(see Note 18). Depreciation expense related to the investment properties held to earn rentalsamounted to P=12.3 million and P=15.0 million in 2019 and 2018.
In July 2016, the Parent Company entered into an operating lease agreement with Crans MontanaProperty Holdings Corp. (Crans Montana), a wholly-owned subsidiary of ALI, for the lease of a land inLegaspi Village, Makati City. The lease is for a period of 25 years commencing on the start ofcommercial operations of the apartment building to be built by the Lessee.
The apartment building started its commercial operation on September 1, 2018. Rental incomerecognized in 2019 and 2018 amounted to P=1.6 million and P=0.8 million, respectively (see Note 21).

- 36 -
*SGVFS039490*
In December 2018, the Parent Company sold a parcel of land in San Antonio, Makati to CransMontana for a total consideration of P=99.4 million. The Parent Company recognized a total gain ondisposal of San Antonio property and other investment properties amounting to P=100.9 million in 2018(see Note 18).
In August 2019, the Parent Company sold a parcel of land located in the Province of Misamis Orientalto Laguna Technopark, Inc. (LTI) for a total consideration of P=299.1 million (see Note 18).
The fair value of the Parent Company’s land and buildings and improvements amounted toP=10.1 billion, including certain investment properties which were not covered by previous appraisal,and P=10.3 billion as of December 31, 2019 and 2018, respectively. The fair value of the investmentproperties was determined based on valuations performed by independent professionally qualifiedappraisers. The valuation techniques and key inputs to valuation of investment properties arepresented in Note 24 to the parent company financial statements.
The Parent Company has determined that the highest and best use of the land and buildings leasedto related parties is its current use. The Parent Company owns certain parcels of idle land which isintended to be sold or developed in the future. The highest and best use of these parcels of land hasbeen determined to be for commercial and agricultural land utilization.
The fair value of the investment properties was arrived using the Market Data Approach and CostApproach for land and building and improvements, respectively.
In Market Data Approach, the value of the land is based on sales and listing of comparable propertyregistered within the vicinity. The technique of this approach requires the establishment ofcomparable property by reducing reasonable comparative sales and listings to a commondenominator. This is done by adjusting the differences between the subject property and those actualsales and listings regarded as comparable. The properties used as basis of comparison are situatedwithin the immediate vicinity of the subject property.
Cost Approach is a comparative approach to the value of the building and improvements or anotherasset that considers as a substitute for the purchase of a given property, the possibility ofconstructing another property that is a replica of, or equivalent to, the original or one that could furnishequal utility with no undue cost resulting from delay. It is based on the reproduction cost (new) of thesubject property or asset, less total (accrued) depreciation, plus indirect costs attributed to theimprovement.
9. Financial Assets at Fair Value through OCI
This account consists of equity investments, which are presented as financial assets at fair valuethrough OCI as at December 31, 2019 and 2018, as follows:
2019 2018
(In Thousands)
Quoted investments Alabang Country Club P=329,400 P=338,500 Manila Golf Club 76,000 50,000 Manila Polo Club 46,000 40,000
Wack Wack Golf Club 35,000 35,000Sta. Elena Golf Club 9,500 10,000Manila Electric Company 6,656 8,097Makati Sports Club 5,400 3,750
The Philodrill Corporation 2,069 2,445Canlubang Golf Club 2,000 2,400
Others 22,445 18,019
P=534,470 P=508,211

- 37 -
*SGVFS039490*
The movements in fair value reserve of financial assets through OCI is as follows:
2019 2018
(In Thousands)
At January 1 (see Note 2) P=282,726 P=212,460
Disposals (18,962) (11,546)
Fair value gain recognized in OCI 41,911 81,812
At December 31 P=305,675 P=282,726
10. Service Concession Assets
The movements in this account follow:
2019 2018
(In Thousands)
CostAt January 1 P=2,237,735 P=2,230,982Construction revenue 29,571 6,931Retirement − (178)
At December 31 2,267,306 2,237,735
Accumulated AmortizationAt January 1 420,261 294,449Amortization 106,484 125,869Retirement − (57)
At December 31 526,745 420,261
Net Book Value P=1,740,561 P=1,817,474
In 2019 and 2018, the Parent Company performed civil and structural works on the concession
assets which were recorded as construction revenue. The recognized revenue is equal to the related
costs (see Note 18).
Concession Agreement with the DPWHThe Parent Company entered into a concession agreement with the DPWH to finance, design,construct, operate and maintain the Daang Hari - SLEX Link Road, otherwise known as MCX(the Project) in April 2, 2012. Under the concession agreement, the Parent Company will:
a. Purchase the advance works on Segment I of the Project from Alabang - Sto. Tomas
Development, Inc. and finance and construct the remaining works thereof;
b. Finance, design, and construct Segment II of the Project;
c. Undertake the operations and maintenance (O&M) of the Project;
d. Impose and collect tolls from the users of the Project; and
e. Grant business concessions and charge and collect fees for non-toll and toll user related facilities
situated within the basic and additional right of way of the project.
The Parent Company is authorized to adjust the toll rates once in every two years in accordance withthe prescribed computation set out in the Concession Agreement and upon compliance with the rulesand regulations on toll rate implementation as issued or may be issued by the Toll Regulatory Board(TRB).

- 38 -
*SGVFS039490*
In the event that the Parent Company is disallowed from charging and collecting the authorizedamounts of the toll rates as prescribed in the Concession Agreement from the users of the MCX, theParent Company shall be entitled to either of the following:
a. Compensation from the DPWH of the toll income forgone by the Parent Company which shall becalculated based on the prescribed computation under the Concession Agreement.
b. Extension of the Concession Period to compensate the Parent Company for the forgone toll
income, the length of the extension shall be mutually agreed by the Parent Company and the
DPWH.
The Parent Company shall remit to the DPWH 5%, as their share, of the gross revenues arising fromthe grant of business concessions of its non-toll related facilities situated within the basic andadditional right of way of the MCX.
The Concession Period commenced on the date of the issuance of the Notice to Proceed withSegment II and shall end on the date that is 30 years thereafter, unless otherwise extended orterminated in accordance with the provisions of the Concession Agreement. Notice to Proceed wasissued last June 29, 2015. Any extension of the Concession Period shall in no event be beyond 50years after the date of the issuance of the Notice to Proceed with Segment II.
At the end of the Concession Period, MCX shall be turned over by the Parent Company to the DPWHin the condition required for turnover, as provided for in the Concession Agreement.
On July 24, 2015, MCX was opened to the public.
In accordance with the Concession Agreement, the Parent Company shall have the right to impose
and collect toll fees (inclusive of value-added tax) from the users of the MCX at the following rates:
Vehicle Class Initial Toll Rate (flat rate)
Class 1: Light vehicles P=17.00
Class 2: Medium-weight vehicles 34.00
Class 3: Heavy vehicles 51.00
Periodic Toll AdjustmentOn September 27, 2016, the Parent Company has filed for a Petition for Approval of Periodic TollAdjustment. Under Section 13.2 of the Concession Agreement, Concessionaire is authorized to adjustthe Toll Rate every two years. Since MCX started commercial operations on July 24, 2015, the ParentCompany is entitled to adjust its toll for MCX effective July 24, 2017. However, under Section 3 of the2013 Revised Rules of Procedure of the Toll Regulatory Board (TRB), the petition has to be filed onor before 30 September. Thus, the Petition was filed knowing fully well that the effectivity of theadjusted toll rate will still be on July 24, 2017.
On June 19, 2017, TRB sent an order directing the publication of the full petition in a newspaper ofgeneral circulation, along with the notice to expressway users that they may file an opposition withinthe period provided for under the Rules. Accordingly, the full petition was published on July 25, 2017.On November 8, 2017, all TRB requirements for the approval of the toll rate increase were submitted.
On September 28, 2018, the second toll rate increase petition has been submitted to the TRB and theorder directing the publication of the full petition in a newspaper of general circulation, along withthe notice to expressway users that they may file an opposition within the period provided for underthe Rules, was sent by TRB on October 26, 2018. Accordingly, the petition was published onNovember 13, 2018. No opposition has been reported until the prescribed filing period.

- 39 -
*SGVFS039490*
On March 26, 2019, the approved resolution of the Toll Regulatory Board (TRB) on Ayala’s 2016Petition for Approval of Periodic Toll Rate Adjustment with Application for Provisional Relief wasreceived. The approved new toll rates are as follows:
Vat Inclusive Rates (Php)
Vehicle Class Current Adjusted Increment
Class I 17.00 17.00 0.00Class II 34.00 35.00 1.00Class III 51.00 52.00 1.00
As indicated in the resolution, prior to TRB’s issuance of the Notice to Start Collection, Ayala isdirected to publish the approved new rates applicable to MCX Expressway (in accordance with TRBrules) and to submit proof of such publication.
Variation Order
On February 25, 2013, the DPWH sent a Variation Notice to Pertconsult International, the Project’s
Independent Consultant (IC), instructing the IC to advise the Parent Company to submit a request for
Prior Clearance and Variation Proposal in connection with TRB’s directive to include in the Project’s
design a provision for future expansion of SLEX to accommodate possible fifth lane for both
directions at the Filinvest to Susana Heights Section. IC, in its letter to the Project’s Management
Consultant dated March 4, 2013, effectively directed the Parent Company to comply with the DPWH
letter dated February 25, 2013.
Such proposal was made in accordance with the Concession Agreement which provides that in the
event the DPWH initiates a variation, the Parent Company as concessionaire, shall prepare a
proposal setting out the necessary details and additional cost estimates.
On April 10, 2014, the Parent Company submitted a variation proposal to the DPWH and sought for
approval of (1) Direct payment of the construction cost for the works related to the provisioning of the
SLEX future expansion amounting to P=251.2 million inclusive of VAT and (2) Extension of the
concession period by 3 ½ years due to the delays encountered as a result of the variation order.
DPWH, in its letter to IC dated February 6, 2015, advised the same that it has issued the approved
Prior Clearance/Authority to Issue Variation Order No. 1 with a cap of P=223.0 million.
On May 27, 2015, the DPWH approved the adjusted cost of the variation order in the amount of
P=223.0 million (which was rectified by the Bureau of Construction) variation proposal and endorsed it
to the National Economic and Development Authority (NEDA) for information and appropriate action.
Accordingly, the Parent Company reclassified the amount of P=223.0 million from service concession
account to receivables from the Government upon DPWH’s approval of the variation order.
NEDA in its meeting held on July 15, 2015 confirmed the recommendation of the variation order.
On May 31, 2016, variation order for the project amounting to P=16.6 million was reclassified to SCA
under investment in toll road. Also, various reimbursement for expenses incurred during the
acquisition of the right of way amounting to P=1.1 million was received from the DPWH under the
Reimbursement Agreement.
On November 21, 2016, the IC recommended to the DPWH that a Certificate of Final Completion be
issued for the project. Subsequently, DPWH, in its letter dated December 21, 2016, issued the
certificate of completion. As of December 31, 2019 and 2018, the Parent Company’s other
receivables includes receivable from DPWH amounting to P=215.9 million pertaining to variation order
and reimbursement of right-of-way acquisition claims.

- 40 -
*SGVFS039490*
Interoperability AgreementOn July 21, 2015, the Parent Company, MCX Tollway, Inc. (MCXI) (an 80% owned subsidiary of ACInfra), South Luzon Tollway Corporation (SLTC), and Manila Toll Expressway Systems, Inc. (MATES)signed a Memorandum of Agreement on Interoperability, together with an Addendum thereto (“MOAon Interoperability”), of the Project and SLEX. The MOA on Interoperability provides the frameworkthat will govern the interface and integration of the technical operations and toll collection systemsbetween the Project and SLEX, and to ensure seamless travel for road users.
On the same date, MCXI and MATES signed the Toll Collection Services Agreement which appointsMATES to perform toll collections services in MCX.
On September 15, 2017, the Parent Company and MCXI together with San Miguel HoldingsCorporation, Private Infra Development Corporation, Citra Metro Manila Tollways Corporation,Skyway O&M Corporation, Citra Central Expressway Corporation, Vertex Tollways DevelopmentIncorporated, SLTC, MATES, Star Infrastructure Development Corporation, Star Tollway Corporation,Metro Pacific Tollways Corporation, NLEX Corporation, Cavitex Infrastructure Corporation, MPCalaHoldings Inc., Bases and Conversion Development Authority, Department of Transportation,Department of Public Works and Highways, Land Transportation Office and Toll Regulatory Boardsigned the Memorandum of Agreement for Toll Collection Interoperability (MOA). The MOA aims for atimely, smoothly, and fairly implementation of the ETC Systems and Cash Payment Systems’interoperability of the covered expressways. As of December 31, 2019, discussions are ongoingamong and between the parties for the implementation of the MOA.
Operations and Maintenance ContractsThe Parent Company shall have the exclusive right and corresponding obligation to undertake theO&M of the Project. As such, on December 19, 2014, the Parent Company entered into anOperations and Maintenance Agreement (OMA) with MCXI for the operations and maintenance of theProject. The OMA has a term of seven (7) years, renewable for another seven (7) years, with the rightof first offer in favor of MCXI. As compensation, the Parent Company shall pay an annual recurringfee of P=77.6 million, exclusive of VAT, subject to yearly escalation using the Consumer PriceIndexation formula.
On the same date, MCXI signed two contracts with EGIS Projects Philippines, Inc. (Egis):
a. Operations Advisory Contract - to provide advice, among others, on the establishment andimplementation of procedures to enforce traffic regulations and safety measures in MCX; and
b. Maintenance Contract - to provide cleaning, inspection, repairs and maintenance on all parts ofMCX, its landscaping, traffic signs and others.
Both contracts have a term of seven (7) years and renewable for another seven (7) years. The annualrecurring fee for both contracts is ₱18.2 million, exclusive of VAT, and P=40.9 million, exclusive ofVAT, respectively and subject to yearly escalation to the effect of changes in labor index rates andconsumer price index as provided by the Department of Labor and Employment.
In 2016, the Parent Company amended its existing O&M agreement with MCXI reducing the annualfee to P=29.52 million, subject to yearly escalation, and novated the existing contracts of MCXI andEgis for the Parent Company to replace MCXI as the principal contracting party to the OperationsAdvisory and Maintenance contracts.
Non-Toll and Toll User Related FacilitiesOn October 24, 2016, the Parent Company entered into a lease agreement with Isuzu AutomotiveDealership, Inc. (the Lessee) for the lease of an approximately 15,000 square meters of theconcession area. The lease term is 20 years from October 1, 2016 to September 30, 2036, renewablefor another period not exceeding June 28, 2045 upon mutual agreement. The fixed initial basic rentof the leased concession area shall be P=1.3 million, exclusive of VAT, per month. Basic rent shallescalate by 5% at the start of the third year and every two years thereafter. The Lessee shall begiven a rent free construction period of 3 months from October 1, 2016 to December 31, 2016.

- 41 -
*SGVFS039490*
The leased concession area shall be used by the Lessee for the purpose of developing and operatinga dealership showroom and service center and to carry out other related retail, services and supportactivities incidental and complementary to its business and may be customary to the trade.
On February 2, 2017, the Parent Company entered into a lease agreement with Premier PetrolDistributors, Inc. (the Lessee) for the lease of an approximately 10,667 square meters of theconcession area. The lease term is 20 years from September 1, 2017 to August 31, 2037, renewablefor another period not exceeding June 28, 2045 upon mutual agreement. The fixed initial basic rentof the leased concession area shall be ₱1.1 million, exclusive of VAT, per month. Basic rent shallescalate by 5% at the start of the second year and every year thereafter. As of December 31, 2019,the lease terms are being re-negotiated.
On July 6, 2017, the Parent Company signed the contract of lease with Globe Telecom, Inc.(the Lessee) for the use of the following locations:
a. Macro Site - 64 square meters of land within the concession areab. Small Cell (Easy Macro) Site - 7 lamp posts locationsc. Atom Cells’ Site - 4 locations in the tunnel underneath SLEX
The lease term shall be twenty-eight (28) years and eleven (11) months, commencing onAugust 1, 2016 and continuing until June 28, 2045. The fixed initial basic rent of the leasedconcession area shall be P=31 thousand per month, exclusive of VAT, subject to annual escalation of4.5% starting at the beginning of the second year.
On November 13, 2018, the Parent Company and Pilipinas Shell Petroleum Corporation executed atwenty (20) years lease contract for an approximate area of 9,689 square meters. The lease contractwas effective July 15, 2018 and ending on July 14, 2038, renewable for another period not exceedingDecember 28, 2044 upon mutual agreement. The fixed initial monthly basic rent of the leasedconcession area shall be P=823,565, exclusive of VAT. Basic rent shall escalate by 5% at the start ofthe third year and every year thereafter.
For all non-toll user related agreements, including short-term advertising leases, concerning theconcession area, the Parent Company will remit, to the DPWH, 5% of its share on the gross revenuesin accordance with Section 12.6.b of the Concession Agreement.
11. Property and Equipment
The movements of property and equipment follow:
2019
CondominiumUnits
CondominiumImprovements
Furniture,Fixtures and
EquipmentTransportation
EquipmentConstruction
in Progress Total
(In Thousands)
CostAt January 1 P=412,178 P=291,586 P=363,568 P=199,372 P=2,647 P=1,269,351Reclassification − − 1,422 − (1,422) −Additions 17,174 − 11,948 42,549 16,754 88,425Disposals − − (229) (40,318) − (40,547)Retirement − − (80) − − (80)
At December 31 429,352 291,586 376,629 201,603 17,979 1,317,149
Accumulated DepreciationAt January 1 359,808 197,038 278,725 81,020 − 916,591Depreciation 16,888 58,318 28,875 38,101 − 142,182Disposals − − (78) (25,397) − (25,475)Retirement − − (80) − − (80)
At December 31 376,696 255,356 307,442 93,724 − 1,033,218
Net Book Value P=52,656 P=36,230 P=69,187 P=107,879 P=17,979 P=283,931

- 42 -
*SGVFS039490*
2018
CondominiumUnits
CondominiumImprovements
Furniture,Fixtures and
EquipmentTransportation
EquipmentConstruction
in Progress Total
(In Thousands)
CostAt January 1 P=412,178 P=288,278 P=360,371 P=210,886 P=263 P=1,271,976Additions – 3,308 22,857 51,150 2,384 79,699Disposals – – (82) (62,664) – (62,746)Retirement – – (19,578) – – (19,578)
At December 31 412,178 291,586 363,568 199,372 2,647 1,269,351
Accumulated DepreciationAt January 1 343,321 138,997 259,949 85,049 – 827,316Depreciation 16,487 58,041 37,895 41,521 – 153,944Disposals – – (52) (45,550) – (45,602)Retirement – – (19,067) – – (19,067)
At December 31 359,808 197,038 278,725 81,020 – 916,591
Net Book Value P=52,370 P=94,548 P=84,843 P=118,352 P=2,647 P=352,760
Depreciation on property and equipment charged to operations amounted to P=142.2 million andP=153.9 million in 2019 and 2018, respectively.
The Parent Company recognized gain on disposal which amounted to P=3.4 million and P=4.8 million in2019 and 2018, respectively. These were included as part of gain on sale of property and equipmentin “Other income” (see Note 18).
12. Provision for Maintenance Obligation
Provision for maintenance obligation pertains to the present value of the estimated contractualobligations of the Parent Company to undertake the financing of the Project’s periodic maintenance,which includes renewal and restoration of toll roads and toll road facilities prior to turnover of theasset to DPWH, the grantor.
Under the Minimum Performance Standards and Specifications (MPSS), the Parent Company hasthe obligation to perform routine and periodic maintenance. Routine maintenance pertains to day-to-day activities to maintain the road infrastructures while periodic maintenance comprises of preventiveactivities against major defects and reconstruction. Moreover, the Parent Company is required toperform maintenance and repair work in a manner that complies with the MPSS once it hands theasset back to the DPWH. The provision is a product of the best estimate of the expenditure requiredto settle the obligation based on the usage of the road during the operating phase. The amount isreduced by the actual obligations paid for heavy maintenance of the SCA.The movements in the account follow:
2019 2018
(In Thousands)
At January 1 P=46,851 P=29,949Provisions for the period (Note 18) 16,538 15,139Accretion of interest (Note 18) 2,630 1,763
66,019 46,851Noncurrent portion (52,413) (35,455)
Current portion P=13,606 P=11,396

- 43 -
*SGVFS039490*
13. Accounts Payable and Accrued Expenses
This account consists of:
2019 2018
(In Thousands)
Accrued expenses P=1,194,196 P=1,233,704Interest payable (Note 21) 577,827 603,075Accounts payable 302,143 279,407Payables to related parties (Note 21) 242,549 265,716Deposit payable (Note 21) − 758,132Others 28,620 8,884
P=2,345,335 P=3,148,918
Accrued expenses pertain mainly to accrual for short-term employee benefits and various generaland administrative expenses of the Parent Company. Total accrual for short-term employee benefitsamounted to P=728.3 million and P=723.8 million as of December 31, 2019 and 2018, respectively.
Interest payable pertains to interest incurred on bank loans and fixed bonds but not yet paid.Accounts payable pertains to payables to non-related parties. These payables are non-interestbearing.
Payables to related parties consist of non-interest bearing liabilities to related parties and others thatare due and demandable.
Deposit payable pertains to deposits from AYCFL for the exchangeable bonds convertible into ALIshares (see Note 26).
Other payables are non-interest bearing and are normally settled within one year. This also includesoutput VAT amounting to P=17.63 million and nil as of December 31, 2019 and 2018, respectively, andexpanded withholding tax payable.
14. Other Current Liabilities
This account consists of:
2019 2018
(In Thousands)
Subscriptions payable (Notes 7 and 21) P=2,069,413 P=1,785,734Others 11,856 11,858
P=2,081,269 P=1,797,592
As of December 31, 2019, the subscriptions payable pertains to the Parent Company’s investment inAHHI, AVHC and AAC amounting to P=1,959.7 million, P=70.3 million, and P=39.4 million, respectively.
While as of December 31, 2018, the subscriptions payable pertains to the Parent Company’sinvestment in ACEI, AVHC and AHHI amounting to P=1,687.5 million, P=96.9 million and P=1.4 million,respectively.

- 44 -
*SGVFS039490*
15. Long-term Debt
This account consists of the following:
2019 2018
(In Thousands)
Bank loans - with fixed interest rates ranging from5.3% to 6.0% and floating interest rates basedon applicable benchmark plus credit spreadranging from 0.5% to 0.70% with varyingmaturity dates up to 2028 (Note 25) P=25,833,141 P=27,405,387
Bonds 39,710,925 39,762,594
Total long-term debt 65,544,066 67,167,981Less current portion 4,387,500 525,500
P=61,156,566 P=66,642,481
Reconciliation of carrying amount against nominal amount follows:
2019 2018
(In Thousands)
Nominal amount P=65,864,650 P=67,513,250Less unamortized discount 320,584 345,269
P=65,544,066 P=67,167,981
Generally, the Parent Company’s long-term loans are unsecured. Due to certain regulatoryconstraints in the local banking system regarding loans to directors, officers, stockholders and relatedinterest, some of the Parent Company’s credit facilities with a local bank are secured by shares ofstock of a subsidiary with a fair value of P=15.4 billion and P=13.8 billion as of December 31, 2019 and2018, respectively, in accordance with Bangko Sentral ng Pilipinas (BSP) regulations (see Note 7).A portion of the Parent Company’s loans with BPI are also secured by dollar deposits of a subsidiaryamounting to P=4.3 billion as of December 31, 2019. All credit facilities of the Parent Companyoutside of BPI are unsecured, and their respective credit agreements provide for this exception.
The Parent Company positions its deals across various currencies, maturities and product types toprovide utmost flexibility in its financing transactions.
In November and December 2013, the Parent Company availed a P=2.0 billion and a P=4.3 billion loanfrom various banks to mature in 2018 and 2020, respectively. The P=2.0 billion loan shall have interestrate per annum equal to the 3-month PDST-R2 plus a spread of 100 basis points (1%) per annum, orBSP overnight reverse repurchase (RRP) rate plus a spread of 25 basis points (0.25%), whichever ishigher. In February 2016 and November 2017, the Parent Company paid the first and secondprincipal payment for the P=2.0 billion loan which amounted to P=100.0 million each. In November2018, the Parent Company paid the final principal payment which amounted to P=1.8 billion.The P=4.3 billion loan shall have interest rate per annum equal to the 6-month PDST-R1 plus a spreadof thirty basis points (0.30%) for the first six months and 3-month PDST-R1 plus a spread of sixtybasis points (0.60%) thereafter. In December 2015, 2016, 2017, 2018 and 2019, the ParentCompany paid the five principal payments for the P=4.3 billion loan which amounted to P=42.5 millioneach.
In August 2015, the Parent Company availed a 7-year loan from a local bank amounting toP=3.0 billion which bears fixed interest rate of 5.2883% per annum. Principal repayments amountingto P=30.0 million shall be made at the end of the third year until the sixth year and payment ofremaining principal balance amounting to P=2.9 billion at maturity date.

- 45 -
*SGVFS039490*
In December 2016, the Parent Company entered into a revolving term loan agreement amounting toP=10.0 billion. The first drawdown of the loan amounted to P=300.0 million on December 22, 2017 witha quarterly repricing rate and a tenor of three years. The P=300.0 million shall have interest rateequivalent to (i) the Benchmark Rate-Floating plus a margin of seventy basis points (0.70%) perannum or (ii) the 28-day BSP Deposit Facility Rate plus a margin of forty-five basis points (0.45%) perannum, whichever is higher. On February 23, 2018 and July 19, 2018, the Parent Company drew anadditional P=2.5 billion for three years and P=0.5 billion for four years, respectively. Both drawdownsare repriced quarterly similar to the terms of the initial drawdown. The Parent Company paid the firstprincipal payment for the P=300.0 million and P=0.5 billion drawdowns amounting to P=3.0 million andP=12.5 million, respectively, in 2018. In 2019, the Parent Company paid the final principal payments ofP=297.0 million for the first drawdown, P=2.5 billion for the second drawdown, and P=0.5 billion for thethird drawdown.
On November 4, 2019, the Parent Company drew down a 45-day P=10 billion loan from its revolvingterm loan agreement dated December 1, 2016. The principal and interest were fully paid onDecember 9, 2019.
On January 30, 2018, the Parent Company signed the following loan facilities with BPI that aresecured by collateral:a. P=1.9 billion 10-year loan facility with ALI shares as collateral (70% of outstanding loan on 2:1
collateral ratio). The loan shall have interest rate equivalent to (i) the Benchmark Rate-Floatingplus a margin of sixty basis points (0.60%) per annum or (ii) the average of BSP OvernightDeposit Facility (ODF) and BSP Term Deposit Auction Facility (TDF) Rate of the tenor nearestthe interest period, whichever is higher; and
b. P=10.0 billion 10-year loan facility with US$ deposits as collateral (1:1 ratio). The loan shall haveinterest rate equivalent to (i) the Benchmark Rate-Floating plus a margin of sixty basis points(0.60%) per annum or (ii) the average of BSP Overnight Deposit Facility (ODF) and BSP TermDeposit Auction Facility (TDF) Rate of the tenor nearest the interest period, whichever is higher.
P=1.9 Billion 10-year Loan Facility with ALI Shares as Collateral
On February 26, 2018, the Parent Company drew down the full amount of the P=1.9 billion loanwith ALI shares as collateral. In 2019 and 2018, the Parent Company paid four and threeprincipal payments, respectively, for the P=1.9 billion loan amounting to P=23.8 million each.
P=10.0 Billion 10-year Loan Facility with US$ Deposits as Collateral
On April 30, 2018, the Parent Company drew P=6.0 billion from its P=10.0 billion 10-year loanfacility secured by an assignment of AYCFL’s deposits amounting to $115.7 million. In 2018, theParent Company made two principal payments of P=75.0 million each, and pre-paid P=4.0 billion inOctober 2018. In 2019, the Parent Company made one principal payment of P=75.0 million andthree principal payments of P=12.5 million each, and pre-paid P=812.5 million in January 2019.
On May 15, 2018, the Parent Company drew down P=0.5 billion from the same facility secured byan assignment of AYCFL’s deposits amounting to $9.6 million. The Parent Company made twoprincipal payments worth P=6.3 million each in 2018, and one principal payment of P=6.3 million in2019. The Parent Company pre-paid the remaining balance of P=481.3 million on January 30,2019.
In January 2019, the Parent Company drew down the remaining P=3.5 billion from the loan facilitysecured by an assignment of AYCFL’s deposits amounting to $67.2 million. In 2019, ParentCompany paid four principal payments amounting to P=43.8 million each.

- 46 -
*SGVFS039490*
In April 2018, the Parent Company signed an P=11 billion fixed term loan facility with a local bank witha tenor of 8 years. The loan shall have a fixed interest rate of 6.0043% for the first five years, whichwas based on the prevailing 5-year PDST-R2 benchmark plus a spread of 65 basis points and willreprice at the prevailing 3-year benchmark plus a spread of 65 basis points. The amount was fullydrawn on April 30, 2018.
Also in April 2018, the Parent Company signed a P=5.0 billion term loan facility with a local bank. TheParent Company drew down P=2.0 billion with a tenor of 5 years with fixed interest rate of 6.0043%,which was based on the prevailing PDST-R2 benchmark plus a spread of 65 basis points.
BondsBelow is the summary of the outstanding Peso bonds issued by the Parent Company:
YearIssued Term
Interestrate
PrincipalAmount
(In thousands)
Carrying Value(In thousands)
Features2019 2018
2011 10 years 6.80% 9,903,400 9,885,752 9,970,466 20% balance puttable on the 5thanniversary of the issue date; balanceputtable on the 8th anniversary issue date
2012 15 years 6.875% 10,000,000 9,952,651 9,946,221 Callable from the 10th anniversary issueuntil every year thereafter until the 14thanniversary issue date
2016 7 years 3.92% 10,000,000 9,942,735 9,927,904 Callable from the 5.5th anniversary issue ata call option price of 100.25%
2017 8 years 4.82% 10,000,000 9,929,787 9,918,003 Callable from the 6.5th anniversary issue ata call option price of 100.25%
P=39,903,400 P=39,710,925 P=39,762,594
The outstanding Peso bonds of the Parent Company have been rated “PRS AAA” by PhilRatings.
Bonds due 2021In May 2019, the Parent Company paid P=96.6 million on the P=10.0 billion bonds issued in May 2011.
Bonds due 2025On February 10, 2017, the Parent Company issued P=10.0 billion, 4.82% bonds due in 2025. Thispertains to the second and final tranche of the P=20.0 billion fixed rate bonds program approved by theBOD on March 10, 2016.
The long-term debt of the Parent Company provides for certain restrictions and requirements withrespect to maintenance of financial ratios at certain levels. These restrictions and requirements werecomplied with by the Parent Company as of December 31, 2019 and 2018.
Interest paid amounted to P=3.9 billion and P=3.3 billion in 2019 and 2018, respectively (see Note 18).
16. Equity
The details of the Parent Company’s preferred and common shares follow:
Preferred A shares Preferred B shares Preferred C sharesVoting Preferred
shares Common shares
2019 2018 2019 2018 2019 2018 2019 2018 2019 2018
(In Thousands, except par value per share)
Authorized shares 12,000 12,000 58,000 58,000 40,000 40,000 200,000 200,000 900,000 900,000Par value per share P=100 P=100 P=100 P=100 P=100 P=100 P=1 P=1 P=50 P=50Issued and subscribed
shares 12,000 12,000 58,000 58,000 – – 200,000 200,000 631,162 630,627Outstanding shares
At beginning of year – – 47,000 47,000 – – 200,000 200,000 630,627 621,292Issuance of shares – – – – – – – – – 8,810Issued shares on
exercise of shareoptions – – – – – – – – 19 7
Subscribed shares – – – – – – – – 516 518
(Forward)

- 47 -
*SGVFS039490*
Preferred A shares Preferred B shares Preferred C sharesVoting Preferred
shares Common shares
2019 2018 2019 2018 2019 2018 2019 2018 2019 2018
(In Thousands, except par value per share)
Treasury sharesRedemption – – (27,000) – – – – – – –Re-issuance – – 30,000 – – – – – – –Acquisition – – – – – – – – (4,479) –
At end of year – – 50,000 47,000 – – 200,000 200,000 626,683 630,627
Details of Preferred B shares as follows (in Thousands, except par value per share):
Series 1 Series 2 Total
Preferred B 2019 2018 2019 2018 2019 2018
Par value per share P=100 P=100 P=100 P=100Issued and subscribed
shares 28,000 28,000 30,000 30,000 58,000 58,000Outstanding shares 20,000 20,000 30,000 27,000 50,000 47,000
Treasury shares 8,000 8,000 – 3,000 8,000 11,000Cost of treasury shares P=800,000 P=800,000 P=– P=300,000 P=800,000 P=1,100,000
Preferred SharesPreferred A sharesOn November 11, 2008, the Parent Company filed a primary offer in the Philippines of its Preferred Ashares at an offer price of P=500.00 per share to be listed and traded on the PSE.
Preferred A shares are cumulative, nonvoting and redeemable at the option of the Parent Companyunder such terms that the BOD may approve at the time of the issuance of shares and with adividend rate of 8.88% per annum. The Preferred A shares may be redeemed at the option of theParent Company starting on the fifth year.
On June 28, 2013, the BOD approved and authorized the exercise of call option on Preferred Ashares effective November 25, 2013 based on the dividend rate of 8.88% per annum. Theredemption of Preferred A shares is presented as part of treasury stock.
Preferred B sharesIn July 2006, the Parent Company filed a primary offer in the Philippines of its Preferred B shares atan offer price of P=100.00 per share to be listed and traded in the PSE. The Preferred B shares arecumulative, nonvoting and redeemable at the option of the Parent Company under such terms thatthe BOD may approve at the time of the issuance of shares and with dividend rate of 9.4578% perannum. The Preferred B shares may be redeemed at the option of the Parent Company starting onthe fifth year from the date of issuance.
On March 14, 2011, the BOD approved and authorized the exercise of call option on its Preferred Bshares effective July 21, 2011 based on the dividend rate of 9.5% per annum. The redemption ofPreferred B shares is presented as part of treasury stock.
Preferred B Series 1 sharesIn September 2013, the BOD approved and authorized the re-issuance and offering of 20.0 millionPreferred B Series 1 shares from its 58.0 million authorized Class “B” preferred treasury share capitalfor an aggregate amount of P=10.0 billion. The Preferred B Series 1 shares were offered at a price ofP=500.00 per share with a dividend rate of 5.25% per annum.
Preferred B Series 2 sharesOn August 22, 2014, the BOD approved and authorized the re-issuance and offering of P=27.0 millionPreferred B Series 2 shares, which comprise a second and separate series from the ParentCompany’s outstanding 5.25% Preferred B Series 1 shares, from its 58.0 million authorized Class “B”preferred treasury share capital, for an aggregate amount of P=13.5 billion. The Preferred B Series 2shares were offered at a price of P=500.00 per share with a dividend rate of 5.575%. The reissuance

- 48 -
*SGVFS039490*
resulted to the Parent Company recognizing P=10.7 billion additional paid-in capital net of directexpenses from re-issuance.
On September 13, 2019, the BOD approved and authorized the redemption by the Parent Companyof its 27.0 million Preferred B Series 2 shares representing all of the outstanding Preferred B Series 2shares shares at the redemption price equal to the issue price plus all accrued and unpaid dividendsuntil November 5, 2019 based on the dividend rate of 5.575% per annum. On the same date, theBOD also approved and authorized the re-issuance and offering of 30.0 million Preferred B Series 2shares for an offer price of P=500.00 per share with initial dividend rate of 4.8214% per annum whichwill be applicable until its next dividend rate resetting date which is 5 years from issue date. The re-issuance resulted to the Parent Company recognizing P=1.1 billion additional paid-in capital net ofdirect expenses from re-issuance.
Preferred C sharesPreferred C shares are cumulative, non-participating, non-voting and redeemable at the option of theParent Company under such terms that the BOD may approve at the time of the issuance of theshares.
Voting Preferred sharesOn March 15, 2010, the BOD approved the reclassification of 4.0 million unissued common shareswith a par value of P=50.00 per share into 200.0 million Voting Preferred shares with a par value ofP=1.00 per share and the amendment of the Parent Company’s amended Articles of Incorporation toreflect the reclassification of the unissued common shares into new Voting Preferred shares.On April 16, 2010, the Parent Company’s stockholders ratified the reclassification.
On April 22, 2010, the SEC approved the amendments to the Parent Company’s Articles ofIncorporation embodying the reclassification of the unissued common shares to new Voting Preferredshares.
The Voting Preferred shares are cumulative, voting and redeemable at the option of the ParentCompany under such terms that the BOD of the Parent Company may approve at the time of theissuance of shares and with a dividend rate of 5.3% per annum. In 2016, the dividend rate wasrepriced to 3.6950%.
On July 16, 2019, the BOD approved the re-pricing of dividend rate to 5.7730% per annum, which isequal to the 3-year PHP BVAL reference rate as of May 20, 2019 and will be applicable until May 20,2022, the next re-pricing date.
Common SharesThe common shares may be owned or subscribed by or transferred to any person, partnership,association or corporation regardless of nationality, provided that at any time at least 60% of theoutstanding capital stock shall be owned by citizens of the Philippines or by partnerships,associations or corporations with 60% of the voting stock or voting power of which is owned andcontrolled by citizens of the Philippines.
In July 2013, the SEC approved the amendments to the Parent Company’s Articles of Incorporationfor the exemption of 100 million common shares from the exercise of pre-emptive rights of holders ofcommon shares. These shares are allocated to support the financing activities of the ParentCompany.

- 49 -
*SGVFS039490*
On July 21, 2018, the Parent Company issued 8.8 million common shares at a price of P=916.0 pershare to an institutional investor and paid documentary stamp taxes and listing fee amounting toP=4.4 million and P=9.0 million, respectively.
On May 22, 2019, the Parent Company purchased its 3,805,644 common shares at P=838.00 fromMitsubishi Corporation ("Mitsubishi") pursuant to the share buyback program approved by the BODon September 10, 2007, June 2, 2010, and December 10, 2010.
On December 11, 2019, the Parent Company also purchased its 613,000 common shares at P=815.00pursuant to the share buyback program of P=10.0 billion worth of shares approved by the BOD onDecember 5, 2019. The Company purchased another 60,000 common shares at P=752.00 onDecember 16, 2019.
Treasury sharesAs of December 31, 2019, treasury shares include 12.0 million Preferred A shares amountingP=1.2 billion, 8.0 million Preferred B shares amounting to P=800.0 million and 4.5 million commonshares amounting to P=3.7 billion.
As of December 31, 2018, treasury shares include 12.0 million Preferred A shares and 11.0 millionPreferred B shares amounting to P=1.2 billion and P=1.1 billion, respectively.
The details of the Parent Company’s paid-in capital follow:
2019
PreferredStock - A
PreferredStock - B
VotingPreferred
CommonStock Subscribed
AdditionalPaid-inCapital
SubscriptionsReceivable
TotalPaid-inCapital
TreasuryStock
(In Thousands)
At beginning of year P=1,200,000 P=5,800,000 P=200,000 P=31,340,717 P=190,658 P=46,156,018 (P=1,525,718) P=83,361,675 (P=2,300,000)Issuance of new shares – – – – – – – – –Redemption of Preferred B Series 2 shares – – – – – – – – (13,500,000)Re-issuance of redeemed Preferred B Series 2 shares – – – – – – – – 13,500,000Issuance of additional Preferred B Series 2 shares – – – – – 1,079,931 – 1,079,931 300,000Exercise/Cancellation/ Subscription of ESOP/ ESOWN – – – 943 25,795 601,297 (468,093) 159,942 –Collection of subscription receivables – – – – – – 274,677 274,677 –Buyback of common shares – – – – – – – – (3,737,896)
At end of year P=1,200,000 P=5,800,000 P=200,000 P=31,341,660 P=216,453 P=47,837,246 (P=1,719,134) P=84,876,225 (P=5,737,896)
2018
PreferredStock - A
PreferredStock - B
VotingPreferred
CommonStock Subscribed
AdditionalPaid-inCapital
SubscriptionsReceivable
TotalPaid-inCapital Treasury Stock
(In Thousands)
At beginning of year P=1,200,000 P=5,800,000 P=200,000 P=30,899,877 P=164,725 P=37,929,927 (P=1,193,355) P=75,001,174 (P=2,300,000)Issuance of new shares – – – 440,500 − 7,615,757 − 8,056,257 –Exercise/Cancellation/
Subscription ofESOP/ESOWN – – – 340 25,933 610,334 (500,942) 135,665 –
Collection of subscription receivables – – – − − − 168,579 168,579 –
At end of year P=1,200,000 P=5,800,000 P=200,000 P=31,340,717 P=190,658 P=46,156,018 (P=1,525,718) P=83,361,675 (P=2,300,000)

- 50 -
*SGVFS039490*
In accordance with Revised SRC Rule 68, Annex 68-K, below is a summary of the Parent Company’strack record of registration of securities.
2019 2018
Number of sharesregistered Issue/offer price Date of approval
Number ofholders of
securities as ofDecember 31
Number ofholders of
securities as ofDecember 31
Common shares 200,000,000* P=1.00 par
value**;P=4.21 issue price
July 1976 6,424 6,507
Preferred A shares*** 12,000,000 P=100 par value;
P=500 issue price
November 2008 − −
Preferred B shares 8,000,000 P=100 par value;P=500 issue price
July 2006 − −
Preferred B shares- Series1****
20,000,000 P=100 par value;P=500 issue price
October 2013 19 19
Preferred B shares- Series
2*****
30,000,000 P=100 par value;
P=500 issue price
November 2019 2 −
27,000,000 P=100 par value;P=500 issue price
October 2014 − 10
Voting preferred shares 200,000,000 P=1 par value;P=1 issue price
March 2010 1,039 1,031
*Initial number of registered shares only.**Par value now is P=50.00
***The Preferred A shares were fully redeemed on November 25, 2013.****The Preferred B- Series 1 shares were re-issued on November 15, 2013.
*****The Preferred B-Series 2 share were re-issued on November 29, 2019.
Retained EarningsRetained earnings are restricted for the payment of dividends to the extent of the cost of shares heldin treasury.
In accordance with Revised SRC Rule 68, Annex 68-D, the Parent Company’s retained earningsavailable for dividend declaration as of December 31, 2019 and 2018 amounted toP=46.5 billion and P=34.0 billion, respectively.
Dividends consist of the following:
2019
Per shareAmount(In Thousands)
Dividends to common shares declared on: July 16 4.15 P=2,603,486 December 5 4.15 2,600,986
Dividends to equity preferred shares declared on: December 5 Preferred Shares B - Series 1 5.2500% 525,000
Preferred Shares B - Series 2 4.8214% 723,210 Voting Preferred shares 5.7730% 11,546
2018
Per shareAmount
(In Thousands)
Dividends to common shares declared on: June 22 P=3.46 P=2,151,488 December 6 3.46 2,181,971
Dividends to equity preferred shares declared on: December 1 Preferred Shares B - Series 1 5.2500% 525,000
Preferred Shares B - Series 2 5.5750% 752,625 Voting Preferred shares 3.6950% 7,390

- 51 -
*SGVFS039490*
As of December 31, 2019 and 2018, the Parent Company has dividend payable to common andpreferred stockholders amounting to P=3.9 billion and ₱3.5 billion.
Capital ManagementThe primary objective of the Parent Company’s capital management policy is to ensure that itmaintains a robust statement of financial position in order to support its business and maximizeshareholder value.
The Parent Company manages its capital structure and makes adjustments to it, in light of changes ineconomic conditions. To maintain or adjust the capital structure, the Parent Company may adjust thedividend payment to shareholders or issue new shares. No changes were made in the objectives,policies or processes for the years ended December 31, 2019 and 2018.
The Parent Company monitors capital using a gearing ratio of debt to equity and net debt to equity.Debt consists of short-term and long-term debt. Net debt includes short-term and long-term debt lesscash and cash equivalents and short-term investments.
Debt to Equity and Net Debt to Equity ratios
2019 2018
(In Thousands)
Long-term debt P=65,544,066 P=67,167,981Less:
Cash on hand and in banks 184,772 187,855Cash equivalents 7,067,678 3,349,241Short-term investments 25,318 25,844
Net debt P=58,266,298 P=63,605,041
Equity P=131,282,102 P=117,703,503
Debt to equity 50% 57%
Net debt to equity 44% 54%
The long-term debt of the Parent Company provide for certain restrictions and requirements withrespect to maintenance of financial ratios at certain levels. These restrictions and requirements werecomplied with by the Parent Company as of December 31, 2019 and 2018.
17. Revenue from Contracts with Customers
This account consists of the categories of revenue from contracts with customers:
2019 2018
(In Thousands)
Management fees (Note 21) P=717,551 P=707,337Toll revenue 221,214 199,064Others 6,910 9,562
P=945,675 P=915,963

- 52 -
*SGVFS039490*
18. Cost and Expenses and Other Income (Expense)
General and administrative expenses consist of:
2019 2018
(In Thousands)
Provision for impairment of investments insubsidiaries, associates and joint ventures – netof reversals P=2,503,000 P=−
Personnel costs (Note 21) 1,877,506 1,671,075Contract labor 212,416 173,170Pension expense (Note 22) 209,835 224,557Professional fees (Note 21) 194,526 207,392Donations and contributions 153,267 149,405Share-based payments (Notes 21 and 23) 135,946 126,324Advertising and promotions 134,430 165,407Transportation and travel 62,141 60,016Repairs and maintenance (Note 12) 44,114 46,566Rental 42,558 43,963Business development 41,436 62,704Taxes, licenses and fees 35,132 33,434Postal and communication 20,011 19,368Entertainment, amusement and recreation 12,499 15,323Dues and fees 11,841 24,899Condominium dues 10,310 10,301Utilities 9,722 10,963Supplies 7,241 7,431Insurance 5,861 49,779Others 39,555 13,108
P=5,763,347 P=3,115,185
“Others” include certain accrued expenses and provisions associated with clearing, relocation costsfor certain properties.
Other income consists of:
2019 2018
(In Thousands)
Gain on sale of investment in shares of stock(Note 7) P=16,725,940 P=386,088
Gain on sale of investment properties(Notes 8 and 21) 290,826 100,940
Gain on merger (Note 7) 238,397 −Rental income (Notes 8, 10 and 21) 179,958 185,105Gain on return of capital 70,751 −Construction revenue (Note 10) 29,571 6,931Gain on sale of property and equipment (Note 11) 3,372 4,793Foreign exchange gains 3,280 6,710Others 316 894
P=17,542,411 P=691,461

- 53 -
*SGVFS039490*
Interest income consists of interest on:
2019 2018
(In Thousands)
Cash in banks, cash equivalents and short-terminvestments (Notes 4 and 21) P=482,205 P=200,434
Notes receivable including amortization (Note 5) 11,079 8,558Others 707 3,996
P=493,991 P=212,988
Interest and other financing charges consist of:
2019 2018
(In Thousands)
Interest expense on long-term debt(Notes 15 and 21) P=3,916,153 P=3,488,083
Amortization of transaction costs of long-term debt(Notes 15 and 21) 75,693 164,802
Accretion of provision for maintenance obligation(Note 12) 2,630 1,763
Others 13,650 8,453
P=4,008,126 P=3,663,101
Other expenses consist of:
2019 2018
(In Thousands)
Construction costs P=29,571 P=6,931Others 1,185 −
P=30,756 P=6,931
19. Income Tax
Provision for income tax consists of:
2019 2018
(In Thousands)
MCIT P=15,307 P=10,764Final tax and capital gains tax 91,779 33,533Deferred − (3,000)
P=107,086 P=41,297

- 54 -
*SGVFS039490*
The reconciliation between the statutory and the effective income tax rates follows:
2019 2018
Statutory income tax rate 30.00% 30.00%Tax effects of: Nontaxable dividend income (18.10) (54.80) Interest income and capital gains subjected to
final/lower taxes (22.83) (2.60)Change in unrecognized deferred tax assets 7.19 24.46
Others 4.22 3.59
Effective income tax rate 0.48% 0.65%
As of December 31, 2019 and 2018, the Parent Company has not recognized deferred tax assets.
The Parent Company has deductible temporary differences, NOLCO and MCIT that are available foroffset against future taxable income or tax payable for which deferred tax assets have not beenrecognized. These deductible temporary differences, NOLCO and MCIT follow:
2019 2018
(In Thousands)
NOLCO P=14,693,911 P=13,879,584Pension liability 836,848 437,153MCIT 37,412 32,256Unrealized foreign exchange (gain) loss 171 (421)Allowance for doubtful accounts 5,394 5,394Provision for maintenance obligation 13,606 11,396
As of December 31, 2019, MCIT and NOLCO that can be claimed as deduction from future incometax liabilities or taxable income, respectively, are as follows (amounts in thousands):
Year incurred MCIT NOLCO Expiry year
2017 P=11,342 P=4,296,081 20202018 10,763 5,055,697 20212019 15,307 5,342,133 2022
P=37,412 P=14,693,911
The movements in NOLCO and MCIT are as follows:
NOLCO:2019 2018
(In Thousands)
At January 1 P=13,879,584 P=12,652,311Additions 5,342,133 5,055,697Expiration (4,527,806) (3,828,424)
At December 31 P=14,693,911 P=13,879,584
MCIT:2019 2018
(In Thousands)
At January 1 P=32,256 P=39,817Additions 15,307 10,763Expiration (10,151) (18,324)
At December 31 P=37,412 P=32,256

- 55 -
*SGVFS039490*
There are no income tax consequences attaching to the payment of dividends by the domesticsubsidiaries, associates and joint ventures to the Parent Company.
Republic Act (RA) No.10963 or the Tax Reform for Acceleration and Inclusion Act (TRAIN) wassigned into law on December 19, 2017 and took effect January 1, 2018, making the new tax lawenacted as of the reporting date. Although the TRAIN changes existing tax law and includes severalprovisions that will generally affect businesses on a prospective basis, the management assessedthat the same did not have any significant impact on the financial statement balances as of thereporting date.
To complement the TRAIN law, House Bill 8083 or the Tax Reform for Attracting Better and High-Quality Opportunities (TRABAHO) was approved last September 10, 2018 by the House ofRepresentatives. TRABAHO proposes to gradually lower the corporate income tax rate andrationalize corporate incentives. The management is currently assessing the impact on the financialstatement balances once this will be signed into a law.
20. Earnings Per Share
The following table presents information necessary to calculate EPS on net income attributable toowners of the Parent Company:
2019 2018
(In Thousands, except EPS figures)
Net income P=22,382,508 P=6,321,047Less dividends on preferred stock (1,259,756) (1,285,015)
P=21,122,752 P=5,036,032
Weighted average number of common shares P=628,558 P=625,644Dilutive shares arising from stock options 1,312 2,119
Adjusted weighted average number of commonshares for diluted EPS 629,870 627,763
Basic EPS P=33.61 P=8.05
Diluted EPS P=33.54 P=8.02
21. Related Party Transactions
Parties are considered to be related if one party has the ability, directly or indirectly, to control theother party or exercise significant influence over the other party in making financial and operatingdecisions. Parties are also considered to be related if they are subject to common control or commonsignificant influence which include affiliates. Related parties may be individuals or corporate entities.
Terms and Conditions of Transactions with Related PartiesThe transactions with related parties are made on terms equivalent to those that prevail in arm’slength transactions. Except as stated otherwise, outstanding balances at year-end are unsecuredand interest free and settlement occurs in cash. For the year ended December 31, 2019 and 2018,allowance for credit losses relating to receivable from related parties amounted to nil. Thisassessment is undertaken each financial year through examining the financial position of the relatedparties and the markets in which the related parties operate.

- 56 -
*SGVFS039490*
In the ordinary course of business, the Parent Company transacts with its related parties. Thetransactions and balances of accounts with related parties follow:
a. Transaction with MCXIThe Parent Company appointed MCXI as the Facility Operator of MCX (see Note 10).
b. Transaction with Mermac, Inc.On December 15, 2014, Mermac, Inc (“the Lessor”) and the Parent Company (“the Lessee”)made and entered into a Contract of Lease. The Lessor leases, lets, and demises unto theLessee, an office space constituting the Leased Premises, located at the 35th Floor, Tower Oneand Exchange Plaza, Ayala Triangle, Ayala Avenue, Makati City. The term of the lease shall befive (5) years, commencing on November 15, 2014 and ending on November 14, 2019. The leaseis subject to annual escalation clause of 5% for the first 2 years and 10% for the next 2 years(see Note 28).
In 2019, the contract of lease was renewed with lease term of one year commencing onNovember 15, 2019.
c. Transaction with ALIIn July 2016, Parent Company entered into an operating lease agreement with Crans MontanaProperty Holdings Corp., a wholly-owned subsidiary of ALI, for the lease of a land in LegaspiVillage, Makati City. As of December 31, 2019 and 2018, rental income amounting to P=1.6 millionand P=0.8 million, respectively, was recognized (see Note 8).
In December 2018, the Parent Company sold a parcel of land in San Antonio, Makati to CransMontana for a total consideration of P=99.4 million (see Note 8).
In August 2019, the Parent Company sold a parcel of land located in the Province of MisamisOriental to Laguna Technopark, Inc. (LTI) for a total consideration of P=299.1 million (see Note 8).
d. Transaction with AC Industrial Technology Holdings, Inc. (AITHI)The Parent Company entered into a contract of lease with Honda Cars Makati Inc. (HCMI) andIsuzu Automotive Dealership, Inc. (IADI) for the lease of land and buildings. Lease fee rangesfrom 1.0% to 2.0% of the net sale of the lessees (see Note 28).
e. Transactions with BPIi. As of December 31, 2019 and 2018, the Parent Company maintains current and savings
account, money market placements and other short-term investments with BPI broken downas follows:
2019 2018(In Thousands)
Cash in bank P=172,493 P=172,813
Cash equivalents 5,266,611 3,342,335
Short-term investment 25,318 25,844
Cash in bank and cash equivalents in BPI earn interest ranging from 0.375% to 6.15% perannum.
ii. As of December 31, 2019 and 2018, the Parent Company has long-term debt with BPI asfollows:
2019 2018(In Thousands)
Long-term debt P=9,976,494 P=8,210,324
As of December 31, 2019 and 2018, outstanding long-term debt with BPI is composed of 10-year floating-rate loans with varying maturity dates up to 2028.

- 57 -
*SGVFS039490*
iii. As of December 31, 2019 and 2018, the Parent Company has outstanding receivable fromand payable to BPI as follows:
2019 2018
(In Thousands)
Interest receivable P=8,641 P=4,525
Interest payable 42,320 44,650
iv. Income and expenses incurred with BPI are as follow:
2019 2018
(In Thousands)
Interest income P=341,742 P=115,211
Interest expense 550,342 376,241
Outstanding balances from related parties follow:
Dividends Receivables Payables
2019 2018 2019 2018
(In Thousands)
Subsidiaries:
AGCC P=30,000 P=30,000 P=− P=–DADC 4,600 − − –
34,600 30,000 − –
Associates:BPI – 1,251,478 − −
− 1,251,478 − −Others:Mermac Inc. − − 1,230,997 1,026,323Mitsubishi Corporation − − 156,753 130,689
− − 1,387,750 1,157,012
P=34,600 P=1,281,478 P=1,387,750 P=1,157,012
Rentals Receivables Payables
2019 2018 2019 2018(In Thousands)
Subsidiaries:IADI P=15,760 P=16,660 P=3,825 P=3,825HCMI 7,015 11,214 − −
22,775 27,874 3,825 3,825
Joint Ventures:Globe − − 98 98Asiacom − − 94 94
− − 192 192
P=22,775 P=27,874 P=4,017 P=4,017
Subscriptions Receivables Payables
2019 2018 2019 2018(In Thousands)
Subsidiaries:AHHI P=− P=− P=1,959,695 P=1,345AVHC − − 70,318 96,889AAC − − 39,400 −ACEI − − − 1,687,500
− − 2,069,413 1,785,734
Others 1,719,134 1,525,718 − −P=1,719,134 P=1,525,718 P=2,069,413 P=1,785,734

- 58 -
*SGVFS039490*
Other outstanding balances Receivables Payables
2019 2018 2019 2018(In Thousands)
Subsidiaries:
Laguna Technopark, Inc. P=149,539 P=– P=− P=2,144Crans Montana Property Holdings Corp. 51,785 50,425 − –Reliant Expressdel Services 13,699 7,842 − –MWC 3,209 1,657 − –AITHI 912 29,940 − –AHHI 177 30,643 − –ALI − − 214,440 214,563Avida Land Corporation – – 19,965 19,965HCX – – 3,428 2,264Ayala Group Club, Inc. – – 444 2,223AIPL – – 138 138Asticom Technology, Inc. − − 108 −AYCFL − − − 758,132IMI – 76,102 − –IADI – 3,699 − –AC Infra – 2,300 − –HCMI – 2,220 − –Liveit Investments Ltd. (LIL) – 231 − –AC Automotive Business Services Inc. – 157 − –AGCC – – − 18,284Honda Cars Alabang, Inc. – – − 1,596Ayala Life Assurance, Inc. – – − 25AFIMPC – – − 2
219,321 205,216 238,523 1,019,336
Associates:
BPI 536 P=18,610 P=− P=–BPI Family 26 51 9 9BPI Trust 26 51 − –GN Power Kauswagan – 2,525 − –
588 21,237 9 9
Joint Ventures:
Globe 1,161 841 − 486
1,161 841 − 486
P=221,070 P=227,294 P=238,532 P=1,019,831
Receivables:
i. Dividends receivables pertain to accrued dividend declarations from subsidiaries, associates and
joint ventures. These are non-interest bearing and usually collectible within one year.
ii. Rental receivables pertain to accrued rent on investment properties of the Parent Company.
These are non-interest bearing and usually collectible within one year.
iii. Subscriptions receivables pertain to subscriptions of key management personnel to the Parent
Company’s common shares as a result of the Parent Company’s ESOWN grants (see Note 16).
iv. Other receivables from Crans Montana Property Holdings, Corp. pertain to sale of inner wheel
lots in San Antonio, Makati (see Note 8).
v. Other receivables from LTI pertain to sale of parcel of land in the Province of Misamis Oriental
(see Note 8).
vi. Other Receivables from IMI, AHHI and AITHI pertain to management fees.

- 59 -
*SGVFS039490*
Payables:
i. Dividends payable pertains to accrued dividends declarations of the Parent Company to its
stockholders. These are non-interest bearing and usually paid within one year.
ii. Rental payable pertains to refundable deposits received by the Parent Company in relation to its
lease agreements with related parties.
iii. Subscriptions payable pertains to additional subscriptions to the common or preferred shares of
the subsidiaries, associates and joint ventures (see Note 14).
iv. Other payable to AYCFL in 2018 pertain to deposits received for AYCFL’s exchangeable bonds
which is convertible to ALI shares (see Note 26).
v. Other payables to ALI pertain to deposit of future purchase of the Parent Company properties
and accrual of security cost for the year. The payable is to be settled once the ownership for the
property is transferred to the buyer.
vi. Other payables to Avida pertain to advances made for the expenses related to the development
of land in Sta. Rosa, Laguna which are non-interest bearing and due and demandable.
vii. Other payables to AGCC pertains to accrual of legal fees for services rendered to the Parent
Company.
f. Notes receivable amounting to P=244.2 million pertains to housing, car, salary and other loans
granted to the Parent Company’s officers and employees which are collectible through salary
deduction, bears 5.0% to 6.0% interest per annum and have various maturity dates ranging from
2020 to 2033.
g. Income and expenses from related parties follow:
Income Management Fee Other Income
2019 2018 2019 2018
(In Thousands)
Subsidiaries:MWCI P=168,390 P=218,819 P=30 P=−ACEI 127,051 123,259 1,181 548IMI 96,952 86,410 − −AC Infra 52,627 54,128 3,926 2,356Ayala Healthcare 46,344 26,308 161 5,283AITHI 29,689 143 148,072 −IADI 10,784 3,813 − −ALI 8,337 8,374 2,550 −Adventure Cycle 5,392 12UNC 5,000 393Automobile Central Enterprise, Inc. 4,044 533 − −BF Jade 3,319 3,015 − −NTC 2,500 4,250 175 −TLI 600 600 − −AGCC − − 79 −Crans Montana Holdings, Inc. − − 2,938 100,919AABSI − − 118 −HCMI − 2,288 − −AEI − 1,062 − −MCXI − 485 − −AIVPL − 206 − −Isuzu Mandaue − − − 62,516AYCFL − − 16,725,940 386,088LTI − − 290,474 −ACIFL − − 70,751 −AHCHI − 30,276 − 380,048
561,029 563,969 17,246,800 937,758
(Forward)

- 60 -
*SGVFS039490*
Income Management Fee Other Income
2019 2018 2019 2018
(In Thousands)
Associates:BPI 46,073 46,306 341,742 115,211Light Rail Manila Corporation 14,750 18,441 − −Entrego Fulfillment Solutions Inc. 14,123 8,084 − −iPeople 8,938 − 238,397 −PPI Prime Ventures, Inc. 339 339 − −SLTEC 188 − 2,021 −GNPK − 2,332 59 −NLRC − − 303 −
84,411 75,502 582,522 115,211
Joint Ventures:GLOBE 53,179 56,758 771 706Asiacom 10,299 10,334 289 255BPI Family 402 348 − −
63,880 67,440 1,060 961
Others:Ayala Group Club 5,062 − − −ALFM 293 − − −Sonoma Services − 426 − −
5,355 426 − −P=714,675 P=707,337 P=17,830,382 P=1,053,930
a) Other income consists of interest income and rental income.
Income Dividend Income
2019 2018
(In Thousands)
Subsidiaries
ALI P=3,535,062 P=3,547,278
ACEI 2,000,000 −MWCI 788,230 743,458
Philwater 400,000 343,000
MHI 300,000 −AITHI 121,626 271,125
TLI 36,234 43,324
AGCC 30,000 30,000
DADC 24,300 2,500
IMI 146 324
7,235,598 4,981,009
Associates
Globe 3,745,312 3,745,312
BPI 2,502,957 2,502,957
iPeople 4,803 −6,253,072 6,248,269
Joint ventures
LHI 81,976 392,706
81,976 392,706
P=13,570,646 P=11,621,984

- 61 -
*SGVFS039490*
Expenses Professional Fees Rental
2019 2018 2019 2018(In Thousands)
Owners:Mermac Inc. P=− P=− P=8,802 P=9,128
Subsidiaries:MCXI 39,319 31,129 − −AGCC 23,500 20,853 − −HCXI 4,129 6,679 − −APMC 3,480 3,820 − −Ayala Healthcare 284 − − −ALI − 2 180 359
70,712 62,483 180 359
Associates:BPI P=28,053 P=492 P=− P=−Affinity Express, Inc. − 7 − −
28,053 499 − −Joint ventures:GLOBE 64 195 − −ASTI 172 − − −
236 195 − −Others:
Ayala Group Club 2,168 − − −Fort Bonifacio Development Corp. − − 13,890 12,128
2,168 − 13,890 12,128
P=101,169 P=63,177 P=22,872 P=21,615
Expenses Interest Others
2019 2018 2019 2018(In Thousands)
Subsidiaries:
ACIFL P=− P=− P=− P=−Associates:
BPI 550,342 376,241 − −Joint ventures:
GLOBE − − 5,298 6,343
P=550,342 P=376,241 P=5,298 P=6,343
h. Compensation of key management personnel by benefit type follows:
2019 2018(In Thousands)
Short-term employee benefits (Note 18) P=657,091 P=565,965Post-employment benefits (Note 22) 51,760 48,757
P=708,851 P=614,722

- 62 -
*SGVFS039490*
22. Retirement Plan
The Parent Company has a funded, noncontributory tax-qualified defined benefit type of retirementplan covering its regular employees. The benefits are based on a defined benefit formula with aminimum lump-sum guarantee of 1.5 months’ effective salary per year of service upon retirement.Pension expense charged to operations amounted to P=209.83 million and P=224.6 million in 2019 and2018, respectively (see Note 18).
The Parent Company's pension fund is known as the AC Employees Welfare and Retirement Fund(ACEWRF). ACEWRF is a legal entity separate and distinct from the Parent Company, governed bya board of trustees appointed under a Trust Agreement between the Parent Company and the initialtrustees. It holds common and preferred shares of the Parent Company in its portfolio. All suchshares have voting rights under certain conditions, pursuant to law. ACEWRF's portfolio is managedby the Retirement Committee composed of the Parent Company's Chief Finance Officer, Group Headof Corporate Governance, General Counsel, Corporate Secretary and Compliance Officer, GroupHead of Corporate Resources, Group Head of Corporate Strategy and Business Development,Treasurer and Comptroller. ACEWRF has not exercised voting rights over any shares of the ParentCompany that it owns.

- 63 -
*SGVFS039490*
Changes in net defined benefit liability of funded funds in 2019 and 2018 are as follows:
2019
Net benefit cost in statement of income
Remeasurements in
other comprehensive income
January 1Current
service cost Net interest SubtotalBenefits
paid
Return
on planassets*
Actuarialloss due
to liabilityexperience
Actuarial
Loss (gain)due
to liability
assumptionchanges Subtotal
Transferpayments
Contribution
by employerand affiliates December 31
(In Thousands)
Present value of defined benefitobligation P=3,972,155 P=197,196 P=246,314 P=443,510 (P=1,627,546) P=– P=264,936 P=343,335 P=608,271 (P=10,594) P=– P=3,385,796
Fair value of plan assets (3,535,002) – (233,675) (233,675) 1,627,546 (174,279) – – (P=174,279) 4,229 (237,767) (2,548,948)
Net defined benefit liability (asset) P=437,153 P=197,196 P=12,639 P=209,835 P=– (P=174,279) P=264,936 P=343,335 P=433,992 (P=6,365) (P=237,767) P=836,848
*Excluding amount included in net interest
2018
Net benefit cost in statement of income
Remeasurements in
other comprehensive income
January 1Current
service cost Net interest SubtotalBenefits
paid
Returnon planassets*
Actuarial
loss dueto liability
experience
Actuarial gaindue
to liabilityassumption
changes SubtotalTransfer
payments
Contributionby employerand affiliates December 31
(In Thousands)Present value of defined benefit
obligation P=3,880,504 P=221,214 P=185,911 P=407,125 (P=197,526) P=– P=127,040 (P=269,286) (P=142,246) P=24,298 P=– P=3,972,155
Fair value of plan assets (3,719,212) – (182,568) (182,568) 197,526 393,748 – – 393,748 (24,298) (200,198) (3,535,002)
Net defined benefit liability (asset) P=161,292 P=221,214 P=3,343 P=224,557 P=– P=393,748 P=127,040 (P=269,286) P=251,502 P=− (200,198) P=437,153
*Excluding amount included in net interest
The maximum economic benefit available is a combination of expected refunds from the plan and reductions in future contributions.

- 64 -
*SGVFS039490*
The fair value of plan assets as at the end of the reporting period are as follow:
2019 2018(In Thousands)
AssetsCash P=139 P=82Investments Domestic equities Listed - Common 889,799 667,443 Listed - Preferred 283,460 307,044 Unlisted - Common 1 1 Unlisted - Preferred 1,271 3,330
Unit investment trust fund 186,466 109,906 Fixed Income Government securities 165,949 824,485 Corporate bonds 834,404 833,848 Fixed Income - Loans Loans 20,000 67,000 Other securities and debt instruments 65,241 80,303 Money market placements 97,647 566,978 Investments in real estate 45 88 Miscellaneous assets 10,138 493Receivables 1,802 17,432
2,556,362 3,478,433
LiabilitiesTrust fee and other payables 7,414 2,445
Net Asset Value* P=2,548,948 P=3,475,988*The difference of P=59.0 million in the fair value of plan assets as of December 31, 2018 pertains to movements after the
valuation date. The actuary used the fair value of plan assets as of September 30, 2018.
All equity and debt instruments held have quoted prices in active market. The remaining plan assetsdo not have quoted market prices in active market.
The plan assets have diverse investments and do not have any concentration risk.
The cost of defined benefit pension plan as well as the present value of the pension obligation aredetermined using actuarial valuations. The actuarial valuation involves making various assumptions.The principal assumptions used in determining pension obligations for the defined benefit plans areshown below:
2019 2018
Discount rates 4.50% 7.50%Future salary increases 7.50% 7.50%Expected rate of return on plan assets 7.68% 8.75%
There were no changes from the previous period in the methods and assumptions used in preparingsensitivity analysis.

- 65 -
*SGVFS039490*
The sensitivity analysis below has been determined based on reasonably possible changes of eachsignificant assumption on the defined benefit obligation as of the end of the reporting period,assuming if all other assumptions were held constant:
December 31, 2019
Increase(decrease)
SensitivityAnalysis Effect on DBO
Discount rates 5.50% 1% (3.76%)3.50% (1%) 4.23%
Rate of salary increase 8.50% 1% 4.07%6.50% (1%) (3.70%)
The management performed an Asset-Liability Matching Study (ALM) annually. The overallinvestment policy and strategy of the Parent Company’s defined benefit plans is guided by theobjective of achieving an investment return which, together with contributions, ensures that there willbe sufficient assets to pay pension benefits as they fall due while also mitigating the various risk ofthe plans. The Parent Company’s current strategic investment strategy consists of 50% of equityinstrument and 50% of fixed income instrument.
Amounts for the current and previous annual periods are as follows:
2019 2018 2017 2016 2015
(In Thousands)
Defined benefit obligation P=3,385,796 P=3,972,155 P=3,880,504 P=3,585,209 P=3,554,124Plan assets (2,548,948) (3,535,002) (3,719,212) (3,293,156) (3,050,602)
Deficit (surplus) P=836,848 P=437,153 P=161,292 P=292,053 P=503,522
The Parent Company expects to contribute P=254.0 million to its defined benefit pension plan in 2020.
As of December 31, 2019 and 2018, the plan assets include shares of stock of the Parent Companywith total fair value of P=322.3 million and P=327.0 million, respectively. Unrealized gain on investmentin the shares of stock of the Parent Company as of December 31, 2019 and 2018 is P=3.9 million andP=2.0 million, respectively.
As of December 31, 2019 and 2018, the fund includes investment in debt and equity securities ofrelated parties. Details of the investment per type of security are as follows:
2019Historical Cost Fair Value Unrealized Gain(Loss)
(In Thousands)
Equity securities P=392,069 P=392,069 P=−Debt securities 119,700 117,720 1,980
Total P=511,769 P=509,789 P=1,980
2018Historical Cost Fair Value Unrealized Gain(Loss)
(In Thousands)
Equity securities P=445,430 P=449,890 P=4,460Debt securities 539,100 503,016 (36,084)
Total P=984,530 P=952,906 (P=31,624)
The overall expected rate of return on assets is determined based on the market prices prevailing onthat date.

- 66 -
*SGVFS039490*
In 2019 and 2018, total contributions made to the retirement fund by affiliates amounted toP=23.3 million and P=26.1 million, respectively. This pertains to the retirement contributions in behalf ofthe seconded employees of the Parent Company to ALI, Globe, HCMI and IADI.
The Parent Company’s transactions with the fund mainly pertain to contributions, benefit paymentsand settlements.
23. Stock Option Purchase Plans
The Parent Company has stock option plans for key officers (Executive Stock Option Plan - ESOP)and employees (ESOWN) covering 3.0% of the Parent Company’s authorized capital stock. Thegrantee is selected based on certain criteria like outstanding performance over a defined period oftime.
ESOPThe ESOP grantees may exercise in whole or in part the vested allocation in accordance with thevesting percentage and vesting schedule stated in the ESOP. Also, the grantee must be anemployee of the Parent Company or any of its subsidiaries during the 10-year option period. In casethe grantee retires, he/she is given 3 years to exercise his/her vested and unvested options. In casethe grantee resigns, he/she is given 90 days to exercise his/her vested options.
A summary of the Parent Company’s stock option activity and related information for the years endedDecember 31, 2019 and 2018 follows:
2019 2018
Numberof Shares
WeightedAverage
Exercise PriceNumber
of Shares
WeightedAverage
Exercise Price
Outstanding, at beginningof year 1,024,067 P=287.82 1,032,703 P=287.32
Exercised (89,611) 341.61 (8,636) 227.53
Outstanding, at end of year 934,456 P=282.66 1,024,067 P=287.82
The options have a contractual term of 10 years. As of December 31, 2019 and 2018, the weightedaverage remaining contractual life of options outstanding is 1.64 years and 2.53 years, respectively,and the exercise prices ranged from P=227.5 to P=500.0.
The fair value of each option is estimated on the date of grant using the Black-Scholes MertonFormula and Binomial Tree Model. The fair values of stock options granted under ESOP at eachgrant date and the assumptions used to determine the fair value of the stock options are as follows:
April 26, 2013 April 18, 2011 April 16, 2010
Weighted average share price P=640.00 P=352.08 P=303.70Exercise price P=500.00 P=264.06 P=227.53Expected volatility 42.40% 41.21% 41.31%Option life 10 years 10 years 10 yearsExpected dividends 0.54% 0.86% 0.92%Risk-free interest rate 3.04% 6.64% 8.56%
The expected volatility reflects the assumption that the historical volatility is indicative of future trends,which may not necessarily be the actual outcome.

- 67 -
*SGVFS039490*
ESOWNThe Parent Company also has ESOWN granted to qualified officers and employees wherein granteesmay subscribe in full to the shares awarded to them based on the average market price determinedby the Personnel and Compensation Committee as the offer price set at grant date. For any shareawards unsubscribed, grantees still have the option to subscribe from the start of the fifth year but notlater than on the start of the seventh year from date of grant.
To subscribe, the grantee must be an employee of the Parent Company or any of its subsidiariesduring the 10-year payment period. In case the grantee resigns, the unsubscribed shares arecancelled, while the subscription may be paid up to the percent of holding period completed andpayments may be converted into the equivalent number of shares. In case the grantee is separated,not for cause, but through retrenchment and redundancy, subscribed shares may be paid in full,unsubscribed shares may be subscribed, and payments may be converted into the equivalentnumber of shares. In case the grantee retires, the grantee may continue to subscribe to theunsubscribed shares anytime within the 10-year period. The plan does not allow sale or assignmentof the shares. All shares acquired through the plan are subject to the Parent Company’s Right toRepurchase.
In 2015, the Parent Company introduced a revised ESOWN plan wherein grantees are givenone (1) month from the time an allocation is awarded to subscribe in full, with any unsubscribedawards forfeited.
ESOWN grants totaling 515,904 and 492,875 were subscribed in 2019 and 2018, respectively.Movements in the number of options outstanding under ESOWN as of December 31, 2019 and 2018follow:
2019 2018
Number ofESOWN grants
Weightedaverage
exercise priceNumber of
ESOWN grants
Weightedaverage
exercise price
At January 1 − P=−Granted 767,942 883.83 494,683 926.00Subscribed (515,904) (883.83) (492,875) (926.00)Expired 252,038 883.83 (1,808) (926.00)
At December 31 − P=− − P=−
The ESOWN grants are effectively treated as options on shares exercisable within a given period,considering both the subscription period allowed to grantees and the subscription payment pattern.As such, the fair values of these options are estimated on the date of grant using the Black-ScholesMerton Formula and Binomial Tree Model, taking into account the terms and conditions upon whichthe options were granted. These models require six inputs to produce the stock option value, whichare namely: share price, exercise price, time to maturity, volatility rate, dividend yield, and risk-freerate.
The fair value of stock options granted under ESOWN at grant date and the assumptions used todetermine the fair value of the stock options follow:
April 26,2019
April 20, 2018
April 18,2017
December 16,2016
December 23,2015
April 11,2014
Number of unsubscribedshares – – – – – 8,344
Fair value of each option P=263.51 P=256.30 P=222.49 P=176.82 P=444.59 P=619.00Share price P=895.00 P=919.00 P=859.00 P=732.00 P=718.88 P=673.96Exercise price P=883.83 P=926.00 P=837.53 P=717.30 P=611.05 P=480.00Expected volatility 29.17% 30.28% 29.55% 30.31% 38.23% 42.13%Dividend yield 0.78% 0.75% 0.61% 0.70% 0.67% 0.74%Interest rate 5.64% 3.68% 2.89% 1.46% 4.81% 4.38%

- 68 -
*SGVFS039490*
In 2019 and 2018, the Parent Company recognized P=135.9 million and P=126.3 million, respectively,as share-based payments expense.
Subscriptions receivable from the stock option plans covering the Parent Company’s shares arepresented under equity.
24. Fair Value Measurement
Fair value hierarchyThe Parent Company uses the following hierarchy for determining and disclosing the fair value ofassets and liabilities by valuation technique:
Level 1: quoted (unadjusted) prices in active markets for identical assets or liabilities
Level 2: other techniques for which all inputs which have a significant effect on the recorded fair value are observable, either directly or indirectly
Level 3: techniques which use inputs which have a significant effect on the recorded fair value that are not based on observable market data.
As of December 31, 2019 and 2018 there were no transfers between Level 1 and Level 2 fair valuemeasurements, and no transfers into and out of Level 3 fair value measurements.
The following table shows the fair value hierarchy of the Parent Company’s assets and liabilitiesfollows (amounts in thousands):
2019Level 1 Level 2 Level 3 Total
Assets for which fair value was disclosed:
Financial assets at FVOCI P=19,595 P=514,875 P=− P=534,470
Notes receivable 192,347 192,347
Other receivable 219,055 219,055
Investments in subsidiaries, associates andjoint ventures* 515,508,493 − − 515,508,493
Investment properties
Land − 4,992,352 − 4,992,352 Buildings and improvements − − 5,085,482 5,085,482
P=515,528,088 P=5,507,227 P=5,496,884 P=526,532,199
Liabilities for which fair value was disclosed:Long-term debt − 56,973,903 − 56,976,903
P=− P=56,973,903 P=− P=56,976,903
*Fair value of investments in listed subsidiaries, associates and joint ventures for which there are published price quotations
2018Level 1 Level 2 Level 3 Total
Assets for which fair value was disclosed:
Financial assets at FVOCI P=28,561 P=479,650 P=− P=508,211
Notes receivable − − 171,499 171,499
Other receivable 222,379 222,379Investments in subsidiaries, associates and
joint ventures* 584,319,973 − − 584,319,973
Investment properties Land − 5,291,431 − 5,291,431 Buildings and improvements − − 5,085,482 5,085,482
P=584,348,534 P=5,771,081 P=5,479,360 P=595,598,975
Liabilities for which fair value was disclosed:Long-term debt − 58,987,772 − 58,987,772
P=− P=58,987,772 P=− P=58,987,772
*Fair value of investments in listed subsidiaries, associates and joint ventures for which there are published price quotations

- 69 -
*SGVFS039490*
The table below summarizes the valuation techniques and the inputs used in the valuation for assetsand liabilities categorized under Level 2 and Level 3 in 2019 and 2018.
2019
Valuation TechniqueSignificant
Unobservable InputRange (weighted
average)
Assets for which fair value was
disclosed:
Financial assets at FVOCI Mark to market Approach Published price quotations
P=50,000 toP=76,000,000
per shareNotes receivable DCF method Discount rate 3.35% to 4.79%Other receivable DCF method Discount rate 3.20%
Investment properties
Land Market data Approach Price per square meter
P=10 toP=675,000 per
square meter
Buildings and Improvements Cost Approach
Reproduction cost (new)
adjusted for depreciation
P=9,297 toP=150,000 per
square meter
Liabilities for which fair value was disclosed:
Long-term debt DCF method Discount rate 3.13% - 6.68%
2018
Valuation Technique
Significant
Unobservable Input
Range (weighted
average)
Assets for which fair value was disclosed:
Financial assets at FVOCI Mark to market Approach Published price quotations
P=50,000 to
P=50,000,000per share
Notes receivable DCF method Discount rate 5.18% - 7.49%
Other receivable DCF method Discount rate 3.925%Investment properties
Land Market data Approach Price per square meter
P=10 to
P=675,000 persquare meter
Buildings and Improvements Cost ApproachReproduction cost (new)adjusted for depreciation
P=9,297 to
P=150,000 persquare meter
Liabilities for which fair value was disclosed:
Long-term debt DCF method Discount rate 5.72% - 9.97%
There was no change in the valuation techniques used by the Parent Company in determining the fairmarket value of the assets and liabilities. There were no transfers between Level 1 and Level 2 fairvalue measurements, and no transfers into and out of Level 3 fair value measurements.
Fair Value of Financial InstrumentsThe table below presents a comparison by category of carrying amounts and estimated fair values ofthe Parent Company’s financial instruments (amounts in thousands):
December 31
2019 2018
Carrying Value Fair Value Carrying Value Fair Value
At Amortized Cost Notes receivable P=244,221 P=192,347 P=235,189 P=171,499 Other receivable 219,055 219,055 222,379 222,379
Financial Assets at Fair Value through OCI Quoted equity investments 534,470 534,470 508,211 508,211
Total financial assets P=997,746 945,872 P=965,779 P=902,089
Other Financial Liabilities Long-term debt 65,544,066 56,973,903 67,168,190 58,987,772
Total financial liabilities P=65,544,066 P=56,973,903 P=67,168,190 P=58,987,772

- 70 -
*SGVFS039490*
The following methods and assumptions were used to estimate the fair value of each class offinancial instrument for which it is practicable to estimate such value:
a. Notes receivable - The fair values are based on the discounted value of future cash flows usingthe applicable rates for similar instruments. The discount rates used ranged from 3.35% to4.79% and 5.18% to 7.49% in 2019 and 2018, respectively.
b. Other receivables - The fair values are based on the discounted value of future cash flows usingthe applicable rates for similar instruments. The discount rates used are 3.20% and 3.925% in2019 and 2018, respectively.
c. Financial assets through OCI - The fair values are based on quoted prices.
d. Long-term debt - The fair value are estimated using the discounted cash flow methodology usingthe current incremental borrowing rates for similar borrowings with maturities consistent withthose remaining for the liability being valued. The discount rates used ranged from 3.13% to6.68% in 2019 and 5.72% to 9.97% in 2018. For variable rate loans that reprice every threemonths, the carrying value approximates the fair value because of recent and regular repricingbased on current market rates.
The carrying amounts of cash and cash equivalents, dividends receivable, receivable from relatedparties, rent receivable, receivable from other companies and interest receivable, accounts payablesand accrued expenses and dividends payables approximates the fair values of these financialinstruments due to the short-term nature of these accounts.
25. Financial Instruments
Financial Risk Management
GeneralLike any other risks, financial risks are inherent in its business activities and are typical of any largeholding company. The financial risk management of the Parent Company seeks to effectivelycontribute to better decision making, enhance performance, and satisfy compliance demands.
The Parent Company defines financial risks as risk that relates to the Parent Company’s ability tomeet financial obligations and mitigate funding risk, credit risk and exposure to broad market risks,including volatility in foreign currency exchange rates and interest rates. Funding risk refers to thepotential inability to meet contractual or contingent financial obligations as they arise and couldpotentially impact the Parent Company’s financial condition or overall financial position. Credit risk isthe risk of financial loss arising from a counterparty’s failure to meet its contractual obligations ornon-payment of an investment. These exposures may result in unexpected losses and volatilities inthe Parent Company’s profit and loss accounts.
The Parent Company maintains a strong focus on its funding strategy to help provide access tosufficient funding to meet its business needs and financial obligations throughout business cycles.The Parent Company’s plans are established within the context of its annual strategic and financialplanning processes. The Parent Company also take into account capital allocations and growthobjectives, including dividend pay-out. As a holding company, the Parent Company generates cashprimarily on dividend payments of its subsidiaries, associates and joint ventures and other sources offunding.
The Parent Company also established credit policies setting up limits for counterparties that arereviewed quarterly and monitoring of any changes in credit standing of counterparties.

- 71 -
*SGVFS039490*
In 2014, the Parent Company formalized the foreign exchange and interest rate risk managementpolicy. The Parent Company actively monitors foreign exchange exposure and interest rate changes.And in addition, the Parent Company ensures that all loan covenants and regulatory requirements arecomplied with.
The Parent Company continues to monitor and manage its financial risk exposures in accordancewith Board approved policies. The succeeding discussion focuses on the Parent Company’s financialrisk management.
Financial Risk Management Objectives and Policies
The Parent Company’s principal financial instruments comprise cash and cash equivalents, short-term investments, financial assets at fair value through OCI, bank loans, corporate notes and bonds.The financial debt instruments were issued primarily to raise financing for the Parent Company’soperations. The Parent Company has various financial assets such as cash and cash equivalents,short-term investments, accounts and notes receivables and accounts payable and accruedexpenses which arise directly from its operations.
The Parent Company’s main risks arising from the use of financial instruments are interest rate risk,foreign exchange risk, price risk, liquidity risk, and credit risk.
The Parent Company’s risk management policies relevant to financial risks are summarized below:
Interest rate riskThe Parent Company’s exposure to market risk for changes in interest rates relates primarily to theParent Company’s long-term debt obligations with floating interest rates. The policy is to keep acertain level of the total obligations as fixed to minimize earnings volatility due to fluctuation in interestrates.
The following table demonstrates the sensitivity of the Parent Company’s profit before tax and equityto a reasonably possible change in interest rates as of December 31, 2019 and 2018, with allvariables held constant.
Change in basis points (bps)
Effect on incomebefore income tax
Increase (Decrease)
(In Thousands)
2019 +100 bps (P=100,213)-100 bps 100,213
2018 +100 bps (P=115,433)-100 bps 115,433
There is no other impact on the Parent Company’s equity other than those already affecting netincome.

- 72 -
*SGVFS039490*
The terms and maturity profile of the interest-bearing financial assets and liabilities, together with the corresponding nominal amounts and carrying values, are shown inthe following tables (amounts in thousands):
2019
Interest Terms (p.a.)
RateFixingPeriod
NominalAmount < 1 year 1 to 5 years > 5 years Carrying Value
Cash and cashequivalents*
Fixed at the date ofinvestment Various P=7,251,116 P=7,251,116 P=− P=− P=7,251,116
Short-terminvestments
Fixed at the date ofinvestment Various 25,318 25,318 − − 25,318
Notes receivableFixed at the date oftransaction Various 244,221 31,634 38,625 173,962 244,221
P=7,520,655 7,308,068 38,625 173,962 P=7,520,655
Long-term debt
Fixed Peso Fixed at 6.0043% 8 years P=11,000,000 P=– P=1,744,919 P=9,187,892 P=10,932,811 Peso Fixed at 6.875% 15 years 10,000,000 – – 9,952,651 9,952,651 Peso Fixed at 3.92% 7 years 10,000,000 – 9,942,735 – 9,942,735 Peso Fixed at 4.82% 8 years 10,000,000 – – 9,929,787 9,929,787 Peso Fixed at 6.80% 10 years 9,903,400 – 9,885,752 – 9,885,752 Peso Fixed at 5.2883% 7 years 2,940,000 30,000 2,933,817 – 2,963,817 Peso Fixed at 6.0043% 5 years 2,000,000 – 1,990,018 – 1,990,018
Floating Peso Variable at 0.60% to 0.70%
over 3-month PDST R2 or0.45% over 28-day BSPTDF Rate 3 months 10,021,250 4,357,500 1,493,703 4,095,292 9,946,495
P=65,864,650 P=4,387,500 P=27,990,944 P=33,165,622 P=65,544,066*Excludes cash on hand

- 73 -
*SGVFS039490*
2018
Interest Terms (p.a.)
RateFixingPeriod
NominalAmount < 1 year 1 to 5 years > 5 years Carrying Value
Cash and cashequivalents*
Fixed at the date ofinvestment Various P=3,535,748 P=3,535,748 P=− P=− P=3,535,748
Short-terminvestments
Fixed at the date ofinvestment Various 25,844 25,844 − − 25,844
Notes receivableFixed at the date oftransaction Various 235,189 39,681 131,174 64,334 235,189
P=3,796,781 P=3,601,273 P=131,174 P=64,334 P=3,796,781
Long-term debt
Fixed Peso Fixed at 6.0043% 8 years P=11,000,000 P=– P=875,760 P=10,071,238 P=10,946,998 Peso Fixed at 3.92% 7 years 10,000,000 – 9,927,904 – 9,927,904 Peso Fixed at 4.82% 8 years 10,000,000 – – 9,918,003 9,918,003 Peso Fixed at 6.80% 10 years 10,000,000 – 9,970,466 – 9,970,466 Peso Fixed at 6.875% 15 years 10,000,000 – – 9,946,221 9,946,221 Peso Fixed at 5.2883% 7 years 2,970,000 29,916 2,931,726 – 2,961,642 Peso Fixed at 6.0043% 5 years 2,000,000 – 2,017,241 – 2,017,241
Floating Peso Variable at 0.60% to 0.70%
over 3-month PDST R2 or0.45% over 28-day BSPTDF Rate 3 months 11,543,250 492,212 8,563,559 2,423,735 11,479,506
P=67,513,250 P=522,128 P=34,286,656 P=32,359,197 P=67,167,981
*Excludes cash on hand

- 74 -
*SGVFS039490*
Foreign Exchange RiskThe Parent Company’s foreign exchange risk results primarily from movements of the Philippine Peso(Php) against the United States Dollar (US$).
The table below summarizes the Parent Company’s exposure to foreign exchange risk as ofDecember 31, 2019 and 2018.
2019 2018US$ Php Equivalent* US$ Php Equivalent*
(In Thousands)
Foreign currency denominatedassets
Cash and cash equivalents US$1,253 P=63,434 US$916 P=48,152Short-term investments 500 25,318 − −
US$1,753 P=88,752 US$916 P=48,152
*Translated using the exchange rate at the reporting date (US$1equivalent to P=50.635 and P=52.58 in 2019 and 2018, respectively).
The following table demonstrates the sensitivity to a reasonably possible change in the Php:US$exchange rate, with all variables held constant, of the Parent Company’s income before income tax(due to changes in the fair value of monetary assets).
Increase (decrease) inPeso per US$depreciation
(appreciation)
Effect on incomebefore income tax
Increase (decrease)(In Thousands)
2019 P=1.00 (P=88,752)(1.00) 88,752
2018 P=1.00 (P=48,152)(1.00) 48,152
There is no other impact on the Parent Company’s equity other than those already affecting netincome.
Equity Price riskQuoted financial assets at fair value through OCI are acquired at certain prices in the market. Suchinvestment securities are subject to price risk due to changes in market values of instruments arisingeither from factors specific to individual instruments or their issuers, or factors affecting allinstruments traded in the market. Depending on several factors such as interest rate movements, thecountry’s economic performance, political stability, and domestic inflation rates, these prices change,reflecting how market participants view the developments. The Parent Company’s investment policyrequires it to manage such risks by setting and monitoring objectives and constraints on investments;diversification plan; and limits on investment in each sector and market.
The analysis below is performed for a reasonable possible movement of the market index, of theParent Company’s equity with all other variables held constant.
Market IndexChange inVariables
Effect onEquity
Increase(decrease)
(In Thousands)
2019 PSEi 5% P=455-5% (455)
2018 PSEi 5% P=544-5% (544)

- 75 -
*SGVFS039490*
There is no impact on the parent company statements of income.
Liquidity RiskLiquidity risk is defined by the Parent Company as the risk of losses arising from funding difficultiesdue to deterioration in market conditions and/or the financial position of the Parent Company thatmake it difficult to raise the necessary funds or that forces the Parent Company to raise funds atsignificantly higher interest rates than usual.
This is also the possibility of experiencing losses due to the inability to sell or convert marketablesecurities into cash immediately or in instances where conversion to cash is possible but at loss dueto wider than normal bid-offer spreads.
The Parent Company seeks to manage its liquidity profile to be able to service its maturing debts andto finance capital requirements. The Parent Company maintains a level of cash and cash equivalentsdeemed sufficient to finance operations. As part of its liquidity risk management, the ParentCompany regularly evaluates its projected and actual cash flows. It also continuously assessesconditions in the financial markets for opportunities to pursue fund-raising activities. Fund-raisingactivities may include bank loans and capital market issues, both on-shore and off-shore.
Cash and cash equivalents and short-term investments are used for the Parent Company’s liquidityrequirements. Please refer to the terms and maturity profile of these financial assets under thematurity profile of the interest-bearing financial assets and liabilities disclosed in the interest rate risksection.
The Parent Company has access to sufficient variety of sources of funding with existing lenders. Thecredit facilities are as follows (in thousands):
Description of Facility Date Contracted
Amount undrawn as
of December 31,
2019
Outstanding loan
balance
as of December 31, 2019
P=10 billion 5-year loan facility,
fixed and/or floating rate December 1, 2016 P=10,000,000 P=−P=10 billion loan facility, fixed
and/or floating rate, with a
maximum tenor of 10 years January 30, 2018 5,500,000 4,250,000
P=1.9 billion loan facility, fixed
and/or floating rate, with a
maximum tenor of 10 years January 30, 2018 − 1,733,750
P=5 billion loan facility, fixed
and/or floating rate, with a
maximum tenor of 5 years April 4, 2018 3,000,000 2,000,000
P=11 billion loan facility, fixed
and/or floating rate, with a
maximum tenor of 8 years April 16, 2018 − 11,000,000
P=18,500,000 P=18,983,750

- 76 -
*SGVFS039490*
The table below summarizes the maturity profile of the Parent Company’s financial liabilities as ofDecember 31, 2019 and 2018 based on contractual undiscounted payments (amounts in thousands).
December 31, 2019
< 1 year 1 to < 2 years 2 to < 3 years > 3 years Total
Accounts payable and
accrued expenses Accrued expenses P=1,194,196 P=− P=− P=− P=1,194,196 Deposits payable − − − − − Accounts payable 302,143 − − − 302,144 Payables to related parties
242,549− − −
242,549
Other payables* 10,990 − − − 10,990Dividends payable 3,860,742 − − − 3,860,742Other current liabilities
Subscriptions payable 2,069,413 − − − 2,069,413 Others 11,856 − − − 11,856Long-term debt 4,387,500 9,903,400 14,910,000 36,663,750 65,864,650
P=12,079,389 P=9,903,400 P=14,910,000 P=36,663,750 P=73,556,540
Interest payable P=3,718,807 P=3,139,521 P=2,807,477 P=8,155,944 P=17,821,749
*Excludes output VAT
December 31, 2018
< 1 year 1 to < 2 years 2 to < 3 years > 3 years Total
Accounts payable and
accrued expenses Accrued expenses P=1,233,704 P=− P=− P=− P=1,233,704 Deposits payable 758,132 − − − 758,132
Accounts payable 279,407 − − − 279,407 Payables to related parties 265,716 − − −
265,716
Other payables 8,884 − − − 8,884Dividends payable 3,466,986 − − − 3,466,986Other current liabilities
Subscriptions payable 1,785,734 − − − 1,785,734 Others 11,858 − − − 11,858Long-term debt 525,500 4,911,500 13,105,000 48,971,250 67,513,250
P=8,335,921 P=4,911,500 P=13,105,000 P=48,971,250 P=75,323,671
Interest payable P=3,760,094 P=3,750,848 P=3,124,796 P=10,167,846 P=20,803,584
Credit RiskCredit risk is the risk that the Parent Company’s counterparties to its financial assets will fail todischarge their contractual obligations. The Parent Company’s holding of cash and short-terminvestments and receivables from customers and other third parties exposes the Parent Company tocredit risk of the counterparty. Credit risk management involves dealing with institutions for whichcredit limits have been established. The Parent Company’s Treasury Policy sets credit limits for eachcounterparty. The Parent Company trades only with recognized, creditworthy third parties and has awell-defined credit policy and established credit procedures.
Impairment of financial assetsThe gross carrying amount of financial assets not subject to impairment also represents the ParentCompany’s maximum exposure to credit risk, as follows:
2019 2018
(In Thousands)
Financial assets Cash in bank and cash equivalents P=7,251,116 P=3,535,748 Short-term investments 25,318 25,844 Notes receivable 244,221 235,189 Receivable from related parties 221,070 227,294 Dividends receivable 34,600 1,281,478
(Forward)

- 77 -
*SGVFS039490*
2019 2018
(In Thousands)
Receivable from other parties P=25,378 P=34,963 Rent receivable 22,775 27,874 Interest receivable 10,203 4,525 Other receivables 219,055 222,380
P=8,053,736 P=5,595,295
The identified impairment losses were immaterial.
The Parent Company has other receivables that are related to government and employees withon-going transactions and/or progressive payments. Based on past experience, managementbelieves that these receivables are fully collectible, thus, are not impaired.
For financial guarantees granted, the maximum exposure to credit risk is the maximum amount thatthe Parent Company would have to pay if the guarantees are called upon.
The credit quality of the Parent Company’s financial assets follows (amounts in thousands):
2019Neither past due nor impaired Past due
High
Grade
Medium
Grade
Low
Grade Total
but not
impaired Impaired Total
Financial assets carried atamortized cost
Cash and cashequivalents* P=7,251,116 P=– P=– P=7,251,116 P=− P=− P=7,251,116
Short-term investments 25,318 – – 25,318 – – 25,318
Accounts and notesreceivable
Dividends receivable 34,600 – – 34,600 − − 34,600 Notes receivable 244,221 – – 244,221 − − 244,221
Receivable from related parties 221,070 – – 221,070 − − 221,070 Rent receivable 22,775 – – 22,775 − − 22,775
Receivable from other companies 19,984 – – 19,984 – 5,394 25,378 Interest receivable 10,203 – – 10,203 – – 10,203
Other receivables – – – – 219,055 – 219,055Financial assets through OCI
Quoted 534,470 – – 534,470 − − 534,470
P=8,363,757 P=– P=– P=8,363,757 P=219,055 P=5,394 P=8,588,206
*Excludes cash on hand
2018Neither past due nor impaired Past due
HighGrade
MediumGrade
LowGrade Total
but notimpaired Impaired Total
Financial assets carried at
amortized costCash and cash
equivalents* P=3,535,748 P=– P=– P=3,535,748 P=− P=− P=3,535,748
Short-term investments 25,844 – – 25,844 – – 25,844Accounts and notes
receivable
Dividends receivable 1,281,478 – – 1,281,478 − − 1,281,478
Notes receivable 235,189 – – 235,189 − − 235,189 Receivable from related parties 227,294 – – 227,294 − − 227,294
Rent receivable 27,874 – – 27,875 − − 27,874
(Forward)

- 78 -
*SGVFS039490*
Neither past due nor impaired Past due
High
Grade
Medium
Grade
Low
Grade Total
but not
impaired Impaired Total Receivable from other companies P=29,569 P=– P=– P=29,569 P=− P=5,394 P=34,963
Interest receivable 4,525 – – 4,525 − − 4,525 Other receivables − – – − 222,380 − 222,380Financial assets
through OCI Quoted 508,211 – – 508,211 − − 508,211
P=5,875,732 P=– P=– P=5,875,732 P=222,380 P=5,394 P=6,103,506
*Excludes cash on hand
The credit quality of the financial assets was determined as follows:
High grade pertains to cash and cash equivalents and short-term investments, quoted financialassets, related party transactions and receivables with high probability of collection.
Medium grade pertains to unquoted financial assets other than cash and cash equivalents and short-term investments with nonrelated counterparties and receivables from counterparties with averagecapacity to meet their obligation.
Low grade pertains to financial assets with the probability to be impaired based on the ParentCompany’s past experience.
26. AYCFL’s loans and borrowings
The Parent Company acted as guarantor to AYCFL’s loans and borrowings as follows:
2019 2018
Description of loans and
borrowings Date Contracted Outstanding balance
(Amounts in thousands)
US$400.0 million PerpetualUndated Notes October 31, 2019 US$400,000 US$–
US$400.0 million PerpetualUndated Notes September 13, 2017 400,000 400,000
US$300.0 million Exchangeable
Bonds May 2, 2014 – 292,800
US$200 million Transferrable
Loan Facility February 1, 2018 – 10,000
US$200 million Revolving
Credit Facility March 18, 2016 – 10,000
US$200 million Transferrable
Term Loan Facility March 18, 2016 – –
US$800,000 US$712,800
US$200 million Transferrable Loan Facility
On February 1, 2018, AYCFL entered a US$200.0 million revolving credit facility with an availabilityperiod of up to one (1) month prior to February 1, 2023. The first drawdown of the credit facilityamounted to US$10.0 million on September 6, 2018 with a quarterly repricing rate. In April 2019,AYCFL drew down US$100.0 million and US$ 90.0 million from the facility with a monthly repricingperiod. All outstanding obligations from this facility worth US$ 200.0 million were pre-paid onJune 10, 2019.

- 79 -
*SGVFS039490*
US$200 million Revolving Credit Facility
On September 6, 2018, AYCFL drew down US$10.0 million with a quarterly repricing rate from itsUS$200 million revolving credit facility contracted on March 18, 2016. On February 22, 2019, AYCFLdrew down US$30.0 million with a monthly repricing rate. Both obligations were pre-paid onJune 24, 2019.
On March 7, 2019, AYCFL drew US$60 million with a monthly repricing rate. This obligation was pre-paid on June 10, 2019.
US$200 million Transferrable Term Loan Facility
In April 2019, AYCFL drew US$60.0 million and US$20.0 million from its US$200 millionTransferrable Loan Facility with an interest repricing date of one month. Both obligations were pre-paid on June 28, 2019.
The Parent Company unconditionally guarantees the due and punctual payment of these loandrawdowns if, for any reason AYCFL does not make timely payment of the amount due. The ParentCompany waived all rights of subrogation, contribution, and claims of prior exhaustion of remedies.The Parent Company’s obligation as guarantor will remain in full force until no sum remains to be lentby the lenders, and the lenders recover the outstanding loan drawdowns.
On May 2, 2014, AYCFL issued at face US$300.0 million Exchangeable Bonds (the Bonds) due onMay 2, 2019 with a fixed coupon rate of 0.50% per annum, payable semi-annually. The Bonds areguaranteed by the Parent Company and constitute direct, unsubordinated, unconditional andunsecured obligations of AYCFL, ranking pari passu and without any preference or priority amongthemselves. The Bonds were listed in the Singapore Stock Exchange and include features such asexchange option, put option and early redemption options. The Bondholders have the right toexchange their Bonds for shares at any time during the exchange period. AYCFL shall lodgesufficient shares in its securities account to service Exchange Rights. In consideration for thereservation of the shares and by way of deposit for the exercise by the Bondholders of the ExchangeRight, AYCFL shall remit to the Parent Company from time to time such amount as may be agreedbetween them, as defined in the Exchange Protocol agreed between AC and AYCFL.
On April 30, 2019, the remaining AYCFL US$292.8 million guaranteed exchangeable bonds as ofDecember 31, 2018 was exchanged and converted into total of 377.5 million ALI ordinary commonshares. On May 2, 2019, the Bonds has zero outstanding balance.
The total cumulative exchanges of the Bonds into shares resulted in an overall gain of P=16.7 billionwhich was booked under other income (see Note 18).
On September 7, 2017, the Parent Company announced that AYCFL had successfully set the termsof a US dollar-denominated fixed-for-life senior perpetual issuance at an aggregate principal amountof US$400 million with an annual coupon of 5.125% for life with no reset and step-up. The issuer,AYCFL, may redeem the Notes in whole but not in part on September 13, 2022 (first redemptiondate) or any interest payment date falling after the first redemption date at 100% of the principalamount of the Notes plus any accrued but unpaid interest. The Parent Company unconditionallyguarantees the due and punctual payment of this note if, for any reason AYCFL does not make timelypayment of the amount due.

- 80 -
*SGVFS039490*
On October 23, 2019, the Parent Company announced that AYCFL had successfully priced a similarUS dollar denominated fixed-for-life senior perpetual issuance at an aggregate principal amount ofUS$400 million with an annual coupon of 4.85% for life with no reset and step-up. The issuer,AYCFL, may redeem the Notes in whole but not in part on October 30, 2024 (first redemption date) orany interest payment date falling after the first redemption date at 100% of the principal amount of theNotes plus any accrued but unpaid interest. The Parent Company unconditionally guarantees thedue and punctual payment of this note if, for any reason AYCFL does not make timely payment of theamount due.
27. Contingencies
The Parent Company is contingently liable for lawsuits or claims filed by third parties which are eitherpending decision by the courts or are under negotiation, the outcomes of which are not presentlydeterminable. In the opinion of management and its legal counsel, the eventual liability under theselawsuits or claims, if any, will not have a material or adverse effect on the parent company financialstatements. The information usually required by PAS 37, Provisions, Contingent Liabilities andContingent Assets, is not disclosed on the grounds that it can be expected to prejudice the outcomeof these lawsuits, claims and assessments.
28. Leases
Operating Leases – Parent Company as LessorThe Parent Company is a party under various operating leases which have lease terms between oneto thirty years with an annual escalation rate of 4.5% to 10%.
Future minimum rentals receivable under non-cancellable operating leases of the Parent Companyfollow:
2019 2018(In Thousands)
Within one year P=31,449 P=29,290More than one (1) year but less than five (5) years 165,839 162,923More than five (5) years 535,330 565,060
P=732,618 P=757,273
Total contingent rent income amounted to P=125.9 million and P=153.3 million in 2019 and 2018,respectively.
Operating Leases – Parent Company as LesseeFuture minimum rentals payable under non-cancellable operating leases follow (see Note 18):
2019 2018(In Thousands)
Within one year P=8,166 P=7,242
P=8,166 P=7,242

- 81 -
*SGVFS039490*
29. Note to Parent Company Statements of Cash Flows
Changes in liabilities arising from financing activities follow:
2018 Cash FlowsNon-cashChanges Others 2019
(In Thousands)
Long-term debt P=66,642,481 (P=1,183,010) P=84,595 (P=4,387,500) P=61,156,566Current portion of long-term
debt 525,500 (525,500) − 4,387,500 4,387,500
Dividends payable(Notes 16 and 21) 3,466,986 (6,070,472) − 6,464,228* 3,860,742
Total liabilities from financing activities P=70,634,967 (P=7,778,982) P=84,595 P=6,464,228 P=69,404,808*Pertains to cash dividends declared by the Parent Company.
The Parent Company’s noncash investing and financing transactions in 2019 and 2018 are asfollows:
2019
· Disposal of investment properties resulted in a receivable of P=149.54 million.
· Conversion of $292.8 million bonds from AYCFL US$300.0 million guaranteed exchangeablebonds to 377,465,612 ALI ordinary shares. Deposits received from AYCFL in prior yearsamounting to P=758.1 million were used for the conversion.
· The Parent Company has unpaid subscriptions to shares of AHHI, ACEI, AVHC and AACamounting to P=1,959.7 million, P=70.3 million, and P=39.4 million, respectively.
· Disposal of 1,993,477,338 AEI shares in exchange for 295,329,976 IPO shares.
· Disposal of financial assets at fair value through OCI resulted in a receivable of P=2.4 million.
2018
· Disposal of investment properties resulted in a receivable of P=49.7 million.
· Conversion of $7.0 million bonds from AYCFL US$300.0 million guaranteed exchangeable bondsto 8,844,704 ALI ordinary shares.
· The Parent Company has unpaid subscriptions to shares of ACEI, AVHC and AHCHI amountingto P=1,687.5 million, P=96.9 million, and P=1.4 million, respectively.
30. Events after the Reporting Period
a) On January 15, 2020, the Parent Company have fully utilized the proceeds from the re-issuanceof Preferred B Series 2 shares.
b) On January 23, 2020, the Parent Company through VIP, disbursed US$82.5 million into FMI via aconvertible loan facility. The investment followed the completion of the conditions precedent fordisbursement, including approval by the Central Bank of Myanmar of the convertible loan. Thetransaction forms part of the Parent Company’s $237.5 million investment in YSH.
c) In January 2020, the Parent Company made capital infusion amounting to P=205.6 million to AITHIto support the operations of its automotive business unit, and P=362.5 million to AC Infra to fundits working capital requirements.
d) On February 7, 2020, 33,751 common shares were exercised under the Parent Company’sESOP.
e) In February 2020, the Parent Company purchased its 1,016,210 common shares amounting toP=764.0 million pursuant to the share buyback program of P=10.0 billion worth of shares approvedby the BOD on December 5, 2019.

- 82 -
*SGVFS039490*
31. Supplementary Information Required Under Revenue Regulations 15-2010
In compliance with the requirements set forth by Revenue Regulations 15-2010 hereunder are theinformation on taxes, duties and license fees paid or accrued during the taxable year.
Output Value Added Tax (VAT)a. The Parent Company is a VAT-registered company with VAT output tax declaration as follows
(in thousands):Net
Sales/Receipts Output VAT
Taxable Sales:Sale of investment properties – excess of
assessed value over selling price P=1,244,036 P=149,284 Management fee 717,551 86,106 Sale of investment properties and property and
equipment 323,155 38,779 Toll revenue 221,214 26,546 Rental income 169,648 20,358 Other income 1,605 192
P=2,677,209 P=321,265
Input VATThe amount of VAT input taxes claimed are broken down as follows (in thousands):
Current year’s domestic purchases/payments for:Capital goods not subject to amortization and services and goods lodged under other accounts P=40,619
Capital goods subject to amortization 27,991
Total input VAT claimed during the year P=68,610
Documentary stamp tax (DST)The DST paid/accrued on the following transactions are (in thousands):
Transaction Amount DST thereon
Long term debt P=13,500,000 P=35,497Issuance of shares 3,025,795 22,758Others − 34
P=16,525,795 P=58,289
Taxes and LicensesThe following are the taxes, licenses and permit fees lodged under the ‘Taxes, licenses and fees’account under general and administrative expenses in 2019 (in thousands):
a. Local
License and permit fees P=10,862Real estate taxes 5,383
P=16,245
b. National
Fringe benefits tax P=16,264Documentary stamp tax 34Other taxes 2,589
P=18,887

- 83 -
*SGVFS039490*
Withholding TaxesDetails of withholding taxes for the year are as follows (in thousands):
Final withholding taxes P=807,111Withholding taxes on compensation 585,070Expanded withholding taxes (EWT) 70,985
P=1,463,166
Tax ContingenciesIn April 2011, the Parent Company filed a claim for issuance of Tax Credit Certificate (TCC) with theCourt of Tax Appeals (CTA) for its excess and unutilized Creditable Withholding Taxes (CWTs)incurred in 2008 and 2009 in the aggregate amount of P=102.2 million. The case was raffled to CTASecond Division and docketed under CTA Case No. 8262. In November 2012, the CTA SecondDivision issued a decision in CTA Case No. 8262 granting a portion of the claim amounting toP=65.0 million. The Parent Company filed a Motion for Partial Reconsideration (PR) on the disallowedportion of the claim. In March 2014, the CTA Second Division issued an amended decision in CTACase No. 8262 granting the Parent Company’s claim for issuance of TCC for its excess andunutilized CWTs incurred in 2008 and 2009 in the total amount of P=99.1 million. The BIR appealedthe amended decision to the CTA En Banc and the case was docketed under CTA EB No. 1152.
The CTA En Banc sustained the Decision of the CTA Second Division granting the Parent Company’sclaim for refund. In February 2016, BIR filed a Motion for Reconsideration (MR) contesting the CTAEn Banc decision which was denied in June 2016. The BIR appealed the CTA En Banc decision tothe Supreme Court by way of petition for review under GR No. 225420. In December 2016, theSupreme Court denied the BIR’s petition for review. An MR was filed by the BIR. In June 2018, theSupreme Court denied with finality BIR’s MR. Thereafter, an Entry of Judgment was issued by theSupreme Court declaring its decision final and executory. On April 3, 2019, the CTA Second Divisionissued a writ of execution ordering the BIR to issue a TCC in favor of the Parent Company in the totalamount of P=99.1 million.
In April 2013, the Parent Company filed a claim for issuance of TCC with the CTA for its excess andunutilized CWTs incurred in 2010 and 2011 in the aggregate amount of P=127.1 million. The case wasraffled to CTA Second Division and docketed under CTA Case No. 8629. In October 2015, the CTAissued a decision in CTA Case No. 8629 granting its claim for issuance of TCC in the total amount ofP=67.7 million. The Parent Company filed a Motion for PR on the disallowed portion of the claim. InMarch 2016, the CTA issued an amended decision in CTA Case No. 8629 granting the ParentCompany’s claim for issuance of TCC for its excess and unutilized CWTs incurred in 2010 and 2011in the total amount of P=97.1 million. Not satisfied with the said CTA amended decision, the ParentCompany and BIR appealed the amended decision to the CTA En Banc. The separate appeals by theParent Company and BIR were consolidated under CTA EB No. 1442 and CTA EB No. 1443. InSeptember 2017, the CTA En Banc issued a Consolidated Decision affirming, in effect, the CTASecond Division Decision’s granting the Parent Company’s claim for issuance of TCC in the totalamount of P=97.1 million. An MR was filed by the BIR with the Court En Banc. In September 2018, theCourt En Banc denied the MR. The BIR appealed the Court En Banc Decision to the Supreme Courtby way of petition for review and docketed under GR No. 242356. On March 25, 2019, the SupremeCourt issued a notice denying the BIR’s petition for review. Thereafter, an Entry of Judgment wasrecorded by the Supreme Court on July 8, 2019 in its Books of Entries and Judgment declaring thedenial of the petition for review as final and executory.
In April 2015, the Parent Company filed a claim for issuance of TCC with the CTA for its excess andunutilized CWTs incurred in 2012 and 2013 in the aggregate amount of P=128.7 million. The case wasraffled to CTA First Division and docketed under CTA Case No. 9024. In February 2018, the CTAFirst Division issued a decision in CTA Case No. 9024 partially granting Parent Company’s claim forissuance of TCC in the total amount of P=81.7 million. Not satisfied with the decision, both parties fileda Motion for PR. The Parent Company filed a Motion for PR on the disallowed portion of the claim. InMay 2018, the CTA First Division gave due course to the Parent Company’s Motion for PR byallowing it to recall its witness and identify relevant documentary evidence in support to the partial

- 84 -
*SGVFS039490*
reconsideration. On March 25, 2019, the CTA First Division issued an amended decision denying theBIR’s Motion for PR. In the said amended decision, the CTA First Division granted the ParentCompany’s Motion for PR thereby increasing the amount subject for issuance of TCC toP=127.2 million. The BIR appealed the amended decision to the CTA En Banc and the case wasdocketed under CTA EB No. 2118.
In March 2017, the Parent Company filed a claim for issuance of TCC with the CTA for its excess andunutilized CWT incurred in 2014 in the aggregate amount of P62.7 million. The case was raffled tothe CTA First Division and docketed under CTA Case No. 9556. The presentation of evidence wasalready terminated and the parties had submitted their respective Memoranda. The case is nowsubmitted for decision by CTA First Division.
In April 2019, the Parent Company filed a claim for issuance of TCC with the CTA for its excess andunutilized CWTs incurred in 2016 and 2017 in the aggregate amount of P=212.9 million. The case wasraffled to CTA First Division and docketed under CTA Case No. 10056. The Parent Company startedthe presentation of evidence.
Further, the Parent Company received a Formal Letter of Demand (FLD) on December 27, 2018 fordeficiency internal revenue taxes including interest and compromise for both taxable years endedDecember 31, 2013 and 2014 amounting to P=506.4 million and P=964.5 million, respectively. InJanuary 2019, the Parent Company has made protest on both FLDs for lack of factual and legalbases. In June 2019, the Parent Company received a Final Decision on Disputed Assessment(FDDA) in connection to the 2014 FLD. Remaining deficiency tax assessments amounted toP=23.7 million which was paid by the Parent Company on June 27, 2019.
32. Approval of the Parent Company Financial Statements
The Parent Company financial statements of Ayala Corporation as of December 31, 2019 and 2018were endorsed for approval by the Audit Committee on March 6, 2020 and authorized for issue by theBOD on March 12, 2020.

Certification
I, Josephine G. de Asis, Comptroller, a duly authorized representative of Ayala Corporation (Company) with SEC registration number 34218 with principal office at 32F to 35F, Tower One and Exchange Plaza, Ayala Triangle, Ayala Avenue, Makati City, do hereby certify and state that:
1) In compliance with the guidelines issued by the Securities and Exchange Commission (SEC) for the filing of structured and current reports by publicly listed companies with the SEC in light of the imposition of an Enhanced Community Quarantine and Stringent Social Distancing Measures over the entire region of Luzon to prevent the spread of the 2019 Coronavirus Disease (COVID-2019), the Company is timely filing its SEC Form PFHS dated April 8, 2020 by uploading the same through the PSE EDGE in accordance with the relevant PSE rules and procedures.
2) The information contained in SEC Form PHFS dated April 8, 2020 is true and correct
to the best of my knowledge.
3) On behalf of the Company, I hereby undertake to a) submit hard or physical copies of SEC Form PHFS dated April 8, 2020 with proper notarization and certification, b) pay the filing fees (where applicable) c) pay the penalties due (where applicable) d) other impositions (where applicable), within ten (10) calendar days from the date of the lifting of the Enhanced Community Quarantine period and resumption of SEC’s normal working hours.
4) I am fully aware that non-submission of hard/physical copies of reports as well as
certification that they refer to one and the same document submitted online, within ten (10) calendar days from the lifting of the Enhanced Community Quarantine period and resumption of SEC’s normal working hours, shall invalidate the reports, applications, compliance, requests and other documents submitted via email. Hence, the corresponding penalties under existing rules and regulations of the Commission shall apply without prejudice to the imposition of penalties under Section 54 of the Securities Regulation Code and other applicable existing rules and regulations for failure to comply with the orders of the Commission.
5) I am executing this certification this April 8, 2020 to attest to the truthfulness of the
foregoing facts and for whatever legal purpose it may serve.
Josephine G. de Asis
Comptroller
Passport No. P0174919B

CERTIFICATION This certifies that Ayala Corporation, with principal office at 32/F to 35/F Tower One and Exchange Plaza, Ayala Triangle, Ayala Avenue, Makati City, and with Securities and Exchange Commission (SEC) Registration Number 34218, hereby undertakes to submit to SEC the Ayala Corporation’s (Parent Company) Special Form for Financial Statements of Publicly-Held and Investment Companies in diskette form (SFFS Form) in compliance with Section 27 of RA 8792 otherwise known as the “Electronic Commerce Act” and Sec. 37 of its Implementing Rules and Regulations within ten (10) calendar days from the date of the lifting of the Enhanced Community Quarantine period and resumption of SEC’s normal working hours following the guidelines on alternative filing dated March 30, 2020. The SFFS Form in printed pdf form uploaded to the PSE Edge/sent by electronic mail to SEC contains the basic and material data in the financial statements submitted to the SEC for the calendar year 2019.
AYALA CORPORATION By: _______________________________ ________________________________ Jose Teodoro K. Limcaoco Josephine G. de Asis Chief Finance Officer, Chief Risk Officer Comptroller Chief Sustainability Officer and Finance Group Head SUBSCRIBED AND SWORN to before me this ______________ at Makati City, affiants exhibiting to me their respective passports/driver’s license, to wit:
Doc. No. ________ Page No. ________ Book No. ________ Series of 2020
Name Passport No. Date and Place of Issue Jose Teodoro K. Limcaoco P6682433A April 5, 2018 - DFA Manila Josephine G. De Asis P0174919B January 9, 2019 - DFA Manila

PHFS (rev 2006)
FAX NO.:
PSIC:
2019 2018( in P'000 ) ( in P'000 )
A. 206,031,688 193,779,748
7,627,020 5,187,846
7,252,450 3,537,096 1,333 1,346 7,250,387 3,533,335 730 2,415
A.1.2 25,318 25,844 343,393 1,616,874
A.1.3.1.1A.1.3.1.2 221,070 227,294 A.1.3.1.3 127,717 1,394,974
A.1.3.1.3.1 34,600 1,281,478 A.1.3.1.3.2 93,117 113,496
A.1.3.1.4 (5,394) (5,394)
A.1.3.2.1A.1.3.2.2
A.1.4.6.1 A.1.4.6.2
-
A.1.5.1.1A.1.5.1.2A.1.5.1.3A.1.5.1.4A.1.5.1.5
-
A.1.5.2.1A.1.5.2.2A.1.5.2.3A.1.5.2.4A.1.5.2.5
This special form is applicable to Investment Companies and Publicly-held Companies (enumerated in Section 17.2 of the Securities Regulation Code (SRC), except banksand insurance companies). As a supplemental form to PHFS, it shall be used for reporting Consolidated Financial Statements of Parent corporations and their subsidiaries.
Domestic corporations are those which are incorporated under Philippine laws or branches/subsidiaries of foreign corporations that are licensed to do business in thePhilippines where the center of economic interest or activity is within the Philippines. On the other hand, foreign corporations are those that are incorporated abroad, includingbranches of Philippine corporations operating abroad.
Financial Institutions are corporations principally engaged in financial intermediation, facilitating financial intermediation, or auxiliary financial services. Non-Financialinstitutions refer to corporations that are primarily engaged in the production of market goods and non-financial services.
National GovernmentPublic Financial Institutions
NOTE:
Held to Maturity Investments - issued by domestic entities:(A.1.5.2.1 + A.1.5.2.2 + A.1.5.2.3 + A.1.5.2.4 + A.1.5.2.5)
National GovernmentPublic Financial Institutions
Private Non-Financial Institutions
Public Non-Financial Institutions
A.1.5.2
Due from domestic entities (A.1.3.1.1 + A.1.3.1.2 + A.1.3.1.3 + A.1.3.1.4)
Private Financial InstitutionsPublic Non-Financial Institutions
Others
Due from customers (trade)Due from related parties
Allowance for doubtful accounts (negative entry)
Financial Assets at Fair Value through Profit or Loss - issued by domestic entities:(A.1.5.1.1 + A.1.5.1.2 + A.1.5.1.3 + A.1.5.1.4 + A.1.5.1.5)
Private Non-Financial InstitutionsPrivate Financial Institutions
Due from foreign entities, specify (A.1.3.2.1 + A.1.3.2.2 )
Others, specify (A.1.2.1.3.1 + A.1.2.1.3.2)
SPECIAL FORM FOR FINANCIAL STATEMENTS OF PUBLICLY-HELD AND INVESTMENT COMPANIES
NAME OF CORPORATION: AYALA CORPORATION(Parent Company)
Form Type:
Control No.:
Tower One,Ayala Triangle,Ayala Avenue, Makati City
TEL. NO.:
COMPANY TYPE : Holding Company
CURRENT ADDRESS:
If these are based on consolidated financial statements, please so indicate in the caption.
Financial Assets other than Cash/Receivables/Equity investments (A.1.5.1 + A.1.5.2 + A.1.5.3 + A.1.5.4 + A.1.5.5)
Allowance for doubtful accounts (negative entry)A.1.4 Inventories (A.1.4.1 + A.1.4.2 + A.1.4.3 + A.1.4.4 + A.1.4.5 + A.1.4.6)
Current Assets (A.1.1 + A.1.2 + A.1.3 + A.1.4 + A.1.5+A.1.6)
A.1.1.3
Dividend Receivable
A.1.3
In foreign banks/entitiesA.1.1.2
A.1.1 Cash and cash equivalents (A.1.1.1 + A.1.1.2 + A.1.1.3)
In domestic banks/entities
Table 1. Balance Sheet
F I N A N C I A L D A T A
ASSETS (A.1 + A.2 + A.3 + A.4 + A.5 + A.6 + A.7 + A.8 + A.9 + A.10+A.11)
Trade and Other Receivables (A.1.3.1 + A.1.3.2)
A.1.4.3 Finished goods
A.1
A.1.1.1
A.1.3.1
Short-term investments
On hand
A.1.4.2 Goods in process (including unfinished goods, growing crops, unfinished seeds)A.1.4.1 Raw materials and supplies
A.1.3.2
A.1.5
A.1.5.1
A.1.4.4 Merchandise/Goods in transitA.1.4.5 Unbilled Services (in case of service providers)A.1.4.6 Others, specify (A.1.4.6.1 + A.1.4.6.2)
Page 1

PHFS (rev 2006)
FAX NO.:
PSIC:
2019 2018( in P'000 ) ( in P'000 )
A.1.5.3 - -
A.1.5.3.1A.1.5.3.2A.1.5.3.3A.1.5.3.4A.1.5.3.5
A.1.5.4 - - A.1.5.4.1A.1.5.4.2A.1.5.4.3A.1.5.4.4
5,859 8,032
A.1.6.1A.1.6.2 - (3,647.00) A.1.6.3 5,859 11,679
283,931 352,760
720,938 703,764 376,629 363,568
201,603 199,372 17,979 2,647
A..2.5.1 Construction in Progress 17,979 2,647 A..2.5.2
A..2.6.1A..2.6.2
(1,033,218) (916,591) A.2.8 Impairment Loss or Reversal (if loss, negative entry)
193,377,477 183,652,654 190,893,046 176,455,688
2,484,431 7,196,966
A.3.3.1A.3.3.2
Investment Property 1,109,980 1,130,861 Biological AssetsIntangible Assets(A.6.1 + A.6.2)
A.6.1.1A.6.1.2
Others, specify (A.6.2.1 + A.6.2.2)A.6.2.1A.6.2.2
A.7A.8
Long-term receivables (net of current portion) (A.9.1 + A.9.2 + A.9.3) 428,515 411,435 428,515 411,435
A.9.1.1 212,588 195,508 A.9.1.2 215,927 215,927
A.9.2.1A.9.2.2
Allowance for doubtful accounts, net of current portion (negative entry)534,470 508,211
-
A.10.1.1A.10.1.2
A.9.1 From domestic entities, specify (A.9.1.1 + A.9.1.2 )Notes ReceivableAccounts Receivable
A.3.3A.3.2 Investment cost in foreign subsidiaries/affiliates
A.9
From foreign entities, specify (A.9.2.1 + A.9.2.2 )A.9.2
A.4
Others, specify (A.3.3.1 + A.3.3.2)
Assets Classified as Held for SaleAssets included in Disposal Groups Classified as Held for Sale
A.6A.5
SPECIAL FORM FOR FINANCIAL STATEMENTS OF PUBLICLY-HELD AND INVESTMENT COMPANIES
NAME OF CORPORATION: Ayala Corporation(Parent Company)
Tower One,Ayala Triangle,Ayala Avenue, Makati cityCURRENT ADDRESS:
TEL. NO.:
A.2.6
A.3 Investments accounted for using the cost method (A.3.1 + A.3.2 + A.3.3)A.3.1 Investment cost in domestic subsidiaries/affiliates
Public Financial Institutions
Table 1. Balance Sheet
F I N A N C I A L D A T A
Machinery and equipment (on hand and in transit)A.2.2
Public Financial Institutions
Public Non-Financial InstitutionsPrivate Financial Institutions
Financial Assets at fair value through profit or lossFinancial Assets issued by foreign entities: (A.1.5.4.1+A.1.5.4.2+A.1.5.4.3+A.1.5.4.4)
Private Non-Financial Institutions
Held-to-maturity investmentsLoans and ReceivablesAvailable-for-sale financial assets
Building and improvements including leasehold improvement
A.1.5.5 Allowance for decline in market value (negative entry)
Transportation/motor vehicles, automotive equipment, autos and trucks, and delivery equipment
A.6.2
A.6.1
National Government
A.9.3
Loans and Receivables - issued by domestic entities:(A.1.5.3.1 + A.1.5.3.2 + A.1.5.3.3 + A.1.5.3.4 + A.1.5.3.5)
National Government
A.2.4
Major item/s, specify (A.6.1.1 + A.6.1.2)
OthersInput VAT
A.2 Property, plant, and equipment (A.2.1 + A.2.2 + A.2.3 + A.2.4 + A.2.5 + A.2.6 + A.2.7+ A.2.8)A.2.1 Land
A.2.3
A.2.7 Accumulated Depreciation (negative entry)
A.2.5
Control No.: Form Type:
A.10 Financial Assets other than Cash/Receivables/Equity investments (A.1.10.1 + A.10.2 + A.10.3 + A.10.4 + A.10.5 )
A.10.1.1 Held to Maturity Investments - issued by domestic entities:(A.10.1.1 + A.10.1.2 + A.10.1.3 + A.10.1.4 + A.10.1.5)
Holding CompanyCOMPANY TYPE :
Appraisal increase, specify (A.2.6.1 + A.2.6.2)
A.1.6 Other Current Assets (state separately material items) (A.1.6.1 + A.1.6.2 + A.1.6.3)Creditable W/holding Tax
Others, specify (A.2.5.1 + A.2.5.2 )
If these are based on consolidated financial statements, please so indicate in the caption.
Page 2

PHFS (rev 2006)
FAX NO.:PSIC:
2019 2018( in P'000 ) ( in P'000 )
A.10.1.3A.10.1.4A.10.1.5
A.10.2 - -
A.10.2.1A.10.2.2A.10.2.3A.10.2.4A.10.2.5
A.10.3 - -
A.10.3.1A.10.3.2A.10.3.3A.10.3.4 - - A.10.3.5
A.10.4A.10.4.1A.10.4.2A.10.4.3
A.10.5 534,470 508,211
A.10.5.1A.10.5.2A.10.5.3A.10.5.4 534,470 508,211 A.10.5.5
- - Other Noncurrent Assets (A.11.1 + A.11.2 + A.11.3 + A.11.4 + A.11.5 ) 2,670,295 2,535,981
35,479 20,758 - -
10,367 10,174 2,762,361 2,642,961
A.11.4.1 1,021,800 825,487 A.11.4.2A.11.4.3 1,740,561 1,817,474
(137,912) (137,912) B. 74,749,586 76,076,245
12,703,759 8,961,156 2,345,335 2,390,786
B.1.1.1 Loans/Notes Payables - - B.1.1.2 Trade Payables
B.1.1.3 Payables to Related Parties 242,549 265,716 B.1.1.4 Advances from Directors, Officers, Employees and Principal Stockholders B.1.1.5 Accruals, specify material items (B.1.1.5.1 + B.1.1.5.2 + B.1.1.5.3) 2,102,786 2,125,070
B.1.1.5.1 1,194,196 1,233,704 B.1.1.5.2 577,827 603,075 B.1.1.5.3 330,763 288,291
B.1.1.6 - - B.1.1.6.1B.1.1.6.2
- 758,132 B.1.2.1 - 758,132 B.1.2.2
13,606 11,396
B.1.4.1 B.1.4.2
B.1.5 15,307 10,764 B.1.6
10,329,511 5,790,078
B.1.7.1 Dividends declared and not paid at balance sheet date 3,860,742 3,466,986
Others, specify (B.1.1.6.1 + B.1.1.6.2 )
Current Liabilities (B.1.1 + B.1.2 + B.1.3 + B.1.4 + B.1.5 + B.1.6 )B.1.1
COMPANY TYPE : Holding Company
Public Non-Financial InstitutionsPrivate Financial InstitutionsPrivate Non-Financial Institutions
Public Financial Institutions
Public Non-Financial Institutions
Loans and Receivables - issued by domestic entities:(A.10.2.1 + A.10.2.2 + A.10.2.3 + A.10.2.4 + A.10.2.5)
National Government
Private Financial InstitutionsPrivate Non-Financial Institutions
Accounts Payable and other payable
Others, specify (If material, state separately; indicate if the item is payable to public/private or financial/non-financial institutions) (B.1.6.1 + B.1.6.2 + B.1.6.3 + B.1.6.4 + B.1.6.5 + B.1.6.6)
LIABILITIES (B.1 + B.2 + B.3 + B.4 + B.5)
A.11.3
If these are based on consolidated financial statements, please so indicate in the caption.
A.11.5
Available-for-sale financial assets - issued by domestic entities:(A.10.3.1 + A.10.3.2 + A.10.3.3 + A.10.3.4 + A.10.3.5)
National Government
Held-to-maturity investments
Allowance for decline in market value (negative entry)
Deposit payable
Deferred Tax Liabilities
Loans and ReceivablesAvailable-for-sale financial assets
Provisions for Maintenance Obligations
SPECIAL FORM FOR CONSOLIDATED FINANCIAL STATEMENTS OF PUBLICLY-HELD AND INVESTMENT COMPANIES
NAME OF CORPORATION: Ayala Corporation(Parent Company)
Control No.: Form Type:
Tower One,Ayala Triangle,Ayala Avenue, Makati City
Table 1. Balance Sheet
A.11.4
A.10.5
Public Financial InstitutionsPublic Non-Financial InstitutionsPrivate Financial InstitutionsPrivate Non-Financial Institutions
Financial Assets issued by foreign entities: (A.10.4.1+A.10.4.2+A.10.4.3)
TEL. NO.:
F I N A N C I A L D A T A
A.11
Deferred Income Tax
Public Financial InstitutionsPublic Non-Financial Institutions
B.1.7
CURRENT ADDRESS:
Liabilities for Current Tax
Deferred charges - net of amortization
Accrued expensesInterest Payable
Others, specify (A.11.4.1 + A.11.4.2 + A.11.4.3 )
Trade and Other Payables to Foreign Entities (specify) (B.1.2.1 + B.1.2.2 )
B.1.4 Financial Liabilities (excluding Trade and Other Payables and Provisions) (B.1.4.1 + B.1.4.2 )
B.1.3
A.11.1
B.1.2
B.1
A.11.2
Allowance for write-down of deferred charges/impairment loss (negative entry)
Advance/Miscellaneous deposits
Creditable W/holding taxInput Vat/(Output Vat)Service Concession Assets
Private Financial InstitutionsPrivate Non-Financial Institutions
Other Comprehensive Income financial assets - issued by domestic entities:(A.10.5.1 + A.10.5.2 + A.10.5.3 + A.10.5.4 + A.10.5.5)
National Government
Trade and Other Payables to Domestic Entities (B.1.1.1 + B.1.1.2 + B.1.1.3 + B.1.1.4 + B.1.1.5 + B.1.1.6)
Page 3

PHFS (rev 2006)
FAX NO.:
PSIC:
2019 2018( in P'000 ) ( in P'000 )
B.1.7.2 Acceptances PayableB.1.7.3 Liabilities under Trust ReceiptsB.1.7.4 Portion of Long-term Debt Due within one year 4,387,500 525,500 B.1.7.5 Deferred IncomeB.1.7.6 2,081,269 1,797,592
B.1.7.6.1 2,081,269 1,797,592 B.1.7.6.2
61,156,566 66,642,481
39,710,925 39,762,594 21,445,641 26,879,887
Indebtedness to Affiliates and Related Parties (Non-Current)B.4
Other Liabilities (B.5.1 + B.5.2) 889,261 472,608 - -
889,261 472,608 B.5.2.1 836,848 437,153 B.5.2.2 52,413 35,455
C. 131,282,102 117,703,503
56,200,000 56,200,000
Common shares 45,000,000 45,000,000 11,000,000 11,000,000
200,000 200,000 Issued Capital Stock (no. of shares, par value and total value) (C.2.1 + C.2.2 + C.2.3) 38,541,660 38,540,717
31,341,660 31,340,717 7,000,000 7,000,000
200,000 200,000 Subscribed Capital Stock (no. of shares, par value and total value) (C.3.1 + C.3.2 + C.3.3) 216,453 190,658
216,453 190,658 - - - -
Additional Paid-in Capital / Capital in excess of par value / Paid-in Surplus 47,837,246 46,156,018
Minority InterestOthers, specify (C.6.1 + C.6.2 + C.6.3) (2,153,128) (1,501,466)
(648,611) (214,619) 214,617 238,871
(1,719,134) (1,525,718) 305,675 282,726
Retained Earnings (C.8.1 + C.8.2) 52,272,092 36,334,850
AppropriatedUnappropriated 52,272,092 36,334,850
Head / Home Office Account (for Foreign Branches only)Cost of Stocks Held in Treasury (negative entry) (5,737,896) (2,300,000)
206,031,688 193,779,748
Holding Company
B.2.4
B.2
B.2.2 Domestic Public Non-Financial Institutions B.2.1 Domestic Public Financial Institutions
Domestic Private Non-Financial Institutions B.2.3
Long-term Debt - Non-current Interest-bearing Liabilities (B.2.1 + B.2.2 + B.2.3 + B.2.4 + B.2.5)
Foreign Financial Institutions
Voting Pref (200,000 shares @ P1)
B.5.1 Deferred Tax
B.3
Other Current LiabilitiesAny other current liability in excess of 5% of Total Current Liabiilities, specify:
Domestic Private Financial Institutions
SPECIAL FORM FOR FINANCIAL STATEMENTS OF PUBLICLY-HELD AND INVESTMENT COMPANIES
NAME OF CORPORATION: Ayala Corporation(Parent Company)
Table 1. Balance Sheet
F I N A N C I A L D A T A
If these are based on consolidated financial statements, please so indicate in the caption.
CURRENT ADDRESS: Tower One,Ayala Triangle,Ayala Avenue,Makati City
TEL. NO.:
COMPANY TYPE :
Pension LiablityProv for maintenance obligation
Liabilities Included in the Disposal Groups Classified as Held for Sale
B.2.5
B.5.2 Others, specify (B.5.2.1 + B.5.2.2)
B.5
C.1.1 (900,000shares @ P50)
Others
C.5
C.2C.2.1 Common shares (626,833shares@P50par);(626,814shares@P50par)
C.2.2 Preferred Shares Pref A(12,000 shares @p100) Pref B (58,000share @P100)
Others Voting Pref (200,000 shares @ P1)
Common shares
OthersC.3.2
TOTAL LIABILITIES AND EQUITY (B + C)
C.9
C.8.1C.8.2
C.10
C.8
C.4
C.6
C.7
C.6.1C.6.2C.6.3Appraisal Surplus/Revaluation Increment in Property/Revaluation Surplus/Fair Value Reserve of Financial Asset Through OCI
Subscriptions ReceivableShare-Based payments
Control No.: Form Type:
Remeasurement gains and losses arising on defined benefit pension plans
EQUITY (C.2+C.3 + C.4 + C.5 + C.6 + C.7 + C.8 + C.9+C.10)
C.1.2 Pref A(12,000 shares @p100) Pref B (58,000 shares@P100)
Pref C(40,000shares@P100)
C.1.3
C.3.1 (4,329 shares @P50par);(3,813 shares @P50par)
C.3
Preferred Shares
Authorized Capital Stock (no. of shares, par value and total value; show details, in thousands except par per share) (C.1.1+C.1.2+C.1.3)
C.1
C.3.3Preferred Shares
C.2.3
Page 4

PHFS (rev 2006)
FAX NO.:
PSIC:
2019 2018 2017( in P'000 ) ( in P'000 ) ( in P'000 )
A. 32,552,764 13,442,405 14,220,391
A.2
179,958 185,105 281,656 179,958 185,105 281,656
A.3.5.1 Rental Income, EquipmentA.3.5.2
32,372,806 13,257,300 13,938,735 493,991 212,988 157,934
13,570,687 11,621,993 12,078,444 17,020,138 491,821 190,013
A.4.3.1 16,725,940 386,088 10,654 A.4.3.2 3,372 4,793 1,012 A.4.3.3 - - 173,484 A.4.3.4 290,826 100,940 4,863
1,287,990 930,498 1,512,344 A.4.4.1 3,280 6,710 A.4.4.2 29,571 6,931 26,290 A.4.4.3 238,397 - A.4.4.4 70,751 - A.4.4.5 724,777 717,793 1,307,590 A.4.4.6 221,214 199,064 178,464
B.
C.
D. 32,552,764 13,442,405 14,220,391
COST OF GOODS SOLD (B.1 + B.2 + B.3)
GROSS PROFIT (A - B - C)
C.2 Merchandise Inventory, Beginning
B.1.4B.1.5
B.2
C.3 Merchandise Inventory, End (negative entry)
Finished Goods, BeginningGoods in Process, End (negative entry)Goods in Process, Beginning
B.1.3
Cost of Goods Manufactured (B.1.1 + B.1.2 + B.1.3 + B.1.4 + B.1.5)B.1.1 Direct Material Used
Toll Revenue
Construction Revenue
Miscellaneous
Gain on mergerGain on return of capital
B.1.2 Direct LaborOther Manufacturing Cost / Overhead
B.1
TEL. NO.:
COMPANY TYPE : Holding Company
Sale of investment properties
Gain / (Loss) on Foreign Exchange
A.1
A.3.4
A.3.5
A.4.4
Sale of Real Estate or other Property and EquipmentRoyalties, Franchise Fees, Copyrights (books, films, records, etc.)
A.4
Sale of investment in stocks
A.4.1 Interest Income
Tower One,Ayala Triangle,Ayala Avenue ,Makati CityCURRENT ADDRESS:
Table 2. Income Statement
F I N A N C I A L D A T A
COST OF SALES (C.1 + C.2 + C.3)
B.3 Finished Goods, End (negative entry)
A.3.1
Other Income (non-operating) (A.4.1 + A.4.2 + A.4.3 + A.4.4)
Sale of available-for-sale investment
Net Sales or Revenue / Receipts from Operations (manufacturing, mining,utilities, trade, services, etc.) (from Primary Activity)
Other Revenue (A.3.1 + A.3.2 + A.3.3 + A.3.4 + A.3.5)
Others, specify (A.3.5.1 + A.3.5.2 )
Gain / (Loss) from selling of Assets, specify(A.4.3.1 + A.4.3.2 + A.4.3.3 + A.4.3.4)
Others, specify (A.4.4.1 + A.4.4.2 + A.4.4.3 + A.4.4.4)
SPECIAL FORM FOR FINANCIAL STATEMENTS OF PUBLICLY-HELD AND INVESTMENT COMPANIES
NAME OF CORPORATION: Ayala Corporation(Parent Company)
Control No.: Form Type:
REVENUE / INCOME (A.1 + A.2 + A.3)
If these are based on consolidated financial statements, please so indicate in the caption.
NOTE: Pursuant to SRC Rule 68.1 (as amended in Nov. 2005), for fiscal years ending December 31, 2005 up to November 30,
2006, a comparative format of only two (2) years may be filed to give temporary relief for covered companies as the more complex
PFRSs will be applied for the first time in these year end periods. After these first time applications, the requirement of three (3)
year comparatives shall resume for year end reports beginning December 31, 2006 and onwards.
Share in the Profit or Loss of Associates and Joint Ventures accounted for using the Equity Method
A.4.3
A.4.2 Dividend Income
Sale of Property and Equipment
A.3
C.1 Purchases
Receipts from Sale of Merchandise (trading) (from Secondary Activity)Rental Income from Land and Buildings
A.3.3A.3.2
Page 5

PHFS (rev 2006)
FAX NO.:
PSIC:
2019 2018 2017( in P'000 ) ( in P'000 ) ( in P'000 )
E. 6,055,044 3,416,960 3,112,364
E.1 Selling or Marketing ExpensesE.2 Administrative ExpensesE.3 General Expenses 5,763,347 3,115,185 2,746,824 E.4 291,697 301,775 365,540
E.4.1E.4.2 30,756 6,931 26,290 E.4.3 260,941 294,844 316,702 E.4.4 - - 22,548
F. 4,008,126 3,663,101 2,887,605
F.1F.2F.3 3,916,153 3,488,083 2,810,124 F.4 75,693 164,802 54,984 F.5 Other interests, specify (F.5.1 + F.5.2 ) 16,280 10,216 22,497
F.5.1 13,650 8,453 21,526 F.5.2 2,630 1,763 971
G. 22,489,594 6,362,344 8,220,422
H. INCOME TAX EXPENSE (negative entry) (107,086) (41,297) (159,331)
I. 22,382,508 6,321,047 8,061,091
J.
J.1 J.2
K.
L
M.
M.1 33.61 8.05 10.91 M.2 33.54 8.02 10.87
Holding Company
CURRENT ADDRESS: Tower One,Ayala Triangle,Ayala Avenue, Makati City
TEL. NO.:
COMPANY TYPE :
Diluted
Amount of (i) Post-Tax Profit or Loss of Discontinued Operations; and (ii) Post-
Tax Gain or Loss Recognized on theMeasurement of Fair Value less Cost to
Sell or on the Disposal of the Assets or Disposal Group(s) constituting the
Discontinued Operation (if any) (J.1+J.2)
INCOME(LOSS) AFTER TAX
PROFIT OR LOSS ATTRIBUTABLE TO MINORITY INTEREST
PROFIT OR LOSS ATTRIBUTABLE TO EQUITY HOLDERS OF THE PARENT
Basic
NET INCOME (LOSS) BEFORE TAX (D - E - F)
EARNINGS (LOSS) PER SHARE
FINANCE COSTS (F.1 + F.2 + F.3 + F.4 + F.5)
Accretion of provision for maintenance obligationOther financing charges
AmortizationInterest on bonds, mortgages and other long-term loansInterest on Long-Term Promissory NotesInterest on Short-Term Promissory Notes
Form Type: Control No.:
Depreciation and amortizationLoss on Return of Capital
OPERATING EXPENSES (E.1 + E.2 + E.3 + E.4)
Education-related expendituresOther Expenses, specify (E.4.1 + E.4.2 + E.4.3 + E.4.4 )
Construction costs
If these are based on consolidated financial statements, please so indicate in the caption.
Table 2. Income Statement
F I N A N C I A L D A T A
SPECIAL FORM FOR FINANCIAL STATEMENTS OF PUBLICLY-HELD AND INVESTMENT COMPANIES
NAME OF CORPORATION:
Ayala Corporation(Parent Company)
Page 6

PHFS (rev 2006)
FAX NO.:
PSIC: PSIC:
2019 2018 2017( in P'000 ) ( in P'000 ) ( in P'000 )
22,489,594 6,362,344 8,220,422
Provision for (reversl of) decline in value of inventory
Gain on reversal of impairment losses on receivablesGain on reversal of accrued expenses and other current liabilities
260,941 294,844 316,702 Amortization, specify:
Others, specify: 3,994,476 3,654,648 2,866,079 135,946 126,324 (504)
Expected maintenance expense on service concession 16,538 15,139 14,876 2,503,000 - (586,000)
Provision for impairment of other assets - - 53,146 Loss on derivative liability - - - Gain on reversion of land - - - Dividend income (13,570,687) (11,621,993) (12,078,444) Interest income (493,991) (212,988) (157,934) Loss(gain) on sale of :
Investmens in shares of stocks (17,035,763) (386,088) 11,894 Investment properties and real estate property for sale (290,826) (100,940) (4,863)
(3,372) (4,793) (1,012) Investment in Available for Sale financial assets - - (173,484)
Pension expense 209,835 224,557 219,349 - 511 - - 121
Decrease (Increase) in:Receivables 167,125 (196,994) (299,137) Other Current Assets (200,152) (58,615) (90,886) Service concession assetsOthers, specify:
Increase (Decrease) in:Trade and Other Payables (49,844) (267,103) 97,087 Income and Other Taxes PayableOthers, specify: 488,314 211,283 166,295
(3,941,400) (3,309,660) (2,868,850) (102,543) (44,876) (35,286)
Contribution to pension fund (214,492) (174,086) (155,318) (5,637,301) (5,488,365) (4,485,868)
Ayala Corporation(Parent Company)
Depreciation
F I N A N C I A L D A T A
NAME OF CORPORATION:
If these are based on consolidated financial statements, please so indicate in the caption.
CURRENT ADDRESS:
Net Income (Loss) Before Tax and Extraordinary Items
NOTE: Pursuant to SRC Rule 68.1 (as amended in Nov. 2005), for fiscal years ending December 31, 2005 up to November 30, 2006, a
comparative format of only two (2) years may be filed to give temporary relief for covered companies as the more complex PFRSs will be
applied for the first time in these year end periods. After these first time applications, the requirement of three (3) year comparatives shall
resume for year end reports beginning December 31, 2006 and onwards.
Write-down of Property, Plant, and Equipment
Cost of Share -based payments
A. Net Cash Provided by (Used in) Operating Activities (sum of above rows)
Interest paidIncome tax paid
Interest received
Changes in Assets and Liabilities:
Loss(gain)on retirement of property and equipment
Provision for(reversal of) impairment losses on subs.,assoc. and joint ventures
Loss(gain)on retirement of service concession assets
Control No.: Form Type:
Property and equipment
CASH FLOWS FROM OPERATING ACTIVITIES
Adjustments to Reconcile Net Income to Net Cash Provided by Operating Activities
Gain on reversal of impairment of input VAT
Tower One,Ayala Triangle,Ayala Avenue, Makati City
COMPANY TYPE Holding Company
Table 3. Cash Flow Statements
Interest Expense
TEL. NO.:
SPECIAL FORM FOR FINANCIAL STATEMENTS OF PUBLICLY-HELD AND INVESTMENT COMPANIES
Page 7

PHFS (rev 2006)
FAX NO.:PSIC:
2019 2018 2017( in P'000 ) ( in P'000 ) ( in P'000 )
Dividends received from subsidiaries,associates and joint ventures 14,817,565 11,465,173 12,118,835 Reductions/(Additions) to Property, Plant, and EquipmentOthers, specify:Proceeds from :
Short -term investments 526 2,864 - Disposal of financial assets at FVOCI 16,739 11,655 Disposal of available-for-sale financial assets - - 282,852 Partial return of capital from subsidiaries 5,784,900 - 8,444,303 Partial disposal of shares of subsidiaries 16,256,299 - 10,846 Deposits for exchangeable bonds - - 1,049,894 Sale of investment properties 149,892 100,940 4,883 Sale of property and equipment 18,445 21,939 19,319 Additions to:Short -term investments - - (28,708) Investment properties - - (44,643) Investments in subsidiaries,associates and joint ventures (17,707,714) (27,205,052) (12,995,789)
(3,473.00) (601) Service concession assets (29,571) (6,931) (26,290) Property and equipment (88,425) (79,699) (67,004)
19,215,183 (15,689,111) 8,767,897
Loans13,440,090 24,193,948 10,189,623
- 8,069,960 - Others, specify: Collecton of subscription receivable 274,677 168,579 374,485
Reissuance of preferred shares 15,000,000 - - -
Long-term debt and Short- term debt (15,148,600) (6,109,250) (11,942,500)
Redemption of preferred shares (13,500,000) - Purchase of common shares (3,737,896) 0Cost of issuance of shares (120,327) (13,703) (114) Cash dividends paid (6,070,472) (5,407,797) (5,399,077)
(9,862,528) 20,901,737 (6,777,583)
3,715,354 (275,739) (2,495,554)
3,537,096 3,812,835 6,308,389 7,252,450 3,537,096 3,812,835
SPECIAL FORM FOR FINANCIAL STATEMENTS OF PUBLICLY-HELD AND INVESTMENT COMPANIESNAME OF CORPORATION: Ayala Corporation(Parent Company)
CASH FLOWS FROM INVESTING ACTIVITIES
F I N A N C I A L D A T A
CURRENT ADDRESS: Tower One,Ayala Triangle,Ayala Avenue, Makati City
If these are based on consolidated financial statements, please so indicate in the caption.Table 3. Cash Flow Statements
TEL. NO.:
COMPANY TYPE : Holding Company
Form Type: Control No.:
End of year
B. Net Cash Provided by (Used in) Investing Activities (sum of above rows)
Financial assets at FVOCI
Long-term DebtIssuance of new common shares
Cash and Cash Equivalents
Proceeds from:
Availment of short-term debtPayments of:
Others, specify (negative entry):
C. Net Cash Provided by (Used in) Financing Activities (sum of above rows)
NET INCREASE IN CASH AND CASH EQUIVALENTS (A + B + C)
Beginning of year
CASH FLOWS FROM FINANCING ACTIVITIES
Page 8

PHFS (rev 2006)
FAX NO.:
PSIC:
Capital StockAdditional Paid-
in Capital
Revaluation
Increment
Translation
Differences
Retained
EarningsTOTAL
J. 34,771,247 37,929,927 639,068 - 35,479,218 108,819,460
- (141,513) 141,513 -
B. Restated Balance 34,771,247 37,929,927 497,555 - 35,620,731 108,819,460 C. - (181,236) - 11,546 (169,690)
-
-
- - - (181,236) - 11,546 (169,690)
J.4.1 (181,236) - (181,236) J.4.2 11,546 11,546
E. 6,321,047 6,321,047 F. (5,618,474) (5,618,474) G. -
-
- H. 134,410 8,226,091 (9,341) - - 8,351,160
134,410 8,226,091 (9,341) 8,351,160 N.2 - - - N.3 -
J. 34,905,657 46,156,018 306,978 - 36,334,850 117,703,503
- - - -
B. Restated Balance 34,905,657 46,156,018 306,978 - 36,334,850 117,703,503 C. - (411,043) - 18,962 (392,081)
-
-
- - - (411,043) - 18,962 (392,081)
J.4.1 (392,081) - (392,081) J.4.2 (18,962) 18,962 -
E. 22,382,508 22,382,508 F. (6,464,228) (6,464,228) G. -
-
- H. (3,436,953) 1,513,607 (24,254) - - (1,947,600)
(3,736,953) 433,676 (24,254) (3,327,531) N.2 300,000 1,079,931 1,379,931 N.3 -
I. 31,468,704 47,669,625 (128,319) - 52,272,092 131,282,102
Note: Capital Stock Common/Pref stock,Subscribed,Subs.Receivable,Treasury APIC APIC Revaluation Increment Share-based payments,remeasurement gains/losses arisng on defined benefit pension,net unrealized gain on available
for sale financial assets Retainerd Earnings Retained Earnings
Balance, 2017
F I N A N C I A L D A T A
Control No.: Form Type:
NAME OF CORPORATION: Ayala Corporation(Parent Company)
SPECIAL FORM FOR FINANCIAL STATEMENTS OF PUBLICLY-HELD AND INVESTMENT COMPANIES
COMPANY TYPE : Holding Company
CURRENT ADDRESS:
(Amount in P'000)
If these are based on consolidated financial statements, please so indicate in the caption.
Tower One, Ayala Triangle,Ayala Avenue, Makati City
TEL. NO.: 02-7594412
Table 4. Statement of Changes in Equity
J.1 Surplus (Deficit) on Revaluation of Properties
J.2 Surplus (Deficit) on Revaluation of Investments
J.3 Currency Translation Differences
H.1 Correction of Error (s)H.2 Changes in Accounting Policy
Surplus
Net Income (Loss) for the PeriodDividends (negative entry)Appropriation for (specify)
M.1 Non-controlling interests of the acquired subsidiary
J.4 Other Surplus (specify)Other Comprehensive IncomeSa;e of Financial Assets through OCI
Preferred StockOthers
Balance, 2018
M.2Issuance of Capital Stock
N.1 Common Stock
H.1 Correction of Error (s)H.2 Changes in Accounting Policy
Surplus
J.1 Surplus (Deficit) on Revaluation of Properties
J.2 Surplus (Deficit) on Revaluation of Investments
J.3 Currency Translation Differences J.4 Other Surplus (specify)
Other Comprehensive IncomeSa;e of Financial Assets through OCI
Net Income (Loss) for the Period
Preferred StockOthers
Balance, 2019
Dividends (negative entry)Appropriation for (specify)
M.1 Non-controlling interests of the acquired subsidiary
M.2Issuance of Capital Stock
N.1 Common Stock
Page 9

PHFS (rev 2006)
FAX NO.:PSIC: PSIC:
2019 2018 2017( in P'000 ) ( in P'000 ) ( in P'000 )
A. 32,552,764 13,442,405 14,220,391
- - -
A.1.1 - - - A.1.2 - - -
32,552,764 13,442,405 14,220,391 A.2.1 15,755,398 13,056,317 14,209,737 A.2.2 16,797,366 386,088 10,654
A.2.2.1 70,751 - - A.2.2.2 16,726,615 386,088 10,654
B. 10,170,256 7,121,358 6,159,300
10,048,495 7,027,621 6,047,066 121,761 93,737 112,234
B.2.1 2,471 2,625 5,838 B.2.2 13,179 13,906 12,700 B.2.3 803 28 42 B.2.4 8,517 16,959 10,776 B.2.5 11,466 3,098 8,064 B.2.6 4,455 9,198 2,394 B.2.7 2,373 2,808 3,229 B.2.8 40,698 3,680 5,290 B.2.9 7,873 22,973 6,250
B.2.10. 3,933 8,653 11,726 B.2.11. 4,156 25 8,655 B.2.12. 14,907 6,235 12,145 B.2.13. - - 171 B.2.14. 6,341 3,549 2,406 B.2.15. 589 - 22,548 Special Publication
Postal & CommunicationsDues & FeesRental OthersScholarship & Training
ContributionsTravel
Repairs&Maintenance
SPECIAL FORM FOR FINANCIAL STATEMENTS OF PUBLICLY-HELD AND INVESTMENT COMPANIES
CURRENT ADDRESS:
NAME OF CORPORATION: Ayala Corporation(Parent Company)
Tower One,Ayala Triangle ,Ayala Ave. Makati City
TEL. NO.:
Net Sales or Revenue / Receipts from Operations (manufacturing, mining,utilities, trade, services, etc.) (from Primary Activity) (A.1.1 +A.1.2)
Table 5. Details of Income and Expenses, by source (applicable to corporations transacting with foreign corporations/entities)
EXPENSES (B.1 + B.2)
Gain on Sale of shares
COMPANY TYPE :
F I N A N C I A L D A T A
A.2 Other Revenue (A.2.1 +A.2.2)
If these are based on consolidated financial statements, please so indicate in the caption.
Domestic
Foreign, specify (A.2.2.1+A.2.2.2)
Holding Company
REVENUE / INCOME (A.1 + A.2)
A.1
Control No.: Form Type:
B.1 Domestic
Contract Labor
Foreign
Representation
Insurance -OthersPersonnel Costs
Business DevelopmentSpecial Events
Professional Fees
Foreign, specify (B.2.1+B.2.2+B.2.3+B.2.4+B.2.5+B.2.6+B.2.7+B.2.8+B.2.9+B.2.10+B.2.11+ B.2.12+B.2.13+B.2.14+B.2.15)
B.2
Domestic
Gain on Return of Capital
Page 10