The Investigation of Human Scent from Epileptic Patients for ...
171
Florida International University FIU Digital Commons FIU Electronic eses and Dissertations University Graduate School 10-31-2017 e Investigation of Human Scent from Epileptic Patients for the Identification of a Biomarker for Epileptic Seizures Philip R.N. Davis Florida International University, pdavis04@fiu.edu DOI: 10.25148/etd.FIDC004043 Follow this and additional works at: hps://digitalcommons.fiu.edu/etd Part of the Analytical Chemistry Commons is work is brought to you for free and open access by the University Graduate School at FIU Digital Commons. It has been accepted for inclusion in FIU Electronic eses and Dissertations by an authorized administrator of FIU Digital Commons. For more information, please contact dcc@fiu.edu. Recommended Citation Davis, Philip R.N., "e Investigation of Human Scent from Epileptic Patients for the Identification of a Biomarker for Epileptic Seizures" (2017). FIU Electronic eses and Dissertations. 3520. hps://digitalcommons.fiu.edu/etd/3520
-
Upload
khangminh22 -
Category
Documents
-
view
0 -
download
0
Transcript of The Investigation of Human Scent from Epileptic Patients for ...

Florida International UniversityFIU Digital Commons
FIU Electronic Theses and Dissertations University Graduate School
10-31-2017
The Investigation of Human Scent from EpilepticPatients for the Identification of a Biomarker forEpileptic SeizuresPhilip R.N. DavisFlorida International University, [email protected]
DOI: 10.25148/etd.FIDC004043Follow this and additional works at: https://digitalcommons.fiu.edu/etd
Part of the Analytical Chemistry Commons
This work is brought to you for free and open access by the University Graduate School at FIU Digital Commons. It has been accepted for inclusion inFIU Electronic Theses and Dissertations by an authorized administrator of FIU Digital Commons. For more information, please contact [email protected].
Recommended CitationDavis, Philip R.N., "The Investigation of Human Scent from Epileptic Patients for the Identification of a Biomarker for EpilepticSeizures" (2017). FIU Electronic Theses and Dissertations. 3520.https://digitalcommons.fiu.edu/etd/3520

FLORIDA INTERNATIONAL UNIVERSITY
Miami, Florida
THE INVESTIGATION OF HUMAN SCENT FROM EPILEPTIC PATIENTS FOR
THE IDENTIFICATION OF A BIOMARKER FOR EPILEPTIC SEIZURES
A dissertation submitted in partial fulfillment of
the requirements for the degree of
DOCTOR OF PHILOSOPHY
in
CHEMISTRY
By
Philip Davis
2017

ii
To: Dean Michael R. Heithaus choose the name of dean of your college/school College of Arts, Sciences and Education choose the name of your college/school
This dissertation, written by Philip Davis, and entitled The Investigation of Human Scent from Epileptic Patients for the Identification of a Biomarker for Epileptic Seizures, having been approved in respect to style and intellectual content, is referred to you for judgment.
We have read this dissertation and recommend that it be approved.
_______________________________________Stefan Rose
_______________________________________
Yong Cai
_______________________________________Joong-ho Moon
_______________________________________Nadja Schreiber Compo
_______________________________________
Kenneth Furton, Major Professor
Date of Defense: October 31, 2017
The dissertation of Philip Davis is approved.
_______________________________________choose the name of dean of your college/school Dean Michael R. Heithaus
choose the name of your college/school College of Arts, Sciences and Education
_______________________________________Andrés G. Gil
Vice President for Research and Economic Development and Dean of the University Graduate School
Florida International University, 2017

iii
© Copyright 2017 by Philip Davis
All rights reserved.

iv
DEDICATION
I dedicate this work to my parents, Philmore Davis and Gail Davis, my sister, Lisa Davis,
my beautiful wife, Beatrice, and our superstar son, Alai. Without their continuous support
and unbelievable patience, this would not have been possible.

v
ACKNOWLEDGMENTS
I would like to thank my committee members Dr. Stefan Rose, Dr. Yong Cai, Dr.
Joong-Ho Moon, and Dr. Nadja Schreiber Compo for serving on my committee and helping
me throughout the course of this dissertation work. I want to especially thank Dr. Rose,
who I have known since I was an undergraduate student. All of our conversations over the
years have been extremely helpful, and I would not have made it this far without his
guidance. I would like to acknowledge the Epilepsy Foundation of Florida for allowing me
to recruit patients from their clinics, and I would like to thank Dr. Jose Gonzalez-Sandoval
and his staff for their assistance in the recruitment process and for allowing me to use their
office to meet with patients. I would also like to thank Dr. Jeffrey Horstmeyer and his staff
for sending flyers to different clinics and hospitals around Miami to help with recruiting. I
would like to thank my undergraduate research assistants, David Mirander and Javier
Sanlley, for their help during different portions of this project. I must thank Howard
Holness for being a wonderful friend and occasional mentor, and for sharing his time and
knowledge even when it was inconvenient for him to do so. Finally, I would like to thank
Dr. Kenneth Furton, for allowing me to join his research group many years ago, and for his
guidance and patience throughout this very long process.
I would like to thank the Furton lab members, past and present, for making my time
here a real pleasure. It was great to work with people who would be there to challenge me
when it was necessary, help me when I needed it, and make me laugh when times seemed
darkest. I specifically want to thank Rudy and Van. Your friendships really helped me get
through the toughest times.

vi
I would like to thank my family for their patience and understanding throughout
the years. It was a long process, but they remained confident in me even when my own
confidence wavered. Finally, I would like to thank my wife for being an amazing partner
and mother, and for always believing in me.

vii
ABSTRACT OF THE DISSERTATION
THE INVESTIGATION OF HUMAN SCENT FROM EPILEPTIC PATIENTS FOR
THE IDENTIFICATION OF A BIOMARKER FOR EPILEPTIC SEIZURES
by
Philip Davis
Florida International University, 2017
Miami, Florida
Professor Kenneth Furton, Major Professor
Studies have shown that some canines have the ability to predict seizures in people
with epilepsy, and that canines can be trained to recognize changes in humans before an
epileptic seizure and make these predictions. It is not known with any certainty to what the
canines are alerting. However, canines’ exceptional sense of smell and their ability to
discriminate human scent is well established. Therefore, it is possible that the canines could
be responding to an olfactory cue, such as the release of some volatile organic compounds
(VOCs) prior to the onset of a seizure.
Individuals release a wide array of VOCs, both odorous and non-odorous, from
their bodies. The odorous VOCs collectively make up human scent and a number of these
VOCs have been identified as biomarkers of different diseases. Evidence suggests that
canines can perceive these biomarkers, leading to early detection of underlying physical
ailments before individuals are aware of their own symptoms.

viii
The main purpose of this study was to use headspace solid phase microextraction
(HS-SPME) with gas chromatography-mass spectrometry (GC-MS) to analyze hand odor,
saliva and breath samples from epileptic with and without seizure activity to determine if
the human scent profiles resulting from a seizure event differs from the scent profiles in
the absence of seizure activity. the HS-SPME-GC-MS method was also used to analyze
and compare hand odor, saliva and breath samples of healthy individuals and epilepsy
patients to determine if the profiles can be differentiated.
Comparison of the VOCs in each specimen from healthy individuals and epileptic
patients revealed compounds that could be used as potential biomarkers to differentiate
between healthy and epileptic individuals. Comparison of the VOCs in each specimen from
epileptic patients with and without seizure activity revealed compounds that could be used
as potential biomarkers for epileptic seizures. Finally, canine trials were used to verify that
these compounds are indeed biomarkers. The canine trials showed that one compound –
menthone – is definitely released by the body in relation to seizures and can possibly be a
biomarker for epileptic seizures.

ix
TABLE OF CONTENTS CHAPTER PAGE
1. RESEARCH INTRODUCTION ................................................................................. 1
1.1. Basis for research ................................................................................................. 1
1.2. Types of Seizures ................................................................................................. 3
1.2.1 Partial Seizures.............................................................................................. 4
1.2.2 Generalized Seizures ..................................................................................... 6
1.3. Epilepsy ................................................................................................................ 9
1.4. The Central Nervous System.............................................................................. 12
1.4.1. The Brain .................................................................................................... 13
1.4.2. The Spinal Cord .......................................................................................... 20
1.4.3. Neurons ....................................................................................................... 21
1.4.4. Epilepsy and Nervous System .................................................................... 28
1.4.5. Generation of Seizures ................................................................................ 30
1.5. Seizure Prediction .............................................................................................. 31
1.5.1. Seizure Alert Dogs ...................................................................................... 34
1.6. Canines (Canis familiaris) .................................................................................. 36
1.6.1. History......................................................................................................... 36
1.6.2. Olfaction ..................................................................................................... 36
1.6.3. Applications ................................................................................................ 41
1.6.4. Detection/odor............................................................................................. 41
1.6.5. VOCs........................................................................................................... 42
1.6.6. Controlled Odor Mimic Permeation System (COMPS) ............................. 43
1.6.7. Canine Detection Training .......................................................................... 46
1.7. Research Objectives ........................................................................................... 46
1.8. Theory of Instrumental Techniques ................................................................... 48
1.8.1. Solid Phase Microextraction-Gas Chromatography-Mass Spectrometry ... 48
1.8.2. Headspace Solid Phase Microextraction ..................................................... 49
1.8.3. Gas Chromatography .................................................................................. 51
1.8.4. Mass Spectrometry...................................................................................... 53
2. METHOD DEVELOPMENT ................................................................................... 60
2.1. GC-MS Method Development ........................................................................... 60
2.1.1. Method ........................................................................................................ 61
x
2.1.2. Results ......................................................................................................... 63
2.2. Determination of best extraction conditions ...................................................... 65
2.2.1. Determination of optimal extraction temperature ....................................... 66
2.2.2. Determination of optimal extraction time ................................................... 68
3. COMPARISON OF SCENT COLLECTED FROM HEALTHY AND EPILEPTIC INDIVIDUALS................................................................................................................. 70
3.1. Materials ............................................................................................................. 70
3.2. Hand Odor .......................................................................................................... 70
3.2.1. Methods....................................................................................................... 70
3.2.2. Results ......................................................................................................... 72
3.2.3. Discussion ................................................................................................... 79
3.3. Oral Fluid (Saliva) .............................................................................................. 81
3.3.1. Methods....................................................................................................... 81
3.3.2. Results ......................................................................................................... 83
3.3.3. Discussion ................................................................................................... 91
3.4. Breath ................................................................................................................. 95
3.4.1. Methods....................................................................................................... 95
3.4.2. Results ......................................................................................................... 95
3.4.3. Discussion ................................................................................................. 104
4. COMPARISON OF SCENT COLLECTED FROM EPILEPTIC INDIVIDUALS WITH AND WITHOUT SEIZURE ACTIVITY ........................................................... 105
4.1. Hand Odor ........................................................................................................ 107
4.1.1. Method ...................................................................................................... 107
4.1.2. Results ....................................................................................................... 107
4.1.3. Discussion ................................................................................................. 107
4.2. Saliva ................................................................................................................ 112
4.2.1. Method ...................................................................................................... 112
4.2.2. Results ....................................................................................................... 112
4.2.3. Discussion ................................................................................................. 112
4.3. Breath ............................................................................................................... 114
4.3.1. Method ...................................................................................................... 114
4.3.2. Results ....................................................................................................... 114
4.3.3. Discussion ................................................................................................. 115

xi
5. CANINE TRIALS FOR POTENTIAL SEIZURE BIOMARKERS ...................... 116
5.1. Preparation of COMPS..................................................................................... 116
5.2. Canine Trials .................................................................................................... 117
6. CONCLUSIONS ..................................................................................................... 119
APPENDICES ................................................................................................................ 138
VITA ............................................................................................................................... 152

xii
TABLE OF TABLES
TABLE PAGE
Table 1 Human scent compounds used to prepare the 50-ppm mixture VOCs ................ 60
Table 2 Frequency of occurrence of all VOCs found in the headspace of hand odor samples .............................................................................................................................. 73
Table 3 Compounds found in the hand odor of epileptic patients .................................... 78
Table 4 Frequency of occurrence of all VOCs found in the headspace of saliva samples 84
Table 5 Compounds found only in the saliva of epileptic patients ................................... 90
Table 6 Frequency of occurrence of all VOCs found in the headspace of breath samples........................................................................................................................................... 97
Table 7 Compounds found in the breath of epileptic patients ........................................ 103
Table 8 Compounds found in postictal hand odor profiles of epileptic patients ............ 107
Table 9 Compounds found in postictal saliva profiles of epileptic patients ................... 112
Table 10 Compounds found in postictal breath profiles of epileptic patients ................ 115
Table 11 Results from first canine trial........................................................................... 118
Table 12 Results from second canine trial ...................................................................... 119

xiii
TABLE OF FIGURES
FIGURE PAGE
Figure 1 The nervous system ............................................................................................ 13
Figure 2 The Human Brain ............................................................................................... 14
Figure 3 The Cerebral Cortex ........................................................................................... 15
Figure 4 Structure of a typical neuron .............................................................................. 22
Figure 5 Action potential inside a neuron ......................................................................... 28
Figure 6 Canine and human nasal airway. ........................................................................ 40
Figure 7 Controlled Odor Mimic Permeation System (COMPS) ..................................... 45
Figure 8 SPME fiber ......................................................................................................... 51
Figure 9 Schematic of gas chromatograph ........................................................................ 53
Figure 10 Schematic of a quadrupole mass analyzer ........................................................ 56
Figure 11 Schematic of an ion trap mass analyzer ........................................................... 57
Figure 12 Schematics of electron multipliers ................................................................... 59
Figure 13 Stationary phase for the DB-5 column ............................................................. 61
Figure 14 Stationary phase for DB-225 column ............................................................... 62
Figure 15 Stationary phase for SolGel-WAX column ...................................................... 62
Figure 16 Chromatogram of the 50-ppm human scent VOC mixture obtained using the DB-5 column ..................................................................................................................... 63
Figure 17 Chromatogram of the 50-ppm human scent VOC mixture obtained using the DB-225 column. ................................................................................................................ 64
Figure 18 Chromatogram of the 50-ppm human scent VOC mixture obtained using the SolGel-WAX column........................................................................................................ 65
Figure 19 Comparison of the temperatures used for extraction of human scent compounds. ....................................................................................................................... 67

xiv
Figure 20 Comparison of the times used for extraction of human scent compounds. ...... 69
Figure 21 Comparison of untreated and pre-treated cotton gauze .................................... 71
Figure 22 Frequency distribution of functional groups of VOCs extracted from hand odor of epileptic patients ........................................................................................................... 76
Figure 23 Comparison of VOC profiles from the hand odor of healthy and epileptic individuals ......................................................................................................................... 77
Figure 24 A PCA scatterplot of hand odor from epileptic patient and healthy individuals........................................................................................................................................... 78
Figure 25 Comparison of untreated and pre-treated cotton-tipped applicators ................ 82
Figure 26 Frequency distribution of functional groups of VOCs extracted from saliva of epileptic patients ............................................................................................................... 87
Figure 27 Comparison of VOC profiles from the saliva of healthy and epileptic individuals ......................................................................................................................... 88
Figure 28 PCA scatterplot of saliva from epileptic patient and healthy individuals ........ 90
Figure 29 Frequency distribution of functional groups of VOCs extracted from breath of epileptic patients ............................................................................................................. 101
Figure 30 Comparison of VOC profiles from the breath of epileptic patients and healthy individuals ....................................................................................................................... 102
Figure 31 PCA scatterplot of breath from epileptic patients and healthy individuals .... 103
Figure 32 Sampling kit given to epileptic patients ......................................................... 106
Figure 33 Comparison of interictal and postictal hand odor chromatograms ................. 111
Figure 34 Comparison of and interictal and postictal saliva chromatograms ................. 114
Figure 35 Comparison of and interictal and postictal breath chromatograms ................ 116
Figure 36 Calibration curve for 2-pentylfuran ................................................................ 138
Figure 37 Calibration curve for hexanal ......................................................................... 139
Figure 38 Calibration curve for 1-octen-3-ol .................................................................. 139
Figure 39 Calibration curve for 6-methyl-5-hepten-2-one ............................................. 140

xv
Figure 40 Calibration curve for 2-furanmethanol ........................................................... 140
Figure 41 Calibration curve for octanoic acid, methyl ester ........................................... 141
Figure 42 Calibration curve for benzaldehyde................................................................ 141
Figure 43 Calibration curve for 1-octanol ...................................................................... 142
Figure 44 Calibration curve for benzyl alcohol .............................................................. 142
Figure 45 Calibration curve for 2-ethylhexanoic acid .................................................... 143
Figure 46 Calibration curve for 2-ethylhexanoic acid .................................................... 143
Figure 47 Calibration curve for octanoic acid ................................................................ 144
Figure 48 Calibration curve for 6,10-dimethyl-5,9-undecadiene-2-one ......................... 144
Figure 49 Calibration curve for 6,10-dimethyl-5,9-undecadiene-2-one ......................... 145

xvi
LIST OF ABREVIATIONS
Ach Acetylcholine
AED Antiepileptic Drug
AMPA a-amino-2,3-dihydro-5-methyl-3-oxo-4-isoxazolepropanoic acid
ASPA Adaptive Seizure Prediction Algorithm
CAR Carboxen
CNS Central Nervous System
COMPS Combined Odor Mimics Permeation System
COX Cyclooxygenase
CT Computerized Tomography
DA Dopamine
DVB Divinylbenzene
ECC Transcorneal electroshock
EEG Electroencephalogram
EM Electron Multiplier
EMU Epilepsy Monitoring Unit
FAME Fatty Acid Methyl Esters
GABA g-amino-butyric acid
GC Gas Chromatography
HS Headspace
IBE International Bureau for Epilepsy
ILAE International League Against Epilepsy

xvii
KA Kainic Acid
LDPE Low-density polyethylene
MES Maximal Electroshock Seizures
MFC-7 Human breast adenocarcinoma cell line
MRI Magnetic Resonance Imaging
MS Mass Spectrometry
NMDA N-methyl-D-aspartate
PCA Principal Component Analysis
PDMS Polydimethylsiloxane
PGD2 Prostaglandin D2
PGG2 Prostaglandin G2
PGH2 Prostaglandin H2
PLA2 Phospholipase A2
PNS Peripheral Nervous System
PTZ Pentylenetetrazole
QUIN Quinolinic acid
SPME Solid Phase Microextraction
TRP Transient Receptor Potential
TRPM8 Transient Receptor Potential channel subfamily M member 8
TRPV1 Transient Receptor Potential channel vanilloid subtype 1
VOC Volatile Organic Compound

1
1. RESEARCH INTRODUCTION
1.1. Basis for research
Epilepsy is a disorder of the central nervous system (CNS), characterized by a
predisposition to unprovoked seizures1. It is the most common neurological disorder in the
world2, affecting approximately 2.3 million people in the U.S.A.3 and 50 million people
worldwide4. Every year, approximately 80 people out of 100,000 in the general population
will experience new-onset seizures, and approximately 60% of these will have epilepsy.
For many people with epilepsy, seizures occur suddenly and without warning.
Medications control seizures in only 2/3 of those affected5, and for those with uncontrolled
epilepsy, the unpredictability of seizure onset can be a cause of disability6. The quality of
life of these individuals is negatively affected by the disorder. This is because it imposes
major limitations in family, social, educational, and vocational activities7. There is also a
risk of serious injury, as some seizures may result in falls8, resulting in physical harm to
the patient. In addition, there is a social stigma attached to epilepsy and its unpredictability
that may cause significant demoralization, frustration, and anxiety9. Studies have shown
that increased anxiety can lead to increased incidence of seizures, and increased seizures
can lead to an even greater increase in anxiety9. The ability to predict the onset of a seizure
would allow patients to take preventive measures to keep the risk of the seizure to a
minimum6, thus allowing them to participate in activities and improve the quality of life.
Some canines have the ability to sense epileptic seizures prior to onset and alert
their owners9-13. This phenomenon is not new, as canines have been used in the past to
detect certain types of disorders. For example, canines can detect hypoglycemia in diabetic

2
patients before they are aware of their own symptoms14. In as early as 1989, a case was
reported where a dog was repeatedly sniffing at a mole on its owner’s leg. This mole was
later determined to be a malignant melanoma15,16. However, it is still not known how
canines are able to detect seizures. Some have suggested that the canines are prompted by
minute gestures or posturing by the patient17. Some service canine trainers believe that the
patient is unknowingly providing a behavioral cue9. However, a canine has a sense of smell
that is superior to humans18, so it is possible that there may be some olfactory cue, such as
the emission of a specific odor in e form of released volatile organic compounds (VOCs),
to which the canines may be alerting.
The human body emits a wide array of VOCs, which are both odorous and non-
odorous19-24, and these VOCs vary with genetics, age, sex, diet and physiological status24.
However, chemical changes that occur in the body result in the production and release of
VOCs14, changing an individual’s odor. In fact, odors emitted from the body can serve as
olfactory cues that give information about the health of an individual. For example, some
infectious diseases can result in the production of VOCs due to microbial interaction with
biological fluids. Also, metabolic disorders are often the result of an accumulation of
metabolites which may be volatile and odorous. Many other disorders cause the buildup of
odorous VOCs in biological fluids, and certain disorders have been associated with
characteristic odors. Even schizophrenia, a neurological disorder, has been associated with
an odor that has not yet been identified24.
There are differences in brain activity when comparing the brain of an epileptic
individual with a normal brain. Most of the time in the normal brain, brain waves are
irregular. However, with brain abnormalities such as epilepsy, distinct patterns may be

3
observed25. These changes in brain activity may be associated with chemical differences,
such as the serum concentrations of ions involved in neurochemical pathways26,27, and
metabolic abnormalities, such as a defect in the metabolism of glucose. In addition to this,
prior to the onset of a seizure, there are changes in brain activity7,28,29. These changes are
mostly the result of neurochemicals, as neurochemical pathways have been shown to play
an important role in seizure initiation1,27. Neurochemical changes are accompanied by
changes in serum ion concentration and increased muscle and brain metabolism26,27.
Based on this, two hypotheses were formulated.
1. The chemical and metabolic state of an individual with epilepsy results in the
production and release of VOCs that can be differentiated from those produced and
released from healthy individuals.
2. The hyper-metabolic state caused by a seizure event causes a change in metabolic
substrate and product concentrations resulting in the production and release of
VOCs that can be differentiated from those released in the absence of seizure
activity.
1.2. Types of Seizures
An epileptic seizure is the manifestation of abnormal and excessive firing of
neurons in the brain30. There are different phases of seizures. Ictal refers to the actual
seizure. The time between seizures is the interictal period. Before and after the seizure are
referred to as pre-ictal and post-ictal, respectively31. If the abnormal neuronal activity
produces subjective symptoms or objective signs, it is a clinical seizure. These are

4
classified according to the International Classification of Epileptic Seizures. However, if
the activity is only observed on an electroencephalogram (EEG), it is considered
electrographic or subclinical. Seizures are divided into two core categories. Partial or focal
seizures originate in one area of the brain, with the abnormal neuronal firing starting focally
at a specific cortical site, while generalized seizures originate in the majority of the brain
simultaneously, with the abnormal activity affecting the cortex in both hemispheres.
1.2.1 Partial Seizures
There are two types of partial seizures, differentiated by how consciousness is
affected. During simple partial seizures, consciousness is unaffected, and the individual
can remember the seizure and anything that happened during the seizure. During complex
partial seizures, consciousness is altered or lost, and the individual often cannot remember
what happened during all or part of the seizure8. Also, partial seizures may become
secondarily generalized, with the abnormal neuronal firing starting at a specific cortical
site, then spreading to other parts of the brain8,32.
Simple Partial Seizures
The physical manifestation of a simple partial seizure depends on the functions
normally controlled by the cortical site at which the seizure originates. For example, a
simple partial seizure that starts in the motor cortex may produce muscle twitches in the
body part controlled by the cortical region of origin33,34. These twitches may be limited to
a specific body part, or with a secondarily generalized seizure, progressively spread to
adjacent areas8.

5
Seizures originating in the sensory cortex may manifest as hallucinations or
illusions, such as seeing flashing lights34, hearing voices or experiencing unpleasant smells
or tastes8. Seizures arising from structures that serve an autonomic function induce changes
in autonomic activity, such as altered heart or breathing rate, or sweating. Psychic seizures
start in areas of the brain that trigger emotions or previous experiences. They manifest in
many ways, including altered language function, perception or memory. The perception of
time may also be affected, as some individuals experience the slowing down or speeding
up of time, or déjà vu. These seizures may also stir up spontaneous emotions such as fear,
anxiety, or depression. Some individuals feeling a warning, called an aura, before a seizure.
This can be sensory, like strange sights, smells or feelings, or experiential, like
hallucinations, or feelings of fear, depression, joy and anger. These auras are actually
simple partial seizures that tend to precede larger seizures8. As seen here, there is a diverse
range of simple partial seizures, and this causes diagnostic challenges. Further challenges
arise because some symptoms of a seizure may be caused by other disorders. For example,
a tingling sensation along the arm may be caused by a seizure, migraine, transient ischemic
attack, or ulnar nerve disorder. Also, an autonomic seizure may cause sudden abdominal
discomfort that may be indistinguishable from a gastrointestinal disorder8.
Complex Partial Seizures
Complex partial seizures may manifest as a blank stare, accompanied by impaired
responsiveness and cognitive function. There may also be automatisms, such as chewing,
swallowing, grunting or hand fumbling. Complex acts like shuffling cards, or more
dramatic movements like running and screaming can occasionally occur. As these seizures
6
are associated with an impairment or loss of consciousness, they are usually followed by a
period of confusion8.
Secondarily Generalized Partial Seizures
Secondarily generalized seizures begin focally, then spread to other parts of the
brain to become generalized seizures. Once this occurs, it may be impossible to
differentiate the secondarily generalized seizure from a primary generalized seizure. These
seizures typically last 1 – 2 minutes, with post-ictal confusion and drowsiness8.
1.2.2 Generalized Seizures
The physical manifestations of a generalized seizure tend to involve much of the
body. The principal types are absence, tonic, myoclonic, atonic and tonic-clonic.
Absence Seizures
Similar to complex partial seizures, absence seizures are brief staring episodes,
accompanied by an impairment of awareness and responsiveness. Unlike a complex partial
seizure involving staring, there is no postictal confusion8. These seizures begin and end
suddenly, with no warning. Typical absence seizures usually last 3 - 20 seconds, and are
often provoked by hyperventilation. If they last longer than 10 seconds, they are often
accompanied by motor phenomena, such as, eye blinking, brief mouth or hand automatic
movements, and changes in muscle tone. Occurring mainly in children between the ages
of 4 and 14, these seizures usually end by the age of 18.

7
Atypical absence seizures also occur predominantly in children, usually starting
before the age of 6. However, these seizures may continue into adulthood. They may begin
and end gradually, usually last 5 - 30 seconds, and are not normally provoked by
hyperventilation. There is staring, but the impairment of responsiveness is usually only
partial. Motor movements, such as eye blinking, are also observed. Some children who
experience atypical absence seizures also have global cognitive impairment, making them
difficult identify, as they may be indistinguishable from the child's usual behavior.
Tonic Seizures
Tonic seizures often occur during sleep and typically last 5 - 20 seconds. They
manifest as sustained muscle contractions in the neck, waist, and upper and lower
extremities. However, unlike with simple partial motor seizures, the contractions are
bilateral, and occur in symmetry. These seizures tend to occur mostly in people who have
other neurologic abnormalities in addition to epilepsy. These seizures are also experienced
by individuals with atypical absence seizures.
Myoclonic Seizures
Myoclonic seizures manifest as a brief, shock-like jerk of a muscle or group of
muscles, typically lasting less than one second, with no apparent impairment of
consciousness. Like tonic seizures, the movements are usually bilateral, with synchronous
jerks that affect the neck, shoulders, upper arms, body, and upper legs. If an individual
experiences several myoclonic seizures in rhythmic succession, this is called a clonic
seizure, and this may be accompanied by diminished awareness. Myoclonic seizures occur

8
in a variety of epilepsy syndromes. However, in rare situations, they may be part of a
progressive, degenerative condition called progressive myoclonus epilepsy.
Atonic Seizures
Atonic seizures manifest as a sudden loss of postural tone. These manifestations
can range from head nods or jaw drops in mild seizures, to falls in more intense seizures.
They usually last several seconds, but in rare occasions, can last longer than one minute.
They are usually associated with an impairment of consciousness and may cause significant
injury. Atonic seizures also often occur in patients with atypical absence seizures.
Tonic-Clonic Seizures
Generalized tonic-clonic seizures are the most common and most dramatic type of
seizures. There are two phases. The first is the tonic phase, where there are sustained
muscle contractions and a loss of consciousness. This is followed by a clonic phase, which
manifests as jerking of the extremities which gradually slows before stopping. The legs are
usually extended, while the arms may be extended, flexed, or alternating between these
two states. Because of excessive salivation and an inability to swallow, drooling or foaming
may be observed. There may also be biting of the tongue, cheek, or lip to cause bleeding,
and a lack bladder or bowel control. These seizures usually last 30 - 120 seconds, and they
are often followed by postictal lethargy and confusion lasting minutes to hours.

9
1.3. Epilepsy
According to the International League Against Epilepsy (ILAE) and the
International Bureau for Epilepsy (IBE), epilepsy is “a brain disorder characterized by an
enduring predisposition to generate epileptic seizures and by the neurobiological,
cognitive, psychological, and social consequences of this condition”30. With the disorder,
there is excessive neuronal activity in all or part of the central nervous system, and when
the basal level of neuronal excitability exceeds a certain critical threshold, a seizure
occurs25. For the presence of epilepsy to be recognized, there must be at least one seizure
accompanied by a lasting change in the brain that increases the likelihood of seizures in
the future. Even the occurrence of multiple seizures in a “normal” brain would not be
considered epilepsy30. After a single, unprovoked seizure, 16 - 62% of patients will
experience another seizure 5 years. The likelihood of this depends on whether there has
been an earlier neurologic injury, a structural abnormality, or a family history of epilepsy8.
Epilepsy is not a single condition. It is a diverse group of disorders that have at least
one thing in common – a predisposition to unprovoked seizures30,34. If the seizures are the
only neurologic disorder, then it is considered an epilepsy, and the disorders are then
separated according to whether the seizures are partial are generalized. If, however, the
seizures are just one of a collection of symptoms, it is called an epileptic syndrome. The
syndromes are then further divided into idiopathic, symptomatic and cryptogenic. The
syndrome is idiopathic when the disorder is not associated with other neurologic or
neuropsychologic abnormalities. It is symptomatic if an abnormality is present and the
cause is known and cryptogenic if an abnormality is present but the cause is unknown.

10
Epilepsy can be a result of several different underlying predicaments, such as head
trauma, nervous system infection, brain tumor, cerebrovascular disease or genetics.
However, over one-half of cases have no clearly defined cause30. Because of this, diagnosis
of the disorder may be very challenging. It requires knowledge of medical history and relies
heavily on patient and eyewitness accounts34. There are no characteristic physical signs
that can prove that a seizure occurred. Even though bites on the side of the tongue or cheek,
and a loss of urinary or fecal control are common after seizures, they may also be the result
of other causes. Direct observation by trained medical staff would add considerably to the
medical history, but direct observation is difficult to obtain unless the patient is under
constant observation in an Epilepsy Monitoring Unit (EMU). Knowledge of types of
epilepsy and different seizure semiologies may be critical to recognizing an epileptic
seizure when it is observed or described. In addition to this, blood tests may be required to
exclude infection as a cause for seizures and brain imaging test like computerized
tomography (CT) and Magnetic resonance imaging (MRI) scans may be used to exclude
brain lesions or abnormalities. Electroencephalography (EEG) can also be used to assist in
the diagnosis of epilepsy. This is a method used to record electrical activity in the brain,
and can help validate the diagnosis and assist in classification of seizure type. It measures
the electrical potentials of neuronal dendrites in the cerebral cortex. The synchronized
bursts from the neuronal population result in a spike on the EEG1. However, although
seizures are the defining characteristic of epilepsy, it is common for there to be a change
in the brain’s electrical field, even in the absence of a seizure. Also, EEG recordings can
show whether the abnormal neuronal firing starts focally, or simultaneously in both
hemispheres7,8.

11
Another issue that may make epilepsy diagnosis difficult is that not all seizures are
epileptic seizures. In fact, most seizures are non-epileptic35. They resemble epileptic
seizures, but are not associated with electrical discharges in the brain, and thus have no
epileptic basis. Non-epileptic seizures may be psychogenic or physiologic. Psychogenic
seizures have a psychological origin and are interpreted as an involuntary response to
distress35,36. They are the most common nonepileptic condition diagnosed in EMUs, using
video/EEG. Physiologic seizures, or provoked seizures, occur in response to a physical
disturbance34,35. They can be a result of sleep deprivation, fever, metabolic abnormalities,
drug withdrawal, or prescription or illicit drug use. Non-epileptic seizures do not recur
without the provoking event, and therefore do not require treatment with antiepileptic drugs
(AEDs)34.
Even though it is one of the most common serious neurological diseases in the
world, epilepsy is one of the most misunderstood. For most of recorded history, it has been
thought to be caused by demonic possession, acts of the devil, having an unclean spirit,
and witchcraft. The first recorded account of epilepsy is from about 1050 BC, in an
Akkadian text known as the Sakikku. These writing suggested that seizures sere the result
of possession. Around 400 BC, the Greek physician Hippocrates insisted that epilepsy was
a brain disorder, but even in the 2nd century AD, it was believed that seizures were caused
by animal spirits that moved through the brain.
Through the Middle Ages, the predominant belief was that seizures were acts of the
devil, or that they happened to people with unclean spirits. Then, during the Renaissance,
Paracelsus attributed seizures to a chemical or physiological process in which spirits boiled
up within the brain. It was not until three centuries later, that English physician James

12
Pritchard proposed that seizures were caused by brain hyperemia, which is an excess of
blood in the brain. This view was supported by many prominent 19th century physicians.
Later in the same century, English neurologist, John Hughlings Jackson, recognized that
seizures arise from the cerebral cortex, and that the site in the cortex from which the
seizures arise determines the symptoms. He was instrumental in the first successful
epilepsy surgeries, working with surgeon Victor Horsley to performed craniotomies on
patients with focal motor seizures. The 19th century also saw the birth of the
pharmacological treatment of seizures, followed in the 20th century by numerous
advancements in the understanding, diagnosis and treatment of epilepsy.
The most significant contribution came from neurologist Herbert Jasper and
neurosurgeon Wilder Penfield, who conducted revolutionary studies in epileptology,
functional anatomy and epilepsy surgery. Since then, there has been tremendous
development in the diagnosis, treatment, and understanding of epilepsy. However, many
misconceptions about the disease that date back centuries remain today. These include the
aforementioned belief that epilepsy is the result of possession, but also that it is rare, it is
contagious, and it is a mental disorder34.
1.4. The Central Nervous System
As epilepsy is a Central Nervous System (CNS) disorder, and epileptic seizures are
caused by excessive neuronal activity of either all or part of the CNS25, it is important to
have a basic understanding of the CNS, which consists of the brain, contained in the
cranium, and the spinal cord, contained in the vertebral canal. It is also important to

13
understand the peripheral nervous system (PNS), as this is made up of sets of neurons
which allow the CNS to communicate with the tissues of the body37.
Figure 1 The nervous system38
1.4.1. The Brain
The brain is the central organ of the human nervous system, controlling most of the
activities of the body. It receives, integrates and processes sensory input from the internal
and external environments, and, if appropriate, creates a response. In addition, it can
generate information and output signals without any external input. The brain is composed
of the brainstem, the cerebellum and the cerebrum37.

14
Figure 2 The Human Brain39
The cerebrum is the largest part of the human brain and is the site of higher brain
functions, such as memory, emotion and consciousness. It is separated by a deep groove
called the longitudinal fissure into two hemispheres. The two hemispheres are connected
primarily at a structure called the corpus callosum, which is made up of axons, and provides
the major pathway for communication between the two hemispheres. Each hemisphere is
divided into four lobes - the frontal, parietal, temporal, and occipital lobes.
The cerebrum also has regions of white and grey matter. The white matter is the
corpus callosum. It is the largest white matter structure in the brain, with as many as 200
million axons passing through it. The grey matter is divided into three major regions – the
limbic system, the basal ganglia and the cerebral cortex.
The limbic system - the most primitive region of the cerebrum - surrounds the brain
stem, and provides a connection between higher cognitive functions like reasoning, and
more primitive emotional responses like fear. Two of the major areas of the limbic system
are the amygdala, which is the emotional center of the brain, and the hippocampus, which

15
is associated with learning and memory. The basal ganglia is a group of nuclei that are
responsible for a variety of functions, the most important being cognitive processing
associated with movement37.
The cerebral cortex is the outer layer of the cerebrum. It is only 2 to 5 millimeters
thick, but contains about 100 billion neurons. The neurons are organized in vertical
columns and horizontal layers. There are three to six layers of neurons, which are separated
into two classes - principal neurons and interneurons1,37. The principal neurons send
information to long distances across the brain, forming excitatory synapses on post-
synaptic neurons. Interneurons only influence the activity of neighboring neurons, forming
mainly inhibitory synapses on principal cells or other inhibitory neurons. They have very
complex branching processes, allowing them to transmit signals to numerous neurons.
Figure 3 The Cerebral Cortex

16
The cortex is an integrating center for sensory input and a decision-making region
for many types of motor output. There are three main areas of the cortex – the sensory
areas, the motor areas and the association areas. The sensory areas receive sensory input,
integrate it, and generate a response. There are five sensory areas that process information.
The somatosensory cortex is found in the parietal lobe. It is the termination point of
pathways from the skin, musculoskeletal system, and internal organs. These pathways
carry information about touch, temperature, pain, itch, and body position. The gustatory
cortex resides near the edge of the frontal lobe, and receives information from the taste
buds. The visual cortex, located in the occipital lobe, receives information from the eyes.
The auditory and olfactory cortices, both found in the temporal lobe, receive input from
the ears and nose, respectively37.
There are three motor areas, each with its own structural representation of muscle
groups and specific motor functions. These areas are the primary motor cortex, the
premotor area, and the supplementary motor area25. The primary motor complex is located
in the frontal lobes, beginning in a structure called the sylvian fissure, which separates the
frontal lobe from the temporal lobe. It spreads to the uppermost portion of the brain, then
dips into the longitudinal fissure, which separates the two hemispheres of the brain25. This
area is responsible for the execution of voluntary movements. Information is received
mainly from sensory areas, but also from the cerebellum and basal ganglia. Descending
motor pathways cross to the opposite side of the body, with the left hemisphere of the brain
controls the right side of the body, and vice versa37. Every part of the body is represented
in the primary motor cortex. The face and mouth region is near the sylvian fissure, the arm
and hand area is in the midportion, the trunk area is near the apex of the brain and the leg

17
and foot areas are in the part that dips into the longitudinal fissure25. The premotor area lies
1 to 3 centimeters anterior to the primary motor cortex. It begins in the sylvian fissure and
extends into the longitudinal fissure, where it connects to the supplementary motor area,
which shares similar functions. This area provides guidance for movement. The anterior
part of the premotor area develops a “motor image” of the total muscle movement that is
to be performed. In the posterior part, this image stimulates the patterns of muscle activity
that are required for this image to be completed. To stimulate specific muscles, signals are
then sent from this area to the primary motor cortex either directly or through the basal
ganglia and thalamus. The supplementary motor area can be found above the premotor
area, but it lies mainly in the longitudinal fissure. It assists in planning complex movements
and in managing bilateral movements25, functioning with the premotor area to provide finer
motor control of the arms and hands by the premotor area and primary motor cortex25.
There are several areas in the cerebral cortex that cannot be categorized as sensory
or motor. These are the association areas, and they receive and integrate information
simultaneously from both the motor and sensory areas, as well as subcortical structures,
and can direct voluntary behaviors25,37. These areas can be divided into specializations, the
most important being the parieto-occipitotemporal association area, the prefrontal
association area, and the limbic association area.
The parieto-occipitotemporal association area lies in the large cortical space
occupied by parietal and occipital lobes. It surrounded by the somatosensory cortex, the
visual cortex, and the auditory cortex, and is responsible for providing interpretative
meaning for signals from these cortices. The prefrontal association area can be found in the
frontal lobe. A massive subcortical bundle of nerve fibers connects this area to the parieto-

18
occipitotemporal association area, and through this bundle, the prefrontal cortex receives
pre-analyzed sensory information on the position of the body in space. This information is
needed to plan effective movements. This area is also capable of processing non-motor
information, and is involved in carrying out “thought” processes in the mind. The limbic
association area, located in the anterior pole of the temporal lobe, the ventral portion of the
frontal lobe, and in the cingulate gyrus, is devoted mainly to behavior, emotions, and
motivation.
The cerebellum is the second largest structure in the brain, located inside the base
of the skull, just above the nape of the neck. The majority of the nerve cells in the brain are
found in the cerebelulum37, and It receives motor input from neurons in the cerebrum and
sensory input from somatic receptors around the body. It also receives input from receptors
for equilibrium and balance in the inner ear25,37. This structure processes sensory
information and directs movement operations. The cerebellum is separated into three lobes
- the anterior lobe, the posterior lobe, and the flocculonodular lobe. The flocculonodular
lobe is the oldest part of the cerebellum, and works with the vestibular system to control
body equilibrium. The anterior and posterior lobes are organized along the longitudinal
axis of the cerebellum. There are two cerebellar hemispheres separated by a narrow band
called the vermis, which houses most of the control functions for muscle movements of the
axial body, neck, shoulders, and hips. The hemispheres on either side of the vermis are
each divided longitudinally into the anterior and posterior lobes, and laterally into an
intermediate zone and a lateral zone. The intermediate zone directs muscle contractions in
the hands and feet, while the lateral zone works with the cerebral cortex to plan sequential
motor movements25.

19
The brain stem is the oldest and most primitive region of the brain, and connects
the higher brain centers to the spinal cord. Descending tracts pass from the higher brain
though the brain stem to the spinal cord. Some ascending tracts from the spinal cord pass
through the brain stem, while some synapse in the brain stem. The anatomies of the brain
stem and spinal cord are somewhat similar, both consisting of gray matter and white matter,
and both having peripheral nerves that branch off in a similar fashion. Eleven cranial nerves
originate in the brain stem, carrying both sensory (afferent) and motor (efferent)
information for the head and neck. Discrete nerve cell bodies (nuclei) are found throughout
the brain stem. These are involved in many basic processes, including arousal and sleep,
muscle tone and stretch reflexes, coordination of breathing, regulation of blood pressure,
and modulation of pain.
The brain stem consists of the medulla oblongata, the pons and the midbrain. The
medulla oblongata is the lower half of the brainstem, and connects the spinal cord to the
cerebrum. Its white matter contains the ascending and descending tracts. Ascending
somatosensory tracts from the spinal cord carry sensory information to the brain, while
descending corticospinal tracts from the cerebrum carry information to the spinal cord.
Most of these corticospinal tracts cross the middle of the body to the other side, resulting
in the phenomenon where each side of the brain controls the opposite side of the body. The
gray matter contains the nuclei of neurons that control many involuntary functions, such as
blood pressure, breathing, swallowing, and vomiting. The pons is a bulge on the ventral
side of the brain stem between the medulla and the midbrain. It works with the nuclei in
the gray matter of the medulla oblongata to coordinate breathing control, but its chief role
is to relay information between the cerebellum and cerebrum. The midbrain, the upper

20
portion of the brain stem, controls eye movement and transmits signals for auditory and
visual reflexes37.
1.4.2. The Spinal Cord
The spinal cord is a long, thin, cylindrical bundle made up of nervous tissue and
support cells. It serves as the main information pathway between the brain and rest of the
body.
It also contains neural networks responsible for locomotion, explaining why spinal
cord injury may result in loss of sensation from the skin and muscles, loss of the ability to
voluntarily control muscles, or even paralysis37. The spinal cord extends from the end of
the brain stem down the spine, and is divided in to four regions named after vertebrae
adjacent to each region. These spinal regions - cervical, thoracic, lumbar and sacral - are
divided into segments. Each of these segments produces a bilateral pair of spinal nerves,
and each nerve divides into two branches, called roots, before connecting to the spinal cord.
The ventral root caries efferent information, while the dorsal root carries afferent
information37.
The gray matter of the spinal cord is butterfly-shaped and is made up of the grey
commissure, and the anterior and posterior grey columns. The grey commissure surrounds
the central canal of the spinal cord. The anterior grey columns are called the ventral horns.
These contain motor neurons that carry efferent signals to muscles and glands. The
posterior grey columns, or dorsal horns, contain the cell bodies of interneurons that synapse
with sensory fibers from the dorsal roots. The white matter surrounds the gray matter and
consists mainly of motor and sensory axons. It is separated into columns, made up of

21
bundles of axons, which transfer information either up or down the spinal cord. Afferent
information is carried up the spinal cord to the brain, while mostly efferent signals are
carried from the brain to the spinal cord. Not all sensory information entering the spinal
cord requires input from the brain to trigger a response. A spinal reflex, allowing the spinal
cord to function as an integrating center. Signals pass from a sensory neuron to an efferent
neuron by going through the grey matter37.
1.4.3. Neurons
The neuron is the functional unit of the nervous system and there are over 100
billion in the CNS25,37. Neurons are considered excitable cells because they can generate
and propagate electrical signals. These electrical signals are called action potentials.
Afferent neurons carry signals from sensory receptors to the CNS, while efferent neurons
carry signals from the CNS to different targets around the body. There are two types of
efferent neurons. Somatic motor neurons control skeletal muscles, while autonomic
neurons control smooth and cardiac muscles, glands, and some types of tissue. Though
neurons may vary in size and shape, they share structural similarities. They all have
dendrites, which receive incoming signals from neighboring cells, and axons, which carry
outgoing information to target cells. These structures are essential for neurons’
communication between each other and with other cells37.

22
Figure 4 Structure of a typical neuron40
The region where an axon terminal of a neuron meets the dendrite of its target cell
is called a synapse, and is made up of two parts - the axon terminal of the presynaptic cell
and the membrane of the postsynaptic cell. Information travels from the presynaptic cell to
the postsynaptic cell. Synapses can be classified as either electrical, passing electrical
signals through gap junctions, or chemical, using neurotransmitters to carry information
between cells. Most synapses in the nervous system, however, are chemical synapses.
Electrical signals from presynaptic neurons are converted into chemical signals that cross
the synapse to the postsynaptic neuron. Any chemical signal secreted by a neuron is called
a neurocrine. If the neurocrine molecule diffuses across the extracellular space to a target
cell and has a rapid effect, it is called a neurotransmitter37.
The neurotransmitter binds to a receptor on the postsynaptic cell, causing an ion
channel in the cell membrane to open1,25,37. The mechanism for channel opening depends
on the type of receptor. Neurotransmitter receptors fall into two categories - ionotropic and
metabotropic. Ionotropic receptors directly alter ion channel function, and are also called
ligand-gated ion channels37. Neurotransmitter binding directly causes the channel to open,

23
and the ion movement and resulting potential change happens very quickly, within a few
milliseconds41. Metabotropic receptors use second messenger systems to alter ion channel
function37. These are also called G protein-coupled receptors, as neurotransmitter binding
causes the receptor to bind to a G protein. It is the G protein that activates the second
messenger to cause the ion channel to open. The changes resulting from binding to these
receptors occur over seconds or minutes41.
The major neurotransmitters in the CNS are glutamate, -amino-butyric acid
(GABA), acetylcholine (ACh), norepinephrine, dopamine (DA), serotonin, and histamine1.
Serotonin and dopamine are inhibitory neurotransmitters, and are both secreted by neurons
located in structures in the brain stem. Serotonin acts as an inhibitor of pain pathways in
the spinal cord and in the higher regions of the nervous system to help control mood, while
dopamine modulates motor control and reward centers linked to addictive behaviors25,37.
Acetylcholine and norepinephrine are both known to be mostly excitatory, but have
inhibitory effects in some cases. In the CNS, acetylcholine is secreted by the neurons in
the motor cortex and in the basal ganglia, and by motor neurons that innervate the skeletal
muscles25. Norepinephrine is secreted by neurons in the brain stem and hypothalamus,
sending nerve fibers to widespread areas of the brain to help control overall activity and
mood25. Histamine is and excitatory neurotransmitter, secreted by mast cells42 and neurons
in the tuberomammillary nucleus, found in the hypothalamus.42,43. It controls arousal and
promotes wakefulness44,45, and can cause constriction of smooth muscles45. Histamine also
plays a role in the mechanism and management of epilepsy46. Glutamate is the major
excitatory neurotransmitter in the CNS1,37. It is secreted in many of the sensory pathways
entering the CNS. It is also secreted in many areas of the cerebral cortex25. The primary

24
inhibitory neurotransmitter is GABA1,37. It is secreted in the spinal cord, cerebellum, basal
ganglia, and cerebral cortex25. Both glutamate and GABA play important roles in epilepsy,
and in the initiation and cessation of seizures1.
Glutamate and GABA have both ionotropic and metabotropic receptors. For
glutamate, the ionotropic receptors are the -amino-2,3-dihydro-5-methyl-3-oxo-4-
isoxazolepropanoic acid (AMPA), N-methyl-D-aspartate (NMDA), and kainate receptors.
These receptors are differentiated from each other by cation permeability and sensitivity to
different pharmacological agonists or antagonists. It has been shown that agonists of these
receptors induce seizure activity, while antagonists suppress seizure activity. There are
three groups of glutamate metabotropic receptors. These groups are separated on the basis
of mechanism of signal transduction, different effectiveness of agonists, and whether there
is pre- or post-synaptic localization. There are two major subtypes of GABA receptors. The
GABAA receptors are inotropic and are found post-synaptically, while GABAB receptors
are metabotropic and are found pre-synaptically. Agonists for GABAA receptors are known
to suppress seizure activity, but some GABAB agonists have been shown to intensify
hyperexcitability and seizures.
Channel opening allows the movement of ions across the cell membrane and into
the cell, which causes a change in the potential of the membrane37,41. All living cells have
a resting membrane potential that is the result of the uneven distribution of potassium (K+),
sodium (Na+), calcium (Ca2+) and chloride (Cl-) ions across the membrane. For neurons,
this resting membrane potential is -70 mV. At rest, the neuronal membrane is significantly
more permeable to K+ than it is to Na+ or Ca2+. As a result, K+ contributes more to the
resting membrane potential than Na+ or Ca2+. Also at rest, there is a greater concentration

25
of Na+, Ca2+ and Cl- in the extracellular fluid, while K+ is more concentrated in the
cytoplasm. A change in the membrane ion permeability leads to a change in concentration
gradients of these ions, and this causes a change in membrane potential. Membrane
permeability is changed by the opening and closing of ion channels. Neurons contain
various gated ion channels and they are typically named after the primary ions that pass
through them. The four major types of ion channels are K+ channels, Na+ channels, Ca2+
channels and Cl- channels. Gated channels alternate between open and closed states and do
so in response to different stimuli. Chemically gated channels respond to neurotransmitters,
neuromodulators or intracellular signal molecules such as second messengers. Voltage
gated channels respond to changes in membrane potential, and mechanically gated
channels respond to physical forces. However, some ion channels spend most of their time
in the open state. An example is K+ leak channels, which allow K+ ions to cross the cell
membrane down their concentration gradient, and are the major determinant of resting
membrane potential37.
The movement of ions creates an electrical signal. The passage of Na+ ions from
the extracellular fluid to the cytoplasm increases the positive charge inside the cell,
depolarizing the cell membrane and generating the electrical signal. The movement of ions
across the membrane also stops the electrical signal. The signal stops if a K+ channel opens,
making the membrane more permeable to K+. The positive charge inside the cell is
decreased, and the membrane becomes hyperpolarized, where the membrane potential is
more negative than the resting potential. Hyperpolarization can also occur if negatively
charged ions, such as Cl- cross the cell membrane and enter the cell.

26
Electrical signals can be classified into two basic types. They are either graded
potentials and action potentials. Graded potentials travel over short distances, losing
strength as they travel through the cell. The strength of the signal is directly proportional
to the strength of the stimulus that triggers the event. If a graded potential is strong enough,
it will eventually reach a region of the neuron known as the trigger zone. This membrane
in this region is highly concentrated with voltage-gated Na+ channels, and if the graded
potential depolarizes the membrane of the trigger zone to the threshold voltage, these Na+
channels open, and an action potential is initiated. Action potentials travel for long
distances through a neuron without losing strength. This is required for signal transmission
over long distances, such as from a fingertip to the spinal cord. Action potentials occur in
an all-or-none fashion, with maximum depolarization if the stimulus reaches threshold, and
no depolarization if the stimulus is below threshold37.
For PNS neurons, action potentials require only voltage-gated Na+ and K+ channels,
and any above-threshold stimulus causes an action potential. Electrical signaling in the
CNS is more complex, as brain neurons fire action potentials in a variety of patterns. This
is because different ion channels differ in activation and inactivation voltages, opening and
closing speeds, and sensitivity to neuromodulators. Also, electrical signaling in the CNS
does not require an external stimulus. Tonically active neurons continuously fire action
potentials, while phasic or bursting neurons fire bursts of action potentials rhythmically,
alternating with intervals of quiet.
The action potential can be divided into three phases. The first phase is the rising
phase, which is followed by the falling phase. The final phase is the post-hyperpolarization
phase. The rising phase results from by a sudden temporary increase in the cell’s

27
permeability to Na+. When a graded potential reaches the trigger zone, it depolarizes the
membrane. If the depolarization reaches threshold, voltage-gated Na+ channels open. This
allows Na+ ions to diffuse into the cell down the electrochemical gradient. The movement
of Na+ ions depolarizes the cell membrane, gradually making it more positive. As the
potential continues to rise, the inside of the cell becomes more positive than the outside
and the membrane potential reverses polarity. Once this happens, there is no longer an
electrical force driving the movement of Na+ into the cell. However, the Na+ concentration
gradient remains, and Na+ ions continue to move into the cell until the Na+ channels in the
axon close. At this point, the action potential peaks. The membrane depolarization causes
Voltage-gated K+ channels then start to open. However, these channels are slower to open
than Na+ channels, so at the peak of the action potential, when the Na+ channels close, the
K+ channels have just finished opening. The positive membrane potential and the
electrochemical gradient for K+ favor the movement of K+ ions out of the cell. This causes
the membrane potential to become more negative, and creates the falling phase of the action
potential. When the membrane potential reaches the resting potential, the K+ channels are
still open and K+ ions continue to leave the cell through these channels and leak channels.
The membrane potential falls below the resting potential, leading the after-
hyperpolarization phase. The slow voltage-gated K+ channels eventually close and some
of the outward K+ leak stops. Some Na+ ions leak into the cell and this, combined with the
retention of K+ ions, brings the membrane back to its resting potential. Hyperpolarization
also occurs if Cl- channels are opened. The influx of Cl- ions into the cell increases the
negative charge of the cell until the potential falls below the resting potential. The K+ ion
retention and Na+ movement through ion leak channels bring the membrane back to resting

28
potential. The rising depolarization phase is mediated by glutamine or other excitatory
neurotransmitters, while the falling repolarization and the hyperpolarization phases are
mediated by GABA.
Figure 5 Action potential inside a neuron47
1.4.4. Epilepsy and Nervous System
Epilepsy can result any process that increases neuronal excitability and the action
potential is the basic mechanism for neuronal excitability1. Therefore, any factor that
increases the chance for action potentials to be generated can result in a hyper-excitable
state, increasing the probability that a seizure could occur. This includes increased

29
excitatory or decreased inhibitory neurotransmission. Excessive glutamate transmission or
decreased GABA transmission induces hyper-excitability. An alteration in ion channels
can also lead to hyper-excitability. The type, number and distribution of ion channels
govern the direction, degree, and rate of changes in the membrane potential. A larger
number of voltage-gated Na+ channels would result in increased excitability. Biochemical
modification of some receptors can increase permeability to ions that cause membrane
polarization, also leading to greater excitability. Any modification of intracellular or
extracellular ion concentrations in a way that supports of membrane depolarization can
result in a hyper-excitability. For example, decreased extracellular volume would lead to
increased extracellular K+ concentration. This causes a resistance to the outflow of K+ ions,
which would inhibit repolarization, effectively increasing excitability. In addition to these
factors, there are several external stimuli, which by themselves are subthreshold. However,
if they occur synchronously, this allows temporal summation to occur in the post synaptic
neurons, and can cause a hyper-excitable state1.
The way in which neuronal networks are organized can also influence excitability.
A basic network that has been well-studied is that of the dentate gyrus and hippocampus.
Here, afferent connections to the network can directly activate the projection cell. The input
can also directly activate local interneurons, which may inhibit neighboring projection
neurons. This is called feed-forward inhibition. The activated projection neuron may then
activate the interneurons, which then inhibit their actions of the projection neurons. This is
known as feedback inhibition. Therefore, neighboring and distant neurons can be affected
by changes in the function of any of the cells within a circuit. Neurons can grow excitatory
axons, allowing them to make more numerous connections. This can increase excitability

30
of the neuronal network. Also, the loss of inhibitory neurons or of excitatory neurons that
drive feedback inhibition can result in increased excitability of the network1.
The entorhinal-dentate-hippocampal loop of the limbic system has been studied
intensively in experimental models of epilepsy. As a result of these studies, there are two
theories about cellular network changes which cause the hippocampus to become hyper-
excitable. According to the first theory, there is either a selective loss of interneurons that
cause normal feed-forward and feedback inhibition of principal neurons, or a loss of
excitatory neurons which usually stimulate the inhibitory interneurons. The other theory
proposes that there is synaptic reorganization following injury. This reorganization occurs
by the sprouting of additional axons, creating recurrent excitatory connections between
neighboring neurons. These mechanisms may coexist and act together in the brain of
someone with epilepsy1.
1.4.5. Generation of Seizures
A partial seizure is initiated as a result of two concurrent events. There are repetitive
action potentials, and the hypersynchronization of the neuronal population. The repetitive
action potentials are a result of prolonged depolarization of the neuronal membrane. The
prolonged depolarization occurs because some receptors, like the NMDA glutamate
receptor, have Ca2+ channels that are blocked by Mg2+ ions in the resting state. However,
when the membrane becomes depolarized, Mg2+ is displaced and the receptors become
permeable to Ca2+. The influx of Ca2+ causes further depolarization, which causes the
opening of Na+ channel and the influx of Na+. This leads to the generation of repetitive
action potentials1. After the action potential burst, there is a rapid GABA mediated

31
repolarization followed by hyperpolarization. Upon activation, GABAA receptors become
permeable to Cl- ions. Influx of Cl- influx hyperpolarizes the membrane and inhibits action
potentials. With metabotropic GABAB receptors, a second messenger causes in opening of
K+ channels, leading to K+ efflux and a hyperpolarizing current1. The hyperpolarization,
along with a region of surrounding inhibition created by inhibitory neurons, normally
prevents the spread of the bursting activity. However, the repetitive action potentials lead
to increased extracellular K+, accumulation of Ca2+ in presynaptic terminals, and
depolarization-induced activation of an NMDA receptor, causing more Ca2+ influx. These
conditions allow the seizure to spread within the brain by recruitment of neighboring
neuron and loss of surround inhibition.
There is very little known about the mechanism for generalized seizures. Absence
seizures have been studied, and are believed to arise from irregularities in oscillatory
rhythms produced by circuits connecting the cortex and thalamus. These oscillatory
rhythms are typically produced during sleep and involve an interaction between GABAB
receptors, Ca2+ channels and K+ channels in the thalamus. The pharmacologic modification
of these receptors and channels has been shown to induce absence seizures1.
1.5. Seizure Prediction
For most of medical history, there has been a belief that epileptic seizures could not
be anticipated. This was because seizures seem to be abrupt, random occurrences.
However, evidence has shown that seizures do not begin abruptly, but develop over
time5,6,48, and hypotheses based on clinical reports and scientific intuition have pointed to
the possibility of seizure predictability7. Even though auras are simple partial seizures, they

32
give warning of an impending complex partial or secondarily generalized seizure8. Wilder
Penfield noted that prior to seizures, there are changes in cerebral blood flow7. There is
also the reservoir theory, postulated by William Lennox in 1960. This theory states that
causes of a seizure may be represented as sources of a reservoir. A person’s predisposition
takes up a volume at the bottom of the reservoir. However, the reservoir is also supplied
by sensory, metabolic, emotional, or other yet unknown factors. If the reservoir overflows,
this results in a seizure7,49.
The first significant attempt at seizure prediction was made by Viglione et al. in
1970. They used scalp EEG recordings of seven seizures from five patients, and they were
able to differentiate between the preictal and interictal periods at a success rate of 90%.
This led to the development of an electronic warning device. The system had a high correct
prediction rate, but there were too many false-positive results. Also, there were limitations
because of the computers available at the time, and apprehension about the need for patients
to wear EEG electrodes during waking hours. Eventually in the mid 1970’s, work on this
system ended50. Work on seizure prediction in the late 1970’s and early 1980’s focused
mainly on visible features in the EEG, such as epileptic spikes, and their relation to
seizures. It was discovered during this time, that abnormal activity in the epileptic and
normal lobes became correlated about 20 minutes prior to seizure onset50. Rogowski et al.
(1981) analyzed the EEG recordings of 12 epileptic patients suffering from absence
seizures. In 10 of the 12 patients, and in 25 of the 28 recorded seizures, they observed
specific pattern linked with the occurrence of the seizure. They stated that these data could
be used to aid in the prediction of the seizure by several seconds51.

33
In the late 1980s,researchers started using new signal processing methodologies
that are derived from on the mathematical theory of nonlinear dynamics and chaos50,52. The
brain is a nonlinear system, an in its “normal” state, is chaotic. However, under conditions
of a seizure, there is a transition to an “abnormal”, more ordered state, then back to the
“normal” state52. In 1990, Iasemidis et al. used non-linear dynamics to analyze intracranial
EEG recordings from a patient with temporal lobe epilepsy. They found that the postictal
state was more chaotic than the preictal or ictal states. In 1991, the same group found
evidence of a preictal phase transition, where chaos is reduced, 7 ½ to 5 ½ minutes prior to
the onset of the seizure53.
Elger and Lehnertz (1994) used correlation dimension, a non-linear measure, to
analyze the intracranial EEG recordings of 20 patients with unilateral temporal lobe
epilepsy. They showed that a loss of complexity in the EEG signal can help identify the
ictal onset zone54. In 1998, they found that the loss of complexity can be used to predict
epileptic seizures several minutes in advance28. In 2001, Le Van Quyen et al. used non-
linear analysis of scalp EEG recordings from patient with temporal lobe epilepsy to
determine if changes in brain dynamics can be detected early enough to anticipate the onset
of a seizure. They found that these changes allowed for the anticipation of a seizure several
minutes before the clinical manifestation6. Litt et al. (2001) analyzed continuous
intracranial EEG recordings from five patients with mesial temporal lobe epilepsy. They
found that there were EEG changes resulting from increased abnormal activity as early as
7 hours before the onset of a seizure. They also measured the energy in the EEG signal and
found that accumulated energy increased 50 min before a seizure. In 2003, Iasemidis et al.
described an adaptive seizure prediction algorithm (ASPA) that was tested on a group of

34
five patients with refractory temporal lobe epilepsy, using continuous intracranial EEG
recordings. They were able to predict 82% of all seizures, with warnings coming an average
of 71.7 min before the onset of the seizure.
Most seizure prediction studies are retrospective. Following a seizure, they work
backward in time to identify changes in the EEG during the preictal period, compared to
the interictal period48,50. Despite the publication of numerous seizure prediction algorithms,
there is little evidence of clinical usefulness.
1.5.1. Seizure Alert Dogs
Evidence has shown that some dogs have an innate ability to predict seizures in
their owners and that dogs can be trained to predict seizures. However, studies have shown
mixed results.
Strong et al. (1999) evaluated Support Dogs, a charity in the UK that trains dogs to
assist disabled people. They had trained six seizure alert dogs, pairing each dog with an
epileptic individual, and conditioning each dog to the seizure type of that individual. The
dogs were then trained to detect and alert to the onset of a seizure, and seizure frequency
was monitored prior to, during and after training. The dogs were able to alert to their
owners’ seizures 15 to 45 minutes prior to a seizure onset. In 2002, the group monitored
seizure frequency of 10 individuals with tonic-clonic seizures, who had been referred to
the Seizure Alert Dogs service at Support Dogs. The monitoring was for 48-week period.
This included a 12-week baseline period, a 12-week training period, and 24 weeks follow
up. There was a 43% mean reduction in seizure frequency. In 2003 Dalziel et al. performed
a study where epileptic patients answered a survey. There were 63 patients, 29 who owned

35
dogs. Of those with dogs, only three patients reported that their dogs predicted an
impending seizure. They also interviewed 13 seizure dog trainers, observed dogs in training
and spoke with individuals who had been paired with a seizure-assist dog. They met 15
individuals with certified seizure-assist service dogs. Eight of them acquired the dogs to
provide assistance during seizures. After a short time, the dogs began to alert to impending
seizures. The other seven dogs were acquired as pets, but after they started to alert to
seizures, were trained and certified. These dogs alerted 30 seconds to 45 minutes before
seizures, with greater than 70% accuracy.
In 2004, Kirton et al. surveyed 123 families with epileptic children, forty-eight who
had lived with a dog for at least one year while having seizures. There were 62 dogs, and
none had been previously trained as seizure-assist dogs. Only nine dogs alerted to
impending seizures. There was about 80% accuracy and the anticipation time ranged from
10 seconds to 5 hours. Ortiz and Liporace (2005) monitored two patients, who owned
seizure alert dogs, in an epilepsy care unit where they were undergoing continuous
computer-assisted EEG. One patient had eight complex partial seizure. The dog alerted to
one of the seizures just two seconds prior to onset, but was asleep for the other seizures.
For one of those seizures, the dog woke up a few seconds after the seizure began and alerted
family members. The other patient had five seizures, but the dog was only present for one
of them. The dog alerted her seven minutes prior to the seizure, but there was no change in
the EEG with the seizure and she was diagnosed with nonepileptic seizures. It was noted
by the investigators that the environment of the epilepsy care unit places limitations on the
patients and their dogs, and that similar studies using larger samples sizes should be
performed.

36
These studies show that some dogs can anticipate epileptic seizures, and when
trained, do so with high accuracy. However, there are several issues with untrained dogs.
Without special training, the dog may resort to a survival strategy, such as fighting or
running away. In some cases, they may also experience adverse health effects10.
1.6. Canines (Canis familiaris)
1.6.1. History
The ability of canines to discriminate human scent has been known for some time.
The first experiment on canine olfactory abilities dates back to the nineteenth century55,
but there is evidence that they were used as tracking, hunting and guard dogs by ancient
Egyptians (496 - 406 B.C.) and the Romans (A.D. 23 - 79). Since World War II, dogs have
been used by the military for the detection of explosives. Civilian use began with tracking
individuals and locating drugs and bombs56. Service dogs have been used since the 1920’s,
when guide dogs for the blind first became an accepted role for dogs. The use of service
dogs for other roles began in the 1960’s, but there was no formal organization or training.
The Americans with Disabilities Act of 1990 defined a service dog as “any guide dog,
signal dog, or other animal individually trained to provide assistance to an individual with
a disability”. Since then, service dog roles have continued to expand to include hearing
assistance dogs, diabetic awareness dogs, and seizure response and alert dogs.
1.6.2. Olfaction
Canine olfaction is 10,000 – 100,000 times more powerful than that of humans, as
they can detect odorants at concentration levels of 1 - 2 parts per trillion18. The difference

37
is mainly because of anatomical, physiological and genetic differences that allow them to
collect, sample and process chemosensory information more effectively than humans57.
The canine’s nasal cavity is divided by the nasal septum into two symmetric
airways, with three main regions: nasal vestibule, respiratory, and olfactory. The nasal
vestibule is the anterior part, and it distributes inhaled air within the nasal cavity and directs
the exhaled air stream58. The respiratory region consists of the dorsal and ventral nasal
conchae. Both the nasal vestibule and respiratory airways are responsible for filtering,
humidifying, and warming or cooling of inhaled air before it moves to the lower respiratory
tract. The ventral nasal conchae, also called the maxilloturbinates, are branched, providing
a large surface area for heat and moisture transfer. The most posterior region of the nasal
cavity is olfactory portion. This region contains scroll-like ethmoidal conchae, or
ethmoturbinates. which offer a large surface area for transfer of odorants. These
ethmoturbinates are lined with olfactory epithelium, which has a high concentration of
olfactory cells and performs the majority of odor processing57,58. Below the
ethmoturbinates, is a bony subethmoidal shelf that forces inhaled air into the olfactory
epithelium59 and traps the air, allowing odors to accumulate on the epithelium. Additional
olfactory epithelium is found in the vomeronasal organ, located above the roof of the
mouth, in the bottom of the nasal cavity, 57. It is made up of a pair of elongated, fluid-filled
sacs that open into either the mouth or the nose59. This epithelium, the vomeronasal sensory
epithelium, has specialized receptors which detect pheromones and other volatile
molecules57.
Sniffing creates unique air flow patterns the carry odor molecules are carried to the
olfactory epithelium57. This is a disruption of the normal breathing pattern, and is

38
performed through a series of rapid, short inhalations and exhalations. The inhaled air flow
during sniffing is different that the air flow during regular breathing. When a canine is
breathing or panting, most of inhaled air travels to the lungs, with only 12 - 13% reaching
areas with olfactory epithelium57. During sniffing, the canine’s nostrils dilate, changing the
conformation of the nasal vestibule. This dilation opens a direct pathway to the dorsal
meatus, a structure that allows odor-bearing air to bypass the maxilloturbinates to the
ethmoidal region58. In addition, the flow of air through the nostrils takes separate pathways
during inhalation and exhalation, minimizing the re-inhalation of expired air and promoting
the inhalation of fresh air samples.
In the nasal cavity, embedded in the nasal epithelium, there is a dense network of
olfactory receptor cells which are activated by odor molecules57,58. Humans have about 5
million olfactory receptor cells, while dogs have 200-300 million57. These cells are
contained within the olfactory epithelium and project dendritic processes to the epithelial
surface58. Olfactory receptor cells are bipolar neurons57,58, in that they have two processes
that extend from the cell body. The dendritic processes extend to the epithelial surface and
terminate in rounded olfactory knobs covered with sensory cilia that are embedded in the
fluid of the mucous membrane57,58. These cilia are the site of initial sensory transduction,
as neuronal protein receptors are embedded here. Water soluble odorant molecules dissolve
in the watery mucous surrounding the cilia in order to attach to the receptor proteins.
Hydrophobic odorant molecules interact with olfactory binding proteins found in the nasal
mucosa, which transport them to the olfactory receptors. Odor receptor cells are constantly
regenerating, living 30-60 days before being replaced by new cells. Replacement neurons
do not automatically contain the same odor receptors, as the type of receptor created on the

39
new neuron is partly triggered by the odors that the animal smells most. Research has
shown that animals develop more receptors for odors on which they are regularly trained57.
On the ethmoid bone, there is a structure called the cribriform plate, which separates
the nasal cavity from the brain cavity. Behind this plate sits the olfactory bulb. Olfactory
nerve bundles that form from axons of the olfactory receptor cells project directly into the
olfactory bulb, providing is a short, direct connection to the brain, and allowing for a very
rapid transmission of information. In the olfactory bulb, are clusters of second order
neurons called glomeruli. The axon terminals make synaptic contact with these clusters.
When an odorant molecule binds to the receptor, the release of a second messenger
molecule, cAMP, triggers a chemical cascade. Depolarization of the membrane of the
olfactory neuron follows, leading to the spread of an electrical signal along the axon, that
stimulates the neurons of the glomeruli. The glomeruli converge with the dendrites of
mitral cells and tufted cells, which form the lateral olfactory tract that conducts the
olfactory signal to the piriform cortex. The mitral cells the, largest cells in the olfactory
bulb, receive information from numerous glomeruli. This allows them process the olfactory
signal before it is sent to the cortex, and it is believed that this allows for enhanced
discrimination of odors57.

40
Figure 6 Canine and human nasal airway. (a) Canine nasal airway has a peripherally located olfactory recess separated from the respiratory region by a bony horizontal plate, the lamina transversa. (b) the human nasal airway has no olfactory recess18.

41
Genetics also plays a role in a canine’s superior sense of smell. Humans have about
450 functional olfactory genes, while canines have more than 800. This large number of
olfactory genes accounts for not only a lower threshold of detection, but also the capability
to learn new and complex odors. Also, certain polymorphisms in specific olfactory receptor
genes may explain why some breeds may be better at scent detection than others57.
1.6.3. Applications
A dog’s keen sense of smell is used in numerous ways. Law enforcement agencies
use specially trained dogs for the detection of narcotics, explosives, currency, firearms, and
contraband agriculture products. Canines have also been used in search and rescue
missions, and to look for lost individuals, homicide victims and cadaver materials. Outside
of law enforcement, canines have been used to detect certain physical ailments, such as
diabetes and cancer.
1.6.4. Detection/odor
Though canines can and have been trained to detect numerous odors, studies have
shown that canines typically respond to volatile organic compounds (VOCs) contained
within the headspace of the material19,60. This has led researchers to numerous studies to
identify chemicals that are responsible for the dominant odors of various narcotics and
explosives, as well as odor from live humans and human remains19,20,60,61.

42
1.6.5. VOCs
Volatile organic compounds are a class of carbon-based chemical compounds that
have high vapor pressure at room temperature, allowing them to easily change from liquid
to vapor. In the human body, VOCs are produced as a result of chemical, metabolic and
pathological processes14,24, and are released through the skin, saliva and
breath14,19,20,22,24,62,63.
Volatile organic compounds from skin originate from eccrine, sebaceous and
apocrine gland secretions, and from their interactions with bacteria on the skin64. Eccrine
glands are found throughout the skin, but they are concentrated in the palms of the hands,
soles of the feet, and the forehead. The sweat from these glands originates in the
extracellular fluid and as a result, reflects the chemistry of blood plasma. Therefore, any
change in blood chemistry, would result in a change in the composition of secretions form
eccrine glands. Sebaceous glands are concentrated in the upper chest, back, scalp, face, and
forehead19,22. Sebum from sebaceous glands consists of a wide variety of organic
compounds, and may be influenced by diet and genetics. Secretions from these glands
should represent the VOCs released from the body under normal conditions. Apocrine
glands are located in the eyelids, anus, areolas and the armpit and pubic areas37,64.
Secretions from this gland are the primary source of underarm odors64. Also, secretions
from the eyelids, anus, armpit and pubic areas are released in response to fear or sexual
excitement37.
Volatile organic compounds can also be obtained from saliva. Human saliva is a
biological fluid that consists of secretions the salivary glands, gingival crevicular fluid,
bacteria, epithelial cells, and food debris, in different stages of decomposition65. The

43
secretions of the salivary glands originate from three principle glands – the parotid,
sublingual, and submandibular. The parotid secretes saliva derived mainly from blood
plasma, otherwise known as serous fluid. The sublingual and submandibular glands secrete
both serous fluid and mucin66. Like sweat, any change in blood chemistry would be
reflected in the chemical composition of saliva. Analysis of compounds in saliva can be
used for the diagnosis of several diseases, for drug testing, and for monitoring exposure to
environmental pollutants67.
More than 500 different VOCs can be detected in the human breath, both exogenous
and endogenous24,68. Exogenous compounds may be inhaled from the external environment
or produced following ingestion of food. Endogenous compounds mainly originate in the
blood and are transferred to the breath via exchange with the lungs, but they may also be
produced by symbiotic bacteria24.
1.6.6. Controlled Odor Mimic Permeation System (COMPS)
An odor mimic is a type of canine training aid which was developed for law
enforcement canine training because illicit substances pose a risk to canines and their
handlers. As mentioned earlier, studies show that canines respond to VOCs in the
headspace of the substance19,60, and mimics are prepared using the compound responsible
for the dominant or signature odor. The Controlled Odor Mimic Permeation System
(COMPS) uses a permeable container, such as a polyethylene bag, which contains the odor
producing compound on a vehicle, such as cellulose or cotton gauze. The vehicle with the
odor is sealed in the permeable bag, which allows for consistent dissipation of the odor.
The dissipation rate can be manipulated by changing the type a thickness of the permeable

44
container. This permeable container is then packaged in a non-permeable container, such
as an aluminum bag or a glass jar, which allows the volatile compound dissipating from
the permeable container to reach equilibrium in the headspace of the non-permeable
container, and slows odor loss during shipping and storage.

45
Figure 7 Controlled Odor Mimic Permeation System (COMPS)

46
1.6.7. Canine Detection Training
As VOCs enter the nasal cavity of a canine’s nose, the molecules interact with a
large surface containing olfactory receptor cells. Odorants that bind to the receptor cells
produce a signal that is transmitted to the olfactory bulb resulting in a response which may
be either learned or involuntary. Learned odor recognition is achieved through repetition
in the form of canine detection training. When a new odor is presented to a canine, the dog
will undergo a process called imprinting. Canine imprinting is achieved by incorporating a
new odor in a canine lineup (row of containers housing various odors) and presenting the
container housing the new odor to the canine. After allowing the dog to engage with the
odor, the handler will command the dog to sit (active sign of alert), and the canine will
receive a reward. The process is continued until the canine is able to actively search and
alert (change in canine behavior recognized by handler) to the new odor within a lineup.
Canines imprinted on new substances will often perform a canine trial, which
includes the odor imprinted and a variety of distractor odors to test the discrimination and
sensitivity of the canine’s olfactory. Canine trials are often used in the forensic realm to
test the likelihood that a single odorant or combination comprised within the imprinted
substance will facilitate the same canine response as the imprinted material.
1.7. Research Objectives
The objectives of this research were to employ analytical instrumental techniques
to compare the VOC profiles of samples taken from epileptic individuals to the VOC
profiles of samples taken from healthy individuals, and to compare the VOC profiles of
samples taken from epileptic individuals immediately following a seizure event to the VOC

47
profiles of samples taken in the absence of seizure activity. Samples of hand odor, saliva
and breath were obtained from healthy and epileptic individuals, and epileptic individuals
were sampled for five consecutive days. Analyses were performed using solid phase
microextraction (SPME) combined with gas chromatography-mass spectrometry (GC-
MS). The tasks of this research study are listed below.
Task 1: Development and Optimization of the GC-MS Method
The first task of this study was the determination of the optimum GC-MS conditions
needed to detect and identify human scent VOCs. Various parameters, such as type of
stationary phase, column temperature and carrier gas flow rates, were assessed to determine
which conditions will result in the best selectivity and sensitivity of the compounds of
interest.
Task 2: Optimization of the SPME Extraction Method
Once the GC-MS method was developed and optimized, the second phase of this
study was to develop and optimize the extraction method. Extraction temperature,
extraction time and equilibration time were assessed to determine which conditions will
result in the best recovery of human VOCs. Upon completion of this task, the results were
assessed using ANOVA.
Task 3: Optimization of Sampling Method
For the three sample types - hand odor, saliva and breath - the time required for
sampling was optimized. The sampling time that gives the best recovery will be chosen as

48
the optimal sampling time. Upon completion of this task, the results were assessed using
ANOVA.
Task 4: Comparison of Scent Collected from Healthy and Epileptic Individuals
Using the sampling, extraction and analysis methods determined in the previous
tasks, samples will be collected from healthy and epileptic individuals, and subsequently
analyzed using SPME-GC-MS. Upon completion of this task, the results were assessed
using Principal Component Analysis.
Task 5: Comparison of Scent Collected from Epileptic Individuals with and without
Seizure Activity
Using the sampling, extraction and analysis methods determined in the previous tasks,
samples will be collected from epileptic individuals immediately following a seizure, and
in the absence of seizure activity, and subsequently analyzed using SPME-GC-MS.
1.8. Theory of Instrumental Techniques
1.8.1. Solid Phase Microextraction-Gas Chromatography-Mass
Spectrometry
Solid phase microextraction (SPME) coupled with gas chromatography-mass
spectrometry (GC-MS) has been widely employed since the early 1990s for the analysis of
live human scent volatiles. Compounds are extracted from the sample using SPME and
analyzed with GC-MS, which is a combination of two well established analytical

49
techniques. Separation of compounds in complex mixtures is performed by the gas
chromatograph, and structural identification of these compounds is provided by the mass
spectrometer.
1.8.2. Headspace Solid Phase Microextraction
Solid phase microextraction was invented in 1989 by Janus Pawliszyn as a solvent-
free alternative for sample preparation69. The device has a very simple configuration like
that of a syringe (Figure 1). It uses a fine bare fused silica fiber or a fine silica fiber that
has been coated with a thin layer of a selective polymer coating to extract organic
compounds70. The SPME fiber is attached to a stainless-steel needle and encased by a metal
sheath for protection. The assembly is housed in a SPME holder, which consists of a barrel,
a spring-loaded plunger, and an adjustable depth gauge. The fiber is exposed from the metal
sheath by pushing the plunger down and turning to lock it in place. Since its invention,
SPME methods have been developed and used for various applications, as the technique
holds numerous advantages. It requires very little sample. As it is does not require the use
of a solvent, it is cost efficient and environmentally friendly. It is field portable, providing
a simple and convenient method for on-site sampling. Additionally, because of its syringe-
like shape, it is easily accommodated in a gas chromatograph (GC) injector, where
extracted compounds are thermally desorbed69.
The fiber coating, a polymer, can be solid or liquid, and varies by polarity and
thickness. The choice of fiber type depends on the properties of the analytes of interest. For
example, polar compounds have a higher affinity to polar coatings, while nonpolar

50
compounds have a higher affinity to non-polar coatings. Therefore, choosing the correct
fiber type is crucial in any analysis using SPME as the extraction method.
Extraction can be performed in three modes. The fiber can be immersed directly
into a liquid sample, immersed into a liquid sample but separated from the sample with a
selective membrane, or exposed to the headspace of an equilibrated sample71. In the present
study, headspace extraction was utilized. Headspace SPME is a static headspace extraction.
Once the sample is sealed in the vial, the volatile components of the sample partition
between the sample and the headspace. Eventually, the relative concentrations of the
analyte of interest between the sample and the headspace will reach a thermodynamically
controlled equilibrium. According to Henry’s Law, in a sealed vessel at equilibrium, the
concentration of volatile compounds in the headspace phase will be proportional to the
concentration of those compounds in the liquid phase. However, when considering
headspace SPME, one must consider a three-phase system in which the polymer coating,
the headspace, and the solid or liquid sample are in equilibrium70. The equilibrium
condition can be described with the following equation,
𝑛 =𝐾 𝑉 𝑉𝐶
𝐾 𝑉 + 𝐾 𝑉 + 𝑉
where nf is the amount of analyte extracted by the fiber coating, Kfs is the fiber coating-
sample matrix distribution constant, Vf is the fiber-coating volume, KhsVh is the analyte
capacity of the headspace, Vs is the sample volume, and C0 is the initial concentration of a
given analyte in the sample matrix. When equilibrium is reached, the analyte concentration
is directly proportional to the amount extracted.

51
Figure 8 SPME fiber
1.8.3. Gas Chromatography
Gas chromatography was first introduced in 1952 by Archer John Porter Martin
and Anthony T. James72. It is an analytical technique used to separate and analyze
compounds that are volatile and thermally stable. The major component of a gas
chromatograph is the column, which is a long capillary tube coated with a stationary phase
on the inner wall. A carrier gas, the mobile phase, flows through the column, carrying the
components of the sample mixture. The basic operation of a gas chromatograph starts the
vaporization of the sample introduced at the heated injection port. This is followed by the
separation of the analytes in the sample through selective distribution between the mobile
phase and the stationary phases as the vaporized sample is transported through the column.
Finally, the separated analytes elute from the column and are detected by the detector.

52
Common mobile phases in GC include hydrogen, helium and nitrogen. The stationary
phase is a high molecular weight, thermally stable polymer that is coated on the interior
surface of the column. The separation of compounds is based on different affinities to the
stationary phase. Differential partitioning occurs between the stationary phase and the
mobile phase and can be described mathematically by the equation73,
𝐾 =[𝐶 ]
[𝐶 ]
where Kc, the partition coefficient, is the tendency of the analyte to be adsorbed or absorbed
into the stationary phase. Cs and Cm represent the concentrations of the analyte in the
stationary and mobile phases, respectively. The stationary phase is a high molecular
weight, thermally stable polymer that is coated on the interior surface of the column. Once
the sample molecules enter the column, they distribute between the two phases. As they
travel through the column, they have interactions with the stationary phase based on
polarity and molecule size. As a result, all of the molecules corresponding to a specific
compound travel through the column at nearly the same rate as a band of molecules.
Ideally, different bands exit the column at different times, leading different, unambiguous
retention times.

53
Figure 9 Schematic of gas chromatograph74
1.8.4. Mass Spectrometry
Mass spectrometry is an analytical technique that ionizes gaseous molecules and
separates the ions based on their mass-to-charge ratios. A mass spectrometer consists of
four components – a sample inlet, an ion source, a mass analyzer, and a detector. In GC-
MS, the GC column serves as the sample inlet.
The first step in mass spectrometry is the ion production of the gas-phase ions,
which yields the molecular ion. The molecular ion obtained depends on the ionization
technique. There are a variety of ion sources used in mass spectrometry, and the selection
of a particular technique depends on the internal energy transferred during the ionization
process and the physico-chemical properties of analyte of interest. Hard techniques use
more energy than is required for ionization and cause extensive fragmentation, while soft
ionization techniques produce only ions of the molecular species. Some techniques are
suitable only for ionization of gas-phase molecules and are limited to compounds that are
volatile and thermally stable, while others are suitable for thermally labile compounds that

54
do not have sufficient vapor pressure to exist in the gas phase. In GC-MS, the molecules
are already in the gas phase, so the former techniques would be used75.
Electron ionization, chemical ionization and field ionization are gas phase
ionization techniques. Electron ionization is one of the most commonly used ionization
techniques in mass spectrometry. It is a hard ionization method, in which a high-energy
beam of electrons collides with gaseous molecules of the analyte(s) of interest, producing
a molecular ion.
M + e- →M˙+
The source consists of a heated filament that produces electrons, which are accelerated
towards and anode. Each electron is associated with a wave whose wavelength is given by
the equation,
𝜆 =
where m is the mass of the electron, v is its velocity, and h is Planck’s constant. An energy
corresponding to a transition in the molecule results in an energy transfer that leads to
electronic excitation. With enough energy, an electron is expelled, producing a molecular
ion.
The number of ions produced, at a constant pressure, is directly related to the kinetic
energy of the electrons. If the kinetic energy is lower than the ionization energy of the
molecule, ionization will not occur. If the energy is too high, the wavelength becomes very
small and molecules become ‘transparent’ to the electrons. For organic molecules, 70 eV
provides a wide maximum75. Curves of ionization cross section of CH4, the simplest
organic compound, vs. electron energy all exhibit a maximum at electron energies around
70 eV. In fact, all atoms or molecules can be ionized at 70 eV76. However, only 10 eV is

55
required to ionize most organic molecules, and the excess energy leads to extensive
fragmentation. Because of this, the molecular ion is not always observed, but molecules
will fragment in predictable patterns, and the fragmentation pattern can give information
about the molecular ion’s structure and identity75.
Once the gas-phase ions are produced, they are accelerated by an electric field into
a mass analyzer, where they are separated according to their mass-to-charge (m/z) ratios.
Just as there are several types of ion sources, there are also several types of mass analyzers.
However, All mass analyzers use static or dynamic electric and magnetic fields, the
difference being the way these fields are used to achieved separation75.
Mass analyzers can be divided in to two classes. Scanning analyzers transit the
ions of different masses successively along a time scale75. An example of this is the
quadrupole. The quadrupole most commonly used mass analyzer. It is more compact, more
rugged, and less expensive than most other analyzers, and has low scan times73. Ions are
separated, according to their m/z ratios, based the stability of trajectories in oscillating
electric fields. These mass analyzers are made up of four parallel cylindrical73 or
hyperbolic75 rods that serve as electrodes. The rods are connected to a variable dc source,
with one pair attached to the positive side and the other pair attached to the negative
terminal. Also, each pair of rods experiences variable radio frequency ac potentials, which
are 180 degrees out of phase. Ions are accelerated into the space between the rods, and as
this happens, the ac and dc voltages are increased simultaneously while maintaining a
constant ratio. At any particular time, only ions of a certain m/z value pass through the
space between the rods to the detector, while all others strike the rods and are converted to
neutral molecules75.

56
Figure 10 Schematic of a quadrupole mass analyzer77
An ion trap mass analyzer is also one of the more commonly used mass analyzers.
Like the quadrupole, it is compact a rugged, but it is less costly73. This mass analyzer uses
an electric field to store ions. It consists of a doughnut-shaped ring electrode between a
pair of ellipsoid end-cap electrodes. After ionization, a burst of gas-phase ions is admitted
through a grid in the upper end cap. A variable radio frequency voltage is applied to the
ring electrode, while the end-cap electrodes remain grounded. Ions of different masses are
trapped within the cavity surrounded by the ring. As the radio frequency voltage is
adjusted, ions of a certain mass are expelled from the cavity through openings in the lower
end cap. Once expelled, the ions travel to the detector. The radio frequency voltage is
adjusted over a certain range to measure all masses within the range of interest75.

57
Figure 11 Schematic of an ion trap mass analyzer78
Once ions pass through the mass analyzer, they are then transformed into a signal
by the detector, which generates an electrical current that is proportional to the abundance
of the ions. There are two different types of detector. Point ion collectors count ions one
mass at a time, while array collectors have the ability to count multiple masses and detect
ions simultaneously along a plane75.
The most commonly used detector in mass spectrometry is the electron multiplier
(EM). The number of ions leaving a mass analyzer at a particular time is very small, so
amplification is required. With the electron multiplier, this is done through a process called
secondary emission. Ions from the mass analyzer are accelerated to a high velocity by
holding an electrode called a conversion dynode at a high potential, opposite to the charge
of the ions. For positive ions, the potential can range from -3 to -30kV. When the ions
strike the conversion dynode, several secondary particles are emitted. If the ions are
positive, these secondary particles are negative ions and electrons. The secondary particles
then strike the first dynode, where they are converted to electrons. These electrons then

58
strike a series of dynodes, each time resulting in the emission of several secondary
electrons. This way, the signal from each ion is amplified by a cascade effect to produce a
current75.
There are two types of EM detector – discrete dynode and continuous dynode.
Discrete dynode EM’s are made up of series of 12 to 20 dynodes, with a chain of resistors
holding them at negative potentials. Secondary particles from the from the conversion
dynode strike the first dynode, which is held at a high negative potential. Because the
second dynode because it is held at a lower potential, secondary electrons emitted from the
first dynode are accelerated to the second dynode. They strike this dynode, causing the
emission of more secondary electrons. Electrons continue to strike dynodes as they travel
toward the ground potential, and a cascade of electrons is created. This creates an electrical
current at the end of the EM when the electrons reach an output electrode. This current is
then amplified by conventional electronic amplification. Continuous dynode EM’s are
made from lead-doped glass with a curved shape. The walls of the tube have uniform
electric resistance, and voltage applied between the two ends produces a continuous
accelerating field along the length. Secondary particles produced by ion collisions at the
conversion dynode strike the curved inner wall at the entrance, producing secondary
electrons. As the electrons are accelerated towards the end of the tube, they continuously
strike the wall, causing the emission of more electrons, creating a cascade of electrons
which is collected by a metal anode at the exit75.

59
Figure 12 Schematics of electron multipliers. (a) Discrete dynode (b) Continuous dynode79

60
2. METHOD DEVELOPMENT
A 50-ppm mixture containing 14 VOCs that have been previously reported in human
scent was prepared (Table 1). All compounds were selected on the basis of findings from
peer reviewed publications.
Table 1 Human scent compounds used to prepare the 50-ppm mixture VOCs
2.1. GC-MS Method Development
The GC-MS instrument used for analysis was the Varian GC CP-3800 coupled to
a Saturn 2000 Ion Trap Mass Spectrometer; operated in electron ionization mode (Walnut
Creek, CA, USA). The first task of this project was development of the GC-MS method.
Hexanal2-Pentylfuran6-Methyl-5-hepten-2-oneOctanoic acid, methyl ester1-Octen-3-olBenzaldehyde1-OctanolHexadecane2-Furanmethanol6,10-Dimethyl-5,9-undecadien-2-oneBenzyl Alcohol2-Ethyl-hexanoic acidOctanoic AcidDodecanoic acid

61
2.1.1. Method
The 50-ppm VOC was analyzed using 3 different columns of varying polarity to
determine which column provides the best selectivity. The columns in order of increasing
polarity are the DB-5, DB-225, and SolGel-Wax columns. With each column, the
temperature ramp was adjusted to achieve the best possible separation.
DB-5
The phase composition of the DB-5 column is 5% phenyl and 95%
dimethylpolysiloxane. It is classified by Agilent as a non-polar column. However, the
phenyl group has a weak dipole, so the 5% phenyl provides the phase with little polarity.
This phase could be classified as low polarity. Applications for the DB-5 are semi-volatiles,
alkaloids, drugs, fatty acid methyl esters, halogenated compounds, pesticides and
herbicides
.
Figure 13 Stationary phase for the DB-5 column

62
DB-225
The phase composition of the DB-225 column is 50% cyanopropylphenyl and 50%
dimethylpolysiloxane. The cyanopropyl group has a very strong dipole while the phenyl
group has a weak dipole. With 50% dimethylpolysiloxane, this column is classified as
medium to high polar. Its applications are cis/trans fatty acid methyl esters, alditol acetates
and neutral sterols.
Figure 14 Stationary phase for DB-225 column
SolGel-Wax
The stationary phase on the SolGel-Wax column is polyethylene glycol in a sol-gel
matrix. Polyethylene glycol has a strong dipole, making this a polar column. Its
applications are alcohols, free acids, fatty acid methyl esters (FAMEs), aromatics, solvents
and essential oils.
Figure 15 Stationary phase for SolGel-WAX column

63
2.1.2. Results
DB-5 Column
Figure 16 Chromatogram of the 50-ppm human scent VOC mixture obtained using the DB-5 column
The DB-5 column demonstrated bad separation and co-elution, as only 9 of the 14
compounds in the mixture were detected. Obtaining better separation for this column would
have resulted in run times greater than one hour.

64
BD-225 Column
Figure 17 Chromatogram of the 50-ppm human scent VOC mixture obtained using the DB-225 column.
The DB-225 column provided better separation than the DB-5 column, with a more
complicated temperature program. One of the compounds in the mixture, 2-furanmethanol,
was not detection, indicating that some co-elution had occurred.

65
SolGel-Wax Column
Figure 18 Chromatogram of the 50-ppm human scent VOC mixture obtained using the SolGel-WAX column.
The SolGel-Wax column allowed for separation and detection of all the compounds
in the mixture. In addition, this was achieved using a shorter run time than the other
columns. The SolGel-Wax column was selected for use in this study.
2.2. Determination of best extraction conditions
The SPME fiber used for this study is the
Carboxen/divinylbenzene/polydimethylsiloxane (CAR/DVB/PDMS). The second subtask
was to develop and optimize the extraction method. This consisted of two subtasks: the
optimization of extraction temperature and the optimization of extraction time.

66
2.2.1. Determination of optimal extraction temperature
Method
To determine the optimal extraction temperature, cotton gauze pads were spiked
with the 50-ppm VOC mixture and sealed in 10-mL glass vials. The vials were then placed
in a heating block and allowed to equilibrate at different temperatures for 30 minutes. The
SPME fiber was then exposed to the headspace above the cotton gauze at the equilibrating
temperature for 30 minutes. The temperatures used for this task were 25.5 ℃, 37 ℃, 50
℃, 60 ℃, and 80 ℃. The extracted VOCs were then analyzed by GC-MS using the SolGel-
Wax column and the temperature program determined in the first task. Each temperature
was evaluated in triplicate.

67
Results
Figure 19 Comparison of the temperatures used for extraction of human scent compounds.
The optimal extraction temperature was determined to be 50 ℃. This temperature
provided the best combination of sensitivity and repeatability. The lower temperatures
extracted a smaller amount of each compound. The higher temperatures extracted a larger
amount of the high molecular weight, high boiling compounds, but a smaller amount of the
low molecular weight, low boiling compounds. Also, as the temperatures increased, the
size of the error bars increased. This means that there is greater variation between samples
as extraction temperature is increased.
-100000000
0
100000000
200000000
300000000
25.5 °C 37 °C 50 °C 60 °C 80 °C
Peak
are
a
Temperature
Extraction Temperature Study
Hexanal 2-Pentylfuran
6-Methyl-5-hepten-2-one Octanoic Acid, Methyl Ester
1-Octen-3-ol Benzaldehyde
1-Octanol Hexadecane
2-Furanmethanol 6,10-Dimethyl-5,9-undecadien-2-one
6,10-Dimethyl-5,9-undecadien-2-one Benzyl Alcohol
2-Ethylhexanoic Acid Octanoic Acid
Dodecanoic Acid

68
2.2.2. Determination of optimal extraction time
Method
Once the optimum extraction temperature was determined, the amount of time
needed to extract the volatiles was examined. Cotton gauze pads were spiked with the 50-
ppm VOC mixture and sealed in glass vials. The vials were then placed in a heating block
and allowed to equilibrate for 30 minutes at 50 ℃. The fiber was then exposed to the
headspace above the cotton gauze at 50 ℃ for different times. The time used for this task
were 1 hr., 2hrs, 4 hrs., 8 hrs., 16 hrs. and 24 hrs. The extracted VOCs were then analyzed
by GC-MS using the SolGel-Wax column and the temperature program determined in the
first task. Each time was evaluated in triplicate.

69
Results
Figure 20 Comparison of the times used for extraction of human scent compounds.
The optimal extraction time was determined to be 2 hours. Apart from hexadecane,
which is the largest bar at every temperature, there is no significant improvement after 2
hours. The extraction time of 2 hours resulted in a better recovery than 1 hour for 7 of the
12 compounds detected. Also, the sizes of the error bars increase with increasing extraction
time, indicating that there is greater variation between samples as extraction time is
increased.
0
500000
1000000
1500000
2000000
2500000
3000000
1 Hr 2 Hr 4 Hr 8 Hr 16 Hr 24 Hr
Peak
Are
a
Extraction Time
Extraction Time Study
Hexanal 2-Pentylfuran
6-Methyl-5-hepten-2-one Octanoic acid, methyl ester
1-Octen-3-ol Benzaldehyde
1-Octanol Hexadecane
2-Furanmethanol 6,10-Dimethyl-5,9-undecadien-2-one
6,10-Dimethyl-5,9-undecadien-2-one Benzyl Alcohol
2-Ethyl-hexanoic acid

70
3. COMPARISON OF SCENT COLLECTED FROM HEALTHY AND
EPILEPTIC INDIVIDUALS
Hand odor, saliva and breath samples were obtained from healthy and epileptic
individuals. Healthy individuals were sampled in the laboratory. Epileptic individuals were
sampled in the laboratory or in their homes.
3.1. Materials
DUKAL brand, 100% cotton, sterile, 2 X 2, 8 ply, gauze pads (DUKAL
Corporation, (Syosset, NY, USA) were used to collect hand odor and breath samples.
Sterile cotton-tipped applicators (Solon Manufacturing Co., Skowhegan, ME, USA) were
used to collect saliva. Ten-ml glass, clear, screw top headspace vials with PTFE/Silicone
septa (SUPELCO, Bellefonte, PA, USA) were used to hold the samples.
Divinylbenzene/Carboxen/Polydimethylsiloxane (DVB/CAR/PDMS) SPME fibers (50/30
m film thickness) and SPME fiber holders (SUPELCO, Bellefonte, PA, USA) were used
for the extraction of VOCs from the samples. HPLC grade methanol (Fisher Scientific,
Pittsburgh, PA, USA) was used for the pretreatment of gauze pads and cotton-tipped
applicators.
3.2. Hand Odor
3.2.1. Methods
Prior to sample collection, DUKAL gauze pads were pretreated to eliminate any
background compounds. the gauze pads were spiked with 1000 L of HPLC-grade
methanol and baked at 105°C for one hour in an Isotemp Oven, Model 655G (Fisher

71
Scientific, Pittsburgh, PA, USA). Pretreated gauze pads were analyzed to ensure analytical
cleanliness by SPME-GC-MS. Chromatograms of cotton gauze, pre-and post-cleaning
treatment, are shown in Figure 21.
Figure 21 Comparison of untreated and pre-treated cotton gauze
The hand odor sampling protocol for initial sampling is as follows: 30 seconds
washing of the hands with an unscented soap, two minutes of rinsing the washed areas with
water, and two minutes of air drying. Subjects were given a pre-treated sterile gauze pad

72
to hold between the palms of their hands for ten minutes. The gauze pad was re-sealed back
into the 10-ml glass headspace vial and stored until analysis.
Sample vials were paced in a heating block set to 50 ℃ and allowed to equilibrate
for 1 hour. The fiber was then exposed to the headspace above the cotton gauze at 50 ℃
for 2 hours. The extracted VOCs were then analyzed by GC-MS using the SolGel-Wax
column and the temperature program determined in the first task.
3.2.2. Results
Eighty-five VOCs (Table 2) were extracted from hand odor samples from healthy
and epileptic individuals. Across samples collected from epileptic patients, 72 VOCs were
extracted. These extracted VOCs include alcohols (25.0%), aldehydes (20.8%), esters
(16.7%), ketones (12.5%), aliphatic (11.1%) and aromatic (4.1%) hydrocarbons,
halogenated hydrocarbons (2.8%), ethers (2.8%), acids (1.4%), furans (1.4%) and azines
(1.4%) as shown in Figure 22. The most abundant compound was menthol, as it was
observed in 100% of the samples from epileptic patients and 63.6% of samples from
healthy individuals of the VOCs that were not observed in samples from healthy
individuals, 2-cyclopentene-1,4-dione, 2,6-dimethyl-7-octen-2-ol and 2,4,6-trimethyl-
1,3,5-Triazine all shared the distinction of being the most abundant, being observed in
45.5% of samples from epileptic patients.

73
Table 2 Frequency of occurrence of all VOCs found in the headspace of hand odor samples
Compound Frequency of Occurrence in
Epileptic Patients
Frequency of Occurrence in
Healthy Individuals Menthol 100.00% 63.64%
1-Hexanol, 2-ethyl- 72.73% 54.55% Nonanal 63.64% 63.64%
1,6-Octadien-3-ol, 3,7-dimethyl- 63.64% 72.73% Decanal 63.64% 36.36%
2-Furanmethanol 54.55% 54.55% Octanal 54.55% 36.36%
Benzaldehyde 54.55% 18.18% Butylated Hydroxytoluene 54.55% 27.27%
Chloroform 45.45% 45.45% 2-Cyclopentene-1,4-dione 45.45% 0.00%
7-Octen-2-ol, 2,6-dimethyl- 45.45% 0.00% 1,3,5-Triazine, 2,4,6-trimethyl- 45.45% 0.00%
Undecane 45.45% 54.55% 1-Dodecanol 36.36% 0.00%
Dodecanoic acid, methyl ester 36.36% 36.36% Octanoic acid, methyl ester 36.36% 9.09%
Benzyl Alcohol 36.36% 9.09% Nonanoic acid, methyl ester 36.36% 27.27%
Lilial 27.27% 0.00% 2,6-Bis(1,1-dimethylethyl)-4-(1-
oxopropyl)phenol 27.27% 45.45%
Limonene 27.27% 0.00% Furan, 2-pentyl- 27.27% 9.09%
Heptanal 27.27% 9.09% Toluene 27.27% 18.18%
1-Octanol 27.27% 63.64% Tetradecane 27.27% 27.27%
Cyclohexanol, 2-(1,1-dimethylethyl)-
18.18% 0.00%
.alpha. Isomethyl ionone 18.18% 0.00% 2-Nonenal, (E)- 18.18% 0.00%
Hexanal 18.18% 0.00% 2-Octanol, 2-methyl-6-methylene 18.18% 0.00%

74
Undecanoic acid, 10-methyl-, methyl ester
18.18% 0.00%
Methyl Z-11-tetradecenoate 18.18% 0.00% Diethyl Phthalate 18.18% 0.00%
Octanal, 2-(phenylmethylene)- 18.18% 9.09% Furfural 18.18% 54.55%
Acetic Acid, phenylmethyl ester 18.18% 0.00% Naphthalene 18.18% 9.09%
5-Hepten-2-one, 6-methyl- 18.18% 63.64% Dodecane 18.18% 18.18%
Cyclohexanone, 5-methyl-2-(1-methylethyl)-
18.18% 9.09%
3-Heptene, 2,2,4,6,6-pentamethyl-
9.09% 0.00%
2-Pentene, 1-bromo-3,4-dimethyl-
9.09% 0.00%
Octadecane, 3-ethyl-5-(2-ethylbutyl)-
9.09% 0.00%
3-Octanol, 3,7-dimethyl- 9.09% 0.00% Benzene, 1,3-bis(1,1-
dimethylethyl)- 9.09% 0.00%
1,3,6-Octatriene, 3,7-dimethyl-, Z)-
9.09% 0.00%
1-Octanol, 3,7-dimethyl- 9.09% 0.00% l-Menthol 9.09% 0.00%
1-Undecene, 5-methyl- 9.09% 0.00% 6-Octen-1-ol, 3,7-dimethyl-,
formate 9.09% 0.00%
Oxirane, tetradecyl- 9.09% 0.00% 3-Cyclohexene-1-methanol, .alpha.,.alpha.,4-trimethyl-,
propanoate 9.09% 0.00%
Estragole 9.09% 0.00% 3-Penten-2-one, 4-(2,6,6-
trimethyl-2-cyclohexen-1-yl)- 9.09% 0.00%
3,5-di-tert-Butyl-4-hydroxybenzaldehyde
9.09% 0.00%
Isopropyl Myristate 9.09% 0.00% 2-Octyl benzoate 9.09% 0.00%
Phenylethyl Alcohol 9.09% 0.00% Diphenyl ether 9.09% 0.00%

75
1-(4-tert-Butylphenyl)propan-2-one
9.09% 0.00%
Benzeneethanal, 4-[1,1-dimethylethyl]-.alpha.-methyl-
9.09% 0.00%
2-Pyridinecarboxaldehyde 9.09% 0.00% .+/-.-.alpha.-Methylbenzyl
acetate 9.09% 9.09%
Tetradecanal 9.09% 9.09% 2-Cyclopenten-1-one 9.09% 27.27%
Octanoic Acid 9.09% 18.18% Benzaldehyde, 2-hydroxy- 9.09% 9.09%
5,9-Undecadien-2-one, 6,10-dimethyl-, (E)-
9.09% 45.45%
2(5H)-Furanone 9.09% 0.00% Phenol 9.09% 9.09%
Nonanol 9.09% 45.45% 4-Cyanocyclohexene 0.00% 9.09%
1-Cyclohexene-1-carboxaldehyde, 2,6,6-trimethyl-
0.00% 9.09%
Benzene, (1-ethyloctyl)- 0.00% 9.09% Hexanoic Acid 0.00% 9.09%
Benzene, (1-pentylhexyl)- 0.00% 9.09% 1H-Pyrrole-2-carboxaldehyde 0.00% 9.09%
n-Decanoic acid 0.00% 9.09% Decane, 2,4,6-trimethyl- 0.00% 9.09%
Tetradecane, 2,6,10-trimethyl- 0.00% 9.09% Nonane, 4,5-dimethyl- 0.00% 9.09% 2,4-Pentadienenitrile 0.00% 9.09%
6-Octen-1-ol, 3,7-dimethyl-, (R)- 0.00% 18.18% Nonanoic acid 0.00% 36.36%

76
Figure 22 Frequency distribution of functional groups of VOCs extracted from hand odor of epileptic patients
Figure 23 shows a comparison of VOC profiles from the hand odor of epileptic
patients and healthy individuals. These profiles show no patterns or similarities between
epileptic patient profiles that can be used to differentiate them healthy profiles. A PCA
scatter-plot of hand odor from epileptic patients and healthy individuals (Figure 24) shows
that these hand odor profiles cannot be used to differentiate epileptic patients from healthy
individuals. Nine of the healthy individuals form a cluster that also includes five epileptic
patients. These five patients all experienced simple partial seizures, indicating that there
may be a larger difference between the hand odor VOC profiles of individuals with
different types of epilepsy than there is between the profiles of individuals with and without
the disorder.

77
However, of the eighty-five VOCs extracted from hand odor samples, six were present in
the hand odor of three or more epileptic individuals, but not in in the hand odor of any
healthy individuals (Table 3). No compound was found to be present in samples from all
eleven patients participating in this study.
Figure 23 Comparison of VOC profiles from the hand odor of healthy and epileptic individuals

78
Figure 24 A PCA scatterplot of hand odor from epileptic patients and healthy individuals
Table 3 Compounds found in the hand odor of epileptic patients
Compounds founds only in the hand odor of epileptic patients
2-Cyclopentene-1,4-dione 1-Dodecanol
2,4,6-Trimethyl-1,3,5-triazine Lilial
2,6-Dimethyl-7-octen-2-ol Limonene

79
3.2.3. Discussion
2-Cyclopentene-1,4-dione
2-Cyclopentene-1,4-dione occurs in the plant, Solanum nigrum80 or black
nightshade, which is used to treat asthma and whooping cough81. It has also been reported
in Tualang honey82, a type of honey collected from wild honey bees’ hives on Tualang
trees found in the rain forest of Malaysia, which has shown the ability to kill leukemia cell
lines83. The presence of this compound is most likely a result of diet.
1-Dodecanol
1-Dodecanol is a fatty alcohol that can be obtained from palm kernel or coconut oil
fatty acids84. It is essentially non-toxic to mammals, and is used as a food-additive in the
U.S. and the EU, in non-alcoholic beverages, ice cream, candy, baked goods, chewing gum
and syrups. As a result, exposure to 1-Dodecanol via foods is common. However, it is also
used in the production of soaps, detergents, lotions, creams and perfumes, and the presence
of this VOC in hand odor are most likely a result of exposure to these sources.
Evidence suggests that the behavioral effects of alcohols are a result of interactions
with NMDA and GABA receptor channels. In 1999, Peoples and Weight investigated the
effect of n-alcohols on NDMA and GABAA channels in mouse hippocampal neurons. They
found that n-alcohols from ethanol to dodecanol enhanced GABA receptor function and
inhibited NMDA receptor function. Alcohols smaller than pentanol affected NMDA
receptors more than GABAA receptors, while alcohols larger than pentanol affected
GABAA receptors more than NMDA receptors. Alcohols larger than dodecanol had no
effect85.

80
2,4,6-Trimethyl-1,3,5-triazine
Some triazine derivatives have been shown to influence nicotinic receptors86. The
anti-convulsant drug lamotrigine is a phenyltriazine derivative. It blocks sodium channels,
and neuronal nicotinic acetylcholine receptors87. Four of the patients participating in this
study had been prescribed lamotrigine medications, such as Lamictal. Of these individuals,
three had 2,4,6-Trimethyl-1,3,5-triazine in their hand odor profiles.
Lilial
Lilial is a synthetic aromatic aldehyde, mostly used as a perfume in soaps and
cosmetic preparations88. It is colorless to slightly yellow liquid with a mild, floral odor,
similar to cyclamen or lily of the valley. It is produced as a racemic mixture, with the (R)-
enantiomer manly responsible for the flowery odor, while the (S)-enantiomer has no strong
odor88,89. The presence of this compound is most likely a result of consumer exposure.
2,6-Dimethyl-7-octen-2-ol
2,6-Dimethyl-7-octen-2-ol (Dihydromyrcenol) is used in cosmetics, fragrances,
shampoos, toilet soaps, household cleaners and detergents90. It is a monoterpenoid which
can be found in white Portuguese wine grapes, and has been shown to have
hepatoprotective properties91,92. The presence of this compound is also most likely the
result of consumer exposure.

81
Limonene
Limonene is a monocyclic monoterpene which is commonly found in citrus fruit.
It has a citrus odor, and is used as a flavor and fragrance additive in perfumes, soaps, foods,
chewing gum, and beverages93. Limonene and its metabolites exhibit chemopreventive and
chemotherapeutic properties against different tumors. Also it is one of the major
components of essential oils from plants with anti-inflammatory properties, and is believed
to contribute to these activities94.
Terpenes are natural products made up of isoprene units. They occur everywhere
and in all organisms, especially in higher plants, and are found in animals mainly as a result
of plant consumption95. Terpenes have many medicinal uses. They act as diuretics and help
in relieving gastrointestinal spasms, they are added to creams and ointments to relieve pain
and itching, and they also possess antimicrobial properties, helping to fight microorganisms
that are resistant to antibiotics. However, one of the adverse effects of terpene exposure is
seizures96. As a terpene, limonene’s presence is most likely a result of exogenous exposure.
3.3. Oral Fluid (Saliva)
3.3.1. Methods
Sterile cotton-tipped applicators were pre-treated prior to sample collection to
eliminate any background compounds. They were spiked with 500 L of HPLC-grade
methanol, then baked in a 105°C Isotemp Oven for one hour. Pre-treated swabs were
analyzed to ensure analytical cleanliness using SPME-GC-MS. Chromatograms of sterile
cotton-tipped applicators, pre-and post-cleaning treatment, are shown in Figure 25.

82
Figure 25 Comparison of untreated and pre-treated cotton-tipped applicators
Oral fluid sampling protocol for initial sampling is as follows: Each subject was
asked to rinse their mouths with water for 30 seconds to saliva sampling. Cotton-tipped
applicators were rubbed up and down on the inside of both cheeks for one minute (30
seconds per cheek). Swabs were resealed back into the ten-ml glass headspace vial.
Sample vials were paced in a heating block set to 50 ℃ and allowed to equilibrate
for 1 hour. The fiber was then exposed to the headspace above the cotton gauze at 50 ℃

83
for 2 hours. The extracted VOCs were then analyzed by GC-MS using the SolGel-Wax
column and the temperature program determined in the first task.
3.3.2. Results
Eighty-two VOCs were extracted from headspace of saliva samples from healthy
and epileptic individuals (Table 4). Across samples collected from epileptic patients, 71
VOCs were extracted. The 71 VOCs include ketones (25.7%), alcohols (17.1%), aldehydes
(15.7%), esters (14.3%), acids (10.0%), aliphatic (5.7%) and aromatic (2.9%)
hydrocarbons, ethers (2.9%), amines (2.9%), furans (1.4%) and halogenated hydrocarbons
(1.4%), as shown in Figure 26. The most abundant VOC was 2-pentylfuran, showing up in
90.9% of samples from epileptic patients and healthy individuals. Propanoic acid was the
most abundant compound extracted from samples from epileptic patients only, being
observed in 63.6% of these samples. It was only compound to be extracted in more than
50% of saliva samples from epileptic patients without being observed in any samples from
healthy individuals.

84
Table 4 Frequency of occurrence of all VOCs found in the headspace of saliva samples
Compound Frequency of Occurrence in
Epileptic Patients
Frequency of Occurrence in
Healthy Individuals 2-Pentylfuran 90.91% 90.91%
Octanoic acid, methyl ester 90.91% 90.91% 2(3H)-Furanone, 5-
ethenyldihydro-5-methyl- 90.91% 72.73%
Benzaldehyde 81.82% 63.64% Hexanoic acid, methyl ester 72.73% 63.64%
Hexanoic acid 72.73% 72.73% Nonanoic acid, methyl ester 72.73% 18.18% Heptanoic acid, methyl ester 63.64% 18.18%
Hexanal 63.64% 54.55% Propanoic acid 63.64% 0.00%
Nonanal 54.55% 54.55% 1-Hexanol, 2-ethyl- 54.55% 54.55%
2(3H)-Furanone, 5-ethyldihydro- 54.55% 54.55% Pentanoic acid 54.55% 18.18% Octanoic Acid 45.45% 27.27%
Hexadecanoic acid, methyl ester 45.45% 27.27% 2-Cyclopenten-1-one, 3,4,5-
trimethyl- 45.45% 18.18%
2(3H)-Furanone, 5-hexyldihydro- 45.45% 0.00% Naphthalene 45.45% 9.09%
Heptanal 45.45% 9.09% Furfural 45.45% 54.55%
2-Octenal, 2-butyl- 45.45% 9.09% Menthol 36.36% 0.00%
2(3H)-Furanone, 5-heptyldihydro-
36.36% 9.09%
Octane, 3-chloro 36.36% 9.09% 3,5-Octadien-2-ol 36.36% 18.18%
5-Ethylcyclopent-1-enecarboxaldhyde
36.36% 9.09%
Pilocarpine 36.36% 0.00% cis-1-
Hydroxybicyclo[4.4.0]decane 36.36% 9.09%
6-Methyl-3,5-heptadiene-2-one 36.36% 9.09%

85
Heptanoic acid 36.36% 9.09% Benzyl Alcohol 36.36% 18.18%
Octadecanal 36.36% 9.09% cis-1-
Hydroxybicyclo[4.4.0]decane 27.27% 9.09%
1-Allyl-cyclopropanecarboxylic acid, 2,6-di-t-butyl-4-methyl-
phenyl ester 27.27% 9.09%
1-Octen-3-ol 27.27% 0.00% 3-Nonen-2-one 27.27% 0.00%
2,6-Bis-(1,1-dimethylethyl)-4-(1-oxopropyl)phenol
27.27% 9.09%
Decanal 27.27% 9.09% 1-Octanol 27.27% 27.27%
1H-Indene, 2,3-dihydro-1,1,3-trimethyl-3-phenyl-
27.27% 27.27%
m-Toluic acid, 2-bromo-4-fluorophenyl ester
18.18% 0.00%
2,4-Decadienal 18.18% 0.00% Hexanethioic acid, S-decyl ester 18.18% 27.27%
Tridecanoic acid, 12-methyl-, methyl ester
18.18% 9.09%
Methane, oxybis[dichloro- 18.18% 0.00% Butanoic acid 18.18% 0.00% Caryophyllene 18.18% 9.09%
Hexanoic acid, 2-ethyl-, methyl ester
18.18% 0.00%
1,3-Hexadiene, 3-ethyl-2-methyl- 18.18% 18.18% 6-Undecanone 18.18% 9.09%
2(5H)-Furanone, 5,5-dimethyl- 18.18% 9.09% 2(3H)-Furanone, 5-
ethenyldihydro- 18.18% 9.09%
3-Hexen-2-one, 3-methyl- 18.18% 9.09% 2(3H)-Furanone, dihydro-5-
pentyl- 18.18% 9.09%
Ethanone, 1-(2-methyl-1-cyclopenten-1-yl)-
9.09% 0.00%
3-Ethoxy-3,7-dimethyl-1,6,octadiene
9.09% 0.00%
Pyridine 9.09% 0.00% Cyclohexanone, 4-hydroxy-4-
methyl- 9.09% 0.00%

86
3-Heptene, 2,2,4,6,6-pentamethyl- 9.09% 0.00% 2H-1,2-Oxazine, 6-(4-
chlorophenyl)tetrahydro-2-methyl-
9.09% 0.00%
Undecane 9.09% 2.70% 5-Hepten-2-one, 6-methyl- 9.09% 18.18%
Octanal 9.09% 9.09% 1H-Pyrazole, 3,5-dimethyl- 9.09% 0.00%
Acetic Acid 9.09% 18.18% 1,6-Octadien-3-ol, 3,7-dimethyl- 9.09% 18.18%
2-Butyl-2,7-octadien-1-ol 9.09% 9.09% 1H-Inden-1-one, 2,3-dihydro-
3,4,7-trimethyl- 9.09% 18.18%
1,2,6-Hexanetriol 9.09% 0.00% Butylated Hydroxytoluene 9.09% 9.09%
Benzophenone 9.09% 0.00% 4-Pyridinamine 0.00% 18.18%
3,5-Dimethyl-2-octanol 0.00% 9.09% Nonanoic acid 0.00% 9.09%
Nonanol 0.00% 9.09% 6-Octen-1-ol, 3,7-dimethyl- 0.00% 9.09%
1H-Pyrrole, 1-butyl- 0.00% 9.09% 4-Methylthiazole 0.00% 18.18%
Benzaldehyde, 2-hydroxy- 0.00% 27.27% 4,4-Dimethyl-2-
allylcyclohexanone 0.00% 18.18%
Benzaldehyde, ethyl- 0.00% 18.18% Phenol, 2,4-bis(1,1-
dimethylethyl)- 0.00% 18.18%

87
Figure 26 Frequency distribution of functional groups of VOCs extracted from saliva of epileptic patients
Figure 27 is a comparison of VOC profiles from the saliva of epileptic patients and
healthy individuals. Comparison of these profiles shows a trend. One compound, 2-
pentylfuran (blue) is commonly found in human saliva and was present in the VOC profiles
of all but one individual. For epileptic individuals, EL, MS, DZ and AA, 2-pentylfuran
represented a larger component of their VOC profiles than it did for any other individuals.
These individuals all reported experiencing regular seizures (at least two per week). EL,
DZ and AA were all diagnosed with partial epilepsy, while MS was diagnosed with
generalized absence epilepsy.

88
Figure 27 Comparison of VOC profiles from the saliva of healthy and epileptic individuals
2-Pentylfuran is not known to by produced by mammalian metabolism, but is found
in foods, such as potatoes and tomatoes, and in alcoholic beverages97, and can possibly be
present in saliva as a result of diet. However, this compound can also be produced by fungi
via metabolism of linoleic acid98, the main polyunsaturated fatty acid in mammals99. The
enzymes used in the metabolic pathway, lipoxygenases, some of which are found in the
human body100. Normally, linoleic acid is metabolized to arachidonic acid by
phospholipase A2 (PLA2). Arachidonic acid is then involved in the biosynthesis of
prostaglandins via oxygenation by cyclooxygenase (COX) enzymes101. First, prostaglandin
G2 (PGG2) is formed, and this is then converted to prostaglandin H2 (PGH2) by a
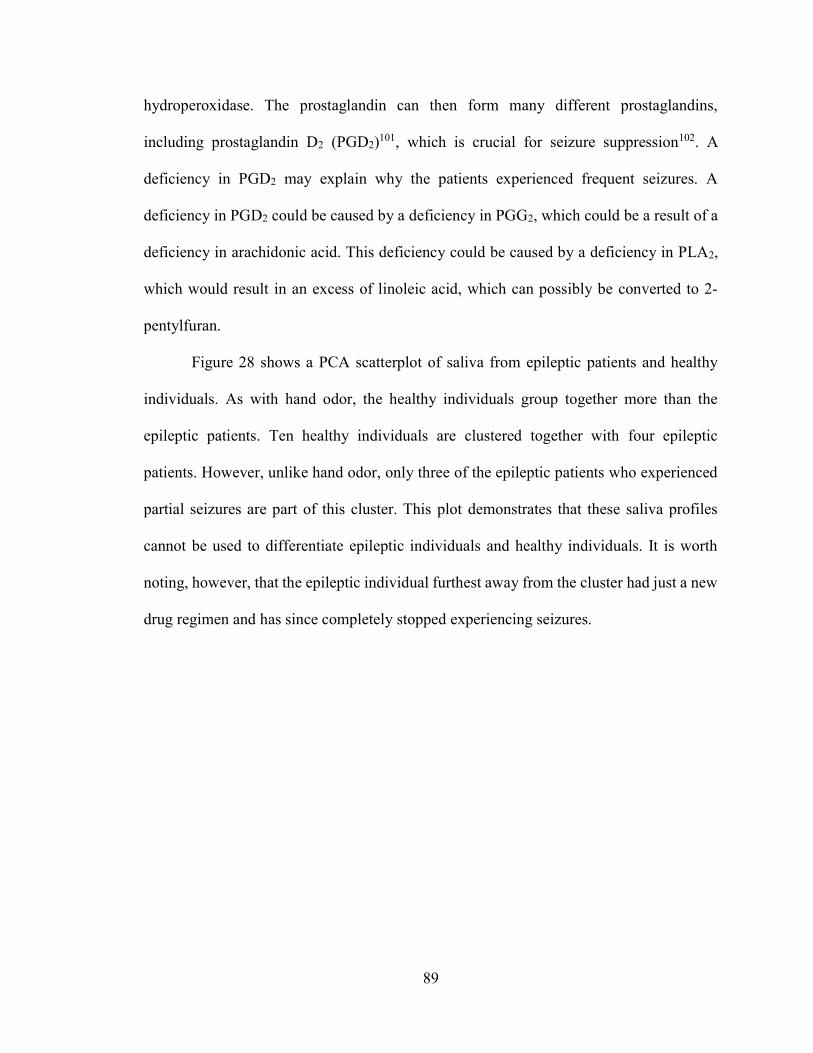
89
hydroperoxidase. The prostaglandin can then form many different prostaglandins,
including prostaglandin D2 (PGD2)101, which is crucial for seizure suppression102. A
deficiency in PGD2 may explain why the patients experienced frequent seizures. A
deficiency in PGD2 could be caused by a deficiency in PGG2, which could be a result of a
deficiency in arachidonic acid. This deficiency could be caused by a deficiency in PLA2,
which would result in an excess of linoleic acid, which can possibly be converted to 2-
pentylfuran.
Figure 28 shows a PCA scatterplot of saliva from epileptic patients and healthy
individuals. As with hand odor, the healthy individuals group together more than the
epileptic patients. Ten healthy individuals are clustered together with four epileptic
patients. However, unlike hand odor, only three of the epileptic patients who experienced
partial seizures are part of this cluster. This plot demonstrates that these saliva profiles
cannot be used to differentiate epileptic individuals and healthy individuals. It is worth
noting, however, that the epileptic individual furthest away from the cluster had just a new
drug regimen and has since completely stopped experiencing seizures.

90
Figure 28 PCA scatterplot of saliva from epileptic patients and healthy individuals
There are six compounds present in the headspace of three or more saliva samples
from epileptic patients, but not in those from healthy individuals (Table 5). No compound
was found to be present in samples from all eleven patients participating in this study.
Table 5 Compounds found only in the saliva of epileptic patients
Compounds founds only in the saliva of epileptic patients
Propanoic Acid 2(3H)-Furanone, 5-hexyldihydro-
Menthol Pilocarpine 1-Octen-3-ol
3-Nonen-2-one

91
3.3.3. Discussion
Propanoic Acid
Propanoic acid is a short chain fatty acid that is an intermediary in cellular fatty
acid metabolism. along with other short chain fatty acids, it is found in high levels in the
gut. It is also used as a preservative in many foods, including wheat and dairy products103.
Some conditions that are related to seizure disorder lead to higher levels of
propanoic acid, and studies have shown that increased propanoic acid levels influence some
CNS processes. Na+,K+-ATPase is an enzyme that is crucial for the active transport of
sodium and potassium ions across cell membranes, and this is necessary to maintain the
ionic gradient for neuronal excitability104. Research has shown that levels of this enzyme
are decreased in epilepsy105. In 1998, Wyse et al. injected propanoic acid into rats, and
found that it significantly reduced Na+,K+-ATPase activity in rat brain cortices106.
Propanoic acid had the highest frequency of occurrence of all the VOCs that were
not observed in healthy individuals. Given its endogenous origin and its connection to
epilepsy, this may be a volatile biomarker for the disease.
5-Hexyldihydro-2(3H)-furanone
2(3H)-Furanone, 5-hexyldihydro- (-Decalactone) is a lactone with a peach-like
aroma107. It is present naturally in many fruits and fermented products108, and is the most
abundant lactone found in strawberries109. like other lactones, it is used extensively in the
flavoring industry108. The presence of this compound is most likely a result of dietary
exposure.

92
Menthol
Menthol is a monoterpene that is found in essential oils of plants from the Mentha
genus110, such as peppermint. It has a pleasant flavor and aroma and a cooling-anesthetic
effect, and is used in many confectionary goods, pharmaceuticals, oral health care products,
cosmetics, tea and tobacco products. The presence of menthol in saliva was most likely a
result of exogenous exposure.
Menthol is a primary activator of TRPM8 channels111, cold and menthol-sensitive
members of the (Transient Receptor Potential) TRP channel family. This family is made
up of cation channels that play critical roles in the responses to all major classes of external
stimuli112. Activation of the TRPM8 channels causes an increase in intracellular Ca2+
levels, facilitating glutamate release from sensory neurons. This leads to modulation of
peripheral nociception110. Menthol also has effects on the CNS, as its lipophilic nature
allows it to cross the blood-brain barrier113. In 2008, Zhang et al. studied the effect of
menthol in central neurons. First, they examined the menthol’s effect on neuronal firing
properties, and found that neuronal firing rate was reduced by menthol in a dose-
dependently manner. They then examined the effect of menthol on GABAA receptors in
hippocampal neurons, and showed that menthol reduced neuronal excitation by enhancing
inhibition mediated by GABAA receptors. These finding implied the menthol may have
antiepileptic properties. Zhang at al. then used pentylenetetrazole (PTZ) induction and
hippocampal kindling to elicit epileptic activity and showed that menthol exerts
anticonvulsant effect in both models110.

93
Pilocarpine
Pilocarpine is an alkaloid that has been used in the treatment of glaucoma to lower
intraocular pressure114, and in the treatment of xerostomia to increase salivary output115. It
has also been used in experiments to provoke seizures in rats116-120.
Pilocarpine is a cholinergic muscarinic agonist, which means that it activates
muscarinic acetylcholine receptors. Muscarinic receptors regulate important physiological
functions, such as heart rate and motor and sensory control, and control multiple processes
in the brain, including learning, pain and arousal. They are G-protein coupled receptors,
and regulate the activity of many effector enzymes and voltage-dependent ion channels in
excitable cells121-123, as well as mediate most of the effects of acetylcholine, an excitatory
neurotransmitter, on central neurons123.
Though not fully understood, cholinergic mechanisms are believed to play a role in
epileptogenesis and the generation of seizures120,124,125. Muscarinic cholinergic excitation
in the brain is a result of reduced K+ conductance and is facilitated by Ca2+ and Na+
conductance120. This action favors the inward movement of Ca2+ and Na+ ions into neurons,
and this influx of Na+ may be responsible for membrane depolarization and generation of
an action potential1,120. The action potential is the basic mechanism of neuronal
excitability1, and this makes acetylcholine relevant for epileptic events. Also, it has been
observed that the cerebrospinal fluid of individuals with epilepsy who experience frequent
seizures contains acetylcholine120.

94
1-Octen-3-ol
1-Octen-3-ol is already a disease biomarker that has been detected in the blood of
patients with liver cancer126. In addition, it is a fungal semiochemical which is formed by
the oxidation and cleavage of linoleic acid. As a semiochemical, it acts as a signal molecule
in insect attraction and deterrence. It is one of the main reasons for the characteristic odor
associated with molds and mushrooms, and is used as a flavoring agent in some
commercially prepared foods127.
In a study by Inamdar et al. in 2013, it was shown that 1-octen-3-ol disrupts
dopamine homeostasis and may be involved in parkinsonism127. they used a Drosophila
model to study the effects of fungal VOCs and found that 1-octen-3-ol reduces dopamine
levels and causes dopamine neuron degeneration. Dopamine plays a major role in stopping
seizures arising in the limbic system. Biochemical evidence has shown that dopaminergic
dysfunctions exist in the brains of epileptic patients, and molecules that stimulate the
dopaminergic system have anti-epileptic action and anti-convulsant effects128. 1-Octen-3-
ol may be in the saliva because of environmental exposure, but the presence of a compound
that reduces dopamine levels may explain a predisposition to seizures.
3-Nonen-2-one
3-Nonen-2-one is used as a flavoring in beverages (alcoholic and non-alcoholic),
chewing gum, confectionary frostings, milk products, and gelatins and puddings. The odor
is strong and nutty, with fruity tones similar to those of peaches, melons and avocados. It
is found in the essential oil of the Centella asiatica plant, which has been used in Ayurveda
medicine in Sri Lanka and India for the treatment of epilepsy (Medicinal and Aromatic

95
Plant Series, No. 1). Its presence in saliva, however, is most likely the result of dietary
exposure.
3.4. Breath
3.4.1. Methods
Prior to sample collection, DUKAL gauze pads were pretreated by spiking with
1000 L of HPLC-grade methanol and baking at 105°C for one hour in an Isotemp Oven.
Pretreated gauze pads were analyzed to ensure analytical cleanliness by SPME-GC-MS
(Figure 21).
The breath sampling protocol for initial sampling is as follows: Subjects were
required to rinse their mouths with water for 30 seconds. Subjects were asked to inhale
deeply, then exhale slowly into pretreated cotton gauze. The gauze pad was re-sealed back
into the 10-ml glass headspace vial.
Sample vials were paced in a heating block set to 50 ℃ and allowed to equilibrate
for 1 hour. The fiber was then exposed to the headspace above the cotton gauze at 50 ℃
for 2 hours. The extracted VOCs were then analyzed by GC-MS using the SolGel-Wax
column and the temperature program determined in the first task.
3.4.2. Results
Analyses of the breath samples from healthy and epileptic individuals show a total
of 118 VOCs (Table 6). Within samples collected from epileptic patients, 82 VOCs were
extracted. The extracted VOCs include alcohols (25.0%), esters (19.3%), aliphatic
hydrocarbons (19.3%), aldehydes (14.8%), ketones (8.0%), aromatic hydrocarbons (4.6%),

96
acids (2.3%), ethers (2.3%), azines (1.1%), furans (1.1%), oxazines (1.1%),
benzodiazepines (1.1%), and halogenated hydrocarbons (1.1%) as shown in Figure 29.
Benzaldehyde was the most abundant compound extracted from all samples, being
observed in 81.8% of samples from epileptic patients and 18.2% of samples from healthy
individuals. Of the VOCs extracted from samples from epileptic patients only, Limonene
was the most abundant, being observed in 63.6% of these samples. It was the only
compound to be extracted in more than 50% of breath samples from epileptic patients
without being observed in any samples from healthy individuals.

97
Table 6 Frequency of occurrence of all VOCs found in the headspace of breath samples
Compound Frequency of Occurrence in
Epileptic Patients
Frequency of Occurrence in Healthy
Individuals Benzaldehyde 81.82% 18.18%
Menthol 72.73% 9.09% Limonene 63.64% 0.00% Nonanal 63.64% 100.00% Decanal 63.64% 100.00%
1-Hexanol, 2-ethyl- 54.55% 54.55% Phenol 54.55% 36.36%
2-Cyclopentene-1,4-dione 45.45% 0.00% 7-Octen-2-ol, 2,6-dimethyl- 45.45% 0.00%
Chloroform 45.45% 9.09% Butylated Hydroxytoluene 45.45% 9.09%
1,3,5-Triazine, 2,4,6-trimethyl-
36.36% 0.00%
1,6-Octadien-3-ol, 3,7-dimethyl-
36.36% 0.00%
Furan, 2-pentyl- 36.36% 18.18% Hexanal 36.36% 9.09%
Hexadecanoic acid, methyl ester
36.36% 9.09%
Heptanal 36.36% 36.36% Hexadecane 36.36% 18.18%
Toluene 36.36% 36.36% Octanal 36.36% 54.55%
Octanoic acid, methyl ester 27.27% 18.18% 2,6-Bis(1,1-dimethylethyl)-4-
(1-oxopropyl)phenol 27.27% 9.09%
Benzyl Alcohol 27.27% 9.09% Benzene, 1-methoxy-4-(1-
propenyl)- 27.27% 0.00%
1-Octanol 27.27% 9.09% Dodecanoic acid, methyl ester 27.27% 9.09%
Tetradecane 27.27% 9.09% Undecane 27.27% 18.18%
Decanoic acid, methyl ester 27.27% 27.27% Benzaldehyde, 2-hydroxy- 27.27% 63.64%

98
2-Furanmethanol 27.27% 72.73% Cyclohexanol, 2-(1,1-
dimethylethyl)- 18.18% 0.00%
2H-1,2-Oxazine, 6-(4-chlorophenyl)tetrahydro-2-
methyl- 18.18% 0.00%
1,1,3-Trimethyl-3-(2-methyl-2-propenyl)-cyclopentane
18.18% 0.00%
3,5-di-tert-Butyl-4-hydroxybenzaldehyde
18.18% 0.00%
Eucalyptol 18.18% 0.00% 2,4,4,6,6,8,8-Heptamethyl-1-
nonene 18.18% 0.00%
Indan-1,3-diol monoacetate 18.18% 0.00% Methyl 9-
methyltetradecanoate 18.18% 0.00%
Nitrazepam 18.18% 0.00% Nonanoic acid, methyl ester 18.18% 9.09%
Octadecane 18.18% 9.09% Dodecane 18.18% 18.18% 2-Butyne 9.09% 0.00%
3-Heptene, 2,2,4,6,6-pentamethyl-
9.09% 0.00%
3-Butene-1,2-diol, 1-(2-furanyl)-3-methyl-
9.09% 0.00%
2-Butenal, 3-methyl- 9.09% 0.00% 3-Octanol, 3,7-dimethyl- 9.09% 0.00%
Benzene, 1,3-bis(1,1-dimethylethyl)-
9.09% 0.00%
1H-Pyrazole, 3,5-dimethyl- 9.09% 0.00% 2-Cyclopenten-1-one 9.09% 0.00%
1-Octen-3-ol 9.09% 0.00% Ethylbenzene 9.09% 0.00%
Cyclopropane, pentyl- 9.09% 0.00% 6-Methyl-3,5-heptadiene-2-
one 9.09% 0.00%
Benzoic acid, methyl ester 9.09% 0.00% Nonadecane 9.09% 0.00%
Cyclodecene, 1-methyl- 9.09% 0.00% Cycloheptane 9.09% 0.00%
Nonanol 9.09% 0.00%

99
Cyclohexanol, 1,3-dimethyl-, cis-
9.09% 0.00%
5,9-Undecadien-2-one, 6,10-dimethyl-, (Z)-
9.09% 0.00%
2-Undecenal 9.09% 0.00% Undecanoic acid, 10-methyl-,
methyl ester 9.09% 0.00%
1-Tetradecanol 9.09% 0.00% 1-Hexadecanol 9.09% 0.00%
Pentadecanoic acid, 14-methyl-, methyl ester
9.09% 0.00%
Lilial 9.09% 0.00% Isopropyl Myristate 9.09% 0.00%
Cyclopentadecanone, 2-hydroxy-
9.09% 0.00%
Methyl Z-11-tetradecenoate 9.09% 0.00% 2-Methyl-d-glucose 9.09% 0.00% Ethanol, 2-phenoxy- 9.09% 0.00%
Pentadecanoic acid, methyl ester
9.09% 0.00%
1H-Fluorene, dodecahydro- 9.09% 0.00% Isopropyl Palmitate 9.09% 0.00%
Cyclotetradecane 9.09% 0.00% 9-Octadecenoic acid, methyl
ester 9.09% 0.00%
Hexadecanal, 2-methyl- 9.09% 0.00% Acetic acid, phenylmethyl
ester 9.09% 0.00%
Diphenyl ether 9.09% 0.00% Cyclopentanoic acid, 3-oxo-2-
pentyl-, methyl ester 9.09% 0.00%
2,3-Butanediol, 2,3-dimethyl- 9.09% 0.00% 3-Penten-2-one, 4-(2,6,6-
trimethyl-2-cyclohexen-1-yl)- 9.09% 0.00%
Hexanoic acid, 2-ethyl- 9.09% 0.00% 5-Hepten-2-one, 6-methyl- 9.09% 9.09%
Pentadecane 9.09% 9.09% Hexanoic Acid 9.09% 9.09% Naphthalene 9.09% 27.27%
Furfural 9.09% 54.55% Phenol, 2-methyl- 0.00% 9.09%

100
E-8-Methyl-9-tetradecen-1-ol acetate
0.00% 9.09%
Bicyclo[2.2.1]heptane, 2,2,3-trimethyl-, endo-
0.00% 9.09%
Formamide, N-methylthio 0.00% 9.09% Octane, 5-ethyl-2-methyl- 0.00% 9.09%
Cyclohexanol, 4-methyl-, cis- 0.00% 9.09% Octadecane, 3-ethyl-5-(2-
ethylbutyl)- 0.00% 9.09%
2-Methyl-7-phenylindole 0.00% 9.09% 2-Pyridinecarboxaldehyde 0.00% 9.09% 2-Pyridinecarboxylic acid 0.00% 9.09%
4-Cyanocyclohexene 0.00% 9.09% 1-Cyclohexene-1-
carboxaldehyde, 2,6,6-trimethyl-
0.00% 9.09%
Cyclohexadecane 0.00% 9.09% Imidazole, 4-methyl-5-[3,3,3-
trifluoropropionylpropyl]- 0.00% 9.09%
Benzene, (1-methoxyethyl)- 0.00% 9.09% Naphthalene, 1-methyl- 0.00% 9.09%
Naphthalene, 1,8-dimethyl- 0.00% 9.09% Naphthalene, 2,7-dimethyl- 0.00% 9.09%
1,4-Dimethyl-6-phenyl-naphthalene
0.00% 9.09%
Octanoic Acid 0.00% 9.09% Z,E-2,13-Octadecadien-1-ol 0.00% 9.09%
1H-Indene, 2-butyl-5-hexyloctahydro-
0.00% 9.09%
Nonanoic acid 0.00% 9.09% (-)-Neoclovene-(II), dihydro- 0.00% 9.09%
Allopregnane 0.00% 9.09% Benzyl Benzoate 0.00% 9.09%
Methane, bromodichloro- 0.00% 27.27% Methyl Salicylate 0.00% 18.18%

101
Figure 29 Frequency distribution of functional groups of VOCs extracted from breath of epileptic patients
Figure 30 is a comparison of VOC profiles from the breath of epileptic patients and
healthy individuals. These profiles show now patterns or similarities between epileptic
patient profiles that can be used to differentiate them healthy profiles. A PCA scatterplot
(Figure 31) shows that these breath profiles cannot be used to differentiate epileptic
individuals and healthy individuals. Again, nine healthy individuals form a tight cluster,
this time joined by six epileptic patients. Four of the five patients who experienced simple
partial seizures are within this tight cluster, while fifth is close. It is worth noting, once
again, that the epileptic patient furthest from the cluster is the patient who no longer
experiences seizures.

102
Figure 30 Comparison of VOC profiles from the breath of epileptic patients and healthy individuals

103
Figure 31 PCA scatterplot of breath from epileptic patients and healthy individuals
Six VOCs (Table 7) were observed in the headspace of at least three breath samples
from epileptic individuals, but not in the breath samples of healthy individuals. No
compound was found in samples from all eleven patients.
Table 7 Compounds found in the breath of epileptic patients
Compounds founds only in the breath of epileptic patients
Limonene 2-Cyclopentene-1,4-dione 2,6-Dimethyl-7-octen-2-ol
2,4,6-Trimethyl-1,3,5-triazine 3,7-Dimethyl-1,6-Octadien-3-ol,
1-Methoxy-4-(1-propenyl)-benzene

104
3.4.3. Discussion
Limonene, 2-cyclopenten-1,4-dione, 2,6-dimethyl-7-octen-2-ol and 2,4,6-
trimethyl-1,3,5-triazine were discussed in previous sections.
3,7-Dimethyl-1,6-octadien-3-ol
3,7-Dimethyl-1,6-octadien-3-ol (Linalool) is a monoterpene, and is a component of
essential oils in aromatic species129, including oil of field mint, lemon balm, rose, neroli,
lavender, geranium, basil and oregano130,131. As a terpene, linalool’s presence is most likely
a result of exogenous exposure.
Linalool has sedative effects in the CNS, including protection against PTZ-induced
and transcorneal electroshock (ECC)-induced convulsions. Neuro chemical analysis has
shown that the compound has an inhibitory effect on glutamate binding129. In 1999,
Elisabetsky et al. investigated the effects of linalool on glutamate binding at CNS
membranes, N-methyl-D-aspartate (NMDA)-induced convulsions, and quinolinic acid
(QUIN)-induced convulsions. They found that linalool dose-dependently inhibited
glutamate binding, QUIN-induced convulsions, and caused a delay in the onset of NMDA-
induced seizures129.
1-Methoxy-4-(1-propenyl)-benzene
1-Methoxy-4-(1-propenyl)-benzene (Anethole) is an aromatic compound that is
widely used as a flavoring agent for foods and beverages and as an odorant in perfumes132.
Anethole is found in the essential oil of the fruits of Anise (Pimpinella anisum), a plant
that has been shown to have anticonvulsant properties133. It is also found in tarragon

105
(Artemisia dracunculus L.), which has been used, in Iranian traditional medicine, to treat
epilepsy134. Anethole is most likely in the breath as a result of exogenous exposure.
4. COMPARISON OF SCENT COLLECTED FROM EPILEPTIC INDIVIDUALS
WITH AND WITHOUT SEIZURE ACTIVITY
Initial sampling of epileptic individuals was performed in the laboratory or in their
homes. Each subject was given a kit containing sampling materials and instructions sample
themselves for five consecutive days – once every morning after awaking and once every
night before bed (interictal), and immediately after every seizure (postictal). The interictal
VOC profiles were compared to the postictal VOC profiles to determine the presence of
any seizure-related VOCs.
The sampling kit (Figure 32) consists of glass vials containing 30 cotton gauze pads
(15 for hand odor sampling and 15 for breath sampling) and 15 cotton-tipped applicators
for saliva sampling. The kit also contained two glass vials, one with a pretreated cotton
gauze pad and one with a pretreated cotton-tipped applicator sealed in to serve as
environmental controls. Other components of the kit included tweezers for handling the
cotton gauze pads, and parafilm and aluminum foil for packaging samples once sampling
is completed. Prior to sampling, subjects were instructed to open these environmental
controls and, using the tweezers, pull the cotton gauze pad so that it protrudes from the top
of the vial, and place both vials within three feet of the sampling location.

106
Figure 32 Sampling kit given to epileptic patients
Of the eleven epileptic patients involved in this study, three experienced seizures
while in possession of the sampling kit. These patients – subjects AA, DZ and EL – were
all diagnosed with focal epilepsy and reported experiencing at least two seizures per week.
Compounds that were not observed in samples from at least two individuals were
disregarded.

107
4.1. Hand Odor
4.1.1. Method
Subjects were instructed to hold a pre-treated sterile gauze pad between the palms
of their hands for ten minutes, then seal the gauze pad into the 10-ml glass headspace vial
and wrap the vial in parafilm and aluminum foil.
4.1.2. Results
Table 8 shows the VOCs that were extracted from postictal hand odor samples, but
not from interictal samples. The extracted VOCs include ketones, aldehydes, esters,
alcohols, ethers and polycyclic hydrocarbons. Figure 33 shows a comparison of interictal
and postictal hand odor chromatograms.
Table 8 Compounds found in postictal hand odor profiles of epileptic patients
Compounds founds only in the postictal hand odor profiles of epileptic patients
Menthone Menthyl acetate
3-Ethoxy-3,7-dimethyl-1,6-octadiene Camphor
Pentadecanal Valencene
4.1.3. Discussion
Menthone
Menthone is a monocyclic ketone, belonging to class of compounds known as p-
menthane monoterpenes. Like other terpenes, it occurs in nature, being produced by higher

108
plants. Menthone is commonly found in plants of the Mentha genus, and is one of the main
volatile components of peppermint (Mentha piperita L.) oil135.
Early studies of menthone and its derivatives have shown that they have
anticonvulsant properties. The essential oil from flower heads of Egletes viscosa contains
menthone, and has shown significant protection from subcutaneous PTZ induced
seizures136. Schiff bases of menthone137 and a Mannich base of menthone138 exhibited
anticonvulsant activity against maximal electroshock seizures (MES). An amino acid
which was derived from hydrolysis of (-) menthone oxime is structurally similar to GABA,
and has the potential to be an inhibitor of GABA neuroreceptors. Jain et al. (2010)
synthesized a series of menthone semicarbazides and thiosemicarbazides and examined the
anticonvulsant activity of these compounds in MES and subcutaneous PTZ screens. Nine
compounds showed significant protection, with seven compounds exhibiting protection in
both models. Two compounds were selected to study their effects on GABA levels in
different regions of rat brain. They were found to increase the GABA level in mid brain
region significantly 137.
Menthyl Acetate
Menthyl acetate is the acetate ester of menthol. Like menthol and menthone, it is
found in peppermint135,139, also contributing to its smell and flavor. Peppermint and its
essential oil are believed to be effective in the treatment of nervous disorders and mental
fatigue139. Umezu et al. (2001) studied the effects of peppermint oil and its constituent
compounds on the ambulatory activity of mice, as drugs that cause mental excitation are
known to increase ambulatory activity in mice. They found that administration of

109
peppermint oil and some of its compounds, including menthyl acetate, significantly
increased ambulatory activity. It is believed that these compounds produce their effect by
acting on the central nervous system. They would be absorbed into the bloods stream, cross
the blood-brain barrier, and act on the neurons in the brain in the same manner as
psychoactive drugs139.
3-Ethoxy-3,7-dimethyl-1,6-octadiene
3-Ethoxy-3,7-dimethyl-1,6-octadiene is a flavoring substance that is found in
nonalcoholic beverages and hard candy140. It was identified in the extract of the non-edible
tissues of Theobroma cacao, which was found to have strong cytotoxic activity against a
breast cancer cell line (MCF-7)141, and it is a minor component of Origanum vulgare
(oregano), a plant has sedative properties142.
Camphor
Camphor is a naturally occurring compound, found mainly in the wood of the
camphor laurel tree (Cinnamomum camphora). It is used as a nasal decongestant and cough
suppressant, and is known to have antipruritic, analgesic, and counterirritant properties143.
However, it is also a constituent of the essential oils of rosemary (Rosmarinus officinalis
L.), sage (Salvia officinalis L.), savin (Juniperus sabina L.), tansy (Tanacetum vulgare L.)
and thuja (Thuya occidentalis L.), which have been known to cause seizures, and is
believed to contribute to their convulsant properties144.
Camphor activates and desensitizes a receptor from the transient receptor potential
(TRP) channel superfamily, the vanilloid subtype 1 (TRPV1). These receptors are found

110
in both the PNS and the CNS, and activation play an important role in pain transmission
and modulation145. For example, mice without the TRPV1 gene exhibited reduced thermal
nociception and a loss of inflammatory thermal sensitivity. Antagonists block TRPV1
activity, reducing pain. However, prolonged or repeated application of an agonist, like
camphor, results in desensitization, also leading to an alleviation of pain143.
In addition to these functions, the TRPV1 channels has been identified as a potential
drug target for treatment of epilepsy, as evidence has suggested that they may play a role
in seizure generation and suppression. It has been reported that activation of this channel
by the agonist, capsaicin, can cause the increase of epileptic activity in hippocampal slices
from rats’ brains146. It has been reported that TRPV1 channel activation enhances the
release of glutamate, the major excitatory neurotransmitter in the CNS, and decreases the
release of GABA, the major inhibitory neurotransmitter in the CNS146.
Pentadecanal
Pentadecanal is a fatty aldehyde which is found in citrus. It has also been found in
the leaves of plants that are used in some cultures to treat epilepsy. The sacred fig (Ficus
religiosa) has been shown to possess anticonvulsant properties, and the leaves contain
0.7% Pentadecanal (Al-Snafi, 2017). Landolphia owariensis, found in West Africa, is used
in the Congo as a treatment for giddiness and epilepsy. It was found to contain 13.63%
Pentadecanal (Okhale et al., 2016). Extracts from Cnestis ferruginea, another plant native
to Africa, have been shown to possess analgesic, anti-inflammatory, antidepressant,
anxiolytic, and anticonvulsant properties. The oil of this plant contains 6.1% Pentadecanal
(Ogunwande et al., 2013).

111
Valencene
Valencene is a sesquiterpene, a terpene with 15 carbon atoms, and is a constituent
of the essential oil of citrus fruits147,148. It has a fruity, woody flavor, and is used as an
additive in drinks and food148. It is also found in Cyperus rotundus L., a medicinal plant
that has been used for management of gastric ailments, cognition disorders, wounds, and
inflammation149. Valencene has been shown to exhibit anti-inflammatory effects, which
may be a result of inhibition of TRPV1 and ORAI1 ion channels, which mediate
dermatological processes, such as melanogenesis, skin wrinkling, and inflammation150. As
mentioned earlier, TRPV1 channels may play a role in seizure generation and suppression.
Figure 33 Comparison of interictal and postictal hand odor chromatograms

112
4.2. Saliva
4.2.1. Method
Subject were instructed to rub the cotton-tipped applicator up and down on the
inside of both cheeks for one minute (30 seconds per cheek), then seal the applicator into
the ten-ml glass headspace vial and wrap the vial in parafilm and aluminum foil.
4.2.2. Results
Table 9 shows the VOCs that were extracted from postictal saliva samples, but not
from interictal saliva samples. These include a ketone, an alcohol, and polycyclic
hydrocarbons. Figure 34 shows a comparison of interictal and postictal saliva
chromatograms.
Table 9 Compounds found in postictal saliva profiles of epileptic patients
Compounds founds only in the postictal saliva profiles of epileptic patients
Menthone (-)-β-Bourbonene
β-Cubebene
4.2.3. Discussion
Menthone was discussed in discussion for hand odor.

113
-Bourbonene
-Bourbonene is a flavoring agent that is found in cloves151, and has previously
been reported in the saliva of healthy individuals152. It is a sesquiterpene, a terpene with
three consecutive isoprene units.151. It is a constituent of the essential oils from Satureja
cuneifolia Ten., a plant that grows in the Mediterranean region, and that exhibits
antimicrobial activity153. It is also found in Emblica officinalis, a tree which is found in
countries like Malaysia, China, Pakistan, India, Indonesia, Zubekistan, Sri lanka and Malay
Peninsula, and has shown CNS protective activity in kainic acid (KA)-induced and PTZ-
induced seizures in rats154.
-Cubebene
-Cubebene is a sesquiterpene that is also found in of the essential oils from the
antimicrobial plant, Satureja cuneifolia Ten.153. It is also found in a subspecies of Melissa
officinalis L. (lemon balm), which has been traditionally used for different medical
purposes, and is of value in the management of mild to moderate Alzheimer’s. it is also a
component of the essential oils of plants which have been used in the treatment of epilepsy,
such as Ferula gummosa155, Artemisia vulgaris L.156, and Synedrella nodiflora157.

114
Figure 34 Comparison of and interictal and postictal saliva chromatograms
4.3. Breath
4.3.1. Method
Subjects were instructed to inhale deeply, then exhale slowly into pretreated cotton
gauze pad, then seal the gauze pad into the 10-ml glass headspace vial and wrap the vial in
parafilm and aluminum foil.
4.3.2. Results
Table 10 shows the VOCs that were extracted from postictal breath samples, but
not from interictal breath samples. include a ketone, an ether, esters, and a polycyclic

115
hydrocarbon. Figure 35 shows a comparison of interictal and postictal breath
chromatograms.
Table 10 Compounds found in postictal breath profiles of epileptic patients
Compounds founds only in the postictal breath profiles of epileptic patients
Menthone Menthyl acetate
3-Ethoxy-3,7-dimethyl-1,6-octadiene 4-tert-Butylcyclohexyl acetate
Valencene
4.3.3. Discussion
Menthone, menthyl acetate, 3-ethoxy-3,7-dimethyl-1,6-octadiene and valencene were
discussed in the discussion for hand odor.
4-tert-Butylcyclohexyl acetate
4-tert-Butylcyclohexyl acetate, also known as woody acetate, is a fragrance
ingredient used in decorative cosmetics, fine fragrances, shampoos, toilet soaps and other
toiletries, and in household cleaners and detergents. It has been known to cause convulsions
in laboratory rats158.

116
Figure 35 Comparison of and interictal and postictal breath chromatograms
5. CANINE TRIALS FOR POTENTIAL SEIZURE BIOMARKERS
Menthone was the only compound extracted from the headspace of all three sample
types, and from samples obtained from all three subjects who experienced seizures.
Therefore, it was selected as a potential biomarker for epileptic seizures and used in canine
trails to determine if canines trained to detect to onset of a seizure would alert to this
compound.
5.1. Preparation of COMPS
Approximate amounts of the menthone present in the headspace of seizure-related
samples were determined using a calibration curve. The COMPS was prepared by spiking

117
the determined amount on a cotton gauze pad and sealing the gauze pad in a low-density
polyethylene (LDPE) bag (2 mil and 4 mil thickness). The LDPE bag was then placed into
a mason jar.
The amount determined for menthone was 28 ng. A standard solution was prepared
using methylene chloride as a solvent. The time required for the methylene chloride solvent
to evaporate was determine by weighing a cotton gauze pad, spiking it with 28 L of
methylene chloride and timing how long it takes for the cotton gauze pad to return to its
original weight. This was determined to be 2.25 minutes.
A 1 ng/L solution of menthone was prepared. A 28 L aliquot was spiked onto a
cotton gauze pad and the gauze pad was left uncovered for 2.25 minutes to allow the solvent
to evaporate. The spiked gauze pad was then sealed in a 2 mil LDPE bag and the bag placed
into a mason jar. The above method was repeated with the spiked gauze being sealed in a
4 mil LDPE bag. These jars were mailed to Canine Assistants to be tested with canines to
determine if any of these compounds are biomarkers for epileptic seizures.
5.2. Canine Trials
Postictal samples were obtained from epileptic patients using the sampling methods
described in sections 3.2.1, 3.3.1, and 3.4.1.
Methods
All canines for this study were provided by Canine Assistants (Alpharetta, GA) and
were housed and trained in their on-site training facility. Trainers and handler, both present
at the facility, were responsible for the weekly training and maintenance of the canines.

118
Once the odors were shipped, the trainers would incorporate the odors into a trial following
the standard operating procedures of Canine Assistants.
Menthone
Four canines were imprinted on menthone using the 2 mil COMPS. They then
identified the menthone five times from a group of one blank gauze, one gauze kept in a
glass jar for a minimum of six hours, one gauze with scent of the tester, and one interictal
sample from an epileptic patient. The canines were then presented with a postictal sample
from the epileptic patient. All four dogs alerted. Three new dogs were then imprinted on a
postictal sample from the same epileptic patient. They were then presented with the
menthone COMPS. All three dogs alerted.
Results
Table 11 Results from first canine trial
Canines Imprinted on Menthone
Canine No. Alert to Blank Alert to Postictal Sample
1 - +
2 - +
3 - +
4 - +

119
Table 12 Results from second canine trial
Canines Imprinted on Postictal Sample
Canine No. Alert to Blank Alert to Menthone
1 - +
2 - +
3 - +
6. CONCLUSIONS
To date, there has been limited research about seizure prediction. The existing
studies all used EEG data to detect changes in brain activity that occur prior to seizures.
Most of these studies were retrospective, working backwards from the seizure to identify
these changes. Some researchers developed prediction algorithms, but none have made it
pass the laboratory phase. One objective of this project was to determine if the chemical
and metabolic state of an individual with epilepsy results in the production and release of
VOCs that can be differentiated from those produced and released from healthy
individuals. Additionally, it was necessary to ascertain whether the changes that occur in
the body because of an epileptic seizure result in the production and release of VOCs that
are not produced and released in the absence of a seizure event.
The HS-SPME-GC-MS method was developed and optimized for the extraction
and identification of VOCs present in hand odor, saliva and breath samples from healthy
individuals and in epileptic patients. Different gas chromatographic column chemistries

120
were examined to determine the best stationary phase for the analysis of human scent
compounds. The SolGel-WAX column provided the best resolution, which was the
parameter used for the selection of the stationary phase chemistry because it combines
selectivity, efficiency and capacity. The extraction temperature and time were evaluated to
determine the best conditions for the extraction of VOCs from the biological samples. An
extraction temperature of 50 ℃ and an extraction time of 2 hours provided the best
sensitivity and repeatability.
Comparison of the VOC profiles obtained from the biological samples from healthy
individuals with those obtained from the biological samples from epileptic patients
revealed fourteen compounds in the odor profiles of epileptic patients which were not
observed in the profiles of healthy ones. Most of these compounds were exogenous and
were most likely a result of diet and lifestyle. Even though none of the epileptic patients
participating in this study were prescribed specific diets, it is possible that they shared
similar diets and lifestyles. Of all the VOCs that were extracted from the samples of
epileptic patients but not from the samples of healthy individuals, propanoic acid was the
only one that could be linked to epilepsy and is of endogenous origin. It was observed in
the headspace of 63.64% saliva samples from epileptic patients, while not being extracted
from any samples from healthy individuals. Considering that high levels of this compound
are linked to seizures, and that it reduces the amount of an enzyme that removes ions that
cause depolarization, propanoic acid may be a volatile biomarker for epilepsy106.
Comparison of the VOC profiles obtained from the postictal samples from epileptic
patients with the interictal samples obtained from the same patients revealed eleven
compounds in the postictal samples that were not observed in the interictal samples. Many

121
of these also appeared to be of exogenous origin and most of them were only observed in
samples from two of the three individuals who experienced seizures. Only one compound
– menthone – was observed in all sample types and in samples from all the individuals
who experienced seizures. This compound was selected to be used in canine trials to
determine if it is indeed a biomarker for epileptic seizures. Canines were imprinted on
menthone, then presented with a sample taken from an epileptic patient immediately
following a seizure. All canines alerted to the seizure sample. New canines were then
imprinted on a postictal sample from the same patient, then presented with menthone. All
canines alert to the menthone COMPS. These results indicate that not only is menthone
released by the body of epileptic patients, but that this release occurs in relation to an
epileptic seizure.
With the detection of propanoic acid in the headspace of samples from epileptic
patients only, the HS-SPME-GC-MS results support the hypothesis that the chemical and
metabolic states of an individual with epilepsy result in the production and release of VOCs
that can be differentiated from those produced and released from healthy individuals. The
HS-SPME-GC-MS results and menthone canine trial results from this study support the
hypothesis that the hyper metabolic state caused by a seizure event results in the production
and release of VOCs that can be differentiated from those released in the absence of seizure
activity. It also shows that these VOCs can be used to train canines to recognize changes
in the body resulting from a seizure and alert to these changes.
The importance of these results cannot be understated. There are approximately 50
million people worldwide with epilepsy, and countless more whose life is affected by it by
extension. This research is an essential first step in allowing people with epilepsy and

122
caretakers of people with epilepsy to be more prepared for the unfortunate circumstance
that is a seizure. Imagine a mother whose whole purpose in life is ensuring the well-being
of her child who is unfortunate enough to have been diagnosed with epilepsy. If she had a
dog that, in addition to providing emotional support to her and her child, could alert when
there is an impending seizure, she would be able to prevent a great number of possible
consequences that result from a seizure. One such consequence could be falling to the
ground and getting a serious injury.

123
Reference List
1. Todd F.Barron, M. D. M.; Donna C.Bergen, M. D.; Thomas P.Bleck, M. D.; Leona D.Borchert, M. D.; David E.Burdette, M. D.; Mimi Callanan, R. N. M. S. N.; Claire M.Chee, R. N. B. S.; Severn B.Churn, Ph. D.; Steve S.Chung, M. D.; Robert R.Clancy, M. D.; Andrew J.Cole, M. D. Basic Mechanisms Underlying Seizures and Epilepsy. In An Introduction to Epilepsy [Internet], Edward B.Bromfield, M. D., José E.Cavazos, M. D. Ph. D., Joseph I.Sirven, M. D., Eds.; American Epilepsy Society: West Hartford (CT), 2006.
2. Poonam Nina Banerjee; David Filippi; W Allen Hauser The descriptive epidemiology of epilepsy-a review. Epilepsy Research 2009, 85 (1), 31-45.
3. Rosemarie Kobau; Yao-Hua Luo; Matthew M.Zack; Sandra Helmers; David J.Thurman Centers for Disease Control and Prevention Morbidity and Mortality Weekly Report; 12.
4. World Health Organiation Epilepsy Fact Sheet. World Health Organization . 2017.
Ref Type: Online Source
5. Herbert Witte; Leon D.Iasemidis; Brian Litt Special Issue on Epileptic Seizure Prediction. IEEE Transactions on Biomedical Engineering 2003, 50, 537-539.
6. Michel Le Van Quyen; Jacques Martinerie; Vincent Navarro; Paul Boon; Michel D'Havé; Claude Adam; Bernard Renault; Francisco Varela; Michel Baulac Anticipation of epileptic seizures from standard EEG recordings. The Lancet 2001, 357, 183-188.
7. Leon D.Iasemidis Epileptic Seizure Prediction and Control. IEEE Transactions on Biomedical Engineering 2003, 50, 549-558.
8. Todd F.Barron, M. D. M.; Donna C.Bergen, M. D.; Thomas P.Bleck, M. D.; Leona D.Borchert, M. D.; David E.Burdette, M. D.; Mimi Callanan, R. N. M. S. N.; Claire M.Chee, R. N. B. S.; Severn B.Churn, Ph. D.; Robert R.Clancy, M. D.; Andrew J.Cole, M. D.; Robert J.DeLorenzo, M. D. Clinical Epilepsy. In An Introduction To Epilepsy, American Epilepsy Society: West Hartford, 2006.
9. Val Strong; Stephen W.Brown; Robin Walker Seizure-alert dogs - fact or fiction? Seizure 1999, 8, 62-65.

124
10. Val Strong; Stephen W.Brown Should people with epilepsy have untrained dogs as pets? Seizure 2000, 9 (427), 430.
11. Stephen W.Brown; Val Strong The use of seizure-alert dogs. Seizure 2001, 2001 (10), 39-41.
12. Val Strong; Stephen W.Brown; Margaret Huyton; Helen Coyle Effect of trained Seizure Alert Dogs on frequency of tonic-clonic seizures. Seizure 2002, 11, 402-405.
13. Adam Kirton, M.; Elaine Wirrell, M. F.; James Zhang, M.; Lorie Hamiwka, M. F. Seizure-alerting and -response behaviors in dogs living with epileptic children. Neurology 2004, 62, 2303-2305.
14. Deborah L.Wells, Ph. D.; Shaun W.Lawson, Ph. D.; A.Niroshan Siriwardena, Ph. D. Canine Responses to Hypoglycemia in Patients with Type 1 Diabetes. The Journal of Alternative and Complementary Medicine 2008, 14 (10), 1235-1241.
15. Hywel Williams; Andres Pembroke Sniffer dogs in the melanoma clinic? The Lancet 1989, 333, 734.
16. John Church; Hywel Williams Another sniffer dog for the clinic? The Lancet 2001, 358, 930.
17. Deborah J.Dalziel; Basim M.Uthman; Susan P.McGorray; Stephen W.Brown Seizure-alert dogs: a review and preliminary study. Seizure 2003, 12, 115-120.
18. Brent A.Craven; Eric G.Paterson; Gary S.Settles The fluid dynamics of canine olfaction: unique nasal airflow patterns as an explanation of macrosmia. Journal of the Royal Society Interface 2010, 7, 933-943.
19. Allison M.Curran; Kenneth G.Furton; Scott I.Rabin Analysis of the uniqueness and persistence of human scent. Forensic Science Communications 2005.
20. Allison M.Curran; Scott I.Rabin; Paola A.Prada; Kenneth G.Furton Comparison of the Volatile Organic Compounds Present in Human Odor Using Spme-GC-MS. Journal of Chemical Ecology 2005, 31 (7), 1607-1619.
21. Allison M.Curran; Carlos F.Ramirez; Adee A.Schoon; Kenneth G.Furton The frequency of occurrence and discriminatory power of compounds found in human scent across a population determined by SPME-GCMS. Journal of Chromatography B 2007, 846, 86-97.
22. Allison M.Curran, Ph. D.; Paola A.Prada, B. S.; Kenneth G.Furton, Ph. D. The Differentiation of the Volatile Organic Signatures of Individuals Through

125
SPME-GC-MS of Characteristic Human Scent Compounds. Journal of Forensic Sciences 2010, 55 (1), 50-57.
23. Jessica S.Brown; Paola A.Prada; Allison M.Curran; Kenneth G.Furton Applicability of emanating volatile organic compounds from various forensic specimens for individual differentiation. Forensic Science International 2013, 226, 173-182.
24. Mika Shirasu; Kazushige Touhara The scent of disease: volatile organic compounds of the human body related to disease and disorder. Journal of Biochemistry 2011, 150 (3), 257-266.
25. Authur C.Guyton, M. D.; John E.Hall, Ph. D. Textbook of Medical Physiology; 11 ed.; Elsevier: Philadelphia, PA, 2006.
26. Samuel Natelson; David J.Miletich; Chresteen F.Seals; David J.Visintine; Ronald F.Albrecht Clinical biochemistry of epilepsy. I. Nature of the disease and a review of the chemical findings in epilepsy. Clinical Chemistry 1979, 25 (6), 889-897.
27. Germán Sierra-Paredes Recent Advances in the Neurochemistry of Epilepsy. European Neurological Review 2008, 3 (1), 96-98.
28. Klaus Lehnertz; Christian E.Elger Can Epileptic Seizures be Predicted? Evidence from Nonlinear Time Series Analysis of Brain Electrical Activity. Physical Review Letters 1998, 80 (22), 5019-5022.
29. Brian Litt; Rosana Esteller; Javier Echauz; Maryann D'Alessandro; Rachel Shor; Thomas Henry; Page Pennell; Charles Epstein; Roy Bakay; Marc Dichter; George Vachtsevanos Epileptic Seizures May Begin Hours in Advance of Clinical Onset: A Report of Five Patients. Neuron 2001, 30, 51-64.
30. Robert S.Fisher; Walter van Emde Boas; Warren Blume; Christian Elger; Pierre Genton; Phillip Lee; Jerome Engel, Jr. Epileptic Seizures and Epilepsy: Definitions Proposed by the International League Against Epilepsy (ILAE) and the International Bureau for Epilepsy (IBE). Epilepsia 2005, 46 (4), 470-472.
31. Marco Mula; Francesco Monaco Ictal and periictal psychopathology. Behavioral Neurology 2011, 24, 21-25.
32. David A.McCormick; Diego Contreras On the Cellular and Network Bases of Epileptic Seizures. Annual Review of Physiology 2001, 63, 815-846.
33. James O.McNamara Cellular and Molecular Basis of Epilepsy. The Journal of Neuroscience 1994, 14 (6), 3413-3425.

126
34. Jonathan C.Edwards, M. Handbook of Epilepsy: Diagnosis and Treatment; Medical University of South Carolina: 2012.
35. Ilo E.Leppik, M. Contempory Diagnosis and Management of the Patient With Epilepsy; 5 ed.; Handbooks in Health Care: 2000.
36. Richard J.Brown; Tanvir U.Syed; Selim Benbadis; W, C. L. Jr.; Markus Reuber Psychogenic nonepileptic seizures. Epilepsy & Behavior 2011, 22, 85-93.
37. Dee Unglaub Silverthorn, Ph. D. Human Physiology: An Integrated Approach; 5th ed.; Pearson Benjamin Cummings: San Francisco, CA, 2009.
38. HUMAN ANATOMY CHART Picture of The Human Anatomy Organs and Body. 2017.
Ref Type: Online Source
39. A Central Nervous System Disease. 2017. Ref Type: Online Source
40. National Cancer Institute SEER Training Modules. 2017. Ref Type: Online Source
41. H.Lodish; A.Berk; S.L.Zipursky Neurotransmitter Receptors. In Molecular Cell Biology, 4 ed.; W. W. Freeman: New York, 2000.
42. Lindsay B.Hough Histaminergic Cells of the Central Nervous System: Anatomy and Morphology. In Basic Neurochemistry: Molecular, Cellular and Medical Aspects, 6 ed.; Siegel GJ, A. B. A. R. e. al., Ed.; Lippincott-Raven: Philadelphia, 1999.
43. Lindsay B Hough Histamine Actions in the Central Nervous System. In Basic Neurochemistry: Molecular, Cellular and Medical Aspects, 6 ed.; Siegel GJ, A. B. A. R. e. al., Ed.; Lippincott-Raven: Philadelphia, 1999.
44. M.Beatrice Passani; Pertti Panula; Jian-Sheng Lin Histamine in the brain . Frontiers in Systems Neuroscience 2014, 8, 1-2.
45. Bryan Kolb; Ian Q.Whishaw Fundamentals of Neuropsychology; 6 ed.; Worth Publishers: New York, 2008.
46. Divya Vohora; S.N.Pal; K.K.Pillai Histamine and selective H3-receptor ligands: a possible role in the mechanism and management of epilepsy. Pharmacology, Biochemistry and Behavior 2001, 68, 735-741.
47. Understanding the Transmission of Nerve Impulses. 2017. Ref Type: Online Source

127
48. Leon D.Iasemidis; Deng-Shan Shiau; Wanpracha Chaovalitwongse; J.Chris Sackellares; Panos M.Pardolos; Jose C.Principe; Paul R.Carney; Awadhesh Prasad; Balaji Veeramani; Konstantinos Tsakalis Adaptive Epileptic Seizure Prediction System. IEEE Transactions on Biomedical Engineering 2003, 50, 616-627.
49. Simon D.Shorvon The causes of epilepsy: Changing concepts of etiology of epilepsy over the past 150 years. Epilepsia 2011, 52 (6), 1033-1044.
50. Brian Litt; Javier Echauz Prediction of epileptic seizures. The Lancet 2002, 1, 22-30.
51. Z.Rogowski; I.Gath; E.Bental On the Prediction of Epileptic Seizures. Biological Cybernetics 1981, 49, 9-15.
52. Leon D.Iasemidis Seizure Prediction and its Applications. Neurosurgery clinics of North America 2011, 22 (4), 489-vi.
53. Leonidas D.Iasemidis; J.Chris Sackellares The evolution with time of the spatial distribution of the largest Lyapunov exponent on the human epileptic cortex. D.Duke, W.Pritchard, Eds.; 1991.
54. Klaus Lehnertz; Christian E.Elger Spatio-temporal dynamics of the primary epileptogenic area in temporal lobe epilepsy characterized by neuronal complexity loss. Electroencephalography and clinical Neurophysiology 1995, 95, 108-117.
55. G.J.Romanes Experiments on the sense of smell in dogs. Nature 1887, 36, 273-274.
56. Kenneth G.Furton; Lawrence J.Myers The scientific foundation and efficacy of the use of canines as chemical detectors for explosives. Talanta 2001, 54, 487-500.
57. Kathryn A.Bamford, Ph. D. Canine Olfaction: An Overview of the Anatomy, Physiology and Genetics. Maine Search and Rescue Dogs . 2017.
Ref Type: Online Source
58. Brent A.Craven; Thomas Neuberger; Eric G.Paterson; Andrew G.Webb; Eleanor M.Josephson; Edward E.Morrison; Gary S.Settles Reconstruction and Morphometric Analysis of the Nasal Airway of the Dog (Canis familiaris) and Implications Regarding Olfactory Airflow. The Anatomical Record 2007, 290, 1325-1340.
59. Julio E.Correa . The Dog's Sense of Smell. Alabama Cooperative Extension System . 2016.
Ref Type: Online Source

128
60. Norma Lorenzo; TianLang Wan; Ross J.Harper; Ya-Li Hsu; Michael Chow; Stefan Rose; Kenneth G.Furton Laboratory and field experiments used to identify Canis lupus var. familiaris active odor signature chemicals from drugs, explosives, and humans. Analytical and Bioanalytical Chemistry 2003, 376, 1212-1224.
61. Ross J.Harper; José R.Almirall; Kenneth G.Furton Identification of dominant odor chemicals emanating from explosives for use in developing optimal training aid combinations and mimics for canine detection. Talanta 2005, 67, 313-327.
62. Laurent Dormont; Jean-Marie Bessière; Anna Cohuet Human Skin Volatiles: A Review. Journal of Chemical Ecology 2013, 39, 569-578.
63. Maiko Kusano, Ph. D.; Eladio Mendez, B. A.; Kenneth G.Furton, Ph. D. Comparison of the Volatile Organic Compounds from Different Biological Specimens for Profiling Potential. Journal of Forensic Sciences 2013, 58 (1), 29-39.
64. M.Gallagher; C.J.Wysocki; J.J.Leyden; A.I.Spielman; X.Sun; G.Preti Analyses of volatile organic compounds from human skin. British Journal of Dermatology 2008, 159, 780-791.
65. Helen J.Martin; Svetlana Riazanskaia; C.L.Paul Thomas Sampling and characterisation of volatile organic compound profiles in human saliva using a polydimethylsiloxane coupon placed within the oral cavity. Analyst 2012, 137, 3627-3634.
66. David A.Kidwell; Janel C.Holland; Sotiris Athanaselis Testing for drugs of abuse in saliva and sweat. Journal of Chromatography B 1998, 713, 111-135.
67. Miguel Del Nogal Sánchez; Elena Hernández.García; José Luis Pérez Pavón; Bernardo Moreno Cordero Fast Analytical Methodology Based on Mass Spectrometry for the Determination of Volatile Biomarkers in Saliva. Analytical Chemistry 2017, 84, 379-385.
68. Wolfram Miekisch; Jochen K.Schubert; Gabriele F.E.Noeldge-Schomburg Diagnostic potential of breath analysis—focus on volatile organic compounds. Clinica Chimica Acta 2004, 347, 25-39.
69. Zhouyao Zang; Min J.Yang; Janus Pawliszyn Solid-Phase Microextraction. A Solvent-Free Alternative for Sample Preparation. Analytical Chemistry 1994, 66 (17), 844A-853A.
70. Zhouyao Zang; Janus Pawliszyn Headspace Solid-Phase Microextraction. Analytical Chemistry 1993, 65, 1843-1852.

129
71. Janus Pawliszyn Theory of Solid-Phase Microextraction. Journal of Chromatographic Science 2000, 38, 270-278.
72. Keith D.Bartle; Peter Myers History of gas chromatography. Trends in Analytical Chemistry 2002, 21 (9-10), 547-557.
73. Douglas A.Skoog; F.James Holler; Timothy A, N. Principles of Instrumental Analysis; 5 ed.; Brooks/Cole, 1998.
74. Gas Chromatography. 2017. Ref Type: Online Source
75. Edmond de Hoffmann; Vincent Stroobant Mass spectrometry: Principles and Applications; 3 ed.; John Wiley and Sons, Ltd: England, 2007.
76. Jürgen H Gross Principles of Ionization and Ion Dissociation. In Mass Spectrometry, 2 ed.; Springer-Verlag: Berlin, 2011; pp 21-66.
77. FUNDAMENTOS Y FUNCIONES DE LA ESPECTROMETRIA DE MASAS. 2017.
Ref Type: Online Source
78. University of Bristol, School of Chemistry, Mass Spectrometry Facility: Quadrupole Ion Trap (QIT). 2017.
Ref Type: Online Source
79. University of Bristol, School of Chemistry, Mass Spectrometry Facility: Ion Detectors. 2017.
Ref Type: Online Source
80. Nagashwari Krishnamurthy; MANI ARUNKUMAR; Balakumar Srimivasan; SIVAKUMAR RAMALAINGAM Effect of Solanum nigrum and Emblica officinalis fruit extracts against H2O2 induced oxidative stress in Saccharomyces cerevisiae. International Journal of Pharma and Bio Sciences 2008, 4 (4), B370-B380.
81. Mithun Sikdar; Uzzal Dutta Traditional Phytotherapy among the Nath People of Assam. Studies on Ethno-Medicine 2008, 2 (1), 39-45.
82. Zahiruddin Othman; Rahimah Zakaria; Nik Hazlina Nik Hussain; Asma' Hassan; Nazlahshaniza Shafin; Badriya Al-Rahbi; Asma Hayati Ahmad Potential Role of Honey in Learning and Memory . Medical Sciences 2015, 3, 3-15.
83. NikMuhd Khuzaimi Nik Man; Rosline Hassan; Cheng Yong Ang; Abu Dzarr Abdullah; Muhammad Amiro Rasheeq Mohd Radzi; Siti Amrah Sulaiman Antileukemic Effect of Tualang Honey on Acute and Chronic Leukemia Cell Lines. BioMed Research International 2015, 2015, 1-7.

130
84. Human Metabolome Database Metabocard for Dodecanol. 2017. Ref Type: Online Source
85. Robert W.Peoples; Forrest F.Weight Differential alcohol modulation of GABAA and NMDA receptors. NeuroReport 1999, 10 (1), 97-101.
86. Ana Vázquez-Romero; Manuel Criado; Angel Messeguer; Francisco Sala; Salvador Sala Effect of Triazine Derivatives on Neuronal Nicotinic Receptors. ACS Chemical Neuroscience 2014, 5 (8), 683-689.
87. Chao Zheng; Kechun Yang; Qiang Liu; Meng-Ya Wang; Jianxin Shen; A.Sofía Vallés; Ronald J.Lukas; Francisco J.Barrantes; Jie Wu The Anticonvulsive Drug Lamotrigine Blocks Neuronal a4b2 Nicotinic Acetylcholine Receptors. The Journal of Pharmacology and Experimental Therapeutics 2010, 335 (2), 401-408.
88. Dietmar Bartschat; Susanne Börner; A.Mosandl; Jan W.Bats Stereoisomeric flavour compounds LXXVI: direct enantioseparation, structure elucidation and structure-function relationship of 4-tert-butyl-a-methyldihydrocinnamaldehyde. Zeitschrift für Lebensmitteluntersuchung und -Forschung A 1997, 205 (1), 76-79.
89. Max Scherera; Holger M.Koch; Andre Schütze; Nikola Pluym; Dusan Krnac; Gerhard Gilch; Edgar Leibold; Gerhard Scherer Human metabolism and excretion kinetics of the fragrance lysmeralafter a single oral dosage . International Journal of Hygiene and Environmental Health 2017, 220, 123-129.
90. D.McGinty; C.S.Letizia; A.M.Api Fragrance material review on dihydromyrcenol. Food and Chemical Toxicology 2010, 48, S70-S75.
91. Sílvia M.Rocha; Elisabete Coelho; Jitka Zrostlíková; Ivonne Delgadillo; Manuel A.Coimbra Comprehensive two-dimensional gas chromatography with time-of-flight mass spectrometry of monoterpenoids as a powerful tool for grape origin traceability. Journal of Chromatography A 2007, 1161, 292-299.
92. Irfan Bayram; Remzi Erten; Yasemin Bayram; Gulay Bulut; Hanefi Özbek The hepatoprotective effects of dihydromyrcenol and geranyl formate in an experimental model of acute hepatic injury induced by the use of carbon tetrachloride. The Turkish Journal of Gastroenterology 2011, 22 (6), 594-601.
93. Jidong Sun, P. D-Limonene: Safety and Clinical Applications. Alternative Medicine Review 2007, 12 (3), 259-264.

131
94. Rita de Cássia da Silveira e Sá; Luciana Nalone Andrade; Damião Pergentino de Sousa A Review on Anti-Inflammatory Activity of Monoterpenes. Molecules 2013, 18, 1227-1254.
95. Manfred Eggersdorfer Terpenes. In Ullmann's Encyclopedia of Industrial Chemistry, Fritz Ullmann, Stephen Hawkins, Gail Schulz, Wolfgang Gerhartz, William E.Russey, Barbara Elvers, Eds.; John Wiley and Sons, Inc.: 2017.
96. Sabitha Kandi; Vikram Godishala; Pragna Rao; K.V.Ramana Biomedical Significance of Terpenes: An Insight. Biomedicine and Biotechnology 2015, 3 (1), 8-10.
97. Human Metabolome Database Metabocard for 2-Pentylfuran. 2017. Ref Type: Online Source
98. Stephen T.Chambers; Mona Syhre; David R.Murdoch; Fiona Mccartin; Michael J.Epton Detection of 2-Pentylfuran in the breath of patients with Aspergillus fumigatus. Medical Mycology 2009, 47, 468-476.
99. Gerhard Spiteller Peroxidation of linoleic acid and its relation to aging and age dependent diseases. Mechanisms ofAgeing and Develpment 2001, 122, 617-657.
100. Alan R.Brash Lipoxygenases: occurrence, functions, catalysis, and acquisition of substrate. The Journal of Biological Chemistry 1999, 274 (34), 23679-23682.
101. Frederick A.Kuehl, Jr.; Robert W.Egan Prostaglandins, Arachidonic Acid, and Inflammation. Science 1980, 210, 978-984.
102. Mahesh K.Kaushik; Kosuke Aritake; Shinya Kamauchi; Osamu Hayaishi; Zhi-Li Huang; Michael Lazarus; Yoshihiro Urade Prostaglandin D2 is crucial for seizure suppression and postictal sleep. Experimental Neurology 2014, 253, 82-90.
103. Derrick F.MacFabe; Donald P.Cain; Karina Rodriguez-Capote; Andrew E.Franklin; Jennifer E.Hoffman; Francis Boon; A.Roy Taylor; Martin Kavaliers; Klaus-Peter Ossenkopp Neurobiological effects of intraventricular propionic acid in rats: Possible role of short chain fatty acids on the pathogenesis and characteristics of autism spectrum disorders. Behavioural Brain Research 2007, 176, 149-169.
104. Zilda Lopes Pontes; Leandro Silva Oliveira; Renata Franzon; Moacir Wajner; Clovis Milton Duval Wannmacher; Angela Terezinha de Souza Wyse

132
Inhibition of Na+,K+-ATPase Activity from Rat Hippocampus by Proline. Neurochemical Research 2002, 26 (12), 1321-1326.
105. Thierry Grisar, M. P. Glial and Neuronal Na+-K+ Pump in Epilepsy. Annals of neurology 1984, 16(suppl), S128-S134.
106. Wyse AT; Brusque AM; Silva CG; Streck EL; Wajner M; Wannmacher CM . Inhibition of Na+,K+-ATPase from rat brain cortex by propionic acid. NeuroReport [9], 8-1719. 1998.
Ref Type: Abstract
107. Hamideh Moradi; Mohammad A.Asadollahi; Iraj Nahvi Improved g-decalactone production from castor oil by fed-batch cultivation of Yarrowia lipolytica. Biocatalysis and Agricultural Biotechnology 2013, 2 (1), 64-68.
108. M.Vara Prasad; A.Venkata Narayana; Ch.A.I.Raju; T.C.Venkateswarulu; A.V.N.Swamy Optimum production of g-decalactone by Sporidiobolus salmonicolor using Response Surface Methodology. International Journal of ChemTech Research 2014, 6 (7), 3478-3486.
109. José F Sánchez-Sevilla; Eduardo Cruz-Rus; Victoriano Valpuesta; Miguel A Botella; Iraida Amaya Deciphering gamma-decalactone biosynthesis in strawberry fruit using a combination of genetic mapping, RNA-Seq and eQTL analyses. BMC Genomics 2014, 15, 218-233.
110. Xiao-Bing Zhang; Peng Jiang; Neng Gong; Xiao-Ling Hu; Da Fei; Zhi-Qi Xiong; Lin Xu; Tian-Le Xu A-Type GABA Receptor as a Central Target of TRPM8 Agonist Menthol. PLoS ONE 2008, 3 (10), e3386.
111. David D.McKemy; Werner M.Neuhausser; David Julius Identification of a cold receptor reveals a general role for TRP channels in thermosensation. Nature 2002, 416, 52-58.
112. Kartik Venkatachalam; Craig Montell TRP Channels. Annual review of biochemistry 2007, 76, 387-417.
113. Demetrius Antonio Machado de Araújo; hristiane Freitas; ader Santos Cruz Essential oils components as a new path to understand ion channel molecular pharmacology. Life Sciences 2011, 89, 540-544.
114. Danny L.Dunn; Britt S.Scott; Edwin D.Dorsey Analysis of Pilocarpine and Isopilocarpine in Ophthalmic Solutions by Normal-Phase High-Performance Liquid Chromatography. Journal of Pharmaceutical Sciences 1980, 70 (4), 446-449.
115. Philip C.Fox, D.; Jane C.Atkinson, D.; Alice A Macynski, R.; Andy Wolff, D.; David S.Kung, D.; Ingrid H.Valdez, D.; William Jackson, M. P.; Robert

133
A.Delapenha, M.; Jeffrey Shiroky, M.; Bruce J.Baum, D. P. Pilocarpine treatment of salivary gland hypofunction and dry mouth (xerostomia). Archives of Internal Medicine 1991, 151, 1149-1152.
116. Fulvio A.Scorza; Ricardo M.Arida; Maria DA Graça Naffa-Mazzacoratti; Débora A.Scerni; Lineu Calderazzo; Esper A.Cavalheiro The pilocarpine model of epilepsy - what have we learned. Annals of the Brazilian Academy of Sciences 2009, 81 (3), 345-365.
117. Alexandre Ademar Hoeller; Cristiane Ribiero de Carvalho; Roger Walz; Thereza Christina Monteiro de Lima Experimental emotional disorders in epilepsy and the implication of muscarinic acetylcholine receptors: a forgotten putative therapeutic target. Vittalle - Revista de Ciências da Saúde 2016, 28, 27-38.
118. Jennifer L.Berkeley; Michael J.Becker; Allan I.Levy The role of muscarinic acetylcholine receptor-mediated activation of extracellular signal-regulated kinase 1/2 in pilocarpine-induced seizures. Journal of Neurochemistry 2002, 82, 192-201.
119. Gabriel Zimmerman; Marleisje Njunting; Sebastian Ivens; Elsa Tolner; Christoph J.Behrens; Miriam Gross; Hermona Soreq; Uwe Heinemann; Alon Friedman Acetylcholine-induced seizure-like activity and modified cholinergic gene expression in chronically epileptic rats. European Journal of Neuroscience 2008, 27, 965-975.
120. Lechoslaw Turski; Chrysanthy Ikonomidou; Waldemar A.Turski; Zuner A.Bortolotto; Esper A.Cavalheiro Review: Cholinergic Mechanisms and Epileptogenesis. The Seizures Induced by Pilocarpine: A Novel Experimental Model of Intractable Epilepsy. Synapse 1989, 3, 154-171.
121. Douglas J.Sheffler; Richard Williams; Thomas M.Bridges; Zixiu Xiang; Alexander S.Kane; Nellie E.Byun; Satyawan Jadhav; Mathew M.Mock; Fang Zheng; L.Michelle Lewis; Carrie K.Jones; Colleen M.Niswender; Charles D.Weaver; Craig W.Lyndsley; P.Jeffrey Conn A Novel Selective Muscarinic Acetylcholine Receptor Subtype 1 Antagonist Reduces Seizures without Impairing Hippocampus-Dependent Learning. Molecular Pharmacology 2009, 76, 356-368.
122. Christian C.Felder Muscarinic acetyicholine receptors: signal transduction through multiple effectors. The FASEB Journal 1995, 9 (8), 619-625.
123. M.P.Caulfield Muscarinic Receptors-Characterization, Coupling and Function. Pharmacology And Therapeutics 1993, 58 (3), 319-379.

134
124. Rebecca L.Kow Role of Muscarinic Acetylcholine Receptors in Adult Neurogenesis and Cholinergic Seizures. 2014.
125. Alon Friedman; Christoph J.Behrens; Uwe Heinemann Cholinergic dysfunction in temporal lobe epilepsy. Epilepsia 2007, 48, 126-130.
126. Ruyi Xue; Ling Dong; Si Zhang; Chunhui Deng; Taotao Liu; Jiyao Wang; Xizhong Shen Investigation of volatile biomarkers in liver cancer blood using solid-phase microextraction and gas chromatography/mass spectrometry. Rapid Communications in Mass Spectrometry 2008, 22, 1181-1186.
127. Arati A.Inamdar; Muhammad M.Hossain; Alison I.Bernstein; Gary W.Miller; Jason R.Richardson; Joan Wennstrom Bennett Fungal-derived semiochemical 1-octen-3-ol disrupts dopamine packaging and causes neurodegeneration. Proceedings of the National Academy of Science of the United States of America 2013, 110 (48), 19561-19566.
128. Yuri Bozzi; Emiliana Borrelli The role of dopamine signaling in epileptogenesis. Frontiers in Cellular Neuroscience 2013, 7, 1-12.
129. E.Elisabetsky; L.F.Silva Brum; D.O.Souza Anticonvulsant properties of linalool in glutamate-related seizure models. Phytomedicine 1999, 6 (2), 107-113.
130. Human Metabolome Database Metabocard for (R)-3,7-Dimethyl-1,6-octadien-3-ol. 2017.
Ref Type: Online Source
131. Chandan S.Chanotiya; Anju Yadav Enantiomeric Composition of (3R)-(-)- and (3S)-(+)-Linalool in Various Essential Oils of Indian Origin by Enantioselective Capillary Gas Chromatography-Flame Ionization and Mass Spectrometry Detection Methods. Natural Product Communications 2009, 4 (4), 563-566.
132. Pedro Marcos G.Soares; Ricardo F.Lima; Alana de Freitas Pires; Emmanuel P.Souza; Ana Maria S.Assreuy; David N.Criddle Effects of anethole and structural analogues on the contractility of rat isolated aorta: Involvement of voltage-dependent Ca2+-channels. Life Sciences 2007, 81, 1085-1093.
133. Asie Shojaii; Mehri Abdollahi Fard Review of Pharmacological Properties and Chemical Constituents of Pimpinella anisum. ISRN Pharmaceutics 2012, 2012, 1-8.
134. Mohammad Sayyah; Leila Nadjafnia; Mohammad Kamalinejad Anticonvulsant activity and chemical composition of Artemisia dracunculus L. essential oil. Journal of Ethnopharmacology 2004, 94, 283-287.

135
135. Diane L.McKay; Jeffrey B.Blumberg A Review of the Bioactivity and Potential Health Benefits of Peppermint Tea (Mentha piperita L.). Phytotherapy Research 2006, 20, 619-633.
136. M.F.Souza; F.A.Santos; V.S.N.Rao; J.J.C.Sidrim; F.J.A.Matos; M.I.L.Machedo; E.R.Silveira Antinociceptive, Anticonvulsant and Antibacterial Effects of the Essential Oil from the Flower Heads of Egletes viscosa L. Phytotherapy Research 1998, 12, 28-31.
137. Jainendra Jain; Y.Kumar; James Stables; Reema Sinha Menthone Semicarbazides and Thiosemicarbazides as Anticonvulsant Agents. Medicinal Chemistry 2010, 6, 44-50.
138. S.N.Pandeya; U.K.Singh; J.P.Stable; A.Pandey Synthesis and Anticonvulsant Activity of Mannich Bases and Unsaturated Amides: Role of Hydrogen Bonding. International Journal of Chemical Sciences 2009, 7 (3), 1933-1940.
139. Toyoshi Umezu; Akiko Sakata; Hiroyasu Ito Ambulation-promoting effect of peppermint oil and identification of its active constituents. Pharmacology, Biochemistry and Behavior 2001, 69, 383-390.
140. R.L.Smith; W.J.Waddell; S.M.Cohen; V.J.Feron; L.J.Mernett; P.S.Portoghese; I.M.C.M.Rietjens; T.B.Adams; C.Lucas Gavin; M.M.McGowen; S.V.Taylor; M.C.Williams GRAS 24: The 24th publication by the FEMA Expert Panel presents safety and usage data on 236 new generally recognized as safe flavoring ingredients. Food Technology 2009, 63 (6), 46-105.
141. Zainal, B.; Abdah, M. A.; Taufiq Yap, Y. H.; Roslida, A. H.; Mohd Redzuan, S.; Kasran, R. Bioactivity-Guided Fractionation of Potent Anti-Cancer Properties from Non-Edible Tissues of Theobroma cacao. Malaysian Cocoa Journal 2016, 9 (1), 170-181.
142. S.A.Uzakbay; Z.B.Halmenova; A.K.Umbetova; G.Sh.Burasheva; H.À.Aisa Analysis of the Lipophilic Components of the Aerial Parts of the Plant Origanum Vulgare. News of the National Academy of Sciences of the Republic of Kazakhstan. Series of chemistry and technology 2017, 1 (421), 5-8.
143. Haoxing Xu; Nathaniel T.Blair; David E.Clapham Camphor Activates and Strongly Desensitizes the Transient Receptor Potential Vanilloid Subtype 1 Channel in a Vanilloid-Independent Mechanism. The Journal of Neuroscience 2005, 25 (36), 8924-8937.

136
144. Pierre R.Burkhard; Karim Burkhardt; Charles-Antoine Haenggeli; Theodor Landis Plant-induced seizures: reappearance of an old problem. Journal of Neurology 1999, 246, 667-670.
145. M.Cui; P.Honore; C.Zhong; D.Gauvin; J.Mikusa; G.Hernandez; P.Chandran; A.Gomtsyan; B.Brown; E.K.Bayburt; K.Marsh; B.Bianchi; H.McDonald; T.R.Neelands; R.B.Moreland; M.W.Decker; C.-H.Lee; J.P.Sullivan; C.R.Faltynek TRPV1 Receptors in the CNS Play a Key Role in Broad-Spectrum Analgesia of TRPV1 Antagonists. The Journal of Neuroscience 2006, 26 (37), 9385-9393.
146. Mustafa Naziroglu TRPV1 Channel: A Potential Drug Target for Treating Epilepsy. Current Neuropharmacology 2015, 13, 239-247.
147. Mai Furusawa; Toshihiro Hashimoto; Yoshiaki Noma; Yoshinori Asakawa Highly Efficient Production of Nootkatone, the Grapefruit Aroma from Valencene, by Biotransformation. Chemical and Pharmaceutical Bulletin 2005, 53 (11), 1513.
148. Jonas Frohwitter; Sabine A.E.Heider; Petra Peters-Wendisch; Jules Beekwilder; Volker F.Wendisch Production of the sesquiterpene (+)-valencene by metabolicallyengineered Corynebacterium glutamicum . Journal of Biotechnology 2014, 191, 205-213.
149. In Jun Yang; Dong-Ung Lee; Heung Mook Shin Inhibitory Effect of Valencene on the Development of Atopic Dermatitis-Like Skin Lesions in NC/Nga Mice. Evidence-Based Complementary and Alternative Medicine 2016, 2016, 1-11.
150. Joo Hyun Nam; Da-Yeong Nam; Dong-Ung Lee Valencene from the Rhizomes of Cyperus rotundus Inhibits Skin Photoaging-Related Ion Channels and UV-Induced Melanogenesis in B16F10 Melanoma Cells. Journal of Natural Products 2016, 79, 1091-1096.
151. Human Metabolome Database Metabocard for beta-Bourbonene. 2017. Ref Type: Online Source
152. B de Lacy Costello; A Amann; H Al-Kateb; C Flynn; W Filipiak; T Khalid; D Osborne; N M Ratcliffe A review of the volatiles from the healthy human body. Journal of Breath Research 2014, 8, 014001.
153. Nada Bezic; Mirjana Skocibusic; Valerija Dunkic Antimicrobial Effect of Satureja cuneifolia Ten. Essential Oil. Acta Botanica Croatica 1999, 58, 99-104.

137
154. Jagdeep Kaur; Dilrajroop Kaur; Harsimran Singh; M.U.Khan Emblica Officinalis: A Meritocratic Drug for Treating Various Disorders. Indo American Journal of Pharmaceutical Research 2013, 3 (6), 4477-4496.
155. Mohaddese Mahboubi; Nastaran Kazempour; Mona Mahboubi Antimicrobial activity of Rosemary, Fennel and Galbanum essential oils against clinical isolates of Staphylococcus aureus. Biharean Biologist 2011, 5 (1), 4-7.
156. Sujatha Govindaraj; Bollipo D.RanjithaKumari Composition and Larvicidal Activity of Artemisia vulgaris L. Stem Essential Oil Against Aedes aegypti. Jordan Journal of Biological Sciences 2013, 6 (1), 11-16.
157. Adjibode A.G.; Tougan U.P.; Youssao A.K.I.; Mensah G.A.; Hanzen Ch.; Koutinhouin G.B. Synedrella nodiflora (L.) Gaertn: a review on its phytochemical screening and uses in animal husbandry and medicine. International Journal of Advanced Scientific and Technical Research 2015, 3 (5), 436-443.
158. S.P.Bhatia; L.Jones; C.S.Letizia; A.M.Api Fragrance material review on 4-tert-butylcyclohexyl acetate. Food and Chemical Toxicology 2008, 46, S36-S41.

138
APPENDICES
Appendix A
Calibration Curves for standard mixture of human scent VOCs
Figure 36 Calibration curve for 2-pentylfuran

139
Figure 37 Calibration curve for hexanal
Figure 38 Calibration curve for 1-octen-3-ol

140
Figure 39 Calibration curve for 6-methyl-5-hepten-2-one
Figure 40 Calibration curve for 2-furanmethanol

141
Figure 41 Calibration curve for octanoic acid, methyl ester
Figure 42 Calibration curve for benzaldehyde

142
Figure 43 Calibration curve for 1-octanol
Figure 44 Calibration curve for benzyl alcohol

143
Figure 45 Calibration curve for 2-ethylhexanoic acid
Figure 46 Calibration curve for 2-ethylhexanoic acid

144
Figure 47 Calibration curve for octanoic acid
Figure 48 Calibration curve for 6,10-dimethyl-5,9-undecadiene-2-one

145
Figure 49 Calibration curve for 6,10-dimethyl-5,9-undecadiene-2-one

146
Appendix B
IRB Consent Forms
English version
ADULT CONSENT TO PARTICIPATE IN A RESEARCH STUDY
The Investigation of Human Scent from Individuals Diagnosed with Epilepsy for the Identification of a Biomarker for Epileptic Seizures
PURPOSE OF THE STUDY You are being asked to be in a research study. The purpose of this study is to determine the human scent profile of individuals with epilepsy and to identify a possible biomarker for the onset of epileptic seizures. NUMBER OF STUDY PARTICIPANTS If you decide to be in this study, you will be one of 50 people in this research study. DURATION OF THE STUDY Your participation will require 5 months. PROCEDURES If you agree to be in the study, we will ask you to do the following things: 1. Allow hand odor samples to be taken. You will be asked to hold a piece of cotton gauze
between your palms for a period of 10 minutes. 2. Allow breath samples to be taken. You will be asked to exhale into a piece of cotton
gauze. 3. Allow saliva samples to be taken. A cotton-tipped applicator will be used to swab the
inside of both cheeks for a period of 1 minute each. RISKS AND/OR DISCOMFORTS There are no immediate or long-term risks associated with your participation in this study. The collection of a set of samples takes approximately 15 minutes. For the subjects with epilepsy, sampling may be performed twice in 1 day and this may be considered an inconvenience.

147
BENEFITS The following benefits may be associated with your participation in this study: If a biomarker is found for the onset of epileptic seizures, this could lead to the development of training aids, which can lead to more efficiently trained seizure assist dogs that can predict the onset of a seizure. ALTERNATIVES There are no known alternatives available to you other than not taking part in this study. However, any significant new findings developed during the course of the research which may relate to your willingness to continue participation will be provided to you. CONFIDENTIALITY The records of this study will be kept private and will be protected to the fullest extent provided by law. In any sort of report we might publish, we will not include any information that will make it possible to identify a subject. Names will not be recorded. The only identifying information that will be recorded is age, race, height and weight. Research records will be stored securely and only the researcher team and Canine Assistants will have access to the records. However, your records may be reviewed for audit purposes by authorized University or other agents who will be bound by the same provisions of confidentiality. COMPENSATION & COSTS There will be no compensation for participation in this study. You will not be responsible for any costs to participate in this study. MEDICAL TREATMENT Routinely, FIU, its agents, or its employees do not compensate for or provide free care for human subjects in the event that any injury results from participation in a research project. If you become ill or injured as a direct result of participating in this study, contact your regular medical provider. If you have insurance, your insurance company may or may not pay for these costs. If you do not have insurance, or if your insurance company refuses to pay, you will be billed. Funds to compensate for pain, expenses, lost wages and other damages caused by injury are not routinely available. RIGHT TO DECLINE OR WITHDRAW Your participation in this study is voluntary. You are free to participate in the study or withdraw your consent at any time during the study. Your withdrawal or lack of participation will not affect any benefits to which you are otherwise entitled. The investigator reserves the right to remove you without your consent at such time that they feel it is in the best interest. PRIMARY RESEARCHER CONTACT INFORMATION If you have any questions about the purpose, procedures, or any other issues relating to this research study you may contact Philip Davis at Florida International University, 305-348-3694, [email protected].

148
INSTITUTIONAL REVIEW BOARD (IRB) CONTACT INFORMATION If you would like to talk with someone about your rights of being a subject in this research study or about ethical issues with this research study, you may contact the FIU Office of Research Integrity by phone at 305-348-2494 or by email at [email protected]. PARTICIPANT AGREEMENT I have read the information in this consent form and agree to participate in this study. I have had a chance to ask any questions I have about this study, and they have been answered for me. I understand that I am entitled to a copy of this form after it has been read and signed. ________________________________ __________________ Signature of Participant Date ________________________________ Printed Name of Participant ________________________________ __________________ Signature of Person Obtaining Consent Date ________________________________ Name of Person Obtaining Consent ________________________________ __________________ Signature of Primary Researcher Date ________________________________ Name of Primary Researcher

149
Spanish version
DOCUMENTO DE CONSENTIMIENTO A PARTICIPACIÓN EN ESTUDIO DE INVESTIGACIÓN
Investigación de olor humano a pacientes diagnosticados con epilepsia para la identificación de marcadores biológicos de convulsiones epilépticas
PROPÓSITO DEL ESTUDIO Usted es candidato para participar en un estudio de investigación. El propósito de este estudio es determinar el perfil de olor humano de aquellos individuos diagnosticados con epilepsia con el propósito de identificar posibles marcadores biológicos. NUMERO DE PARTICIPANTES Si usted decide participar de este estudio, será uno de 50 participantes. DURACION DEL ESTUDIO Su participación requiere 5 meses. PROCEDIMIENTO Si usted está de acuerdo con la participación en el estudio deberá seguir las siguientes indicaciones:
1. Permitir la colección de muestras de olor de sus manos. Deberá sujetar una gaza de algodón entre las palmas de sus manos por un periodo de 10 minutos.
2. Permitir la colección de muestras de su aliento. Deberá exhalar hacia un pedazo de gaza de algodón.
3. Permitirla colección de saliva. Un bastoncillo de algodón (Q-tip) será frotado entre sus mejillas por un periodo de 1 minuto en cada lado.
RIEGOS Y/O INCOMODIDADES No hay ningún riesgo asociado a su participación en este estudio. La colección de muestras tomara aproximadamente 15 minutos. La colección de muestra de aquellos individuos diagnosticados con epilepsia puede ser tomada dos veces al día, esto podría ser considerado una inconveniencia BENEFICIOS Los siguientes beneficios pueden estar asociados con su participación en el estudio. De encontrar marcadores biológicos para las convulsiones estos podría ser utilizado para el desarrollo de elementos para el entrenamiento de caninos, esto podría ayudar a mejorar la

150
eficiencia en el entrenamiento de aquellos perros de servicio capaces de predecir el momento de alguna convulsión. ALTERNATIVAS No hay ninguna alternativa conocida aparte de usted formar parte de este estudio. Sin embargo, si durante el transcurso del estudio se descubre algo significativo que involucre participación en este estudio, esto se le dará a conocer. CONFIDENCIALIDAD Todo archivo relacionado a este estudio será confidencial y el mismo estará completamente protegido por ley. En caso de alguna publicación, no será incluida ninguna información que pueda ser utilizada para la identificación de los participantes del estudio. Los nombres de los participantes no serán registrados. La única información que será colectada para la identificación de aquellos que participen será la edad, raza, altura y peso. Los archivos de investigación serán guardados y solo los investigadores y asistentes caninos tendrán acceso a estos. Sin embargo, los archivos podrían ser evaluados para auditoria por la universidad o algún agente que esté involucrado en el estudio. COMPENSACIÓN Y COSTO No habrá ninguna compensación por su participación en este estudio. Usted no será responsable de ningún gasto para participar en este estudio. TRATAMIENTO MÉDICO Usualmente, FIU, sus agentes, o empleados no compensan o proveen cuidado a sujetos en caso de que ocurrir alguna lesión como resultado de su participación en este estudio de investigación. De usted resultar enfermo o sufrir de alguna lesión como consecuencia directa de su participación en este estudio, contacte su proveedor médico. De tener cobertura médica, su compañía de seguro podría o no hacerse responsable de este costo. De no tener cobertura médica, o si su compañía de seguro se niega a pagar, usted será facturado. Fondos para compensar por dolor, gastos, salario perdido, y otros daños causados por lesiones no están disponibles. DERECHO A RECHAZAR O RETIRARSE Su participación en este estudio es completamente voluntaria. Usted está libre de participar en este estudio o retirarse del mismo en cualquier momento. Su retiro o falta de participación en el estudio no afectará ninguno de beneficios a los cuales usted tiene derecho. El investigador se reserva el derecho de removerlo del estudio con o sin su consentimiento si este cree, que es en el mejor de los intereses para el/la participante. INFORMACIÓN DE CONTACTO (INVESTIGADOR PRINCIPAL) De tener alguna pregunta relacionada al propósito, procedimiento, o algún otro problema relacionado al estudio de investigación puede comunicarse con Philip Davis a Florida International University, 305-348-3694, [email protected]

151
INFORMACIÓN DE CONTACTO (IRB) Si desea hablar con alguien acerca de sus derechos de ser participante de este estudio de investigación o acerca de algún problema de ética con el estudio, puede comunicarse con la Oficina de Integridad en la Investigación en FIU vía telefónica al 305-348-2494 o por correo electrónico a [email protected]. ACUERDO DEL PARTICIPANTE He leído la información en este documento de consentimiento y estoy de acuerdo con mi participación en este estudio. Tuve la oportunidad de hacer las preguntas que tenía acerca del estudio y estas han sido contestadas. Entiendo que se me permita obtener una copia de este documento luego de ser leído y firmado. ________________________________ __________________ Firma de el/la Participante Fecha ________________________________ Nombre Completo de el/la Participante ________________________________ __________________ Firma del Padre/Guardian Fecha ________________________________ Nombre Completo del Padre/Guardian ________________________________ __________________ Firma de Persona Obteniendo el Consentimiento Fecha ________________________________ Nombre Completo de Persona Obteniendo el Consentimiento ________________________________ __________________ Firma de Investigador Principal Fecha ________________________________ Nombre Completo de Investigador Principal

152
VITA
PHILIP DAVIS
Born, Bridgetown, Barbados
1997-2007 B.S. Chemistry Florida International University Miami, FL
2006-2007 Undergraduate Research Assistant Florida International University Miami, FL
2012 Teaching Assistant Florida International University Miami, FL
2012-2014 Research Assistant Florida International University Miami, FL
2014-2017 Teaching Assistant Florida International University Miami, FL
PUBLICATIONS AND PRESENTATIONS
Davis, P., Rose, S., Furton, K. An Investigation into Volatile Organic Compounds that have the Potential to Cause False Positives in Blood Alcohol Analysis. (in preparation) Davis, P., Furton, K. The Determination of Potential Volatile Biomarkers for Epilepsy Using Solid-Phase Microextraction with Gas Chromatography-Mass Spectrometry. (in preparation) Davis, P., Rose, S., Furton, K. Advancement in the Qualitative and Quantitative Analysis of Volatile Organic Compounds found in Human Breath and Blood for Medical and Forensic Purposes Using SPME-GC-MS. Florida Annual Meeting and Exposition (FAME) Tampa, FL; May 2011

153
Davis, P., Rose, S., Furton, K. An Investigation Into Volatile Organic Compounds that have the Potential to Cause False Positives in Blood Alcohol Analysis. Annual American Academy of Forensic Sciences (AAFS) Meeting; Seattle, WA; February 2013 Davis, P., Kabir, A., Furton, K. Development of Improved Extraction and Analysis Technique for Human Scent Evidence Analysis. Annual American Academy of Forensic Sciences (AAFS) Meeting; Seattle, WA; February 2014