The Interplay between Cumulative Customer Satisfaction and Brand Value: Its Effect on Cash Flow, ROI...
33
AUTONOMOUS UNIVERSITY OF BARCELONA BUSINESS ECONOMICS DEPARTMENT THE INTERPLAY BETWEEN CUMULATIVE CUSTOMER SATISFACTION AND BRAND VALUE: ITS EFFECT ON CASH FLOW, ROI AND TOBIN’S Q Luis Fernando Angulo Josep Rialp [email protected] [email protected] (+34) 93.581.1209 (+34) 93.581.2266 Departament d’Economia de l’Empresa Fac. CC. Econòmiques i Empresarials - Edifici B Universitat Autònoma de Barcelona 08193 Bellaterra (Cerdanyola del Vallès) Barcelona (Espanya) August 18, 2007
-
Upload
independent -
Category
Documents
-
view
4 -
download
0
Transcript of The Interplay between Cumulative Customer Satisfaction and Brand Value: Its Effect on Cash Flow, ROI...
AUTONOMOUS UNIVERSITY OF BARCELONA
BUSINESS ECONOMICS DEPARTMENT
THE INTERPLAY BETWEEN CUMULATIVE CUSTOMER SATISFACTION AND BRAND VALUE:
ITS EFFECT ON CASH FLOW, ROI AND TOBIN’S Q
Luis Fernando Angulo Josep Rialp [email protected] [email protected] (+34) 93.581.1209 (+34) 93.581.2266
Departament d’Economia de l’Empresa Fac. CC. Econòmiques i Empresarials - Edifici B
Universitat Autònoma de Barcelona 08193 Bellaterra (Cerdanyola del Vallès)
Barcelona (Espanya)
August 18, 2007

THE INTERPLAY BETWEEN CUMULATIVE CUSTOMER SATISFACTION AND
BRAND VALUE: ITS EFFECT ON CASH FLOW, ROI AND TOBIN’S Q ABSTRACT This research focuses its attention to empirically investigate the interplay between cumulative customer satisfaction and brand value as well as its effect over firms’ performance. As literature review suggests, both cumulative customer satisfaction and brand value have been probed as regards the isolated impact of each of them on financial performance. Nevertheless, when both of them put together into action, there is no empirical evidence which support such interplay effect. Theoretically speaking, both cumulative customer satisfaction and brand value play a strategic role in marketing. Based on resource based view, marketing paradigm approach, market-based assets perspective and operational management; we found a theoretical link between them. The link have been called marketing efficiency, i.e. the ability of firms to maximize both cumulative customer satisfaction and brand value, better than competitors, under the same amount of marketing expenditures. In that sense, we provide empirical evidence through modelling marketing efficiency using data envelopment analysis and researching the effect of such interplay applying three stages least square regression. The results demonstrate that marketing efficiency has a positive direct effect on Cash flow and ROI, and positive indirect effect, through Cash flow, on Tobin’s Q. Keywords: Brand Value, Cumulative Customer Satisfaction, Marketing Efficiency, Cash flows, ROI and Tobin’s Q.
2

1. PROBLEM STATEMENT AND PURPOSE
One of the current challenges in marketing is the interplay1 between customer and brand management. In a recent conference of the Association of National Advertisers of the United States of America, the chief executive officer of one titan brand around the globe urged on marketers to let go brand management and focus on customer management. Contrarily, the vice president-marketing of another giant brand suggested to the audience to focus on brand management2.
The relevance of customer and brand approaches in marketing is not only discussed by practitioners but by marketing scientists as well. In this respect, Marketing Science Institute considered studies related to “connecting metrics with marketing strategy” as one of its top research priorities (MSI 2006)3.
Moreover, marketing researchers have regarded customers and brands as marketing assets that contribute to firm’s profitability (Srivastava et al. 1998; 2001). Furthermore, management scientists have recognized the importance of those assets as determinants of the firm’s strategy and performance (Amit and Shoemaker 1993; Barney 1991; Grant 1991; Peteraf 1993; Wernerfelt 1984). Accordingly, the research topic is supported by practitioners, marketing researchers and management scientists.
Going to the topic, customer management is related to links between customer and product (e.g. expectative, perceived quality), customer and service delivery (e.g. experience with product, loyalty), and customer and financial accountability (e.g. repurchase, sales, margin) (Moorman and Rust 1999; Srivastava et al. 1999). Those involved aspects of customer management are interrelated with concerned factors of customer satisfaction. That is, the antecedents of customer satisfaction have been stated as customer expectative, perceived quality and perceived value. The consequences have been settled as customer loyalty and word-of-mouth (Anderson and Sullivan 1993; Fornell 1992; Fornell et al. 1996).
In addition to that, customer satisfaction has been studied from two perspectives: transactional and cumlative. In a transactional perspective, customer satisfaction is viewed as a customer evaluation of a specific buying situation. Nevertheless, in a cumulative perspective, customer satisfaction is the result of an overall evaluation of whole purchase and consumption experience with a good or service over the time (Anderson et al. 1994: 55; Auh and Johnson 2005: 37; Fornell 1992:11). Moreover, cumulative customer satisfaction is more appropriate to study and analyze the effect of customer management efforts on firms’ financial performance4 (Fornell et al. 1996). Consequently, in this research we work with cumulative customer satisfaction.
On the other hand, brand management has two distinct but associated definitions: customer and financial brand management. From customer standpoint, brand management is related with building strong brands based on brand awareness and brand image (Keller 1993). Going farther, taking current and future revenues as proxies of brand awareness and brand image, financial brand management is the process of linking stable brand names to managing earnings and cash flows (Kerin and Sethuraman 1998). Both perspectives intend to account 1 We understand interplay as the interaction and relationship between cumulative customer satisfaction and brand value. 2 See adage.com/abstract.php?article_id=112311 and adage.com/abstract.php?article_id=112302 3 Specifically topics related to measuring the impact of marketing actions and marketing strategy on firm value, and analyzing the relationship between brand value and customer value. See www.msi.org/research/index.cfm 4 In firms with more than one product, as the business reality evidences, cumulative perspective gathers the overall purchase experience of customer with a firm instead of with a specific product (Fornell et al. 1996). Accordingly, cumulative customer satisfaction fits with financial performance, and the link between them can be analyzed.
3
for the mental representation of brands in customers minds (Ambler 2000; Keller and Lehmann 2003). However, brand management from financial standpoint tends to be broader and corporate oriented, i.e. it captures brand value of a firm as a whole, as a basket of brands. For that reasons, we use brand value5 from financial standpoint as measure of brand management6.
Additionally to conceptual approaches, a number of empirical studies of the link between marketing assets and firm performance have been developed. Firms’ performance has been analyzed from two viewpoints. Accounting-based performance viewpoint is associated with operating results such as revenues, profits, return on investment and cash flows. However, capital market-based performance viewpoint is related to stock returns, market value of equity and Tobin’s Q. As a whole cumulative customer satisfaction has shown positive effects on return on investment, cash flow generation and Tobin’ Q (Anderson et al. 1994, 2004; Gruca and Rego 2005). In the same line, brand value has revealed positive linking to net income, stock returns and market value of equity (Barth et al. 1998; Chu and Keh 2006; Kerin and Sethuraman 1998; Madden et al. 2006).
The empirical evidence reveals that cumulative customer satisfaction and brand value leads to profitability. However, those effects have been studied isolated from each other. Researchers have supposed that firms follow either increasing customer satisfaction or growing brand value. As suggested by business press, there are firms that pursue not only increasing cumulative customer satisfaction but also growing brand value (ACSI 2007; Interbrand 2007).
Both approaches analyzed together have different mechanisms to impact firms’ performance (Ambler et al. 2002; Anderson and Sullivan 1993; Keller 1993, 2003). Theoretically, the main difference between cumulative customer satisfaction and brand value resides in that the former relies on the marketing defensive paradigm; however, brand value rests on the marketing offensive paradigm. While cumulative customer satisfaction intends to fend off customers, brand value tries to generate new customers (Ambler et al. 2002; Keller and Lehmann 2006; Leone et al. 2006). Cumulative customer satisfaction looks for customer retention, i.e. maintaining customers; and brand value searches for customer acquisition, i.e. attracting potential customers.
Notwithstanding the increasing interest in research about the effect of cumulative customer satisfaction and brand value on performance, empirical studies which focus on delving the interplay between the two is left unexamined. We consider that such an interplay can be better captured by what is called marketing efficiency. The concept and measurement approach of marketing efficiency that we propose is able to simultaneously capture the interaction between different marketing assets (e.g. cumulative customer satisfaction and brand value) under a specific amount of marketing activities.
In referring to the concept of marketing efficiency, Rust et al. (2004) suggested that it is the link between marketing activities and short and long term performance. However, we consider that marketing is not only activities but also assets. In that sense, Sheth et al. (2002) when define marketing efficiency suggest the idea of getting loyal customers at low marketing costs. Nevertheless, competition is not considered neither in the definition of Rust et al. (2004) nor in the one of Sheth et al. (2002).
We define marketing efficiency as the ability of marketing to maximize firms’ cumulative customer satisfaction and brand value, better than rivals, under the same amount
5 Brand value has been also called brand equity (Kerin and Sethuraman 1998) 6 Barth et al. (1998) suggest that brand values are relevant to evaluating the performance of brand managers because the single most important asset a brand manager must manage is the brand itself.
4

of expenditures in marketing activities.7 It is relevant to note that marketing efficiency related concepts have been empirically developed but in a narrow perspective. For instance, Mittal et al. (2005) only focus in one marketing asset and propose the concept of customer satisfaction efficiency. Mukherjee et al. (2003) and Kamakura et al. (2002) just focus on one specific antecedent of customer satisfaction and propose the concept of service quality efficiency. Our work intends to be broader and employ the concept of marketing efficiency considering two important marketing assets: cumulative customer satisfaction and brand value.
Reinforcing the lack of research stated above, studies that focus on the broad concept of marketing efficiency as an influencer of firms’ financial performance is another research gap. Therefore we expect to fill the gaps in literature by shedding light on the following research objectives. The first is related to measuring the interplay between cumulative customer satisfaction and brand value based on marketing efficiency. The second objective intends to demonstrate whether the marketing efficiency has positive effect on performance of firms.
The remaining part of this paper is organized as follows. Firstly, the theoretical framework of the interplay between brand management and customer management performance, the role of marketing activities in that interplay, and hypotheses are presented. Secondly, the models for measuring marketing efficiency and its impact on financial performance are stated. Thirdly, the research methodology, including sample, data bases, measures and research techniques, is developed. Finally, the results, discussion and conclusion are presented.
2. THEORETICAL FRAMEWORK: THE INTERPLAY BETWEEN CUSTOMER SATISFACTION AND BRAND EQUITY8
The Resource based-view (RBV) theory recognizes the importance of a firm’s internal organizational resources as determinants of the firm’s strategy and performance (Barney 1991; Grant 1991; Wernerfelt 1984). Barney (1991) defines the term internal organizational resources as all assets, capabilities, organizational processes, and knowledge, that are controlled by a firm and that enable it to envision and implement strategies to improve its efficiency and effectiveness.
Although RBV recognizes that a firm’s physical resources are important determinants of performance, it places primary emphasis on the intangible and organizational resources of the firm (Barney 1991). In addition to that, combining intangibles resources and structural characteristics, firms obtain intangibles that have been called key strategic factors (Amit and Schoemaker 1993). Taking the concept of key strategic factors to marketing, firms develop market-assets9 or assets that are the result of the commingling between marketing intangibles resources and environment (Srivastava et al. 1998). The most important market-assets are customer satisfaction and brand equity (Aaker and Jacobson 1994; Ambler et al. 2002; Anderson et al. 1994; Fornell et al. 2006; Keller 1999; Keller and Lehmann 2003; Srivastava et al. 1998).
As stated in the problem statement, the empirical evidence has shown that customer satisfaction and brand equity leads to profitability. However, both approaches have different
7 The definition of marketing efficiency is based on the definition of technical efficiency used in operation management (e.g. Farrell 1957; Charnes et al. 1978; Kumbhakar and Lovell 2000). 8 Brand equity refers to brand management from customer and financial perspectives. 9 Under the conception of dynamic capabilities approach, market-based assets can be also named positions that firms have gained in the industry (Teece et al. 1997)
5

mechanisms to improve profitability (Anderson et al. 2004; Anderson and Sullivan 1993; Keller 1993; 2003; Keller and Lehmann 2003). Hence, what is the interplay between customer satisfaction and brand equity?
There are two paradigms in marketing: offensive and defensive marketing (Fornell and Wernerfelt 1987, 1988). Offensive marketing underlines strategies designed to obtain additional customers, support brand switching, and increase purchase frequency. Essentially, offensive marketing emphasizes in generating new customers – customer acquisition. Defensive marketing, on the other hand, fends off from competitors and underscores reducing customers exit and patronage switching, i.e. customer retention.
While the goal of offensive marketing is to attract competitor dissatisfied buyers, the goal of defensive paradigm is to maximize customer retention and to minimize dissatisfaction and grievance. Offensive paradigm focuses on competition10 whereas defensive marketing centres on customer. Both offensive and defensive paradigms have been developed in saturated markets which characterize for intensive competition and high quality elasticity of demand. The interaction between offensive and defensive marketing paradigms has been stated as negative, i.e. there is a trade-off between them.
As the cornerstone of customer satisfaction is to evaluate the experience of customer with the product in order to increase retention, repurchase intention, loyalty and reduce complaints (e.g. Anderson and Sullivan 1993; Anderson et al. 1994), customer satisfaction is in actual fact a defensive marketing strategy (See Fornell 1992, Rust and Zahorik 1993 and Zeithaml 2000). On the other hand, the keystone of brand equity is mainly to increase intangible asset in current customers’ minds -customers that have experienced with the brand (Ambler 2000: 61; Keller 2003). However, as one goal of brand equity is to maximize exposure of brands (brand awareness); it will potentially generate mental representation of the brands in potential customers and general audience, who have not experienced with the product yet (Keller 1993). Accordingly, the goal of brand equity will go beyond keeping current customers and it is related to generating new customers (Ambler et al. 2002; Keller and Lehmann 2006; Leone et al. 2006). Hence, brand equity is actually an offensive marketing strategy.
When firms look for increasing financial performance, they have two choices, one related to increasing revenues and the other associated with minimizing costs or what have been called revenues expansion and cost reduction, respectively. Obviously, the ideal choice would be expanding revenues and reducing costs at the same time, or following a dual emphasis (Rust et al. 2002). In the case of customer satisfaction, revenues expansion and cost reduction orientations depend on the kind of industry. In services industry, customer satisfaction will increase profitability through revenues expansion. In goods industries, customer satisfaction will enhance bottom-line performance by reduction of costs (See Rust et al. 2002). Services industry is characterized by customer heterogeneity (different targets to attend); while goods industry is attributed by customer homogeneity (lesser targets to attend) (Anderson et al. 1997). Customer satisfaction in services tends to aim customization while in goods it is likely to seek standardization. More employees, for instance, will be needed in services industry in order to attend different targets and boost customer satisfaction; whereas less employees will be occupied in goods industries in order to serve less targets and augment customer satisfaction level (Anderson et al. 1997).
10 Both offensive and defensive paradigms take competition into account. However, offensive paradigm places more emphasis on it due to the fact that firms are capturing new customers from new entrants to market or customers lost of competitors (Rust and Zahorik 1993).
6
In relation to brand equity, the orientation on revenues expansion and cost reduction depends on industry characteristics as well. In services industry, brand equity will increase profitability through revenues expansion; while in goods industry brand equity will increase profits by cost reduction. As services industries are characterized by heterogeneity of customers and customization of service, more marketing effort will be necessary to create and increase mental representation of brands on heterogeneous potential customers (Ambler et al. 2002; Keller 1993). Nevertheless, in goods industry characterized by standardization of products, brand equity efforts to acquire new customers will be less than those of services.
Customer satisfaction and brand equity have been considered the most important assets of marketing. Assets that are the result of the commingling between the firm and its environment. Assets that go beyond the traditional assumptions based on specificities of organization. Assets that are largely intangible and off-balance instead of being largely tangible and on-balance (Srivastava et al. 1998). Tangible assets can be capitalized, are recognized as assets and are reported on firms’ balance sheet. Quite the reverse, intangibles assets (e.g. customer satisfaction efforts) are expensed and written off in the income statement together with regular expenses such as wages (Villalonga 2004). Accordingly, the book value of assets do not reveal the stock11 of customer satisfaction and brand equity that results from cumulative investments in marketing activities. The stock of customers’ mental representation about the brand is intangible brand equity (Ambler 2000; Keller 1993). The stock of customers’ positive evaluation of experience with the product is intangible customer satisfaction (Fornell 1992; Srivastava et al. 1998).
Customer satisfaction and brand equity have been also regarded as long-term assets that assure firms’ long-term profitability (Ambler et al. 2002; Fornell et al. 2006; Keller 1999; Keller and Lehmann 2003, 2006; Rust et al. 2004; Srivastava et al. 1998). The effects of customer satisfaction over long-term performance obey to customer loyalty and repurchase (Anderson and Sullivan 1993; Anderson et al. 1994) as well as the focus on current customers (Ambler et al. 2002; Fornell and Wernerfelt 1987, 1988). In contrast, the link between brand equity and long-term financial performance is due to memory effects of potential customers becoming new customers along the years (Ambler et al. 2002; Keller 1993, 1999).
The interplay between customer satisfaction and brand equity intangibles depends also on structural characteristics of industry. Customer demand growth or decline (Amit and Schoemaker 1993; Porter 1980) would affect the interplay between customer satisfaction and brand equity. When customer demand grows, the stock of brand equity has to be enough in order to attract new customers. In contrast, when customer demand declines, the stock of customer satisfaction has to be enough in order to maintain current customers. In addition to that, competition configuration (Amit and Schoemaker 1993; Porter 1980) is another structural characteristic related to customer satisfaction and brand equity. The more intensive the competition and the more rivalry in a specific industry, the more stock of customer satisfaction is necessary to maintain current customers (Anderson and Sullivan 1993; Anderson et al. 1994), and the more stock of positive mental representation of brand will be required to build in customers’ minds (Keller and Lehmann 2003) in order to maintain them and generate purchase.
Customer satisfaction and brand equity have to take into account internal factors as well. There are firms that focus in only one segment12 of industry, and others that focus on more than one segment. The minimum expression of customer satisfaction and brand equity 11 Stock refers to a specific amount of customer satisfaction and brand equity (Srivastava et al. 1998) 12 The number of segments refers to level of firms diversification (Rao et al. 2004)
7
depends on one brand/product specification13 (Fornell et al. 1996; Keller 1993, 2003). Accordingly, the number of segments or the number of brands will have an effect over the link between marketing intangibles and firms’ performance (Rao et al. 2004; Gruca and Rego 2005).
In relation to brand equity, being on different segments or having different brands will reduce brand awareness of firms (Keller 1993). However that reduction will be mitigated if firms have one corporate brand for their different segments (Rao et al. 2004). In reference to customer satisfaction, as it needs the experience with the product (Fornell 1992), product quality will be in danger when firms diversify in new markets and new products that they do not have a deep knowledge and experience yet. In that sense when firms diversify in new markets, customer satisfaction and brand equity become difficult to increase.
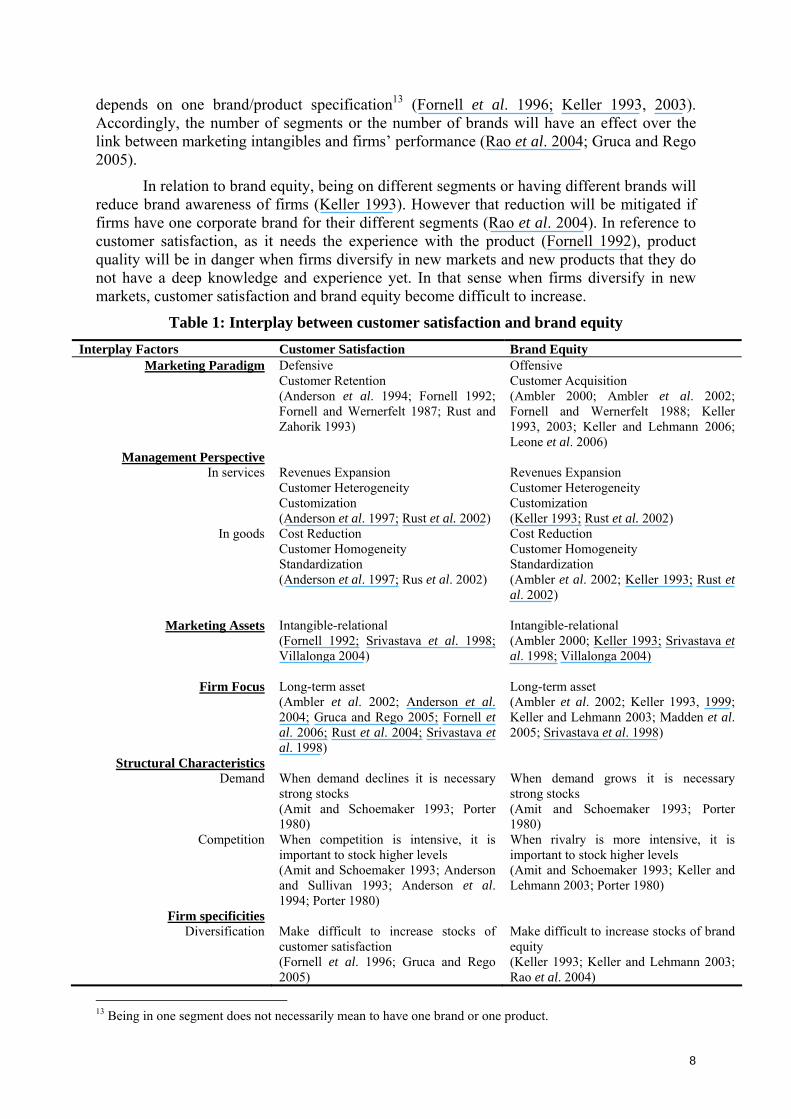
Table 1: Interplay between customer satisfaction and brand equity Interplay Factors Customer Satisfaction Brand Equity
Marketing Paradigm Defensive Customer Retention (Anderson et al. 1994; Fornell 1992; Fornell and Wernerfelt 1987; Rust and Zahorik 1993)
Offensive Customer Acquisition (Ambler 2000; Ambler et al. 2002; Fornell and Wernerfelt 1988; Keller 1993, 2003; Keller and Lehmann 2006; Leone et al. 2006)
Management Perspective In services Revenues Expansion
Customer Heterogeneity Customization (Anderson et al. 1997; Rust et al. 2002)
Revenues Expansion Customer Heterogeneity Customization (Keller 1993; Rust et al. 2002)
In goods Cost Reduction Customer Homogeneity Standardization (Anderson et al. 1997; Rus et al. 2002)
Cost Reduction Customer Homogeneity Standardization (Ambler et al. 2002; Keller 1993; Rust et al. 2002)
Marketing Assets Intangible-relational
(Fornell 1992; Srivastava et al. 1998; Villalonga 2004)
Intangible-relational (Ambler 2000; Keller 1993; Srivastava et al. 1998; Villalonga 2004)
Firm Focus Long-term asset
(Ambler et al. 2002; Anderson et al. 2004; Gruca and Rego 2005; Fornell et al. 2006; Rust et al. 2004; Srivastava et al. 1998)
Long-term asset (Ambler et al. 2002; Keller 1993, 1999; Keller and Lehmann 2003; Madden et al. 2005; Srivastava et al. 1998)
Structural Characteristics Demand When demand declines it is necessary
strong stocks (Amit and Schoemaker 1993; Porter 1980)
When demand grows it is necessary strong stocks (Amit and Schoemaker 1993; Porter 1980)
Competition When competition is intensive, it is important to stock higher levels (Amit and Schoemaker 1993; Anderson and Sullivan 1993; Anderson et al. 1994; Porter 1980)
When rivalry is more intensive, it is important to stock higher levels (Amit and Schoemaker 1993; Keller and Lehmann 2003; Porter 1980)
Firm specificities Diversification Make difficult to increase stocks of
customer satisfaction (Fornell et al. 1996; Gruca and Rego 2005)
Make difficult to increase stocks of brand equity (Keller 1993; Keller and Lehmann 2003; Rao et al. 2004)
13 Being in one segment does not necessarily mean to have one brand or one product.
8

In summary, customer satisfaction and brand equity have some differences and commonalities (see table 1). Customer satisfaction follows a defensive marketing paradigm; however brand equity pursues an offensive paradigm. While in service industries management perspective of both of them is revenues expansion, in goods industries customer satisfaction and brand equity focus on cost reduction perspective. Both of them are intangible marketing assets and focus on long term. Stocks of customer satisfaction and brand equity become difficult to increase when firms follow higher levels of diversification. Stocks of customer satisfaction and brand equity have to be strong when demand declines and competition is intensive.
2.1. The role of marketing activities in the interplay between customer satisfaction and brand equity
Marketing actions involved in marketing program, such as new product development (e.g. research, development and design), trade or intermediary support (e.g. packaging, density of the distribution channel), marketing communications (e.g. advertising), and other marketing related activities (e.g. direct mail, customer relationship marketing, sales promotion, couponings, catalogs, business publications, special events) (Keller and Lehmann 2003; Van Waterschoot and Van den Bulte 1992) can help build marketing assets such as customer satisfaction and brand equity, and in turn, deliver short-term and long-term profitability (Rust et al. 2004; Srivastava et al. 1998). However there is research that has jumped that chain (activities-assets-performance) and has studied links between marketing activities and accounting-based measures such sales, profits and return on investments. The most studied marketing activity in this topic has been advertising, and it has been connected to sales (Assmus et al. 1984; Clarke 1976; Dekimpe and Hanssens 1995), to net income (Jedidi et al. 1999), and return on investment (Danaher and Rust 1996; Fitzgerald 2004). All of them assumed that advertising has indirect effects on accounting-based measures. The direct effect of advertising goes from consumer mind, purchase intention, and buying to sales, net income and return on investment.
The whole process of marketing in generating value to firm has been called brand value chain (Keller and Lehmann 2003) or marketing productivity chain (Rust et al. 2004). Following the rationale of the marketing value chain, the value stage after marketing activities is customer mindset or customer impact, and follows accounting impact and capital market value. In the customer impact stage, marketing activities generate and accumulate by time customer satisfaction and brand equity. That is why it is better to first measure marketing value by focusing on what marketing generate, i.e. from marketing activities to customer satisfaction and brand equity, and second centre on accounting and capital market-based performance of marketing (e.g. Chu and Keh 2006; Gruca and Rego 2005).
As suggested by extant literature, the antecedents of customer satisfaction are product quality and customer expectative (e.g. Anderson and Sullivan 1993). Product quality is directly linked to experience with the product; however customer expectative is not necessarily involved with that experience. It can change before or after experience with product. Besides, as customer satisfaction is an evaluation of the experience with a product, it requires that customers have experience with the product (Fornell 1992).
Traditionally, marketing activities (e.g. initiatives for improving quality) have been directly linked to transactional customer satisfaction (Rust and Zahorik 1993; Rust et al. 1995; Rust et al. 1999). However, in cumulative customer satisfaction, marketing activities (e.g. advertising and other marketing related activities) that shape product expectation and product quality have been emphasized. Specifically, advertising initiatives influence
9

10
customer expectation formation through information and makes product quality easy to evaluate (Anderson and Sullivan 1993:132).
With respect to brand equity, any potential encounter with the brand (be experienced or not, be initiated by a marketing activity or not) has the opportunity to change the mental representation of the brand in customer memory (Ambler 2000; Keller 2003), and in turn, increase or decrease brand equity. Marketing activities, hence, affects customer brand awareness and brand image (Keller 1993).
The main role of marketing activities, such as advertising, is to build brand awareness. Advertising and other marketing related activities (e.g. direct mail, customer relationship marketing, sales promotion, special events) can increase consumer awareness or familiarity of brands (Keller 1993, 2003).
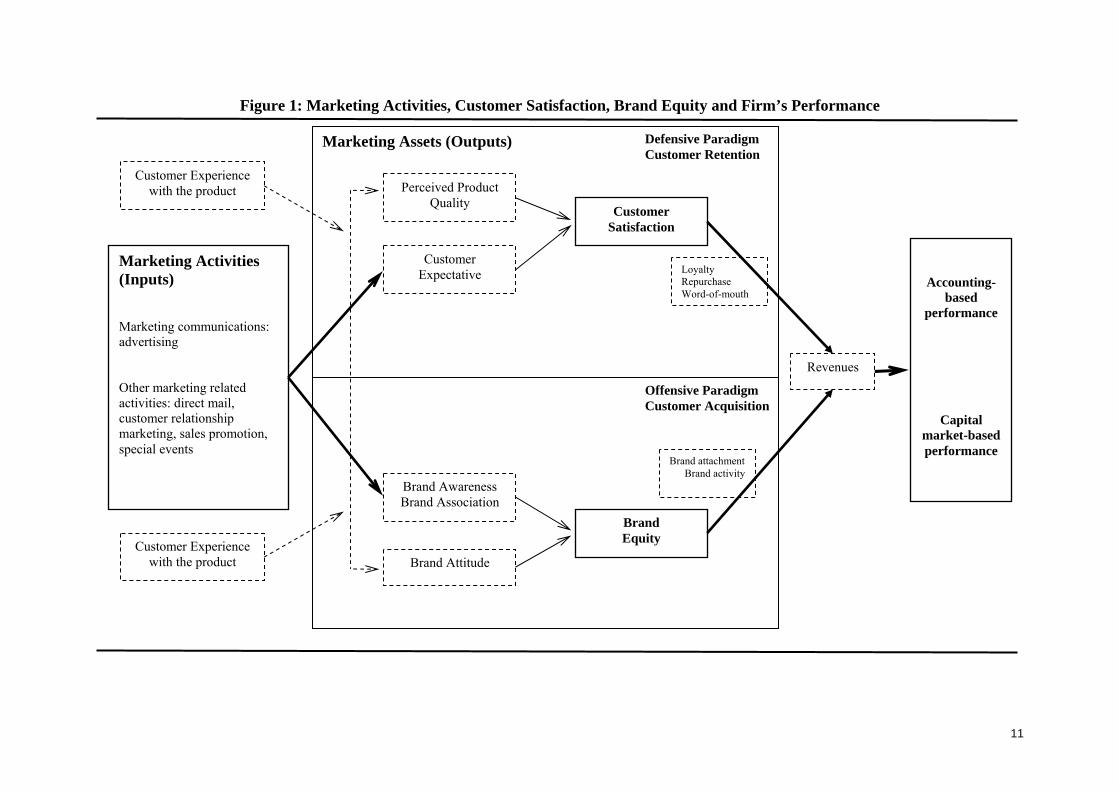
In summary (see figure 1), marketing activities lead changes in different dimensions of customer satisfaction (customer expectation) and brand equity, i.e. brand awareness and brand association (Anderson and Sullivan 1993; Keller and Lehmann 2003). Additionally, customer satisfaction and brand equity have some dimensions that require the customer experience with the product, i.e. perceived product quality and brand attitude, respectively (Aaker and Jacobson 1994; Aaker and Jacobson 2001; Frieder and Subrahmanyam 2005; Rust and Zahorik 1993; Rust et al. 1995). Furthermore, marketing assets materialize in financial performance through loyalty, repurchase, word-of-mouth, brand attachment and brand activity.
2.2. Stating hypotheses: Introducing Marketing Efficiency
As the current literature has revealed, market-assets have different mechanisms to increase profitability. Extant literature only supports isolated effects of customer satisfaction and brand equity on profitability (e.g. Anderson and Sullivan 1993; Anderson et al. 2004; Aaker and Jacobson 2001; Madden et al. 2006; Chu and Keh 2006). However, interplay factors (see table 1) are capable of sustaining the dual mechanism of customer satisfaction and brand equity over firm’s performance. Customer satisfaction follows a defensive marketing paradigm; meanwhile brand equity pursues an offensive marketing paradigm. Customer satisfaction looks for customer retention; however brand equity search for customer acquisition (see also Ambler et al. 2002; Keller and Lehmann 2006; Leone et al. 2006). Both of them pursue different ways that lead bottom-line performance.
In order to simultaneously maximize customer satisfaction and brand equity, we consider to base our analysis on what is called marketing efficiency. Sheth et al. (2002) define marketing efficiency as the ratio of marketing outputs over inputs. We would like to point out that marketing efficiency is usually confused with the concept of marketing productivity although these concepts are different. When analyzing productivity, firms only focus on themselves; in contrast, when evaluating efficiency, firms follow a benchmarking process that is not only focused on themselves but also on competition, i.e. firms compare their productivities to those of competitors and then determine which one is more efficient (Charnes et al. 1978; Donthu et al. 2005; Farrel 1957).
Going back to the definition of marketing efficiency, in referring to marketing outputs, firms generate and accumulate customers’ mindset (Keller and Lehmann 2003) or what have been called marketing assets: customer satisfaction and brand equity (Rust et al. 2004). In reference to marketing inputs, firms develop marketing program investments which include product research, development and design, intermediary support and marketing communications (Keller and Lehmann 2003; Rust et al. 2004; Van Waterschoot and Van den Bulte 1992).
11
Figure 1: Marketing Activities, Customer Satisfaction, Brand Equity and Firm’s Performance
Marketing Assets (Outputs)
Marketing Activities (Inputs) Marketing communications: advertising Other marketing related activities: direct mail, customer relationship marketing, sales promotion, special events
Accounting-based
performance
Capital market-based performance
Perceived Product Quality
Customer Expectative
Customer Satisfaction
Brand Awareness Brand Association
Brand Attitude
Brand Equity
Offensive Paradigm Customer Acquisition
Defensive Paradigm Customer Retention
Revenues
Loyalty Repurchase Word-of-mouth
Brand attachment Brand activity
Customer Experience with the product
Customer Experience with the product
Accordingly, the marketing efficiency concept that we assume considers not only marketing activities and marketing assets but also competition comparison. In that sense we define marketing efficiency as the ability of marketing to maximize firms’ customer satisfaction and brand equity, better than rivals, under the same amount of expenditure in marketing activities14. Extant research has studied the concept of marketing efficiency from a narrow perspective. Mittal et al. (2005) only focus in customer satisfaction efficiency. Mukherjee et al. (2003) and Kamakura (2002) focus on service quality efficiency. As suggested by Srivastava et al. (1998; 2001), firms develop more than customer satisfaction asset, they also build up brand equity and relationships. In that sense, in our concept of marketing efficiency, we consider customer satisfaction and brand equity. Therefore, we focus on maximizing customer retention and customer acquisition. In this respect, we expect that
H1: Marketing Efficiency concept, that simultaneously maximizes customer satisfaction and brand equity, captures marketing philosophy better than marketing efficiency that focuses only on maximizing customer satisfaction or maximizing brand equity.
Sheth et al. (2000) and Sheth and Sisodia (1995) suggest that the objective of being efficient is to get loyal customers at low marketing costs. In addition, they question about whether marketing efficiency contributes to firms’ performance, i.e. increase accounting-based and capital market-based performance (Rust et al. 2004; Srivastava et al. 1998). Nevertheless, marketing research in this topic is scant and has not yet properly considered the marketing efficiency contribution to firm performance. Mittal et al. (2005) only focus in analyzing the effect of customer satisfaction efficiency firms’ capital market-based performance. Mukherjee et al. (2003) and Kamakura (2002) focus on delving the contribution of service quality efficiency to firms’ accounting-based performance. Our work, in that sense, intends to be broader and boards the concept of marketing efficiency considering two relevant assets of marketing, customer satisfaction and brand equity, and how firms more efficient in marketing are more capable of generating better financial results, from accounting and capital market-based performance.
Why should firms that successfully attain marketing efficiency create better financial results? Let’s consider one marketing efficient firm (called A) and other marketing inefficient firm (called B) that have spent the same amount in marketing activities. Both firms have incurred in the same amount of marketing costs; however only one of them, firm A, has generated and maximized its customer satisfaction and brand equity intangibles more than firm B. Following defensive marketing paradigm, firm A has fended off better from competitors and has reduced customers exit and switching. Generally speaking, firm A has been more capable of keeping customers and of minimizing dissatisfaction and grievance. Following the offensive marketing paradigm, firm A has obtained more additional customers, and increased customers’ purchase frequency. Firm A, by and large, has generated new customers by attracting dissatisfied buyers of competitors.
Customer has evaluated better the product/service of firm A. Customers of firm A will be more able to repurchase, to be loyal and to do favourable word-of-mouth activity. This will reinforce the marketing defensive paradigm. Moreover, current customers of firm A have better mental representation of its brands, more brand awareness, better brand attitude, more brand attachment and more brand activity. Likewise, firm A will have generated better mental representation of the brands in potential customers, who have not experienced with 14 The definition of marketing efficiency is based also on the definition of technical efficiency used in operation management (e.g. Kumbhakar and Lovell 2000)
12
the product yet. Accordingly, firm A has more probability to generate new customers. This will fortify marketing offensive paradigm. Hence, firm A, a marketing efficient firm, will have more probability to expand its revenues and better maximize accounting and capital market-based performance. Besides, as Williamson (1991) suggests that the best strategy to increase profits is to operate efficiently, we hypothesize that:
H2: Firms that are more marketing efficient will have higher accounting-based financial performance
H3: Firms that are more marketing efficient will have higher capital market-based financial performance.
3. MODELS FOR MEASURING MARKETING EFFICIENCY AND ITS EFFECT ON FIRM PERFORMANCE
3.1. Modelling marketing efficiency
Efforts in marketing efficiency research have been developed since middle 1980s. Studies have been focused in three main topics: marketing activities efficiency, marketing business process efficiency and marketing assets efficiency. In the first topic, we find works related to price efficiency (Kamakura et al. 1988), salespeople efficiency (Boles et al. 1995), advertising efficiency (Färe et al. 2004; Luo and Donthu 2001, 2005) and outdoor advertising efficiency (Luo and Donthu 2001). In the second topic, we come across research associated with retailing and outlets efficiency (Donthu and Yoo 1998; Kamakura et al. 1996) and supply-chain efficiency (Heikkilä 2002). Finally in the topic of marketing assets efficiency, studies linked to service quality efficiency (Mukherjee et al. 2003) and customer satisfaction efficiency (Donthu et al. 2005; Kamakura et al. 2002; Mittal et al. 2005) can be found.
Moreover, the majority of the research in topics of marketing efficiency has been modelled using mathematical linear programming functions. Why do not researchers employ regression analysis in measuring marketing efficiency? Remember that marketing efficiency concept tackles firm and its competition. What it intends to do is making a comparison of firm’s productivity with the best performers. Then, when using ordinary least square methods, firms’ marketing activities, process or assets would be compared to average efficiency. Nevertheless, mathematical programming functions compare firms’ marketing assets with the best performer. Furthermore, mathematical functions permit us to consider more than one output in the analysis; which is different from regression analysis that allows us to take only one dependent variable15 (Boles et al. 1995: 40; Donthu and Yoo 1998: 90; Luo and Donthu 2005: 33).
In that sense, for modelling marketing efficiency, we used data envelopment analysis (DEA) (Charnes et al. 1985). Data envelopment analysis is a method for mathematically comparing different firms’ productivity based on multiple outputs and multiple inputs. An important feature of DEA is that it builds an efficient frontier comprising of all the efficient units, thus allowing comparison to the best performers.
DEA has become in the last two decades an important tool in efficiency measurement. It is based on the seminal work of Farrell (1957) and was originally developed by Charnes et al. (1978) with constant returns to scale and later amplified by Banker et al. (1984) to include variable returns to scale. Likewise, DEA models can be specified in two orientations: output 15 See Donthu and Yoo (1998) for a more detailed comparison between regression analysis and mathematical programming functions.
13
and input oriented. Output oriented models intend to maximize outputs; while the latter tries to minimize inputs. The ratio of weighted outputs and inputs produces a single measure of productivity called relative efficiency16.
Charnes et al. (1985) first suggested applying DEA to gain insights into efficiency of marketing efforts. Since then, there have been some marketing studies that used the DEA as a methodology (e.g. Kamakura et al. 2002; Mittal et al. 2005).
In designing DEA it is necessary to chose appropriate orientation of the model. An input oriented model will seek efficiency by proportionately diminishing inputs, whereas an output oriented model will focus on augmenting outputs given a level of inputs. In our research, the output-oriented DEA model (Banker et al. 1984; Charnes et al., 1978) is employed to modelling marketing efficiency.
In the case of measuring marketing efficiency the output oriented model appears to be more relevant since budgets of marketing are frequently preliminary decided and the aim is maximization of output with the available funds. (Low and Mohr 1999; Piercy 1987). In addition, according to Hamel and Prahalad (1994), firms have to change the perspective of management, i.e. not to concentrate efforts in the denominator (inputs) but to concentrate on the numerator (the outputs). Furthermore, one of the main interrelationships between marketing intangibles is that customer satisfaction and brand equity have to be expanded in order to maximize profitability.
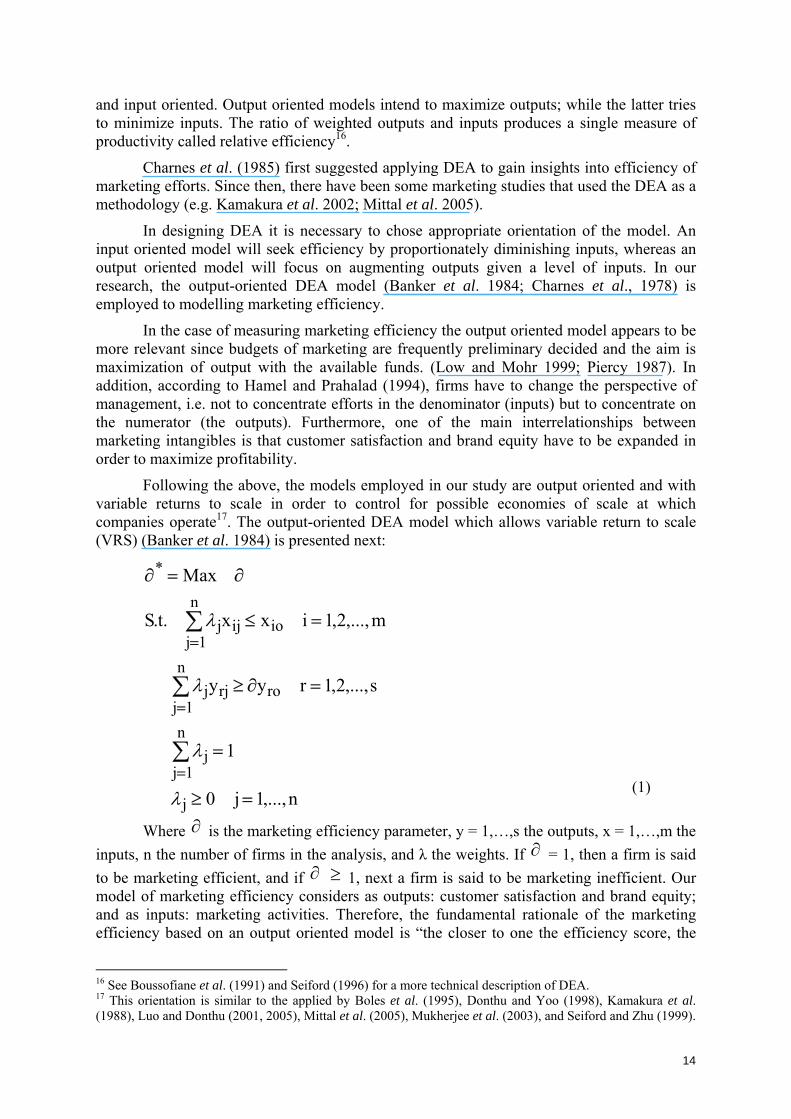
Following the above, the models employed in our study are output oriented and with variable returns to scale in order to control for possible economies of scale at which companies operate17. The output-oriented DEA model which allows variable return to scale (VRS) (Banker et al. 1984) is presented next:
n,...,1j0
1
s,...,2,1ryy
m,...,2,1ixx.t.S
Max
j
n
1jj
n
1jrorjj
n
1jioijj
*
=≥
=
=∂≥
=≤
∂=∂
∑
∑
∑
=
=
=
λ
λ
λ
λ
(1)
Where is the marketing efficiency parameter, y = 1,…,s the outputs, x = 1,…,m the inputs, n the number of firms in the analysis, and λ the weights. If
∂∂ = 1, then a firm is said
to be marketing efficient, and if ∂ 1, next a firm is said to be marketing inefficient. Our model of marketing efficiency considers as outputs: customer satisfaction and brand equity; and as inputs: marketing activities. Therefore, the fundamental rationale of the marketing efficiency based on an output oriented model is “the closer to one the efficiency score, the
≥
16 See Boussofiane et al. (1991) and Seiford (1996) for a more technical description of DEA. 17 This orientation is similar to the applied by Boles et al. (1995), Donthu and Yoo (1998), Kamakura et al. (1988), Luo and Donthu (2001, 2005), Mittal et al. (2005), Mukherjee et al. (2003), and Seiford and Zhu (1999).
14
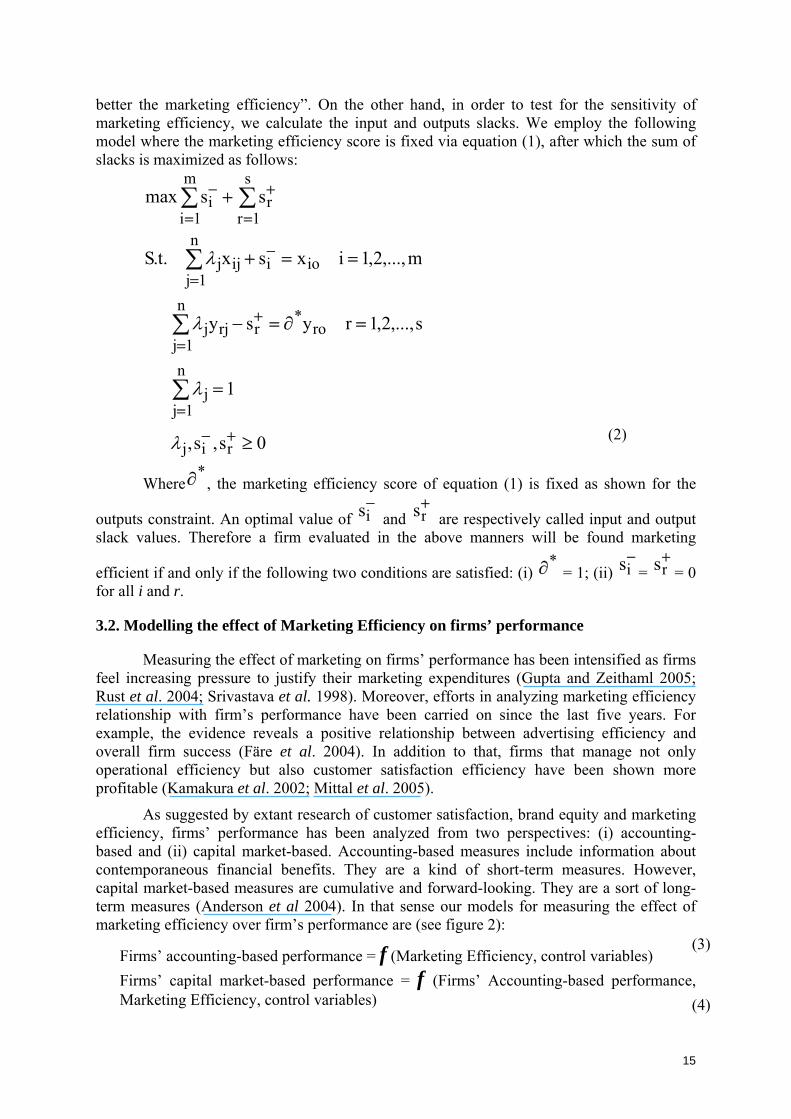
better the marketing efficiency”. On the other hand, in order to test for the sensitivity of marketing efficiency, we calculate the input and outputs slacks. We employ the following model where the marketing efficiency score is fixed via equation (1), after which the sum of slacks is maximized as follows:
0s,s,
1
s,...,2,1rysy
m,...,2,1ixsx.t.S
ssmax
rij
n
1jj
n
1jro
*rrjj
n
1jioiijj
s
1rr
m
1ii
≥
=
=∂=−
==+
+
+−
=
=
+
=
−
=
+
=
−
∑
∑
∑
∑∑
λ
λ
λ
λ
(2)
Where , the marketing efficiency score of equation (1) is fixed as shown for the
outputs constraint. An optimal value of
*∂−is and
+rs are respectively called input and output
slack values. Therefore a firm evaluated in the above manners will be found marketing
efficient if and only if the following two conditions are satisfied: (i) *∂ = 1; (ii) =
−is +
rs = 0 for all i and r.
3.2. Modelling the effect of Marketing Efficiency on firms’ performance
Measuring the effect of marketing on firms’ performance has been intensified as firms feel increasing pressure to justify their marketing expenditures (Gupta and Zeithaml 2005; Rust et al. 2004; Srivastava et al. 1998). Moreover, efforts in analyzing marketing efficiency relationship with firm’s performance have been carried on since the last five years. For example, the evidence reveals a positive relationship between advertising efficiency and overall firm success (Färe et al. 2004). In addition to that, firms that manage not only operational efficiency but also customer satisfaction efficiency have been shown more profitable (Kamakura et al. 2002; Mittal et al. 2005).
As suggested by extant research of customer satisfaction, brand equity and marketing efficiency, firms’ performance has been analyzed from two perspectives: (i) accounting-based and (ii) capital market-based. Accounting-based measures include information about contemporaneous financial benefits. They are a kind of short-term measures. However, capital market-based measures are cumulative and forward-looking. They are a sort of long-term measures (Anderson et al 2004). In that sense our models for measuring the effect of marketing efficiency over firm’s performance are (see figure 2):
Firms’ accounting-based performance = f (Marketing Efficiency, control variables) Firms’ capital market-based performance = f (Firms’ Accounting-based performance, Marketing Efficiency, control variables)
(3)
(4)
15

Figure 2: Framework for analysis18
Marketing Efficiency
Accounting based performance
Note: The spotted line indicates the traditional relationship studied in literature. However, the concept
of marketing efficiency used only takes customer satisfaction into account. We also test this relationship with our marketing efficiency concept.
4. SAMPLE, DATA COLLECTION, MEASURES AND RESEARCH TECHNIQUES
4.1. Sample and Data Collection
The research model has been applied to the top United States firms. The data of marketing activities expenditures and the raw data of branding strategy have been obtained from the reports of “Leading National Advertisers (LNA)” published by Crain Communication Inc. and The Ad Age Group©19. The customer satisfaction index was obtained from the annual American Customer Satisfaction Index (ACSI) that has been made available to us by the National Quality Research Centre at the University of Michigan20. The data of brand equity has been found in the Interbrand report about the ranking of the world’s most valuable brands published in Business Week Magazine. In reference to financial and other related information, COMPUSTAT data of Standard & Poor’s and OSIRIS data base of Bureau Van Dijk Electronic Publishing© have been used21. Moreover the recollection of marketing and financial data covers six consecutives years as of 2005, i.e. 2000-2005.
18 The specification of measures related to each variable considered in the framework for analysis is presented in section 4.2. 19 See adage.com/datacenter/ for specific details. 20 See www.theacsi.org for more details 21 COMPUSTAT Global 2006 CD-ROM has been used. It is a data base that includes financial information of firms of more than 80 countries around the world. For instance, information of 5600 United Stated and Canada’s
Control Variables 1. Lag Earnings 2. Financial Strategy
Leverage
3. Branding Strategy Corporate Brand House of Brands
4. Competition
Industry Concentration 5. Others
Infrastructure Age
Cash Flow Capital market-
based performance
Tobin’s Q
ROI
16

One relevant aspect to note is that we use different marketing data sets (Ad Age, ACSI, and Interbrand). The challenge of different data bases is to find matching firms. In the particular case of this paper we have found fifteen firms that match marketing information along the years of analysis. Consequently the total sample of firms along the years is ninety. According to North American Industry Classification System (NAICS) our sample takes part of accommodation and food services, information, manufacturing/durable goods and manufacturing non-durable goods sectors. Moreover, the brand equity of firms under analysis is equivalent to 44% of the whole brand equity of Interbrand firms in 2005. Furthermore, the advertising spending and other marketing related expenditures of sample firms ascend to 14% of those of firms considered by Ad Age.
TABLE 2 Variable Specifications
Constructs Variables Measure Years of Analysis Sources of Information
Advertising
spending Annual spending in
US$ thousands 2000 - 2005 Advertising Age
Marketing Activities Other marketing related
expenditure
Annual spending in US$ thousands 2000 - 2005 Advertising Age
Cumulative Customer Satisfaction ACSI Annual Index 2000 - 2005
National Quality Research Centre at the University of
Michigan
Brand Equity Brand Value Annual brand value in US$ thousands 2000 - 2005 Interbrand Data
Cash Flow Annual cash/total assets 2000 - 2005 Accounting-based
performance ROI EBITDA/total assets 2000 - 2005 Capital market-based
performance Tobin’s Q Ratio 2000 - 2005
COMPUSTAT OSIRIS
Lag earnings One-lag 2000 - 2005
Leverage Long-term debt/total assets 2000 - 2005
Infrastructure Fixed assets/total assets 2000 - 2005
COMPUSTAT OSIRIS
Corporate brand name
% corporate brands/#total brands 2000 - 2005 Advertising Age
Industry Concentration Herfindahl Index 2000 - 2005
Control
Age Year of analysis minus IPO 2000 - 2005
COMPUSTAT OSIRIS
firms and more than 16000 firms around the world has been gathered. In the same line, OSIRIS is a fully integrated public company database and analytical information solution. OSIRIS works with specialist data providers from around the world such as Dow Jones Indexes (Princeton), EDGAR Online (Washington), Financial Times, Reuters, and Standard & Poor’s to name a few. OSIRIS provides financial information of 11000 US firms out of more than 46000 firms around the world (osiris.bvdep.com).
17
4.2. Measures
Marketing Activities
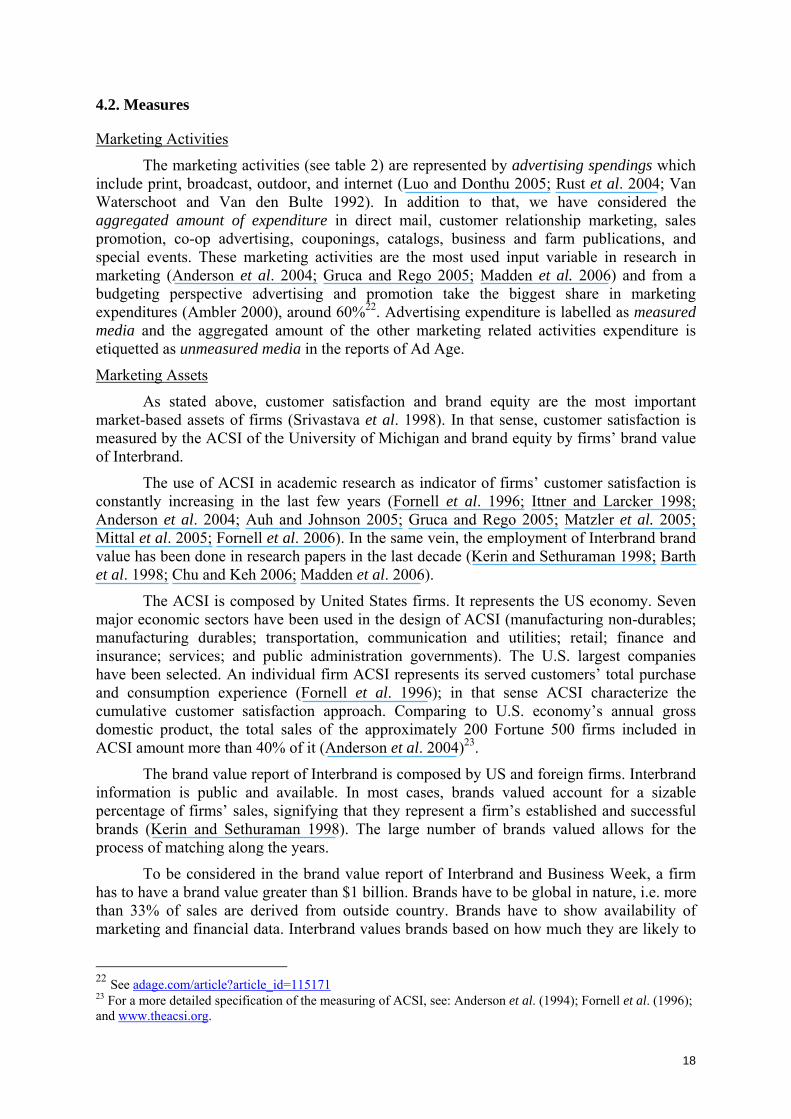
The marketing activities (see table 2) are represented by advertising spendings which include print, broadcast, outdoor, and internet (Luo and Donthu 2005; Rust et al. 2004; Van Waterschoot and Van den Bulte 1992). In addition to that, we have considered the aggregated amount of expenditure in direct mail, customer relationship marketing, sales promotion, co-op advertising, couponings, catalogs, business and farm publications, and special events. These marketing activities are the most used input variable in research in marketing (Anderson et al. 2004; Gruca and Rego 2005; Madden et al. 2006) and from a budgeting perspective advertising and promotion take the biggest share in marketing expenditures (Ambler 2000), around 60%22. Advertising expenditure is labelled as measured media and the aggregated amount of the other marketing related activities expenditure is etiquetted as unmeasured media in the reports of Ad Age.
Marketing Assets
As stated above, customer satisfaction and brand equity are the most important market-based assets of firms (Srivastava et al. 1998). In that sense, customer satisfaction is measured by the ACSI of the University of Michigan and brand equity by firms’ brand value of Interbrand.
The use of ACSI in academic research as indicator of firms’ customer satisfaction is constantly increasing in the last few years (Fornell et al. 1996; Ittner and Larcker 1998; Anderson et al. 2004; Auh and Johnson 2005; Gruca and Rego 2005; Matzler et al. 2005; Mittal et al. 2005; Fornell et al. 2006). In the same vein, the employment of Interbrand brand value has been done in research papers in the last decade (Kerin and Sethuraman 1998; Barth et al. 1998; Chu and Keh 2006; Madden et al. 2006).
The ACSI is composed by United States firms. It represents the US economy. Seven major economic sectors have been used in the design of ACSI (manufacturing non-durables; manufacturing durables; transportation, communication and utilities; retail; finance and insurance; services; and public administration governments). The U.S. largest companies have been selected. An individual firm ACSI represents its served customers’ total purchase and consumption experience (Fornell et al. 1996); in that sense ACSI characterize the cumulative customer satisfaction approach. Comparing to U.S. economy’s annual gross domestic product, the total sales of the approximately 200 Fortune 500 firms included in ACSI amount more than 40% of it (Anderson et al. 2004)23.
The brand value report of Interbrand is composed by US and foreign firms. Interbrand information is public and available. In most cases, brands valued account for a sizable percentage of firms’ sales, signifying that they represent a firm’s established and successful brands (Kerin and Sethuraman 1998). The large number of brands valued allows for the process of matching along the years.
To be considered in the brand value report of Interbrand and Business Week, a firm has to have a brand value greater than $1 billion. Brands have to be global in nature, i.e. more than 33% of sales are derived from outside country. Brands have to show availability of marketing and financial data. Interbrand values brands based on how much they are likely to
22 See adage.com/article?article_id=115171 23 For a more detailed specification of the measuring of ACSI, see: Anderson et al. (1994); Fornell et al. (1996); and www.theacsi.org.
18

earn going forward. The process of valuation that Interbrand follows is: (1) figure out what percentage of overall revenues the brands explain, (2) project the net earnings of the business segment, (3), deduct a charge for the cost of owning the tangible assets (what ever cost is generated beyond that costs is due to intangible assets), (4) winnow the earnings generated by brands from the earnings generated by other intangibles, and (5) analyze the strength of the brand in order to figure out how risky those future brand earnings are, based on market leadership, stability and ability to cross geographical and cultural borders, to name a few24. Accordingly, Interbrand valuation show whether brands have been capable to tell customer clearly why they stand for and what products they offer. In that sense, brand value represents brand awareness and image of firms in a monetary perspective25.
Marketing Efficiency
The inputs considered for measuring marketing efficiency are advertising expenditure (measured advertising in Ad Age) and the aggregated amount of other marketing related activities spending (e.g. in direct mail, customer relationship marketing, sales promotion). Cumulative customer satisfaction of ACSI and brand value of Interbrand have been taken as outputs for marketing efficiency model.
Additionally, we have calculated isolated customer satisfaction efficiency and brand equity efficiency as well. Following equations (1) and (2), the inputs for customer satisfaction and brand equity efficiency will be the same as for marketing efficiency, in order to be comparable. However the outputs will be different, in customer satisfaction efficiency the output is the ACSI score and in brand equity efficiency the output is the brand value of Interbrand. The purpose of this additional analysis is to find out whether the efficiency score improves when the two marketing assets variables are jointly included in the efficiency measurement.
Financial Performance
The variables used for measuring accounting-based performance are cash flow and return on investment-ROI (Aaker and Jacobson 1994; Anderson et al. 1994, 1997; Gruca and Rego 2004).
Cash Flow. Cash flow is a comparable accounting-based measure across firms. Extant research in finance has long proposed that the value of a firm equals the net present value of all future cash flows (Rappaport 1986). Moreover, existing research in marketing has also supported cash flows as an appropriate measure of firm value (Srivastava et al. 1998). Marketing efficiency leads increasing cash flows by repurchases of satisfied customers and purchases of acquired customers. Accordingly, we expect a positive relationship between marketing efficiency and cash flows. In measuring the effect of marketing efficiency on cash flow, we use the model proposed by Gruca and Rego (2005), i.e. cash flows depends on previous cash flow and control variables. Cash flow is the total annual cash from operating activities. It has been normalized to total assets (Gruca and Rego 2005).
Return on investment (ROI). ROI is an accounting-based measure. It has the advantage of being comparable across firms. ROI suppose that previous investments affect current earnings. ROI shows profitability of investments (Anderson et al. 2004). Extant research in customer satisfaction and brand equity has employed ROI as a measure of profitability (Anderson et al. 1997; Ittner and Larcker 1998; Rust et al. 2002). Higher stocks 24 See Barth et al. (1998) and Kerin and Sethuraman (1998) for a more detailed explanation of the valuation process and the factors considered in measuring the strength of a brand. 25 It has been stated a simultaneity bias between brand value of Interbrand and Financial performance indicators such as market value of equity, however it has been found no bias between the two (Barth et al. 1998: 56)
19

of customer satisfaction and brand equity26; contribute to revenues expansion, in services industry, and cost reduction, in goods industry, which in turn leads to increase ROI. As a consequence, we expect a positive association between marketing efficiency and return on investment. ROI has been measured as the ratio of annual earnings before interests, taxes, depreciation and amortization to total assets (Bates et al. 2003). The raw data for measuring cash flow and ROI has been obtained from COMPUSTAT and OSIRIS databases.
Tobin’s Q. The variable used for measuring capital market-based performance is Tobin’s Q. It is a forward-looking measure of firm value. It is also comparable across firms. Tobin’s Q provides information about the future potential profits. In this respect, it is influenced by current cash flow and current profitability. Tobin’s Q has been currently used in marketing research (Anderson et al. 2004; Matzler et al. 2005; Mittal et al. 2005; Rao et al. 2004). Customer satisfaction and brand equity has been recognized as marketing intangibles and long-term assets. Tobin’s Q is capable of capturing the intangible effects as well as long-term performance. For that reasons we use Tobin’s Q as a measure of capital-market based performance. Accordingly, we expect two effects of marketing efficiency on Tobin’s Q. The first one is an indirect positive relationship through cash flow generation and return on investment. The second one is a direct positive effect of marketing efficiency on Tobin’s Q.
We have estimated Tobin’s Q using the approach of Chung and Pruitt27 (1994). We use the following formulae:
Approximate Tobin’s Q = f (MVE + LPS + DEBT) / BTA (5)
Where: MVE: (annual close stock price) x (annual common shares outstanding) LPS: liquidating value of firm preferred stock DEBT: (short-term liabilities - short-term assets) + (long-term debt) BTA: book value of total assets
The numerator of equation (5) stands for the total value of the firm and the collective cash flows to the firm’s equity investors and bondholders. The numerator of Tobin’s Q uses stock market–based information to measure the long-term value of a firm (Anderson et al. 2004; Rao et al. 2004). That’s why it has been classified as a capital market-based performance. On the other hand, the denominator is the replacement cost of the assets, assumed to equal the book value. The higher the Tobin’s Q, the higher is the value of the intangible assets of the firm. We use the raw data taken from the annual COMPUSTAT and OSIRIS data bases to calculate Tobin’s Q.
Control Variables
In order to measure the net effects of marketing efficiency on firms’ performance, we have considered five categories as control variables. We select these control variables due to the fact that they have been tested as influencers of firms’ accounting and capital-market performance (e.g. Barth et al. 1998; Gruca and Rego 2005; Rao et al. 2004).
(1) Lag Earnings. In most cases higher past earnings goes to prospective cash flows, and in turn drives Tobin’s Q. Moreover, there exists evidence that link higher stock of customer satisfaction and brand equity to firms’ earnings (Kerin and Sethuraman 1998).
26 Holding the same amount of expenditures in marketing activities. 27 The approach of Chung and Pruitt differs from Lindenberg and Ross (1981) in that the formers assume the book value of total assets as the replacement value of a firm’s plant, equipment and inventories (Chung and Pruitt 1994).
20
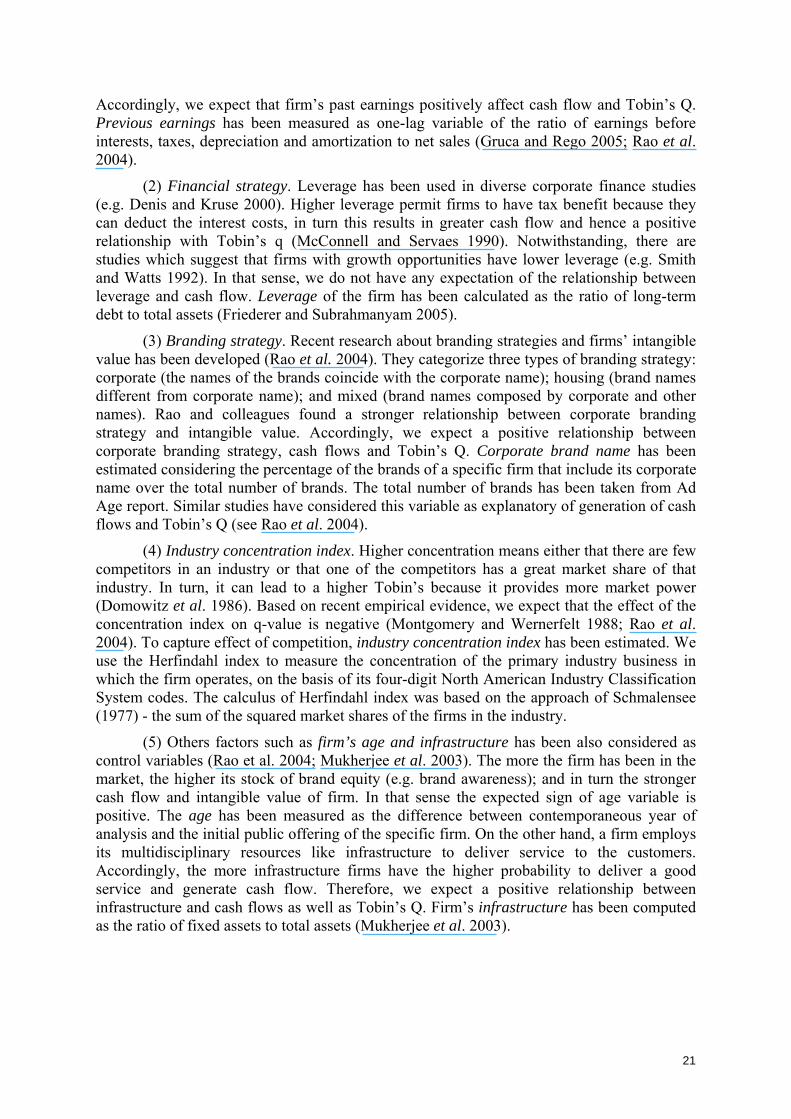
Accordingly, we expect that firm’s past earnings positively affect cash flow and Tobin’s Q. Previous earnings has been measured as one-lag variable of the ratio of earnings before interests, taxes, depreciation and amortization to net sales (Gruca and Rego 2005; Rao et al. 2004).
(2) Financial strategy. Leverage has been used in diverse corporate finance studies (e.g. Denis and Kruse 2000). Higher leverage permit firms to have tax benefit because they can deduct the interest costs, in turn this results in greater cash flow and hence a positive relationship with Tobin’s q (McConnell and Servaes 1990). Notwithstanding, there are studies which suggest that firms with growth opportunities have lower leverage (e.g. Smith and Watts 1992). In that sense, we do not have any expectation of the relationship between leverage and cash flow. Leverage of the firm has been calculated as the ratio of long-term debt to total assets (Friederer and Subrahmanyam 2005).
(3) Branding strategy. Recent research about branding strategies and firms’ intangible value has been developed (Rao et al. 2004). They categorize three types of branding strategy: corporate (the names of the brands coincide with the corporate name); housing (brand names different from corporate name); and mixed (brand names composed by corporate and other names). Rao and colleagues found a stronger relationship between corporate branding strategy and intangible value. Accordingly, we expect a positive relationship between corporate branding strategy, cash flows and Tobin’s Q. Corporate brand name has been estimated considering the percentage of the brands of a specific firm that include its corporate name over the total number of brands. The total number of brands has been taken from Ad Age report. Similar studies have considered this variable as explanatory of generation of cash flows and Tobin’s Q (see Rao et al. 2004).
(4) Industry concentration index. Higher concentration means either that there are few competitors in an industry or that one of the competitors has a great market share of that industry. In turn, it can lead to a higher Tobin’s because it provides more market power (Domowitz et al. 1986). Based on recent empirical evidence, we expect that the effect of the concentration index on q-value is negative (Montgomery and Wernerfelt 1988; Rao et al. 2004). To capture effect of competition, industry concentration index has been estimated. We use the Herfindahl index to measure the concentration of the primary industry business in which the firm operates, on the basis of its four-digit North American Industry Classification System codes. The calculus of Herfindahl index was based on the approach of Schmalensee (1977) - the sum of the squared market shares of the firms in the industry.
(5) Others factors such as firm’s age and infrastructure has been also considered as control variables (Rao et al. 2004; Mukherjee et al. 2003). The more the firm has been in the market, the higher its stock of brand equity (e.g. brand awareness); and in turn the stronger cash flow and intangible value of firm. In that sense the expected sign of age variable is positive. The age has been measured as the difference between contemporaneous year of analysis and the initial public offering of the specific firm. On the other hand, a firm employs its multidisciplinary resources like infrastructure to deliver service to the customers. Accordingly, the more infrastructure firms have the higher probability to deliver a good service and generate cash flow. Therefore, we expect a positive relationship between infrastructure and cash flows as well as Tobin’s Q. Firm’s infrastructure has been computed as the ratio of fixed assets to total assets (Mukherjee et al. 2003).
21
4.3. Research Techniques
The present research has two mainly objectives, one is to measure marketing efficiency and the other is related to probe the effect of marketing efficiency on firm’s cash flow, return on investment and Tobin’s Q. In reference to the first objective, we use data envelopment analysis, variable returns to scale, and output oriented model, as stated above. Specifically, we run contemporaneous marketing efficiency measurement, in order to capture the annual marketing efficiency of firms. We use the software “Efficiency Measurement System28” and DEA excel solver (Zhu 2003) to run the equations (1) and (2). Furthermore, in order to test the significant differences of marketing efficiency comparing to customer satisfaction efficiency and brand equity efficiency models, we use Wilcoxon-range test.
In relation to probing the effects of marketing efficiency on firm performance, we first used a longitudinal panel data model. We run random and fixed effect models of longitudinal panel data. However, after testing both types of models with Hausman test, we found that our data fails to meet the asymptotic assumptions of that test. Accordingly, as suggested by that test, we look for a seemingly unrelated estimation (SUES).
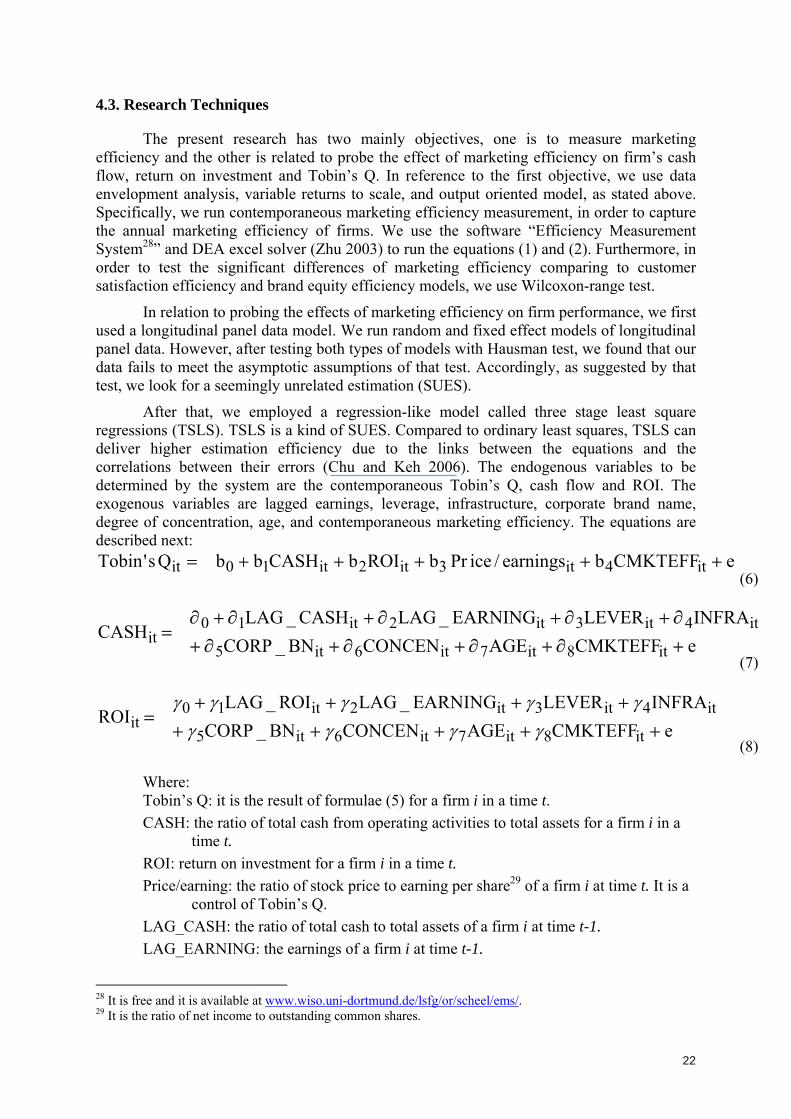
After that, we employed a regression-like model called three stage least square regressions (TSLS). TSLS is a kind of SUES. Compared to ordinary least squares, TSLS can deliver higher estimation efficiency due to the links between the equations and the correlations between their errors (Chu and Keh 2006). The endogenous variables to be determined by the system are the contemporaneous Tobin’s Q, cash flow and ROI. The exogenous variables are lagged earnings, leverage, infrastructure, corporate brand name, degree of concentration, age, and contemporaneous marketing efficiency. The equations are described next:
eCMKTEFFAGECONCENBN_CORPINFRALEVEREARNING_LAGROI_LAG
ROI
eCMKTEFFAGECONCENBN_CORPINFRALEVEREARNING_LAGCASH_LAG
CASH
eCMKTEFFbearnings/icePrbROIbCASHbbQs'Tobin
it8it7it6it5
it4it3it2it10it
it8it7it6it5
it4it3it2it10it
it4it3it2it10it
+++++++++
=
+∂+∂+∂+∂+∂+∂+∂+∂+∂
=
+++++=
γγγγγγγγγ
Where:
(6)
(7)
(8)
Tobin’s Q: it is the result of formulae (5) for a firm i in a time t. CASH: the ratio of total cash from operating activities to total assets for a firm i in a
time t. ROI: return on investment for a firm i in a time t. Price/earning: the ratio of stock price to earning per share29 of a firm i at time t. It is a
control of Tobin’s Q. LAG_CASH: the ratio of total cash to total assets of a firm i at time t-1. LAG_EARNING: the earnings of a firm i at time t-1.
28 It is free and it is available at www.wiso.uni-dortmund.de/lsfg/or/scheel/ems/. 29 It is the ratio of net income to outstanding common shares.
22
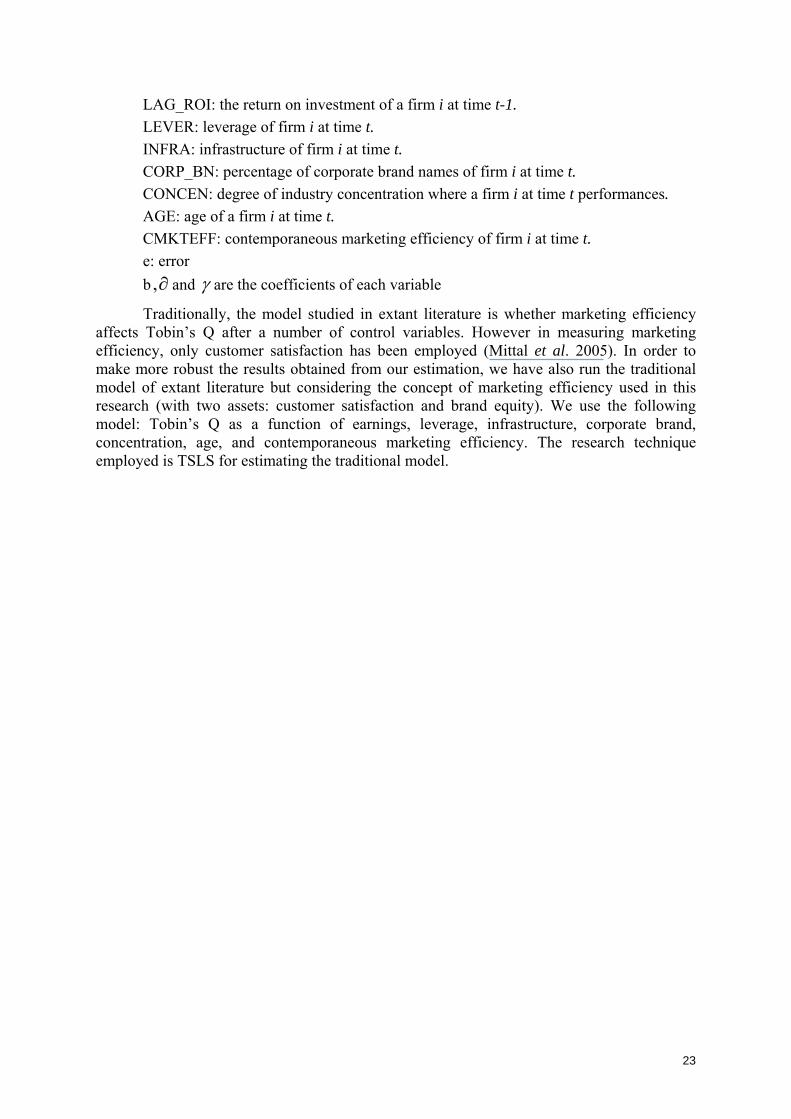
LAG_ROI: the return on investment of a firm i at time t-1. LEVER: leverage of firm i at time t. INFRA: infrastructure of firm i at time t. CORP_BN: percentage of corporate brand names of firm i at time t. CONCEN: degree of industry concentration where a firm i at time t performances. AGE: age of a firm i at time t. CMKTEFF: contemporaneous marketing efficiency of firm i at time t. e: error b and ∂, γ are the coefficients of each variable
Traditionally, the model studied in extant literature is whether marketing efficiency affects Tobin’s Q after a number of control variables. However in measuring marketing efficiency, only customer satisfaction has been employed (Mittal et al. 2005). In order to make more robust the results obtained from our estimation, we have also run the traditional model of extant literature but considering the concept of marketing efficiency used in this research (with two assets: customer satisfaction and brand equity). We use the following model: Tobin’s Q as a function of earnings, leverage, infrastructure, corporate brand, concentration, age, and contemporaneous marketing efficiency. The research technique employed is TSLS for estimating the traditional model.
23

24
5. RESULTS
Before analyzing the results, we recall that this paper has two levels of analysis: marketing efficiency measurement and probing the effect of marketing efficiency on firm’s performance.
5.1. Marketing Efficiency Measurement
The descriptive statistics for the inputs and outputs variables of the marketing efficiency model, as well as competing models of marketing efficiency such as customer satisfaction efficiency and brand equity efficiency are presented in table 3. The average customer satisfaction is nearly 76. We can also observe that firms of the sample have accumulated strong level of brand values. The highest brand value ascends to more than $72 billions and the minimum rises to approximately $2.2 billions. The average amount of advertising expenditures goes up to $600 millions. In the same vein, the quantity of spending in direct mail, customer relationship marketing, sales promotion, and special events among others ascend to $424 millions.
In the case of the measure of marketing efficiency and its competitive models, we can observe that marketing efficiency average is 109.32%, customer satisfaction efficiency rises to 110.68% and brand equity efficiency goes up to 517.13%. These results suggest that firms are 9.32% inefficient on average for the case of marketing efficiency concept.
TABLE 3 Descriptive Statistics of Marketing Efficiency
Variables Type Minimum Maximum Median Mean S.D. ACSI Output 57.40 86.00 78.00 75.49 7.60Brand Value a Output 2120000.00 72537000.00 11424500.00 21056560.98 21419893.06Advertising Expenditures a Input 97571.00 1938182.00 499969.00 600951.21 410993.90Other marketing activities related spending a, b Input 54398.00 1536263.00 344551.00 423693.72 308297.28Contemporaneous Marketing Efficiency (%) 100.00 147.16 103.60 c, d ** 109.32 12.60Contemporaneous Customer Satisfaction Efficiency (%) 100.00 147.16 104.20 110.68 13.34Contemporaneous Brand Equity Efficiency (%) 100.00 3219.46 278.93 517.13 633.77
Notes: S.D. is the acronym for Standard deviation. ACSI is measured in points. The maximum score allowed is 100. a Measured in US$ thousands b Amount of expenditure in direct mail, customer relationship marketing, sales promotion, co-op
advertising, couponings, catalogs, business and farm publications, and special events c Comparison of median of contemporaneous marketing efficiency to contemporaneous customer
satisfaction efficiency. The results of Wilcoxon test suggest significant differences. d Comparison of median of contemporaneous marketing efficiency to contemporaneous brand equity
efficiency. The results of Wilcoxon test suggest significant differences. ** p < .01.
Apparently, average marketing efficiency score is equal to mean customer satisfaction efficiency level. Nevertheless, Wilcoxon test suggest that the difference between them is statistically significant. Likewise, marketing efficiency is statistically different from brand equity efficiency. Accordingly, marketing efficiency captures the level of efficiency better than isolated customer satisfaction or brand equity efficiency models.
25
TABLE 4 Descriptive Statistics and Correlation Matrix for the variables in the probing analysis
Variables Mean S.D. 1 2 3 4 5 6 7 8 9 10 11 12 131. Tobin’s Q a 2.72 1.64 1.000
2. CASH a 0.15
0.06
0.789 1.000* 0.00*
3. ROI a 0.18
0.08
0.610 0.771 1.000 0.00** 0.00**
4. Price/earning a 26.90
13.65
0.493 0.218 -0.175 1.000 0.00** 0.05* 0.12
5. Lag_CASH a 0.15
0.06
0.824 0.864 0.659 0.277 1.000 0.00** 0.00** 0.00** 0.02*
6. Lag_Earnings a 0.20
0.09
0.341 0.242 0.268 0.070 0.228 1.000 0.00** 0.04* 0.02* 0.58 0.06†
7. Lag_ROI a 0.18
0.08
0.674 0.738 0.899 -0.128 0.748 0.349 1.000 0.00** 0.00** 0.00** 0.31 0.00** 0.00**
8. Leverage a 0.22
0.17
-0.206 -0.197 0.178 -0.432 -0.165
0.089 0.240 1.000 0.06† 0.07† 0.10† 0.00** 0.17 0.46 0.04*
9. Infrastructure a 0.65
0.22
-0.165 -0.222 0.168 -0.451 -0.175
0.154 0.216 0.675 1.000 0.13 0.04* 0.12 0.00** 0.14 0.20 0.07† 0.00**
10. Corporate Brand Name b 42.82
37.90
0.087 0.180 -0.069 0.209 0.173
-0.287 -0.082 -0.247 -0.505 1.000 0.44 0.11 0.54 0.07† 0.16 0.02* 0.51 0.03* 0.00**
11. Concentration a 0.25 0.20 -0.121
-0.067
0.173 -0.305 -0.065 0.152 0.181 0.103 0.058 -0.227 1.000 0.27 0.54 0.11 0.01** 0.59 0.20 0.13 0.34 0.59 0.04*
12. Age 40.13 32.46 -0.169
-0.227 -0.178 -0.193 -0.239 0.073 -0.179 0.046 0.044 -0.244 0.360 1.000 0.04*0.12 0.10† 0.09† 0.05* 0.54 0.13 0.67 0.69 0.02* 0.00**
109.32
12.60
-0.307 -0.424 -0.424 0.052 -0.416 -0.078 -0.416 0.076 0.276 0.129 -0.345 -0.362 1.000
13. Contemporaneous Marketing Efficiency b 0.01** 0.00** 0.00** 0.66 0.00** 0.53 0.00** 0.50 0.01** 0.24 0.00** 0.00**
Notes: S.D. is the acronym for Standard deviation; Age is expressed in number of years a Values are expressed in ratios (See measures of variables above) b Values are expressed in percentages (See measures of variables above) † p < .10 * p < .05 ** p < .01
5.2. Probing the effects of Marketing Efficiency on firm’s performance
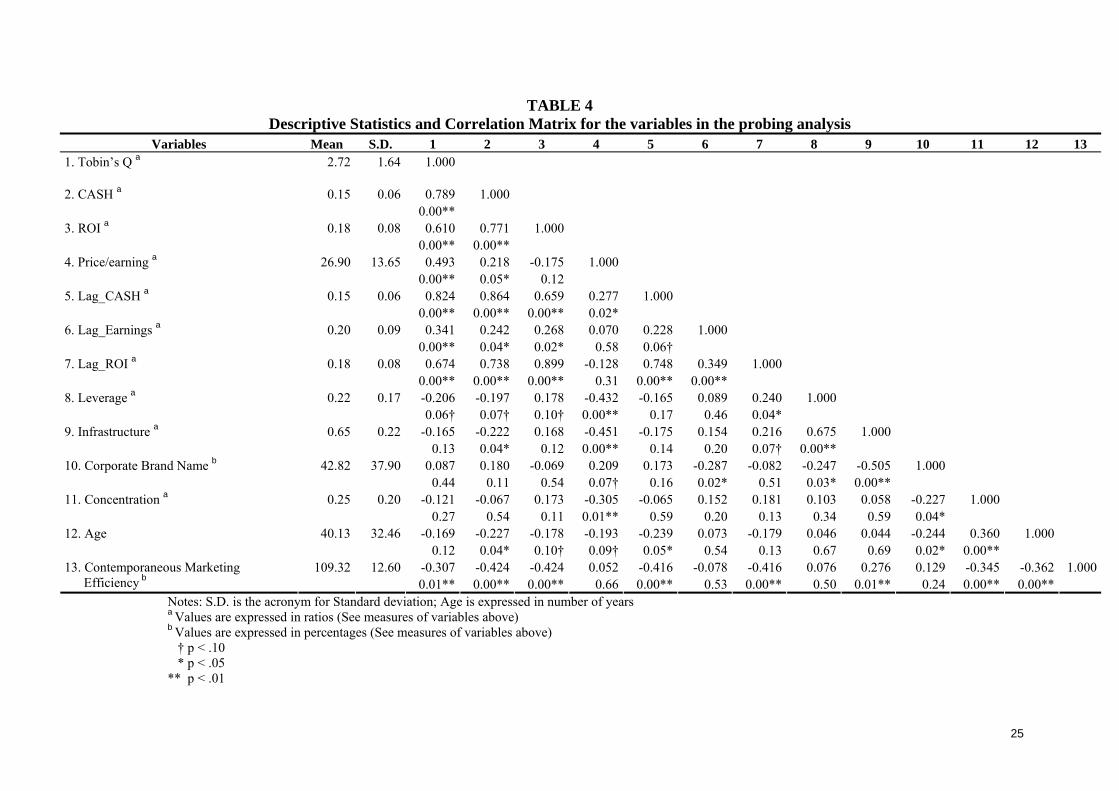
Descriptive Statistics and the correlation matrix of the variables used in the probing analysis are presented in table 4. The average Tobin’s Q ascends to 2.72. That quantity is associated with possession of high level of intangibles. A Tobin’s Q score higher than one shows that a firm possesses intangibles (Chung and Pruitt 1994; Villalonga 2004). Moreover, firms’ profitability rises to 15-18% according to CASH and ROI. The average score of marketing efficiency is 109.32%, in other words, firms’ are on average 9.32% inefficient. According to the correlation matrix, contemporaneous marketing efficiency has a negative and significant correlation with Tobin’s Q (-0.31), CASH (-0.424) and ROI (-0.424). Recall that the rationale of the contemporaneous marketing efficiency resulted from an output oriented DEA model (as the scores obtained are higher than one) is “the closer to one the efficiency score, the better the marketing efficiency”. In turn, from a correlation matrix perspective, marketing efficiency has positive relationship with Tobin’s Q, generation of Cash and ROI.
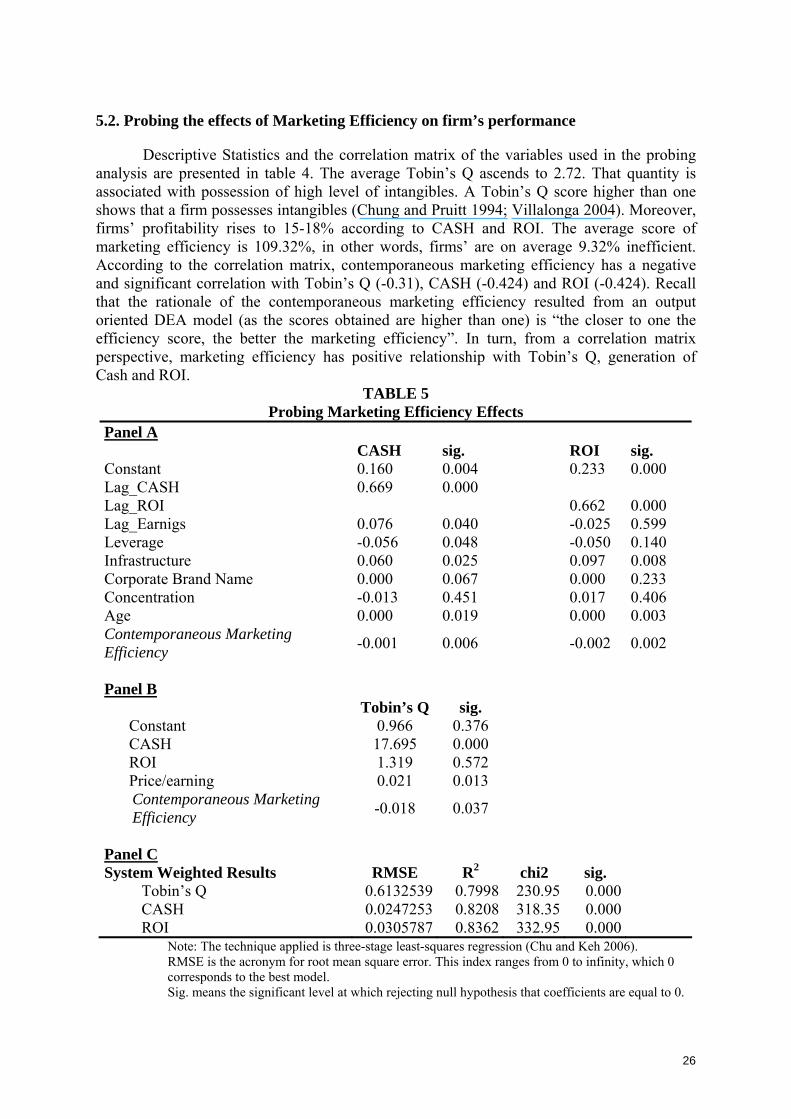
TABLE 5 Probing Marketing Efficiency Effects
Panel A CASH sig. ROI sig. Constant 0.160 0.004 0.233 0.000 Lag_CASH 0.669 0.000 Lag_ROI 0.662 0.000 Lag_Earnigs 0.076 0.040 -0.025 0.599 Leverage -0.056 0.048 -0.050 0.140 Infrastructure 0.060 0.025 0.097 0.008 Corporate Brand Name 0.000 0.067 0.000 0.233 Concentration -0.013 0.451 0.017 0.406 Age 0.000 0.019 0.000 0.003 Contemporaneous Marketing Efficiency -0.001 0.006 -0.002 0.002
Panel B Tobin’s Q sig.
Constant 0.966 0.376 CASH 17.695 0.000 ROI 1.319 0.572 Price/earning 0.021 0.013 Contemporaneous Marketing Efficiency -0.018 0.037
Panel C System Weighted Results RMSE R2 chi2 sig.
Tobin’s Q 0.6132539 0.7998 230.95 0.000 CASH 0.0247253 0.8208 318.35 0.000 ROI 0.0305787 0.8362 332.95 0.000
Note: The technique applied is three-stage least-squares regression (Chu and Keh 2006). RMSE is the acronym for root mean square error. This index ranges from 0 to infinity, which 0 corresponds to the best model. Sig. means the significant level at which rejecting null hypothesis that coefficients are equal to 0.
26
We also examined the effect of marketing efficiency on CASH and ROI (i.e. accounting based performance) and on Tobin’s Q (i.e. capital market-based performance) (see table 5). In panel A, we can observe that the majority of the expected sign of variables has been obtained not only for CASH but also for ROI. In the case of CASH, for instance, firms’ leverage and industry concentration index have negative signs. However, in the case of ROI, only firms’ leverage has a negative sign. One important result, in both cases, is the positive sign of corporate brand name variable, i.e. firms’ that have more corporate brands names are showing better generation of CASH and higher profitability-ROI.
The most relevant finding is that marketing efficiency has demonstrated its net effect on CASH and ROI. As expected, we found a significant and negative sign between marketing efficiency and CASH as well as between marketing efficiency and ROI.
In Panel B, we can remark that CASH and price/earnings ratio have positive and significant effects on Tobin’s Q as expected. Moreover we can observe that marketing efficiency has a negative sign and significant effect on Tobin’s Q. Bear in mind that the underlying principle of the contemporaneous marketing efficiency resulted from DEA output oriented model is “the closer to one the efficiency score, the better the marketing efficiency”. In that sense, as marketing efficiency score decreases, i.e. efficiency improves and Tobin’s Q increases. Consequently, we found a direct positive relationship between marketing efficiency and firms’ capital market-based performance. On the other hand, CASH has a direct positive relationship with Tobin’s Q. Marketing efficiency has positive relationship with CASH. Accordingly, as we are analyzing a system of equations, marketing efficiency also shows indirect relationship with Tobin’s Q.
Regarding the results of the traditional model applied, we found statistically significant evidence that marketing efficiency affects Tobin’s Q after the effect of control variables (see table 6 in appendix).
In Panel C, we can observe the fitting and explanatory power of the model. The system weighted results reveal that RMSE for the three models is close to zero, i.e. zero corresponds to the ideal model. Additionally, chi2 of the three models is high enough to make them statistically significant. Furthermore, CASH and ROI models show r-squares of 82% and 84% respectively. R-square of Tobin’s Q model is almost 80%. The model about the effect of marketing efficiency on accounting and capital market-based performance is statistically significant and powerful. Moreover, the r-square of the traditional model is 46.88%. Accordingly, our model not only is significant and powerful, but also robust and more powerful than that of extant literature.
6. DISCUSSION AND CONCLUSION
This research has three main hypotheses. The first is related to empirically probing whether the efficiency score improves when customer satisfaction and brand equity are jointly included in the marketing efficiency measurement. The second and third pursue to demonstrate whether marketing efficiency contributes positively to firms’ accounting and capital market-based performance, respectively. We test the objectives focusing on a sample of U.S. Corporations.
In reference to first hypothesis, we found that marketing efficiency based on the maximization of two marketing intangible assets, i.e. cumulative customer satisfaction and brand value, captures more properly efficiencies of marketing than that based on isolated customer satisfaction and brand equity efficiencies. These results go beyond what Mittal et
27
al. (2005) propose. They suggest the concept of customer satisfaction efficiency. Our marketing efficiency concept captures the underlying goals of not only customer retention but customer acquisition as well. Accordingly, marketing efficiency concept based on customer satisfaction and brand equity gives better understanding of marketing philosophy.
In relation to hypotheses 2 and 3, we found a negative sign between marketing efficiency and cash flow, between marketing efficiency and ROI, and between marketing efficiency and Tobin’s Q. It is important to underline that our measure of efficiency means that: the closer to one the efficiency score, the better the marketing efficiency. In that sense, a negative sign of regression coefficient of marketing efficiency was expected. Therefore the results reveal that the more marketing efficient the firms are; the higher their cash flow, ROI and Tobin’s Q. These results are in line with research that links advertising efficiency (Färe et al. 2004) and customer satisfaction efficiency (Kamakura et al. 2002; Mittal et al. 2005) to firms’ accounting and capital market-based performance.
Marketing efficiency controls not only for marketing expenditures but also for marketing intangible assets. Marketing efficiency proposes that higher levels of marketing assets have been obtained by the best use of marketing spending. As a result, marketing efficiency acts as an accelerator so that the impact of customer satisfaction and brand equity on cash flow, ROI and Tobin’s Q is stronger for relatively more efficient firms (Kamakura et al. 2002; Mittal et al. 2005).
The results of this study have important implications for practitioners. As mentioned in the introduction, practitioners tend to focus either on customer management or on brand management. However, our findings put forward that the two approaches, shaped by the concept of marketing efficiency, lead to improvement in short and long term results. Furthermore, as the business reality suggests that firms aims at not only increasing customer satisfaction but also accumulating brand value, this research gives a framework for analysing a marketing strategy based on two approaches: customers retention and customer acquisition.
In addition, our research opens up a new approach for researchers in the field of marketing adding marketing efficiency as an explaining variable, when considering the effect of marketing intangibles-marketing activities over firms’ financial performance. The results are consistent with Villalonga (2004) and Srivastava et al. (2001), who affirms that intangibles play a crucial role in sustaining a firm’s competitive advantage. These intangibles are responsible for the difference between market value and book value, i.e. Tobin’s Q. Marketing, through building customer satisfaction and brand equity, is a major origin of intangibles, and consequently contributes to firm’s market position and performance.
Our research, in conclusion, reveals that in assessing the contribution of marketing it is essential to take a broader view and examine the chain of effects of marketing starting from the initial investment in marketing activities through the generation of marketing assets and finally the financial consequences for firm performance.
7. LIMITATIONS AND FUTURE RESEARCH LINES
The question that remains unanswered in this research is what leads to increased marketing efficiency? Possible answers could be found using knowledge based view theory (Grant 1996; Spender 1996). For instance, how marketing personnel transfer experience and knowledge about practices of customer satisfaction and brand equity can give a picture about the possible explanation of why firms are more marketing efficient.
28
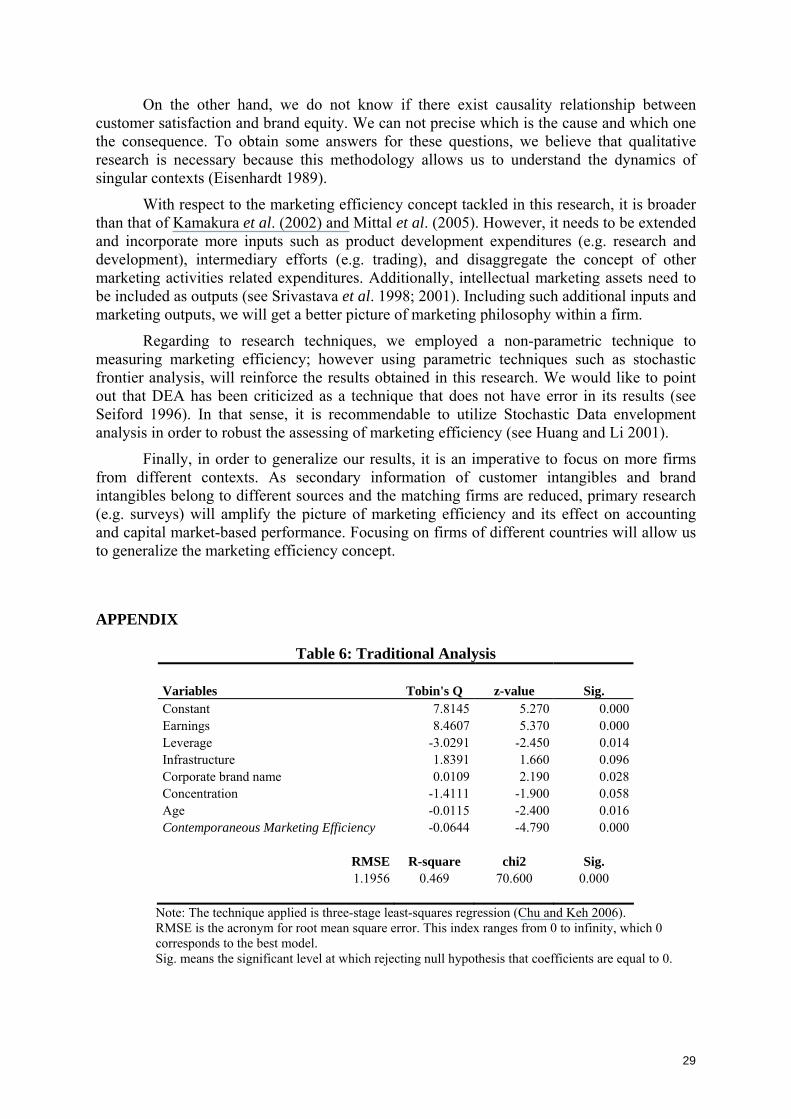
On the other hand, we do not know if there exist causality relationship between customer satisfaction and brand equity. We can not precise which is the cause and which one the consequence. To obtain some answers for these questions, we believe that qualitative research is necessary because this methodology allows us to understand the dynamics of singular contexts (Eisenhardt 1989).
With respect to the marketing efficiency concept tackled in this research, it is broader than that of Kamakura et al. (2002) and Mittal et al. (2005). However, it needs to be extended and incorporate more inputs such as product development expenditures (e.g. research and development), intermediary efforts (e.g. trading), and disaggregate the concept of other marketing activities related expenditures. Additionally, intellectual marketing assets need to be included as outputs (see Srivastava et al. 1998; 2001). Including such additional inputs and marketing outputs, we will get a better picture of marketing philosophy within a firm.
Regarding to research techniques, we employed a non-parametric technique to measuring marketing efficiency; however using parametric techniques such as stochastic frontier analysis, will reinforce the results obtained in this research. We would like to point out that DEA has been criticized as a technique that does not have error in its results (see Seiford 1996). In that sense, it is recommendable to utilize Stochastic Data envelopment analysis in order to robust the assessing of marketing efficiency (see Huang and Li 2001).
Finally, in order to generalize our results, it is an imperative to focus on more firms from different contexts. As secondary information of customer intangibles and brand intangibles belong to different sources and the matching firms are reduced, primary research (e.g. surveys) will amplify the picture of marketing efficiency and its effect on accounting and capital market-based performance. Focusing on firms of different countries will allow us to generalize the marketing efficiency concept.
APPENDIX
Table 6: Traditional Analysis Variables Tobin's Q z-value Sig. Constant 7.8145 5.270 0.000 Earnings 8.4607 5.370 0.000 Leverage -3.0291 -2.450 0.014 Infrastructure 1.8391 1.660 0.096 Corporate brand name 0.0109 2.190 0.028 Concentration -1.4111 -1.900 0.058 Age -0.0115 -2.400 0.016 Contemporaneous Marketing Efficiency -0.0644 -4.790 0.000
RMSE R-square chi2 Sig. 1.1956 0.469 70.600 0.000
Note: The technique applied is three-stage least-squares regression (Chu and Keh 2006). RMSE is the acronym for root mean square error. This index ranges from 0 to infinity, which 0 corresponds to the best model. Sig. means the significant level at which rejecting null hypothesis that coefficients are equal to 0.
29
REFERENCES
Aaker, D.A., & Jacobson, R. 1994. The Financial Information Content of Perceived Quality. Journal of Marketing Research, 31 (May): 191-201.
Aaker, D.A., & Jacobson, R. 2001. The Value Relevance of Brand Attitude in High-Technology Markets. Journal of Marketing Research, 38 (November): 485-493.
Ambler, T. 2000. Marketing metrics. Business Strategy Review, 11 (2): 59-66.
Ambler, T., Bhattacharya, C. B., Edell, J., Keller, K. L., Lemon, K. N. & Mittal, V. 2002. Relating Brand and Customer Perspectives on Marketing Management. Journal of Service Research, 5 (1): 13-25.
ACSI. 2007. American Customer Satisfaction Index: www.theacsi.org
Amit, R., & Schoemaker, P. J. H. 1993. Strategic assets and organizational rent. Strategic Management Journal, 14 (1): 33-46.
Anderson, E.W., & Sullivan, M.W. 1993. Antecedents and Consequences of Customer Satisfaction for Firms. Marketing Science, 12 (2): 125-143.
Anderson, E.W., Fornell, C., & Lehman, D.R. 1994. Customer Satisfaction, Market Share and Profitability: Findings from Sweden. Journal of Marketing, 58 (July): 53-66.
Anderson, E.W., Fornell, C., & Mazvancheryl, S.K. 2004. Customer Satisfaction and Shareholder Value. Journal of Marketing, 68 (October): 172-185.
Anderson, E.W., Fornell, C., & Rust, R.T. 1997. Customer Satisfaction, Productivity and Profitability: Differences between goods and services. Marketing Science, 16 (2): 129-145.
Assmus, G., Farley, J.U., & Lehmann, D.R. 1984. How Advertising Affects Sales-Meta Analysis of Econometrics Results. Journal of Marketing Research, 21 (1): 65-74.
Auh, S., & Johnson, M. D. 2005. Compatibility effects in evaluations of satisfaction and loyalty. Journal of Economic Psychology, 26: 35–57.
Banker, R.D., Charnes, A., & Cooper, W.W. 1984. Some Models for Estimating Technical and Scale Efficiencies in Data Envelopment Analysis. Management Science, 30 (9): 1078-1092.
Barney, J. 1991. Firm Resources and Sustained Competitive Advantage. Journal of Management, 17 (1): 99-120.
Barth, M.E., Clement, M.B., Foster, G., & Kasznik, R. 1998. Brand Values and Capital Market Valuation. Review of Accounting Studies, 3: 41-68.
Bates, K., Bates, H., & Johnston, R. 2003. Linking service to profit: the business case for service excellence. International Journal of Service Industry Management, 14 (2): 173-183.
Boles, J. S., Donthu, N. & Lohtia, R. 1995. Sales performance evaluation using relative performance efficiency: The application of Data Envelopment Analysis. Journal of Personal Selling & Sales Management, 15 (3): 31-49.
Boussofiane, A., Dyson, D.G. & Thanassoulis E. 1991. Applied data envelopment analysis. European Journal of Operational Research, 52: 1-15.
Charnes, A., Cooper, W.W., & Rhodes, E. 1978. Measuring the Efficiency of Decision Making Units. European Journal of Operational Research, 3: 429-444.
Charnes, A., Cooper, W.W., Learner, D.B., & Philips, F.Y. 1985. Management Science and Marketing Management. Journal of Marketing, 49 (April): 93-105.
Chu, S., & Keh, H.T. 2006. Brand Value creation: Analysis of the Interbrand Business Week brand value rankings. Marketing Letters, 17: 323-331.
Chung, K.H., & Pruitt, S.W. 1994. A Simple Approximation of Tobin’s Q. Financial Management, 23 (3): 70-74.
Clarke, D.G. 1976. Econometric Measurement of Duration of Advertising Effects on Sales. Journal of Marketing Research, 13 (4): 345-357.
30

Danaher, P.J., & Rust, R.T. 1996. Determining the Optimal Return on Investment for an Advertising Campaign. European Journal of Operational Research, 95 (3): 511-521.
Dekimpe, M.G., & Hanssens, D.M. 1995. The Persistence of Marketing Effects on Sales. Marketing Science, 14 (1): 1-21.
Denis, D. J. & Kruse, T. A. 2000. Managerial Discipline and Corporate Restructuring Following Performance Declines. Journal of Financial Economics, 55 (March): 391–424.
Donthu, N., Hershberger, E. K., & Osmonbekov, T. 2005. Benchmarking marketing productivity using data envelopment analysis. Journal of Business Research, 58: 1474– 1482.
Donthu, N., & Yoo, B. 1998. Retail Productivity Assessment Using Data Envelopment Analysis. Journal of Retailing, 74(1): 89-105.
Eisenhardt, K. M. 1989. Building theories from case study research. Academy of Management Review, 14 (4): 532-550.
Färe, R., Grosskopf, S., Seldon, B. J., & Tremblay, V.J. 2004. Advertising efficiency and the choice of media mix: a case of beer. International Journal of Industrial Organization, 22: 503– 522.
Farrel, M.J. 1957. The measurement of productive efficiency. Journal of the Royal Statistical Society, Series A, 120 (3), 253-290.
Fitzgerald, J. 2004. Evaluating Return on Investment of Multimedia Advertising with a Single-Source Panel: A Retail Case Study. Journal of Advertising Research, 44 (3): 262-270.
Frieder, L., & Subrahmanyam, A. 2005. Brand Perceptions and the Market for Common Stock. Journal of Financial and Quantitative Analysis, 40 (1): 57-85.
Fornell, C. 1992. A National Customer Satisfaction Barometer: The Swedish Experience. Journal of Marketing, 56 (January): 6-21.
Fornell, C., Johnson, M.D., Anderson, E.W., Cha, J., & Bryant, B.E. 1996. The American Customer Satisfaction Index: Nature, Purpose and Findings. Journal of Marketing, 60 (October): 7-18.
Fornell, C., Mithas, S., Morgeson F. V., & Krishnan, M.S. 2006. Customer Satisfaction and Stock Prices: High Returns, Low Risk. Journal of Marketing, 70 (January): 3–14.
Fornell, C., & Birger W. 1987. Defensive Marketing Strategy by Customer Complaint Management: A Theoretical Analysis. Journal of Marketing Research, 24 (November): 337-346.
Fornell, C., & Birger W. 1988. A Model for Customer Complaint Management. Marketing Science, 7 (3): 287-298.
Grant, R. M. 1991. The Resource-Based Theory of Competitive Advantage: Implications for Strategy Formulation. California Management Review, 33 (3): 114-135.
Grant, R. M. 1996. Toward A Knowledge-Based Theory of the Firm. Strategic Management Journal, 17 (Winter): 109-122.
Gruca, T.S., & Rego, L.L. 2005. Customer Satisfaction, Cash Flow, and Shareholder Value. Journal of Marketing, 69 (July): 115-130.
Gupta, S., & Zeithaml V. 2005. Customer Metrics: The Past, the Present, and the Future in Academia and Practice. Marketing Science Institute, Special Report, 05-200: 39-75.
Hamel, G., & Prahalad, C.K. 1994. Competing for the Future. Harvard Business Review, 72, (4): 122-128.
Heikkilä, J. 2002. From supply to demand chain management: efficiency and customer satisfaction. Journal of Operations Management, 20: 747–767.
Huang, Z. & Li, S. X. 2001. Stochastic DEA Models with Different Types of Input-Output Disturbances. Journal of Productivity Analysis, 15: 95–113.
Interbrand. 2007. www.interbrand.com/surveys.asp
Ittner, C. D. & Larcker, D. F. 1998. Are Nonfinancial Measures Leading Indicators of Financial Performance? An Analysis of Customer Satisfaction. Journal of Accounting Research, 36: 1-35.
Jedidi, K., C.F. Mela, & Gupta, S. 1999. Managing Advertising and Promotion for Long-Run Profitability. Marketing Science, 18 (1): 1-22.
31
Kamakura, W. A, Lenartowicz, T. & Ratchfrord, B. T. 1996. Productivity Assessment of Multiple Retail Outlets. Journal of Retailing, 72(4): 333-356.
Kamakura, W. A., Mittal, V., De Rosa, F., & Mazzon, J. A. 2002. Assessing the Service-Profit Chain. Marketing Science, 21 (3): 294-317.
Kamakura, W. A., Ratchford, B., & Agrawal, J. 1988. Measuring Market Efficiency and Wefare Loss. Journal of Consumer Research, 21 (December): 289-302.
Keller, K. L. 1993. Conceptualizing, Measuring, and Managing Customer-Based Brand Equity. Journal of Marketing, 57 (1): 1-22.
Keller, K. L. 1999. Managing Brands for the Long Run: Brand Reinforcement and Revitalization Strategies. California Management Review, 41 (3): 102-124.
Keller, K. L. 2003. Brand Synthesis: The Multidimensionality of Brand Knowledge. Journal of Consumer Research, 29 (March): 595-600.
Keller, K. L., & Lehmann, D. R. 2003. How brands create value? Marketing Management, May/June, 26-31.
Keller, K. L., & Lehmann, D. R. 2006. Brands and Branding: Research Findings and Future Priorities. Marketing Science, 25 (6): 740-759.
Kerin, R.G., & Sethuraman, R. 1998. Exploring the Brand Value-Shareholder Value Nexus for Consumer Goods Company. Journal of the Academy of Marketing Science, 26 (4): 260-273.
Kumbhakar, S.C., & Lovell, C.A.K. 2000. Stochastic frontier analysis, Cambridge University Press.
Leone, R.P., Rao, V.R., Keller, K.L., Luo, A.M., McAlister, L., & Srivastava, R. 2006. Linking Brand Equity to Customer Equity. Journal of Service Research, 9 (2): 125-138
Lindenberg, E. B. & Ross, S. A. 1981. Tobin’s q Ratio and Industrial Organization. Journal of Business, 54 (January): 1–32.
Low, G., & Mohr, J. 1999. “Setting advertising and promotion budgets in multi-brand companies”. Journal of Advertising Research, 39 (1): 67-78.
Luo, X., & Donthu, N. 2001. Benchmarking Advertising Efficiency. Journal of Advertising Research, 41 (6): 7-18.
Luo, X., & Donthu, N. 2005. Assessing advertising media spending inefficiencies in generating sales. Journal of Business Research, 58: 28– 36.
McConnell, J. J., & Servaes, H. 1990. Additional Evidence on Equity Ownership and Corporate Value. Journal of Financial Economics, 27 (October): 595–612.
Madden, T.J., Fehle, F., & Fournier, S. 2006. Brands Matter: An Empirical Demonstration of the Creation of Shareholder Value through Branding. Journal of the Academy of Marketing Science, 34 (2): 224-235.
Marketing Science Institute. 2006. Research Priorities 2006-2008: A guide to MSI research programs and procedures.
Matzler, K., Hinterhuber, H. H., Daxer, C., & Huber, M. 2005. The Relationship between Customer Satisfaction and Shareholder Value. Total Quality Management, 16 (5): 671–680.
Mittal, V., Anderson, E. W., Sayrak, A., & Tadikamalla P. 2005. Dual Emphasis and the Long-Term Financial Impact of Customer Satisfaction. Marketing Science, 24 (4), 544–555.
Moorman, C., & Rust, R. T. 1999. The Role of Marketing. Journal of Marketing, 63 (4): 180–197.
Mukherjee, A., Nath, P. & Pal, M. 2003. Resource, service quality and performance triad: a framework for measuring efficiency of banking services. Journal of the Operational Research Society, 54: 723–735.
Peteraf, M. 1993. The cornerstones of competitive advantage: A resource-based view. Strategic Management Journal, 14 (3): 179-191.
Piercy, N. 1987. The marketing budgeting process: marketing management implications. Journal of Marketing, 51: 45-59.
Porter, M.E. 1980. Competitive Strategy. New York: The Free Press.
32

Rao, V.R., Agarwal, M.K., & Dahlhoff, D. 2004. How is Manifest Branding Strategy related to the Intangible Value of a Corporation? Journal of Marketing, 68 (October): 126-141.
Rappaport, A. 1986. Creating Shareholder Value. New York: The Free Press.
Rust, R.T., Ambler, T., Carpenter, G.S., Kumar, V., & Srivastava, R.K. 2004. Measuring Marketing Productivity: Current Knowledge and Future Directions. Journal of Marketing, 68 (October): 76-89.
Rust, R. T., Keiningham, T., Clemens, S., & Zahorik A. 1999. Return on Quality at Chase Manhattan Bank. Interfaces, 29 (2): 62-72.
Rust, R.T., Moorman, C. & Dickson, P. R. 2002. Getting Return on Quality: Revenue Expansion, Cost Reduction, or Both? Journal of Marketing, 66 (October): 7-24.
Rust, R.T. and Zahorik, A. 1993. Customer Satisfaction, Customer Retention and Market Share. Journal of Retailing, 69 (2): 193-215.
Rust, R.T., Zahorik, A., & Keiningham, T. 1995. Return on Quality (ROQ): Making service quality financially accountable. Journal of Marketing, 59 (April): 58-70.
Seiford, L.M. 1996. Data Envelopment Analysis: The Evolution of the State of the Art (1978-1995). Journal of Productivity Analysis, 7 (2/3): 99-137.
Seiford, L.M., & Zhu, J. 1999. Profitability and Marketability of the Top 55 U.S. Commercial Banks. Management Science, 45 (9): 1270-1288.
Sheth, J.N., & Sisodia, R.S. 1995. Feeling the Heat: Making Marketing More Productive. Marketing Management, 4 (2): 8-23.
Sheth, J.N., Sisodia, R.S., & Sharma, A. 2000. The Antecedents and Consequences of Customer-Centric Marketing. Journal of the Academy of Marketing Science, 28 (1): 55-66.
Sheth, J.N., Sisodia, R.S., & Sharma, A. 2002. Marketing Productivity: Issues and Analysis. Journal of Business Research, 55: 349-362.
Smith, C.W., & Watts, R. L. 1992. The Investment Opportunity Set and Corporate Financing, Dividend, and Compensation Policies. Journal of Financial Economics, 32 (December): 263–92.
Spender J.C. 1996. Making Knowledge The Basis of A Dynamic Theory of The Firm. Strategic Management Journal, 17 (Winter): 45-62.
Srivastava, R.K., Shervani, T.A., & Fahey, L. 1998. Market-Based Assets and Shareholder Value: A Framework for Analysis. Journal of Marketing, 62 (January): 2-18.
Srivastava, R. K., Shervani, T. A., & Fahey, L. 1999. Marketing, Business Processes, and Shareholder Value: An Organizationally Embedded View of Marketing Activities and the Discipline of Marketing. Journal of Marketing, 63 (Special Issue): 168-179.
Srivastava, R.K., Fahey, L., & Christensen, H.K. 2001. The Resource-Based View and Marketing: The Role of Market-Based Assets in gaining Competitive Advantage. Journal of Management, 27: 777-802.
Teece, D., Pisano, G., & Shuen, A. 1997. Dynamic capabilities and strategic management. Strategic Management Journal, 18 (7): 509-533.
Van Waterschoot, W. & Van den Bulte, C. 1992. The 4P Classification of the Marketing Mix Revisited. Journal of Marketing, 56 (October): 83-93.
Villalonga, B. 2004. Intangible resources, Tobin’s Q, and sustainability of performance differences. Journal of Economic Behaviour & Organization, 54: 205-230.
Wernerfelt, B. 1984. A Resource-Based View of the Firm. Strategic Management Journal, 5 (2): 171-180. Williamson, O.E. 1991. Strategizing, Economizing, and Economic Organization. Strategic Management
Journal, 12: 75-94.
Zeithaml, V. A. 2000. Service Quality, Profitability, and the Economic Worth of Customers: What We Know and What We Need to Learn. Journal of the Academy of Marketing Science, 28 (1): 67-85.
Zhu, J. 2003. Quantitative Models for Performance Evaluation and Benchmarking: Data Envelopment Analysis with Spreadsheets and DEA Excel Solver. International Series in Operations Research and Management Science. United States of America: Kluwer Academic Publishers.
33