Designing sustainable sanitation: Involving design in innovative, transdisciplinary research
Upload
khangminh22Category
view
3download
0
sustainability
Article
The Innovative Model of Runway Sustainable Management onSmaller Regional Airports
Boštjan Kovacic 1,* , Damjan Doler 2 and Drago Sever 1
�����������������
Citation: Kovacic, B.; Doler, D.;
Sever, D. The Innovative Model of
Runway Sustainable Management on
Smaller Regional Airports.
Sustainability 2021, 13, 652.
https://doi.org/10.3390/su13020652
Received: 29 November 2020
Accepted: 6 January 2021
Published: 12 January 2021
Publisher’s Note: MDPI stays neu-
tral with regard to jurisdictional clai-
ms in published maps and institutio-
nal affiliations.
Copyright: © 2021 by the authors. Li-
censee MDPI, Basel, Switzerland.
This article is an open access article
distributed under the terms and con-
ditions of the Creative Commons At-
tribution (CC BY) license (https://
creativecommons.org/licenses/by/
4.0/).
1 Faculty of Civil Engineering, Transportation Engineering and Architecture, University of Maribor,Smetanova 17, 2000 Maribor, Slovenia; [email protected]
2 Ministry of the Environment and Spatial Planning, Dunajska Cesta 48, 1000 Ljubljana, Slovenia;[email protected]
* Correspondence: [email protected]; Tel.: +386-2-22-94-316
Abstract: Airport runways are exposed to large traffic loads and other external factors which causetheir transformation. Monitoring the state of the unevenness and determining the runway defective-ness is a complex procedure which includes fast and qualitative measurements of the execution offlatness, their evaluation and the determination of the level of runway defectiveness. For this purpose,an improved process of determining airport runway defectiveness is proposed, based on geodeticsurvey and the management information system prototype, which enables evaluating the results ofthe executed survey and suggesting the runway maintenance measures. A similar analysis of theconsidered data on the example of a smaller, regional airport in Maribor, Slovenia, was performedwith the help of our own algorithm, which, on various platforms, enables the tabular and graphicaldisplay of surface irregularities. The algorithm prototype allows the automated monitoring and eval-uating of the unevenness or runway states, determining their defectiveness and advising adequateaction. With the help of the suggested method and developed information system prototypes, itis possible to confirm the demand for professionally adequate and on-time planning of necessarymaintenance works, with which it is surely possible to prevent an eventual unexpected closing of therunway and related costs. The suggested method is also usable in evaluating the state of other trafficinfrastructure.
Keywords: runway; sustainable; monitoring; innovated model; deformations; pavements
1. Introduction
Logistics systems, including those regarding airport infrastructure, in most cases,function effectively and successfully only if all of the corresponding elements functioneffectively and successfully. In their research [1,2], note that improper and insufficientlogistics infrastructure is the second most important factor affecting logistics. In [3], theauthors suggest a guidance model in the case of accidents or disorders which limit thefunction of logistics (including those regarding airport) infrastructure. The extraction ofsuch data is generally linked to automated procedures, and the demand for their prompt-ness, exactness and availability at any time encourages the development of systems whichallow automated extraction and processing in real time [4–6].
Aircraft traffic has a significant role in the global economy [7]. The authors of [8] pointout that improving airport infrastructure can reduce air traffic costs by up to 15%.
Traffic safety is key in aircraft traffic. Most international organizations work to providetraffic safety in aircraft traffic. Everybody is aware that a high level of safety provisionin aviation means a safe and uninterrupted occurrence of aircraft traffic. Due to this, itis necessary to unify, as much as possible, all the procedures which are related to provid-ing traffic safety and establish the generally well-established procedures (methodology).Considering the need to design a global safety plan, the International Civil Aviation Or-
Sustainability 2021, 13, 652. https://doi.org/10.3390/su13020652 https://www.mdpi.com/journal/sustainability

Sustainability 2021, 13, 652 2 of 20
ganisation (ICAO) proposed that the following groups of events cause the highest risks todisorder development in aircraft traffic [7,9]:
• events on the area intended for aeroplane landing and take-off, and in their surround-ings;
• events related to loss of control over the aircraft while flying;• events while flying in the take-off or landing phase.
The present article considers in detail the first group of events, which can occur on therunway and in its surroundings. Among others, in this group belong the following eventswith a high level of risk to develop disorders and which are directly connected with thestage (status) of runways flatness:
• unusual contact with the runway when landing—rough landing (hereinafter: ARC);• the trip from the runway (hereinafter: RE);• loss of control over the aircraft on the runway or taxiway (hereinafter: LOC-G) and• collision with the obstacles when aircraft take-off or landing (hereinafter: CTOL).
RE events present the biggest part of plane crashes and often surpass 25% of all planecrashes in commercial flights [7,9–11]. Deformations on the runway pavement surfaceobstruct pilots’ aircraft management and cause onboard vibrations, which makes it difficultto correctly read the measure instruments, cause mechanical defects on the aircraft anddiminish the contact of the tire with the floor, which affects the correct action of the brakingsystem. Most difficulties present dents and the production of aquaplaning [12].
Therefore, the safe occurrence of aircraft traffic is, to a great extent, connected withproviding safety on the runway and its surroundings [13–17]. In order for these disordersto be limited and diminished to the greatest extent possible, the runways must also be inthe best possible state (adequately maintained). Runways must provide adequate loadcapacity, good surface friction and a smooth aircraft run. All of these demands dependon adequate runway maintenance. Well maintained runways are very important for safeaircraft take-off and landing [18].
2. Related Works2.1. Monitoring the Runways’ Conditions
Detection of runways‘ unevenness and determining their shape, dimensions andthe causes of why these occur is a complex process which demands an interdisciplinaryapproach [19]. The interdisciplinary approach to problem solving is used in many modernscientific types of research, since it is necessary to research the exposed issue from a numberof aspects. Recently, automated extraction and spatial data processing on roadway andrunway unevenness are the subjects of many types of research [20–26]. The authors, inresearch, mainly focus on interpretation, pavement surface and runway analysis and thedevelopment of algorithms for automated recognition or extraction of unevenness (cracks,holes etc.) from the recordings, determining the dimensions of the unevenness (widthand depth) and their classification [27–29]. The use of geodetic methods in determiningthe vertical deviations and detecting deformations on runway surfaces and predicting theoccurrence of new deformations is not yet sufficiently researched and not many researchpieces on this topic can be found in the open literature [30].
2.2. Management Information Systems
Airports are large, complex, dynamic systems which are constantly under the influ-ences of internal and external participants. This demands the effective management of allprocesses which are necessary for uninterrupted airport function. The authors of [31–35]researched the use and prevalence of some information systems which are used at airportsin the United States of America on the aerial and terrestrial parts of the airport. They note,in the research, that there are many types of information systems which are managementsupport. The airports‘ equipment with them is very different and, to the greatest extentpossible, it depends on the airport purpose and size [36]. In the 1990s, the Airport Associ-

Sustainability 2021, 13, 652 3 of 20
ation Council International showed the need to establish information systems intendedfor management maintenance; the authors of [37] also note that the establishment of suchinformation systems is key for effective maintenance.
In the present work, we discuss the maintenance area, we focused in detail on lo-gistics infrastructure maintenance the runway maintenance and the development of theprocess decision-making model, which will support basic maintenance process and directparticipants in the maintenance process, and will also be used as management support fordecision-making regarding the airport infrastructure maintenance area, mostly in runwaymaintenance. Infrastructure conditions data are a critical part of such models, which areextracted with measurements in the field [38,39]; in addition, the selection of the pro-cess decision-making models must be based on qualitative data the on the state of theinfrastructure. Due to this fact, we focus in detail on the process decision-making modeldevelopment in order to determine the deformations of the runways; we integrated it intothe process decision-making maintenance model. This was necessary to establish AirportPavement Management System (APMS). In the development of the APMS, we consideredthe demand that it mostly needs to be useful on smaller airports:by its extent, as wellas the loading, and that it allows collecting, storing and maintenance of more types ofmeasurement data and analysis performances.
APMS and PMS are built from six basic building blocks [40]: inventory of infras-tructure characteristics (construction data, traffic data and infrastructure state data), theassessment of the infrastructure state (for prediction the future states, alternatives, deci-sion making), the database (overview the results, executed and planned activities), thedata analysis (choosing the optimal alternative), the results preparation (reports) and thefeedback.
For logistics transport systems management, the decision-makers have computer-supported decision-making systems called Traffic Management Systems (TMS). Due to therequirement of airport specificity, the Air Transportation System (ATS) have developedparallelly. For adequate and timely road maintenance, the decision-makers use varioustechnical and economic analyses when creating the maintenance strategies which areimplemented in the Pavement Management System (PMS). Due to the airport specificity,the APMS is also used for the need to create adequate maintenance strategies. Theseinclude the procedures which are of help when evaluating and searching for adequatemaintenance strategies. APMS is used by many airports around the world [41,42].
PMS and APMS development are subjects of many types of research [43–46]. Thedownside of the development of APMS is that it is intended mostly for larger and fre-quently used airports, but not for smaller or less frequently used airports, e.g., the MariborEdvard Rusjan Airport, which is mostly intended for emergency flights, the performanceof exhibition, training and school flights. In all described systems, there is not a system forautomated unevenness detection on the runways and their evaluation. On the runways,instances of unevenness can appear in the shape of a lift of the runway, cracks or otherdents, and all of these can affect safe landing or take-off of lighter aeroplanes. The biggestproblem that can occur is aquaplaning risks. The authors conduicted the automated detec-tion of the dents with the help of a point laser displacement sensor and accelerometer. Theyconcluded that the biggest issues are in the accuracy of detecting the damage location inthe dependence of certain measure time intervals. The runways unevenness is the biggestextent impact that increases the possibilities of suspension damage, the malfunction ofsensitive devices, uneven contact with the floor, cargo damage or even aeroplane damage.
2.3. Contribution
The research works in the field of identifying different methods and methodologies formeasuring unevenness at the airport runways have shown that the suggested method hasnot yet been used or carried out. Furthermore, in runway maintenance, special attention isgiven to larger, more burdened (also richer) airports which can implement larger financialinputs into management information systems, which are of course available in the market.

Sustainability 2021, 13, 652 4 of 20
Automated systems for evaluation of runway state at smaller regional airports are notdetected. This is why the contribution of this article is provided with:
• a changed (adjusted) method for execution of the measurements of unevenness onregional airports and
• an adjusted, sustainably inclined information system for airport infrastructure man-agement on smaller regional airports.
3. Methods and Materials
The methodology to establish an automated system for monitoring and evaluatingrunway unevenness was composed of the following steps:
• a critical analysis of valid demands for evaluating the runways’ unevenness;anadapted method for measuring the runway’s state;
• the analysis of (geodetic) methods;• the production of the adapted method suggestion;• the test of suggested method:
Sustainability 2020, 12, x FOR PEER REVIEW 4 of 19
larger financial inputs into management information systems, which are of course available in the market. Automated systems for evaluation of runway state at smaller regional airports are not detected. This is why the contribution of this article is provided with: • a changed (adjusted) method for execution of the measurements of unevenness on re-
gional airports and • an adjusted, sustainably inclined information system for airport infrastructure man-
agement on smaller regional airports.
3. Methods and Materials The methodology to establish an automated system for monitoring and evaluating
runway unevenness was composed of the following steps: • a critical analysis of valid demands for evaluating the runways´ unevenness;an
adapted method for measuring the runway’s state; • the analysis of (geodetic) methods; • the production of the adapted method suggestion; • the test of suggested method: the execution of the measurements;■▪ the recalculation and results evaluation. • an adapted information system for airport logistics infrastructure management: • the analysis of the possibility to upgrade existing information systems; • the suggestion and upgrade execution; • the test in a real environment.
Substantively, the research was executed in terms of a PhD thesis at the Faculty of Logistics, the University of Maribor, and the fieldwork was executed at the Maribor Edvard Rusjan Airport, Slovenia. The airport is a public international airport with the reference code 4D and is, in terms of volume of turnover, among the smaller public air-ports. The runway is 2500 m long, 45 m wide and has a load capacity PCN 86/F/A/X/T. The measurements of the unevenness on the Maribor Edvard Rusjan Airport runway were executed in agreement with the airport management.
The runway´s state was found out with the help of a geodetic survey. For this pur-pose, the vehicle with built-in geodetic sensors with which the state of runways was found out, was made. The key geodetic equipment was a robotized total station RTS Leica Nova TS50. With it, the moving towing vehicle on which the 360° prism was in-stalled, was observed. RTS Leica Nova TS50 has the accuracy which is complied with the ISO 17123-3 for measuring angles and is 0,5” and with ISO 17123-4 for measuring the lengths and is 0,6 mm ± 1 ppm. All measurements were executed in a unified coordinate system.
The dual-frequency base GNSS receiver Topcon Hiper Pro was installed on the towing vehicle, with which the coordinates of the driving trajectories were encompassed and measured larger vertical unevenness were noted down. The data with RTS and GNSS were encompassed with the speed of 6–10 readings per second which means that, at an individual measurement at the constant speed of 6 km/h, on average, 7800 trajectory points were measured. In terms of the research, we made three independent measure-ments of the unevennessstate, which were later mutually analysed and compared.
The established geodetic net presents the geometric base of measuring of the run-waystate. This is essential to consider the rules of planning geodetic nets which deter-mine that it is necessary to control the capture and data processing, consider the correc-tions of measured quantities and use an appropriate balancing method [47,48].
Stabilized points of the geodetic zero net provide stability for a longer time, and with optimal execution and multiple repetitions of the measurement (Figure 1).
To provide as much accuracy as possible, three classic terrestrial dimension methods were used: triangulation (the GNSS method which allows bonding on the national spatial
the execution of the measurements;
Sustainability 2020, 12, x FOR PEER REVIEW 4 of 19
larger financial inputs into management information systems, which are of course available in the market. Automated systems for evaluation of runway state at smaller regional airports are not detected. This is why the contribution of this article is provided with: • a changed (adjusted) method for execution of the measurements of unevenness on re-
gional airports and • an adjusted, sustainably inclined information system for airport infrastructure man-
agement on smaller regional airports.
3. Methods and Materials The methodology to establish an automated system for monitoring and evaluating
runway unevenness was composed of the following steps: • a critical analysis of valid demands for evaluating the runways´ unevenness;an
adapted method for measuring the runway’s state; • the analysis of (geodetic) methods; • the production of the adapted method suggestion; • the test of suggested method: the execution of the measurements;■▪ the recalculation and results evaluation. • an adapted information system for airport logistics infrastructure management: • the analysis of the possibility to upgrade existing information systems; • the suggestion and upgrade execution; • the test in a real environment.
Substantively, the research was executed in terms of a PhD thesis at the Faculty of Logistics, the University of Maribor, and the fieldwork was executed at the Maribor Edvard Rusjan Airport, Slovenia. The airport is a public international airport with the reference code 4D and is, in terms of volume of turnover, among the smaller public air-ports. The runway is 2500 m long, 45 m wide and has a load capacity PCN 86/F/A/X/T. The measurements of the unevenness on the Maribor Edvard Rusjan Airport runway were executed in agreement with the airport management.
The runway´s state was found out with the help of a geodetic survey. For this pur-pose, the vehicle with built-in geodetic sensors with which the state of runways was found out, was made. The key geodetic equipment was a robotized total station RTS Leica Nova TS50. With it, the moving towing vehicle on which the 360° prism was in-stalled, was observed. RTS Leica Nova TS50 has the accuracy which is complied with the ISO 17123-3 for measuring angles and is 0,5” and with ISO 17123-4 for measuring the lengths and is 0,6 mm ± 1 ppm. All measurements were executed in a unified coordinate system.
The dual-frequency base GNSS receiver Topcon Hiper Pro was installed on the towing vehicle, with which the coordinates of the driving trajectories were encompassed and measured larger vertical unevenness were noted down. The data with RTS and GNSS were encompassed with the speed of 6–10 readings per second which means that, at an individual measurement at the constant speed of 6 km/h, on average, 7800 trajectory points were measured. In terms of the research, we made three independent measure-ments of the unevennessstate, which were later mutually analysed and compared.
The established geodetic net presents the geometric base of measuring of the run-waystate. This is essential to consider the rules of planning geodetic nets which deter-mine that it is necessary to control the capture and data processing, consider the correc-tions of measured quantities and use an appropriate balancing method [47,48].
Stabilized points of the geodetic zero net provide stability for a longer time, and with optimal execution and multiple repetitions of the measurement (Figure 1).
To provide as much accuracy as possible, three classic terrestrial dimension methods were used: triangulation (the GNSS method which allows bonding on the national spatial
the recalculation and results evaluation.
• an adapted information system for airport logistics infrastructure management:• the analysis of the possibility to upgrade existing information systems;• the suggestion and upgrade execution;• the test in a real environment.
Substantively, the research was executed in terms of a PhD thesis at the Facultyof Logistics, the University of Maribor, and the fieldwork was executed at the MariborEdvard Rusjan Airport, Slovenia. The airport is a public international airport with thereference code 4D and is, in terms of volume of turnover, among the smaller public airports.The runway is 2500 m long, 45 m wide and has a load capacity PCN 86/F/A/X/T. Themeasurements of the unevenness on the Maribor Edvard Rusjan Airport runway wereexecuted in agreement with the airport management.
The runway´s state was found out with the help of a geodetic survey. For this purpose,the vehicle with built-in geodetic sensors with which the state of runways was found out,was made. The key geodetic equipment was a robotized total station RTS Leica NovaTS50. With it, the moving towing vehicle on which the 360◦ prism was installed, wasobserved. RTS Leica Nova TS50 has the accuracy which is complied with the ISO 17123-3for measuring angles and is 0,5” and with ISO 17123-4 for measuring the lengths and is0,6 mm ± 1 ppm. All measurements were executed in a unified coordinate system.
The dual-frequency base GNSS receiver Topcon Hiper Pro was installed on the towingvehicle, with which the coordinates of the driving trajectories were encompassed andmeasured larger vertical unevenness were noted down. The data with RTS and GNSSwere encompassed with the speed of 6–10 readings per second which means that, at anindividual measurement at the constant speed of 6 km/h, on average, 7800 trajectory pointswere measured. In terms of the research, we made three independent measurements of theunevennessstate, which were later mutually analysed and compared.
The established geodetic net presents the geometric base of measuring of the run-waystate. This is essential to consider the rules of planning geodetic nets which determinethat it is necessary to control the capture and data processing, consider the corrections ofmeasured quantities and use an appropriate balancing method [47,48].
Stabilized points of the geodetic zero net provide stability for a longer time, and withoptimal execution and multiple repetitions of the measurement (Figure 1).

Sustainability 2021, 13, 652 5 of 20
Sustainability 2020, 12, x FOR PEER REVIEW 5 of 19
coordinate system D96/TM), trilateration (a precise terrestrial method), and precise lev-elling.
The positional net balancing was executed based on the smallest squares method, with the software package Columbus 4.6. The points position accuracy of the geodetic zero net was estimated with standard ellipses of the errors [49,50] and with global accu-racy measurement [50]. When balancing the altitude net, the Earth curvature effect and systematic environment effect were considered.
GRID (see Figure 1) presents a rectangular net of points of a mutual distance of 6 m. GRID was used as the base in the benchmarking of individual dimensions with the trailer. All relative deviations of individual dimensions are determined relatively based on the GRID. The GRID dimension points were executed with a precise terrestrial method.
The running surface state measurement was executed with an assumption that the object of observation (the runway) is still. Three dimensions for three meteorological pe-riods (low temperatures in January 2018, medium temperatures in April 2018 and high temperatures in June 2018) were executed with the described equipment. Special atten-tion was given to the touchdown runway zone (Figure 2).
In measuring the running surface state, the object of observation was a trailer with an installed 3600 reflective prism. The movement of the trailer was concerned as a kine-matic process, and the position of the trailer was executed with the GNNS method and with the terrestrial cinematic dimension method. The robotized electronic tachymeter, Leica Nova TS50, followed the movement of the trailer and noted its position with the frequency of 10 measured positions in a second. Supernumerary measurements, which provide classic balancing of geodetic observations, were executed [51].
Figure 1. Basic (zero) geodetic net and GRID on the runway. Figure 1. Basic (zero) geodetic net and GRID on the runway.
To provide as much accuracy as possible, three classic terrestrial dimension methodswere used: triangulation (the GNSS method which allows bonding on the national spatialcoordinate system D96/TM), trilateration (a precise terrestrial method), and precise levelling.
The positional net balancing was executed based on the smallest squares method, withthe software package Columbus 4.6. The points position accuracy of the geodetic zero netwas estimated with standard ellipses of the errors [49,50] and with global accuracy mea-surement [50]. When balancing the altitude net, the Earth curvature effect and systematicenvironment effect were considered.
GRID (see Figure 1) presents a rectangular net of points of a mutual distance of 6 m.GRID was used as the base in the benchmarking of individual dimensions with the trailer.All relative deviations of individual dimensions are determined relatively based on theGRID. The GRID dimension points were executed with a precise terrestrial method.
The running surface state measurement was executed with an assumption that theobject of observation (the runway) is still. Three dimensions for three meteorologicalperiods (low temperatures in January 2018, medium temperatures in April 2018 and hightemperatures in June 2018) were executed with the described equipment. Special attentionwas given to the touchdown runway zone (Figure 2).
In measuring the running surface state, the object of observation was a trailer with aninstalled 3600 reflective prism. The movement of the trailer was concerned as a kinematicprocess, and the position of the trailer was executed with the GNNS method and with theterrestrial cinematic dimension method. The robotized electronic tachymeter, Leica NovaTS50, followed the movement of the trailer and noted its position with the frequency of10 measured positions in a second. Supernumerary measurements, which provide classicbalancing of geodetic observations, were executed [51].

Sustainability 2021, 13, 652 6 of 20
Sustainability 2020, 12, x FOR PEER REVIEW 6 of 19
Figure 2. Measured positions of the trailer in the third time dimensions.
3.1. Determination of the Vertical Deviations The direct comparison of measured points in more various time dimensions and
with the condition that the points, according to the position, do not coincide, is not pos-sible [52]. With appropriate processing of the point cloud (set of points), changes of the shape and position of the observed object can be found.
The data processing of individual dimensions was executed in the following steps and is described in more detail in [53]: • the calculation of the plain, measured through the points in individual time dimension:
the equation of the plain through the non-coplanar points according to the Moor–Penrose inverse method;
• the calculation of vertical deviations between individual dimensions and GRID; • the calculation of average vertical shift between individual dimensions.
The calculated values are shown in Table 2. The algorithm for calculation of vertical deviations and graphical presentation of the
calculation results was made in the software package MATLAB R2019b. The software LetMB.m is intended for the calculation of the regression plains and vertical deviations and graphical display of results. The algorithm is executed in two steps [52,53]: • In the first step, with the use of pseudoinverse matrix or Moor–Penrose matrix inverse
for each time dimension, the parameters of regression plains—and in, hereinafter, ver-tical deviations of these regression plains from the GRID—are calculated,
• In the second step, individual time dimensions are mutually compared and vertical shifts of regression plains between individual time dimensions are calculated.
At the execution of the measurements in the real environment, it is sensible to use at least two independent measuring methods [54]. As a supplementary method, the estab-lished geomechanics method was used: Falling Weight Deflectometer (FWD) (Figure 3). With the help of this method, comparison and evaluation of the relevance of the sug-gested method for monitoring the state of runways were allowed [53,55].
Figure 2. Measured positions of the trailer in the third time dimensions.
3.1. Determination of the Vertical Deviations
The direct comparison of measured points in more various time dimensions and withthe condition that the points, according to the position, do not coincide, is not possible [52].With appropriate processing of the point cloud (set of points), changes of the shape andposition of the observed object can be found.
The data processing of individual dimensions was executed in the following stepsand is described in more detail in [53]:
• the calculation of the plain, measured through the points in individual time dimension:the equation of the plain through the non-coplanar points according to the Moor–Penrose inverse method;
• the calculation of vertical deviations between individual dimensions and GRID;• the calculation of average vertical shift between individual dimensions.
The calculated values are shown in Table 2.The algorithm for calculation of vertical deviations and graphical presentation of the
calculation results was made in the software package MATLAB R2019b. The softwareLetMB.m is intended for the calculation of the regression plains and vertical deviationsand graphical display of results. The algorithm is executed in two steps [52,53]:
• In the first step, with the use of pseudoinverse matrix or Moor–Penrose matrix inversefor each time dimension, the parameters of regression plains—and in, hereinafter,vertical deviations of these regression plains from the GRID—are calculated,
• In the second step, individual time dimensions are mutually compared and verticalshifts of regression plains between individual time dimensions are calculated.
At the execution of the measurements in the real environment, it is sensible to use atleast two independent measuring methods [54]. As a supplementary method, the estab-lished geomechanics method was used: Falling Weight Deflectometer (FWD) (Figure 3).With the help of this method, comparison and evaluation of the relevance of the suggestedmethod for monitoring the state of runways were allowed [53,55].

Sustainability 2021, 13, 652 7 of 20
Sustainability 2020, 12, x FOR PEER REVIEW 7 of 19
Figure 3. Using FWD equipment.
3.2. Management of Irregularities on the Airport Runway International organizations in the area of aviation—including the European Union
Aviation Safety Agency (EASA) in the documents Acceptable Means of Compliance (AMC) and Guidance Material (GM) to Authority, Organisation and Operations Re-quirements for Aerodromes in Certification Specifications (CS) and Guidance Material (GM) for Aerodromes Design and ICAO in the document Annex 14, among others—also prescribe the permissible presence of irregularities (dents and bulges) on runways and other surfaces intended for aircraft moving. On the surface, there must not be unevenness in the shape of bulges higher than 1.25 cm, measured with a 3 m long crossbar in any direction and dents deeper than 3 mm, measured with the 3 m long crossbar in any di-rection, which can be filled with water.
This demanding method is based on manual work; due to that, the method is unre-liable, time-consuming and financially extensive. The key disadvantage of this method is that unevenness is not located in a unified coordinate system.
Due to the obsoleteness of the demanding but valid method, it was determined in the terms of the research that the measuring procedure, and consequently, the evaluation of the runway state (unevenness) is attempted to be automated. It was necessary to re-peatedly study the strategy of evaluating the measurements results with modern meas-uring equipment and provide the methodology for making the adapted information system for the airport logistics infrastructure management.
The basis with which to establish the adapted information system presents the fact that the maintenance of the runway must be performed periodically, at short-term, mid-dle-term and long-term plans, which are known in advance, with known equipment and methods, with the intention to as well as possible, with as little procedures as possible, with as little congestion as possible, and in an economically favourable way maintain the runways in the best condition. An overdue restoration of the deformations causes them to appear in the bigger extent, which consequently means that maintenance or renovation costs are bigger, and time necessary for renovation is longer [56–59]. Due to safety and economic reasons, it is necessary to constantly maintain the runways in an optimal state. The runway life expectance is approximately 20 years, but with proper and timely maintenance, this can be extenced to 40 years [59].
Extensive and prolonged renovations of the runways cause the closure or limited function of the runways, which can mean a failure in revenue from the principal activity for the airport manager. Furthermore, airline costs during the renovation forces the air-craft to ground or for an alternative location to be found, not to mention that the costs due to the delays occurred in the air traffic increase as well [60].
In developing the adapted information system for the airport logistics infrastructure management, the following assumptions were made:
Figure 3. Using FWD equipment.
3.2. Management of Irregularities on the Airport Runway
International organizations in the area of aviation—including the European UnionAviation Safety Agency (EASA) in the documents Acceptable Means of Compliance (AMC)and Guidance Material (GM) to Authority, Organisation and Operations Requirementsfor Aerodromes in Certification Specifications (CS) and Guidance Material (GM) for Aero-dromes Design and ICAO in the document Annex 14, among others—also prescribe thepermissible presence of irregularities (dents and bulges) on runways and other surfacesintended for aircraft moving. On the surface, there must not be unevenness in the shape ofbulges higher than 1.25 cm, measured with a 3 m long crossbar in any direction and dentsdeeper than 3 mm, measured with the 3 m long crossbar in any direction, which can befilled with water.
This demanding method is based on manual work; due to that, the method is unreli-able, time-consuming and financially extensive. The key disadvantage of this method isthat unevenness is not located in a unified coordinate system.
Due to the obsoleteness of the demanding but valid method, it was determined in theterms of the research that the measuring procedure, and consequently, the evaluation ofthe runway state (unevenness) is attempted to be automated. It was necessary to repeat-edly study the strategy of evaluating the measurements results with modern measuringequipment and provide the methodology for making the adapted information system forthe airport logistics infrastructure management.
The basis with which to establish the adapted information system presents the fact thatthe maintenance of the runway must be performed periodically, at short-term, middle-termand long-term plans, which are known in advance, with known equipment and methods,with the intention to as well as possible, with as little procedures as possible, with as littlecongestion as possible, and in an economically favourable way maintain the runways inthe best condition. An overdue restoration of the deformations causes them to appear inthe bigger extent, which consequently means that maintenance or renovation costs arebigger, and time necessary for renovation is longer [56–59]. Due to safety and economicreasons, it is necessary to constantly maintain the runways in an optimal state. The runwaylife expectance is approximately 20 years, but with proper and timely maintenance, thiscan be extenced to 40 years [59].
Extensive and prolonged renovations of the runways cause the closure or limitedfunction of the runways, which can mean a failure in revenue from the principal activityfor the airport manager. Furthermore, airline costs during the renovation forces the aircraftto ground or for an alternative location to be found, not to mention that the costs due tothe delays occurred in the air traffic increase as well [60].
In developing the adapted information system for the airport logistics infrastructuremanagement, the following assumptions were made:

Sustainability 2021, 13, 652 8 of 20
• the measurements of runway unevenness need to be executed with modern geodeticequipment which provides the measurment in the unified coordinate system, highaccuracy and repeatability of the measurements;
• a variable state of the airport logistics infrastructure is established, which is easilyand uniquely determinable based on the executed measurements with the moderngeodetic equipment;
• the strategy of airport logistics infrastructure maintenance is determined or suggestedbased on the executed evaluation of the state of the airport logistics infrastructure.
The final product is in the shape of the adapted information system prototype for theairport logistics infrastructure management. This was created in the software environmentBizagi Modeler, 3.6.0.044 version and was planned with a BPMN standard modellingtechnique, which is process-oriented and intended for the software development [61,62].The conceptual model was made in the shape of LetMB high-level diagram.
4. Results4.1. Monitoring the Runways State
The mathematical model to calculate vertical deviations and graphical presentation ofthe calculation results is made in the MATLAB R2019b software package. For this purpose,the LetMB.m programme was made, which is intended for the calculation of regressionplains, vertical deviations and graphical display of the results. The calculation was madein two steps.
In the first step, for each time dimension, the calculation of the regression plainparameters and vertical deviations of regression plains from GRID was made. The resultsare shown in Table 1 for all three-time dimensions.
Table 1. Parameters of regression plains R1, R2 and R3 and their evaluated accuracy.
Parameters of Regression Plain a b c D
R1 −0.011018 −0.005116 1 0R2 −0.017345 −0.004878 1 0R3 −0.011022 −0.005113 1 0
The accuracy of the regressionplain parameters [m]
R1 1.6810 × 10⁻⁵ 1.2756 × 10⁻⁵ 1 1R2 0.9783 × 10⁻⁵ 0.7669 × 10⁻⁵ 1 1R3 1.5154 × 10⁻⁵ 1.1416 × 10⁻⁵ 1 1
In the second step, the vertical shifts of regression plains between individual timedimensions were calculated. The comparison results are average vertical shifts of regressionplains between time dimension. In Figure 4, only the results of third-time dimension aregraphically displayed. On the left side, the results of the whole area of the processing aredisplayed and on the right is the detail. With the colour scale, the values of the difference ofthe average vertical shift between the compared plains are shown. The red coloured areasshow that the deviations are positive (regression plain is above the GRID—bumps) andthe blue coloured areas show that the deviations are negative (regression plain is belowthe GRID—holes). In the case of third time dimension measurement, the biggest deviationdetected was in the value of 0.51 cm. The analytical results of the all time dimensions areshown in Table 2.

Sustainability 2021, 13, 652 9 of 20
Sustainability 2020, 12, x FOR PEER REVIEW 9 of 19
ger than the ICAO demands, and the graphical analysis of the peaks (red encircled area in Figure 5) shows that even on shorter distances—assessed under 5 m—the deviations of the value of one equidistance (0.005 m) can be detected which very likely exceeds the other ICAO demand.
(a) (b)
Figure 4. LetMB.m results: Surface of the deviation of time dimension measure R3 from GRID (hole—blue colour; the biggest bump—red colour); (a) The difference of compared plains; (b) De-tail.
Table 2. Vertical departures between individual time dimensions measures.
Vertical Departures Δ (m) Δ (cm) ↓ Descent ↑ Ascent
ΔR1/R0 max 0.00639 0.64 plane ↑ ΔR1/R0 min −0.03274 −3.27 plane ↓ ΔR1/R0 avg −0.01219 −1.22 plane ↓ ΔR2/R0 max 0.00923 0.92 plane ↑ ΔR2/R0 min −0.02787 −2.79 plane ↓ ΔR2/R0 avg −0.00885 −0.89 plane ↓ ΔR3/R0 max 0.00510 0.51 plane ↑ ΔR3/R0 min −0.03124 −3.12 plane ↓ ΔR3/R0 avg −0.01083 −1.08 plane ↓
Note: ↓ represents negative displacement or descent of the plane and ↑ represents the ascent of the plane.
In Figure 5, the distances between the areas of the biggest vertical deviations in the case of the third time dimension measure in the touch-down area are shown. The biggest detected deviations on the concerned area were 3 cm (dark blue colour), the distance to other peaks of areas with the highest deviation was, on average, 29 m.
Figure 4. LetMB.m results: Surface of the deviation of time dimension measure R3 from GRID(hole—blue colour; the biggest bump—red colour); (a) The difference of compared plains; (b) Detail.
Table 2. Vertical departures between individual time dimensions measures.
Vertical Departures ∆ (m) ∆ (cm) ↓ Descent↑ Ascent
∆R1/R0 max 0.00639 0.64 plane ↑∆R1/R0 min −0.03274 −3.27 plane ↓∆R1/R0 avg −0.01219 −1.22 plane ↓
∆R2/R0 max 0.00923 0.92 plane ↑∆R2/R0 min −0.02787 −2.79 plane ↓∆R2/R0 avg −0.00885 −0.89 plane ↓
∆R3/R0 max 0.00510 0.51 plane ↑∆R3/R0 min −0.03124 −3.12 plane ↓∆R3/R0 avg −0.01083 −1.08 plane ↓
Note: ↓ represents negative displacement or descent of the plane and ↑ represents the ascent of the plane.
Later, with the purpose to determine the runway road surface value assessment state,we tried to implement the requirements of evaluating the runway state the according toICAO (see Figure 5).
It was concluded that the ICAO demands in the computer environment cannot beused directly.
It was seen from the Figure 5 that the distance between the peaks of the deviationsof individual time dimension measures from the demanded GRID was even up to 10×bigger than the ICAO demands, and the graphical analysis of the peaks (red encircled areain Figure 5) shows that even on shorter distances—assessed under 5 m—the deviations ofthe value of one equidistance (0.005 m) can be detected which very likely exceeds the otherICAO demand.
In Figure 5, the distances between the areas of the biggest vertical deviations in thecase of the third time dimension measure in the touch-down area are shown. The biggestdetected deviations on the concerned area were 3 cm (dark blue colour), the distance toother peaks of areas with the highest deviation was, on average, 29 m.

Sustainability 2021, 13, 652 10 of 20
Sustainability 2020, 12, x FOR PEER REVIEW 10 of 19
Figure 5. The distances between the areas of maximal vertical deviations in the third time dimen-sion measure.
To update the obsolete evaluation system, it is suggested that, as the base for evalu-ating the runway state, the value of evaluated vertical deviations are obtained based on executed measurements and analysis, as it is suggested with the adapted method to monitor the runways state.
The airport logistics infrastructure maintenance strategy of smaller regional airports is determined in compliance with graph on Figure 6 as: • execution of basic measurements (zero net establishment of, the first time measure-
ment), establishment (upgrade) of information system for airport logistics infrastruc-ture maintenance on smaller regional airports (IMR)—basic condition for maintenance system to function;
• evaluation of assessed vertical deviations and determining the value of variable con-dition of airport logistics infrastructure (SLL) on the touch-down area:
• SLL = »great«: no indentation bigger than 1 mm and no lifts of the runway sur-face bigger than 1 cm is not detected,
• SLL = »good«: no indentation bigger than 3 mm and no lifts of the runway sur-face bigger than 2 cm are not detected, the SLL demand = »great is exceeded«;
• SLL = »satisfactory«: no indentations bigger than 5 mm and no lifts of the runway surface bigger than 3 cm is not detected, the SLL demand = »good is exceeded«;
• SLL = »bad«: no indentations bigger than 10 mm and no lifts of the runway sur-face bigger than 5 cm is not detected, the SLL demand = »satisfactory is exceed-ed«;
• SLL = »very bad«: no indentations bigger than 15 mm and no lifts of the runway surface bigger than 7 cm, the SLL demand = »bad is exceeded«;
• SLL = »inappropriate«: detected indentations bigger than 15 mm and lifts of the runway surface bigger than 7 cm,
• intervention based on the evaluation of the airport logistics infrastructure state on smaller regional airports—Figure 6;
• the monitoring is performed in regular periodical overviews every 5 years or since the last complete renovation or last larger maintenance works (surfacing).
Figure 5. The distances between the areas of maximal vertical deviations in the third timedimension measure.
To update the obsolete evaluation system, it is suggested that, as the base for eval-uating the runway state, the value of evaluated vertical deviations are obtained basedon executed measurements and analysis, as it is suggested with the adapted method tomonitor the runways state.
The airport logistics infrastructure maintenance strategy of smaller regional airportsis determined in compliance with graph on Figure 6 as:
• execution of basic measurements (zero net establishment of, the first time measure-ment), establishment (upgrade) of information system for airport logistics infrastruc-ture maintenance on smaller regional airports (IMR)—basic condition for maintenancesystem to function;
• evaluation of assessed vertical deviations and determining the value of variablecondition of airport logistics infrastructure (SLL) on the touch-down area:
• SLL = »great«: no indentation bigger than 1 mm and no lifts of the runway surfacebigger than 1 cm is not detected,
• SLL = »good«: no indentation bigger than 3 mm and no lifts of the runway surfacebigger than 2 cm are not detected, the SLL demand = »great is exceeded«;
• SLL = »satisfactory«: no indentations bigger than 5 mm and no lifts of the runwaysurface bigger than 3 cm is not detected, the SLL demand = »good is exceeded«;
• SLL = »bad«: no indentations bigger than 10 mm and no lifts of the runwaysurface bigger than 5 cm is not detected, the SLL demand = »satisfactory isexceeded«;
• SLL = »very bad«: no indentations bigger than 15 mm and no lifts of the runwaysurface bigger than 7 cm, the SLL demand = »bad is exceeded«;
• SLL = »inappropriate«: detected indentations bigger than 15 mm and lifts of therunway surface bigger than 7 cm,
• intervention based on the evaluation of the airport logistics infrastructure state onsmaller regional airports—Figure 6;
• the monitoring is performed in regular periodical overviews every 5 years or since thelast complete renovation or last larger maintenance works (surfacing).

Sustainability 2021, 13, 652 11 of 20
Sustainability 2020, 12, x FOR PEER REVIEW 11 of 19
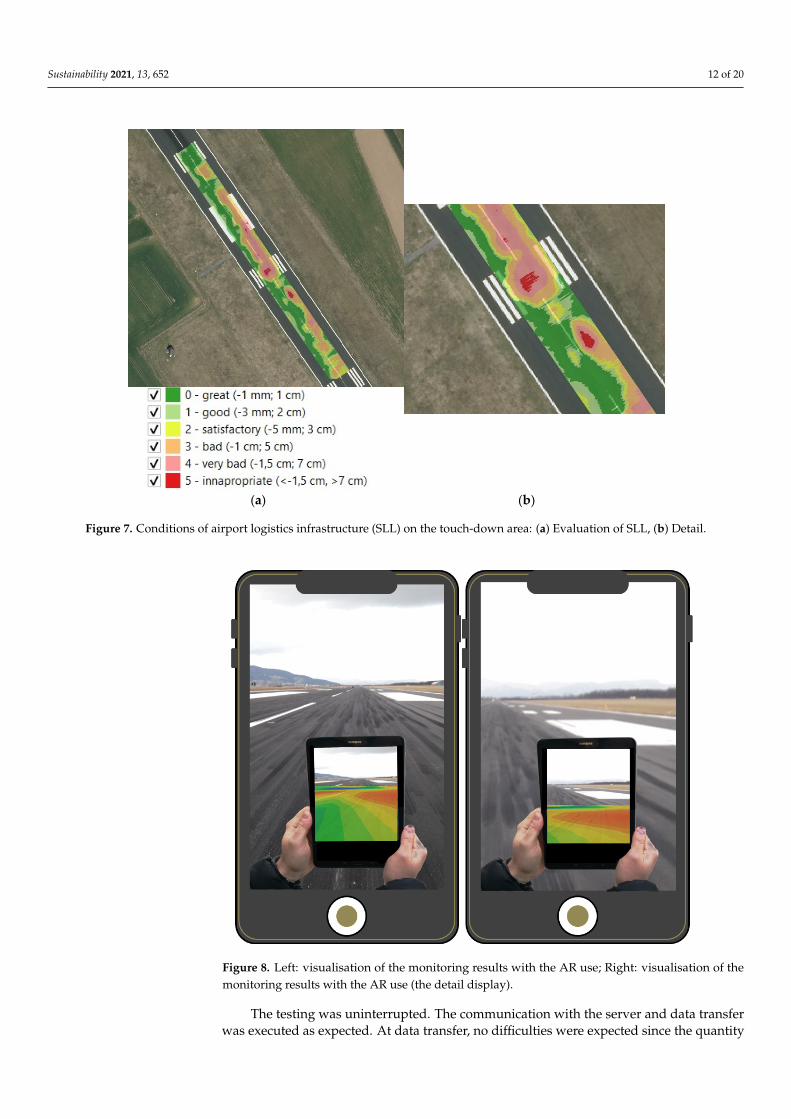
The proposed model for assessing airport infrastructure conditions has been tested. Figure 7 shows the result of the assessment of the condition of the test runway based on real time data of the third time dimension measure. All analyses were perform in QGIS v 14.0 with tools of vektorisating and labelling polygons. As expected, the condition of airport logistics infrastructure (SLL) is inappropriate in the area of touch down where, in the event of rain, it could be expected larger puddles will appear right at the place where the aircraft needs the greatest possible grip when landing.
Figure 6. Intervention based on the evaluation of the airport logistics infrastructure state on smaller regional airports [53,56,57].
(a) (b)
Figure 6. Intervention based on the evaluation of the airport logistics infrastructure state on smallerregional airports [53,56,57].
The proposed model for assessing airport infrastructure conditions has been tested.Figure 7 shows the result of the assessment of the condition of the test runway based onreal time data of the third time dimension measure. All analyses were perform in QGISv 14.0 with tools of vektorisating and labelling polygons. As expected, the condition ofairport logistics infrastructure (SLL) is inappropriate in the area of touch down where, inthe event of rain, it could be expected larger puddles will appear right at the place wherethe aircraft needs the greatest possible grip when landing.
Monitoring (IMR) is based as a sub-process in the maintenance process (APMS-MB).In the monitoring process, the external geodetic measurements’ executant, according to theforeseen plan, executes measurements and writes the measurements results into the centraldatabase (»CB-LetMB«).
The results shown were also confirmed with supplementary measurements.The Visualization of Results of the Monitoring with the Use of Augmented RealitySince the preliminary analysis, we set an indirect goal which claims that the results
of the model will be shown in a way that it will be presented to the user from a differentperspective and provide them with some kind of ambient experience. AR-technologyallows the data overview in a real environment or allows one to view the data in theinteraction with the real environment.
The application was tested in February 2020. The outlines and surfaces of verticaldeviations (2D) on the processing area were displayed in the interaction with the realenvironment. In practice, it means that the mobile device on which the real environmentwas displayed was directed towards the processing area on the runway and at that moment,on the mobile device’s screen, the contours and areas of vertical deviations were displayed.It is shown, in Figure 8, how the user sees the real picture of the runway, augmented withthe outlines and areas of vertical deviations.
Sustainability 2021, 13, 652 12 of 20
Sustainability 2020, 12, x FOR PEER REVIEW 11 of 19
The proposed model for assessing airport infrastructure conditions has been tested. Figure 7 shows the result of the assessment of the condition of the test runway based on real time data of the third time dimension measure. All analyses were perform in QGIS v 14.0 with tools of vektorisating and labelling polygons. As expected, the condition of airport logistics infrastructure (SLL) is inappropriate in the area of touch down where, in the event of rain, it could be expected larger puddles will appear right at the place where the aircraft needs the greatest possible grip when landing.
Figure 6. Intervention based on the evaluation of the airport logistics infrastructure state on smaller regional airports [53,56,57].
(a) (b)
Figure 7. Conditions of airport logistics infrastructure (SLL) on the touch-down area: (a) Evaluation of SLL, (b) Detail.
Sustainability 2020, 12, x FOR PEER REVIEW 12 of 19
Figure 7. Conditions of airport logistics infrastructure (SLL) on the touch-down area: (a) Evaluation of SLL, (b) Detail.
Monitoring (IMR) is based as a sub-process in the maintenance process (APMS-MB). In the monitoring process, the external geodetic measurements’ executant, according to the foreseen plan, executes measurements and writes the measurements results into the central database (»CB-LetMB«).
The results shown were also confirmed with supplementary measurements.
The Visualization of Results of the Monitoring with the Use of Augmented Reality Since the preliminary analysis, we set an indirect goal which claims that the results
of the model will be shown in a way that it will be presented to the user from a different perspective and provide them with some kind of ambient experience. AR-technology allows the data overview in a real environment or allows one to view the data in the in-teraction with the real environment.
The application was tested in February 2020. The outlines and surfaces of vertical deviations (2D) on the processing area were displayed in the interaction with the real environment. In practice, it means that the mobile device on which the real environment was displayed was directed towards the processing area on the runway and at that mo-ment, on the mobile device’s screen, the contours and areas of vertical deviations were displayed. It is shown, in Figure 8, how the user sees the real picture of the runway, augmented with the outlines and areas of vertical deviations.
The testing was uninterrupted. The communication with the server and data trans-fer was executed as expected. At data transfer, no difficulties were expected since the quantity of transferred data was small. The application was first tested with the used of external GNSS and then with the use of internal GNSS, which was built-in in the mobile device. The accuracy of data displaying with the use of external GNSS was estimated on ten centimetres, and the accuracy of the data display with the use of internal GNSS was much worse and was estimated to approximately one meter. AR use aimed to display areas of vertical deviations and non-accurately show the position of an individual de-formation; therefore, it is estimated that the meter accuracy of the data display is appro-priate.
Figure 8. Left: visualisation of the monitoring results with the AR use; Right: visualisation of themonitoring results with the AR use (the detail display).
The testing was uninterrupted. The communication with the server and data transferwas executed as expected. At data transfer, no difficulties were expected since the quantity

Sustainability 2021, 13, 652 13 of 20
of transferred data was small. The application was first tested with the used of externalGNSS and then with the use of internal GNSS, which was built-in in the mobile device.The accuracy of data displaying with the use of external GNSS was estimated on tencentimetres, and the accuracy of the data display with the use of internal GNSS was muchworse and was estimated to approximately one meter. AR use aimed to display areas ofvertical deviations and non-accurately show the position of an individual deformation;therefore, it is estimated that the meter accuracy of the data display is appropriate.
The graphical data on areas of vertical deviations and deformations, and especiallytheir visual presentation in interaction with the real world, is in our opinion key in decision-making about the way and extent of the execution of maintenance or renovation works.The visualisation of graphical data with the use of advanced technologies, among themthe AR, allows the decision-makers better data presentation and analysis results andallows the overview and interpretation of these data in a real environment without otherprofessionals being presented (designers, builders, geodesists, etc.) As it is shown inFigure 8, the decision-makers, or all who overview and analyse the data, overview them ina real environment or interaction with it.
4.2. The Expanded Innovative Model for the Continuous Monitoring of the Runway’sDeformations
The monitoring (IMR) was, hereinafter, expanded with new actors, since the incorpo-ration of additional supplementary measurements with which runway deformations canbe detected or confirmed is intended. Thus, the expanded BDP-monitoring (IMR all), inwhich the geodetic measurement executant and supplementary measurement provider areincluded as outer actors, was created and shown in Appendix A Figures A1–A3.
The monitoring results (IMR all) are determined areas of vertical deviations, whichare a combination of findings based on the visual runway check-up, the results of usedgeodetic method and the results of supplementary method, which is shown in [53]. Theareas of the deformities can be shown as 2D contours of the plane of deviations from theregression plane, as a 3D plane of deviations from the regression plane or on a plate in areal space.
5. Discussion
Airport runways are exposed to the function of external and internal forces; therefore,they must be regularly checked and properly restored. For this purpose, on the airportin Maribor, which is not exposed to heavy air traffic, we executed the research of therunway unevenness with a geodetic survey, which is fast, accurate and economic. Themeasurements were executed in four time periods. The first measurement presents acomparative surface—GRID. The obtained results were processed and displayed in twodifferent ways which offer similar results. The biggest vertical deviations from GRID areobtained in the third time dimension which was also used as the comparative one. Withboth methods, we got the biggest deformations on the same places of the runway, whichproves the applicability hypothesis of various methods for measuring the unevenness stateon the runways.
Later, the adapted management information system was developed, and with thehelp of the suggested automated system of evaluating the detected unevenness state onthe runway, the execution of proper measures can be suggested. Parallelly, maintainancestrategies and instructions which would need to be implemented in the case of it certainairports decide to use this method were developed.
Since the subject of the research was tested and applied only at the certain regionalairport (Maribor Airport, Slovenia), where we concluded that the execution of suggestedmeasures is possible and feasible, it is sensible to later test the suggested measures also onthe other comparable airports.
In terms of the research, it was concluded that a generally valid and used evaluationsystem of unevenness is not appropriate for use in a computer environment [7]; therefore,the new adapted suggestion of evaluation was developed, which would be sensible to
Sustainability 2021, 13, 652 14 of 20
check in the wider experts public and according to the executed developed procedures,based on the normative provisions, place into official documents.
6. Conclusions
Computer-supported tools are also becoming more and more effective in the areaswhere, for whatever reason still (at least in the normative sense), the evaluation principleswhich were exposed in the middle or at the end of the 20th century are still valid. With theexecuted research, we have shown and proven that runway unevenness can be measuredwith modern tools, and the obtained results can be directly used in sustainably directedinformation systems for runway management on smaller regional airports.
In order to enable the measurement of the runway condition in geodetic accuracy,a vehicle with sensors was manufactured as part of the research. With the help of thevehicle, the vulnerability of the runway was measured in such a way that the results ofthe measurements are given with geodetic accuracy and transferable (digital record). Themeasurements themselves were performed during the closure of the test airport, and themethod itself is made in such a way that it is not time consuming. A similar approach isnot observed in the present literature.
The measurement results were computer-processed using our own algorithm (MAT-LAB) and compared using existing free geographic information system (QGIS) algorithms.The condition of the airport infrastructure was assessed on the basis of the differencefound between the actual condition of the runway (time dimension measure) and theoriginal constructed condition (GRID). From the point of view of monitoring the conditionof runways, depressions or holes (the measured plane is below the GRID) may representthose conditions that could be problematic and would need to be monitored to ensuretraffic safety.
In order to enable work with the available measurement results and the process ofassessing the condition of the flatness of the runway in question in the field, a computer toolfor smartphones was established. It allows the decision-makers better data presentationand analysis results and allows the overview and interpretation of these data in a realenvironment without other professionals being presented.
The used computer aided approach provides as much accuracy as possible, repeata-bility of measurements and thus professional credibility in the evaluation process of therunway unevenness state. Finally, considering the sustainability principle and runway lifecycle, the innovative model of sustainable runway management was made; its use providesproper control of the runway state and proper professional action in the case of detecteddeviations.
With the suggested type of management, the always-useful runways state, the opti-mum recovery of airport infrastructure at minimal maintenance finance inputs and themost safe and efficient occurrence of air traffic at the airports is provided.
Author Contributions: Conceptualization: D.D., D.S. and B.K.; methodology: D.D.; software: D.D.;validation: D.D., D.S. and B.K.; formal analysis: D.D., D.S. and B.K.; investigation: D.D., B.K. andD.S.; resources: B.K.; data curation: D.D.; writing—original draft preparation: D.D., B.K. and D.S.;writing—review and editing: D.D., D.S. and B.K.; visualization: D.D.; supervision: B.K.; projectadministration: D.D. and B.K. All authors have read and agreed to the published version of themanuscript.
Funding: This research received no external funding.
Institutional Review Board Statement: Not applicable.
Informed Consent Statement: Informed consent statement was obtained from all subjects involvedin the study.
Data Availability Statement: The data presented in this study are available on request from thecorresponding author. The data are not publicly available. The data were obtained on the basis

Sustainability 2021, 13, 652 15 of 20
of own research within the doctoral dissertation of dr. Damjan Doler at the Faculty of Logistics,University of Maribor [53].
Acknowledgments: Authors of the article thank the airport staff, Faculty of Logistics, Universityof Maribor and the Troia d.o.o., Slovenj Gradec, Slovenia company, which provided the hardwarefor the realisation of the idea of the use of augmented reality in the procedures of evaluation of therunways state.
Conflicts of Interest: The authors declare no conflict of interest.
Appendix A
Sustainability 2020, 12, x FOR PEER REVIEW 15 of 19
provided the hardware for the realisation of the idea of the use of augmented reality in the procedures of evaluation of the runways state.
Conflicts of Interest: The authors declare no conflict of interest.
Appendix A
Figure A1. The first part of BPD˙s process decision-making maintenance model IMR all.
Figure A1. The first part of BPD˙s process decision-making maintenance model IMR all.

Sustainability 2021, 13, 652 16 of 20
Sustainability 2020, 12, x FOR PEER REVIEW 16 of 19
Figure A2. Second part BPDs process decision-making maintenance model IMR all. Figure A2. Second part BPDs process decision-making maintenance model IMR all.

Sustainability 2021, 13, 652 17 of 20
Sustainability 2020, 12, x FOR PEER REVIEW 17 of 19
Figure A3. The third part of Table 2016. 90, 1–6, doi:10.1016/j.autcon.2010.03.001.
References 1. Tsai, M.C.; Su, Y.S. Political risk assessment on air logistics hub developments in Taiwan. J. Air Transp. Manag. 2002, 8, 373–380,
doi:10.11175/easts.8.2355. 2. Caunhye, A.M.; Zhang, Y.; Li, M.; Nie, X. A location-routing model for prepositioning and distributing emergency supplies.
Logist. Transp.Rev. 2016, 90, 161–176, doi:10.1016/j.tre.2015.10.011. 3. Jackson, P.T.G.; Nelson, C.J.; Schiefele, J.; Obara, B. Runway detection in High Resolution remote sensing data. In Proceedings
of the 9th International Symposium on Image and Signal Processing and Analysis (ISPA), Zagreb, Croatia, ), 7–9 September 2015; doi:10.1109/ispa.2015.7306053.
4. Lee, M.H.; Chou, C.P.; Li, K.H. Automatic measurement of runway grooving construction for pavement skid evaluation. Autom. Constr. 2009, 18, 856–863, doi:10.1016/j.autcon.2009.03.013.
Figure A3. The third part of Table 2016. 90, 1–6, doi:10.1016/j.autcon.2010.03.001.

Sustainability 2021, 13, 652 18 of 20
References1. Tsai, M.C.; Su, Y.S. Political risk assessment on air logistics hub developments in Taiwan. J. Air Transp. Manag. 2002, 8, 373–380.
[CrossRef]2. Caunhye, A.M.; Zhang, Y.; Li, M.; Nie, X. A location-routing model for prepositioning and distributing emergency supplies.
Logist. Transp.Rev. 2016, 90, 161–176. [CrossRef]3. Jackson, P.T.G.; Nelson, C.J.; Schiefele, J.; Obara, B. Runway detection in High Resolution remote sensing data. In Proceedings of
the 9th International Symposium on Image and Signal Processing and Analysis (ISPA), Zagreb, Croatia, 7–9 September 2015.[CrossRef]
4. Lee, M.H.; Chou, C.P.; Li, K.H. Automatic measurement of runway grooving construction for pavement skid evaluation. Autom.Constr. 2009, 18, 856–863. [CrossRef]
5. Moon, S.; Yang, B.; Kim, J.; Seo, J. Effectiveness of remote control for a concrete surface grinding machine. Autom. Constr. 2010, 19,734–741. [CrossRef]
6. ICAO—International Civil Aviation Organization (Safety Report, 2018 Edition). Available online: https://www.icao.int/safety/Pages/Safety-Report.aspx (accessed on 4 July 2019).
7. Micco, A.; Serebrisky, T. Infrastructure, Competition Regimes, and Air Transport Costs: Cross-Country Evidence; Policy ResearchWorking Paper Series; The World Bank: Washington, DC, USA, 2004.
8. ICAO—International Civil Aviation Organization (Global Aviation Safety Plan, 2017–2019). Available online: https://www.ulc.gov.pl/en/safety-management/467-civil-aviation-safety-programmes/icao-global-aviation-safety-plan-gasp/5076-icao-global-aviation-safety-plan-gasp-2017-2019 (accessed on 14 July 2017).
9. IATA—International Air Transport Association (Safety Report 2018). Available online: https://www.https://libraryonline.erau.edu/online-full-text/iata-safety-reports/IATA-Safety-Report-2018.pdf (accessed on 1 April 2019).
10. IATA—International Air Transport Association (Runway Excursion Report 2004–2009). Available online: https://www.iata.org/en/pressroom/pr/2009-09-10-01/ (accessed on 10 September 2009).
11. D’Apuzzo, M.; Festa, B.; Giuliana, G.; Mancini, L.; Nicolosi, V. The Evaluation of Runway Surface Properties: A New Approach.Procedia Soc. Behav. Sci. 2012, 53, 1192–1201. [CrossRef]
12. Micaelo, R.; Soares, A.; Ferreira, A. Aquaplaning risk assessment in Portuguese road design guide. Proc. Inst. Civ. Eng. Trans.2015, 168, 300–311. Available online: http://www.icevirtuallibrary.com/content/article/10.1680/tran.13.00029 (accessed on 19September 2020). [CrossRef]
13. Justo-Silva, R.; Ferreira, A. Pavement maintenance considering traffic accident costs. Int. J. Pavement Res. Technol. 2019, 12,562–573. [CrossRef]
14. Lord, D.; Mannering, F.L. The Statistical Analysis of Cresh-Frequency Data: A Review and Assessment of methodologicalAlternatives. Transp. Res. Part A Policy Pract. 2010, 44, 291–305. [CrossRef]
15. Chang, L.Y.; Chen, W.C. Data mining of three-based models to analyze freeway accident frequency. J. Saf. Res. 2005, 36, 365–375.[CrossRef]
16. Lee, J.; Mannenering, F.L. Impact of roadside features on the frequency and severity of run-off-roadway accidents: An empiricalanalysis. Accid. Anal. Prev. 2002, 34, 149–161. [CrossRef]
17. Moretti, L.; Di Mascio, P.; Nichele, S.; Cokorilo, O. Runway veer-off accidents: Quantitative risk assessment and risk reductionmeasures. Saf. Sci. 2018, 104, 157–163. [CrossRef]
18. Wang, W.; Deng, S. Evaluation and analysis of the pavement roughness of airport runway. J. Chin. Civ. Aviat. Coll. 2006, 24.[CrossRef]
19. Wang, W. Protocol Based Pavement Cracking Measurement with 1 mm 3D Pavement Surface Model. Ph.D. Thesis, OklahomaState University, Stillwater, OK, USA, 2015.
20. Oliveira, H.; Correia, P.L. Automatic Road Crack Detection and Characterization. IEEE Trans. Intell. Transp. Syst. 2013, 14, 155–168.[CrossRef]
21. Mokhtari, S.; Wu, L.; Yun, H.B. Comparison of Supervised Classification Techniques for Vision-Based Pavement Crack Detection.J. Transp. Res. Board 2016, 2595, 119–127. [CrossRef]
22. Shi, Y.; Cui, L.; Qi, Z.; Meng, F.; Chen, Z. Automatic Road Crack Detection Using Random Structured Forests. IEEE Trans. Intell.Transp. Syst. 2016, 17, 3434–3445. [CrossRef]
23. Wang, P.; Hu, Y.; Dai, Y.; Tian, M. Asphalt Pavement Pothole Detection and Segmentation Based on Wavelet Energy Field. Math.Probl. Eng. 2017, 2017, 1–13. [CrossRef]
24. Peng, L.; Chao, W.; Shuangmiao, L.; Baocai, F. Research on Crack Detection Method of Airport Runway Based on Twice-Threshold Segmentation. In Proceedings of the Fifth International Conference on Instrumentation and Measurement, Computer,Communication and Control (IMCCC), Qinhuangdao, China, 18–20 September 2015. [CrossRef]
25. Fernandez, C.A.; Lozano, F.J.R.; Villatoro, R.; Olivares, J.; Palomares, J.M. Efficient pavement crack detection and classification.EURASIP J. Image Video Process. 2017, 39. [CrossRef]
26. Li, W.; Huyan, J.; Tighe, S.L.; Ren, Q.; Sun, Z. Three-Dimensional Pavement Crack Detection Algorithm Based on Two-DimensionalEmpirical Mode Decomposition. J. Transp. Eng. Part B Pavement 2017, 143. [CrossRef]
27. Loprencipe, G.; Zoccali, P. Comparasion of methods for evaluating airport pavement roughness. J. Pavement Eng. 2019, 20,782–791. [CrossRef]

Sustainability 2021, 13, 652 19 of 20
28. Barbarella, M.; De Blasiis, M.R.; Fiani, M. Terrestrail Laser scanner for the analysis of airport pavement geometry. J. Pavement Eng.2019, 20, 466–480. [CrossRef]
29. Read, J.M. New Method for Measuring Crack Propagation in Asphalts. Int. J. Pavement Eng. 1999, 1, 15–34. [CrossRef]30. Duong, N.S.; Blanc, J.; Hornych, P.; Menant, F.; Lefeuvre, Y.; Bouveret, B. Monitoring of pavement deflections using geophones.
Int. J. Eng. 2020, 21, 1103–1113. [CrossRef]31. De Souza, N.M.; de Almeida Filha, A.T. A systematic airport runway maintenance and inspection policy based on a delay time
modeling approach. Autom. Constr. 2020, 110. [CrossRef]32. Marks, A.; Rietsema, K.; Hudson, G. Aviation Management Information Systems; Embry-Riddle Press: Daytona-Beach, FL, USA,
2013. [CrossRef]33. Marks, A.; Rietsema, K. Airport Information Systems—Airside Management Information System. Intell. Inf. Manag. 2014, 6,
149–156. [CrossRef]34. Marks, A.; Rietsema, K.; AL-Ali, M. Airport Information Systems—Landside Management Information System. Intell. Inf. Manag.
2015, 7, 130–138. [CrossRef]35. Khozeimeh, I. An Automated Maintenance Management System for International Airports. Ph.D. Thessis, The George Washington
University, The School of Engineering and Applied Science, Washington, DC, USA, 1994.36. Flintsch, G.W.; McGhee, K.K. NCHRP Synthesis 401: Quality Management of Pavement Condition Data Collection; Transportation
Research Board: Washington, DC, USA, 2009. [CrossRef]37. Chen, Y.; Chou, C. Effects of Airport Pavement-Profile Wavelength on Aircraft Vertical Responses. J. Trans. Res. Board 2004, 1889,
83–93. [CrossRef]38. Santos, J.; Ferreira, A.; Flintsch, G.; Cerezo, V. A multy-objective optimization approach for sustainable pavement management.
Struct. Infrastruct. Eng. 2018, 14, 854–868. [CrossRef]39. WSAA—Washington State Aviation Alliance, Washington Airport Pavement Management Manual. Available online: https:
//wsdot.wa.gov/aviation/Grants/AirportPavementManagement.htm (accessed on 2 November 2020).40. De Luca, M.; Dell’Acqua, G. Runway surface friction characteristics assessment for Lamezia Terme airfield pavement management
system. J. Air Trans. Manag. 2014, 34, 1–5. [CrossRef]41. De Luca, M.; Dell’Acqua, G. Touchdown Remaining Lift on the Wings and Dynamic Vertical Force Transmitted to the Runway.
Period. Polytech. Civ. Eng. 2018, 34, 1–5. [CrossRef]42. Di Mascio, P.; Moretti, L. Implementation of a pavement management system for maintenance and rehabilitation of airport
surfaces. Case Stud. Constr. Mater. 2019, 11, e00251. Available online: http://www.sciencedirect.com/science/article/pii/S2214509519301688 (accessed on 20 October 2020). [CrossRef]
43. Ghosh, R.; Schilling, T.; Wicke, K. Theoretical framework of systems design for the air transportation system including aninherently quantitative philosophy of scenario development. J. Air Trans. Manag. 2017, 58, 58–67. [CrossRef]
44. Bazlamit, S.M.; Ahmad, H.S.; Obaidat, T.I.A. Pavement Maintenance Applications Using Geographic Information Systems.Procedia Eng. 2017, 182, 83–90. [CrossRef]
45. Gendreau, M.; Soriano, P. Airport pavement management systems: An appraisal of existing methodologies. Transportation. Res.Part A Policy Pract. 1998, 32, 197–214. [CrossRef]
46. Mao, X.; Yuan, C.; Gan, J. Incorporating Dynamic Traffic Distribution into Pavement Maintenance Optimization Model. Sustain-ability 2019, 11, 2488. [CrossRef]
47. Šarlah, N. Izdelava Modela Georadarskih Opazovanj za Evidentiranje Gospodarske Infrastrukture. Ph.D. Thesis, Univerzav Ljubljani, Fakulteta za Gradbeništvo in Geodezijo, Ljubljana, Slovenia, 2016. Available online: https://repozitorij.uni-lj.si/Dokument.php?id=97913&lang=slv (accessed on 17 May 2018).
48. Ghilani, C.D. Adjustment Computations; John Wiley & Sons: Hoboken, NJ, USA, 2010. [CrossRef]49. Macarol, S. Prakticna Geodezija; Tehnicka Knjiga: Zagreb, Croatia, 1978; pp. 1–723.50. Bakker, G.; de Munck, J.C.; Strang van Hees, G.L. Radio Positioning at Sea—Geodetic Survey Computations, Least Squares Adjustment;
Delf University of Technology, Faculty of Geodetic Engineering: Delft, The Netherlands, 1995.51. Holst, C.; Kuhlmann, H. Challenges and Present Fields of Action at Laser Scanner Based Deformation Analyses. J. Appl. Geod.
2016, 10. [CrossRef]52. Doler, D.; Kovacic, B. Improved Decision-Making Geo-Information System for Continuous Monitoring of Deformations on
Airport Infrastructure. ISPRS Int. J. Geo-Inf. 2019, 8, 1. [CrossRef]53. Doler, D. Inoviran Model Kontinuiranega Spremljanja Deformacij Letaliških Vzletno-Pristajalnih Stez. Ph.D. Thesis, Fakulteta za
Logistiko Univerza v Mariboru, Celje, Slovenia, 2020.54. Kovacic, B.; Kamnik, R.; Bieliatynskyi, A. The Different Methods of Displacement Monitoring at Loading Tests of Bridges or
Different Structures. In Proceedings of the MATEC Web of Conferences 53, International Scientific Conference Week of Science inSPbPU—Civil Engineering (SPbWOSCE–2015), Saint-Petersburg, Russia, 3–4 December 2015. [CrossRef]
55. Kovacic, B.; Želodec, D.; Doler, D. Prototype of the Runway Monitoring Process at Smaller Airports: Edvard Rusjan AirportMaribor. Processes 2020, 8, 1689. [CrossRef]
56. Galehouse, L.; Moulthrop, J.S.; Hicks, R.G. Principles of pavement preservation: Definitions, Benefits, Issues, and Barrier. Highw.Infrastruct. Preserv. 2003, 4–9. Available online: http://worldcat.org/issn/07386826 (accessed on 3 July 2018).

Sustainability 2021, 13, 652 20 of 20
57. Ong, G.P.; Nantung, T.; Sinha, K. Indiana Pavement Preservation Program; Joint Transportation Research Program; IndianaDepartment of Transportation and Purdue University: West Lafayette, IN, USA, 2010. [CrossRef]
58. Cokorilo, O.; De Luca, M.; Dell’Acqua, G. Aircraft safety analysis using clustering algorithms. J. Risk Res. 2014, 17, 1325–1340.[CrossRef]
59. Liang, Z.; Xiao, F.; Qian, X.; Zhou, L.; Jin, X.; Lu, X.; Karichery, S. A column generation-based heuristic for aircraft recoveryproblem with airport capacity constraints and maintenance flexibility. Transport. Res. Part B Methodol. 2018, 113, 70–90. [CrossRef]
60. Airlines for America. U.S. Passenger Carrier Delay Costs. 2019. Available online: https://www.airlines.org/dataset/per-minute-cost-of-delays-to-u-s-airline (accessed on 5 September 2018).
61. Križevnik, M.; Juric, M.B. Modeliranje in izvajanje poslovnih procesov v storitveno orientiranih arhitekturah. Uporabna Informatika2009, 3, 137–147.
62. Polancic, G.; Jošt, G. Analiza upravljanja poslovnih procesov z BPMN 2.0m. Uporabna informatika 2012, 3, 153–163.
Copyright © 2022 FDOKUMEN