The influence of strategic corporate re-branding on customer ...
56
THE INFLUENCE OF STRATEGIC CORPORATE RE-BRANDING ON CUSTOMER SATISFACTION AMONG MOBILE SERVICE PROVIDERS IN KENYA BY GABRIEL GIKONYO MWANGI A RESEARCH PROJECT SUBMITTED IN PARTIAL FULFILLMENT OF THE REQUIREMENTS FOR THE AWARD OF MASTER OF BUSINESS ADMINISTRATION DEGREE OF THE SCHOOL OF BUSINESS, UNIVERSITY OF NAIROBI NOVEMBER, 2013
-
Upload
khangminh22 -
Category
Documents
-
view
5 -
download
0
Transcript of The influence of strategic corporate re-branding on customer ...
THE INFLUENCE OF STRATEGIC CORPORATE RE-BRANDING ON
CUSTOMER SATISFACTION AMONG MOBILE SERVICE PROVIDERS IN
KENYA
BY
GABRIEL GIKONYO MWANGI
A RESEARCH PROJECT SUBMITTED IN PARTIAL FULFILLMENT OF THE
REQUIREMENTS FOR THE AWARD OF MASTER OF BUSINESS
ADMINISTRATION DEGREE OF THE SCHOOL OF BUSINESS, UNIVERSITY
OF NAIROBI
NOVEMBER, 2013
DECLARATION
I declare that this project is my original work and has never been submitted for a degree
in any other university or college for examination/academic purposes.
Signature:………………………………….. Date:…………………………………
Gabriel Gikonyo Mwangi D61/60030/2011
This research project has been submitted for examination with my approval as the
University Supervisor.
Signature…………………………………….….Date………………………………….
DR. JUSTUS MUNYOKI
SENIOR LECTURER.
DEPARTMENT OF BUSINESS ADMINISTRATION
ii

DEDICATION
My study is dedicated to my dear loving wife Sarah Wanja for her support and patience
during the entire period of my study.
Thank you and God bless you abundantly.
iii
ACKNOWLEDGEMENTS
I would like to express my sincere thanks to my Supervisor Dr. Justus Munyoki for
agreeing to supervise this research work. I am also grateful to my wife and family for
giving the invaluable support during my research work.
Lastly I thank the Almighty God as my source of all inspiration in allowing me to
undertake this project that is too involving in terms of time and resources.
iv
ABSTRACT
Re-branding can be described as the practice of creating a new name representative of a
differentiated position in the mind frame of stakeholders and a distinctive identity from
competitors. In today’s very competitive environment, brand creation is very crucial.
Strong brand helps to create the options for growth, break barrier of entry for competitors
and consumer loyalty while at the same time helping to command the market share. The
mobile industry is one of the fastest growing industries in the Kenya. The objective of
this study was to determine the influence of corporate re-branding on customer
satisfaction basing on mobile service providers in Kenya using a case of mobile phone
service providers.
This study adopted the survey approach, which is suitable for collecting information in
breath and not width. The target population comprised all the four mobile service
providers in Kenya. The study targeted customers of the four mobile companies within
Nairobi County. The study selected 25 customers from each mobile service provider by
selecting every 5th customer to visit the shops. Primary data was collected using a
questionnaire. Quantitative data collected was analyzed through the use of descriptive
statistics using SPSS and presented through the use of means and averages, percentages,
standard deviations, frequencies and regression analysis.
The study found that rebranding was very important in relation to customers’ level of
satisfaction with the service provider and that the service brand name is a very important
component of the brand and an important information source to the customer, because
service attributes are difficult to communicate via other means. The study found that
customer satisfaction is also affected by the advertising theme and that low tariffs had
minimal impact on customers’ level of satisfaction. The study also found that customer
satisfaction is a key and valued outcome of good marketing practice and that firm’s
objective during any re-branding should be to either maintain or improve on the
satisfaction of its customers.
v
TABLE OF CONTENTS
DECLARATION.................................................................................................................ii
TABLE OF CONTENTS....................................................................................................vi
LIST OF ABREVIATIONS AND ACRONYMS.............................................................vii
LIST OF TABLES............................................................................................................viii
CHAPTER ONE..................................................................................................................1
INTRODUCTION...............................................................................................................1
1.1 Background of the Study...........................................................................................1
1.2 Research Problem .....................................................................................................8
1.3Research Objective...................................................................................................10
1.4 Value of the Study...................................................................................................10
2.5 Customers’ Evaluations of Brand Renaming...........................................................18
CHAPTER THREE...........................................................................................................20
RESEARCH METHODOLOGY.......................................................................................20
3.1 Introduction..............................................................................................................20
3.4 Sample Selection......................................................................................................21
4.1 Introduction..............................................................................................................24
4.2 General Information.................................................................................................24
4.3 Use of mobile services.............................................................................................25
4.4 Effect of Corporate Rebranding On Customer Satisfaction....................................28
4.5 Effect of Brand Logo and Slogan Change on Customer Satisfaction......................30
5.1 Introduction..............................................................................................................37
5.2 Summary of Findings...............................................................................................37
5.3 Conclusion...............................................................................................................39
5.5 Recommendations....................................................................................................39
5.5.1 Recommendations with Policy Implication..........................................................39
5.5.2 Recommendations for further Studies..................................................................40
REFERENCES..................................................................................................................41
Appendix I: Questionnaire for Customers.........................................................................44
vi

LIST OF ABREVIATIONS AND ACRONYMS
AIG American Insurance Group)
ANOVA Analysis of Variance
ARPU Average Revenue Per User
CCK Communications Commission of Kenya
CGE Compagnie Générale des Eaux
HSBC Hong Kong and Shanghai Banking Corporation
SIM Subscriber Identity Module
SPSS Statistical Package for Social Sciences
VAS Value Added Services
vii

LIST OF TABLES
viii
CHAPTER ONE
INTRODUCTION
1.1 Background of the Study
Re-branding is the practice of building a new name representative of a differentiated
position in the mind frame of stakeholders and a distinctive identity from competitors
(Muzellec, Doogan and Lambkin, 2003). Rebranding may involve radical changes to the
brand's logo, brand name, image, marketing strategy, and advertising themes. These
changes are typically aimed at the repositioning of the brand/company, sometimes in an
attempt to distance itself from certain negative image of the previous branding, or to
move the brand up market (Muzellec and Lambkin 2006). A corporate name change may
enhance market recognition and position and generate an increase in the stock market
value of renamed firm (Horsky and Swyngedouw, 1987). For a new name to be launched,
however, the old name has to be abandoned, an action likely to nullify years of branding
effort in terms of creating awareness. Since name awareness is a key component of brand
equity this action is likely to further damage the equity of the brand (Aaker, 1991). As the
name is the anchor for brand equity, the change of name might not only damage the
brand equity, it might simply destroy it (Muzellec and Lambkin, 2006).
This study is anchored on the theory of the competitive advantage. The globalization of
the competition and the appearance of the trans-national companies do not eliminate the
influence of a certain country for getting the competitive advantage; a country can offer
different competitive advantages for a company, depending if it is an origin country or a
host country. If sustainable superior performance (which equals sustainable competitive
advantage) is to be achieved a firm must differentiate itself. Alderson (1937) hinted at a
basic tenet of sustainable competitive advantage, that a fundamental aspect of
competitive advantage is the specialization of suppliers to meet the variations in buyer
demand. To be able to keep-up with stiff competition and dynamics, companies aim at
transforming their business as a result of changing business directions and expanding
business units.
In today’s competitive market, brand building is crucial. Strong brand can create options
of growth, command market share, barrier of entry for competitors and consumer loyalty.
Moreover, a strong brand will enhance positive perceptions of a product’s quality,
provides a consistent brand image and personality and maintains high level of product
awareness. For firms to keep up with fierce competition in the market, they must seek to
transform their business and make them adapt to changing business environment. This
change is mandatory for any one organization that wants to survive. Therefore, re-
branding can be termed as a necessary strategy or ingredient that can help build a new
business image and also help in building confidence in the consumers. Rebranding is also
one of the most important factors that marketers and brand experts must pay attention to
in order to refresh a brand that could be becoming obsolete (Korakoj 2009).
The mobile industry is among the fastest growing industries in the Kenya. According to
the Communications Commission of Kenya (CCK), by Quarter 2 of the 2012/13 financial
year there were 30.7 million registered mobile cell phone subscribers representing a
marginal growth of 1.0% from the previous quarter. Mobile penetration stood at 78.0 %
during the period up from 77.2 % recorded during the previous reporting period. With all
2
these statistics it is no wonder that it has generated a lot of attention from the public and
private sectors. The industry has several players who contribute to its growth. There is
mobile industry the regulatory body, the Communications Commission of Kenya , the
mobile service providers- Safaricom, Airtel, Orange and Yu, the Content and Value
Added Services (VAS) companies such as InMobia, OnMobile, Cellulant, Virtual City
among others. We also have the businesses using mobile commercial products and of
course the customers.
1.1.1 Concept of strategy
Strategy may be defined as the direction and scope of an organization over the long term,
which achieves advantage for the organization through its configuration of its resources
within a challenging environment and geared towards meeting the needs of the markets
as it fulfils stakeholder expectations according to Johnson and Scholes (2002).Ansoff
(1995) defines strategy as the product market scope of a company. This refers to a
decision of what to produce in what market. If the environment is stable, an organization
can operate without changing its product-market focus. However, if the environment
changes, this would require changes in the organization's product-market focus that is its
strategy. Product-market focus relates to conditions of the external environment, which
have to be incorporated into strategy. If the products the company is producing or the
markets it is serving are not reflective of the demands of the external environment, then
the company's efforts are futile.
A strategy reflects a company's awareness of how, where and when it should compete
and for what purposes it should compete. The underlying issue of this definition is that
the main thrust of strategy is to achieve long term sustainable advantage over the other
3
competitors of the organization in every business in which it participates. It recognizes
that competitive advantage results from a thorough understanding of the external forces
that impact on the organization. According to Johnson and Scholes (2002), the term
strategy gives the direction and scope of an organization over the long term which
achieves advantage for the organization through its configuration of resources within
changing environment to meet the needs of the market and fulfill stakeholders'
expectations. Mintzberg (1988) identified five interrelated definitions of strategy as a
plan, ploy, pattern, position and as a perspective. He does not argue that one definition
should be preferred to the others, but rather be considered as alternatives or
complementary approaches. Since resources are scarce, managers must decide which
alternative strategies will benefit the firm most. For any organization to succeed, it will
be necessary for top management, managers and employees to work as a team to achieve
the company goals and objectives.
1.1.2 Corporate Re-branding
The corporate brand is the heart of all forms of branding. It defines the organization’s
identity. The corporate brand ties all the elements of a company together – it is the
integrating force that brings the organization, its employees, shareholders, and, most of
all, customers together (Schultz, 2001). It is the combination of elements of strategy,
corporate culture and corporate communications (Knox & Bickerton, 2003). Through the
corporate brand various stakeholders are able to see, remember and talk about the
organization (Kuusela, 2003).
A corporate name change may enhance market recognition and position and generate an
increase in the stock market value of renamed firm (Horsky and Swyngedouw, 1987). For
4
a new name to be launched, however, the old name has to be abandoned, an action likely
to nullify years of branding effort in terms of creating awareness. Since name awareness
is a key component of brand equity (Aaker, 1991), this action is likely to further damage
the equity of the brand. As the name is the anchor for brand equity, the change of name
might not only damage the brand equity, it might simply destroy it (Muzellec and
Lambkin, 2006).
The main drivers for corporate re-branding include the change in ownership structure,
change in corporate strategy, competitive position and external environment. Reasons for
corporate re-branding include change in ownership structure (mergers & acquisitions,
sponsorships, spin-offs among other aspects of change in ownership). It May also include
a change of name which presents the opportunity to project the company’s distinctiveness
through intensive use of the total corporate communication mix (Muzellec and Lambkin,
2006). Some of the big global firms that have rebranded include AIG (American
Insurance Group) to Chartis Insurance, Midland Bank to the globally renowned financial
institution, HSBC and CGE becoming Vivendi an international media conglomerate.
1.1.3 Customer Satisfaction
A huge range of literature has examined the concept of satisfaction. Oliver (1981)
suggests that consumer satisfaction results from comparisons between the consumer
expectations about a product and his actual experience. Customer satisfaction occurs
when his perception of performance exceeds the expected one (Oliver, 1980). In this
approach, the customer satisfaction is defined as “an individual’s subjectivity derived
favorable evaluation of any outcome and/or experience associated with consuming a
product” (Maxham in Duffy et al., 2006). Customer satisfaction refers to transactional
5
measures focusing on a separate occasion or cumulative construct resulting from a
succession of transactions (Garbarino and Johnson, 1999). It can either indicate the
affective reaction toward the recent experience with the product (Oliver, 1999). Spreng et
al. (1996) define customer satisfaction as “the emotive response to service attributes and
service information. It is the immediate reactions to dimensions which include attributes
and processes. According to Chen and Chang (2004), satisfaction is “the consumer’s
fulfillment response. Gurbüz (2008) notes that “this measurable response to company’s
offerings can be defined as a positive affective function of both pre-purchase expectation
and after-purchase performance. It is a kind of psychological sum-up in which connection
is built between the feelings and the emotions arising from the probable discrepancies,
large or small, between perceptions and expectations on the one hand and the experience
of consumption on the other.
While some works focused on the relation between customer satisfaction and the
experience with the product (e.g., Oliver, 1981), further studies were oriented to the
examination of the link between the satisfaction and the brand image, the brand
reputation (Bloemer and De Ruyter, 1998; Selnes, 1993) and the brand name (Grace and
O’Cass, 2005; Gurbüz, 2008). Actually, the latter is considered as an instrument that can
be used to influence the consumer perception or corporation attributes (Klink, 2001). In
the case of services industry like telecommunication, customer satisfaction is closely
associated with quality. Davis (2007) emphasizes that the use of brand name as a
heuristic service quality is reinforced by the brand associations. On the same note,
Gurbüz(2008) tests empirically the impacts of the brand name of a service on customer
satisfaction and service quality: “Store brand name has a positive effect on satisfaction”.
6
He concludes that customer experience plays an important role in successful store
branding, and may prove to be a better predictor of customer satisfaction.
1.1.4 Mobile service providers in Kenya
The mobile industry is among the fastest growing industries in the Kenya. According to
the Communications Commission of Kenya (CCK), by Quarter 2 of the 2012/13 financial
year there were 30.7 million registered mobile cell phone subscribers representing a
marginal growth of 1.0% from the previous quarter. With all these statistics it is no
wonder that it has generated a lot of attention from the public and private sectors. The
industry has several players who contribute to its growth. There is mobile industry the
regulatory body, the Communications Commission of Kenya , the mobile service
providers- Safaricom, Airtel, Orange and Yu, the content and Value Added Services
(VAS) providers, the businesses using mobile commercial products and of course the
customers.
For the past few years, Safaricom has been the most dominate mobile service provider in
Kenya with an average of 84% of the revenue market share belonging to them. The
operator had managed to maintain its position as the dominant player despite the entrance
of new and very aggressive service providers such as Orange, Celtel which later became
Zain and later taken over by Airtel. 10 years ago, Safaricom's only sole competitor was
Kencell which was owned by French firm Vivendi. However since then the company has
been unable to take over or topple the dominance of Safaricom despite having high
praises on better services, high quality network, wider coverage and better pricing. The
only segment of dominance by Celtel in the past has been the corporate and post-paid
7
segments who are more concerned with quality of service and network than popularity
and pricing.
Over the years Safaricom has dominated in both revenue market share and customer
market share. Airtel has changed hands 4 times from French Vivendi to Netherlands.
1.2 Research Problem
Rebranding may be described as the process by which a product or a service associated
with a particular brand is marketed with a new brand identity. A brand name refers “the
part of the brand that can be verbalized” (e.g. Airtel, Zain, Celtel, Kencell), while a brand
symbol refers to “the part of the brand that can be (visually) recognized, such as designs,
signs or distinctive colors” like Red and Yellow used by re-branded Airtel group. Kencell
was launched in Kenya in 2000 and rebranded to Celtel in 2004, Zain in 2008 and finally
to Airtel in 2010. It’s Kenya’s second largest telecommunications firm boasting of 4
million active subscribers (Allafrica.com). Airtel Kenya is part of Bharti Airtel Limited
an Indian company offering telecommunication services in 19 countries.
A number of studies on corporate rebranding have been done internationally and locally.
For instance, Huang (2004) did a study on the impact of rebranding on guest satisfaction
and financial performance using a case study of Holiday Inn Singapore Orchard City
Centre Hotel and found out that Overall after the rebranding, the Hotel’s occupancy and
reservation increased significantly. Myers (2003) who did a study to examine the effect
of intangible and tangible attribute on brand equity as well as its relationship to consumer
preferences established that there is a strong relationship between brand equity and each
8
of the preference measures utilized in this study. So, the brand with the higher equity in
the category generates significantly greater preference.
Locally the studies include Munyoki (2010) who did a study on effectiveness of co-
branding as a brand strategy in the credit card sector in Kenya. Findings from the
research suggested that co-branding has positive effect to both the market share of the
organization and card usage. Co-branding contributes to market penetration as the credit
card issuer has access to customer list from which new customers can be acquired. The
overall effect of co-branding on the brand equity of the product is therefore improved.
Co-branding appears to be a win/win proposition for compatible product proposition.
Wairimu (2010) who did on factors that determine brand loyalty to supermarkets in
Nairobi found out that there are many factors that determine brand loyalty to
supermarkets.
Out of the eight categories of factors considered, employee appearance and behavior
towards customers prompt services, solving customer problems as well as availability of
merchandise and price charged received high ratings. Information technology such as
database management programs that allow for individualized marketing and online
shopping received the lowest rating. Mwangi (2010) who focused on the effectiveness of
pricing strategies on brand loyalty among cell phone uses in Ol-Kalou location in Kenya
found that they rarely used high computing services of smart phones like internet,
multimedia messaging among others.
The level of awareness of the prices charged on various services residents enjoys stands
at an average of 35.53%. Most of them shift from one cell phone service provider to the
9
other. A study was conducted by Chemayiek (2005) who investigated on consumers’
perception of corporate rebranding strategy by Kenya Airways. The previous studies on
the same or related topics did not address rebranding with relation to telecoms industry
which is very unique and dynamic compared to other less turbulent industries. This study
sought to fill the gap by conducting a study on the influence of corporate re-branding on
customer satisfaction basing on mobile service providers in Kenya using a case of mobile
phone service providers.
1.3Research Objective
The objective of this study was to determine the influence of corporate re-branding on
customer satisfaction basing on mobile service providers in Kenya: Case of mobile phone
service providers.
1.4 Value of the Study
It would help the public understand why companies opt for corporate rebranding. It
would also help the consumers understand what management styles and strategies can be
used to effectively and successfully adopt the rebranding strategy effectively.
This study would be useful to the marketers to strategically plan on their rebranding
efforts with the consumer in mind. The outcomes of the study would also help various
companies from the telecommunication industry and in the private sector learn tactics
that they should employ when seeking to adopt rebranding strategy, thus become
effective.
It would add value to the existing knowledge about corporate rebranding and serve as a
reference document for future research. The paper would also serve as a basis of future
10

research work as research problem could be formulated out of it.
11
CHAPTER TWO
LITERATURE REVIEW
2.1 Introduction
This chapter presents a review of the related literature on the subject under study
presented by various researchers, scholars, analysts and authors. It also reviews literature
with respect to the research objective on the influence of corporate re-branding on
customer satisfaction. The specific areas covered here are concept of strategy, and
corporate rebranding and customer satisfaction.
2.2 Theoretical Foundation
The theory of the competitive advantage starts from the principle that the only important
concept at the national level is the national productivity (Constantin, 2004). The nature of
the competition just like the sources of competitive advantage is vary among industries as
well as among different segments within the same industry. At the same time certain
country can influence the attainment of the competitive advantage within a particular
sector of industry. the globalization of the competition and the appearance of the trans-
national companies do not eliminate the influence of a certain country for getting the
competitive advantage ; a country can offer different competitive advantages for a
company, depending if it is an origin country or a host country; - the competitively has a
dynamic character (Schumpeter); the innovations have a role of leading force in this
permanent change and determine the companies to invest on order not to be eliminated
from the market (NegriţoiuMişu, 1997 ).
12
Competitiveness theories proposed some kind of advantage as enabling a country gain
more out of international trade. The same is true for the firm. If sustainable superior
performance (which equals sustainable competitive advantage) is to be achieved a firm
must differentiate itself. Alderson (1937) hinted at a basic tenet of sustainable
competitive advantage, that a fundamental aspect of competitive advantage is the
specialization of suppliers to meet the variations in buyer demand. Later Alderson (1965)
recognized that firms should strive for unique characteristics in order to distinguish
themselves from competitors in the eyes of the consumer. He stated that differential
advantage might be achieved through lowering prices, selective advertising appeals
and/or product improvement and innovations. While these concepts lay the core
foundation for firms in moving toward sustainable competitive advantage, the intense
nature of competition today requires that firms be more innovative and entrepreneurial in
their strategy planning than just lowering prices or improving existing products.
In order to keep up with fierce competition and dynamics, companies seek to transform
their business due to changing business directions or branching out business units. This
change is mandatory for anyone who wants to survive. Thus, re-branding is a necessary
strategy that can escalate a new business image to build confidence to the consumers.
2.3 Rebranding Strategy
Rebranding refers to the process by which a product or a service associated with a
particular brand is marketed with a new brand identity (Reach Information, 2008). A
brand is defined as a name, term, sign, symbol, or design or a combination of them used
to identify the goods or services of a seller or group of sellers, and differentiates them
from those of its/their competitors (Cunill, 2006). A brand name refers “the part of the
13
brand that can be verbalized” like Kencell, Econet among others while a brand symbol
refers to “the part of the brand that can be visually recognized, such as designs, signs or
distinctive colors” (Cunill, 2006, p. 150). The name of an organization is a main brand
identity element that has an influence on both the brand image and the customer’s
perceptions because of its link to psychological associations (Keller, 1998) which makes
it form the essence of the brand (Aaker, 1991). The brand name is argued as the primary
mean and signal by which the company communicates to its public (Muzellec and
Lambkin, 2006).
The brand name represents the link between what the company is (Balmer, 2001) and
which is thought of (Davies and Chun, 2002). According to Turly and Moore (1995), the
weight of the brand name is more significant when the product has an intangible nature
like a service since it represents a good source of information about the company in
consumers’ pre-purchase evaluation.
2.3.1 Rebranding by a Brand Name Change
The brand name is defined as a Name, symbol, design or mark that enhances the value of
a product beyond its functional purpose” (Aaker, 1991), the brand reflects the complete
experience consumers have with products (Keller, 1993). It is also viewed as a
communication, vision, identity, culture, promise or image (Dunnion and Knox, 2004). A
brand name is an intangible signifier of the physical entity, acting as a surrogate for the
individual characteristics of products or services, related more to the company’s
reputation than to the lines it sells (Selnes, 1993). Strong brand name is considered as a
pillar of both the brand equity formation (Keller, 1993) and the branding process (Davis,
14
2007; Muzellec and Lambkin, 2006). Berry (2000) argues that the firm’ name is
confounded with the brand name.
The service brand name is the most important component of the brand and an important
source of information to the customer, because service attributes are difficult to
communicate via other means (Turly and Moore, 1995). Muzellec and Lambkin (2005)
propose a model of rebranding which includes four factors: change in ownership
structure, change in corporate strategy, change in external environment and change in
competitive position. Company re-branding involving brand name change may be
motivated by many factors including mergers and acquisitions (Muzellec and Lambkin,
2005). Stuart and Muzellec (2004) describe rebranding as a continuum varying from
minor changes to major changes.
2.3.2 Logo Change
According to Van den Bosch et al. (2006), repositioning an organization or
modernization may be reasons for changing corporate visual identity. According to Stuart
and Muzellec (2004), there are two reasons for logo change; first, the logo is changed
when the organization has changed its name, and second, to update the logo only in order
to update it. The goals of corporate rebranding are divided into two groups: reflecting the
new identity of a company like if a company has gone through major changes and even
the new identity of a company is formed or creating a new image. In both cases the
rebranding process includes both internalization and externalization, that is, affecting
internal employees and the culture, as well as influencing external stakeholders and the
images they have of the company (Muzellec & Lambkin 2006.)
15
JaniszewskiandMeyvis (2001) stated that meaningful stimuli like logos are expected to
improve conceptual fluency which occurs when exposure to a stimulus creates a
meaning-based representation of a stimulus that facilitates encoding and processing of the
stimulus when viewed at a later time. Hem and Iversen (2004) found that logo
representativeness and design were important determinants of logo success.
Representativeness is somewhat associated with appropriateness. Keller, Heckler and
Houston (1998) found that a brand name that indicates or suggests a product benefit like
Picture Perfect television leads to a higher recall of advertised benefit claims that are
consistent in meaning with the brand name as compared to that of a brand name that’s
non suggestive or not indicative of a product benefit. Keller, Heckler and Houston (1998)
found that suggestive brand names will lead to lower recall of new, unrelated benefit
claims than non suggestive brand names.
2.3.3 Slogan Change
A slogan is a memorable motto or phrase used as a repetitive expression of an idea or
purpose. Slogans vary from the written and the visual to the chanted and the vulgar. Their
simple rhetorical nature usually leaves little room for detail, and as such, they serve
perhaps more as a social expression of unified purpose, rather than a projection for an
intended audience (Brierley, 2002).Advertising slogans are short, often memorable
phrases used in advertising campaigns. They are claimed to be the most effective means
of drawing attention to one or more aspects of a product. Its purpose is to emphasize a
phrase that the company wishes to be remembered by, particularly for marketing a
specific corporate image or connection to a product or consumer base.
16
Some slogans are created just for specific campaigns for a limited time; some are
intended as corporate slogans, to be used for an extended period; some slogans start out
as for a given campaign, and find themselves converted to the corporate slogans because
they take hold with the public, and some are memorable many years after their use is
discontinued (Brierley, 2002).
2.4 Customer Satisfaction
Customer satisfaction is a measure of how products and services supplied by a company
meet or surpass customer expectation. It is seen as a key performance indicator within
business and is part of the four perspectives of a Balanced Scorecard. Customer
satisfaction can be defined as extent to which a product’s perceived performance matches
a buyer’s expectations. Customer satisfaction depends on the product’s perceived
performance relative to a customer’s expectations. If the product or service performance
falls short of expectations, the customer is dissatisfied. On the other hand, if performance
matches expectation, the customer is satisfied. If performance exceeds expectations, the
customer is highly satisfied thus; this is referred to as customer delight (Kotler, 2006).
Customer satisfaction is a very important and valued outcome of a good marketing
practice today. According to Drucker (1954), the principle purpose of a business is to
create a satisfied customer. At the same time increasing customer satisfaction has been
found to lead to higher future profitability (Anderson et al, 1994), lower costs related to
defective goods and services (Anderson et al., 1997), increased buyer willingness to pay
price premiums, provide referrals, and use more of the product (Anderson and Mittal,
2000), and higher levels of customer retention and loyalty (Fornell, 1992; Anderson and
Sullivan, 1993). Increasing loyalty, in turn, has been found to lead to increases in future
17
revenue (Fornell and Lehmann, 1994) and at the same time leading to reductions in the
cost of future transactions (Reichheld, 1996). All of this empirical evidence suggests that
customers’ satisfaction is vital and valuable from the customer goodwill point of view
and at the same time from and an organization’s financial perspective.
Customer satisfaction brings many benefits. Satisfied customers are less price sensitive,
buy additional products, are less influenced by competitors and stay longer (Zineldin,
2000). Although customer satisfaction is important, it is not equally important to the
company. There are many customers whose satisfaction is less important, such as those a
company cannot serve or who are unprofitable; on the other hand, there are customers
whose satisfaction is crucial to a company’s survival, and the goal should always be to
satisfy those customers.
2.5 Customers’ Evaluations of Brand Renaming
Brand Personality is one of the measures of evaluating rebranding. It is a metaphor
stemming from the concept of Human Personality and early introduced in Marketing”
(Ferrandi et al., 2005). Pitt et al. (2006) notice that the word “personality” has two
different meanings: the first one is about individual’s internal processes; it helps to
understand why persons act in a particular way and corresponds to “what I say about
myself”. The second meaning concerns the way in which a person is perceived by others:
“what others say and think about me” (Pitt et al. 2006). The brand personality is one of
many components of the emotional brand side. It is used to build a unique identity to the
brand and plays a significant role in the comprehension of consumers’ attitudes and
choices (Kapferer, 1997).
18
Aaker (1997) defines brand personality as the set of human characteristics associated
with a brand. Brand personality is a mean to build a unique identity to the brand and
plays a significant role in the comprehension of consumers’ attitudes and choices
(Kapferer, 1997). Brand personality, considered as the key source of differentiation even
before functional attributes, is thought to be an important issue of brand attitude
determination and emotions creation (Ferrandi and Valette- Florence, 2002).
Another measure of customer satisfaction in rebranding includes brand Attitudes:
Schiffman and Kanuk (2000) defines attitude as a learned predisposition to behave in a
consistently favorable or unfavorable way with respect to a given object. The attitude
toward brands might be related to brand attitudes. The name can generate a positive and
strong attitude toward the brand. Accordingly, instant non-neutral attitudes will be
formed just after a contact with a product name (Zinkhan and Martin, 1987).
19
CHAPTER THREE
RESEARCH METHODOLOGY
3.1 Introduction
This chapter describes the methods that was used in collection or gathering of data
pertinent in answering the research questions. The chapter comprises the following sub-
topics; research design, target population, research instruments, the sample and sampling
procedures, data collection procedures and data analysis procedures.
3.2 Research Paradigm
The study adopted a descriptive survey research design. Mugenda and Mugenda (2003)
describes descriptive research design as a systematic, empirical inquiring into which the
researcher does not have a direct control of independent variable as their manifestation
has already occurred or because the inherently cannot be manipulated. The research
design is chosen because of its ability to create a profile about a phenomenon.
Descriptive research design is concerned with finding out about the how, who, when and
where of a phenomenon so as to build a profile (Mugenda and Mugenda, 2003).
This study adopted the survey approach, which is suitable for collecting information in
breath and not width. According to Malhotra & Birks (2007) a survey is a method of
collecting data from people about who they are, how they think (motivations and beliefs)
and what they do (behavior).
20
3.3 Population of Study
Mugenda and Mugenda (2003) define population as the entire group of individual’s,
events or objects having a common observable characteristic. The target population
comprised of all the four mobile service providers in Kenya. The study targeted
customers of the four mobile companies within Nairobi County because they are the ones
who experienced the change in services delivered by the companies following the
rebranding processes.
3.4 Sample Selection
The study used stratified sampling method to select a sample of 100 respondents in
Nairobi divided equally across the four mobile service providers. Before sampling, the
population was divided into 4 strata according to the existing mobile providers within
Nairobi and then random sampling was used within each category.
The study selected 25 customers from each mobile service provider by selecting every 5 th
customer to visit the shops. Selection of respondents was done by visiting various
customer care centers of the four operators within Nairobi.
3.5 Data Collection
The study used both primary and secondary data. Primary data was collected using a
questionnaire. The questionnaire comprised of open and closed ended questions. The
close-ended questions provided more structured responses to facilitate tangible
recommendations. The open-ended questions provided additional information that was
not captured in the close-ended questions.
21
The questionnaire were carefully designed and tested with a few members of the
population for further improvements. This was done in order to enhance its validity and
accuracy of data to be collected for the study. The researcher administered the
questionnaire to customers of the four mobile service providers visiting the various
customer care shops. The questionnaires were administered in person to give a high
response rate.
3.6 Data Validity and Reliability
A pilot study was conducted to test the reliability and validity of the research. According
to Orodho (2003), a pilot test helps to test the reliability and validity of data collection
instruments. Validity refers to the extent to which an instrument measures what is
supposed to measure data need not only to be reliable but also true and accurate. If a
measurement is valid, it is also reliable (Joppe, 2000). The pilot test comprised of five
senior staff at Airtel Kenya were not involved in the final study.
3.6.1 Validity
The content of validity of the data collection instruments was determined through
discussing the stated questions in the interview guide with the managers for the pilot.
Validity was determined by the use of Content validity Index (C.V.I). C.V.I of between
0.7 and 1 shows the instruments to be valid for the study (Orodho, 2003).
3.6.2 Reliability
Reliability refers to the consistence, stability, or dependability of the data. Whenever an
investigator measures a variable, he or she wants to be sure that the measurement
provides dependable and consistent results (Cooper & Schindler, 2003). A reliable
22
measurement is one that if repeated a second time gives the same results as it did the first
time. If the results are different, then the measurement is unreliable (Mugenda &
Mugenda, 2003). To measure the reliability of the data collection instruments an internal
consistency technique using Cronbach's alpha was applied to the gathered data (Mugenda
& Mugenda, 2003). Cronbach's alpha is a coefficient of reliability that gives an unbiased
estimate of data generalizability and an alpha coefficient of 0.60 or higher indicates that
the gathered data is reliable as it has a relatively high internal consistency and can be
generalized to reflect opinions of all respondents in the target population (Zinbarg, 2005).
3.7 Data Analysis
The completed questionnaires were first edited for completeness and consistency.
Quantitative data collected was analyzed by the use of descriptive statistics using SPSS
and presented through percentages, means, standard deviations and frequencies. The data
was split down into different aspects of rebranding and customer satisfaction. This
offered a systematic and qualitative of the study objectives.
The information was presented using bar charts, graphs and pie charts and in prose-form.
Descriptive data was presented using measures of central tendency like mean and
standard deviation. The researcher conducted a regression and correlation analysis in
order to establish the relationship between rebranding and customer satisfaction among
mobile service providers in Kenya.
23

CHAPTER FOUR
DATA ANALYSIS, PRESENTATION AND INTERPRETATION
4.1 Introduction
This chapter presents analysis of the data on the influence of corporate re-branding on
customer satisfaction basing on mobile service providers in Kenya.
The study targeted a sample of 100 respondents out of which 89 respondents gave their
responses giving a response rate of 89%. This response was excellent and representative
of the population and conforms to Mugenda and Mugenda (1999) stipulation that a
response rate of 50% is adequate for analysis and reporting; a rate of 60% is good and a
response rate of 70% and above is excellent.
4.2 General Information
The study sought to determine the respondents’ gender. It was established that 57% of the
respondents were male while 43% of the respondents were female. The findings showed
that respondents were evenly distributed across the gender divide although there were
more male than female respondents.
The respondents were asked to indicate their age. The results are shown in table 4.1
Table 4.1: Age of the respondents Frequency PercentBelow 18 years 2 2%19 -30 years 19 21%31- 40 years 28 31%41-50 years 31 35%51 years and above 9 10%Total 89 100%Source: Field Data
24
From Table 4.1 above, the study found out that only 2% of the respondents were below
18 years old and that majority of respondents were between the age of 31 and 50 years .
The findings showed that respondents were distributed across all age bands hence more
representative of the different profiles of subscribers to the mobile service providers.
Respondents were also asked to indicate their marital status and the results are shown in
table 4.2.
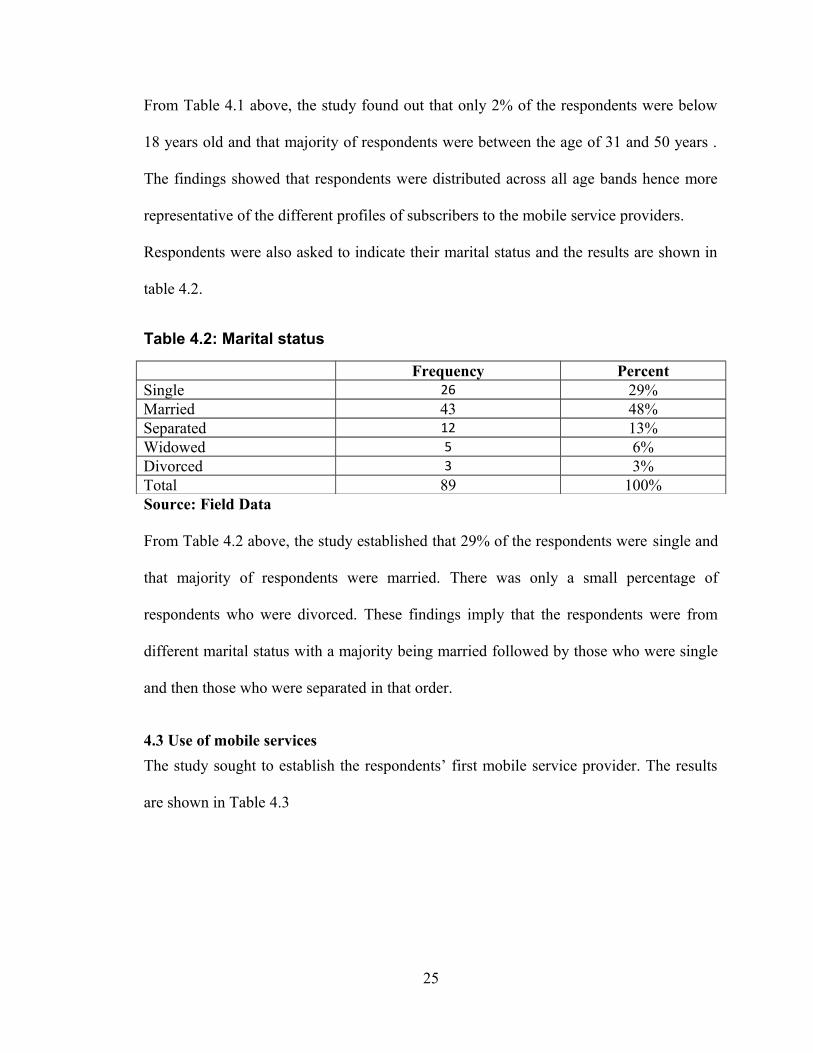
Table 4.2: Marital status
Frequency PercentSingle 26 29%Married 43 48%Separated 12 13%Widowed 5 6%Divorced 3 3%Total 89 100%Source: Field Data
From Table 4.2 above, the study established that 29% of the respondents were single and
that majority of respondents were married. There was only a small percentage of
respondents who were divorced. These findings imply that the respondents were from
different marital status with a majority being married followed by those who were single
and then those who were separated in that order.
4.3 Use of mobile services
The study sought to establish the respondents’ first mobile service provider. The results
are shown in Table 4.3
25
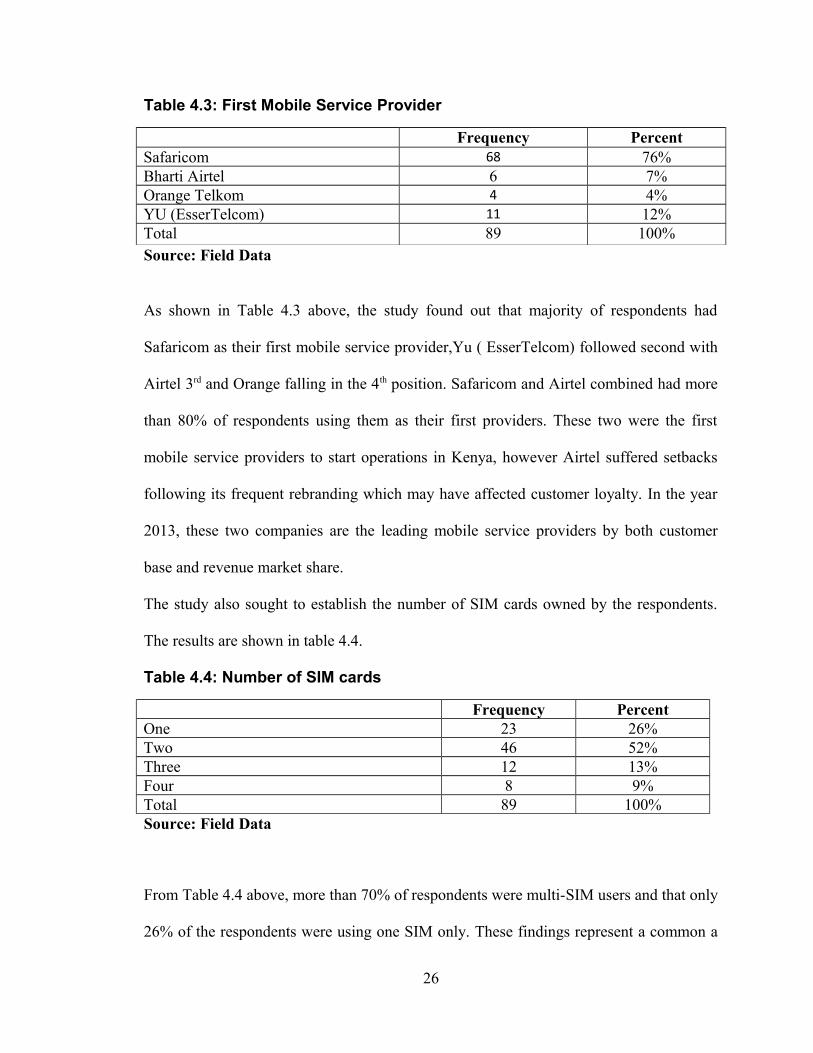
Table 4.3: First Mobile Service Provider
Frequency PercentSafaricom 68 76%Bharti Airtel 6 7%Orange Telkom 4 4%YU (EsserTelcom) 11 12%Total 89 100%Source: Field Data
As shown in Table 4.3 above, the study found out that majority of respondents had
Safaricom as their first mobile service provider,Yu ( EsserTelcom) followed second with
Airtel 3rd and Orange falling in the 4th position. Safaricom and Airtel combined had more
than 80% of respondents using them as their first providers. These two were the first
mobile service providers to start operations in Kenya, however Airtel suffered setbacks
following its frequent rebranding which may have affected customer loyalty. In the year
2013, these two companies are the leading mobile service providers by both customer
base and revenue market share.
The study also sought to establish the number of SIM cards owned by the respondents.
The results are shown in table 4.4.
Table 4.4: Number of SIM cards
Frequency PercentOne 23 26%Two 46 52%Three 12 13%Four 8 9%Total 89 100%Source: Field Data
From Table 4.4 above, more than 70% of respondents were multi-SIM users and that only
26% of the respondents were using one SIM only. These findings represent a common a
26
scenario in numerous developing countries in Africa where multi-simming is very
common. Different mobile service providers in the country have been trying to win over
customers by offering several goodies which attracted customers to use more than one
SIM card. In addition, the introduction of dual SIM mobile phones in the market
increased the chances of customers owning more than one SIM card and using them
concurrently in one handset.
The researcher also sought to establish the main mobile service provider that the
respondents were subscribed to. The results are shown in table 4.5
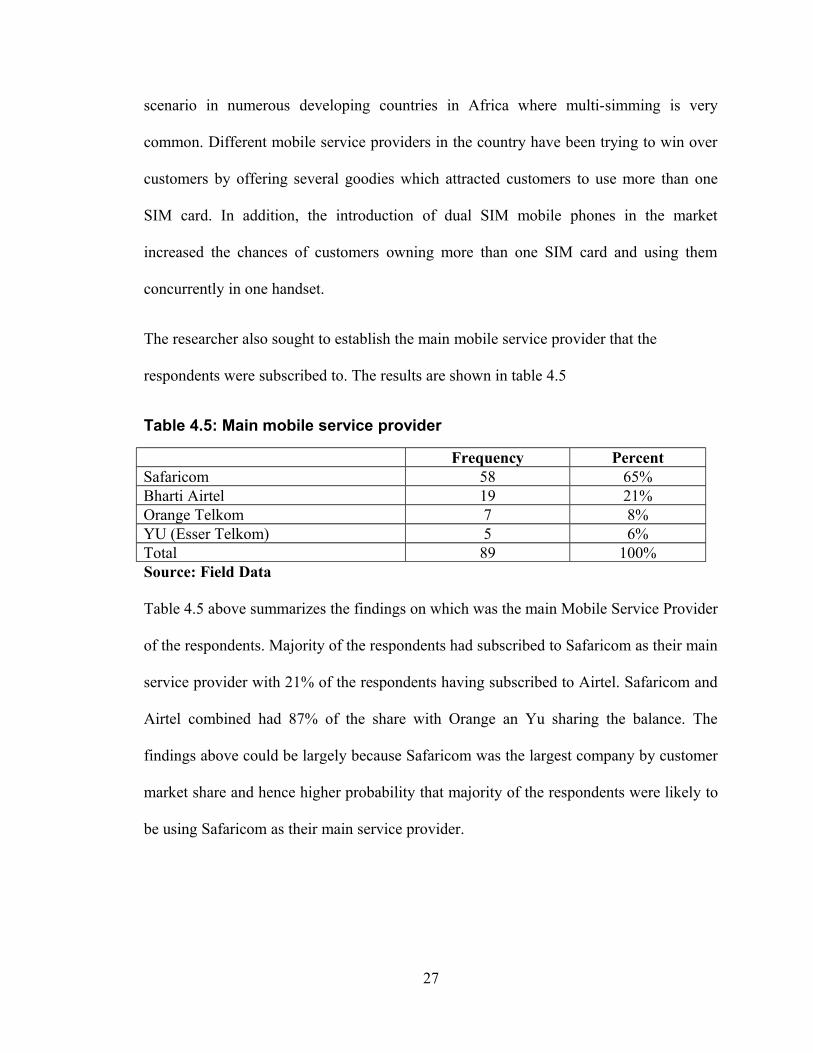
Table 4.5: Main mobile service provider
Frequency PercentSafaricom 58 65%Bharti Airtel 19 21%Orange Telkom 7 8%YU (Esser Telkom) 5 6%Total 89 100%Source: Field Data
Table 4.5 above summarizes the findings on which was the main Mobile Service Provider
of the respondents. Majority of the respondents had subscribed to Safaricom as their main
service provider with 21% of the respondents having subscribed to Airtel. Safaricom and
Airtel combined had 87% of the share with Orange an Yu sharing the balance. The
findings above could be largely because Safaricom was the largest company by customer
market share and hence higher probability that majority of the respondents were likely to
be using Safaricom as their main service provider.
27
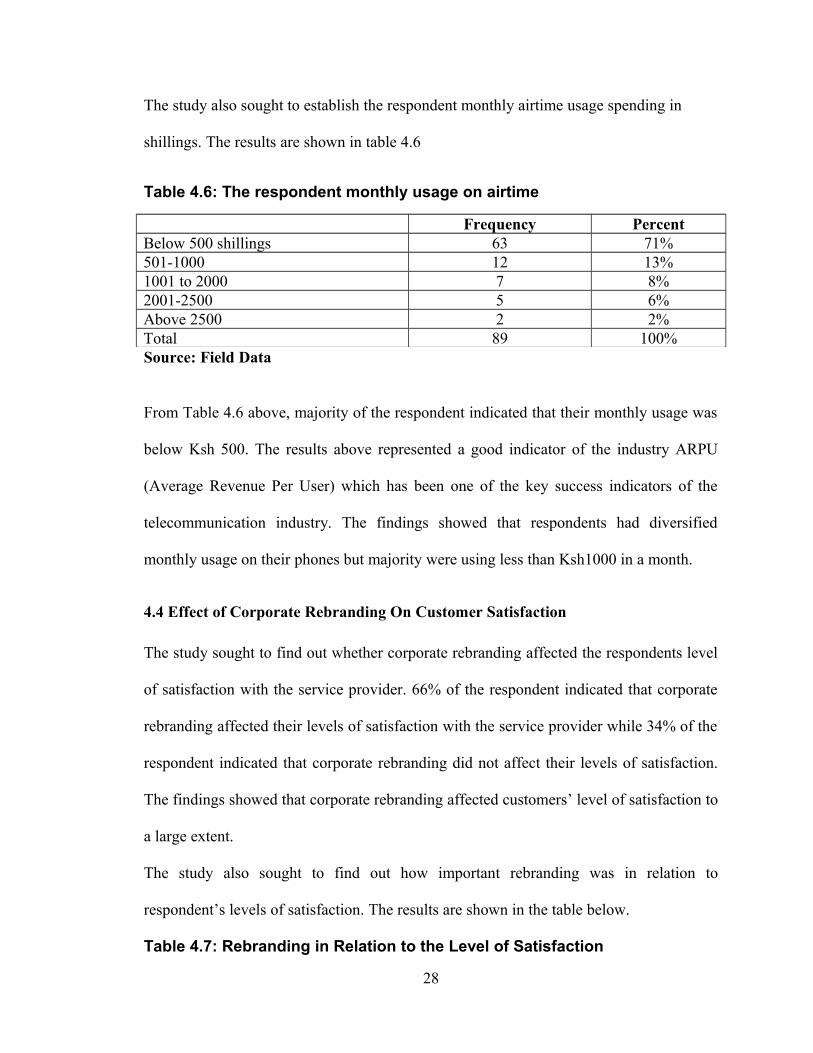
The study also sought to establish the respondent monthly airtime usage spending in
shillings. The results are shown in table 4.6
Table 4.6: The respondent monthly usage on airtime
Frequency PercentBelow 500 shillings 63 71%501-1000 12 13%1001 to 2000 7 8%2001-2500 5 6%Above 2500 2 2%Total 89 100%Source: Field Data
From Table 4.6 above, majority of the respondent indicated that their monthly usage was
below Ksh 500. The results above represented a good indicator of the industry ARPU
(Average Revenue Per User) which has been one of the key success indicators of the
telecommunication industry. The findings showed that respondents had diversified
monthly usage on their phones but majority were using less than Ksh1000 in a month.
4.4 Effect of Corporate Rebranding On Customer Satisfaction
The study sought to find out whether corporate rebranding affected the respondents level
of satisfaction with the service provider. 66% of the respondent indicated that corporate
rebranding affected their levels of satisfaction with the service provider while 34% of the
respondent indicated that corporate rebranding did not affect their levels of satisfaction.
The findings showed that corporate rebranding affected customers’ level of satisfaction to
a large extent.
The study also sought to find out how important rebranding was in relation to
respondent’s levels of satisfaction. The results are shown in the table below.
Table 4.7: Rebranding in Relation to the Level of Satisfaction
28
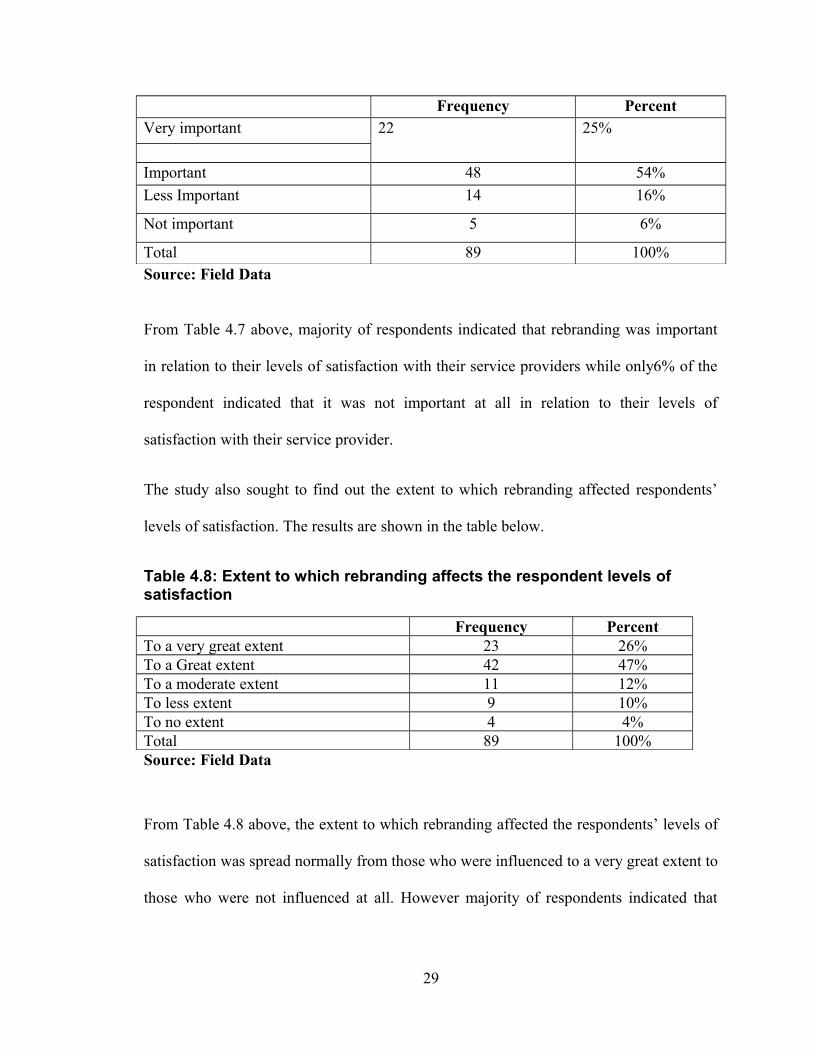
Frequency PercentVery important 22 25%
Important 48 54%
Less Important 14 16%
Not important 5 6%
Total 89 100%Source: Field Data
From Table 4.7 above, majority of respondents indicated that rebranding was important
in relation to their levels of satisfaction with their service providers while only6% of the
respondent indicated that it was not important at all in relation to their levels of
satisfaction with their service provider.
The study also sought to find out the extent to which rebranding affected respondents’
levels of satisfaction. The results are shown in the table below.
Table 4.8: Extent to which rebranding affects the respondent levels of satisfaction
Frequency PercentTo a very great extent 23 26%To a Great extent 42 47%To a moderate extent 11 12%To less extent 9 10%To no extent 4 4%Total 89 100%Source: Field Data
From Table 4.8 above, the extent to which rebranding affected the respondents’ levels of
satisfaction was spread normally from those who were influenced to a very great extent to
those who were not influenced at all. However majority of respondents indicated that
29
they were influenced by rebranding to a great extent while only 4 % of the respondent
indicated that rebranding did not affect their levels of satisfaction at all.
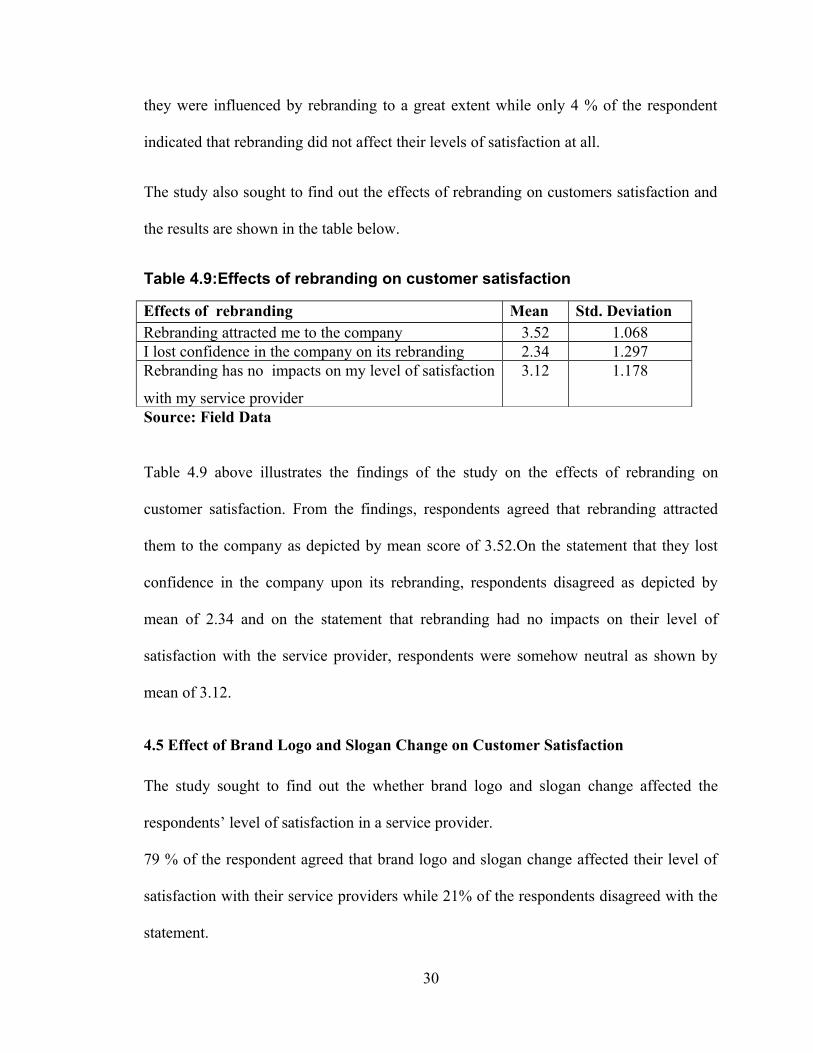
The study also sought to find out the effects of rebranding on customers satisfaction and
the results are shown in the table below.
Table 4.9:Effects of rebranding on customer satisfaction
Effects of rebranding Mean Std. DeviationRebranding attracted me to the company 3.52 1.068I lost confidence in the company on its rebranding 2.34 1.297Rebranding has no impacts on my level of satisfaction
with my service provider
3.12 1.178
Source: Field Data
Table 4.9 above illustrates the findings of the study on the effects of rebranding on
customer satisfaction. From the findings, respondents agreed that rebranding attracted
them to the company as depicted by mean score of 3.52.On the statement that they lost
confidence in the company upon its rebranding, respondents disagreed as depicted by
mean of 2.34 and on the statement that rebranding had no impacts on their level of
satisfaction with the service provider, respondents were somehow neutral as shown by
mean of 3.12.
4.5 Effect of Brand Logo and Slogan Change on Customer Satisfaction
The study sought to find out the whether brand logo and slogan change affected the
respondents’ level of satisfaction in a service provider.
79 % of the respondent agreed that brand logo and slogan change affected their level of
satisfaction with their service providers while 21% of the respondents disagreed with the
statement.
30

Table 4.10: Effects of Brand Logo and Slogan Change
Effects of brand logo and slogan change Mean Std. DeviationBrand logo and slogan change impacts positively on mysatisfaction.
4.01 1.176
Customer satisfaction is highly affected by brand logo and sloganchange.
3.64 1.284
A good brand logo and slogan change has a influenced my stayingwith the service provider
3.74 1.041
Source: Field Data
The above Table4.10 illustrates the findings of the study on the effects of brand logo and
slogan change on customer satisfaction. From the findings, respondents agreed that brand
logo and slogan change impacted positively on their satisfaction as indicated by a mean
of 4.01. On customer satisfaction being highly affected by brand logo and slogan change,
respondents agreed as shown by mean score of 3.64 while on the statement that a good
brand logo and slogan change had influenced customers’ staying with the service
provider, respondents agreed as illustrated by mean of 3.74.
31
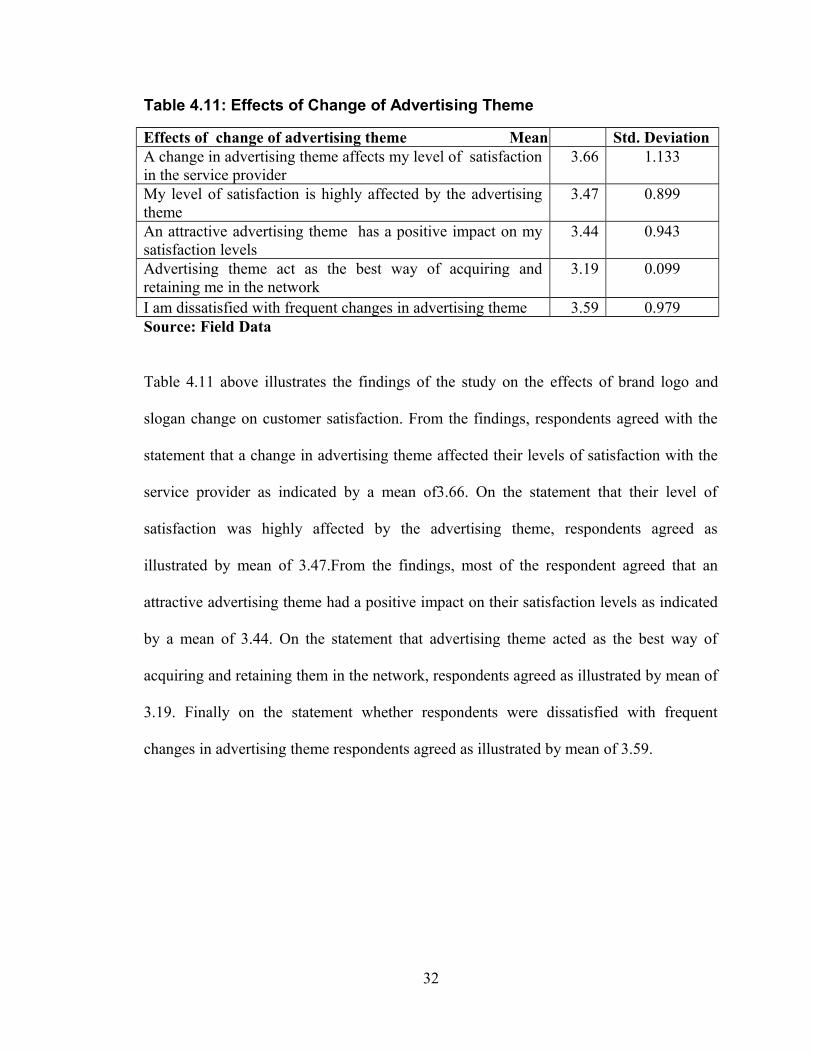
Table 4.11: Effects of Change of Advertising Theme
Effects of change of advertising theme Mean Std. DeviationA change in advertising theme affects my level of satisfactionin the service provider
3.66 1.133
My level of satisfaction is highly affected by the advertisingtheme
3.47 0.899
An attractive advertising theme has a positive impact on mysatisfaction levels
3.44 0.943
Advertising theme act as the best way of acquiring andretaining me in the network
3.19 0.099
I am dissatisfied with frequent changes in advertising theme 3.59 0.979Source: Field Data
Table 4.11 above illustrates the findings of the study on the effects of brand logo and
slogan change on customer satisfaction. From the findings, respondents agreed with the
statement that a change in advertising theme affected their levels of satisfaction with the
service provider as indicated by a mean of3.66. On the statement that their level of
satisfaction was highly affected by the advertising theme, respondents agreed as
illustrated by mean of 3.47.From the findings, most of the respondent agreed that an
attractive advertising theme had a positive impact on their satisfaction levels as indicated
by a mean of 3.44. On the statement that advertising theme acted as the best way of
acquiring and retaining them in the network, respondents agreed as illustrated by mean of
3.19. Finally on the statement whether respondents were dissatisfied with frequent
changes in advertising theme respondents agreed as illustrated by mean of 3.59.
32
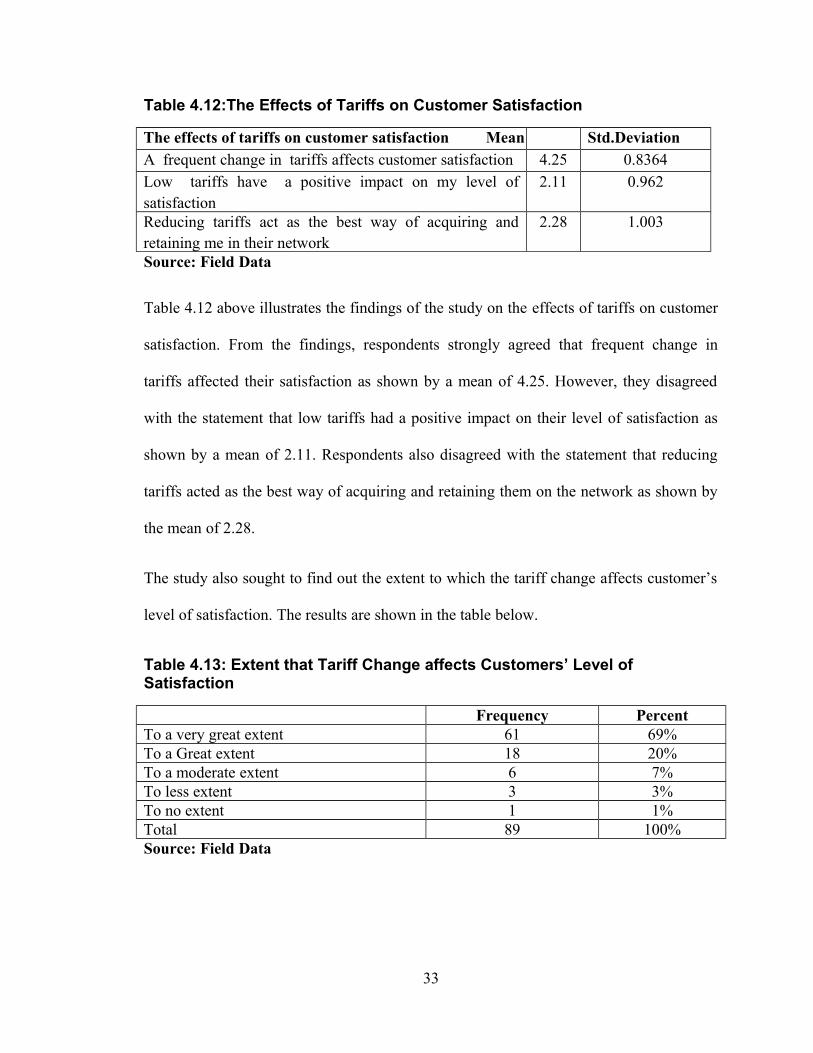
Table 4.12:The Effects of Tariffs on Customer Satisfaction
The effects of tariffs on customer satisfaction Mean Std.DeviationA frequent change in tariffs affects customer satisfaction 4.25 0.8364Low tariffs have a positive impact on my level ofsatisfaction
2.11 0.962
Reducing tariffs act as the best way of acquiring andretaining me in their network
2.28 1.003
Source: Field Data
Table 4.12 above illustrates the findings of the study on the effects of tariffs on customer
satisfaction. From the findings, respondents strongly agreed that frequent change in
tariffs affected their satisfaction as shown by a mean of 4.25. However, they disagreed
with the statement that low tariffs had a positive impact on their level of satisfaction as
shown by a mean of 2.11. Respondents also disagreed with the statement that reducing
tariffs acted as the best way of acquiring and retaining them on the network as shown by
the mean of 2.28.
The study also sought to find out the extent to which the tariff change affects customer’s
level of satisfaction. The results are shown in the table below.
Table 4.13: Extent that Tariff Change affects Customers’ Level of Satisfaction
Frequency PercentTo a very great extent 61 69%To a Great extent 18 20%To a moderate extent 6 7%To less extent 3 3%To no extent 1 1%Total 89 100%Source: Field Data
33
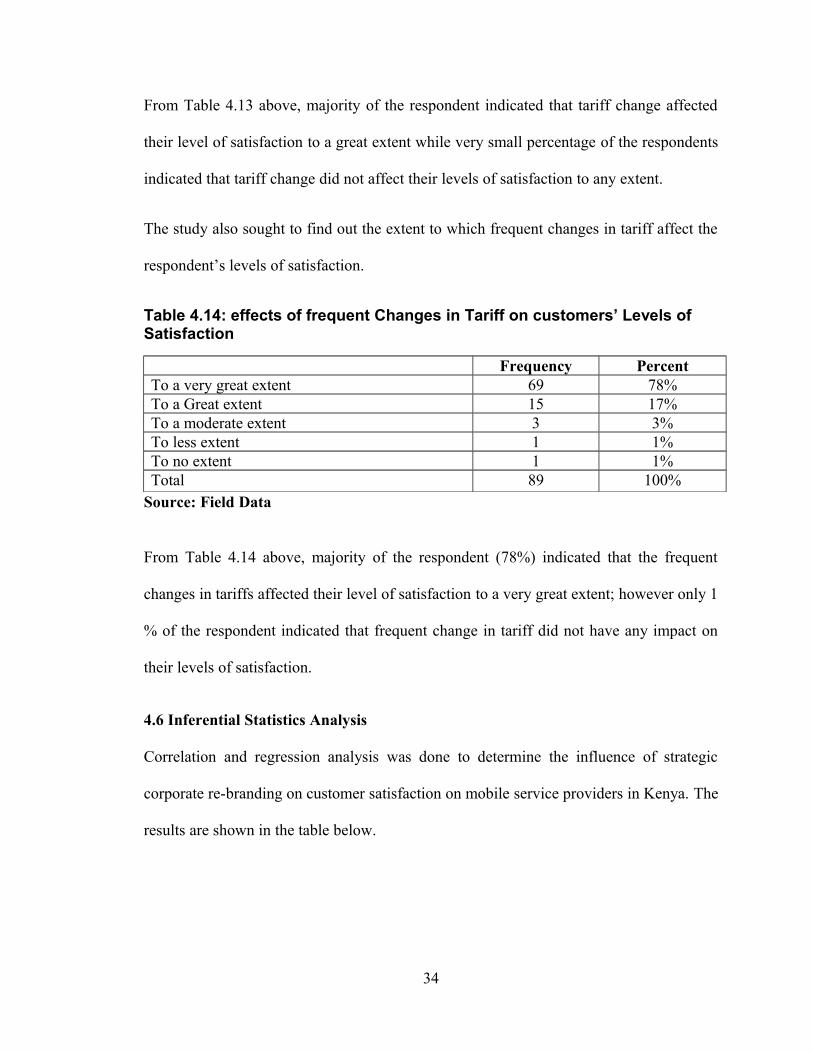
From Table 4.13 above, majority of the respondent indicated that tariff change affected
their level of satisfaction to a great extent while very small percentage of the respondents
indicated that tariff change did not affect their levels of satisfaction to any extent.
The study also sought to find out the extent to which frequent changes in tariff affect the
respondent’s levels of satisfaction.
Table 4.14: effects of frequent Changes in Tariff on customers’ Levels of Satisfaction
Frequency PercentTo a very great extent 69 78%To a Great extent 15 17%To a moderate extent 3 3%To less extent 1 1%To no extent 1 1%Total 89 100%
Source: Field Data
From Table 4.14 above, majority of the respondent (78%) indicated that the frequent
changes in tariffs affected their level of satisfaction to a very great extent; however only 1
% of the respondent indicated that frequent change in tariff did not have any impact on
their levels of satisfaction.
4.6 Inferential Statistics Analysis
Correlation and regression analysis was done to determine the influence of strategic
corporate re-branding on customer satisfaction on mobile service providers in Kenya. The
results are shown in the table below.
34
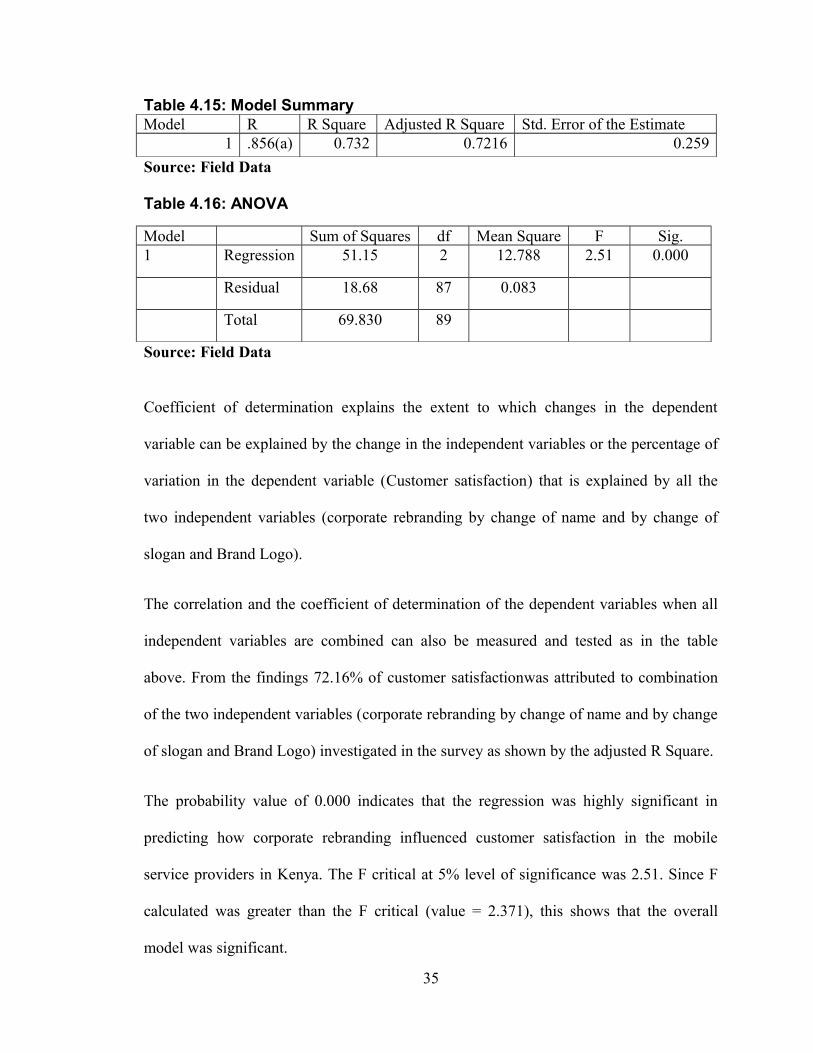
Table 4.15: Model SummaryModel R R Square Adjusted R Square Std. Error of the Estimate
1 .856(a) 0.732 0.7216 0.259
Source: Field Data
Table 4.16: ANOVA
Model Sum of Squares df Mean Square F Sig.1 Regression 51.15 2 12.788 2.51 0.000
Residual 18.68 87 0.083
Total 69.830 89
Source: Field Data
Coefficient of determination explains the extent to which changes in the dependent
variable can be explained by the change in the independent variables or the percentage of
variation in the dependent variable (Customer satisfaction) that is explained by all the
two independent variables (corporate rebranding by change of name and by change of
slogan and Brand Logo).
The correlation and the coefficient of determination of the dependent variables when all
independent variables are combined can also be measured and tested as in the table
above. From the findings 72.16% of customer satisfactionwas attributed to combination
of the two independent variables (corporate rebranding by change of name and by change
of slogan and Brand Logo) investigated in the survey as shown by the adjusted R Square.
The probability value of 0.000 indicates that the regression was highly significant in
predicting how corporate rebranding influenced customer satisfaction in the mobile
service providers in Kenya. The F critical at 5% level of significance was 2.51. Since F
calculated was greater than the F critical (value = 2.371), this shows that the overall
model was significant.
35
4.6.1 Regression Analysis
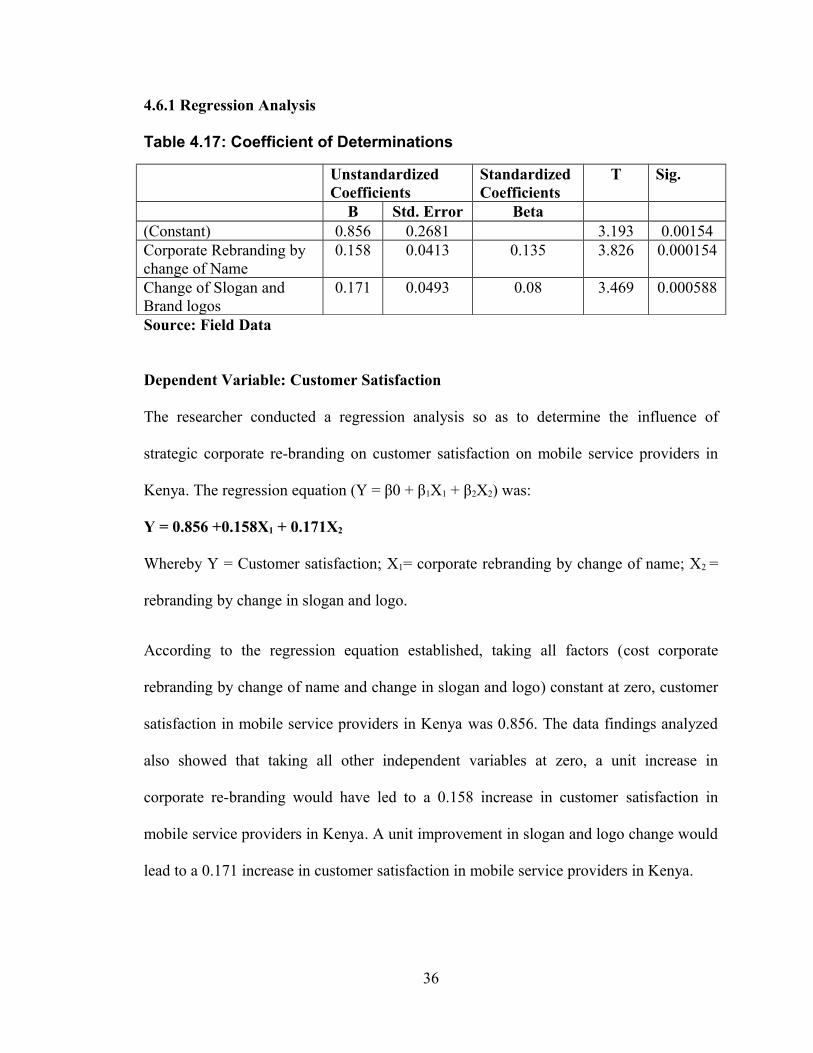
Table 4.17: Coefficient of Determinations
Unstandardized Coefficients
Standardized Coefficients
T Sig.
B Std. Error Beta(Constant) 0.856 0.2681 3.193 0.00154Corporate Rebranding by change of Name
0.158 0.0413 0.135 3.826 0.000154
Change of Slogan and Brand logos
0.171 0.0493 0.08 3.469 0.000588
Source: Field Data
Dependent Variable: Customer Satisfaction
The researcher conducted a regression analysis so as to determine the influence of
strategic corporate re-branding on customer satisfaction on mobile service providers in
Kenya. The regression equation (Y = β0 + β1X1 + β2X2) was:
Y = 0.856 +0.158X1 + 0.171X2
Whereby Y = Customer satisfaction; X1= corporate rebranding by change of name; X2 =
rebranding by change in slogan and logo.
According to the regression equation established, taking all factors (cost corporate
rebranding by change of name and change in slogan and logo) constant at zero, customer
satisfaction in mobile service providers in Kenya was 0.856. The data findings analyzed
also showed that taking all other independent variables at zero, a unit increase in
corporate re-branding would have led to a 0.158 increase in customer satisfaction in
mobile service providers in Kenya. A unit improvement in slogan and logo change would
lead to a 0.171 increase in customer satisfaction in mobile service providers in Kenya.
36
CHAPTER FIVE
DISCUSSION, CONCLUSION AND RECOMMENDATION
5.1 Introduction
This study sought to determine the influence of corporate re-branding on customer
satisfaction basing on mobile service providers in Kenya. The findings, discussions,
conclusion and recommendations are presented below.
5.2 Summary of Findings
The study found out that 76% of the respondents had Safaricom as their first mobile
service provider while 12% of the respondents had YU (Esser Telkom as their first
mobile service provider, most of the respondents (52%) had two SIM cards while only
9% of the respondents had four SIM cards. Majority of the respondents (65%) had
subscribed to Safaricom while only 6% of the respondents had subscribed Yu. Most of
the respondent (71%) indicated that their monthly usage was below Ksh500and, 2% of
the respondent indicated that their monthly usage was aboveKsh2500.66% of the
respondent indicated that corporate rebranding affected their level of satisfaction with the
service provider while as 34% of the respondent indicated that corporate rebranding did
not affect their level of satisfaction.
From the data findings, most of the respondent indicated that rebranding was very
important in relation to their level of satisfaction with their service provider while only
6% of the respondent indicated that rebranding was not important in relation to their level
of satisfaction. 26 % of the respondent indicated that rebranding affected their levels of
37
satisfaction to a very great extent and 4 % of the respondent indicated that rebranding did
not affect their levels of satisfaction to any extent.
From the findings, respondents agreed that rebranding attracted them to the company.
Most of the respondents also agreed that they lost confidence in the company upon its
rebranding. Majority of the respondents also agreed with the statements that their
satisfaction was highly affected by brand logo and slogan change, and that a good brand
logo and slogan change had a positive impact on their satisfaction.
On whether their level of satisfaction was highly affected by the advertising theme,
majority of respondents agreed with the statement while on the statement whether an
advertising theme acted as the best way of acquiring and retaining them in the network,
majority of respondents also agreed as illustrated by mean of 3.19. Majority of
respondents also agreed with the statement that they were dissatisfied with frequent
changes in advertising theme.
On impact of frequent change in tariff to customer’s satisfaction, majority of respondent
agreed with the statement while majority of the respondents disagreed with the statement
that low tariffs had a positive impact on their level of satisfaction. Finally on the
statement whether reducing tariffs acted as the best way of acquiring and retaining them
in their network, majority of respondents disagreed.
From the findings, majority of respondent agreed that brand logo and slogan change
affected their level of satisfaction in a service provider. Majority of respondents also
indicated that tariff change affected their level of satisfaction to a very great extent. On
38
statement on impact of frequent tariff changes, majority of respondent also indicated that
frequent changes in tariff affected their levels of satisfaction to a very great extent.
5.3 Conclusion
From the data findings, the study concludes that rebranding was very important in
relation to their level of satisfaction with the company and that the service brand name is
the most important component of the brand and an important source of information to the
customer, because service attributes are difficult to communicate via other means.
The further study concludes that customer satisfaction is highly affected by brand logo
and slogan change and that that brand logo and slogan are important elements of creating
bonding with customers in service industry.
5.5 Recommendations
5.5.1 Recommendations with Policy Implication
From the data findings, the study recommends that customer satisfaction is a key and
valued outcome of good marketing practice. Although customer satisfaction is important,
satisfaction for some customers is more crucial to the company than for others. High
value customers are more valued than other customers since they are the pillars of the
company’s profitability. Equally, there are some customers whose satisfaction is less
important, such as those a company cannot serve or who are unprofitable. For high value
customers, their satisfaction is crucial to a company’s survival, and the goal should
always be to satisfy those customers.
39
5.5.2 Recommendations for further Studies
This study concentrated on the influence of corporate re-branding on customer
satisfaction basing on mobile service providers in Kenya: Case of mobile phone service
providers. This study therefore recommends that another study be done on the effect of
rebranding on other industries including the cement production industry which has seen
Bamburi Cement change its branding strategies or Media industry which is comparable to
telecommunication industry since its equally dynamic.
40
REFERENCES
Aaker D.A. (1991), Managing Brand Equity - Capitalizing on the Value of a Brand
Name, New York. Free Press.
Bloemer, J. and De Ruyter, K. (1998), On the relationship between store image, store
satisfaction and store loyalty, European Journal of Marketing, Vol. 32, Nos 5/6,
pp. 499-513.
Berry L.L. (2000), Cultivating Service Brand Equity, Journal of the Academy of
Marketing science, 28( 1), pp. 128-137.
Baker, M. & Balmer, J. (1997), Visual Identity: trapping or substance. European Journal of Marketing, 31(5), 366-382.
Balmer, J.M.T. and Wilkinson, A. (1991), Building societies: change, strategy and
corporate identity, Journal of General Management, Vol. 17, No. 2, pp. 20-33.
Dunnion B. and Knox S. (2004), Understanding and Managing Corporate Brands: A
system Dynamics Perspective, 7th Iresh Academy of Management, Dublin.
Davis J.C. (2007), A conceptual View of Branding for Services, Innovative Marketing, 3,
1, 7.
Davies G. and Chun, R. (2002), Gaps between the Internal and External Perceptions of
the Corporate Brand, Corporate Reputation Review, 5 (2/3), p. 144.
Etzel, M. Walker, B. and Stanton, W. (1997), Marketing. USA: Irwin/Mc-Graw Hill.
Ferrandi J.M. and Valette-Florence P., Merunka D. (2005), The impact of Brand
Personality on consumer behavior: the Mediating role of attitude, working paper,
No 23, http://halshs.archives-ouvertes.fr/halshs-00103145.
Gurbüz E. (2008), Retail store branding in Turkey: its effects on perceived quality,
satisfaction and loyalty, Euromed Journal of Business, Vol. 3, No 3, pp. 286-304.
Janiszewski, C. and Van Osselear, S. M. J. (2000), A Connectionist Model of Brand –
Equity Associations, Journal of Marketing Research, Vol. 37, pp. 331- 350.
Kuusela, Jutta (2003). Corporate Brand Identity Management in Global Context: Case
UPM Kymmene Corporation. Master’s thesis, Helsinki School of Economics
Kapferer J.G. (1996), Les Marques: Capital de l’Entreprise, Paris, Les Editions
Organizations, 2ème édition.
41
Kapferer J.N. (1997), Strategic Brand Management: Creating and Sustaining Brand
Equity Long Term, 2nd ed., London: Kogan Page.
Keller, K.L. (1993), Conceptualizing, Measuring and Managing Consumer-Based Brand
Equity, Journal of Marketing, 57, 1-22.
Korakoj, P, (2009), The Impact of Corporate Re-branding on Brand Equity and Firm
Performance, RU. International journal. vol. 3(1)
Kotler, P. & Armstrong, G. (2010), Principles of Marketing, 13th ed. New Jersey:
Prentice Hall.
Kilic C. and Dursun T. (2006), The effect of corporate identity changes on firm value an
empirical investigation, Journal of American Academy of Business, Cambridge;
10, p. 1.
Lentschner, K. (2001), Behind the new wave of corporate rebranding, Christian Science
Monitor, pp.16.
Mitra, Anusree and John G. Jr Lynch (1995), Toward a Reconciliation of Market Power
and Information Theories of Advertising Effect on Price Elasticity, Journal of
Consumer Research, 21 (4), 644-59.
Muzellec, L.Doogan, M. Lambkin, M., (2003), Corporate rebranding- An exploratory
review. Irish marketing review Dublin. Vol 16, p.p 31-40.
Muzellec L. (2005), What is a Name change? Re-JoycingCorporte Names to create
Corporate Brand, Corporate Reputation Review, 8, 4, p. 305.
Muzellec L. and Lambkin M. (2006), To Brand or not to Brand a Corporation:
Exploring Corporate Rebranding challenges at Guinness Ireland, American
Marketing Association,
Mugenda, O.M., & Mugenda, A. G. (2003), Research methods: Quantitative and
qualitative approaches. Nairobi, Kenya: Act Press.
Munyoki, P. K. (2010), Effectiveness of co-branding as a brand strategy in the credit
card sector in Kenya. Unpublished MBA thesis, University of Nairobi.
Mwangi, T. (2010), Effectiveness of pricing strategies on brand loyalty among cell phone
users in Ol-kalou location in Kenya. Unpublished MBA thesis, University of
Nairobi.
42
Oliver, R. L. (1997), Satisfaction: A Behavioral Perspective on the Consumer, New
York: McGraw Hill.
Oliver, R.L. (1981), Measurement and evaluation of satisfaction processes in retail
settings, Journal of Retailing, Vol., 57, No. 3, pp. 25-48.
Peng, Leong Yow & Wang, Qing (2006), Impact of Relationship Marketing Tactics
(RMTs) on Switchers and Stayers in a Competitive Service Industry, Journal of
Marketing Management, V.22, pp.25-59.
Pitt L.F., Opoku R., Hultman M., Abratt R. and Spyropoulou S. (2006), What I say about
myself: communication of Brand personalities by African countries, Tourism
Management, 28, pp. 835-844
Stuart H. and Muzellec L. (2004), Corporate makeovers: Can a hyena be rebranded?,
Journal of Brand Management, 11, 6, p. 472.
Schiffman G. and Kanuk L., (2000), Consumer Behavior, 7th edition, Upper Saddle
River.
Schultz, Don. E. (2001), The Core of Integration Is the Brand. Marketing Management
10:1. 6-7.
Selnes, F. (1993), An examination of the effect of product performane on brand
reputation satisfaction and loyalty, European Journal of Marketing, Vol. 27, No.
9, pp. 19-35.
Thurtle G. (2002), Preparing over the cracks (Rebranding), Marketing Week (UK), Vol.
25, No 10, p. 24
Turley L.W. and Moore P.A. (1995), Brand Name Strategies in the service sectors,
Journal of Consumer Marketing, Vol. 12, No 4, pp. 42-50.
Wairimu, N. G. (2010), Factors that determine brand loyalty in supermarkets in Nairobi,
Unpublished MBA thesis, University of Nairobi
Zeithamal, V. A. (1988), Consumer perceptions of price, quality, and value: a means-end
model and synthesis of evidence. Journal of Marketing, 52, 2-22
Zinkhan G.M. and Martin C.R. Jr. (1987), Brand Names and Inferential Beliefs: Some
insights on naming new products, Journal of Business Research, Vol. 15, N°2, p.
15.
43
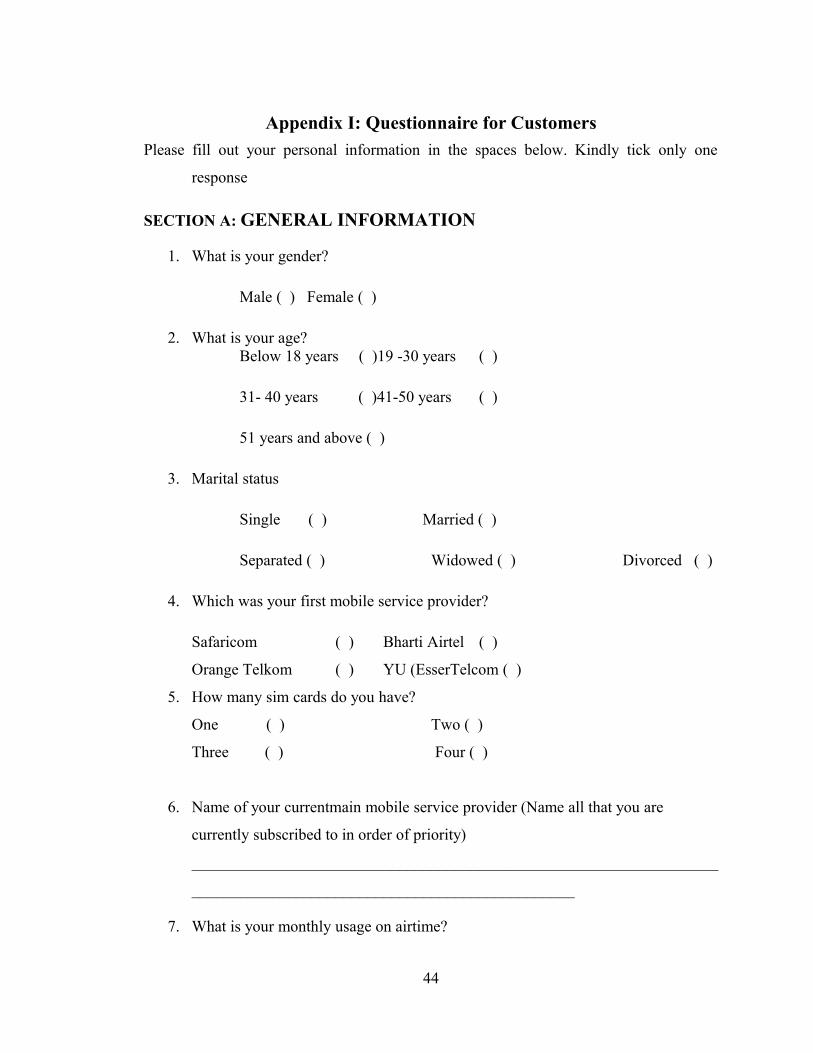
Appendix I: Questionnaire for Customers
Please fill out your personal information in the spaces below. Kindly tick only one
response
SECTION A: GENERAL INFORMATION
1. What is your gender?
Male ( ) Female ( )
2. What is your age?Below 18 years ( )19 -30 years ( )
31- 40 years ( )41-50 years ( )
51 years and above ( )
3. Marital status
Single ( ) Married ( )
Separated ( ) Widowed ( ) Divorced ( )
4. Which was your first mobile service provider?
Safaricom ( ) Bharti Airtel ( )
Orange Telkom ( ) YU (EsserTelcom ( )
5. How many sim cards do you have?
One ( ) Two ( )
Three ( ) Four ( )
6. Name of your currentmain mobile service provider (Name all that you are
currently subscribed to in order of priority)
__________________________________________________________________
________________________________________________
7. What is your monthly usage on airtime?
44
Below 500 shillings ( )
501-1000 ( )
1001-2000 ( )
2001-2500 ( )
Above 2500 ( )
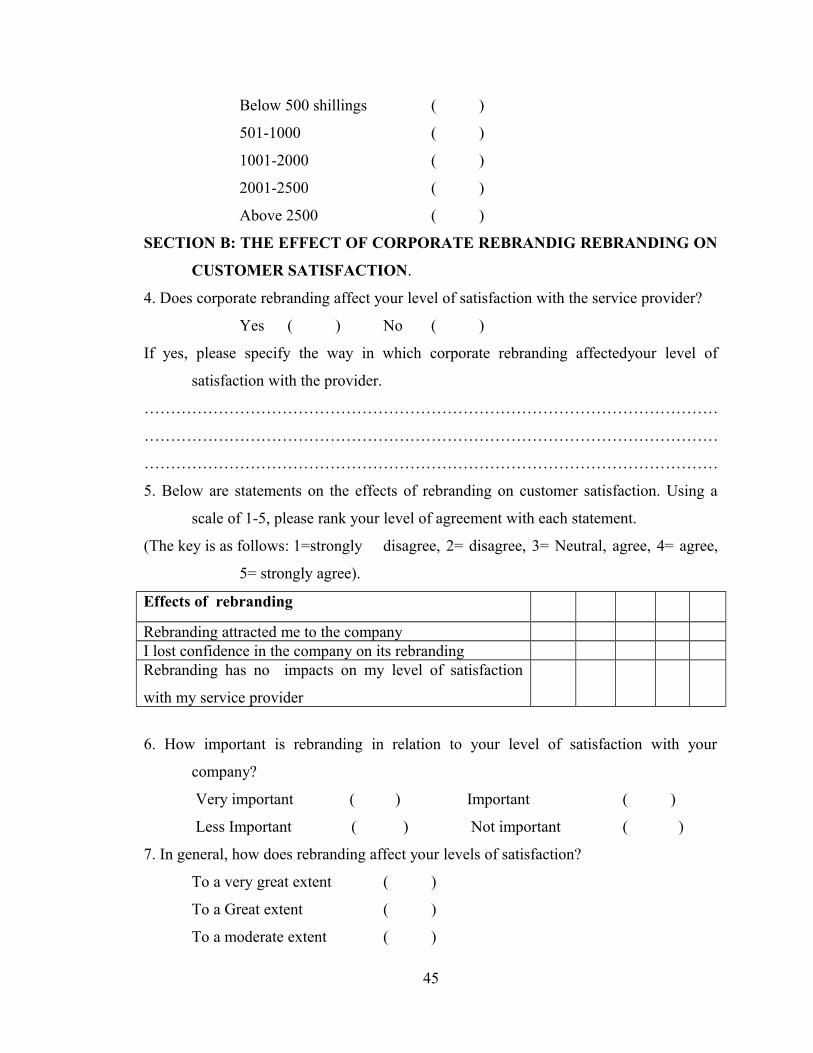
SECTION B: THE EFFECT OF CORPORATE REBRANDIG REBRANDING ON
CUSTOMER SATISFACTION.
4. Does corporate rebranding affect your level of satisfaction with the service provider?
Yes ( ) No ( )
If yes, please specify the way in which corporate rebranding affectedyour level of
satisfaction with the provider.
………………………………………………………………………………………………
………………………………………………………………………………………………
………………………………………………………………………………………………
5. Below are statements on the effects of rebranding on customer satisfaction. Using a
scale of 1-5, please rank your level of agreement with each statement.
(The key is as follows: 1=strongly disagree, 2= disagree, 3= Neutral, agree, 4= agree,
5= strongly agree).
Effects of rebranding
Rebranding attracted me to the companyI lost confidence in the company on its rebrandingRebranding has no impacts on my level of satisfaction
with my service provider
6. How important is rebranding in relation to your level of satisfaction with your
company?
Very important ( ) Important ( )
Less Important ( ) Not important ( )
7. In general, how does rebranding affect your levels of satisfaction?
To a very great extent ( )
To a Great extent ( )
To a moderate extent ( )
45
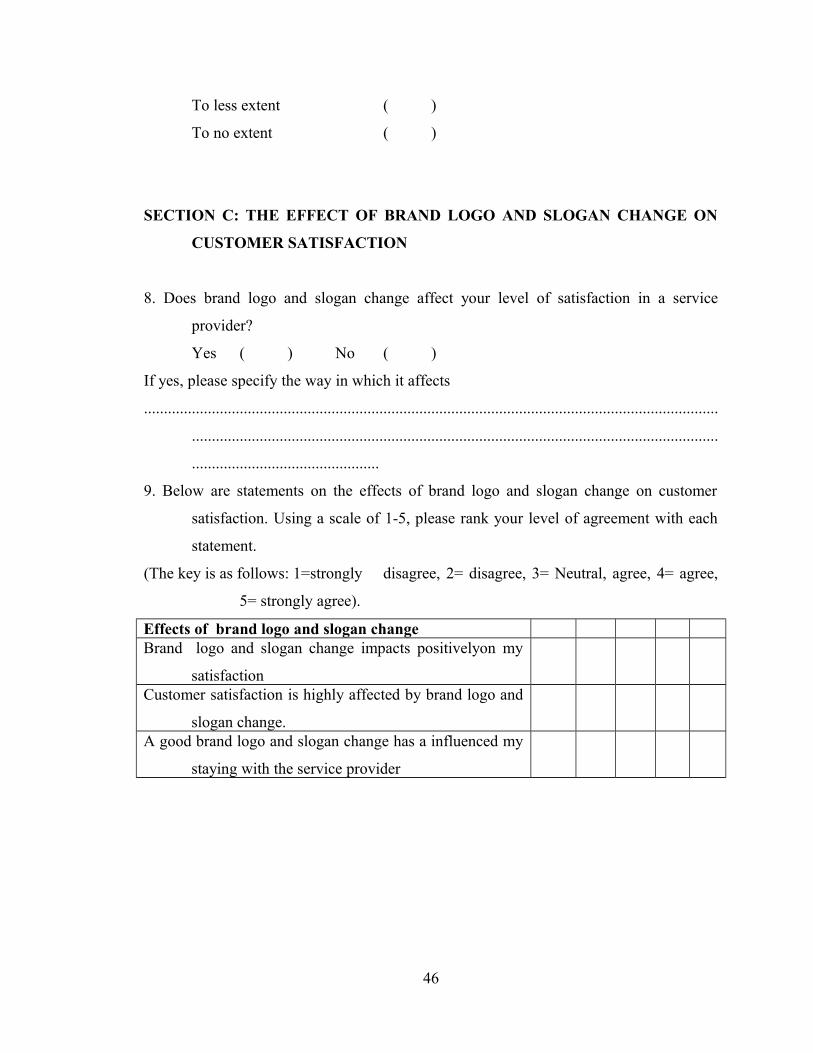
To less extent ( )
To no extent ( )
SECTION C: THE EFFECT OF BRAND LOGO AND SLOGAN CHANGE ON
CUSTOMER SATISFACTION
8. Does brand logo and slogan change affect your level of satisfaction in a service
provider?
Yes ( ) No ( )
If yes, please specify the way in which it affects
................................................................................................................................................
....................................................................................................................................
...............................................
9. Below are statements on the effects of brand logo and slogan change on customer
satisfaction. Using a scale of 1-5, please rank your level of agreement with each
statement.
(The key is as follows: 1=strongly disagree, 2= disagree, 3= Neutral, agree, 4= agree,
5= strongly agree).
Effects of brand logo and slogan changeBrand logo and slogan change impacts positivelyon my
satisfactionCustomer satisfaction is highly affected by brand logo and
slogan change.A good brand logo and slogan change has a influenced my
staying with the service provider
46
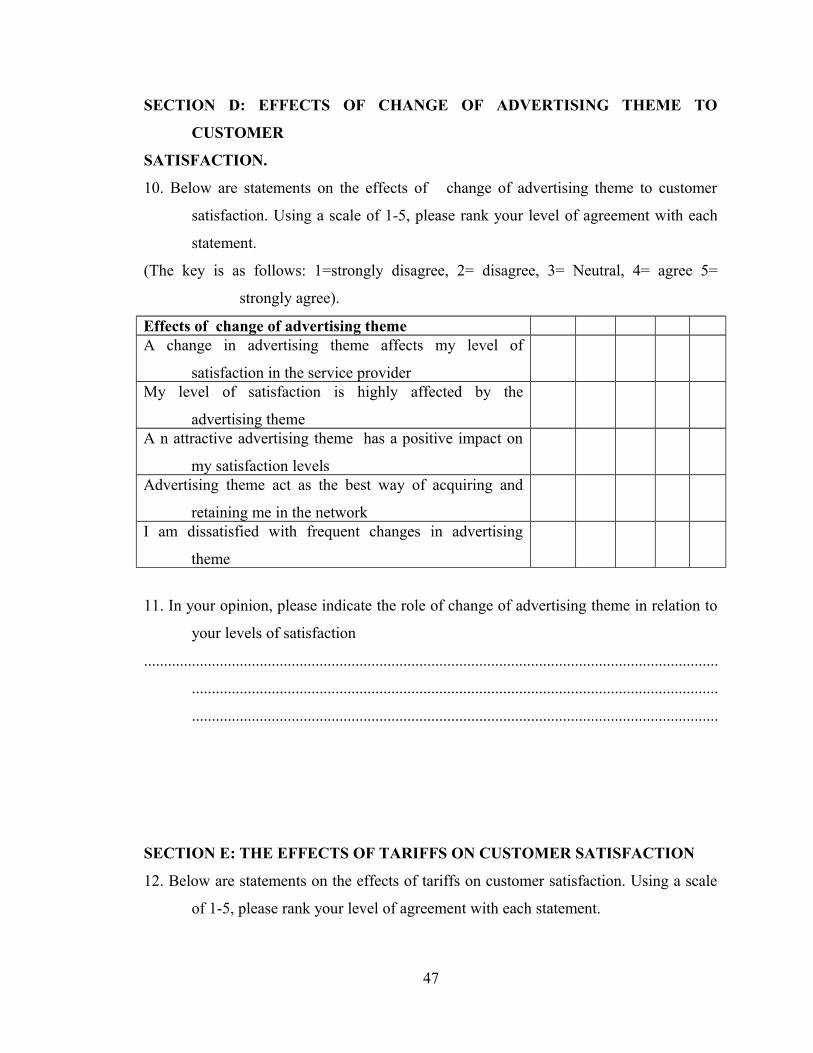
SECTION D: EFFECTS OF CHANGE OF ADVERTISING THEME TO
CUSTOMER
SATISFACTION.
10. Below are statements on the effects of change of advertising theme to customer
satisfaction. Using a scale of 1-5, please rank your level of agreement with each
statement.
(The key is as follows: 1=strongly disagree, 2= disagree, 3= Neutral, 4= agree 5=
strongly agree).
Effects of change of advertising themeA change in advertising theme affects my level of
satisfaction in the service providerMy level of satisfaction is highly affected by the
advertising themeA n attractive advertising theme has a positive impact on
my satisfaction levelsAdvertising theme act as the best way of acquiring and
retaining me in the networkI am dissatisfied with frequent changes in advertising
theme
11. In your opinion, please indicate the role of change of advertising theme in relation to
your levels of satisfaction
................................................................................................................................................
....................................................................................................................................
....................................................................................................................................
SECTION E: THE EFFECTS OF TARIFFS ON CUSTOMER SATISFACTION
12. Below are statements on the effects of tariffs on customer satisfaction. Using a scale
of 1-5, please rank your level of agreement with each statement.
47
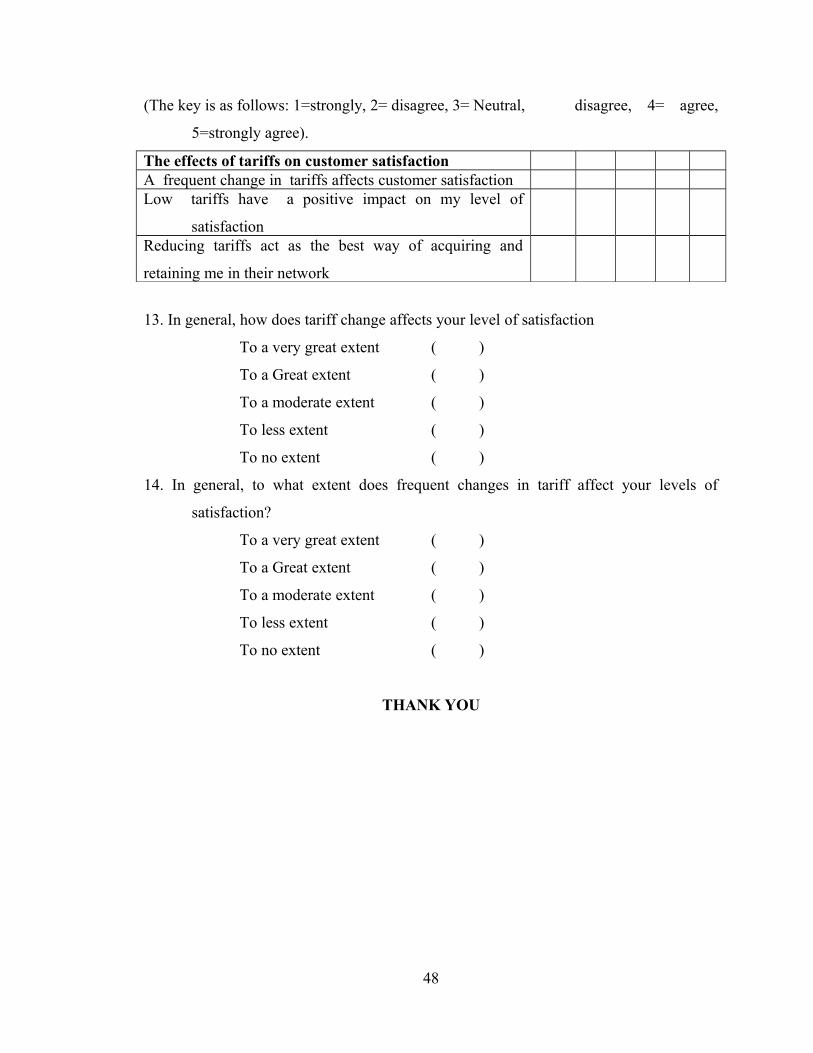
(The key is as follows: 1=strongly, 2= disagree, 3= Neutral, disagree, 4= agree,
5=strongly agree).
The effects of tariffs on customer satisfaction A frequent change in tariffs affects customer satisfactionLow tariffs have a positive impact on my level of
satisfactionReducing tariffs act as the best way of acquiring and
retaining me in their network
13. In general, how does tariff change affects your level of satisfaction
To a very great extent ( )
To a Great extent ( )
To a moderate extent ( )
To less extent ( )
To no extent ( )
14. In general, to what extent does frequent changes in tariff affect your levels of
satisfaction?
To a very great extent ( )
To a Great extent ( )
To a moderate extent ( )
To less extent ( )
To no extent ( )
THANK YOU
48