Influence of the Mechanical Properties of Elastoplastic ... - MDPI
Upload
khangminh22Category
view
2download
0
THE INFLUENCE OF GEOTECHNICAL
PROPERTIES ON THE PERFORMANCE
OF GRAVEL WEARING COURSE MATERIALS
BY
PHILIP PAIGE-GREEN
THIS THESIS IS SUBMITTED IN PARTIAL FULFILMENT OF
THE REQUIREMENTS FOR THE DEGREE PH.D IN THE
FACULTY OF SCIENCE, UNIVERSITY OF PRETORIA.
PRETORIA, MAY 1989
Digitised by the Open Scholarship Programme in support of public access to information, University of Pretoria, 2017

ACKNOWLEDGEMENTS
The author would like to express his grateful appreciation to the
following people and authorities:
Dr S.H. Kuhn, Mr R.N. Walker and Dr C.R. Freeme, the Directors of the
National Institute of Transport and Road Research and latterly the
Division of Road and Transport Technology during the period of this
research, for their encouragement and permission to use the findings
of my research for this dissertation.
Dr Frank Netterberg, my supervisor and mentor since I started work at
NITRR, who has guided, taught and encouraged me in the field of
engineering geology. Frank, I am deeply indebted.
Dr Alex Visser for his guidance and assistance during the course of
the project.
Professors Monte van Schalkwyk and Philip Savage, my promoters for
their valuable comments and advice, especially during the preparation
of this thesis.
Messrs Doug Edwards, Pierre Roux, Dave Ventura, Simon Sepitla, Joseph
Kabinde and the late Simon Dhladhla for all their assistance with the
field work and laboratory testing. Particular thanks are due to Andre
Bam for the invaluable assistance with the monitoring and surveying
work and accepting without question the many nights spent in the
field. Thanks are also due to his wife, Annette and children who were
without a husband and father for much of this time.
The staff of the Head Office, Main Laboratory and Regional and
District offices of the Transvaal Administration Roads Department for
their assistance with the experimental sections and especially Mes~~rs
Ed Kleyn and Gerrie van Zyl for their interest and assistance.
(i)
Digitised by the Open Scholarship Programme in support of public access to information, University of Pretoria, 2017

The staff of the South West Africa Department of Transport who under
the guidance of Mr Stefaans Poolman carried out the satellite
experiment in South West Africa.
The National Transport Commission, Department of Transport for funding
the project on which this thesis is based and especially Mr Nicol van
der Walt for his continued support and interest in the project.
My many other colleagues at DRTT (formerly NITRR), especially Les
Sampson, Steve Emery, Roger Williams, Dave Lockwood and Peter Curtayne
for their valuable assistance and discussions.
Trudie Hubener and Maureen Hobbs for the advice and assistance with
the typing and word-processing.
Bets Diering and Boshka Saler for their patience and assistance with
the drafting of the figures.
Mrs Lizelle Fletcher (Dept of Statistics, UNISA) and Dr Dick Wixley
(National Research Institute for Mathematical Sciences, CSIR) for
their assistance and useful discussions on some of the statistical
aspects of this thesis.
Sam Maredi for the assistance with printing and copying of the
manuscript.
My late father, Guy, and mother, Maureen, for stimulating my interest
in geology, and encouraging and supporting me through my primary
degrees and working career.
Last, but by no means least, to my dear wife, Pam, for her constant
support, encouragement and patience during the many field trips and
late nights over the last five years.
(ii)
Digitised by the Open Scholarship Programme in support of public access to information, University of Pretoria, 2017

SUMMARY
Unpaved roads comprise about 72 percent of the national and provincial
road network in South Africa and substantially more of the total
southern African road network. Significant costs are incurred annually
by the authorities on the maintenance of these roads and enormous sums
are associated with the cost of using these roads. Specifications for
the use of materials for unpaved roads in southern Africa abound, the
origin of most of these, however being rather obscure. It would appear
that many of them have been transferred from other countries, mostly
in the northern hemisphere.
The geological materials used for construction in southern Africa,
having been subjected to aeons of weathering and minimal major periods
of recent glaciation, differ greatly from those in the northern
hemisphere. One of the main objectives of this research was to
investigate the performance of local geological materials used in
wearing courses for unpaved roads and relate this to their
geotechnical properties. This involved the sampling, testing and
monitoring of 110 sections of unpaved road in the Transvaal and South
West Africa over a period of more than three years. A large data base
of gravel height, roughness, rut and corrugation measurements and the
severity and extent of dustiness, stoniness, potholes, cracks, loose
material, slipperiness and trafficability was compiled.
The material and performance data were then used to develop
performance related specifications and prediction models for roughness
progression and gravel loss with the aim of providing improved unpaved
roads and consequently reducing the road user and maintenance costs,
in the national interest. Some of the savings will obviously be
off-set to some extent by slightly increased materials location and
construction costs. These costs are, however, shown to be minimal in
comparison with the potential savings to the road user, the national
economy and the generally improved quality of life of many road users
in southern Africa. A good knowledge of the geotechnical properties of
potential wearing course materials (which are significantly dependent
on the geological origin) is necessary to differentiate good gravels
from poor ones.
(iii)
Digitised by the Open Scholarship Programme in support of public access to information, University of Pretoria, 2017
SAMEVATTING
Ongeplaveide paaie maak ongeveer 72 persent uit van die nasionale en
provinsiale padnetwerk in Suid Afrika en heelwat meer van die totale
padnetwerk van suidelike Afrika. Groot kostes word jaarliks aangegaan
deur die owerhede vir die instandhouding van hierdie paaie, asook
enorme kosts wat in verband gebring kan word met die gebruik van
hierdie paaie. Materiaalspesifikasies vir ongeplaveide paaie· in
suidelike Afrika is volop. Die oorsprong van die meeste hiervan is
egter twyfelagtig en dit wil voorkom of dit uit ander lande,
hoofsaaklik in die noordelike halfrond, afkomstig is.
Die geologiese materiale gebruik vir padkonstruksie in suidelike
Afrika verskil grootliks van die in die noordelike halfrond. Dit was
onderwerp aan eeue se verwering en minimale groot-skaalse onlangse
glasiale werking verskil grootliks van die. Een van die hoof doelwitte
van hierdie navorsing was om ondersoek in te stel na die
werkverrigting van plaaslike geologiese materiale wat gebruik word vir
die slytlaag van ongeplaveide paaie en om dit in verband te bring met
hul 3eotegniese eienskappe. Dit het behels monsterneming en toets van
materiale, asook monitering van 110 seksies ongeplaveide pad in
Transvaal en Suid-Wes Afrika oor 'n tydperk van drie jaar. 'n Groot
databasis bestaande uit inligting oor metings van gruishoogte,
ongelykheid, spoor en sinkplaat asook inligting van graad en omvang
van stof, klipperigheid, slaggate, krake, los materiaal, glibberigheid
en rybaarheid is saamgestel.
Die materiaal- en werkverrigtingsdata is toe gebruik om
werkverrigtingsverwante spesifikasies op te stel, asook om modelle
daar te stel om verswakking in gelykheid, en gruisverlies te voorspel.
Die doel is om beter ongeplaveide paaie te voorsien en gevolglik die
padverbruikers- en onderhoudskoste in nasionale belang te verminder.
'n Gedeelte van die besparing sal onvermydelik deur effens duurder
konatruksiekost~ en moontlike langer vervoerafstande van materiaal
gekanselleer word. Hiedie koste is egter minimaal in verhouding tot
die potensiele besparing vir die padgebruiker, die nasionale ekonomie
en die algemene verbetering in lewenskwaliteit van baie padgebruikers
(iv)
Digitised by the Open Scholarship Programme in support of public access to information, University of Pretoria, 2017

in suidelike Afrika. 'n Goeie kennis van die geotegniese eienskappe
van potensiele slytlaagmateriale (wat grootliks afhanklik is van
geologiese oorsprong) is noodsaaklik om te differensieer tussen goeie
an swak gruise.
(v)
Digitised by the Open Scholarship Programme in support of public access to information, University of Pretoria, 2017

THE INFLUENCE OF GEOTECHNICAL PROPERTIES ON THE PERFO&~NCE OF
GRAVEL WEARING COURSE MATERIALS
TABLE OF CONTENTS
ACKNOWLEDGEMENTS SUMMARY SAMEVATTING LIST OF FIGURES LIST OF PLATES LIST OF TABLES LIST OF ABBREVIATIONS AND SYMBOLS
1 1.1 1.2 1.3 1.4
2 2.1 2.2 2.3 2.4 2.5 2.6 2.7 2.8 2.9
3 3.1 3.2 3.3 3.4 3.5 3.6 3.7
4 4.1 4.2 4.3 4.4 4.5 4.6 4.7 4.8 4.9 4.10 4.11 4.12
INTRODUCTION Background Justification of the project Objectives of the project Structure of the dissertation
EXISTING INFORMATION Introduction Historical research Previous studies - other countries Previous studies - local Ideal wearing course requirements Specifications Discussion Statistical methods Conclusions
EXPERIMENTAL DESIGN, TESTING AND MONITORING Introduction Experimental design of the study York programme Testing and monitoring techniques s~~ary of results Climatic effects Conclusions
GENERAL PERFORMANCE Introduction Dust Stoniness Potholes Cracks Loose material Drainage and erosion Slipperiness Trafficability (Passability) Corrugations Ruts Conclusions
(vi)
Page
i iii iv viii X
xi xiii
1.1 1.3 1.5 1.5
2.1 2.1 2.5 2.7 2.8 2.11 2.16 2.19 2.21
3.1 3.1 3.11 3.16 3.24 3.27 3.29
4.1 4.4. 4.13 4.22 4.28 4. 30 4.35 4.37 4.41 4.44 4.51 4. 54
Digitised by the Open Scholarship Programme in support of public access to information, University of Pretoria, 2017

5 5.1 5.2 5.3 5.4 5.5
ROUGHNESS PREDICTION Introduction Results
6 6.1 6.2 6.3 6.4 6.5 6.6
7 7.1 7.2 7.3 7.4 7.5 7.6 7.7 7.8 7.9
8 8.1 8.2 8.3 8.4 8.5 8.6 8.7 8.8 8.9 8.10 8.11 8.12
9 9.1 9.2 9.3
10
Analysis Discussion Conclusions
GRAVEL LOSS PREDICTION Introduction Results Analysis Discussion Comparison with other models Conclusions
SPECIFICATION DEVELOPMENT Introduction Requirements of good specifications Experiment to define acceptability criteria Acceptability limits for specification development Applicability of existing specifications Analysis of results Development of specifications Discussion Conclusions
PRACTICAL IMPLICATIONS OF FINDINGS Introduction Material location and selection Material preparation Pavement design Construction considerations Maintenance Road user costs National economy Shoulders for sealed roads Other roads Other implications Conclusions
SUMMARY OF CONCLUSIONS AND RECOMMENDATIONS Summary of conclusions Recommendations Summary of findings
REFERENCES
Appendix 1: Maintenance and road user cost analysis Appendix 2: Existing specifications Appendix 3: Summary of stratigraphic units and lithology Appendix 4: Influence of roughness on foreign exchange
(vii)
Page
5.1 5.7 5.7 5.17 5.30
6.1 6.4 6.6 6.11 6.15 6.20
7.1 7.1 7.2 7.10 7.12 7.21 7.32 7.42 7.46
8.1 8.1 8.3 8.4 8.5 8.7 8.8 8.11 8.15 8.15 8.16 8.17
9.1 9.7 9.8
10.1
Al.l A2.1 A3.1 A4.1
Digitised by the Open Scholarship Programme in support of public access to information, University of Pretoria, 2017

FIGURE
2.1
3.1
LIST OF FIGURES
An engineering dilemma - climate and performance of unpaved wearing course materials Experimental design matrix for sampling of unpaved roads in the Transvaal
3.2 Identification numbers of test sections in the
3.3
3.4 3.5 3.6
4.1 4.2
4.3a
4.3b
4.4 4.5 5.1
5.2 5.3 5.4 5.5 5.6
5.7
5.8 6.1 6.2
6.3 6.4
6.5 7.1
7.2
7.3
7.4
7.5
7.6
7.7
Transvaal Design matrix of South West African experiment showing identification numbers, road numbers and traffic counts Transvaal test section locations South West Africa test section locations Annual rainfall of selected stations in the Transvaal during the monitoring period Road condition evaluation sheet Theoretical modes of transport of quartz spheres at different wind shear velocities Plot of roughness against time for section 917 (Grid rolled) Plot of roughness against time for section 916 ("Rockbuster") Effect of different surfaces on deceleration Effect of different speeds on deceleration Relationship between roughness before and after grader blading Effect of vertical grade on measured roughness Measured and predicted roughness for good roads Measured and predicted roughness for average roads Measured and predicted roughness for bad roads Measured and predicted roughness on section 251 under frequent maintenance Measured and predicted roughness on section 205 which was not bladed during the observation period Measured and predicted roughness (Brazil model) Plots of actual and predicted gravel loss Moisture and density changes and gravel loss for road 2452 Histograms of actual and predicted gravel loss Gravel loss versus cumulative traffic volume for a selection of gravel roads from the Kenya study Predicted and measured gravel loss on section 251 Regression line of mean rated roughness against measured roughness Performance of sections in relation to 1975 Rhodesian specification Performance of sections in relation to 1979 Rhodesian specification Relation between load, repetitions, tyre pressure and CBR for unsurfaced soils Surface strength requirements for aggregate surfaced roads Relationship between shrinkage product, grading coefficient and performance Plots of performance by traffic and climate
(viii)
Page
2.14
3.7
3.9
3.10 3.14 3.15
3.28 4.2
4.11 4.15
4.15
4.39 4.39 5.14
5.19 5.23 5.24 5.25 5.26
5.27
5.30 6.10
6.14 6.16 6.18
6.19
7.7
7.17
7.18
7.28 7.28
7.34
7.38
Digitised by the Open Scholarship Programme in support of public access to information, University of Pretoria, 2017

FIGURE
7.8
7.8
8.1 8.2
LIST OF FIGURES (cont)
Overall performance of test sections by material properties (cont) Overall performance of test sections by material properties Effect of moist compaction on roughness Effect of roughness on costs of tyres, fuel, lubricants and maintenance parts for cars, medium trucks and buses
(ix)
Page
7.39
7.40 8.6
8.12
Digitised by the Open Scholarship Programme in support of public access to information, University of Pretoria, 2017

PLATE
4.1 Section roller
4.2 Section buster"
4.3 Typical 4.4 Typical
LIST OF PLATES
917 showing material broken down by Grid
916 showing material broken down by "Rock-
"loose" corrugations with uncompacted crests "fixed" corrugations with compacted crests
(x)
Page
4.16
4.16
4.46 4.46
Digitised by the Open Scholarship Programme in support of public access to information, University of Pretoria, 2017

TABLE
1.1 1.2
2.1 2.2 2.3 3.1 3.2
3.3
3.4 4.1
4.2
5.1 5.2
5.3
5.4
5.5
5.6 5.7 5.8 6.1 6.2 6.3 6.4 6.5 6.6
6.7 7.1 7.2 7.3 7.4
7.5 7.6 7.7
7.8
7.9
7.10
LIST OF TABLES
Statistics of road networks in some countries Statistics of roads in independent and self governing states of South Africa Specifications proposed by Strahan (1922) Relative importance of wearing course requirements Natal Roads Department wearing course guide Characteristics of experimental sections Comparison of section data for Kenya, Brazil, Transvaal and South West Africa studies Summary of test results for Transvaal and South West Africa Specification compliance of experimental sections Theoretical number of stones in one square metre of road containing 5 per cent oversize by mass Areal exposure of various proportions of non-spherical oversize material Statistics of roughness measurements Regression coefficients of change of roughness with time (Model 5.10) Regression coefficients of change of roughness with time (Model 5.11) Regression coefficients of model for roughness after blading (Model 5.12) Percentage change in roughness with time generated from Model 5.11 Comparison of predictive capabilities of various models Statistics of residuals of available prediction models Maximum and minimum predictions and residuals Adjusted material constants (Jones, 1984a) Precision of levelling measurements Gravel loss regression analysis (Model 6.5) Gravel loss regression analysis (Model 6.8) Gravel loss predicted by Model 6.8 Comparison of residuals of gravel loss data using different models Summary statistics of predicted and actual gravel losses Criteria for measured roughness Comparison of panel and project dustiness ratings Performance criteria used in specification development Compliance of study sections with existing specifications Summary of test results for different performances Moisture sensitivity of some samples Predicted number of vehicle passes for different material streng~hs and tyre pressures Recommended material specifications for unpaved rural roads Recommended material specifications for unpaved roads in urban areas Recommended material specifications for unpaved haul roads
(xi)
Page
1.2
1.3 2.2 2.12 2.15 3.12
3.13
3.25 3.26
4.20
4.21 5.7
5.9
5.10
5.15
5.21 5.28 5.28 5.30 6.3 6.5 6.8 6.9 6.12
6.15 6.17 7.6 7.8 7.12
7.14 7.19 7.25
7.27
7.33
7.41
7.42
Digitised by the Open Scholarship Programme in support of public access to information, University of Pretoria, 2017

TABLE
7.11
8.1
LIST OF TABLES (cont)
Compliance of study sections with existing and new specifications Effect of roughness on vehicle operating costs
(xii)
Page
7.46 8.9
Digitised by the Open Scholarship Programme in support of public access to information, University of Pretoria, 2017

LIST OF ABBREVIATIONS AND SYMBOLS
The abbreviations and symbols often used in this thesis are:
Abbreviation
AASHTO
ADT AFV APV ASTM BI BS c CALC CBR CHLOR CLASS COMP CP Cret CRS CSIT D DCP DENS DR EMC exp F FEL Fm, FMC FME G G GI GL GM GOET ILL Im I l<RoL km km/h kN
Form
kPa LAA LAB MAX LDI LDISO LDI80
Term description
American Association of State Highway and Transport Officials average daily traffic (total vehicles per day) Aggregate fingers value (%) Aggregate pliers value (%) American Society for Testing Materials bump integrator season during which blading occurred (Visser, 198la) horizontal curvature (radius in metres) estimated percentage of calcite (%) California Bearing Ratio (%) estimated percentage of chlorite group minerals (%) TPA soil classification (modified after AASHO, 1961) in-situ relative compaction (%) cumulative precipitation since last blading (m) Cretaceous Crack severity Clegg soil impact tester number of days since blading (in hundreds) Dynamic cone penetrometer in-situ density (kgjm3) dust ratio (P075/P425) Equilibrium moisture content (%) exponential F-value for statistical significance estimated percentage of feldspar (%) Formation field moisture content (%) field moisture equivalent (%) vertical grade (%) grading coefficient ((P26 - P2) x P475)/100 gravel index (1 - (P2/P26)) gravel thickness loss (mm) grading modulus (300 - (P425 + P2 + P075))/100 estimated percentage of goethite (%) estimated percentage of illite-type clays (%) Thornthwaite's moisture index (Emery, 1985) oversize index (per cent larger than 37,5 mm) estimated percentage of kaolin group minerals (%) kilometre kilometres per hour kilonewton kilopascal Los Angeles Abrasion value (%) laboratory determined maximum size (mm) Linear displacement integrator Roughness measurement at 50 km/h (counts/km) Roughness measurement at 80 km/h (counts/km)
(xiii)
Digitised by the Open Scholarship Programme in support of public access to information, University of Pretoria, 2017

Abbreviation
LDQ LL ln LnR Log LRA LRB LS m MATGRP max, M MDD MDS MLA MLC mm MMP MMSO MM80 MODLS MOIST MP
n N NAASRA
NC NT NITRR NPA OCL OMC OTM
OMCCBR P075 Pl3 Pl9 P2 P2M P26 P425 P475 P6 PERHEAV PF PI PL QI
LIST OF ABBREVIATIONS AND SYMBOLS
Term description
change in natural logarithmic value of roughness Liquid limit (%) natural logarithm (base e) natural logarithm of rate of change of roughness logarithm (base 10) natural logarithm of roughness after blading natural logarithm of roughness before blading Bar linear shrinkage (%) metre, minimum material group (see chapter 3.2.1) maximum maximum dry density (kg/m3 )
Maintenance and Design System (Visser, 198la) predicted annual material loss (mm/yr) estimated percentage of mixed layer clays (%) millimetre mean monthly precipitation (m) Roughness at 50 km/h (mm/km) (Visser, 198la) Roughness at 80 km/h (mm/km) (Visser, 198la) modified British Standard linear shrinkage (%) in-situ moisture content at the time of sampling (%) average rainfall intensity during blading cycle (m/month) (Paterson, 1985) number of observations in the analysis Weinert's N-value (Weinert, 1980) National Association of Australian State Road Authorities number of cars per day (< 3 tonnes) number of trucks per day (> 3 tonnes) National Institute for Transport and Road Research Natal Provincial Administration estimated percentage of uncommon clay minerals (%) Optimum moisture content (%) estimated percentage of minerals not classified individually (%) unsoaked California Bearing Ratio (%) per cent passing 0,075 mm sieve (200 mesh) per cent passing 13,2 mm sieve per cent passing 19,0 mm sieve per cent passing 2,00 mm sieve (10 mesh) per cent finer than 0,002 mm per cent passing 26,5 mm sieve per cent passing 0,425 mm sieve (40 mesh) per cent passing 4,75 mm sieve (4 mesh) per cent passing 6,7 mm sieve percentage of heavy vehicl3s plastic factor (plastic limit x p75) (%2) plasticity index (%) plastic limit (%) Quartercar index (counts/km)
(xiv)
Digitised by the Open Scholarship Programme in support of public access to information, University of Pretoria, 2017

Abbreviation
QI(TG1 ) QI(TG2) QTZ r r2 R R R RAIN RG RGfl
RMSE s s s sRBs SAS SCBR Sev SG SMEC
Std dev sv
SWAAR t T Tl T2 T7 Ta
TGl
~~ TPA TRH TRRL USDA v VERM voc vpd w X
yr 10% FACT (1
"
LIST OF ABBREVIATIONS AND SYMBOLS
Term description
roughness at time TG1 in QI counts/km roughness at time TG 2 in QI counts/km estimated percentage of quartz (%) Pearson correlation coefficient r-squared value mean roughness (mm/km) (Hodges et al, 1975) annual rainfall (m) (Hodges et al, 1975) radius of horizontal curvature (m) (Visser, 198la) mean annual rainfall (mm) roughness after blading (counts/km) (Paterson, 1985) average roughness over duration of blading cycle (QI counts/km) (Paterson, 1985) Root mean square error second season dummy variable (Vis~er, 198la) shrinkage product (BLS x P425) South African Bureau of Standards Statistical Analysis System soaked California Bearing Ratio (%) severity Sub-group estimated percentage of smectite group minerals (e.g. montmorillonite) (%) standard deviation percentage of material passing 0,075 rnm (Visser, 198la) South West Africa Department of Transport t-statistic for significa!'ce cumulative traffic in thousands (Hodges et al, 1975) surfacing type dummy variable (Visser, 198la) material dummy variable (Visser, 198la) material dummy variable annual traffic volume in both directions in thousands of vehicles (Hodges at al, 1975) time elapsed since last grading (days) time elapsed since last grading (days) Technical Methods for Highways Transvaal Provincial Administration Technical Recommendation for Highways Transport and Road Research Laboratory United States Department of Agriculture vertical curvature (per cent) estimated percentage of vermiculite clays (%) vehicle operating costs (Rand) vehicles per day road width (m) mean year Ten percent fines aggregate crushing test (kN) standard deviation inch
(xv)
Digitised by the Open Scholarship Programme in support of public access to information, University of Pretoria, 2017
CHAPTER 1
INTRODUCTION
1.1 BACKGROUND
The transport infrastructure is
affecting the economic viability
probably the most important factor
of a country, especially developing
countries with strong agriculture- or mining-based economies. The road
network is usually the major component of the transport infrastructure
and consists of a hierarchy of structures ranging from the least
important roads conveying very low traffic volumes in rural areas up
to those carrying heavily loaded commercial traffic between major
urban centres. Even the low volume roads in rural areas are extremely
important in that they are the roads by which the farming, timber and
mining industries get their products to the market.
At the bottom end of the road hierarchy are cleared earth roads and
roads constructed of imported natural gravels, with single and multi
lana surf&ced pavements at the top end. Tne aLllity of these roads to
perform their tasks adequately under all weather conditions increases
through this hierarchy, as does the cost of their construction and
maintenance.
In nearly all of the developing countries and many of the developed
countries a significant proportion of the road network consists of
roads constructed with imported natural gravels but which are unsealed
(Table 1.1). The upgrading of these roads to sealed pavements is
becoming increasingly expensive and unpaved roads are of necessity
going to have to be improved to carry the heavier, quicker traffic at
affordable cost.
South Africa with its urban first-world economy and rural third-world
economy (especially in the independent and self goverrting states) is
in a particularly difficult situation. The often underdeveloped and
generally economically strained homelands comprise many kilometres of
heavily trafficked, poorly maintained unpaved roads which act as
feeder routes to the urban commercial and industrial centres
Digitised by the Open Scholarship Programme in support of public access to information, University of Pretoria, 2017

- 1. 2 -
TABLE 1.1: STATISTICS OF ROAD NETWORKS (1985) IN SOME COUNTRIES
(IRF, 1986)
Country Length of road Percentage paved network (km) (%)
Great Britain 346 872 100 Germany 490 045 99 Sweden 130 691 69 Spain 318 991 56 Canada 283 796 (1984) 55 (1984) United States 6 261 876 55 Australia 852 986 so South Africa 183 851 28 Botswana 8 026 23 Malawi 12 192 21 Swaziland 2 723 (1982) 19 (1982) Zimbabwe 77 927 17 Zambia 37 310 15 Kenya 64 584 12 Lesotho 4 250 12 Angola 72 300 12 South West Africa 41 701 10 Brazil 1 583 172 7
(Table 1.2). Many of these routes carry large numbers of coffiQuter
buses daily. It is therefore imperative that the routes are
trafficable at all times and that user costs are minimal. Van Niekerk
(pers comm, 1988) maintains that the road infrastructure is more
important than the sanitation and water reticulation in a developing
area, as the importance of reliable transport to the place of
employment determines whether the population retains that employment
and can thus afford food and accommodation in the area, i.e. if the
transport is unreliable or irregular, the job may be lost.
Apart from this movement of commuters over relatively long distances
(which is probably unique to South Africa), the rapid economical
movement of agricultural produce to urban markets is of prime
importance. Any increase in the cost of this transport by way of
poorer trafficability or even the effect uf rougher roalls on the
vehicle operating cost to the farmers will result in increased
production costs and hence increased consumer prices. Poor roads may
even affect the quality of, for example, farm products resulting in
lower market prices or increased packaging costs.
Digitised by the Open Scholarship Programme in support of public access to information, University of Pretoria, 2017

- 1. 3 -
TABLE 1.2: STATISTICS OF ROADS IN INDEPENDENT AND SELF-GOVERNING
STATES OF SOUTH AFRICA (1985)
State Length of road Percentage paved network (km) (%)
Ciskei 2 486 20 Venda 1 036 17 KaNgwane 861 16 Gazankula (a) 972 15 Bophuthatswana 5 290 14 Lebowa (b) 5 126 11 QwaQwa 231 11 Transkei 9 482 10
a Excluding Mhala region b Excluding Mapuleng region
Regions where tourism is important to the local economy (e.g. South
West Africa (Namibia), the Eastern Transvaal and Drakensberg areas)
require a high standard of unpaved roads (the traffic alone does not
usually warrant upgrading to sealed
can significantly affect the volume
roads). The quality of the
of · traffic and influence
roads
the
overall tourist potential of the region.
1.2 JUSTIFICATION OF THE PROJECT
The major costs involved in unpaved roads are the initial construction
cost, the routine maintenance costs and the road user costs, their sum
being the total costs. The accurate quantification of these costs is
often difficult as they are generally not accounted for individually.
The construction costs of unpaved roads (1987) are estimated to be
about R60 000/km but this obviously varies with the availability of
suitable material, the quantity of earthworks required (cut, fill and
drainage) and the geometric standards applied. Most unpaved roads,
however, have limited earthworks. An important part of the
construction of most civil engineering projects is the site
investigation and material location and in general more attention
should be paid to this phase of the project. Although specifications
for gravel wearing course materials abound the "best available local
material" is usually used. This material is usually located on past
experience, with minimal expert geotechnical input, often resulting in
Digitised by the Open Scholarship Programme in support of public access to information, University of Pretoria, 2017

- 1.4 -
the use of material which is not necessarily the most suitable for the
prevailing climatic, traffic and maintenance conditions.
Visser (198la and b) used a cost optimisation maintenance management
programme (Maintenance and Design System (MDS)) to evaluate the
maintenance strategies of the Bronkhorstspruit district in the
Transvaal. The values determined by this study (Viss~r. 198lb) were
used for an approximate analysis (Appendix 1) of the annual
maintenance and road user costs for the whole of South Africa
(corrected for approximately 100 % inflation batween 1981 and 1987)
which breaks down as follows:
Regravelling
Grader blading
Total annual maintenance costs
Annual road user costs
R 97 189 714
R 63 360 000
Rl60 869 714
R2 052 338 000
Significant costs are thus involved in the construction and
maintenance of the road infrastructure. Even marginal improvements in
material selection and maintenance management procedures should
therefore result in improved roads with major savings in maintenance
and road user costs. A small percentage of this saving would, however,
be absorbed in the increased cost of materials location and testing
and higher construction costs.
Visser and Van Niekerk (1987) note that about five per cent of the
South African unpaved road network (some 6 600 km) carries more than
200 vehicles per day despite general agreement that it is economically
viable to apply a bituminous surfacing to roads with a traffic volume
of more than 200 to 300 vehicles per day (Richards, 1978).
The preliminary results of a transportacion demand scudy in Lebowa
indicated that some Rl90 million would be required to address the
upgrading of those elements of the rural road network for which a
viable internal rate of return could be demonstrated (Van Niekerk,
1988). On a national scale the required funding is estimated at about
Digitised by the Open Scholarship Programme in support of public access to information, University of Pretoria, 2017

- 1. 5 -
Rl 200 million (Van Niekerk, 1988). A study of the road network needs
for the five years from 1986 to 1990 (Department of Transport, 1981)
showed that about R658 million (at 1980 prices) would be needed to
reconstruct and surface unpaved roads which met the current traffic
warrant for upgrading. From 1990 onwards normal traffic growth would
result in an increasing number of roads requiring upgrading.
The financial implications of this are enormous and it is highly
unlikely that any significant proportion of the required upgrading
will be possible in the foreseeable future. (In fact it is more likely
that the length of road requiring upgrading will increase annually as
traffic increases). Funds allocated by the World Bank (Harral and
Fossberg, 1977) are biased in favour of the construction of unpaved
roads. This is mainly due to the lack of maintenance of paved roads in
developing areas (Harral, 1988) and a consequent sacrifice of past
investments. It is therefore imperative that the heavily trafficked
unpaved roads are constructed from the most suitable geological
materials and can thus carry the traffic without excessive maintenance
or road user costs.
1.3 OBJECTIVES OF THE PROJECT
The main objectives of the project were:
1. To investigate existing gravel roads and identify those important
geotechnical and material properties affecting the performance of
wearing course gravels.
2. To develop performance-related specifications for gravel wearing
course materials, which can be economically applied.
3. To develop unpaved road deterioration relationships for southern
African conditions for use in maintenance management systems.
1.4 STRUCTURE OF THE DISSERTATION
The historical background to research into gravel wearing course
materials and the large-scale experiments carried out in the late
Digitised by the Open Scholarship Programme in support of public access to information, University of Pretoria, 2017

- 1.6 -
1960's and early 1970's in Kenya and Brazil are reviewed in Chapter 2.
The limited amount of work done locally (mainly in the 1960's and
early 1970's) is discussed and the requirements of ideal wearing
courses are identified. A number of existing material specifications
are compared and the inherent problems are identified.
The development of performance related specifications and performance
prediction models required data to be collected from as many different
combinations of likely material, climatic and traffic situations as
possible. A statistically designed experiment resulted in the maximum
benefit being obtained from the minimum number of situations. In
Chapter 3 the decision process behind the experimental design is
discussed and the important factors used in the experimental design of
this study are described. A discussion of the work programme and
testing and monitoring techniques employed, follows.
Chapter 4 includes the discussion and analysis of the performance
criteria monitored. These analyses identify the geotechnical (and
geological to a lesser extent) properties affecting the various
performance crit~rla of unpaved road wearing courses. The roughness of
unpaved roads is the most important factor affecting grader
maintenance requirements and road user costs and is affected
significantly by performance criteria such as corrugations, potholes
and stoniness. The analysis of the roughness data and development of
roughness prediction models is therefore dealt with separately in
Chapter 5. The analysis of the gravel loss data is considered
separately in Chapter 6 as this comprises an important part of the
maintenance management of unpaved roads, specifically with respect to
regravelling requirements and strategies.
Specifications based on the findings of Chapters
developed in Chapter 7 and are one of the main
study. An experiment to identify acceptability
4, 5 and 6
objectives of
criteria for
are
the
the
performance of unpaved roads is described and the results are utilised
in the specification development. The requirements of good
specifications are identified and their relation to the proposed
specifications is discussed. Specifications are developed to fulfil
the requirements of different users.
Digitised by the Open Scholarship Programme in support of public access to information, University of Pretoria, 2017

- 1.7 -
In Chapter 8 the implications of the findings of the project,
specifically with respect to the economic, social and political
consequences are put forward. Improved construction and maintenance
procedures based on the experience of this and similar projects are
identified. The conclusions and recommendations are summarised in the
final chapter, Chapter 9.
Digitised by the Open Scholarship Programme in support of public access to information, University of Pretoria, 2017

CHAPTER 2
EXISTING INFORMATION
2.1 INTRODUCTION
This chapter discusses the development of some of the important
philosophies concerning unpaved roads since the earliest published
research reports, both locally and overseas. The requirements of ideal
wearing course materials are discussed and existing specifications are
compared and analysed.
2.2 HISTORICAL RESEARCH
Archaeologists suggest that the the first "roads" apparently
originated about 3 500 B.C. following the invention of the wheel,
probably by the Sumerians in Mesopotamia (Rose, 1952). The science of
road building was however inaugurated by the Romans with the
construction of major roadways such as the well-known Via Appia (about
300 B.C.). with the fall of the Roman Empire (476 A.D.) the road
network deteriorated to "quagmires in winter and dustbowls in summer"
(Rose, 1952). The dramatic increase in travel prior to 1800 led to
major advances in the science of road construction with natural
materials by ~he pioneers of the road-building industry such as
Tresaguet, Metcalf, Telford and Macadam (Rose, 1953). During the
1800s, Johnson, Gillespie and Owens (Rose, 1953) pioneered the use of
sand-clay mixtures because they were cheaper, less dusty and noisy and
more resilient than macadam surfaces.
The first published reference to detailed research into gravel wearing
course materials (semi-gravel, top soil or sand clay) was that of
Strahan (1922) who described the work which had been carried out since
1907, and in which
"samples were secured from short stretches of existing
roads whose firmness and water resisting qualities were
notable by contrast with.the prevailing dirt roads".
Digitised by the Open Scholarship Programme in support of public access to information, University of Pretoria, 2017

- 2.2 -
His research resulted in the specification of three classes of soil
with limits as follows (Table 2.1):
TABLE 2.1: SPECIFICATIONS PROPOSED BY STRAHAN (1922)
Class Clay Silt Total sand Sand retained on (%) (%) (%) 60 mesh sieve (%)
Hard (A) 9-15 5-15 65-80 45-60 Medium (B) 15-25 10-20 60-70 30-45 Soft (C) 10-25 10-20 55-80 15-30
These specifications were developed before soil testing and
classification methods had progressed very far. Clay was defined as
material smaller than 0,02 mm while silt was restricted in the narrow
range 0,02 to 0,07 mm and the 60 mesh sieve (apparently 0,25 mm)
separated the coarse sand from the fine. Strahan (1922) noted that the
coarse aggregate (i.e. greater than sand size)
"to be valuable must be hard siliceous aggregate,
preferably in sizes graded from one-fourth inch (6,7
mm) to two inch (50 mm) diameter. Rocks above three
inches (75 mm) are objectionable".
The importance of the coarse sand in the general function of the soil
was noted (Strahan, 1922):
• The large amount of sand, particularly the coarser grades,
furnishes the hardness and resistance to wear.
• In graded mixtures, the coarse sand embedded in the fine sediments
of silts and clays develops a strong mechanical bond.
• The adhesive value of the clay provides the binder which holds the
sand in place during dry weather.
• In wet weather the clay softens, but the mechanical bond of the
coarse sand remains to support the traffic.
• The overall density prevents the ready penetration of water.
Strahan (1929) followed up this early work with a full treatise on
construction and maintenance, incorporating economic aspects. In
Digitised by the Open Scholarship Programme in support of public access to information, University of Pretoria, 2017

- 2.3 -
addition he noted that surface losses (gravel loss) seldom exceeded
one inch (25,4 mm) per year. The lack of knowledge on the quality of
the clay ingredients with respect to adhesion and composition was a
problem and investigations were recommended. Strahan (1929) noted that
the work being carried out on the quality of clays by Terzaghi (1925)
had opened the way to improved results with road soils.
Hogentogler et al (1929), Travers and Hicks (1933) and Hogentogler
(1935) all developed the work of Strahan further, and also
investigated additives such as calcium chloride,- sodium chloride and
even lime and cement to improve the materials. By using recently
developed tests such as the Atterberg limits and hydrometer grain-size
analyses, soil classification systems were developed. The particle
size classifications were revised with the clay and silt fractions
extended to smaller sizes. Hogentogler (1935) proposed the following
limits for materials which gave good results based on observations and
laboratory tests:
Passing 1" (25,4 mm) screen 100 %
3/4" (19 mm) 85-100 %
No 4 sieve (4,7 mm) 55-85 %
10 (2,00 mm) 40-65 %
40 (0,42 mm) 25-50 %
270 (0,053 mm) 10-25 %
Not more than 2/3 of the percentage passing the 40 mesh
sieve should pass the 270 mesh sieve.
For the fraction passing the 40 mesh sieve the
Plasticity Index should be between one and 15 and
Liquid Limit less than 35.
The use of recently developed compaction techniques (Proctor, 1933)
and the removal of large stones (by raking if necessary) were shown to
improve the road performance (Hogentogler, 1935). Runner (1935)
surveyed early United States experience and included the following
specifications:
Digitised by the Open Scholarship Programme in support of public access to information, University of Pretoria, 2017

- 2.4 -
Percentage passing 1" (25,4 mm) circular mesh screen 100
Percentage passing 1/4" (6,7 mm) sieve 35-50
Percentage wear in abrasion test - round pebbles < 25
Percentage wear in abrasion test - broken fragments < 15
In 1943, the Highway Research Board (HRB, 1943) recommended
specifications for surface course materials based on the ASTM (ASTM,
1944) and AASHO (AASHO, 1942) specifications:
Sand clay:
Passing 1" (25,4 mm) sieve 100 %
Passing No 10 (2,0 mm) sieve 65-100 %
Grading of material passing No 10 (2,0 mm) sieve:
Passing No 10 (2,0 mm) sieve 100 %
Passing No 20 (0,84 mm) sieve 55-90 %
Passing No 40 (0,42 mm) sieve 37-70 %
Passing No 200 (0,074 mm) sieve 8-25 %
Coarse graded aggregate:
Passing 1" (25,4 mm) sieve 100 %
Passing 3/4" (19 mm) sieve 85-100 %
Passing 3/8" (10 mm) sieve 65-100 %
Passing No 4 (4,7 mm) sieve 55-85 %
Passing No 10 (2,0 mm) sieve 40-70 %
Passing No 40 (0,42 mm) sieve 25-45 %
Passing No 200 (0,074 mm) sieve 10-25 %
Note: If the mixture consists of angular particles, a
higher percentage passing the No 10 sieve is desirable
than if rounded particles predominate.
The plasticity index should be between 4 and 9 % and
the percentage passing the No 200 sieve should not
exceed two-thirds of that passing the No 40 sieve
(i.e. dust ratio not more than 2/3).
Digitised by the Open Scholarship Programme in support of public access to information, University of Pretoria, 2017

- 2.5 -
Most work on wearing course gravels
around the ASTM specifications devised
(ASTM, 1944). Frost (1968) studied a
after this appears to revolve
in 1940 and published in 1944
number of specifications and
concluded that classification tests were not completely satisfactory
as criteria for specification purposes but should be combined with a
strength criterion. The California Bearing Ratio (CBR) test was
recommended. The UNESCO guide for low cost roads (UNESCO, 1971)
recommended specifications published in 1952 (Road Research
Laboratory, 1952) based on the ASTM specifications.
Much of the subsequent research into unpaved roads concentrated on the
problem of corrugations, with numerous investigations being carried
out between 1924 (Ladd, 1924) and 1980, some 28 of these being
summarised by Heath et al (1980). This work is discussed fully in
Chapter 4.10.
2.3 PREVIOUS STUDIES - OTHER COUNTRIES
The first of the large-scale investigations into unpaved road
performance was carried ouc in Kenya between 1970 and 1975. This was a
multidisciplinary project investigating both paved and unpaved road
deterioration (Hodges et al, 1975), vehicle opera.ting costs (Hide et
al, 1975) and developing a road transport investment model (Robinson
et al, 1975). The unpaved road experiment consisted of 46 sections of
existing roads, each se~tion being one kilometre long. The various
combinations of two different rainfall regions and four material types
(lateritic, quartzitic, volcanic and coral) together with the
horizontal and vertical geometry made up the necessary experimental
sections. The study resulted in a number of models relating the gravel
loss, roughness, rut depth development and surface looseness to the
traffic, environmental characteristics and design, maintenance and
construction standards. The quality of the maintenance operation was
identified as the most important factor affecting the surface
condition.
In 1975 a second large experiment was initiated in
similar lines to the Kenya investigation. The "Brazil
Brazil
Road
along
Costs
Study" concentrated on deterioration models and road user costs for
Digitised by the Open Scholarship Programme in support of public access to information, University of Pretoria, 2017

- 2.6 -
paved and unpaved roads (Visser, 198la). The unpaved experiment
involved 48 sections, each 300m long with material type, traffic and
horizontal and vertical geometry being the independent variables.
Three different material types were used (lateritic, quartzitic and
earth). Performance related models for the prediction of the
roughness, gravel loss and rut depth were developed and incorporated
into a model for the programming of maintenance and management of
unpaved road networks (MDS, Visser, 198la).
A number of other investigations on smaller scales have been primarily
aimed at investigating maintenance procedures. Jones et al (1984a)
described an experiment in Kenya following on from the previous one
but replacing coral materials with sandstone and investigating
different maintenance strategies.
Roberts (1983) conducted research into the performance of unpaved
roads in Ghana, with different maintenance strategies. A simple
experiment using climate, traffic and terrain as variables included 13 ·
sections each 10 km long. Each of the sections was divided into three
equal lengths and different maintenance procedures used on each.
Beaven et al (1987) carried out a number of experiments in Ethiopia
using basalts as wearing course materials. There was generally poor
agreement between the measured performance and the performance
predicted from the models developed in Kenya (Hodges et al, 1975). It
was, however noted that for more than 50 vehicles per day it was
cost-effective to carry out material processing in order to remove or
crush oversized material (larger than 37,5 mm).
Other experiments which have been carried out in India, the Caribbean
and Bolivia (Paterson, 1985) have yielded limited data.
Paterson (1985) analysed all of the existing data and developed an
"improved" set of models which form the basis of the deterioration
relationships used in the Highway Design and Maintenance Model (HDM 3)
for the management of low volume road networks in developing areas
(World Bank, 1985).
Digitised by the Open Scholarship Programme in support of public access to information, University of Pretoria, 2017

- 2.7 -
Wearing course materials in the United States have always been closely
specified by the American Association of State Highway and Transport
Officials (AASHTO), American Society for Testing Materials (ASTM), the
Federal Highway Administration (FHWA) and the United States Forest
Service (USFS). A theoretical study of these specifications has been
carried out, resulting in a relaxation of some of them being
recommended (Meyer and Hudson, 1987). This relaxation, however, is
generally fairly conservative allowing a maximum plasticity index for
example of 15 per cent in hot dry areas (the previous maximum was 9).
An important aspect of all of the investigations which have been
carried out over the last 20 years or so has been the limited input in
terms of material characterisation and testing, and geological
classification, with the major emphasis being on maintenance
procedures, management systems and road user cost studies. Many of the
experimental sections were far too long to be able to assume
homogeneity of the materials.
2.4 PREVIOUS STUDIES - LOCAL
Although a number of specifications were in use in South Africa in the
early 1960s, very little information as to their origin is available.
Fossberg (1962) refers to the Natal Roads Department specifications
which were based on the test results of a number of gravels from roads
that were considered to have been constructed of "good all-the-year
round gravels".
The first serious research into the performance of gravel wearing
course materials in southern Africa was initiated at the National
Institute for Road and Transport Research (NITRR) in the early 1960s
(Fossberg, 1963a). This resulted mainly in recommendations concerning
possible future research. The importance of more care in the selection
of wearing course gravels, and soil blending if necessary were
emphasised (Fossberg, 1963b). Most of the work at this time, however,
involved dust palliatives (especially sulphite lye) (Fossberg, 1966).
During the late 1960s, Netterberg (1969, 1978) investigated the use of
calcrete in unpaved roads in South West Africa, the northern Cape and
Digitised by the Open Scholarship Programme in support of public access to information, University of Pretoria, 2017

- 2.8 -
the western Transvaal. An empirical analysis of borrow-pit and
in-service calcretes resulted in comprehensive specifications for
calcrete wearing course gravels (Netterberg, 1978). Because of the
unique properties of calcretes (e.g. self stabilization), the
likelihood of these specifications being directly applicable to many
other material types was doubtful.
Visser (198lb) investigated maintenance strategies for the
Bronkhorstspruit district of the Transvaal and later for a portion of
the Middelburg district (Visser et al, 1983).·These studies were
primarily aimed at comparing the results of the Maintenance and Design
System (Visser, 198la) developed in Brazil with maintenance strategies
presently in use locally. Minimal attention was paid to the material
characteristics and all the materials involved were necessarily
classified according to the material types on which the Brazil study
was based.
Theron (1983) evaluated the MDS in the Witbank district of the
Transvaal and compared a number of the materials with the standard
specifications of the Transvaal Provincial Administration (TPA, 1973).
He concluded that many of the materials used did not comply with the
specifications. Performance varied from good to bad for both the
materials conforming with, and
specifications.
those not conforming with the
A marked deficiency of all the work carried out in South Africa has
been the minimal number of different geological material types
investigated.
2.5 IDEAL WEARING COURSE REQUIREMENTS
An ideal wearing course
requirements (mostly after
Netterberg, 1987):
gravel should satisfy
Netterberg, 1985 and
the following
Paige-Green and
• The ability to provide an acceptably smooth and safe ride without
excessive maintenance.
• Adequate stability, i.e. the resistance to deformation under both
Digitised by the Open Scholarship Programme in support of public access to information, University of Pretoria, 2017

- 2.9 -
wet and dry conditions.
• The ability to shed water without excessive erosion or scouring.
• Resistance to the abrasive action of traffic.
• Freedom from excessive dust in dry weather.
• Freedom from excessive slipperiness in wet weather
excessive tyre wear.
• Low cost and ease of maintenance.
Ability to provide an acceptably smooth and safe ride
without
The ability of the road to provide an acceptably smooth and safe ride
is one of the most important requirements and depends on a number of
factors. The main factors affecting roughness and safety are discussed
in more detail later in this thesis but have been identified as
corrugations, stoniness, potholes and surface erosion (Paige-Green and
Netterberg, 1987). All of these problems can be attributed either
directly or indirectly to material properties. Stoniness should be
reduced to a minimum by better material selection or construction
procedures before compaction of the wearing course. The removal of
oversize material also reduces the number of potholes caused by
plucking of stones during grader blading. The selection of a material
with a smaller erosion potential (i.e. higher cohesion) reduces
erosion runnels and probably inhibits the formation of corrugations.
The safety of a road appears to a large extent to depend on the
directional stability of a vehicle (Paige-Green and Netterberg, 1988)
which is in turn influenced by the roughness of the road.
Stability
Neither the wearing course nor the subgrade, to a lesser extent,
should deform under applied loads in either wet or dry conditions. A
lack of stability results in potholes, rutting and general deformation
and poor wet weather trafficability. An adequate material strength
(e.g. soaked CBR) and gravel thickness is necessary to ensure
stability. An adequate CBR will also ensure that there is a sufficient
load spreading capacity so as not to overstress weak subgrades.
Digitised by the Open Scholarship Programme in support of public access to information, University of Pretoria, 2017

- 2.10 -
Ability to shed water
Should water accumulate on the surface of the wearing course,
localised areas of reduced strength due to soaking often result in the
formation of potholes and depressions. Of greater concern is the
formation of transverse erosion channels in certain materials due to
excessive water flow rates along the cross-fall. Longitudinal erosion
has less of an effect on the riding quality but is important from the
material loss, maintenance and safety aspects. Adequate compaction
should be achieved to improve the water shedding capability and to
decrease the permeability of the wearing course as far as possible.
Resistance to abrasion by traffic
The abrasive action of traffic results in the development of ruts, the
generation of loose material and an overall material loss with time.
This necessitates regravelling, the most costly maintenance operation.
An adequate cohesion is necessary to reduce the abrasive action of
traffic. A suitably high level of compaction with water assists in the
reduction of ravelling under traffic. Routine grader maintenance also
helps in reducing abrasion by moving the wheel tracks and forming a
thin blanket of loose material.
Freedom from excessive dust
Excessive dust is undesirable primarily from the safety aspect, but
also from the effect on mechanical wear, driver discomfort and the
probable effect on roadside vegetation and crops. During discussions
with road users many rated the importance of dust above riding
quality, especially in terms of driver and passenger discomfort.
Freedom from excessive slipperiness without excessive tyre wear
The road should not be slippery in the dry condition or become
slippery when wet. This is generally overcome by the presence of a
well graded fines/aggregate mix. The aggregate however, should not be
of such a size that excessive tyre wear or roughness is introduced.
Digitised by the Open Scholarship Programme in support of public access to information, University of Pretoria, 2017

- 2.11 -
Low cost and ease of maintenance
Local materials are required to maintain a low construction cost.
These should form a wearing course capable of being reshaped to a good
riding surface during routine grader blading. Maintenance of most
unpaved roads is not a problem unless excessive hard, oversize
material is present. It is important to control the frequency of
blading by its necessity (programmed maintenance) and not to follow a
fixed period type of programme (systematic maintenance).
These requirements in relation to the serviceability, safety, vehicle
operating costs and effect on the environment and agriculture have
been summarised in Table 2.2. Comments on some material requirements
are included.
2.6 SPECIFICATIONS
Specifications for gravel wearing course materials abound. Most
countries have their own specifications, while many provincial and
local authorities have their own. 1be origin of most of these
specifications is unknown, although it is expected that some have been
transferred from other regions or countries and others are based on
local experience. An important aspect of all the specifications is the
variation between them. Fossberg (1962, 1963a, 1963b) carried out an
extensive survey of wearing course materials (Netterberg, 1985) and
concluded that:
• There is no universally applicable method for the design of
wearing courses for unpaved roads.
• Unlike paved roads, unpaved roads are profoundly affected by the
weather.
• Specifications vary widely and the allowance made for climate, if
any, also varies widely.
• Performance data and suitable test methods for wearing course
materials are lacking.
• Most specifications rely heavily on indicator tests i.e. grading
and Atterberg limits.
• The importance of proper compaction is stressed.
Digitised by the Open Scholarship Programme in support of public access to information, University of Pretoria, 2017

TABLE 2.2: RELATIVE IMPORTANCE OF WEARING COURSE REQUIREMENTS
RE!quirement
Smooth ride: Roughness
Stability:
Water shedding:
Erosion Trafficability
Resistance to abrasion:
Loose material Gravel loss Rutting
Freedom from dust:
Not slippery:
Easy maintenance: --- ---
A - very important B - important C - unimportant
Service
c
A
B A
c A B
c
c
B
Safety Comfort Total costs
B B A
B B A
B A A B B A
A B B c B A B B B
A A c
A c c
B B A ----- ---- -
Environment/ Material requirements agriculture
B Good grading, adequate cohesion and strength.
B Good grading, strength + density
B Adequate cohesion. B Good grading, strength + density N . ....
N
c High density and cohesion. B High density and cohesion. c High density and cohesion.
A Ade_quate plasticity index.
c Good grading, not too plastic.
c Little oversize. ------· - -------------------~
Digitised by the Open Scholarship Programme in support of public access to information, University of Pretoria, 2017

- 2.13 -
• Plasticity should always be considered in relation to the grading.
Unfortunately, nature has not been on the side of the road engineer
with the provision of wearing course materials. In arid areas a higher
plasticity in the wearing course is preferred as wet conditions
leading to poor trafficability are atypical and traffic is often
light. Materials with low plasticity tend to ravel and corrugate. In
these areas disintegration of rocks by physical weathering is typical
and subordinate formation of relatively inactive clays (e.g. illite)
results in low plasticity soils and gravels.· The deposition of
wind-blown sand is also characteristic of arid areas resulting in the
addition of further non-plastic sandy material.
In wetter areas a low (but sufficient to keep the material cohesive)
plasticity material is preferred, as higher plasticity material
quickly becomes impassable during prolonged wet periods. The natural
process of weathering, however, produces higher plasticity, clayey
soils in wet areas by decomposition of the primary rock forming
minerals to the higher activity clays (e.g. montmorillonite, chlorite,
vermiculite).
The result of this is illustrated in Figure 2.1 where materials other
than pedocretes generally plot in Zone 1. Ideal wearing course gravels
would plot in the area of required materials shown as Zone 2, but,
combination is seldom found naturally. other than pedocretes, this
This generally results in the use of moderately cohesive
(Zone 3) and a concomitant average performance (the
intersection of the lines joining Zones 1 and 2 for the
materials
point of
different
climatic areas). There are of course exceptions to the rule and
certain ideal materials do occur in some areas, but these have mostly
been used up or are becoming depleted.
Most of the present specifications used in southern Africa and a few
o£ the impor~ant ones used overseas and probably applied in many
developing countries are summarised in Appendix 2. A guide to the
behaviour of wearing course gravels compiled by the Natal Roads
Department, and apparently based on the performance of in-service
materials (Table 2.3) was probably used to devise some of the South
Digitised by the Open Scholarship Programme in support of public access to information, University of Pretoria, 2017

GOOD
IJJ (.)
z ~ ~ a:: 0 LL. a:: IJJ a..
BAD
- 2. 14 -
ZONE
INCREASING PLASTICITY
FIGURE 2.1
NORMAL CONDITION
REQUIRED CONDITION
BEST PRACTICAL SOLUTION
AN ENGINEERING DILEM.MA - CLIMATE AND PERFORMANCE OF UNPAVED WEARING COURSE MATERIALS
Digitised by the Open Scholarship Programme in support of public access to information, University of Pretoria, 2017

- 2.15 -
African specifications (Fossberg, 1962).
TABLE 2.3: NATAL ROADS DEPARTMENT WEARING COURSE GUIDE (NPA, ca 1961)
Performance Liquid Plasticity Coarse and Clay limit index medium sand (%)
(%) (%) (%)
Corrugates < 20 - > 55 -Potholes > 35 - < 30 . Dusty in dry < 20 - < 30 . weather
Ravels in dry < 20 < 6 .- < 6 weather
Slippery in wet . > 14 - . weather
Cuts up in wet - . < 25 > 10 weather
The origin of most of the specifications described is not known, but
there is little evidence to suggest that they have been empirically
derived from performance related studies. Some of them (e.g. AASHTO,.
1974) have tight grading envelopes and unrealistic plasticity
criteria, and were probably derived from theoretical considerations.
It is usually not possible to carry out routine acceptance testing of
materials for unpaved roads during construction due to time and cost
constraints. The use of tight limits such as those specified by AASHTO
(up to seven grading criteria are specified) are unlikely to be
complied with for even the highest class of unpaved roads used
locally. During the initial test programme carried out for material
location and selection purposes, appropriate specifications should be
used and a compromise between the cost of further testing or
investigation and the risk of using unacceptable materials should be
reached. The inherent variability of weathered geological materials
precludes the use of tight specifications, and thus time·consuming
tests should be limited as far as possible. The use of a greater
number of quick simple test:s is far more beneficial and gives a better
indication of the range and potential variation of the material
properties which will be used in the road.
Digitised by the Open Scholarship Programme in support of public access to information, University of Pretoria, 2017

- 2.16 -
2.7 DISCUSSION
The earliest published work on gravel wearing course materials
indicated the importance of the particle size distribution. The
influence on riding quality of particles larger than 75 mm was
emphasised and the hardness of the particles was identified as .an
important property. Subsequent research into gravel wearing course
materials has generally pursued the importance of grading with little
emphasis on the importance of eliminating oversize material, although
many specifications limit the maximum particle size.
Even though Strahan (1922) noted the importance of the various
fractions of the sand component, few of the subsequent researchers
have looked at this aspect separately from the overall grading.
Netterberg (1978) differentiated calcrete gravel materials on the
basis of grading which resulted in different material requirements
depending on the fineness of the material.
Many of the older specifications rely heavily on Talbot's curves to
give maximum density and hence maximum stability. These curves use the
formula
p 100 (d/D)n (2.1)
where p is the per cent by volume of material passing sieve size d for
maximum particle size D and n an exponent which is about 0,5 for
maximum density (historically known as Fuller's maximum density
curve). Most specifications adopt upper and lower limits of n of 0,5
and 0,3 which produces a reasonably tight envelope. Analysis of the
specifications summarised in Appendix 2 indicates that for a nominal
19 mm material the coefficient for n for the 4,75 mm fraction varies
from 0,12 to 0,57. The values of n for the passing 0,075 mm fractions
vary from 0,19 to 0,48. A number of factors such as differential
particle densities, eap-grading and the non-sphe~ical nature of soil
particles however affect the applicability of these idealised grading
curves. The typical grading analysis is based on the percentage by
mass, therefore different particle densities in the various fractions
will result in spurious grading curves. It does, however, appear that
a move away from rigid maximum density curves is occurring in the more
Digitised by the Open Scholarship Programme in support of public access to information, University of Pretoria, 2017

- 2.17 -
recent specifications.
Along with the particle size distribution the plasticity index and
liquid limits have been traditionally specified for wearing course
gravels. Strahan (1929) noted the importance of the characteristics of
the clay minerals in the behaviour of the materials. Subsequent
specifications all included one or more of the plasticity index (PI),
the liquid limit (LL) or linear shrinkage (LS). All of the
specifications summarised in Appendix 2 contain at least the
plasticity index although the limits range from slightly plastic to a
PI of 30 per cent. Five of the 15 specifications allow for the effect
of various climatic conditions as discussed in Section 2.6. This
effect mainly takes into account the influence of the plasticity on
slipperiness and stability when wet. As the climatic regimes become
more arid, a higher plasticity is generally allowed. Problems may,
however, be encountered in locating higher plasticity material in the
arid areas. Frost (1968) investigated the use of the plasticity index
and liquid limit in wearing course materials and concluded that the
theoretical basis for their use was unjustified and that they should
be :Laplaced by strength tests. A major problem when comparing
plasticity indices is the different sample preparation techniques and
test methods used by various authorities which often results in
significantly different values (Netterberg and Paige-Green, 1988a;
1988b).
Of the 15 specifications in Appendix 2, five include limits for
material strength and five specify aggregate "durability"
requirements. The material strength requirements are generally in
terms of the soaked California Bearing Ratio (CBR) with a range of
prescribed values between 15 and 60 per cent (at various compaction
efforts). Frost (1968) suggested that a minimum CBR of 40 is generally
associated with good roads. The CBR value is strongly dependent on the
density at which it is penetrated during testing. This is often poorly
defined in che specifications but the lowest value specified (15 %) is
at a density of 93 per cent of modified AASHTO. The higher values are
probably tested at higher relative densities. The specification of the
higher CBRs (e.g. 45 at 93 per cent and 60 at 95 per cent) appear to
be excessive for the type of gravel generally used in unpaved roads.
Digitised by the Open Scholarship Programme in support of public access to information, University of Pretoria, 2017

- 2.18 -
Only 14 of the sections monitored during this project had CBR
strengths in excess of 45 at 93 per cent compaction. It is unlikely
that many more materials would have CBR strengths in excess of 60 at
the higher compaction effort. The NAASRA guide (NAASRA, 1980)
specifies a minimum CBR of 60 at the expected in-situ moisture and
density. The differences in sample preparation, compaction efforts,
test procedures and interpretation of the results of the CBR, however,
make direct comparison of results difficult (Netterberg and
Paige-Green, 1988a).
With regard to aggregate strength (actually hardness and abrasion
resistance) two of the specifications use the Los Angeles Abrasion
value (LAA) while two are in terms of the 10 % Fines Aggregate
Crushing Value (10% FACT). The AASHTO specifications limit the LAA
loss to a maximum of 50 per cent while the NPA specify a loss in the
range of 30 to 60 per cent. The maximum value for the loss is
specified in order to eliminate those soft materials which will
degrade and form potholes, or ravel. The minimum value for the loss
is, however, necessary to reduce the quantity of larger hard stones
which will not abrade and result in a rough, stony surface. The other
strength criterion used in the specifications is the 10 % FACT with a
range of specified values between SO and 135 kN.
Netterberg (1978) specified the hardness in terms of the Aggregate
Pliers Value (APV) and Aggregate Fingers Value (AFV), two simple field
tests requiring minimal apparatus.
Current specifications for unpaved wearing course materials have been
fully reviewed by Netterberg and Paige-Green (1988b) and are not
discussed further
specifications used
Chapter 7.5.
in this chapter. The applicability of existing
in southern Africa is, however, analysed in
The results of the experiment carried out in Kenya (Hodges et al,
1975) have been found not to be transferable to other areas (Beaven
et al, 1987). A major problem with the prediction models developed in
Kenya is that those for roughness and rut depth prediction were cubic
equations with traffic being the only factor. These models are
Digitised by the Open Scholarship Programme in support of public access to information, University of Pretoria, 2017

- 2.19 -
suitable for long term estimates of deterioration of roads with low
maintenance but are unsuitable for normal maintenance management
systems or short term predictions. An obvious omission in these models
is a reference to the material properties.
The Brazil (Visser, 1981a) and World Bank (Paterson, 1985) models are
based only on laterite and quartzitic wearing course materials. The
applicability to other materials has not been studied although, on a
network basis, the predicted gravel losses and roughness progressions
were found to correlate fairly well with those determined in practice
(Visser, 1981b).
A number of investigations into the performance of unpaved roads have
been carried out since the 1960's. Most of these have, however, been
restricted to tropical areas (Kenya, Brazil, Ghana, Bolivia) and their
findings are thus primarily applicable to higher rainfall regions
(many with no marked seasonal differences). The geological materials
in these regions are generally quartzitic or lateritic, typical of the
soils formed under tropical weathering conditions. Laterites are well
known for their non-classical geotechnical behaviour characteristics
such as self cementing properties and the difficulties with lime
stabilization. Southern Africa with its relatively thin soil cover,
extremes of climate with marked rainy seasons and variability of
material types formed under a number of weathering regimes (mainly
temperate to arid at present) thus requires material specifications
adapted to the local geological and climatological conditions.
2.8 STATISTICAL METHODS
The development of the prediction models and to a lesser extent the
specifications relied heavily on a statistical approach. The methods
used generally followed standard techniques as described in Moroney
(1951), Blommers and Lindquist (1965), Draper and Smith (1966) and the
Statistical Analysis System (SAS, 1985) manuals.
Standard statistical parameters such as the mean, mode, variance,
standard deviation and percentiles were liberally used in the
analyses. The probability distributions of the gravel loss and
Digitised by the Open Scholarship Programme in support of public access to information, University of Pretoria, 2017

- 2.20 -
roughness measurements were assumed to be normal i.e. unbounded in
both directions. This is a valid assumption in nearly every case with
almost symmetrical distributions around the mean.
The prediction models for roughness progression and gravel loss were
derived from multiple linear regression analyses. This technique
allows the investigation of any relationships between one dependent
variable and two or more independent variables. The least squares
method is used to estimate the "best" fit regression model, at which
point the vertical differences between observed and predicted data are
minimised. The value of the Pearson correlation coefficient (r)
squared is an indication of the goodness of fit with a value of one
indicating a perfect correlation and zero indicating no correlation.
The r-squared value should be interpreted in terms of the number of
data points used in the analysis. As the number of data points used in
the analysis increase, a lower value of the r-squared becomes
significant (GEIPOT, 1980). The root-mean-square-error (RMSE) is
defined as the square root of the ratio of the error variance and the
degrees of freedom (the difference between the number of data points
used in the analysis and the number of terms in the model). The
minimising of the root-mean-square-error in conjunction with the
maximising of the r-squared and F-value was used in the selection of
the best-fit model.
The analysis of variance which is the basis of the regression analyses
assumes homogeneity of variances. The analysis is robust with respect
to this assumption only if equal sample sizes are used. This was not
the case in the analyses for roughness and logarithmic transformations
were applied to force them to homogeneity for the analysis.
The F-statistic (the ratio of the explained and unexplained variances
(mean squares)) indicates the statistical significance of the overall
regression model. The F-statistic is compared with a theoretical
tabulated vehicle (done automatically in the SAS program) to indicate
the significance. Generally, if the F-value is large a highly
significant regression model is indicated.
Digitised by the Open Scholarship Programme in support of public access to information, University of Pretoria, 2017

- 2.21 -
A similar analysis, the t-statistic is indicative of the significance
of an individual coefficient in the presence of all other regressors
(independent variables). This is also carried out automatically in the
SAS program.
The 95 per cent confidence intervals were determined by assuming a
normally distributed population and taking two standard deviations
above and below the mean (Moroney, 1951). This is a standard
statistical procedure.
2.9 CONCLUSIONS
In this chapter, the background to the following topics was given:
• past research, both overseas and local,
• requirements of ideal wearing courses,
• existing specifications,
• statistical techniques employed.
Although extensive research has been
materials for unpaved roads since
carried out on wearing course
the early 1920's, inadequate
attention has been directed towards the influence of the geotechnical
properties of a material on its performance as a wearing course for an
unpaved road. Most of the recent studies have concentrated
specifically on the maintenance aspects of unpaved roads.
Numerous specifications (generally of obscure derivation) are
currently in use in southern Africa. Their reliability and
applicability in practice, however, have not been rigorously
quantified and there is little evidence to indicate that any of them
are performance-related.
The only performance-related studies fully documented are those by
Netterberg on the use of calcretes as wearing courses in southern
Africa.
Digitised by the Open Scholarship Programme in support of public access to information, University of Pretoria, 2017

CHAPTER 3
EXPERIMENTAL DESIGN, TESTING AND MONITORING
3.1 INTRODUCTION
The primary objectives of this project were to study the influence of
geotechnical properties on the performance of wearing course
materials, to improve existing material specifications for unpaved
roads and to develop deterioration relationships for southern African
materials and conditions. Fossberg (1963a), some 20 years prior to
starting this project, concluded that
" a survey of existing gravel roads, relating
performance to traffic, climate and soil conditions
"
deserved study in South Africa. The best way of carrying out this type
of project is by investigating a number of randomly selected
in-se~vice road$ wl1ich cover a full range of the major factors
influencing their performance. These factors are numerous but the
major ones include material properties, climate, traffic volume and
type, and geometries. This chapter describes the philosophy behind the
experimental design decisions and processes, the work programme
followed, the testing and monitoring carried out and the methods used.
3.2 EXPERIMENTAL DESIGN OF THE STUDY
To meet the objectives of the project the fieldwork was done in
accordance with a detailed experimental design. The experiment was the
first of this type of investigation in southern Africa and is
apparently the largest done anywhere in the world, with respect to the
number of different materials.
From previous studies on unpaved roads (Fossberg, 1963a; Hodges et al,
1975; Visser, 198la) the material properties, climate, traffic and
geometries are generally considered to be the major independent
variables (factors) affecting the performance of unpaved roads. The
Digitised by the Open Scholarship Programme in support of public access to information, University of Pretoria, 2017

- 3.2 -
Brazil study was almost entirely in one climatic region (humid) with
an annual rainfall of 1250 to 2000 mm (GEIPOT, 1980) and climate was
not one of the factors in the experimental design. Both the Kenya and
Brazil studies used factorial experimental designs successfully and no
advantage would have been gained by using any other type of
experimental design for this study.
A properly designed factorial experiment using typical South African
material properties, climatic zones and traffic volumes as the major
factors allows the results to be extrapolated over a much wider area
than the original experimental area, i.e. the results of a factorial
experiment in the Transvaal can be extrapolated to other parts of
South Africa, Botswana, Lesotho, Swaziland, South West Africa and
Zimbabwe which have similar climatic, material and traffic conditions.
In fact, the results from this study which covered a total area of
about 128 700 square kilometres can probably be applied to over
2 000 000 square kilometres south of the Zambezi and Kunene Rivers.
For this reason and the logistics of the monitoring travelling it was
decided to restrict the main project to the Transvaal. Even this
resulted in a total distance of more than 250 000 kilometres being
travelled during the project.
Recent work on deterioration and prediction models (Paterson, 1985)
re-evaluated the data from the Brazil study for the following reasons:
• Detailed time-series observations of condition over a period of up
to three years on existing sections of the road network were
obtained.
• The sections were selected by factorial design and cover wide
ranges of the factors.
• The measurements were systematic, frequent and reproducible.
The only drawback mentioned in the re-evaluation was the limited
number of materials. The present study was designed to conform with
the above reasons and, in addition, to include more levels for the
material factor.
Digitised by the Open Scholarship Programme in support of public access to information, University of Pretoria, 2017

- 3.3 -
3.2.1 Materials
The use of a factorial design requires the sub-division of each factor
into discrete ranges or levels. The obvious levels for the material
factor would be a number of even divisions of an important property,
such as plasticity index, in the range non-plastic to a plasticicy of
25 or 30 percent. This is impractical as it would have required either
the sampling and testing of all possible roads and then a selection of
the suitable ones or else a random selection of the required number of
roads. This latter procedure would in all probability result in a
disproportionate representation of factor levels unless an
uneconomically large number of roads was investigated.
The use of rock genesis (e.g. igneous, metamorphic, sedimentary or
pedogenic) as a factor level was contemplated but the variability of
the weathering products and residual material within any one group was
considered to be too extreme. The classification system proposed by
Weinert (1980) grouped rock types by their weathering products and
geotechnical behaviour,
the
irrespective of
acid cryscalline example, within
metamorphic rocks which produce similar
similar climatic regimes, are grouped.
contains nine material groups as follows:
their genesis. Thus, for
group, both igneous and
weathering products under
This classification system
1 Basic crystalline rocks - e.g. amphibolite, basalt, dolerite
2 Acid crystalline rocks - e.g. felsite, gneiss, granite
3 High silica rocks - e.g. chert, quarczite, hornfels
4 Arenaceous rocks - e.g. arkose, sandstone, mica schist
5 Argillaceous rocks - e.g. shale, mudstone, phyllite
6 Carbonate rocks - e.g. dolomite, limestone, marble
7 Diamictites - e.g. tillite
8 Metalliferous rocks - e.g. ironstone, magnetite, magnesite
9 Pedocretes - e.g. calcrete, ferricrete, laterite
Of these groups, diamictites and metalliferous rocks are of minimal
importance in the construction of unpaved roads in the Transvaal due
to their limited occurrence, and high transportation cost in the case
of the metalliferous rocks. Diamictites are important construction
Digitised by the Open Scholarship Programme in support of public access to information, University of Pretoria, 2017

- 3.4 -
materials in Natal, but it was considered that the material groups
selected would adequately cover the range of properties exhibited by
typical diamictites. The natural weathering process of carbonate rocks
results in their almost total dissolution with a chert-rich residue
which is used in unpaved road construction. This chert is classified
as a high silica rock. Thus, six important material groups were
incorporated in the analysis in the Transvaal, namely basic and acid
crystalline, high silica, arenaceous and argillaceous rocks and
pedocretes.
3.2.2 Climate
The choice of levels for the climatic factor was initially thought to
be best based on rainfall. The Kenya study concluded, however, that
for an annual rainfall of between 400 and 2 000 mm the performance of
unpaved roads was independent of rainfall (Hodges et al, 1975). While
the rainfall in the Brazil study was within this range it was expected
that areas with an annual rainfall of less than 400 mm would be
included in this study. A second climatic indicator which has been
used in local paveci road performance studies (Emery, 1985),
Thornthwaite's moisture index (Im) (Thornthwaite, 1948), was
considered. The limited range of this index in the Transvaal and the
lack of well-defined, performance-related, discrete levels weighed
against its use. Weinert's N-value (Weinert, 1980) was considered to
be the most suitable climatic indicator for the following reasons:
• The N-val~e is based on annual rainfall and evaporation during the
warmest month (mostly January in southern Africa) and
characterises the climate into discrete geotechnical provinces.
The N-value can be easily determined for any site by the following
equation:
N - 12 E. /P J a
(3.1)
where E. is the computed evaporation from a shallow freewater J
surface during January (or the warmest month) and P is the total a
annual precipitation.
• The N-values of 2, 5 and 10 are distinct physiographical
Digitised by the Open Scholarship Programme in support of public access to information, University of Pretoria, 2017

- 3.5 -
boundaries (Weinert, 1980).
• The weathering products of the different groups used as levels for
the material factor are unique for the N-value province in which
the weathering occurs (Weinert, 1980).
The mean annual rainfall and Thornthwaite Index were, however,
determined for each test section and included in the final analysis.
3.2.3 Traffic
The traffic volume for the various roads was available from existing
Transvaal Provincial Administration records (TPA, 1982). It was
initially decided to have two traffic levels, less than 150 vehicles
per day (vpd) and greater than 150 vpd based on a study of the traffic
counts. However, when the possible test sections were identified it
was found that a split at 100 vpd was more realistic in the rural
areas being investigated. During the field work, however, it became
apparent that the traffic counts were not all totally accurate, and
counts on or near the actual sections were carried out. These
indicated that the original counts under-estimated the traffic for
many of the roads.
A problem with the traffic counts is that they are generally in terms
of vehicles per day with no differentiation by direction. In addition
seasonal effects such as the extra traffic during the crop harvesting
or holiday seasons are difficult to estimate. These problems are
common to most research into roads and it is standard practice to use
the traffic in both directions when analysing results (Hodges et al,
1975; Visser, 198la). The HDM 3 model (World Bank, 1985) classifies
the traffic into nine categories (not subdivided by direction), but
this was considered extreme for a study of this nature. Traffic on
unpaved roads is by nature very variable, very seasonal and
directional and if the categories are to be used in the analyses, an
estimate of the load should be used. Anything more than average daily
traffic and percentage of heavy vehicles (over three tonnes) was
considered an unnecessary accuracy
parameter.
for an inherently variable
Digitised by the Open Scholarship Programme in support of public access to information, University of Pretoria, 2017

- 3.6 -
3.2.4 Design
A factorial design similar to those used in Kenya and Brazil was used
with the actual test sections selected in a stratified and clustered
manner as follows:
(a) Suitable areas of each of the climatic regions were selected with
the logistics of the project in mind. The primary reason for this
was to reduce monitoring distances to a practical minimum.
(b) Roads conforming with the required material and traffic
characteristics were identified. This was done by obtaining a list
of about six roads (which were unlikely to be regravelled or
upgraded in the following three years) for each of the material
and traffic combinations from the Regional Engineers in each of
the relevant climatic regions.
(c) The traffic counts were confirmed against the available records.
(d) Each of the roads was then visited and those roads which had
suitable sections were noted. This suitability was based on the
presence of a straight, flat, homogeneous section of road 300
metres long (Section A). At least 300 metres of reasonable
approach was required at each end in order co reach 80 km(h during
roughness monitoring. In addition a 300 metre section of road on a
hill or horizontal curve was selected as close to the straight
section as possible in order to investigate the influence of the
road geometries (Section B). It was not always possible to satisfy
all these criteria and some roads therefore only had an A section
or else had an A section with a slight gradient or curve, although
this was kept to a minimum. This gradient or curvature was
recorded and used in the analyses.
(e) 'rhose sections on a convenienc monitoring route were finally
selected for the experiment and resulted in the experimental
design matrix shown in Figure 3.1. Each of the cells of the matrix
contains a road which satisfies each set of combinations. No
suitable roads constructed of arenaceous materials could be found
Digitised by the Open Scholarship Programme in support of public access to information, University of Pretoria, 2017

I 2 3 4 5 6 SUR FACING MATERIAL ACID BASIC HIGH SILICA ARENACEOUS ARGILLACEOUS PEDOCRETE CRYSTALLINE CRYSTALLINE
TRAFFIC 576 796 625 [>< 210 268
CLIMATE (98/39) (32134) ( 57144~ (92/50) (90/36)
< 100 1298 421 1008 vpd (25/16) (89/63) (37135)
1560 383 P8-4 210 1110 N<2 > 100
{333175) (100/28) (111114) (246/34) (223/25)
vpd 219 1266 (115/38) ( 108/36)
1439 1561 1886 178 1342 1717
< 100 C ~/20 I (61/20) (69/13) (26/25) (53/15) ( 31 I 27 ) vpd 942
( 18/7) 2<N<5
024 1161 420 522 771 327 I I
>100 (427/17) ( 200/10) ( 197/20) (17 3/14) ( 236/29) (395/22)
vpd 685 685 P175-l (127/15) (132/14) (148/45)
017 437 1479 1141 508 167 ! (58/25) (92/211 ( 20/26) (46/24) (51/10) ( 56/15)
<100 433 14 508 1216 vpd (53/8) ( 22/27) (61/13) (11/22)
N>5 502 912 509 611 146 1401
>too (112/13) ( 127120) ( 156/16) ( 100/23) (105/15) (200/50)
611 vpd ( II 0/30)
------· -·- ------ ---·-·--·---
~TE : THE NUMBERS IN EACH CELL ARE THE ROAD NUMBERS WITH THE NUMBER OF VEHICLES/DAY AND PERCENT .. i EAVY IN PARENTHESES
FIGURE 3.1
EXPERIMENTAL DESIGN MATRIX FOR SAMPLING OF UNPAVED ROADS IN THE TRANSVAAL
w . .._J
Digitised by the Open Scholarship Programme in support of public access to information, University of Pretoria, 2017

- 3.8 -
where the N-value was less than 2. The road numbers and the
traffic counts used for the design are shown for
addition 14 of the cells contain duplicate sections
Thus any differences between replicate sections
behave identically) can be attributed to those
which make up experimental error.
each cell. In
(replicates).
(which should
random factors
As there was some personal selection involved in the test site
location, some of the randomness was lost. However, as no existing
information was available for local conditions a· great deal of time
and money would have been required to obtain enough data to permit a
completely randomised design.
To simplify section identification and data processing, the sections
were numbered from 1 to 49 (with an A and B section for most) for
monitoring and analysis purposes (Figure 3.2). During the course of
the project the following sections became unsuitable and monitoring
was abandoned:
Section 23 A - The seccion was incorporated into a bridge approach and
sealed before monitoring commenced.
Section SA and B - The road was regravelled with a different material
- April, 1985
Section 22A and B - The road was reconstructed and upgraded - May,
1986
Section 34A and B - The road was upgraded and sealed - August, 1986
Section 48A and B - The road was regravelled with a different material
- September, 1986
In order to extend the applicability of the results of the study as
far as possible it was decided to carry out a satellite experiment in
South West Africa (Namibia). The experiment was designed on the same
basis as that in the Transvaal but as the N-value was about 10 for all
the sections no climatic factor was useci. The design matrix for this
experiment is shown in Figure 3.3. The monitoring was carried out by
the Department of Transport in Windhoek (SWAAR) under the supervision
of the National Institute for Transport and Road Research (NITRR). All
the results were sent to NITRR for analysis. The Weinert material
Digitised by the Open Scholarship Programme in support of public access to information, University of Pretoria, 2017

SURFACING MATERIAL I 2 3 4 5 6
TRAFFIC 26 18 28 ~~~~~ti 21 27 .,~,r1~;;_~
CLIMATE < 100 29 22 ·~t{~~!l:f.~ 19 v pd ~~~ .. ;r~-.•5;:~~.~
i.J::tst~:'ta~:t~>.· N < 2 > 1 0 0 2 4 3 0 2 3 ~'!$~~~,~~~:\ 2 0 I 6.
v P d 2 5 ~.i..:,~~~~;~ 3 I ,-::;, \·"l't~<~''"'-"··w ·~·l~.:),•t...-t'&~ I
< I 00 9 7 6 I I I 3 I
vpd 13 '
2<N<5
>100 10 8 5 12 2 4
vpd 14 15 32 w . 1.0
< I O O 4 3 34 4 5 4 0 3 7 4 6
vpd 49 47 35 44
N > 5 42 4 I 48
>100 36 39 33 vpd 38
L------~----------L....______- ----------------- ------ -- ----- ----------- ------~-
NO SUITABLE SECTION FOR NUMBER 17 COULD BE LOCATED
FIGURE 3.2
IDENTIFICATION NUMBERS OF TEST SECTIONS IN THE TRANSVAAL
Digitised by the Open Scholarship Programme in support of public access to information, University of Pretoria, 2017

~ I 5
ACID CRYSTALLINE ARGILLACEOUS c
901* 904
MR052 MR048
50/15 35/15 ~ 50 vpd
902
Dl9 58
10/15
903 908
MR049 MR057
100/15 67/9
91o""*
MR039 >50 vpd 120/15
913
MR091
120/15
11 LATER SECTION 918 AND 919 ADDED
**RECONSTRUCTED 916 AND 917
FIGURE 3.3
6 7
PEDOCRETE CALCAREOUS MIXTURE
905 * 907
MR048 Dl535
35/15 20/15
906 909
Tl5/l DIB05
40/17 35/15
912 911
MR091 MR039
120/15 120/15
915 914
MR055 MR056
90/15 120/15
DESIGN MATRIX OF SOUTH WEST AFRICAN EXPERIMENT SHOWING
IDENTIFICATION NUMBERS, ROAD NUMBERS AND TRAFFIC COUNTS
f vpd / % heavy)
I
w 0
....... 0
Digitised by the Open Scholarship Programme in support of public access to information, University of Pretoria, 2017

- 3.11 -
classification was used for acid crystalline and pedogenic materials,
and a seventh group, calcareous mixtures was included. The behaviour
of this material is probably governed by the calcareous content,
although a large percentage of shale and hornfels is common. It is a
commonly used material in South West Africa and was thus treated as a
separate group.
A total of 91 sections in the Transvaal and 19 sections in South West
Africa was investigated. A summary of the section characteristics is
given in Table 3.1.
The scope and range of the parameter values of the Transvaal and SWA
experimental sections is compared with those for the Kenya and Brazil
studies in Table 3.2. Maps showing the locations of the Transvaal and
South West African sections are provided (Figures 3.4 and 3.S
respectively).
3.3 WORK PROGRAMME
.3el:ween January, 1984 and August, 1984 each test section ~o~as visited.
The 300 metre sections were measured out and carefully marked with
numbered steel plates which were hung on adjacent fences at the start
and end of the sections. The horizontal curvature of the curved
sections was measured using a prismatic compass.
In-situ testing of the wearing course and subgrade materials was
carried out at each end of the section just outside the section so as
not to cause any potholes or roughness and a bulk sample (about SO
kilogrammes) was taken. At the same time a SO metre section was laid
out for gravel loss measurements (Chapter 3.4.6) and a gravel loss
survey was carried out.
Monitoring of the test sections commenced during November, 1984 in the
Pretoria area and in January, 1985 monitoring of all the sections on a
three weekly basis was initiated. During each monitoring trip riding
quality measurements were taken, rut depths and corrugations were
measured and a full condition description was made. Every six months a
gravel loss levelling survey was carried out on each section.
Digitised by the Open Scholarship Programme in support of public access to information, University of Pretoria, 2017

TABLE 3.1: CHARACTERISTICS OF EXPERIMENTAL SECTIONS
Transvaal South West Africa
-Variable X a m M X a m M
~o. of sections 91 91 19 19 Grade (%) 1,5 2,4 0 8 0,5 0,6 0 2 Radius of curvature (m) - - 118 <0 All straight sections N-value 3,8 2,1 1,3 8 10 0,2 9 10 Thornthwaite Index (Im) -6 17 -24 60 -35 0 -35 -35 Rainfall {mm/yr) 648 172 375 1100 339 25 300 375 Average daily traffic 94 87 12 427 74 45 10 150 No. of cars/day 72 76 7 354 63 38 9 128 w No. of trucks/day 28 17 l 73 11 7 2 23 .... Road width (m) 9,1 1,9 5 14 7,5 1,6 6 10 N
Trafficked width (m) 6,0 1,4 3 10
x = mean
a = standard deviation
m = minimum
M = maximum
Digitised by the Open Scholarship Programme in support of public access to information, University of Pretoria, 2017

TABLE 3.2: COMPARISON OF SECTION DATA FOR KENYA, BRAZIL, TRANSVAAL AND SOUTH WEST AFRICA STUDIES
Total no. of sections No. of gravel roads No. of earth roads Period of observation (years) Length of sections (m) Road width (m) Gradient (%) Horizontal curvature (degrees/km) Traffic volume (vpd) Truck Volume (vpd) Road roughness (QI counts/km) Surface material
Annual rainfall (mrn/year) Evapotranspiration balance I
(Thornthwaite Index, 1948) m Climate
N-value
Kenya
46 37
9 2
1000
0 to 5,5 0 - 200 42-403 12-136 52-221 Lateritic nodular;
quartzitic rounded;
Volcanic angular;
coral angular 400-2000 -30 to 0
semi-arid to dry subhumid ?
Sources: Brazil : GEIPOT (1981); Paterson (1985) Kenya : Hodges et al, (1975)
Brazil
48 37 11 2,5 320-720 7 to 11 0 to 8,2 0 to 143 18-608 5-477 20-377 Lateritic nodular;
quartzitic subangular;
clayey silts
1200-2000 35 to 100
moist subhumid to humid ?
Transvaal
91 91
0 > 2 yrs 300 5-14 0-8 0-500 12-388 1-113 12-330 Acid crystalline basic crystalline high silica arenaceous argillaceous pedocretes
375-1100 -24 to 60
dry semi-arid to moist humid
1,3-8
SWA
19 18
1 3 yrs 300 6-10 0-2 0 10-150 2-23 18-195 quartzitic calcrete calcareous mix shale
300-375 -55 to -45
dry arid
9-10
w ..... w
Digitised by the Open Scholarship Programme in support of public access to information, University of Pretoria, 2017

26 °E
24°5
BOTSWANA ,.,..-' ... ....
/ /
/
,~I .....
I I N > 5
28°E
N=5
N = 2-5
II 12 • NYLSTROOM • X
I; I WA~M~ATHS el3
7 • •a
X
PIETERSBURG
I
TRANSVAAL
--.... __ _
26 °5
CAPE I I
I ,.J
~ ...... _, 1 •4e
I OELAREYVILLE I )(
I •4~ I .46
e47
36 xj 4 "• e37
I I
//SCHWEIZER-
/ RENEKE.
I •42
• 43
41 39. •3? . .38. WOLMARAN
STAO
LICHTENBURG
, I
' e34 1 ,. .... /
/
28 °S / I
•44 ,.-X /
/ /
I .... I
·" 3 • ~ .2x
6 ' PRETORIA e1 •• 5
• BRONKHORSTSPRUIT
ANNES BURG
e32
)( POTCHEFSTROOM /"'\ _.,.,. .... -.,.. I
/ ,-~--__ r-~'-/ ...... ,, -' , ,_,...~ J \
' -, ..........
\
" ORANGE FREE STATE \ ,.. ..,. \."'\
X= RAINFALL STATIONS (FIGURE 3.6) "') , ... I \
FIGURE 3.4 /
TRANSVAAL TEST SECTION LOCATIONS
30 °E
N=2
N
t
N < 2
23 x••p
N=2
LYOENBURG \ )I • • SABlE
20 24
• • • • 19 21 22
REST
25
)1tN\SPRUIT
2:·llt \ ,'"', .Is
/ ' ' '
I I I I I I \ I I I I I I I I
--
27 • .28
X I I I
/ I
/ I
/
I L.-.
' l ' \
.,.'""'- -- .. --....... \
NATAL
SWAZILAND
\ I I I
I \ \ \ I I
r--' I I
- I ...... :1 ------ ,.. __ ..... ----""'
0 20 40 60 80 100 ~----~---j____--~--~----~
km
I : 2 500 000
w . ,_. ~
'
Digitised by the Open Scholarship Programme in support of public access to information, University of Pretoria, 2017

16°E 18°E 20°E
N < 10
I ---------220S N > 10--~~~--l-------~~~~~~-------------t-------------------------------:-SOUTH WEST AFRICA
(NAMIBIA) 1 STEINHAUSEN
24°5
TROPI!; OF CAPRICORN
go2 • f> WINDHOEK
•go3
907 •
OOROABISI •g04 e905
• (gig) 906 918
I REHOBOTH
FIGURE 3.5
914 90s.. e915
(916) IGOBABIS 917 g10• eg12
gog• • •g13 311
N
1 SOUTH WEST AFRICAN TEST SECTION LOCATIONS
I I I I
' I I
---- -t--1 I I I I I
BOTSWANA
o 20 40 GO eo 100
km
I: 2 500 000
w
..... Vl
Digitised by the Open Scholarship Programme in support of public access to information, University of Pretoria, 2017

- 3.16 -
During June, 1985 all of the TPA road inspectors involved in the
project were requested to reduce the routine grader maintenance to not
more than once every four months, in order to obtain as many
measurements per grading cycle as possible. During January and
February, 1987, the final monitoring trips were carried out and at the
same time a quantitative estimate of the stoniness and skid resistance
was obtained. Samples of the wearing course material were collected
for additional testing.
When the final report stage of the project was reached (August, 1988)
an extended private trip was made through the northern Cape and South
West Africa to investigate unpaved roads from a tourists point of
view. This trip involved in excess of 2 000 km on unpaved roads with a
modern, compact, family saloon car (1985 Ford Escort) towing a four
metre long low-profile caravan (the minimum ground-clearance of the
combination was 125 mm). The point of view thus obtained was totally
different to that obtained during monitoring of the experimental
sections in a CSIR station wagon.
3.4 TESTING AND MONITORING TECHNIQUES
3.4.1 In-situ testing
In-situ testing involved mainly density, moisture and strength
investigations. The normal sand replacement density test (NITRR, 1979)
was considered to be a time-consuming, complicated test for what was
considered would be a relatively variable parameter. Instead, a simple
sand replacement test (Cernica, 1980) was chosen and duplicate tests
were done on the wearing course while a single test was done on the
subgrade which was generally finer grained and more homogeneous.
Normal oven-dried volumetric moisture content determinations were
carried out. Dynamic Cone Penetrometer (DCP) tests and Clegg Soil
Impact Tests (CSIT) followed the usual procedures (Kleyn, 1975 and
Clegg, 1983 respectively).
Two samples of both the wearing course and subgrade materials, one of
about five kg for indicator tests and the other of about 45 kg for
compaction and strength tests, were collected at the beginning and end
Digitised by the Open Scholarship Programme in support of public access to information, University of Pretoria, 2017

- 3.17 -
of each section. All the material excavated from the sample holes was
collected except for those stones larger than 150 mm, which were
discarded. These stones were considered to be unnecessary for testing
and often comprised a disproportionate quantity of the sample. This
problem with the sampling and testing method as outlined in TMH 1
(NITRR, 1979) has been closely examined and a new sampling and testing
procedure proposed (Paige-Green, 1988b).
The proportion of stones with an average diameter larger than 50 mm
was estimated by sweeping an area of the road . at each end of the
sections and drawing a circle of one metre radius. The number and size
of all stones larger than 50 mm in this circle was determined.
3.4.2 Laboratory testing
The laboratory testing generally followed the Standard Methods for
Testing Materials (TMH 1; NITRR, 1979). The tests included Atterberg
Limits, particle size distribution (sieve and hydrometer), compac~ion
characteristics and soaked and unsoaked California Bearing Ratio
(CBR). The only modifications to the test methods were for the
compaction and CBR tests where the crushed oversize material (larger
than 19,0 mm) was not added to the sample. The addition of this
material resulted in a very coarse grading which would not compact
properly. This problem, as well as the problems caused by substituting
the oversized fraction with finer material is well known (Beaven et
al, 1987). The laboratory strength should therefore only be taken as a
guide to the actual strength. As the field and laboratory gradings,
compaction and moisture content are so different the applicability of
the test is questionable. In the absence of nothing better the results
must be used. As the normal specified compaction for wearing course
materials is about 95 % Modified AASHO density, Proctor compaction was
used in the laboratory in order to save time. Other tests carried out
were the aggregate pliers value (APV) and aggregate fingers value
(AFV) (Netterberg, 1967), the cone liquia limit (Sampson, 1986), field
moisture equivalent (AASHTO, 1982), and a modified British Standard
linear shrinkage. This test was modified to be used as a possible
quick, simple field indicator test and consisted of material passing
Digitised by the Open Scholarship Programme in support of public access to information, University of Pretoria, 2017

- 3.18 -
the 40 mesh sieve being mixed at the field moisture equivalent and
then oven dried in a British Standard shrinkage trough.
Further problems were encountered with the interpretation of the
particle size analyses. The TMH 1 method (Test Al(a); NITRR, 1979) was
followed where the calculation of the cumulative percentage passing is
based on the total mass of the test sample. However, when oversized
material is present this can lead to extreme distortion of the values
determined (Paige-Green, 1988b). Depending on the proportion of
material larger than 50 mm, comparison of differ~nt gradings becomes
meaningless. All the results were therefore recalculated as a
percentage of the material passing the 37,5 mm sieve (Standards
Association of Central Africa, 1971).
A full X-ray diffraction analysis was carried out using the standard
NITRR method (Paige-Green, 1978). The major primary and secondary
constituents of each wearing course gravel were identified and an
approximate estimate of the quantities of each was made. The problems
of quantitative X-ray determination of soil clays are well known
(Carroll, 1970) and are semi-quam:itative at best (Karathanasls et al,
1982). This is mainly because of the variable crystallinity and
chemical composition of soil clays. Direct comparison of peak heights
or intensities is not possible due to the variation of the mass
absorption coefficients of the clay minerals and the use of internal
standards (Norrish and Taylor, 1962) requires considerable input by
highly-trained personnel. No petrographic examinations were carried
out because of the extreme variability of the materials and the
problems of preparing thin sections.
For this work semi-quantitative estimates were obtained by comparing
the diffraction traces for each section with a number of standard
traces obtained from composite samples made up in the laboratory of
standard minerals.
A summary of the stratigraphic units and lithology of the materials
included in the experiment is provided (Appendix 3). All of these
materials can be classified as highly to completely weathered rock
(AEG, 1976) and many are mixtures of residual material, transported
soil and/or pedogenic materials.
Digitised by the Open Scholarship Programme in support of public access to information, University of Pretoria, 2017

- 3.19 -
3.4.3 Roughness measurement
The roughness of the sections was determined using a number of
vehicles fitted with Linear Displacement Integrators (LDI). The LDI
was developed at NITRR during the 1970s (Van der Merwe and Grant,
1982) and is a simple, robust, response-type roughness measuring
device which integrates the movement between the back axle of the
vehicle and the passenger compartment above it. Each LDI is calibrated
over a number of standard control sections of known roughness (Visser
and Curtayne, 1982) and a calibration equation is obtained relating
the LDI output to the Quartercar Index (QI). This Quartercar Index
(Sayers, l98S) is determined from routine rod and level surveys of the
control sections (Visser, 1982). Although the roughest calibration
section has a QI of only 79 counts/km the linearity of the QI-LDI
relationship has been confirmed for values up to 210 counts/km
(Visser, 1983).
Before and after each monitoring trip the calibration of the LDI
vehicle was tested on three of the control sections and the results
checked against control charts for the mean and range of cne resulcs
from five runs. Any change in the suspension, shock-absorbers or wheel
balance was timeously identified and corrective action taken.
Periodically, as the suspension of the vehicle aged it became
necessary to recalibrate the vehicle and a new calibration equation
was obtained. As the QI is a speed dependent parameter it should be
determined for different speeds by calibrating the vehicle at those
speeds. This is, however, impracticable each time the vehicle is
calibrated and as only a few measurements were taken at SO km/h
(LDISO) it was decided to simply use a correlation between those taken
at 80 km/h (LDI80) and the SO km/h readings which were taken. The use
of two correlation equations to determine the roughness in terms of QI
amplifies any errors. Visser (198la) however noted that this procedure
is preferable to extrapolating a single correlation curve based on a
number of relatively smooth sections to the rougher gravel seccions.
The readings obtained at SO km/h (MMSO) from the Mays Meters (the
instruments used in Brazil which were similar to LDI's) were corrected
to 80 km/h (MM80) using the following equation (Visser, 198la):
Digitised by the Open Scholarship Programme in support of public access to information, University of Pretoria, 2017

- 3.20 -
MM80 - 275 + 1,04 MM50 (3.2)
The r-squared value for this equation is 0,81 with 95 per cent
confidence limits of ± 2 934 mm/km. Paterson (1985) subsequently
modified this equation by using a non-linear model:
MM80 = 2 22 MMSo0 •831 • (3.3)
(r2 = 0,75; n = 76S4)
The linear regression equation obtained for this work was:
LDI80 - 0,311 + 0,807 LDISO (3.4)
(r2- 0,76; n = 1556; RMSE = 0,70)
A non-linear transformation as used by Paterson (1985) resulted in the
following equation:
LDI80 = 0 963 LDI50°• 934 '
(3.5)
(r2 = 0,83; n = 1555; logRMSE- 0,196)
The logarithmic transformation results in an improved r-squared value,
with an exponent almost equal to unity, indicating a small deviation
from a linear relationship. Equation 3.5 is, however, better
correlated than the linear model (3.4) and those of Visser (198la) and
Paterson (1985) (equations 3.2 and 3.3 respectively). Model 3.5 was
used to convert all measurements at SO km/h to values at 80 km/h where
these could not be obtained by direct measurement.
It is interesting to note that the predicted roughness at 80 km/h from
Model 3.2 is greater than at SO km/h whereas the roughness at 80 km/h
is always less than at SO km/h for Model 3.4. The reason for this is
not clear as Model 3.3 (the logarithmic transformation of the data
used in Model 3.2) also shows the roughness at 80 km/h to be less than
at 50 km/h (for values of MM50 gretaer than 100). Higher roughnesses
Digitised by the Open Scholarship Programme in support of public access to information, University of Pretoria, 2017

- 3.21 -
at lower speeds are general for unpaved roads, but for smooth asphalt
roads the reverse may occur (Paterson and Watanatada, 198S).
Each test section was monitored every three weeks as far as possible.
Only occasional mechanical or electronic problems interfered with this
routine during the project. Initially each section was tested at 80,
SO and 32 kmfh with the actual result being the average of three runs
in both directions. Some sections (e.g. very sharp corners) could not
be tested at 80 kmfh and were tested at SO and 32 kmfh only. The tests
at 32 kmfh were carried out in case any of the. sections became so
rough that testing at 80 or SO kmfh became too dangerous or was likely
to damage the vehicle or LDI system. After the first couple of
monitoring trips the measurements at 32 kmfh were discontinued as they
were time consuming and were likely to be of little use. In June, 1986
testing at SO kmfh was also omitted if the section could be tested at
80 kmfh. No sections became so rough that they could not be tested at
80 kmfh, even after no maintenance for up to S months.
3.4.4 Rut depth and corrugation measurement
During each monitoring trip the rut depth was measured. Initially this
was done with a two metre straight edge and a wedge. This method was
soon found to be unsuitable for gravel roads due to the stones in the
wearing course which stopped the straight edge from lying flush with
the surface, and the variability of the wedge readings. An AASHO type
rut depth gauge was subsequently used (Visser, 198la). Rut depths were
measured in obvious wheel tracks (i.e. where no loose material
occurred) every 60 m along the section. Initial analyses showed no
trends and minimal rutting and as these measurements
substantial amount of time, testing was discontinued after
198S unless obvious ruts were present.
took a
September,
Corrugation depchs were measured with the rut depth gauge while the
spacing and width were measured with a ruler or tape. An estimate of
the percentage of the length of the road in each direction affected by
corrugations was made.
Digitised by the Open Scholarship Programme in support of public access to information, University of Pretoria, 2017

- 3.22 -
3.4.5 Condition description
A full condition description of each section was carried out during
each visit unless the section was wet (only drainage, slipperiness and
trafficability were recorded) or had recently been graded. The
description followed TRH 6 principles (NITRR, 1980) using a five point
classification for both severity and extent (Paige-Green, 1983;
1988a). For severity a rating of one implied excellent condition while
a rating of five indicated a totally unacceptable condition.
The following conditions were rated:
Dust -
Stoniness -
Potholes -
Cracks -
Loose material -
Surface drainage -
Slipperiness when dry -
Slipperiness when wet -
Wet weather trafficability -
In addition the largest stone found was measured, and the maximum
depth and diameter of the pothole which had the biggest influence on
the roughness of the section was recorded.
3.4.6 Gravel loss surveys
The gravel loss surveys determined the average change in height of the
surface of the levelled section with respect to a set of bench marks.
These bench marks were installed during the initial sampling trips and
consisted of 500 rnm long mild steel rods hammered into the subgrade
and set in concr~te about 150 rnm in depth and diameter. By using
shallow bench marks it could be assumed that any subgrade movement,
either due to expansive clay or soil compaction would have the same
effect on the bench marks as the wearing surface and would not affect
the gravel loss measurements. Benchmarks out of the section used over
active clays in Ethiopia (Beaven et al, 1987) were subject to
Digitised by the Open Scholarship Programme in support of public access to information, University of Pretoria, 2017

- 3.23 -
significant movement, which resulted in the measurements being almost
unusable. Movements of this type which affected the readings would be
indicated by significant differential movement of the bench marks,
none of which occurred during the project. The installation of three
bench marks in each section allowed the identification of any bench
mark which moved relative to the other two, whether through subgrade
movement or disturbance by a grader or any other means.
The gravel loss sections were SO metres long with two bench marks at
the edge of the trafficked portion of the road at. the beginning of the
section and one SO metres away, at the left hand edge of the
trafficked portion of the road. During the surveys a SO metre tape was
stretched along the section and the level survey was done on a S metre
long by 1 metre across grid.
3.4.7 Skid resistance tests
Initially estimates of the slipperiness in both the wet and dry
condition were obtained during routine monitoring from the general
fseling of safety at 80 kmfh. Towards the end of the project it was
decided to actually quantify this as far as possible. A "MOTOMETER"
brake efficiency meter was obtained and locked-wheel skid tests were
carried out from SO kmfh. As this device measures deceleration the
actual speed does not affect the results assuming the road/tyre
friction remains constant. This was confirmed by doing a few stops
from different speeds. As no literature could be found for this type
of test on unpaved roads a number of tests were done on various
surfaces for comparative purposes. These results are discussed in
Chapter 4.8.
Deceleration measurements of the test sections were done in the wheel
tracks in both directions and also in areas of loose material typical
of the various sections. Unless it was coincidentally raining at the
time of testing it was logistically not possible to test the sections
for wet weather slipperiness. However attempts were made to test as
many of the sections as possible in the rain.
Digitised by the Open Scholarship Programme in support of public access to information, University of Pretoria, 2017

- 3.24 -
3.5 SUMMARY OF RESULTS
Table 3.3 contains a summary of the laboratory and in-situ test
results for the Transvaal and South West African experimental
sections. A full list of the test and monitoring results has been
produced separately (Paige-Green, 1989).
It is evident that the site selection procedure in the Transvaal
resulted in a reasonably good range of material properties being
incorporated into the experiment. The plasticity index varied from
non-plastic to 33 but the average of 7,5 is indicative of the bias
towards low-plasticity (non-slippery) materials during material
selection for unpaved roads. The site selection procedure has
resulted in relatively few sections with very high plasticity
these materials are seldom intentionally used for unpaved roads
then only for short sections of
0,425 mm (40 mesh) sieve varies
the roads. The percent passing
from 15 to 93 and includes a
thus
but
and
the
good
range of fine to coarse materials (also shown by the grading modulus
range). The range of soaked CBR (Proctor compaction) varies between
zero and 99 with a mean of 26.
Comparison of the in-situ material properties of the test sections
with the TPA 1973 specifications (those effective at the time most of
the roads were built or regravelled) and the 1980 and 1983
specifications (there is no difference between the two) was carried
out. The compliance of the results with the specifications is shown in
Table 3.4.
None of the sections complied with the requirement for
maximum size, every section having stones larger than 50
minimum average maximum size of 132 mm and a maximum
Approximately half of the materials comply with the
in place
mm, with a
of 669 mm.
minimum GM
requirement of 1,5 and the 1973 grading envelope requirements. Most
of the macerials not complying are too fine although only 9 per cent
are too fine for the 1980/83 grading modulus (GM) relaxation of 1,2
with special approval. It should be noted that the TMHl method of
particle size analysis (as used by the TPA) results in a higher
grading modulus than a value calculated on the fraction passing the
37,5 mm sieve. The presence of a few stones of about 50 mm diameter
Digitised by the Open Scholarship Programme in support of public access to information, University of Pretoria, 2017

TABLE 3.3: SUMMARY OF TEST RESULTS FOR TRANSVAAL AND SOUTH WEST AFRICA
Property n
Liquid limit (%) 201 Plasticity Index (%) 201 Bar linear shrinkage (%) 201 Modified linear shrinkage (%) 201 Laboratory maximum size (mm) 201 Passing 26 mm sieve (%) 201
4,75 mm sieve (%) 201 0,425 mm sieve (%) 201 0,075 mm sieve (%) 201
Grading Modulus 201 AFV (%) 168 APV (%) 168 Plasticity Product
3 201
Maximum dry density (kg/m ) 201 Optimum moisture content (%) 201 Soaked CBR (%) 201 CBR at OMC (%) 182 Layer thickne~s (em)
3 201
In situ density (kg/m ) 201 In situ moisture (%) 201
X
27 7,5 3,9 3,1
30,4 96,3 77,2 43,7 22,4 1, 72
65 22
320 1962 11,7 25,5 33,7
13 1924
5,3
Plasticity Product = % passing 0,425 mm x PI.
Transvaal 0
7,5 5,2 2,7 2,4
14,4 6,5
16,0 15,1 11,8 0,36
21 18
260 124 2,9
19,8 26,1 4,7 144 2,8
m
14 0 0 0
4, 75 65 30 15
9 0,32
0 0 0
1613 6,6
0 3 3
1507 0,9
M
so 33 16 11 63
100 100
93 76
2,52 100
82 1881 2309 23,8
99 205
28 2195 14,2
-X
27 9,8 5,2 3,6
88 61 38 17
1,95 90 73
380 2097 8,3
23,7
12 1976 3,4
0
7,3 4,9 2,2 1,8
13 18 13
7 0,4
7 15
255 94
1,7 11,2
3 141 2,1
SWA m
11 l 1
0,5
45 28 11
6 1,3
70 40 36
1936 6 6
7 1685 1,4
M
40 22 10
7
100 91 62 38
2,6 98 96
1140 2233
11 46
18 2187 8,7
w N U1
Digitised by the Open Scholarship Programme in support of public access to information, University of Pretoria, 2017
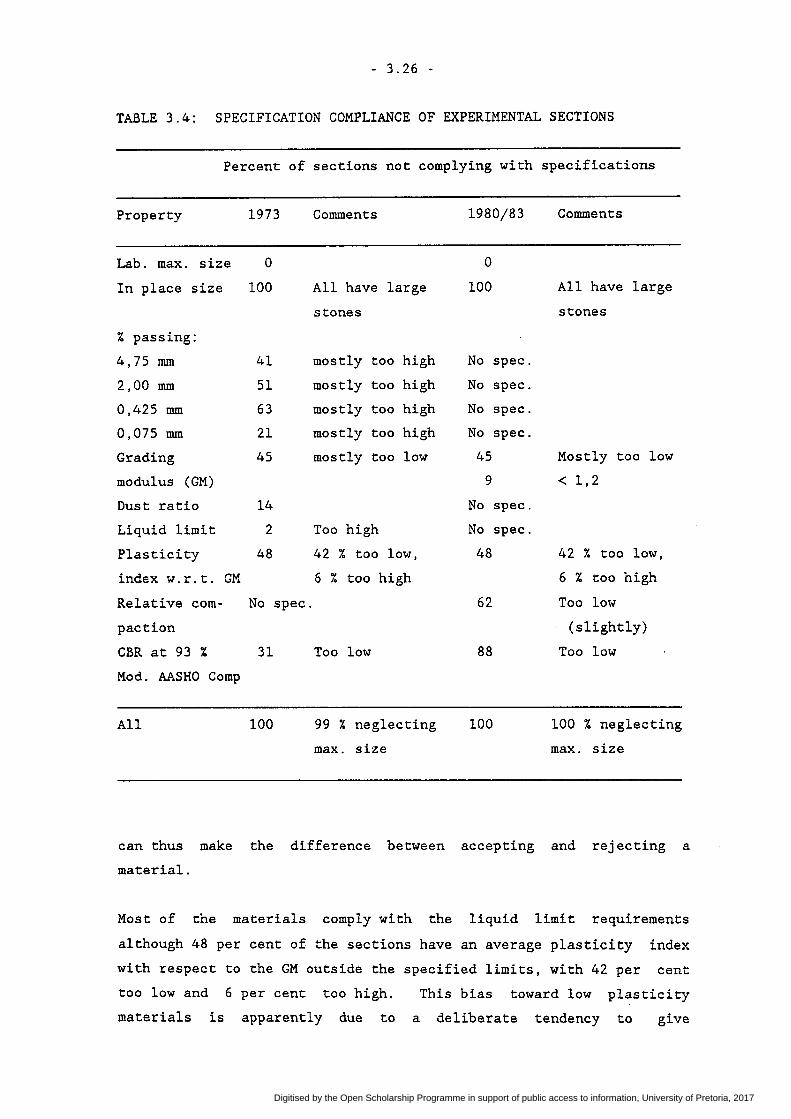
- 3.26 -
TABLE 3.4: SPECIFICATION COMPLIANCE OF EXPERIMENTAL SECTIONS
Percent of sections not complying with specifications
Property 1973 Comments
Lab. max. size 0
In place size 100 All have large
% passing:
4,75 mm
2,00 mm
0,425 mm
0,075 mm
Grading
modulus (GM)
Dust ratio
Liquid limit
Plasticity
index w.r.t. GM
Relative com
paction
CBR at 93 %
Mod. AASHO Comp
All
41
51
63
21
45
14
stones
mostly too high
mostly too high
mostly too high
mostly too high
mostly too low
2 Too high
48 42 % too low,
6 % too high
No spec.
31 Too low
100 99 % neglecting
max. size
1980/83
0
100
No spec.
No spec.
No spec.
No spec.
45
9
No spec.
No spec.
48
62
88
100
Comments
All have large
stones
Mostly too low
< 1,2
42 % too low,
6 % t:OO high
Too low
(slightly)
Too low
100 % neglecting
max. size
can thus make the difference between accepting and rejecting a
material.
Most of the materials comply with the liquid limit requirements
although 48 per cent of the sections have an average plasticity index
with respect to the GM outside the specified limits, with 42 per cent
too low and 6 per cent too high. This bias toward low plasticity
materials is apparently due to a deliberate tendency to give
Digitised by the Open Scholarship Programme in support of public access to information, University of Pretoria, 2017

- 3.27 -
preference to materials which it is believed will maximise skid
resistance in the wet.
The compaction of the wearing course is generally slightly below
specification with 62 per cent of the sections having values less than
93 per cent of modified AASHO compaction (approximately 100 per cent
standard Proctor compaction). This is due to the reliance on traffic
compaction with only a nominal number of passes of a grid roller
during construction. Nearly all of the materials fail the 1980/83
minimum CBR requirement of 45 and 31 per cent the 1973 requirement of
15.
On an overall basis not one material satisfies either of the
specifications. If the maximum size is neglected, one material
satisfies the 1973 specification while none satisfies the 1980/83
specification.
3.6 CLIMATIC EFFECTS
During the course of the project South Africa was generally suffering
from a major drought. For the purposes of this project it was
considered unlikely to affect the results to any great extent for the
following reasons:
• The performance of unpaved roads is affected more by the short
term weather than the long term climate. Periodic thunderstorms
and periods of intermittent drizzle are important in unpaved road
performance and although the annual rainfall may be lower than
normal, storms and drizzle still occur, though not necessarily to
the same extent.
• An analysis of the rainfall during 1985 and 1986 for 7 stations
distributed in each of the three N-value regions shows that the
annual rainfall did not differ from the long-term mean to any
major extent (Figure 3.6). In the wet areas (N < 2) the average
rainfall just exceeded the long-term mean (102 and 103 %) while in
the intermediate areas (N - 2-5) the average was just less in 1985
(96 %) and more in 1986 (102 %). In the drier areas of the western
Transvaal (N > 5) the rainfall was only 73 per cent of the annual
Digitised by the Open Scholarship Programme in support of public access to information, University of Pretoria, 2017

...J
...J <t ~ z <t a::
...J <t ::l z z <t
z <t 11.1 ::E 11.1 J: ~
~ 0
11.1 (!)
~ z 11.1 (,) a:: l.IJ a.. <t
(/)
<t
...J
...J <t ~ z <t a:: ...J <t ::l z z <t
- 3.28 -
N<2
X
100
50
BELFAST BARBERTON LYDEN BURG NELSPRUIT
N = 2-5
x 679 632 625
100
PRETORIA WARMBATHS POTCHEFSTROOM CULLINAN
l( 5.4 6 583 511
N >5 602
903
ERMELO PILGRIMS REST AMSTERDAM
599
x= 797 mm 1985-103% 1986-102%
01985
~1986
i = 649 mm
1985-96%
1986-99%
NYLSTROOM RUST OE WINTER RANKINES PASS
448 488 i=542 mm
1985-73% 1986-102%
<D 100 CD en
0 z <t
10 CD en
50
WOLMARAN- OTTOS-STAO OAL
DELAREYVILLE
LICHTENBURG
HARTE BEES- CHRISTIANA SCHWEIZER-FONTE IN RENEKE
x = MEAN ANNUAL RAINFALL FOR EACH STATION
FIGURE 3.6
ANNUAL RAINFALL OF SELECTED STATIONS IN THE TRANSVAAL
DURING THE MONITORING PERIOD f SEE FIGURE 3.4} Digitised by the Open Scholarship Programme in support of public access to information, University of Pretoria, 2017

- 3.29 -
mean in 1985 but increased to 102 per cent in 1986. The rainfall
for all the stations over both years was 97 per cent of the long
term average.
• It is therefore unlikely that the "drought" had a significant
effect on the results obtained during the monitoring period.
3.7 CONCLUSIONS
As in the Kenya and Brazil studies a factorial design with material,
traffic, climate and road geometries was selected for this experiment.
Although the experimental site selection was not completely random a
suitable range of material properties was included in the experiment.
The obvious bias towards the use of low plasticity materials in
existing roads was evident in the distribution of the plasticity
indices. The records from which the traffic counts were obtained were
not totally accurate and the counts done during the project resulted
in a change in the design matrix. However the cells of the matrix were
still filled and the statistical validity of the project was not
interfered with.
In all, 110 sections of road in the Transvaal and South West Africa
were monitored for more than 2 years. The main consideration in the
experiment was the influence of the geotechnical properties on the
performance of the test sections. The effect of different maintenance
strategies on the performance of the sections was not investigated to
any significant extent, unlike all the previous studies which
concentrated on the maintenance and not the materials.
Testing and monitoring followed well documented techniques and a
carefully controlled and closely supervised, regular monitoring
programme resulted in a large data base containing high quality
results. An important finding of the test programme was that none of
the materials in the test sections complied with the present
(1980/1983) or previous TPA specifications (1973) on the ba~ls of the
specified maximum size. Even
only one section complied with
the present one. However, many
neglecting the maximum size criterion
the early specification and none with
of the sections provided adequate
Digitised by the Open Scholarship Programme in support of public access to information, University of Pretoria, 2017

- 3.30 -
performance, even under prolonged
It is apparent that research into
development of performance-related
overdue.
periods with no maintenance.
material specifications and the
specifications is thus long
The "drought" prevailing over much of southern Africa during the
monitoring period was found not to have affected the study area
significantly in terms of the total rainfall as a percentage of the
long term average.
Digitised by the Open Scholarship Programme in support of public access to information, University of Pretoria, 2017

CHAPTER 4
GENERAL PERFORMANCE
4.1 INTRODUCTION
In order to develop performance-related material specifications it was
necessary to investigate the performance of the various materials on a
regular basis. During each monitoring trip a full road surface
condition description was made. Each parameter shown in Figure 4.1 was
classified by severity and extent where possible (Paige-Green, 1983;
1988a). In addition the longest dimension of the largest exposed stone
and the depth and diameter of the most severe pothole were measured.
Subsequent comparison with an ~quivalent rating carried out by
engineers from the TPA (Paige-Green, 1987a) indicated a number of
differences between the two methods. These stem mainly from the
purpose of classification. For research purposes it was necessary to
identify the propensity of the materials (and sections) to result in
the specific condition (e.g.
etc.). From the TPA point of
potholes, dust, cracks, loose material,
view it was necessary to identify the
maintenance requirements. Thus a few potholes of severity 4 (i.e. bad)
over 10 per cent of the road area would be rated as 4/5 by the TPA
(i.e. the whole section needs maintenance) but as 4/1 for this project
(i.e. potholes are not very prevalent). Conversely a section with no
potholes would be rated 1/5 for this project (i.e. no potholes over
the whole section) but 1/1 by the TPA (i.e. no potholes requiring
maintenance over less than 20 per cent of the section).
Prior to analysis of the data, five data files were created to reduce
computer utilisation. These were as follows:
PROPS - a summary of all the section characteristics, material
properties and test results for both the Transvaal and South West
Africa sections. This file contained the section number and for
each section the grade (G), curvature (C), Weinert's N-value (N),
Thornthwaite's moisture index (Im), the mean annual rainfall
(RAIN), material type group (MATGRP), average daily traffic (ADT),
per cent heavy vehicles (over 3 tonnes) (PERHEAV) and the number
Digitised by the Open Scholarship Programme in support of public access to information, University of Pretoria, 2017

- 4.2 -
NITRR CSIR
GRAVEL ROADS PROJECT
ROAD CONDITION DESCRIPTION
c ROAD SECTION NO
f ~ '8 M ~ ~ ~LIP I DUST 0 foTH SLIP w.w. MAX POTH. POT H. DATE N c ~ ~ R I WET TRAF SIZE DEPTH DIAM
s1E
K F N DRY D D M MY yi S E Is E Is F= Is =- ~ E S E S E S E (mm) (mm) (em)
811 I I I I I I I I I I i I I 81 I I I
I
I I I I
I I I I f I I I I I
81 I i I I I I I I I 81' I 81 I I
I
I I I I I I I
I I I I i I
I 1
sj1 I I I I I I I I I sl1 I I I I I I I I I I I I ! 81 I I I I I i 81 I I . I 81 I I I I 81 I I I I I I I I I I I
81 I 81 I 81 I I I I 81 I I I I I I 81 I I I I I 81 I I I I I 81 I I I I I I I I I
I I
81 I I I I I 81 I I I I I I I I I 81 I I I I I 81 I I 81
I I I I I liT
81 I I I I I I I 1 2 3 4 5 s..tJa 9 10 -- II 12 13 14 15 16 17 18 19 2C 21 ,,.....,,26 ~ 12e ~30 31 M33t34 3~~37 ~~#t~zk=
FIGURE 4.1
ROAD CONDITION EVALUATION SHEET
Digitised by the Open Scholarship Programme in support of public access to information, University of Pretoria, 2017

- 4.3 -
of cars (NC) and trucks (NT). The following test results were
included: in-situ density (DENS), moisture content at the time of
sampling (MOIST), liquid and plastic limits (LL and PL), bar
linear shrinkage (LS), modified bar linear shrinkage (MODLS),
plasticity index (PI), percentage passing the 26,5 mm (P26),
19,0 mm (Pl9), 13,2 mm (Pl3), 6,7 mm (P6), 4,75 mm (P475), 2,0 mm
(P2), 0,425 mm (P425), and 0,075 mm (P75) sieves, the clay
fraction (percentage smaller than 0,002 mm) (P2M), the laboratory
maximum size (LABMAX), the grading modulus (GM), aggregate fingers
and pliers values (AFV and APV), field moisture equivalent (FME),
optimum moisture content (OMC) and maximum dry density (MDD) at
Proctor compaction effort), soaked and unsoaked CBR (Proctor
compaction) (SCBR and OMCCBR), estimated percentage of kaolin
(KAOL), smectite (SMEC), chlorite (CHLOR), vermiculite (VERM),
illite (ILL) and other clays (OCL) (e.g. sepiolite, palygorskite),
mixed layer clays (MLC), quartz (QTZ), feldspar (FEL), goethite
(GOET), calcite (CALC) and other minerals (OTM), a quantitative
estimate of the in-situ stoniness (STONES), the soil
classification (a modification of the AASHO system as used by the
TPA) (CLASS) and the relative compaction (COMP). This resulted in
110 observations each with 64 variables.
CONDIT - this file consisted of all the condition description data as
follows: section number, the severity and extent of the dust,
stoniness, potholes, cracks, loose material, surface drainage,
slipperiness when dry and wet, the wet weather trafficability and
the measured maximum size, pothole depth and diameter, the depth,
wavelength, width and extent of corrugations and the date of
description. In all, 5 515 observations each with 33 variables
were included in this file.
RUTS - the average rut depth in both directions for each section and
the date of measurement were contained in this file which
consisted of 1 370 observations and 5 variables.
ROUGH this file contained all the roughness measurements after
correction for the instrument calibration, correction for speeds
other than 80 kmfh and averaging the three readings in each
Digitised by the Open Scholarship Programme in support of public access to information, University of Pretoria, 2017

- 4.4 -
direction. The file contained 7 083 observations with 5 variables
as follows: section number, direction, date of measurement,
previous grader blading date and roughness in terms of quarter-car
index.
GRLOSS - this file contained the average height of each section after
each levelling survey. Altogether, 750 observations with 4
variables (section number, previous regravelling date,
surveyed and average change in height) were included.
date
The main objective of the analysis of the performance characteristics
was to identify the important material properties which affect the
behaviour of the different materials, in terms of their performance.
Many factors which could not be accurately or easily quantified (such
as rainfall intensity or duration, seasonal traffic during harvesting,
vehicle speeds, driver characteristics, etc) affect the performance of
the roads. Although prediction models were obtained for most of the
variables the intention of these was to identify the important
material properties and not to be able to predict the severity of any
possible problems. Most of the prediction models account for about SO
percent of the total variation and have standard errors of about 0,5.
The rest of the variation is apparently due to the unquantifiable
factors described previously, considering that as many possible
material properties as possible were quantified. The high standard
error of 0,5 is probably due to the ratings being discrete integer
values, with any intermediate values being of necessity rounded to the
nearest integer values.
4.2 DUST
The effects and consequences of dust on unpaved roads are difficult to
quantify. However the presence of dust is important for the following
reasons:
• Dust affects the visibility. If the dust is too thick the
possibility of accidents is increased (Sultan, 1976).
• One of the major factors leading to passenger discomfort is
excessive dust. This is especially true in areas with
Digitised by the Open Scholarship Programme in support of public access to information, University of Pretoria, 2017

- 4.5 -
consistently high ambient temperatures (i.e. many parts of
southern Africa) where it is uncomfortable to keep the vehicle
windows continuously closed. The dust may also pose a health
hazard via dust-borne diseases.
• The presence of excessive dust plays a major role in increasing
the wear on moving parts of vehicles such as greased bearings and
universal joints (Snyman, 1987).
• In developing areas many of the roads are unpaved. The presence of
excessive dust in these areas (especially the residential areas)
is both politically undesirable and socially unacceptable.
• The effect of dust on roadside vegetation and crops has yet to be
quantified. Initial indications in New Zealand are that the
horticultural development adjacent
significantly affected by road dust
to unsealed roads
(van Barneveld, 1984). It
is
is
thought possible that the revenue lost due to the decreased
agricultural yield may be significant in comparison with the cost
of providing a seal coat (van Barneveld, 1984). The USDA Forest
Service (1973) has recorded that "for every vehicle travelling one
mile (1,6 km) of unpaved roadway once a day, every day of the
year, one ton of dust is deposited along a 1 000 foot (305 m)
corridor centred on the road".
• Dust from unpaved roads can cause serious air pollution and
pollute adjacent waterways.
• It has been shown in Kenya (Jones, 1984b) that between 25 and 33
tonnes of material per kilometre can be lost annually in the form
of fine airborne material (dust) ie a layer 1,8 to 2,5 mm thick.
Despite the obvious influences of dust identified above, most of the
published research experience with dust problems has been restricted
to the use and efficacy of dust palliatives (Fossberg, 1966; Hoover et
al, 1973; Jones, 1984b). No published work on the effect of the
geological or geotechnical properties on dust emission from unpaved
roads was found.
4.2.1 Method
A quantitative determination
material types was desirable.
of the
Although
dust emanating from various
a number of techniques for
Digitised by the Open Scholarship Programme in support of public access to information, University of Pretoria, 2017

- 4.6 -
determining dust emission are available (ASTM, 1987; van Barneveld,
1984), the following factors were considered:
• Most techniques require the collection of dust in some way. This
is a very time consuming process, highly susceptible to vandalism,
thus necessitating constant surveillance.
• Climatic factors, especially the rainfall and wind affect the
evolution and collection of dust.
• The speeds and design of passing vehicles affect the generation of
dust to a large extent.
• The elapsed time since the
important. Roads are usually
grading.
previous grader maintenance is
at their dustiest immediately after
• The dust is at its worst during the dry season, winter over most
of southern Africa.
For these reasons it was thought that a regular visual classification
of the dust would be more appropriate. The average dust rating over
the duration of the project would be more indicative of the potential
dustiness of the different materials relative to one another than a
one-off numerical value. A one-off numerical value would mean very
little as any variation in wind velocities and direction or the
traffic type and volume would result in non-representative results
(ASTM, 1987).
Taylor et al (1987) have recently developed a simple dust monitoring
device (Road Dust Monitor) which is eminently suitable for the type of
dust measurement required for this project. The instrument uses an
infrared beam and transducer system and measures the air opacity in a
duct behind a rear wheel of the testing vehicle, and should be
considered for future work on unpaved roads.
For this project, however, a five-point rating system was developed by
which the dust was classified by the driver of the LDI during
roughness testing at 80 kmfh. The severity of the dust visible in the
interior rear-view mirror was rated as follows (Paige-Green, 1988a):
Digitised by the Open Scholarship Programme in support of public access to information, University of Pretoria, 2017

- 4.7-
1 - No visible dust behind the vehicle
2 - Dust just visible through the rear window
3 - Dust easily visible, but not enough to cause driver discomfort
4 - Very dusty - major discomfort when passing approaching vehicles
but not causing dangerous loss of visibility
5 - Extremely dusty - surroundings obscured to a
totally unacceptable from driver/passenger
aspects.
dangerous level
comfort and safety
If the road surface was obviously moist a dust rating was not carried
out.
4.2.2 Results
About 30 ratings were obtained for each section in the Transvaal and
50 in South West Africa. The average dust severity of all 110 sections
over the monitoring period was 3,9 (a = 0,68) with a minimum of 2,0
and a maximum of 4,97. All ratings of 1 were excluded from the
analysis as the sections were assumed to be moist at the time of
rating.
4.2.3 Analysis
The dust was analysed in terms of the material properties affecting
its evolution from the road. The average dust severity rating over the
duration of monitoring for each section was correlated with the
material properties for the sections using a multiple correlation
analysis (SAS, 1985). The significant variables were then analysed
using a linear regression analysis (SAS, 1985) to identify the best
fit equation. Although every section gave a dust rating of 5 at least
once during the project (usually just after grading) the average for
each section over the duration of the project (excluding the ratings
when wet) is probably representative of the overall dustiness of that
section.
The significant variables affecting the dustiness identified for the
analysis were the material group, plastic limit (PL), fraction smaller
than 6,7 (P6), 4,75 (P475) and 2,00 mm (P2), dust ratio (DR) (ratio of
Digitised by the Open Scholarship Programme in support of public access to information, University of Pretoria, 2017

- 4.8 -
per cent passing 0,075 mm to per cent passing 0,425 mm sieves),
feldspar content (FEL), percentage of heavy vehicles (PERHEAV),
laboratory maximum size (LABMAX), soaked CBR (SCBR) and the Gravel
Index (GI) (1 - ratio of the per cent passing the 2,00 mm sieve to the
per cent passing the 26,5 mm sieve). Unfortunately, the 6,7 mm sieve
was not used for the South West African grading analyses and was not
used in the overall analysis despite it being the most highly
correlated grading parameter. The material group was the most highly
correlated parameter with dustiness. However, arbitrary numbers were
assigned to each of the groups (e.g acid crystalline = 1; arenaceous =
4) and any correlation between these numbers and the material
properties or road performance is purely coincidental as no definite
relationship exists between them.
The correlation coefficient for the best-fit model below was 0,43:
DUST- 6,7 - 4,03.GI - 0,16.PL- O,ll.FEL + 0,28.GI.PL
+ 0,0003.SCBR.PERHEAV - 0,0002.SCBR.P475
The percentage of feldspar in the material is a highly
(4.1)
parameter but this cannot easily be quantified without specialised
equipment. An analysis excluding the feldspar content but containing
the percentage smaller than 6,7 mm and the aggregate fingers and
pliers values together with all the other significant variables and
their interactions gave an r-squared value of 0,73. However, because
of the missing values for the passing 6,7 mm fraction and the AFV and
APV parameters only 68 results, all from the Transvaal were used in
the analysis. The standard error of this model was still high at 0,42.
The model was significant at the 0,01 per cent level and was as
follows:
DUST- 12,57 - P6(0,06 - 0,0002.PF + 0,093.DR + 0,0017.APV
+ 0,0004.AFV- 0,003.LABMAX) - PL(0,295 + 0,007.AP7- 0,003.AFV
- 0,006.?ERHEAV) - PF(0,017 - O,OOOl.APV - O,OOOl.LABMAX)
+ DR(ll,45 - 0,12l.PERHEAV) + 0,205.APV - 0,233.L~BMAX
- 0,037.PERHEAV (4.2)
Digitised by the Open Scholarship Programme in support of public access to information, University of Pretoria, 2017

where
P6
PF
DR
APV
AFV
lAB MAX
PL
PERHEAV
- 4.9 -
Percentage passing the 6,7 mm sieve
Plastic factor (Plastic limit x percent passing 0,075 mm)
Dust ratio (ratio of percent passing 0,075 and 0,425 mm
sieves)
Aggregate pliers value
Aggregate fingers value
Maximum sieve size
Plastic limit
Percentage of heavy vehicles
Analyses studying the seasonal effects resulted in poor correlations
as did those using the modal values for dust and various
It was considered that the modal values did not
percentiles.
adequately
differentiate the materials with respect to each other, being integer
values.
4.2.4 Discussion
Model 4.2 is ~ather cumbersome with a relatively poor prediction
capability but identifies those parameters which affect the generation
of dust and should be considered in the specifications. Apart from the
effect of heavy vehicles which appear to suppress dust (probably due
to the multi-collinearity with rainfall) the plasticity, grading and
aggregate strength are the important factors influencing the
generation of dust.
During analysis of the performance of the sections and the material
properties affecting the performance (see Chapter 7.5.6), it was noted
that the product of the bar linear shrinkage and the percentage
passing the 0,425 mm sieve was the best indicator of dustiness. This
did not, however, show up in the dust analysis described here as the
relationship was not linear (the best fit curve is probably parabolic)
with both low and high values being dusty and intermediate values
identifying those materials least prone to dustiness.
The guide to wearing course materials of the NPA (ca 1961) identifies
materials with a liquid limit of less than 20 percent and a coarse and
Digitised by the Open Scholarship Programme in support of public access to information, University of Pretoria, 2017

- 4.10 -
medium sand fraction of less than 30 percent as being dusty in dry
weather. The results of this study indicate that the dust on 53
percent of the sections was unacceptable and on 81 percent of the
sections was undesirable. However only 21 percent of the sections had
liquid limits of less than 20 although 62 percent had coarse and
medium sand fractions of less than 30 percent. Thirty percent of the
sections rated as having unacceptable dust had a coarse fraction in
excess of 30 percent. It would thus appear that if these limits are
satisfactory in Natal, some other factor (e.g. rainfall or humidity)
plays an important part in reducing dustiness.
It is generally postulated that dust generation is related to the silt
content of the aggregate (Van Barneveld, 1984) and the threshold shear
velocity of the wind generating the dust. This threshold shear
velocity depends on the grain size, sorting and cohesion of the source
material (Tsoar and Pye, 1987) and is of the order of 200 to 600
mmjsec. When one considers that a vehicle travelling at 100 km/h has a
maximum wind shear velocity of 27 780 mmjsec and a vehicle with a
ground clearance of 150 mm has a wind shear velocity gradient of
185 mmjsecjmm it is easy to see why dus~ is so readily generated. Once
the dust has been generated it can either settle rapidly or stay in
suspension in the air according to the Stokes' settling velocity
relationships (Tsoar and Pye, 1987). These relationships are
graphically illustrated for quartz spheres in Figure 4.2. Typical
grading curves of some dust samples collected from behind a vehicle
are included on the Figure.
It is clear that the dust collected behind vehicles consists almost
totally of material finer than 0,075 mm with only between 15 and 25
per cent being finer than 0,002 mm i.e. the dust collected is
predominantly silt. The material adhering to the back of a vehicle
after travelling in very wet conditions (rain and mud) is slightly
finer with about 30 per cent less than 0,002 mm in diameter. fhe high
sil~ conten~ confirms the findings of Taylor et al (1987) who
suggested differences in dustiness resulting from soil properties
dependent on the relative proportion of silt-sized particles and
the clay-sized fraction. Van Barneveld (1984) noted that the
sized particles predominate in samples collected, irrespective of
are
not
silt
the
Digitised by the Open Scholarship Programme in support of public access to information, University of Pretoria, 2017

0,1
E E
a: ...., 1- / ....,
/ := <{ / 0
z <{ 0:: <.:)
,;
0,01
0,002
- 4.11-
CUMULATIVE PERCENT PASSING 100 0
BED LOAD {ROLLING AND SALTATION) .
/ ./ .// - WET
.// -~~' /
/-~~ / . '"t
./ / \J'. ~0, /./~ / ~ .
. /"/o~Y ./ /"\~"\~/
/;/e;,~"/ / r.c'<c.,.~/ ~"/ /
/ ~~ SHORT-TERM \,; SUSPENSION \)\ ~0' /
/ /~ /
/ /
/ /
/ / LONG- TERM
SUSPENSION
Ut : SETTLING VELOCITY {mm s·1)
U* = FRICTION VELOCITY OF TURBULENT FLOW (mms-1l
DRY
1-..J II)
0,1
E E
a: ...., 1-...., := <{
0
z <{
a: <.:)
0,01
0,001 L...-------~----~---~---~----_.__ __________ _.. 0,001 100 300 500 700 1000 2000
WIND SHEAR VELOCITY !mm/s l
FIGURE 4.2 THEORETICAL MODES OF TRANSPORT OF QUARTZ SPHERES AT DIFFERENT WINO SHEAR VELOCITIES (MODIFIED AFTER TSOAR
AND PYE, 1987)
Digitised by the Open Scholarship Programme in support of public access to information, University of Pretoria, 2017

- 4.12 -
distance from the road centre line. The clay-sized fraction never
exceeds 10 per cent of the sample deposited. The general paucity of
clay-sized particles in samples collected may, however, be indicative
of the very low settling velocity of these fine particles and general
loss into the atmosphere, even under minimal wind velocities.
X-ray analyses of the dust samples collected in the dry condition
showed the main components (and estimated percentages) to be quartz
(70 %), feldspar (10 %), kaolin (10- 15 %) and illite (s 10 %). The
dust samples were a dark red-brown colour but boiling in concentrated
sulphuric acid rapidly revealed white quartz particles and stained the
acid green. It can thus be concluded that the quartz is coated ~ith
a thin layer of iron oxide (or hydroxide) which produces the red-brown
colour.
The strong correlation between the feldspar content of the material
and the dustiness is indicative of the importance of the stage of
weathering in the generation of dust. The feldspar content is a good
indicator of weathering as nearly all of the materials tested contain
feldspar to a greater or lesser extent, which is replaced by finer,
clay minerals as weathering proceeds. The determination of the
feldspar content of soils and gravels with any degree of confidence
requires X-ray diffraction techniques which are not readily available
to road authorities. The feldspar content should therefore not be a
factor in the material specifications despite its significance.
The only other minerals which had significant correlations with the
dust severity rating were the smectite content (at the 0,7 per cent
level) and the non-differentiated other minerals (dolomite, amphibole,
pyroxene, etc) which were significant at the 0,6 per cent level.
Unlike the material group identification, the material classification
in terms of the TPA modified TRB/AASHO classification system is
approximately linear. As the classification changes from the Al-a to
A7 groups (AASHO, 1961), the quality generally deteriorates (the
materials tend to become finer and more plastic). Thus, by numbering
the groups consecutively from 1 (Al-a) to 17 (A7) any correlation
between the material classification and the properties or performance
Digitised by the Open Scholarship Programme in support of public access to information, University of Pretoria, 2017

- 4.13 -
should be significant. No corralation between dust and the TPA
classification was, however, evident.
4.3 STONINESS
The influence of stoniness on the roughness of unpaved roads was
recorded as far back as 1929 (Strahan, 1929) and has been related to
field performance by Paige-Green and Netterberg (1987) and road user
costs by Beaven et al (1987). Most specificati~ns provide for the
exclusion of large stones and boulders but none of the sections
investigated in the Transvaal or South West Africa was totally free of
oversized material. Many of these sections were, however, acceptable
with respect to roughness. The total exclusion of "large" stones by
specification, although desirable, would therefore appear to be
unnecessarily harsh. However a limit on the quantity and dimensions
of large stones and boulders is definitely necessary.
The presence of large stones affects the performance of the road in a
number of ways:
• The main effect is the protrusion of the stones from the road
resulting in an uneven running surface and a rough road.
• An excess of large stones results in difficulty during grader
blading. The grader either plucks the stones from the surface of
the road causing potholes or "bounces" over the stones resulting
in minimal improvement in the riding quality.
• Large stones result in poor compaction of the layer during
construction as the stresses from the roller are transmitted by
the stones to the subgrade without compacting the matrix between
the stones. This results in a rapid loss of the uncompacted
material under traffic and accelerated protrusion of the stones.
In addition the uncompacted material behind the stones compacts
under wheel loads and forms potholes behind the stones.
• A number of roads showed distinct corrugations due to the presence
of large stones spaced at regular intervals along the road.
• The passage of wheels over the protruding stones results in a
certain amount of vehicle bounce causing compaction on regaining
Digitised by the Open Scholarship Programme in support of public access to information, University of Pretoria, 2017

- 4.14 -
contact with the road and the formation of potholes behind the
stones.
The importance of oversize material is clearly shown in Figure 4.3 (a
and b) where the roughness measurements for sections 917 (material
compacted with a grid roller i.e. normal construction practice (Plate
4.1)) and 916 (material broken down by a Rockbuster (Plate 4.2)) are
plotted. The roughness of section 916 varies between about 30 and 80
counts/km with an average of about 50, while section 917 varies
between 60 and 140 with an average of about 90 counts/km. Towards the
end of the project it was noted that the material on section 916 was
not as fine with depth, and as the surface wore down and the coarser
material became exposed the roughness increased considerably.
It is interesting to note that most wearing course gravels used in the
United States are crushed materials with a maximum size of 26 mm. The
blading frequencies are much lower than in South Africa and yet the
riding quality is generally very good.
4.3.1 'Method
The severity of the stoniness was rated according to the following
criteria (Paige-Green, 1983; 1988a):
1 - No stones protrude above the surrounding matrix
2 - Stones protrude above the matrix but cannot be felt or heard when
traversing them in a light vehicle
3 - Protruding stones are felt and heard when driving over them
4 Protruding stones require evasive action (avoidance and/or speed
reduction) and result in a noisy, bumpy ride. A criterion used was
that the driver would not subject his private vehicle to the road
for an extended distance (say 5 km) at 80 km/h.
5 - The stones cause unacceptable roughness. Vehicles drive on the
shoulders (i.e. not in the main wheel paths) or use alternative
routes. A criterion which was used during the project was that the
driver would not travel at 80 km/h in his private vehicle on that
road.
Digitised by the Open Scholarship Programme in support of public access to information, University of Pretoria, 2017

150
140
130
120
~ 110 ....... ~100 z :)go 0 u
80 .... 0 - 10 C/'1
~ 60 z ~ 50 :::)
0 40 a:
30
20
10
0
90
80
~ 10 ....... C/'1 ..... z 60 :::)
0 u .... so 0
C/'1
~ 40 z :I: C) :::) 30 0 a:
20
10
0
- 4. 15 -..... B 8 B B 8 B B B B B B B
- • • X
- • X X
~ - X I
X
• X X • I X
- X X X
I X
• 1- X X • • I • X
• 1- • X X I X
X • • X X 1- • X • ~ ~ • )( • I • 1- • • X • • X •
•
• - • • • X - • f.-
i- x - INCREASING DIRECTION . - DECREASING DIRECTION-f.-
GRADER BLADED B-f.- _ll j I I I I I I I I Ll ll l l I 30-11-84 19-1-85 10-3-85 29-4-85 18-6-85 7-8-85 26-9-85 15-11-85 4-1-86 23-2-86 14-4-86 3-6-86 23-7-86
DATE
FIGURE 4.3 a PLOT OF ROUGHNESS AGAINST TIME FOR SECTION 917 (GRID ROLLED)
r- B B B B 8 B 8 8 8 8 8 B
f.- • X
f.- • • X
• l • 1- • • X X
• X • • • • • ~ • X • I f.- • X X • X • • • • • X X X • X X X • • l( I X X • l(
I f.- l( X
I• X • X X • • I 1- X
X I 1-
1-
I I I I I l u l l l l I I 30-11-84 19-1-85 10-3-85 29-4-85 18-6-85 7-8-85 26-9-85 15-11-85 4-1-86 23-2-86 14-4-86 3-6-86 -7-86
DATE
FIGURE 4.3 b
PLOT OF ROUGHNESS AGAINST TIM£ FOR SECTION 916 fROCKBUSTER)
Digitised by the Open Scholarship Programme in support of public access to information, University of Pretoria, 2017

- 4.16 -
PLATE 4.1: SECTION 917 SHOWING MATERIAL AFTER COMPACTION WITH A
GRID-ROLLER
PLATE 4.2: SECTION 916 SHOWING MATERIAL BROKEN DOWN BY A "ROCKBUSTER"
Digitised by the Open Scholarship Programme in support of public access to information, University of Pretoria, 2017

- 4.17 -
An attempt to correlate these ratings with the protruding heights of
the stones was unsuccessful as the diameter and quantity of the
stones affected the rating. It was found however that stones
protruding more than about 30 mm were generally classified as a
severity of 5. It was also noted that once stones up to about 200 mm
in diameter protrude more than about 40 mm above the surface of the
road they tend to be ripped out during routine grader blading. If the
diameter of the stone is more than 200 mm the stone is usually
unaffected by blading and needs to be manually removed.
The extent of the stones was estimated as the areal percentage of the
road consisting of stones larger than 40 or 50 mm in exposed
dimension.
4.3.2 Results
Some 5 500 results were obtained for the stoniness severity and extent
and the maximum dimension of the largest stone observed in the
section. These were averaged for each section. The average stoniness
severity for all the sections was 3, 0 while the avera.ge extent was
2,6. The average maximum stone size measured in the field for all the
sections was 322,5 mm (a = 119,6) with a minimum of 139 mm and a
maximum of 674 mm.
4.3.3 Analysis
No prediction analysis for stoniness was necessary as this parameter
can be easily determined from grading analyses on the material from
the borrow pit. It is, however, recommended that the modified method
of grading analysis proposed by Paige-Green (1988b) is utilised.
4.3.4 Discussion
The importance of removing oversize stone from the w~aring course
material cannot be overemphasised. This is one of the few material
properties which can be "controlled" prior to use of the material.
The removal of large stones can be done in a number of ways depending
on the available resources:
Digitised by the Open Scholarship Programme in support of public access to information, University of Pretoria, 2017

. 4.18 .
• Screening at the borrow pit by means of a "Grizzly"
• Mechanical disintegration on the road with a mobile hammer-mill
such as a "ROCKBUSTER"
• Removal from the road prior to compaction with a "Rock Rake"
• Removal from the road prior to compaction by hand-picking
• Crushing of oversize material
These techniques and their implications are discussed further in
Chapter 8.3.
Although it is not imperative that every stone larger than SO or 75 mm
is removed from the wearing course material, it is strongly
recommended that the percentage of oversize material is restricted to
a specified value. The areal extent of the exposed oversize material
in a road will depend to a large degree on:
• Size · as the size of the stones increase there is a greater
chance of the stone or part of it being exposed at the surface. If
the minimum dimension of the stone is greater than the wearing
course thickness, compaction and shaping of the road will not be
possible without breaking the stone or compacting it into the
subgrade. In the latter case, the stone soon protrudes from the
road and causes significant roughness, affects the safety and
complicates grader blading.
• Shape · shales generally result in very platy stones while granite
and dolerite stones usually tend to be more spherical. This
usually results in a larger exposed surface area of shale stones
in the road due to their horizontal orientation and
while the more spherical stones are not exposed to
extent.
compaction,
the same
• Quantity · the more large stones there are, the more chance there
is of exposure at the surface, although a part of all stones
greater than 150 mm should theoretically be exposed in the road.
• Time since construction - as the matrix surrounding the stones
wears away more of the stone will be exposed, especially if the
stones are rounded.
To take these aspects into account, strict specifications for each
Digitised by the Open Scholarship Programme in support of public access to information, University of Pretoria, 2017

- 4.19 -
material type or stone shape would be required. However, other aspects
such as the variable density of the different particle size fractions
(the large stones are often more dense than the matrix particles)
compound the problem and result in a simple grading analysis by mass
(including the material larger than 75 mm) not being an adequate
indicator.
Existing methods of grading analysis (e.g. TMH 1, NITRR, 1986) do not
give an indication of the very coarse material. The method of analysis
proposed by Paige-Green (1988b) gives a direct indication of the
quantity of coarse material in terms of the Oversize Index (I ). 0
For optimum performance the maximum particle size should be restricted
to 37,5 mm. This is the size specified in the majority of
specifications studied and it has been shown to be cost-effective to
crush oversize material to pass 37,5 mm for roa~s carrying more than
SO vehicle per day (Beaven et al, 1987). A limited number of stones up
to lSO mm (or 100 mm preferably), however, can be tolerated. It is
important that if stones larger than SO mm are included in the wearing
course aggregate, they are not permitted to remain on the surface and
in loose material after blading. Extensive damage to modern compact
sedan cars and caravans (braking systems, transmissions, petrol tanks
and body-work) caused by these large stones has been observed. It is
thus recommended that, if a limited number of stones larger than SO mm
are permitted in the wearing course gravel, those loosened during
grader maintenance should be manually removed from the road surface.
The number of oversize stones in a square metre of road 150 mm thick
can be easily calculated. Table 4.1 shows the number of spherical
stones (for 5 per cent oversize by mass) of 150 mm, 100 mm and 75 mm
diameters theoretically in a section of road as described compacted to
2000 kgjm3. The effect of the different stone densities used to
convert the per cent by volume in the calculation to a percentage by
mass (the usual practice for grading analyses) is shown.
Digitised by the Open Scholarship Programme in support of public access to information, University of Pretoria, 2017

- 4.20 -
TABLE 4.1: THEORETICAL NUMBER OF STONES IN ONE SQUARE METRE OF ROAD
CONTAINING 5 PER CENT OVERSIZE BY MASS
Stone density Number of stones of nominal diameter (kgjm3) (mm)
150 100 75
3000 3 10 23 2500 3 12 27 2200 4 14 31
Except in strongly gap-graded materials, the oversize stones would,
however, include various proportions of the different fractions
between 37,5 mm and 75, 100 or 150 mm. Five per cent of material
between 37,5 and 150 mm would therefore actually result in less than
the number of stones shown.
In practice very few large stones are perfectly spherical. A simple
laboratory experiment to relate the areal extent of non-spherical
particles to the percentage by mass of the material using two samples
was thus carried out. Artificial mixtures of various percentages of
oversize material (9,5 to 13,0 mm) and matrix (passing 4,75 mm) were
spread into a pan to a depth of 13,0 mm, and the areal percentage of
exposed stone measured. This was considered to simulate the full-scale
situation of non-spherical stones with a maximum dimension of 100 to
150 mm in a matrix passing SO mm constructed to 150 mm thickness.
Table 4.2 summarises the results of the experiment.
On average only 72 per cent of the mass of the stones is represented
in the areal exposure at any one time. It is therefore theoretically
probable that only 72 per cent of the number of stones indicated in
Table 4.1 would be exposed at the surface at any one time.
Geologically the igneous rocks are generally harder and more likely to
produce excessive oversize material. They are also prone to spheroidal
weathering resulting in large boulders in a clayey matrix. Pedocretes
are also prone to stoniness due to the cementitious nature of their
Digitised by the Open Scholarship Programme in support of public access to information, University of Pretoria, 2017

- 4.21 -
TABLE 4.2: AREAL EXPOSURE OF VARIOUS PROPORTIONS OF NON-SPHERICAL
OVERSIZE MATERIAL
Areal extent (%) Oversize
Quartzite Granite (% by mass)
Mean Std dev Mean Std dev
5 3,0 1,19 4,0 1,63 10 7,3 2,38 6,8 1,96 15 9,0 2,34 12,1 3,44 20 15,5 4,63 14,0 2,27
are also prone to stoniness due to the cementitious nature of their
formation. Arenaceous rocks, although generally fairly soft, often
have large platy particles.
The severity of the stoniness showed significant correlations (at the
0,5 % or better level) with the kaolin, illite and calcite contents
(r- -0,29, 0,26 and 0,34 respectively). The correlation with the
calcite content is indicative of the cementitious nature of calcite.
Most of the materials with high calcite contents were calcretes which
tend to be very stony because of the strong cementing action of
calcite. The negative correlation with the kaolin is a good example of
consequential correlation. The calcretes generally have little kaolin
and a strong negative correlation exists between calcite and kaolin
(r- -0,56). This multi-collinearity between the calcite and kaolin
results in a significant correlation between kaolin and stoniness and
emphasises the importance of analysing the cause of high correlations
carefully. The correlation with the illite is attributed to illite
being the prime constituent of shales which are particularly stony.
In areas with N-values greater than 5 most of the weathering of rocks
is physical with disintegration predominating and only a small amount
of decomposition. This results in the formation of a coarse
disintegrated gravel with illite being the main clay mineral (Weinert,
1980). The stones show some correlation with theN-value (r- 0,41),
confirming the predominance of disintegration in the more arid areas.
This correlation is diminished somewhat by the fact that many shales
and mudrocks in the wetter areas, although mostly unweathered, are
Digitised by the Open Scholarship Programme in support of public access to information, University of Pretoria, 2017

- 4.22 -
soft enough to be ripped and used in unpaved roads although they
contain a large proportion of oversize material.
The extent (quantity) of the stones had significant correlations with
the smectite (-0,25), illite (0,47) and calcite (0,31) contents. The
previous discussion on the illite and calcite contents are applicable
to the quantity of stones but the absence of a significant correlation
with kaolin is apparently due to the less significant correlation
between calcite and stone extent. The negative correlation with
smectite clays (which occur mainly in the igneous rocks) can be
ascribed to the chemical weathering of these rocks. The materials with
a high smectite content have generally reached an advanced stage of
weathering and, whereas the partly weathered igneous rocks with
minimal smectite generally have many stones, their highly weathered
counterparts have very few stones larger than 50 mm.
4.4 POTHOLES
It ~as been shown (Paige-Green and Netterberg, 1987) that potholes
play an important role in the development of roughness. Potholes can
be formed in a number of ways, many of which can be prevented by
improved material selection. Any depression in the road surface which
affected the roughness of the road (other than corrugations) was
classified as a pothole during the routine monitoring trips. Possible
causes of these depressions were observed to be as follows:
• Small diameter but deep depressions result from the grading
operation plucking oversize stones from the road. Sometimes these
stones are dragged along the road by the grader causing elongated
furrows but these are usually repaired manually while the
maintenance team is on site. Stones greater than 75 mrn are
particularly prone to this "shoving" by the grader.
' The area immediately after (in the direction of travel) large
stones (diameter more than 150 mm) is usually compacted by the
traffic to form a depression with a depth approximately equal to
the height the stone protrudes above the normal running surface.
The depression is caused by both the bounce of the vehicles and
Digitised by the Open Scholarship Programme in support of public access to information, University of Pretoria, 2017

- 4.23 -
compaction of the material which is generally poorly compacted
during construction because of the stress concentration and
support of the roller by the large stones.
• With the passage of time corrugations cause vehicles to bounce and
enlarge the contact area behind the corrugation into a rounded
depression. Potholes formed in this way are difficult to remove
during routine maintenance and remain for many months.
• The formation of depressions by any of the means described results
in pending of water during wet periods. This pending allows the
water to soak in and weaken the wearing course material which
results in enlargement of the pothole by compaction and shearing
under traffic. This is a self-perpetuating process (unless the
depressions are timeously repaired) and can lead to large
diameter, deep depressions.
• The presence of a weak subgrade can lead to the formation of large
depressions during wet periods. If the wearing course becomes too
thin and cannot distribute the applied loads adequately,
compaction and/or shear in the subgrade occurs and a large pothole
may form.
• Potholes caused oy animals and inseccs have been noted on a number
of roads. These range from small, shallow holes caused by moles
and mongooses to larger depressions due to "undermining" by ants
and large holes (500 mm diameter by 1 to 1,5 m deep) caused by
warthog. These holes need to be carefully filled and compacted in
order to eliminate traffic compaction and further development of
potholes.
• The disintegration of highly cracked roads and highly weathered
boulders (especially granites and sandstones) results in the
formation of potholes.
• "Powder potholes" are common in the drier western parts of the
region and consist of depressions filled with very powdery
material, usually calcrete. No examples of these were recorded in
the Transvaal test sections, but occur commonly in the northern
Cape and South West Africa.
Additionally, the presence of dispersive soils (sodium rich) may lead
to potholes (Visser, pers. comm) and would certainly exacerbate
existing potholes in the presence of standing water.
Digitised by the Open Scholarship Programme in support of public access to information, University of Pretoria, 2017

- 4.24 -
4.4.1 Method
The potholes were rated by severity and extent on a standard S-point
scale and the depth and diameter of the pothole which appeared to
affect the roughness most was measured. The depth of the potholes was
generally measured in the direction of traffic flow with the rut depth
gauge. If the diameter was more than the length of the gauge, a
reading was taken with the gauge angled slightly or the depth under a ~
piece of string across the hole was measured.
The severity of the potholes was rated according to the following
criteria:
1 - No visible potholes
2 Minor depressions which were visible but were not felt in the
vehicle
3 - Significant potholes felt in the vehicle but not requiring evasive
action
4 - Severe potholes which were obviously avoided by most vehicles
5 - Very severe potholes requiring speed reduction and careful
avoidance
Both Eaton et al (1987) and Hudson et al (1987) recommend ratings for
potholes based on their depth and diameter with the severity
increasing as both of these increase. This results in a pothole about
one meter in diameter and SO to 100 mm deep being rated as high
severity while a pothole less than 300 mm in diameter and SO to 100 mm
deep would have a low severity. The monitoring experience has,
however, shown that the latter pothole would be far more severe on a
passenger vehicle than the former, stressing the mechanical components
to a much higher degree. For this reason none of the measured values
were used in the severity rating.
An estimate of the percentage of the road over which potholes occurred
was made. This was usually less than 20 per cent except for those very
stony roads which had depressions caused by impact compaction behind
the stones.
Digitised by the Open Scholarship Programme in support of public access to information, University of Pretoria, 2017

- 4.25 -
4.4.2 Results
The average pothole severity and extent for each section was
calculated from all the results. The average severity was 2,13
(a= 0,65) with a minimum of 1 and a maximum of 4,1 while the average
extent was 1,25 (a- 0,72; M 3,5; m- 0). The averages of the most
severe pothole depth
each inspection were
35,5 mm (a 8,3;
(a = 308; m 291; M
4.4.3 Analysis
and diameter for each section recorded during
also determined. The average pothole depth was
m - 20,0; M 59,2) and diameter was 776 mm
1828 mm).
The analysis of the potholes attempted to identify those materials
prone to the formation of potholes and those properties which were
associated with potholed roads. The significant variables with
respect to the severity of the potholes were found to be the grade of
the section (G), Weinert N-value (N), dust ratio (DR), APV, optimum
moisture content (OMC) and maximum dry density (MDD) and the
percentage of kaolin in the sample. The extent of the potholes was
indicated by the grade, OMC and the MDD.
As both the severity and extent of the potholes were considered
important a composite pothole factor was analysed. This factor
consisted of the product of the square of the severity and the extent
of the potholes. The correlation for this was significantly worse than
for the pothole severity by itself and the severity therefore was used
for further analyses. A linear regression analysis using the
significant variables and their interactions produced a maximum
r-squared value of only 0,62. The APV was excluded from the model
because of the missing values as was the percentage of kaolin because
of the difficulty of determining it. After simplifying the model by
removing the non-significant interaction and main effects the
r-squared value decreased to 0,45 (RMSE 0,49; F 17) for the
following prediction equation for pothole severity (POTSEV):
POTSEV = 4,2 - 0,185.G - 0,00004.N.MDD - DR(3,10 - 0,257.0MC)
- 0,12.0MC (4.3)
Digitised by the Open Scholarship Programme in support of public access to information, University of Pretoria, 2017

- 4.26 -
All of these variables are significant at the one percent level except
the dust ratio which is significant at the 3 percent level. Inclusion
of the stoniness severity and extent resulted in a marginal increase
in the r-squared value to 0,48. The potholes which form behind the
stones are thus generally of minor consequence in relation to the
overall pothole severity. The low r-squared value is caused by one of
the major contributors to potholes being poor drainage, more than
material properties. Ponding of water on flat sections of road with a
poor crown, areas of seepage or perched water tables and at the bottom
of dips usually results in pothole formation.
4.4.4 Discussion
Most potholes are formed by poor grader maintenance, inadequate
drainage and the final stage of corrugation development if maintenance
is delayed. The quality of the grader maintenance is of utmost
importance as this dictates
which in turn influences
permitted to accumulate
the shape and cross-section of the road
the surface drainage. If water is not
on the road surface potholes would be
restricted in their severity.
All of the parameters included in the model reduce the pothole
severity from a maximum rated value of 4,2 i.e. theoretically every
unpaved road would have potholes of a severity of 4,2 if all of the
factors in the model had values
potholes are an inherent part of
of zero. The implication
unpaved roads. The grade
is
of
that
the
section was the most important factor in the analysis. The formation
of potholes on steeper grades is minimal as there is very little
ponding of water and generally improved drainage. The importance of
water is confirmed by the fact that as the area becomes more arid (N
increases and rainfall decreases) the pothole severity is decreased.
Contrary to expectations, an increase in the OMC and dust ratio (i.e.
increased plasticity and fines) reduces the pothole severity. This is
indicative of potholes being formed by ravelling of weakly cohesive
material and the relatively small number of potholes formed by weak
wearing courses and subgrades.
Digitised by the Open Scholarship Programme in support of public access to information, University of Pretoria, 2017

- 4.27 -
The Natal wearing course guide (NPA, ca 1961) indicates that material
with a liquid limit greater than 35 percent and a coarse and medium
sand content of less than 30 percent is likely to pothole. During the
project, none of the sections had a pothole severity mode of 5 (i.e.
unacceptable) although 11 sections had modal values of 4
undesirable). Fifteen of the sections had liquid limits greater
35 while 67 had a coarse sand percentage of less than 30. Of
fifteen sections with liquid limits greater than 35 percent only
(i.e.
than
the
four
exhibited undesirable potholes, while six showed potholes rated as two
or less. The NPA guidelines appear therefore to be invalid for the
Transvaal and South West Africa.
Netterberg (1978) noted that "wearing course materials with weak
aggregate tended to break up and form powder potholes under traffic,
especially when compacted dry". No powder potholes were recorded in
the Transvaal where wet compaction is the norm, but many were noted in
the more arid northern Cape and South West Africa where moist
compaction is unusual. Some of the Transvaal sections had very weak
aggregate, however, with Aggregate Pliers Values considerably lower
than the 25 specification of Netterberg (1978). It would thus appear
that moist compaction plays an important part in the reduction of
powder pothole formation.
The successful repair of potholes in certain materials appears to be
difficult. Many of the potholes in the experimental sections remained
through the duration of the monitoring with little change except in
their depth. It was noted that those sections constructed of chert
gravels were the only ones where grader blading adequately repaired
the potholes. It is, however, recommended that potholes be repaired by
manually compacting good replacement gravel at about optimum
content. Presently pothole maintenance generally consists of
filling the pothole with material from the side of the road
usually has a poor grading due to repeated grader blading and
moisture
loosely
(which
removal
of fine material by wind and traffic flow and often includes grass and
litter).
In summary, drainage problems are the major cause of potholes with the
material type being only a minor contributory factor.
Digitised by the Open Scholarship Programme in support of public access to information, University of Pretoria, 2017

- 4.28 -
4.5 CRACKS
The presence of cracks was initially thought to have no effect on the
performance of the roads and was rated as a possible simple indicator
of plasticity. It was however noted that those sections with very bad
cracks broke up quite badly under hea'7 traffic and formed potholes.
4.5.1 Method
Cracks were rated during each monitoring trip using the standard TRH 6
(NITRR, 1980) method. Although the method was devised for asphalt
pavements, the definitions of the severity of distress adapted well to
unpaved roads. The following definitions were used:
1 - No visible cracks
2 - Faint cracks - require close scrutiny to see them
3 - Distinct cracks - easily visible when walking at a reasonable pace
4 - Open cracks with width less than 3 mm
5 - Open cracks with width more than 3 mm
The percentage of the area of the road over which visible cracks of
any s·everity occurred was estimated.
4.5.2 Results
About 5 500 results were used in the analysis. These results were
influenced by a number of factors as follows:
1. During the wet season the cracks did not develop fully. After
periods of rain the cracks were usually closed due to swell of the
wearing course matrix and/or squeezing together of the upper layer
of the gravel under traffic.
£. After grader blading or when a lot of loose material had been
generated by traffic it was often not possible to see cracks with
a severity of less than 5 or to estimate the extent.
3. On very dusty roads the cracks could not be easily discerned.
Digitised by the Open Scholarship Programme in support of public access to information, University of Pretoria, 2017

- 4.29 -
For analysis purposes the average crack severity for each section over
the duration of the project was used. This value was determined
separately for the wet and dry seasons with an average crack severity
of 2,3 (a - 1,09; m - 1,0; M- 5,0) and an average extent of 3,7
(a 1,3; m- 1,0; M = 5,0) for the dry season. The wet season results
were considered to be meaningless.
4.5.3 Analysis
A number of analyses were carried. out in order to identify the
parameters influencing cracking and to derive prediction models. The
following parameters were found to account for 70 percent of the
variability:
Plastic limit (PL), liquid
Aggregate fingers value (AFV),
limit (LL), linear shrinkage
maximum dry density (MDD),
(LS),
grading
modulus (GM), material classification, wet or dry season and Weinert
N-value (N).
Because of the inability to determine the AFV value of fine materials,
this parameter was excluded from the analysis. The following model
was the best obtained for the crack severity (CRS) and had an
r-squared value of 0,59 and a standard error of 0,68:
CRS- 4,50 - 0,16.N - 1,26.GM - 0,076.PL + 0,08.LL (4.4)
The model is significant at the 0,01 percent level as are all the
parameters except the plastic limit which is significant at the 0,5
percent level.
4.5.4 Discussion
Though the final model accounts for about 60 percent of the
variability the 95 percent confidence limits of the prediction are
extremely high (± 1,36) when one considers that the predicted value
should lie between 1 and 5. The variability of the ratings for each
section would thus appear to be very high as was anticipated earlier.
Digitised by the Open Scholarship Programme in support of public access to information, University of Pretoria, 2017

- 4.30 -
As the N-value, grading modulus and plastic limit increase the
propensity of the material to form cracks is reduced, while an
increase in the liquid limit results in a significant increase in the
cracking.
The importance of various other factors such as the clay mineral type
and quantity, traffic, material strength, etc. were found to be
insignificant or were incorporated indirectly by being closely
correlated with some other property.
Other factors such as the maximum daytime temperature, rainfall
intensity, subgrade plasticity and wearing course stiffness would
therefore appear to affect the cracking as well as the properties
identified in Model 4.4.
Apart from the indirect relationships between the plasticity and the
material types, the incidence of cracks could not be related to the
geological properties of the material.
4.6 LOOSE MATERIAL
Loose material is considered an important part of unpaved road
performance. The generation of loose material by traffic results in a
general loss of gravel, the development of ruts and influences the
safety and skid resistance of the road. The presence of thick loose
material affects the rolling resistance significantly, with a
concomitant increase in fuel consumption. Previous studies (Hodges et
al, 1975; Visser, 198lb) quantified the loose material by weighing all
the loose material in a one square metre section of the road.
Initially it was proposed to follow this procedure for this project,
but analysis of the existing results indicated little relationship
between the loose material and other properties. In addition the
results which probably would have been achieved did not warrant the
time which would have been expended on determining the loose material.
The main reason for the poor results is probably the areal variation
of the loose material over the road and the influence of grader
blading.
Digitised by the Open Scholarship Programme in support of public access to information, University of Pretoria, 2017

- 4.31 -
The wheel tracks normally have the least loose gravel of the whole
road while thick accumulations are common at the edge of the
trafficked portion of the road ("sandwalle") and in the centre of the
lane ("middelmannetjie"). It is interesting to note that all of the
accidents seen on or near the experimental sections during the
monitoring period were associated with total loss of control of the
vehicles due to thick berms of loose material (usually more than 100
mm). During roughness testing however it was noted that the most
slippery roads in the dry state were those which had a thin layer of
loose, rounded gravel (usually about 5 mm in diameter) over most of
the surface, such as the quartz porphyry gravels of the western
Transvaal.
4.6.1 Method
A quantitative estimate of the loose material was obtained for each
section during each monitoring trip. If the road had been graded
within the past few days and no distinct wheel tracks were evident no
rating was done. The rating was carried out with the objective of
identifying those materials which were particularly prone to ravelling
under traffic and would thus require frequent grader blading and
regravelling.
The following severity rating system was used:
1 - No loose material at all was present
2 - Less than 10 mm thickness of loose material was present
3 - Between 10 and 20 mm thickness of loose material was present
4 - Between 20 and 40 mm thickness of loose material was present
5 - More than 40 mm thickness of loose material was present
Loose material was defined as that surface material which had no
cohesion and could be freely moved by scraping with a shoe or stick.
The maximum observed severity was recorded provided that this occurred
over more than about five percent of the area of the section or else
the most prevalent severity was recorded. A quantitative estimate of
the total areal extent of the loose material (irrespecti~e of its
severity) in the section was made.
Digitised by the Open Scholarship Programme in support of public access to information, University of Pretoria, 2017

- 4.32 -
The thicknesses used for this project are significantly less than
those recommended by Eaton et al, (1987), where a low severity is less
than two inches (SO mm) while a high severity is more than four inches
(100 mm) of loose gravel. The local monitoring experience has shown
these values to be unrealistically high as thicknesses of SO mm play
an important part in influencing the control that the driver has over
the vehicle.
4.6.2 Results
The average loose material for each section over the duration of the
project was analysed in terms of the salient properties. The influence
of time on the generation of loose material was considered important
initially but observation indicated that within about three weeks of
grading, the loose material reached an optimum thickness and only the
extent varied after this. Redistribution of the material seemed to
occur and a gradual loss by vehicle whip-off and surface erosion
probably removed what was being generated.
The average loose material severity rating for all the sectious was
3,0 (a 0,68; m 1,43; M = 4,62) with a similar average for the
extent ratings (a 0,67; m- 1,1; M = 4,S).
4.6.3 Analysis
The important factors affecting the formation of loose material were
identified by a multiple correlation analysis. The following
parameters all had Pearson Correlation Coefficients in excess of 0,3S
(significant at the 0,01 percent level):
Weinert N-value (N), rainfall (RAIN), percent heavy vehicles
(PERHEAV), in situ density and moisture (DENS and MOIST), liquid limit
(LL), plastic limit (PL), percent smaller than 0,07S (P7S) and
0,002 mm (P2M), dust ratio (DR), grading modulus (GM), optim~
moisture content (OMC), maximum dry density (MDD), soaked CBR (SCBR)
and material classification. A linear regression analysis of those of
the variables which can be easily determined and those for which
results were available for all the sections was carried out. The
Digitised by the Open Scholarship Programme in support of public access to information, University of Pretoria, 2017

- 4.33 -
material classification was not used in the analysis as it is a
classification variable and is not continuous.
An r-squared value of 0,59 was obtained for the best model which had a
standard error of 0,44 (F- 51, significant at 0,01 percent level):
LOOSE MATERIAL- 0,68 - 1,49.DR + 0,09.N + 0,0013.MDD (4.5)
The other significant variables were all excluded during the
regression analysis with a decrease in the r-squared value of only
0,02.
4.6.4 Discussion
The loose material is mainly dependent on the climatic N-value with
this accounting for 37 percent of the total variability. The cohesion
of the material would be expected to be an important factor
influencing the loose material generation and this is taken into
account in the density and dust ratio parameters where the plasticity,
fine fraction grading and strength all correlate closely. It must also
be noted that the N-value has an important influence on the mineralogy
of the gravel (Weinert, 1980).
The 95 percent confidence limits (± 0,88) are again somewhat larger
than hoped for, indicating either that substantial variation occurred
in the results or that some property which was not analysed (e.g.
vehicle speed, rainfall intensity, etc.) affects the generation of
loose material significantly. The rating system consisting of integer
values probably also plays an important role in this high standard
error.
The NPA wearing course guide indicates that material with a liquid
limit less than 20 per cent, and/or a plasticity index and clay
content of less than six per cent are likely to ravel in dry weather
(Mitchell et al, 1979). Seven of the sections monitored had modal
values for the loose material severity of 5 (i.e. unacceptable) while
32 had values of 4 (i.e. undesirable). In terms of the NPA guidelines,
23 sections had liquid limits less than 20 and 39 sections had
Digitised by the Open Scholarship Programme in support of public access to information, University of Pretoria, 2017

- 4.34 -
plasticity indices less than 6. Clay fraction determinations were not
done on the South West African sections but of the Transvaal sections
26 had percentages less than 6. There was, however, no correlation
between the limits in the guide and the formation of loose material.
The loose material did not correlate significantly with the material
groups although a poor but significant correlation (r = 0,36) was
found with the material classification. Although the material
classification is discontinuous there is a general increase in
plasticity with an increase in the classification number allocated.
The use of so-called "sand-blankets" over unpaved roads provided some
interesting observations. These sand blankets are theoretically a thin
layer of fine material bladed over the surface of the road. It would
appear that they were originally intended as a protective layer over
calcrete wearing courses which had formed a crust ("blad" (Netterberg,
1967)) by avoiding breaking of the surface crust under heavy traffic
and during grader maintenance. The purpose of these sand blankets
seems, however, to have been obscured with time, and many grader
operators now blade a loose layer of material as a standard procedure.
This results in a number of problems as follows:
• Ruts are filled with permeable, loose material and form drainage
channels.
• No definite crown is retained on the road, resulting in poor
drainage, and ultimately a concave cross-section.
• The loose material affects the overall safety of the road
significantly.
• Towing with
difficult.
front-wheel-drive vehicles is made extremely
• Numerous oversize stones are included in the loose material which
can cause significant damage to vehicles and tyres.
• This material is particularly prone to the formation of
corrugations. Corrugations removed by blading have been seen to
reform within 24 hours, under less than 50 vehicle passes.
• Many sand blankets are particularly dusty.
It is recommended that the practice of blading a thick layer of loose
Digitised by the Open Scholarship Programme in support of public access to information, University of Pretoria, 2017

- 4.3S -
material over unpaved roads is curtailed and sand-blankets are limited
to a thin layer (not more than lS mm) of fine material over roads with
a definite crust or "blad".
4.7 DRAINAGE AND EROSION
During the monitoring a single evaluation of the surface drainage of
each section was made. The drainage parameter evaluated the water
shedding capability of the section and implicitly included any
evidence of erosion. This resulted in one ·descriptor for both
parameters. Although this was adequate for most of the sections, in
retrospect separate evaluations would have provided a lot more useful
data. Fortunately, because of the repeated visits to the sections the
characteristics of each one became well known and it was possible
during analysis to recall the erosion susceptibility of each section.
4.7.1 Method
The surface drainage and erosion were evaluated according to the
following severity criteria:
1 - No water would accumulate or lie on the road surface.
No surface erosion was evident
2 - Shallow depressions may retain water for a limited period but most
water would drain rapidly. Side drains were effective.
No surface erosion was evident
3 - water may be retained in shallow ruts and potholes and in the
side-drains.
Surface erosion was restricted to loose material.
4 - Water may be retained in depressions up to SO mm deep. This
lead to weakening of the material by saturation and
development of potholes under trafficking.
Surface erosion affects the compacted material to a dep~h of
than SO mm.
could
the
less
S - Water ponds in ruts and potholes to a depth greater than 50 mm and
lies in side-drains for a number of days.
Surface erosion results in channels deeper than SO mm.
Digitised by the Open Scholarship Programme in support of public access to information, University of Pretoria, 2017

- 4.36 -
4.7.2 Results
As it was seldom raining during monitoring the surface drainage was
evaluated with respect to the observed drainage characteristics e.g.
cross-section, side-drains, potholes, ruts, erosion, etc. Obvious
signs of poor drainage such as wheel ruts and churning were looked
for. The average ratings of severity and extent for all the sections
were 3,23 (a- 0,65; m- 1,78; M- 4,62) and 3,59 (a- 0,54; m- 2,33;
M- 5,0) respectively.
4.7.3 Analysis
A correlation matrix was developed in order to identify the
significant variables (at the 5 per cent level). These were the
N-value (N), rainfall (RAIN), average daily traffic (ADT), plastic
limit (PL), laboratory maximum size (LABMAX), per cent passing 4,75 mm
sieve (P475) (the best of many significant grading parameters),
grading modulus (GM), gravel index (GI), AFV, APV, OMC and relative
compaction (COMP).
The r-squared value for the best model was 0,40 (significant at the
0,01 per cent level) which had a standard error of 0,55. Exclusion of
the APV results reduced the r-squared value to 0,32 but included the
results from all the sections.
The best model obtained for the surface drainage severity (SURDR) was
the following:
SURDR = GM(5,63 - 0,18.PL - 0,02.P475) + LABMAX(O,lS - O,OOl.COMP)
+ N(0,06 - 0,002.APV) - GI(l7,32 - 0,8l.PL) + 0,04.P475
+ 0,06.COMP + 0,002.ADT - 6,9 (4.6)
This is a fairly cumbersome model involving a number of interactions,
but it identifies the grading parameters and plasticity as the main
material factors.
Digitised by the Open Scholarship Programme in support of public access to information, University of Pretoria, 2017

- 4.37 -
4.7.4 Discussion
When one considers that the main factor influencing the surface
drainage is the cross section and shape of the road a high correlation
between the surface drainage severity and the material and
environmental properties cannot be expected. The cross-section is
however controllable by using well trained and experienced grader
operators and not allowing the shape of the road to deteriorate to a
condition which cannot be easily restored.
The rainfall intensity and duration are certainly significant
parameters in the surface drainage and erosion characteristics of an
unpaved road.
No significant correlation was found between the material groups and
classification and the drainage and erosion problems. It was, however,
generally observed that granitic materials were susceptible to
erosion, but this was probably more because of their particle size ·
distribution than the fact that they were granites.
4.8 SLIPPERINESS
The slipperiness of unpaved roads in both the wet and dry states is
important from the safety aspect. This is confirmed by the average
plasticity index of all the sections which is biased towards the lower
end of the existing specifications. It would appear that non-slippery
materials are intentionally selected.
4.8.1 Methods
During the monitoring the slipperiness rating was based on the
perceived handling of the LDI vehicles at 80 kmfh. It was, however,
decided to obtain a more qua~tifi~d val~c towards the end of the
project and a MOTOMETER brake efficiency meter was used to measure the
actual deceleration under locked-wheel skidding tests. A number of
tests on various surfaces were carried out in order to check the
validity of the equipment for slipperiness testing. The results of
Digitised by the Open Scholarship Programme in support of public access to information, University of Pretoria, 2017

- 4.38 -
these are shown in Figure 4.4. Assuming uniform deceleration (i.e.,
constant tyrejroad friction or skid resistance), the deceleration is
independent of the speed and this was confirmed by a number of braking
tests from different speeds (Figure 4.5). Safety and tyre wear
considerations resulted in all the testing being done from 50 km/h.
All the A sections in the Transvaal remaining at the end of the
project were tested in the dry condition and as many as possible under
wet conditions. The B sections were not tested as the horizontal
curvature would have made skidding dangerous and the grade would have
yielded different results depending on whether testing was in the
uphill or downhill direction. Testing in the wet condition relied
purely on chance (whether it was raining at the time of visit to any
section) and logistical considerations made testing of all the
sections distant from Pretoria impossible. Testing was carried out in
both directions in the wheel-paths and loose material, where it
occurred, with six tests generally being done per section.
4.8.2 Results
The average deceleration of all the sections tested in the dry state
(45) was 5,9 mjs2 with a maximum of 8,0 and a minimum of 4,1
(a- 0,57). The six sections tested wet had an average value of 5,3
mjs 2 with a maximum of 6,2 and a minimum of 4,1 mjs2 (a- 0,83).
4.8.3 Analysis
A correlation matrix was developed for the mean slipperiness when dry
and the significant variables identified. These were the mean annual
rainfall (RAIN), average daily traffic (ADT), per cent passing the 26
mm (P26) and 0,075 mm (P75) sieve, the plastic factor (PF), optimum
moisture content (OMC), and dust ratio (DR). The best model obtained
had an r-squared value of 0,70 with a standard error of 0,33 (Model
4.7).
SLIPPERINESS- 7,69 - RAIN(O,OOl + 0,000l.P75) - 0,018.P26 - 0,004.PF
+ 1,08.DR (4.7)
Digitised by the Open Scholarship Programme in support of public access to information, University of Pretoria, 2017

N
"' ' E
z 0 1-4 ll: LJ.J ...J LJ.J u UJ 0
-l'\1
"' ' E
z 2 1-4 ll: LJ.J ...J LJ.J u LJ.J 0
- 4.39 -
9,81 ASPHALT SURFACING
9
8
7
6
5
4
3
2
GOOD GRAVEL ---- --- WET CHIP SEAL
'f-~ ....... LOOSE GRAVEL
--~ .-::.-: =" --\ • • • • • • • l \ TYPICAL UNSEALED GRAVEL . ·- :•:.-.. -- . . . ., filii"' •• • ··--,-.- •• •••••,t•••••• •• SHOULDER (FAIRLY STONY) .. . . -... ....... •.
.······. ·-r ... . \ .. ~·. ...
\ i\ 0 ·~/MUDDY PATCH ON GRAVEL ROAD WET GRASS \ • ·,
,-------~ ~' ,. , --"""4 ' • ..... . .
0 2 3 4 5 TIME (SECONDS)
FIGURE 4.4
EFFECT OF DIFFERENT SURFACES ON DECELERATION
9,81
9
8
7
6
5
4
3
2
0
. . . • . I
... I I . . I . . .
-- .-.----/ --------~..,----~·~· -·~.-~----------- ---~ \ --, ~ \ : . \
: \ \ . . I I 30 40 • 60 \ 80 \
. . • • .
. I I
I km/h: kmlh. km/h\
~ \ \ . . . 2 3
TIME (SECONDS)
FIGURE 4.5
4 5
EFFECT OF DIFFERENT SPEEDS ON DECELERATION
Digitised by the Open Scholarship Programme in support of public access to information, University of Pretoria, 2017
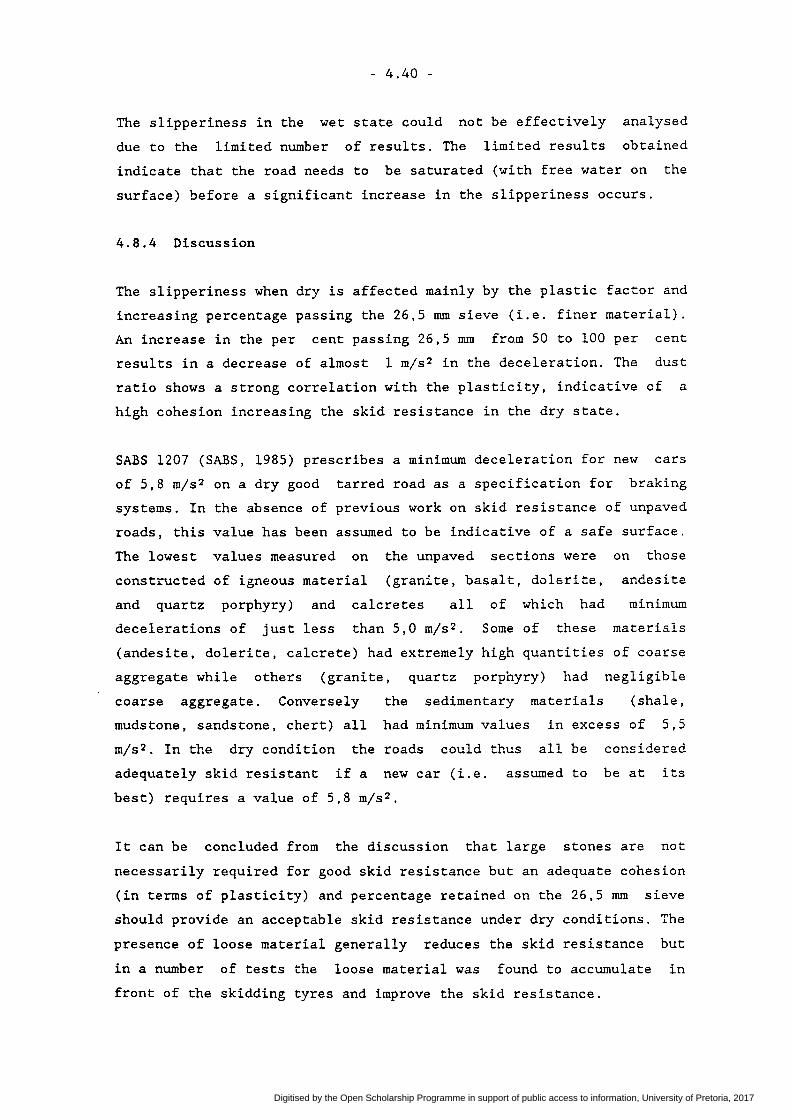
- 4.40 -
The slipperiness in the wet state could not be effectively analysed
due to the limited number of results. The limited results obtained
indicate that the road needs to be saturated (with free water on the
surface) before a significant increase in the slipperiness occurs.
4.8.4 Discussion
The slipperiness when dry is affected mainly by the plastic factor and
increasing percentage passing the 26,5 mm sieve (i.e. finer material).
An increase in the per cent passing 26,5 mm from 50 to 100 per cent
results in a decrease of almost 1 mjs2 in the deceleration. The dust
ratio shows a strong correlation with the plasticity, indicative of a
high cohesion increasing the skid resistance in the dry state.
SABS 1207 (SABS, 1985) prescribes a minimum deceleration for new cars
of 5,8 mjs2 on a dry good tarred road as a specification for braking
systems. In the absence of previous work on skid resistance of unpaved
roads, this value has been assumed to be indicative of a safe surface.
The lowest values measured on the unpaved sections were on those
constructed of igneous material (granite, basalt, dolerite, andesite
and quartz porphyry) and calcretes all of which had minimum
decelerations of just less than 5,0 mjs2. Some of these materials
(andesite, dolerite, calcrete) had extremely high quantities of coarse
aggregate while others (granite, quartz porphyry) had negligible
coarse aggregate. Conversely the sedimentary materials (shale,
mudstone, sandstone, chert) all had minimum values in excess of 5,5
mjs2. In the dry condition the roads could thus all be considered
adequately skid resistant if a new car (i.e. assumed to be at its
best) requires a value of 5,8 mjs2.
It can be concluded from the discussion that large stones are not
necessarily required for good skid resistance but an adequate cohesion
(in terms of plasticity) and percentage retained on the 26,5 mm sieve
should provide an acceptable skid resistance under dry conditions. The
presence of loose material generally reduces the skid resistance but
in a number of tests the loose material was found to accumulate in
front of the skidding tyres and improve the skid resistance.
Digitised by the Open Scholarship Programme in support of public access to information, University of Pretoria, 2017

- 4.41 -
Although only six roads were tested wet the decrease in average
deceleration was generally between 4 and 40 per cent with a granite
road increasing in skid resistance by 5 percent. The highest recorded
decreases were for the shale roads which reduced from initial values
of 6,4 to 6,7 mjs2 to between 4,1 and 4,5 m/s 2 . Free water was on the
surface when the the value of 4,1 mjs2 was measured. Again the roads
with the largest proportion of oversize material (shales) were the
most slippery while the granite road with no stones at all increased
in skid resistance (probably due to the rapid infiltration of water
and capillary cohesion of the loose material.
4.9 TRAFFICABILITY (PASSABILITY)
All weather trafficability or passability of unpaved roads is probably
the main consideration for the existence of engineered unpaved roads
and the necessity to import suitable gravels. Previous work carried
out by Visser (198la) indicated that a minimum soaked CBR
(intermediate Proctor compaction) of 12 is necessary for passability ·
for an ADT of 12 while a value of 18 is required for an ADT of 400. In
addition the duration of the rainfall should be considered and not the
intensity (Visser, 198la). Heavy rainstorms of short duration (common
in the western areas of the study region) usually result in fairly
rapid drainage and drying whereas continuous light rain such as that
prevalent in the eastern areas results in penetration into the wearing
course and an overall weakening of the material. Visser (198la) showed
that the plasticity index and per·cent finer than 0,075 mm were not
adequate indicators of passability.
The trafficability is basically an indication of the load supporting
characteristics of the material. The wearing course should have an
adequate strength (in the weakest condition it is likely to achieve)
to support the number of vehicles passing over it without excessive
deformation or weakening of the trafficked surface or excessive
stressas being transferred to the underlying layers which themselves
may deform or shear. The weakest state is always associated with wet
conditions. The wearing course deformation generally takes the form of
shallow surface shearing (churning) with the formation of a
progressively deepening layer of uncompacted low strength "mud". If
Digitised by the Open Scholarship Programme in support of public access to information, University of Pretoria, 2017

- 4.42 -
the wearing course strength decreases to such a degree that it cannot
distribute the applied stresses adequately over the subgrade deeper
seated shearing occurs resulting in exposure of the subgrade and the
formation of deep potholes surrounded by low strength saturated soil.
4.9.1 Methods
The monitoring of the trafficability was based on visual examination
of each section during the routine visits. Any evidence of vehicles
being bogged down or churning of the wearing course would indicate
poor or unacceptable trafficability. No section during the course of
the project showed any evidence of impassability although some of the
sections showed limited areas of minor shearing and rutting which
under heavier traffic may have resulted in unacceptably poor
trafficability or impassability. These were generally associated with
areas of inadequate drainage. The general conclusion from the
observations was that the traffic was minimal during very wet periods.
The severity of the trafficability was rated according to the
following criteria:
1 - No evidence of softening of the wearing course
2 - Shallow wheel tread impressions were present (< 5 mm)
3 - Marked wheel tread impressions were present ( ± 10 mm)
4 - Churning of the surface was evident
5 Evidence of substantial churning and shearing of the wearing
course was present
Although the passability of severity 5 sections was still acceptable
the fact that all of the sections were numbered roads resulted in a
conservative rating. It was considered that if the condition was
extended for longer distances the effect of wheel spin and "mud-spray"
would probably result in rapid deterioration of the sectio~s. The
rating was thus an indicator of the possible problems under sustained
traffic in prolonged periods of wet weather.
Digitised by the Open Scholarship Programme in support of public access to information, University of Pretoria, 2017

- 4.43 -
4.9.2 Results
Very few results, none of which indicated unacceptably poor
trafficability were obtained. The worst condition monitored for each
section was thus used in the analysis. The average of the worst
condition for all the sections was 2,6 (a= 1,5; M = 5; m = 1). In all
cases the ratings of 5 were over limited lengths of the road
(generally less than 20 per cent) and were usually associated with
poor drainage which resulted in ponding and churning under traffic.
4.9.3 Analysis
A multiple correlation analysis indicated that the rainfall, in situ
density, liquid limit, linear shrinkage, plasticity index, optimum
moisture content, maximum dry density and kaolin, smectite, illite and
calcite contents were the only variables significant at the 5 per cent
level. The plasticity index and calcite content have the highest
positive correlation while rainfall has the
correlation. Visser (198la) showed that the soaked
highest negative
CBR was the best
indicator of pa~sability while the grading and plasticity factors were
inadequate. Yoder (in Netterberg, 1978) indicated that the soaked CBR
(Modified AASHTO compaction) above 60 was necessary for wearing
courses under heavy truck traffic. The results of this study show a
poor correlation between soaked CBR (Proctor compaction) (r- 0,1).
This may be due to the fact that none of the sections showed any
unacceptable trafficability over any significant length.
4.9.4 Discussion
Visser (198la) provided a number of plots of various material
properties against traffic with limits for passability. The maximum
CBR for impassability (CIM) was defined in terms of the traffic (ADT)
as
CIM- 8,254 + 3,745 LoglO (ADT) (4.8)
No definite relationships existed for material grading or plasticity
parameters.
Digitised by the Open Scholarship Programme in support of public access to information, University of Pretoria, 2017

- 4.44 -
During the wide-spread flooding of the northern areas of South Africa
in February, 1988 most of the unpaved roads over large areas were
totally closed to traffic. Many of these roads, however, had high
soaked strengths (in terms of the CBR) in terms of existing standards.
Two reasons for the inadequacy of these roads are proposed.
1. Nearly all natural gravels used in unpaved roads contain clay
minerals, which expand on absorption of water to a greater or
lesser extent. Under flooded conditions some expansion of the
clays occurs and the compaction density decreases resulting in a
lowering of the strength.
2. The CBR test involves the application of a load at 1,27 mm/min
which is probably adequate to allow pore-water pressure
dissipation for most soils, certainly in the partially saturated
state which is probably not exceeded under normal rainfall
conditions. Under a moving wheel, however, the load application is
much quicker, and if the material is in the fully saturated state.
(e.g. after prolonged total submersion during flooding) the pore
water pressure will not dissipate and the material will fail under
total stress conditions.
4.10 CORRUGATIONS
Corrugations typically consist of a series of ridges perpendicular to
the direction of the road. Where they occur they are usually the major
contributors to roughness (Paige-Green and Netterberg, 1987) and can
also cause considerable damage to vehicle suspension systems (Heath
and Robinson, 1980). Corrugations also lead to intermittent loss of
contact between tyres and the road surface, reducing the effectiveness
of steering and braking which can lead to loss of control of the
vehicle. The most extreme roughness measurements recorded during the
project were on badly corrugated roads. Unlike other forms of distress
such as stones and potholes which can usually be avoided at =e~sonable
speeds, corrugations often become worse as the vehicle decelerates or
accelerates. Two distinct types of corrugation were recorded during
the project:
Digitised by the Open Scholarship Programme in support of public access to information, University of Pretoria, 2017

- 4.45 -
a. "Loose" corrugations which consisted of parallel ridges of
unconsolidated sandy material perpendicular to the direction of
travel (Plate 4.3).
b. "Fixed" corrugations which consisted of hard compacted parallel
ridges of material (Plate 4.4). Some of these corrugations were
perpendicular to the direction of travel (usually about one metre
wavelength) while others were at about forty five degrees to the
direction of travel (usually 2,5 to 3,0 metre wavelength).
Corrugations were observed in a number of situations not all of which
were the fault of the materials used for construction:
1. The most common cause of corrugations was apparently due to
excessively sandy material with a paucity of plastic fines and
minimal cohesion.
2. Very stony roads often indicated a form of corrugation probably
due to the oscillation of the vehicle initiated by the stones.
3. A number of sections exhibited
between 2,5 and
maximum depth
3,0 metres and
150 mm). These
type", at 45° to the direction
grader maintenance.
corrugations with a wavelength of
amplitudes of up to 75 mm (i.e.
corrugations were of the "fixed
of travel and were not removed by
4. Corrugations generally do not occur during the rainy season.
4.10.1 Methods
The severity of corrugations was rated for all sections in the
Transvaal on the following basis:
Digitised by the Open Scholarship Programme in support of public access to information, University of Pretoria, 2017

- 4.46 -
PlATE 4.3: TYPICAL "LOOSE" CORRUGATIONS WITH UNCOMPACTED CREST
PlATE 4.4: TYPICAL "FIXED" CORRUGATIONS WITH COMPACTED CREST
Digitised by the Open Scholarship Programme in support of public access to information, University of Pretoria, 2017

- 4.47 -
1 - No corrugations were visible
2 - Slight corrugations were visible but could not be felt in the
monitoring vehicle at 80 km(h
3 - Significant corrugations could be felt but were not bothersome to
the occupants
4 - Severe corrugations were felt and required evasive action e.g.
speed reduction
5 - Very severe corrugation necessitated drastic speed reduction and
affected the directional stability of the vehicle.
This severity rating was, however, not carried out for the South West
Africa sections as it was only developed some time after monitoring
began in South West Africa. The average amplitude, wavelength and
width was measured and the areal extent of corrugations estimated for
all sections in the Transvaal and South West Africa as described in
Chapter 3.4.
4.10.2 Results
The average corrugation depth
section over the duration of
and spacing (wavelength) for each
the project was determined. If no
corrugations were evident a missing value was recorded and the average
was determined on the measured values. Those sections where no
corrugations occurred at all were given a value of zero for the
analysis. The mean corrugation depth recorded for all the sections was
16,9 mm (u- 10,5; M- 37,8; m- 0) and the mean spacing measured was
759 mm (u- 567; m- 0; M- 2 830 mm). The average maximum depth and
wavelength were 28,4 mm (u 18,9; M 65,0) and 1 198 mm (u - 912;
M - 3 000 mm) respectively. It is interesting to note that the
corrugation depth appears to have a maximum value, which is reached
fairly quickly after maintenance, after which no further increase
occurs even if maintenance is delayed.
4.10.3 Analysis
The depth of the corrugations appeared to be the factor affecting the
roughness the most while the spacing was bimodal with values of about
800 to 900 mm and 2 500 to 3 000 mm. For analysis purposes the
Digitised by the Open Scholarship Programme in support of public access to information, University of Pretoria, 2017

- 4.48 -
maximum measured corrugation depth and wavelength were used as these
were considered better indicators of the propensity to form
corrugations. The significant variables affecting the maximum depth of
the corrugations (which were the same as those for the average depth)
were dust ratio (DR), grade (GRADE), rainfall (RAIN), Weinert N-value
(N), percentage of heavy vehicles (PERHEAV), liquid and plastic limits
(LL and PL), per cent smaller than 0,075 mm (P75), optimum moisture
content (OMC), maximum dry density (MDD), CBR at optimum moisture
content, (OMCCBR) and quartz content.
The liquid limit and quartz content were not included in the analysis
as the plastic limit correlated better than the liquid limit and the
quartz content is difficult to determine.
obtained was the following which had an
standard error of 12,4:
The best prediction model
r-squared of 0,57 and a
CORR- 93,2 - 37,7.DR- RAIN(0,07 + 0,007.GRADE + O,OOl.OMCCBR)
- 0,8l.OMCCBR- PL(0,37.GRADE + 0,25.N) - 0,39.0MC.N
4.10.4 Discassion
(4.9)
The cause of corrugations has fascinated engineers for many years with
theories on their origin having been published regularly since the
first publication by Ladd (1924). Heath and Robinson (1980) summarised
some 30 papers published between 1924 and 1978 and concluded that
"corrugations are formed and perpetuated by forced oscillations at the
resonant frequency of vehicles' suspension and tyre systems".
It was recorded during the project that the average wavelength of
corrugations was about 800 or 900 mm on normal rural roads. The
average spacing in the Kruger National Park, however, was found to be
about 320 mm. The speed limit here is 40 km(h and monitoring showed
that most vehicles travel at a speed of between 25 and 40 km(h. Other
meas~rements were carried out in different areas where characteristic
speeds were found with the following results:
Digitised by the Open Scholarship Programme in support of public access to information, University of Pretoria, 2017

- 4.49 -
Rietvlei Dam: Very stony road limited speeds to about 20 km(h: 200 mm
Kalahari Gemsbok Park: Speed limit 50km(h: 350 - 450 mm
Etosha National Park: Speed limit 60 km(h: 500 - 600 mm
South West Africa rural roads: Average speed± 120km(h: 1000 - 1200 rnm
Augrabies Falls: Drainage mounds restrict speeds to <20krnjh: 200 rnrn
It would thus appear that the wavelength is proportional to the speed
of the vehicles. Further evidence for this is the presence of short
wavelength corrugations near areas of acceleration and deceleration
(e.g. near intersections and sharp corners) on .normal rural roads.
Shorter wavelength corrugations tend to have smaller depths. The
average depth of the corrugations (in the main study) correlates
significantly (at the 0,01 per cent level) with the average wavelength
(r == 0,5).
This would fit in with the "forced oscillation theory" (Heath et al,
1980) where both the horizontal and vertical components of the wheel
movement increase with increasing vehicle speed resulting in a longer ·
wavelength and deeper trough. The impact stresses caused by the impact
of the wheel on regaining contact with the ~ . rca... ::;.ncrease as the
wavelength increases (i.e. the trough of the corrugation is deepened)
while the longer period with no road contact results in a more rapid
spin of the wheels and greater material kick-back resulting in a
higher mound of loose material. In summary it thus appears that the
wavelength of corrugations is speed dependent while their depth is
both speed and material dependent.
Much controversy has been generated over the movement of corrugations
along the road surface (Heath and Robinson, 1980). Some workers
predict movement of the corrugations in the same direction as the
traffic movement (Mather, 1962; Riley and Furry, 1973) while in the
field corrugations have been observed to move in the opposite
direction to the traffic flow (Gresillon, 1978). Floren tin and
L'Heriteau (1950) suggest that corrugations move in the same direction
as traffic during their formation, but in the reverse direction once
they have stabilised. The proportionality of the speed and the spacing
can account for both of these theories. Should the average speed of
travel change for some reason (e.g. more heavy vehicles, tourist
Digitised by the Open Scholarship Programme in support of public access to information, University of Pretoria, 2017

- 4.50 -
season, etc) the corrugation spacing can be expected to change, with a
concomitant movement of the corrugations (forward for increased
average speed; backwards for decreased average speed).
No reference was found in the literature to the formation of "fixed
corrugations". Two distinct forms of these were recorded during the
study and attributed to different causes.
1. Some of the sections were found to have large wavelength, fixed
corrugations (between 2,5 and 3,0 metres) with troughs up to 150
mm deep which were not removed by grader blading. The corrugations
were generally at an angle of about 45° to the direction of the
road and the materials were generally cohesive with plasticity
indices of about 10. During the blading operation it was noted
that the grader rode over the corrugations and did not cut them at
all. It was then found that the wavelength of the corrugations was
the same as the distance between the front wheels of the grader
and the grader blade which was at an angle of 45°. Normal grader·
maintenance will not remove these corrugations. In order to
remove this type cf corrugation it is recommended that the
blade is extended out of the side of the grader and the
grader
grader
drives on the uncorrugated shoulder for the first cut i.e., the
grader is not affected by the corrugations.
2. Fixed corrugations with a wavelength of about 900 to 1 000 mm were
common in both the Transvaal and South West Africa. These consist
of well compacted wearing course material and may be formed by two
processes.
• Compaction of loose crest material - The normal corrugations
formed of loose material appear in some cases to have been
compacted in a moist condition under traffic. Examination of
the crest material shows a fairly sandy material different to
the ur.der!ying corupactec ~aaring course material. A certain set
of conditions would be necessary for this to occur as
corrugations are usually flattened out by traffic in the wet
season. The moisture content probably needs to be at about
optimum and the percentage of heavy vehicles should be low.
Digitised by the Open Scholarship Programme in support of public access to information, University of Pretoria, 2017

- 4.51 -
• Compaction of firm trough material - Evidence was noted of the
possibility that during the dry season the impact of the wheels
on regaining contact with the road after passing over the crest
of the corrugation causes compaction of the material in the
trough. Grader maintenance spreads out the crest material but
leaves unconsolidated fine material in the troughs which are not
affected by the blading. This material is rapidly "whipped out"
to leave deep troughs which perpetuate the process.
Fixed corrugations are not normally removed by ro~tine grader blading.
The tops of the crests are usually skimmed off and loose material is
deposited in the troughs. The loose material is soon kicked back to
the crests and new corrugations form. Where fixed corrugations occur
heavy cutting by the grader is necessary to remove them and regular
blading is required to stop them forming again. It does not help to
fill them with loose material cut from the crests.
4.11 RUTS
Ruts on unpaved roads are contir.couG longitudinal depressions marking
the wheel paths in the wearing course. Rutting is caused by the
ravelling and loss of gravel from the wheel paths under traffic and/or
the compaction in the wheel paths of the wearing course or subgrade
under traffic loading. The rut depth has in the past been used as an
indication of failure or the point of terminal use (Ahlvin and
Hammitt, 1975; Paterson et al, 1975), where ruts of between 50 and
100 mm are classified as a failure condition.
The development of ruts on unpaved roads has been investigated in
great detail in
198la). Both of
Kenya (Hodges et al, 1975) and in Brazil (Visser,
these studies produced equations for rut depth
prediction none of which were particularly good models in terms of
their prediction accuracy. This was attributed to the variability in
location, a~d therefore depth of ruts with time and traffic (7isser,
198la).
Digitised by the Open Scholarship Programme in support of public access to information, University of Pretoria, 2017

- 4.52 -
4.11.1 Methods
The procedure followed in Brazil (Visser, 198la) was used for this
project. However after about 8 months of monitoring it was noted that
the development of ruts was minimal and the measurement techniques
resulted in large variations in measurements. This was particularly
true for the roads with a large number of oversize stones where it was
difficult to seat the straight edge and obtain consistent results.
For this reason and the time involved in the collection of this
somewhat variable data it was decided only to measure ruts where
significant well-defined ruts occurred with the objective of
identifying those materials which were particularly prone to rutting.
4.11.2 Results
The ruts were measured in both directions of the section and the
traffic average depth over the section calculated. However, as the
counts were for both directions the average rut depth over the whole
section was used in the analysis. In all 1 370 rut depth measurements
were obtained (each one the mean of 6 meesure1nents in each wheel track
of the section). The average rut depth for each section over the
duration of the project was then determined. This value is biased on
the high side as measurements were not carried out if no obvious ruts
were observed and more measurements were thus taken when the ruts were
at their deepest. The mean rut depth of all the sections was 7,8 mm
with a minimum and maximum of 2,5 and 17,9 mm respectively. The
values are surprisingly low considering that Inany of the sections were
left ungraded for periods of up to 6 months or more.
4.11.3 Analysis
Attempts to predict the rate of
for the Brazil study were
rut development along the lines
generally unsatisfactory.
used
The
identification of those pr~perties which led to rut development was
thus carried out by a multiple correlation analysis. The significant
properties (at the 1 per cent level) were the rainfall (RAlN), Weinert
N-value (N), average daily traffic (ADT), percentage heavy vehicles
(PERHEAV), laboratory maximum size (LABMAX), per cent passing 4,75 and
Digitised by the Open Scholarship Programme in support of public access to information, University of Pretoria, 2017

- 4.53 -
0,075 mm sieves (P475 and P75), optimum moisture content (OMC),
maximum dry density (MDD) and plastic factor (PF). A multiple
correlation with these parameters resulted in an r-squared value of
only 0,24 for the best model (standard error- 2,79).
This low correlation is indicative of the variation in the non
material factors affecting the rut depths which were not included in
the analysis (e.g. drainage, vehicle wander, trafficked road width).
4.11.4 Discussion
Eaton et al (1987) and Ahlvin and Hammitt (1975) indicate rutting of
25 mm as low severity with ruts deeper ~han 75 mm as high severity.
The average values obtained in this study are thus all of low severity
with very few measurements of more than 50 mm obtained during the
study.
The factors affecting the formation of ruts are basically similar to.
those influencing the gravel loss. Climate and traffic have a strong
influence on the rut formation while a low plasticity results in
ravelling and material whip-off.
Jones (1984a) monitored the rut depths of lateritic, quartzitic,
volcanic and sandstone gravels in Kenya and developed different
prediction models for each material group. No laboratory test results
are given in the paper, although testing was carried out. The models
predict the rut depth from the traffic alone (no statistics are
provided) and do not account for the material variability within the
material groups (e.g. volcanic gravels in this study had PI values in
the range 1,5 to 14,0). The rut depths on volcanic and quartzitic
materials were predicted from the following models:
Rut depth- 10,11 + 0,314T + 0,0003T2 + 0,00002T3 (volcanic) (4.10)
Rut depth= 7,49 + 0,171T + 0,014T2 - 0,00009T3 (quartzitic) (4.11)
where T - cumulative traffic in thousands.
Digitised by the Open Scholarship Programme in support of public access to information, University of Pretoria, 2017

- 4.54 -
This model indicates that minimum rut depths of about 10 and 7,5 mm
are always present and after 10 000 vehicle passes (i.e. 100 vehicles
per day for over three months) the depths increase to 13 and 10 mm
respectively. The curves were based on cumulative traffic counts of up
to 120 000.
Under the normal grading frequencies used in southern Africa and even
the reduced frequencies for this project, the rut development is often
minimal. It can usually be neglected in maintenance management
systems as maintenance required for roughness correction generally
corrects the rutting.
4.12 CONCLUSIONS
A number of multiple correlation analyses have been carried out to
identify the main factors affecting the various performance criteria
of unpaved roads. Most of these models have very low r-squared values
and relatively high standard errors in terms of prediction models.
Results from all the standard engineering classification tests, many
strength tests and a nt~ber of non-routine tests were used in the
analyses and the best prediction models with this data were obtained.
The fact that only about 50 per cent of the variation is accounted for
by most of the models indicates .that· other factors not taken into
account in the analyses are as important. A number of these factors
have been discussed in the chapter (e.g. variation in t~affic volume
and speed, rainfall intensity, quality of maintenance etc.) but other
unidentified factors must also be important. It is, however, unlikely
that these factors can be controlled and this type of influence has to
be accepted.
The interaction of different performance parameters results in
problems with the interpretation of the behaviour of the materials.
Potholes, rutting, trafficability and dust for example are all
strongly influenced by surface drainage which in itself may be
influenced by potholes and rutting.
Digitised by the Open Scholarship Programme in support of public access to information, University of Pretoria, 2017
- 4.55 -
The geotechnical properties (particle size distribution and plasticity
in particular) influence the performance of the materials
significantly.
The observations and measurements of corrugations support the "forced
oscillation theory" as the cause of their development. New theories
regarding the influence of vehicle speed on the depth, spacing and
movement of corrugations have been propounded, while the differences
between loose and fixed corrugations and probable causes of the latter
are discussed.
As no published records of the skid resistance of unpaved roads could
be found, measurements of the slipperiness of typical unpaved roads
was carried out. The results indicated that at worst, dry unpaved
roads are only slightly more slippery than average paved roads but are
adequately safe. In the wet condition, unpaved roads become more
slippery but apparently only unacceptably slippery when free water
occurs on the surface.
Plasticity and grading are the main contributors to the performance of
the wearing courses and the development of the specifications should
concentrate on the use of these two parameters.
Digitised by the Open Scholarship Programme in support of public access to information, University of Pretoria, 2017

CHAPTER 5
ROUGHNESS PREDICTION
5.1 INTRODUCTION
The roughness of a road is the most important condition parameter
affecting the vehicle operating cost of that road. The roughness is a
reflection of both the surface type and properties and ~he maintenance
standards, and has been shown to be a significant·contributor to every
vehicle operating cost except depreciation (Harral and Agarwal, 1975;
Lu, 1985). Until the early 1970s no research had been done on
roughness measurement of unpaved roads or the quantitative
of the roughness of .unpaved roads. The main reason for
prediction
this was
probably the lack of suitable roughness measurement equipment.
With the development of simple, durable, response type measurement
devices such as the British "Bump Integrator" (BI) and the locally·
constructed "Linear Displacement Integrator" (LDI) the measurement
road roughness became fairly simple and repeatable. The
of
bump
integrator is an inexpensive, simple mechanical device which is used
at 32 km(h and calibrated against a beam and towed fifth wheel. The
LDI on the other hand is a slightly more sophisticated electronic
device which can be used at any speed (usually 80 kmjh), but must be
calibrated at that speed over a series of calibration sections (see
Chapter 3.4.3). A comparison of the measurements of the two devices
showed a good correlation but large discrepancies occurred in roads
with corrugations because of the different speeds of testing
(Paige-Green, 1986). The correlation between the Bump Integrator (BI)
and Quartercar Index (QI) used in this study is that given by the
World Bank (1985) as follows:
1 12 BI roughness - 630 (QI/13) ' (5.1)
The first published work on roughness prediction for unpaved roads was
that carried out in Kenya (Hodges et al, 1975). This project had the
advantage of being in a third world country where normal maintenance
is minimal. It was thus possible to include a number of sections with
Digitised by the Open Scholarship Programme in support of public access to information, University of Pretoria, 2017

- 5.2 -
nil maintenance over the duration of the experiment.
This allowed some of the sections to carry in excess of 100 000
vehicles before grading although most of the sections were graded
before 13 000 vehicles had passed over them. The factors which were
considered to affect roughness were traffic, rainfall, gravel type and
particle size distribution. The rainfall was subsequently shown to be
an unimportant factor in Kenya.
Two models for the predicted roughness were obtained, one for coral
gravels and another for lateritic, volcanic and quartzitic gravels as
follows:
R- 6500 + 58.T- 1,02.T2 + 0,017,T3
for coral gravels (r2 - 0,61)
R = 3250 + 84.T - 1,62.T2 + 0,016.!3
for lateritic, quartzitic and volcanic gravels (r2 - 0,94)
where
R - mean roughness in mm/km at 30 km/h
(5.2)
(5.3)
T -cumulative traffic volume in both directions (in thousands of
vehicles).
Other than the correlation coefficients (r 0,78 and
respectively), no statistical information is provided for
0,97
the
regression equations. An examination of the results however indicates
a strong concentration of values at traffic volumes below 13 000
vehicles and few values above 60 000 vehicles with an influential
point above 100 000 vehicles for Model 5.3. This may account for the
high r-squared value for Model 5.3 when the expected variability of
roughness is considered. A disturbing aspect of these models for use
outside Kenya is the absence of any climatic or material properties
(other than material type), with the roughness being totally dependant
on the traffic. Although these models may be valid in the long term
for roads with very little maintenance, they are unlikely to apply to
those roads with periodic maintenance where corrugations, erosion
channels and stoniness have an important influence on the roughness.
Digitised by the Open Scholarship Programme in support of public access to information, University of Pretoria, 2017

- 5.3 -
The corrugations, erosion and
dependant and material properties
roughness prediction models.
stoniness are strongly material
should thus feature prominently in
It is interesting to note that only one of the sections (Hodges et al,
1975) deteriorated to a roughness level (15 000 mm/km) where vehicles
created a new track next to the road. This equates with a Quartercar
Index of about 220 counts/km which compares well with the local
criteria for total unacceptability (QI- 200, see Chapter 7.3).
The Brazil study (Visser, 198la) involved a programme of extensive
roughness measurements which resulted in the following model for the
change in the natural logarithmic value of roughness (LDQ) in terms of
the Quartercar Index (QI in counts/km):
LDQ- 0[0,4314 - 0,1705.T2 + 0,001159.NC + 0,000895.NT - 0,000227.NT.G
+ S(-0,1442 - 0,0198.G + 0,0062l.SV - 0,0142.PI
- 0,000617.NC)]
where
D number of days since last blading in hundreds
T2 surfacing type dummy variable:
T2 1 if surfacing is clay
T2 - 0 if otherwise
NC average daily car and pickup traffic in both directions
NT - average daily bus and truck traffic in both directions
G absolute value of grade in per cent
S - season dummy variable:
S 0 if dry season
S - 1 if wet season
SV - percentage of surfacing material passing the 0,075 mm
sieve
PI - plasticity index of surfacing material (%)
(5.4)
This model had an r-squared value of 0,26 with a sample size of 8 276
and a standard error of 0,222. Thus, if a change in roughness of 100
QI units is predicted the actual change will be between 65 and 154 QI
units with 95 percent confidence.
Digitised by the Open Scholarship Programme in support of public access to information, University of Pretoria, 2017

- 5.4 -
A second model incorporating the monthly rainfall instead of a season
dummy variable (GEIPOT, 1981) was developed:
LDQ- 0(0,376 - 0,19l.T2 + 0,00032.NC + 0,001014.NT) + CP(-0,16
- 0,0354.G + 0,00883.SV - 0,0218.PI)
where
(5.5)
CP = cumulative precipitation since the previous blading, in m
and the other variables are as defined for model (5.4).
This model has an r-squared value of 0,31, a standard error of 0,211
and used 8 276 observations. The wisdom of replacing the mean annual
rainfall (variable in itself) in Model 5.4 with an even more variable
parameter such as the cumulative precipitation since the previous
blading (Model 5.5) in order to improve the r-squared value and
standard error marginally is questionable. For prediction purposes,
the latter parameter would generally be an estimate at best.
Both of these models predict the rate of change of roughness with
time. This is useful for comparing various situations but cannot be
used to give an indication of the absolute roughness at any time. For
this purpose a datum which was defined as the roughness after blading
was also predicted using the following model (Visser, 198la):
LRA- (1,4035 - 0,0239.W- 0,0048.SV + 0,01694.PI + 0,6307.LRB
+ 0,1499.Tl + 0,3096.T2 + 0,00020.NT + 0,2056.BS
where
LRA
LRB
w Tl
- 0,01183.PI.BS)
natural logarithm of roughness after blading
natural logarithm of roughness before blading
road width in metres
surfacing type dummy variable
Tl 1 i::: surfacing type is quartzite
Tl 0 if otherwise
BS - season during which blading occurred
BS 0 if dry season
BS - 1 if wet season
and the other parameters are defined as before.
(5.6)
Digitised by the Open Scholarship Programme in support of public access to information, University of Pretoria, 2017

- 5.5 -
This model was based on 1 308 observations and had an r-squared value
of 0,61 and standard error of 0,34. The 95 percent confidence interval
for a predicted value of 100 would thus be 52 to 194.
Paterson (1985) subsequently re-worked the Brazilian data and obtained
a "better" prediction model by reducing the tendency to overestimate
the roughness at high levels and to underestimate at low levels of
roughness. This model predicts the average roughness over the duration
of a blading cycle (RGM) as follows:
lnRGM- 1,607 + 0,605.lnRG + 0,174.T2 + D(0,0393.NC + 0,119.NT) 0
+ MP(0,370 - 0,069.G - 0,0567.PI + 0,00855.SV) (5.7)
where
RG roughness after blading, at beginning of blading cycle, 0
QI counts/km;
MP- average rainfall intensity during blading cycle (m/month),
and the other variables were defined previously.
7his model has an r-squared value of 0,76 with a standard error of
0,239 and used 1 089 observations. An important aspect to be noted is
that although the r-squared value is substantially higher than for
Model 5.4 the root mean square error is a little larger indicating
that the 95 percent confidence interval is somewhat larger (a
predicted value of 100 counts/km would have a value of between 48 and
209 with 95 percent confidence). The number of samples in the latter
analysis is also much smaller than for Model 5.4, decreasing the
significance of the r-squared value (GEIPOT, 1980). The danger of
using only the r-squared values for comparing different models is thus
clearly confirmed.
The c~bic (Hodges et al, 1975) and exponential (Visser, 198la) models
both lead to unrealistically high predictions of roughness for
policies or infrequent blading unless restrained (World Bank, 1985).
The model used in the Highway Design and ~aintenance Manual (HDM3)
(World Bank, 1985) constrains this tendency by decreasing the rate of
roughness progression as roughness tends towards the maximum for a
particular material. The result of this exercise was the following
Digitised by the Open Scholarship Programme in support of public access to information, University of Pretoria, 2017

- 5.6 -
somewhat complex model:
(5.8)
where
QI(TG1
) - roughness at time TG1 , in QI
QI(TG2
) -roughness at time TG2 , in QI
TG1
, TG2
- time elapsed since last grading, in days
b- exp [c (TG2 - TG1)]; where 0 < b < 1;
c- - 0,001 (0,461 + 0,174.ADL + 0,0114,ADH
- 0,0287.ADT.MMP);
and
- max [279 - 421.(0,05 - MGDj)2 + 0,22.C - 9,93.RF.MMP;
150]; for section j
where
ADL - average daily light vehicle traffic (< 3 500 kg) in both
directions, in vehicles/day
ADH - average daily heavy vehicle traffic (~ 3 500 kg) in both
directions, in vehicles/day
ADT- average daily vehicular traffic in both directions, in
vehicles/day
MMP - mean monthly precipitation (m/month)
RF - average rise and fall of the road (m/km)
MGD. - material gradation dust ratio defined as J
[
1 MGD. -
J P075./P425. J J
if P425. = 0 J
if P425. > 0; J
P075. -percent passing 0,075 mm sieve for section j J
P425.- percent passing 0,425 mm sieve for section j. J
This non-linear least squares regression had an r-squared value of
0,856 with a standard error of 19,8 QI units and used 1 044
observations. However, as there was no logarith=ic transformation of
the roughness measurements in this model, the variances are not
homogeneous and the standard error should be viewed in this light. In
reality, the best prediction of roughness occurs for the mean value of
the independent variables used to obtain the model, becoming poorer
the greater the independent variables differ from this mean (Draper
Digitised by the Open Scholarship Programme in support of public access to information, University of Pretoria, 2017

- 5.7 -
and Smith, 1966). In order to constrain the prediction model at high
roughness values, the maximum value of the roughness was artificially
limited to a QI of 150 counts/km. This value appears to be too low for
the average unpaved road in rural and developing areas in southern
Africa, although it may be defined as an acceptable limit before
blading is necessary.
5.2 RESULTS
During the project some 10 000 roughness measurements at various
speeds were collected in the Transvaal and a further 1 500 in South
West Africa. A summary of some of the statistics related to these
results is shown in Table 5.1.
TABLE 5.1: STATISTICS OF ROUGHNESS MEASUREMENTS
Variable Mean Std. dev. Min Max
* Number of observations 7 005 Roughness (QI counts/km) 77 31,2 12 329 Number of days per
blading cycle 36 34,3 l 454 Number of vehicles per
blading cycle 3 7W 5 003 10 108 486
* - measured at 80 kmjh or corrected to 80 kmjh equivalent
The means and ranges of these results are comparable with those of the
Kenya study, but the mean days and vehicles per blading cycle are much
lower than those of the Brazil study (Visser, 198la). The more
frequent blading activity resulted in a mean roughness over the
duration of the project, lower than that measured in Brazil. The
Brazil study also incorporated a number of in situ or native materials
(earth roads) which resulted in rougher roads.
5.3 ANALYSIS
The analysis of the data followed a similar procedure to the analysis
of the Brazil data (Visser, 198la). Each time a section was graded a
new performance cycle was started. The results were analysed using the
SAS programme (SAS, 1985) and used all the measurements at 80 kmjh.
Digitised by the Open Scholarship Programme in support of public access to information, University of Pretoria, 2017

- 5.8 -
Where roughness could not be measured at 80 kmjh, the measurements at
SO kmjh were corrected to the 80 kmjh equivalent using equation 3.5,
and these were used.
At the outset of the analysis an Analysis of Variance of the
experimental design factors (i.e. material type, climate and traffic)
was carried out in order to confirm the assumptions made during the
experimental design. An analysis of variance using the mean, minimum
and maximum roughness measured for each section was carried out. The
highest r-squared value obtained was 0,52 (significant at the
0,05 percent level) with average daily traffic and the interaction
between the materia~ group and N-value the most significant
parameters. It was thus concluded that other factors such as seasonal
rainfall effects, measurement variability, blading effectiveness and
stoniness were probably important contributors to roughness. Some
multi-collinearity between the traffic and climate was also present.
The mean rate of change of roughness for each blading and seasonal
cycle was calculated from the maximum and minimum roughness in the
cycle and the mean rate of roughness change for each section was
determined. This value was used in a multiple correlation analysis in
order to identify the significant variables affecting the roughness.
These were the N-value (N), average daily traffic (ADT), grading
modulus (GM), plastic factor (PF), vertical grade (G), aggregate
pliers value (APV), plastic limit (PL), percentage passing the 26,5
and 0,075 mm sieves (P26 and P75 respectively) and a dummy variable
for the season (Sl -1 for the dry season and 0 for the wet season).
The time factor was obviously of extreme importance and was included
in the analysis. A regression analysis with the natural logarithm of
the mean of the roughness in both directions as the dependent variable
and two- and three-way interactions of time with all the above factors
(66 degrees of freedom for the model) produced an r-squared value of
only 0,33 with a standard error of 0,16 for 2 687 observations. An
important aspect of this is that the time factor alone accounted for
55 percent of the total r-squared value.
The best-fit model which was obtained was Model 5.9:
Digitised by the Open Scholarship Programme in support of public access to information, University of Pretoria, 2017

- 5,9 -
LnR = D[-6,021 + 0,00056.ADT + 2,4~l.GM + 0,0002.PF + P26(0,058
- 0,023.GM) + 0,0005.N.APV] (5.9)
(r2 = 0,25; n = 2 687; RMSE = 0,17; F-va1ue = 125)
A second analysis using the roughne$s measurements in both directions
was carried out and at the same tim$ the variable APV was excluded as
it could not be determined for a number of the sections. This resulted
in the following model (Model 5.10), with the regression coefficients
shown in Table 5.2:
LnR- D[-8,3 + 0,0003.PF + 0,07.Sl t 0,08l.P26 + 0,0003.N.ADT
+ GM(3,63 - 0,035.P26)]
(r2 - 0,23; n = 7 004; RMSE = 0,15; F-value- 302)
(5.10)
TABLE 5.2: REGRESSION COEFFICIENTS OF CHANGE OF ROUGHNESS WITH TIME
(MODEL 5.10)
Parameter Estimate Standard t-value deviation
D -8,30709 0,48467 -17,14 D*PF 0,00027 0,00003 8,20 D*Sl 0,06975 0,00936 7,45 D*P26 0,08118 0,00488 16,64 D*GM 3,62967 0,22463 16,16 D*N*ADT 0,00032 0,00003 12,55 D*P26*GM -0,03507 0,00230 -15,27
If a value of 100 counts/km is prepicted for the change in roughness
the actual value will, with 95 perc¢nt confidence, lie between 74 and
134 counts/km.
The roughness results were re-analysed with the modified values for
the particle size distribution ss d~scribed by Paige-Green (1988b) in
order to eliminate any variation caused by the interpretation of the
grading analyses. This resulted in Model 5.11 with the t-values shown
in Table 5.3.
Digitised by the Open Scholarship Programme in support of public access to information, University of Pretoria, 2017

- 5.10 -
LnR = D[-13,8 + 0,00022.PF + 0,064.Sl + 0,137.P26 + 0,0003.N.ADT
+ GM(6,42 - 0,063.P26)] (5.11)
(r2 = 0,22; n = 7 005; RMSE = 0,15; F-value = 288)
TABLE 5.3: REGRESSION COEFFICIENTS OF C~~GE OF ROUGHNESS WITH TIME
(MODEL 5.11)
Parameter Estimate Standard t-value deviation
D -13,81877 0,95189 -14,52 D*PF 0,00022 0,00003 6,86 D*Sl 0,06351 0,00941 6,75 D*P26 0,13705 0,00964 14,22 D*GM 6,41945 0,46791 13,72 D*N*ADT 0,00034 0,00003 13,66 D*P26*GM -0,06340 0,00477 -13,29
If a value of 100 counts/km is predicted for the change in roughness ·
the actual value will, with 95 percent confidence, lie between 74 and
135 counts/km. Only a marginal change in the statistics and
reliability of Model 5.11 is caused by the use of the corrected
grading results.
In all of these models, as in the Brazilian models, the r-squared
values are poor (only between twenty and thirty percent of the
variation is accounted for by the models). Low r-squared values for
the prediction of pavement distress are generally reported in the
literature (Middleton and Mason, 1987). The HDM3 Manual identifies
high prediction errors (95 percentile confidence intervals of 20 to 40
percent) as being typical of this type of study (World Bank, 1985) and
ascribed them to the large variability of material properties,
drainage, surface erosion and the high roughness levels of unpaved
roads. A number of reasons for the poor r-squared values in this work
are proposed:
1. Although the LDI vehicles were calibrated regularly a number of
factors may have affected the readings during a days monitoring.
These include tyre pressure variation (due to high road surface
Digitised by the Open Scholarship Programme in support of public access to information, University of Pretoria, 2017

- 5.11 -
temperatures, low surface temperatures during rainstorms, altitude
variation or high tyre temperatures caused by extremely rough
roads), minor variations in testing speed (an automatic speed
control was used) and the decreasing mass of fuel during a days
testing. As far as possible the speed and tyre pressures (which
were checked cold every morning before testi~g) were
constant and testing was not carried out during rainstorms.
kept
2. The actual wheel-paths tested may vary considerably. On recently
graded sections no definite wheel-paths are ·present, whereas on
roads which have been left ungraded for extended periods the
wheel-paths become wide and considerable variation in roughness
may exist within the wheel-path tested. The average reading of
three test runs was used in order to take this variation into
account as far as possible.
3. When a road becomes rough, or potholes or corrugations form, the
traffic starts to move away from the problem areas and a decrease
in the measured roughness without any maintenance having been done
is recorded. This cannot be quantified or taken into account in
the analyses. Many sections start with three wheel paths after
grading with a fourth appearing some time later as the road
becomes rougher. This results in a sudden decrease in the measured
roughness in one direction.
4. At the beginning of the wet season the road roughness usually
decreases especially if the traffic is light. Corrugations are
flattened out by the traffic, stones may be plucked from the road
or pushed deeper into the road or the wheel-path may change to
avoid water-filled ruts or muddy areas. Conversely, if the traffic
is heavier and the bearing capacity of the wet material is low the
roughness may increase through churning and rutting.
5. The normal analysis procedure for this type of work uses the
traffic in both directions, although obvious differences in the
roughness in the two directions often occur. As all the
environmental and material factors for any section are identical
only the volume and nature of the traffic can be expected to cause
Digitised by the Open Scholarship Programme in support of public access to information, University of Pretoria, 2017

- 5.12 -
this difference. Strong evidence for this was the periodic
observation on some of the sections of trucks loaded with grain or
gravel. These caused rapid deterioration of the road in one
direction but on returning unladen in the other direction minimal
deterioration was caused.
6. The influence of temporary periods of very high traffic (e.g.
construction, harvesting, detours around important routes, farmers
meetings, public holidays) also causes errors during analysis.
During the traffic counts specifically carried out for this
project two problems of this type were recorded. A local farmers
"get-together" resulted in a traffic count of 192 vpd (27 % heavy)
compared to a count of 37 vpd (35 % heavy) the next day on one of
the experimental sections. Similarly a train derailment near one
of the sections resulted in a count of 294 vpd (21 % heavy)
compared with 164 vpd (20 % heavy) over the next two days.
7. During the wet season steeply cambered corners tend to erode at
right angles to the direction of travel. This is caused by the
flow of water down the slope of the corner and results in a
corrugation-like effect with the amplitude increasing towards the
bottom of the slope. At the same time, the drainage on steeply
cambered corners is often such that the water accumulates at the
foot of the camber. This often results in potholes and movement of
the wheel tracks towards the outside of the corner.
8.
9.
It is commonly observed that
blading is much less than before
the roughness soon after grader
blading but within a week or so
it has increased dramatically. This can usually be attributed to
the loose material which was bladed over large protruding stones,
potholes and corrugations being whipped off by the traffic, and
the roughness rapidly returning to what it was before grading.
This is especially true during the dry season where no compaction
occurs. The spurious results obtained cause large residuals in the
regression models leading to low r-squared values.
Conversely, the roughness after
worse than before blading in
blading was no better or even
about 30 percent of the cases
Digitised by the Open Scholarship Programme in support of public access to information, University of Pretoria, 2017

- 5.13 -
recorded (Figure 5.1). This could often be attributed to loose
stones being bladed from the shoulder onto the road. However,
within a few days these stones were generally moved to the side of
the road by traffic, with a concomitant improvement in riding
quality.
10. Although the sections were chosen to be as homogenous as possible,
the roughness over the 300 m length of the section often varied
considerably, while the average roughness for the whole section
was used in the analyses. This variation in the Kenya experiment
(one kilometre long sections) must have been extremely high.
The models of Visser (198la) and Paterson (1985) both predict the rate
of change of roughness. This can be used in comparing the proclivity
of various materials to result in rough roads over time and should be
minimised to identify the best of a range of materials. For use in a
maintenance management model such as the Maintenance and Design System
(MDS) a datum from which the roughness will increase is needed to·
predict the road performance. The datum used by Visser (198la) and
Paterson (1985) was the roughness after blaaing. The prediction
equation for this (Model 5.6) requires a value of the roughness before
blading, which in a maintenance management system can be assigned as
the maximum acceptable roughness.
A model to predict the roughness after blading was developed for use
locally in the MDS. It was seldom possible to measure the roughness
immediately before or after blading. Thus, in many cases the road may
have been bladed some days before or after the roughness was measured.
The following model for the prediction of roughness after blading was
the best obtained:
LRA- 1,07 + 0,699.LRB + 0,0004.ADT - 0,13.DR + 0,0019.LABMAX (5.12)
where
LRA natural logarithm of roughness after blading
LRB natural logarithm of roughness before blading
Digitised by the Open Scholarship Programme in support of public access to information, University of Pretoria, 2017

200
22~ • ~ ~
~~ ,"'-v "i-"
• Q~ <c,;
• ~
.5 ....... en 17~ 1-z :::) 0 u .... 1~0 0
• •
/" • • • • •
• • • • • •• •
• • • • •••
~ • • • • • • ~ z • • •• • • • •• 0 <l 125
• • • •• •• • • • •• •• •• •
..J lXI • •• •• •• •••• • •
• • • • • • a:: • • •• • • • • • • liJ • • • • •• •• • • • • 1- 100 u. ••••• • •••••• • • • L/1 . <l •••• • •••• • • .......
• • •• • • • • • ~
Ul • Ul ••••• • • liJ • •• • • • • • •• • z 75 • • •• • ••• • • • • ::r: • •••••••• ••••• • • ~ :::) •• ••••••••••••• • • • 0 .... •• • •• •• •• •• • • a:: • • • •• • • •
50 •• • • • ••• • • • ••
• ••
•• • • •• 25 •
• •
0
0
ROUGHNESS BEFORE BLADING ( QI COUNTS/ km)
FIGURE 5.1 RELATIONSHIP BETWEEN ROUGHNESS BEFORE AND AFTER GRADER MAINTENANCE
Digitised by the Open Scholarship Programme in support of public access to information, University of Pretoria, 2017

- 5.15 -
ADT - average daily traffic
DR - dust ratio
LABMAX - laboratory determined maximum stone size (mm)
The r-squared value of this model was 0,62 with a standard error of
0,28 (i.e. if a value of 100 QI counts/km is predicted the actual
value will lie between 56 and 179 counts/km. The model used 1 601
samples and is highly significant (F = 650) with all parameters
significant at the 1 percent level. No change in the model occurred
when the modified grading results (Paige-Green, .1988b) were used. A
summary of the regression coefficients is given in Table 5.4.
TABLE 5.4: REGRESSION COEFFICIENTS OF MODEL FOR ROUGHNESS AFTER
BLADING (MODEL 5.12)
Parameter Estimate Standard t-value deviation
Intercept 1. 07215 0, 07156 14,98 LRB 0,69943 0,01521 45,99 ADT 0,00042 0,00009 4, 51 DR -0,13059 0,04884 -2,67 LAB MAX 0,00187 0,00058 3,23
A marginal improvement in the r-squared value for the prediction of
roughness after blading (Model 5.13) was obtained by incorporating
dummy variables for the material group. Only the dummy variable (T2)
for material group 2 (basic igneous rocks) was significant indicating
that the basic igneous rocks tend to result in a slightly higher
roughness than all the other material types. This is mainly due to the
presence of large spheroidal boulders typical of weathered dolerites,
andesites and basalts.
LRA- 0,974 + 0,704.LRB + 0,0004.ADT + 0,002.LABMAX + 0,089.T2 (5.13)
(r2 - 0,62; RMSE - 0,28; n = 1600; F- 659)
Although the F value is slightly higher for Model 5.13 the inclusion
of the material factor makes a negligible difference (one unit) to the
Digitised by the Open Scholarship Programme in support of public access to information, University of Pretoria, 2017

- 5.16 -
overall prediction of the roughness after blading. Model 5.12 is
therefore recommended for general use.
The roughness after blading depends primarily on the roughness before
blading with LRB accounting for 98,8 percent of the total correlation.
The statistics of both models are similar to those of Model 5.6,
although the standard error is smaller. The main advantage of Model
5.12 over Model 5.6, however, is its simplicity with only four
parameters against the ten of Model 5.6.
For optimum performance of the road, materials with a minimal rate of
change of roughness and the minimum roughness which can be obtained by
maintenance are the major factors affecting the choice of material. It
would thus be useful to be able to predict this initial value. As most
of the roads were bladed at various time frequencies and by a number
of different grader operators during all seasons, it was considered
that for each section the mode of the roughness after blading during
the project, would be indicative of the expected roughness obtainable
by routine blading for the section. Similarly, the mode of the
roughness before blading was considered to be the potential maximum
roughness of the section. This assumes that the sections were left
until the maximum roughness for that material was reached, a valid
assumption for most of the sections which were left unmaintained as
long as possible.
An analysis of the roughness after blading, in terms of the mode, for
each section indicated that the properties did not predict wi~h any
accuracy the potential roughness after blading, (or the potential
minimum roughness which could be obtained by blading) for a particular
material. The highest r-squared value obtained was 0,19 (for 110
observations). Only the particle size parameters (LABMAX, P75 and
P26), plasticity index and percentage heavy vehicles showed
significant correlations with the minimum roughness (significant at
the 0,1 to 10 percent level). It would thus appear tha~ the expert~se
of the grader operator and thus the quality of the blading operation
is the most important aspect affecting the roughness after blading. A
decrease in roughness after blading occurred in only 72 percent of the
cases studied in South West Africa and 70 percent in the Transvaal. In
Digitised by the Open Scholarship Programme in support of public access to information, University of Pretoria, 2017

- 5.17 -
the other cases the roughness was either not affected or increased
(Figure 5.1).
The analysis of the maximum roughness produced similar results with a
maximum r-squared value of 0,14. The only significant variables (at
the 2 to 10 percent level) were the stoniness, average daily traffic
and plasticity index.
Interesting correlations were obtained when the minimum roughness of
each section was taken as the 5th percentile and the maximum roughness
as the 95th percentile of all the results obtained for each section.
This eliminated those very low and very high results which may have
been spurious (e.g. after rain, incorrect tyre pressures or testing
speed etc.). The significant factors influencing the minimum roughness
were primarily material properties (most of the particle size and
plasticity parameters, the maximum size, the stoniness and the
aggregate strength tests). The maximum roughness on the other hand
depended mainly on the environmental factors (i.e. traffic, rainfall,
grade, curvature and compaction). The correlations were generally
significant at a lcvE:l of between one and t:eu percent: but: the
r-squared values were still below 0,20. An inspection of the 95th
percentile values indicated that the high values were obtained from
those roads which were very stony and those prone to potholes and
corrugations, while the low values were for the finer grained
materials. The sections with the highest minimum roughness (5th
percentiles) were generally those with large stones. Those sections
constructed of fi~er grained material which corrugate and pothole and
have a high 95th percentile roughness, rate significantly better in
terms of the minimum roughness i.e. a substantial decrease in
roughness can be obtained by blading.
5.4 DISCUSSION
The models developed for the predict:ion of the rat:e cf
development with time and the roughness after blading are
roughness
generally
statistically comparable with the existing models developed elsewhere,
but are easier to use and require less specialist input. No
significant models for the prediction of maximum and minimum roughness
could be developed, probably due to the unexplained factors which
Digitised by the Open Scholarship Programme in support of public access to information, University of Pretoria, 2017

- 5.18 -
cause potholes, corrugations and erosion channels (see Chapter 4).
Even including all the important material properties identified in
Chapter 4 resulted in too many variables to analyse properly.
Model 5.11 indicates that the rate of roughness progression is
dependent on time which accounts for more than 72 percent
mainly
of the
explained variation. As the
passing the 26,5 mm sieve,
grading modulus, plastic factor,
the Weinert N-value and daily
percent
traffic
increase the rate of roughness deterioration becomes higher. The rate
of roughness deterioration is greater during the.dry season (Sl- 1)
which is in agreement with the findings in Brazil (Visser, 198la).
This can be attributed to the compaction of stones and smoothing
effect of vehicles on corrugations during the wet season, and possibly
the change of wheel path to avoid water-filled potholes. It is
anticipated that heavy traffic in the wet season could result in
churning of weaker materials and increased roughness, but the existing
situation indicates that most of the heavy traffic seems to stay off
the road during periods of wet weather. The limited heavy traffic that
does use the road in wet weather probably causes compaction and
smoothing. In the dry season ravelling results in loose macP.rial and
corrugations. The interaction between the grading modulus and
fraction finer than 26,5 mm indicates that as the material becomes
coarser, the influence of the grading becomes increasingly more
important, and the roughness increases rapidly.
The absence of the vertical grade in the model is surprising. Although
it was a significant variable, it was excluded during the modelling
with no significant effect on the overall model. In Models 5.4 and
5.8, however, the grade was
was generally found to be
roughness plots of adjacent
important as the roughness deterioration
less on grades. Figure 5.2 shows the
flat and inclined sections for two
sections from this investigation, indicating no significant
differences in roughness (i.e. the grade is of minimal importance in
the overall development of roughness). One reason for this is that the
stoniness, which is such an important factor in the roughness does not
vary between grades and flat areas. Other factors influencing
roughness such as potholes and corrugations are generally minimal on
grades, but would appear to be of subordinate importance in relation
Digitised by the Open Scholarship Programme in support of public access to information, University of Pretoria, 2017

90
eo
70
E .:.:.
' 60 (/) 1-z 50 :::> 0 u H 40 0
(/) 30 (/) w z
20 :I: (!)
:::> 0 10 a:
0
leO
160
140 r:: .X
' 120 (/)
.1-z 100 :::> 0 u 1-1 eo
_g (/) 60 (/) w z 40 :I: (!)
:::> 0 20 a:
0
8 """
1-
1-
1-
1-
1- X
'- X X 0
0 0 Q
f"o - 0 X
~ X
I I I _I
- 5.19-
o SECTION 9A (0 % GRADE) x SECTION 9A (4% GRADE)
8 8 8 8
0
X
X X
~ X
0
0 X X lt 0
X 0 f 0
0
l L I I I
8 8
0
I
X 0
X 0
X X X 0
X 0 X 0
0 X X
0
X 0 0 X 0
0
X
I I f _l I I
22-06 21-10 20-12 le-o2 19-04 1e-o6 17-oe 16-10 1~12 13-02 14-Q4 13-o6 12-0e 11-10 10-12 oe-02
i--19e4 I I
1- 8 8 8
1-
1-
1-
1-
1-j R
1- lt
1-
1-
I I I I
19e5 I
i
DAYS
o SECTION 31A (I% GRADE) x SECTION 318 (7% GRADE)
8 8 8 ~ I
0
~ 0 /(
~ X X
0
" 0
19e6 1 19e7-i
8 8 8
0
§ X X X 0
0 0 • X
i X
0 •
1
30-11 19-l)l 10-03 29·04 le-06 07-0e 26-09 15-11 04-QI 23-Q2 14-04 03-06 23-07 11-09 31-10 20-12
--19e4 19e5 19e7------------------~
DAYS
FIGURE 5.2
EFFECT OF VERTICAL GRAD£ ON MEASURED ROUGHNESS
X 0
Digitised by the Open Scholarship Programme in support of public access to information, University of Pretoria, 2017

- 5.20 -
to the stoniness. Beaven et al (1987) noted that the gradient and
curvature had little effect on the performance of the materials
studied in Ethiopia.
The seasonal effect in Model 5.4 interacts with the vertical
material properties and traffic. This effect in Model
independent of these parameters and the seasonal effect is a
increase in roughness in the dry season. This increase is
mainly due to the formation of loose material and corrugations
the dry season.
grade,
5.11 is
general
probably
during
An analysis incorporating dummy variables for the material groups
resulted in a marginal improvement in the r-squared value (0,24) over
Model 5.11 with no improvement in the standard error and a 44 percent
reduction in the F-statistic (F 170). No benefit was gained by
incorporating the material type in the Model and a necessity for some
specialist input would arise by its inclusion.
The incorporation of the rated severity of the stoniness for each
roughness measurement decreased the standard error marginally although
there was no significant change in the r-squared value. The stoniness
severity is, however, not a parameter which can be determined prior to
construction and varies with time. Generally, the roads with high
stoniness were indicated by higher percentages retained on the 26,5 mm
sieve and are thus incorporated in the model.
Table 5.5 shows a matrix of the predicted
values of the variables in Model 5.11
roughness for the extreme
as measured during the
experiment. The values in each cell are for the predicted change in
the roughness as a percentage of the initial roughness (i.e. the
roughness after blading). Some of the combinations are hypothetical
and unlikely to occur in nature (e.g. 70 per cent passing 26,5 mm
sieve with a grading modulus of 0,32) and were not calculated. The
predicted change in roughness in some cases (e.g. very light traffic
with a low plastic/fine fraction) shows a small negative value and can
be considered outside the inference space of the model. Similarly, the
predictions for roads constructed with coarse gravels in arid areas
and carrying very high traffic, indicate very high roughness values.
Digitised by the Open Scholarship Programme in support of public access to information, University of Pretoria, 2017

TABLE 5. 5: PERCENTAGE CHANGE IN ROUGHNESS WITH TIME GENERATED FR<li WDEL 5.11
DAYS 10
PF 104 2100
S1 0 1 0 1 0
P26 70 100 70 100 70 100 70 100 70
N ADT GH
2,5 24 16 24 17 29 21 30 22 728 395
0,32 X 14 X 15 X 19 X 20 X 10
2,5 8 2 9 2 13 6 14 7 119 10
0,32 X 0 X 0 X 4 X 5 X
2,5 10 3 10 4 15 8 15 8 153 395
0,32 X 1 X 2 X 6 X 6 X 1,3
2,5 8 1 9 2 13 6 13 6 113 10
0,32 X -1 X 0 X 4 X 5 X --- --- --
100
104
1
100 70 100 70
335 782 363 1184
266 X 290 X
15 134 23 240
3 X 3 X
33 170 42 292
12 X 19 X
12 127 19 230
-1 X 0 X - ----- ---
2100
0
100 70
575 1268
468 X
79 263
50 X
106 318
73 X
74 252
46 X ----
1
100
619
505
91
60
120
85
85
56 --
l.1l . N ......
Digitised by the Open Scholarship Programme in support of public access to information, University of Pretoria, 2017

- 5.22 -
The probability of this type of gravel having such high plastic
factors is, however, very low. Other than these discrepancies the
predicted values appear realistic.
Plots of the predicted values for some of the sections are shown in
Figures 5.3 - 5.5. These plots show both the actual values recorded
and the predicted values, using the roughness after blading as a
starting datum. In some cases the predicted roughness has been plotted
through the mean roughness of the blading cycle as well. The general
tailing off of the roughness at higher values is shown by most of the
sections, while the inherent variability of the roughness measurements
is well exhibited especially at higher roughness levels.
From Table 5.5 and Figures 5.3 - 5.5, the importance of good grader
blading is shown. The lower the roughness achieved after blading, the
longer the period before blading is required again.
As the Kenya study and most of the other studies have been carried out
by the TRRL, .a TRRL Bump Integrator was used to measure the roughness.
The measurements were taken at a speed of 32 km/h and thus the output
from this instrument cannot readily be used to compare the models.
Model 3.1 has, however, been used to convert the TRRL Models to QI
outputs assuming that the relationships between the QI determined in
Brazil and South Africa are comparable. As they are based on similar
rod and level survey techniques this assumption should be valid.
The Quartercar Index was used in Brazil and the material test results
are available (Visser and Queiroz, 1979) enabling the model developed
locally to be compared for two sections studied in Brazil (Visser,
198la) (Figure 5.6 and 5.7). The local model underpredicts the
roughness badly on sections which were regularly maintained but
overpredicts the roughness for sections with minimal maintenance. The
reason for· this appears to be that both of these sections are outside
the inference space of che local scudy i.e. the traffic on section 251
was almost double the highest used to develop Model 5.11, while the
time elapsed without blading for section 205 was almost 2 years. When
the Brazil model (5.4) is applied to the local results a very strong
tendency to overestimate the roughness for those sections with minimal
Digitised by the Open Scholarship Programme in support of public access to information, University of Pretoria, 2017

55
50
E 45 ~
' 40 (/)
1-35 z
:::) 0 30 (.)
1-1 25 c
(/) 20
(/) liJ 15 z J: (!) 10 :::)
0 5 a: 0
90
eo
E 70 ~
' (/) 60 1-z :::)
0 (.)
t: 40
(/) 30 (/)
liJ z 20 J: (!)
:::) 10 0 a:
SECTION 909
8 8 B 8 B
!26-t2 24-02 24-04 23-o6 22-oe -1983 I 1984
SECTiON 37A
8 B B B B B
- 5.23 -
LEGEND:
• MEASURED ROUGHNESS
- PREDICTED ROUGHNESS- THROUGH ROUGHNESS AFTER BLADING
PREDICTED ROUGHNESS-THROUGH MEAN ROUGHNESS FOR CYCLE
8 BLADING DATE
B
DAYS
B B B
•
• • •
• • •
oW-~--~~~~--~--+-~--~----~--~----~--~--~~--~----~--~----~--~---130-II 19-01 10-03 29-04 18·06 07-08 26-09 15-11 04-01 23-02 14-o4 03-Q6 23-07 11•09 31-11 20-12
~984 1985----------------r--------------1986--------------~
DAYS
FIGURE 5.3
MEASURED AND PREDICTED ROUGHNESS FOR GOOD ROADS
fQI< 80 COUNTS/kmJ
Digitised by the Open Scholarship Programme in support of public access to information, University of Pretoria, 2017

150
140
130
120 E .X 110
' (/) 100
f- 90 z :::> 0 80 <..)
H 70
0 60
(/) 50 (/) w 40 z J: 30 <.!) :::> 20 0 a: 10
SECTION 15A
8 8
X
- 5.24 -
LEGEND:
o MEASURED ROUGHNESS
~ PREDICTED ROUGHNESS- THROUGH ROUGHNESS AFTER BLADING
PREDICTED ROUGHNESS -THROUGH MEAN ROUGHNESS FOR CYCLE
8 BLADING DATE
8 8 8
0 0
o~----~---U--~----~--~----~--~--~~--~--~----~--~----~--_.--~~---
180
160
E 140 .X
' ~ 120
z :::> 0 100 <..)
H
130-rr 19-0I 10-03 29-Q4 18-06 07-08 26-09 15-11 04-<>1 23-02 14-Q4 03-<>6 23-07 11-os 31-10 20-12
119B4 1985 1986
DATE
SECTION 49A
8 8 8 8 8 8 8
0 I 0
0
0
0 0
-- __ ,. 0 0
0
0 BO 0
ov~ 0 00-
(/) (/) 60 w z J: <.!) 40 :::> 0 a: 20
~ 0 0
20-12 I 30-11 19-QI 10-03 29-Q4 18-Q6 07-08 26-09 15-11 04-QI 23-Q2 14-04 03-06 23-07 11-09 31-11
11984 -+--------1985 ---------1-------- 1986 ---------+ DATE
FIGURE 5.4
MEASURED AND PREDICTED ROUGHNESS FOR AVERAGE ROADS
fQI Z' /00-150 COUNTS/kmJ
Digitised by the Open Scholarship Programme in support of public access to information, University of Pretoria, 2017

E .:.::
' (/)
1-z :::> 0 u .... 0
(/) (/)
IJ.J z :I: (.!)
:::> 0 Q:
SECTION 21 8 27!5
2!50
22!5 8 8 8
200
17!5
1!50
125 ,.. .....
100
75
50
2!5
• • --
- 5.25 -
LEGEND
• MEASURED ROUGHNESS
x...-..,x PREDICTED ROUGHNESS -THROUGH ROUGHNESS AFTER 9LADI114G PREDICTED ROUGHNESS- THROUGH MEAN ROUGHNESS FOR CYCLE
9 BLADING DATE
• --::--
8 • / B
0~
~
._......,..'• - . L:./~
• • •
o~----~~~--~~--~----~--~--~----~--~~--~---L--~----~--~----~.30-il· 19-01 10-03 29-04 18-Q6 07-08 26-Q9 1!5-11 04-01 2~2 14-04 03-06 23-Q7 11-09 31-10 20-12
r-198~ 198!5 1986
DATE
SECTION 14 A 330 8 8 8 B
300 • 270
E 240 .:.::
' • (/) 210 1-z :::> 0 u 1-1 0
(/) (/) IJ.J z :I: (.!)
:::> 0 Q:
180
1!50
120
90
60
30
• •
. """"""'·--- - ...... _ -- _ ...... •
•
... ~
/ . ,. . •
• •
1o-o3 29-04 18-06 o7-o8 26-09 1!5·11 04-ol 23-04 14-o4 03-06 23-o7 11-o9 31-10 30-11 19-01 r-1984~----------------1985------------------+----------------1986-----------------;
20-12
DATE
FIGURE 5.5
MEASURED AND PREDICTED ROUGHNESS FOR BAD ROADS
fQI :t /20-300 COUNTS /km J
•
Digitised by the Open Scholarship Programme in support of public access to information, University of Pretoria, 2017

E -"' ...... (/)
350
300
250
~ 200 :::> 0 (.)
..... 0
(/) 150 (/) w z J: (!) :::> 0 0: 100
50
- 5.26 -
WET SEASON DRY SEASON WET SEASON DRY SEASON
• •
t I I J
"I ~
.~~ • I ~' I
/~ I
•
·~' I : • .J I • ...... ---'ld I
I I
. I I I I I ) ,
SECTION CHARACTERISTICS:
•
• ADT = 608 vpd GM = I, 79
~BLADING I I
• I . •I
• • I I • • If /1 I I J
~" I I I ~ I I
• " I I I /~ I • ~ 1
~ / ~~
"• I .t ~ / ,.,. 1...-""
----MODEL 5.11
-MODEL 5.4
•
PREDICTED ROUGHNESS
FIGURE 5.6
MEASURED AND PREDICTED ROUGHNESS ON SECTION 251
UNDER FREQUENT MAINTENANCE f After VISSER 198/aJ
Digitised by the Open Scholarship Programme in support of public access to information, University of Pretoria, 2017

E -"
' Ul 1-z :J 0 u ~
H 0 ~
Ul Ul w z I (!) :J 0 a::
250
200
150
100
.. /
50
WET SEASON
,.,-"' .,.,.
/ _,./
DRY SEASON
,' II
//
~"
1/
• •
SECTION CHARACTERISTICS:
ADT = 92 vpd SV = 48 %
CLAY SURFACING PI= 16%
GRADE= 6,3 °/o
I PREDICTED ROUGHNESS I MODEL 5.11
I II
I I
I I PREDICTED ROUGHNESS WET SEASON P/ .. I~ DRY MODEL 5.4 ______ .,
• •
• • • • • •• •
•
0 I I I I I I I I I I I I I I I I I I I I I I I
FIGURE 5.7
MEASURED AND PREDICTED ROUGHNESS ON SECTION 205 WHICH WAS NOT BLADED DURING THE OBSERVATION PERIOD
fAller VISSER 1981a)
ll1 . N -..J
Digitised by the Open Scholarship Programme in support of public access to information, University of Pretoria, 2017

- 5.28 -
blading (less than twice a year) exists (Figure 5.8). The inference
space of the Brazil study in this case would appear to be exceeded.
The predictive capabilities of the available models for local
conditions were compared by analysing the mean roughness predicted by
each of the models (Table 5.6) and the statistics of the residuals for
the models (Table 5.7). Over 7 000 results were used in the analysis.
TABLE 5.6: COMPARISON OF PREDICTIVE CAPABILITIES OF VARIOUS MODELS
Model Mean Standard Standard error Percentage deviation of mean error
5.3 64,0 12,24 0,145 -20,1 5.4 96,1 87,83 1,044 20,1 5.8 66,2 30,79 0,366 -17,3 5.11 77,4 38,28 0,455 -3,3
Measured 80,0 38,49 0,457
The Kenya and World bank models (5.3 and 5.8) underpredict the average
roughness quite badly while the Brazil model (5.4) shows a significant
overprediction. The local model (5.11) underpredicts by about three
percent.
TABLE 5.7: STATISTICS OF RESIDUALS OF AVAILABLE PREDICTION MODELS
Model Mean Standard Standard error deviation of mean
5.3 -16,0 38,21 0,454 5.4 16,0 77,30 0,912 5.8 -13,9 26,71 0,317 5.11 -2,7 26,52 0,315
The mean residuals of the Kenya, Brazil and World Bank models differ
significantly from zero while that for the local model differs
alightly from the optimum solution. This indicates that the models
developed elsewhere are not totally adequate for southern African
conditions and have been bettered by the new model. The bias towards
underprediction is shown by the means (Table 5.6) and the minima and
maxima (Table 5.8).
Digitised by the Open Scholarship Programme in support of public access to information, University of Pretoria, 2017

110
roo
90
E .:.: 80
' tJ) 1- 70 z ~ 0 60 (.)
1-1 50 0
tJ) 40 tJ) w z 30 ::c (!) ~ 20 0 0::
10
0
90
ao
70
E .:.:
' 60
tJ)
1-z 50 ~ 0 (.)
H 40
g tJ) 30 tJ) w z 20 ::c (!) ~ 0 10 0::
0
- 5.29 -
LEGEND
• MEASURED ROUGHNESS
SECTION 909 x FREDICTED ROUGHNESS- THROUGH ROUGHNESS AFTER BLADING
8 BLADING DATE
1- 8 8 8 8 8 8 8 8 8
1- I I I I
X
I 1-
1- X
I I X
1- • X
I X 1- I
I X
X X I 1-
j X
X l oo X
• X
1- ~ • .. X X . . ... . XX
X i f I . X . l • .. 0 X a., o o X
- .. X • X X I X 0 0 . . X • I I I . 0 X I I • . . - .
-I I I _l I I I I I I _l ~ I
26-12 24-<>2 24-<>4 23-<>6 22-08 21-10 20-12 18-02 19-04 18-06 17-08 16-10 15-12 13-<>2 14-Q4 13-Q6
r-1983 1984 198 1986
DATE
1-SECTION 37A
- B 8 B 8 B 8 8 B B
1- X . X
X
1- • . . . X
. • - X X X .
X X X X X
X . . . . X • - . . . • . X . • . . . . . • - . -
'--
I _I lJ ~ I I I I 11 I I I I I
I 30-11 19-01 10-03 29-04 18-06 D7-08 26-Q9 15-11 04-QI 23-02 14-<>4 03-Q6 23-Q7 11-09 31-10 20-12
r-1982--1---------------1985 ------------------~--------------1986---------------1
DATE
FIGURE 5.8
MEASURED AND PREDICTED ROUGHNESS f BRAZIL MODEL J
Digitised by the Open Scholarship Programme in support of public access to information, University of Pretoria, 2017

- 5.30 -
TABLE 5.8: MAXIMUM AND MINIMUM PREDICTIONS AND RESIDUALS
Model Predicted Predicted Residual Residual minimum maximum minimum maximum
5.3 56,3 294,9 -244,5 182,6 5.4 12,6 2425,9 -196,3 2294,5 5.8 12,1 229,5 -240,1 122,2 5.11 12,3 296,1 -230,1 203,4
The measured minimum and maximum roughness values were 12,0 and 329,1
respectively. All the models apart from 5.3 predict the minimum
roughness very closely. The Kenya model is based on cumulative traffic
and it can thus be expected that at low roughness values (i.e. shortly
after grading when the cumulative traffic counts are still low) the
error would be exaggerated. The extreme overprediction by the Brazil
model is evident but the constraining effect of the World Bank model
appears to be too limiting for local conditions. The Kenya and local
models predict the maximum fairly closely, but it is recommended that.
a maximum of this order should not be permitted in practice. For a
minimum recommended number of bladings of two per year (Visser, 198la)
the Brazil model would be relevant to southern African conditions.
Paterson (1985) showed that the roughness after blading is generally
about 80 percent of the roughness before blading. The model developed
in this study shows an increase in the effectiveness of blading as the
roughness increases. If the roughness before blading is low ( ± 50
counts/km) the predicted roughness after blading shows an improvement
of about 16 percent, while at high roughness values (about 200
counts/km) the predicted improvement is about 45 percent. Blading
seldom returned the roughness to an approximately constant value for
any section which concurs with the findings in Brazil (Visser, 198la;
Paterson, 1985).
5.5 CONCLUSIONS
A number of models for the prediction of roughness progression in
unpaved roads have been developed overseas. These models are all
fairly complicated, necessitating the determination of a number of
geotechnical properties, an identification of the material types and
Digitised by the Open Scholarship Programme in support of public access to information, University of Pretoria, 2017

- 5.31 -
the incorporation of an estimate of the average vertical grade for the
total length of the link. When one considers that these models have
been developed for use mainly in developing areas where computing
facilities are often rudimentary and the skill levels of the roads
personnel may be low, the usefulness of the models is questionable,
especially in remoter areas.
The models developed in this study have eliminated the necessity of
identifying the material type and of estimating the average grade for
the road link. Simple indicator tests requiring minimal equipment and
only basic operator training are required for the input parameters for
the model. The predictive capability has, however, not been diminished
through this process and, in fact, it has generally been improved for
local conditions.
It can thus be concluded that the geotechnical properties, which are
directly dependent on the geology in terms of the mineralogical
composition, significantly affect the development of roughness of
unpaved roads. Again, the particle size distribution and plasticity
are the most important material properties.
Digitised by the Open Scholarship Programme in support of public access to information, University of Pretoria, 2017

CHAPTER 6
GRAVEL LOSS PREDICTION
6.1 INTRODUCTION
The prediction of the expected material loss of a gravel road is of
utmost importance for both unpaved road design and maintenance
planning as the gravelling and regravelling operations are the most
costly construction and maintenance procedures. The loss of gravel is
caused both by natural weathering (rain, wind, etc.) and by friction
and whip-off from the vehicles. Timeous prediction of which roads are
likely to need regravelling is important during network management and
maintenance budgeting.
As far back as 1929, Strahan noted that an average gravel loss of 0,6
inches (15 mm) per year occurred. He concluded that up to 0,3 inches
(7,6 mm) of this loss was due to "weather influences, grade conditions
and machining", regardless of traffic density.
No further reference to gravel loss measurement is recorded until the
Kenya study in 1975 (Hodges et al, 1975). The results of this study
generally "did not extrapolate very satisfactorily" but the following
best fit equation was given, although no statistics were included.
Annual gravel loss ~f( Ta2 )(4,2 + 0,092.Ta + 3,5.R2 + 1,88.V)
Ta2+50
where
f = 0,94 for lateritic gravel
1,10 for quartzitic gravel
0,70 for volcanic gravel
1,50 for coral gravel
(6.1)
Ta annual traffic volume in both directions (/ 1 000 vehicles)
R annual rainfall (metres)
V vertical curvature (%)
The material factor (f) depends on those properties of the material
Digitised by the Open Scholarship Programme in support of public access to information, University of Pretoria, 2017

- 6.2 -
such as plasticity, particle size distribution, particle strength,
clay mineralogy and probably in-situ density. The equation in this
form indicates that the gravel loss of a road constructed with a
volcanic gravel will be only 64 per cent of that of a similar road
using a quartzitic gravel. No account is, however, taken of the
variation of material properties within the two groups. This variation
is probably inherent in the factors as the sections were each one
kilometre long and, considering the natural variability of geological
materials, it is unlikely that they were homogeneous over their entire
length.
The Brazil study (Visser, 198la) used the same basic gravel loss
measurement procedure as the previous study, but reduced the number of
readings per section. Instead of the measurements being taken every
2 m along the road they were taken every 5 m. A number of gravel loss
prediction models were obtained the following model being the most
useful:
GL- 0(1,58 + 0,366.G + 0,083.SV - 0,210.PI + 0,0132.NC + 0,008l.NT
+ 420,45/R) (6.2)
where
GL gravel thickness loss in mm
D time period considered, in hundred days, i.e. days/100
G absolute value of grade in percent
PI plasticity index (PI)
SV percentage of the surfacing material passing the 0,075 rnrn
sieve
NC average daily car and pick-up traffic, both directions
NT average daily truck traffic, both directions
R radius of horizontal curvature, in m
This model was basee on 604 observations and had an r-squared value of
0,62 aud standard error of 11,17.
Roberts (1980) conducted a series of gravel loss measurements in Ghana
on a grid of 0,5 by 4,0 m. The main objective of this was to estimate
the gravel loss, with a secondary objective of recording the change of
Digitised by the Open Scholarship Programme in support of public access to information, University of Pretoria, 2017

- 6.3 -
shape of the road cross section. No analysis of the data is given but
an average annual gravel loss of 9 mm was determined for both low and
high traffic volumes. These two categories were not defined in terms
of actual vehicles although high varied from 39 to 167 vehicles per
day while low counts were in the range 15 to 74 vpd (Roberts, 1983).
An analysis of the independent variables with respect to the
performance indicated that the traffic played a major influence in the
gravel loss (significant at the 1 per cent level) and the zone
(climate, terrain and material type) was significant at the 5 per cent
level. The vertical alignment and season show~d no statistically
significant relationship with the gravel loss.
Jones et al (1984a) carried out work in Kenya and compared the gravel
loss on a number of roads with the loss predicted from the model
developed during the earlier work in Kenya (Hodges et al, 1975). The
gravel loss was generally underpredicted by about 37 per cent. The
material factor in equation 6.1 was thus adjusted to account for this
difference as follows (Table 6.1):
TABLE 6.1: ADJUSTED ~~TERIAL CONSTANTS (JONES, l~S4a)
Material Old value New value
Lateritic gravels 0,94 1,29 Quartzitic gravels 1,10 1,51 Volcanic gravels 0,70 0,96 Coral gravels 1,50 -Sandstone gravels - 1,38
To investigate reasons for this difference 2 sections of road were
constructed and left untrafficked and the eroding effect of rainfall
was studied. The measured annual gravel loss on these roads (4,3 and
7,5 mm) was much higher than that predicted by the universal equation
for rainfall-erosion losses (Agricultural Research Service, 1961) or
that predictac by the original TRRL work (Jones ct al, 1984). rne
variability of the material properties within any one material group
would also influence the gravel loss. It is unlikely that discrete
values for the properties in the material group would apply to a
continuously variable process i.e. the plasticity and grading would
Digitised by the Open Scholarship Programme in support of public access to information, University of Pretoria, 2017

- 6.4 -
probably vary considerably for different volcanic gravels depending on
the conditions and stage of weathering.
Paterson (1985) used the data collected in Brazil to obtain the
following gravel loss prediction equation:
MLA- 3,65 ( 3,46 + 0,246.MMP.G + KT.ADT)
where
MLA predicted annual material loss (mm/yr) .
MMP mean monthly precipitation (m)
G grade (%)
ADT average daily traffic in both directions
KT max (0; (0,022 + 0,969/53700.KCRV + 0,00342.MMP.P75
- 0,0092.MMP.PI - O,lOl.MMP)]
with KCRV- curvature ( 0 /km)
and the other variables are as defined before.
More recently, Beaven et al (1987) carried out gravel
(6.3)
loss
measurements on weathered basalt roads in Ethiopia. However, th~
benchmarks were such that significant differential movement occurred
and the results were not altogether satisfactory. The measured gravel
losses were, however, considerably higher than those predicted by the
model developed in Kenya (Model 6.1).
A study of the past work on gravel loss analyses indicates a number of
differences between the predictions of the different models when used
in areas in which they were not developed. It would thus appear to be
important to develop models specifically for the materials and
environmental conditions encountered in southern Africa.
6.2 RESULTS
During the project each section was surveyed 7 times at about 6
monthly intervals. As the gravel loss is a long term parameter
(usually 5 years or more) the effect of seasonal loss is not important
and biannual measurements were considered adequate. About 740 results
Digitised by the Open Scholarship Programme in support of public access to information, University of Pretoria, 2017
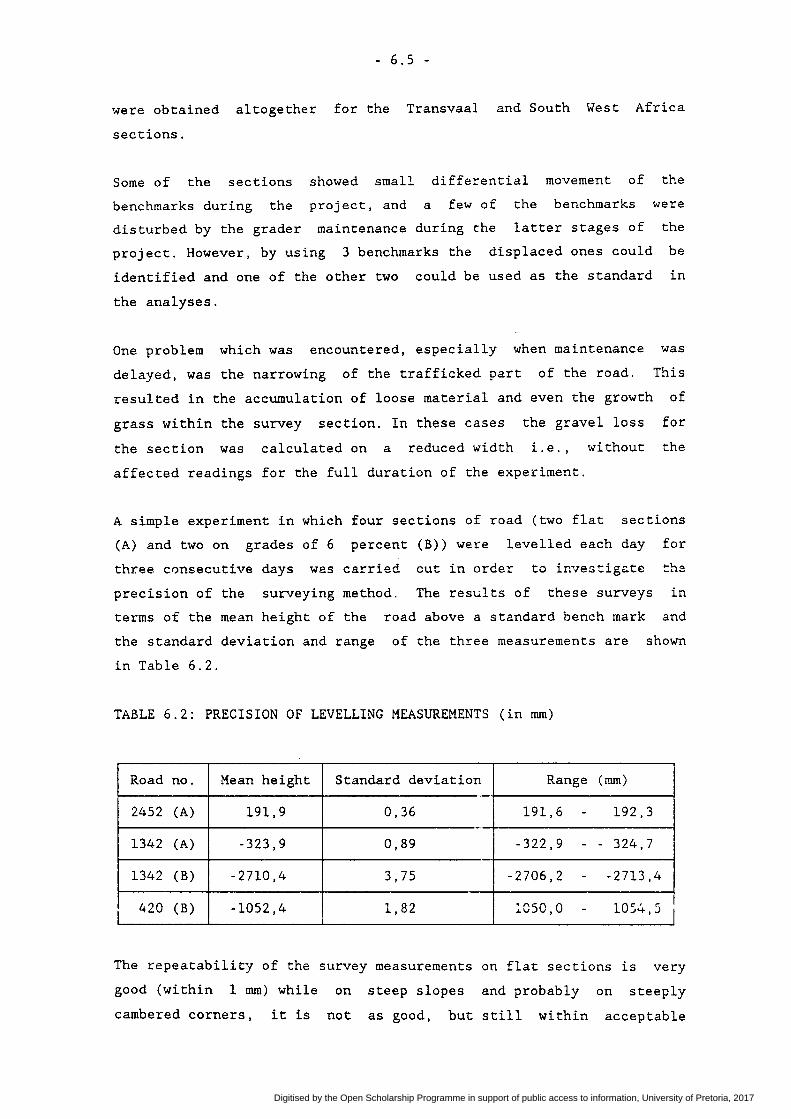
- 6.5 -
were obtained altogether for the Transvaal and South West Africa
sections.
Some of the sections showed small differential movement of the
benchmarks during the project, and a few of the benchmarks were
disturbed by the grader maintenance during the latter stages of the
project. However, by using 3 bencrunarks the displaced ones could be
identified and one of the other two could be used as the standard in
the analyses.
One problem which was encountered, especially when maintenance was
delayed, was the narrowing of the trafficked part of the road. This
resulted in the accumulation of loose material and even the growth of
grass within the survey section. In these cases the gravel loss for
the section was calculated on a reduced width i.e., without the
affected readings for the full duration of the experiment.
A simple experiment in which four sections of road (two flat sections
(A) and two on grades of 6 percent (B)) were levelled each day for
three consecutive days was carried cut in order to investig~t€ tha
precision of the surveying method. The results of these surveys in
terms of the mean height of the road above a standard bench mark and
the standard deviation and range of the three measurements are shown
in Table 6.2.
TABLE 6.2: PRECISION OF LEVELLING MEASUREMENTS (in mm)
Road no. Mean height Standard deviation Range (mm)
2452 (A) 191,9 0,36 191,6 - 192,3
1342 (A) -323,9 0,89 -322,9 - - 324,7
1342 (B) -2710,4 3,75 -2706,2 - -2713,4
420 (B) -1052,4 1,82 :cso,o - 105~,5 I
The repeatability of the survey measurements on flat sections is very
good (within 1 mm) while on steep slopes and probably on steeply
cambered corners, it is not as good, but still within acceptable
Digitised by the Open Scholarship Programme in support of public access to information, University of Pretoria, 2017

- 6.6 -
limits. The section on road 1342 (B) was the first one laid out in the
experiment and had the bench marks outside the survey section. All the
other sections monitored included the bench marks in the section (e.g.
420 (B)) and a more repeatable survey was obtained as the grid was
more accurately located. The standard deviation of two tangent and two
curved sections surveyed in Brazil (Visser, 198la) was 6,67 mm.
Similar problems were encountered on hills in the Brazil study where a
slight dislocation of the survey grid resulted in a "large" change in
the average height as the average height changes but the bench marks
do not. By including the bench marks in the survey grid this
dislocation was minimised in the local study.
6.3 ANALYSIS
Initially the South West African data was analysed in terms of the
existing prediction models developed in Kenya and Brazil and a
preliminary model developed for the South West Africa data (Paige
Green, 1987b). The model was a simple best-fit linear regression using
the same parameters as the Brazil model:
GL- D(-0,15.PI + 0,62.G + 0,04.ADT + 0,335.T7 - 0,87) (6.4)
where
ADT Average daily traffic in both directions
T7 1 for calcareous mixtures and 0 for all other materials
and the other variables are defined for Model 6.2.
The predictive capability of this model for the combined Transvaal and
South West Africa data was investigated and found to be inadequate.
Although the mean predicted loss differed from the measured gravel
loss by about 17 percent, the variance was very high (166,5) and the
predicted maximum annual gravel loss was excessively high (60 mm).
The data for the Transvaal and South West Africa seccions were thus
combined for further analysis. The analysis was done using the
Statistical Analysis System (SAS, 1985). The significant variables
were initially identified using a full correlation matrix (SAS, 1985).
The model was then developed using these significant variables in the
Digitised by the Open Scholarship Programme in support of public access to information, University of Pretoria, 2017

- 6.7 -
GLM (General Linear Models) programme for the maximum r-squared value
and minimum Root Mean Square Error (RMSE).
The approach used for the analysis was to find the average height of
the section relative to a standard benchmark each time the section was
surveyed. In order to investigate the rate of change of the gravel
height (i.e. the gravel loss) the intercept was removed by
centralising the data for each section through the mean monitoring
date (Draper and Smith, 1966). This procedure eliminates the problems
described by Burger (undated) who showed that the.r-squared value in a
no-intercept model (i.e. zero intercept is forced) should be used with
great care.
The significant variables used in the model were time (D), average
daily traffic (ADT), N-value (N), the plastic factor (PF; product of
plastic limit and percent passing 0,075 mm sieve), the percentage
passing the 26,5 mm sieve (P26) and the vertical grade (G) in percent.
All of these variables were significant at the 0,01 percent level but
some multi-collinearity was obvious. Thus all of the second order
interactions were analysed as well. Tne best fit equation was obtained
from the following model:
GL- D [ADT(0,047 + 0,0027.N- 0,0005.P26) - 0,365.N- 0,0014.PF
+ 0,048.P26] (6.5)
(r2 - 0,84; RMSE- 5,3; n = 702; F- 624)
where
GL Gravel loss
D Time period under consideration (days/100)
ADT Average daily traffic
N Weinert N-value
PF Plastic limit x percent passing 200 mesh sieve (P75)
P26 Percenc passing the 26,5 mm sieve
The approximate 95 percent confidence intervals are gravel loss + 10,6
mm. The t-values of the coefficients are given in Table 6.3.
Digitised by the Open Scholarship Programme in support of public access to information, University of Pretoria, 2017

- 6.8 -
TABLE 6.3: GRAVEL LOSS REGRESSION ANALYSIS (Model 6.5)
Parameter Estimate Standard t-value Deviation
D*ADT 0,047 0,0091 5,13 D*N -0,365 0,0375 -9,73 D*PF -0,001 0,0003 -4,49 D*P26 0,048 0,0027 18,04 D*ADT*N 0,0027 0,0004 6,70 D*ADT*P26 -0,0005 0,0001 -4,98
In the eastern part of the study region the higher rainfall has
resulted in the forestry industry, with a concomitant increase in
traffic. This is also a more mountainous part of the country resulting
in steeper grades on many of the roads. This has led to some multi
collinearity of some of the factors in the model which is unavoidable.
The data was thus split at an N-value of 5 to remove some of this
effect and two further models developed.
Where N < 5 (wetter eastern areas)
GL- D [ADT(0,136.N- 0,0255) - 1,7.N- 0,0073.PF + 0,077.P26
+ 0,1564.P75]
(r2 - 0,88; RMSE - 5,5; n - 376; F - 440)
where the variables are defined as above.
Where N > 5 (drier western areas)
GL- D [0,222.ADT - 0,096.N + 0,03l.P26 - 0,046.P75]
(r2- 0,79; RMSE- 4,7; n- 325; F- 299)
where the variables are as defined for model (6.5).
(6.6)
(6.7)
When the influence of the oversize material on the interpretation of
the grading analyses was identified towards the end of the project
Digitised by the Open Scholarship Programme in support of public access to information, University of Pretoria, 2017

- 6.9 -
(Paige-Green, 1988b) the data was re-analysed with the modified
grading analyses. The following best-fit model was obtained (Model
6.8) for the full data set:
GL- D [ADT(0,059 + 0,0027.N- 0,0006.P26) - 0,367.N- 0,0014.PF
+ 0,0474.P26] (6.8)
(r2 = 0,84; RMSE ~ 5,3; n = 703; F = 619)
No significant changes in the statistics of the model compared to
Model 6.5 were evident although minor changes occurred in some of the
coefficients. Consequently no further work was done to redevelop
models to replace 6.6 and 6.7. The coefficients and the t-values for
model 6.8 are shown in Table 6.4:
TABLE 6.4: GRAVEL LOSS REGRESSION ANALYSIS (Model 6.8)
Parameter Estimate Standard t-value Deviation
-D*ADT 0,0594 0,0159 3,72 D*N -0,3671 0,0377 -9,72 D*PF -0,0014 0,0003 -4,50 D*P26 0,0474 0,0027 17,84' D*ADT*N 0,0027 0,0004 6,64 D*ADT*P26 -0,0006 0,0002 -3,63
During the analyses the influence of the frequency of grader
maintenance was found to be insignificant. Normal grader maintenance
(graded about once a month) was carried out during the first half of
the monitoring period (about 18 months) while maintenance was delayed
for up to 6 months during the second half of the experiment.
Comparison of the gravel losses predicted from model 6.8 with the
measured gravel losses confirms this (Figure 6.1). The plot for
section 30B shows excellent correlation over the duration of the
project, while that for section 41A is one of the worst predictions.
Section 41A however was extremely stony and the gravel loss was in
fact much less than predicted due to the large exposed area of the
stones. Grader maintenance resulted in the replacement of the matrix
between the stones with uncompacted fine material from the shoulders
Digitised by the Open Scholarship Programme in support of public access to information, University of Pretoria, 2017

E E
10
(/) 20 (/)
0 ...J
~ 30 > c:t a:: t!)
40
- 6.10 -SEC 308
50 L---~--~---L--~----~--~--~--~--~----~~~~
E E
(/) (/)
0 ...J
...J 1.1.1 > c:t a:: (.!)
E E
(/) (/)
0 ...J
...J 1.1.1 > c:t a:: (.!)
0 300 600 900 1200
TIME (DAYS)
0
~ SEC 41A
~"' • 10 A
A A
20
A
30 ~--~--~---L--~~--~--~--~--~--~----~--~~
0
5
10
15
20
25
0 300 600 900 1200"
A
0 300
TIME(DAYS)
A
~A ."""'
600
TIME (DAYS)
FIGURE 6.1
SEC 906
~ .. ~A
A ~ .........
900 1200
PLOTS OF ACTUAL (A) AND PREDICTED(.,~~-) GRAVEL LOSS
Digitised by the Open Scholarship Programme in support of public access to information, University of Pretoria, 2017

- 6.11 -
and hence the variation in the measured gravel loss. The rate of
gravel loss on section 906 on the other hand followed the prediction
curve well for about two years before a large gravel loss occurred and
then the loss returned to the predicted rate. The cause of the sudden
gravel loss is not known but may be due to an unusually heavy rain
storm, a period of heavy traffic or excessive cutting during grader
maintenance.
A number of the level surveys taken 6 months after completion of the
roughness monitoring showed very large gravel gains or gravel losses
on some of the sections. These were generally those sections which
became extremely rough during the latter part of the project and
required heavy grading to restore the riding quality to acceptable
levels.
6.4 DISCUSSION
Examination of the four models developed shows that they are generally
similar. Although the grade was a significant variable (gravel loss on
grades can be expected to be higher due to erosion) the multi
collinearity between this and the N-value resulted in it being
excluded from the main model (6.8). The horizontal curvature was
surprisingly not a significant variable in the drier western areas. It
was also noted that the average daily traffic was more important than
either the cars or the trucks individually. This may be due to the
multi-collinearity between the percentage of heavy vehicles and the
N-value (both associated with the forestry industry).
In all the models the time factor is the most important variable with
the N-value also playing a major role. The gravel loss as expected is
directly proportional to the time elapsed. This temporal factor is in
turn clearly modified by a traffic and an environmental component. The
traffic component depends on the number of vehicles per day with a
higher loss as the N-value increases (less cohesion) but a smaller
loss as the percent passing the 26,5 mm sieve increases (i.e. the
traffic induced erosion is less as the coarse fraction decreases). The
environmental component is composed of those factors affecting the
erosion by wind or rain. As the N-value and the plastic factor
Digitised by the Open Scholarship Programme in support of public access to information, University of Pretoria, 2017

- 6.12 -
increase the possibility of erosion is decreased while the coarser
materials are less susceptible to erosion.
Similar relationships are found for the separate regions and for the
different methods of carrying out the grading analyses.
It is suggested that Model 6.8 is taken for general use in South
Africa as all the parameters necessary can be accurately and easily
determined and the quicker grading analysis recommended by Paige-Green
(1988b) can be used. All further discussion is therefore related to
this model. The predicted versus actual measurements for three
sections are plotted in Figure 6.1 and a matrix of the predicted
gravel losses for the extreme values of ADT, N, P26 and PF used in the
analysis is given (Table 6.5).
TABLE 6.5: GRAVEL LOSS PREDICTED BY MODEL 6.8 (in mm)
ADT (vpd) 10 395
N 1,3 10 1,3 10
P26 (%) 66 100 66 100 66 100 66 100
p 2100 -0,1 5,1 -10,9 -5,7 32,1 8,7 54,3 30,9 F
104 10,1 15,3 -0,7 4,5 42,3 18,9 64,5 41,1
The predictions of gravel loss under low traffic yield a number of
negative losses (i.e. gains), especially for the high values of the
plastic factor in the dry areas. It is, however, highly unlikely that
the plastic factor of typical wearing course gravels would become this
high in the drier areas where physical disintegration is predominant
and the formation of plastic clays by chemical decomposition is
uncommon. The other predicted gravel gains are less than 1 mm per year
and are related primarily to the material coarseness under minimal
traffic. This gravel ga~n is neutralised at a traffic count of 15
vehicles per day. As only one of the sections studied had a traffic
count of less than 20 vehicles per day inaccuracies can be expected at
these very low counts. Other than these anomalies the predicted annual
gravel losses range from 4,5 mm for a lightly trafficked, fine
grained, low plasticity material in a dry area to about 65 mm for a
Digitised by the Open Scholarship Programme in support of public access to information, University of Pretoria, 2017

- 6.13 -
non-cohesive, coarsely graded aggregate under high traffic in a dry
area.
An interesting aspect noticed after regravelling of some of the
sections was an initial rapid "gravel loss" after opening to traffic
before the gravel loss became more consistent. Examination of the
results from the sections which were regravelled during the project
showed this to be common to them all. This phenomenon was confirmed by
the Brazil data (Visser, 198la) and was attributed to initial
compaction effects.
An experiment was carried out on a
section of road where gravel loss
newly regravelled, experimental
and density measurements were
carried out at frequent intervals after construction. The road was
compacted with at least three passes of a pneumatic tyred roller, an
unusually high compactive effort for an unpaved road. An average
relative compaction of 97 per cent Mod AASHO was obtained. The
analysis of these results showed only a small initial traffic
compaction followed by a consistent gravel loss of 2,5 mm per month
(higher than predicted) over the next 4 months (Figure 6.2). A
significant increase in the gravel loss is noted in August immediately
after an unusually large number of vehicles used this road to attend
an agricultural show. From the beginning of the wet season the gravel
loss decreases to an amount less than the predicted loss. The increase
in dry density of about 9 per cent (from the compacted density) during
the initial period after construction is not reflected in a rapid
initial compaction (as was the case in the roads
grid roller) although it may be incorporated in
loss.
compacted under a
the overall gravel
This experiment certainly showed the benefit of adequate compaction
during construction as noted by Netterberg (1985).
The rate of gravel loss is affected mainly by the traffic, but an
important overlying influence of the geotechnical properties is
present. This can be seen from Table 6.5 where, for example, the
annual gravel loss on a road carrying 395 vehicles per day in an area
with anN-value of 1,3 will vary between 8,7 mm and 42,3 mm depending
on the grading and plasticity of the material. The grading and
Digitised by the Open Scholarship Programme in support of public access to information, University of Pretoria, 2017

"' E ....... 0
.:Jt:.
>-I-(f)
z w Q
>-a:: Q
- 6.14 -
20
;e :!... I-z w I-z 0 u 10 w a:: ::> I-(f)
0 ~
0
2000
1900
1800
0 ·I· --------~~~-----WET SEASON------~~
' I ' """- ',1 '
E E
.J w > 10 <t a:: (!)
lL. 0 .... (f) (f)
0 .J
20 L---------~----------~--------~----------~--------~ 0 2 4 6 8 10
TIME (MONTHS)
FIGURE 6.2
MOISTURE AND DENSITY CHANGES AND GRAVEL LOSS FOR ROAD 2452
Digitised by the Open Scholarship Programme in support of public access to information, University of Pretoria, 2017

- 6.15 -
plasticity are related almost entirely to the geological composition
of the parent rock (or material in the case of pedocretes) and the
climate under which weathering took place.
6.5 COMPARISON WITH OTHER MODELS
It is not recommended that different models are compared using
statistical parameters such as the r-squared or root mean square
errors, as the inference space of the models may differ considerably.
A comparison of the predictive capability of the various models using
the residuals was thus carried out. The residuals were calculated by
subtracting the predicted annual gravel losses from the annualised
differences between the first and last measured gravel heights for
each section or regravelling cycle. The results of this analysis are
shown in Table 6.6.
TABLE 6.6: COMPARISON OF RESIDUALS OF GRAVEL LOSS DATA USING DIFFERENT
MODELS
Origin of model Mean Variance Sed Error of mean
Kenya 6.1 2,17 104,01 0,96 Brazil 6.2 -0,85 78,S4 0,84 Kenya
(Jones mod) 6.1 7,98 167,00 1,22 World Bank 6.3 5,49 55,62 0,70 South West Africa 6.4 3,12 158,98 1,19 This project 6.8 -0,87 39,97 0,59
It is noted that the closest prediction of the mean to zero of all the
models is Model 6.2 derived in Brazil which underpredicts by 0,85 mm
on average. Model 6.8 is marginally worse underpredicting by 0,87 mm
on average. The variance of the residuals of Model 6.8 is much smaller
than that of the other models indicating that the predicted values do
not differ from the actual results as much and a narrower band of
predicted values is obtained. An analysis of the actual measurements
is summarised in Table 6.7 and shown as histograms in Figure 6.3.
Digitised by the Open Scholarship Programme in support of public access to information, University of Pretoria, 2017

>u
MEAN MEASURED
GRAVEL LOSS
- 6. 16 -
MODEL 6.8
0 MODEL 6.2
~ MODEL 6.3
0 MODEL 6.1
~ MODEL 6. I (Mod)
~ 0~-----------J~~~~~~ua~~~~~~~~~~~~~-::> 0 w a: u...
ACTUAL GRAVEL LOSS
-20 0 20 40 60 GRAVEL LOSS (mm)
FIGURE 6.3 HISTOGRAMS OF ACTUAL AND PREDICTED GRAVEL LOSS
Digitised by the Open Scholarship Programme in support of public access to information, University of Pretoria, 2017

- 6.17 -
TABLE 6.7: SUMMARY STATISTICS OF PREDICTED AND ACTUAL GRAVEL LOSSES
MODEL MEAN VARIANCE ACTUAL ERROR PREDICTED (%)
6.1 16,0 83,5 15,1 6.2 13,0 46,3 -6,5 6.1 21,8 157,5 56,8
(Jones mod) 6.3 19,4 21,7 39,6 6.4 17,0 162,3 22,3 6.8 13,1 18,7 -5,8
ACTUAL 13,9 58,8 0
An examination of the actual measured and predicted mean gravel loss
and the prediction errors shows that Model 6.8 is the closest to the
mean (5,8 percent under), Model 6.2 is the next best underpredicting
by 6,5 percent while Model 6.1 overpredicts by 15,1 percent. The
variance of Model 6.8 is much smaller than that of 6.2 indicating a
much smaller range of predicted results. Inspection of the actual
gravel loss measurements indicates that five of the nine results above
the maximum predicted value of 25,4 mm were obtained from sections
·;;hich were regravelled during the project and both of t:he negative
values were obtained for sections which were regravelled during the
project. It would thus appear that the high gravel losses are caused
by excessive cutting during grader blading prior to regravelling
(probably to restore the shape as the subgrade became exposed),
excessive gravel loss from the subgrade material or traffic compaction
of the poorly compacted wearing course after construction. The model
(6.3) developed by Paterson (1985) is recommended by the World Bank in
the HDM3 document for developing countries. This model overpredicts
the gravel loss under South African conditions by more than 20 per
cent. There is very little difference between the Brazil model and the
locally developed one in terms of prediction capability but the Model
6.8 is much simpler to use and requires less input.
Application of the local model to the gravel loss measurements
recorded in Kenya (Figure 6.4) and Brazil (Figure 6.5) indicates that
Model 6.8 generally underpredicts the gravel loss but overpredicts for
one section (G29) in the Kenya study. The predictions are more
accurate for the Brazil study (Figure 6.5) conforming well with the
Digitised by the Open Scholarship Programme in support of public access to information, University of Pretoria, 2017

- 6.18 -
LEGEND:
-PREDICTION OF SOUTH AFRICAN MODEL (6.8) --PREDICTION OF BRAZIL MODEL (6.2) --PREDICT ION OF KENYA MODEL (6. I )
50 Gl LATERITE G3 LATERITE
•
40 ~--------------~
E 30 E
en en 0 20 ...J
...J ILl
~ 10 a:: (!)
0
40
30
20
10
0
G7 LATERITE GIO LATERITE
G28 QUARTZITE G29 QUARTZITE
0 50 100 150 0 50 100 150
CUMULATIVE TRAFFIC VOLUME, T (THOUSANDS)
FIGURE 6.4
GRAVEL LOSS VERSUS CUMULATIVE TRAFFIC VOLUME FOR A SELECTION OF GRAVEL ROADS FROM TH£ KENYA
STUDY f Hodges eta/ 1975; Visser 1981 a J
Digitised by the Open Scholarship Programme in support of public access to information, University of Pretoria, 2017

(.!) z
170 1- :::i ...J w > <t
160 r 0: ...J (.!) w w ~ 150 0:
...J
>-0: <t 140 0: 1-iii 0: 130 <t
::E 0 120 0: La.. ~
E 110 E (/)
(/) 100 w z ~
~ 90 I 1-
....J w
~ 0: (.!)
77,0
(.!) z
77,5
~PREDICTED ~ GRAVEL LOSS
~
INITIAL TRAFFIC COMPACTION
(.!) z ....I ....I w > <t • 0: (.!) w 0:
~, ............
•
LEGEND:
>r---K HIGH MAINTENANCE
- _. LOW MAINTENANCE
MODEL 6.8
_.__ ________ 1________ I I
78,0 78,5 79,0 79,5 DATE
FIGURE 6.5
PREDICTED AND MEASURED GRAVEL LOSS ON
SECTION 251
(J'I
..... \.0
Digitised by the Open Scholarship Programme in support of public access to information, University of Pretoria, 2017

- 6.20 -
actual measurements for the first two cycles. The actual gravel loss
in the third cycle is much higher than predicted and it would appear
that either the material used had different characteristics or the
traffic on the section increased dramatically. The rapid "gravel loss"
between the first two measurements of the second cycle is typical of
the traffic induced compaction after regravelling reported in Chapter
6.4.
6.6 CONCLUSIONS
The analysis of existing models to predict the gravel loss on unpaved
roads indicated large differences between the predicted gravel losses
for a number of roads in South and South West Africa and the actual
losses. A model based on some 700 results from southern Africa has
been developed. This model predicts the gravel,loss with an accuracy
of within 11 mm and should replace the model developed in Brazil for
the Maintenance and Design System when used locally.
One of the main advantages of this model is its simplicity compared to
the existing models. Aspects such as the vertical grade and horizo~tal
curvature which need to be averaged for a road link are excluded from
the model eliminating a major problem. No geological classification is
necessary. All the parameters required can be easily obtained by"
relatively unskilled staff in developing areas.
As noted for the roughness prediction model, the geotechnical
properties (notably the grading and plasticity again) significantly
affect the gravel loss of unpaved roads.
Digitised by the Open Scholarship Programme in support of public access to information, University of Pretoria, 2017

CHAPTER 7
SPECIFICATION DEVELOPMENT
7.1 INTRODUCTION
From the discussion of the important properties affecting the road
performance (Chapters 4, 5 and 6), suitable limits for the
specification of the various material properties were developed. This
chapter discusses the derivation of performance-~elated specifications
for wearing course gravels based on the results of the monitoring
programme and the field and laboratory testing. Although the
specifications were based on a limited number of sections, they cover
a wide range of material, climate and traffic regimes, and
statistically are applicable over much of southern Africa.
Prior to the development of the specifications, the requirements of
good specifications were identified and the applicability of the
specifications in current use was investigated. An experiment to
define some acceptability limits for roughness, dustiness and safe~y.
using two rating panels was also carried out.
7.2 REQUIREMENTS OF GOOD SPECIFICATIONS
Good material specifications should fulfil a number of requirements:
• They should be simple, with as few requirements or different test
methods as possible.
• The limits should be as wide as possible and not restricted to a
narrow range of a significant property (e.g. a tight grading
envelope), but adequately comprehensive to accept suitable
materials and reject unsuitable materials. Experience has shown
that strict specif:cations result in their being totally
or in excessively high costs to locate and transporc
material. The trend in recently specified limits is
simplification (e.g. the most recent TPA (1983) and DOT
ignored,
suitable
toward
(1985)
specifications have all but eliminated grading requirements).
• The properties specified should require inexpensive, quick, easily
Digitised by the Open Scholarship Programme in support of public access to information, University of Pretoria, 2017

- 7.2 -
done tests which are
minimal sophisticated
repeatable and reproducible and necessitate
equipment and a relatively low level of
operator training.
• Specifications should be practical to implement and apply to the
total area for which they are intended.
• Specifications should adequately define important properties
(indirectly if necessary) such as cohesion and strength and
eliminate obvious problems such as oversize material.
• Specifications should preferably be in terms of existing test
methods or combinations of results from existing methods, although
scope exists for the development of simple new methods.
• Specifications should be based on performance related studies.
• Although specifications should be rigidly adhered to, the facility
should exist for the user to appreciate the consequences of the
use of materials outside the specified limits e.g. the
implications of increased construction, maintenance and road user
costs, increased dust, poor safety standards.
The specifications were developed bearing all of these factors
carefully in mind.
7.3 EXPERIMENT TO DEFINE ACCEPTABILITY CRITERIA
Acceptability criteria for paved roads are well defined and have been
summarised by Visser (198la). Acceptability criteria for unpaved
roads, however, have generally consisted of various criteria such as
those affecting the profitability of haulage routes in the forestry
industries of the USA and Canada (Paterson et al, 1975; Visser,
l98la). These criteria are suitable for this type of service but are
unsuitable even for developing countries where the all weather
trafficability of important routes is necessary.
African situation where together with the all weather
the road roughness, passenger comfort and safety
In the southern
trafficability,
are considered
equally important, acceptability criteria for these parameters needed
to be defined.
Visser (198la), instead of considering a set of subjectively
determined standards proposed a set of limiting conditions, mainly
Digitised by the Open Scholarship Programme in support of public access to information, University of Pretoria, 2017

- 7.3 -
related to maintenance philosophies. For this study, it was necessary
to quantify acceptability criteria for road roughness, passenger
comfort and safety in order to relate the material properties to these
parameters.
In order to quantify these parameters two rating panels were used. The
first one consisted of 8 engineers, road inspectors and materials
technicians from the TPA and one from South West Africa who carried
out a full condition description as used in the routine monitoring of
the gravel road experimental sections. In addition a rating of the
roughness, dustiness and safety was obtained. This was followed up
four days later by a panel made up of a cross section of the
travelling public. This 14 member panel consisted of black and white
males and white females and included motoring and other journalists, a
farmer, a rallyist and an engineer and geologist. In this case only
the ratings for roughness, dustiness and safety were requested. The
results of this experiment are fully described by Paige-Green and
Netterberg (1988) and are summarised below.
For both panels 5 of the experimental sections were selec~ed with
measured roughness values in the range QI = 30 (very good) to QI 184
(thought to be totally unacceptable). The dust was generally in the
range average to unacceptable as rated during the project. The
engineers' panel was asked to drive through the sections at 80 kph and
rate the three parameters on a 5 point scale as follows:
1 - excellent
2 - good
3 - average
4 - bad
5 - unacceptable
This rating was done in both directions although the roughness
differed in the two directions. They were then asked to carry out a
full condition description. The same 5 point scale was used for
severity and the areal extent was rated as follows:
Digitised by the Open Scholarship Programme in support of public access to information, University of Pretoria, 2017

- 7.4-
1 - 0 - 20 % (of area of travelled surface)
2 - 20 - 40 %
3 - 40 - 60 %
4 - 60 - 80 %
5 - 80 - 100 %
The results of this rating varied considerably from those which were
based on the standard method used during the project. After some
discussion it became apparent that the TPA staff were rating the
sections in terms of required maintenance. This differed from the
NITRR approach which rated the sections in terms of the propensity to
form potholes, loose material etc.
In addition the TPA ratings generally overestimated the extent,
usually classifying the extent as 100 % of the section. Should any
distress occur the whole section would need maintenance and not just a
few potholes patched or the excess loose material removed in places.
For research purposes it was considered more important to classify the
worst severity in the section (provided it was significant in the
section i.e. occurred ovar say at least 5 % of tha area or affected
the riding quality or safety). It was also important to estimate the
area affected by that condition as opposed to the TPA rating of the
whole section, e.g. if there were only a few potholes, mainly with a
severity of 3 but one or two with a severity of 5 the rating would be
- severity 5, extent 1.
The public rating panel visited the same sections four days later and
rated the roughness, dustiness and safety. A practice section was
rated first so that any problems could be clarified and the
participants knew what was required. Each section was only rated in
one direction and the actual roughness in that direction was measured.
An analysis of variance of the roughness rating matrix (Paige-Green,
1987a) indicated that the variation betwt::~::n the racers and sectio11s
was significant at the 0,01 level. This agrees with the ratings
carried out during the AASHO Road Test (Hutchinson, 1963). The overall
reliability (a measure of the repeatability) of the raters and ratings
was 0,76 and 0,987. These figures compare well with the values
Digitised by the Open Scholarship Programme in support of public access to information, University of Pretoria, 2017

- 7.5 -
obtained by Curtayne et al (1972) of 0,661 and 0,978 for a panel
rating paved roads in South Africa (a value of 1 indicates perfect
repeatability and 0, no repeatability).
7.3.1 Roughness rating
The roughness ratings were generally fairly consistent with the range
of ratings within a panel only differing by more than 2 units on three
of the sections, one being the practice panel for the public. It must
be noted that some of the sections had fairly wide wheel paths and the
ratings may not apply to exactly the same paths each time. This is
taken into account as far as possible by using the average of three
results for the measured roughness.
In order to get an acceptance criterion the average of each panel and
section was determined. These were regressed against the measured
roughness (in QI counts/km) of the sections. A good correlation was
obtained for the following equation:
Mean rating- 0,018 ROUGHNESS + 1,26 (7 .1)
(r2 - 0,93; RMSE = 0,25; 95 % confidence limits + 0,5)
The regression equations for the TPA and public when compared are as
follows:
TPA Rating = 0,018 ROUGHNESS + 1,28
(r2 - 0,91; RMSE - 0,35)
Public rating- 0,017 ROUGHNESS + 1,24
(r2 - 0,97; RMSE = 0,17)
(7.2)
(7.3)
Analysis of these relationships (Figure 7.1) yield the following
criteria for measured roughness (QI rounded to the nearest 10) (Table
7.1):
Digitised by the Open Scholarship Programme in support of public access to information, University of Pretoria, 2017

- 7.6 -
TABLE 7.1: CRITERIA FOR MEASURED ROUGHNESS
Severity Proposed Engineers Public
Excellent (1) 0 - 40 0 - 40 0 - 40 Good (2) 40 - 100 40 - 90 40 - 100 Average (3) 100 - 150 90 - 150 100 - 160 Bad (4) 150 - 200 150 - 200 160 - 220 Unacceptable (5) > 200 > 200 > 220
The proposed values (Paige-Green and Netterberg,. 1988) indicate that
the roughness of gravel roads should be maintained at values less than
150 QI and preferably less than 100 counts/krn (i.e. good). During the
routine monitoring of the experimental sections many sections were
rated by the different LDI drivers and the following tentative limits
were proposed:
QI
Severity 1 0 - 45
2 45 - 90
3 90 - 135
4 - 135 - 180
5 > 180
From Figure 7.1 it is observed that the TPA rating was apparently more
variable than that of the public. This is probably due to the TPA
ratings being in both directions while the higher measured roughness
of the two directions was used in the analysis. An interesting aspect
was that the public considered a slightly higher value (QI of 162
against 146) as the lower limit of a bad section. Both of these limits
are higher than that proposed tentatively during the monitoring.
7.3.2. Dustiness
As no quantitative value for the dustiness was available the tatings
of the panels were compared with the standard method used during the
routine monitoring of the project. The rating panels used subjective
values on the 5 point scale while the standard used more objective
ratings (e.g. Severity 4 - the silhouettes of cars are visible in the
Digitised by the Open Scholarship Programme in support of public access to information, University of Pretoria, 2017

(!) 4,0
4,5
---- X
MEAN OF BOTH PANELS
z -1- TPA <t 0::
en 3,5 en w z I X (!)
:::> 0 3,0 0::
PANEL z <t
-.J
w -I
~ 2,5 X : T P A PANEL . : PUBLIC PANEL
2,0
I ,5
I I 30 40 50 60 70 80 90 100 110 120 130 140 1~0 160 170 180
MEASURED ROUGHNESS (QI IN COUNTS/km)
FIGURE 7.1
REGRESSION LINE OF MEAN RATED ROUGHNESS AGAINST MEASURED ROUGHNESS fQI COUNTS /km)
Digitised by the Open Scholarship Programme in support of public access to information, University of Pretoria, 2017

- 7.8 -
dust while for a rating of 5 a car is totally obscured by the dust at
80 kmjh).
The average dust for all the sections was less than 4 (i.e., no
section was regarded as bad or unacceptable) although two sections
(Sections 2 and 4) were rated 4 by the standard method. Although it
was indicated by a number of the panel members that dust is an
important aspect it would appear that provided visibility is not
totally obscured the dust is tolerable. A comparison of the panel
ratings and project ratings is given in Table 7. 2 ..
TABLE 7.2: COMPARISON OF PANEL AND PROJECT DUSTINESS RATINGS
Section Project Engineers Project Public rating rating rating rating for eng for public panel panel
8 4 2,3 3 2,4 7 3 2,7 3 3,0 4 4 3,0 4 3,6 l 4 2,7 3 2,9 2 5 3,1 4 3,6
The project ratings differed for the two panels as the dustiness was
affected by rain between the two panel ratings. The public panel rated
the dust marginally higher than the engineers on every section even
though the dust was rated lower on 4 of the sections by the project
standard. The public therefore requires a stricter dust standard (i.e.
less dust) than the engineers.
From this rating it can be assumed that those roads which consistently
gave ratings of 5 during the project monitoring (when not affected by
rain) are the only ones unacceptably dusty. The mean for the public
panel was consistently slightly higher (i.e. worse) than that for the
engineers.
Digitised by the Open Scholarship Programme in support of public access to information, University of Pretoria, 2017

- 7.9 -
7.3.3 Safety
The analysis of the safety aspect was difficult to relate to any one
characteristic of the road. All the sections had an average safety
rating of less than 3 (i.e. considered to be of better than average
safety), except Section 4. This had an average rating of over 4 from
both the TPA panel and the public panel. The main reasons given for
the poor safety were the loose material ("sandwalle"), the roughness
and the unpredictability when driving on it.
Skid resistance tests on this section using a MOTOMETER brake
efficiency meter indicated that the skid resistance was adequate when
compared to most other sections and substantially better than Sections
7 and 8. It appears therefore that the public opinion of safety is
directly related to the directional handling characteristics of the
vehicle under normal conditions and not under emergency braking
situations.
In summary it can be concluded that:
1. The acceptable limit for road roughness was found to be a
Quartercar Index (QI) of 200 and the desirable limit 150. This
compares closely with the value of 180 and 135 estimated during
the monitoring programme.
2. The roughness ratings of the TPA and Public panels were very close
to each other with the average for the Public panel being
surprisingly higher (rougher) than that of the TPA.
3. The rating of dustiness showed that the dust is generally
acceptable provided vehicles are not totally obscured by the dust.
4. Safety criteria seem to be based entirely on the vehicle
directior.el handling un~er normel ccn~iticr.s ~~th lit~lc regard to
emergency braking situations.
Digitised by the Open Scholarship Programme in support of public access to information, University of Pretoria, 2017

- 7.10 -
7.4 ACCEPTABILITY LIMITS FOR SPECIFICATION DEVELOPMENT
The acceptability limits discussed in this section are defined as the
critical levels beyond which the roads fail to provide the service
expected from them (i.e. become unacceptable) and are applicable only
to performance criteria. This acceptance should not to be confused
with the acceptance testing of materials for specification compliance.
Acceptability criteria for the roughness, dustiness and safety under
local conditions have been derived for unpaved roads (Paige-Green and
Netterberg, 1988). These criteria are, however, defined for the worst
conditions which would be accepted. For the purpose of specification
development it was necessary to classify the performance of the
various properties monitored in terms of their acceptability over a
period of time. The results of the condition evaluation (Paige-Green,
1988a) and performance monitoring could be analysed in terms of a
number of statistical parameters (i.e. mean, maximum, mode, minimum,
various percentiles, etc). The mode (the most frequently occurring.
value) was considered to be the most useful of these parameters for
those performance criteria with discrete values (e.g. dust, ·potholes)
for the purpose of specification development. Use of the mode would
exclude such spurious measurements as those affected by rain, recent
grader blading, or poor subjective assessments. It was noted during
the monitoring that an equilibrium condition was reached for most of
the performance criteria fairly soon after maintenance and the
condition seldom deviated from this equilibrium, until affected by
blading or rainfall.
During analysis the mode for each parameter was determined but was
found to be unsuitable for those properties with continuously variable
values (i.e. roughness, rut depth, corrugation depth, even though for
example corrugations would form and deepen to an equilibrium depth,
after which they seldom varied by more than about 5 mm until the
section was bladed or rain fell) ~s thes~ results were often multi
modal and the first observation which had more than one value was
taken as the mode by the analysis programme (SAS, 1985). The 90th
percentile was
considered to
therefore taken
exclude spurious
for these properties as
results and be indicative
this
of
was
the
Digitised by the Open Scholarship Programme in support of public access to information, University of Pretoria, 2017

- 7.11-
condition that would not be exceeded 90 per cent of the time. The
performance of each section was then classified for each property as
desirable, undesirable or unacceptable according to Table 7.3.
The criteria for selecting the values in Table 7.3 were based mainly
on the acceptability criteria experiment (Paige-Green and Netterberg,
1988), the rating criteria (Paige-Green, 1988a), existing information
and the experience gained from having travelled some 90 000 km on
unpaved roads during the project. As it is usual (and recommended)
that most unpaved roads are bladed periodically . during the year all
the results for roughness recorded longer than 4 months after blading
were excluded from the analyses so as not to bias the results
excessively. Very few roads should, in practice, be bladed less than
three times per year, but for the purpose of this project, blading was
limited as far as possible to less than once every four months. This
allowed the performance in the longer term to be investigated.
The performance acceptability criteria (Table 7.3) of the dust,
cracks, loose material, slipperiness when wet and passability were
based solely on the most frequently occurring ratings (modes) for the
severity as rated during the monitoring (Paige-Green, 1988a). The
areal extent of the stoniness, potholes and surface drainage affected
the performance of the road significantly, but to a lesser degree· than
the severity. The product of the square of the severity rating and the
extent rating was thus considered to be representative of the
influence of the parameter on the performance. All of these criteria
are unitless values based purely on the ratings of severity and extent
obtained during monitoring.
As no data existed on the skid resistance of unpaved roads, no basis
for the decision on acceptability limits for the deceleration was
available. The recommended minimum deceleration for new cars on good
surfaces is 5,8 mjs2 (SABS, 1985) and a value just less than this was
ccr..sidered tc be t~c lc•,te::- limlt of desi::-ability for dry u::paved
roads. None of the sections had values less than 5,1 mjs2.
It was considered that a maximum of 20 mm for the 90th percentile
values of the rut and corrugation depths was desirable. Although a
Digitised by the Open Scholarship Programme in support of public access to information, University of Pretoria, 2017

- 7.12 -
TABLE 7.3: PERFORMANCE CRITERIA USED IN SPECIFICATION DEVELOPMENT
p E R F 0 R M A N c E Property Criterion
Desirable Undesirable Unacceptable
Dust Sev :s 3,5 3,5 - 4,5 ~ 4,5
Stoniness Sev2x ext < 25 25 - 32 > 32
Potholes Sev2x ext < 25 25 - 32 > 32
Cracks Sev :s 3,5 3,5 - .4, 5 ~ 4,5
Loose mater. Sev :s 3,5 3,5 - 4,5 ~ 4,5
Surf. drain. Sev2x ext < 25 25 - 32 > 32
Slip (dry) Deceler. > 5,5 4,5 - 5,5 < 4,5
Slip (wet) Sev :s 3,5 3,5 - 4,5 ~ 4,5
Passability Sev :s 3,5 3,5 - 4,5 ~ 4,5
Ruts Depth (mm) < 20 20 - 30 > 30
Corrugation Depth (mm) < 20 20 - 30 > 30 -·
Roughness QI < 100 100 - 150 > 150
Sev - severity; ext = extent; Deceler -deceleration (mjs2); QI = Quartercar index (counts/km).
roughness value of 150 counts/km was found to be the upper limit for
desirability from the acceptability experiment (Paige-Green and
Netterberg, 1988), the limit for desirability in terms of the 90th
percentile could not be set at this value. A maximum value of 100
countsjkm was considered desirable, while a value of more than 150
countsjkm was taken as unacceptable.
7.5 APPLICABILITY OF EXISTING SPECIFICATIONS
Prior to developing new specifications, it was considered prudent to
analyse the performance of the sections studied in terms of their
overall acceptability with respect to their compliance with the
existing specifications applicable to southern Africa. The TRRL (1981)
and UNESCO (Odier et al, 1967) limits used by some commonwealth
Digitised by the Open Scholarship Programme in support of public access to information, University of Pretoria, 2017

- 7.13 -
countries in southern Africa are generally the basis of the Botswana
(Min of Works and Comm, 1982) specifications and were not considered
separately. The main
which specifications
objective of this analysis
(if any) were adequate,
was to investigate
and what the main
deficiencies of the inadequate specifications were so as to eliminate
these problems in future specifications. Table 7.4 shows the total
percentage of sections complying with all the material limits (except
maximum size where specified which eliminated all of the sections
studied). This is sub-divided by the observed performance. The
percentage of sections not complying with the specifications but
providing at least a desirable performance is also shown for each
specification.
Most of the materials rejected by the TRH 14 (NITRR, 1985a)
specification had either plasticity indices which were too low, or the
percentages passing the 0,425 mm and 4,75 mm sieves were too large.
The Natal Roads Department (NPA, ca 1985) and Swaziland (Shepherd,
1986) requirements include the TRH 14 grading limits but specify a_
narrower range for the plasticity index. The lower plasticity index
requirement (6 per cent) of Natal, results in more of the lower
plasticity materials being accepted than the TRH 14 and Swaziland
requirements. The Department of Transport (1985) and Transvaal Roads
Department (1983) use the same specifications with the preferable
minimum limit for the soaked CBR of 45 eliminating most of the
materials. Those materials with a CBR of 45 or more generally have
plasticity indices less than 6.
The Orange Free State (Van der Walt, 1973) specification requires a
minimum PI of 10 and CBR of 25 which excludes many of the experimental
sections. The percentage passing the 2,0 mm sieve is specified by the
CPA (Provincial Administration of the Cape of Good Hope, 1983) and
this together with the minimum plasticity of 8 eliminates nearly all
of the sections. The Botswana (Ministry of Works and Communic, 1982)
speci!ica~~on is ~dapted to the prevailing aridity a~d restricts
PI to between 15 and 30. This excludes many of the materials in
study, but the difference in climate should be considered.
the
this
The
Botswana specification makes allowance for the use of the Netterberg
(1978) specification for calcretes which improve the situation
significantly as discussed below. South West Africa (Von Solms, 1987)
Digitised by the Open Scholarship Programme in support of public access to information, University of Pretoria, 2017

- 7.14 -
TABLE 7.4: COMPLIANCE OF STUDY SECTIONS WITH EXISTING SPECIFICATIONS
Sections complying Sections not (%) complying
Specific- but at ion Total By performance giving
desirable Desir- Undesir- Unaccept- performance able able able (%)
TRH14 12,2 4,7 5,6 1,9 32,6 DOT 2,7 0,9 0,9 0,9 36,4 TPA 2,7 0,9 0,9 0,9 36,4 NPA 22,5 7,5 10,3 4,7 29,8 OFS 4,5 1,8 1,8 0,9 35,5 CPA 14,0 7,5 5,6 0,9 29,8 Botswana 3,8 1,9 1,9 0 33,6 Lesotho 0 0 0 0 37,3 Swaziland 15,0 5,6 4,7 4,7 31,7 SWA • 3,6 0,9 1,8 0,9 36,4 Netterberg 29,0 14,1 10,2 4,7 23,2
has much the same climatic conditions as Botswana but allows for much
lower plasticity materials. Most of the materials are however rejected
by the restriction on the grading modulus with more than half of the
acceptable materials having GM values in excess of 1,7 while more than
40 per cent of the unacceptable sections have materials with grading
moduli within the limits. The Lesotho (Tsekoa, pers comm, 1986)
requirement of a minimum CBR of 60 eliminates all but five of the
sections, these five, however, defaulting on the plasticity index
(generally less than 6) or the percentage passing the 200 mesh sieve.
The specification developed by Netterberg (1978) specifically for
calcretes in dry areas accepts the highest percentage of the desirable
materials. A number of the acceptable materials are only just rejected
by virtue of marginally low AFV or APV values. The relative success of
these specifications for the range of different materials in this
study is indicative that the performance of wearing course gravels is
not significantly dependent on the rock type. The specification
excludes a number of materials which perform acceptably but with
slightly low plasticity indices and liquid limits. Some of the finer
grained materials with more than 75 per cent passing the 40 mesh sieve
performed adequately but cannot be tested against the specifications
as no limits for these fine materials are specified by Netterberg. In
Digitised by the Open Scholarship Programme in support of public access to information, University of Pretoria, 2017

- 7.15 -
addition, values for the aggregate fingers value and aggregate pliers
value cannot be determined when the material is fine and the 9,5 to
13,2 mm fraction is very small. Of the five unacceptable materials
which would be accepted by the Netterberg specification, three perform
unacceptably by virtue of the percentage of oversize material while
one section had bad grader-induced fixed corrugations.
In terms of the 18 calcrete sections of road included in the study, of
which eight were classified as giving a desirable performance during
the project, two as undesirable and seven as unacceptable, the
Netterberg criteria identify the following:
• Three of the eight desirable materials comply with the limits,
three have marginally low APV values, one a low liquid limit and
the other sample was too fine grained (87 per cent passing the 40
mesh sieve) for application of the specified limits. Using the
finest specified limit all the requirements were satisfied except
the plasticity index which was too low (6 instead of 8).
• One of the undesirable sections was accepted and the other
rejected because of a low liquid limit. The material accepted was
rated undesirable be~~use of its stoniness and would probably
provide an acceptable roughness without the excessive oversize
material.
• Three of the unacceptable materials complied with the limits, two
having excessive oversize material and the other, having almost
worn through the wearing course, was prone to the formation of
potholes. The four materials rightfully rejected had one or more
of a low liquid limit, a high linear shrinkage, an excessive LS x
percent passing the 40 mesh (0,425 mm) sieve and a low AFV.
The performance guide for wearing course materials used in Rhodesia
(now Zimbabwe) (Mitchell et al, 1975) utilised the plasticity product
(PI x per cent < 0,075 mm) and the coarseness index (m3ss of material
passing 37,5 mm but retained on 2,36 mm as a percentage of material
passing 37,5 mm). The performance of the sections monitored
this study are plotted on the chart of Mitchell et al (1975)
during
(Figure
7.2). It must be noted that the test results have been corrected for
Digitised by the Open Scholarship Programme in support of public access to information, University of Pretoria, 2017

- 7.16 -
the different test methods (i.e. PI increased by 3,5 to account for
the BS 1377 method used in Rhodesia compared to TMH 1 (NITRR, 1986;
Sampson and Netterberg, 1984) and particle size analysis re-calculated
on a maximum size of 37,5 mm) (Standards Association of Central
Africa, 1971). The material in two of the sections is classified as
being too fine but both perform well whilst the material used for 20
of the sections is classified as too coarse. There was, however, an
almost even division between the performance of the sections in terms
of their acceptability (7 desirable, 7 undesirable and 6
unacceptable). About 50 per cent of the sections in zones C (performs
well under wet and dry conditions) and D (performs reasonably well
during wet conditions but corrugates in dry weather) perform
desirably. In zone E (poor all round performance) 30 per cent of the
sections perform well. The bias towards the use of coarser, lower
plasticity materials locally is clearly evident in Figure 7.2.
A later specification (Rhodesia Ministry of Works, 1979) recommended
in Rhodesia characterises the material in terms of the plasticity .
index and grading modulus (Figure 7.3). The upper limit of the grading
modulus excludes one unacceptable material and could perhaps be
reduced (say to 2,3) which would exclude two further unacceptable
materials. The lower specified grading modulus excludes 20 materials,
nine of which perform desirably. Only 12 materials comply with the
specified limits, six of which perform desirably. Fifty two of the
materials are excluded, even by the extended limits which make
allowance for climate. Of these, 18 sections provided a desirable
performance.
As a whole none of the specifications differentiate between the
desirable, undesirable and unacceptable materials adequately although
the Netterberg (1978) specification shows the most potential to do
this. All of them, except that of Netterberg (1978) reject thirty per
cent or more of the acceptable materials, whilst there is only a
slightly better chance of the accepted materials performing desirably
than performing unacceptably.
A summary of results of some of the standard tests used in most of the
specifications for the three categories of performance is given in
Table 7.5.
Digitised by the Open Scholarship Programme in support of public access to information, University of Pretoria, 2017

E E I() ,.... 0 0~
v >< H
1100
1000
900
800
700
n.. 600
1-u :::> 0 0 0: n..
>-1-u f= (/)
<X _J
n..
500
400
300
200
100
0
TOO FINE
0
FIGURE 7.2
A POOR PERFORMANCE
2
---------- -- ........... -----------B PERFORMS REASONABLY WELL ---------------- -----C PERFORMS WELL --2 -
3
3
I 2
3 2 ------------II I 12
~- 2 ------1
D PERFORMS REASONABLY WELL 2
I 2 I ---- I 3 I I 3 2 -----1 I
E --~---...;3 3 3 2 POOR I I 2 - 2 -- - 2 -l PERFORMANCE 2 I I I 3 3 1
I I I 12 :11 3 3 3 32 3 3 3 2 I
3 3 31 3 2 2 331 I 3 2 3 3
3 2
TOO
COARSE
I 2
~ 2 I 3
2
3
10 20 30 40 50
COARSENESS INDEX
2
22
3
60
I ~ DESIRABLE PERFORMANCE
2 ~ UNDESIRABLE PERFORMANCE
3 ~ UNACCEPTABLE PERFORMANCE
3 3
70
3
80
PERFORMANCE OF SECTIONS IN RELATION TO 1975 RHODESIAN SPECIFICATION
90
-.J 0
..... -.J
Digitised by the Open Scholarship Programme in support of public access to information, University of Pretoria, 2017

26 ,o
24 ,o
22,0 ·-
20,0
18,0
X 16,0 w 0 z >- 14' 0 u i= (/)
<( 12' 0 ...J Q..
10,0
8,0
6,0 ·-
4,0
o,o
I: DESIRABLE PERFORMANCE
2 = llNDESI RABLE PERFORMANCE
3= UNACCEPTABLE PERFORMANCE
2
3
/3
/ /
0<v/~~ q.. <v '\?;/_ 00
~cy t--<0
o\o/ v" 40/ #-'V' /~
y~~
FIGURE 7.:3 PERFORMANCE OF SECTIONS IN RELATION TO 1979 RHODESIAN SPECIFICATIONS
Digitised by the Open Scholarship Programme in support of public access to information, University of Pretoria, 2017

- 7.19 -
TABLE 7.5: SUMMARY OF TEST RESULTS FOR DIFFERENT PERFORMANCES
Performance PI LL %<0,425 %<0,075 GM
Desirable 1,5-19,0 16 - 40 23 - 92 12 - 75 0,32-2,28 Undesirable 0,5-24,0 17 - 42 22 - 61 10 - 46 1,23-2,30 Unacceptable NP-20,0 NP - 46 16 - 71 6 - 32 1,26-2,50
The properties on which most of the specifications investigated rely
so heavily do not differentiate between the performance of the
sections adequately, with a substantial overlap between properties for
the different performances. The Rhodesian and Netterberg limits are
the best predictors at present, both using the plasticity and grading
in conjunction with each other, as recommended by Fossberg (Netterberg
and Paige-Green, 1988b).
One of the features which does come out of this discussion is the
influence of oversize material. In a direct comparison of the
performance of the sections studied, many of the sections contain ·
excessive oversize stones which result in an unacceptable performance.
Had these stones not been in the sections, the materials may have
performed adequately. In the development of the specifications this
has necessarily had to be taken into account and for some of the stony
sections it has had to be assumed that had the stones not been present
the sections would have performed better. This assumption was,
however, based on a good personal knowledge of the materials studied
and the performance of both the test sections and adjacent sections of
road. No other valid means of taking this problem into account could
be found.
The presence of excessive oversize material renders the interpretation
of the grading analyses difficult, and comparison of results almost
meaningless. Many of the sections contain boulders substantially
larger than the 63 or 75 mm sieve, normally the largest sieves used
(NITRR, 1979 and 1986). The underestimation of the percentage passing
the smaller sieve sizes (and the consequent overestimation of the
grading modulus) caused by these large stones (noted more than 60
Digitised by the Open Scholarship Programme in support of public access to information, University of Pretoria, 2017

- 7.20 -
years ago (Strahan, 1922)) results in a number of potentially
acceptable materials being rejected by many of the specifications.
This is illustrated in the case of one kilogramme of test sample
(NITRR, 1979 and 1986) which contained a stone of about 60 mm diameter
in a finer matrix with all the material passing the 26,5 mm sieve. The
percentage passing the 0,425 mm sieve was determined as 27 while as a
percentage of the material finer than 37,5 mm it was 41. This makes a
significant difference to the specification compliance.
Bearing in mind that the finer fraction (passing .the 2,00 mm sieve) is
the major contributor to the strength and cohesion of the material
(Strahan, 1922), this should be accurately quantified. It is therefore
suggested (Paige-Green, 1988b) that all grading analyses for unpaved
roads are standardised with the percentage retained on the 37,5 mm
sieve being calculated as a percentage of the dried, bulk field
sample, and reported as the Oversize index (I ) 0
while the particle
size distribution of the material is calculated on the weight of
sample passing the 37,5 mm sieve (Standards Association of Central
Africa, 1971). This allows a direct comparison between materials with
significantly different coarse fractions without affecting the
interpretation of results on finer materials (maximum size less than
37,5 mm).
The standard maintenance procedures resulted in some sections having
potholes or corrugations throughout the monitoring period. Had the
potholes been filled by hand with suitable material and compacted with
added water, many of them would have undoubtedly been repaired. The
standard procedure of grader blading does not repair potholes
adequately. Some of the corrugations were of such a wave-length that
they were not removed by grader blading and were probably made worse
as the grader bounced over them during blading.
For the specification development the particle size analyses were
standardised as percentages passing the 37,5 mrn sieve in order co make
the finer fractions directly comparable. This ensures that, provided a
consistent test technique is used in future (Paige-Green, 1988b), the
specifications are transferable for different materials .
Digitised by the Open Scholarship Programme in support of public access to information, University of Pretoria, 2017

- 7.21-
7.6 ANALYSIS OF RESULTS
In order to develop performance-related specifications it was
necessary to classify the overall performance of each of the sections.
The classification of the individual performance criteria (Paige
Green, 1988a) according to Table 7.3 allowed a value to be put to each
rating (desirable- 0; undesirable 1; unacceptable 2). The overall
quality of all the roads studied was then rated by the following
equation:
QUALITY - 2.Dust + Stones + Potholes + 2.Loose material + Surface
drainage + Ruts + Corrugations + 4.Roughness
The roughness, being the most important criterion (the major
contributor to vehicle operating costs) was weighted by a factor of 4
and the dustiness and loose material which are major criteria
affecting the safety were weighted by a factor of 2. The other
parameters were not weighted, but the cracking (which plays a minimal
role in the performance), and slipperiness and passability which were
not fully quantified were excluded from the equation. The stones,
potholes, drainage, ruts and corrugations are all included to a lesser
or greater extent in the roughness and were thus not weighted further.
This resulted in a ranking of the sections in terms of their overall
performance and classification into desirable, undesirable or
unacceptable performance (quality less than 10, 10 to 14 and greater
than 14 respectively). These values were subjectively determined by
consensus of those involved in the routine moni taring and the findings ..
of the acceptability experiment (Paige-Green and Netterberg, 1988).
The performance of all the sections was related to the material
properties to develop specifications. The analysis involved
identifying those material properties and limits which would provide
the ideal wearing course according to the criteria identified in
Chapter 2.5.
7.6.1 Smooth ride
The smooth ride is the most important aspect of an unpaved road as the
Digitised by the Open Scholarship Programme in support of public access to information, University of Pretoria, 2017

- 7.22 -
roughness is the major contributor to the vehicle operating cost. A
low roughness is obtained by minimising oversize material and
eliminating corrugations, erosion channels and potholes. The presence
of oversize material is one of the few material properties which can
be controlled and those sections which were excessively rough because
of large stones were accounted for in the analyses. The overall
roughness (including the effects of corrugations, potholes and erosion
channels) was analysed in terms of a number of the material properties
with the shrinkage product (linear shrinkage x per cent passing
0,425 mm sieve (Netterberg, 1969)) being the best indicator. A minimum
value of 100 for the shrinkage product rejects 4 desirable, 18
undesirable and 9 unacceptable sections on the basis of roughness.
Most of the sections with shrinkage products less than 100 were
particularly prone to the formation of corrugations and even those
which were excessively
remain rough if the
rough due
oversize
to oversize
material
stones would
was removed,
probably
due to
corrugations. Thirty three desirable sections, 33 undesirable sections
and 5 unacceptable sections have shrinkage products in excess of 100.
However, many of the undesirable sections would probably perform
desirably with proper maintenance. The 5 unacceptable sections with a
shrinkage product larger than 100 all contained excessive oversize
material or had maintenance-induced corrugations.
The oversize material should therefore be eliminated in order to
reduce the roughness to acceptable levels. This is of particular
importance in urban areas where the number of potential projectiles
used in vandalism, especially during periods of urban unrest, should
be reduced. An Oversize Index of up to 5 per cent can be allowed as
discussed in Chapter 4.3.4.
7.6.2 Safe ride
The perceived safety of unpaved roads is apparently mainly concerned
with the directional stability of the vehicle (Paig~-Green anc
Netterberg, 1988), the most important property affecting the vehicle
handling on a dry road being the presence and quantity of loose
material. Under wet conditions the slipperiness and drainage is the
most important aspect and is discussed under the relevant section.
Digitised by the Open Scholarship Programme in support of public access to information, University of Pretoria, 2017

- 7.23 -
The generation of loose material depends both on the material
properties and the compaction during construction. Adequate wet
compaction reduces ravelling significantly (SF Poolman, pers comm).
Materials with a shrinkage product of less than 100 have a 60 per cent
chance of forming undesirable or unacceptable loose material, whilst
those with a value in excess of 100 have only a 26 per cent chance.
When the material becomes well sorted (i.e. poorly graded (Rosenak,
1963)) or becomes excessively coarse the materials are prone to ravel,
as the interlocking capability of the particles diminishes. These two
aspects are taken into account by the grading coefficient (difference
between the per cent passing the 26,5 mm and 2,0 mm sieves x per cent
passing 4,75 mm sievejlOO). This function not only defines the
quantity of gravel in the sample, but relates it to the sorting of the
material. A value in excess of 34 results in ravelling even when the
shrinkage product is more than 100.
7.6.3 Deformation resistance
The resistance to deformation results from the material having an
adequately high stability (or strength) at the in-place density and
moisture to avoid shearing, and having an adequate thickness and
strength to spread the applied loads sufficiently to avoid over
stressing the subgrade.
The latter requirement is seldom a problem in southern Africa as most
of the subgrades are sandy materials, and the water-table is generally
deep. The subgrades on the test sections generally had similar
laboratory soaked CBR values (Proctor compaction) (mean- 22; a= 17)
to the imported wearing course materials (mean- 25; a= 17), but
lacked the cohesion to form a hard wearing course in the unconfined
condition. This type of sandy material is usually quick draining and
therefore not subject to high pore-water pressures under loading. Very
few examples of subgrade failure were recorded during the project,
these generally being associated wi~h deep pc~holes which were ~ct
repaired and thus retained water for prolonged periods, or thin
wearing courses.
Digitised by the Open Scholarship Programme in support of public access to information, University of Pretoria, 2017

- 7.24 -
The strength of the material is generally defined in terms of the
California Bearing Ratio (CBR) in most specifications. This test is,
however, subject to a number of problems, especially when carried out
on materials with a significant coarse fraction (in excess of
19,0 mm). The coarse fraction is either broken down and added to the
finer material (NITRR, 1979 and 1986), replaced by finer material
(Beaven et al, 1987) or left out all together (RRL, 1952; Country
Roads Board, 1982; GEIPOT, 1980). The material strength obtained by
any of these methods is not a true reflection of the actual strength.
It is recommended that for unpaved road testing the test is only
carried out on the material passing the 19 mm sieve, which will
probably result in a slightly lower (but repeatable) value, as the
coarser material in the road is likely to increase the stability and
strength (Beaven et al, 1987).
In most cases where N is less than 5 the "worst" moisture condition is
probably less than the condition at which the soaked CBR is carried
out, apart from areas adjacent to potholes which retain water. Where N
is greater than 5 the "worst" condition is unlikely to exceed the
optimum moisture content except perhaps in the upper 25 mm of the
road. However, certain areas which obtain continuous rain for
prolonged periods may have soaked materials.
It was thought that the moisture contents in the wearing courses of
the test sections at the time of sampling (field moisture content)
(FMC) would vary considerably, unlike that of surfaced roads where an
equilibrium is reached within about 2 years of surfacing (Emery,
1985). Where N s 5, the average field moisture content (FMC) to OMC
ratio was 0,49 (a - 0,20) and where N > 5 the average value was 0,39
(a- 0,22). It must be noted that the sections with N < 5 were
generally sampled towards the end of the wet season while the roads in
the drier areas were sampled early in the dry season. However, roads
in both areas were sampled in both sunny and rainy conditions. The
maximum recorded FMC:OMC ratio was 102 percent with only chree results
over 100 percent. Emery (1985) found that the mean equilibrium
moisture content (EMC) (the point at which the FMC equilibrates in
paved roads) to OMC ratio varied between 0,71 and 1,05 (a- 0,29 to
0,45) for subgrades, 0,7 to 0,83 (a - 0,26 to 0,28) for subbases and
Digitised by the Open Scholarship Programme in support of public access to information, University of Pretoria, 2017

- 7.25 -
0,53 to 0,63 (a = 0,16 to 0,24) for bases, under bitumen surfaced
roads (average coefficient of variation 0,38, 0,35 and 0,33
respectively). Where N ~ 5 the coefficient of variation for unpaved
wearing courses is 0,41 and where N > 5 the value is 0,56.
Significantly more variation occurs in the wearing courses of unpaved
roads (as found by Visser, 1976). A more intensive investigation into
the moisture changes in unpaved roads associated with rainfall and
seasons is recommended.
It can, however, be stated with 95 percent confidence that the ratio
of the field moisture content to the optimum moisture content will be
less than 0,89 where N ~ 5 and less than 0,83 where N > 5. The
difference in the CBR between a soaked test and one done at OMC or 90
per cent of the optimum moisture content is usually substantial,
especially in those natural gravels containing an appreciable amount
of clay, which results in particularly moisture sensitive materials.
Some increases in the CBR between the soaked determination and the
values at OMC and 90 percent of OMC (Proctor compaction effort) are _
shown in Table 7.6.
TABLE 7.6: MOISTURE SENSITIVITY OF SOME SAMPLES
Sample Description Soaked CBR at CBR at CBR OMC 90% OMC
10534 Weathered shale 6,9 16,5 30,0 10588 Fine ferricrete 1,4 5,3 15,0 10610 Coarse ferricrete 36,0 45,7 43,5 10677 Chert gravel 7,9 12,3 42,0 10654 Red powdery shale 12,0 16,0 46,5 10700 Decomposed granite 8,6 11,5 18,0 10985 Gravelly quartz porphyry 82,9 94,8 180,0
As none of the sections studied in the project (including heavily
trafficked timber haul roads in wet areas) became impassable during
the project, specification limits with respect to impassability cannot
be derived solely from the results of this project. However, the fact
that some of the sections had soaked CBR values (at Proctor
compaction) as low as zero, confirms the conclusion that the
specification of soaked CBR values is unnecessarily harsh for many
Digitised by the Open Scholarship Programme in support of public access to information, University of Pretoria, 2017

- 7.26 -
conditions, and it is unlikely that even during periods of sustained
rainfall wearing courses become fully saturated.
Measurement of the moisture contents on a number of compacted calcrete
gravels (OMC 7,2 to 12,7) after the usual 4 days soaking (NITRR,
1986) showed that the changes in moisture content during soaking
depend strongly on the degree of compaction achieved. At Mod AASHO
compaction the average change in moisture content was 1,85 percentage
points (a - 0,65) whilst at standard Proctor effort the average change
was 4,2 percentage points (a- 1,7). This is of course purely an
indication of the extra moisture required to fill the air voids as all
the samples were fully saturated after 4 days soaking. The importance
of good compaction to preserve the stability of the wearing course,
both by increasing the stability and decreasing the permeability and
porosity, is thus confirmed.
The evidence indicates that in practice, except for the upper
centimetres, it is unlikely that a well-compacted unpaved road
become soaked even under severe rainfall conditions.
Although the CBR at 90 percent of OMC would be adequate 95 percent
few
will-
of
the time under most conditions prevailing in southern Africa, the CBR
at OMC should be used as the design criterion. This reduces both the
time for testing and the number of moulds which need to be compacted
as each mould compacted during the density determination can be
penetrated and a moisture sensitivity versus strength curve can be
obtained quickly and at minimum cost. The necessity for higher
compaction can be judged from the moisture/strength relationships.
Visser (198la) presented a plot of the soaked CBR (Standard Proctor
compaction effort) against the traffic, and all materials with a CBR
greater than 15 at 100 vehicles per day and greater than 18 for 500
vpd remained passable during the wet season. Specifications currently
in use limit the soaked CBR from Yaluec as lc~r as 1.5 .:o.t: 93 per cent
Mod AASHO density to not less than 60 at a 95 to 98 per cent BS
compaction (heavy). This is an extremely wide range which could have
serious cost implications during material selection.
Digitised by the Open Scholarship Programme in support of public access to information, University of Pretoria, 2017

- 7.27 -
Because none of the sections studied became impassable during the
monitoring period, recourse to other available work in conjunction
with the findings of this project was necessary in order to define
limits for stability. Ahlvin and Hammitt (1975) have provided a
nomograph for the relation between load, tyre pressure, CBR and
repetition of load for unsurfaced soils in which a maximum rut depth
of 50 to 75 mm can be expected (under nil-maintenance conditions). A
second nomograph in which minimal distortion of the road (with no
maintenance) is allowed uses the tyre pressure, stress repetitions and
surface CBR strength. The CBR used in these nomographs is not clearly
identified but is probably at Mod AASHO compaction.
Taking typical South African tyre pressures of 620 kPa (Van Vuuren,
1973) and 800 kPa (for modern radial ply truck tyres (A Thomas, pers
comm)) these models (Figure 7.4 and 7.5) predict the following number
of coverages possible for heavy vehicles (40 kN wheel load, normally
the worst condition) and different material strengths (Table 7.7):
TABLE 7.7: PREDICTED NUMBER OF VEHICLE PASSES (40KN WHEEL LOADS) FOR
DIFFERENT MATERIAL STRENGTHS AND TYRE PRESSURES (AHLVIN AND
HAMMITT, 1975)
Material CBR Figure 7.4 Figure 7.5
620 kPa 800 kPa 620 kPa 800 kPa
5 50 10 < 20 < 20 10 3 000 950 < 20 < 20 15 6 500 4 000 < 20 < 20 25 >10 000 >10 000 < 20 < 20 40 >10 000 >10 000 40 20 60 >10 000 >10 000 480 260
100 >10 000 >10 000 >10 000 6 000
It can be seen that provided some deterioration of the riding surface
is allowed and maintenance is carried out, a material with a CBR of 5
in the worst condition prevailing is inadequace for the number of
heavy vehicles typically using local roads during wet weather (80 TO
160 40 kN wheel loads (plotted on Figure 7.4), equivalent to the
passage of some 2000 light vehicles) while a minimum CBR of 10 is
adequate. If, however, no deformation is allowed and no maintenance is
carried out, a CBR of about 50 at the worst condition prevailing would
Digitised by the Open Scholarship Programme in support of public access to information, University of Pretoria, 2017

100 500 1000
TYRE PRESSURES kPa
- 7.28 -
CBR IIOO
50
20
10
FIGURE 7.4
COVERAGES ::;::10000
f'ooo i2000
!1000
I5oo
±200
1100 ::;: +50
20
RELATION BETWEEN LOAD,REPETITIONS, TYRE PRESSURE AND CBR FOR UNSURFACED SOILS.
TYRE PRESSURE kPa
1000
-----!~~ - ..:::::--250
100
CBR
100
50
-:::::::- -40 --------- -30 ---- --------- --20 ------10
·FIGURE 7.5
COVERAGES
10000
5000 4000
3000
2000
1000
500
400
300
200
100
50
40
30
20
SURFACE STRENGTH REQUIREMENTS FOR AGGREGATESURFACED ROADS
Digitised by the Open Scholarship Programme in support of public access to information, University of Pretoria, 2017

- 7.29 -
be required for between 80 and 170 40 kN wheel coverages (plotted on
Figure 7.5). The actual CBR necessary, allowing some deformation
before routine maintenance, is probably somewhere between these two
figures and it is proposed that a value of 15 at 95 per cent Mod AASHO
compaction and optimum moisture content is adequate for most roads.
It must be noted that this recommendation is based on the findings of
Ahlvin and Hammitt (1975), Visser (1981) and the local monitoring
programme. Many of the roads with soaked 95 per cent Mod AASHO CBR
values of much less than 15 proved successful in practice and the
recommendation of 15 probably carries a significant factor of safety
for many climatic and traffic conditions.
7.6.4 Water shedding ability
The water shedding ability is extremely important as it affects the
material strength and slipperiness in wet conditions. It is mainly a
function of the shape of the road (a maintenance problem) and the_
compaction density achieved. Water should not be allowed to accumulate
on the surface of the road or be retained long enough to soak in to
the layer. High quality maintenance grading is necessary to ensure an
adequate cross-fall, and eliminate ruts, potholes and other forms of
ponding.
The wearing course material should be erosion resistant, especially on
vertical grades. Run-off down poorly shaped grades often results in
the water accumulating in the centre of the road and causing extensive
scouring. On slopes steeper than about 4 per cent, any extra cost
incurred in reducing erosion will soon be recovered by the necessity
for less frequent regravelling. The crossfall should be maintained at
about 4 per cent to allow adequate run-off but not at velocities which
will cause erosion. Excessive super-elevations on corners are often
the cause of erosion across the road (i.e. down the camber). They
should be limited to a maximum of about 8 per cent.
Adequate compaction results in a tight, dense layer which retards the
penetration of water and resists erosion significantly better than
loosely compacted materials. Materials with a grading coefficient of
Digitised by the Open Scholarship Programme in support of public access to information, University of Pretoria, 2017

- 7.30 -
more than 34 will generally not compact to a dense layer as a definite
gap-grading occurs in the gravel component. Compaction should,
however, always be in excess of 95 per cent Mod AASHO, and moist
compaction under suitable rollers is essential. The present practice
of a limited number of passes with a grid roller followed by traffic
compaction is
research into
necessary.
unacceptable
the optimum
for optimum performance,
compaction procedures and
and further
standards is
Materials with a grading coefficient of less than 16 (these are
generally fine-grained, poorly graded soils) are particularly
susceptible to erosion and should be avoided in wet areas.
7.6.5 Abrasion resistance
The abrasion resistance of the wearing course is mainly influenced by
the cohesion and particle interlock of the material. The use of
materials which will resist abrasion results in a reduced necessity
for regravelling, the major maintenance costs associated with unpaved
roads. All those materials with a shrinkage product of less than 100
tend to ravel under traffic and should be avoided. The influence of
the strength of the aggregate particles on the performance has
previously been shown to be important (Netterberg, 1978). However, the
present study has indicated no relationship between the aggregate
strength and the abrasion loss on the road. This confirms the findings
of Von Solms (1987).
7.6.6 Dustiness
Dust from unpaved roads should be reduced as far as possible. Dust is
a major contributor to poor safety (in terms of visibility), vehicle
occupant discomfort, the wear of vehicle components (such as universal
joints) and has an unquantified but significant effect on roadside
vegetation and agriculture (Van Barneveld, 1984). During monitoring of
the sections, every section had dustiness ratings of 5 (unacceptable)
at some stage, usually shortly after grader blading. The dust rating
for all the sections generally showed a strong mode, this being the
characteristic dust rating for the section;
Digitised by the Open Scholarship Programme in support of public access to information, University of Pretoria, 2017

- 7.31 -
Attempts to eliminate the dust through the selection of relatively
dust-free materials should be made but it is often not possible to
locate suitable materials within reasonable haul distances. Very few
materials are dust-free and little correlation could be found between
dustiness and material properties. Materials with a shrinkage product
of more than 240 have only a 30 per cent chance of having a dustiness
of 4 (undesirable (Paige-Green, 1988a)) or less. If the shrinkage
product is less than 100 this probability increases to 40 per cent and
with a value of between 100 and 240 the probability is about 60 per
cent.
It is often difficult to find adequately dust free materials and
recourse should be made to some of the available dust palliatives
(e.g. ligno-sulphonates, magnesium chloride, etc). Although it is
difficult to analyse the effectiveness of dust palliatives in terms of
the cost/benefit ratio, the social consequences of dusty roads, for
example in townships are extremely important (i.e. the benefits of
dust reduction or elimination are very high) and should be taken into
account. Further research into the different dust palliatives and
their economics is, however, long overdue.
7.6.7 Slipperiness
The slipperiness of a dry unpaved road is affected by the presence of
fine rounded gravel, which acts as "ball bearings" between the vehicle
and the road. None of the roads studied, however, was slippery under
normal driving conditions during the project. The slipperiness in wet
weather, on the other hand, is affected mainly by the clay and fine
material content of the wearing course, and the water shedding ability
of the road. The influence of the aggregate larger than 37,5 mm has
been shown to be of relatively minor importance in terms of
slipperiness.
Those materials with a shrinkage product of more than 370 tend to
become slippery when wet irrespective of their grading coefficients. A
maximum particle size of 37,5 mm is adequate to provide stability in
the upper layers of the wearing course and prevent the shearing and
churning of the top layer under the tractive forces of vehicle wheels.
Digitised by the Open Scholarship Programme in support of public access to information, University of Pretoria, 2017

- 7.32 -
Aggregate of this size contributes to the skid resistance, without
influencing the roughness of the road or causing excessive tyre wear.
7.6.8 Cost considerations
The ~aterials should be locally derived with minimal haul distances,
but the cost of providing a material with an adequate performance
should be balanced against the life-cycle cost of the road (including
road user costs). In most cases the cost of hauling better materials
further distances, or blending or processing poor local materials is
rapidly offset by the reduced blading maintenance and road user costs
(Szkutnik, 1983) and a longer period before regravelling is required.
The exclusion of large stones simplifies the blading maintenance
considerably. The frequency of blading is reduced, the pothole-filling
and oversize removal is minimal and wear on the grader-blades is
significantly reduced.
7.6.9 Suited to prevailing conditions
The choice of materials (and design of the road) should be suited to
the local environmental and traffic conditions. The specifications are
developed in such a way that materials outside the recommended limits
may be used under certain conditions e.g. erodible or slippery
materials may be suitable in arid areas (with adequate warnings for
road users) or material likely to ravel or corrugate may often be
acceptable for very lightly trafficked roads.
7.7 DEVELOPMENT OF SPECIFICATIONS
As well as fulfilling all the requirements of ideal wearing course
materials the specifications were developed to comply with as many of
the requirements of good specifications as possible (see Sec 7.2).
It was considered that any new specifications should be use-specific
and should allow different limits for the different classes of service
provided. The following classes of unpaved roads were identified:
Digitised by the Open Scholarship Programme in support of public access to information, University of Pretoria, 2017

- 7.33 -
• Rural roads
• Urban roads
• Haul roads
7.7.1 Rural roads
Unpaved rural road links are are mainly farm to market or intervillage
roads, generally measured in tens of kilometres and should as far as
possible be smooth, safe, comfortable all weather roads which cause
minimal disturbance to the environment (both in terms of the dust
emission and scarring of the countryside from old borrow pits) while
requiring minimal maintenance. This is
but certain of the sections studied
fulfilled all of these requirements.
obviously a rather tall order
during the project certainly
The following specifications for materials for rural roads are
proposed (Table 7.8):
TABLE 7.8: RECOMMENDED MATERIAL SPECIFICATIONS FOR UNPAVED RURAL ROADS
a
b
c
Maximum size:
Oversize index (I): 0
Shrinkage product (S )a: p
Grading coefficient (G )b: c
37,5 mm
~ 5 per cent
100 - 365 (max. of 240 preferable)
16 - 34
CBR: ~ 15 at ~ 95 per cent Mod AASHO compaction and OMCc
s p
G c
Linear shrinkage x per cent passing 0,425 mm sieve
(Per cent passing 26,5 mm - per cent passing 2,0 mm) x per
cent passing 4,75 mm)/100
tested immediately after compaction
The specifications for shrinkage product and grading coefficient are
shown schematically in Figure 7.6 together with the actual data points
on which they are based. The CBR requirements are not shown as they
were derived from a different source and are in effect a second
Digitised by the Open Scholarship Programme in support of public access to information, University of Pretoria, 2017

550 t-I = DESIRABLE PERFORMANCE
UNDESIRABLE PERFORMANCE D 3
2 = 500 2
3 = UNACCEPTABLE PERFORMANCE
450 3
I
400 3 3
3 2 ....,: u 350
E I c :::l I 0 I 3 I 0 I 0:: n. 300 2
w 2 2 (!) I I q I ::,c: 250 2 3 3 z
A I 2 -..J
ll: 3 I I 2 . :r: 2 I I 2 I w V) 200 I I ,j::.
2 2 3 I I 2
150 1- I 2
2 I 2 2 I
31 2 I 2 2 I 2
100 I I 2 I I
3 3 3 ~2 3 3 3 3
50 1-3 3 3 3
B 3 3 I 2 2 3 3 I 2 I 3
3 3 3 3 I 3
0
0 2 4 6 8 10 12 14 16 18 20 22 24 26 28 30 32 34 36 38 40 42 44 46 48
GRADING COEFFICIENT (Gc )
FIGURE 7.6 RELATIONSHIP BETWEEN SHRINKAGE PRODUCT, GRADING COEFFICIENT AND PERFORMANCE I
Digitised by the Open Scholarship Programme in support of public access to information, University of Pretoria, 2017

- 7.35 -
performance criterion (passability). The following conclusions can be
drawn about each zone as defined in the figure:
A - Materials in this area generally perform satisfactorily but are
finely graded and particularly prone to erosion: they should be
avoided if possible, especially on steep grades and sections with
steep cross-falls and super-elevations. Eighty per cent (four) of
the sections in this zone were classified as providing a desirable
performance (but required constant labour intensive maintenance
over short lengths and had high gravel losses) and 20 per cent
(one) section as undesirable.
B - These materials generally lack cohesion and are highly susceptible
to the formation of loose material and corrugations. Sixty three
per cent (22) of the sections in this zone were classified as
unacceptable while 17 per cent (6)
desirable fell into this zone. All
of the
of
sections which
these materials
were
did,
however, form corrugations and loose material, but the roads were
wide enough to accommodate lateral movement of the traffic or were
maintained prior to the full development of the corrugations.
Twenty per cent (7) of the sections performed undesirably, mainly
because of corrugations. These sections were generally on corners
or near intersections where the traffic was moving at a slower
speed resulting in less well-developed corrugations.
C - These materials are generally comprised of fine, gap-graded
gravels lacking adequate cohesion, which results in ravelling and
the production of loose material. Two of the sections were
desirable, four undesirable, but none was unacceptable.
D - Materials with a shrinkage product in excess of 365 tend to be
slippery when wet. Five of the sections in this zone performed
unacceptably (due to stoniness in four cases and potholes formed
by excessive cracking in the other) whilst. two performed
'.!~desirably and two desirably.
E - Materials in this zone perform well in general provided the
oversize material is restricted to the recommended limits. Six of
the eight samples performing unacceptably contained excessive
Digitised by the Open Scholarship Programme in support of public access to information, University of Pretoria, 2017

- 7.36 -
oversize material while the other two had grader induced
corrugations (3 m wavelength) which remained throughout the
duration of the project. Sixteen of the sections (32 per cent)
performed undesirably, most of them being dusty or containing
excessive oversize material, but less than those classified as
unacceptable. Fifty two per cent of the sections in this zone
performed desirably.
The above specifications accept a number of materials with
unacceptable dust but 13 roads which were not classified as
unacceptable in terms of their overall performance would be eliminated
by lowering the shrinkage product to 240. This was considered
unnecessarily harsh for rural roads. Attempts should be made, however,
to locate materials with a shrinkage product of less than 240 as far
as possible.
For very lightly trafficked rural roads (less than SO vpd) the
requirements can be relaxed and a higher level of dust and roughness
can be tolerated. On economic grounds it would be hard to justify the
maintenance of roughness at levels less than 100 QI counts/km on roads
carrying less than SO vehicles per day. Social, political or other
reasons (e.g. tourism) may of course dictate otherwise. The maximum
acceptable roughness for the lightly trafficked roads can be taken as
the limit of acceptability determined in the acceptability criteria
experiment (i.e. 200 QI counts/km (Paige-Green and Netterberg, 1988)).
None of the sections had 90 percentile values for the roughness in
excess of 200 counts/km, implying that all the roads were acceptable
for light traffic 90 per cent of the time, even under conditions of
reduced grader maintenance (only three times per annum in most cases).
An analysis in terms of road user costs would, however, be necessary
for each road in order to delineate the exact limit of traffic for
which almost any material could be used. In terms of the dustiness,
for a road carrying less than SO vpd (i.e. less than S vehicles per
daylight hour on average, with minimal vehicle interaction) the
discomfort and safety aspects associated with dust, although
undesirable, are generally tolerable for even the dustiest roads, and
a limit for the shrinkage product of 36S is allowable. Materials for
these roads ·should, however, be selected to comply as closely as
Digitised by the Open Scholarship Programme in support of public access to information, University of Pretoria, 2017

- 7.37 -
possible with the specifications, especially the maximum size which is
the only property which can be relatively easily controlled.
Figure 7.7 shows plots of the performance of the sections by climate
and traffic and Figure 7.8 shows the performance of the sections by
material group. Little correlation between the performance and
material groups is evident. The plots can, however, be used to obtain
site-specific information depending on the prevailing traffic and
climate and the proposed material group to be used.
7.7.2 Urban roads
Unpaved urban roads generally consist of a network of short road links
and need primarily to provide a dust-free surface which will not
become excessively loose during dry weather or muddy during wet
weather and which requires minimal maintenance. An important positive
factor in these roads is that very few heavy vehicles use them whilst
vehicle travel speeds are generally low, and should be encouraged to
remain low, as pedestrians and children often use these roads as paths
and playgrounds. Their main use is as residential access roads within
townships in developing areas and not as arterial or major collector
streets which carry buses and delivery vehicles (these roads should be
constructed to normal paved road standards (NITRR, 1985b; Department
of Development Aid, 1987). It is recommended that the access roads be
restricted to normal vehicles by using cul-de-sac type roads (or less
desirably loop roads) serving a limited number of residences, with no
through traffic.
The driver and passenger comfort consideration is therefore of
relatively minor importance and the main objectives are to eliminate
as far as possible the dustiness, drainage and erosion problems and
muddiness when wet at minimum cost. The formation of loose material
should be reduced as far as possible.
The following specifications are proposed for urban roads (Table 7.9):
Digitised by the Open Scholarship Programme in support of public access to information, University of Pretoria, 2017

t; ::> 0 0 0: a.
w
"' <I :.: z 0: :X: {/)
1-u ::> 0
500
400
300
200
100
0
500
400
g 300 a. w "' <I 200 :.: z 0:
~ 100
0 ·-
N ~ 5 2
---------,
3
12 2
3 .2
2 31
I
3 2 I
2
2 I I 2 2 2 I I
-------fi...L _2 __ 2.1__
3 3 233 3 3
3 13 3 3
3
2
2
2' 2 3
I I I __L___ _ _________l
0 10
TRAFFIC ~ 100 vpd
2
20 30
GRADING COEFFICIENT
2
2 3 2
l I
--h-~--3
33
40
2
J I ______ l I l
0 10 20 30 40
GRADING COEFFICIENT
50
50
1-u ::> 0
500
400
0 300 0: a.
w
"' 200 <I :.: z a: :X: {/) 100
0
500
400
N > 5
0 10
l TRAFFIC > 100 '"
1-- -----u ::> 0
~ 300 Q.
w
"' <I 200 ·-:.: z a:
3
I : DESIR ABLE
2 = UNDESIRABLE
3: UNACCEPTABLE
I 3 3
3----------2
3 I
2 I 3
I 1 3 I
2 2
2
3-a- -3-l-_!_z_l_ 3 I -
1- -------
2
3 3.; 3 2
20 30
GRADING COEFFICIENT
2
3-- _3_ .2.
31 I
I 2
3 2
2 3
I I
3 22
I
2 I
3
40
3
3
-;!--
2
50
": t --~'--:X: {/)
12 ~ I ll 2
-·- 31 I 3 3 - i!- -J. --<1 - _.J 1- L__ 2 3 3 ~2 3----
33 31 33 3 3 323 I 2 2
I 3
2 3
__ __1_
0 10 20 30 __j 40 50
GRADING COEFFICIENT
FIGURE 7. 7 PLOTS OF PERFORMANCE BY TRAFFIC AND CLIMATE
-.J
w OJ
Digitised by the Open Scholarship Programme in support of public access to information, University of Pretoria, 2017

500 ACID CRYSTALLINE ROCKS
t :> 0 0 0: "-.... C)
" "' z 0: :c "'
1-u :> 0
400
300
200 ·-
100
0
500
400
~ 300 "w C)
<f 200 "' z
-------T
---------j
0 10
HIGH SILICA ROCKS
a: ----:c ---"' 100 ·--
0
0 10
3
3
I __ --r----- 3
2
3
20 30
GRADING COEFFICIENT
2 I
33
12
3
I I
20 30
GRADING COEFFICIENT
2
2
40 50
2
2 3
I ___ j
40 50
500
I = DESIRABLE
2 = UNDESIRABLE
3• UNACCEPTABLE
3
BASIC CRYSTALLINE ROCKS
1-u :> 0
400
0 300 0: "-w ~ 200
"' z ii: :c "' 100
0
2
0 10
500 r- ARENACEOUS ROCKS
1-u :> 0
400
~ 300 ·"-
"' C)
" 200
2 3
2
---~~----
3
20 30
GRADING COEFFICIENT
2
2 2
3
3
L 2 3-------
40 50
2
~ l I __ -2- ~ ::_ - -"' 100 -------- 3
0
0 10
3 3 3
I I ________ I ___ I
20 30 40 50
GRADING COEFFICIENT
FIGURE 7.8 OVERALL PERFORMANCE OF TEST SECTIONS BY MATERIAL GROUP
-.I
w 1.0
Digitised by the Open Scholarship Programme in support of public access to information, University of Pretoria, 2017

500
1- 400 u ::> 0 0 tr 300 "-w C> <l
"' z tr :r U)
1-u ::> 0
200
100
0
500
400
~ 300 "-w C> <l 200 "' z ;;;
~ 100
0
ARGILLACEOUS ROCKS
2 2
2
2 ------------ ----------3 3 3 I
3
3
0 10 20 30 40 50
GRADING COEFFICIENT
CALCAREOUS MIXTURES
---3--- .:_-------- --
----~-----~ 0 10 20 30 40 ~0
GRADING COEFFICIENT
1-u ::> 0
500
400
0 300 tr "-
w ~ 200
"' z tr
PEDOCRETES
:r U) 100 ·------ ---
0
3 ----------
2
2 3
I I 3 I 2 I 2 ----- _z __ L_
3 2-f' 33 2 ' 3
0 10 20 30 40 50
GRADING COEFFICIENT
I' DESIRABLE
2' l:lNDESIRABLE
3' UNACCEPTABLE
FIGURES 7.8 !CONT) OVERALL PERFORMANCE Of" TEST SECTIONS BY MATERIAL GROUP
-...) . ~ 0
Digitised by the Open Scholarship Programme in support of public access to information, University of Pretoria, 2017

- 7.41 -
TABLE 7.9: RECOMMENDED MATERIAL SPECIFICATIONS FOR UNPAVED ROADS IN
URBAN AREAS
Maximum size: 37,5 mm
Oversize index (I ) 0 0
Shrinkage product (S ) : 100 - 240 p
Grading coefficient (G): 16 - 34 c
CBR: ~ 15 at ~ 95 per cent Mod AASHO compaction and OMC
In comparison with the limits for rural roads it can be seen that the
limits for the oversize index have been reduced to eliminate stones
whilst the shrinkage product has been reduced to a maximum of 240 to
reduce the dust as far as practically possible.
7.7.3 Haul roads
Unpaved haul roads are generally restricted to fairly limited lengths
in forests, quarries and mines, but are required to be always passable
for high numbers of very heavy vehicles at minimum total cost (i.e.
sum of construction, maintenance and user costs) and not excessively
slippery when wet. The materials used for the construction of haul
roads should therefore have an adequate strength under the "worst"
moisture conditions likely to occur in the area and be able to support
the high wheel loads and tractive forces common to the vehicles using
these roads. Obviously, an element of risk needs to be considered in
this decision, in order to balance the "worst" moisture condition with
the cost of obtaining better materials.
Slipperiness in the wet is an important factor on mine and forestry
haul roads where significant vertical grades are common, mainly from
the service viewpoint of hauling up steep slopes, but also from the
safety aspect of vehicles descending steep slopes. Slippery roads
which provide minimal traction for vehicles result in churning and
loosening of the surface with the production of increasing thicknesses
of weak material which leads to poor trafficability.
Digitised by the Open Scholarship Programme in support of public access to information, University of Pretoria, 2017

- 7.42 -
Dust should be eliminated as far as possible for safety and vehicle
component wear reasons.
The material selected for an unpaved haul road should therefore have
the following properties (Table 7.10):
TABLE 7.10: RECOMMENDED MATERIAL SPECIFICATIONS FOR UNPAVED HAUL ROADS
Maximum size:
Oversize index (I ): 0
Shrinkage product (S ): p
Grading coefficient (G): c
75 - 100 mm
~ 10 per cent
100 - 365 (max preferably < 240)
16 - 34
CBR: ~ 15 at ~ 95 per cent Mod AASHO compaction and 4 days
soaking
An increase in the maximum size and Oversize index (within limits) has_
been proposed as haul-vehicles generally have large tyres (often with
lower tyre pressures) and travel at slower speeds than on rural and
urban roads. Road user costs will therefore not be as sensitive to the
stoniness. A soaked CBR is recommended in order to allow for the
greater traction forces exerted by the heavily-loaded vehicles usually
associated with haul roads. Vertical grades on haul roads are usually
steeper than those found on rural and urban roads.
7.8 DISCUSSION
The simplicity and brevity of the new specifications (Tables 7.8, 7.9
and 7.10) is significant when compared with existing material
requirements for unpaved roads. Only a simple bar linear shrinkage
test, a compaction and CBR test and a grading analysis through the
37,5 mm, 26,5 mm, 2,0 mm and 0,425 mm sieves are necessary for
acceptance testing. When using only these siev~s it is ofte~ n0t
necessary to wash the materials unless they are very clayey: brushing
of the fractions retained on each sieve with a hard bristle brush is
adequate.
Digitised by the Open Scholarship Programme in support of public access to information, University of Pretoria, 2017

. 7.43 .
One problem with nearly all material specifications is that the
specifications apply to the material after compaction (NITRR, 1985a).
Wearing course materials are probably more likely to degrade during
construction than say base or subbase materials, due to their weaker
nature. If the shrinkage product is borderline the particles retained
on the sieves with openings greater than 0,425 mm should be examined
and an estimate of the potential increase in the per cent passing the
0,425 mm sieve (and hence shrinkage product) made before the material
is accepted. The use of a durability mill test (Sampson and
Netterberg, 1988) may be a useful indicator of potential degradation
during construction and deserves investigation.
Climate and traffic are conspicuous by their absence in
specifications. The experiment was designed to investigate
influence of these factors on the performance of unpaved roads
although they appear in the prediction models for gravel loss
these
the
and
and
roughness progression no improvement in the
achieved by incorporating them.
specifications could be
A number of the existing specifications incorporate the
strength. The main reason for this is to limit the coarse
which will break down under traffic and often lead to powder
(Netterberg, 1978). Analysis of the influence of aggregate
showed no correlation with performance, with both hard
aggregates (in terms of the AFV and APV) giving good
performance.
aggregate
aggregate
potholes
strength
and soft
and bad
It is interesting to note that the limits for the shrinkage product
are very similar to those of Netterberg (1978) which were determined
from the performance of a number of calcretes in the western Transvaal
and South West Africa.
Many of the recent specifications (NITRR, 1985a; DOT, 1985; TPA, 1983)
only specify limits for the grarling, plasticity and strengrh. ThP.
problems caused by oversize material in the existing method for
particle size analysis described before may have a significant
influence on the grading results and affect the acceptance or
rejection of materials.
Digitised by the Open Scholarship Programme in support of public access to information, University of Pretoria, 2017

- 7.44 -
The importance of good construction and maintenance procedures cannot
be overemphasised. The moist compaction, to densities in excess of 95
per cent Mod AASHO, alone results in significant improvements in the
performance of unpaved roads. It is important to provide an adequate
crown and a definite crossfall during construction and to maintain it.
The crossfall should be about 4 per cent which allows water to drain
rapidly, thereby reducing the possibility of the material becoming
saturated and shearing under traffic, but not enough to cause erosion.
Adequate side-drains should be provided to remove the water from the
vicinity of the roadway.
The occurrence of periodic flooding in South Africa should not be
underestimated. During the extensive flooding at the end of 1987,
numerous unpaved roads were closed to traffic for extended periods.
Discussions with some of the Authorities involved indicated that the
problems were not impassability but extensive erosion and wash-aways.
If the drainage is inadequate even the best materials will not perform
satisfactorily. Those roads constructed of materials with marginal CBR
strengths at OMC should be noted and during periods of extensive
flooding, the traffic should be limited as far as possible or the
roads closed.
Compliance with requirements of a good wearing course material.
If the specifications and construction requirements are followed the
road should fulfil all the requirements of an ideal wearing course as
specified previously (See Chap 2.5).
Compliance with requirements of good specifications.
The new specifications which have been developed comply with all the
requirements for good specifications defined earlier (Sec 7.2) except
for perhaps not accepting all suitable materials. Although all the
test results available were used in the analysis, no single test or
combination of different tests predicts the performance of all
materials with 100 per cent confidence. The specifications as defined
do, however, accept most of the materials which will perform well and
reject all of the materials which perform unacceptably. Those existing
Digitised by the Open Scholarship Programme in support of public access to information, University of Pretoria, 2017

- 7.45 -
roads which perform undesirably but are apparently constructed of
materials complying with the specifications (except for the oversize
criterion) can generally be improved by better compaction, removing
the oversize material or programmed maintenance.
Reliability
The specifications as proposed reject all unacceptable materials
(after accounting for the stoniness and maintenance problems) and 13
(12 per cent) of the materials rated as acceptable. Although these
materials were rated as having an acceptable weighted overall
performance over the duration of the project, they should not normally
be used without examining the consequences of their use, as they were
prone to corrugations, ravelling, erosion and slipperiness which
required labour intensive maintenance or was temporarily undesirable
from the safety viewpoint. Sixteetl materials (15 per cent) which were
rated as undesirable would be accepted by the specifications. Removal
of the oversize material, routine maintenance (the sections were
maintained for 4 months or longer) and acceptance of a higher
level would result in their being rated as acceptable. Twelve (11
cent) of the sections rated undesirable are rejected by
not
dust
per
the
specifications. Seven of these are susceptible to erosion,
slipperiness or ravelling while 5 formed corrugations, but were graded
regularly or occurred on wide roads which allowed lateral movement of
vehicles.
The specifications therefore reject all materials susceptible to
corrugations, erosion, ravelling and slipperiness and accept all
materials which will provide a good riding quality and minimal loose
material. A number of dusty materials are, however, accepted by the
specifications. If the shrinkage product is limited to between 100 and
240, 60 per cent of the sections will have a dust rating of 4
(undesirable but acceptable) or less, but if the limit is extended to
370, 50 per cent of the sections have unacceptable dust.
In general, ~he proposed specifications are apparently a marked
improvement on the specifications currently used locally (Table 7.11).
Digitised by the Open Scholarship Programme in support of public access to information, University of Pretoria, 2017

- 7.46 -
TABLE 7.11: COMPLIANCE OF STUDY SECTIONS WITH EXISTING AND NEW
SPECIFICATIONS
Sections complying Sections not (%) complying
Specific- but at ion Total By performance giving
desirable Desir- Undesir- Unaccept- performance able able able (%)
TRH14 12,2 4,7 5,6 1,9 32,6 DOT 2,7 0,9 0,9 0,9 36,4 TPA 2,7 0,9 0,9 0,9 36,4 NPA 22,5 7,5 10,3 4, 7 29,8 OFS 4,5 1,8 1,8 0,9 35,5 CPA 14,0 7,5 5,6 0,9 29,8 Botswana 3,8 1,9 1,9 0 33,6 Lesotho 0 0 0 0 37,3 Swaziland 15,0 5,6 4,7 4,7 31,7 SWA 3,6 0,9 1,8 0,9 36,4 Netterberg 29,0 14,1 10,2 4,7 23,2 New specs 47,0 28,0 15,0 4,0 12,0
7.9 CONCLUSIONS
Numerous specifications for unpaved roads are currently in use in
southern Africa, none of which are successful for all geological
materials. Performance-related specifications have thus been derived
for the identification of suitable gravel wearing course gravels.
The specifications are simple, requiring minimal testing (a quick
grading analysis, a linear shrinkage test and a CBR) and should be
valid for various types of road carrying any traffic in any
climatic area (scientifically valid for
southern Africa). The importance of removing
practically
the oversize
all of
material,
limiting the shrinkage product to the specified values and adequately
compacting the wearing course has been clearly identified.
In order to ensure all weather trafficability, an adequate material
strength is required. As none of the sections on which the
specifications were developed became impassable during the project,
tentative limits based on theoretical considerations and empirical
studies elsewhere have been proposed.
Digitised by the Open Scholarship Programme in support of public access to information, University of Pretoria, 2017

CHAPTER 8
PRACTICAL IMPLICATIONS OF FINDINGS
8.1 INTRODUCTION
The practical implications of the findings of this project are
extremely significant, affecting all the costs associated with unpaved
road networks (some increasing but most of the significant ones
decreasing). Socio-economic and socio-political implications are
equally important. Application of these specifications during the
materials location and construction of unpaved roads in southern
Africa will result in both improved riding quality and performance and
reduced maintenance costs. This will result in substantial maintenance
savings and a better satisfied travelling public. In addition
significant savings on road user costs due to smoother roads will
accrue in the national interest.
8.2 MATERIAL LOCATION AND SELECTION
Optimum use of the proposed specifications which have been developed
will obviously necessitate increased attention to materials location
and testing prior to the construction or regravelling of unpaved
roads. Presently many of the materials used for unpaved roads are
obtained from old borrow pits, most of which provided adequate
materials in the past. However, traffic has increased, both in
quantity and mass, vehicles developed typically for local condicions
tend to have harder suspensions than the older imported vehicles and
axle weights on many of these unpaved roads are in excess of the legal
limits. Many of the older borrow pits have been extended beyond their
original specified limits and to much greater depths resulting in a
deterioration of the material as a gravel wearing course. Many of the
good wearing course gravels have been depleted or are rapidly running
out.
In order to optimise the maintenance and road user costs it is
imperative that the best material is utilised and this requires
adequate prospecting by experienced staff, confirmation of the
Digitised by the Open Scholarship Programme in support of public access to information, University of Pretoria, 2017

- 8.2 -
material properties by adequate laboratory testing, careful
delineation of the areal limits and depth of proposed borrow pits, and
adequate supervision during excavation.
The implications of this extra work are increased costs. An estimate
of the increase in costs is difficult as existing costs are difficult
to obtain and the cost will depend on the state of existing
borrow pits, the length of the road to be built or regravelled and the
experience of the prospector. Many materials are located by field
technicians of the Provincial Roads Departments who probably spend
about a week in the field for a job. The prospecting is generally
based on experience (often extensive, but more recently becoming less
as older staff retire) with very little recourse to modern techniques.
The use of an experienced engineering geologist will result in the use
of modern techniques (air photo interpretation or other remote sensing
techniques where they already exist) with a sound scientific basis. It
is unlikely that the increase in cost will exceed about RS 000 or
RlO 000 for a typical 30 or 40 km rural road (i.e. R250 to R333 extra
per kilometre).
Methods for the location and identification of potential wearing
course material borrow pits need to be researched further. A survey of
existing borrow pits from which good wearing course materials have
been obtained should be carried out. As the geological material is not
an adequate indicator of potential suitability of the material,
aspects such as the land form (NITRR, 1978) should be investigated.
A great deal of useful information is probably available from existing
data bases (NITRR, 1978).
In many cases the material will not comply exactly with the proposed
specifications, but it would certainly be very close.
Pre~ently, mini~al testing is cerried out on proposed borrow pits.
Normally five samples (one from each corner and one from the centre)
are tested in the laboratory. With the newly proposed specifications,
substantially more testing can be carried out for the same price as
only values for the bar linear shrinkage, a dry grading (percentage
Digitised by the Open Scholarship Programme in support of public access to information, University of Pretoria, 2017

- 8.3 -
passing the 37,5, 26,5, 4,75, 2 and 0,425 mm sieves) and a CBR at 95
per cent Mod AASHO compaction and optimum moisture content are
required. It is recommended that CBR penetrations are carried out on
all the density moulds to get an idea of the moisture/density/strength
sensitivity analysis. If no laboratory is available DCP testing of
proof rolled sections may'be considered. Testing will be significantly
quicker because of the reduced preparation for grading and shrinkage
and as the CBR moulds do not have to soak for four days.
8.3 MATERIAL PREPARATION
Once the best available material is located the borrow pit should be
opened and adequate material for the proposed job excavated and
stockpiled. This material is unlikely to meet each of the requirements
specified in Chapter 7.6 and will therefore require some additional
work in the borrow pit as follows:
a) If the shrinkage product of the material is too high, the material·
should be blended with a lower plasticity material to dilute the
shrinkage. The fines content (passing 0,425 1nm sieve) can also be
adjusted by blending to correct the shrinkage product.
b) If the shrinkage product is too low, plastic or other finer
material should be added to correct it.
c) If the grading coefficient is incorrect blending of a suitable
gravel is necessary to correct it. It should be noted that the
grading coefficient is a product of the percentage gravel and the
percentage passing the 4,75 mm sieve. Blending should take into
account the cause of the material being outside specification e.g.
the gravel content is high but it is too fine.
d) The gravel may contain excessive oversize material. This should be
removed in the borrow pit. Probably the most cost effective way is
by labour intensive hand-picking. If a large proportion of
oversize is present
processed it may be
wasting most of it.
and a large quantity of material is to be
economic to crush the material instead of
Other means of overcoming problems with
Digitised by the Open Scholarship Programme in support of public access to information, University of Pretoria, 2017

- 8.4 -
oversize material are by screening (Grizzly), rock rakes (Gallup,
et al, 1974) or "ROCK-BUSTER" type hammer mills (Gallup et al,
1974; Fisher, 1979). Economics dictate that excessive oversize
material should never be hauled to the road unless it is to be
"Rockbusted". Even this is preferably done in the borrow pit. Many
instances were observed during the project where large boulders
were hauled to the road with the (false) expectation that they
could be broken under a grid roller. This usually resulted in the
boulders being embedded into the subgrade during compaction and
protruding through the wearing course soon after trafficking of
the road.
A general economic analysis of the increased costs of material
processing is of no benefit as each case will depend on unique factors
e.g. proximity and availability of equipment, quantity of material to
be processed, percentage of oversize material, haul distance of
material for blending, etc). The use of manual labour for hand-picking
of oversize material in the borrow-pit is, however, unlikely to
increase the cost of the material significantly.
8.4 PAVEMENT DESIGN
Numerous design procedures for unpaved roads have been published
(Hammitt, 1969; Ahlvin and Hammitt, 1975; Greenstein et al, 1981;
Alkire, 1987; Hudson et al, 1987; Mathur et al, 1988). None of these
design procedures is applicable to local conditions as they mostly
take the failure criterion as a rut depth of 75 mm, this being
considered excessive for local urban and rural roads.
A design procedure for unpaved roads has been proposed by Paige-Green
(1988c) and will not be discussed fully here. The proposed procedure
optimises the material thickness to avoid sub grade overstressing, to
provide the required design life and to account for the loss of
t:hickness due to traffic compaction. No major financial gains or
losses result from the design, but the new design method together with
the ability to estimate the life of the wearing course, assists
greatly in the future programming of maintenance and rehabilitation of
the road network. For the first time in South Africa, a scientific
Digitised by the Open Scholarship Programme in support of public access to information, University of Pretoria, 2017

- 8.5 -
basis for the design of unpaved roads is available. Previously, nearly
all unpaved roads were built with a nominal thickness (usually 150 mm)
of gravel. The design can now take the effects of material quality,
traffic, climate, construction procedures and subgrade strength into
account to provide a road with a known life before rehabilitation is
necessary.
8.5 CONSTRUCTION CONSIDERATIONS
The use of the proposed specifications will probably result in a
minimal increase in the construction cost. Other recommendations of
this thesis will, however, result in significant increases in the
construction cost compared with the present situation but will result
in substantial savings in maintenance and road user costs.
The only increase in construction cost arising from the new
specifications will probably be the result of increased haulage costs.
Where the nearest available "suitable" material is used at present,
the proposed specification may result in greater haulage distances as
the borrow pits may be further from the section bP.ing constructed.
The present cost of gravel (assuming a nominal haulage of two or three
kilometres) is about R6jm3 (about R6 300 per kilometre fo·r a standard
7 m wide 150 mm wearing course). An extra haul cost of 40 cjm3 km
would increase this cost to about RlO 000/km if the haul distance was
taken as a conservative 10 km (i.e. an increased cost of some
R4 000/km).
The importance of moist compaction has been clearly shown by Poolman
(1988). Adjacent sections of "identical" material were constructed in
the Namib desert. Three sections were moist compacted and two were dry
compacted (the standard practice over much of the arid part of
southern Africa). The performance of the sections as monitored is
shown in Figure 8.1 (after Poolman, 1988).
It is clear that after four months of traffic (about 35 vpd) the wet
compacted sections were in a very good condition while the dry
compacted sections were extremely rough and should have been bladed
Digitised by the Open Scholarship Programme in support of public access to information, University of Pretoria, 2017

lBO
170 ·-
160.
t5o
140
~
130 E .,.
" (/) 120 ,_ ;z ::J
8 IIO
H 0 too (/)
(/)
UJ 90 ;z r (!)
80 ::J 0 Q:
70
60
!'SO
40 I~ 30
0 IO 20 30 40 50 60 70 so
DAYS SINCE: BLADING
--------AVERAGE DRy
COMPACTED
r-----_ AVERAGE WET
COMPACTED
SECTIONs I AND 5
90 100 IIO
Q) . 0'1
120
FIGURE: B. I E:FFE:cr OF MOIST COMPACT/ON ON ROUGHNess
/ AFrcn POOLAfAN, 1988)
------------------------------------------------------------------------------------------------------------------
Digitised by the Open Scholarship Programme in support of public access to information, University of Pretoria, 2017
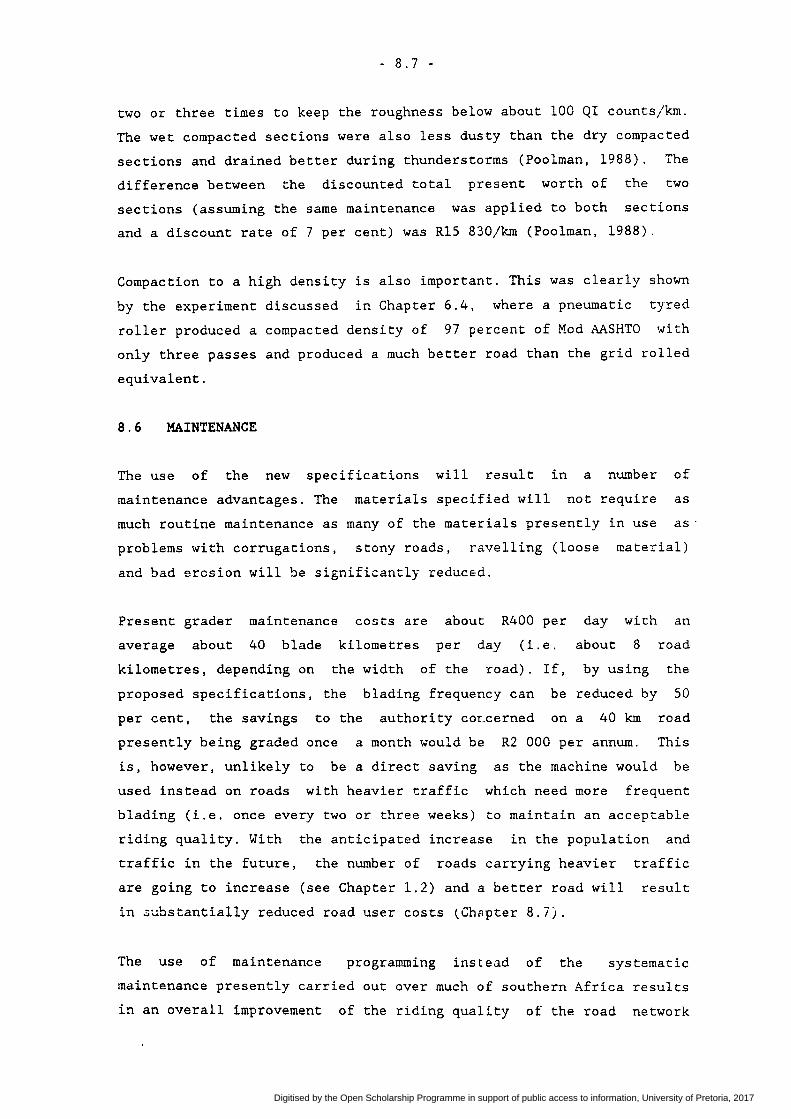
- 8.7 -
two or three times to keep the roughness below about 100 QI counts/km.
The wet compacted sections were also less dusty than the dry compacted
sections and drained better during thunderstorms (Poolman, 1988). The
difference between the discounted total present worth of the two
sections (assuming the same maintenance was applied to both sections
and a discount rate of 7 per cent) was RlS 830/km (Poolman, 1988).
Compaction to a high density is also important. This was clearly shown
by the experiment discussed in Chapter 6.4, where a pneumatic tyred
roller produced a compacted density of 97 percent of Mod AASHTO with
only three passes and produced a much better road than the grid rolled
equivalent.
8.6 MAINTENANCE
The use of the new specifications will result in a number of
maintenance advantages. The materials specified will not require as
much routine maintenance as many of the materials presently in use as ·
problems with corrugations, stony roads, ravelling (loose material)
and bad erosion will be significantly reduced.
Present grader maintenance costs are about R400 per day with an
average about 40 blade
kilometres, depending on
kilometres per
the width of the
day (i.e.
road). If,
about 8
by using
road
the
proposed specifications, the blading frequency can be reduced by 50
per cent, the savings to the authority corcerned on a 40 km road
presently being graded once a month would be R2 000 per annum. This
is, however, unlikely to be a direct saving as the machine would be
used instead on roads with heavier traffic which need more frequent
blading (i.e. once every two or three weeks) to maintain an acceptable
riding quality. With the anticipated increase in the population and
traffic in the future, the number of roads carrying heavier traffic
are going to increase (see Chapter 1.2) and a better road will result
in ~ubstantially reduced road user costs (Ch~pter 8.7).
The use of maintenance programming instead of the systematic
maintenance presently carried out over much of southern Africa results
in an overall improvement of the riding quality of the road network
Digitised by the Open Scholarship Programme in support of public access to information, University of Pretoria, 2017

- 8.8 -
with significantly reduced road user costs.
(Visser, 198la) is applied locally but this
developed in Brazil. Although the results of
At present the MDS
uses prediction models
the MDS are consistent
with local observations, its accuracy and scope require improvement
(Visser and Curtayne, 1987). It is anticipated that the application of
the models developed in this thesis to the MDS will go a long way
towards increasing the validity of the MDS under local material,
traffic and climatic conditions.
Maintenance programming results in an improved road network by
identifying those roads which deteriorate rapidly and indicating that
they should be graded more frequently than those roads which
deteriorate at a slower rate. From model 5.12 it can be seen that the
roughness after blading depends primarily on the roughness before
blading and thus by avoiding excessive deterioration of the road the
general standard of the road is improved.
It is of course equally important that the maintenance team is
experienced and that the standard of maintenance is of a high quality.
Maintenance practices and procedures are fully descr~bsd by Ferry
(1986).
8.7 ROAD USER COSTS
Unpaved roads constructed with the specified materials will provide
a substantially better service to the road user. Removal of oversize
stones and the reduction (elimination in most cases) of corrugations
will improve the riding quality with concomitant savings in road user
costs. The road user costs for three typical roads, two with excessive
oversize material (sections 34A and 919) and one susceptible to the
formation of bad corrugations (section 26A) are compared below with
the expected costs of the same roads constructed with material
complying with the proposed specifications. Vehicle operating costs at
the typical roughnesses measured on roads infrequently maint~indd
(bladed every three months with average QI of 160 counts/km on stony
sections and 130 on corrugated sections), frequently maintained
(bladed every month with average QI of about 100 counts/km on stony
roads and 85 on corrugated roads) and constructed with material
Digitised by the Open Scholarship Programme in support of public access to information, University of Pretoria, 2017

- 8.9 -
complying with the proposed specifications (average QI about
SO counts/km) are compared in Table 8.1. In order to eliminate the
influence of road geometry on the road user costs, it is assumed that
the roads are 10 km long and straight and flat. Horizontal curvature
and positive road gradient both increase the vehicle operating costs.
The road user costs are calculated using the modified HOM 3 model (du
Plessis and Rust, 1988).
TABLE 8.1: EFFECT OF ROUGHNESS ON VEHICLE OPERATING COSTS
Section QI Total vehicle No Counts/km operating cost
R/yr
34A 160 34S 30S 100 247 723 so 187 390
26A 130 470 866 8S 362 393 so 290 974
919 160 122 4S4 100 87 682 so 67 139
·- -· Section 34A - 73 cars and 19 heavy vehicles per day Section 26A - 74 cars and 48 heavy vehicles per day Section 919 - 30 cars and S heavy vehicles per day
The implications of improving the quality of unpaved roads on the
vehicle operating costs for a short link of a road are significant. An
improvement of the riding quality of section 26A from 160 to 100
counts/km results in an annual saving in vehicle operating costs of
Rl08 473 while an improvement to 50 counts/km would save Rl79 892 per
year. This monetary saving would be accompanied by an increase in the
average speed of the heavy vehicles of about 30 per cent. Most of the
heavy vehicles on this road haul timber from nearby forests to the
local saw-mills and although the authority who constructs and
maintains this road would have higher initial costs (less than R20 000
assuming one borrow-pit along the section) and the unchanged or
slightly reduced road maintenance costs, the savings to the timber
industry (and the country as a whole due to improved productivity)
would be significant. When viewed on a district or regional basis the
figures are astounding.
Digitised by the Open Scholarship Programme in support of public access to information, University of Pretoria, 2017

- 8.10 -
It is estimated that there are in excess of 200 000 km of unpaved
roads in southern Africa (provincial, homeland, recreation, forestry
and mine haul, urban, etc.). Assuming that these roads carry on
average 50 vehicles per day with 20 per cent heavy (a conservative
estimate as many buses and agricultural vehicles use these roads) and
the present average roughness is 100 QI counts/km (also very
conservative as homeland, parks and haul roads are generally much
rougher) an improvement in the average roughness to a QI value of 60
counts/km would result in an annual decrease in the vehicle operating
costs from R2 672 974 000 to R2 142 279 900 (i.e .. an annual saving in
vehicle operating costs of R530 694 100).
These analyses and discussions are all related to road roughness
values of 160 QI counts/km or less. The relationship between road
roughness (QI) and vehicle operating costs (VOC) is exponential and
takes the form
VOC - EXP (a + b.QI) (8.1)
where a and b are constant values related to the vehicle
characteristics and road geometry (duPlessis and Rust, 1988). Some of
the values of the road roughness measured during the project were
consistently higher than 160 counts/km with a maximum measured value
of 320 counts/km. The predicted vehicle operating cost (per 1000 km)
at a roughness of this magnitude (from the appropriate values of a and
bin Model 9.1) would be Rl747,25 for cars (R452,64 at QI -50) and
R5909,99 for trucks (R962,99 at QI- 50). These figures are, however,
outside the inference space of the original data from which Model 8.1
was derived (max QI - 200) and should be viewed with caution. The
vehicle operating cost of buses is much higher than the values used
for medium trucks (5,4 tonnes) in the analyses carried out with costs
of Rl323,44, Rl614,70 and R2122,20 at QI values of 50, 100 and 150
counts/km.
The estimates of traffic volume, the ratio of light to heavy vehicles
and the average road roughness used in this discussion are generally
conservative and the figures derived are at best optimistic. The
average road roughness in many of the homeland areas is closer to 200
Digitised by the Open Scholarship Programme in support of public access to information, University of Pretoria, 2017

- 8.11 -
QI counts/km (maintenance is minimal) and the traffic often consists
mainly of buses. The actual total vehicle operating costs for the
southern African region can thus be expected to be substantially
higher than those derived in this study.
Forder (1987) discussed the experience of a single bus company with
respect to tyre problems. In northern Natal many of the roads became
so rough and eroded (with exposed stones) after cyclone Demoina that
most tyres were scrapped prematurely for his company. The estimated
costs of replacement tyres in 1987 was almost 1,7 million Rand. As
many of the roads were in remote areas tyre problems resulted in major
delays to the bus service, passenger inconvenience and generally an
unacceptable erosion of the quality of service.
8.8 NATIONAL ECONOMY
The influence of the findings of this project on the national economy
relate mainly to the foreign exchange benefits. Fuel, lubricants, tyre_
and parts consumption are directly related to road roughness (Hide,
1975; Du Plessis et al, 1988) and these are significant in terms of
foreign exchange.
Fuel
Actual quantities of fuel imported and consumed in southern Africa are
not available (for strategic reasons) but it would appear that a
significant portion of the South African foreign exchange account is
directed towards fuel purchases.
Although the percentage contribution of fuel to the total vehicle
operating cost decreases as the road roughness increases, the fuel
cost generally rises (Figure 8.2). The marginal increase in fuel cost
with increasing roughness appears minimal but in terms of the total
consumption is significant.
If the average roughness of the network can be reduced from the
estimated present value of more than 100 QI counts/~~ to a value of
around 60 counts/km a saving of some Rll,S million (Appendix 4) in
Digitised by the Open Scholarship Programme in support of public access to information, University of Pretoria, 2017

·'
E' 15o X
§ ...... ~ Ul 100 w 0:: >-1-u.. 0
1- 50 ·Ul 0 u
CARS ·-- .--· --·-·-·-0 1------------------------------------------
150 ~--
E' ..lol:
§ -...... 0:: 100
_______ ......
~
.J MED TRUCKS w ::::> u.. u.. 0 50
.!:._A.R~. _. _ .-.- ·-
1-Ul 0 u
0 50 ~{"H) 150 200 250
QUARTERCAR INDEX (COUNTS/km)
....... 800 E .X
8 0
...... 0:: 600
\II 1-0:: tf.
lj 400 z <( z w 1-z ~ :i! 200
0
E "" 8 10 0
...... 0::
~ z <( 5 u ii: m ::::> .J
0
/ /
/
___ ,,-
I
I I
I I
I
I MED TRUCKS I
I /BUSES
/ / / ~ /.CARS
/
/ /
/ /
MED TRUCKS ..,.~-----
~--BUSES
/ ....... /
/'. ,-·
,/CARS
-·-·-50 100 I 50 200
QUARTERCAR INDEX (COUNTS/km)
250
FIGURE 8.2 EFFECT OF ROUGHNESS ON COSTS OF TYRES, FUEL, LUBRICANTS AND MAINTENANCE PARTS FOR CARS, MEDIUM TRUCKS AND BUSES
(X) . ,__,. N
Digitised by the Open Scholarship Programme in support of public access to information, University of Pretoria, 2017

- 8.13 -
fuel could be expected (assuming an economic cost of fuel of R0,60 per
litre (Du Plessis and Rust, 1988) a large percentage of which would be
in foreign exchange. Present world oil prices and rand/dollar exchange
rates indicate that imported oil costs about 30 c/litre, the remaining
cost being the refining, and transport costs i.e. probably half of the
economic cost is foreign exchange. Assuming half of South Africa's oil
needs are imported (the other half being produced by SASOL) annual
savings in foreign exchange of R2 875 000 could be expected.
In practice, better roads generally result in higher speeds and
concomitant increased fuel consumption. Unless law enforcement was
increased much of the savings would be consumed by the higher petrol
consumption at the increased speeds.
Lubricants
A saving in foreign exchange on reduced use of lubricants would be
achieved by reducing the average road roughness (Figure 8.2). By
improving the average road roughness from 100 to 60 QI counts/km an
annual saving of R4 635 000 can be made (Appendix 4). At least 25 per
cent of this would be foreign exchange savings (i.e. Rl 160 000).
Tyres
Much of the rubber used in the manufacture of tyres is imported and
significant savings (especially in bus and truck tyres) can be
achieved by reducing the roughness of unpaved roads. Figure 8.2 shows
that a decrease in road roughness results in a significant saving in
tyre costs. An improved unpaved road may also result in significant
savings from reduced punctures.
A decrease in the average road roughness from 100 to 60 QI counts/km
would result in an annual saving in tyre costs of Rl5 250 000
(Appendix 4). It is estimated that at least twenty per cent of this
cost would be in foreign exchange on the imported rubber (i.e.
R3 000 000).
The increase in passenger delays and disruption to bus services on
Digitised by the Open Scholarship Programme in support of public access to information, University of Pretoria, 2017

- 8.14 -
rougher roads caused by a larger number of breakdowns and punctures
(Forder, 1987) has a significant effect on the national economy in
terms of productivity and unscheduled trips to effect repairs to the
buses and maintain the service.
Maintenance parts
It is conservatively estimated that about thirty per cent of the
important maintenance parts are imported. The maintenance parts are
the major contributor to the vehicle operating _costs (together with
the associated labour) for trucks and buses and the second major
contributor (after depreciation) for cars. As the road roughness
increases the cost of maintenance parts increases significantly
(Figure 8.2) and major savings in imports can thus be obtained by
decreasing the road roughness.
A general decrease in the average unpaved road roughness from 100 to
60 QI counts/km would result in an annual saving of R289 500 000.
(Appendix 4) of which at least 30 per cent (i.e. almost R87 million)
would involve foreign exchanee.
General
The main contribution to the national economy of improving the unpaved
road network would be a significant saving in foreign exchange. A
total estimated annual saving in foreign exchange of at least
R96 500 000 can be expected if the average road roughness is improved
from 100 to 60 QI counts/km. In practice many of the roads in
developing and rural areas have roughness levels far higher than 100
counts/km and many of these roads carry a significantly higher traffic
and larger proportion of buses and heavy vehicles than has been
assumed for the calculations on which the analyses were based. No
geometric effects (curvature or vertical grades) were included in the
anRlyses thereby biassing the results on the lo't-7 side. The final
figure is therefore a conservative estimate.
With the possibility of increased sanctions against South Africa and a
possible worsening of the Rand/dollar exchange rate the importance of
Digitised by the Open Scholarship Programme in support of public access to information, University of Pretoria, 2017

- 8.15 -
reducing the imported fuel and rubber requirements becomes
increasingly significant.
Other aspects which affect the national interest are the effects of
accidents. It is difficult to quantify the cost of accidents on
unpaved roads, but smoother, less slippery and less dusty roads should
theoretically result in a decrease in the accident rate. The higher
speeds associated with a better unpaved road network may, however,
increase the number and severity of accidents.
8.9 SHOULDERS FOR SEALED ROADS
Many thousands of kilometres of rural road in southern Africa have
unsealed shoulders. Some of these roads carry up to 15 000 equivalent
vehicle units per day (1 truck - 3 cars) and in wet weather extensive
damage is done to the shoulders by heavily loaded vehicles stopping on
the shoulders.
Existing specifications
generally the same as the
gravels for unpaved roads
for unpaved shoulders for sealed roads are
existing specifications for wearing course
(TPA, 1983; Dept of Transport, 1985). The
new specifications for wearing course gravels proposed in this work
(preferably those for urban areas (Section 7.7.2) to reduce the dust
nuisance on major routes) should therefore replace the existing
shoulder material specifications.
It is considered that this will result in an improvement in existing
shoulders and reduced grader and drain maintenance requirements.
8.10 OTHER ROADS
The roads studied during this project were all provincial numbered
roads in the Transvaal and South West Africa. However, thousands of
kilometres of unpaved roads exist in urban areas, public and privat~
forests and recreation areas, and national, municipal and privately
owned parks and nature reserves. In addition, thousands of kilometres
of unpaved strategic and tactical military roads and landing strips
are constructed and maintained in southern Africa.
Digitised by the Open Scholarship Programme in support of public access to information, University of Pretoria, 2017

- 8.16 -
The expected performance of these roads varies considerably. Some of
the roads are required to be passable all the time and thus require
routine maintenance while others are seldom used and then only by
off-road or four-wheel-drive vehicles. In many cases, however, the
economic viability of a nature reserve, forest or recreation area
depends on a reliable all-weather road system. Many of the smaller
enterprises cannot afford to own and maintain road graders or
alternative maintenance equipment and it
construct the road (probably by contract)
is thus important to
of the highest quality
materials in order to reduce the maintenance to an absolute minimum.
The use of a suitable material specification from the three derived in
this study will result in both improved service and reduced
maintenance. In many of these cases the extra expenditure required to
locate the materials and construct the road to a standard appropriate
to the traffic and needs of the road will soon be recovered by savings
in maintenance and vehicle operating costs.
8.11 OTHER IMPLICATIONS
Resources of good quality gravels are rapidly being depleted. Many of
the existing specifications for unpaved road materials are so tight
that materials potentially suitable for low-volume paved roads are
accepted for wearing courses. These materials should be conserved for
future use in paved roads. The proposed specifications will allow the
use of many materials not suitable for paved roads and thus allow
conservation of better gravels for future paved road use.
In many townships in
results in blocking
developing areas, erosion
of drains and culverts.
of the unpaved roads
This necessitates
excessive maintenance which is seldom available and results in
unsanitary conditions and breeding areas for flies and mosquitoes. The
proposed specifications will eliminate those materials particularly
prone to erosion or. provide advance warni~g of possible c=osion
problems if only erodible material is available. Contingency plans for
drainage maintenance can therefore be built into the road design.
Socio-economically, an improved transportation system will result in
Digitised by the Open Scholarship Programme in support of public access to information, University of Pretoria, 2017

an increased
Better roads
- 8.17 -
quality of life in
will lead to
urban and
a more
rural developing areas.
efficient transportation
infrastructure with less break-downs, lower transportation costs (less
maintenance, fuel and spares required) and quicker travel in greater
comfort.
Socio-politically, an improved quality of life in the developing areas
with fewer muddy and slippery roads, less dust, improved public health
conditions and a visibly better road network is tremendously important
to the country as a whole.
8.12 CONCLUSIONS
The findings of the project and the new specifications which have been
proposed have significant implications for the roads authorities, the
road users and the national economy.
In order to implement the proposed specifications increased attention
will need to be directed towards the material location, testing and
processing. Increased haul distances for wearing course materials may
be necessary resulting in increased construction costs. It is
estimated that the increased costs involved with implementing the
specifications are unlikely to exceed R6 000 per kilometre at the time
of construction. This increased cost would need to be borne by the
roads authorities.
Some of the increased construction cost may be recouped by the road
authorities by reduced maintenance costs but it is anticipated that
the programming of maintenance will make optimum use of the available
plant to reduce road user costs and thus will not result in any direct
savings to the roads authorities.
The major benefit of implementing the proposed specifications would be
significant saviDgs in road user costs with annual savings well in
excess of R530 million ultimately being possible. Of this total,
almost RlOO million would be in terms of foreign exchange savings.
Digitised by the Open Scholarship Programme in support of public access to information, University of Pretoria, 2017

- 8.18 -
The proposed specifications are equally applicable to shoulder
materials for paved roads and significant savings are possible in
terms of the maintenance of these shoulders.
A substantial improvement of the quality of life in developing urban
and rural areas can be expected through implementation of these
specifications.
Digitised by the Open Scholarship Programme in support of public access to information, University of Pretoria, 2017

CHAPTER 9
SUMMARY OF CONCLUSIONS AND RECOMMENDATIONS
9.1 SUMMARY OF CONCLUSIONS
• Although extensive research has been carried out on wearing course
materials for unpaved roads since the early 1920's, minimal
attention has been directed towards the influence of geotechnical
properties on the performance of unpaved roads. Recent studies
have concentrated specifically on the maintenance aspects.
• Numerous specifications (generally of obscure derivation) are
currently in use in southern Africa. Their reliability and
applicability in practice, however, have not been rigorously
quantified and there is little evidence to indicate that any of
them are performance-related.
• Of the published work, only the work by Netterberg, specifically
on the use of calcretes as wearing cou~ses ir. southern Africa, is
performance-related.
• As in the Kenya and Brazil studies a factorial desigri with
material, traffic, climate and road geometries was selected for
this experiment. Although the experimental site selection was not
completely random a suitable range of material properties was
included in the experiment.
• In all, 110 sections of road in the Transvaal and South West
Africa were regularly monitored for more than 2 years.
• The main consideration in the experiment was the influence of the
geotechnical properties on the performance of the test sections.
Th~ effe~t of diff~rent maintenance strategies on the performance
of the sections was not investigated, unlike all the previous
studies which concentrated on the maintenance and not the
materials.
Digitised by the Open Scholarship Programme in support of public access to information, University of Pretoria, 2017

- 9.2 -
• Testing and monitoring followed well documented techniques and a
carefully controlled and closely supervised, regular monitoring
programme resulted in a large data base containing high quality
results.
• None of the materials in the test sections complied with the TPA
specifications on the basis of the specified maximum size. Even
neglecting the maximum size criterion only one section complied
with the early specification and none with the present one.
However, many of the sections provided a satisfactory performance,
even under prolonged periods with no maintenance.
• The "drought" prevailing over much of southern Africa during the
monitoring period was found not to have affected the study area
significantly in terms of the total rainfall as a percentage of
the long term average.
• Multiple correlation analyses were carried out to identify the
main geotechnical properties and environmental factors affecting
·the various performance criteria of unpaved roads.
• Most of the models developed to predict the rated performance of
the roads have unacceptably low R-squared values and relatively
high standard errors in terms of prediction models. The fact that
only about SO percent of the variation is accounted for by most of
the models indicates that other factors not taken into account in
the analyses are as important (e.g. variation in traffic volume
and speed, rainfall intensity, quality of maintenance etc.).
• The interaction of different performance parameters results in
problems with the interpretation of the behaviour of the
materials. Potholes, rutting, trafficability and dust, for
example, are all strongly influenced by surface drainage which in
icself may be influenced by potholes and rutting.
The geotechnical properties
plasticity in particular)
materials significantly.
(particle size distribution
influence the performance of
and
the
Digitised by the Open Scholarship Programme in support of public access to information, University of Pretoria, 2017

- 9.3 -
• The observations and measurements of corrugations have resulted in
a confirmation of the "forced oscillation theory" as the cause of
their development. Vehicle speed has been shown to be the major
factor determining the depth, spacing and movement of
corrugations. The presence of both loose and fixed corrugations is
discussed and traffic compaction is identified as the probable
cause of the latter.
• Measurements of the slipperiness of typical unpaved roads were
carried out. The results indicated that at worst, dry unpaved
roads are only slightly more slippery than average paved roads but
are adequately safe. In the wet condition, unpaved roads become
more slippery but apparently only unacceptably slippery when free
water occurs at the surface.
~ The plasticity and grading characteristics of materials are the
main contributors to their performance as wearing courses gravels.
• A number of models for the prediction of roughness progression in
unpaved roads have been developed overseas. These models are all
fairly complicated, necessitating the determination of a number of
geotechnical properties, an identification of the material types
and the incorporation of an estimate of the average vertical grade
for the total length of the link.
• The new models developed in this study have eliminated the
necessity in existing models for identifying the material type and
of estimating the average grade for the road link. Simple
indicator tests requiring minimal equipment and only basic
operator training are required for the input parameters for the
model. The predictive capability has, however, not been diminished
through this process and, in fact, it has generally been improved
for local conditions.
• The geological origin of the wearing course materials do not
directly affect the roughness of unpaved roads. The geotechnical
Digitised by the Open Scholarship Programme in support of public access to information, University of Pretoria, 2017

- 9.4 -
properties, which are directly dependent on the geology in terms
of the mineralogical composition, on the other hand significantly
affect the roughness development.
• The analysis of existing models to predict the gravel loss on
unpaved roads indicated large differences between the predicted
gravel losses for a number of roads in South and South West Africa
and the actual losses.
• A new model for the prediction of gravel loss has been developed.
This model predicts the gravel loss with an accuracy of within
11 rnrn over the design life of a typical unpaved road (wearing
course about 150 rnrn thick) and should replace the model developed
in Brazil for the Maintenance and Design System when used locally.
• Like the model for roughness progression, this model is simple
compared to the existing models. Aspects such as the vertical
grade and horizontal curvature which need to be averaged for a
road link are excluded from the model eliminating a major problem.
No geologi~al classification is necessary. All the parameters
required can be easily obtained by relatively unskilled staff in
developing areas.
• As noted for the roughness prediction model, the geotechnical
properties (notably the grading and plasticity again)
significantly affect the gravel loss.
• Although numerous specifications for unpaved roads are currently
in use in southern Africa, none of them are successful for all
potential wearing course materials.
~ Performance-related specifications have been derived for the
identification of suitable gravel wearing course gravels.
• The specifications are simple, requiring minimal testing (a quick
grading analysis, a linear shrinkage test and a CBR) and should be
applicable to various types of road carrying any traffic in any
climatic area in South Africa (scientifically valid for
practically all of southern Africa).
Digitised by the Open Scholarship Programme in support of public access to information, University of Pretoria, 2017

- 9.5 -
~ The importance of removing the oversize material, limiting the
shrinkage product and grading coefficient to the specified values
and adequately compacting the wearing course has been clearly
identified.
• In order to ensure all weather trafficability, an adequate
material strength is required. As none of the sections on which
the specifications were developed became impassable during the
project, tentative limits based on theoretical considerations and
empirical studies elsewhere have been propose.d.
• The use of these specifications together with good construction
and maintenance procedures should result in a general
of unpaved roads country-wide as existing roads are
regravelled according to these specifications.
improvement
gradually
• Together with the routine regravelling of roads and non-routine
regravelling of roads requiring excessive maintenance, a·
maintenance management system should be implemented to optimise
the grader maintenan~e in terms of mainte:nance and .:-oad user
costs.
• Although previous work in Kenya and Brazil has shown that a
classification of the material type is necessary to predict
wearing course gravel performance, this study has shown that for
South African conditions the material properties in terms of
plasticity and particle size distribution are the only valid means
of predicting the performance.
G0 The performance of natural wearing course gravels has been shown
to be independent of the geological origin and geotechnical
classification of the gravel, and is entirely dependent on the
material properties (mainly -plasticity and particle size
distribution).
• Existing classification
properties appear to
systems, although based on
have excessively wide
classification based material selection processes.
the correct
ranges for
Digitised by the Open Scholarship Programme in support of public access to information, University of Pretoria, 2017

- 9.6 -
• The findings of the project and the new specifications which have
been developed have significant implications for the road
authorities, the road users and the national economy.
• In order to implement the proposed specifications increased
attention will need to be directed towards the material location,
testing and processing. Increased haul distances for wearing
course materials may be necessary resulting in increased
construction costs. It is estimated that the increased costs
involved with implementing the specificatio.ns will not exceed
RlO 000 per kilometre. This increased cost will need to be borne
by the road authorities.
• Some of the increased construction cost may be recouped by the
road authorities by reduced maintenance costs but it is
anticipated that the programming of maintenance will make optimum
use of the available plant to reduce road user costs and thus may
not result in any direct savings to the roads authorities.
• Significant savings in road user
savings in excess of RS30 million
this total, almost RlOO million
exchange savings.
costs are envisaged with annual
ultimately being possible. Of
would be in terms of foreign
• The proposed specifications are equally applicable to shoulder
materials for paved roads and significant savings are possible in
terms of the maintenance of these shoulders.
• A substantial improvement of the quality of life in developing
urban and rural areas can be expected through implementation of
these specifications.
Digitised by the Open Scholarship Programme in support of public access to information, University of Pretoria, 2017

- 9.7-
9.2 RECOMMENDATIONS
• It is recommended that as existing roads are routinely regravelled
and those roads which perform unsatisfactorily and require
excessive maintenance are regravelled, the proposed specifications
are used. At the same time a data base of the material, traffic
and climatic characteristics is built up and a maintenance
management system is put into practice.
• Further work on cost-effective dust palliatives, wet-weather
trafficability, the effect of increased compaction, maximum
allowable subgrade strains in unpaved roads and improved
geotechnical classification systems is recommended.
• An investigation into the optimum methods for the location of
suitable materials for unpaved roads should be carried out.
~ Maintenance should concentrate on the retention of the crown of
the road and the crossfall, more than on the reduction of
roughness. Monicoring has indicaced that cne roughness is only
decreased by blading about 70 per cent of the time. Restoration of
the shape on the other hand results in improved drainage and less
rutting with a concomitant improvement in riding quality in the
longer term. Grader blading should be carried out in a programmed
manner, and the roads should not be allowed to deteriorate too far
or else routine blading will not correct the deficiencies.
• Improved training for grader operators is strongly recommended.
This should include such aspects as the importance of the pavement
cross-section and good drainage and the effect of loose material
on the road.
• Further research on the use of sand blankets is necessary. Many
grader operators spread a thick layer of material from the side of
the road over the road. This results in unsafe conditions and
increases the vehicle operating costs and should be discouraged.
Digitised by the Open Scholarship Programme in support of public access to information, University of Pretoria, 2017

- 9.8 -
• A number of the sections monitored were excessively wide (up to
14m with 10m trafficked widths). This allows considerable
lateral movement of the traffic but also results in a substantial
extra maintenance cost, requiring one or two extra grader passes.
Road widths should thus not be increased above the safe minimum.
9.3 SUMMARY OF FINDINGS
The specifications which were developed and the prediction models for
roughness progression, roughness after blading _and gravel loss are
summarised below. The definitions of the symbols are given in the
front of this thesis.
Recommended material specifications for unpaved rural roads
Maximum size: 37,5 mm Oversize index (I ): ~ 5 per cent Shrinkage product0 (S ): 100- 365 (max. of 240 preferable) Grading coefficient p(G ): 16- 34 CBR: ~ 15 at ~ 95 pgr cent Mod AASHO compaction and OMC
Recommended material specifications for unpaved roads in urban areas
Maximum size: Oversize index (I ) Shrinkage product0 (S ): Grading coefficient P(G ):
c CBR: ~ 15 at ~ 95 per cent
37,5 mm 0
100 - 240 16 - 34
Mod AASHO compaction and OMC
Recommended material specifications for unpaved haul roads
Maximum size: Oversize index (I): Shrinkage product0
(S ):
75 - 100 mm ~ 10 per cent
100 - 365 (max preferably < 240) 16 - 34 Grading coefficient p(G ):
c CBR: ~ 15 at ~ 95 per cent Mod AASHO compaction and 4 days soaking
Tests according to TMH 1 (NITRR, 1979) except grading according to Paige-Green (1988b) and plus 19 mm material discarded in CBR test.
Digitised by the Open Scholarship Programme in support of public access to information, University of Pretoria, 2017

- 9.9 -
The model to predict the change in roughness (CR) of an unpaved road
after any selected number of days (D ~No of days/100) is as follows:
CR- exp{D[-8,3 + 0,0003.PF + 0,07.Sl + 0,08l.P26 + 0,0003.N.ADT
+ GM(3,63 - 0,035.P26)]}
The following model is recommended for the prediction of the roughness
after grader blading (RA):
RA = ex~(l,07 + 0,699.LRB + 0,0004.ADT - 0,13.DR + 0,0019.LABMAX)
The recommended model for the prediction of gravel loss from an
unpaved road is as follows:
GL- D [ADT(0,059 + 0,0027.N- 0,0006.P26) - 0,367.N- 0,0014.PF
+ 0,0474.P26]
Digitised by the Open Scholarship Programme in support of public access to information, University of Pretoria, 2017

CHAPTER 10
REFERENCES
AGRICULTURAL RESEARCH SERVICE (ARS)
predicting rainfall-erosion losses.
Washington, D.C.
(1961) A universal equation for
ARS Special Report ARS 22-66,
AHLVIN, R.G. and HAMMITT, G.M. (1975) Load supporting capability of
low-volume roads. TRB Special Report 160: . Low volume roads.
Transportation Research Board, Washington, D.C., pp. 198-203.
ALKIRE, B.D. (1987) An aggregate thickness design that is based on
field and laboratory data. Transportation Research Record, 1106,
Washington, DC, pp. 304-317.
AMERICAN ASSOCIATION OF STATE HIGHWAY OFFICIALS (AASHO) (1942)
Standard specification for materials for stabilised base courses.
AASHO, Washington, D.C.
AMERICAN ASSOCIATION OF STATE HIGHWAY OFFICIALS (AASHO) (1961)
The classification of soils and soil-aggregate mixtures for highway
construction purposes: Highway materials: Part 1. AASHO, Washington,
D.C.
AMERICAN ASSOCIATION OF STATE HIGHWAY AND TRANSPORTATION OFFICIALS
(AASHTO) (1974) Standard specification for materials for aggregate
and soil-aggregate subbase, base and surface courses: AASHTO M 147-65.
In: Standard specifications for transportation materials and methods
of sampling and testing, Part 1, Specifications. AASHTO, Washington,
D.C., pp. 226-228.
AMERICAN ASSOCIATION OF STATE HIGHWAY AND TRANSPORT OFFICIALS (AASHTO)
(1982) AASHTO Materials Part 2: Tests. AASHTO, i3th eaicion,
Washington, D.C.
AMERICAN GEOLOGICAL INSTITUTE (AGI) (1962) Dictionary of geological
terms. Dolphin Books, New York.
Digitised by the Open Scholarship Programme in support of public access to information, University of Pretoria, 2017

- 10.2 -
AMERICAN SOCIETY FOR TESTING MATERIALS (ASTM) (1944) Tentative
specification for stabilised base course (D556-40T and D557-41T),
ASTM, Philadelphia.
AMERICAN SOCIETY FOR TESTING MATERIALS (ASTM) (1987) Annual book of
ASTM Standards, Vol 11, ASTM, Philadelphia.
ASSOCIATION OF ENGINEERING GEOLOGISTS COMMITTEE ON CORE LOGGING (AEG)
(1976) A guide to core logging for rock engineering. Proceedings of
the Symposium on Exploration for Rock Engineering, Johannesburg,
pp 71-86
BEAVEN, P., ROBINSON, R. and AKLILU, K. (1987) Experimental use of
weathered basalt gravels on roads in Ethiopia. Transportation Research
Record, 1106, Washington, D.C., pp. 103-115.
BLOMMERS, P. and LINDQUIST, E.F. (1965) Elementary statistical
methods. University of London Press, London.
BURGER, A. P. (undated) Deflnition of the R2 stat:f.stic in a l:i.near
regression model without an intercept. Unpublished report, Research
Dept, United Building Society.
CARROLL, D. (1970)
identification. Special
Boulder, Colorado.
Clay minerals: A guide to
Report 126, Geological Society
their X-ray
of America,
CERNICA, J.N. (1980) Proposed new method for the determination of
density of soil in place. Geotech. Test. Jnl, Vol 3, 3, pp. 120-123.
CLEGG, B. (1983) Application of an impact test to field evaluation
of marginal base course materials. Transp. Res. Record 898,
Transportation Research Board, pp. 174-181.
COUNTRY ROADS BOARD ( CRB) (1982) Manual of testing procedures,
Vol 3. Test CRB 315.01, Melbourne, Australia.
Digitised by the Open Scholarship Programme in support of public access to information, University of Pretoria, 2017

- 10.3 -
CURTAYNE, P.C., and WALKER, R.N. (1972) A fresh look at the
interpretation of pavement serviceability and an experiment to measure
the riding quality of roads in South Africa. Proc. 3rd Int. Con£. on
Struct. Design of Asphalt Pavements, London, pp. 776-785.
DEPARTMENT OF DEVELOPMENT AID (DDA) (1988) Towards guidelines for
services and amenities in developing communities. Department of
Development Aid, Pretoria.
DEPARTMENT OF TRANSPORT (DOT) (1958) Standard methods of testing
materials and specifications. Department of Transport, Pretoria.
DEPARTMENT OF TRANSPORT (DOT) (1981) National rural roads needs
study: report on initial study. Land Transportation Directorate,
Department of Transport, Pretoria.
DEPARTMENT OF TRANSPORT (DOT) (1985) Standard Specifications for
Road and Bridge Yorks. Department of Transport, Pretoria.
DRAPER, N.R. and SMITH, H. (1966) Applied ragression analysis. John
Wiley and Sons, New York.
DU PLESSIS, H.W. and RUST, U.A. (1988) A vehicle operating cost
model for southern Africa: Draft user's manual. Contract Report
DPVT-C23.1, Roads and Transport Technology, CSIR, Pretoria.
EATON, R.A., GEP~. S. and GATE, D.W. (1987) Rating unsurfaced
roads: A field manual for measuring maintenance problems. Special
Report 87-15, US Army Corps of Engineers, Vicksburg, Mississippi.
EMERY, S.J. (1985) Prediction of moisture content for use in
pavement design.
Witwatersrand.
Unpublished Ph.D thesis, University of the
FERRY, A.G. (1986) Unsealed roads: A manual of repair and
maintenance for pavements. Road Research Unit Technical Recommendation
TR8, Wellington, New Zealand.
Digitised by the Open Scholarship Programme in support of public access to information, University of Pretoria, 2017

- 10.4 -
FISHER, P.H. (1979) Mobile hammermill for inplace processing of
oversize rock. Equipment development and test report 7700-13, Forest
Service, US Dept Agriculture, San Dimas, California.
FLORENTIN, J. and L'HERITEAU, G. (1950) Deformation ondulatoire des
pistes routieres dans les pays tropicaux. Via, 11, pp. 23-27.
FORDER, M.S. (1987) The operator's problem - bad roads and high
costs. NITRR Seminar on Vehicle Operating Costs, CSIR, Pretoria.
FOSSBERG, P.E. (1962) A preliminary report on some specifications
for gravel roads. NITRR unpublished report RS/9/62, CSIR, Pretoria.
FOSSBERG, P.E. (1963a) Gravel roads - the performance and testing of
materials. Proc 3rd Reg Conf Africa on Soil Mech. and Foundn Engng,
Salisbury, June, 1983, pp. 69-72.
FOSSBERG, P.E. (1963b) New developments in "low cost" road
construction and maintenance. NITRR unpublished report RS/4/63, CSIR,
Pretoria.
FOSSBERG, P.E. (1966) The treatment of gravel roads with waste
sulphite lye. NITRR bulletin No. 7, CSIR, Pretoria.
FROST, R.J. (1968) Review of specifications
materials for low cost tropical roads. Proc. 1st
Reg. Con£ Soil Egng., Bangkok, pp. 451-460.
for gravel
South East
paving
Asian
GALLUP, R.M. and AIRALL, C.S. (1974) Treatment of oversize rock on
non-surfaced roads. Report ED&T 2055, Forest Service, US Dept
Agriculture, San Dimas, California.
GEIPOT (1980) Research on the interrelationships between costs of
highway constructi~n. maintenance and ~til!.sa~!on - F!.~al rer:ort V:
Pavement and maintenance studies. (UNDP Project BRA 012/74) GEIPOT,
UNDP, IBRD, Brasilia, Brazil.
Digitised by the Open Scholarship Programme in support of public access to information, University of Pretoria, 2017

- 10.5 -
GEIPOT (1981) Research on the interrelationships between costs of
highway construction, maintenance and utilisation - Final report Vll:
Pavement and maintenance studies. (UNDP Project BRA 012/74) GEIPOT,
UNDP, IBRD, Brasilia, Brazil.
GREENSTEIN, J. and LIVNEH, M. (1981)
roads. Transportation Research Record,
Board, Washington, D.C., pp. 21-26.
Pavement design of unsurfaced
827, Transportation Research
GRESILLON, J.M. (1978) Quelques observations sur l'usure mecanique
des chausees non revetues appelee tole ondulee. Review Generale des
Routes et des Aerodromes, 539, pp.63-66.
HAMMITT, G.M. (1969) A development of thickness design criteria for
unsurfaced roads and airfields, Masters thesis, Mississippi State
University.
HARRAL, C.G. (1988) Road deterioration in developing countries:-
causes and remedies. The World Bank, Washington, DC.
HARRAL, C.G. and AGARWAL, S.K. (1975) Highway design standards
study. TRB Special Report 160: Low volume roads. Transportation
Research Board, Washington,D.C., pp. 17-24.
HARRAL, C.G. and FOSSBERG, P.E. (1977) Evaluating the economic
priority of highway maintenance. Pan African Conf on Highway Maint and
Rehabilitation, Ghana.
HEATH, W, and ROBINSON, R. (1980) Review of published research into
the formation of corrugations on unpaved roads. TRRL Supp Report 610,
Department of Environment, Dept of Transport, Crowthorne.
HIDE, H. (1975) Investigation of vehicle operating costs in Kenya.
Special Report 160: Lov volume roads, Transportcitlon Rt::search Boar<.l,
Washington, DC, pp. 355-375.
Digitised by the Open Scholarship Programme in support of public access to information, University of Pretoria, 2017

- 10.6 -
HIDE, H., ABAYNAYAKA, S.W., SAYER, I and WYATT,R. (1975) The
Road Transport Cost Study: research on vehicle operating costs.
of Environment, TRRL Report LR 762, Crowthorne.
Kenya
Dept
HIGHWAY RESEARCH BOARD (HRB) (1943) Wartime road problems No 5:
Granular stabilised roads. HRB, Washington D.C., Feb., 1943, 27pp.
HODGES, J .W.,
Transport Cost
ROLT, J. and JONES, T.E. (1975) The
Study: Research on Road Deterioration.
Kenya Road
TRRL Report
LR 673, Transport and Road Research Laboratory, C.rowthorne.
HOGENTOGLER, C.A., and TERZAGHI, C. (1929) Interrelationships of
load, road and subgrade. Public Roads, 10, 3, pp. 37-64.
HOGENTOGLER, C.A. (1935) Soil road surfaces. Public Roads, 15, 12,
Feb, 1935, pp. 273-286.
HOOVER, J.M., BERGESON, K.L., FOX, D.E., DENNY, C.K. and HANDY, R.L.
(1973) Surface improvement and dust palliation of unpaved secondary
roads and streets. Final report, Iowa Highway Research Board Project,
HR-151, Ames, Iowa
HUDSON, S.W., McCULLOUGH, B.F. and CAR}!ICHAEL, R.F. (1987) Surface
design and rehabilitation guidelines for low-volume roads. Report
FHWA/TS-87-225, Federal Highway Administration, Washington, D.C.
HUTCHINSON, B.G. (1963) Principles of subjective rating
46, Washington,
scale
construction. Highway Research
pp. 60-70.
INTERNATIONAL ROAD FEDERATION (IRF)
1981 - 1985. IRF, Washington, D.C.
Record, D.C.,
(1986) World road statistics
JONES, T.E. (1984a) The ~enya rua~nt~nanc~ stuay on unpaved roads:
research on deterioration. TRRL Lab Report LR 1111, Transport and Road
Research Laboratory, Crowthorne, England.
Digitised by the Open Scholarship Programme in support of public access to information, University of Pretoria, 2017

- 10.7 -
JONES, T.E. (1984b) Dust emission from unpaved roads in Kenya. TRRL
Lab Report LR 1110, Transport and Road Research Laboratory,
Crowthorne, England.
JONES, T.E., ROBINSON, R and SNAITH, M,S. (1984) A field study on
the deterioration of unpaved roads and the effect of different
maintenance strategies. Proc 8th Reg. Conf. Africa on Soil Mech. and
Foundn Engng, Harare, 1984, Vol 1, pp. 293-303.
KARATHANASIS, A.D. and HAJEK, B.F. (1982) Revised methods for rapid
quantitative determination of minerals in soil clays. Soil Science
Society of America, 46, pp. 419-425.
KLEYN, E.G. (1975) The use of the dynamic cone penetrometer (DCP).
Transvaal Roads Department, Pretoria.
LADD, G.E. (1924) Rhythmic corrugations in gravel roads. Public
Roads, V, pp.l8 - 20.
LU, X-P. (1985) Effects of road roughness on vehicular rolling
resistance. In Measuring road roughness and its effect on user cost
and comfort (Editors: Gillespie and Sayers), ASTM Special Technical
Publication 884, Philadelphia, pp 143-161.
MATHER, K.B. (1962) The cause of road corrugations and the
instability of surfaces under wheel action. Civil Engineering and
Public Works Review, May and June, pp. 617-620 and 781-784.
MATHUR, S., WASON, O.P., MEHTA, H.S. and KUMAR, A. (1988)
pavement design procedure for unpaved gravel roads.
Australian Road Research Board Conference, Part 5,
pp. 79-86.
A simple
Proc 14th
Canberra,
MEYER, A.H and HUDSON, W.R. (1987) Prel~minary guidelines for
material requirements of low volume roads. Transportation Research
Record, 1106, Transportation
pp. 260-268.
Research Board, Washington, D.C.,
Digitised by the Open Scholarship Programme in support of public access to information, University of Pretoria, 2017

- 10.8 -
MIDDLETON, D.R.
truck traffic
and MASON,
to evaluate
J.M.
the
(1987) The use
performance of
pavements. Transportation Research Record, 1106,
Research Board, Washington, DC, pp 123-132
of site-specific
surface-treated
Transportation
MINISTRY OF WORKS AND COMML~ICATIONS (1982) Botswana road design
manual. Ministry of Works and Communications, Roads Dept., Gaborone,
Botswana.
MINISTRY OF WORKS AND SUPPLIES (1978) Standard specification for
road and bridge works. Government Printer, Zomba, Malawi.
MITCHELL, R.L, VAN DER MERWE, C.P. AND GEEL, H.K. (1975) Standardised
flexible pavement design for rural roads with light to medium traffic.
Ministry of Roads and Road Traffic, Salisbury, Rhodesia, 70 pp.
MITCHELL, M.F., PETZER, E.C.P. and VAN DER WALT, N. (1979) The
optimum use
developing
of natural materials for lightly trafficked roads in-
countries. Transportation Research Record, 702,
Transportation Research Board, Washingto~. DC, pp 155-163.
MORONEY, M.J. (1951) Facts from figures Penguin Bo.oks, London, 472pp.
NATAL PROVINCIAL ADMINISTRATION (NPA) (ca 1961) Specification for
gravel road wearing courses. NPA, Pietermaritzburg, Natal.
NATAL PROVINCIAL ADMINISTRATION (NPA)
NPA, Pietermaritzburg, Natal.
(ca 1985) Materials Manual.
NATIONAL ASSOCIATION OF AUSTRALIAN STATE RCAD AUTHORITIES (NAASRA)
(1980) Pavement materials: Part 2 - Natural gravels, sand-clay and
soft and fissile rock, NAASRA, Sydney.
NATIONAL INS'!'ITU'!'E FOR '!'~'\NSPCR'!' A .. 'i!D RCAD RESEARCH (NITRR) (1973)
Geotechnical and soil engineering mapping for roads and the storage of
materials data. Technical Recommendations for Highways, TRH 2, CSIR,
Pretoria, 31 pp.
Digitised by the Open Scholarship Programme in support of public access to information, University of Pretoria, 2017

- 10.9 -
NATIONAL INSTITUTE FOR TRANSPORT AND ROAD RESEARCH (NITRR) (1979)
Standard methods of testing road construction materials. Technical
Methods for Highways No 1, CSIR, Pretoria, 183 pp.
NATIONAL INSTITUTE FOR TRANSPORT AND ROAD RESEARCH (NITRR) (1980)
Standard nomenclature and methods for describing the condition of
asphalt pavements. Draft TRH 6, CSIR, Pretoria, 48pp.
NATIONAL INSTirJTE FOR TRANSPORT AND ROAD RESEARCH (NITRR) (1985)
Guidelines for road construction materials. TRH 14, CSIR, Pretoria,
57pp.
NATIONAL INSTITUTE FOR TRANSPORT AND ROAD RESEARCH (NITRR) (1986)
Standard methods of testing road construction materials. Technical
Methods for Highways No 1, 2nd Edition, CSIR, Pretoria, 232 pp.
NETTERBERG, F. (1967) Some road making properties of South African
calcretes. Proc. 4th Reg. Conf. Africa Soil Mech. and Foundn. Engng,
Cape Town, Dec,l967, Vol 1, pp 77-81.
NETTERBERG, F. (1969) The geology and engineering properties of
South African calcretes. Unpublished Ph.D. Thesis, University of the
Witwatersrand, Johannesburg.
NETTERBERG, F. (1978) Calcrete wearing courses for unpaved roads.
The Civil Engineer in South Africa, Vol 20, 6, pp. 129-138.
NETTERBERG, F. (1982) Behaviour of calcrete as flexible pavement
materials in southern Africa. Proc 11th Australian Road Research Board
Conf, Vol 11, Part 3, Melbourne, pp. 60-69.
NETTERBERG, F. (1985) Wearing courses for unpaved roads. NITRR
Technical note TS/33/85, (Presented at SA Road Federation Seminar),
CSIR, Pretoria.
NETTERBERG, F and PAIGE-GREEN, P. (1988a) Pavement materials for
low volume roads in southern Africa: A review. Proc Annual
Transportation Convention, Vol 2D, Paper 2D/2, Pretoria, 51 pp.
Digitised by the Open Scholarship Programme in support of public access to information, University of Pretoria, 2017

- 10.10 -
NETTERBERG, F and PAIGE-GREEN, P. (1988b) Wearing courses for
unpaved roads in southern Africa: A review. Proc Annual Transportation
Convention, Vol 2D, Paper 2D/5, Pretoria, 36 pp.
NORRISH, K. and TAYLOR, R.M. (1962) Quantitative analysis by X-ray
diffraction. Clay minerals bulletin, 5, pp. 98-109.
ODIER, L., MILLARD, R.S., DOS SANTOS, P. and MEHRA, S.R. (1967) Low
cost roads. Butterworths, London
PAIGE-GREEN, P. (1978) A preliminary report on methods of sample
preparation and treatment for X-ray diffraction study of rock and
soil. NITRR technical note TS/26/77, revised July,l978, CSIR,
Pretoria.
PAIGE-GREEN, P. (1983) Techniques for monitoring gravel road
performance, NITRR Technical Note TS/40/83, NITRR, CSIR, Pretoria
PAIGE-GREEN, P. (1986) A comparison of the roughness measurement with
& bump integ~ator and linear displacement integrator. NITRR technical
note TS/31/86, CSIR, Pretoria.
PAIGE-GREEN, P. (1987a) Acceptability criteria for unpaved roads.
NITRR technical note TS/3/87, CSIR, Pretoria, lOpp.
PAIGE-GREEN, P. (1987b) Wearing course materials for unpaved roads.
NITRR technical note TS/5/87, (Notes prepared for Roads Information
Forum, CSIR, April, 1987), CSIR, Pretoria, 24pp.
PAIGE-GREEN, P. (1988a) Monitoring techniques for unpaved road
networks. Proc Annual Transportation Convention, Volume 3D, Paper
3D/2, Pretoria, 2lpp.
£AIG~-GaEEN, P. (l983b) A revised method for the sieve analysis of
wearing course materials, DRTT Report DPVT-Cl4.1, Division of Roads
and Transport Technology, CSIR, Pretoria.
Digitised by the Open Scholarship Programme in support of public access to information, University of Pretoria, 2017

- 10.11 -
PAIGE-GREEN, P. (1988c) A preliminary structural design procedure
for unpaved roads, DRTT Report DPVT-C29.1, Division of Roads and
Transport Technology, CSIR, Pretoria.
PAIGE-GREEN, P. (1989)
records of unpaved roads
Pretoria.
Summary of
project.
test
DRTT
results and monitoring
Report L~~/2/89, CSIR,
PAIGE-GREEN, P. and NETTERBERG, F. (1987) Requirements and
properties of wearing course materials for unpaved roads in relation
to their performance. Transportation Research Record 1106,
Transportation Research Board, Washington, D.C., pp. 208-214.
PAIGE-GREEN, P. and NETTERBERG, F. (1988) Towards acceptability
criteria for unpaved roads. Proceedings Annual
Convention, Vol 2D, Paper 2D/6, Pretoria, 15pp.
Transportation
PATERSON, W.D.O. (1985) Prediction of road deterioration and-
maintenance effects: Theory and quantification. In The Highway Design
and Maintenance Standards Study, Vol 3. Transportation Department,
World Bank, Washington, DC.
PATERSON, W.D.O. and WATANATADA, T. (1985) Relationships between
vehicle speed, ride quality and road roughness. In Measuring road
roughness and its effect on user cost and comfort (Editors: Gillespie
and Sayers), ASTM Special Technical Publication 884, Philadelphia,
pp 89-110.
PATERSON, W.G., McFARLANE, H.W. and DOHANEY, W.J. (1975) Forest road
classification in eastern Canada. TRB Special Report 160: Low volume
roads, Transportation Research Board, Washington, D.C., pp. 288-295.
POOLMAN, F.W. (1988) Pers comm.
POOLMAN, F.W. (1988) 'n Poging om die standaard van gruispaaie te
verhoog en terselfdertyd die totale vervoerkoste daarop te
Inskrywing vir die nasionale produktiwiteitstoekenning,
Vervoer, Windhoek, 13 pp.
ver1aag.
Dept van
Digitised by the Open Scholarship Programme in support of public access to information, University of Pretoria, 2017

- 10.12 -
PROCTOR, R.R. (1933) Fundamental principles of soil compaction.
Engineering News Record, Vol 111, 9.
PROVINCIAL ADMINIST~~TION OF THE CAPE OF GOOD HOPE (CPA) (1983)
Materials Manual Department of roads, Provincial Administration of the
Cape of Good Hope, Cape Town.
RHODESIAN MINISTRY OF ROADS (1979) Specification for wearing course
gravel, Central Laboratory, Salisbury.
RICHARDS, R. G. (1978)
review of practice and
RP/8/78, CSIR, Pretoria.
Lightly trafficked roads in southern Africa: A
recommendations for design. NITRR Report
RILEY, J.G. and FURRY, R.B.
corrugation phenomenon. Highway
D.C. , pp. 54-62.
ROAD RESEARCH LABORATORY (RRL)
engineers. H.M.S.O., London.
(1973)
Research
Simulation of
Record, 438,
the road
Washington,
(1952) Soil mechanics for road
ROBERTS, P.W.D.H. (1980) Measuring the performance of unsealed road
surfaces in Ghana. Proc 7th Reg Conf Africa on Soil Mech and Foundn
Engng, Accra, Ghana, pp. 373-387.
ROBERTS, P.W.D.H. (1983) Performance of unsealed roads in Ghana. TRRL
Lab. Report 1093, Transport and Road Research Laboratory, Crowthorne.
ROBINSON, R. , HIDE, H. , HODGES, J. W. , ABAYNAYAKA, S. W. and ROLT, J.
(1975) A road transport investment model for developing countries.
Dept. of Environment, TRRL Report LR 674, Crowthorne.
ROSE, A.C. (1952) Public roads of the past: 3500 BC t.o 1800 AD,
AASHO, Washington, DC.
ROSE, A.C. (1953) Public roads of the past: historic American
highways, AASHO, Washington, DC.
Digitised by the Open Scholarship Programme in support of public access to information, University of Pretoria, 2017

- 10.13 -
ROSENAK, S, (1963) Soil mechanics. Batsford, London, 190 pp.
RUNNER, D.G. (1935) Origin and road building properties of caliche.
Roads and Streets, Vol 78, pp. 197-202.
SAMPSON, L.R. (1986) The determination of the liquid limit of soils by
means of the cone penetrometer method. NITRR technical note TS/15/86,
CSIR, Pretoria.
SAMPSON, L.R. and NETTERBERG, F. (1984) A cone penetration method for
measuring the liquid limits of South African soils. Proc 8th Reg Conf
Africa Soil Mech Foundn Engng, Harare, Vol 1, pp.l05-114.
SAMPSON, L.R. and NETTERBERG, F. (1988) The durability mill: a new
performance-related durability test for basecourse aggregate. Civil
Engineer in South Africa (submitted).
SAYERS, M. (1985) Development, implementation and application of the
reference Quarter-car simulation. In Measuring road roughness and its
effect en user cost and comfcrt (Editors: Gillespie and Sayers), ASTM
Special Technical Publication 884, Philadelphia, pp 25-47.
SHEPHERD, J. (1986) Pers. comm.
SNYMAN, N.V. (1987) The impact of road condition on vehicle
operating cost - an introduction. NITRR Seminar on Vehicle Operating
Costs, CSIR, Pretoria.
SOUTH AFRICAN BUREAU OF STANDARDS (SABS) (1985) SABS 1207: Motor
vehicle safety standards: specification for braking. SABS GR 14,
Pretoria.
SOUTH AFRICAN COMMITTEE FOR STRATIGRAPHY (SACS) (1980) Stratigraphy
of Svuth Africa. Part 1. Handbook of Geological Survey South Africa,
8, Government Printer, Pretoria.
Digitised by the Open Scholarship Programme in support of public access to information, University of Pretoria, 2017

- 10.14 -
STANDARDS ASSOCIATION OF CENTRAL AFRICA (SACA) (1971) Methods of
testing soils for civil engineering purposes Part 1. CAS No A43 Part
1, Salisbury, Rhodesia.
STATISTICAL ANALYSIS SYSTEM (SAS) (1985) SAS Users Guide: Basics and
Statistics. SAS Institute Inc, Cary, North Carolina.
STRAHAN, C.M. (1922) Research
sand-clay and other materials in
Georgia. 35pp.
work on semi-gravel, top soil
Georgia. Bulletin Sa, University
and
of
STRAHAN, C.M. (1929) A study of gravel, top soil and sand-clay roads
in Georgia. Public Roads 10, 7, Sept, 1929. pp. 117-136.
SULTAN, H.A. (1976) Soil erosion and dust control on Arizona
highways. Arizona Dept of Transportation, Phoenix.
SZKUTNIK, A. (1983) A procedure to assist in selecting gravel
wearing course materials to minimise total cost. NITRR Technical Note
TC/34/83, NITRR, CSIR, Pretoria.
TAYLOR, D.J., IRWIN, L.H. and ANESHANSLEY, D.J. (1987) A device to
measure road dustiness on aggregate surfaced roads. Report EM 7170-8,
United States Dept of Agriculture, Forest Service, Washington, D.C.
TERZAGHI, C. (1925) Principles of soil mechanics. Engineering News
Record, Vol 95, 5, 1925.
THERON, P.J. (1983)
en spesifikasies.
Stellenbosch, 147 pp.
Ongeplaveide Paaie: 'n e~aluering van onderhoud
Unpublished M.Eng Thesis, University of
THORNTHWAITE, c.w. (1948) An approach towards a rational
classification of climate. Geographical Review, vol 38, no 1.
TRANSPORT AND ROAD RESEARCH LABORATORY (TRRL) (1981) Maintenance
techniques for district engineers.
Unit, TRRL, Crowthorne, 42pp.
Overseas road note 2, Overseas
Digitised by the Open Scholarship Programme in support of public access to information, University of Pretoria, 2017

- 10.15 -
TRANSVAAL PROVINCIAL ADMINISTRATION (TPA) (1973) Standard
specifications for road and bridge works. TPA, Pretoria.
TRANSVAAL PROVINCIAL ADMINISTRATION (TPA)
counts. TPA, Pretoria.
(1982) Maps and traffic
TRANSVAAL PROVINCIAL ADMINISTRATION (TPA) (1983) Standard
specifications for road and bridge works. TPA, Pretoria.
TRAVERS, R.B., and HICKS, W.B. (1933) Gravel type. stabilised surfaces
for secondary roads. Proc. of 12 Annual Meeting, Part 2, Highway
Research Board, pp. 228-243.
TSEKOA, D.T. (1986) Pers. comm.
TSOAR, H. and PYE, K. (1987) Dust transport and the question of
desert loess formation. Sedimentology, 34, pp. 139-153.
UNESCO (1971) Low Cost Roads United Nations Education, Scientific and
Cultural Orgenisation, ButterNorths, London. 158 pp.
USDA FOREST SERVICE (USFS) (1973) What the forest service does.
USDA Forest Service, Washington, D.C.
VAN BARNEVELD, J.H. (1984) Road dust can be measured. Road Research
Newsletter, May, 1984, Road Research Unit, National Roads Board,
Wellington, pp. 12-13.
VANDER MERWE, C.J. and GRANT, M.C. (1982) A simple instrument for the
assessment of road riding quality. NITRR report RC/8/80 revised
July, 1982, CSIR, Pretoria.
VANDER WALT, N. (1973) Voorskrif en materiale spesifikasie
gr~ispaaie. In : Materia1e H~ndleiding. Orange Free State Roads
Manual, Bloemfontein, pp. 4-7.
VAN NIEKERK, T. (1988) Personal communication.
vir
De~t.
Digitised by the Open Scholarship Programme in support of public access to information, University of Pretoria, 2017

- 10.16 -
VAN NIEKERK, T. (1988) Standard road pavement design procedures for
developing countries. Specialist Course K6: Annual Transportation
Convention, Pretoria.
VISSER, A.T. (1976) Research on the interrelationships between costs
of highway construction, maintenance and utilisation: Quarterly
Progress Report. No 1, GEIPOT, Brasilia, Brazil.
VISSER, A.T. (198la) An evaluation of unpaved road performance and
maintenance. Unpublished Ph.D Thesis, University .of Texas at Austin.
VISSER, A.T. (198lb) An evaluation of the maintenance of unpaved
roads in the Bronkhorstspruit District. NITRR Technical note TC/56/81,
CSIR, Pretoria.
VISSER, A.T. (1982) A correlation study of roughness measurements with
an index obtained from a road profile measured with rod and level.
NITRR Technical report RC/2/82, CSIR, Pretoria.
VISSER, A.T. (1983) Roughness measurements with linear displacement
integrator and bump integrator on calcrete road sections in Botswana,
October 1982 NITRR Technical Note TC/2/83, CSIR, Pretoria.
VISSER, A.T. and CURTAYNE, P.C. (1982) The routine operation
calibration and control of the linear displacement integrator. NITRR
report RC/7/82, CSIR, Pretoria.
VISSER, A.T. and CURTAYNE, P.C. (1987) The Maintenance and Design
System: a management aid for unpaved road networks. Transportation
Research record, 1106, Transportation Research Board, Washington, DC,
pp. 251-259.
VISSER, A.T., KRUGER, A.J. and BOTe~, J.L. (1983) 'n Raamwerk vir
toepassing van padbestuurstelseltegnieke in die Mlddelburg
distrik. Annual Transportation Convention, Johannesburg, 1983.
Digitised by the Open Scholarship Programme in support of public access to information, University of Pretoria, 2017

- 10.17 -
VISSER, A.T. and QUEIROZ, C.A.V. (1979) Research on the inter
relationships between costs of highway construction, maintenance and
utilisation: Progress Report: Details of pavement and maintenance
study sections: Working document No 9. GEIPOT, Brasilia, Brazil.
VISSER, A.T. and VAN NIEKERK, T. (1987) The implementation of
appropriate technology in the design of light pavement structures.
Transportation Research Record, 1106, Transportation Research Board,
Washington, DC, pp 222-231.
VON SOLMS, C.L. (1987) An interim specification for gravel wearing
courses in South West Africa. Materials Section, Dept of Transport,
Windhoek, 24pp.
WEINERT, H.H. (1980) The natural road construction materials of
southern Africa. Academica, Cape Town.
WORLD BANK (1985) Highway Design and Maintenance Standards Study.
World Bank, Washington, D.C.
Digitised by the Open Scholarship Programme in support of public access to information, University of Pretoria, 2017

- Al.l -
APPENDIX 1: MAINTENANCE AND ROAD USER COST ANALYSIS (1987 Rand)
Regravelling - each road once every 7 years on average (132 000 km I 7) X (R5 154/km) = R 97 189 714
Grader blading - each road once a month on average (132 000 km x 12) X (R40/km) R63 360 0006
TOTAL = Rl60 867 714
The calculated cost of maintaining the 29 745 km of unpaved roads in the Transvaal (21% of the South African total) would therefore be:
21 % of Rl60 867 714 R33 782 219/yr
The 1986/87 budget for the maintenance of unpaved roads in the Transvaal was R28 994 500. Therefore, (assuming the maintenance programmes of the various provinces are similar) the estimate of Rl60 867 714 for the provincial unpaved road network in South Africa would appear to be reasonably accurate.
Road user costs are difficult to quantify because of the effect of the variable traffic volumes on different routes. An estimate can, however, be made as follows:
Provincial unpaved roads Average daily traffic Average road roughness Vehicle operating costs (du Plessis & Rust, 1988)
132 000 75 vpd; 12 % heavy QI - 70 counts/km Cars: R491,20 per 1000 vehicle krn Trucks: Rll30,90 per 1000 veh km
Estimated annual vehicle operating cost = R2 052 338 000
If the roads are bladed 25 % less than the optimum frequency then the road user costs are increased by about 33,3 per cent (Visser, 198la): i.e. R2 735 766 554/yr.
If the roads are bladed 25 % more than the optimum frequency then the road user costs are decreased by about 33,3 per cent: i.e. Rl 366 857 108/yr.
Digitised by the Open Scholarship Programme in support of public access to information, University of Pretoria, 2017

-A2.1 -
APPENDIX 2: EXISTING SPECIFICATIONS
A summary of existing specifications is included in this appendix.
These are most of the specifications presently in use in southern
Africa and some of the more important ones which are probably used in
other developing countries.
Some rounding-off and metrication has been done in order to make the
various specifications more easily comparable. Most of the
specifications are complete other than neglecting qualitative
statements such as "hard, durable, angular gravels should be used".
Both the 1973 and 1983 specifications for the Transvaal are included
as most of the roads selected for the investigation were either
constructed or regravelled prior to 1983.
SPECIFICATIONS SUMMARISED Specification
TRH 14 (NITRR, 1985) Department of Transport (DOT, 19~8)
Department of Transport (DOT, 1985) Transvaal (TPA, 1973) Transvaal (TPA, 1983) Natal (NPA, ca 1985) Orange Free State (Van der Walt, 1973) Cape (Provincial Administration Cape of Good Hope, 1983) Fossberg (1963b) Netterberg (1978) South West Africa (Von Solms, 1987) Botswana 01inistry of works and communications, 1982) Lesotho (D T Tsekoa, 1986) Swaziland (J Shepherd, 1986) Rhodesia (Rhodesian Ministry of Roads, 1979) Malawi (Ministry of works and supplies, 1978) Transport and Road Research Laboratory (TRRL, 1981) AASHTO (1974) UNESCO ( 1971) NAASRA (1980)
Page
A2.2 A2.3 A2.4 A2.5 AZ.6 A2.. 7 A2.8 A2.9 A2.10 A2.11 A2.12 A2.13 A2.14 A2.15 A2.16 A2.17 A2.18 A2.19 A2.20 A2.21
Digitised by the Open Scholarship Programme in support of public access to information, University of Pretoria, 2017

- A2.2 -
AUTHORITY (Reference): TRH 14 (NITRR, 1985)
Maxinnn size: 50 mm but preferably 37,5 mm.
Sieve Size (mm)
37,5 26,5 19,0 13,2 9,5 4,75 2,00 0,425 0,075 0,053
Grading modulus Dust ratio
Limits of consistency
Liquid limit Plasticity index Linear shrinkage
Aggregate strength and durability
Material strength: CBR (%) CBR swell (%)
37,5
100 85-100 70-100 60-85
40-60 25-45 15-40
7-30
N < 5
8 - 14
% Pasaing
Nominal Size (lmD)
26,5 19,0
100 80-100 100 60-85 75.;.100
45-65 50-75 30-50 35-55 15-40 18-45
7-30 7-30
Climate
5 < N < 10
14 - 20
13,2
100
60-100 45-70 25-50
7-30
N > 10
14 - 20+
Relative compaction: ~ 93 percent Mod AASHTO density.
Coa:ments: For calcretes use specification of Netterberg (1978).
Digitised by the Open Scholarship Programme in support of public access to information, University of Pretoria, 2017

- A2.3 -
AUTHORITY (Reference): Department of Transport (1958)
Maximum size:
% Passing
Sieve Size Nominal Size (rnm)
(rnm)
Semi-sandl Gravel Sand-clay 1 clay
I
37,5 100 26,5 75-100 19,0 70-90 13,2 60-80 9,5 4,75 40-60 2,00 25-50 50-80 80-100 0,425 10-35 20-55 32-70 0,075 0,053 4-15 8-25 12-30
Grading modulus Dust ratio
"';'(
Material type Limits of consistency
1 2 3
Liquid limit (%) ::5 35 ::5 35 ::5 35 Plasticity index (%) 6 - 15 6 - 12 6 - 12 Linear shrinkage (%) ::5 7 ~ 4,5 ::5 4,5
Aggregate strength and durability ~ 25 % sodium sulphate loss after 5 cycles
Material strength: CBR (%) CBR swell (%)
Relative compaction:
* Comments: Material type 1 ~ gravel 2 - semi-sand clay 3 - sand-clay
Digitised by the Open Scholarship Programme in support of public access to information, University of Pretoria, 2017

- A2.4 -
AUTHORITY (Reference): Department of Transport (DOT, 1983)
Ma:imum size: 40 mm.
Sieve Size (mm)
37,5 26,5 19,0 13,2 9,5 4,75 2,00 0,425 0,075 0,053
Grading modulus Dust ratio
Limits of consistency
Liquid limit (%) Plasticity index Linear shrinkage
Aggregate strength and durability
Material strength:
(%) (%)
% Passing
Nominal Size (:1)
2:: 1,5
Climate
6-10+3(GM)
CBR (%) 2:: 45 at 95 percent Mod AASHO density CBR swell {%)
Relative compaction: 2:: 93 per cent Mod. AASHO density.
I
Comments: The GM may be reduced to 1,2 with the permission of the Engineer.
Digitised by the Open Scholarship Programme in support of public access to information, University of Pretoria, 2017

- A2.5 -
AUTHORITY (Reference): Transvaal (TPA, 1973)
Maximum size: 50 mm.
Sieve Size (mm)
37,5 26,5 19,0 13,2 9,5 4,75 2,00 0,425 0,075 0,053
Grading modulus Dust ratio
I Limits of consistency
Liquid limit (%)
Plasticity index Linear shrinkage
Aggregate strength and durability
Material strength:
(%) (%)
% Passing
Nominal Size
35-85 28-70 16-45 10-30
2:: 1,5 s 0,67
Climate
s 40 6 - 10+3(GM)
(mm)
CBR (%) 2:: 15 at 93 % Mod AASHO density. CBR swell (%)
Relative compaction: 2:: 93 % Mod AASHO density.
Comments: Grading Modulus may be reduced to 1,2 with engineers approval.
Digitised by the Open Scholarship Programme in support of public access to information, University of Pretoria, 2017

- A2.6 -
AUTHORITY (Reference): Transvaal Roads Dept. (TPA, 1983)
Maximum size: 40 mm.
Sieve Size (mm)
37,5 26,5 19,0 13,2 9,5 4,75 2,00 0,425 0,075 0,053
Grading modulus Dust ratio
Limits of consistency
Liquid limit (%) Plasticity index Linear shrinkage
Aggregate strength and durability
Material strength:
(%) (%)
% Passing
Nominal Size (lt:ll)
I 100
I
~ 1,5
Climate
6 - 10+3(GM)
CBR (%) ~ 45 at 93 % Mod AASHO density. CBR swell (%)
Relative campaction: ~ 93 % Mod AASHO density
Comments: Grading Modulus may be reduced to 1,2 with engineers approval.
Digitised by the Open Scholarship Programme in support of public access to information, University of Pretoria, 2017

- A2.7-
AUTHORITY (Reference): Natal Roads Department (NPA, ca 1985)
MaJtimum size: 100 mm.
% Passing
Sieve Size Nominal Size (mm) (mm)
37,5 I 26,5 THE S.AME AS TRH 14 19,0 13,2 9,5 4,75 2,00 0,425 0,075 0,053
Grading modulus Dust ratio
'
Climate Limits of consistency
Liquid limit 20 - 35 Plasticity index 6 - 15 Linear shrinkage
Aggregate strength and durability Los Angeles Abrasion 30 - 60 %.
Material strength: CBR (%) CBR swell (%)
Relative compaction: ~ 93 per cent Mod AASHO density.
Comments:
Digitised by the Open Scholarship Programme in support of public access to information, University of Pretoria, 2017

- A2.8 -
AUTHORITY (Reference): Orange Free State (Vander Walt, 1973)
Maximum size:
% Passing
Sieve Size Nominal Size (mm) (mm)
37,5 100 26,5 90-100 19,0 75-100 13,2 60-95 9,5 4, 75 35-85 2,00 25-70 0,425 20-45 0,075 15-30 j 0,053
Grading modulus <:! 1,5 j Dust ratio
Climate* Limits of consistency
1 2 3
Liquid limit (%) Plasticity index (%) 14 - 18 12 - 16 10 - 14 Linear shrinkage (%)
Aggregate strength and durability 10 % FACT <:! 135 kN ( <:! 90 kN in drier areas)
Material strength: CBR (%) CBR swell (%)
~ 25 % at 95 % relative compaction. ~ 1 %
Relative compaction:
* Comments: The province is climate. PI may be as high as west of the area.
divided into 3 regions depending on 20 for calcretes and 21 in the south
Digitised by the Open Scholarship Programme in support of public access to information, University of Pretoria, 2017

- A2.9 -
AUTHORITY (Reference): Cape Province (Provincial Administration of the Cape of Good Hope, 1983)
Max1mun size: 50 mm but preferably 37,5 mm.
Sieve Size (mm)
37,5 26,5 19,0 13,2 9,5 4,75 2,00 0,425 0,075 0,053
Grading modulus Dust ratio
Limits of consistency
Liquid limit (%) Plasticity index Linear shrinkage
Aggregate strength and durability
Material strength: CBR (%) CBR swell (%)
(%) (%)
% Passing
Nominal Size (mm)
37,5 26,5 19,0
26-45 30-50 35-55
7-30 7-30 7-30
Climate
dry wet
8 - 20+ 8 - 20
Relative compaction: ~ 95 % of Mod. AASHTO density.
13,2
45-70
7-30
Comments: In wet areas a lower PI is desirable. For pedogenic materials the upper limit of PI may be exceeded.
Digitised by the Open Scholarship Programme in support of public access to information, University of Pretoria, 2017

- A2.10 -
AUTHORITY (Reference): Fossberg (1963)
Maximum size:
Sieve Size (Dill)
37,5 26,5 19,0 13,2 9,5 4,75 2,00 0,425 0,075 0,053
Grading modulus Dust ratio
Limits of consistency
Liquid limit (%) Plasticity index Linear shrinkage
Aggregate strength and durability
Material strength: CBR (%) CBR swell (%)
(%) (%)
Relative compaction:
Ccmments:
% Psssing
Nominal Size
Lower Upper
100 70-100 100
50-80 80-100 35-65 65-85 25-50 50-70 13-30 30-50
5-15 15-30
Climate
I Lower Upper
6 - 8 8 - 20
(mm.)
Digitised by the Open Scholarship Programme in support of public access to information, University of Pretoria, 2017

- A2 .11 -
AUTHORITY (Reference): Netterberg (1978).
Netterberg devised these specifications from in-service materials and departs from the traditional method of specifying grading envelopes and plasticity reqirements. The specification of various properties depends on the fraction passing 0,425 mm as follows.
% Passing 0,425 mm
Sieve Size (rom)
20-40 41-50 51-60 61-75
Maximum size (rom) 53 53 53 38 Liquid limit (%) 30-65 22-48 22-40 18-36 Plasticity index (%) 9-22 7-23 5-13 8-13 Bar linear shrink (%) 2,0-9,5 2,7-9,0 2,0-5,5 2,0-5,0 Linear shrinkage x
% < 0,425 mm 70-340 130-395 100-320 130-330 Min AFV (%) 65 60 35 40 Min APV (%) 20 20 15 -
Comments: Linear shrinkages between 2,0 and 2,7 and values of the_ linear shrinkage x % passing 0,425 mm between 70 and 100 may cause looseness and dust. A minimum APV of 14 is permissible if the AFV > 75.
Digitised by the Open Scholarship Programme in support of public access to information, University of Pretoria, 2017

- A2.12 -
AUTHORITY (Reference):South West Africa (L von Solms, 1987)
37 mm if N < 10 ; 25 mm if N >10
Sieve Size (mm)
37,5 26,5 19,0 13,2 9,5 4,75 2,00 0,425 0,075 0,053
Grading modulus Dust ratio
Limits of consistency
Liquid limit (%) Plasticity index Linear shrinkage
Aggregate strength and durability
Material strength:
(%) (%)
% Paaaing
Nominal Size
1,1-1,9
Climate
I N < 10 N > 10
6 - 15 4 - 18
(mm)
CBR (%) ~ 25 but preferably ~ 45 if N < 10. CBR swell (%)
Relative compaction: ~ 95 per cent Mod AASHO.
KAlahari
4 - 20
Comments: It is important to get the right combination of Grading Modulus and PI. For roads with less than 75 vpd the grading modulus may go up to 1,9, a per cent passing 0,075 mm of 15-40 and fineness index of 50-400 is preferred. If N < 10 the minimum grading modulus should be 1,5 with a minimum of 20 per cent passing 0,075 mm and a minimum fineness index of 150.
Digitised by the Open Scholarship Programme in support of public access to information, University of Pretoria, 2017

- A2.13 -
AUTHORITY (Reference): Botswana (Ministry of Works and Comm., 1982)
Maximvn size: 20 mm but up to 20 Z may be between 20 and 38 mm.
% Passing
Sieve Size Nominal Size (mm) (mm.)
19,0 13,2 4,75
37,5 26,5 19,0 100 13,2 90-100 100 9,5 4,75 60-85 75-100 100 2,00 45-70 50-75 80-100 0,425 25-40 25-45 20-45 0,075 10-25 10-25 10-25 0,053
Grading modulus (min) 1,6 1,55 1,3 Dust ratio
Climate Limits of consistency
All areas
Liquid limit ~ 55 Plasticity index 15 - 30 Linear shrinkage 8 - 15
Aggregate strength and durability 10 % FACT ~ 50 kN or modified AIV ~ 40%.
Material strength: CBR (%) CBR swell (%)
Relative compaction: ~ 95 per cent MOd. AASHO density.
Comments: Not less than 10 per cent should be retained on successive sieves, except the largest pair. For calcretes the specification of Netterberg (1978) should be used.
Digitised by the Open Scholarship Programme in support of public access to information, University of Pretoria, 2017
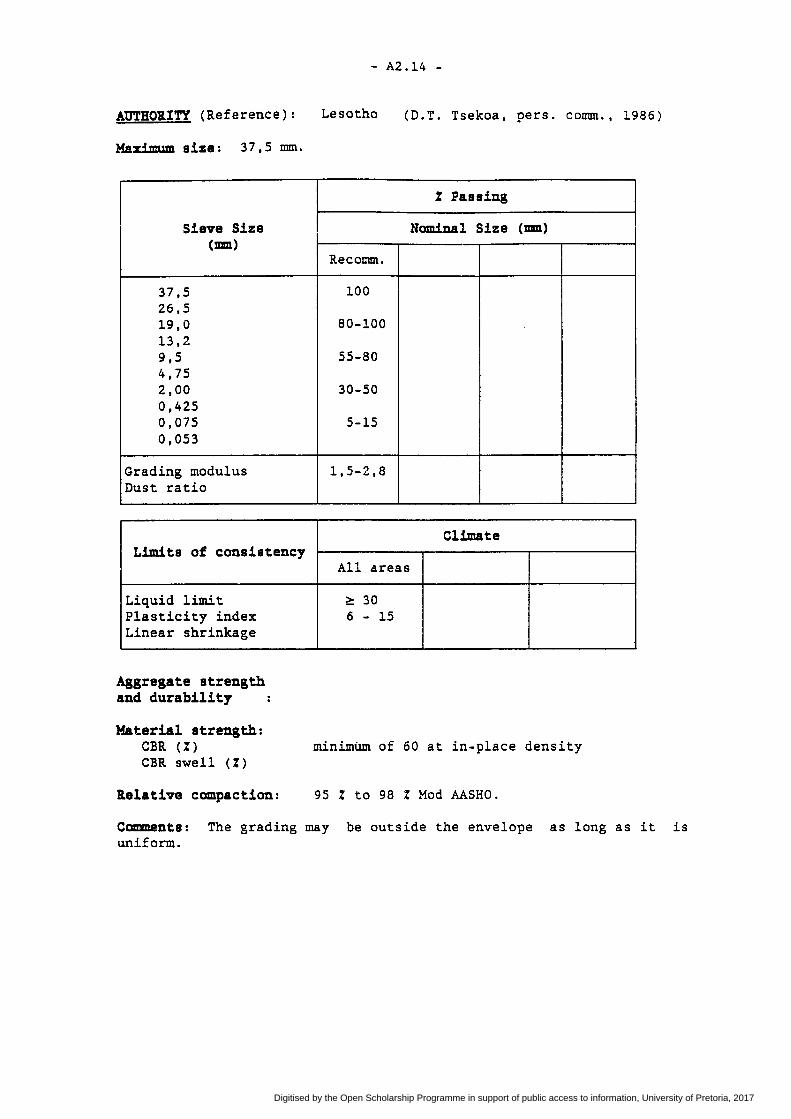
AUTHORITY (Reference):
Maximum size: 37,5 mm.
Sieve Size (mm)
37,5 26,5 19,0 13,2 9,5 4,75 2,00 0,425 0,075 0,053
Grading modulus Dust ratio
Limits of consistency
Liquid limit Plasticity index Linear shrinkage
Aggregate strength and durability
Material strength: CBR (%) CBR swell (%)
Relative compaction:
- A2.14 -
Lesotho (D.T. Tsekoa, pers. comm., 1986)
% Passing
Nominal Size (mm)
Recomm.
100
80-100
55-80
30-50
5-15
1,5-2,8
Climate
All areas
~ 30 6 - 15
minimum of 60 at in-place density
95 % to 98 % Mod AASHO.
Comments: The grading may be outside the envelope as long as it is uniform.
Digitised by the Open Scholarship Programme in support of public access to information, University of Pretoria, 2017
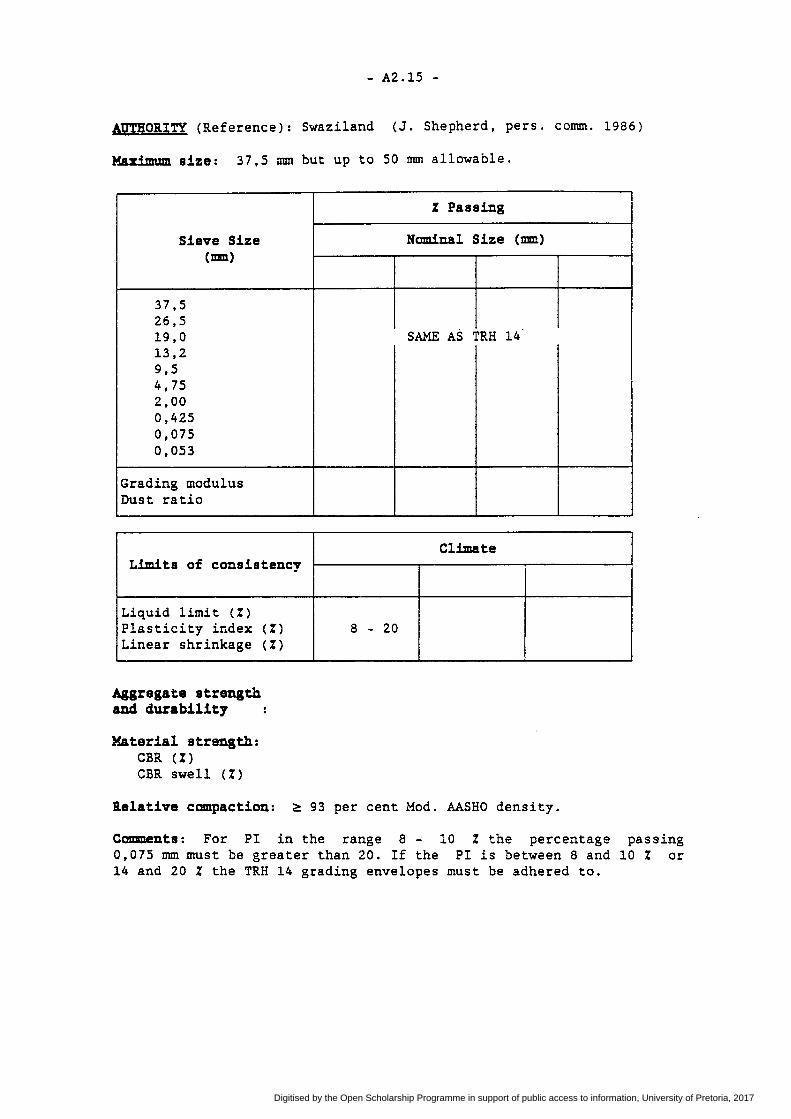
- A2.15 -
AUTHORITY (Reference): Swaziland (J. Shepherd, pers. comm. 1986)
Maz±mum size: 37,5 mm but up to 50 mm allowable.
Sieve Size (Dill)
37,5 26,5 19,0 13,2 9,5 4,75 2,00 0,425 0,075 0,053
Grading modulus Dust ratio
Limits of consistency
Liquid limit (%)
Plasticity index Linear shrinkage
Aggregate strength and durability
Material strength: CBR (%) CBR swell (%)
(%)
(%)
% Passing
Nominal Size (mm)
SAME AS TRH 14
Climate
8 - 20
Relative compaction: ~ 93 per cent Mod. AASHO density.
Comments: For PI in the range 8 - 10 % the percentage passing 0,075 mm must be greater than 20. If the PI is between 8 and 10 % or 14 and 20 % the TRH 14 grading envelopes must be adhered to.
Digitised by the Open Scholarship Programme in support of public access to information, University of Pretoria, 2017

- A2.16 -
AUTHORITY (Reference): Rhodesia (1979)
Max~mum size:
Sieve Size (mm)
37,5 26,5 19,0 13,2 9,5 4,75 2,00 0,425 0,075 0,053
Grading modulus Dust ratio
Li=itz of consistency
Liquid limit (%) Plasticity index Linear shrinkage
Aggregate strength and durability
Material strength: CBR (%) CBR swell (%)
(%) (%)
Relative compaction:
Comments:
% Passing
Nominal Size (mm)
1,5-2,5
Climate
I < 70
10(GM-0,25)- 15(GM-0,"%)
Digitised by the Open Scholarship Programme in support of public access to information, University of Pretoria, 2017

- A2.17 -
AUTHORITY (Reference): Malawi (Ministry of Works, 1978)
Ma:z .. fnun size: 20 mm.
Sieve Size (mm)
37,5 26,5 19,0 13,2 9,5 4,75 2,36 0,300 0,075 0,053
Grading modulus Dust ratio
Limits of consistency
Liquid limit (%) Plasticity index Linear shrinkage
Aggregate strength and durability
Material strength: CBR (%) CBR swell (%)
(%) (%)
Relative compaction:
% Passing
Nominal Size {mm)
100
80-100 60-85 45-70 20-40 10-25
Climate
:S 40 ~ 8
Comments: The fineness index (PI x Passing 0,075 mm) shall not exceed 600.
Digitised by the Open Scholarship Programme in support of public access to information, University of Pretoria, 2017

- A2.18 -
AUTHORITY (Reference): TRRL (TRRL, 1981)
Maximum size:
Sieve Size (mm)
37,5 26,5 19,0 13,2 9,5 4,75 2,00 0,425 0,075 0,053
Grading modulus Dust ratio
Limits of consistency
Liquid limit (%) Plasticity index Linear shrinkage
Aggregate strength and durability
Material strength: CBR (%) CBR swell (%)
(%) (%)
Relative compaction:
19,0
100
80-100 60-85 45-70 25-45 10-25
1
:S 35 4 - 9 2 - 5
% Passing
Nominal Size (mm)
9,5 4,75
100 80-100 100 50-80 80-100 25-45 30-60 10-25 10-25
Climate *
2
:S 45 6 - 20 3 - 10
3
:S 55 15 - 30
8 - 15
Comments: > 10 % retained between each pair of sieves except the last pair. Nominal size 9,5 and 4,75 may have up to 35 per cent> 38 mm provided the passing 4,75 is within the limits.
* Zone 1 - Moist tropical to wet tropical - PT .<\nd LL !!'.ay be higher for concretionary materials.
Zone 2 - Seasonally wet tropical Zone 3 - Arid and semi-arid
Digitised by the Open Scholarship Programme in support of public access to information, University of Pretoria, 2017

- A2.19 -
AUTHORITY (Reference): AASHTO (AASHTO, 1974)
Maximum size:
% Passing
Sieve Size Nominal Size (Dm) (Dm)
37,5 26,5 100 19,0 13,2 9,5 50-85 60-100 4,75 35-65 50-85 55-100 70-100 2,00 25-50 40-70 40-100 55-100 0,425 15-30 25-45 20-50 30-70 0,075 8-15 8-20 8-20 8-25 0,053
Grading modulus Dust ratio s 2/3 s 2/3 s 2/3 s 2/3
Climate Limits of consistency
Liquid limit (%) s 35 Plasticity index (%) 4 - 9 Linear shrinkage (%)
Aggregate strength and durability Los Angeles Abrasion value not exceeding 50.
Material strength: CBR (%) CBR swell (%)
Relative compaction:
Comments:
Digitised by the Open Scholarship Programme in support of public access to information, University of Pretoria, 2017

- A2.20 -
AUTHORITY (Reference): UNESCO (UNESCO, 1971).
Maximum size: 19 mm.
Sieve Size (mm)
37,5 26,5 19,0 13,2 9,5 4,75 2,00 0,425 0,075 0,053
Grading modulus Dust ratio
Limits of consistency
Liquid limit (%) Plasticity index Linear shrinkage
Aggregate strength and durability
Material strength: CBR (%) CBR swell (%)
(%) (%)
Relative compaction:
% Passing
Nominal Size (mm)
19 9,5 4,75
100
80-100 100 60-85 80-100 100 45-70 50-80 80-100 25-45 25-45 30-60 10-25 10-25 10-25
Climate
1 2
::; 35 ::; 40 4 - 9 6 - 15 2 - 4 3 - 7
3
::; 55 15 - 30
7 - 14
Comments: Not less than 10 % should be retained between each pair of sieves except the largest pair. Up to 35 % of stones larger than 38mm may occur in the 9,5 and 4,75 mm nominal size material provided that the material passing 4,75 mm is within the limits. The ~limatic zones are:
Zone 1 - moist temperate and iJet tropical Zone 2 - seasonal wet tropical Zone 3 - arid
Digitised by the Open Scholarship Programme in support of public access to information, University of Pretoria, 2017

- A2.21 -
AUTHORITY (Reference): NAASRA (1980)
Maxi mum size :
Sieve Size (Dill)
37,5 26,5 19,0 13,2 9,5 4,75 2,00 0,425 0,075 0,053
Grading modulus Dust ratio
Limits of consistency
Liquid limit (%) Plasticity index Linear shrinkage
Aggregate strength and durability
Material strength:
(%) (%)
% Passing
Nominal Size (mm)
DEPENDS ON MAXIMUM SIZE
Annual rainfall (Dill)
< 400 > 400
:S 35 :S 35 4 - 15 4 - 9
:S 6 :S 3
CBR (%) ~ 60 at expected in-situ moisture and density CBR swell (%)
Relative compaction:
Comments: Maximum dry compressive strength at least 2,8 MPa.
Digitised by the Open Scholarship Programme in support of public access to information, University of Pretoria, 2017

-A3.1 -
APPENDIX 3a SUMMARY OP STRATIGRAPHIC UNITS AND LITHOLOGY
Section
1 2 3 4 5 6 7 8 9
10 11 12 13 14 15 16 18 19 20 21 22 23 24 25 26 27 28 29 30 31 32 33 34 35 36 37 38 39 40 41 42 43 44 45 46 47 48 49
Stratigraphic unit
Silverton Shale Formation Silverton Shale Formation Post Cretaceous on Dwyka Form Post Cretaceous on Ecca Form Malmani Subgroup Malmani Subgroup Letaba Formation Letaba Formation Lebowa Granite Suite Lebowa Granite Suite Alma Graywacke Formation Alma Graywacke Formation Post Cretaceous on Irrigasie Form Rustenburg Layered Suite Rustenburg Layered Suite Post Cretaceous on Vryheid Form Vaalian Intrusives Silverton Shale Formation Silverton Shale Formation Undifferentiated Pretoria Group Malmani Subgroup Malmani Subgroup Nelspruit Granite Kaap Valley Granite Kaap Valley Granite Post Cretaceous on Vryheid Form Vryheid Formation Karoo Sequence Intrusives Karoo Sequence Intrusives Post Cretaceous on Vryheid Form Undifferentiated Pretoria Group Hospital Hill Subgroup Karoo Sequence Intrusives Undifferentiated Witwatersrand SG Makwassie Formation Recent lake deposit Post Cretaceous on Vryheid Form Vryheid Fo~~tion Vryheid Formation Allanridge Formation Undifferentiated Swazian Intrusiv Undifferentiated Swazian Intrusiv Post Cretaceous on Allanridge Fm Kareefontein Formation Post Cretaceous on Allanridge Fm Allanridge Formation Post Cretaceous on Allanridge Fm Undifferentiated Swazian Intrusiv
Lithology
Shale Shale Ferric rete Ferricrete Chert Chert Amygdaloidal basalt Amygdaloidal basalt Granite Granite Sandstone Sandstone Calcrete Ferrodiorite Norite/anorthosite Ferricrete Diabase Shale Shale Shale/mudrock Chert Chert Granite Hornblende granite Hornblende granite Ferric rete Grit stone Dolerite Dolerite Ferricrete Sandstone/shale Shale/sandstone Dolerite Sandstona/shale Quartz porphyry Mudstone Ferricrete Sandstone Sandstone/calcrete Andesite Granite/gneiss Granite/gneiss Calcrete Quartz !>Or!'hyry Calcrete Andesite Calcrete Granite/gneiss
Digitised by the Open Scholarship Programme in support of public access to information, University of Pretoria, 2017

-A3.2 -
APPENDIX 3 (cont)l SUMMARY OF STRATIGRAPHIC UNITS AND LITHOLOGY
Section Stratigraphic unit Lithology
901 Kuiseb Formation Mica schist 902 Kuiseb Formation Mica schist 903 Kuiseb Formation Mica schist/quartzite 904 Mulden Group Phyllite/hornfels 905 Post Cret. on Mulden Group Calcrete 906 Post Cret. on Mulden Group Calcrete 907 Post Cret. on Damara Sequence Calcrete 908 Kamtsas Formation Conglomerate 909 Post Cret. on Kamtsas Form Calcrete/hornfels 910 Kuibis Subgroup Shale/hornfels 911 Kuibis Subgroup Hornfels/calcrete 912 Post Cret. on Kuibis Subgroup Calcrete 913 Kuibis Subgroup Shale/hornfels 914 Post Cret. on Kamtsas Form Hornfels/calcrete 915 Post Cret. on Kamtsas Form Calcrete 916 Kuibis Subgroup Shale/hornfels 917 Kuibis Subgroup Shale/hornfels 918 Post Cret. on Mulden Group Calcrete 919 Post Cret. on Mulden Group Calcrete
Digitised by the Open Scholarship Programme in support of public access to information, University of Pretoria, 2017

- A4.1 -
APPENDIX 4: INFLUENCE OF ROUGHNESS ON FOREIGN EXCHANGE
In order to analyse the influence of the roughness of unpaved roads on foreign exchange transactions in South Africa a number of assumptions and estimations were necessary:
• The total unpaved road network in southern Africa was estimated at 200 000 km (provincial, national states, parks and industry).
• Each road was assumed to carry 50 vehicles per day of which 10 were classed as medium trucks (i.e. Tare weight 5 400 kg).
• The average road roughness at present was 100 QI counts/km and use of the proposed specifications would result in an average roughness of not more than 60 counts/km.
The average annual distance travelled would there-fore be:
Cars - 200 000 x 40 x 365 Trucks - 200 000 x 10 x 365 ~
2 920 000 000 730 000 000
The road user costs (per 1000 vehicle km) at a roughness of 100 and 60 counts/km were (after duPlessis et al, 1987):
Fuel
Cars Trucks -
QI ~ 100 cnts/km R 570,10
1381,70
QI = 60 cnts/km R 471,92
1046,95
For cars, at QI 100 fuel makes up 9,2 per cent of the total operating cost and at QI = 60, 10,8 per cent. For trucks these figures are 9,1 and 7,0 respectively.
Therefore, cost of fuel:
Cars Trucks Total
Saving
Lubricants
OI =- 100 R 153 151 664
76 656 716 229 808 380
Rll 434 800
For cars, at QI = 60 and 100 total operating cost. For respectively.
QI - 60 R 148 824 691
69 548 889 218 373 580
lubricants makes up 1,2 per cent of trucks these figures are 0,9 and
Therefore, cost of lubricants:
QI "" 100 QI =- 60 Cars R 19 972 800 R 16 527 200 Trucks 8 066 500 6 876 600 Total 28 039 300 23 403 800
Saving R4 635 500
the 0,8
Digitised by the Open Scholarship Programme in support of public access to information, University of Pretoria, 2017

- A4.2 -
Tyres
For cars, at QI 100 tyres make up 2,2 per cent of the total operating cost and at QI- 60, 2,1 per cent. For trucks these figures are 7,6 and 7,5 respectively.
Therefore, cost of tyres:
QI = 100 QI = 60 Cars R 36 623 224 R 28 938 134 Trucks 75 648 075 58 084 786 Total 102 271 299 87 022 920
Saving - RlS 248 379
Maintenance parts
For cars, at QI - 100 maintenance parts make up 24,1 per cent of the total operating cost and at QI- 60, 16,9 per cent. For trucks these figures are 36,7 and 29,7 respectively.
Therefore, cost of maintenance parts:
Cars Trucks Total
QI - 100 R 401 190 772
370 171 019 771 362 019
Saving = R289 441 605
QI = 60 R 254 931 184
226 989 230 481 920 414
Digitised by the Open Scholarship Programme in support of public access to information, University of Pretoria, 2017
Copyright © 2022 FDOKUMEN