The influence of copper coating on the fume formation rate of ...
145
University of Wollongong Research Online University of Wollongong esis Collection University of Wollongong esis Collections 2012 e influence of copper coating on the fume formation rate of carbon steel welding wire during the gas metal arc welding process Nicolaas Christian Bothma University of Wollongong Research Online is the open access institutional repository for the University of Wollongong. For further information contact the UOW Library: [email protected] Recommended Citation Bothma, Nicolaas Christian, e influence of copper coating on the fume formation rate of carbon steel welding wire during the gas metal arc welding process, Doctor of Philosophy thesis, School of Mechanical, Materials and Mechatronic Engineering, University of Wollongong, 2012. hp://ro.uow.edu.au/theses/3761
-
Upload
khangminh22 -
Category
Documents
-
view
2 -
download
0
Transcript of The influence of copper coating on the fume formation rate of ...
University of WollongongResearch Online
University of Wollongong Thesis Collection University of Wollongong Thesis Collections
2012
The influence of copper coating on the fumeformation rate of carbon steel welding wire duringthe gas metal arc welding processNicolaas Christian BothmaUniversity of Wollongong
Research Online is the open access institutional repository for theUniversity of Wollongong. For further information contact the UOWLibrary: [email protected]
Recommended CitationBothma, Nicolaas Christian, The influence of copper coating on the fume formation rate of carbon steel welding wire during the gasmetal arc welding process, Doctor of Philosophy thesis, School of Mechanical, Materials and Mechatronic Engineering, University ofWollongong, 2012. http://ro.uow.edu.au/theses/3761

THE INFLUENCE OF COPPER COATING ON
THE FUME FORMATION RATE OF CARBON
STEEL WELDING WIRE DURING THE
GAS METAL ARC WELDING PROCESS
A thesis submitted in fulfilment of the requirements for the award of the degree
DOCTOR OF PHILOSOPHY
UNIVERSITY OF WOLLONGONG
NICOLAAS CHRISTIAN BOTHMA
FACULTY OF ENGINEERING
SCHOOL OF MECHANICAL, MATERIALS AND MECHATRONICS
2012
ii
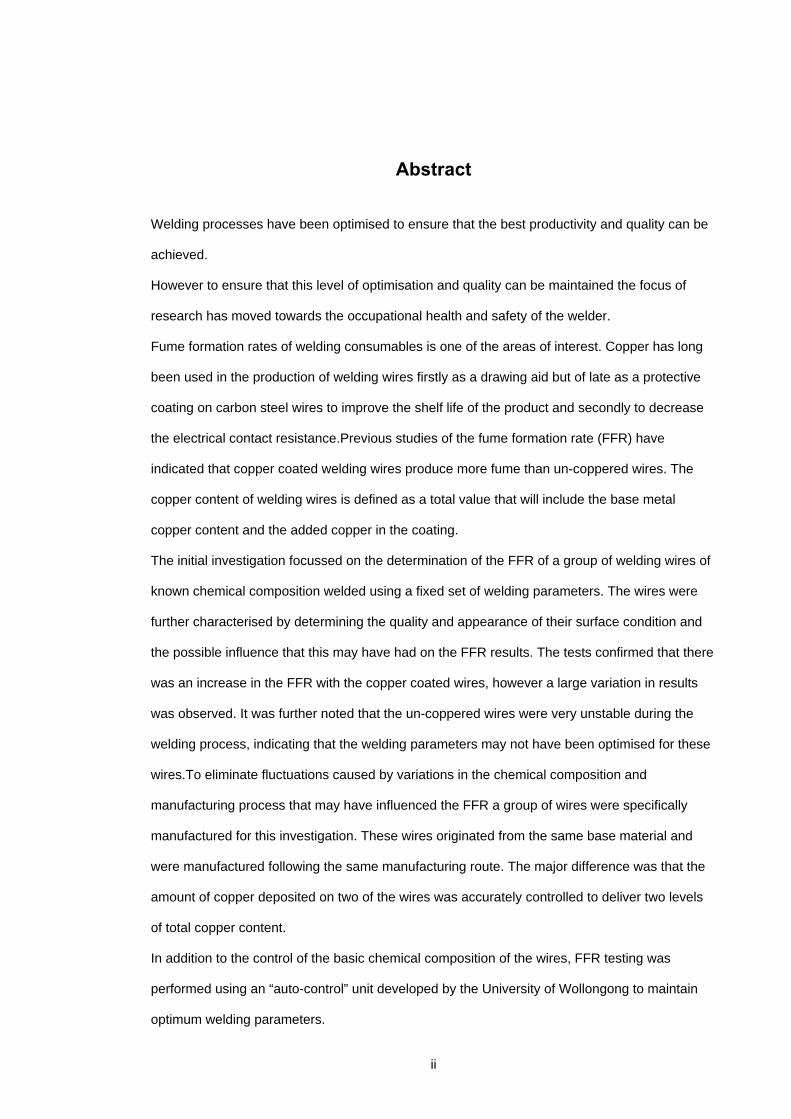
Abstract
Welding processes have been optimised to ensure that the best productivity and quality can be
achieved.
However to ensure that this level of optimisation and quality can be maintained the focus of
research has moved towards the occupational health and safety of the welder.
Fume formation rates of welding consumables is one of the areas of interest. Copper has long
been used in the production of welding wires firstly as a drawing aid but of late as a protective
coating on carbon steel wires to improve the shelf life of the product and secondly to decrease
the electrical contact resistance.Previous studies of the fume formation rate (FFR) have
indicated that copper coated welding wires produce more fume than un-coppered wires. The
copper content of welding wires is defined as a total value that will include the base metal
copper content and the added copper in the coating.
The initial investigation focussed on the determination of the FFR of a group of welding wires of
known chemical composition welded using a fixed set of welding parameters. The wires were
further characterised by determining the quality and appearance of their surface condition and
the possible influence that this may have had on the FFR results. The tests confirmed that there
was an increase in the FFR with the copper coated wires, however a large variation in results
was observed. It was further noted that the un-coppered wires were very unstable during the
welding process, indicating that the welding parameters may not have been optimised for these
wires.To eliminate fluctuations caused by variations in the chemical composition and
manufacturing process that may have influenced the FFR a group of wires were specifically
manufactured for this investigation. These wires originated from the same base material and
were manufactured following the same manufacturing route. The major difference was that the
amount of copper deposited on two of the wires was accurately controlled to deliver two levels
of total copper content.
In addition to the control of the basic chemical composition of the wires, FFR testing was
performed using an “auto-control” unit developed by the University of Wollongong to maintain
optimum welding parameters.

iii
The results of this testing indicated that the increase in FFR for coppered wires varied from 18%
to 32%. The second part of the investigation concentrated on finding an explanation for the
increased FFR as a result of increased copper content in the welding wire. Several hypothesis
were developed and tested and the most likely explanation for the increase in the FFR seemed
to be related to the increase in the droplet temperature between a copper coated and uncoated
welding wire. This increase in temperature would lead to a higher evaporation rate with a
resultant increase in the FFR. The thesis explores possible reasons for an increase in
temperature.

University of Wollongong
Thesis Declaration
This is to certify that I, Nicolaas Christian Bothma, being a candidate for the degree of Doctor
of Philosophy, am fully aware of the University of Wollongong’s rules and procedures relating
to the preparation, submission, retention and use of higher degree theses, and its policy on
intellectual property.
I acknowledge that the University requires the thesis to be retained in the Library, and that
within copyright privileges of the author, it should be accessible for consultation and copying
at the discretion of the Library officer in charge and in accordance with the Copyright Act
(1968)
I authorise the University of Wollongong to publish and abstract of this thesis.
I declare that the work reported in this thesis is my own, except where explicitly specified and
referenced. I further declare that this thesis has not been submitted for a degree at any other
university or institution
Signed: N Bothma
Dated: 31 January 2013

v
Acknowledgements
I would like to thank Professor John Norrish and Associate Professor Brian Monaghan for the
guidance, assistance and knowledge that they shared during the course of this study. I also
want to thank Prof Manabu Tanaka and his team, Hiroshi Sawato, Kuniyoshi Ito, Tsubasa
Katayama and Yoshihiro Tsujimura from the JWRI at the University of Osaka, Japan for their
valuable assistance during the experimental work performed at this facility. I am indebted to Dr
Kristin Carpenter and Dr Zoran Sterjovski for the assistance during the experimental work, and
Mr Bruce Cannon of Bluescope steel for the assistance in the determination of the chemical
composition of the welding wires used during this investigation. To Dr Dominic Cuiuri for the
development of the “auto-control “ unit which proved to be critical to the outcome of this
investigation, I thank you.
To Mr Grant Wise of the Afrox Consumable factory in South Africa for the production of the
controlled sample group of welding wires, I thank you.
Thank you to my work colleagues and especially Alistair Forbes that had assisted me in
preparing this thesis, and in the process had to endure my many hours of sharing thoughts and
progress reports, your assistance was invaluable.
Most importantly, I wish to convey my immeasurable gratitude to my wife Ludi and children
Vicole and Marnus. Without their constant support and encouragement I would not have been
able to learn, achieve success and most of all enjoyed this experience. Your support meant the
world to me. Thank you.

vi
Table of Contents
Abstract ............................................................................................................................................ i)
Declaration ....................................................................................................................................... ii)
Acknowledgments ............................................................................................................................ iii)
Contents ........................................................................................................................................... iv)
Nomenclature................................................................................................................................... v)
List of figures
List of tables
T1.0 Introduction T .....................................................................................................1
T1.1 BackgroundT ............................................................................................................................1
T1.2 Aims of the researchT...............................................................................................................2
T1.3 Brief overview of the thesis T ....................................................................................................2
T2.0 Literature ReviewT ............................................................................................4
T2.1 Introduction to weldingT ...........................................................................................................4
T2.1.1 IntroductionT ......................................................................................................................4
T2.1.2 Gas metal arc welding ( GMAW)T .....................................................................................6
T2.1.3 MIG/MAG welding operationT............................................................................................7
T2.1.4 Modes of metal transferT ...................................................................................................9
T2.1.4.1 ClassificationT .............................................................................................................9
T2.1.4.2 Short circuiting transfer (Dip Transfer) T ......................................................................12
T2.1.4.3 Globular metal transferT..............................................................................................13
T2.1.4.4 Spray transferT............................................................................................................14
T2.1.4.5 Rotating sprayT ...........................................................................................................15
T2.1.4.6 Streaming sprayT ........................................................................................................15
T2.1.4.7 Drop spray transferT ...................................................................................................16
T2.1.5 Physics of metal transfer T .................................................................................................18
T2.1.5.1 IntroductionT................................................................................................................18
T2.1.5.2 Gravitational forceT .....................................................................................................19

vii
T2.1.5.3 Aerodynamic drag.T ....................................................................................................20
T2.1.5.4 Electromagnetic forcesT..............................................................................................20
T2.1.5.5 Vapour jet forcesT .......................................................................................................21
T2.1.5.6 Surface tensionT .........................................................................................................22
T2.1.6 Welding wire production T ..................................................................................................25
T2.1.7 SummaryT..........................................................................................................................31
T2.2 Fume formation during WeldingT .............................................................................................33
T2.2.1 Source of welding fume T ...................................................................................................33
T2.2.2 Sources of fume formationT...............................................................................................34
T2.2.3 Burn off rateT .....................................................................................................................36
T2.2.4 Sources of fume formationT...............................................................................................37
T2.2.4.1 Molten at tip of wire T ...................................................................................................38
T2.2.4.2 Droplet transfer and temperature T ..............................................................................39
T2.2.4.3 Weld poolT ..................................................................................................................39
T2.2.4.4 Ejected spatterT ..........................................................................................................39
T2.2.5 Factors affecting fume formation rateT ..............................................................................39
T2.2.5.1 Time related parameters T ...........................................................................................39
T2.2.5.2 Temperature related parametersT ..............................................................................40
T2.2.5.3 Droplet temperature T ..................................................................................................41
T2.2.5.4 Welding transfer modeT ..............................................................................................44
T2.2.5.5 Composition (Shielding gas)T .....................................................................................45
T2.2.5.6 Composition (Welding consumables)T .......................................................................47
T2.2.6 Effect of metal vapour in arc welding T...............................................................................49
T2.2.7 SummaryT..........................................................................................................................51
T3.0 Experimental Equipment and MethodologyT ....................................................54
T3.1 ScopeT .....................................................................................................................................54
T3.2 IntroductionT .............................................................................................................................54
T3.3 Welding apparatusT..................................................................................................................54
T3.4 Wire characterisationT..............................................................................................................57
T3.4.1 Wire composition.T ............................................................................................................57
viii
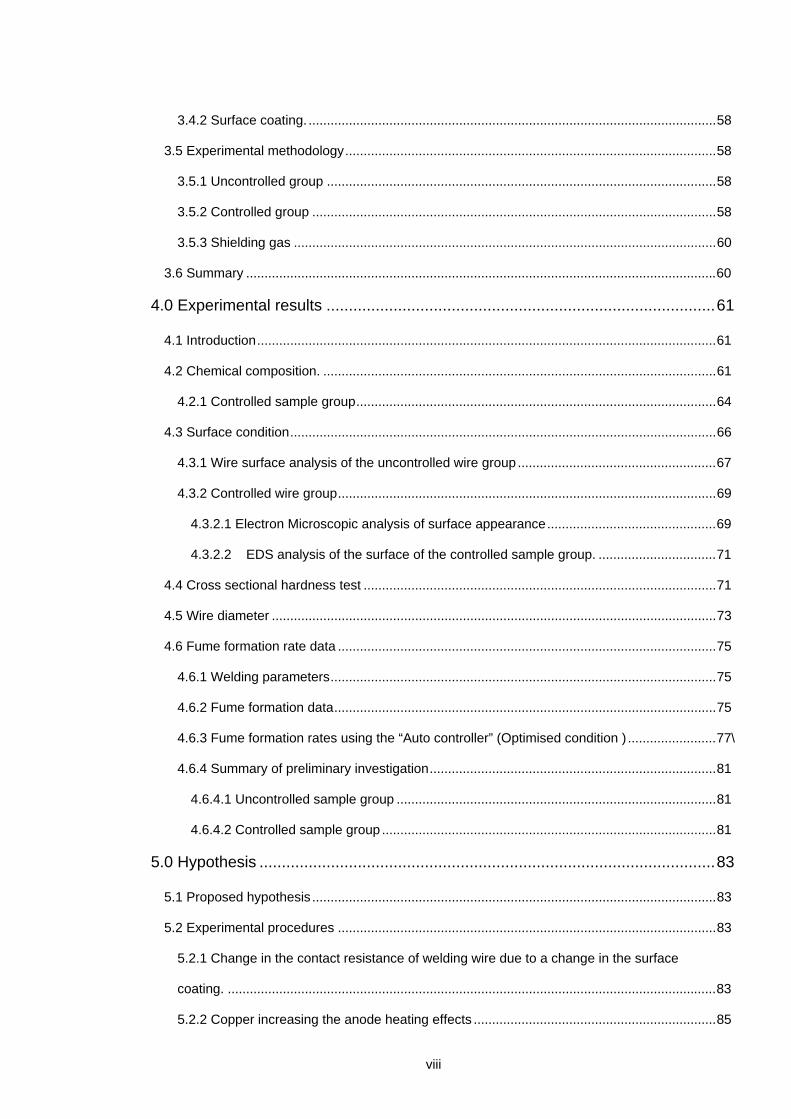
T3.4.2 Surface coating.T ...............................................................................................................58
T3.5 Experimental methodologyT .....................................................................................................58
T3.5.1 Uncontrolled groupT ..........................................................................................................58
T3.5.2 Controlled groupT ..............................................................................................................58
T3.5.3 Shielding gasT ...................................................................................................................60
T3.6 SummaryT ................................................................................................................................60
T4.0 Experimental results T .......................................................................................61
T4.1 IntroductionT .............................................................................................................................61
T4.2 Chemical composition. T ...........................................................................................................61
T4.2.1 Controlled sample groupT..................................................................................................64
T4.3 Surface conditionT....................................................................................................................66
T4.3.1 Wire surface analysis of the uncontrolled wire group T ......................................................67
T4.3.2 Controlled wire groupT.......................................................................................................69
T4.3.2.1 Electron Microscopic analysis of surface appearanceT ..............................................69
T4.3.2.2 EDS analysis of the surface of the controlled sample group. T ................................71
T4.4 Cross sectional hardness testT ................................................................................................71
T4.5 Wire diameterT .........................................................................................................................73
T4.6 Fume formation rate data T .......................................................................................................75
T4.6.1 Welding parametersT.........................................................................................................75
T4.6.2 Fume formation dataT........................................................................................................75
T4.6.3 Fume formation rates using the “Auto controller” (Optimised condition )T ........................77T\T
T4.6.4 Summary of preliminary investigation T..............................................................................81
T4.6.4.1 Uncontrolled sample groupT .......................................................................................81
T4.6.4.2 Controlled sample groupT ...........................................................................................81
T5.0 Hypothesis T ......................................................................................................83
T5.1 Proposed hypothesisT ..............................................................................................................83
T5.2 Experimental proceduresT .......................................................................................................83
T5.2.1 Change in the contact resistance of welding wire due to a change in the surface
coating.T .....................................................................................................................................83
T5.2.2 Copper increasing the anode heating effects T ..................................................................85

ix
T5.2.3 Droplet temperatureT .........................................................................................................86
T5.2.3.1 Test conditionsT........................................................................................................87
T5.2.4 The presence of copper will change the surface tension. T ...............................................89
T5.2.5 There is copper intrusion into the microstructure of the steel. T.........................................90
T5.3 ResultsT....................................................................................................................................92
T5.3.1 Change in the contact resistance of welding wire due to a change in the surface
coatingT.......................................................................................................................................92
T5.3.2 Copper increasing the arc temperatureT ...........................................................................93
T5.3.3 Droplet temperatureT .........................................................................................................95
T5.3.4 The presence of Copper will change the surface tensionT................................................98
T5.3.5 Copper intrusion into the microstructure of the steel T .......................................................100
T6.0 DiscussionT.......................................................................................................104
T6.1 Discussion of Results T .............................................................................................................104
T6.2 Results of the preliminary investigation T..................................................................................104
T6.3 Resultsf the second phase of the investigation ( Controlled sample group)T ..........................107
T6.4 Results of the investigation into the mechanisms that causes an increase in FFR of
coppercoated wiresT ......................................................................................................................110
T6.5 Recommendations for further work T ........................................................................................118
T7.0 Conclusions T ....................................................................................................119

xi
Table of figures
TFigure 1 Consumable sale by process in Western Europe [Svetsarin
Magazine(Vol59,2004)]T ................................................................................................ 5
TFigure 2 Deposited weld metal by country[Svetsarin Vol 59 2004]T .................................... 6
TFigure 3 Illustration of the MIG welding arc[BOC 2007]T ..................................................... 7
TFigure 4 MIG/MAG welding equipment set up [BOC 2007]T ................................................ 8
TFigure 5 Illustration of terminology used in MIG/MAG welding operation[BOC 2007]T...... 8
TFigure 6 Classification of modes of metal transfer IIW 2006 (Quebec)T .............................. 10
TFigure 7 Typical transfer modes in relation to V/A[Lucas W et al (2005)]T .......................... 11
TFigure 8 High speed images of welding transfer modes; a) short‐circuiting, b)
globular[Lucas W,Iordachescu D andPonomarev V 2005]T ........................................... 12
TFigure 9 High speed images related to voltage/current curveT ........................................... 13
TFigure 10 Schematic representation of globular transfer. Large irregular droplet forms
at the end of the wire and then under gravitational force drop onto the workpiece
resulting in ejected splatter [BOC2007]T........................................................................ 14
TFigure 11 Rotating spray transfer [Pomaska H 1991]T......................................................... 15
TFigure 12 Streaming spray transfer [Pomaska H (1991)]T.................................................... 16
TFigure 13 High speed images of drop spray transfer[Pomaska H 1991]T ............................ 17
TFigure 14 Heat transfer through GMAW electrodes controlled by droplet size [Jenkins N
T, Mendez P F and Eagar T WT....................................................................................... 18
TFigure 15 Balance of forces acting on a droplet [Norrish J 1992]T ....................................... 19
TFigure 16 ‘Geometry’ of the current path in various transfer modes [Norrish J 1992]T....... 21

xii
TFigure 17 The influence of copper on the surface tension of steel as determined by
Dyson using the sessile drop technique[Dyson 1963]T .................................................. 23
TFigure 18 Surface tension of Fe‐Cu as determined by Nogi et al using the levitated
droplet technique[Nogi et al 1991]T .............................................................................. 24
TFigure 19 a) Images of a typical welding wire drawing facility (Welding Consumable
Factory, Afrox,T .............................................................................................................. 28
TFigure 19(b) Images of a typical copper coating and finishing operations of the welding
wire drawing facility (Welding Consumable Factory, Afrox, South Africa)T .................. 28
TFigure 20 Influence of the welding wire diameter on the stability index of the wire
[Modenesi and de Avelar 1999]T.................................................................................... 29
TFigure 21.Influence on wire diameter on (FCC) [Modenesi and de Avelar 1999]T ............... 30
TFigure 22 Stability index on two different wire coatings. The influence that the surface
coating has on the feeding resistance of two welding wires over a given time period
[Koshisi and Shimizu 2001]T ........................................................................................... 31
TFigure 23 Schematic diagram of the fume generation processes [Deam R T et al 2000]T... 33
TFigure 24 Average droplet temperature and average droplet heat content for ER70S‐6 (
mild steel)[Soderstrom et al 2011]T ............................................................................... 35
TFigure 25 Fundamentals of wire melting in conventional GMAW. The burn‐off rate is a
function of heating by the arc plus resistive heating in the electrical extension.
(L)[Norrish J 2011]T ........................................................................................................ 37
TFigure 26 Determination of the droplet temperature using two‐colour pyrometry
technique [Tanaka et al 2009]T...................................................................................... 42
TFigure 27 Droplet temperature profiles after detachment from the wire in free flight
across the arcT................................................................................................................ 43
xiii
TFigure 27 Droplet temperature profiles after detachment from the wire in free flight
across the arc[Tanaka M et al 2009]T............................................................................ 43
TFigure 28 Droplet temperature profile displaying a localised small hot spot as observed
by Tanaka in a mixed shielding gas atmosphere (Ar‐COR2R – OR2R) [Tanaka M et al
2009]T............................................................................................................................. 43
TFigure 29 Comparative droplet temperature in MIG/MAG welding using COR2R or mixed
gas.T ............................................................................................................................... 44
TFigure 30 Change in fume formation rate as a function of current. A localised area of
relatively low FFR can be observed in the transition between globular and spray
transfer.[Sterjovski Z et al 2006]T .................................................................................. 45
TFigure 31 The influence of increasing percentages of OR2R and COR2R has on the
FFR[Carpenter C et al 2010]T.......................................................................................... 47
TFigure 32 Comparison of the FFR of a copper coated wire (YGW15) and an uncoated
wire (SEA‐50S)with improved surface finish.[Kobelco Wire Co]T ................................... 48
TFigure 33 Calculated values of the temperature (left), the Fe mass fraction (right), and
the flow (vectors) in a 250A arc with a vaporisation rate of 1% relative to the 10
n/min wire feed rate [Schnick M et al 2010]T ................................................................ 50
TFigure 34 Welding trace taken of a wire welded in the spray regime. A large number of
short circuits can be observed which leads to an instability of the welding process.
These short circuits can also lead to an increase in the FFR of the sampleT.................. 55
TFigure 35 Control panel of the “auto‐controller” developed by the University of
Wollongong. T ................................................................................................................. 56
TFigure 37 Voltage waveforms for various fume generation levels[Cuiri D 2009]T ............... 59
TFigure 35 Variations of the copper content of C Mn steel welding wires from a singleT ..... 63
xiv
TFigure39 Controlled wire sample group consisting of an uncoppered and two copper
coated wires T ................................................................................................................. 65
TFigure 40a Surface finish of the uncontrolled sample group(low magnification) T.............. 67
TFig40b Surface finish of the uncontrolled sample group( low magnification) T.................... 68
TFig 40c Surface finish of the uncontrolled sample group (high magnification)T .................. 68
TFig 40d Surface finish of the uncontrolled sample group ( high magnification)T................. 69
TFig 40e Surface finish of the uncontrolled sample group ( Uncoppered wire) ( High
magnification)T .............................................................................................................. 69
TFig 41 (a&b) represents the typical surface imperfections that has been noticed on the
controlled sample group welding wiresT ....................................................................... 70
TFig42 EDS analysis of the surface of the controlled sample group. The results is
consistent with the chemical analysis of the samples, where the copper content of
sample 1 (0.083%Cu) and sample 2 (0.13% Cu).T .......................................................... 71
TFig 43 Position of the microhardness indentations on the cross section of the wireT ....... 73
TFig 44(a,b and c) Trace of the electrical parameters (V,A) over a time period. A large
number of short circuiting events can be observed. Welding parameters were fixed
for all wires. The frequency of these events is greater in the case of the Uncoppered
wire indicating a higher instabilityT ............................................................................... 78
TFig 45 Trace of the electrical parameters ( V,A) over time using the “Auto controller”. A
significant reduction of short circuiting events can be observed, indicating a higher
degree of stability in the wire that should lead to lower FFR.T...................................... 79
TFig 46 Principle operation of the “Migfast” contact tip T ...................................................... 84
TFig 47 Experimental set up to determine the cathode/anode fall voltage determinationT . 85

xv
TFig 48 T TTemperature map of an individual droplet as determined by the two colour
pyrometry methodT........................................................................................................ 87
TFig 49 Experimental set‐up for the determination of temperature maps of weldmetal
droplets using the two colour pyrometry method.T....................................................... 87
TFig 50 shows the typical experimental setup for the typical sessile drop determinations.T 89
TFig 51 Graphic illustration of the determination of θc, γRslR , γRsgR , γRlg, R where θc is contact
angle; γRslR , γRsgR , γRlgR represents the solid‐liquid, solid‐gas and liquid‐gas interfaces.T .... 90
TFig 52 Experimental set up for capturing single droplets for metallographic examinationT91
TFig 53 Arc voltage determination as a function of the arc length for steel, copper
(unmelted), copper (melted) and tungstenT .................................................................. 93
TFig 54 Arc voltage determination for steel and copper as a function of the Arc length.
The lines have been extrapolated to provide a typical anode and cathode fall
voltageT .......................................................................................................................... 94
TFig 55 (a) Coppercoated sample 1T....................................................................................... 95
TFig 55 (b) Coppercoated sampleT ......................................................................................... 96
TFig 56 Uncopperred wire T ..................................................................................................... 96
TFig 57 A comparison of the average temperature as a function of the droplet area
between the copper coated wire ( Sample C2 (C2DC)) and uncoated wire UCDC1T ..... 97
TFig 58 Images of the droplets obtained during the Sessile drop experiment; a)
Coppercoated wire,T ...................................................................................................... 100
TFig 59 Metallographic images of welding droplets of the controlled sample group.
Droplet still attached to the tip of the wireT .................................................................. 101
TFig 60 SEM images of the controlled group coppercoated welding wire with droplet
attachedT........................................................................................................................ 101

xvi
TFig 61 SEM images of the controlled sample group uncoppered welding wire with
droplet attached,a) clearly shows a deposition on the surface of the wire and b) is a
cross‐section of the wire in the area were the surface deposition is presentT .............. 102
TFig 62 (a) displays the copper coated welding wire with the droplet attached, three
areas can be observed behind the droplet 1) an area were there is no copper
coating, 2) an area were re‐condensation has occurred and 3) the undisturbed
copper coating T .............................................................................................................. 103
TFig 63 Increase in FFR as a result of an increase in copper contentT.................................... 109
TFig 64 Droplet images obtained using high speed photography of the transfer that
occurred during the FFR experiments using the “auto controller” Fig 64(a) is the
copper coated wire and (b) the uncoated wireT ............................................................ 110
TFig 65 Temperature map representing the temperature distribution within welding
droplets. Data collected during experiments at University of Osaka, Japan.T .............. 114
TFig 66 The number of high temperature points expressed as a ratio compared with the
total volume of the droplet.T.......................................................................................... 115
TFig 67 Change in the Evaporation constants of Cu and Fe with: a) Uncoppered wire;T . 116
xvii
List of tables
TUTable 1 Welding Process Classification UT ............................................................................... 4
TUTable 2 Chemical composition requirements for solid electrodes and rods[AWS SFA5.18
(2001) UT............................................................................................................................ 25
TUTable 3 Factors affecting fume formation rates [Sterjovski Z et al 2006]UT........................... 41
TUTable 4 Comparative results of FFR and fume dispersion between a copper coated and a
uncoppered wire. [Koshiishi F & Shimizu H (2001), Slater (2004) UT ................................ 52
TUTable 5 Chemical composition (published by the manufacturers) of randomly selected
wires from different welding wire manufacturers, BOC wire benchmarking exercise
Report FTC 125UT ............................................................................................................. 62
TUTable 6 Chemical analysis of the uncontrolled group of welding wires independently
verified[Bluescope Steel report 2009]UT .......................................................................... 64
TUTable 7 Chemical analysis of the “Controlled group” of welding wires. The difference in
Copper content is as a result of the surface coating UT .................................................... 65
TUTable 8 : Cross‐sectional hardness test of the controlled and uncontrolled sample
groups UT ........................................................................................................................... 72
TUTable 9 Variations in wire diameter of a randomly selected group of welding wires.
BOC Benchmarking exercise Report No: FTC 125UT ......................................................... 74
TUTable 10 Wire diameter of the “controlled “ group of welding wires ( Published versus
actual)UT........................................................................................................................... 74
TUTable 11 Fixed welding parameters for all welding wires per size used in this studyUT......... 75
TUTable 12 Fume formation rate data for the uncontrolled sample group using a fixed set
of welding parameters.UT ................................................................................................ 76
xviii
TUTable 13 Fume formation rate data for the controlled sample group using a fixed set of
welding parameters.UT..................................................................................................... 76
TUTable 14 Fume formation rate data for the controlled sample group using the “Auto
Controller” to optimise the welding parameters for each individual welding wire.UT .... 80
TUTable 15 Comparison of the FFR of the controlled group of wires when using the “Auto
Controller” (after) to using a fixed set of welding parameters for all wires (before).UT.. 82
TUTable 16 Welding parameters used for the determination of the droplet temperature by
two colour pyrometry.UT .................................................................................................. 88
TUTable 17 Pulsed welding parameters used for the determination of the droplet
temperature by two colour pyrometry. UT ........................................................................ 88
TUTable 18 Chemical analysis of wire samples used for the Sessile drop experimentsUT .......... 89
TUTable 19 Summary of the FFR of the controlled group of wires, using the Migfast tip and
Auto controller for optimised welding conditionsUT ........................................................ 92
TUTable 20 Average droplet temperature as determined with the two colour pyrometery
techniqueUT...................................................................................................................... 97
TUTable 21 Comparison between the FFR of the controlled sample group using fixed and
optimised welding conditions UT ...................................................................................... 108
TUTable 22 Comparison of the FFR of the controlled sample group using the “Migfast”
contact tip in conjunction with the “auto controller” compared to the same group
without the Migfast tip UT................................................................................................. 108
TU63 Increase in FFR as a result of an increase in copper contentUT ......................................... 109
TUTable 23. The average droplet temperature of the three controlled sample wires using
the temperature maps obtained during experiments at the University of Osaka
Japan UT............................................................................................................................. 115

xix
TUTable 24. Comparison of the evaporation constant for Fe and Cu of the three
controlled welding wire sample groups as a function of temperature.UT ...................... 117
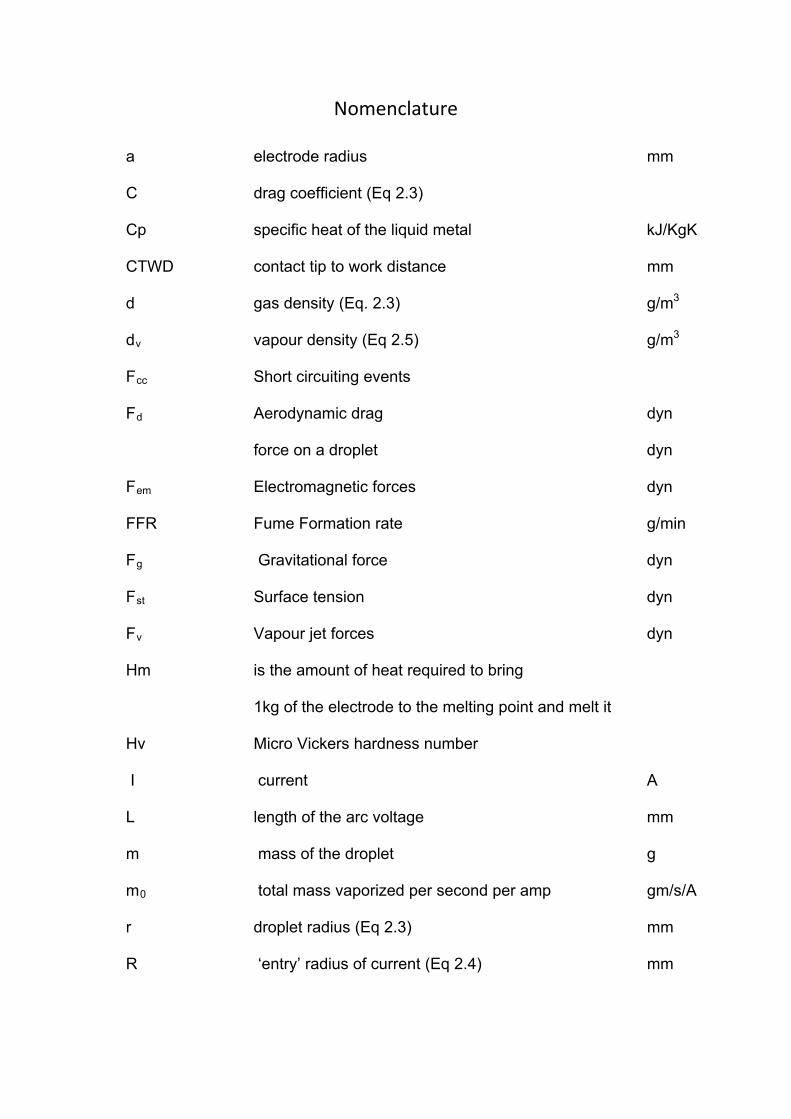
Nomenclature
a electrode radius mm
C drag coefficient (Eq 2.3)
Cp specific heat of the liquid metal kJ/KgK
CTWD contact tip to work distance mm
d gas density (Eq. 2.3) g/m3
dv vapour density (Eq 2.5) g/m3
Fcc Short circuiting events
Fd Aerodynamic drag dyn
force on a droplet dyn
Fem Electromagnetic forces dyn
FFR Fume Formation rate g/min
Fg Gravitational force dyn
Fst Surface tension dyn
Fv Vapour jet forces dyn
Hm is the amount of heat required to bring
1kg of the electrode to the melting point and melt it
Hv Micro Vickers hardness number
I current A
L length of the arc voltage mm
m mass of the droplet g
m0 total mass vaporized per second per amp gm/s/A
r droplet radius (Eq 2.3) mm
R ‘entry’ radius of current (Eq 2.4) mm
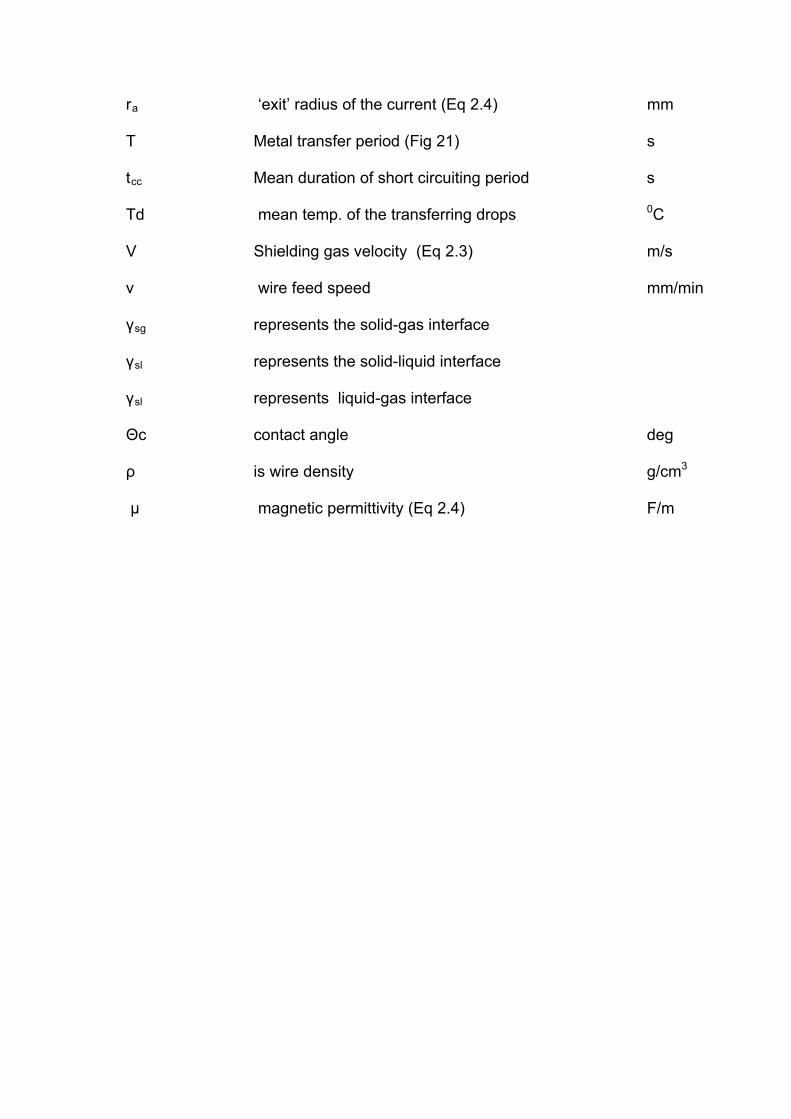
ra ‘exit’ radius of the current (Eq 2.4) mm
T Metal transfer period (Fig 21) s
tcc Mean duration of short circuiting period s
Td mean temp. of the transferring drops 0C
V Shielding gas velocity (Eq 2.3) m/s
v wire feed speed mm/min
γsg represents the solid-gas interface
γsl represents the solid-liquid interface
γsl represents liquid-gas interface
Θc contact angle deg
ρ is wire density g/cm3
µ magnetic permittivity (Eq 2.4) F/m

1
1.0 Introduction 1.1 Background
The manufacturing industry largely depends on welding as a joining process. The
welding process itself has evolved over time and today, with the development of
welding equipment, is accessible to almost everybody.
The emphasis in the welding operations has mainly been concentrated on the
development of different welding consumables for the same welding applications.
Quality and integrity of the welded joint has been the primary focus in the past. Today
this focus has shifted to include the health and wellbeing of the welding operator.
Fume has become an area of particular interest and there are several researchers and
research projects working in this field. [Voitkevic V (1995), Dennis J et al (2001),Deam
et al (2000),McMillan(2006),Redding (2002),Norrish(1992)]
The aim of this research is to investigate the influence of the modification of the
welding consumables on the fume generation during welding.
The investigation has been limited to C‐Mn welding wire used during the Gas Metal Arc
welding process.Fume generation during welding has posed a risk to the health of
welders since the use of the first covered stick electrodes.
The effects of certain constituents in welding fume, such as zinc and beryllium has
been well documented. International safety standards have been developed to control
the exposure of the welder to fume. Welding fume has been analysed to identify its
constituents [Norrish(2005), and Chen (1998), Sowards(2006) and Jenkins and
Eagar(2005)].
2
These studies have contributed to developing a greater understanding of the welding
fume composition and morphology and led to improvements in the exposure
standards.
T1.2 Aims of the research
The aim of the research was to develop greater understanding of the influence that
the modification of the welding consumable, in this case the addition of copper to the
surface of the most common carbon steel welding wire, has on the fume formation
rate in the gas metal arc process (GMAW)
The objectives were to:
Establish the fume formation rate FFR of a range of welding wires and correlate this
with previously published data.
Establish the effect of the total copper content of the welding wire and the FFR.
Establish the influence of the welding parameters on the FFR.
Establish the factors that contribute to the increase in FFR of welding wires containing
higher levels of total copper.
Investigate whether the increase in FFR of C‐Mn wires, are proportional to the
increased copper levels.
Investigate possible mechanisms for the observed behaviour.
1.3 Brief overview of the thesis
The introductory chapter (Chapter 2) provides some background information on
welding, GMAW, solid wire welding consumables and fume formation rates. This
chapter also contains a literature review concerning the use of copper on welding wire.
3
Several studies on the fume formation rates associated with copper coated and
uncoppered wire are analysed and the influence of metal vapour on the FFR is also
discussed. The chapter concludes with a review of the gaps in the current knowledge
relating to the effect of copper on GMAW fume formation and suggestions for a
systematic experimental investigation.
Chapter 3 details the experimental procedures that were developed during this
research.
Chapter 4 details the results obtained during the study of these initial experiments.
Chapter 5 suggests a mechanism for the observed differences in the FFR of the wires
and details the experimental techniques designed to test these hypothesis.
Chapter 6 discusses the results of the experimental work.
Chapter 7 draws some conclusions about the experimental work that was performed.
4
2.0 Literature Review 2.1 Introduction to welding
2.1.1 Introduction
Welding forms an intrinsic part of the fabrication process. There is hardly any industry
in which welding and joining does not play a key role. In most industrialised countries
up to 2% of the workforce will be employed in this sector and in developed countries
welding and joining influence up to 70% of the GNP [TWI report]
There are a wide variety of welding processes, but in essence welding is divided into
solid state and fusion welding processes [ISO4063[3], Norrish(1992)] as shown in Table
1.
Table 1 Welding Process Classification
Welding Processes
Welding with pressure Fusion welding
Cold pressure Manual metal arc welding (MMAW)
Resistance welding Gas tungsten arc welding (GTAW)
Friction welding Gas metal arc welding (GMAW)
Diffusion banding Submerged arc welding (SAW)
Explosive welding Laser welding
Magnetically impelled arc butt welding Electron beam welding
The processes differ in terms of the equipment used, and the manner in which heat
and/or pressure is applied.

5
Manual metal arc (MMA) welding is the most basic of all fusion welding processes and
in developing countries remains one of the most popular processes. With the
development of more sophisticated power sources, increased availability of shielding
gas and advancements in consumable manufacturing, the GMAW process has however
become one of the most commonly used welding processes in developed economies.
The application of GMAW has increased rapidly and it has become the most important
welding process within all industries all over the world. The growth in the process
application is due to an increased understanding of the individual components of the
process itself.
0%
20%
40%
60%
80%
100%
Western Europe Consumable sales
SAW%
FCW%
MIG%
MMA%
Figure 1 Consumable sales as a percentage of the total sales by process in Western
Europe [Svetsarin Magazine (Vol 59, 2004)]

6
Figure 2 Deposited weld metal by country/region [Svetsarin Vol 59 2004]]
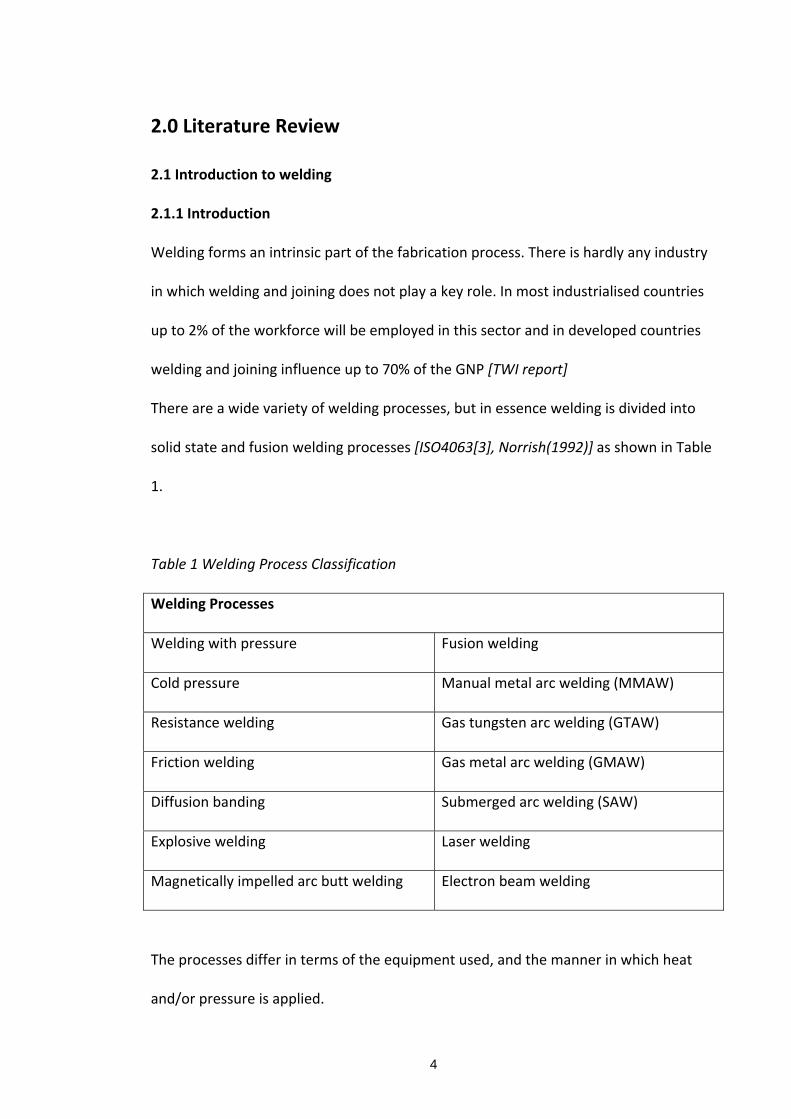
2.1.2 Gas metal arc welding (GMAW)
GMAW – commonly referred to as Metal Inert Gas (MIG) or Metal Active Gas (MAG) in
Europe – welding embraces a group of arc welding processes in which a continuous
electrode (the wire) is fed by powered feed rolls (wire feeder) into the weld pool. An
electric arc is created between the tip of the wire and the weld pool. The wire is
progressively melted at the same speed at which it is being fed and forms part of the
weld pool. Both the arc and the weld pool are protected from atmospheric
contamination by a shield of substantially inert (non‐reactive) gas, which is delivered
through a nozzle which is concentric with the welding wire guide tube. (Fig 3)
7
Figure 3 Illustration of the MIG welding arc [BOC 2007]
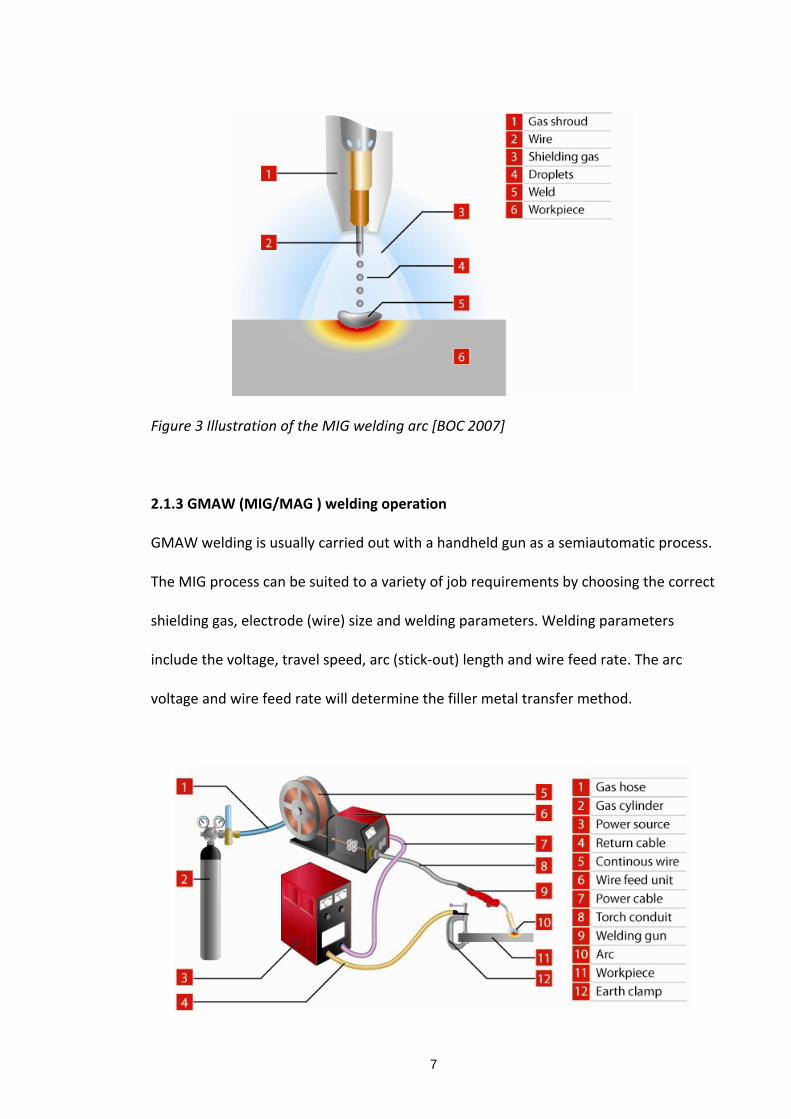
2.1.3 GMAW (MIG/MAG ) welding operation
GMAW welding is usually carried out with a handheld gun as a semiautomatic process.
The MIG process can be suited to a variety of job requirements by choosing the correct
shielding gas, electrode (wire) size and welding parameters. Welding parameters
include the voltage, travel speed, arc (stick‐out) length and wire feed rate. The arc
voltage and wire feed rate will determine the filler metal transfer method.

8
Figure 4 MIG/MAG welding equipment set up [BOC 2007]
Figure 5 Illustration of terminology used in GMAW (MIG/MAG) welding operation [BOC
2007]
This application combines the advantages of continuity, speed, comparative freedom
from distortion and the reliability of automatic welding with the versatility and control
of manual welding. The process is also suitable for mechanised set‐ups, and its use in
this respect is increasing.
GMAW welding can be carried out using solid wire, flux cored, or a copper‐coated solid
wire electrode. The shielding gas or gas mixture may consist of the following:
Argon
Carbon dioxide
Argon and carbon dioxide mixtures
Argon mixtures with oxygen or helium mixtures

9
Each gas or gas mixture has specific advantages and limitations. Other forms of GMAW
welding include using a flux cored continuous electrode and carbon dioxide shielding
gas, or using self‐shielding flux cored wire, requiring no shielding.
2.1.4 Modes of metal transfer
2.1.4.1 Classification
The mode or type of metal transfer in MIG welding depends upon the current, arc
voltage, type of filler material, electrode polarity and type of shielding gas used.
There are generally two theories that describe the modes of metal transfer:
1. The static force balance theory and, [Norrish(1992)]
2. The pinch instability theory [Pires, Quintana and Miranda(2007)]
The static force balance theory basically postulates that the droplet will detach from
the end of the wire when the detaching forces exceeds the retention forces.
Detaching forces are classified as: gravitational, plasma drag and electromagnetic
whilst
Retention forces are: surface tension and vaporisation.
In relation to transfer modes:
In globular transfer the predominant force is gravity. The wire melts and a big droplet
forms until it is too heavy to be held by surface tension. It then detaches under its own
weight. Vapour jets may repel the falling droplet. This mode of transfer is largely
undesirable in GMAW.
In spray the droplet is pinched off and projected across the arc by the electromagnetic
pinch effect, but since this is dependant on current it only occurs when a current

10
threshold (usually exceeding 200A) is reached. Normally long arc and high currents is
associated with high FFR.
In the short circuiting mode the electromagnetic pinch due to high short circuit current
causes detachment but it is assisted by surface tension which on balance is greater
between the weld pool and the droplet than between the wire and the droplet. High
pinch forces may result in spatter and instability. [Norrish(1992)]
The International Institute of Welding (IIW) has recently agreed ( IIW Annual Assembly
2006 Quebec) to classify transfer modes in GMAW as “Natural” or “Controlled” and
these modes are a function of the design and a function of the power supply and wire
feed unit.
Figure 6 Classification of modes of metal transfer IIW 2006 (Recommendation to
Commission XII, IIW,2006 Quebec)
For natural modes an essentially passive DC power supply is used, its output and
response to the welding load governed by the power source’s inherent static and
dynamic characteristics (i.e. as a result of the internal power source impedance). The
filler wire is fed at a constant speed. Other variables which affect the transfer in these
modes are polarity, contact tip to work distance, the filler wire type and diameter, and
the shielding gas.

11
For controlled transfer modes the power source output or wire feed speed (or both)
are modulated in real time to control the transfer behaviour. This requires an active
interaction between the welding supply and the process. This control may be “open
loop” as in the case of some pulsed transfer modes or adaptive as in the case of
controlled dip transfer.
Figure 7 Typical transfer modes in relation to V/A [Lucas W et al (2005)
12
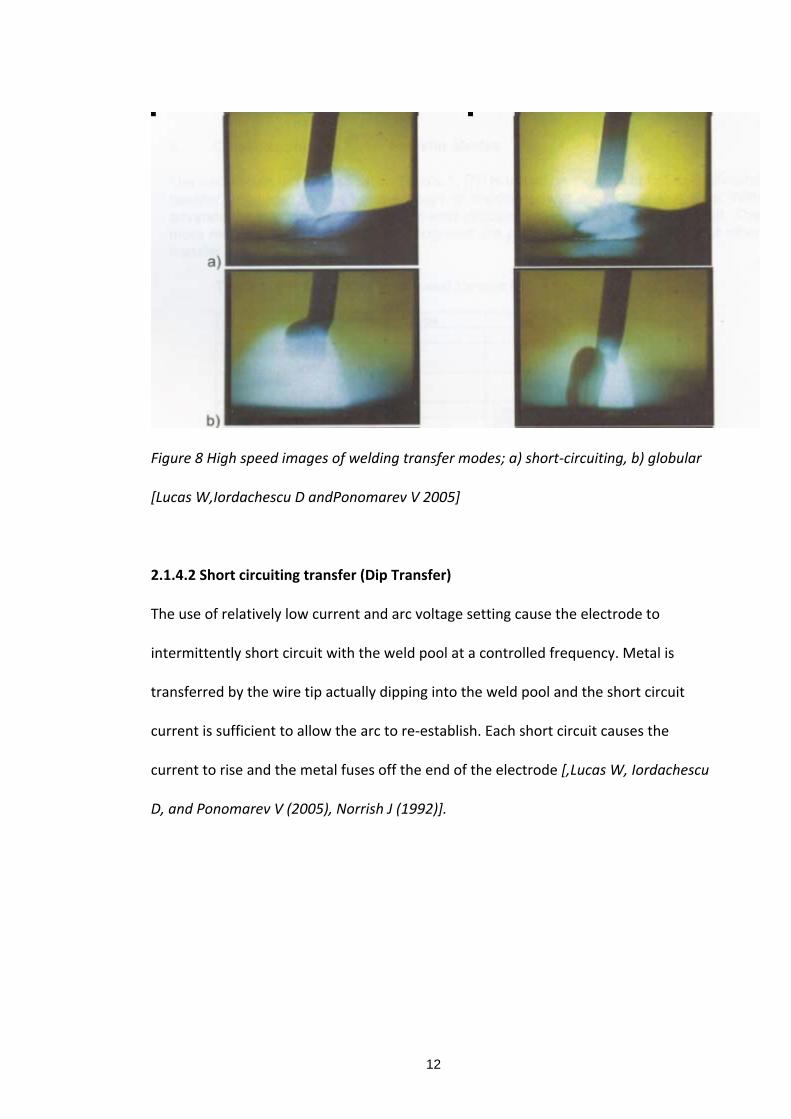
Figure 8 High speed images of welding transfer modes; a) short‐circuiting, b) globular
[Lucas W,Iordachescu D andPonomarev V 2005]
2.1.4.2 Short circuiting transfer (Dip Transfer)
The use of relatively low current and arc voltage setting cause the electrode to
intermittently short circuit with the weld pool at a controlled frequency. Metal is
transferred by the wire tip actually dipping into the weld pool and the short circuit
current is sufficient to allow the arc to re‐establish. Each short circuit causes the
current to rise and the metal fuses off the end of the electrode [,Lucas W, Iordachescu
D, and Ponomarev V (2005), Norrish J (1992)].

13
Figure 9 High speed images related to voltage/current curve (Norrish J, private communication)
2.1.4.3 Globular metal transfer
In globular metal transfer the transfer is controlled by slow ejection resulting in large
irregularly‐shaped “globules” falling into the weld pool under the action of gravity.
There is a lot of spatter especially in carbon dioxide, resulting in greater wire
0
50
100
150
200
0
10
20
30
40
50
0 10 20
U (V)
t (ms)
U
I (A)
I
t
14
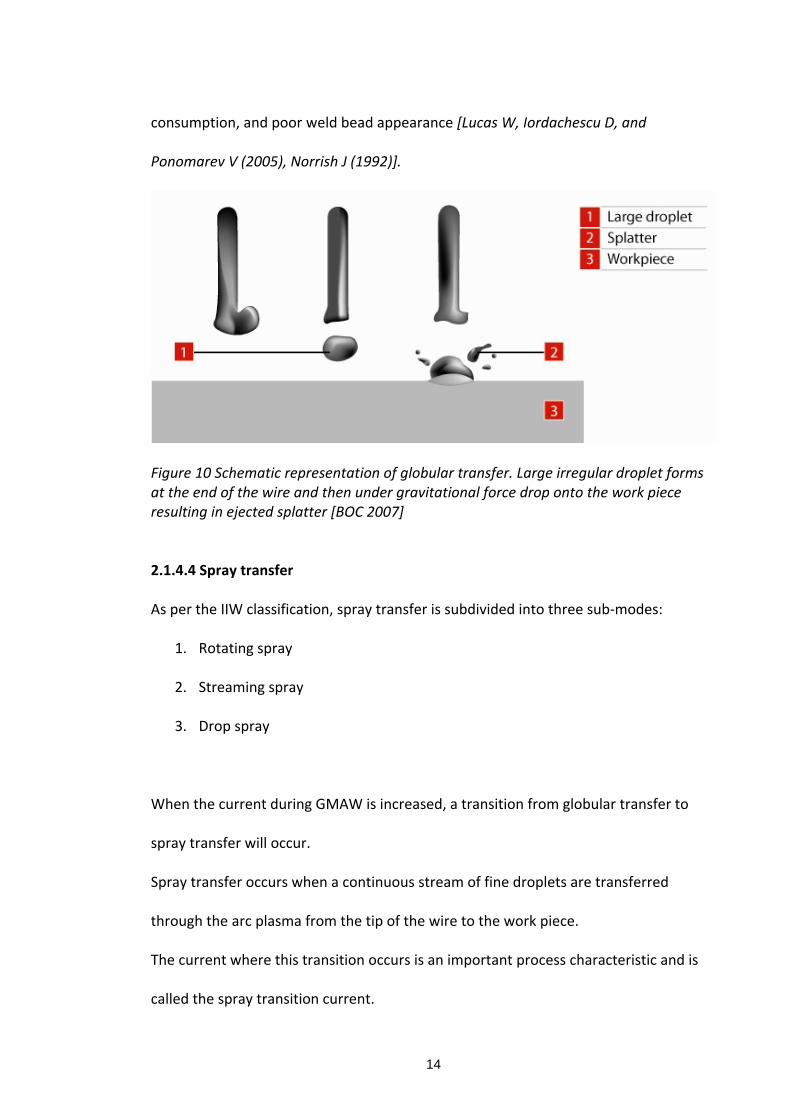
consumption, and poor weld bead appearance [Lucas W, Iordachescu D, and
Ponomarev V (2005), Norrish J (1992)].
Figure 10 Schematic representation of globular transfer. Large irregular droplet forms at the end of the wire and then under gravitational force drop onto the work piece resulting in ejected splatter [BOC 2007]
2.1.4.4 Spray transfer
As per the IIW classification, spray transfer is subdivided into three sub‐modes:
1. Rotating spray
2. Streaming spray
3. Drop spray
When the current during GMAW is increased, a transition from globular transfer to
spray transfer will occur.
Spray transfer occurs when a continuous stream of fine droplets are transferred
through the arc plasma from the tip of the wire to the work piece.
The current where this transition occurs is an important process characteristic and is
called the spray transition current.

15
This transition current will be influenced by the filler material composition, size and
shielding gas used.
The transition current occurs at relatively high values, resulting in high heat input
values.
2.1.4.5 Rotating spray
In the repelled mode droplet rotation can occur. The term rotating spray also describes
the rotation of an extended metal filament between the solid wire tip and the droplet
in streaming transfer. This transfer normally occurs at very high currents and is usually
undesirable.
Figure 11 Rotating spray transfer [Pomaska H 1991]
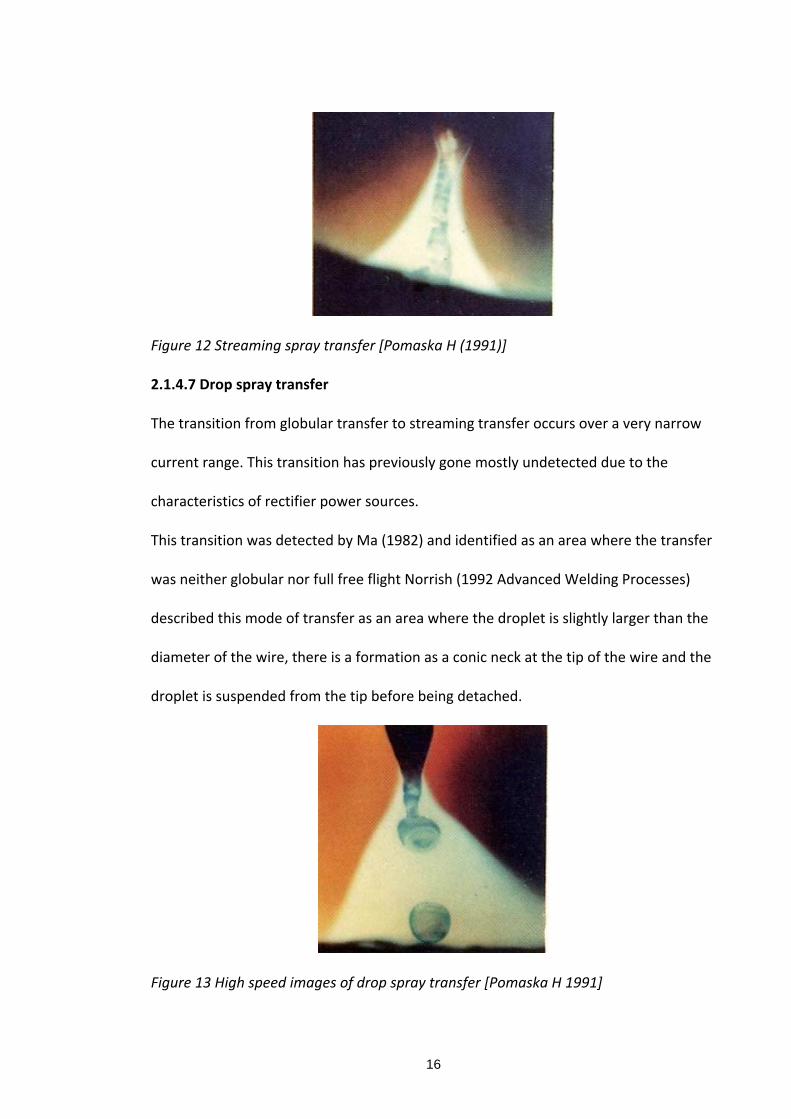
2.1.4.6 Streaming spray
As the current increases the droplet size decreases and the electrode tip becomes
tapered. As the current further increases the droplet frequency increases. The volume
of individual droplets decreases, but the droplet temperature increases with
subsequent increase in the vapour content of the arc that leads to arc widening and
increased fume formation [Richardson I (2006), Carter G (2002), Norrish J,Slater G and
Cooper P (2005)].
16
Figure 12 Streaming spray transfer [Pomaska H (1991)]
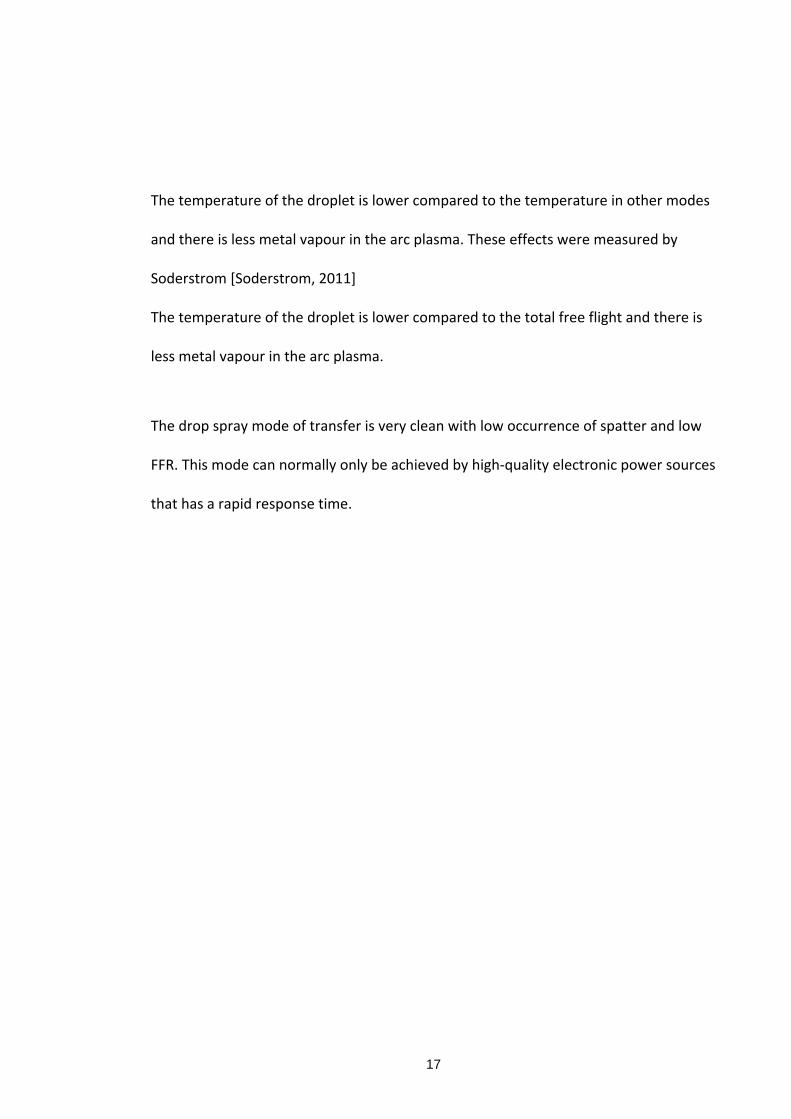
2.1.4.7 Drop spray transfer
The transition from globular transfer to streaming transfer occurs over a very narrow
current range. This transition has previously gone mostly undetected due to the
characteristics of rectifier power sources.
This transition was detected by Ma (1982) and identified as an area where the transfer
was neither globular nor full free flight Norrish (1992 Advanced Welding Processes)
described this mode of transfer as an area where the droplet is slightly larger than the
diameter of the wire, there is a formation as a conic neck at the tip of the wire and the
droplet is suspended from the tip before being detached.
Figure 13 High speed images of drop spray transfer [Pomaska H 1991]
17
The temperature of the droplet is lower compared to the temperature in other modes
and there is less metal vapour in the arc plasma. These effects were measured by
Soderstrom [Soderstrom, 2011]
The temperature of the droplet is lower compared to the total free flight and there is
less metal vapour in the arc plasma.
The drop spray mode of transfer is very clean with low occurrence of spatter and low
FFR. This mode can normally only be achieved by high‐quality electronic power sources
that has a rapid response time.

18
Figure 14 Heat transfer through GMAW electrodes controlled by droplet size [Jenkins N
T, Mendez P F and Eagar T W]
2.1.5 Physics of metal transfer
2.1.5.1 Introduction
The principal forces that act on a metal droplet can be summarised as:
Gravitational forces, FRg
Aerodynamic drag, FRd

19
Electromagnetic forces, FRem
Vapour jet forces, FRv
Surface tension, FRst
The welding parameters (voltage, wire feed speed, wire diameter, shielding gas used,
contact tip to work distance (CTWD)) will determine the dominant force and its
influence on the mode of transfer.
Fig 15 illustrates the static balance of forces at the point of detachment of a metal
droplet in free flight transfer and is described by the equation:
FRgR + FRdR + FRemR = FRvR + FRst
R(2.1)
Figure 15 Balance of forces acting on a droplet [Norrish J 1992]
2.1.5.2 Gravitational force
The gravitational force is given by the equation
FRgR = mg
(2.2)
20
Where m is the mass of the droplet and g the vertical component of the acceleration
due to gravity,
This force will have its maximum value (positive) in the downhand welding position
and maximum value (negative) in the overhead welding position. Measured values for
this force are 600dyn for iron. (1.6mm wire using Argon as a shielding gas with the
globular transfer mode) [Norrish J 1992]
2.1.5.3 Aerodynamic drag.
The shielding gas used in the GMAW process can induce a force on a droplet (Fd),
which may be calculated from the following equation:
FRdR = 0.5πV P
2Pdr P
2PC (2.3)
where V is the shielding gas velocity, d gas density, r droplet radius and C the drag
coefficient.
The magnitude of the force will be at its greatest when both the shielding gas velocity
and droplet radius are high. This is not likely to occur as large droplets are normally
found at low currents which in turn require low gas flow velocities. Gas flow velocities
will increase with higher currents which will as a rule result in smaller droplets. As a
result of this the aerodynamic drag force are small in most cases.
2.1.5.4 Electromagnetic forces
Electromagnetic forces will be generated by the magnetic field that is created when
current flows through a conductor.
The geometry of the current path, refer to Fig 16 will influence the magnitude of the
electromagnetic force, especially in the area surrounding the tip of the electrode.

21
The magnitude of the force can be calculated from:
FRemR = (µIP
2P/4π) ln|raP
2P/R| (2.4)
were µ is the magnetic permittivity of the material, I is the current, ra is the ‘exit’
radius of the current and R is the ‘entry’ radius.
In spray transfer the droplet is pinched off and projected across the arc by the
electromagnetic pinch effect but since this is dependent on current it only occurs when
a current threshold usually exceeding 200 amps is reached
Figure 16 ‘Geometry’ of the current path in various transfer modes [Norrish J 1992]
2.1.5.5 Vapour jet forces
Vaporization of the surface of the molten droplet will occur in the arc root area at
significantly high currents. The vapour particles is projected into the arc plasma due to
thermal acceleration an a force is created that oppose the droplet transfer.
Under conditions of uniform temperature and composition this force can be calculated
for a flat surface by means of the following:
Fv = (mR0R/dRvR)IJ (2.5)
22
where mR0R is the total mass vaporized per second per amp, I is the current, J is the
current density, dRvR is the vapour density.
2.1.5.6 Surface tension
As described in the section on welding transfer mode surface tension plays a
significant part in the transfer of the molten droplets during GMAW.
In the case of globular transfer the gravitational force needs to overcome the surface
tension of the droplet before the droplet will detach from the end of the wire.
In short circuiting transfer the pinch force is assisted by the surface tension which is
normally higher between the droplet and the weldpool compared to between the wire
and the droplet.
A large percentage of welding wires used in GMAW is coppered. The total copper is
measured as the sum of the copper coating and the copper contained within the steel
rod. Copper in welding wires is limited to 0.5%.
One of the recognised methods of determining the surface tension of materials is the
Sessile drop experiment.
Dyson (1963) used the sessile drop technique to determine the influence of copper on
the surface tension of iron (Fe) in a vacuum.

23
Figure 17 The influence of copper on the surface tension of steel as determined by Dyson using the sessile drop technique [Dyson 1963]
The results from Dyson (1963) were verified by Nogi et al (1991) however they used
the Levitated droplet method. A similar influence to that of Dyson was recorded

24
Figure 18 Surface tension of Fe‐Cu as determined by Nogi et al using the levitated droplet technique [Nogi et al 1991]
Both researchers are in agreement that the surface tension of liquid Fe sharply
decreases with the addition of copper to a level of 20mass % and then gradually
decreases to the level of pure copper.
Subramaniam (1999) reported that the surface tension of the metal droplets will
change depending on the shielding gas used. He reported that there is a clear
reduction in the surface tension in the presence of OR2R and COR2R in the arc atmosphere.

25
2.1.6 Welding wire production
The chemical composition of welding wire is regulated by international standards. One
such standard is the American Welding Society standard. AWS SFA 5.18‐(2001)
“Specification for carbon steel electrodes and rods for gas shielded arc welding”.
This specification indicates a range for elements such as carbon manganese and silicon
but for all other elements it just specifies a maximum value. Table 2
Table 2 Chemical composition requirements for solid electrodes and rods [AWS SFA5.18
(2001)
Different to other specifications for welding consumables the AWS specification for
wire is the actual wire composition and not the weld metal composition.

26
In the case of the copper content it is the total copper content i.e. this includes the %
of copper in the rod plus the additional copper that is added during the copper coating
process. The American Welding Society standard for solid wire (AWS A5.18‐2001)
specifies the following for the determination of the chemical analysis of the rod (clause
10)
“A sample of the solid electrode or rod shall be prepared for chemical analysis. Solid
filler metal, when analysed for elements that are present in a coating (copper
flashing, for example), shall be analysed without removing the coating. When the
filler metal is analysed for elements other than those in the coating, the coating shall
be removed, if it’s presence affects the results of the analysis for the other elements”
[AWS SFA5.18 (2001)]]
The International Institute of Welding’s (IIW) Commission XII prepared a document
[IIS/IIW‐901‐86 1986] that has suggested values for copper content of wires that are
not copper coated. It recommends that the copper level of the steel should not exceed
0.15%.
Copper was initially used as an aid for the wire drawing process. However, modern
wire drawing practices now negated the use of copper. Most wire drawing would be
done using a drawing lubricant mainly composed of mineral soaps (potassium
sulphate, sodium sulphate, sodium carbonate and 40% sodium or potassium borate).
These compounds would typically stay on the surface of the wire for the duration of

27
the drawing process. A typical 1.2mm wire will pass through 14 sets of drawing dies.
After the drawing process the wires will typically be cleansed with an alkaline cleaner
prior to the copper coating.
Copper coating of wires will be done using an electrolytic copper coating process. After
coating, the wire will be cleaned and polished.
1) Rod Descaling 2) Chemical cleaning of rods prior to drawing
3) Principle of wire drawing 4) Typical wire drawing block
5) Wire drawing line
28
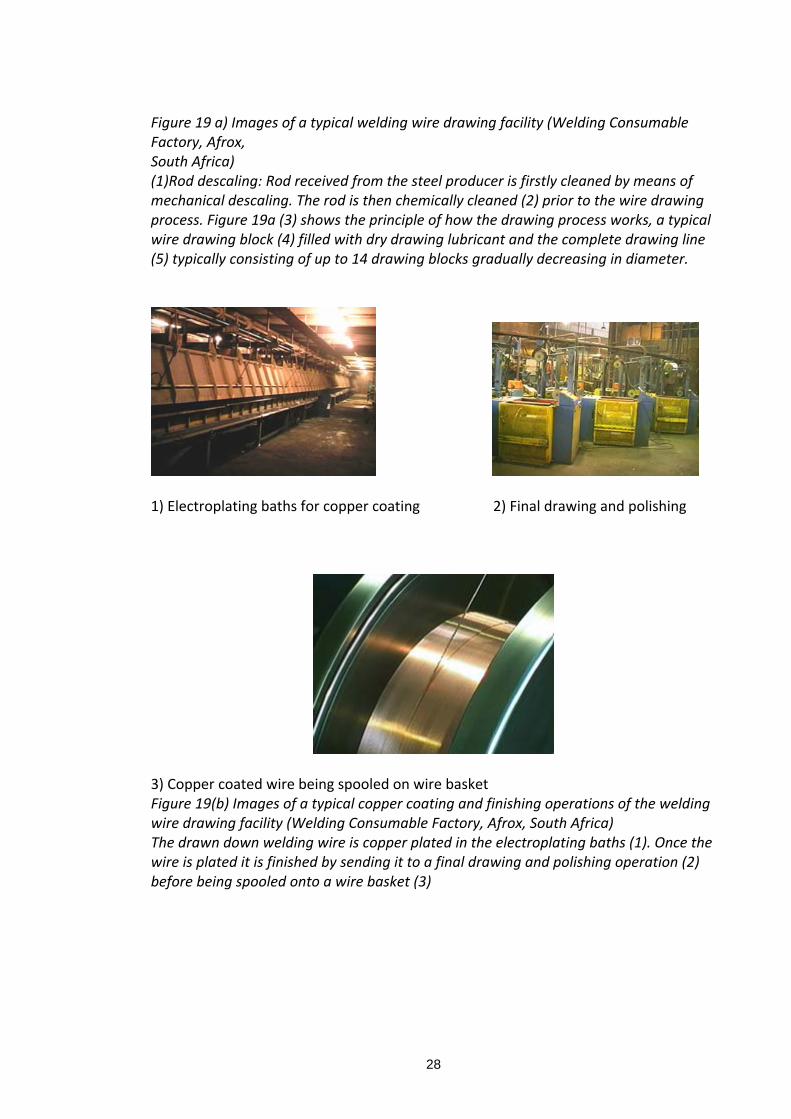
Figure 19 a) Images of a typical welding wire drawing facility (Welding Consumable Factory, Afrox, South Africa) (1)Rod descaling: Rod received from the steel producer is firstly cleaned by means of mechanical descaling. The rod is then chemically cleaned (2) prior to the wire drawing process. Figure 19a (3) shows the principle of how the drawing process works, a typical wire drawing block (4) filled with dry drawing lubricant and the complete drawing line (5) typically consisting of up to 14 drawing blocks gradually decreasing in diameter.
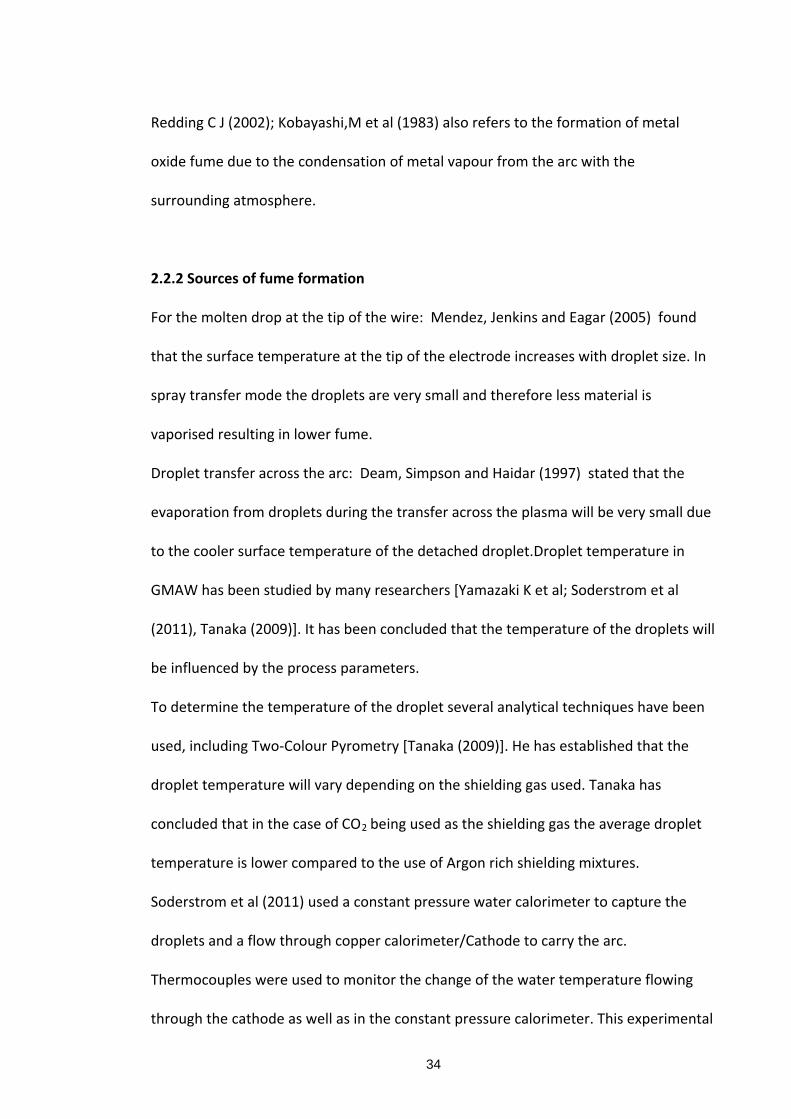
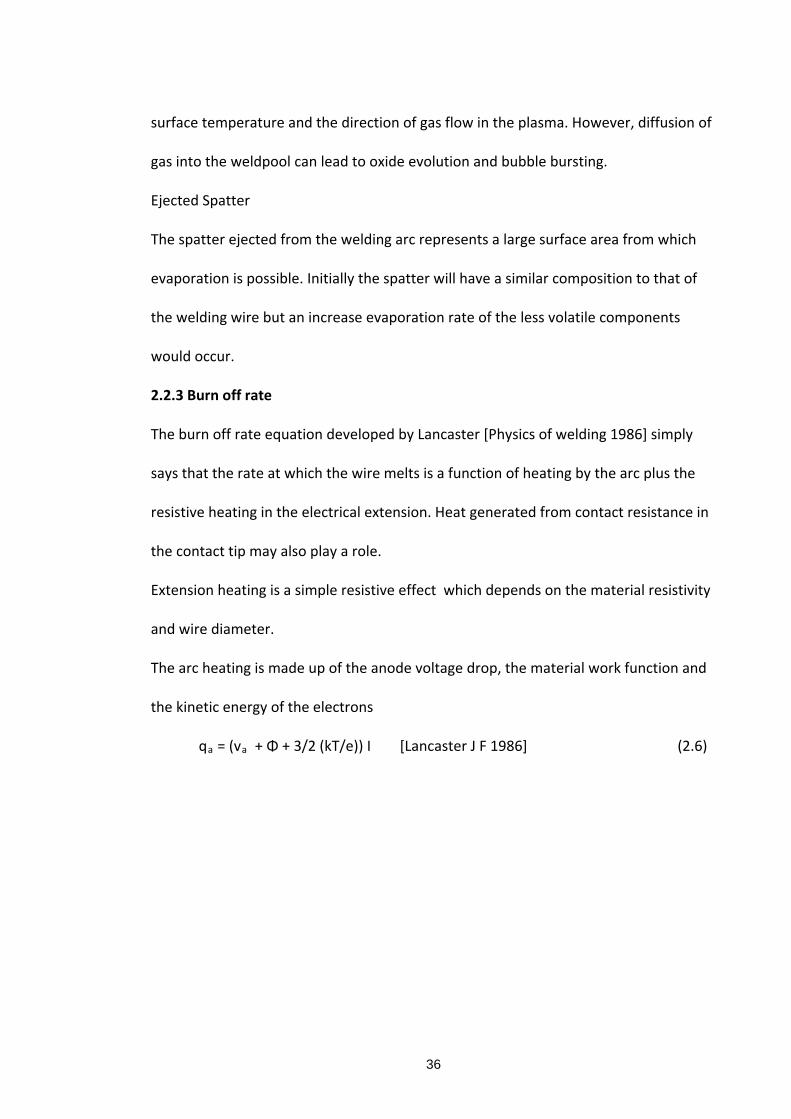
1) Electroplating baths for copper coating 2) Final drawing and polishing
3) Copper coated wire being spooled on wire basket Figure 19(b) Images of a typical copper coating and finishing operations of the welding wire drawing facility (Welding Consumable Factory, Afrox, South Africa) The drawn down welding wire is copper plated in the electroplating baths (1). Once the wire is plated it is finished by sending it to a final drawing and polishing operation (2) before being spooled onto a wire basket (3)

29
Both copper coated and non coppered wires follow the same manufacturing route.
The main difference between the wires is the final copper coating or a coating of
organic oils in the case of non coppered wires.
Research done by Modenesi and de Avelar (1999) on the influence of small variations
of wire characteristics on GMAW process stability concluded that wire diameter
caused significant changes in the short circuiting transfer mode. This study did not look
at the effect of the coating on the FFR.
Figure 20 Influence of the welding wire diameter on the stability index of the wire [Modenesi and de Avelar 1999]

30
Figure 21.Influence on wire diameter on (FCC)[Modenesi and de Avelar 1999] The influence of the welding wire diameter on the short circuiting index (Fcc),where Fcc is defined as the presence of short circuit event during welding (Calculated by the following equation Fcc= (tcc/T)X100 %. T being the period of metal transfer, and tcc the mean duration of the short circuit period. Koshishi and Shimizu (2001) discussed the influence that the surface quality of the wire
has on the subsequent arc stability and concluded that the electrical resistance of a
copper coated wire will vary due to the inconsistency of the coating

31
Figure 22 Stability index on two different wire coatings. The influence that the surface coating has on the feeding resistance of two welding wires over a given time period [Koshisi and Shimizu 2001]
2.1.7 Summary
The introduction of fully electronic power sources has opened up a whole new
approach to the natural occurring transfer modes in the GMAW process. This
“modification” to the natural occurring transfer modes has been recognised by the IIW
with the introduction of the “Controlled Mode” in the transfer mode classification
tables. This development by the IIW ensures that process modification (controlled
short circuiting) by commercial companies such as CMT® by Fronius, coldArc® by EWM,
STT® by Lincoln RMD® by Miller etc can now be grouped under a single classification
which relates to the underlying operating principles.

32
Continued research into the arc physics, and the improvement of electronic power
sources has also led to the commercial application of the previously undetected “drop‐
spray “transfer mode. Today the drop‐spray transfer mode regime offers the end user
a useable alternative to spray transfer coupled to a much lower FFR compared to that
of spray‐transfer.
Improvements in wire drawing techniques have eliminated the previous practice of
using copper as a drawing lubricant and in the modern wire drawing facilities the
application of copper coatings to welding wire is done in a more scientific and
controlled manner.
The improvement in drawing techniques has also opened the door for the production
of uncoated welding wires.

33
2.2 Fume formation during Welding
2.2.1 Source of welding fume
There are several factors that can influence the generation rate of welding fume,
however, it is important to have an understanding of the source of welding fume.
Deam R T et al (2000) describes the mechanisms that are prevalent in fume formation.
Condensation from metal vapour and oxides in the gas phase, to form sub‐micron
particles (0.1 µm and smaller)
Micro‐spatter, which is formed by the break up of the molten liquid into fine droplets,
between 100 and 0.1 gm in diameter
Figure 23 Schematic diagramme of the fume generation processes [Deam R T et al
2000]
34
Redding C J (2002); Kobayashi,M et al (1983) also refers to the formation of metal
oxide fume due to the condensation of metal vapour from the arc with the
surrounding atmosphere.
2.2.2 Sources of fume formation
For the molten drop at the tip of the wire: Mendez, Jenkins and Eagar (2005) found
that the surface temperature at the tip of the electrode increases with droplet size. In
spray transfer mode the droplets are very small and therefore less material is
vaporised resulting in lower fume.
Droplet transfer across the arc: Deam, Simpson and Haidar (1997) stated that the
evaporation from droplets during the transfer across the plasma will be very small due
to the cooler surface temperature of the detached droplet.Droplet temperature in
GMAW has been studied by many researchers [Yamazaki K et al; Soderstrom et al
(2011), Tanaka (2009)]. It has been concluded that the temperature of the droplets will
be influenced by the process parameters.
To determine the temperature of the droplet several analytical techniques have been
used, including Two‐Colour Pyrometry [Tanaka (2009)]. He has established that the
droplet temperature will vary depending on the shielding gas used. Tanaka has
concluded that in the case of COR2 Rbeing used as the shielding gas the average droplet
temperature is lower compared to the use of Argon rich shielding mixtures.
Soderstrom et al (2011) used a constant pressure water calorimeter to capture the
droplets and a flow through copper calorimeter/Cathode to carry the arc.
Thermocouples were used to monitor the change of the water temperature flowing
through the cathode as well as in the constant pressure calorimeter. This experimental

35
technique showed a local minimum in temperature during the transition from globular
to spray transfer for 1.2mm electrodes shielded with argon.
Figure 24 Average droplet temperature and average droplet heat content for ER70S‐6 (
mild steel)[Soderstrom et al 2011]
Data used for calculating average droplet temperature and heat content in regions
A,B, and C are indicated by square, diamond, and triangle markers, respectively.
For the weldpool :Dennis and Mortazavi (1996) as well as Deam et al (1997) recognise
that the evaporation of the weld pool is small due to the combination of the low
36
surface temperature and the direction of gas flow in the plasma. However, diffusion of
gas into the weldpool can lead to oxide evolution and bubble bursting.
Ejected Spatter
The spatter ejected from the welding arc represents a large surface area from which
evaporation is possible. Initially the spatter will have a similar composition to that of
the welding wire but an increase evaporation rate of the less volatile components
would occur.
2.2.3 Burn off rate
The burn off rate equation developed by Lancaster [Physics of welding 1986] simply
says that the rate at which the wire melts is a function of heating by the arc plus the
resistive heating in the electrical extension. Heat generated from contact resistance in
the contact tip may also play a role.
Extension heating is a simple resistive effect which depends on the material resistivity
and wire diameter.
The arc heating is made up of the anode voltage drop, the material work function and
the kinetic energy of the electrons
qRaR = (vRaR + Φ + 3/2 (kT/e)) I [Lancaster J F 1986] (2.6)

37
+L
I
Resistive I2R heating
Arc heating – qa = 6.5 x I watts
Anode fall 2v
Electron energy 0.5v
Work function 4.0v
qa = (va + Φ + 3/2 (kT/e)) I
MR = αI + (βlI2/a)
Figure 25 Fundamentals of wire melting in conventional GMAW. The burn‐off rate is a
function of heating by the arc plus resistive heating in the electrical extension.
(L)[Norrish J 2011]
The heat absorbed by the wire anode is at the rate
qRaR = πaP
2P vRaRρ [Hm + (Td ‐ Tm) Cp] [Lancaster J F 1986] (2.7)
were a is the electrode radius, v is the wire feed speed, ρ is wire density, Hm is the
amount of heat required to bring 1kg of the electrode to the melting point and melt it,
Td is the mean temperature of the transferring drops and Cp is the specific heat of the
liquid metal
2.2.4 Sources of fume formation
2.2.4.1 Molten at tip of wire
Jenkins N T, Mendez P F and Eager T W (2005) has found that the surface temperature
at the tip of the electrode increases with droplet size. In spray transfer mode the
droplets are very small and therefore less material is vaporised resulting in lower
fume.
38
2.2.4.2 Droplet transfer and temperature
Deam, Simpson and Haidar(2000) stated that the evaporation from droplets
during transfer across the plasma will be very small due to the cooler surface
temperature of the detached droplet.
Droplet temperature in GMAW has been studied by many researchers
[Yamazaki K et al , Soderstrom et al (2011), Tanaka (2009)]. It has been
concluded that the temperature of the droplets will be influenced by the
process parameters.
To determine the temperature of the droplet several analytical techniques has
been used, including Two‐Colour Pyrometry (Tanaka (2009)). He has
established that the droplet temperature will vary depending on the shielding
gas used. Tanaka (2009) has concluded that in the case of COR2R being used as
the shielding gas the average droplet temperature is lower compared to the
use of Argon rich shielding mixtures.
Soderstrom et al (2011) used a constant pressure water calorimeter to capture
the droplets and a flow through copper calorimeter/Cathode to carry the arc.
Thermocouples were used to monitor the change of the water temperature
flowing through the cathode as well as in the constant pressure calorimeteter.
This experimental technique showed a local minimum in temperature during
the transition from globular to spray transfer.

39
2.2.4.3 Weld pool
Dennis and Mortazavi (1996)] as well as Deam et al(2000) recognises that the
evaporation of the weld pool is small due to the combination of the low surface
temperature and the direction of gas flow in the plasma. However, diffusion of gas
into the weldpool can lead to oxide evolution and bubble bursting.
2.2.4.4 Ejected spatter
The spatter ejected from the welding arc represents a large surface area from which
evaporation is possible. Initially the spatter will have a similar composition to that of
the welding wire but an increase evaporation rate of the less volatile components
would occur
2.2.5 Factors affecting fume formation rate
Several factors can influence the FFR. Sterjovski et al (2006) identified that these
factors can be classified into one or more of the following groups:
Time
Temperature
Composition (both atmosphere and consumables) and
Geometry
2.2.5.1 Time related parameters
Time related parameters include the total time that the molten metal is exposed to the
atmosphere. The total time is related to:
Indirectly to metal transfer mode
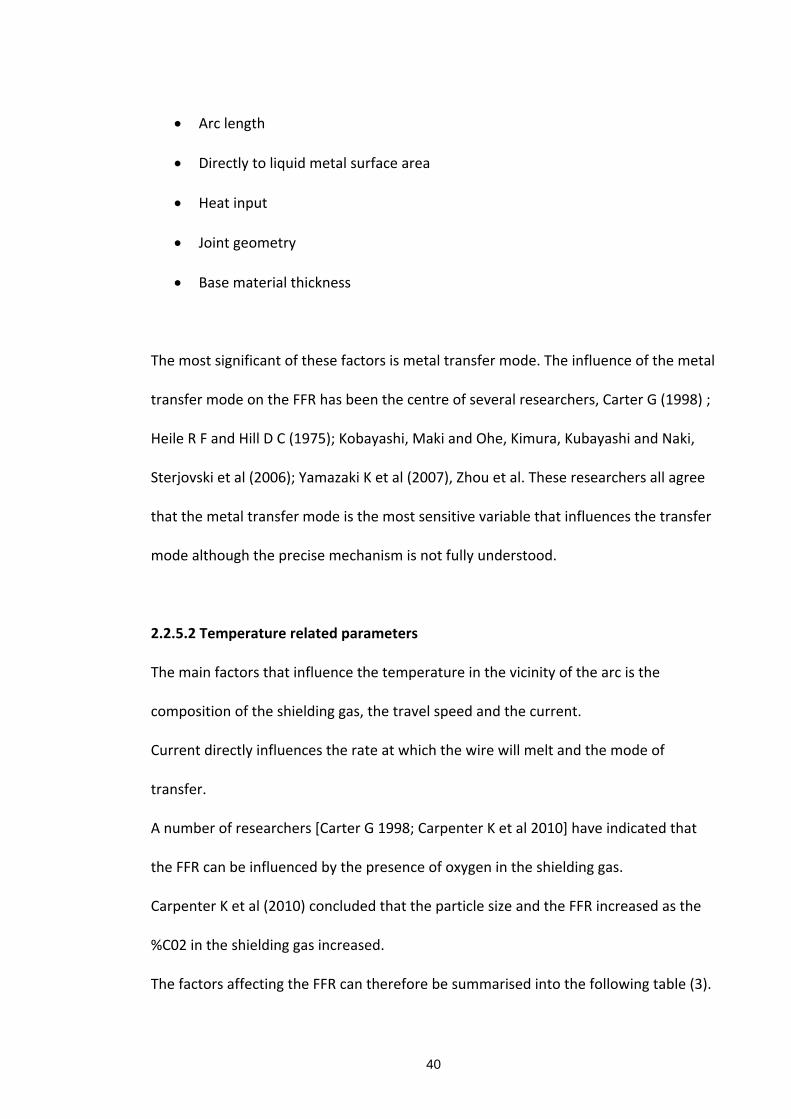
40
Arc length
Directly to liquid metal surface area
Heat input
Joint geometry
Base material thickness
The most significant of these factors is metal transfer mode. The influence of the metal
transfer mode on the FFR has been the centre of several researchers, Carter G (1998) ;
Heile R F and Hill D C (1975); Kobayashi, Maki and Ohe, Kimura, Kubayashi and Naki,
Sterjovski et al (2006); Yamazaki K et al (2007), Zhou et al. These researchers all agree
that the metal transfer mode is the most sensitive variable that influences the transfer
mode although the precise mechanism is not fully understood.
2.2.5.2 Temperature related parameters
The main factors that influence the temperature in the vicinity of the arc is the
composition of the shielding gas, the travel speed and the current.
Current directly influences the rate at which the wire will melt and the mode of
transfer.
A number of researchers [Carter G 1998; Carpenter K et al 2010] have indicated that
the FFR can be influenced by the presence of oxygen in the shielding gas.
Carpenter K et al (2010) concluded that the particle size and the FFR increased as the
%C02 in the shielding gas increased.
The factors affecting the FFR can therefore be summarised into the following table (3).

41
Table 3 Factors affecting fume formation rates [Sterjovski Z et al 2006]
Fume Formation Rate (FFR)
Time dependent variables Temperature dependent variables
Metal transfer mode Composition of the shielding gas
Arc length Travel speed
Liquid metal surface area Current
Heat input
Joint geometry
Base material thickness
2.2.5.3 Droplet temperature
The droplet temperature in GMAW will depend on the welding parameters such as arc
voltage, current and shielding gas. The temperature of the droplets will also have a
influence on the Fume formation rate. Determination of the droplet temperature
during welding poses many difficulties and previous experiments relied on collecting
droplets in a calorimeter, determining the heat retained by the droplet and the
converting this to a temperature. The heat loss of the droplets before entering the
calorimeter had to be estimated and the accuracy and repeatability of this technique
was considered to be low.
Hirata et al develop a technique using two colour pyrometry,to determine the droplet
temperatures in MAG welding. The wavelengths measured were 689 and 590.2nm in
the visible light range. This restricted the technique to be used in the short circuiting
transfer mode when the arc extinguished only.

42
Tanaka et al improved this technique by selecting two wave length 980 and 950 nm in
the infrared red range to reduce the arc light sufficiently, which allowed them to
measure the droplet temperature in the high current range (Spray and Pulse transfer
modes)
Figure 26 Determination of the droplet temperature using two‐colour pyrometry technique [Tanaka et al 2009]
Tanaka concluded that there was a difference between the temperatures of the
droplet in GMAW using 100% COR2R compared to GMAW using shielding gas mixtures
(Ar‐COR2R). The difference was attributed to the fact that in COR2R welding due to the
constricted arc the heat input density is high and there is a noticeable high
temperature spot at the bottom tip of the droplet which coincided with the arc root.

43
Figure 27 Droplet temperature profiles after detachment from the wire in free flight across the arc [Tanaka M et al 2009]
In the case of shielding gas mixtures the droplet was completely covered by the arc
and a local high temperature hotspot is small.
Figure 28 Droplet temperature profile displaying a localised small hot spot as observed by Tanaka in a mixed shielding gas atmosphere (Ar‐COR2R – OR2R) [Tanaka M et al 2009]

44
Tanaka further concluded that in the case of shielding gas mixtures welding at high
current, the heat input density of the droplet is low compared to that of the droplet
under CO2. In spray transfer with shielding gas mixtures the droplet frequency and the
likelihood that the droplets are relatively small increases. Based on this it can be
concluded the average droplet temperature of the complete metal droplet in COR2R arc
welding is higher than when shielding gas mixtures are used.
Figure 29 Comparative droplet temperatures in MIG/MAG welding using COR2R or mixed
gas.
2.2.5.4 Welding transfer mode
The relationship between the GMAW transfer mode and the FFR has been proven by
several researchers. Willingham and Hilton (1998) represented the fume data in a
quasi‐three dimensional format where there is a distinct dip in the rate following the
transition from the globular transfer regime.
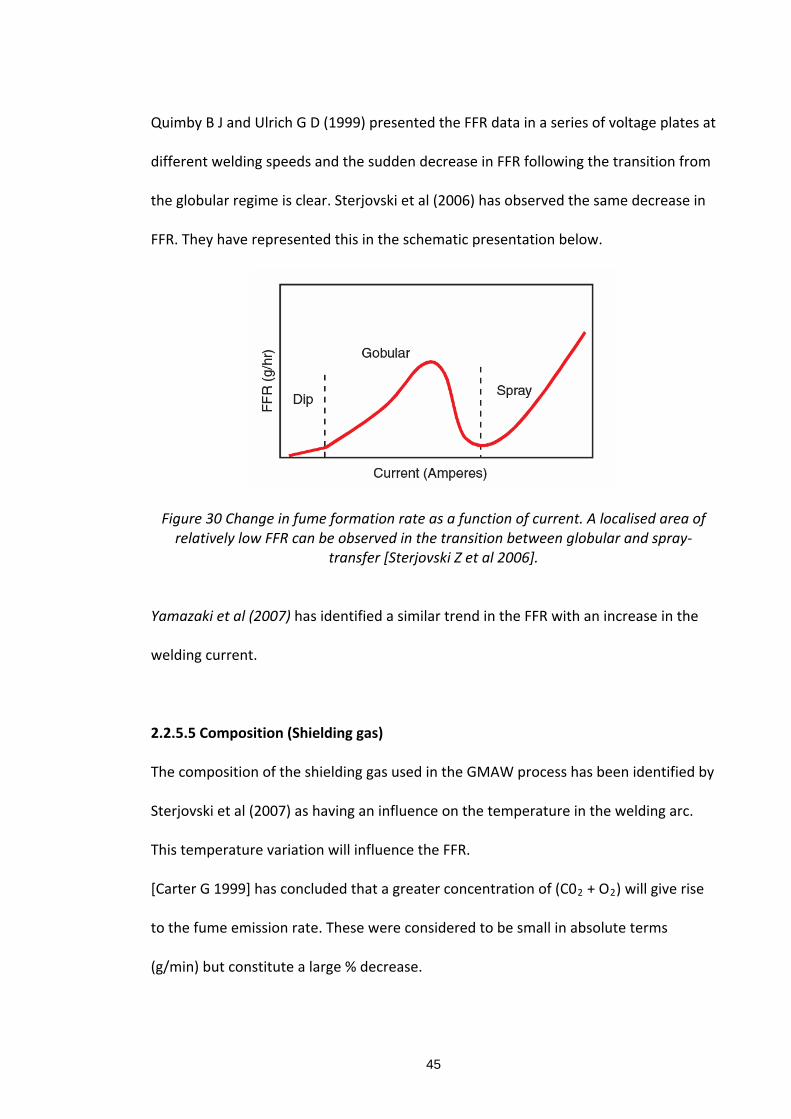
45
Quimby B J and Ulrich G D (1999) presented the FFR data in a series of voltage plates at
different welding speeds and the sudden decrease in FFR following the transition from
the globular regime is clear. Sterjovski et al (2006) has observed the same decrease in
FFR. They have represented this in the schematic presentation below.
Figure 30 Change in fume formation rate as a function of current. A localised area of relatively low FFR can be observed in the transition between globular and spray‐
transfer [Sterjovski Z et al 2006].
Yamazaki et al (2007) has identified a similar trend in the FFR with an increase in the
welding current.
2.2.5.5 Composition (Shielding gas)
The composition of the shielding gas used in the GMAW process has been identified by
Sterjovski et al (2007) as having an influence on the temperature in the welding arc.
This temperature variation will influence the FFR.
[Carter G 1999] has concluded that a greater concentration of (C0R2R + OR2R) will give rise
to the fume emission rate. These were considered to be small in absolute terms
(g/min) but constitute a large % decrease.

46
In a BOC study of shielding gas conducted by Hilton (Hilton, 2006) it was found that
carbon dioxide appears to be the most active gas in the production of particulate
fume. An increase of 0.1‐0.5 g/min with a rise of 5 to 20% C0R2R was obtained whilst in
the case of oxygen the rise was between 0.2 – 0.3 g/min with an increase of 1‐20% OR2R.
However, when oxygen and carbon dioxide were present in the same shielding gas the
effect of oxygen appears to be negligible.
The other significant conclusion that was made in this study was that as the amount of
oxygen in the shielding gas increased the percentage of manganese in the particulate
fume falls. For carbon dioxide there appears to be a peak in percentage manganese at
5% C0R2R decreasing until it reaches a minimum at 15% C0R2R after which it starts to
increase again.
Carpenter K et al (2010) studied the influence of the shielding gas on fume size
morphology and particle composition. They concluded that an increase in the OR2R and
COR2R content of the shielding gas resulted in higher nucleation rates and subsequent
growth by vapour condensation leading to an increase in average particle size. They
also concluded that an increase in the COR2R content of the shielding gas had a greater
effect than increasing the OR2R levels.
At 100% COR2R, the particle size and distribution significantly changed. This change was
due to the fact that the metal transfer mode was altered. Carpenter et al (2010)
however concluded that a change in the shielding gas composition had no change in
the particle composition.

47
Figure 31 The influence of increasing percentages of OR2R and COR2R has on the
FFR[Carpenter K et al 2010]
2.2.5.6 Composition (Welding consumables)
The composition of the welding consumable (in the case of GMAW, the welding wire)
was identified as a contributing factor to the FFR.
The composition of C‐Mn wire used in GMAW is specified by international standards.
AWS/ASME‐SFA A5.18; AS/NZS 2717.1:DIN 8559; BS2901 part1. Most commonly used
is the AWS SFA5.18 [2001] standard. The standard specifies, in most cases, only the
maximum value permitted for an element.
IIS/IIW Commission XII Doc‐901‐86 (2006) has made recommendations on the
maximum permitted level of copper in the welding wire. It has concluded that the total
copper content of welding wire should not exceed 0.5%, however, also recommended
that the copper content of the steel should not exceed 0.15%.

48
This document only commented that Cu levels in welding wire should be kept low so
as to minimise fume formation.
It has been reported that the removal of the copper coating from welding wire leads to
a reduction in the FFR of such wires. [ Slater,2005]
[Slater] reported a reduction of 34% in the breathing zone concentration between
copper coated and non coppered wires. It was further concluded that non coppered
wires produced a significant reduction in the breathing concentration of the operator.
Koshishi F and Shimizu H(2001);Kobelco wire company compared the performance of
copper coated and non coated wires with regards to the welding process and fume
formation rates. It was found that as a result of the improved surface quality of the
non copper coated wire the arc stability was improved and this led to a decrease in the
spatter formation as well as the fume generation.
0
100
200
300
400
500
240 250 260 270 280 290 300 310
Fume Form
ation rate (mg/min)
Welding Current A
Welding wire 1.2mm, Shielding gas Ar +20% CO2
Figure 32 Comparison of the FFR of a copper coated wire (YGW15) and an uncoated wire (SEA‐50S)with improved surface finish.[Kobelco Wire Co]
Dennis et al (2001) developed a model for the prediction of fume formation rate in
GMAW. The model was based on a single mild steel consumable and the researchers
49
commented that it is not sufficiently refined to enable recommendations to be made
for changes to the consumable composition.
In a later study Redding C J (2002) describes changes to the Dennis model and
established that an increase of 0.2% in the Mn percentage of the welding wire changed
the predicted FFR by as much as 8%.
Parkes S, Haynes S and Veldsman W (2000) published a BOC investigation into the
chemical composition of C‐Mn welding wires. Wide variations in the actual
composition of the same type and grade of welding wire were observed, Mn levels
varied by as much as 10% whilst Cu content varied by 80%.
2.2.6 Effect of metal vapour in arc welding
Metal vapour is normally formed in arc welding processes by the evaporation of the
molten metal in the weldpool. In the case of GMAW, vapour will form in the wire
electrode and droplets.
Metal vapour will have a significant influence on not only the properties of the arc but
also the shape and size of the weldpool.
The influence of vapour on GMAW arcs has been studied by several researchers
[Murphy A (2010),Schnick M et al (2010); Tashiro S et al (2010) ] from these studies it
has been concluded that with an increase in metal vapour concentration there is a
proportional increase in the radiative emission coefficient across the complete range
of temperatures in the arc.

50
The characteristic appearance of a GMA is due to the fact that the main influence of
the metal vapour is to increase the radiative emission from central arc region, thereby
cooling this region down.
Schnick et al (2010) similarly reported a significant decrease of the temperature of the
central region in the presence of metal vapour.
Figure 33 Calculated values of the temperature (left), the Fe mass fraction (right), and the flow (vectors) in a 250A arc with a vaporisation rate of 1% relative to the 10 m/min wire feed rate[Schnick M et al 2010]
It has further been found that metal vapour normally decreases the arc temperature a
similar effect that is obtained by an increase in the electrical conductivity and radiative
emission.
Voltage however was found to decrease for low metal vapour concentrations and
increase for high metal vapour concentrations.
Murphy concluded that there have been limited investigations into the influence of
wire compositions on vapours and that future research into this area was required.

51
2.2.7 Summary
This literature review has identified that the fume formation rate will be influenced by
several factors. The main factors can be contributed to the transfer mode, shielding
gas composition and the composition of the electrode [Sterjovski Z et al 2006]. The
influence of the transfer mode and shielding gas has received a lot of attention from
several researchers and this is well understood.
The influence of the composition of welding consumables has been researched but the
emphasis of the research has been mainly around the FFR of different processes or
variants of the GMAW such as flux cored and metal cored welding. [Jenkins N T, Pierce
W M and Eagar T W (2005);, Carter G (2002).Modenesi P J and de Avelar R C (1999)
investigated what the influence of small variations in the welding wire has on the arc
stability and concluded that wire diameter has an influence on transfer mode which, in
turn, will influence the FFR. Koshishi F and Shimizu H (2001) concluded that the
removal of the copper coating from solid steel wire will result in lower FFR.
Commercially, non copper coated wires are often sold as “low fume” wire [ESAB
brochure] however ,the fact that the FFR is affected by several factors as described in
this literature study and the lack of scientific proof about the influence that the copper
coating on welding wires has on the FFR, makes this claim difficult to verify.

52
Table 4 Comparative results of FFR and fume dispersion between a copper coated and a uncoppered wire. [Koshiishi F & Shimizu H (2001), Slater (2004)
Sample FFR (mg/min) at 300A
Sample Fume dispersion mg/m P
3
Copper coated 475 Copper coated 82.7
Uncoppered 330 Uncoppered 54.2
In previous attempts to explore this claim a fixed set of welding parameters and a
common shielding gas were used. Wires were, however, selected on the basis of the
diameter of the wire, whether they are coated or uncoated, or on their total copper
content. In many of the reported investigations the consumables are from different
manufacturers and there is little information on the core wire or surface treatment
during production. The copper content reported in the analysis of the wire is usually a
reflection of the total copper content of the wire and includes the amount of copper in
the base material as well as the copper contained in the surface coating of the wire
[Hewitt P J and Hirst A 1993]. Another source of error in previous work is batch to
batch variations of the copper content of the filler wire.
The data summarised in Table 4 indicates that both these researchers have established
that uncoppered wire does produce lower fume levels, however there is no data with
regards to the total copper content or surface condition available. This therefore
makes it difficult to verify the influence of the copper on the increased fume levels.
To eliminate the uncertainty associated with the previous work this study set out to
explore the fume generation rate variations using a single cast of core wire with a
variety of surface treatments under very carefully controlled experimental conditions.
Koshiishi F & Shimizu H (2001) Welding wire ER 70S‐6
Slater (2004) Welding wire ER 70S‐6

53
It was also believed that this approach could lead to a better understanding of the
underlying mechanisms.
54
3.0 Experimental Equipment and Methodology 3.1 Scope
This chapter discusses the experimental equipment that was used to collect the fume
data that was required for the analysis of the FFR between coppered and non‐
coppered wires.
It further describes the analytical equipment and methods that were used for the
characterisation of each of the wires used.
3.2 Introduction
The primary focus of this study was to determine the influence of the copper content
of the welding wire on the FFR.This required that the wire used for the determination
of the FFR was from the same steel cast, it was manufactured using the same process.
The only difference would be in the final surface coating of the wire.To ensure that the
test rig was suitable to accurately determine the FFR a random set of welding wires
was tested and the test results correlated to similar tests conducted by other
researchers [Hilton, 2006].
Wire surface analyses were also conducted to ensure that there were no other surface
abnormalities that would substantially contribute to the FFR.
3.3 Welding apparatus
Gas metal arc welding was performed using an inverter power source [Fronius Synergic
4000]. This welding power source was coupled to a Cigweld Trans Robot WS 0550 (see
figure 2A). The welding robot was programmed to produce a constant tip to work
distance of 20mm and the initial welding parameters were selected to be as close to
the “drop‐spray” transfer regime as possible.

55
Welding was carried out in a modified fume box on ground C‐Mn steel plate and the
welding bead length was equal to 225mm of welding at a set travel speed.
The welding bead length of 225mm was selected as this represented a welding time of
20sec. Previous research work done on the similar apparatus [Sterjovski Z et al 2006]
determined that exceeding 20sec of welding in this apparatus clogged the filter paper
used, and inconsistent results were obtained.
Fume was collected on a Pall A/E glass filter with minimum pane size of 1 qm. Each
filter was weighed before and after welding on a Sartorius balance (with resolution of
0.00g). Each measurement was repeated three times.
The “drop spray” transfer regime has been identified as an area of minimum FFR. This
area can be achieved by limiting the number of “short circuiting” that occurs in the
transition zone from globular to free flight transfer.
0
100
200
300
400
500
600
11378 11379 11380 11381 11382 11383 11384
Am
pe
rag
e (
A)/
Vo
lta
ge
(V
)
Time (sec)
Welding trace Sample C3 AFROX Welding wire
Figure 34 Welding trace taken of a wire welded in the spray regime. A large number of short circuits can be observed which leads to an instability of the welding process. These short circuits can also lead to an increase in the FFR of the sample. Wire ER70S‐6, Shielding gas Ar+18%COR2R + 2%OR2 R. Current line (pink) Voltage line (blue)

56
The University of Wollongong has developed a software package that was coupled to
the inverter power source. The controller minimises the operating voltage (reduces the
arc length) until the electrode tip is infrequently contacting the weldpool. This
produces a minimised fume condition while maintaining a welding condition that
produces an acceptable weld bead with minimum disturbance and spatter. This
transfer is consistent with the transfer that appears in the “drop‐spray” regime
resulting in minimum FFR.
Figure 35 Control panel of the “auto‐controller” developed by the University of
Wollongong.

57
3.4 Wire characterisation
3.4.1 Wire composition.
The chemical composition of all wires was independently determined. Carbon and
sulphur by combustion technique, nitrogen and oxygen by inert gas fusion and all
other elements by wet chemical analysis

58
3.4.2 Surface coating.
The surface coating on the controlled wire sample group was verified by EDS analysis.
The quality and consistency of the copper coating on the wire surface was verified by
optical and electron microscopy.
3.5 Experimental methodology
Welding wires were divided into two distinct groups. These groups will be referred to
as the “uncontrolled” and “controlled” groups.
3.5.1 Uncontrolled group
The uncontrolled group of wired consisted of randomly selected wires from a number
of welding wire suppliers. These wires were either copper coated or uncoated.
A number of wires were also tested that had experimental surface coatings i.e.
“oxidised” and “bronze coated”.
3.5.2 Controlled group
The controlled group of wire consisted of three wires that were specifically
manufactured for this research by the Afrox Consumable Manufacturing facility in
South Africa. These wires were from the same steel cast and were manufactured at the
same time using the exact same wire drawing process.
Two of these wires were coper coated after wire drawing. The copper coating on one
of these wires was polished down to achieve a thinner copper coating thereby
reducing the total copper content.

59
The FFR of both groups of wire were determined by selecting a set of welding
parameters that would yield a typically low FFR. These parameters were kept constant
for all wires of the same diameter. Fume samples were collected and weighed.
The results of these tests were compared with typical results reported by other
researchers.
For the second set of FFR data the “auto control” device developed by the University
of Wollongong was activated.
This resulted in an “optimised” welding condition for each wire. The optimised
condition was in the “drop‐spray” regime and FFR levels were again measured.
(a) High Fume 36V (b) Medium Fume 33V
(c) Low Fume 31V
Figure 37 Voltage waveforms for various fume generation levels [Cuiuri D 2009]

60
3.5.3 Shielding gas
Shielding gas used for all the FFR testing of both the “controlled” as well as the
“uncontrolled” sample group was kept constant. A shielding gas mix of Ar/CO2
(18%)/O2 (2) was used from a pre‐mixed cylinder of gas.
3.6 Summary
The use of the “auto control” device ensured that the minimum FFR for each type of
wire could be obtained.
As noted in the literature study, variations in the transfer mode will influence the FFR
and can lead to incorrect results. Although the selection of constant parameters for
comparative FFR testing of wire are used by several researchers this does not
necessarily achieve the lowest possible FFR for that particular wire.
61
4.0 Experimental results 4.1 Introduction
The composition of welding wires are specified by International standards:
One such standard for C‐Mn steel is the AWS SFA 5.18 2001, “Specification for Carbon
steel Electrodes and Rods for Gas Shielded Arc Welding”
This standard not only specifies the chemical composition of the wire but several other
physical attributes, such as:
Wire diameter
Cast and Helix
Surface appearance.
4.2 Chemical composition.
An initial review of existing analytical data of randomly selected wires from different
manufactures was analysed. The data is represented in Table 5

62
Table 5 Chemical composition (published by the manufacturers) of randomly selected wires from different welding wire manufacturers, BOC wire benchmarking exercise Report FTC 125
Wire % % % % % % % % % % % % % % %
id C Si Mn P S Cr Ni Mo Cu Al Ti V Ca K Sn
1 0.070 0.910 1.580 0.019 0.025 0.023 0.012 <0.005 0.007 <0.005 <0.005 <0.005 0.007 <0.005 <0.005
2 0.058 0.870 1.440 0.026 0.016 0.019 0.013 <0.005 0.007 <0.005 <0.005 <0.005 0.009 <0.005 <0.005
3 0.076 0.860 1.440 0.017 0.022 0.022 0.023 <0.005 0.029 <0.005 <0.005 <0.005 0.005 <0.005 <0.005
4 0.087 0.840 1.420 0.014 0.018 0.027 0.025 <0.005 0.008 <0.005 <0.005 <0.005 0.006 <0.005 <0.005
5 0.074 0.940 1.580 0.011 0.028 0.010 0.032 <0.005 0.047 <0.005 <0.005 <0.005 0.007 <0.005 0.008
6 0.075 0.980 1.590 0.013 0.030 0.004 0.031 <0.005 0.055 <0.005 <0.005 <0.005 0.006 <0.005 <0.005
7 0.098 1.000 1.520 0.012 0.014 0.051 0.078 <0.005 0.039 <0.005 <0.005 <0.005 0.006 <0.005 <0.005
8 0.093 1.000 1.520 0.012 0.013 0.052 0.078 <0.005 0.036 <0.005 <0.005 <0.005 0.005 <0.005 <0.005
9 0.068 0.840 1.420 0.016 0.013 0.032 0.057 0.006 0.053 <0.005 <0.005 <0.005 0.006 <0.005 <0.005
10 0.082 0.920 1.460 0.015 0.005 0.029 0.093 0.015 0.014 <0.005 <0.005 <0.005 0.006 <0.005 <0.005
11 0.081 0.870 1.430 0.020 0.008 0.013 0.013 <0.005 0.020 <0.005 <0.005 <0.005 0.006 <0.005 <0.005
12 0.094 0.840 1.380 0.016 0.009 0.017 0.022 <0.005 0.005 <0.005 <0.005 <0.005 0.009 <0.005 <0.005
13 0.074 0.850 1.480 0.016 0.008 0.030 0.021 0.014 0.033 <0.005 <0.005 <0.005 0.006 <0.005 <0.005
14 0.080 0.650 1.640 0.013 0.009 0.007 0.023 <0.005 0.010 <0.005 <0.005 <0.005 0.009 <0.005 <0.005
15 0.084 0.980 1.640 0.012 0.006 0.008 0.019 <0.005 0.013 <0.005 <0.005 <0.005 0.007 <0.005 <0.005
16 0.075 0.880 1.460 0.013 0.012 0.006 0.023 <0.005 0.009 <0.005 <0.005 <0.005 0.005 <0.005 <0.005
17 0.067 0.920 1.690 0.013 0.022 0.014 0.031 <0.005 0.067 <0.005 <0.005 <0.005 0.007 <0.005 <0.005
18 0.077 0.910 1.640 0.013 0.022 0.014 0.032 <0.005 0.070 <0.005 <0.005 <0.005 0.006 <0.005 <0.005
19 0.089 0.840 1.350 0.014 0.017 0.023 0.021 <0.005 0.036 <0.005 <0.005 <0.005 0.006 <0.005 <0.005
20 0.077 0.880 1.430 0.015 0.018 0.036 0.034 <0.005 0.075 <0.005 <0.005 <0.005 0.007 <0.005 0.005
22 0.073 0.800 1.410 0.019 0.013 0.053 0.032 0.005 0.007 0.006 <0.005 <0.005 0.010 <0.005 0.005
23 0.073 0.760 1.430 0.013 0.013 0.021 0.016 0.005 0.006 <0.005 <0.005 <0.005 0.006 <0.005 0.005
24 0.088 0.810 1.500 0.027 0.023 0.026 0.025 0.017 0.017 0.005 <0.005 <0.005 0.006 <0.005 <0.005
25 0.083 0.810 1.500 0.020 0.019 0.037 0.024 0.023 0.023 0.006 <0.005 <0.005 0.007 <0.005 <0.005
26 0.077 0.800 1.460 0.018 0.012 0.023 0.015 <0.005 0.010 <0.005 <0.005 <0.005 0.008 <0.005 <0.005
27 0.076 0.810 1.430 0.014 0.011 0.018 0.015 <0.005 0.012 0.005 <0.005 <0.005 0.007 <0.005 <0.005
28 0.094 0.880 1.410 0.013 <0.005 0.031 0.021 0.007 <0.005 <0.005 <0.005 <0.005 0.008 <0.005 <0.005
28 0.095 0.840 1.410 0.010 <0.005 0.027 0.021 0.007 <0.005 <0.005 <0.005 <0.005 0.008 <0.005 <0.005
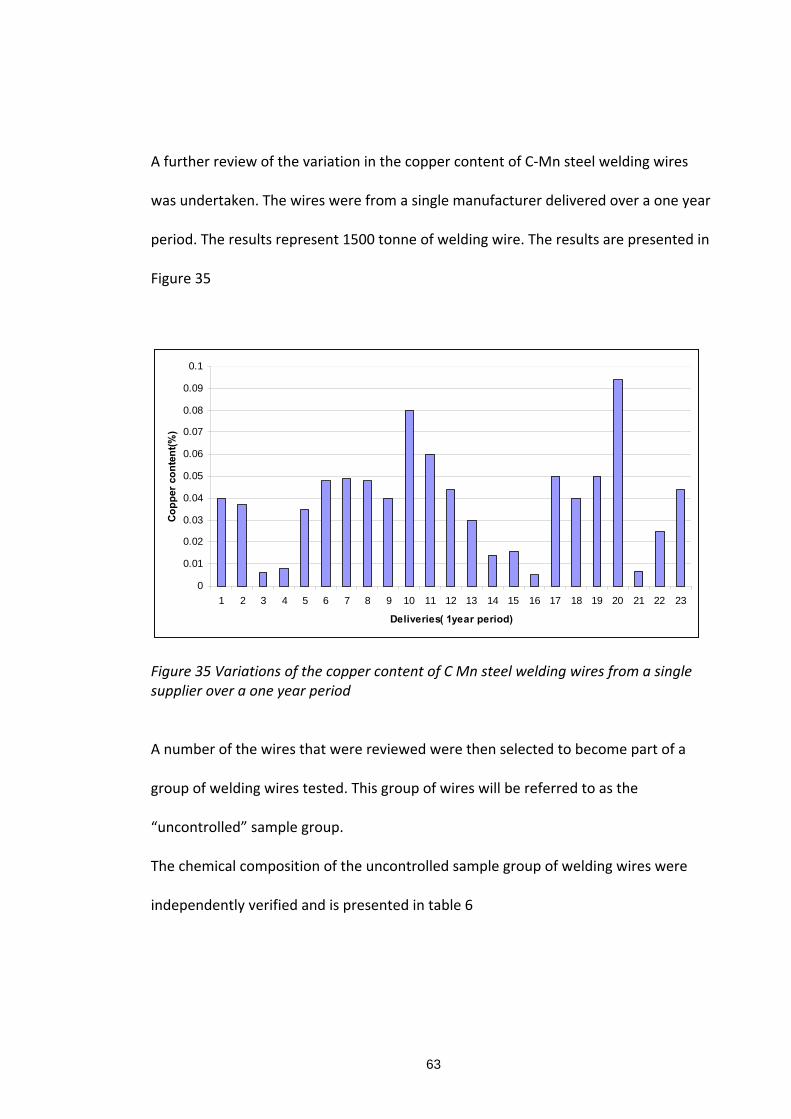
63
A further review of the variation in the copper content of C‐Mn steel welding wires
was undertaken. The wires were from a single manufacturer delivered over a one year
period. The results represent 1500 tonne of welding wire. The results are presented in
Figure 35
0
0.01
0.02
0.03
0.04
0.05
0.06
0.07
0.08
0.09
0.1
1 2 3 4 5 6 7 8 9 10 11 12 13 14 15 16 17 18 19 20 21 22 23
Deliveries( 1year period)
Co
pp
er c
on
ten
t(%
)
Figure 35 Variations of the copper content of C Mn steel welding wires from a single supplier over a one year period
A number of the wires that were reviewed were then selected to become part of a
group of welding wires tested. This group of wires will be referred to as the
“uncontrolled” sample group.
The chemical composition of the uncontrolled sample group of welding wires were
independently verified and is presented in table 6

64
Table 6 Chemical analysis of the uncontrolled group of welding wires independently verified [Bluescope Steel report 2009]
4.2.1 Controlled sample group
A second group of welding wires were used in the FFR determination. This group of
wires was manufactured under strict supervision and was from the same cast of steel.
This group of wires consisted of two copper coated wires and one uncoated wire, it will
be referred to as the “controlled “group Fig 39
AWS SPECIFICATION A B C 70S‐6 D E LW1 C 70S‐6 F
ER 70S‐6; A5.18‐90 SM‐70 ARISTOROD COPPER COAT COPPER COAT COPPER COAT COPPER COAT UNCOATED
Diameter 1.2mm 1.2mm 1.2mm 0.9mm 0.9mm 0.9mm 0.9mm
C* 0.06‐0.15 0.07 0.07 0.07 0.06 0.07 0.06 0.07
S* 0.035 max 0.016 0.015 0.008 0.02 0.007 0.024 0.014
O# 0.015 0.009 0.008 0.004 0.018 0.018
N# 0.006 0.003 0.007 0.008 0.01 0.005
P 0.025 max 0.011 0.012 0.005 0.009 0.015 0.015 0.015
Mn 1.40‐1.85 1.49 1.46 1.48 1.43 1.44 1.42 1.45
Si 0.8‐1.15 0.85 0.87 0.94 0.77 0.84 0.81 0.85
Ni 0.15max 0.012 0.023 0.013 0.044 0.053 0.046 0.019
Cr 0.15 max 0.053 0.045 0.016 0.024 0.061 0.027 0.042
Mo 0.15 max 0.001 0.008 0.015 0.007 0.008 0.007 0.005
Cu 0.5 max 0.011 0.043 0.11 0.34 0.28 0.13 0.033
Al 0.004 0.001 0.003 0.001 0.004 0.004 0.002
Sn <0.001 0.002 <0.001 0.007 0.01 0.002 0.002
Nb <0.001 <0.001 0.001 <0.001 <0.001 <0.001 <0.001
Ti 0.004 0.001 0.015 0.002 0.001 0.001 0.001
V 0.03 max 0.001 0.001 0.005 0.002 <0.001 <0.001 <0.002

65
Figure39 Controlled wire sample group consisting of an uncoppered and two copper
coated wires
These wires were manufactured from the same cast of steel and via the same
processing route.
The chemical composition of these wires were independently verified and the results is
presented in Table 7
Table 7 Chemical analysis of the “Controlled group” of welding wires. The difference in Copper content is as a result of the surface coating AWS SPECIFICATION “C” 70S‐6 “C” 70S‐6 “C” 70S‐6
COPPER COAT #1 COPPER COAT #2 COPPER FREE
C* 0.06‐0.15 0.07 0.07 0.07
S* 0.035 max 0.008 0.008 0.008
P 0.025 max 0.012 0.012 0.012
Mn 1.40‐1.85 1.55 1.56 1.55
Si 0.8‐1.15 0.84 0.85 0.84
Ni 0.15max 0.006 0.006 0.006
Cr 0.15 max 0.018 0.019 0.018
Mo 0.15 max 0.001 0.001 0.001
Cu 0.5 max 0.083 0.13 0.001
Al 0.003 0.003 0.002
Sn <0.001 <0.001 <0.001
Nb 0.001 0.001 0.001
Ti 0.015 0.016 0.015
V 0.03 max 0.004 0.004 0.004

66
4.3 Surface condition
The surface of both the controlled as well as the uncontrolled sample group was
analysed.
The International Standard AWS SFA 5.18 (2001) specifies the following;
“18. Finish and uniformity
18.1 All electrodes and rods shall have a smooth finish which is free from slivers,
depressions, scratches, scale, seams, laps (exclusive of the longitudinal joint in
composite metal cored electrodes), and foreign matter that would adversely affect
the welding characteristics, the operation of the welding equipment, or the
properties of the weld metal.
18.2 Each continuous length of filler metal shall be from a single heat or lot of
material, and welds, when present, shall have been made so as not to interfere with
the uniform, uninterrupted feeding of the filler metal on automatic and semi‐
automatic equipment.
18.4 A suitable protective coating may be applied to any filler metal in this
specification. Copper may be used as a coating for any classification except one that
carries the suffix “N” (nuclear) in its designation.”
Inconsistency of the surface quality and copper coating may lead to variations in the
electrical contact resistance of the wire. This variation could influence the transfer
mode with a subsequent change in the FFR.
The surface appearance of the wires in both the controlled as well as the uncontrolled
group was analysed using both optical as well as electron microscopy.

67
4.3.1 Wire surface analysis of the uncontrolled wire group
1) Cross sectional view 2) Longitudinal view
3) Longitudinal view Figure 40a Surface finish of the uncontrolled sample group(low magnification) Samples
were polished and etched.
1) The fact that the copper has penetrated a surface imperfection is a clear indication
that the copper coating was applied after final drawing of the rod
2) The asperity on the surface of the wire that was plated over by the copper coating
process. Such asperities will cause erratic current pick up in the contact tip that will
lead to a variation in the current
3) Inconsistencies in the copper coating of the surface of the wire. Chemical analysis
has revealed that this sample had the second highest total Cu of the copper coated
samples.
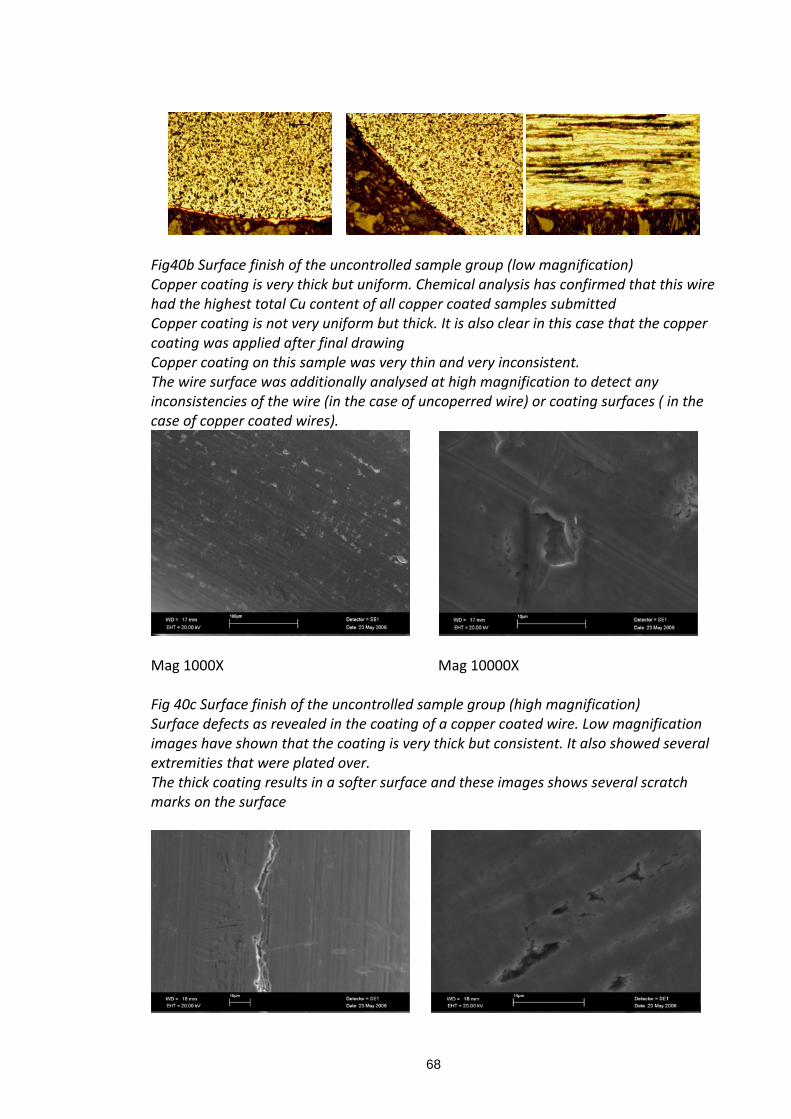
68
Fig40b Surface finish of the uncontrolled sample group (low magnification) Copper coating is very thick but uniform. Chemical analysis has confirmed that this wire had the highest total Cu content of all copper coated samples submitted Copper coating is not very uniform but thick. It is also clear in this case that the copper coating was applied after final drawing Copper coating on this sample was very thin and very inconsistent. The wire surface was additionally analysed at high magnification to detect any inconsistencies of the wire (in the case of uncoperred wire) or coating surfaces ( in the case of copper coated wires).
Mag 1000X Mag 10000X
Fig 40c Surface finish of the uncontrolled sample group (high magnification) Surface defects as revealed in the coating of a copper coated wire. Low magnification images have shown that the coating is very thick but consistent. It also showed several extremities that were plated over. The thick coating results in a softer surface and these images shows several scratch marks on the surface

69
Mag 3000X Mag 3000X
Fig 40d Surface finish of the uncontrolled sample group (high magnification) Longitudinal scratch mark on the surface of the wire most likely caused by a mark on the final polishing and sizing die There are several areas of imperfections on the surface of the copper coated BOC wire. This is consistent of what was observed at lower magnification revealing inconsistencies of the copper coating
Mag 1000X Mag 10000X
Mag 3000X
Fig 40e Surface finish of the uncontrolled sample group (Uncoppered wire) (High magnification) Poor surface quality of the uncoppered wire revealing several deep gouge marks. Extremely poor surface quality of the non‐copper coated wire Also note several deep gouge marks on the surface
4.3.2 Controlled wire group
4.3.2.1 Electron Microscopic analysis of surface appearance
The surface appearance of the wires was determined by electron microscopy at
magnifications of 1000, 3000 and 10 000 times. These images clearly illustrate the
differences in the surface quality of the 3 samples.

70
The uncoppered sample exhibits several deep scorch marks on the surface parallel to
the drawing direction of the wire. These appear as both valleys and peaks on the
surface.
Sample C1 is the coppered coated and polished wire that has the second highest
percentage copper. From the surface image it can be seen that the copper coating has
not yet covered all of the valleys and peaks of the subsurface and several deep gouge
marks can still be seen
Sample C3 is a fully copper coated sample. Most underlying surface imperfections have
been covered over. Some minor surface coating imperfections can be observed.
X1000 magnification Sample C1 coppered Sample C3 Coppered Uncoppered Fig 41(a)
X3000 magnification Sample C1 coppered Sample C3 Coppered Uncoppered Fig 41(b) Fig 41 (a&b) represents the typical surface imperfections that has been noticed on the controlled sample group welding wires Inconsistency of the surface and copper coating will lead to variations in the electrical
resistance of the wire. This variation could influence the transfer mode with a
subsequent change in the FFR.
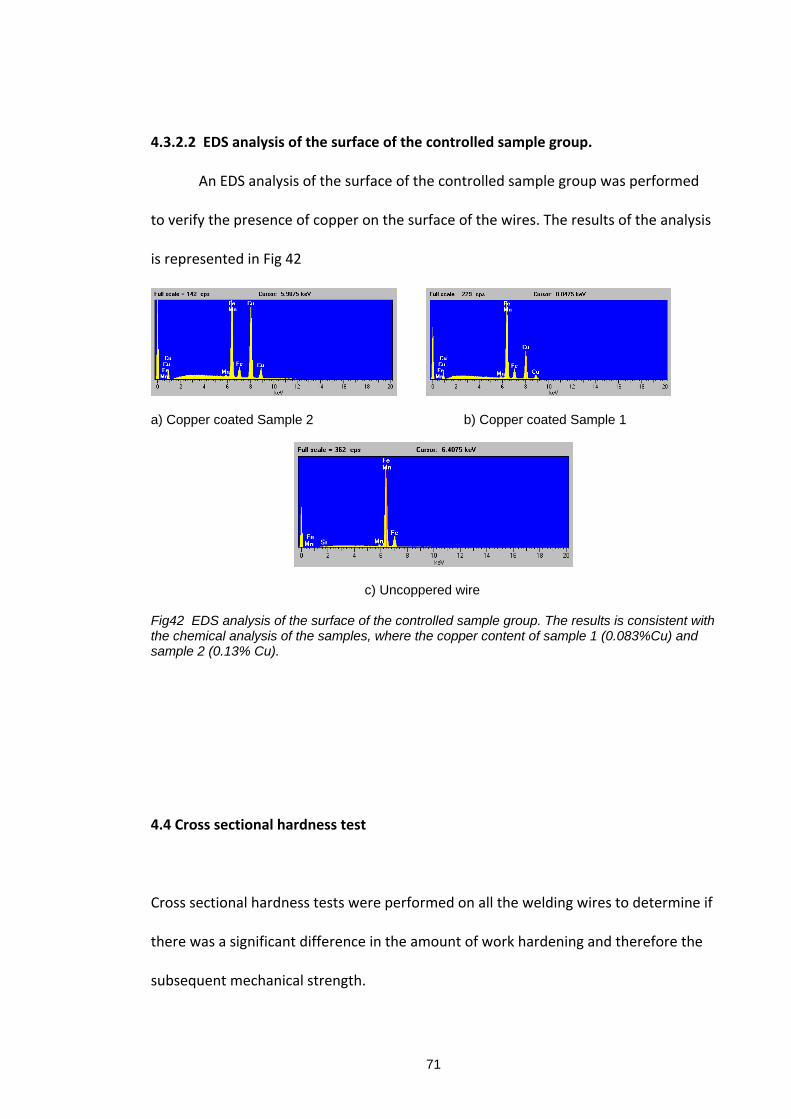
71
4.3.2.2 EDS analysis of the surface of the controlled sample group.
An EDS analysis of the surface of the controlled sample group was performed
to verify the presence of copper on the surface of the wires. The results of the analysis
is represented in Fig 42
a) Copper coated Sample 2 b) Copper coated Sample 1
c) Uncoppered wire Fig42 EDS analysis of the surface of the controlled sample group. The results is consistent with the chemical analysis of the samples, where the copper content of sample 1 (0.083%Cu) and sample 2 (0.13% Cu).
4.4 Cross sectional hardness test
Cross sectional hardness tests were performed on all the welding wires to determine if
there was a significant difference in the amount of work hardening and therefore the
subsequent mechanical strength.
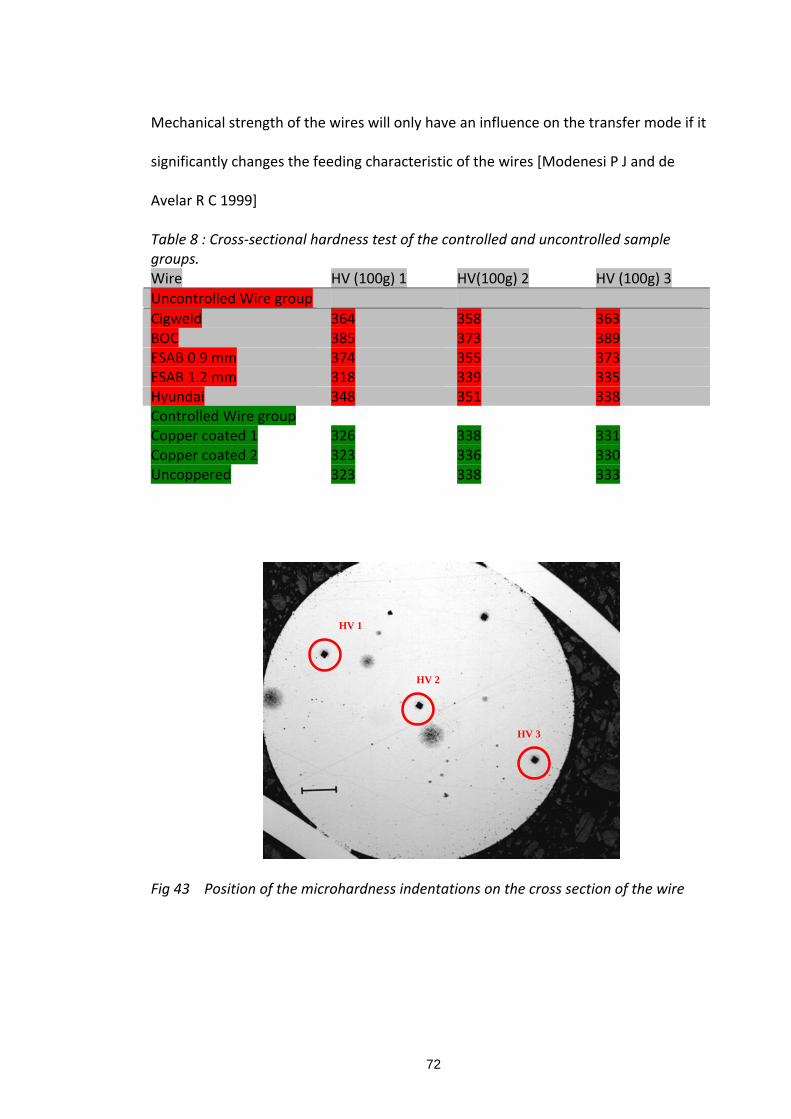
72
Mechanical strength of the wires will only have an influence on the transfer mode if it
significantly changes the feeding characteristic of the wires [Modenesi P J and de
Avelar R C 1999]
Table 8 : Cross‐sectional hardness test of the controlled and uncontrolled sample groups. Wire HV (100g) 1 HV(100g) 2 HV (100g) 3
Uncontrolled Wire group
Cigweld 364 358 363 BOC 385 373 389 ESAB 0.9 mm 374 355 373 ESAB 1.2 mm 318 339 335 Hyundai 348 351 338 Controlled Wire group Copper coated 1 326 338 331 Copper coated 2 323 336 330 Uncoppered 323 338 333
HV 1
HV 2
HV 3
Fig 43 Position of the microhardness indentations on the cross section of the wire

73
4.5 Wire diameter
The diameter of the welding wire is specified by the International standard AWS SFA
5.18‐2001.
The diameter of the wire will have a influence on the transfer mode. Changes as small
as (16%) in wire diameter has resulted in the change of arc stability and transfer mode
[Modenesi and de Avelar 1999].
A study of the diameter of a randomly selected group of wires was conducted by the
Applications laboratory of BOC in Wolverhampton,UK. The results obtained from this
BOC study is shown in Table 9
Table 9 Variation in wire diameter of a randomly selected group of welding wires. BOC Benchmarking exercise Report No: FTC 125 (Measured on multiple sections of the wire using a vernier calipar) Wire diameter measurements
Wire ID Wire diameter (mm) Advertised
Wire diameter (mm) Actual
1 0.9 0.91 3 0.9 0.87 5 0.9 0.88 7 0.9 0.87 9 0.9 0.91
11 0.9 0.9 13 0.9 0.86 15 0.9 0.93 17 0.9 0.92 19 0.9 0.88 21 0.9 0.86 23 0.9 0.87 25 0.9 0.9 27 0.9 0.88
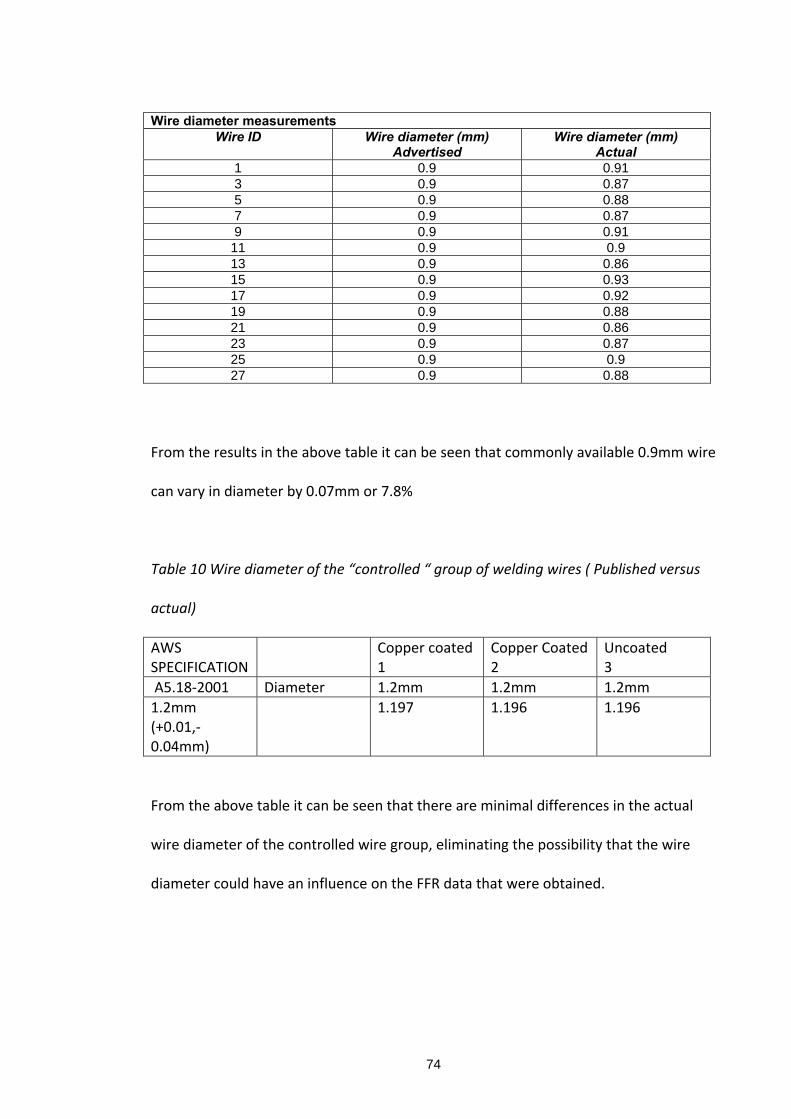
74
Wire diameter measurements Wire ID Wire diameter (mm)
Advertised Wire diameter (mm)
Actual 1 0.9 0.91 3 0.9 0.87 5 0.9 0.88 7 0.9 0.87 9 0.9 0.91
11 0.9 0.9 13 0.9 0.86 15 0.9 0.93 17 0.9 0.92 19 0.9 0.88 21 0.9 0.86 23 0.9 0.87 25 0.9 0.9 27 0.9 0.88
From the results in the above table it can be seen that commonly available 0.9mm wire
can vary in diameter by 0.07mm or 7.8%
Table 10 Wire diameter of the “controlled “ group of welding wires ( Published versus
actual)
AWS SPECIFICATION
Copper coated 1
Copper Coated 2
Uncoated 3
A5.18‐2001 Diameter 1.2mm 1.2mm 1.2mm
1.2mm (+0.01,‐0.04mm)
1.197 1.196 1.196
From the above table it can be seen that there are minimal differences in the actual
wire diameter of the controlled wire group, eliminating the possibility that the wire
diameter could have an influence on the FFR data that were obtained.

75
4.6 Fume formation rate data
Fume formation rate data was collected for all welding wires (controlled and
uncontrolled wire groups) by selecting a fixed set of welding parameters. The only
variation in this data was based on wire diameter. The parameters selected were
based on previous results obtained by researchers and represented the free flight
transfer mode for that particular wire.
4.6.1 Welding parameters
Fixed welding parameters all welding wires
Table 11 Fixed welding parameters for all welding wires per size used in this study
Wire size(mm)
Voltage (V)
Wire feed speed (mm/min)
Current (A)
Contact tip to work distance (CTWD) (mm)
Shielding gas type and flowrate
Travel speed (mm/min)
0.9 29.3 11 230 20 Ar/C0218% 20l/min
765
1.2 30 7.8 240 20 Ar/C0218% 20l/min
765
4.6.2 Fume formation data
The Fume formation rate data for both the controlled and uncontrolled sample groups
were collected using a equal parameter approach. These results were achieved by
using the same set of welding parameters for each wire of each sample group. The
results of the experimental data is summarised in Table 12

76
Table 12 Fume formation rate data for the uncontrolled sample group using a fixed set of welding parameters.(Refer to Table 11 for welding parameters)
Wire Sample/ Wire diameter
Surface coating
Mass of fume collected in 20 sec welding (ave of 3 measurements (g)
FFR (g/min)
“A” SM‐70 1.2mm
Copper Free 0.093 0.279
“B” Aristo Rod 12.5 1.2mm
Copper Free 0.118
0.354
“C” 70S‐6 1.2mm
Copper coated 0.129 0.387
“D” 70S‐6 0.9mm
Copper coated 0.083 0.249
“E” LW1‐5 0.9mm
Copper coated 0.086 0.258
“C” 70S‐6 0.9mm
Copper coated 0.075 0.225
“D” 0.9mm
Copper Free 0.062 0.186
Summary of FFR data for the uncontrolled sample group
Table 13 Fume formation rate data for the controlled sample group using a fixed set of welding parameters.
Wire Sample/ Wire diameter
Surface coating
Mass of fume collected in 20 sec welding (ave of 3 measurements (g)
Fume Formation Rate (g/min)
“C” 70S‐6 (3) 1.2mm
Copper Free 0.129 0.387
“C” 70S‐6 (1) 1.2
Copper Coated 0.153 0.459
“C” 70S‐6 (2) 1.2mm
Copper coated 0.179 0.537

77
4.6.3 Fume formation rates using the “Auto controller” (Optimised condition)
From observations made during the testing of the wires based on selecting a single set
of parameters for all welding trials, it was clear that some of the wires in the controlled
group were performing sub‐ optimally.
Based on the information gathered during the literature study it was clear that these
deviations could lead to increased FFR.
A welding trace of current and voltage of each wire was recorded and studied for the
occurrence of “short‐circuiting” during the spray transfer mode.
These welding traces are presented in Fig 44
BOC coppered Welding trace Sample 1
0
100
200
300
400
500
600
0 1 2 3 4 5 6 7
Time (msec)
Wel
din
g p
ara
met
ers
(V,A
)

78
BOC coppered Welding trace Sample 2
0
100
200
300
400
500
600
0 1 2 3 4 5 6 7
Time (msec)
Wel
din
g p
aram
ete
rs (
V,A
)
BOC uncoppered Welding trace Sample 3
0
50
100
150
200
250
300
350
400
450
0 1 2 3 4 5 6 7
Time(msec)
Wel
din
g p
aram
eter
s (V
,A)
Fig 44(a,b and c) Trace of the electrical parameters (V,A) over a time period. A large number of short circuiting events can be observed. Welding parameters were fixed for all wires. The frequency of these events is greater in the case of the uncoppered wire indicating a higher instability and tendency to short‐circuiting.(Current indicated in pink and voltage in blue)
The fume formation rate tests were repeated for the controlled groups of welding
wires using the “auto control” unit developed by the University of Wollongong.
The “auto control” unit ensured that the optimum welding condition for the drop‐
spray regime for each wire was achieved.

79
With the use of the “auto control” unit the welding parameters could be controlled to
minimise the number of short‐circuits thereby ensuring that the welding wires were
welding in it’s most optimised condition
The improvement in the stability of the welding transfer could visually be observed
and this was verified by the welding trace sample obtained for all the wires in the
controlled group.
0
100
200
300
400
500
600
15961.5 15962.5 15963.5 15964.5 15965.5 15966.5 15967.
We
ldin
g p
ara
me
ters
(V
,A)
Time (msec)
BOC uncoppered Welding trace Sample C1 optimised
Fig 45 Trace of the electrical parameters (V,A) over time using the “Auto controller”. A
significant reduction of short circuiting events can be observed, with respect to Fig44c
indicating a higher degree of stability in the wire that should lead to lower FFR.
From the trace in Fig 45 it is clear that the incidents of short‐circuiting have been
largely eliminated.
Based on the individual optimised parameters for each wire in the controlled group the
FFR was again determined.

80
The results of the FFR of the controlled group of wires in the optimised condition is
presented in the following table
Table 14 Fume formation rate data for the controlled sample group using the “Auto Controller” to optimise the welding parameters for each individual welding wire.
Wire Sample/ Wire diameter
Surface coating
Mass of fume collected in 20 sec welding (ave of 3 measurements (g)
Fume Formation Rate (g/min)
“C” 70S‐6 1.2mm
Copper Free 0.112 0.336
“C” 70S‐6 (1) 1.2
Copper Coated 0.119 0.357
“C” 70S‐6 (2) 1.2mm
Copper coated 0.146 0.438
Summary of FFR data for the Controlled sample group using the “auto controller” to
determine the optimum welding conditions for the lowest FFR for each individual wire

81
4.6.4 Summary of preliminary investigation
4.6.4.1 Uncontrolled sample group
The international standard for C‐Mn welding wire only specifies a maximum copper
content. There has been many attempts to limit the base material copper content to
below 0.15% however this recommendation is not unilaterally accepted.
From the collected data it can be seen that there is a wide variance in the copper
content of welding wires.
The fume formation rate data supports the general statement that the FFR of copper
coated wires are higher than those of uncoppered wires.
This variance in FFR was as low as 18%.
During the determination of the FFR data using fixed welding parameters for all wires
in the “un‐controlled” group it was noted that the arc stability varied to a degree that
the arc transfer mode changed intermittently from the spray regime to a more
globular nature. This intermittent change resulted in higher FFR values.
4.6.4.2 Controlled sample group
The controlled sample group consisted of three wires produced from the same steel
cast and by the same manufacturing route.
The only difference in the wire composition was the total copper content.

82
The initial welding test for the determination of the FFR was done by selecting a fixed
set of welding parameters.
From Table 14 it can be seen that both the copper coated wires had higher FFR
compared to that of the uncoppered wire.
The instability in the arc process for each of the controlled group of wires recorded
during the fixed welding parameter trial and after the “auto control” unit was used.
It can clearly be noted that the arc stability has increased and the number of “short
circuits” decreased.
The FFR results of the controlled group of wires decreased as a result of using the
“auto controller”. The copper coated wires still displayed higher FFR compared to that
of the uncoppered wire.
Table 15 Comparison of the mass of fume collected of the controlled group of wires when using the “Auto Controller” (after), to using a fixed set of welding parameters for all wires (before). Sample Type Before
Fixed parameters (g) After “Auto controller” (g)
“C” 70S‐6 1.2mm
Copper Free 0.129 0.112
“C” 70S‐6 (1) 1.2
Copper Coated 0.153 0.119
“C” 70S‐6 (2) 1.2mm
Copper coated 0.179 0.146
The result that has been obtained from specifically the controlled group of wire
indicates that the increase in the total copper content of the wire will result in an
increase in the FFR. This result confirmed the general statement from previous
researchers. However, it is clear that the increase in fume is not directly linearly
proportional to an increase in copper content this indicates that there may be other
factors apart from the simple increase in copper content that contributes.

83
5.0 Hypothesis 5.1 Proposed hypothesis
The following hypotheses were formulated to help explain the increase of the FFR of
copper coated welding wires:
There is a change in the contact resistance of copper coated wires
Copper increases the anode heating effects
There is copper intrusion into the microstructure of the steel
Copper changes the surface tension of the droplet
5.2 Experimental procedures
A series of experimental procedures were developed to test each of the hypothesis
that were developed.
5.2.1 Change in the contact resistance of welding wire due to a change in the surface
coating.
To eliminate the probability that a large variation in the contact resistance of the
different wires of the controlled sample group contributed to the variation in the FFR,
fume formation measurements were repeated using a patented electrical contact tip.
(Migfast tip)

84
This tip was developed by the CSIRO (Australia) and the Australian Co‐operative
Research centre for welded structures.
Fig 46 Principle operation of the “Migfast” contact tip. (Patent No 6381923,
June3,2008)
The main difference between the “Migfast” tip and a conventional contact tip is the
fact that in conventional contact tips surface contact between the wire and the contact
tip takes place over the entire length of the contact tip, whilst in the case of the
“Migfast” tip contact between the wire and the contact tip is only established at a
single point.
The single point contact should largely eliminate the variation of the contact resistance
observed by Koshiishi F et al (2001) during their FFR experiments. This variation that
has been observed in these experiments would mainly be attributed to the quality of
the surface finish or the consistency of the copper coating along the length of the
welding wire.
The welding parameters selected for the test conducted with the “Migfast” tip were
consistent with those used during the optimised controlled sample group testing.

85
Fume measurements for each of the wires were repeated three times and the average
mass gain of the filter paper was recorded by repeating each measurement three
times.
5.2.2 Copper increasing the anode heating effects
Anode and cathode fall determination
To determine the sum of the anode and cathode fall regions for different materials a
simple experimental set‐up based on a GTAW system. The arrangement is shown in Fig
47.
Fig 47 Experimental set up to determine the cathode/anode fall voltage determination The length of the arc voltage (L) was varied to determine the results. The arc current was held steady at 100 amps. The length of the arc (L) was changed in
fixed increments and the arc voltage, was measured at each increment. The voltage

86
was then plotted against arc length and extrapolated to zero arc length to determine
the sum of the anode voltage drop VRa R and cathode drop Vc ( see figure 53)
The experiment was repeated for both Cu and Fe anodes.
5.2.3 Droplet temperature
Droplet temperature determination has experimentally been determined by Prof M
Tanaka of the University of Osaka Japan (Measurements and Visualizations of 2D
Temperature of Arc Plasma from a monochromator with High speed Video Camera)
and In‐Situ measurement of metal droplet temperature in gas metal arc welding by
two‐colour pyrometry by Yamazaki K et al of the Kobe steel Welding company
As the experimental technique and equipment had already been established at the
Joining and Welding research Institute (JWRI), Osaka University it was decided to
complete the droplet temperature experiments at this facility. The technique consists
of capturing droplet images on a high speed‐high resolution video camera equipped
with a beam splitter and two band pass filters ( 950 and 980 nm wavelength). The
intensity ratio of the two wavelengths is then converted into temperature using
predetermined calibration curve. The resultant image is a temperature map of the
individual droplet. A typical example is shown below in Fig 48

87
Fig 48 Temperature map of an individual droplet as determined by the two colour pyrometry method
The experimental set‐ up is shown in the image below:
Fig 49 Experimental set‐up for the determination of temperature maps of weldmetal droplets using the two colour pyrometry method. 5.2.3.1 Test conditions
A) Equipment used :

88
Powersource OTC DP 350 High speed camera: NAC fitted with a dual stage band pass filters 950 and 980 µm. Capture rate of camera 2000f/sec Data logged with: PowerShot! 2000. Wire: Supplied by Afrox through BOC Australia 3 samples 1) Uncoppered 2) Copper coated Sample 1 (Cu 0.083%) 3) Copper coated Sample 2 (Cu 0.13%) Gas: Ar/20%COR2R Supplied by Air Liquide B) Summary of experimental work
Each test condition was repeated 3 times. The test condition for pulse welding was done only once for each wire Table 16 Welding parameters used for the determination of the droplet temperature by two colour pyrometry.
Sample Wire Feed speed (WFS)
m/min
Arc Voltage (V)
Contact Tip to work distance (CTWD)
Travel speed (mm/min)
Shielding gas
Uncoppered Run 1
8 31.5 20 600 Ar/20%COR2
Uncoppered Run 2
8 32 20 600 Ar/18%COR2
Copper coated
(Sample 1)
8 31.5 20 600 Ar/20%COR2
Copper coated
(Sample 2)
8 31.5 20 600 Ar/20%COR2
Table 17 Pulsed welding parameters used for the determination of the droplet temperature by two colour pyrometry.
Sample Wire Feed speed (WFS) m/min
Arc Voltage
(V)
Pulse Peak
current (A)
Pulse Background current (A)
Pulse width (ms)
Shielding gas
Copper coated (Sample 1)
8 31.5 380 30 1.7 Ar/20%COR2
Copper coated (Sample 2)
8 31.5 380 30 1.7 Ar/20%COR2

89
5.2.4 The presence of copper will change the surface tension.
To determine if the addition of copper to the base material had a significant influence
on the surface tension of the molten metal it was decided to do use a sessile drop
experiment to verify changes in the surface tension.
Fig 50 shows the typical experimental setup for the typical sessile drop determinations.
The experiments were conducted using as sample of the Uncoated and coated wire of
the controlled group of welding wires. (Chemical analysis below)
Table 18 Chemical analysis of wire samples used for the Sessile drop experiments
Sample
/Chemical
analysis (%)
C
S
P
Si
Cu
Coppered
Sample 2
0.07 0.008 0.012 0.84 0.13
Uncoppered 0.07 0.008 0.012 0.85 0.001
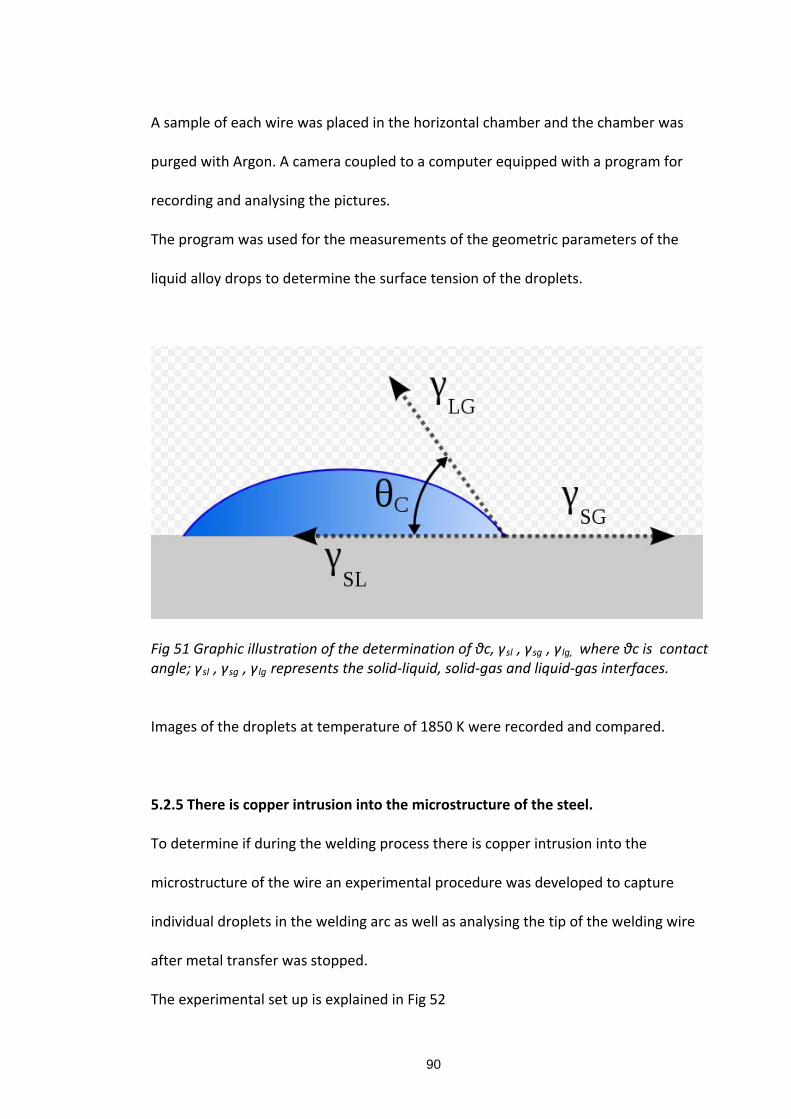
90
A sample of each wire was placed in the horizontal chamber and the chamber was
purged with Argon. A camera coupled to a computer equipped with a program for
recording and analysing the pictures.
The program was used for the measurements of the geometric parameters of the
liquid alloy drops to determine the surface tension of the droplets.
Fig 51 Graphic illustration of the determination of θc, γRslR , γRsgR , γRlg, R where θc is contact angle; γRslR , γRsgR , γRlgR represents the solid‐liquid, solid‐gas and liquid‐gas interfaces.
Images of the droplets at temperature of 1850 K were recorded and compared.
5.2.5 There is copper intrusion into the microstructure of the steel.
To determine if during the welding process there is copper intrusion into the
microstructure of the wire an experimental procedure was developed to capture
individual droplets in the welding arc as well as analysing the tip of the welding wire
after metal transfer was stopped.
The experimental set up is explained in Fig 52

91
Fig52 Experimental set up for capturing single droplets for metallographic examination
The experimental procedure involved creating a small air gap between two workpieces
and capturing the droplet transfer in the arc when the Mig torch was moved across
this gap.
The droplets were collected in a container filled with water placed directly below the
air gap.
The Droplets of both the coppered coated and uncoppered wires were collected and a
metallographic examination of these was carried out.
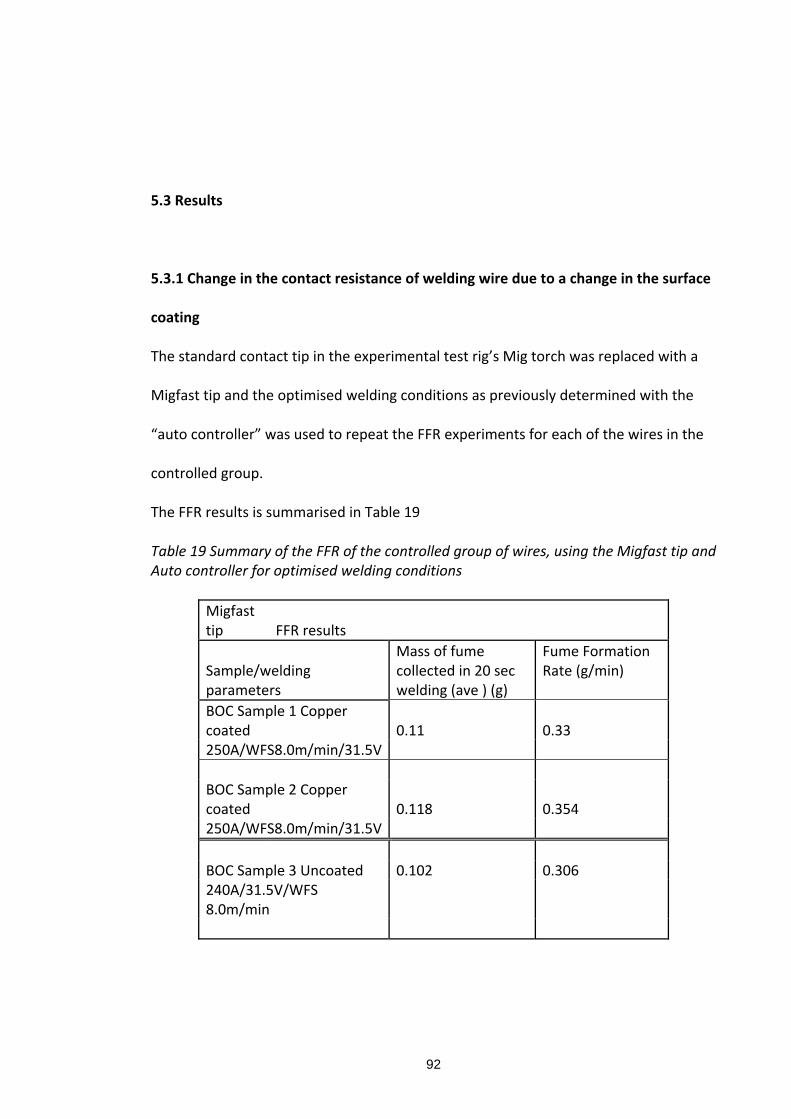
92
5.3 Results
5.3.1 Change in the contact resistance of welding wire due to a change in the surface
coating
The standard contact tip in the experimental test rig’s Mig torch was replaced with a
Migfast tip and the optimised welding conditions as previously determined with the
“auto controller” was used to repeat the FFR experiments for each of the wires in the
controlled group.
The FFR results is summarised in Table 19
Table 19 Summary of the FFR of the controlled group of wires, using the Migfast tip and Auto controller for optimised welding conditions
Migfast tip FFR results
Sample/welding parameters
Mass of fume collected in 20 sec welding (ave ) (g)
Fume Formation Rate (g/min)
BOC Sample 1 Copper coated 0.11 0.33 250A/WFS8.0m/min/31.5V
BOC Sample 2 Copper coated 0.118 0.354 250A/WFS8.0m/min/31.5V
BOC Sample 3 Uncoated 0.102 0.306 240A/31.5V/WFS 8.0m/min
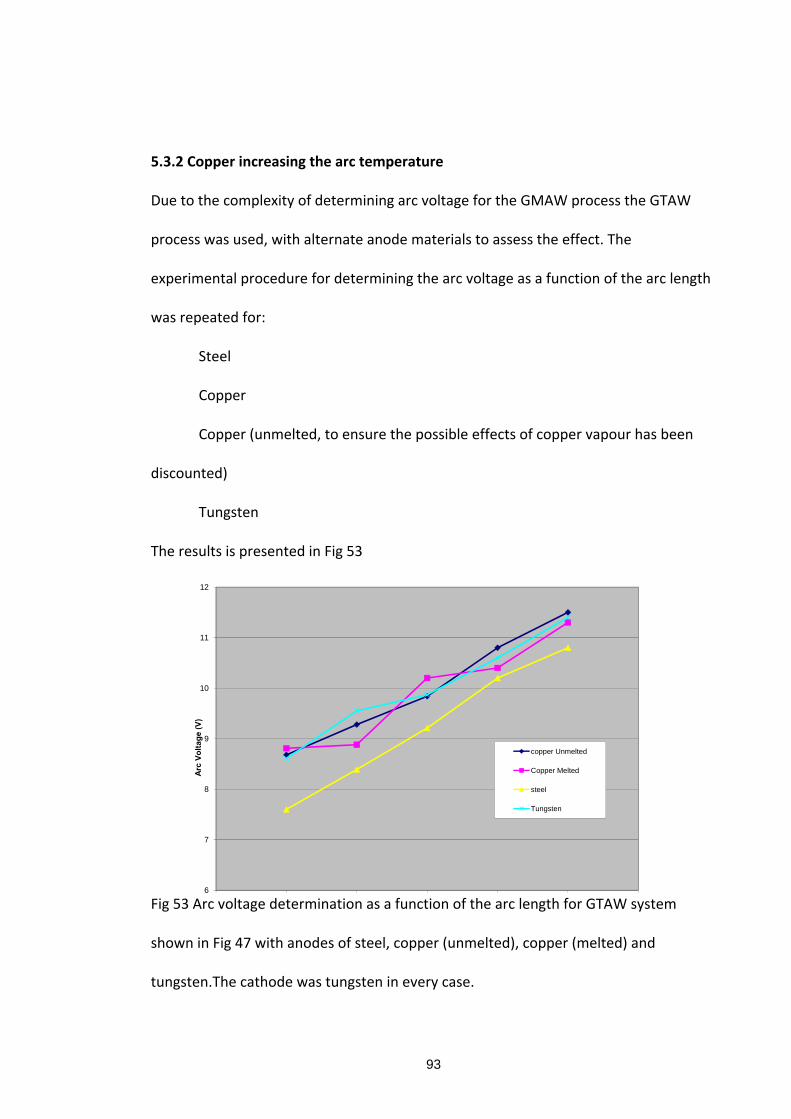
93
5.3.2 Copper increasing the arc temperature
Due to the complexity of determining arc voltage for the GMAW process the GTAW
process was used, with alternate anode materials to assess the effect. The
experimental procedure for determining the arc voltage as a function of the arc length
was repeated for:
Steel
Copper
Copper (unmelted, to ensure the possible effects of copper vapour has been
discounted)
Tungsten
The results is presented in Fig 53
6
7
8
9
10
11
12
Arc
Vo
ltag
e (V
)
copper Unmelted
Copper Melted
steel
Tungsten
Fig 53 Arc voltage determination as a function of the arc length for GTAW system
shown in Fig 47 with anodes of steel, copper (unmelted), copper (melted) and
tungsten.The cathode was tungsten in every case.

94
Fig 54 Arc voltage determination for steel and copper as a function of arc length. The
lines have been extrapolated to provide a typical anode plus cathode fall voltage
From the results obtained in Fig 54 and substituting the values in the anode heating
rate equation
qRaR = (vRaR + Φ + 3/2 (kT/e)) I [Lancaster J F 1986]
Φ = 4V
3/2 (kT/e) = 0.5
I = 280A
For steel vRaR = 6.77 V and for copper vRaR = 7.87V
For steel qRaR = (6.77 + 4 + 0.5)280 = 3.156kW…………………………………………..(a)
For copper qRaR = (7.87 + 4 + 0.5)280 = 3.464kW………………………………………..(b)
Substituting the values obtained from a) and b) above into the equation
For steel qRaR = 3.156kW from (a) above and for copper qRaR = 3.464kW

95
HRmR = 272 Kj
A = 0.6mm (electrode radius)
Ρ = 7.2g/cm P
3
CRpR = 0.46Kj/Kg/P
0PK
TRmR = 1535P
oPC
the droplet temperature can be calculated.
TRdR steel = 943.8
TRd Rcopper = 943.9
5.3.3 Droplet temperature
The droplet temperature images were captured using the experimental setup of the
University of Osaka.
The experiments were repeated for all the samples in the controlled sample group
using the same parameters as achieved during the optimised FFR experiments.
The temperature maps of the droplets are presented in the Fig 55 below.
Fig 55 (a) Copper coated sample 1

96
Fig 55 (b) Copper coated sample Temperature maps of single droplets of the copper coated wires as determined by the two colour pyrometry method.
Fig 56 Uncopperred wire Temperature maps of single droplets of the uncoated wires as determined by the two colour pyrometry method.
An average temperature as a percentage of the droplet area was calculated. Fig 57
gives a comparison of this data for the copper coated sample C2 and the uncoppered
sample of the controlled sample group

97
Fig 57 A comparison of the average temperature as a function of the droplet area between the copper coated wire (Sample C2 (C2DC)) and uncoated wire UCDC1. X‐axis represents % of the droplet area and Y‐axis P
0PK
The average droplet temperature for the wire samples are given in Table 20. It should
be noted that these techniques only measure droplet surface temperature. This is
probably more relevant when considering surface evaporation, but may not reflect the
bulk temperature of the droplet. From this table it can be seen that the average drop
temperature of the copper coated wires are higher than that of the uncoppered
sample.
Table 20 Average droplet temperature as determined with the two colour pyrometery
technique
Sample Average droplet
temperature
( P
oPK)
Average temperature of
sample droplets
Copper coated sample C2
(Highest copper content)
2107.1;2160.9;2191.8
2153.3

98
Copper coated sample C1
( Higher copper content)
2162.5;2122.5;2091
2125.3
Uncoppered sample 2155.6;2097.7;2067.3 2106.9
5.3.4 The presence of copper will change the surface tension
The sessile drop experiment was used to determine the possible influence that the
addition of copper has on the surface tension of welding wires.
A sample of the uncoppered wire and a sample of the coppered wire of the controlled
group were prepared for the Sessile drop experiment.
The images of the two droplets are given in Fig 58
a b Fig 58 Images of the droplets obtained during the Sessile drop experiment; a) Copper coated wire, b) Uncoated wire. Wire samples were accurately weighed to ensure that they were equivalent From the images obtained during the Sessile drop experiment it can be seen that in the
case of the uncoated wire the surface tension is higher than that of the copper coated
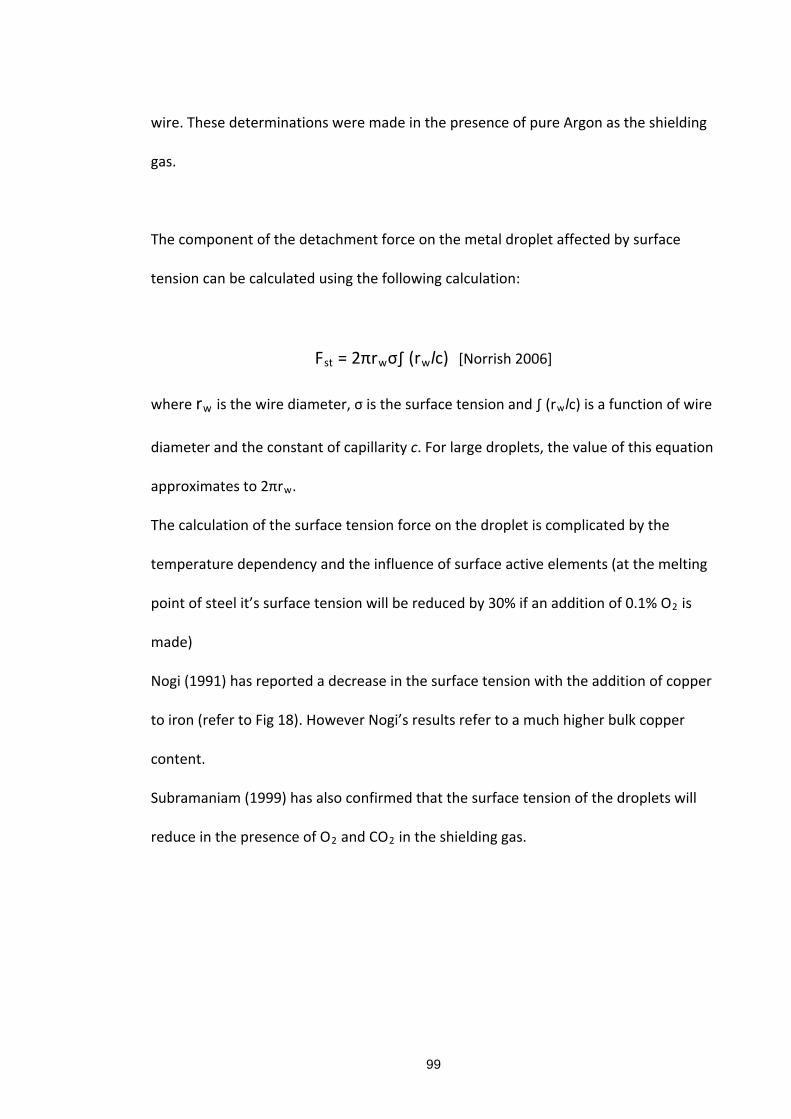
99
wire. These determinations were made in the presence of pure Argon as the shielding
gas.
The component of the detachment force on the metal droplet affected by surface
tension can be calculated using the following calculation:
FRstR = 2πrRwRσ∫ (rRwRlc) [Norrish 2006]
where rRwR is the wire diameter, σ is the surface tension and ∫ (rRwRlc) is a function of wire
diameter and the constant of capillarity c. For large droplets, the value of this equation
approximates to 2πrRwR.
The calculation of the surface tension force on the droplet is complicated by the
temperature dependency and the influence of surface active elements (at the melting
point of steel it’s surface tension will be reduced by 30% if an addition of 0.1% OR2R is
made)
Nogi (1991) has reported a decrease in the surface tension with the addition of copper
to iron (refer to Fig 18). However Nogi’s results refer to a much higher bulk copper
content.
Subramaniam (1999) has also confirmed that the surface tension of the droplets will
reduce in the presence of OR2R and COR2R in the shielding gas.
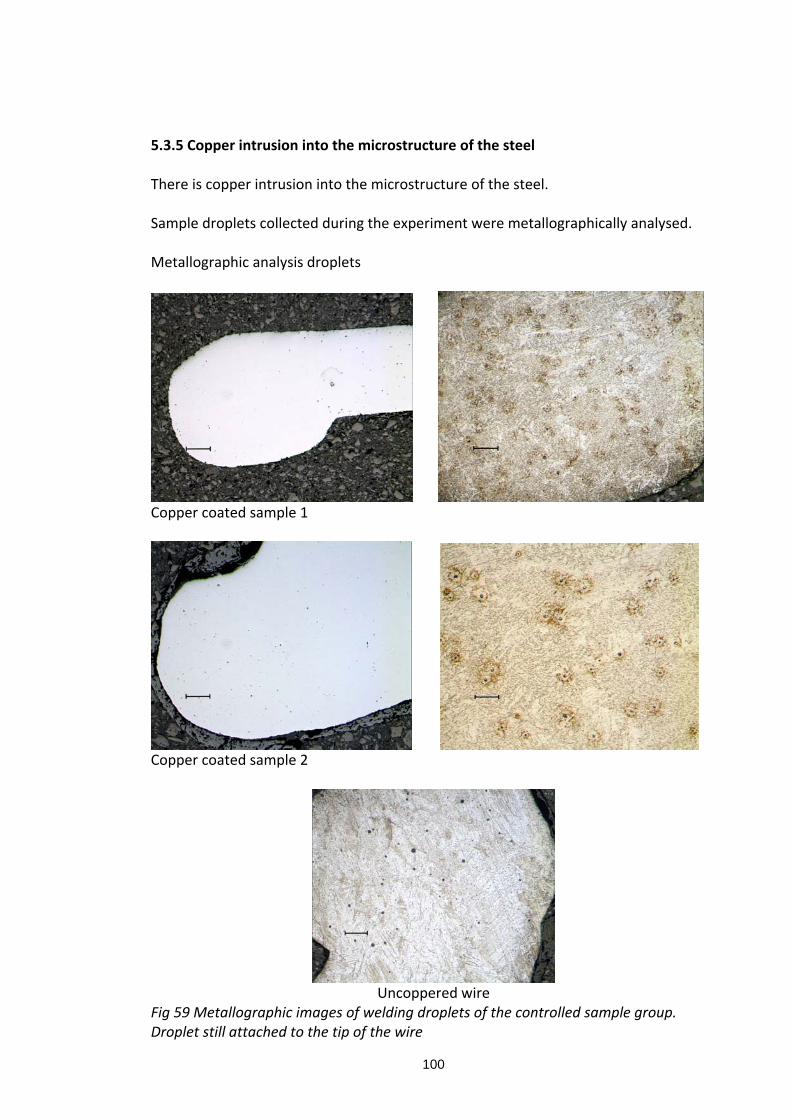
100
5.3.5 Copper intrusion into the microstructure of the steel
There is copper intrusion into the microstructure of the steel.
Sample droplets collected during the experiment were metallographically analysed.
Metallographic analysis droplets
Copper coated sample 1
Copper coated sample 2
Uncoppered wire
Fig 59 Metallographic images of welding droplets of the controlled sample group. Droplet still attached to the tip of the wire

101
No evidence of copper intrusion into the microstructure of the captured droplets could be detected. However from high magnification images and surface analyses probing it was detected that the surface copper of the copper coated wires was absent close to the backend of the droplet that formed on the end of the wire. Beyond this area there is an area of surface deposit before the copper coating was intact some further distance away from the droplet, as can be seen in the images below.
Fig 60 SEM images of the controlled group copper coated welding wire with droplet
attached
A similar observation could be made from the uncoppered wire where re‐deposition
has taken place behind the droplet on the surface of the wire. An analysis of the
deposition revealed that it was rich in iron and manganese. Fig 61 (b) shows a cross
section of the wire clearly showing the re‐deposition layer on the wire.

102
a) b) Fig 61 SEM images of the controlled sample group uncoppered welding wire with droplet attached, a) clearly shows a deposition on the surface of the wire and b) is a cross‐section through the wire in the area were the surface deposition is present Fig 62(a) shows the copper coated wire with the droplet attached. Three areas can be
observed, firstly an area behind the droplet where there is no copper coating
remaining on the surface of the wire, secondly an area where re‐condensation on the
surface of the wire has taken place and thirdly the normal surface appearance of the
wire
Fig 62 (b) shows the arc plasma of the copper coated wire of the controlled sample
group welded using the “auto controller” to ensure the most optimised welding
condition. Using this image to correlate the finding observed in Fig 60, Fig 61 and Fig
62 (a) the following can be concluded:
a) The area of no copper on the surface correlates with the presence of the arc
plasma,
b) The area of re‐condensation falls just outside the arc plasma and
c) The undisturbed copper coating is well outside the plasma area
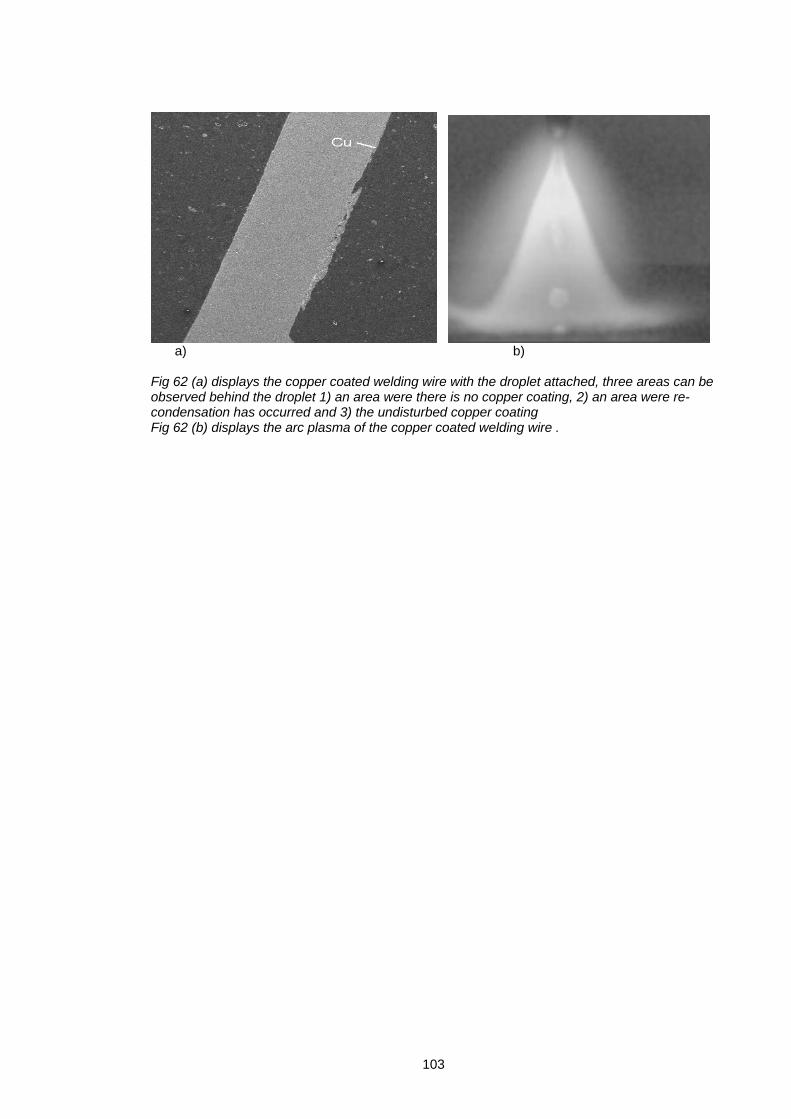
103
a) b)
Fig 62 (a) displays the copper coated welding wire with the droplet attached, three areas can be observed behind the droplet 1) an area were there is no copper coating, 2) an area were re-condensation has occurred and 3) the undisturbed copper coating Fig 62 (b) displays the arc plasma of the copper coated welding wire .
104
6.0 Discussion 6.1 Discussion of Results
This thesis describes an investigation into the fume formation rates (FFR)
generated by solid carbon steel welding wires, and in particular the influence of copper
on the FFR.
The preliminary investigation included the determination of the FFR of commercial
copper coated and uncoated welding wires. The aim of this investigation was to
investigate previous claims that there is an increase in the FFR if the wire is copper
coated.
All of the FFR determinations were carried out in a dedicated fume chamber, the
design which was in conformance with the design of a modified American Welding
Society (AWS) chamber. This enabled comparison of the results with previously
obtained published data.
6.2 Results of the preliminary investigation
The initial FFR tests were performed on a randomly selected group of welding
wires commonly sold in the industry. This group of wires are referred to as the
“uncontrolled sample group” throughout this thesis.
A fixed set of welding parameters was selected for the test conducted on all the
welding wires in this group. Using a fixed set of welding parameters is the normal
approach taken by several researchers in the past.
This study of the FFR of solid carbon steel GMA welding wires, confirmed that under
comparable conditions there was an increase in the FFR of the copper coated wires
compared to the uncoated wires.
105
The results however did not support previous findings that the FFR of copper coated
wires were typically 30% higher than that of uncoated wires. Results obtained during
this phase of the investigation varied between a increase of 18% to 38% in the FFR of
copper coated wires. From observations made during the initial study it was found that
there was varying degrees of arc instability amongst the wires with the uncoated wires
being the most unstable.
From the literature study it is clear that arc instability can lead to an increase in the FFR
of a particular wire [Koshishi F 2001]
To determine the cause of the varying arc instabilities for the commercial welding
wires an investigation into the size and surface condition of all the wires was
undertaken.
The results of this investigation confirmed that there were large differences to be
found not only in the surface appearance of the wires, but also the uniformity and
thickness of the copper coating in the case of the copper coated wires. Several deep
scratch marks as well as surface cracking was found in some of the uncoated wires.
These differences were thought to be pronounced enough that it could have an
influence in particular the feedability of the wire which in turn may affect the arc
stability. Arc stability will have an affect on the FFR.
Investigation of the diameter of the wire indicated that there was a difference in
diameter of 7.8 % between the wires. Testing during the fixed parameter phase was
done at a set current and changes in the wire diameter will lead to a change in the
current density. Current density has a direct effect on burn off rate and metal transfer
behaviour.

106
Whilst these preliminary tests show some support for previously reported results the
results are obviously affected by:
Arc instability, variations in surface condition, wire diameter and chemical
composition could therefore be contributing factors to the variations found in the FFR
of the uncontrolled wire group.
The chemical analysis of the wires in the uncontrolled sample group was compared
and large variations in not only the copper content, but also the Mn, Si and C content
of the wires were observed. It was also noted that instances occurred where the total
copper content of an uncoated wire was higher than the total copper content of a
copper coated wire, this could be due to the use of secondary processed steel for the
core wire. In the current work this discrepancy was avoided by the use of the carefully
controlled wires as described.
This observation confirmed that it is important to verify the chemical composition of
the welding wire if any comparison is to be drawn between copper coated and
uncoppered wires.
To eliminate some of the uncertainty in the FFR of the uncontrolled sample group, the
samples were re‐tested but in this case every individual wire was tested using an
optimised set of welding parameters for that particular wire.
Optimisation of the welding parameters was achieved by employing the “auto‐control
system” that was developed by the University of Wollongong.
The primary function of the “auto‐control system” is to allow the operation of a stable
condition at the low current end of the spray transfer region. It achieves this by

107
adjusting the arc voltage to prevent short circuiting whilst maintaining a very short arc
length.
As a result of the optimisation of the welding parameters the FFR of the uncontrolled
sample group as determined in this condition was lower than in the initial tests.
Particularly in the case of the uncoppered wire which had exhibited the highest level of
arc instability during the fixed parameter testing. As a result the FFR decreased by a
further 6%.
This result clearly demonstrates that if the welding wires are to be compared with
respect to the FFR then it is imperative to ensure that all wires are tested at their
optimum welding parameters however there still remain uncertainties with reference
to the chemical composition and surface quality of each wire.
6.3 Results of the second phase of the investigation ( Controlled sample group)
For the second phase of this investigation it was attempted to eliminate as
many variables as possible with regards to the selection of wires for testing.
Three wires were produced by the consumable manufacturing plant of Afrox in South
Africa. These wires were produced from the same original cast of rod material. The
primary manufacturing route for all wires was the same and the only difference was
the final surface coating. Two wires were copper coated and the third left uncoated.
One of the two copper coated wires was polished which removed a percentage of the
copper coating resulting in a lower total copper content.
The chemical analysis of the wires was independently verified and EDS analysis
confirmed lower copper levels on one of the welding wires.

108
The surface appearance of the controlled group of wires was analysed and only minor
differences between the two copper coated wires could be detected. The uncoppered
wire surface was smooth and free of any noticeable defects.
A similar approach to that of the uncontrolled sample group was taken where the FFR
of the “controlled’ sample group was established using a fixed set of parameters. In
the second stage the welding parameters again were optimised for each wire using the
“auto‐control system”.
The results achieved were similar to that of the uncontrolled sample group, where the
wire with the highest copper content also had the highest FFR.
The result was similar for the controlled wire group tested in the optimised condition,
however the FFR of all wires were lower than in the case of the fixed parameters.
Table 21 Comparison between the FFR of the controlled sample group using fixed and optimised welding conditions
Sample Type Before Fixed parameters
After “Auto controller”
BOC Sample 3 ER 70S‐6 1.2mm
Copper Free 0.129 0.112
BOC Sample 1 ER 70S‐6 1.2mm
Copper Coated 0.153 0.119
BOC Sample 2 ER 70S‐6 1.2mm
Copper coated 0.179 0.146
The result achieved in this part of the investigation is of significant importance as this
has now compensated for any possible variation, except for the variation in the copper
content of the welding wire itself.

109
The results confirm that there is an increase in the FFR when there is an increase in the
copper content of the welding wire.
The results obtained in this part of the investigation indicate that the increase in FFR is
not directly linearly proportional to the increase in the copper content
0
0.1
0.2
0.3
0.4
0.5
0.6
0.000
0.020
0.040
0.060
0.080
0.100
0.120
0.140
1 2 3
FF
R (
g/m
in)
Co
pp
er c
on
ten
t (%
)
Sample number
Cu Content
FFR (g/mm)
Fig 63 Increase in FFR as a result of an increase in copper content
The presence of copper in welding wires will result in an increase in the FFR of the
wire.
The FFR of all welding wires will increase with an increase in current, yet it does show a
sharp decrease in a very narrow region beyond the globular transfer region. This
region known as the drop‐spray region has the lowest FFR levels of all the free‐flight
transfer modes.
Using the “auto‐control system” allowed this investigation to establish the optimal
welding condition for each wire where the FFR will be at its lowest.
The droplet transfer across the arc for all the wires in the controlled sample group was
captured using high speed photography. A comparison between the average droplet
size of the coppered wire and uncoppered wire is shown in Fig 64.

110
Fig 64 (a) (b) Fig 64 Droplet images obtained using high speed photography of the transfer that occurred during the FFR experiments using the “auto controller” Fig 64(a) is the copper coated wire and (b) the uncoated wire No significant difference between the average droplet volume between the two different wires could be observed. 6.4 Results of the investigation into the mechanisms that causes an increase in FFR of
copper coated wires
The early part of this work confirmed that higher FFR is expected with copper
coated GMAW consumables even under rigorously controlled experimental conditions.
The third part of the investigation concentrated on investigation of mechanisms that
could explain the reason for the increased FFR experienced with the copper coated
wires.
Several hypothesis were formulated and tested.
These were:
1) There is a change in the contact resistance of copper coated wires
2) There is copper intrusion into the grain boundaries of the molten steel
droplet
3) Copper changes the surface tension of the droplet
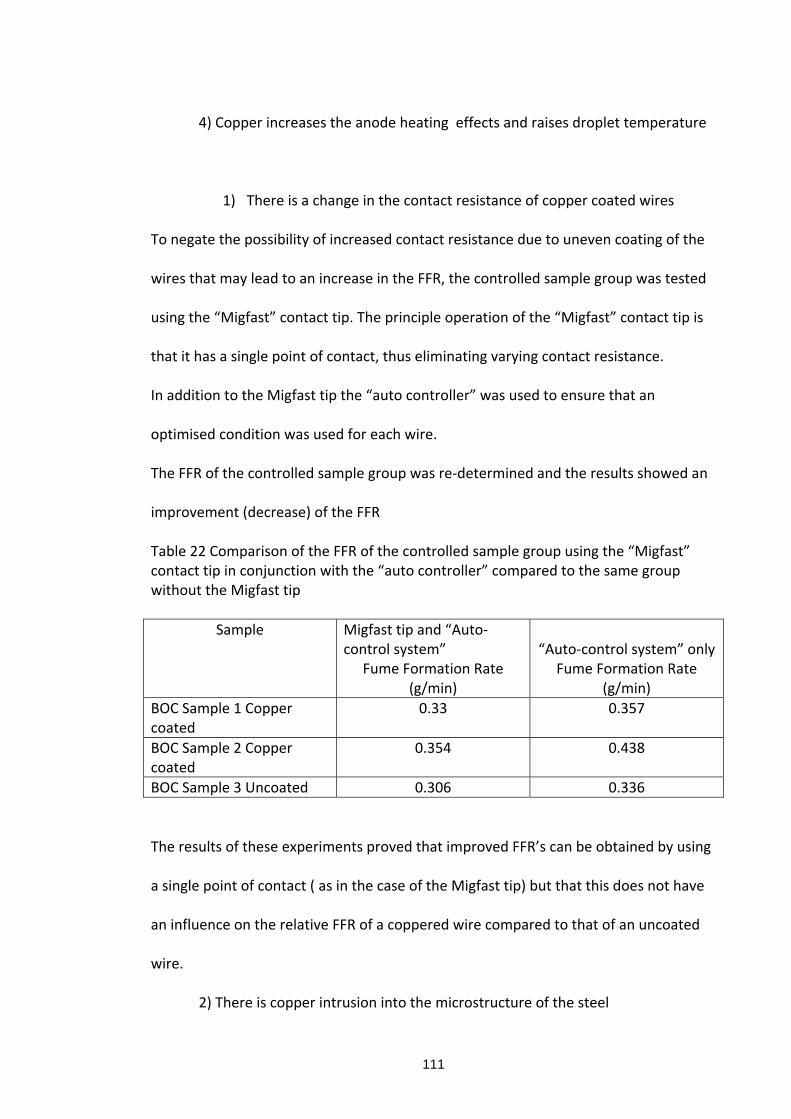
111
4) Copper increases the anode heating effects and raises droplet temperature
1) There is a change in the contact resistance of copper coated wires
To negate the possibility of increased contact resistance due to uneven coating of the
wires that may lead to an increase in the FFR, the controlled sample group was tested
using the “Migfast” contact tip. The principle operation of the “Migfast” contact tip is
that it has a single point of contact, thus eliminating varying contact resistance.
In addition to the Migfast tip the “auto controller” was used to ensure that an
optimised condition was used for each wire.
The FFR of the controlled sample group was re‐determined and the results showed an
improvement (decrease) of the FFR
Table 22 Comparison of the FFR of the controlled sample group using the “Migfast” contact tip in conjunction with the “auto controller” compared to the same group without the Migfast tip
Sample Migfast tip and “Auto‐control system”
Fume Formation Rate (g/min)
“Auto‐control system” only
Fume Formation Rate (g/min)
BOC Sample 1 Copper coated
0.33 0.357
BOC Sample 2 Copper coated
0.354 0.438
BOC Sample 3 Uncoated 0.306 0.336
The results of these experiments proved that improved FFR’s can be obtained by using
a single point of contact ( as in the case of the Migfast tip) but that this does not have
an influence on the relative FFR of a coppered wire compared to that of an uncoated
wire.
2) There is copper intrusion into the microstructure of the steel

112
The metallographic examination of the detached droplet samples as well as the
droplet formed at the tip of the wire does not support the theory that there may be
copper intrusion into the microstructure of the welding wires. Furthermore
examination of the wire indicates that the copper coating is vaporised above the
molten droplet.
3) Copper changes the surface tension of the droplet
The outcome of the results obtained during the Sessile drop experiments indicated
that there is an increase in the surface tension of the uncoppered wires compared to
that of coppered wires. These measurements were obtained in a 100% Argon
atmosphere and are consistent with the expected effect of copper reported in the
literature. Subramaniam (1999) has reported that there is a reduction in the surface
tension of the welding droplets in the presence of OR2R and C OR2R in Argon shielding gas.
The experimental procedure followed by Subramanian does not indicate if the wire
was copper coated or uncoated. The differences in copper content are however very
small,as is the potential change in surface tension. If the effect were significant it
would be expected to result in a change in metal transfer behaviour (droplet size and
frequency) which could affect FFR. Examination of the high speed video footage of
metal transfer did not indicate such changes.

113
4) Copper increases the anode heating rate effects
It was postulated that an increase in droplet temperature could be caused by the
effect of copper on the anode heating.
Anode heating is given by
qRaR = (vRaR + Φ + 3/2 (kT/e)) I [Lancaster J F 1986]
Other than the anode voltage drop VRaR; most of these variables are unlikely to be
affected by copper additions to the wire.
Results obtained from GTAW experiments with copper and steel anodes indicated that
copper causes an increase in the anode voltage drop which will increase the anode
heating rate.
From the anode heating rate results it could be expected that the mean temperature
of the transferring drops will be higher in the presence of copper.
Droplet temperature measurements were determined using the experimental set‐up
of the JWRI of the Osaka University of Osaka, Japan as described by Tanaka (Tanaka,
2009). The intensity of two wavelengths (950 and 980nm) in an image of the droplet
captured by a high speed camera was determined The ratio of the intensities was
converted to temperature in Excel using an algorithm and the values were graphed as
temperature maps.

114
C1 DC
Fig 65 Temperature map representing the temperature distribution within
welding droplets. Data collected during experiments at University of Osaka, Japan.
Using 1800P
PK as a typical droplet boundary value the droplet area for each droplet was
calculated from these boundary maps.
Within the droplet boundary a further calculation was made of all points higher than
2100P
PK. This was expressed as a ratio compared to the total droplet area.

115
Fig 66 The number of high temperature points expressed as a ratio compared with the
total volume of the droplet.
From this image it can be seen that the copper coated wire displays on average a
higher ratio of high temperature points compared to that of the uncoppered wire. A
further calculation of the droplet temperature using the temperature maps was made
to determine the individual droplet temperatures.
Table 23. The average droplet temperature of the three controlled sample wires using the temperature maps obtained during experiments at the University of Osaka Japan
SAMPLE
Copper coated
wire
Sample C2
Copper coated
wire
Sample C1
Uncoppered wire
2107.2 2162.5 2155.6
2160.9 2122.5 2097.7
TEMPERATURE
(°K)
2191.8 2091 2067.31
Average 2153.3 2125.3 2106.9

116
From these temperature maps the following conclusions were made.
There is some evidence of higher droplet temperature from 2150K to 2350K in the
copper coated sample.
The measurements of the individual droplets indicate that the copper coated sample
droplets have a higher average temperature than the uncoppered sample.
The evaporation constants for both Fe and Cu as a function of temperature are given in
fig 67
0
0.005
0.01
0.015
0.02
0.025
0.03
0.035
0.04
1800
1850
1900
1950
2000
2050
2100
2106
2125
2150
2153
2200
2250
2300
2350
2400E
vapo
ratio
n co
nsta
nt
˚K
Cu p
Fe p
Fig 67 Change in the Evaporation constants of Cu and Fe with: a) Uncoppered wire;
b) Coppered wire (Sample 1 Cu = 0.083%) ; Coppered wire( Sample2 Cu = 0.13%)
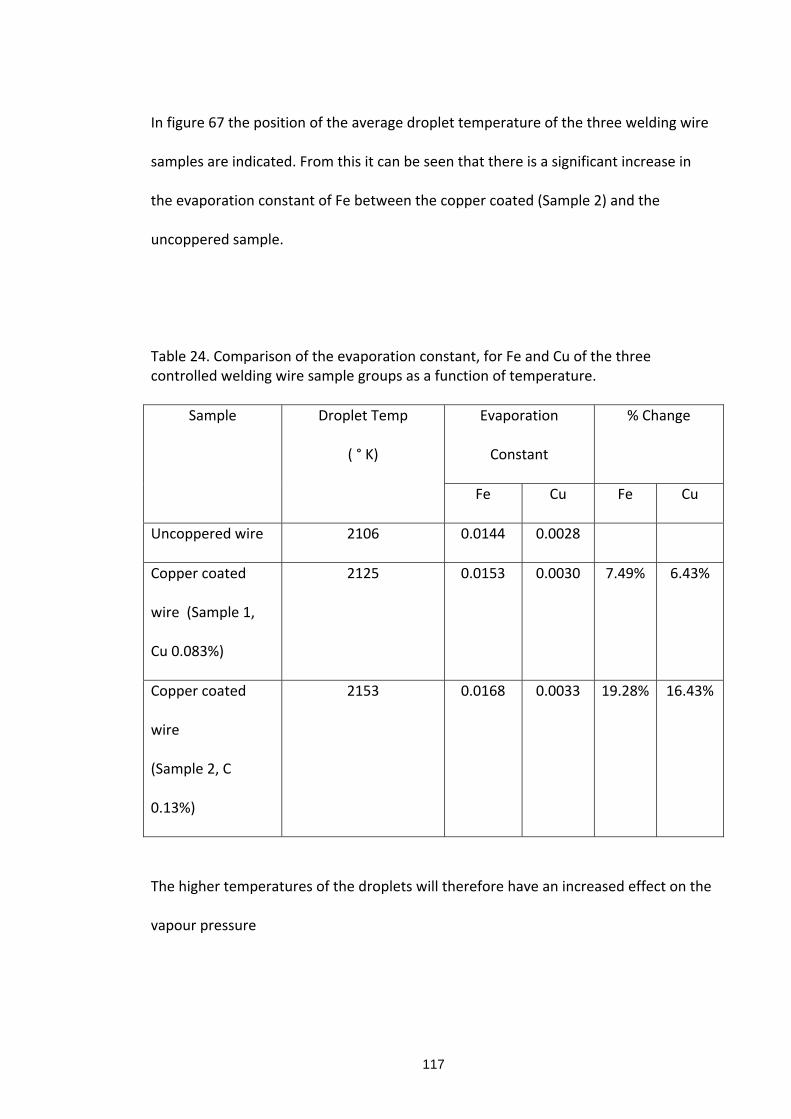
117
In figure 67 the position of the average droplet temperature of the three welding wire
samples are indicated. From this it can be seen that there is a significant increase in
the evaporation constant of Fe between the copper coated (Sample 2) and the
uncoppered sample.
Table 24. Comparison of the evaporation constant, for Fe and Cu of the three controlled welding wire sample groups as a function of temperature.
Evaporation
Constant
% Change Sample Droplet Temp
( ° K)
Fe Cu Fe Cu
Uncoppered wire 2106 0.0144 0.0028
Copper coated
wire (Sample 1,
Cu 0.083%)
2125 0.0153 0.0030 7.49% 6.43%
Copper coated
wire
(Sample 2, C
0.13%)
2153 0.0168 0.0033 19.28% 16.43%
The higher temperatures of the droplets will therefore have an increased effect on the
vapour pressure

118
6.5 Recommendations for further work
Further investigation using high speed filming to determine if there is a
significant change in the frequency and size of the droplets during “drop‐spray “
transfer between a copper coated and uncoppered wire should be undertaken.
Refinements in the experimental technique used in the determination of the two‐
colour pyrometry experiments to improve control of arc extinction could increase the
accuracy and repeatability of the droplet temperature measurement results.
The work that Subramaniam (1999) has conducted into the changes of the surface
tension of the droplets due to the addition of OR2R and C OR2R should be expanded to
include welding with both a copper coated as well as an uncoated wire. Currently
these results do not indicate the surface coating of the wire and the absence of copper
on the coating of the wire may have an influence on the results.
119
7.0 Conclusions
This thesis describes an investigation into the influence that copper coating has on the
Fume Formation rates of carbon steel welding wires. As a result of these studies, the
following conclusions were drawn.
A very rigorous experimental approach has verified previous claims
that the Fume Formation Rate of carbon steel ER70S‐6 welding wires
increase with an increase in the total copper content of the wire.
The increase in the Fume Formation Rate of carbon steel ER70S‐6
welding wires is not linearly directly proportional to the increase in
the total copper content of the wires.
The presence of copper vapour in the arc is believed to increase the
anode voltage drop and the anode heating rate with a resultant
increase in the temperature of the droplet. Although the copper
evaporates before the droplet enters the arc the copper vapour is
still believed to enter into the arc.
An increase in droplet temperature consistent with the mechanism
proposed above has been demonstrated using a dual wavelength
pyrometry technique.
Increased droplet temperature is believed to be the main cause of
the increased evaporation rate resulting in higher Fume formation
rates in copper coated wires.
120
List of References
ANSI/AWS F1.2-85 (1985), “Laboratory method for measuring Fume generation rates and total fume emission of welding and allied processes”, American Welding Society, Miami, Florida AS 3853.1 – 1991, “Fume from welding and allied processes. A guide to methods for the sampling and analysis of particulate matter”, Australian Standards AWS (1972), “Welding handbook vol 1,Welding Technology”, American Welding Society, Miami, Florida AWS SFA A5.18-2001 (2001) “Specification for Carbon steel electrodes and Rods for Gas shielded arc welding AWS (1979), “Fumes and Gases in the Welding environment”, American Welding society, Miami, Florida BOC (2007), “Technical Product reference manual” Bosworth MR and Deam RT (2000),“Influence of GMAW droplet size on Fume formation” Journal of Physics. D, Applied Physics, vol 33, Pt 20 Carpenter K, Monaghan BJ, Nicholson A, Cuiuri and Norrish J (2010), “Influence of shielding gas on fume formation rates and particle distribution for optimal GMAW”, Australian Welding Journal vol 55 First Quarter Carpenter KR, Monaghan BJ, Norrish J (2007) “Influence of shielding gas and welding conditions on fume size morphology and fume formation rate (FFR) for gas metal arc welding (GMAW)” University of Wollongong publication Carter G (1999), “Shielding gas formulation – its effect on arc welding fume emissions”, TWI Bulletin January Carter G (2002) “Fume characteristics- the effects of arc welding practice”, TWI Technology briefing 736 Carter GJ (1998), “Estimation of Exposure to arc welding fume”, The welding institute, 7324.03/98/1004.03 Carter GJ (1998), “Estimation of exposure to arc welding fume”, TWI Industry research report 654/1998 Carter GJ (2002), “Evaluation of the effect of arc welding practice on fume emission rate, exposure and it’s control”, TWI research report 736/2002 Carter GJ (2004), “Assessing exposure and fume control requirements during arc welding of steel”, Welding and Cutting Journal 3 no 6 Deam R, Bosworth M, McAllister, Norrish J, Brooks G, Zhou S, Haidar J, Lowke J, Farmer A and Simpson (1997), “ Understanding fume formation by GMAW”, Research report for the CRC for Materials and welding Deam RT, Bosworth M, Chen Z, French I, Haidar J, Lowke J, Norrish J, Tyagi J and Workman A (1997), “Investigation of fume formation mechanisms in GMAW”, Proceedings of the Technological Developments and Advances for Australian Industry, International Welding and Joining research conference Deam RT, Simpson SW and Haidar J (2000), “A semi-empirical model of the fume formation from gas metal arc welding”, Journal of Physics D: App. Physics 33 1393-1402

121
Dennis J and Mortazavi (1996), “The mechanism of fume and spatter formation in Mig welding”, Occasional Technical report 9608 for the Metal Fume research Unit, University of Bradford Dennis JH, Hewitt PJ, Redding CAJ and Workman AD (2001), “A Model for the prediction of fume formation rate in Gas Metal Arc Welding (GMAW), Globular and Spray modes, DC electrode positive”, Ann. Occup. Hyg vol 45 ESAB “Aristo-Rod- a new generation of copper free mag welding wire” Haidar J (1998), “A theoretical model for gas metal arc welding and gas tungsten arc welding.
1.” Journal of
Applied Physics, vol 84, number 7 Haidar J (1999), “A analysis of heat transfer and fume production in gas metal arc welding. III”
Journal of applied Physics, vol 85, number 7
Heile RF and Hill DC (1975), “Particulate Fume generation in arc welding processes” Welding journal, vol 54 (7) Hewitt PJ and Hirst AA (1993),“A systems approach to the control of welding fumes at source”, Ann. Occupy. Hyg .Vol 37 no 3 Hilton DE, Plumridge PN and Green JI (1992), “Particulate fume generation during gas metal arc welding and gas tungsten arc welding”, IIW Document VIII-1652-1992 IIS/IIW document (1987), “Copper levels in welding wire”, Welding in the world vol 25, no3/4 Irving R (1992), “Inverter power sources check fume emissions in GMAW”, Welding Journal, vol. 71 (2) ISO 4063 (2009), “Welding and Allied processes” Jenkins NT and Eagar TW (2005), “Chemical analysis of welding fume particles”, AWS Welding Journal June Jenkins NT, Mendez PF and Eagar (2005) “Effect of arc welding electrode temperature on vapour and fume composition” Jenkins NT, Pierce WM-G and Eagar TW (2005), “Particle size distribution of gas metal and flux cored arc welding fumes”, AWS welding Journal Kobayashi M, Maki S, Hashimoto Y and Suga T (1983), “ Investigation on Chemical composition of welding fumes” Welding Journal vol 62 no 7 Kobelco steel welding company, “SE wire: A high performance, non-copper-coated solid wire for Mag welding Koshiishi F and Shimizu (2001), “High performance, non-copper-coated solid wire for MAG welding SE wire”, Kobelco Technology review no24 Lancaster JF (1986), “Physics of Welding” 2P
ndP Edition, Pergamon Press
Lucas W, Iordachescu and Ponomarev V (2005), “Classification of metal transfer modes in GMAW”, IIW Doc No XII- 1859-05 Ma J and Apps RL (1982), “Mig Transfer Discoveries of Importance to Industry,“ Welding and Metal Fabrication, vol51 Sept.

122
Marassi D (2000), “OK Autrod 12.50 and 12.63 EcoMig the ultimate technological innovation in Mig/Mag welding”, Svetsaren 1/2000 McMillan G (2006), “Revised draft of ISO Technical report – Health and safety aspects of welding – Fume constituents related to welding processes and consumables”, IIS/IIW Commission V111 paper Mendez PF, Jenkins NT and Eagar TW (2000), “Effect of electrode droplet size on evaporation and fume generation in GMAW”, Proceedings of the Gas Metal Arc Welding for the 21P
stP Century
Conference: Orlando FL Migfast Tip, (2010), Australian Welding Journal vol 56 First Quarter Modenesi PJ and de Avelar RC (1999), “The influence of small variations of wire characteristics on gas metal arc welding process stability”, Journal of Materials Processing Technology 86 Mortazavi SB (1997), “Engineering control of occupational exposure to welding fume by process modification,” Welding in the World, vol 39, part 6 Murphy AB (2010), “Metal vapour in atmospheric pressure arcs”, Journal Phys, D:Appl. Phys. Vol43 Nogi K, Chung WB, McLean A and Miller WA (1991) “Surface tension of liquid Fe-(Cu, Sn, Cr) and Ni- (Cu, Sn) binary alloys”, Materials Transactions, JIM, vol32, No2 Norrish (1992), “Advanced Welding Processes”, Institute of Physics publishing Norrish J, Slater G and Cooper P (2005) “ Particulate fume plume distribution and breathing zone exposure in gas metal arc welding” University of Wollongong publication Parkes S, Haynes S and Veldsman WM (2000), “ 0.9 and 1.2mm Mag wire benchmarking exercise”, Report no FTC 125 BOC group fabrication technology centre Wolverhampton UK Pires I, Quintino L and Miranda RM (2007), “ Analysis of the influence of shielding gas mixtures on gas metal arc welding metal transfer modes and fume formation”, Materials and Design 28 Pomaska H-U ( 1991), “MAG Welding “Not a sealed Book” Linde AG Quimby BJ and Ulrich GD (1999), “Fume formation rates in Gas Metal arc Welding”, AWS Welding Journal April Redding CJ (2002) “Fume model for gas metal arc welding” AWS Welding Journal Richardson I, Norrish J and Hermans M (2006), “Reviewing the Classification of metal transfer”, IIW Doc No XII-1888-06 Schnick M, Fuessel U, Hertel M, Haessler M, Spille-Kohoff A and Murphy AB (2010), „Modelling of gas metal arc welding taking into account metal vapour”, Journal Phys, D:Appl. Phys. Vol43 Schnick M, Fussel U, Hertel M, Rose S from Technical University Dresden, and Spille-Kohoff A from CFX Berlin Software GmbH, Germany and Murphy AB CSIRO Australia (2009), “Numerical Investigations of the influence of the metal vapour in GMA welding”, IIW document doc 212-1134-09 Shutt RC (1997), “Controlled total copper in wire electrodes”, Welding Journal, November Slater G ( 2004), “ Welding fume plume dispersion” PhD Thesis, University of Wollongong

123
Soderstrom EJ, Scott KM and Mendez PF (2011), “Calorimetric measurement of droplet temperature in GMAW” AWS Welding Journal April Sowards JW (2006), “Method for sampling and characterizing arc welding fume particles”,Welding in the World vol 50, no 9/10 Sterjovski Z, Brossier J, De Thoisy E, Cuiuri D, Norrish J and Monaghan BJ (2006), “An investigation of particulate weld fume generated from the GMAW of plain carbon steel”, Australian Welding Journal vol 51 First Quarter Svetsarin Magazine (2004) “The ESAB Welding and Cutting Journal“, vol59 no1 Subramaniam S, White DR, “Effect of shield gas composition on surface tension of steel droplets in a gas-metal-arc welding arc (1999),” Metallurgical and Materials transactions B, vol 32B Tanaka M, Sawato H and Nakata K from JWRI, Osaka University and Yamamoto E, Yamazaki K and Suzuki K from Kobe steel welding company (2009), “ Measurements and visualizations of 2d temperature of arc plasma from monochromator with high speed video camera”, IIW document Doc 212-1145-09 Tashiro S, Zeniya T, Yamamato K, Tanaka M, Nakata K, Murphy AB, Yamamato E, Yamzaki K and Suzuki K (2010), “Numerical analysis of fume formation mechanism in arc welding” Journal Phys, D:Appl. Phys. Vol43 Voitkevick V (1995), “Welding Fumes, Formation, Properties and Biological Effects”, Abington Publishing, Cambridge WTIA (1997), Fume minimisation guidelines”, Welding Technology Institute of Australia, Sydney HTUwww.twi.comUTH - The Welding Institute website HTUwww.wtia.com.auUTH – Welding Technology Institute of Australia web site Yamazaki K, Yamamoto E, Suzuki K and Koshiishi F “ In-situ measurement of metal droplet temperature in gas metal arc welding by two-colour pyrometry” Kobe steel welding company Yamazaki K, Yamamoto E, Suzuki K and Koshiishi F of the Kobe steel welding company and Ono K, Tashiro S, Tanaka M and Nakata K of JWRI Osaka University (2007), “Effects of welding process parameters on fume emission in gas metal arc welding”, IIW document no XII-1922-07 Zhou S, Norrish J and Chen Z (1998), “ Influence of different metal transfer modes on welding fume generation during gas metal arc welding” Materials 98, Wollongong Australia Published Work by the Author Related to this Thesis 1)Bothma N, Norrish J and Monaghan B (2011) “The influence of copper content of welding wires on the fume formation rates in gas metal arc welding”, 6 P
thP Asian Pacific IIW
International congress, Cairns, Australia.