The Influence of an Electronic Attendance Monitoring System ...
176
The University of Southern Mississippi The University of Southern Mississippi The Aquila Digital Community The Aquila Digital Community Dissertations Summer 8-2018 The Influence of an Electronic Attendance Monitoring System on The Influence of an Electronic Attendance Monitoring System on Undergraduate Academic Success Undergraduate Academic Success Charles Childress University of Southern Mississippi Follow this and additional works at: https://aquila.usm.edu/dissertations Part of the Academic Advising Commons, Curriculum and Instruction Commons, Educational Assessment, Evaluation, and Research Commons, Educational Psychology Commons, Higher Education Administration Commons, Higher Education and Teaching Commons, Performance Management Commons, Technology and Innovation Commons, and the Training and Development Commons Recommended Citation Recommended Citation Childress, Charles, "The Influence of an Electronic Attendance Monitoring System on Undergraduate Academic Success" (2018). Dissertations. 1560. https://aquila.usm.edu/dissertations/1560 This Dissertation is brought to you for free and open access by The Aquila Digital Community. It has been accepted for inclusion in Dissertations by an authorized administrator of The Aquila Digital Community. For more information, please contact [email protected].
-
Upload
khangminh22 -
Category
Documents
-
view
0 -
download
0
Transcript of The Influence of an Electronic Attendance Monitoring System ...

The University of Southern Mississippi The University of Southern Mississippi
The Aquila Digital Community The Aquila Digital Community
Dissertations
Summer 8-2018
The Influence of an Electronic Attendance Monitoring System on The Influence of an Electronic Attendance Monitoring System on
Undergraduate Academic Success Undergraduate Academic Success
Charles Childress University of Southern Mississippi
Follow this and additional works at: https://aquila.usm.edu/dissertations
Part of the Academic Advising Commons, Curriculum and Instruction Commons, Educational
Assessment, Evaluation, and Research Commons, Educational Psychology Commons, Higher Education
Administration Commons, Higher Education and Teaching Commons, Performance Management
Commons, Technology and Innovation Commons, and the Training and Development Commons
Recommended Citation Recommended Citation Childress, Charles, "The Influence of an Electronic Attendance Monitoring System on Undergraduate Academic Success" (2018). Dissertations. 1560. https://aquila.usm.edu/dissertations/1560
This Dissertation is brought to you for free and open access by The Aquila Digital Community. It has been accepted for inclusion in Dissertations by an authorized administrator of The Aquila Digital Community. For more information, please contact [email protected].

The Influence of an Electronic Attendance Monitoring System
on Undergraduate Academic Success
by
Charles Felix Childress, III
A Dissertation
Submitted to the Graduate School,
the College of Science and Technology
and the Department of Human Capital Development
at The University of Southern Mississippi
in Partial Fulfillment of the Requirements
for the Degree of Doctor of Philosophy
Approved by:
Dr. H. Quincy Brown, Committee Chair
Dr. Heather M. Annulis
Dr. Cyndi H. Gaudet
Dr. Dale L. Lunsford
Dr. Chad R. Miller
____________________ ____________________ ____________________
Dr. H. Quincy Brown
Committee Chair
Dr. Cyndi H. Gaudet
Department Chair
Dr. Karen S. Coats
Dean of the Graduate School
August 2018

COPYRIGHT BY
Charles Felix Childress, III
2018
Published by the Graduate School

iii
ABSTRACT
Investing in human capital development increases education levels, workplace
skills, and boost individual abilities. Undergraduate students who attend class and
perform well are more likely to get jobs, due to their development of workplace skills.
State governments, as the funding bodies for public universities, are finding it beneficial
to increase the number of college graduates because a citizenry that is prepared for the
job market is ultimately good for the state. States recognize that an increase in education
can produce job opportunities for citizens. University administrators can employ tactics
to increase graduation rates, one of which is monitoring students’ class attendance.
This study uses a quasi-experimental design to analyze the influence of an
electronic attendance monitoring system on undergraduate academic success. The
researcher uses point-biserial and logistic regression to analyze archival data. Through
this analysis of the current study, three findings were present: (a) an electronic attendance
monitoring system increased academic success for students, (b) the presence of a positive
relationship between electronic attendance monitoring and academic success, and (c)
different literature-based demographics effect academic success of students depending on
the course. Finally, the results show that attendance increases student academic success
and implementing an electronic attendance monitoring system provides attendance
accountability in the classroom.

iv
ACKNOWLEDGMENTS
I realize that I am lucky! I have had the support and encouragement of many
friends, family members, colleagues, mentors, students in the program, and
undergraduate students at Southern Miss, even from those who did not fully understand
what I was doing. Special thanks to my Mom, Dad, Katie, Martin, Johan, Uncle Jim,
Aunt Phe, Uncle Steve, Aunt He, Ellen, and Lizzie thanks for all your support. Thank
you to my many relatives for all your encouragement. Also, thanks to the many people in
my life I consider close family without being blood related; you have truly made an
impact on my life. Thanks to my grandparents (and others) for instilling pride, morals,
and values in my life. While I name additional individuals, I also realize I will forget
someone who has played a role in the completion of my degree. Please know that no
matter your role, large or small, I am appreciative of your unending support.
The encouragement that everyone has shown me during the process has kept me
focused on the project. As the saying goes, “Slow and steady wins the race.” To my
family, thank you for always trying to understand that this “little paper” meant so much
and that the countless hours spent typing were not just playing games. To John Hubbard
and Steve Ellis, THANK YOU! Your steadfast friendship and mentorship throughout this
journey has meant the world to me. From the highest of highs to the lowest of lows, you
were there for me and I will never forget it. To my other program colleagues, Donna,
Robert, Deano, Steve, Ellie, Kristy, and Lisa, thanks for all the encouragement and
friendship along the way. To the best class project partner, Tonya, thanks for always
having just as much fun as I did, and for giving me another nickname, Chris.

v
To Megan Wilkinson and Johnell Goins, thank you for everything. Thanks for
always understanding that I was crazy to spend late nights in the library and come back at
8am to do a full workday. You made coming to the office fun and enjoyable and I know
that together we made a difference that very few will ever begin to understand. To Gary
Kimble, my first supervisor and mentor, thank you for encouraging me to start this
journey, understanding my commitment to the cause, allowing me to take classes in a
non-traditional format, and supporting me every step of the way. Your mentorship means
the world to me! To Casey Thomas, thanks for all your help in the Research Support
Center and with helping me through the myriad of challenges that occurred throughout
the journey. Additionally, I would like to thank other colleagues and mentors (Sid
Gonsoulin, Eddie Holloway, Mike Lopinto, Jay Dean, Maryann Kyle, Toni Stringer,
Justin Long, Rusty Anderson, April Woodall, Karen Reidenbach, and Kelly James-Penot)
for all the help, support, and encouragement throughout the journey. Additionally, I am
fortunate for the many colleagues that became friends during my time at Southern Miss
and will treasure our experiences together, forever.
I would like to acknowledge the faculty, staff, and students of The University of
Southern Mississippi’s Department of Human Capital Development at the Gulf Park
campus. The supportive structure, learning atmosphere, challenging curriculum, and
lasting friendships experienced during the past few years made the process enjoyable and
my goals achievable. To the faculty in the Human Capital Development Program (Dr.
Cyndi Gaudet, Dr. Heather Annulis, Dr. Dale Lunsford, Dr. Patti Phillips, Dr. Jack
Phillips, Dr. Sandra Dugas, and Dr. John Kmiec), thank you for providing a wonderful
education and supportive educational environment. To my dissertation chair, Dr. H.

vi
Quincy Brown, what can I say. Thanks for putting up with me, this young, energetic,
enthusiastic, inquisitive, semi-stubborn pupil. They say you become close with your
dissertation chair, and I was lucky to have someone like you, who understood me and
what I wanted to do every step of the way. I am proud to be one of your graduates! Dr.
Gaudet, thanks for encouraging me when I needed it the most, which happened to be
during my very first class. Dr. Annulis, thanks for “putting your money on me” and
encouraging me to finish. Suzy Robinson, thanks for giving me the final kick in the rear
to complete my application for admittance, a decision I will never forget.
To my friends, thanks for understanding that throughout this journey, sometimes I
just could not attend a function or spend time with you because I needed to finish this
opportunity and education. Make no mistake, your friendship through the years means
the world to me. Special thanks to two truly dear friends, Elizabeth Bush Foreman and
Angela Davis-Morris, who helped keep me sane during the entire process. Thanks to my
friends at Crescent City Grill and especially Jarred Patterson and Dusty Frierson for
giving me a new hope. To my new family at Cintas, I am looking forward to our journey
together. To my Sigma Phi Epsilon fraternity brothers, thanks for always encouraging
me to take a break and live life. To my marathon running best friends, Dustin Ellzey,
Chris Thompson, and Phillip Parnell, thanks for always making me unplug to enjoy
friendship with all of you as we travelled the country. To the students I have worked
with through the years, especially those who held leadership positions, thanks for making
“work” fun.
Now that the journey is complete, Let’s Party!

vii
DEDICATION
Throughout the journey to pursue my doctoral degree, I have had the support of
many friends, family members, colleagues, mentors, students in the program, and
undergraduate students I have worked with at Southern Miss. I have been fortunate to
share the journey with many family and friends. I dedicate this research to my Mom and
Dad, sister Katie, Brother-in-law Martin, and my family. Also, I want this research to
affect all of my godchildren. Further, I dedicate my research study to anyone the
research may affect in a positive way.

viii
TABLE OF CONTENTS
ABSTRACT ................................................................................................................... iii
ACKNOWLEDGMENTS ................................................................................................. iv
DEDICATION .................................................................................................................. vii
TABLE OF CONTENTS ................................................................................................. viii
LIST OF TABLES ........................................................................................................... xiv
LIST OF FIGURES ......................................................................................................... xvi
CHAPTER I – INTRODUCTION ...................................................................................... 1
Background of the Study ................................................................................................ 2
Problem Statement .......................................................................................................... 4
Statement of Purpose ...................................................................................................... 5
Research Questions and Objectives ................................................................................ 5
Conceptual Framework ................................................................................................... 6
Significance of the Study ................................................................................................ 9
Definition of Terms....................................................................................................... 10
Assumptions of the Study ............................................................................................. 11
Delimitations of the Study ............................................................................................ 12
Chapter Summary ......................................................................................................... 12
CHAPTER II – LITERATURE REVIEW ....................................................................... 14
Defining Human Capital Development ........................................................................ 14

ix
Psychological Domain .............................................................................................. 16
Economic Domain .................................................................................................... 17
Systems Domain ....................................................................................................... 19
Connecting Human Capital Development and Today’s Higher Education .................. 20
Student Development and Human Capital Development ............................................. 22
Social Interaction ...................................................................................................... 23
Workplace Skill Development .................................................................................. 24
Connecting Attendance, Student Development, Academic Success and Human Capital
Development ................................................................................................................. 24
Human Capital Development and Mississippi .............................................................. 26
Human Capital Development Today ............................................................................ 30
Human Performance Interventions and Behavior Change ............................................ 32
Human Performance Interventions ........................................................................... 33
Attendance Monitoring Systems ............................................................................... 34
Implementing Behavior Change Practices ................................................................ 35
Transtheoretical Model of Change........................................................................ 37
Theory of Planned Behavior ................................................................................. 38
Demographics, College Success, and Undergraduate Student Attendance .................. 39
Gender ....................................................................................................................... 41
Local Residency ........................................................................................................ 41

x
State Residency ......................................................................................................... 42
Greek Life Organization Affiliation ......................................................................... 43
Admission Type ........................................................................................................ 44
Cumulative Grade Point Average ............................................................................. 45
Age ............................................................................................................................ 46
Undergraduate Year Classification ........................................................................... 46
Ethnicity .................................................................................................................... 47
Current Enrollment Status......................................................................................... 48
University Designation ............................................................................................. 49
Chapter Summary ......................................................................................................... 50
CHAPTER III – RESEARCH DESIGN AND METHODOLOGY ................................. 52
Research Objectives ...................................................................................................... 53
Research Design ............................................................................................................ 53
Population and Sample ................................................................................................. 56
Previous Academic Success of Sample ........................................................................ 56
Sampling Process .......................................................................................................... 58
Instrumentation ............................................................................................................. 59
Data Collection ............................................................................................................. 60
Institutional Review Board ........................................................................................... 61
Data Request and Confidentiality of Data .................................................................... 62
xi
Data Analysis ................................................................................................................ 63
Data Analysis Plan ........................................................................................................ 64
Validity and Reliability ................................................................................................. 68
Chapter Summary ......................................................................................................... 70
CHAPTER IV – RESULTS .............................................................................................. 71
Research Objective 1 – Describing demographics, attendance, and academic success
rates ............................................................................................................................... 71
Demographic Characteristics ................................................................................ 71
Electronic Attendance Monitoring System Descriptive Results ........................... 78
Academic Success Rates ....................................................................................... 83
Research Objective 2 – Difference in academic success rates when using an electronic
attendance monitoring system....................................................................................... 90
Research Objective 3 – Relationship between attendance rates and academic success 94
Research Objective 4 – Relationship between demographic factors and attendance rates
on academic success rates ............................................................................................. 96
Introduction to Research Objective 4 ....................................................................... 97
All Courses Combined .............................................................................................. 98
History 101 Analysis............................................................................................... 101
History 102 Analysis............................................................................................... 104
Math 102 Analysis .................................................................................................. 106

xii
Chapter Summary ....................................................................................................... 108
CHAPTER V – CONCLUSIONS .................................................................................. 110
Findings, Conclusions, and Recommendations .......................................................... 110
Finding 1: Academic success rates increased with attendance monitoring ............ 111
Conclusions ............................................................................................................. 111
Recommendations ................................................................................................... 112
Finding 2: Academic success increases as attendance increases ............................ 113
Conclusions ............................................................................................................. 113
Recommendations ................................................................................................... 113
Finding 3: Courses are unique; Demographics correlate with academic success
differently in combined or individual data sets, while attendance remains important
throughout ............................................................................................................... 114
Conclusions ............................................................................................................. 115
Recommendations ................................................................................................... 117
Implications for Human Capital Development ........................................................... 118
Limitations .................................................................................................................. 119
Recommendations for Further Research ..................................................................... 120
Discussion ................................................................................................................... 121
Summary ..................................................................................................................... 122
APPENDIX A – Use of table permission ....................................................................... 124

xiii
APPENDIX B – Institutional research pre-approval ...................................................... 125
APPENDIX C – Institutional review board approval letter ............................................ 126
APPENDIX D – Attendance rates for all courses ........................................................... 127
APPENDIX E – Academic success outcomes ................................................................ 128
APPENDIX F – Electronic attendance monitoring system gender comparison results . 130
APPENDIX G – Electronic attendance monitoring system local residence comparison 131
APPENDIX H – Electronic attendance monitoring system state residence comparison 132
APPENDIX I – Electronic attendance monitoring system Greek life affiliation
comparison ...................................................................................................................... 133
APPENDIX J – Electronic attendance monitoring system admit type comparison ....... 134
APPENDIX K – Electronic attendance monitoring system cumulative GPA comparison
......................................................................................................................................... 135
APPENDIX L – Electronic attendance monitoring system age comparison .................. 136
APPENDIX M – Electronic attendance monitoring system classification comparison . 137
APPENDIX N – Electronic attendance monitoring system ethnicity comparison ......... 138
APPENDIX O – Electronic attendance monitoring system enrollment status comparison
......................................................................................................................................... 139
REFERENCES ............................................................................................................... 140

xiv
LIST OF TABLES
Table 1 Fall 2005 Freshman Cohort Student Graduation Rates ....................................... 39
Table 2 Academic Success in Electronic Attendance Monitoring System Participating
Courses .............................................................................................................................. 57
Table 3 Electronic Attendance Monitoring System Participating Courses ...................... 58
Table 4 Data Analysis Timetable ...................................................................................... 63
Table 5 Data Analysis Plan ............................................................................................... 68
Table 6 Group Demographic Characteristic Comparison ................................................. 72
Table 7 Breakdown of Students in Participating and Non-Participating Courses ............ 83
Table 8 Academic Success in Participating Courses: Monitored vs. Non-Monitored ..... 85
Table 9 Academic Success Course Data Comparison: History 101 ................................. 86
Table 10 Academic Success Course Data Comparison: History 102 ............................... 88
Table 11 Academic Success Course Data Comparison: Math 102 ................................... 89
Table 12 Attendance Monitoring Versus Non-Attendance Monitoring: History 101 ...... 91
Table 13 Attendance Monitoring Versus Non-Attendance Monitoring: History 102 ...... 92
Table 14 Attendance Monitoring Versus Non-Attendance Monitoring: Math 102 .......... 93
Table 15 Correlation Between Attendance Rates and Academic Success ....................... 95
Table 16 Logistic Regression Identification Coding Used in SPSS ................................. 97
Table 17 Demographic and Attendance Relationship on Academic Success – All Courses
Combined .......................................................................................................................... 99
Table 18 Demographic and Attendance Relationship on Academic Success – History 101
......................................................................................................................................... 102

xv
Table 19 Demographic and Attendance Relationship on Academic Success – History 102
......................................................................................................................................... 104
Table 20 Demographic and Attendance Relationship on Academic Success – Math 102
......................................................................................................................................... 107
Table A1 Attendance Rates for All Courses Adapted from Figure 6 ............................. 127
Table A2 History 101 Academic Success Outcomes ..................................................... 128
Table A3 History 102 Academic Success Outcomes ..................................................... 128
Table A4 Math 102 Academic Success Outcomes ......................................................... 129
Table A5 Comparison of Gender Results ....................................................................... 130
Table A6 Comparison of Local Residence Results ........................................................ 131
Table A7 Comparison of State Residence Results ......................................................... 132
Table A8 Comparison of Greek Life Affiliation Results ................................................ 133
Table A9 Comparison of Admission Type Results ........................................................ 134
Table A10 Comparison of Cumulative GPA Results ..................................................... 135
Table A11 Comparison of Age Results .......................................................................... 136
Table A12 Comparison of Classification Results ........................................................... 137
Table A13 Comparison of Ethnicity Results .................................................................. 138
Table A14 Comparison of Enrollment Status Results .................................................... 139

xvi
LIST OF FIGURES
Figure 1. Conceptual Framework ....................................................................................... 8
Figure 2. Educational attainment of working adults aged 25 to 64 .................................. 28
Figure 3. Median annual wages for employed workers aged 25 to 64 by level of
education ........................................................................................................................... 31
Figure 4. Research design of the current research project................................................ 55
Figure 5. Combined Classroom Attendance Data ............................................................ 79
Figure 6. Individual Course Attendance Monitoring Data ............................................... 81

1
CHAPTER I – INTRODUCTION
Students who enroll in a college or university make a personal decision to
enhance their knowledge in a field of study (Pascarella & Terenzini, 1991; Robertson,
Hurst, Williams, & Kieth, 2017). Simply stated, undergraduate students who attend class
and perform well are more likely to get jobs following graduation due to their
development of workplace skills. Multiple factors determine student academic success,
including the personal level of engagement and the social support received (Mackinnon,
2012; Tinto, 1993, 1985, 2006). Nationally, only 60% of students who enroll as first-
time, full-time freshmen complete a degree within six years of initial acceptance (U.S.
Department of Education, National Center for Education Statistics, 2016). From another
perspective, 40% of students who enter college do not complete a degree program (U.S.
Department of Education, National Center for Education Statistics, 2016). This statistic
offers an impetus for change. Universities across the country are attempting to create
environments that focus on promoting academic success and skill building to increase
student involvement, attendance, and academic success (Bailey & Morais, 2005).
Implementing engagement-based initiatives has shown to provide the highest results to
influence academic success of students (Fike & Fike, 2008; Tinto, 2006).
Research demonstrates a positive relationship between the frequency of
class/lecture attendance and students’ academic success (Moore, 2003). Crede, Roch,
and Kieszczynka (2010) report that student attendance is a better indicator of academic
success than standardized test scores or high school grade point averages. Additional
research shows that students involved in lectures achieve higher grades than students who
do not attend class regularly (Benzing & Christ, 1997; Bligh, 1998; Markham, Jone,

2
Hughes, & Sutcliffe, 1998). Students who regularly attend classes are able to connect
with faculty (Kanfer & Ackerman, 1989). Specifically, Kanfer and Ackerman’s (1989)
research suggests that student engagement during the collegiate experience can change
motivation levels of students, which tends to boost students’ academic success rates.
The present study examines whether the use of an electronic attendance
monitoring system impacts undergraduate student academic success. Additionally, this
study is an expansion on previous research as it determines the influence of multiple
literature-based demographic factors affecting attendance and academic success
concurrently. Chapter I introduces the study and contains the background of the study,
problem, purpose, research objectives, conceptual framework, significance, assumptions,
and delimitations associated with the study. The chapter ends with a summary of
presented materials. The background of the study provides information that describes the
problem and purpose of the study.
Background of the Study
In 1990, Congress passed the Student Right-to-Know Act, requiring all colleges
and universities eligible for federal funding to report graduation rates of students who
begin each year together in a cohort (National Center for Education Statistics, 2017).
Data originating from the National Center for Education Statistics (2017) highlights the
problem of non-completion across the country. Many reasons exist to preclude someone
from completing their degree program. One reason for non-completion is the lack of
academic success in attempted courses (Noel, Levitz, & Saluri, 1985). Lack of
attendance may cause low levels of academic success in the classroom (Romer, 1993).

3
Frequently, the lack of attendance points to the fact that attendance is not tracked in
college classrooms (Dicle & Levendis, 2013; Newsom, 2016; O’Connor, 2010).
Recruitment and retention play a direct role in a university’s enrollment (Noel et
al., 1985). Recruitment of a prospective student begins as soon as the individual interacts
with the college. Enrollment at a university begins when a prospective student registers
for college classes after completing high school, attending junior or community college,
or returning to college as a member of the workforce (Noel et al., 1985). Retention
focuses on keeping students enrolled in university courses until degree completion so
they can receive the necessary training and education for success in the workplace (Noel
et al., 1985). Retaining students already connected to the institution is financially more
feasible than attracting new students through recruitment efforts (Noel et al., 1985). By
focusing on academic success, especially during the first year of enrollment, universities
can positively impact retention and graduation rates (Fike & Fike, 2008; Tinto, 2006).
Nationally, the retention rate for open-admission colleges and universities hovered
around 62% for the fall 2014 cohort. This rate describes individuals who enrolled in the
fall 2014 semester and returned to the same institution in the fall 2015 semester (National
Center for Education Statistics, 2017).
Successful completion of courses plays a significant role in determining college
student retention rates (Slanger, Berg, Fisk, & Hanson, 2015). Effective academic
success strategies focus not only on academic endeavors but also on activities to promote
student academic growth through interactions both within and outside of the classroom
(Roberts & Styron, 2010). Attendance accounts for a 31% increase in academic
performance (Romer, 1993). Student engagement and involvement in campus activities

4
affect academic success and student retention (Tinto, 1975, 2006). Specifically, colleges
can support academic success by encouraging interactions that promote classroom
attendance (Benzing & Christ, 1997; Bligh, 1998; Markham et al., 1998; Tinto, 1993).
One way to encourage class attendance is by using an electronic attendance monitoring
system.
Problem Statement
When students are successful in college courses, they develop workplace skills to
help fill the current skills gap in the workforce (Kaplan, 2017). Ideally, undergraduate
students complete their degree programs in a timely fashion, while developing workplace
skills that contribute to the human capital needs of society (Blackwell, Bowes, Harvey,
Hesketh, & Knight, 2001; Noel et al., 1985; Pascarella & Terenzini, 1991; Robertson et
al., 2017). However, the reality is organizations, researchers, and policymakers believe
employees’ workplace skills fail to match the requirements and needs for existing jobs
(Altonji, Blom, & Meghir, 2012; Handel, 2003; Swanson & Holton, 2009). One factor
contributing to this skill gap is the low level of undergraduate degree completion (Altonji
et al., 2012; Swanson & Holton, 2009). On a national level, four out of ten
undergraduate college students leave college without graduating, establishing a skills gap
in human capital needs in the workforce (National Center for Education Statistics, 2017;
White House, Office of the Press Secretary, 2009). In the state of Mississippi, five out of
ten undergraduate college students leave college without achieving their degrees
(Institutions of Higher Learning Board, State of Mississippi, 2013). Generally, poor
college student attendance is due to a lack of accountability, which enables a low rate of
attendance, while also limiting interactions between faculty and students (Jones,

5
Crandall, Vogler, & Robinson, 2013). Automated accountability tools can improve
attendance, resulting in increased interaction between faculty and students, greater
academic success, and increased graduation rates (Borland & Howsen, 1998). When
students fail to complete their degrees, thus failing to develop workplace skills, the
resulting lack of a sustainable workforce impacts an organization or state’s competitive
advantage.
Statement of Purpose
The purpose of the present study is to determine the influence of an electronic
attendance monitoring system on undergraduate student success. Specifically, this study
assesses if an electronic attendance monitoring system affects student academic success.
Low class or lecture attendance among undergraduate students remains an issue in the
collegiate setting (Lopez-Bonilla & Lopez-Bonilla, 2015). Much of the limited research
investigating the link between an electronic attendance monitoring system and student
academic success examines only one demographic variable (eg. sex, ethnicity, age, or
campus residency). The present study examines the connection of multiple demographic
factors simultaneously, showing how an electronic attendance monitoring system
influences undergraduate student success, regardless of other demographic factors.
Research Questions and Objectives
The following research question guides the present study. Does the electronic
attendance monitoring system have an effect on student success when considering
literature-based demographics? The following research objectives guide the study:
RO1 - Describe the literature-based undergraduate demographic factors,
attendance rates, and academic success rates of the student sample.
6
RO2 - Compare academic success rates of students in the sections of courses
using the electronic attendance monitoring system in the Spring 2015 Semester with the
sections of courses that did not use the system.
RO3 - Determine the relationship between undergraduate attendance rates and
academic success in courses using an electronic attendance monitoring system.
RO4 - Determine the relationship between the literature-based undergraduate
demographic factors and attendance rates on student academic success in courses using
an electronic attendance monitoring system.
Conceptual Framework
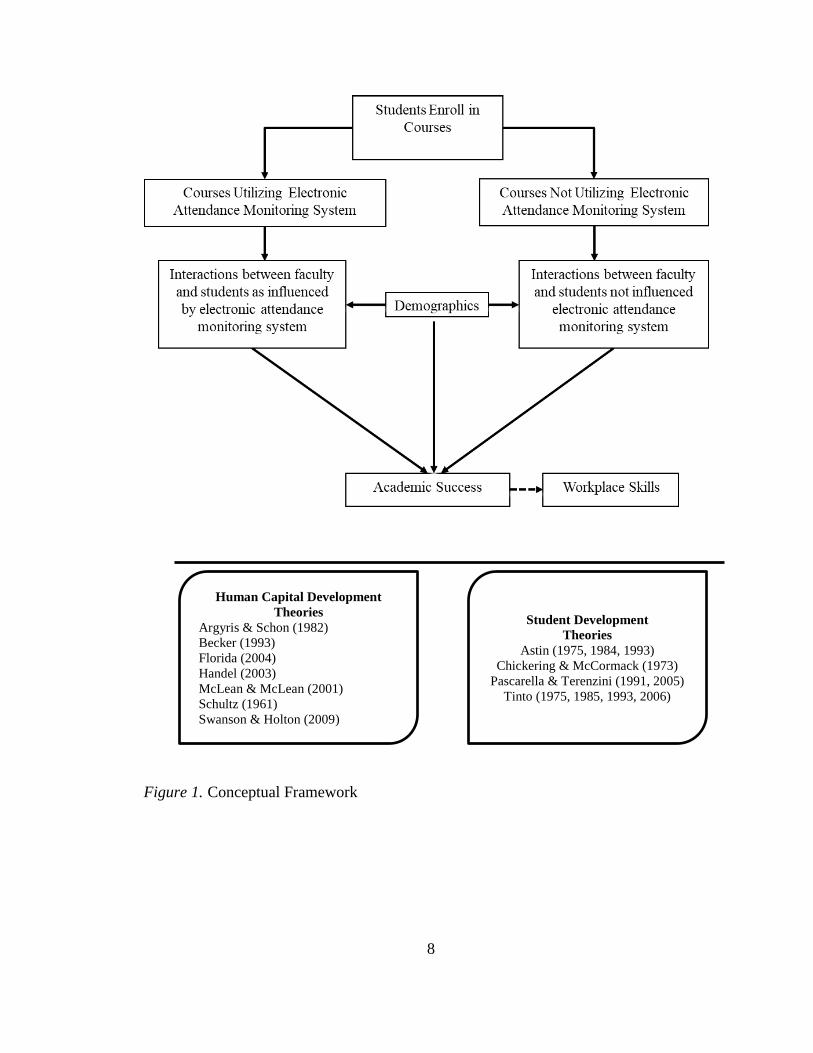
A conceptual framework, shown in Figure 1, provides a graphic illustration of
theories, connections, ideas, and interactions supporting the objectives of the present
study (C. Roberts, 2010). The present study focuses on two major areas affecting student
academic success in at the university level: student development and human capital
development. Rodgers (1990) defines student development as “the ways that a student
grows, progresses, or increases developmental capabilities because of enrollment in an
institution of higher education” (p. 27). While student development focuses on the
educational environment, human capital development focuses on the improvement or
performance of an individual, a team, or an organization through the development of
knowledge, skills, and abilities (Swanson & Holton, 2009).
Student development in college is inseparable from the level of faculty-student
interaction. Astin’s (1975) Theory of Involvement contends that academic success is
based on the quantity and quality of interactions between faculty and students. The
involvement theory describes how student involvement, and interactions between faculty
7
and students during college, enhances cognitive and skill development, both of which
improve effective learning. According to Astin (1984), “Student involvement equates to
the amount of physical and psychological energy that the student devotes to the academic
experience” (p. 297). Involvement in the college classroom environment translates to
increased academic success, which serves as a significant source of skill development,
learning and student development (Astin, 1984).
The development a student receives during a college education increases the
human capital of society by building workplace skills that benefit the student later in life
(Dychtwald, Erickson, & Morison, 2006). These workplace skills relate to three areas
that pertain to human capital development: economic, psychological, and systems
focused on improving undergraduate student attendance rates and academic success
(Becker, 1993; Crede et al., 2010).
Figure 1 presents the conceptual framework for the present study, showing the
interaction of the three core research areas: attendance, academic success, and
attendance-based demographics. The conceptual framework shows the student point of
entry and separates courses according to use of the electronic attendance monitoring
system.
8
Figure 1. Conceptual Framework
Human Capital Development
Theories
Argyris & Schon (1982)
Becker (1993)
Florida (2004)
Handel (2003)
McLean & McLean (2001)
Schultz (1961)
Swanson & Holton (2009)
Student Development
Theories
Astin (1975, 1984, 1993)
Chickering & McCormack (1973)
Pascarella & Terenzini (1991, 2005)
Tinto (1975, 1985, 1993, 2006)

9
Significance of the Study
The present study has relevance to three different audiences: the State, the
university, and the individual. First, the study may identify factors to improve academic
success throughout the state. According to the Education Commission of the States
(2011), more than 71% of Mississippi’s population did not have an education level equal
to an Associate’s Degree. Student academic success can increase by reducing barriers to
persistence and increasing student retention levels. Improving undergraduate attendance
and enabling student persistence can positively impact a state’s education level leading to
increased economic prosperity among its citizens (Adelman, 1999).
In Mississippi, consistent with trends across the nation, the system of funding
state-sponsored colleges and universities has changed (SB 2851, 2013). In 2011, the
Mississippi Legislature passed an Institutions of Higher Learning Appropriations Bill (SB
2851, 2013), to change the funding of universities to a performance-based allocation
model (Institutions of Higher Learning Board, State of Mississippi, 2013). The new
funding model links state-sponsored institutional funding to completed course credit
hours, academic success, retention rates, and graduation rates (Institutions of Higher
Learning Board, State of Mississippi, 2013). This new funding formula enacted a major
change from earlier funding models, which focused on the total number of enrolled
students (Institutions of Higher Learning Board, State of Mississippi, 2013). The
revamped funding formula changed the focus for colleges and universities from attracting
new students to promoting increased student academic success.
For the university, the present study seeks to determine the influence of an
electronic attendance monitoring system on undergraduate student success. By affecting

10
undergraduate academic success through student retention, the university can expect to
maintain or increase funding levels from the state (Institutions of Higher Learning Board,
State of Mississippi, 2013).
From an individual perspective, on average those who have attained a bachelor’s
degree have a lower unemployment rate, earn $300 more each week than those who have
not earned a bachelor’s degree and develop workplace skills during their collegiate career
(Altonji et al., 2012; Handel, 2003; National Center for Educational Statistics, 2005;
Swanson & Holton, 2009). By analyzing data examining relationships between
attendance, academic success, and literature-based demographics, the present study
focuses on improving the collegiate atmosphere for individuals. Specifically, the present
study fills a gap in the research because previous research has only focused on identifying
one or two demographic traits at a time instead of looking at multiple traits
simultaneously. By looking at multiple demographic factors at the same time, the
opportunity exists to examine relationships between these demographics. Further, the
university chosen for the present study has not previously conducted a similar study.
Therefore, the university and similar institutions could use the findings to develop tactics
to impact students’ academic success based upon the outcomes of the data, or they could
seek to duplicate the study at their site.
Definition of Terms
The present study contains the following terms aiding the reader throughout the
document.
1. Academic Success – When a student achieves a grade of A, B, or C in a course
taught at the university (The University of Southern Mississippi, 2014)

11
2. Participating Classes – The courses where faculty volunteered their class
section(s) for the electronic attendance monitoring system (M. Arrington,
personal communication, 2015)
3. Non-participating Classes – Comparison class sections of the courses taking
part in the electronic attendance monitoring system (M. Arrington, personal
communication, 2015)
4. Electronic Attendance Monitoring System – describes the actual attendance
monitoring procedure, where a member of the university’s Institutional
Research Office was present to collect attendance data (Dicle & Levendis,
2013)
Assumptions of the Study
The four assumptions of the present study concentrate on the classroom
experience between the participating classes that used the electronic attendance
monitoring system and the non-participating classes. First, the researcher assumes all
course sections are equally challenging, regardless of section or course material. The
present study compares course sections that implemented an electronic attendance
monitoring system to course sections that did not implement a monitoring system. If the
faculty teaching the courses are not utilizing similar curriculums, an effect on the
outcome would occur (Shadish, Cook, & Campbell, 2002). Second, the researcher
assumes faculty members use the same grading criteria, including the grading scale and
rigor of grading. The grading scale for the course sections should be similar; as having
one faculty member use one grading scale and another use a different grading scale
would impact the end-of-term course grades (Gump, 2006). Third, the researcher

12
assumes similarity of the physical classrooms for the students enrolled during the
semester of the electronic attendance monitoring system. While the physical
characteristics of classroom selection are out of the control of the researcher, different
dynamics exist in a smaller classroom as opposed to a larger classroom regarding
attendance (Gump, 2006). Last, the researcher assumes the quality of effort and teaching
remains the same regardless of the faculty member tasked with course instruction.
Faculty enthusiasm for teaching a course subject has been shown to impact students’
choice of attendance (Longhurst, 1999).
Delimitations of the Study
Delimitations describe the selections made by the researcher, which set the
constraints for the current research study (Roberts, 2010). The present study used
archived data; therefore, those who implemented the actual program produced the
delimitations. The population of students enrolled during the Spring 2015 Semester
delimits those available for the sample. The Office of Institutional Research selected the
courses in which to offer the opportunity to participate in the electronic attendance
monitoring system (M. Arrington, personal communication, 2015). The system was
implemented only in sections in which the faculty volunteered to participate (M.
Arrington, personal communication, 2015). The volunteering of courses in this fashion
delimits those available to be included in the sample.
Chapter Summary
The present study focuses on the premise that when student academic success is
limited, students face barriers to achieving their degrees (Pascarella & Terenzini, 1991;
Singell & Wadell, 2010). Undergraduate student attendance in collegiate classes,

13
specifically in the general education category, remains problematically low at institutions
across the country (Moore, 2003; Noel et al., 1985; Singell & Wadell, 2010). University
administrators continue to increase focus on academic success.
The present study seeks to determine the influence of an electronic attendance
monitoring system on undergraduate student success in classes that historically have a
low academic success rate. Additionally, the researcher examines multiple attendance-
based demographics to examine relationships between these demographics, attendance
rates, and academic success. Chapter II presents a literature review that focuses on
providing a link between human capital development and student development. In
Chapter III, this present study focuses on the research objectives, research design, data
collection, and analysis. Chapter III discusses the research methods employed, using a
quasi-experimental design using archival data. Analysis of these courses determines if a
difference occurs in the Spring 2015 Semester in the sections of courses using the
electronic attendance monitoring system and the sections of courses that did not use the
system.

14
CHAPTER II – LITERATURE REVIEW
Literature reviews give the opportunity for the researcher to examine earlier
research to support the present study (Roberts, 2010). The purpose of the present study is
to determine the influence of an electronic attendance monitoring system on
undergraduate student success. Chapter II includes a review of relevant literature
regarding the areas of human capital development, student development, undergraduate
student attendance and subsequent behavior changes, how these changes affect academic
success, and undergraduate student demographic factors that affect attendance, and their
connection to the electronic attendance monitoring system. Throughout the development
of the literature review, the researcher conducted multiple searches to find pertinent
material to support the present research study. Multiple literature searches are necessary
so that the researcher can ensure that a robust network of sources helps shape the
conceptual framework and research objectives (Roberts, 2010). The researcher used
various web-based research sites such as Google Scholar and the University of Southern
Mississippi online research library, as well as consulting with reference librarians at the
University.
Defining Human Capital Development
Human capital development theory involves any program or intervention a person
receives to enhance their skills and productivity, which, in turn, creates a positive impact
both for the affiliated organization and for the individual (Smith, 1988). For example, an
organization may have a program that encourages employees to achieve a higher level of
education, including a bachelor’s degree. By promoting an increased education
attainment for employees, the organization allows the individual to interact with subject

15
matter experts in a setting that promotes innovation and skill development (Astin, 1975).
The Bureau of Labor (2015) estimates that individuals who attain a bachelor’s degree
gross approximately one million dollars more in lifetime earnings than people who do not
attain that degree. By pursuing additional education levels, individuals increase their
academic and workplace skills development and affect their personal economic stability
(Noel et al., 1985; Pascarella & Terenzini, 2005). From the employer perspective, having
educated employees in the workplace helps to ensure the company stays competitive
locally, regionally, and globally. Focusing on human capital development within higher
education and increasing opportunities for training and career development can create
employees who will position the organization for global competition (Swanson & Holton,
2009).
Not only does human capital development link closely with student development
and academic success, student development is human capital development. In high-
performing states, partnerships exist between the business sector and academic
institutions (Praxis Strategy Group, 2010a). By linking business and academic partners,
people can collaborate, fostering the opportunity for innovation and feedback to occur in
terms of preparing citizens for industry needs (Praxis Strategy Group, 2010b). Governors
and other government leaders search for ways to offer a competitive advantage for their
state’s citizens by providing workforce development and workplace skills training (Praxis
Strategy Group, 2010b). In addition to providing a competitive advantage for the state or
region, government officials know that human capital development remains one of the
best ways to increase the wealth and to provide economic stability to individuals and
takes a partnership that includes all stakeholders (Florida, 2004; Schultz, 1961). For

16
instance, California developed a higher education master plan in the 1960s to promote
human capital development involving all education partners from the community college
system to the elite universities (Praxis Strategy Group, 2010a). Apparently, the master
plan was successful, as California has one of the more educated populations in the
country (Praxis Strategy Group, 2010b).
When examining human capital development, three domains (psychological,
economic, and systems) link human resource development with undergraduate student
attendance, academic success, and student development (Swanson & Holton, 2009).
These three domains also involve ethics and the relationship that exists with external and
internal environments (Swanson & Holton, 2009). The psychological domain focuses on
human behaviors that influence an organization (Swanson & Holton, 2009). The
economic domain of human resource development relates to the sustainability of
organizations by way of encouraging workplace skill development and succession
planning (Rothwell, 2005; Swanson & Holton, 2009). The systems domain involves the
relationships of organizations and how they assist or hinder the goals of their partnerships
(Swanson & Holton, 2009). These three domains interact, giving a holistic human
resource development approach for professionals in the industry (Swanson & Holton,
2009).
Psychological Domain
The psychological domain helps to explain the relationship between human
capital development and student development. The psychological domain combines
three areas of psychological study: Gestalt psychology, behavioral psychology, and
cognitive psychology (Lee, 2007; Swanson, 1999). Gestalt, which in the German

17
language translates to organization and configuration, explains that employees provide
contributions to influence the experience in a workplace setting in a holistic way (Lee,
2007; Olson & Hergenhahn, 2013; Swanson, 1999). Behavioral psychology speaks to the
idea that people respond to different stimuli based upon their present capacity,
experiences, and the various forces influencing them (Swanson & Holton, 2009).
Cognitive psychology attempts to integrate the Gestalt and behavioral psychology subsets
(Lee, 2007; Swanson, 1999). Cognitive psychology states that humans organize their
lives by goals and around purposes (Tolman, 1948). The psychological domain of human
capital development operates effectively when these three areas interact. Human capital
development professionals may then work to clarify any goals of the organization and
develop the knowledge and ability of individuals, owners, and leaders while considering
the goals and behaviors of all participants (Lee, 2007; Swanson, 1999). The
psychological aspect relates to the present research because, when initiating any new
intervention, especially one that may affect the future, ensuring that everyone
understands the human capital intervention is essential to the project’s success (Fuller,
1997; Kolb & Kolb, 2005; Kotter, 2008; Russell, 2007). Further, the psychological
domain supports undergraduate student attendance by stating that a holistic experience
provides the best path for academic success and workplace skill development. Without
the interactions created by being present in a classroom, a student misses the opportunity
for development.
Economic Domain
The economic domain of human capital development relates to both organizations
and the population. Becker (1993) emphasizes that everyone should view investments in

18
increasing human potential and productivity the same way as investments in traditional
capital improvements. One such supporting theory for the economic domain, the scarce
resource theory, states that everything has an economic significance to an organization or
individual (Swanson, 1999). Scarce resource theory further explains that limitations exist
for everything, which requires us to make hard choices as to how monetary expenditures
provide the greatest return on investment. Further, when considering the scarce resource
theory, organizations focus on the benefit that any investment has on the bottom line for
the organization (Swanson & Gradous, 1986). For example, the environment limits raw
materials; money limits organizations; and time limits humans. The scarce resource
theory states that organizations need to be strategic in the use of capital to receive the
highest return on investment and best impact on the organization (Swanson, 1999).
Scarce resource theory also forces decision makers to prioritize initiatives, ensuring that
each initiative has the appropriate impact they seek (Swanson & Holton, 2009).
The sustainable resource theory and scarce resource theory are similar, but have
one major difference (Swanson & Gradous, 1986; Thurow, 1993). The sustainable
resources theory focuses on long-term implementation of initiatives as opposed to the
scarce resource theory, which focuses on short-term initiatives (Swanson & Gradous,
1986; Thurow, 1993). Sustainable resource theory focuses on using new processes and
technologies to implement initiatives to be successful over extended periods of time
(Swanson & Gradous, 1986; Thurow, 1993). For instance, finding talented and well-
educated employees is essential for the long-term sustainability of organizations
(Thurow, 1993). By promoting the further education of employees, organizations
promote the holistic development of employee’s skills through the interactions between

19
subject matter experts and employees, thus giving the organization a competitive
advantage (Florida, 2004). The employee’s skill based competitive advantage replaces
the global competitive advantage that, in the past, centered on natural resources or capital
funding (Swanson, 1999).
Systems Domain
The third foundation of human capital development lies with incorporating a
holistic systematic approach to promote workplace skill development (Swanson, 1999).
Systems theory allows for the implementation of an intervention designed to increase the
skill development of individuals (Chalofsky, 1992; Swanson, 1999). For individuals
seeking to further their education in an area, systems theory supports the development of
opportunities for learning activities and idea sharing to focus on personal growth to build
skills in individuals and aid in career development (Gilley & Eggland, 1989). Systems
theory dictates the gathering and analysis of performance data to encourage a long-term
focus on skill development and performance improvement (Gilley & Eggland, 1989;
Swanson, 1999; Watkins, 2010). Essentially, systems theory states that people who want
to learn more should do so and their employer or school should encourage that type of
behavior.
Providing the opportunity for students to interact with faculty in the collegiate
environment, while learning workplace skills, is a fundamental core function of the
collegiate atmosphere. By involving the three foundation areas of human resource
development, individuals can build an unbiased opinion on ways to improve the current
climate in an organization or, in this case, the academic success rates in the college

20
classroom. Further, the literature shows the need to change behaviors associated with
low classroom attendance which, by nature, increases the interactions with faculty.
Connecting Human Capital Development and Today’s Higher Education
The exploration of human capital development has existed since the ancient
Greeks began the first education process, which focused on interactions between teachers
(faculty) and students to develop skills. As societies evolved and flourished, other
cultures developed similar systems focused on educating their populace. Over time, these
systems included monasteries, merchants, craft guilds, and apprenticeships leading to the
development of public schools for training the population in basic skills. The interactions
occurred because of the educational opportunities allowed individuals to develop skills.
This is the basis of the education process.
Since the beginning of its existence, higher education sought to create an
opportunity for students to explore intellectual curiosity through enrollment in a variety
of courses, specifically, courses in the liberal arts discipline (Berrett, 2015; Sellingo,
2015). Conversely, today’s culture sets expectations of job attainment for college
graduates (Sellingo, 2015). On February 28, 1967, Ronald Reagan delivered a speech
while serving as Governor of California, during a budget crisis in the state. This speech
was centered on the need for higher education to shift away from intellectual discovery
and toward educating citizens about skills needed for jobs (Berrett, 2015). From this
point on, society began to reshape views of college, and cultural changes began to
reinforce the need for more practical degrees, as opposed to exploration of the liberal arts
(Berrett, 2015). With the change in educational philosophy, students became customers,
and the higher education community transformed into a venue where students learn

21
workplace skills needed to become productive members of society (Berrett, 2015).
Regardless of the change, the interactions between faculty and students continued to be
important, to ensure the environment existed to promote learning and innovation. As the
change in educational philosophy continued, so did the mechanisms for publicly funding
state colleges and universities.
Public higher education institutions derive funding through a variety of financial
sources, including tuition dollars, private giving, and state allocations. In 1978, Pfeffer
and Salancik introduced the notion of resource dependency theory, which says that
organizations depend on their internal and external environments for resources. Internal
environments serve those within the university, while external environments, such as
budgets and world affairs affect the university. Further, Pfeffer and Salancik (1978)
explain that the organization’s behavior responds to changes in environments. If a
resource change occurs, then the entity must adapt to the changes, preventing the change
from destabilizing the organization. To guarantee the survival of the institution, this
adaptation to change must happen (Pfeffer & Salancik, 1978). For colleges and
universities in Mississippi, the need to adapt to a change in external resources is
paramount. In 2013, The Mississippi Institutions of Higher Learning Board—the
external entity that directs funding—changed to a new funding model for colleges and
universities which specifically distributes 85% of an institution’s state funding based on
students’ academic success and graduation statistics (Institutions of Higher Learning
Board, State of Mississippi, 2013). As such, colleges and universities in Mississippi must
adapt to this change in their funding resource to prevent destabilization of their
organizations.
22
Astin (1975) stated that a focus on academic success, by encouraging faculty and
student interaction, promotes higher retention and graduation rates. At The University of
Southern Mississippi, entering freshman students complete an average of 85% of
attempted courses, but the first-year retention rate is 75% for the university (Institutions
of Higher Learning Board, State of Mississippi, 2014). In 2014, The University of
Southern Mississippi’s Student Success Committee issued a report focused on improving
academic success rates. One suggested method of doing so focuses on the
implementation of an electronic attendance monitoring system (The University of
Southern Mississippi, 2014).
Student Development and Human Capital Development
Promoting student development through interactions between faculty and students
increases academic success during the collegiate years and sets up a critical base for the
future success of individuals (Astin, 1993). While examples exist of individuals who
enjoy success without a bachelor’s degree, many people need the academic and
workplace skill development that occurs while achieving a degree to experience job and
income security (De Gregorio & Lee, 2002). In 2009, more than 75% of available jobs
needed an education level above a high school degree (White House, Office of the Press
Secretary, 2009). Per the Bureau of Labor Statistics (Torpey & Watson, 2014), the
number of available jobs needing at least a high school education has held steady at 73%.
Becker (1993) introduced research correlating higher salaries with more highly educated
employees. These employees develop enhanced workplace skills and higher productivity
rates through academic interactions between faculty and students (Becker, 1993).
Further, the more highly educated an individual becomes, the greater the benefit to the

23
community (Florida, 2004). Focusing on academic success strategies offers benefits for
all involved at the university and community level (Astin, 1975).
Social Interaction
Research over the past four decades link student involvement to higher retention
and academic success (American College Testing, 2010; Bean & Metzeler, 1985; Berger
& Braxton, 1998; Pascarella & Terenzini, 2005; Tinto, 1993). Tinto (1993) reports that
sustained social interaction among faculty and students improve knowledge retention.
Further, the higher the level of student involvement or engagement, the more positive
impact a student receives in the areas of academic and workplace skill development
(Tinto, 1993). When students pursue post-high school education, they continue to focus
on academic and workplace skill development, refining learning processes through social
interaction following Kolb’s theory of experiential learning (Kolb & Kolb, 2005). In
other words, to develop intellectually and socially, students need to interact with others
and with the faculty who are the subject matter experts (Kolb & Kolb, 2005). Students
arrive at college with expectations and perceptions of a campus culture, and universities
strive to aid students as they assimilate to this culture (Gerdes & Mallinckrodt, 1994;
Harrison, 2006; Lowis & Castley, 2008). Astin (1975) surmises that the more
interactions between faculty and students in the classroom during their collegiate career,
the higher the likelihood of retention. Depending upon the campus of enrollment, a
student could choose from several student organizations—such as general and specialized
organizations, professional organizations, honors organizations, or Greek Life
organizations—to gain both personal development and social interaction. As a strategy,
universities should promote social interaction of undergraduate students and faculty to

24
increase student retention and graduation rates (Astin, 1975; Noel et al., 1985). When
involved in campus organizations, students develop workplace skills through both the
social involvement between their peers and their interaction with university faculty and
staff (Patton, Renn, Guido, & Quaye, 2016).
Workplace Skill Development
The development of workplace skills—such as autonomy, personal integration,
impulse expression, introverted thinking, and complex thinking—occurs heavily in the
college years (Patton et al., 2016; Chickering & McCormack, 1973; Gianoutsos, 2011;
Sternberg, 2013). According to Gianoutsos (2011) and Sternberg (2013), employers
report difficulty finding the previously mentioned workplace skills because many
students leave higher education institutions before completing a degree plan. The
negative impact on human capital development affects the local area due to the lack of
refined workplace skills one receives in the postsecondary education setting (Patton et al.,
2016). Companies continue to spend more time training employees on skills not
developed as part of the collegiate experience (Cappelli, 2011). Thus, academic success
remains a priority for everyone at a college or university as students are trained to meet
the needs of the business world.
Connecting Attendance, Student Development, Academic Success and Human Capital
Development
Higher education offers an avenue for the development of skills in a focused
subject area. Providing opportunities for subject specific knowledge through the higher
education process supports human capital development, defined as follows:

25
Any process or activity that, either initially or over the long term, has the potential
to develop adults’ work-based knowledge, expertise, productivity, and
satisfaction, whether for personal, group, or team gain, or for the benefit of an
organization, community, nation, or ultimately, the whole of humanity. (McLean
& McLean, 2001, p. 315)
Offering opportunities for students to have a peer-to-peer interaction, as well as a faculty-
student interaction, are principal factors supporting academic success (Noel et al., 1985).
Creating an environment centered on academic success and workplace skill
building leads to increases in student attendance, involvement, and academic success
(Bailey & Morais, 2005). The Student Success Steering Committee had the following to
say about the importance of undergraduate student attendance:
Studies show that class attendance can significantly improve academic
performance and lower the time it takes to complete a degree. Regular class
attendance promotes faculty/student engagement and allows for early assessment
of the student’s strengths and weaknesses. Absences more than 10% of the
scheduled classes are detrimental to a student’s chance of success. (The
University of Southern Mississippi, 2014, p. 10)
Just as human capital development professionals find themselves in an ever-
changing and innovative society, so do the professionals in higher education. Because
constant change occurs, post-secondary education must adapt, giving university
professionals the opportunity to interact frequently with students who are the future
workforce. These interactions are critical to the development of human capital, as the

26
three domains of human capital development show; thus, they are important to the local
community, the state, the region, and society as a whole (Becker, 1993; Florida, 2004).
Human Capital Development and Mississippi
Human resource is, simply put, the development of human capital or people
(Swanson & Holton, 2009). Human capital includes the skills, knowledge, competencies,
social network, professional network, creativity, and personal attributes humans have
(McLean & McLean, 2001). People find employment in a multitude of organizations,
and each type of organization and job requires a different skill set. Therefore, leaders
must create plans to support the continuous education of their employees by
incorporating research, theory, and practice into the development of programs (Marsick
& Watkins, 1994). Then, as organizations lay a path to carry out their goals, it is
paramount to remember how human capital development aims to create productive and
educated citizens of society (Swanson & Holton, 2009). The collegiate setting offers one
place for this education to occur by increasing the academic and workplace skills of the
future workforce. Because of this, academic success and human capital development
intertwine. Becker (1993), a pioneer in the human capital research field, stressed that the
human capital sector relies on skilled workers. President Obama argued that education
provides the best means to create these skilled workers (White House, Office of the Press
Secretary, 2009). In his joint address to Congress in 2009, President Obama said the
following:
Right now, three-quarters of the fastest-growing occupations require more than a
high school education. And yet, just over half of our citizens have that level of
education. We have one of the highest high school dropout rates of any

27
industrialized nation and half of the students who begin college never finish. This
is a prescription for economic decline, because we know the countries that out-
teach us today will out-compete us tomorrow. That is why it will be the goal of
this administration to ensure that every child has access to a complete and
competitive education from the day they are born to the day they begin a career.
(para. 62)
In his speech, President Obama stated 75% of the available jobs now require above a high
school education, adding that the country must establish a pathway to success through
educational opportunities (White House, Office of the Press Secretary, 2009). Businesses
consider education level of the local population before investing in a geographic area
(Florida, 2004). Education increases the knowledge level of potential employees and
offers one of the most important capital investments that an organization or region can
make (Florida, 2004). To that effect, the higher the education a person achieves, the
more mobile the person becomes, which leads to greater opportunities, income security,
and wages for the individual (Schultz, 1961). The Bureau of Labor Statistics (2015)
recently published a table describing the differences in earning and unemployment rates
based upon education level. Figure 2 reinforces the President’s remarks made before
Congress and provides a parallel to the state of education in Mississippi. As Chapter II
continues, research, figures, and tables highlight human capital development and its
importance to Mississippi.

28
Figure 2. Educational attainment of working adults aged 25 to 64
Note. Net Migration of 22 to 64 year olds by education level (2005-2009). Adapted from “College Completion in Mississippi: The Impact on the Workforce and the Economy” by Education Commission of the States, 2011. Copyright 2011 by Education Commission
of the States. Adapted with permission of the publisher. See Appendix A for statement of permission from organization.
In 2013, the Mississippi Legislature passed an Institutions of Higher Learning
Appropriations Bill (SB 2851, 2013), adopting a performance-based allocation model
linking institutional funding to completed course credit hours, retention rates, and
graduation rates (Institutions of Higher Learning Board, State of Mississippi, 2013). The
new funding formula—the performance-based allocation model—caused a meaningful
change from earlier funding models, which focused primarily on the total number of
enrolled students at each university. The new design created a shift in focus from student
enrollment to student retention by distributing state educational funds based upon
retention and graduation rates, not overall numbers (Institutions of Higher Learning
Board, State of Mississippi, 2013).
16.5
30.1
24.5
8.1
13.6
7.2
12.6
27
22.2
8.4
19.1
10.78.8
23.8
17.2
8.4
24.3
17.4
0
5
10
15
20
25
30
35
Less than HighSchool
High School Some College,No Degree
Associate Degree Bachelor'sDegree
Graduate,Professional
Degree
Mississippi US Average Massachusetts (Most Educated)
29
In the past, state-funded public institutions of higher education in Mississippi
have relied on two major sources of funding: state appropriations and student tuition.
Between fiscal years 2008 and 2014, state appropriations for higher education decreased
by 25% across the nation (Mitchell, Palacios, & Leachman, 2014). The adjustment in
funding has affected many state higher education budgets. A new tactic sees higher
education institutions’ funding tied to performance metrics (Quinton, 2016). In fact, 26
states have already adopted the tactic with another 10 states considering adopting the new
way of distributing state funding for institutions of higher education (Quinton, 2016).
With changes and innovation coming to higher education funding, citizens and
lawmakers must make sure future students have access to education. In addition to the
state placing an increased focus on academic success, the Southern Association of
Colleges and Schools asked universities to develop a five-year strategic initiative focused
on the success of current students (Southern Association of Colleges and Schools
Commission on Colleges, 2015). The University of Southern Mississippi has chosen to
develop their Quality Enhancement Plan to obstacles to academic success, and by
extension, student retention.
The Organization of Economic Co-operation and Development (2014) ranks the
United States 14th out of 37 countries as it pertains to college degree completion.
According to Figure 2, in 2011, only 29.8% of adults in the United States aged 25-34 had
a bachelor’s degree or higher (Education Commission of the States, 2011). Regarding
the present study, the eight four-year publicly financed universities in Mississippi have a
joint six-year graduation rate average of 50% among students who make the decision to
enroll in a bachelor’s degree program (Institutions of Higher Learning Board, State of

30
Mississippi, 2014). To address this graduation rate issue, the Institutions of Higher
Learning reconfigured the funding methods to reward successful schools by focusing on
academic success, retention, and graduation (Institutions of Higher Learning Board, State
of Mississippi, 2013). Schiller (2008) states,
Research shows that having large numbers of college graduates in a region
increases that region’s economic growth and that spillovers (also called
externalities) are an important factor in generating more rapid growth. Aware of
this connection, educators, state and local governments, and businesses around the
country are making efforts to increase the educational attainment of their local
workforces, especially the number of college graduates. (para. 16)
According to Schiller (2008), a clear link exists between human capital development and
college academic success, and by proxy, student retention, which over time leads to
graduation.
Human Capital Development Today
Employers operate in an environment that expects quick change, adaptability, and
results (Miller & Ireland, 2005). As students prepare for the workplace, they must
develop the proper academic and workplace skills needed to prosper; these workplace
skills develop while a student attends college. Chickering and McCormack (1973) define
some of these skills as personal integration, complexity, impulse expression, autonomy,
estheticism, and introverted thinking. Further, research from Chickering (1974) and
Handel (2003) offers that confidence, integration to social scenes, increased job-specific
skills, awareness of situations, and stability are examples of workplace skills developed
by students as they progress through college. However, many researchers, policy makers,

31
and organizations believe employees’ work-related skills do not match the requirements
for existing jobs (Handel, 2003).
Figure 3. Median annual wages for employed workers aged 25 to 64 by level of
education
Note. Net Migration of 22 to 64 year olds by education level (2005-2009). Adapted from “College Completion in Mississippi: The
Impact on the Workforce and the Economy” by Education Commission of the States, 2011. Copyright 2011 by Education Commission
of the States. Adapted with permission of the publisher. See Appendix A for statement of permission from organization.
Companies and states’ prosperity rely on preparing a viable workforce and
developing a sustainable pool of human capital talent (Florida, 2004). Figure 3 presents
information on the status of the median annual wages for employed workers aged 25 to
64 by their level of education as originally provided by the Education Commission of the
States (2011). The information, gathered in 2011, would have been available to inform
decisions to adjust the funding formula for the Institutions of Higher Learning in
Mississippi. As states look to offer opportunities for their citizens, the focus on education
17,991
24,487
28,985
34,382
39,979
49,974
29,984
19,990
27,985
31,983
37,980
49,974
64,966
35,681
0
10,000
20,000
30,000
40,000
50,000
60,000
70,000
Less ThanHigh School
High SchoolGraduate or
GED
Some College,No Degree
AssociateDegree
Bachelor'sDegree
Graduate orProfessional
Degree
All Workers
Mississippi US Average

32
attainment remains at the forefront of initiatives for the country and for the individual
states to improve the financial security of residents.
Human Performance Interventions and Behavior Change
Interventions are tactics used in human capital development to promote change
through a coordinated improvement process (Fuller, 1997). Specifically, interventions in
human capital development revolve around theories of action designed to increase
effectiveness (Argyris & Schon, 1982; Fuller, 1997). Interventions can take many forms,
including job aids, training games, rewards, recognition, team building, conflict
management, process redesign, and newsletters (Fuller, 1997).
Before beginning any intervention, leaders need to obtain information on the
employees or group members taking part in the intervention process (Argyris & Schon,
1982; Russell, 2007). When implementing a change in an organization, leaders provide
the knowledge and ideas needed for the betterment of the organization (Kotter, 2008).
Testing the impact of a change could occur by creating employee focus groups, testing on
a small population of employees while measuring the outcomes, or examining similar
programs at other organizations (Kotter, 2008). Researchers test the program’s
effectiveness by establishing a control group to compare the data from the beginning of a
program to after the program concludes (Argyris & Schon, 1982; Fuller, 1997).
However, the programs sometimes rely on the premise that people enact change when
they realize their behavior has the opportunity for improvement (Argyris & Schon, 1982;
Fuller, 1997; Kotter, 2008). The researcher of this present study seeks to find if the
implementation of an electronic attendance monitoring system affects academic success

33
rates (Dicle & Levendis, 2013; O’Connor, 2010; University of Southern Mississippi,
2014).
Human Performance Interventions
Colleges and universities adopt different innovative strategies to improve
academic success rates. In college, all students, especially undergraduates, make
decisions affecting their behaviors, including class attendance (Newman-Ford,
Fitzgibbon, Lloyd, & Thomas, 2008). Some reasons for student absenteeism are travel
and weather, external commitments (work, volunteering, sports), illness, peer group
influence, parental influence, and college discipline (Longhurst, 1999). Additionally,
student perception of course rigor and attitudes regarding the importance of attendance
can also affect attendance rates (Gump, 2006).
From a university perspective, one of the most effective strategies to improve
academic success rates is to focus on undergraduate student attendance and promote
interaction between faculty and students (Romer, 1993). Just as in a job setting, people
are not able to perform at their best if they are not in attendance. The same holds true for
the collegiate classroom: A person’s ability to absorb information increases with his or
her presence in the classroom. Crede et al. (2010) and Moore (2003) found that increased
attendance rates of undergraduate students positively affected academic success and that
a student’s attendance in a classroom setting provides a stronger indicator of success than
high school grade point averages or standardized test scores. Bligh (1998) found that
undergraduate students who regularly attend lectures achieve higher grades due to their
attendance and interaction with faculty and students. Research shows that the time
students spend attending class positively affects their end of course academic grade

34
(Stanca, 2004; Thomas & Higbee, 2000; Vidler, 1980). Further, increasing
undergraduate student classroom attendance and interactions with faculty can improve
academic and workplace skill development, while also increasing students’ motivation
levels to succeed (Kanfer & Ackerman, 1989).
Attendance Monitoring Systems
To find the potential effect of undergraduate student attendance, universities such
as The University of Mississippi, University of Glamorgan (United Kingdom), Loyola
University New Orleans, and the University of Northern Arizona have each recently
implemented attendance-monitoring software systems on their campuses (Dicle &
Levendis, 2013; Newman-Ford et al., 2008; Newsom, 2016; O’Connor, 2010). By
encouraging undergraduate student attendance in the classroom, universities like the ones
mentioned above have the potential to aid students in academic growth by promoting
interaction.
Loyola University New Orleans’ attendance-monitoring software, developed by
two faculty in the College of Business, uses radio frequency identification chips,
embedded in the student ID card to log a student’s attendance (Dicle & Levendis, 2013).
Of the students using the technology, 97.5% approved of the method to track
undergraduate student attendance, while the faculty appreciated not needing to determine
attendance for each class meeting (Dicle & Levendis, 2013). The University of Northern
Arizona funded their program through the federal stimulus to support education
initiatives (O'Connor, 2010). The project outfitted one building under construction with
the new attendance trackers. The identification card system used by the students already
had the radio frequency identification chips embedded. The RFID type of intervention

35
took years of planning to implement (O'Connor, 2010). Within Mississippi, the
University of Mississippi (Ole Miss) has adopted a similar strategy of attendance
monitoring by using wall mounted card scanners (Wiley, 2013). Ole Miss uses a system
where students scan the barcode on their ID cards, registering their attendance in a
system that faculty and the university can use to track attendance and provide data for
other university reports. By monitoring attendance, Ole Miss allows for statistical
modeling to occur and places emphasis on the interaction between students and faculty
(Newsom, 2016). The University of Glamorgan (United Kingdom) used a formalized
attendance monitoring system, which allowed for data-sharing with the university
community that showed expected grades of students based upon their absenteeism
(Newman-Ford et al., 2008). Electronic attendance monitoring systems allow
universities to find students needing interventions to improve their opportunity to succeed
academically (Newman-Ford et al., 2008).
Implementing Behavior Change Practices
Human capital development practices incorporate improvement processes to
promote changes in behavior (Fuller, 1997). These behavior changes in human capital
development revolve around theories of action designed to increase effectiveness
(Argyris & Schon, 1982; Fuller, 1997). Testing the impact of a behavior change occurs
through many different facets such as creating employee focus groups or conducting a
test on a small population (Kotter, 2008). No matter the format, researchers must always
measure the outcomes of behavior change endeavors (Kotter, 2008). Researchers use
data from a control group to compare the beginning and end points of the intervention
and to establish the behavior change’s effectiveness (Argyris & Schon, 1982; Fuller,

36
1997). However, the behavior change endeavors incorporate that individuals change
upon realizing that improvements can be made to their behaviors (Argyris & Schon,
1982; Fuller, 1997; Kotter, 2008). The researcher of this present study seeks to find if the
formal attendance-monitoring procedure affects academic success rates (Dicle &
Levendis, 2013; O’Connor, 2010; University of Southern Mississippi, 2014).
When looking to implement behavior change practices, two theories support such
endeavors, The transtheoretical model of change and the theory of planned behavior. The
psychological domain for human capital development serves as a base for observing and
as a starting point to research behavioral changes (Epstein & Sheldon, 2002; Tanner-
Smith & Wilson, 2013). School attendance provides not only the opportunity for
interactions between faculty and students, but also the opportunity to develop social and
workplace related skills. (Epstein & Sheldon, 2002; Tanner-Smith & Wilson, 2013)
The transtheoretical model of change is a multistep process that sees individuals
work through intentional behavior changes (Edwards-Stewart, Prochaska, Smolenski,
Saul, & Reger, 2017). The theory applies to a variety of settings, populations, and
behaviors presenting different stages that individuals progress through (Prochaska et al.,
2008). The different stages of the transtheoretical model of change are pre-
contemplation, contemplation, preparation, action, and maintenance (Edwards-Stewart et
al., 2017). Individuals move through these stages at different paces when attempting to
modify a behavior. Many people envision behavior change as a single event that occurs
to correct a behavior (Epstein & Sheldon, 2002; Tanner-Smith & Wilson, 2013).
However, the transtheoretical model of change suggests that time plays an important part
in the behavior change process.

37
Transtheoretical Model of Change
As individuals prepare for behavior changes, they must realize their starting
points in the process. The different stages of the transtheoretical model of change
provide a framework for individuals to assess their readiness to implement change. In
order to implement the changes, individuals must work through these stages in order.
The first stage, pre-contemplation, takes place when individuals are not ready to act on a
needed behavior change in the next six months. Sometimes, individuals become stuck in
this stage because they lack the information necessary about the consequences of their
existing behavior. When multiple unsuccessful attempts occur, individuals can become
resistant to implementing the needed change. The second stage, contemplation, occurs
when an individual intends to make a change in the next six months. Individuals in this
stage are aware of the benefits if they implement the behavior change but are not willing
to take immediate action to implement the change. The preparation stage occurs as
individuals realize the need to take action immediately to affect their lives. Individuals in
this stage have already taken some steps to address their shortcomings or distractions and
stand ready to implement behavior change actions. The action stage occurs as individuals
make specific changes or modifications to behaviors in their lives. These actions are
observable by others, who see an individual taking specific actions to correct a behavior
shortcoming. The final stage of the transtheoretical model of change is the maintenance
stage. The maintenance stage occurs when individuals have implemented the needed
behavior changes over a period of time and have taken necessary precautions to prevent a
relapse. Individuals in the maintenance stage also become accustomed to the new
behavior and recognize that the behavior changes have resulted in distinct benefits to
38
their life. The transtheoretical model of change lays the foundation for individuals who
are ready to implement behavior changes.
Theory of Planned Behavior
The theory of planned behavior attempts to provide explanations for individual’s
behavior intentions in specific circumstances (Kautonen, Gelderen, & Fink, 2015). The
theory of planned behavior involves an individual’s behavior intent and how outcomes,
risks, and benefits of the intended behavior impact the intentions (Kautonen et al., 2015).
The most integral part of the theory comes from the motivation that an individual has,
giving them the ability to change their behavior. The attitudes that an individual
possesses includes the individual’s perception of the end result of performing the
behavior. In other words, the stronger the motivation a person possesses to perform a
behavior, the more likely they are to follow through. In the classroom setting, the
expected normal behavior is that enrolled students attend the class meetings for each
course. By implementing the electronic attendance monitoring system, the researcher can
rely on the theory of planned behavior and transtheoretical model of change enabling
enrolled students to make a conscious decision as to whether or not their behavior needs
to change. Further, the results of the electronic attendance monitoring system enable the
researcher, through the incorporation of demographic variables, to identify at-risk
individuals enrolled in future courses.
Similar to other universities’ undergraduate student-attendance intervention
programs, The University of Southern Mississippi’s Student Success Initiative report
focuses on increasing attendance by linking to the Freshman Attendance-Based Initiative
(The University of Southern Mississippi, 2014; Wiley, 2013). Because of changes in

39
state funding from the Institutions of Higher Learning Board, The University of Southern
Mississippi, like other institutions in the state, now focuses on new academic success
endeavors. The consequences of not implementing strategic endeavors, such as the
electronic attendance monitoring system, could include a lower level of funding from the
state. Table 1 highlights the student graduation rates from the fall 2005 freshman cohort
that was available the most recent data available prior to implementing the electronic
attendance monitoring system. The descriptive statistics outline the necessity for change
to occur when comparing the success of students to the statewide average.
Table 1
Fall 2005 Freshman Cohort Student Graduation Rates
Note. Student Graduation Rates of Fall 2005 Freshman Cohort. Adapted from “Factbook 2014/2015 Retention” by The University of
Southern Mississippi, 2015. From The University of Southern Mississippi Office of Institutional Research, 2015. Document available
for public consumption.
Demographics, College Success, and Undergraduate Student Attendance
Demographics identify personal traits of participants and these traits also have the
ability to influence academic success and, by proxy, student retention. Discovering traits
that influence academic success provides the data to develop proper strategies to aid in
retention of these students (Tharp, 1998). Following the student’s grade point average,
attendance, which promotes interaction in the classroom between faculty and students,
Student Cohort USM Average Mississippi Average
First-time, full-time,
Freshman Fall 2005 1,328 (100%) 1,009 (100%)
Graduating within 4 years
(100% of normal time) 296 (22.3%) 271 (26.8%)
Graduating within 6 years
(150% of normal time) 623 (46.9%) 502 (49.8%)
Graduating within 8 years
(200% of normal time) 676 (50.9%) 537 (53.2%)

40
has been indicated to be the next highest factor in student academic performance (Sauers,
McVay, & Deppa, 2005). Demographic factors affecting attendance are used in the
present study and in past research. The present study examines the following
undergraduate student demographic factors affecting attendance: gender, local residency,
state residency, Greek Life organization affiliation, admission type, cumulative GPA,
age, undergraduate year classification, ethnicity, current enrollment status, and the
semester of course enrollment. In previous research (Altermatt, 2007; Behar, 2010;
Borland & Howsen, 1998; Caldas, 1993; Chickering, 1974; Lamdin, 1996; Lowis &
Castley, 2008; Newman-Ford et al., 2008; Romer, 1993; Stewart, Merrill, & Saluri, 1985;
Stewart & Rue, 1983), these authors, focused on the importance of undergraduate student
attendance with one of the attendance-based demographics previously mentioned. A
shortcoming of their research lies with focusing on only one demographic factor at a
time. Additionally, in the past, many researchers have observed undergraduate student
attendance rates aggregated on the course or school-wide level but have not integrated
this data with student demographic factors (Borland & Howsen, 1998; Caldas, 1993;
Farsides & Woodfield, 2003; Lamdin, 1996; Romer, 1993; Woodfield, Jessop, &
McMillan, 2006). Combining the demographic options can lead to developing proper
strategies to improve academic success rates and to identify which types of student are
less likely to graduate (Tharp, 1998). By analyzing student demographics, researchers
may be able to identify patterns between the various demographic factors that affect
academic success. The purpose of the present study is to determine the influence of an
electronic attendance monitoring system on undergraduate student success.

41
Gender
Research shows differences in male and female academic success levels in higher
education (Altermatt, 2007; Behar, 2010; Newman-Ford et al., 2008). The National
Center for Educational Statistics (2005) reported that the percentage of women who have
successfully pursued a bachelor’s degree has increased from 61% in the 1970s to 71% in
the 1990s. Conversely, the bachelor’s degree attainment for men has stagnated at 61%
since the 1970s (National Center for Educational Statistics, 2005). The gender divide
continues to grow, with women outnumbering men attending post-secondary institutions
(U.S. Census Bureau, 2006; U.S. Department of Education, 2016). According to the U.S.
Census Bureau (2006), more women under the age of 45 have bachelor’s degrees than
men in the same age range. Further, research shows that gender influences students’
academic success (Altermatt, 2007; Newman-Ford et al., 2008). Arredondo and Knight
(2005) and Newman-Ford et al. (2008) found that gender played a role in students’
decision to attend class. Research by Woodfield et al., (2006) found that men, especially
men with higher GPAs, were more likely to be absent from class. In contrast, women
were more likely to be present for class meetings (Woodfield et al., 2006). Previous
research supports gender playing a role in academic success and attendance in the
classroom (Adelman, 1999; Altermatt, 2007; Arredondo & Knight, 2005; Astin &
Oseguera, 2005; Behar, 2010; Campbell & Fugua, 2008; Crisp, Horn, Dizinmo, &
Barlow, 2013, Newman-Ford et al., 2008).
Local Residency
Through more than 20 years of research, Pascarella and Terenzini (1991) found
that on-campus students tend to achieve higher academically. Pascarella and Terenzini

42
(2005) later reaffirmed their research, reporting that the retention of resident students
remains consistently higher than that of commuter students. Research shows that
students who do not live on campus are less committed academically (Chickering, 1974;
Lowis & Castley, 2008; Stewart et al., 1985; Stewart & Rue, 1983). Students who live
on campus make a higher investment in developing relationships that exist both outside
of the classroom and in their residence halls (Lowis & Castley, 2008). Further,
interactions with peers aid both student’s academic success and their social integration
into the campus community (Lakey & Cohen, 2000). By residing on campus, resident
students have the opportunity to participate in more activities outside of the classroom,
promoting interaction with other students and faculty (Pascarella & Terenzini, 2005).
Stewart et al. (1985) and Stewart and Rue (1983) reported that commuting students are
more easily disrupted, not only by not attending classes but also by withdrawing from
school, thus making the withdrawal from college a less intrusive decision. Facilities that
students live in during their college careers can have an impact on their academic success
by motivating them to attend class (Lau, 2003). The on-campus residence facilities have
support staff and other students that provide motivation to attend class and encourage
academic success (Pascarella & Terenzini, 2005). By including local residency as a
demographic factor, the data exposes whether on-campus or off-campus living leads to
higher academic success in the courses participating in the electronic attendance
monitoring system.
State Residency
In addition to local residency, the demographics include whether a student is a
resident of Mississippi or is a non-resident student. Both local and state residency

43
information give valuable information when evaluating academic success (Arredondo &
Knight, 2005). Previous research (Arredondo & Knight, 2005; Chimka et al., 2007)
shows that state residency information relates to undergraduate student’s decision to
attend class. Students coming from out of state have lower academic success rates and
college completion rates than students with in-state residence (Arredondo & Knight,
2005). Mentally, these students feel disconnected from past social support networks due
to the distance of the students’ residences from the institution (Chimka, Reed-Rhoads, &
Barker, 2007). The attitudes of these students could affect their decision to attend class
on any certain date.
Greek Life Organization Affiliation
The organizations that a student becomes involved with can also influence
academic success (Berger & Braxton, 1998). Previous research has shown that students
involved in at least one significant campus activity have higher rates of academic success
and retention (American College Testing, 2010; Pascarella & Terenzini, 2005). Tinto
(1993) states that the support networks formed through organizational membership
positively influence a student’s academic success. Kuykendall (2008) expanded upon
Tinto’s research by adding that students are more likely to succeed in college when they
are involved in campus activities. Further, Astin (1984) stated that when students spend
more time on campus, especially in the classroom, it is likely they interact with a wider
array of campus entities, thus leading to increased academic success. Berger and Milem
(1999) added that an undergraduate student’s campus involvement leads to higher levels
of academic success and that a student’s involvement level can influence their decision to
attend classes, due to their attachment to the university. At The University of Southern

44
Mississippi, all Greek Life organizations houses are on campus; thus, students who
participate in a Greek Life organization shape a positive experience by having on-campus
resident status (Pascarella & Terenzini, 2005).
Research has found that students who are involved with at least one major campus
organization and have an elevated level of motivation are more successful than the
general student body population (American College Testing, 2010). However, in a
review of the literature, previous research has not measured the link between
undergraduate student attendance rates and Greek affiliation. According to the Office of
Institutional Research, the only consistent student involvement is in Greek Life
organizations (M. Arrington, personal communication, 2015). Involving Greek Life
membership as a demographic during the electronic attendance monitoring system could
be strategic in providing additional data.
Admission Type
The admission type of students can also play a role in academic success (Noel et
al., 1985). Examining the admission type of students is of interest in the present study
because, in Mississippi, 15 two-year colleges offer similar campus amenities to four-year
institutions, such as classes, training, residential facilities, and athletic team competitions
(Mississippi Community College Board, 2016). The community college system presents
students with local options to begin their education. Students have the choice to
complete their associate degree or to transfer their desired number of credit hours to a
four-year institution. Further, The University of Southern Mississippi has the highest
number of transfer students of the eight publicly funded universities in Mississippi (M.
Arrington, personal communication, 2015). The University of Southern Mississippi uses

45
the designation of freshman admit and transfer admit for student admittance applications
(M. Arrington, personal communication, 2015). Yu, DiGangi, Jamnasch-Pennell, and
Kaprolet (2010) found that students with transferred hours are more likely to demonstrate
academic success, but there is a lack of research involving admission type and
undergraduate student attendance rates. Thus, identifying whether or not there is a
difference in the academic success rates and attendance rates of freshman admitted or
transfer admitted students would yield usable data.
Cumulative Grade Point Average
Another demographic factor to examine for its influence during the present study
includes a student’s grade point average (GPA). GPA measures academic success at the
end of every term or quarter (Great Schools Partnership, 2014). The GPA metric
demonstrates a student’s progress through school until graduation and provides the
student with a snapshot of his or her academic achievement (Great Schools Partnership,
2014). The cumulative GPA is a summary of a student’s achievement level, with all
classes or courses figured into the metric. The GPA is one recognized metric for success.
Many universities require students to maintain a minimum cumulative GPA to graduate.
Further, the federal government relies on each university to determine a cumulative grade
point average in determining a student’s eligibility for financial aid (The University of
Southern Mississippi, 2016). Singell and Waddell (2010) asserted that by using GPA
information, administrators would be able to recognize potential academic achievement
risks, allowing them to intervene as needed. Singell and Wadell’s (2010) analysis shows
a positive correlation between student retention, GPA, and academic success. Further,
monitoring undergraduate student attendance is indicated to have a positive and

46
significant outcome on final course grades (Caldas, 1993; Farsides & Woodfield, 2003;
Lamdin, 1996; Rau & Durand, 2000; Romer, 1993). One can infer that the higher a
student’s GPA, the higher the number of courses a student has successfully completed.
Age
Age can influence students’ success rates in courses, as non-traditional students
have a lower graduation rate than traditionally aged students (Markle, 2015). The present
study could show that a difference exists between traditionally aged and non-traditionally
aged students when it comes to academic success, as well as a difference in the academic
success rates for traditional-aged and non-traditional-aged students, as noted in Pascarella
and Terenzini’s (1991) research. The quality and quantity of the interactions that occur
between students, faculty, and staff affect students (Pascarella & Terenzini, 1991).
Similarly, Astin (1984) stated that the social interactions students have on campus with
faculty contribute to the development of skills. Tinto (1993, 2006) found that non-
traditional students faced limitations through fewer on-campus interactions when
compared to traditional-aged students. Markle’s (2015) research found that there was no
difference between non-traditional males and females in their academic success and
graduation rates. Crede et al. (2010) found that students who were older attended class
more often than students who are younger and that it factored into their end-of-course
grades.
Undergraduate Year Classification
Undergraduate year classification describes a student using the established terms
of freshman, sophomore, junior, or senior. The undergraduate year classifications are
determined by the university, but the general standard across the country is that freshmen

47
have fewer than 30 successfully completed credit hours; sophomores have between 30
and 60 successfully completed credit hours; juniors have between 60 and 90 successfully
completed credit hours; and seniors have more than 90 successfully completed credit
hours (The University of Southern Mississippi, 2016). A successfully completed credit
hour occurs when the student completes a course with a grade of A, B, or C, and sees
those hours added to their cumulative total number of completed course hours. By
including the undergraduate year classification demographic, the present study analyzes
whether a student’s decision about when to enroll in the participating courses makes a
difference in academic success. In a review of the current literature, studies have not
measured the interaction of different classification levels and attendance rates. In terms
of academic success, Crede et al. (2010) found a significance between classification,
undergraduate student attendance, and academic success. In addition, one can infer that
as students matriculate through college, they are successful because they remain enrolled;
students with unsatisfactory academic success frequently choose not to continue.
Ethnicity
Ethnicity is also an important demographic, as the present study aims to identify
influences that affect academic success in the courses observed (Zea, Reisen, Beil, &
Caplan, 1997). Rodgers (2013) found that in the United Kingdom, minority students
were less likely to complete their degrees when compared to other students. Historically
Black Colleges and Universities saw higher graduation rates among African-American
students as compared to students at Predominately-White Institutions (Allen, Epps, &
Haniff, 1991; Pascarella & Terenzini, 2005). Astin and Oseguera (2005) found that,
overall, Whites and Asians were more likely to exhibit academic success as compared to

48
Blacks and Hispanics. Further, Pascarella and Terenzini (2005) found that minority
students at Predominately-White Institutions felt isolated, which can be a factor that
negatively affects students’ success rates. For these students, one way to improve their
academic success lies with establishing a peer culture and orientation toward minority
issues (Pascarella & Terenzini, 1991). When considering ethnicity and residential status,
research suggests that minorities, especially Black students, are more likely to flourish in
a living-learning residential community than the White student majority (Pascarella &
Terenzini, 2005; Rodgers 2013). Currently, research does not examine the undergraduate
student attendance rates of different ethnicities; the research focuses only on academic
success rates.
The University of Southern Mississippi is classified as a Predominately-White
Institution (The Carnegie Classification of Institutions of Higher Education, 2016), but
the student body is 27% Black (Institutions of Higher Learning Board, State of
Mississippi, 2014). Because Black and White students comprise the majority of The
University of Southern Mississippi’s student body, there is not enough of a percentage to
provide confident data analysis for other specific ethnicities. A third category represents
the remaining ethnicities which include Asian, American Indian, Hispanic, Multi-Racial,
Not Specified, and Pacific Islander. As such, this study uses three different categories for
ethnicity: Black, White, and Other Ethnicity. The terms used to represent the ethnicities
coincide with the terminology used at the university.
Current Enrollment Status
To receive federal financial aid, students enrolled in college need to have at least
a full-time course load—a minimum of 12 credit hours (Federal Student Aid, An Office

49
of the U.S. Department of Education, 2016). In addition, only full-time students receive
the benefits of most university-based scholarships, such as out-of-state tuition waivers (E.
Dornan, personal communication, 2016). Classifying a student as full- or part-time is an
important factor of the present study because it determines whether there is a significant
difference in academic success between the groups. Students who enroll in 12 credit
hours or more a semester are classified as full-time, while students who are enrolled in
less than 12 credit hours a semester are classified as part-time. Kuh, Cruce, Shoup, and
Kinzie (2008) found that there is a significant difference in the academic success rates
between these groups. Crede et al. (2010) found a difference in the undergraduate
student attendance rates based on their course load. The Institutions of Higher Learning
(IHL) Institutional Report (2014) states that only 66.8% of full-time students at The
University of Southern Mississippi complete 24 credit hours in one academic year
compared to the 70.5% average for the entire IHL system. The report additionally states
that 37.9% of part-time students at The University of Southern Mississippi complete 12
credit hours within one academic year compared to the IHL system average of 44.3%
(Board of Trustees of State Institutions of Higher Learning, 2014). Therefore, reviewing
students’ success rates in conjunction with attempted course credit hours provides
additional relevant data for the present study.
University Designation
Universities receive different designations based upon the makeup of their
campuses (The Carnegie Classification of Institutions of Higher Education, 2016). Some
of these designations are commuter, residential, research, public, or private.
Additionally, a university may have a classification type based upon the university’s

50
history and ethnic makeup, leading to designations of a Predominately-White Institution
or a Historically Black College or University (The Carnegie Classification of Institutions
of Higher Education, 2016). If at least 25% of degree-seeking students live on campus or
nearby, a university is primarily a residential institution (The Carnegie Classification of
Institutions of Higher Education, 2016). The University of Southern Mississippi is
classified as a primarily residential, predominately-White, research university. The
University of Southern Mississippi’s designation is an important factor to consider
because the results may be generalizable to other institutions of a similar designation and
ethnic makeup.
Chapter Summary
In summary, existing literature discusses the many characteristics that influence
academic success through student retention. However, none of the previously mentioned
research combines multiple undergraduate student demographic factors affecting
attendance in the same study. The present study seeks to analyze the effects of an
electronic attendance monitoring system at one institution, The University of Southern
Mississippi, to provide usable data to enhance academic success. Through implementing
the electronic attendance monitoring system, the study aims to uncover data that policy
makers can use to influence the student body. In the end, the present study can serve as a
resource allowing other universities to make informed decisions regarding electronic
attendance monitoring systems.
In 2011, the majority of adults in the United States aged 25-34 did not have a
bachelor’s degree, and in the state of Mississippi, more than 71% did not have that level
of education (Education Commission of the States, 2011; Organization of Economic Co-

51
operation and Development, 2014). Mississippi’s eight publicly funded institutions of
higher learning have an average six-year graduation rate of 50% (Institutions of Higher
Learning Board, State of Mississippi, 2014). In response to years of lagging graduation
rates, the Institutions of Higher Learning reconfigured the funding method to reward
schools that focus on academic success, retention, and graduation (Institutions of Higher
Learning Board, State of Mississippi, 2013). The present study combines demographics
with data on undergraduate student attendance rates to discover traits that influence
academic success.
52
CHAPTER III – RESEARCH DESIGN AND METHODOLOGY
This study seeks to determine the relationship between undergraduate student
class attendance and academic success when employing an electronic attendance
monitoring system. In the Spring 2015 Semester, The University of Southern
Mississippi’s Office of Institutional Research monitored undergraduate student
attendance in certain course sections whose faculty voluntarily participated. While other
universities such as The University of Mississippi, University of Glamorgan (United
Kingdom), Loyola University of New Orleans, and The University of Northern Arizona
have used formalized attendance-monitoring procedures, this study fills a gap in the
research (Dicle & Levendis, 2013; Lopez-Bonilla & Lopez-Bonilla, 2015; Newman-Ford
et al., 2008; Newsom, 2016; O’Connor, 2010). Unlike previous studies, the present study
seeks to interpret the impact of an electronic attendance monitoring system on multiple
undergraudate student demographic factors affecting attendance.
The researcher uses archival data from The University of Southern Mississippi in
a quasi-experimental design (Goodwin, 2009; Shadish et al., 2002). The archival data
request was made for student demographic information from the Spring 2015 Semester
that, based on previous research studies, are important to attendance and academic
success (Church, 2002; Shadish et al., 2002). Appendix B contains a pre-authorization
letter approving the use of archival data from the organization. This chapter discusses the
research objectives, the design, a description of the population, and sampling procedures.
The methodology discusses the instrumentation, data collection procedures, validity and
reliability, and data analysis. Finally, the study’s limitations and chapter summary
complete the chapter.

53
Research Objectives
The purpose of the present study is to determine the influence of an electronic
attendance monitoring system on undergraduate student success. The link between
college academic success and human capital development appears when one examines
student development theory and human capital development principles. Four research
objectives guide this study:
RO1 - Describe the literature-based undergraduate demographic factors,
attendance rates, and academic success rates of the student sample.
RO2 - Compare academic success rates of students in the sections of courses
using the electronic attendance monitoring system in the Spring 2015 Semester with the
sections of courses that did not use the system.
RO3 - Determine the relationship between undergraduate attendance rates and
academic success in courses using an electronic attendance monitoring system.
RO4 - Determine the relationship between the literature-based undergraduate
demographic factors and attendance rates on student academic success in courses using
an electronic attendance monitoring system.
Research Design
This study analyzes archival data using a quasi-experimental design due to lack of
random assignment because the researcher was unable to assign subjects to specific
groups (Field, 2013; Goodwin, 2009; Shadish et al., 2002; Trochim 2006). The
researcher requested archival demographic data on the students enrolled in the course
sections that participated in the electronic attendance monitoring system and for students
enrolled in similar course sections that did not participate. The information includes the
54
following data: the number of students enrolled in each course, individual attendance
rates, individual end-of-course grades, and undergraduate student demographic factors
that relate to attendance and student success (gender, local residency, state of residency,
Greek Life organization affiliation, admission type, cumulative GPA, age, undergraduate
year classification, ethnicity, current enrollment status). Figure 3 illustrates the
difference between sections of non-participating and participating courses and shows how
the research objectives use the data.

55
Figure 4. Research design of the current research project
Spring 2015
Semester
Input: Students
Enrolled in
Selected Courses
with Intervention
Spring 2015
Semester
Result: Student
Success Rates
Spring 2015
Semester
Intervention: ID
Card Swiping for
Attendance
Spring 2015
Semester
Input: Students
Enrolled in
Selected Courses
w/o Intervention
Spring 2015
Semester
Result: Student
Success Rates
Student Enrolls in Academic Course: RO 1
Results: RO 2, 3, 4
56
Population and Sample
The present research study took place at The University of Southern Mississippi,
where six out of ten undergraduate college students, who begin as freshman, do not
graduate within four years (Institutions of Higher Learning Board, State of Mississippi,
2013). The University’s Office of Institutional Research implemented an electronic
attendance monitoring system during the Spring 2015 Semester. The researcher
requested the data from that semester as well as academic success data and demographic
factors of the population and sample.
The population for this study was undergraduate students enrolled during the
Spring 2015 Semester at The University of Southern Mississippi. Additionally, the
electronic attendance monitoring system took place in regular session course sections; no
honors course sections, online course sections, offsite course sections, or abbreviated
term course sections participated. The sample includes students from the course sections
whose faculty voluntarily participated in the electronic attendance monitoring system and
students in the course sections that did not participate. Because the study uses archival
data, the opportunity to pre-select students for participation did not exist. The students
choose the courses and section based on personal schedules and preferences. Because the
students were not randomly assigned to any of the courses, no controls are present to
ensure that the same demographics of students enroll in each course (Goodwin, 2009).
Previous Academic Success of Sample
The study compares data among students in the Spring 2015 Semester of the
courses and sections using the electronic attendance monitoring system to data for
students who were in similar courses and sections, but who did not use the electronic

57
attendance monitoring system. Three lecture-based courses voluntarily participating in
the electronic attendance monitoring system and have comparable class sections that did
not take part:
• History 101 (World Civilization I)
• History 102 (World Civilization II)
• Math 102 (Brief Applied Calculus)
Table 2 describes the relevant academic success summary data from the period of Fall
2009 to Fall 2014 (prior to implementing the electronic attendance monitoring system)
for the courses that participated in the electronic attendance monitoring system. The
table outlines how many students have taken the course during the Fall 2009 to Fall 2014
period and the academic success rates of the enrolled students.
Table 2
Academic Success in Electronic Attendance Monitoring System Participating Courses
Success Not Success
Course Description Total
C or Better
n (%)
Less than C
n (%)
Withdrew
n (%)
DFW
n (%)
History 101
World Civilization I 9,775
5,401
(54.6%)
3,992
(41.6%)
382
(3.9%)
4,374
(45.5%)
History 102
World Civilization II 8,184
5,090
(62.3%)
2,818
(34.4%)
276
(3.3%)
3,094
(37.7%)
Math 102
Brief Applied Calculus 1,772
1,038
(58.8%)
650
(36.7%)
84
(4.5%)
734
(41.2%)
Note. The total represents the total number of students enrolled in the course between the fall 2009 and fall 2014 semesters. The C or better column represents the number of students and the percentage of total students enrolled between the fall 2009 and fall 2014
semesters who achieved an academic grade of a C or better (A, B, or C). The Less than C column represents the number of students
and the percentage of total students enrolled between the fall 2009 and fall 2014 semesters who achieved an academic grade of a C or better (D or F). The Withdrew column represents the number of students and the percentage of total students enrolled between the fall
2009 and fall 2014 semesters who withdrew from the course while attempting to complete it (the student did not complete the course and did not receive any course credit). The DFW column represents the combined number of students and the percentage of total
students enrolled between the fall 2009 and fall 2014 semesters who achieved an academic grade of a D or F or if the student
withdrew from the course. If the DFW rate is above 30% for six of the eight past semesters, the course is considered historically
difficult.
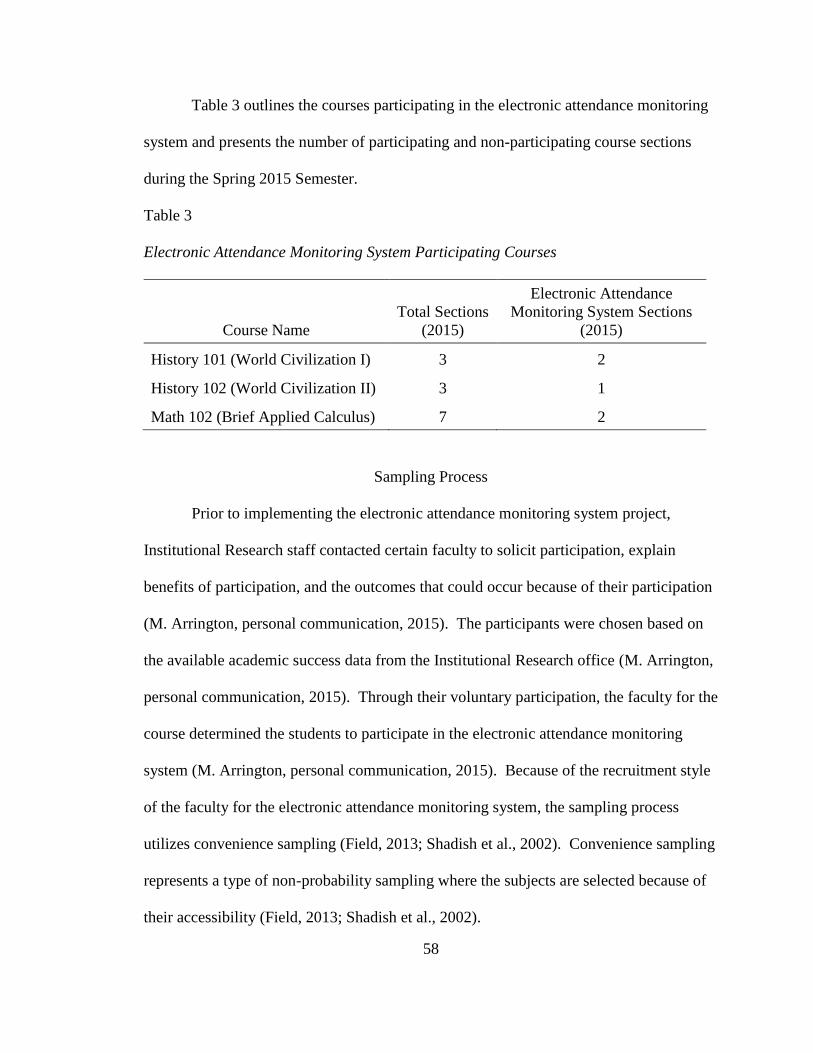
58
Table 3 outlines the courses participating in the electronic attendance monitoring
system and presents the number of participating and non-participating course sections
during the Spring 2015 Semester.
Table 3
Electronic Attendance Monitoring System Participating Courses
Course Name
Total Sections
(2015)
Electronic Attendance
Monitoring System Sections
(2015)
History 101 (World Civilization I) 3 2
History 102 (World Civilization II) 3 1
Math 102 (Brief Applied Calculus) 7 2
Sampling Process
Prior to implementing the electronic attendance monitoring system project,
Institutional Research staff contacted certain faculty to solicit participation, explain
benefits of participation, and the outcomes that could occur because of their participation
(M. Arrington, personal communication, 2015). The participants were chosen based on
the available academic success data from the Institutional Research office (M. Arrington,
personal communication, 2015). Through their voluntary participation, the faculty for the
course determined the students to participate in the electronic attendance monitoring
system (M. Arrington, personal communication, 2015). Because of the recruitment style
of the faculty for the electronic attendance monitoring system, the sampling process
utilizes convenience sampling (Field, 2013; Shadish et al., 2002). Convenience sampling
represents a type of non-probability sampling where the subjects are selected because of
their accessibility (Field, 2013; Shadish et al., 2002).
59
Instrumentation
During the electronic attendance monitoring system trial, the Office of
Institutional Research used the MagTek Model-21040145 SureSwipe Dual Head Triple
Track Magnetic Stripe Card Reader with 6' universal serial bus (USB) Interface Cable, 60
in/s Swipe Speed, 5V, to collect data. The project used 10 identification card swipe
machines to collect data. The card swipe machines accommodate a university
identification card swiped facing any direction which prevented having to align the
identification cards a certain way to capture their information. The Office of Institutional
Research selected the MagTek card swipe machines for their compatibility with the
current student identification cards (M. Arrington, personal communication, 2015). In
addition, it meant students enrolled in the classes where the electronic attendance
monitoring system occurred would not have to carry around an additional item to verify
their attendance. The system offers the flexibility to manually input a student
identification number. The staff members who collected the data would use the card
swipe machines to track attendance and view the computer screen to ensure that the
student identification card registered correctly (M. Arrington, personal communication,
2015). Using the MagTek card swipe machine presents an important difference from
other universities because the system did not require the installation of expensive
equipment, incorporation of new radio frequency identification detectors, or barcode
scanners (M. Arrington, personal communication, 2015). Using the card swipe machine
allowed for rapid data collection.

60
Data Collection
According to the director of the Office of Institutional Research, the project began
with members of the Office of Institutional Research staff volunteering to ensure accurate
data collection (M. Arrington, personal communication, 2015). The protocol developed
by the Office of Institutional Research staff, and vetted through the faculty, stated that the
seven staff members tasked with swiping identification cards would ensure card readers
were available 15 minutes prior to the class beginning and remained there until five
minutes after the class began (M. Arrington, personal communication, 2015). Data
collectors were obligated to ensure that they had a full view of the computer screen to
reduce errors. If a student forgot to bring their student identification card, the system
allowed for the manual input of their numbers. All data, swiped and manually entered,
was uploaded in the same file to the Institutional Research database. A byproduct of the
electronic attendance monitoring system was that it created more time for instruction in
the class, as the faculty did not need to collect attendance information prior to every class
period, as compared with faculty who devoted time to record attendance themselves (M.
Arrington, personal communication, 2015). There was a possibility that non-enrolled
students could swipe into the monitored course, but the cross-referencing of the swiped
data with the class roster ensured that non-enrolled students’ information did not end up
in the database.
The staff members operated their location beginning 15 minutes prior to the class
start time to five minutes after the class started (M. Arrington, personal communication,
2015). The presence of a person at the check-in sites ensured that the course could start
on time and allowed for some members of the course to arrive late while still being

61
included in the figures collected. As the semester progressed, three student workers were
hired to relieve some staff members of having to attend two or three classes to complete
the project. For large classes (those with over 120 registered students) two people staffed
the location to collect data to ensure quick entry to the classroom. On some days, only
one staff member was present, but the difference in staff did not affect the quality of the
data collected or starting time of the class (M. Arrington, personal communication, 2015).
Upon entering the university, students submit demographic data that updates as
they matriculate (M. Arrington, personal communication, 2015). The researcher
requested archived demographic information from students’ online records supplied by
the Office of Institutional Research. The accuracy of the data relies on the student’s
attention to detail. The university regularly updates some of the data, like undergraduate
year classification, throughout the time that a student is enrolled. These records are
accessible through the online record keeping software used by The University of
Southern Mississippi, PeopleSoft. Faculty, staff, and students know the system as SOAR
or Southern’s Online Accessible Records.
Institutional Review Board
Upon completion of the dissertation proposal defense, the researcher submitted
the research proposal to The University of Southern Mississippi’s Office of Research
Integrity’s Institutional Review Board (IRB) for approval. The application includes a
detailed explanation of the proposed research, ways to ensure the privacy of subjects, and
how confidentiality of all the data would be maintained. The Institutional Review Board
ensures that researchers take appropriate safeguards to protect any subjects involved,
protect the data researchers use, and to ensure that the research complies with applicable

62
federal and institutional standards and guidelines (The University of Southern
Mississippi, n.d.). The official approval from the Institutional Review Board is provided
in Appendix C.
Data Request and Confidentiality of Data
The Office of Institutional Research granted approval to use the electronic
attendance monitoring system data as evidenced in the approval letter found in Appendix
B. To request the data, the researcher completed an Institutional Review Board (IRB)
request. One of the most important parts of this data request is to ensure the
confidentiality of the data. The researcher asked that the data not include student names
or identification numbers to protect student confidentiality. To support confidentiality,
the researcher requests that the data use the following identification method: Course
Name-Section Number-Year-Roster Number (ex. HIS101;H001;2015;45). Further, each
semicolon (;) represents separated data in Microsoft Excel in a different cell in the table
so that it assists in the data analysis process. Labeling the data in this fashion allows for
the analysis of data at a later point. Academic success metrics from the Spring 2015
Semester include the total number of students enrolled in each section and individual
end-of-course grade. For the courses taking part in the Spring 2015 electronic attendance
monitoring system, the researcher requested individual attendance rates (attended/max
number of class meetings) and undergraduate demographic factors. The researcher
requested that the demographic factors be coded as follows: Gender (Male/Female), local
residency (On-Campus/Off-Campus), state of residency (Mississippi/Other), Greek Life
organization affiliation (Yes/No), admission type (Freshman/Transfer), cumulative GPA
at time of course enrollment (Below 2.5/2.5 and above), age at the time of course
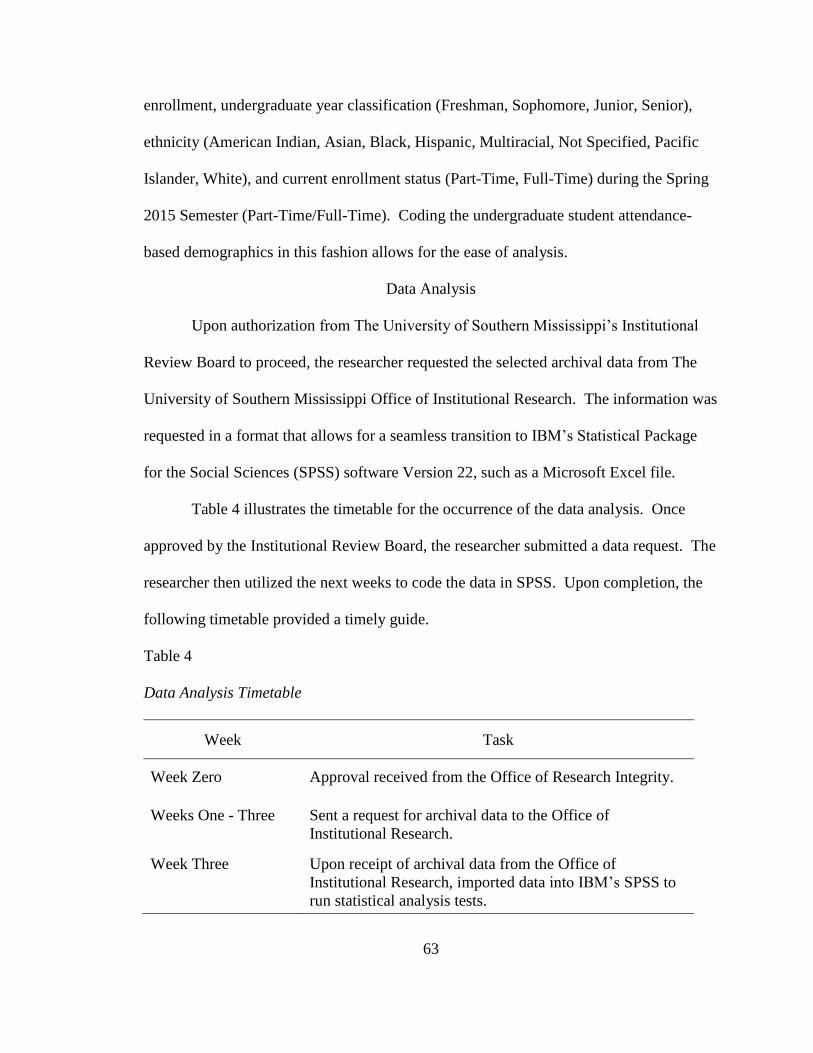
63
enrollment, undergraduate year classification (Freshman, Sophomore, Junior, Senior),
ethnicity (American Indian, Asian, Black, Hispanic, Multiracial, Not Specified, Pacific
Islander, White), and current enrollment status (Part-Time, Full-Time) during the Spring
2015 Semester (Part-Time/Full-Time). Coding the undergraduate student attendance-
based demographics in this fashion allows for the ease of analysis.
Data Analysis
Upon authorization from The University of Southern Mississippi’s Institutional
Review Board to proceed, the researcher requested the selected archival data from The
University of Southern Mississippi Office of Institutional Research. The information was
requested in a format that allows for a seamless transition to IBM’s Statistical Package
for the Social Sciences (SPSS) software Version 22, such as a Microsoft Excel file.
Table 4 illustrates the timetable for the occurrence of the data analysis. Once
approved by the Institutional Review Board, the researcher submitted a data request. The
researcher then utilized the next weeks to code the data in SPSS. Upon completion, the
following timetable provided a timely guide.
Table 4
Data Analysis Timetable
Week Task
Week Zero Approval received from the Office of Research Integrity.
Weeks One - Three Sent a request for archival data to the Office of
Institutional Research.
Week Three Upon receipt of archival data from the Office of
Institutional Research, imported data into IBM’s SPSS to
run statistical analysis tests.

64
Table 4 (Continued)
Week Task
Weeks Four - Seven Analyzed data pertaining to RO 1 - Describe the
undergraduate demographic factors affecting attendance,
academic success rates, and attendance rates of the student
sample.
Analyzed data pertaining to RO 2 - academic success rates
of students in the sections of courses using the electronic
attendance monitoring system in the Spring 2015 Semester
with the sections of courses that did not use the system.
Analyzed data pertaining to RO 3 - Determine the
relationship between undergraduate attendance rates and
academic success when using an electronic attendance
monitoring system.
Analyzed data pertaining to RO 4 - Determine the
relationship between the undergraduate demographic
factors affecting attendance and attendance rates on
student academic success when using an electronic
attendance monitoring system
Weeks Eight - Ten Completed established tables with report of results from
SPSS and summarize results.
Data Analysis Plan
The following section outlines the data analysis plan and explains the different
types of data used in the study. As previously outlined, the researcher requested the data
upon IRB approval. The Office of Institutional Research provided data in three category
types: nominal, ordinal, and ratio. Nominal data are labels for variables that have no
numeric value (Field, 2013; Shadish et al., 2002). Ordinal data does have an order in the
values, but the differences separating the values are unknown (Field, 2013; Shadish et al.,
2002). Ratio-based data tells the researcher the exact value of the data points and has an
absolute zero-based figure (Field, 2013; Shadish et al., 2002).
65
To analyze RO1, the researcher describes the demographics of the population and
sample, student success rates, and undergraduate student attendance rates, using
descriptive statistics. Tables and figures describe the data which include numbers,
percentages, and histograms. Some tables show the differences in academic success rates
between the sections of courses using the electronic attendance monitoring system and
the sections of courses that did not use the system.
Logistic regression was used to analyze RO2 and RO4. Logistic regression
analysis allows the researcher to use the demographic variables as predictors to estimate
the likelihood of an event to occur (Field, 2009; Gellman & Hill, 2007; Shadish et al.,
2002; Wong & Mason, 1985). In this case, the event observed is the student’s record of
attendance in the classroom. Logistic regression also allows the researcher to analyze the
impact of demographic variables on a student’s decision to attend class (Peng & So,
2002). The researcher chose logistic regression because the student demographic data
categories and subcategories for classes can accommodate dependent variables that are
dichotomous, categorical, and allow for the use of dummy variables as the independent
variable, something that linear regression testing cannot perform (Field, 2009; Gellman &
Hill, 2007; Shadish et al., 2002; Wong & Mason, 1985). Additionally, Peng and So
(2002) believe demographics must be analyzed to determine if one variable interacts with
another as a risk factor affecting attendance and a logistic regression analysis examines
the relationship. The continuous variable for Research Objective 2 is attendance rates.
The dependent variable presents the academic success rates of the sample. The basic
assumptions for logistic regressions are For logistic regression analysis some basic
assumptions exist: (a) having a dichotomous dependent variable, (b) ensuring that each

66
grouping is unique meaning that there can be no crossover of data within a group, (c)
large sample sizes are needed in order for the data to be robust, and (d) that a linear
relationship does not exist between the independent and dependent variables (Field, 2009;
Gellman & Hill, 2007; Shadish et al., 2002; Wong & Mason, 1985). Another assumption
of the logistic regression is that the variables are measured accurately (Field, 2009;
Gellman & Hill, 2007; Shadish et al., 2002; Wong & Mason, 1985). One item that may
stand out due to accuracy is the presence of outliers. As such, major outliers in the data
should be removed to prevent skewing the data (Field, 2009; Gellman & Hill, 2007;
Shadish et al., 2002; Wong & Mason, 1985). A 95% confidence level (p < .05), was used
in these tests.
Additionally, an odds ratio is reported in a logistic regression. The odds ratio
statistic, eB, provides an explanation describing the relationship between the independent
and dependent variables (Field, 2009; Peng & So, 2002; Shadish et al., 2002; Statistic
Solutions, 2013). The odds ratio describes the change in odds of being in a category of
the dependent variable for every unit increase of any given variable in the logistic
regression model output (Field, 2009; Peng & So, 2002; Shadish et al., 2002; Statistic
Solutions, 2013). In logistic regressions, if the odds ratio is above 1, it shows the
importance of the variable to academic success (Field, 2009; Peng & So, 2002; Statistic
Solutions, 2013). Conversely, if the eB figure is less than 1, it indicates that an inverse
relationship exists (Field, 2009; Peng & So, 2002; Statistic Solutions, 2013). For a less
than 1 eB figure, as the independent variable increase, the less likely for the outcome to
occur (Field, 2009; Statistic Solutions, 2013).
67
The researcher uses a point-biserial statistical test to evaluate Research Objective
3 and the supposition that students who attend have better academic success rates than
students who do not (Field, 2009; Shadish et al., 2002). The point-biserial tests used a
95% confidence interval (p < .05) for all tests, which is the norm for all social science
statistics (Field, 2009; Shadish et al., 2002). Point-biserial tests report a Pearson
coefficient number in the output. The Pearson coefficient numbers can range from -1 to
1; where -1 represents a perfect negative relationship and 1 represents a perfect positive
relationship (Field, 2009; Statistic Solutions, 2013). A perfect negative relationship
means that there is an indirect relationship between the variables and as one variable
increases the other variable will decrease (Field, 2009; Statistic Solutions, 2013). A
perfect positive relationship means that there is a direct relationship between the variables
and as one increases so does the other (Field, 2009). Cohen’s standard segments
correlations into distinct categories where .10 to .29 represents a weak association, .30 to
.49 represents a moderate association, and .50 and above represents a strong association
(Statistic Solutions, 2013). By squaring the Pearson coefficient number, researchers
determine is the percentage of variability that one factor has on the other (Field, 2009;
Statistic Solutions, 2013). Point-biserial tests have certain assumptions to ensure validity.
Point-biserial tests must have one or two variables using ratio data, while the other
variable is dichotomous (Field, 2009). Point-biserial testing does not use independent
and dependent variables because it is a test comparing two variables to each other (Field,
2009). This research objective uses the point-biserial test to assess the importance of
undergraduate student attendance on academic success.
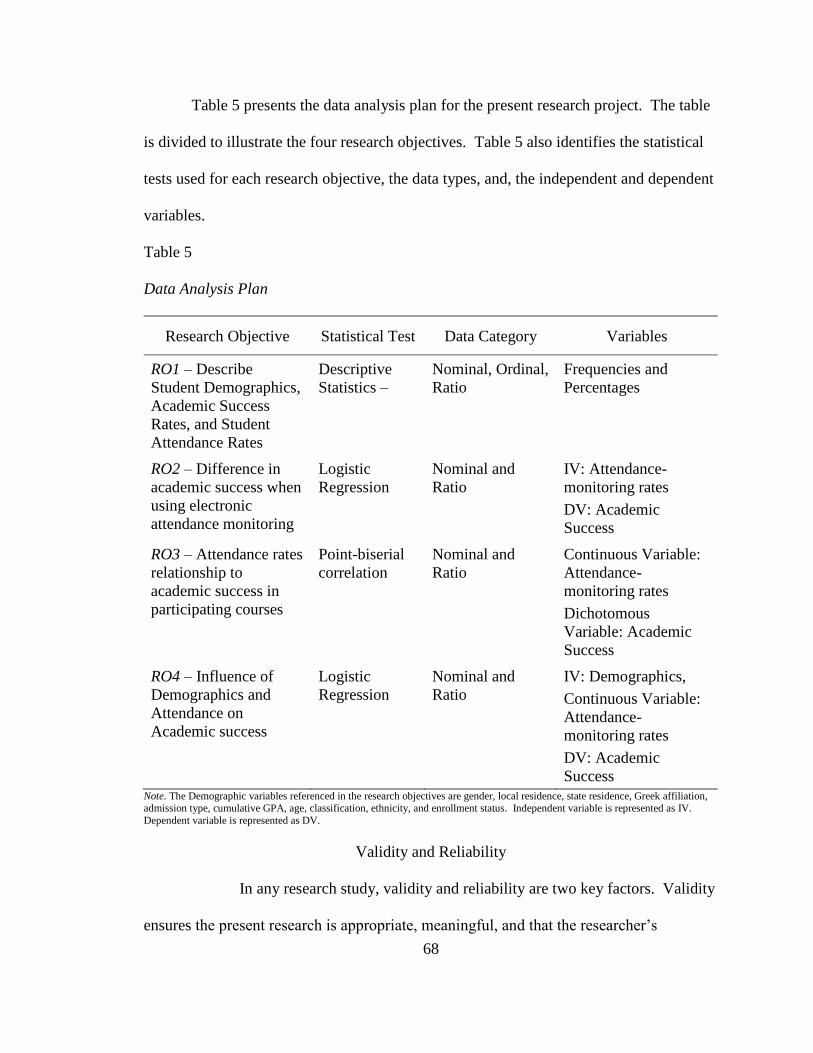
68
Table 5 presents the data analysis plan for the present research project. The table
is divided to illustrate the four research objectives. Table 5 also identifies the statistical
tests used for each research objective, the data types, and, the independent and dependent
variables.
Table 5
Data Analysis Plan
Research Objective Statistical Test Data Category Variables
RO1 – Describe
Student Demographics,
Academic Success
Rates, and Student
Attendance Rates
Descriptive
Statistics –
Nominal, Ordinal,
Ratio
Frequencies and
Percentages
RO2 – Difference in
academic success when
using electronic
attendance monitoring
Logistic
Regression
Nominal and
Ratio
IV: Attendance-
monitoring rates
DV: Academic
Success
RO3 – Attendance rates
relationship to
academic success in
participating courses
Point-biserial
correlation
Nominal and
Ratio
Continuous Variable:
Attendance-
monitoring rates
Dichotomous
Variable: Academic
Success
RO4 – Influence of
Demographics and
Attendance on
Academic success
Logistic
Regression
Nominal and
Ratio
IV: Demographics,
Continuous Variable:
Attendance-
monitoring rates
DV: Academic
Success
Note. The Demographic variables referenced in the research objectives are gender, local residence, state residence, Greek affiliation, admission type, cumulative GPA, age, classification, ethnicity, and enrollment status. Independent variable is represented as IV.
Dependent variable is represented as DV.
Validity and Reliability
In any research study, validity and reliability are two key factors. Validity
ensures the present research is appropriate, meaningful, and that the researcher’s

69
conclusion can be useful (Fraenkel & Wallen, 2006). Additionally, validity breaks down
into two subordinate subsets, internal and external validity, and determines if the
requirements of the research methods are met (Shadish et al., 2002). External validity
refers to whether or not the results and generalizations are applicable to a larger
population (Fraenkel & Wallen, 2006; Shadish et al., 2002). External validity was
controlled because the population involved all students from courses participating, and
the sections that did not participate, in the electronic attendance monitoring system
(Fraenkel & Wallen, 2006; Shadish et al., 2002). Internal validity is addressed because
course sections that did not employ the electronic attendance monitoring system are in
the data received and used as a control group (Fraenkel & Wallen, 2006; Shadish et al.,
2002). By doing this, the researcher can control the presence of other reasons that may
affect the outcomes of the tests (Fraenkel & Wallen, 2006; Shadish et al., 2002).
Reliability defines the degree of dependability of the assessment tool (Fraenkel &
Wallen, 2006; Shadish et al., 2002). The Office of Institutional Research organized the
electronic attendance monitoring system and thus ensuring reliability of the data
collection rested with their staff. Members of the office staff conducted training for all
individuals tasked with collecting data (M. Arrington, personal communication, 2015).
The protocol consisted of having a training session to demonstrate the proper collection
procedures and a member of the staff being present to observe the person during the first
day of swiping in their assigned course (M. Arrington, personal communication, 2015).
The protocol established a system ensuring that individuals knew what to expect during
their assigned times to swipe for a course and no issues arose to indicate a gap in
reliability (M. Arrington, personal communication, 2015).

70
Chapter Summary
In summary, the present study seeks to determine the influence of an electronic
attendance monitoring system on undergraduate student success. Chapter III presents
information regarding research objectives, research design, population, sample, sampling
process, instrumentation, data collection, research objectives, data analysis, and
limitations of the study. This study utilizes a quasi-experimental design using archival
data. Data was analyzed for the Spring 2015 Semester when the electronic attendance
monitoring system was implemented. In Chapter III the methodology was described to
include the chosen statistical tests determined by the research objectives. The data
analysis occurred using IBM SPSS version 22 software. Chapter IV summarizes the
results and analysis of the study.

71
CHAPTER IV – RESULTS
The present study determined the influence of an electronic attendance monitoring
system on undergraduate student success. Chapter IV reports the results of the study’s
research objectives which determined the design of the study and the process for
analyzing the data. This study utilizes a quasi-experimental design using archival data
from an electronic attendance monitoring system implemented during the Spring 2015
Semester. The analysis for the study includes descriptive statistics, logistic regression,
and a point-biserial correlation. The sample includes University of Southern Mississippi
undergraduate students from the Spring 2015 course sections whose faculty voluntarily
participated in the electronic attendance monitoring system.
Research Objective 1 – Describing demographics, attendance, and academic success rates
Research Objective 1 describes the demographic factors, attendance rates, and
academic success rates of the student sample. Research Objective 1 uses descriptive
statistics to provide a snapshot of the population and sample. Descriptive statistics
provide quantitative data to researchers using simple tables, graphics, and summary data
(Field, 2009; Shadish et al., 2002). The student demographics, academic success rates,
and student attendance data were obtained from the Institutional Research Office.
Demographic Characteristics
The research-based demographic factors, tying both to academic success and
attendance accountability, include gender, local residence, state residence, Greek
affiliation, admit type, cumulative GPA, age, undergraduate classification, ethnicity, and
enrollment status. The demographics in Table 6 describe the population and sample in
the present study. During the Spring 2015 semester, the total number of students in the

72
sample is 1593, where 640 students were enrolled in sections of courses using the
electronic attendance monitoring system and 953 students were enrolled in sections of
courses that did not use monitor attendance. Table 6 presents the demographic
information of students in the sections of courses using the electronic attendance
monitoring system and the sections of courses that did not use the system.
Faculty volunteered to use the electronic attendance monitoring system and were
not randomly selected. Student demographic information was collected as students
applied for admission to the university and updated throughout a student’s enrollment.
Table 6
Group Demographic Characteristic Comparison
Characteristics
Attendance Monitoring
Number (%)
Non-Attendance Monitoring
Number (%)
Gender
Female 388 (60.6%) 610 (64.0%)
Male 252 (39.4%) 343 (36.0%)
Local Residence
Commuter 257 (40.2%) 593 (62.2%)
Resident 383 (59.8%) 360 (37.8%)
State Residence
In-State 466 (72.8%) 784 (82.3%)
Out-of-State 174 (27.2%) 169 (17.7%)
Greek Affiliation
No 451 (70.5%) 770 (80.8%)
Yes 189 (29.5%) 183 (19.2%)

73
Table 6 (Continued)
Characteristics
Attendance Monitoring
Number (%)
Non-Attendance Monitoring
Number (%)
Admit Type
Freshman 534 (83.4%) 590 (61.9%)
Transfer 106 (16.6%) 361 (37.9%)
Cumulative GPA
Below 2.5 397 (62.0%) 470 (49.3%)
2.5 and Above 211 (33.0%) 373 (39.1%)
No Established GPA 32 (5.0%) 110 (11.5%)
Age
Traditional (18-24) 609 (95.2%) 765 (80.3%)
Non-Traditional (>24) 31 (4.8%) 188 (19.7%)
Classification
Underclassmen 521 (81.4%) 589 (61.8%)
Upperclassmen 119 (18.6%) 364 (38.2%)
Ethnicity
American Indian 2 (0.3%) 6 (0.6%)
Asian 10 (1.6%) 16 (1.7%)
Black 230 (35.9%) 378 (39.7%)
Hispanic 27 (4.2%) 34 (3.6%)
Multiracial 14 (2.2%) 14 (1.5%)
Not Specified 1 (0.2%) 12 (1.3%)
Pacific Islander 1 (0.2%) 2 (0.2%)
White 355 (55.5%) 491 (51.5%)
Enrollment Status
Part-Time 15 (2.3%) 82 (8.6%)
Full-Time 625 (97.7%) 871 (91.4%)

74
As students applied for admission, two gender choices were available, female or
male. At the time, the university did not provide additional choices for gender
identification. During the semester of study, the gender breakdown at the university level
for the population was 63.2% female and 36.8% male. In the sections of courses that
instituted the electronic attendance monitoring system, 60.6% (n = 388) were female and
39.4% (n = 252) were male, representing a 21.2% higher rate of females than males. The
sections of courses that did not use the electronic attendance monitoring system was
64.0% (n = 610) female and 36.0% (n = 343) male.
Each semester, students make an important choice regarding their desire to reside
in on-campus housing or to reside off-campus and be a commuter student. Information
regarding the residency designation for the university population was not available
through an online search for the information nor was it provided through the request for
archival data. Overall, the students enrolled in the sections of courses using the
electronic attendance monitoring system had a makeup of 40.2% (n = 257) commuter
students and 59.8% (n = 383) resident students. Comparatively, the demographics of
students not in the sections of courses using the electronic monitoring system were made
of 62.2% (n = 593) commuter students and 37.8% (n = 360) resident students.
Universities across the nation recruit students from both their home state and
other states in the United States, as well as other countries. For the purposes of the study,
students were categorized as either being in-state residents or out-of-state residents. The
population of the university is made up of 65.0% in-state residents and 35.0% out-of-state
residents. The sections of courses using the electronic attendance monitoring system had
a state residence breakdown of 72.8% (n = 466) as in-state residents and 27.2% (n = 174)

75
as out-of-state residents. In the sections of courses that did not monitor attendance 82.3%
(n = 784) were in-state residents and 17.7% were out-of-state residents.
The literature review presented research conducted regarding the success of
students if they were involved in at least one major campus organization. In this study,
the major campus organization selected was whether a student is involved in a fraternity
or sorority. Information regarding the number of students university-wide involved in
Greek Life is not available on the Institutional Research website, nor was it provided
through the data request. However, in the sample, the number of students not involved in
a Greek organization in the sections of courses using the electronic attendance monitoring
system was 70.5% (n = 451) and the number of students who were in a Greek
organization was 29.5% (n = 189). In the sections of courses that did not participate in
the electronic attendance monitoring system the number of non-Greek affiliated students
was 80.8% (n = 770) and the number affiliated with a Greek organization was 19.2% (n =
183).
As students are admitted to the university, they receive a classification as either a
freshman admit, their first time in college, or a transfer admit, those students transferring
credit from another institution. The University of Southern Mississippi publishes the
number of new students each semester who fall into these categories, however, the
figures are not available for the full university-wide population. The sections of courses
that took part in the electronic attendance monitoring system had 83.4% (n = 534)
freshman admit students and 16.6% (n = 106) transfer admit students. Comparatively,
the sample included 61.9% (n = 590) freshman admit students and 37.9% (n = 361)

76
transfer admit students in the sections of courses that did not participate in the electronic
attendance monitoring system.
As students progress through college, their academic success is recorded as a
Cumulative GPA, another demographic factor used in this study. The GPA was recorded
with three distinct categories, students who earn Below a 2.5 Cumulative GPA, students
who achieve a 2.5 and Above, and students with no previous university grade point
average. No figures are available to describe the student population for this demographic
because the information is not published. In the sections of courses implemented the
electronic attendance monitoring system, 62.0% (n = 397) of the students in the sample
had a GPA below a 2.5, 33.0% (n = 211) had a GPA of 2.5 and above, and 5.0% (n = 32)
were without any previous university GPA. In the sections of courses that did not take
place in the electronic attendance monitoring system, 49.3% (n = 470) earned a GPA
below a 2.5, 39.1% (n = 373) attained a GPA of 2.5 and above, and 11.5% (n = 110) were
without any previous university GPA.
Colleges and universities find a wide age range of students in attendance pursuing
a degree. Traditional aged students are defined as being between 18-24 years of age and
those above 24 years of age are defined as non-traditional students. In all, the university
population for this demographic at the time was 67.5% in the traditional age and 32.5%
in the non-traditional age group. Sections of courses that used the electronic attendance
monitoring system had a makeup of 95.2% (n = 609) traditional aged students and 4.8%
(n = 31) non-traditional aged students. The sections of courses that did not use the
electronic attendance monitoring had a breakdown of 80.3% (n = 765) traditional aged
and 19.7% (n = 188) in the non-traditional category. The difference in the percentages
77
can be attributed to the courses that took part in the electronic attendance monitoring
system and their place in the course sequencing for academic majors which is to enroll in
these classes early in the undergraduate career.
As students progress through college, they are classified in one of four categories,
freshman, sophomore, junior, or senior. The present study used two factors to classify
students, underclass students which are freshman and sophomores, and upperclass
students which are juniors and seniors. Altogether, the classification of the student body
population for this demographic factor shows that 38.6% of the university-wide students
are classified in the underclass category and 61.4% in the upperclass category. In the
sections of courses that used the electronic attendance monitoring system, the makeup
was 81.4% (n = 521) underclass students and 18.6% (n = 119) upperclass students. The
sections of courses that did not use the electronic attendance monitoring system consisted
of 61.8% (n = 589) underclass students and 38.2% (n = 364) upperclass students.
Students have the opportunity to select their ethnicity when applying for entrance
into the university. During this process, individuals can select one of eight categories to
describe their ethnicity which are American Indian, Asian, Black, Hispanic, Multiracial,
Not Specified, Pacific Islander, or White. Due to the lack of numbers in each ethnicity
category in the courses that used the electronic attendance monitoring system, some
ethnicities had to be combined for the purposes of conducting the research. The ethnicity
for the population was 62.9% in the White category, 27.2% in the Black category, and
9.9% in the combined other ethnicity category. The ethnicity of students in the sections
of courses that used the electronic attendance monitoring system is 55.5% (n = 355) in
the White category, 35.9% (n = 230) in the Black category, and 8.6% (n = 55) in the

78
combined other ethnicity category. The ethnicity of students in the sections of courses
that did not use the electronic attendance monitoring system is 51.5% (n = 491) in the
White category, 39.7% (n = 378) in the Black category, and 8.9% (n = 84) in the
combined other ethnicity category.
Each semester, students are able to choose how many credit hours they wish to
enroll as they select their classes. Full-time students must be enrolled in at least 12 credit
hours while individuals below 12 credit hours are classified as part-time students.
Overall, the enrollment status breakdown for the population was 11.9% part-time
students and 88.1% full-time students. The breakdown in the sections of courses that
used the electronic attendance monitoring system was 2.3% (n = 15) part-time students
and 97.7% (n = 625) full-time students. This compared to 8.6% (n = 82) part-time
students and 91.4% (n = 871) full-time students in the sections of courses that did not
utilize the electronic attendance monitoring system.
Electronic Attendance Monitoring System Descriptive Results
Research Objective 1 also presents the data on the percentage of class times that
students attended class. Research Objective 1 breaks down the data in two ways. Figure
5 presents the undergraduate student electronic attendance monitoring data combining all
participating courses in one graphic. Figure 5 uses descriptive statistics to show the
undergraduate student electronic attendance monitoring-data describing the attendance
rates for the individual class sections for the sample. Figure 5 organizes the attendance
data as follows: 0-20%, 20.1-40%, 40.1-60%, 60.1-80%, 80.1-90%, 90.1-95%, 95.1-
99.99%, and 100%. The data provided by the Office of Institutional Research was in
percentage of classes that the student attended. The percentage figures provide increased
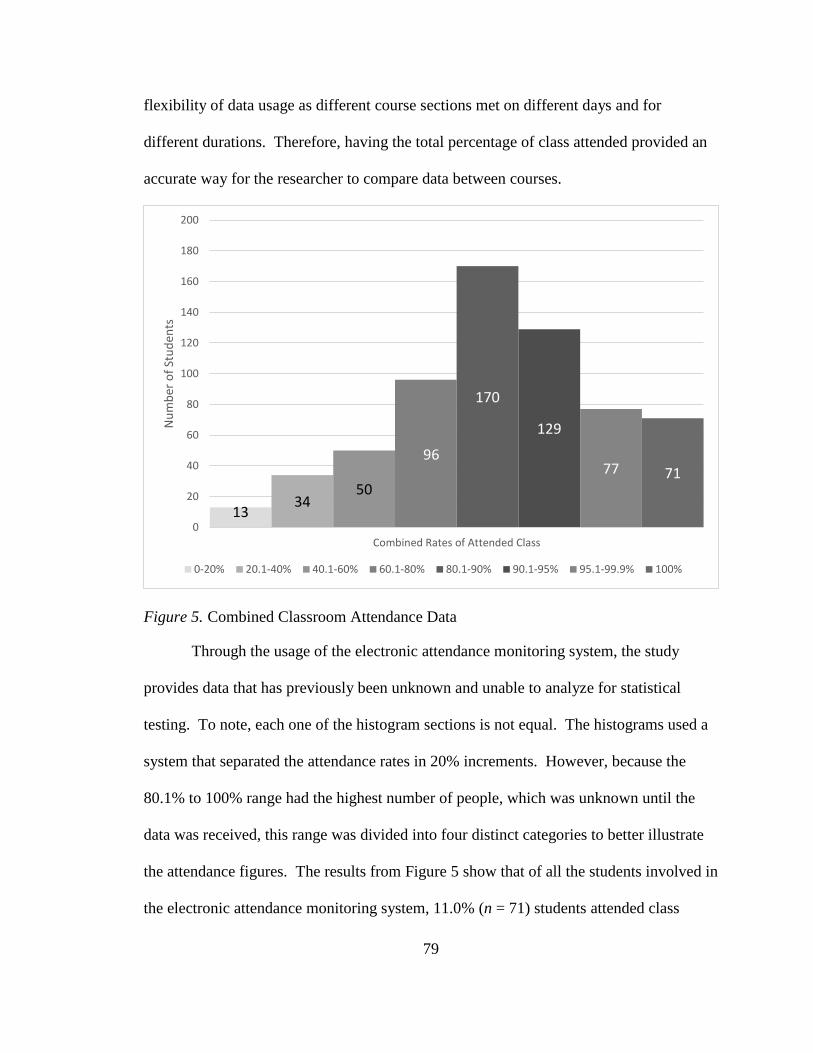
79
flexibility of data usage as different course sections met on different days and for
different durations. Therefore, having the total percentage of class attended provided an
accurate way for the researcher to compare data between courses.
Figure 5. Combined Classroom Attendance Data
Through the usage of the electronic attendance monitoring system, the study
provides data that has previously been unknown and unable to analyze for statistical
testing. To note, each one of the histogram sections is not equal. The histograms used a
system that separated the attendance rates in 20% increments. However, because the
80.1% to 100% range had the highest number of people, which was unknown until the
data was received, this range was divided into four distinct categories to better illustrate
the attendance figures. The results from Figure 5 show that of all the students involved in
the electronic attendance monitoring system, 11.0% (n = 71) students attended class
1334
50
96
170
129
77 71
0
20
40
60
80
100
120
140
160
180
200
Combined Rates of Attended Class
Nu
mb
er o
f St
ud
ents
0-20% 20.1-40% 40.1-60% 60.1-80% 80.1-90% 90.1-95% 95.1-99.9% 100%

80
meetings 100% of the time, 12.0% (n = 77) students attended 95.1 to 99.9% of class
meetings, 20.2% (n = 129) of students were in class for 90.1 to 95% of full meeting time,
26.6% (n = 170) of students attended class between 80.1 to 90% of available course
meetings, and 15.0% (n = 96) of students attended class 60.1 to 80% of class meeting
time. This shows that 84.8% (n = 543) students attended class 60% or more of the time.
In contrast, 15.2% (n = 97) students did not attend class over 60% of the time. That
breakdown is 2.1% (n = 13) of students attended class 0 to 20% of the time, 5.3% (n =
34) were in class for 20.1 to 40% of class meetings, and 7.8% (n = 50) attended class 40.1
to 60% of the time.
Figure 6 uses descriptive statistics to show the undergraduate student electronic
attendance monitoring-data describing the attendance rates for the individual class
sections for the sample. Figure 6 organizes the attendance data as follows: 0-20%, 20.1-
40%, 40.1-60%, 60.1-80%, 80.1-90%, 90.1-95%, 95.1-99.99%, and 100%.
The results from Figure 6 were broken down by course title enabling the
illustration of attendance in specific courses involved in the electronic attendance
monitoring system. In History 101, 6.7% (n = 19) students attended class meetings 100%
of the time, 13.6% (n = 39) students attended 95.1 to 99.9% of class meetings, 17.2% (n
= 49) of students were in class for 90.1 to 95% of full meeting time, 25.0% (n = 71) of
students attended class between 80.1 to 90% of available course meetings, and 16.5% (n
= 47) of students attended class 60.1 to 80% of class meeting time. This shows that
79.0% (n = 225) students attended class 60% or more of the time. In contrast, 21.0% (n =
60) students did not attend class over 60% of the time. That breakdown is 2.1% (n = 6)

81
of students attended class 0 to 20% of the time, 7.0% (n = 20) were in class for 20.1 to
40% of class meetings, and 11.9% (n = 34) attended class 40.1 to 60% of the time.
Figure 6. Individual Course Attendance Monitoring Data
6 34
2013
1
34
12
4
47
40
9
71
8811
49
66
14
39
29
9
19
4012
0%
10%
20%
30%
40%
50%
60%
70%
80%
90%
100%
History 101 History 102 Math 102
Per
cen
tage
of
Stu
den
ts in
Co
urs
e
Percentage of Attended Class
0-20% 20.1-40% 40.1-60% 60.1-80%
80.1-90% 90.1-95% 95.1-99.9% 100%

82
In History 102, 13.7% (n = 40) students attended class meetings 100% of the
time, 10.0% (n = 29) students attended 95.1 to 99.9% of class meetings, 22.7% (n = 66)
of students were in class for 90.1 to 95% of full meeting time, 30.2% (n = 88) of students
attended class between 80.1 to 90% of available course meetings, and 13.7% (n = 40) of
students attended class 60.1 to 80% of class meeting time. This shows that 90.3% (n =
263) students attended class 60% or more of the time. In contrast, 9.7% (n = 28) students
did not attend class over 60% of the time. That breakdown is 1.2% (n = 3) of students
attended class 0 to 20% of the time, 4.4% (n = 13) were in class for 20.1 to 40% of class
meetings, and 4.1% (n = 12) attended class 40.1 to 60% of the time.
In Math 102, 18.6% (n = 12) students attended class meetings 100% of the time,
14.1% (n = 9) students attended 95.1 to 99.9% of class meetings, 21.8% (n = 14) of
students were in class for 90.1 to 95% of full meeting time, 17.3% (n = 11) of students
attended class between 80.1 to 90% of available course meetings, and 14.1% (n = 9) of
students attended class 60.1 to 80% of class meeting time. This shows that 85.9% (n =
55) students attended class 60% or more of the time. In contrast, 14.1% (n = 9) students
did not attend class over 60% of the time. That breakdown is 6.3% (n = 4) of students
attended class 0 to 20% of the time, 1.5% (n = 1) were in class for 20.1 to 40% of class
meetings, and 6.3% (n = 4) attended class 40.1 to 60% of the time.
One area of Figure 6 that stands out is in History 101, the number of people who
were in the 40.1-60% range. Otherwise, the data shows that the percentage of student
attending class less than 60% of the time is below 15%. The attendance range where the
largest majority of students attended class is the 80.1-90% range for History 101 and
History 102 but is 90.1-95% for Math 102. History 101 has a very low 100% attendance

83
percentage when compared to the other courses in the study. Appendix D presents an
adapted view of Figure 6 in a table format.
Academic Success Rates
The final section of Research Objective 1 provides the summary information
regarding academic success rates in the Spring 2015 Semester in the sections of courses
using the electronic attendance monitoring system and the sections of courses that did not
use the system. Table 7 presents a breakdown of students, on a summary scale and
categorized by each course, in the sections of courses using the electronic attendance
monitoring system and the sections of courses that did not use the system during the
Spring 2015 Semester.
Table 7
Breakdown of Students in Participating and Non-Participating Courses
Course
Attendance
Monitoring
(n)
Non-Attendance
Monitoring
(n) Total
All Courses Combined 640 953 1593
History 101 World Civilization I 285 219 504
History 102 World Civilization II 291 540 831
Math 102 Brief Applied Calculus 64 194 258
Note. The table lists the courses that participated in the electronic attendance monitoring system. The table shows the number of
students enrolled in the sections of courses using the electronic attendance monitoring system and the sections of courses that did not
use the system as well as presents the total numbers in the categories.
Table 7 provides the breakdown of the number of students enrolled in the sections
of courses using the electronic attendance monitoring system and the sections of courses
that did not use the system. In total, 640 students took part in course sections
implementing the electronic attendance monitoring system, and 953 students were in the
non-attendance monitoring course sections. The total number of students in the sample is

84
1593. Three courses participated in the electronic attendance monitoring system. The
History 101 course had 285 students enrolled in the attendance monitoring while 219
students were in the course sections that did not participate in attendance monitoring.
The enrollment for History 102 saw 291 students in the attendance monitoring course
sections and 540 students in the non-attendance monitoring course sections. Math 102
had 64 students in the course sections that participated in the attendance monitoring and
194 students in the course sections that did not participate.
The total number of students for each course is different for a number of reasons.
First, each course had different number of available course sections that could and did
participate. Two of the three History 101 class sections participated in the study. One of
the three class sections of History 102 participated in the study. Two of the seven class
sections of Math 102 course participated. Second, the size of the enrollment cap on the
class could have affected the number of students enrolled in each course section. For
instance, the number of students allowed to register in a course section of Math 102 is
lower than that of History 101 or History 102. Next, the number of course sections for
each class and the classroom assigned for the class section to meet was out of control of
the researcher as it is assigned at least two semesters prior to that semester. The
classroom assigned for a course section dictates how many students can enroll in the
class. Finally, faculty who voluntarily participated in the electronic attendance
monitoring system controlled the number of available students for attendance monitoring.
Table 8 presents the academic success data combining all participants in the
course sections in the Spring 2015 Semester. Table 8 presents the raw data of academic
success rates, students who received an A, B, or C end-of-term grade in the sections of

85
courses using the electronic attendance monitoring system and the sections of courses
that did not use the system.
Table 8
Academic Success in Participating Courses: Monitored vs. Non-Monitored
Courses
Attendance
Monitoring Number
(%)
Non-Attendance
Monitoring Number
(%)
History 101 - World Civilization I 161 (56.5%) 80 (36.5%)
History 102 - World Civilization II 205 (70.4%) 258 (47.8%)
Math 102 - Brief Applied Calculus 41 (64.1%) 95 (49.0%)
Note. The table lists the courses that participated in the electronic attendance monitoring system. The table compares the combined
academic success rates in the sections of courses using the electronic attendance monitoring system and the sections of courses that
did not use the system.
Table 8 presents the end-of-term academic success data for the three courses that
took part in the electronic attendance monitoring system as compared to the course
sections that did not participate. While other factors could have influenced the academic
success rates, they are not known at this time. However, the main difference between
these course sections is the implementation of the electronic attendance monitoring
system. The results show higher levels of academic success in the courses using the
electronic attendance monitoring system. The results for History 101 indicate that 56.5%
(n = 161) of students enrolled in the attendance monitored class sections were
academically successful as compared to 36.5% (n = 80) in the class sections that did not
participate. The data shows a 20.0% increase in academic success rates between the
attendance monitoring and non-attendance monitoring classes when using an electronic
attendance monitoring system. History 102 had the highest number of students in a class
that participated in the electronic attendance monitoring system. History 102 saw a

86
70.4% (n = 205) rate of academic success in attendance monitored classes as opposed to
47.8% (n = 258) in the non-attendance monitored classes. This represents a 22.6%
increase in the academic success rate between these classes. The results from Math 102
indicated an 25.1% increase in the academic success rates between the course sections.
The course sections that used attendance monitoring had a 64.1% (n = 41) academic
success rate versus 49.0% (n = 95) rate in the non-attendance monitoring classes.
The data has shown a difference in the academic success rates between the
sections of courses using the electronic attendance monitoring system and the sections of
courses that did not use the system. The end-of-term grades were provided by the Office
of Institutional Research in an anonymous fashion and because of that, descriptive
statistics can be used to see the actual differences in the end-of-term academic success
grades. Tables 9, 10, and 11 compare the actual course grades for History 101, History
102, and Math 102 during the Spring 2015 Semester in the sections of courses using the
electronic attendance monitoring system and the sections of courses that did not use the
system. Table 9 presents the information from History 101.
Table 9
Academic Success Course Data Comparison: History 101
Group
Success Not Success
A B C D F W
Attendance
Monitored
24
(8.4%)
67
(23.5%)
70
(24.6%)
35
(12.3%)
57
(20.0%)
32
(11.2%)
Non-Attendance
Monitored
13
(5.9%)
38
(17.4%)
29
(13.2%)
33
(15.1%)
71
(32.4%)
35
(16.0%)
Note. The table represents the total number of students enrolled in the course during the Spring 2015 semester and is separated into
two categories, attendance monitored and non-attendance monitored. The attendance monitored category represents course sections that participated in the electronic attendance monitoring system and has 285 participants. Conversely, the non-attendance monitored
category represents the sections of the course that did not participate in the electronic attendance monitoring system and has 265
participants total. The end-of-term grades of A, B, and C, are classified as “Success”. The end-of-term grades of D, F, and W are
classified as “Not Success.

87
Table 9 presents the academic success data of the sample and divides the data by
attendance monitored,” the class sections participating in the electronic attendance
monitoring system, and non-attendance monitored,” the class sections that did not take
part. The data in Table 9 shows academic success in this course is greater in the class
sections that implemented the electronic attendance monitoring system. As reported
earlier, the students enrolled in the History 101 class sections that implemented the
electronic attendance monitoring system had a 56.5% academic success rate as compared
to 36.5% in the class sections that did not implement the system. Specifically, as
compared to the courses that did not implement attendance monitoring, the courses that
did monitor for attendance saw an increase of 2.5% in A grades, an increase of 6.1% of B
grades, and an increase of 11.4% in C grades. Conversely, the data in the D, F, and W
columns (Not Success), shows a reduction in the number of students who are in each
column. The attendance monitored courses had a 2.8% drop in D grades, a 12.4% drop in
F grades, and a 4.8% drop in the Withdrawal rate. The data shows a difference is present
by implementing the electronic attendance monitoring system.
Table 10 presents the actual course grades for History 102 in the Spring 2015
Semester of the courses and sections using the electronic attendance monitoring system
and courses that did not participate.

88
Table 10
Academic Success Course Data Comparison: History 102
Group
Success Not Success
A B C D F W
Attendance
Monitored
44
(15.1%)
83
(28.5%)
78
(26.8%)
34
(11.7%)
39
(13.4%)
13
(4.5%)
Non-Attendance
Monitored
42
(7.8%)
114
(21.1%)
102
(18.9%)
90
(16.7%)
147
(27.2%)
45
(8.3%)
Note. The table represents the total number of students enrolled in the course during the Spring 2015 semester and is separated into
two categories, attendance monitored and non-attendance monitored. The attendance monitored category represents course sections
that participated in the electronic attendance monitoring system and has 291 participants. Conversely, the non-attendance monitored category represents the sections of the course that did not participate in the electronic attendance monitoring system and has 540
participants total. The table includes the individual grades for students enrolled in the sections of courses using the electronic
attendance monitoring system and the sections of courses that did not use the system. The grades provided are A, B, C, D, F, and W. The end-of-term grades of A, B, and C, are classified as “Success”. The end-of-term grades of D, F, and W are classified as “Not
Success.
Table 10 presents the data, divided by attendance monitored, the class sections
participating in the electronic attendance monitoring system, and non-attendance
monitored”, the class sections that did not take part. The data in Table 10 shows
academic success in this course is greater in the class sections that implemented the
electronic attendance monitoring system. The students enrolled in the class sections that
implemented the electronic attendance monitoring system had a 70.4% academic success
rate as compared to 47.8% in the class sections that did not implement the system. When
comparing the courses implementing attendance monitoring to the ones that did not, a
difference in the academic success grades is present. Increases in academic success were
noted with an increase of 7.3% in A grades, a 7.4% increase of B grades, and a 7.9%
increase in C grades. Additionally, a decrease is present in the grades classified as “Not
Success”. The results show a 5.0% decrease in D grades, a 13.8% decrease in F grades,
and a 3.8% decrease in the Withdrawal rate. The percentage increases and decreases
show that a difference in academic success rates is present through the implementation of
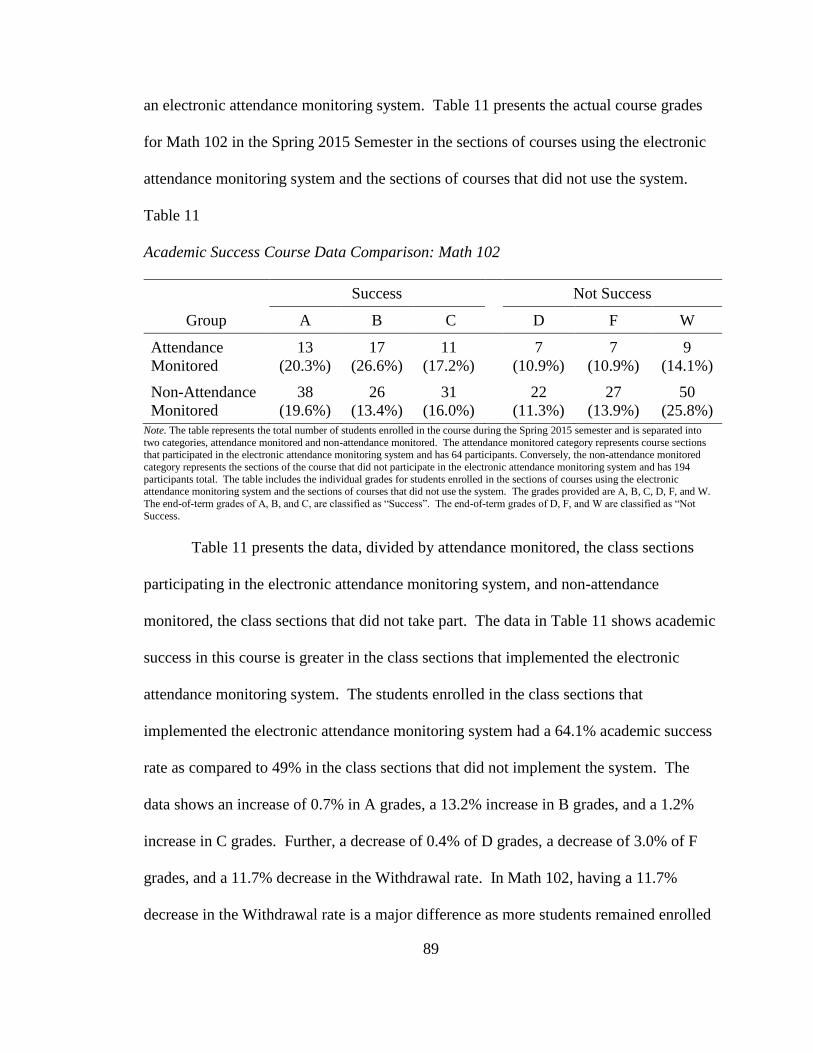
89
an electronic attendance monitoring system. Table 11 presents the actual course grades
for Math 102 in the Spring 2015 Semester in the sections of courses using the electronic
attendance monitoring system and the sections of courses that did not use the system.
Table 11
Academic Success Course Data Comparison: Math 102
Group
Success Not Success
A B C D F W
Attendance
Monitored
13
(20.3%)
17
(26.6%)
11
(17.2%)
7
(10.9%)
7
(10.9%)
9
(14.1%)
Non-Attendance
Monitored
38
(19.6%)
26
(13.4%)
31
(16.0%)
22
(11.3%)
27
(13.9%)
50
(25.8%)
Note. The table represents the total number of students enrolled in the course during the Spring 2015 semester and is separated into
two categories, attendance monitored and non-attendance monitored. The attendance monitored category represents course sections that participated in the electronic attendance monitoring system and has 64 participants. Conversely, the non-attendance monitored
category represents the sections of the course that did not participate in the electronic attendance monitoring system and has 194
participants total. The table includes the individual grades for students enrolled in the sections of courses using the electronic attendance monitoring system and the sections of courses that did not use the system. The grades provided are A, B, C, D, F, and W.
The end-of-term grades of A, B, and C, are classified as “Success”. The end-of-term grades of D, F, and W are classified as “Not
Success.
Table 11 presents the data, divided by attendance monitored, the class sections
participating in the electronic attendance monitoring system, and non-attendance
monitored, the class sections that did not take part. The data in Table 11 shows academic
success in this course is greater in the class sections that implemented the electronic
attendance monitoring system. The students enrolled in the class sections that
implemented the electronic attendance monitoring system had a 64.1% academic success
rate as compared to 49% in the class sections that did not implement the system. The
data shows an increase of 0.7% in A grades, a 13.2% increase in B grades, and a 1.2%
increase in C grades. Further, a decrease of 0.4% of D grades, a decrease of 3.0% of F
grades, and a 11.7% decrease in the Withdrawal rate. In Math 102, having a 11.7%
decrease in the Withdrawal rate is a major difference as more students remained enrolled

90
in the course until the end of the academic term. Appendix E through M presents
additional tables that further report the outcomes of academic success comparing to the
historical averages for the courses.
Research Objective 2 – Difference in academic success rates when using an electronic
attendance monitoring system
Research Objective 2 determines if a difference in academic success rates exists
in courses using an electronic attendance monitoring system. To analyze the data, the
researcher used a logistic regression analysis to determine the significance between the
summary data for the courses involved (Field, 2009; Gellman & Hill, 2007; Shadish et
al., 2002; Wong & Mason, 1985).
Research Objective 2 tests for significance of students during the Spring 2015
Semester in the sections of courses using the electronic attendance monitoring system and
the sections of courses that did not use the system, to determine whether electronic
attendance monitoring affects academic success rates. Tables 12, 13, and 14 present the
results of the statistical testing. In this testing, the independent variable is the rate of
undergraduate student attendance for the sample and the dependent variable is the end-of-
semester grade, which measures academic success. Using the IBM SPSS program, the
researcher categorized the different course sections to provide statistical evidence of the
impact of the electronic attendance monitoring system on each individual course.

91
Table 12
Attendance Monitoring Versus Non-Attendance Monitoring: History 101
Class Comparison B Wald SE df eB Sig.
Monitored vs. Non-Monitored .814 19.485 .184 1 2.256 .000
Constant -.552 15.497 .140 1 .576 .000
Note. Course refers to the specific course taking part in the electronic attendance monitoring system. The logistic coefficient (β) helps
determine the direction of the relationship (positive or negative) based upon the numeric value (positive or negative). The Wald chi square statistic assesses the significance to coefficients, measuring the ratio of the square of the regression coefficient to the square of
the standard error of the coefficient. S.E. stands for Standard Error and is calculated by taking the standard deviation divided by the
square root of the sample size; the Standard Error measures the accuracy of comparing a statistic to a population. The df refers to the Degrees of Freedom and stands for the number of values in the final calculation of the statistic that are free to vary without violating
any constraints. The eB symbol represents the odds ratio and is an alternative value given to interpret the coefficient. Sig represents
the significance or p value using a 95% confidence interval where results less than .05 are found to be considered significant.
Table 12 shows the results of a logistic regression using IBM’s SPSS program to
determine if the History 101 end-of-term academic success rates between the sections of
courses that used the electronic attendance monitoring system versus sections of courses
that did not was statistically significant. The results express the impact of implementing
the electronic attendance monitoring system in this course. In the SPSS output, the
Model chi-square statistic within the Omnibus Tests of Model Coefficients table. The
results of the test, using a 95% confidence rate, was determined to be significant with the
results of Χ2 (1) = 19.485, p < .001. The Cox and Snell R2 = .039 and the Nagelkerke R2
= .052. The results indicate that the electronic attendance monitoring system made a
statistically significant difference in the end-of-term academic success rates. The
outcome was that students enrolled in the attendance monitored courses were 2.256 times
more likely to receive an A, B, or C end-of-term grade than students who were in the
non-attendance monitored classes. This statement applies to the students who were
enrolled in these classes during the Spring 2015 Semester. In conclusion, the testing was
significant, indicating that students enrolled in the attendance monitoring classes were
more successful academically.

92
Table 13
Attendance Monitoring Versus Non-Attendance Monitoring: History 102
Class Comparison B Wald SE df eB Sig.
Monitored vs. Non-Monitored .958 38.324 .155 1 2.605 .000
Constant -.089 1.066 .086 1 .915 .302
Note. Course refers to the specific course taking part in the electronic attendance monitoring system. The logistic coefficient (β) helps
determine the direction of the relationship (positive or negative) based upon the numeric value (positive or negative). The Wald chi square statistic assesses the significance to coefficients, measuring the ratio of the square of the regression coefficient to the square of
the standard error of the coefficient. S.E. stands for Standard Error and is calculated by taking the standard deviation divided by the
square root of the sample size; the Standard Error measures the accuracy of comparing a statistic to a population. The df refers to the Degrees of Freedom and stands for the number of values in the final calculation of the statistic that are free to vary without violating
any constraints. The eB symbol represents the odds ratio and is an alternative value given to interpret the coefficient. Sig represents
the significance or p value using a 95% confidence interval where results less than .05 are found to be considered significant.
A Logistic Regression was conducted on the History 102 course to assess if the
end-of-term academic success rates between the course sections that used the electronic
attendance monitoring system versus courses that did not was significant. The SPSS
output reports the Model chi-square statistic within the Omnibus Tests of Model
Coefficients table. The test used a 95% confidence rate and the results determined a
significant difference where Χ2 (1) = 38.324, p < .001. The Cox and Snell R2 = .047 and
the Nagelkerke R2 = .063. The results indicate that the electronic attendance monitoring
system made a statistically significant difference in the end-of-term academic success
rates. The outcome was that students enrolled in the attendance monitored courses were
2.605 times more likely to be academically successful than students who were in the
courses that did not implement the electronic attendance monitoring system. This
statement applies to the students enrolled in these classes during the Spring 2015
Semester. In conclusion, the testing was significant, indicating the impact of an
electronic attendance monitoring system and that students enrolled in the attendance
monitoring classes were more successful academically.

93
Table 14
Attendance Monitoring Versus Non-Attendance Monitoring: Math 102
Class Comparison B Wald SE df eB Sig.
Monitored vs. Non-Monitored .619 4.334 .297 1 1.858 .037
Constant -.041 .82 .144 1 .960 .774
Note. Course refers to the specific course taking part in the electronic attendance monitoring system. The logistic coefficient (β) helps
determine the direction of the relationship (positive or negative) based upon the numeric value (positive or negative). The Wald chi square statistic assesses the significance to coefficients, measuring the ratio of the square of the regression coefficient to the square of
the standard error of the coefficient. S.E. stands for Standard Error and is calculated by taking the standard deviation divided by the
square root of the sample size; the Standard Error measures the accuracy of comparing a statistic to a population. The df refers to the Degrees of Freedom and stands for the number of values in the final calculation of the statistic that are free to vary without violating
any constraints. The eB symbol represents the odds ratio and is an alternative value given to interpret the coefficient. Sig represents
the significance or p value using a 95% confidence interval where results less than .05 are found to be considered significant.
Similar to the other courses, a Logistic Regression analysis assessed if the end-of-
term academic success rates for Math 102 were significantly different between the
sections of courses using the electronic attendance monitoring system and the sections of
courses that did not use the system. The Omnibus Tests of Model Coefficients used a
95% confidence rate and the results determined a significant difference between the
classes where Χ2 (1) = 4.334, p < .001. The Cox and Snell R2 = .017 and the Nagelkerke
R2 = .023. The results indicate that the electronic attendance monitoring system made a
significant difference in the end-of-term academic success rates. The outcome was that
students enrolled in the attendance monitored courses were 1.858 times more likely to be
academically successful than students who were in the courses that did not implement the
electronic attendance monitoring system. This statement applies to the students enrolled
in these classes during the Spring 2015 Semester. In conclusion, the testing was
significant, indicating the impact of an electronic attendance monitoring system and that
students enrolled in the attendance monitoring classes were more successful
academically.
94
Research Objective 3 – Relationship between attendance rates and academic success
Research Objective 3 tested the relationship between undergraduate student
attendance rates and academic success in courses using an electronic attendance
monitoring system. The statistical testing used for this research objective is a point-
biserial test. The point-biserial test measures item reliability (Field, 2009). Point-biserial
tests assess the correlation of a dichotomous variable and a continuous variable (Field,
2009). For this test, the dichotomous variable is academic success, end-of-term grades of
an A, B, or C, or not successful academically, end-of-term grades of a D, F, or W. The
percentage of class that a student attended represents the continuous variable. In terms of
the importance for this research objective, the point-biserial test allows the researcher to
test whether the percentage classes that an undergraduate attended effects academic
success.
In Table 15, reports the results of the point-biserial statistical test. The results
present the information from running the point-biserial statistical test to determine the
relationship between undergraduate student attendance rates and academic success. The
information gathered from Research Objective 3 provides insight into the relationship
between undergraduate student attendance rates and academic success when using an
electronic attendance monitoring system.

95
Table 15
Correlation Between Attendance Rates and Academic Success
Course
Pearson
Correlation Sig. (2-tailed) N
All Courses Combined .560 <.001 1593
History 101 World Civilization I .560 <.001 285
History 102 World Civilization II .549 <.001 291
Math 102 Brief Applied Calculus .540 .001 64
Table 15 presents the correlation between attendance rates and academic success.
The point-biserial test was formatted to combine all of the classes together into one data
set and allowed the courses to be split by the individual courses. Pearson coefficients can
result in either positive or negative relationships between the two variables. The Pearson
coefficient numbers can range from -1 to 1; where -1 represents a perfect negative
relationship and 1 represents a perfect positive relationship (Field, 2009; Statistic
Solutions, 2013). The Pearson coefficient number is squared to get the percentage of
variability in academic success that is accounted for by attendance in the classroom
(Field, 2009; Statistic Solutions, 2013). Stated another way, the stronger the correlation,
the more variability is explained. The correlations in Table 15 assess the correlations for
all courses, History 101, History 102, and Math 102. Each of the cases has a correlation
number above .540 which according to Statistic Solutions (2013), represents a strong
association between attendance and academic success.
The result of the test for the full sample indicated r (1593) = .560 p < .001 and the
r value of .560 indicates a strong correlation between attendance and academic success.
Further, by squaring the Pearson Correlation, we find that 31.4% of the variability in
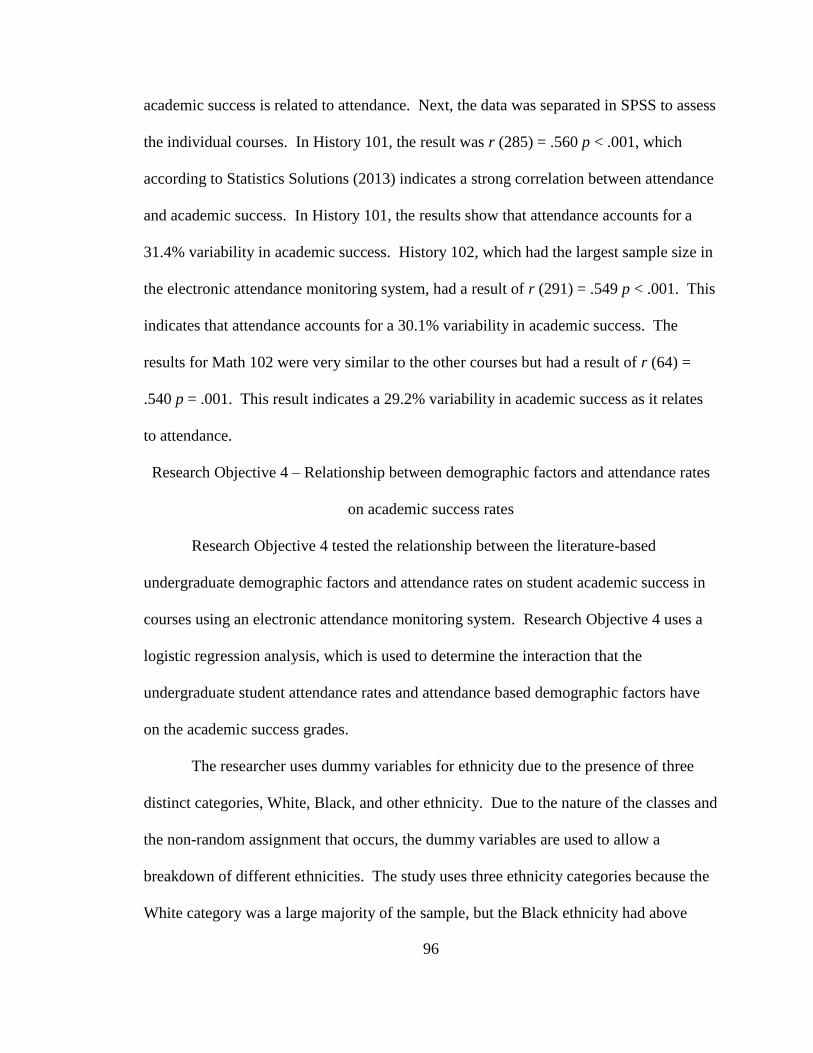
96
academic success is related to attendance. Next, the data was separated in SPSS to assess
the individual courses. In History 101, the result was r (285) = .560 p < .001, which
according to Statistics Solutions (2013) indicates a strong correlation between attendance
and academic success. In History 101, the results show that attendance accounts for a
31.4% variability in academic success. History 102, which had the largest sample size in
the electronic attendance monitoring system, had a result of r (291) = .549 p < .001. This
indicates that attendance accounts for a 30.1% variability in academic success. The
results for Math 102 were very similar to the other courses but had a result of r (64) =
.540 p = .001. This result indicates a 29.2% variability in academic success as it relates
to attendance.
Research Objective 4 – Relationship between demographic factors and attendance rates
on academic success rates
Research Objective 4 tested the relationship between the literature-based
undergraduate demographic factors and attendance rates on student academic success in
courses using an electronic attendance monitoring system. Research Objective 4 uses a
logistic regression analysis, which is used to determine the interaction that the
undergraduate student attendance rates and attendance based demographic factors have
on the academic success grades.
The researcher uses dummy variables for ethnicity due to the presence of three
distinct categories, White, Black, and other ethnicity. Due to the nature of the classes and
the non-random assignment that occurs, the dummy variables are used to allow a
breakdown of different ethnicities. The study uses three ethnicity categories because the
White category was a large majority of the sample, but the Black ethnicity had above
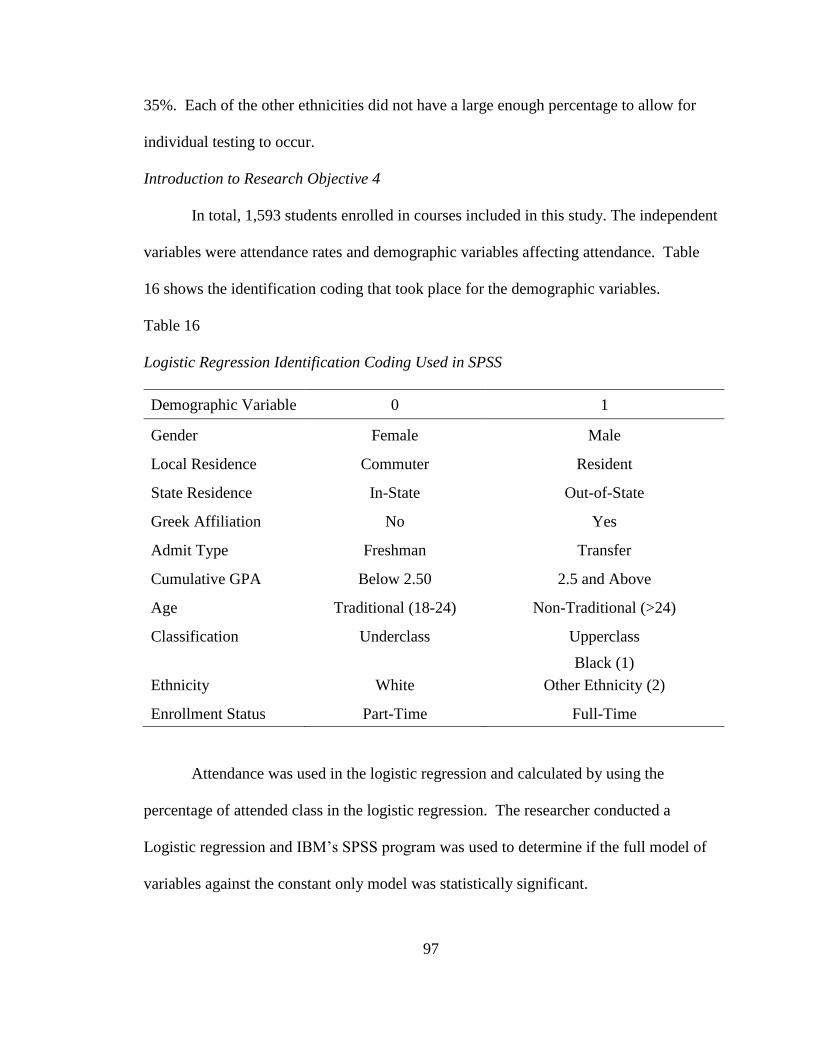
97
35%. Each of the other ethnicities did not have a large enough percentage to allow for
individual testing to occur.
Introduction to Research Objective 4
In total, 1,593 students enrolled in courses included in this study. The independent
variables were attendance rates and demographic variables affecting attendance. Table
16 shows the identification coding that took place for the demographic variables.
Table 16
Logistic Regression Identification Coding Used in SPSS
Demographic Variable 0 1
Gender Female Male
Local Residence Commuter Resident
State Residence In-State Out-of-State
Greek Affiliation No Yes
Admit Type Freshman Transfer
Cumulative GPA Below 2.50 2.5 and Above
Age Traditional (18-24) Non-Traditional (>24)
Classification Underclass Upperclass
Ethnicity White
Black (1)
Other Ethnicity (2)
Enrollment Status Part-Time Full-Time
Attendance was used in the logistic regression and calculated by using the
percentage of attended class in the logistic regression. The researcher conducted a
Logistic regression and IBM’s SPSS program was used to determine if the full model of
variables against the constant only model was statistically significant.

98
All Courses Combined
Table 17 presents data illustrating the interactions of the undergraduate student
attendance figures, demographics, and academic success rates. Table 17 presents the,
data using a Wald test to determine if the independent variables are significant (Field,
2009; Goodwin, 2009; Trochim, 2006). The variable(s) found not significant are deleted
from the predictive equation, as they do not influence the results (Field, 2009; Goodwin,
2009; Trochim, 2006). Table 17 also highlights the logistic regression coefficient and
odds ratio for each of the attendance based demographic variables. The researcher used a
p < .05 criterion for the significance value.

99
Table 17
Demographic and Attendance Relationship on Academic Success – All Courses
Combined
Demographic Variable B Wald SE df eB Sig.
Gender -.366 2.174 .227 1 .694 .136
Local Residence .424 6.995 .264 1 1.528 .141
State Residence .104 .513 .280 1 1.110 .731
Greek Affiliation .923 7.135 .308 1 2.518 .005
Admit Type -.601 6.112 .351 1 .548 .123
Cumulative GPA 1.643 43.891 .248 1 5.171 .000
Age 1.594 9.324 .714 1 4.924 .026
Classification .855 4.844 .388 1 2.350 .028
Ethnicity 9.324 2 .009
White (0)
Black (1) -907 9.222 .299 1 .404 .002
Other Ethnicity (2) -.451 .960 .461 1 .637 .327
Enrollment Status .472 .311 .846 1 1.603 .577
Attendance .078 78.187 .009 1 1.081 .000
Constant -7.726 43.527 1.171 1 .000 .000
Note. The logistic coefficient (β) helps determine the direction of the relationship (positive or negative) based upon the numeric value
(positive or negative). The Wald chi square statistic assesses the significance to coefficients, measuring the ratio of the square of the regression coefficient to the square of the standard error of the coefficient. S.E. stands for Standard Error and is calculated by taking
the standard deviation divided by the square root of the sample size; the Standard Error measures the accuracy of comparing a statistic
to a population. The df refers to the Degrees of Freedom and stands for the number of values in the final calculation of the statistic that are free to vary without violating any constraints. The eB symbol represents the odds ratio and is an alternative value given to
interpret the coefficient. Sig represents the significance or p value using a 95% confidence interval where results less than .05 are
found to be considered significant.
The SPSS output included the Model chi-square statistic within the Omnibus
Tests of Model Coefficients table. The Omnibus test and Model chi-square statistic
determines if the model is a significant fit (Field, 2009; Shadish et al., 2002; Statistic
Solutions, 2013). To be considered a significant fit, the model must have a p value of

100
less than .05 and the results show significance where Χ2 (11) = 312.172, p = .002. The
SPSS generated classification table provides the overall percentage of correctly predicted
cases (Field, 2009). The percentage for the null model was 63.6% which increased to
82.7% when using the full model data. The Hosmer and Lemeshow goodness-of-fit test
indicates that the model is a good fit for the data, Χ2 (11) = 8.701, p = .368 (Field, 2009;
Shadish et al., 2002; Statistic Solutions, 2013).
Table 17 presents the results of the logistic regression. In the results, the study
shows that of the demographic variables included in the analysis, Greek affiliation,
Cumulative GPA, Age, Classification, Ethnicity – White, Ethnicity – Black, and
Attendance are all significant with a p value less than .05. Because of finding
significance in these variables, their odds ratio number is able to be used. For Greek
affiliation, the students who were involved in Greek Life in this sample were found to be
2.518 times more successful than non-Greek Life students. Students with a Cumulative
GPA of 2.5 and Above were 5.171 times more likely to be academically successful than
students who had Below a 2.5 Cumulative GPA. Students who were of the Non-
Traditional Age, Above 24 years old, were found to be 4.924 times more successful than
Traditional Age students, 18-24 years old. In the Classification demographic, Upperclass
students were 2.350 times more likely to be successful as compared to Underclass
students. Ethnicity used dummy variables because the category had three different
subsets to analyze. Because of this, the White category, which had the largest percentage
of students, was used as the comparison group for ethnicity. The data used the White
category as the comparison and significance was found in the Ethnicity-Black category.
Because this result is inversely related to the White category, the results found that Black

101
students are 0.404 times less likely to be successful than White students. Attendance was
found to be significant but used a continuous variable for assessment in the logistic
regression. As such, for each 1% increase in attendance, the odds of a person being
academically successful is 1.081 times more likely.
Gender, Local Residence, State Residence, Admit Type, and Enrollment Status
were not found to have significance in the logistic regression. By not finding
significance for these demographic variables, it means that the variable does not
contribute to the outcome of academic success among the participants. These factors
have been found in previous research to be important to academic success and
attendance. But this previous research only analyzed one variable at a time as opposed to
the current study which combined multiple demographic variables. The variables are not
able to be removed from the equation as it will affect the significance of the other
variables.
This section of Research Objective 4 details the results from the logistic
regression analysis. The data provided shows no indications of any influential cases or
outliers in the data. No evidence exists to suggest that the testing violated the
assumptions of a logistic regression test. In conclusion, the testing was statistically
significant.
History 101 Analysis
Next, Table, 18 shows the results of the logistic regression when the data is split
for only the History 101 (World Civilization I) course. Also included in Table 18 are the
logistic regression coefficient, Wald test, and odds ratio for each of the attendance based
demographic variables. The researcher used a .05 criterion for the significance value.

102
Table 18
Demographic and Attendance Relationship on Academic Success – History 101
Demographic Variable B Wald SE df eB Sig.
Gender -.636 3.008 .367 1 .529 .083
Local Residence .189 .200 .422 1 1.208 .655
State Residence .202 .216 .435 1 1.224 .642
Greek Affiliation 1.299 6.889 .495 1 3.665 .009
Admit Type -.418 .461 .616 1 .658 .497
Cumulative GPA 1.263 12.092 .363 1 3.535 .001
Age 1.608 2.415 1.035 1 4.994 .120
Classification .878 2.040 .615 1 2.407 .153
Ethnicity 1.099 2 .577
White (0)
Black (1) -.455 1.095 .425 1 .641 .295
Other Ethnicity (2) -.420 .091 .644 1 .818 .763
Enrollment Status -.855 .364 1.417 1 .425 .546
Attendance .077 38.645 .012 1 1.080 .000
Constant -5.990 11.917 1.735 1 .003 .001
Note. The logistic coefficient (β) helps determine the direction of the relationship (positive or negative) based upon the numeric value
(positive or negative). The Wald chi square statistic assesses the significance to coefficients, measuring the ratio of the square of the regression coefficient to the square of the standard error of the coefficient. S.E. stands for Standard Error and is calculated by taking
the standard deviation divided by the square root of the sample size; the Standard Error measures the accuracy of comparing a statistic
to a population. The df refers to the Degrees of Freedom and stands for the number of values in the final calculation of the statistic that are free to vary without violating any constraints. The eB symbol represents the odds ratio and is an alternative value given to
interpret the coefficient. Sig represents the significance or p value using a 95% confidence interval where results less than .05 are
found to be considered significant.
The Omnibus Tests of Model Coefficients table and Model chi-square statistic
determines a significant fit as long as model has a p value of less than .05 (Field, 2009;
Shadish et al., 2002; Statistic Solutions, 2013). The results show significance where Χ2
(11) = 138.200, p = .001 (Field, 2009). The SPSS generated classification table provides
the overall percentage of correctly predicted cases (Field, 2009). The percentage for the

103
null model was 56.5% which increased to 81.4% when using the full model data. The
Hosmer and Lemeshow goodness-of-fit test indicates that the model is a good fit for the
data, Χ2 (11) = 7.336, p = .501.
Table 18 presents the results of the logistic regression. The study shows the
demographic factors of Greek affiliation, Cumulative GPA, and Attendance were
significant as their p value was less than .05. Since these variables were found to be
significant, their odds ratio numbers are able to be used. In History 101, the study shows
that Greek students are 3.665 times more likely to succeed than non-Greek students and
students with a Cumulative GPA of 2.5 and above are 3.535 times more likely to succeed.
Attendance used a continuous variable and as such, for every 1% increase in attendance,
the odds of a person succeeding in the course was 1.080 times more likely to happen.
Gender, Local Residence, State Residence, Admit Type, Age, Classification,
Ethnicity, and Enrollment Status were not found to have significance in the logistic
regression. The lack of significance means that during this time, using this data, the
variable does not contribute to the outcome of academic success. In previous research,
individually, these variables have shown academic success and attendance. The variables
are not able to be removed from the equation as it will affect the significance of the other
variables.
This section of Research Objective 4 details the results from the logistic
regression analysis. The data provided shows no indications of any influential cases or
outliers in the data. No evidence exists to suggest that the testing violated the
assumptions of a logistic regression test. In conclusion, the testing was statistically
significant.

104
History 102 Analysis
Next, Table, 19 shows the results of the logistic regression for only the History
102 (World Civilization II) course. Also included in Table 19 are the logistic regression
coefficient, Wald test, and odds ratio for each of the attendance based demographic
variables. The researcher used a .05 criterion for the significance value.
Table 19
Demographic and Attendance Relationship on Academic Success – History 102
Demographic Variable B Wald SE df eB Sig.
Gender -.034 .007 .410 1 .967 .934
Local Residence .500 1.165 .463 1 1.649 .280
State Residence -.007 .000 .486 1 .993 .988
Greek Affiliation .484 .749 .559 1 1.623 .387
Admit Type -.297 .192 .679 1 .743 .661
Cumulative GPA 1.946 22.434 .411 1 6.998 .000
Age .024 .000 1.461 1 1.024 .987
Classification 2.081 8.217 .726 1 8.009 .004
Ethnicity 12.751 2 .002
White (0)
Black (1) -1.856 12.377 .528 1 .156 .000
Other Ethnicity (2) -1.140 2.248 .760 1 .320 .134
Enrollment Status .1.194 .436 1.808 1 3.2993 .509
Attendance .087 27.876 .016 1 1.091 .000
Constant -9.408 16.510 2.315 1 .000 .000
Note. The logistic coefficient (β) helps determine the direction of the relationship (positive or negative) based upon the numeric value
(positive or negative). The Wald chi square statistic assesses the significance to coefficients, measuring the ratio of the square of the regression coefficient to the square of the standard error of the coefficient. S.E. stands for Standard Error and is calculated by taking
the standard deviation divided by the square root of the sample size; the Standard Error measures the accuracy of comparing a statistic
to a population. The df refers to the Degrees of Freedom and stands for the number of values in the final calculation of the statistic that are free to vary without violating any constraints. The eB symbol represents the odds ratio and is an alternative value given to
interpret the coefficient. Sig represents the significance or p value using a 95% confidence interval where results less than .05 are
found to be considered significant.

105
The Omnibus Tests of Model Coefficients table and Model chi-square statistic
determines a significant fit as long as model has a p value of less than .05 (Field, 2009;
Shadish et al., 2002; Statistic Solutions, 2013). The results show significance where Χ2
(11) = 146.756, p = .001 (Field, 2009). The SPSS generated classification table provides
the overall percentage of correctly predicted cases (Field, 2009). The percentage for the
null model was 56.5% which increased to 81.4% when using the full model data. The
Hosmer and Lemeshow goodness-of-fit test indicates that the model is a good fit for the
data, Χ2 (11) = 4.004, p = .857.
Table 19 presents the results of the logistic regression. The analysis shows which
demographic factors have significance, which are Cumulative GPA, Classification,
Ethnicity, and Attendance as their p value is less than .05. Because these variables are
significant, their odds ratio numbers are able to be used. The results indicate that
students with a Cumulative GPA of 2.5 and Above are 6.998 times more likely to be
academically successful than students with Below 2.5 GPA. Upperclass students are
8.009 times more likely to succeed in History 102 as compared to Underclass students.
Because Ethnicity has three subset categories, dummy variables had to be used to analyze
the data. The comparison category was White students and the analysis found
significance in both the comparison and Black subsets. Black students were found to be
.156 times less likely to be successful academically than the comparison group. The
reason for this is because the significance is inversely related to the comparison group.
Attendance used a continuous variable in the analysis and as such for each 1% increase in
attendance rates, a student was 1.091 times more likely to succeed academically.

106
Gender, Local Residence, State Residence, Greek Affiliation, Admit Type, Age,
and Enrollment Status were not found to have significance in the logistic regression.
These variables do not contribute to the outcome of the logistic regression analysis
because they lack significance. The variables are not able to be removed from the
equation as it will affect the significance of the other variables.
This section of Research Objective 4 details the results from the logistic
regression analysis. The data provided shows no indications of any influential cases or
outliers in the data. No evidence exists to suggest that the testing violated the
assumptions of a logistic regression test. In conclusion, the testing was statistically
significant.
Math 102 Analysis
Next, Table, 20 shows the results of the logistic regression for only the Math 102
(Brief Applied Calculus) course. Also included in Table 20 are the logistic regression
coefficient, Wald test, and odds ratio for each of the attendance based demographic
variables. The researcher used a .05 criterion for the significance value.

107
Table 20
Demographic and Attendance Relationship on Academic Success – Math 102
Demographic Variable B Wald SE df eB Sig.
Gender -2.514 2.257 1.713 1 .076 .133
Local Residence 1.955 1.298 1.716 1 7.063 .255
State Residence 1.933 1.119 1.827 1 6.098 .290
Greek Affiliation 1.702 1.163 1.578 1 5.484 .281
Admit Type -2.830 1.837 2.088 1 .059 .175
Cumulative GPA 6.150 5.597 2.600 1 468.920 .018
Age 4.637 3.082 2.641 1 103.224 .079
Classification 2.882 1.471 2.376 1 17.856 .225
Ethnicity .292 2 .864
White (0)
Black (1) -.224 .0152 1.826 1 1.199 .902
Other Ethnicity (2) 2.632 .282 4.959 1 113.905 .596
Enrollment Status .058 .001 2.128 1 1.060 .978
Attendance .174 3.882 .088 1 11.189 .049
Constant -18.260 4.107 9.010 1 .000 .043
Note. The logistic coefficient (β) helps determine the direction of the relationship (positive or negative) based upon the numeric value
(positive or negative). The Wald chi square statistic assesses the significance to coefficients, measuring the ratio of the square of the regression coefficient to the square of the standard error of the coefficient. S.E. stands for Standard Error and is calculated by taking
the standard deviation divided by the square root of the sample size; the Standard Error measures the accuracy of comparing a statistic
to a population. The df refers to the Degrees of Freedom and stands for the number of values in the final calculation of the statistic that are free to vary without violating any constraints. The eB symbol represents the odds ratio and is an alternative value given to
interpret the coefficient. Sig represents the significance or p value using a 95% confidence interval where results less than .05 are
found to be considered significant.
The Omnibus Tests of Model Coefficients table and Model chi-square statistic
determines a significant fit as long as model has a p value of less than .05 (Field, 2009;
Shadish et al., 2002; Statistic Solutions, 2013). The results show significance where Χ2
(11) = 44.644, p = .001). The SPSS classification table provides the overall percentage of
correctly predicted cases (Field, 2009; Statistic Solutions, 2013). The percentage for the

108
null model was 64.1% which increased to 85.9% when using the full model data. The
Hosmer and Lemeshow goodness-of-fit test indicates that the model is a good fit for the
data, Χ2 (11) = 2.510, p = .961. Included in Table 20 are figures that show the
importance of the demographic variables.
Table 20 presents the results of the logistic regression. The analysis shows only
two areas of the logistic regression analysis have significance, Cumulative GPA and
Attendance. The logistic regression output shows that students with a Cumulative GPA
of 2.5 and Above are 468.920 times more likely to be academically successful than
students with Below 2.5 GPA. Attendance used a continuous variable in the analysis and
as such for each 1% increase in attendance rates, a student was 11.189 times more likely
to succeed academically.
Gender, Local Residence, State Residence, Greek Affiliation, Admit Type, Age,
Classification, Ethnicity, and Enrollment Status were not found to have significance in
the logistic regression. With the data for this sample, these variables are not shown to
contribute to the overall logistic regression analysis. Removing these variables would
adjust the outcome of the analysis and must not occur.
Research Objective 4 details the results from the logistic regression analysis. The
data provided shows no indications of any influential cases or outliers in the data. No
evidence exists to suggest the testing violated the assumptions of a logistic regression
test. The results showed that the testing was statistically significant.
Chapter Summary
The analysis indicates that when using the electronic attendance monitoring
system, a positive relationship between attendance and academic success exists.

109
Furthermore, the findings present information on specific demographic variables
affecting attendance that shows significance in the courses participating in the electronic
attendance monitoring system. For each of the courses participating in the electronic
attendance monitoring system, attendance was found to impact academic success rates in
a statistically significant fashion. In Chapter V, the researcher presents the final
summary, conclusions, and recommendations of this study. Chapter V also includes the
limitations of the study and recommendations for further research.
110
CHAPTER V – CONCLUSIONS
Generally, poor college student attendance is due to a lack of accountability,
which enables a low rate of attendance, while also limiting interactions between faculty
and students (Jones, Crandall, Vogler, & Robinson, 2013). Nationally, and in the state of
Mississippi, a skill gap is present in the workforce and one factor affecting this gap is the
low level of undergraduate degree completion (Altonji et al., 2012; Kaplan, 2017;
National Center for Education Statistics, 2017; Swanson & Holton, 2009; White House,
Office of the Press Secretary,2009). Automated accountability tools, like the electronic
attendance monitoring system, can assist in increasing interaction between faculty and
students, greater academic success, and increased graduation rates (Borland & Howsen,
1998). During this time, undergraduate students develop workplace skills that contribute
to the human capital needs of society (Blackwell, Bowes, Harvey, Hesketh, & Knight,
2001; Noel et al., 1985; Pascarella & Terenzini, 1991; Robertson et al., 2017).
The purpose of the present study is to determine the influence of an electronic
attendance monitoring system on undergraduate student success. Specifically, the study
assesses if an electronic attendance monitoring system affects student academic success.
The findings and conclusions drawn from the research are discussed throughout Chapter
V, followed by recommendations and suggestions for policy, practice, and future
research.
Findings, Conclusions, and Recommendations
The findings, conclusions, and recommendations outlined in the following
sections relate to the analysis from the analysis in Chapter 4 and the problem of the
present research. All research objectives were examined through the study and as a result

111
of the analysis, certain outcomes were expected and in line with previous literature.
However, the analysis revealed results contradicting the literature providing additional
insight into the role of the electronic attendance monitoring system on academic success.
The findings, conclusions, and recommendations result from the data analysis.
Finding 1: Academic success rates increased with attendance monitoring
The results of this study show that students enrolled in the sections of courses
using the electronic attendance monitoring system were more successful academically
than the sections of courses that did not use the system. In each of the three courses,
History 101, History 102, and Math 102, a significant difference exists when comparing
the sections of courses that used the electronic attendance monitoring system to the
sections of courses that did not use the electronic attendance monitoring system. The
results indicate that implementing an electronic attendance monitoring system can
increase academic success for undergraduate students. These results may not always be
the outcome, but for this study, they were.
Conclusions
The findings of this study align with and support previous research that promotes
undergraduate student attendance accountability as a way to increase academic success
rates (Kuh et al., 2008; Moore, 2003; Noel et al., 1985). The lack of accountability
through attendance monitoring in classes can be detrimental to the learning aspirations of
students. While the lack of attendance accountability allows freedom of choice for
students to attend class, attendance monitoring systems promote attendance while
students experience learning atmospheres with multiple distractions (Gump, 2006;
Longhurst, 1999). Other universities have implemented electronic attendance monitoring

112
systems, but the results of their endeavors have not been published (Dicle & Levendis,
2013; Neman-Ford et al., 2008; Newsom, 2016; O’Connor, 2010). The present study
suggests the impact of implementing attendance accountability systems. While the
present study finds its basis in literature, the difference from the literature is the sample
participants and the difference in location. The present study replicates the underlying
notion that the presence of electronic attendance monitoring systems provides a way to
promote accountability among students.
Recommendations
Universities must implement systems aimed at promoting attendance
accountability. The following recommendations are predicated on the implementing a
system similar to the electronic attendance monitoring system used in this study. First,
universities can design outreach programs focused on students who are not attending
class. These programs may occur through a campus retention office, residence life office,
Greek Life office, or other major university departments that have large numbers of
student involvement. Next, by implementing an attendance accountability procedure
similar to the electronic attendance monitoring system, the opportunity exists for faculty
to communicate to students directly regarding their lack of attendance. Communication
originating from the faculty can lead to greater engagement between students and faculty.
Last, through the proper identification of student involvement in a student’s online
records, the opportunity exists for a faculty or staff member that the student knows, for
example through their on-campus involvement in co-curricular activities, to communicate
with them. Through all of these outreach options, the opportunity exists to communicate
the need for a behavior change to occur. Regardless of the method, higher education

113
institutions, already suffering from low retention and graduation rates, should provide
accountability structures that promote attendance which boosts undergraduate student
academic success.
Finding 2: Academic success increases as attendance increases
The results of the study indicate a positive relationship exists between attendance
and academic success. While other factors may impact academic success, this study
focused on the ability of attendance accountability to affect all students enrolled in the
sections of courses using the electronic attendance monitoring system while comparing
the outcomes to the sections of courses that did not use the system.
Conclusions
Previous research supports the importance of class attendance for academic
success. Students who do not attend class regularly may become disengaged with the
topic and lose the connection to the faculty member and the topic material (Blackwell et
al., 2001; Noel et al., 1985; Pascarella & Terenzini, 1991; Robertson et al., 2017).
Multiple reasons exist for students missing classes, but the most frequently stated reasons
include sickness, peer pressure, parental influence, work commitments, conflicts with
extracurricular activities, and the difficulty of their academic major (Longhurst, 1999).
The results for this finding shows a link between attendance and academic success in the
sample used during the present study.
Recommendations
The results of this study demonstrate the impact of electronic attendance
monitoring systems to address the lack of attendance accountablity in the classroom.
Strategies to assist students who do not attend class regularly be implemented. These
114
strategies can include the adoption of a university-wide attendance policy,
implementation of an electronic attendance monitoring system in courses with low
academic success rates, and marketing focused on the importance of classroom
attendance on academic success rates. Implementing attendance accountability programs
to promote academic success, especially in historically difficult courses, needs to occur at
universities. Additionally, the collection of data by the Office of Institutional Research
included the presence of an individual at the entrance to the classroom. Universities
should make all attempts to incorporate a person-to-person contact when collecting the
data when implementing the research study.
Finding 3: Courses are unique; Demographics correlate with academic success
differently in combined or individual data sets, while attendance remains important
throughout
In the request for data, The Office of Institutional Research identified the enrolled
course for each student. The data request included the demographic information of the
students. The data was analyzed in two distinct combinations; first analyzing all of the
data combining all courses in one data set and second analyzing each course using
separate data sets. The results of this research show the importance of certain
demographic factors to academic success. In the all courses combined data set, the
demographic factors of ethnicity, classification, age, cumulative GPA, and Greek
affiliation positively affected academic success of students using electronic attendance
monitoring systems. In History 101, the demographic factors of cumulative GPA, and
Greek affiliation have a positive effect on the academic success of students using
electronic attendance monitoring systems. In History 102, a positive effect exists among

115
the demographic factors of ethnicity, classification, and cumulative GPA on the academic
success of students using electronic attendance monitoring systems. In Math 102, a
positive effect is found between academic success and the demographic factor of
cumulative GPA of students using electronic attendance monitoring systems. By
combining the data all together and also separating the data by course, the analysis
reveals information regarding the importance of different factors on undergraduate
student success depending on the those included in the sample analysis. A significant
relationship between attendance and academic success remains present throughout the
analysis of the data, both combined and individually.
Conclusions
Previous research has shown that each of the demographic factors chosen for
analysis made a difference in attendance rates and academic success rates (Altermatt,
2007; Arredondo & Knight, 2005; Behar, 2010; Borland & Howsen, 1998; Caldas, 1993;
Chickering, 1974; Chimka et al., 2007; Lamdin, 1996; Lowis & Castley, 2008; Newman-
Ford et al., 2008; Romer, 1993; Stewart et al., 1985; Stewart & Rue, 1983; Yu et al.,
2010). However, the results of the present study, depending on if the combined data set
is used or if the data is separated by course, differs with the literature for some of the
demographic factors. Individually each class is unique and obtained different results for
each of the demographic factors. To explain the differences between previous literature
and the present results, differences exist in the population and sample, the types of
courses observed, the university where the study took place, and class size variations.
The most effective strategies that promote attendance accountability and academic
success involve implementing multiple strategies that recognize each course, class

116
section, and the uniqueness of students enrolled; what works for one course or class
section may not be successful in another course or class section.
The data analysis included the ability to determine factors from a combined data
set and from individual course specific data sets. The analysis allowed the researcher to
determine factors that remain constant and significant throughout the data sets for this
sample. Of the students utilizing the electronic attendance monitoring system, the
demographic factor of cumulative GPA effected academic success of students throughout
the analysis, regardless of analyzing the combined data or the course specific data. A
focus can be placed on cumulative GPA to lead students to academic success. Further, in
the sample combining all courses, the demographic factors of attendance, ethnicity,
classification, age, cumulative GPA, and Greek affiliation showed significance. The
results from the larger sample allow for a larger generalization to occur as compared to
the results from the individual courses. With the ability to include the largest amount of
students possible in the combined sample, outreach can occur to students using the data.
In the analysis of the data associated with this study, the importance of attendance
to academic success is demonstrated through the significance levels and agrees with
previous literature (Stanca, 2004; Thomas & Higbee, 2000; Vidler, 1980). Finding 2
surmises that the more a student attends class, the higher their academic grades will be at
the end of the term. In the analysis for Finding 3, attendance and the demographic factors
were analyzed concurrently, and the results show the significance of attendance to the
end of term academic success of students. The present study allows the researcher to
provide information illustrating that by using an electronic attendance monitoring system,
different courses achieve different results. Further, the present study shows the

117
uniqueness of the demographic factors of each student, but allows for the analysis of
multiple demographic factors at one time.
Recommendations
Faculty, staff, and students need to know why the electronic attendance
monitoring system is needed and to explain the results of the program. The academic
success of students is closely related to their ability to persist through to graduation.
Allowing stakeholders to use the data from the program allows individuals the
opportunity to make decisions to support their academic success.
An additional recommendation is for institutions to implement programs to assist
students who have a low cumulative GPA. Programs designed to assist students with a
low cumulative GPA support student retention and academic success (Singell & Wadell,
2010). Some examples of these programs are academic department organized tutoring
programs and academically focused skill building programs organized through the
campus retention office. Implementing this recommendation can assist students in
developing academic success skills needed to be successful in courses.
Another recommendation is for universities to look for undetected bias in the
curriculum for courses that could adversely affect different ethnic groups. Ethnicity is
shown to have significance in academic success when all the data is combined, but the
significance is different for the three categories of ethnicity in the analysis. Examining
for the presence of undetected bias serves as a tactic for universities to promote academic
success through the adaptation to the needs of students, while still promoting the
academic rigor needed to achieve a degree. Additionally, the data analysis demonstrates
that certain demographic factors contribute to a student’s academic success. The

118
information allows for the opportunity for outreach to occur to students in these
demographics. Furthermore, officials can seek to determine the underlying factors that
make students successful when they do have certain demographic factors.
A final recommendation lies with finding ways to utilize technology to assist
students that cannot attend class. Many different conflicts can occur affecting a student’s
ability to attend, but little is done to ensure that the student doesn’t miss out on the
pertinent information for the course. Universities should implement technological aids,
such as audio and video recordings, that assist students who are unable to attend class to
promote dissemination of information.
Implications for Human Capital Development
This study is important to three different audiences: the State, the institution, and
the individual. On a state level, improving attendance and graduation rates can positively
impact the state’s education level leading to increased economic prosperity among its
citizens (Adelman, 1999). Systemic change needs to occur in universities, which are
complex organizations, to witness success in improving the academic success, retention,
and graduation metrics. Research, over the past four decades, links the level of student
involvement or engagement with the more positive impact a student receives in the areas
of academic and workplace skill development (American College Testing, 2010; Bean &
Metzeler, 1985; Berger & Braxton, 1998; Gerdes & Mallinckrodt, 1994; Harrison, 2006;
Lowis & Castley, 2008; Pascarella & Terenzini, 2005; Tinto, 1993). States, including
Mississippi, have implemented laws linking higher education funding to academic
success, retention, and graduation data points (Institutions of Higher Learning Board,
State of Mississippi, 2013). On an institution level, recruitment and retention are key

119
aspects that affect a university’s student population. As student populations evolve,
institutions should implement innovative measures to promote and support student
success (Noel et al., 1985; The University of Southern Mississippi, 2014). Research
indicates identifying students at risk of dropping out, especially freshman, is the most
efficient way to boost retention and graduation rates, thus promoting academic success
(Reason, 2003). Institutions would be shortsighted to not implement interventions to
positively impact academic success (Mitchell et al., 2014; Quinton, 2016; Swanson &
Holton, 2009). From an individual standpoint, implementing attendance accountability
systems could be one way to assist students in achieving higher levels of education and
the development of workplace skills during college. The use of attendance monitoring
could increase performance in classes and graduation rates leading to more prepared
students for the workforce. In the state of Mississippi, only 29% of citizens have an
education level at or above an Associate’s degree (Education Commission of the States
2011). However, individuals who attain bachelor’s degree earn $300 more each week
than those that do not have a degree and experience a lower unemployment rate (Altonji
et al., 2012; National Center for Educational Statistics, 2005). As the education level of a
citizenry increases, so does the economic stability of the local economy. But, most
importantly, the increase in education level assists the individual in meeting the
qualifications for additional career opportunities.
Limitations
Researchers recognize limitations exist for all research. Limitations define the
parameters of a researcher’s scope of analysis (Roberts, 2010). Several limitations exist
in the present study. First, the study analyzes data from only one institution, The

120
University of Southern Mississippi, and studies only one of two campuses, the
Hattiesburg campus. The selection of the institution occurred due to its convenience and
record in the areas of retention and graduation rates. Another limitation of the study is
that the electronic attendance monitoring system was conducted for only one semester.
The research did not control for other interventions that might have occurred during the
time of the study, such as increased emphasis on study sessions or availability of
university-provided tutoring, among other possible interventions during the Spring 2015
Semester. The difference in enrolled students each semester may affect overall academic
success rates and influence the role demographics play on academic success rates.
Having a diverse student population for a course can assist in generalizing the study to
the university population and beyond. The study does not account for faculty-enforced
attendance policies. Undergraduate student attendance policies could be viewed as
having a non-effect on students’ success, as the policies have been in place for multiple
semesters prior to the electronic attendance monitoring system and may not have
influenced academic success rates.
Recommendations for Further Research
Opportunities arise for future research based upon the results, limitations, and
constraints of the research. Several suggestions for future research related to the topic of
electronic attendance monitoring systems follow:
• Implementation of a longitudinal study over multiple semesters. The study
could provide greater insight to promote academic success.
• Expand the research to a variety of other institutions. By doing this,
generalization of the research to a greater population could occur.

121
• Evaluate other literature-based demographic factors such as financial aid
status, first generation college student, academic major, academic college,
ACT/SAT score, incoming GPA, and disability accommodations.
• Assess if a difference occurs in active attendance monitoring versus passive
attendance monitoring in attendance rates and academic success rates.
• Determine ways to assess and monitor attendance in online only classes.
The areas for future research serve as recommendations for individuals interested in
implementing strategies to promote undergraduate student success. These additional
research areas could provide valuable information to universities, students, their families,
policy makers, and peer institutions.
Discussion
This quasi-experimental study using archival data allowed the researcher to gather
information about implementing an electronic attendance monitoring system. While
previous research was conducted on the topic, the study allowed for the researcher to gain
knowledge of a specific sample, at one point in time, at one university. Recent advances
in technology allow for better integration of systems to assist students in academic
success measures and add accountability in cost effective ways not addressed previously
by academic institutions.
The present study compared three courses with sections that implemented the
electronic attendance monitoring system and sections that did not. The findings showed
that a significant difference occurs in end-of-term grades and that the more a student
attends class, the better their academic success rate. Additionally, by analyzing
demographics simultaneously, information is available on the impact of certain

122
demographic factors. The results show the likelihood of academic success when
concurrently analyzing multiple demographic factors and attendance rates.
Entire university communities are engaged in finding ways to impact retention
and graduation rates. This study could help fill a gap in their knowledge and
understanding about attendance accountability. The results of this program should be
shared with faculty, staff, and students to explain why electronic attendance monitoring is
needed and explaining the results of the program.
Achieving academic success results from a combination of tactics, with each
tactic designed to assist certain members of the population. Attendance monitoring is not
the solution, but one solution. Nevertheless, the adoption of an electronic attendance
monitoring system can address attendance accountability issues in courses identified by
institutions through internal data analysis. The electronic attendance monitoring system
positively impacted the end-of-term grades of students in the sample. Increasing the end-
of-term grades of students is only one way to assist in retaining students and removing
barriers in an effort to boost graduation rates. Further, by taking steps to improve
attendance in the classroom, the development of workplace skills can occur as students
progress through college.
Summary
The purpose of this research was to determine the influence of an electronic
attendance monitoring system on undergraduate student success. Promoting student
development through interactions between faculty and students increases academic
success during the collegiate years and sets up a critical base for the future success of
individuals (Astin, 1993). This establishes a link between collegiate academic success

123
and human capital development. Four research objectives guided the research and
focused on the impact of an electronic attendance monitoring system on academic
success.
The study examined these research objectives using the data provided through
The Universityof Southern Mississippi’s Office of Institutional Research on the sections
of courses using the electronic attendance monitoring system and the sections of courses
that did not use the system. Appropriate measures to determine external factors that
could have impacted the research were identified, but which occurred naturally during the
system’s implementation. The study found a significant difference between the academic
success rates in the sections of courses using the electronic attendance monitoring system
and the sections of courses that did not use the system. Further, the study identified
demographic factors that play a part in undergraduate student academic success.
Attaining higher levels of education assists individuals with finding gainful
employment and leads to ecnomic stability (Bureau of Labor Statistics, 2015). With the
everchanging landscape of higher education, colleges and universities should implement
interventions designed to support undergraduate academic success and interaction with
faculty as they develop human capital (Institutions of Higher Learning Board, State of
Mississippi, 2013; Mitchell et al., 2014; Quinton, 2016). Implementing attendance
accountability measures, such as an electronic attendance monitoring system, represents
one stragety to positively impact academic success in college. Electornic attendance
monitoring provides a viable way to assist students and promote academic success.

124
APPENDIX A – Use of table permission

125
APPENDIX B – Institutional research pre-approval

126
APPENDIX C – Institutional review board approval letter

127
APPENDIX D – Attendance rates for all courses
Appendix D presents the electronic attendance monitoring data between the
courses as found in Figure 6 which has been adapted into this table for the purposes of
discussion.
Table A1.
Attendance Rates for All Courses Adapted from Figure 6
Attendance
Rate
History 101
World Civilization I
n (%)
History 102
World Civilization II
n (%)
Math 102
Brief Applied Calculus
n (%)
0-20% 6 (2.1%) 3 (1.2%) 4 (6.3%)
20.1-40% 20 (7.0%) 13 (4.4%) 1 (1.5%)
40.1-60% 34 (11.9%) 12 (4.1%) 4 (6.3%)
60.1-80% 47 (16.5%) 40 (13.7%) 9 (14.1%)
80.1-90% 71 (25.0%) 88 (30.2%) 11 (17.3%)
90.1-95% 49 (17.2%) 66 (22.7%) 14 (21.8%)
95.1-99.9% 39 (13.6%) 29 (10.0%) 9 (14.1%)
100% 19 (6.7%) 40 (13.7%) 12 (18.6%)

128
APPENDIX E – Academic success outcomes
The tables included in Appendix E present comparison tables presenting the
results from the Spring 2015 Semester of the classes that participated in the electronic
attendance monitoring system, classes that did not participate, and the historical average
for that class from fall 2009 through fall 2014.
Table A2.
History 101 Academic Success Outcomes
Table A3.
History 102 Academic Success Outcomes
History 102
World Civilization II Success Rate Not-Success Rate Withdrawal Rate
Participating Class Sections 70.4% 29.6% 4.5%
Non-Participating Class
Sections 47.8% 52.2% 8.3%
Historical Average 62.3% 37.7% 3.3%
History 101
World Civilization I Success Rate Not-Success Rate Withdrawal Rate
Participating Class Sections 56.5% 43.5% 11.2%
Non-Participating Class
Sections 36.5% 63.5% 16.0%
Historical Average 54.6% 45.5% 3.9%

129
Table A4.
Math 102 Academic Success Outcomes
Math 102
Brief Applied Calculus Success Rate Not-Success Rate Withdrawal Rate
Participating Class Sections 64.1% 35.9% 14.4%
Non-Participating Class
Sections 49.0% 51.0% 25.8%
Historical Average 58.8% 41.2% 4.5%

130
APPENDIX F – Electronic attendance monitoring system gender comparison results
The table in Appendix F presents a comparison of academic success rates for one
demographic factor showing the impact the electronic attendance monitoring system has
on academic success.
Table A5.
Comparison of Gender Results
Gender
Success
n (%)
Not Success
n (%)
Monitored
Female 259 (66.8%) 129 (33.2%)
Male 148 (58.7%) 104 (41.3%)
Total 407 (63.6%) 233 (36.4%)
Not Monitored
Female 292 (47.9%) 318 (52.1%)
Male 141 (41.1%) 202 (58.9%)
Total 433 (45.4%) 520 (54.6%)

131
APPENDIX G – Electronic attendance monitoring system local residence comparison
The table in Appendix G presents a comparison of academic success rates for one
demographic factor showing the impact the electronic attendance monitoring system has
on academic success.
Table A6.
Comparison of Local Residence Results
Local Residence
Success
n (%)
Not Success
n (%)
Monitored
Commuter 135 (52.5%) 122 (47.5%)
Resident 272 (71.0%) 111 (29.0%)
Total 407 (63.6%) 233 (36.4%)
Not Monitored
Commuter 258 (43.5%) 335 (56.5%)
Resident 175 (48.6%) 185 (51.4%)
Total 433 (45.4%) 520 (54.6%)

132
APPENDIX H – Electronic attendance monitoring system state residence comparison
The table in Appendix H presents a comparison of academic success rates for one
demographic factor showing the impact the electronic attendance monitoring system has
on academic success.
Table A7.
Comparison of State Residence Results
State Residence
Success
n (%)
Not Success
n (%)
Monitored
In-State 279 (59.9%) 187 (40.1%)
Out-of-State 128 (73.6%) 46 (26.4%)
Total 407 (63.6%) 233 (36.4%)
Not Monitored
In-State 341 (43.5%) 443 (56.5%)
Out-of-State 92 (54.4%) 77 (45.6%)
Total 433 (45.4%) 520 (54.6%)

133
APPENDIX I – Electronic attendance monitoring system Greek life affiliation
comparison
The table in Appendix I presents a comparison of academic success rates for one
demographic factor showing the impact the electronic attendance monitoring system has
on academic success.
Table A8.
Comparison of Greek Life Affiliation Results
Greek Affiliation
Success
n (%)
Not Success
n (%)
Monitored
No 258 (57.2%) 193 (42.8%)
Yes 149 (78.8%) 40 (21.2%)
Total 407 (63.6%) 233 (36.4%)
Not Monitored
No 328 (42.6%) 442 (57.4%)
Yes 105 (57.4%) 78 (42.6%)
Total 433 (45.4%) 520 (54.6%)
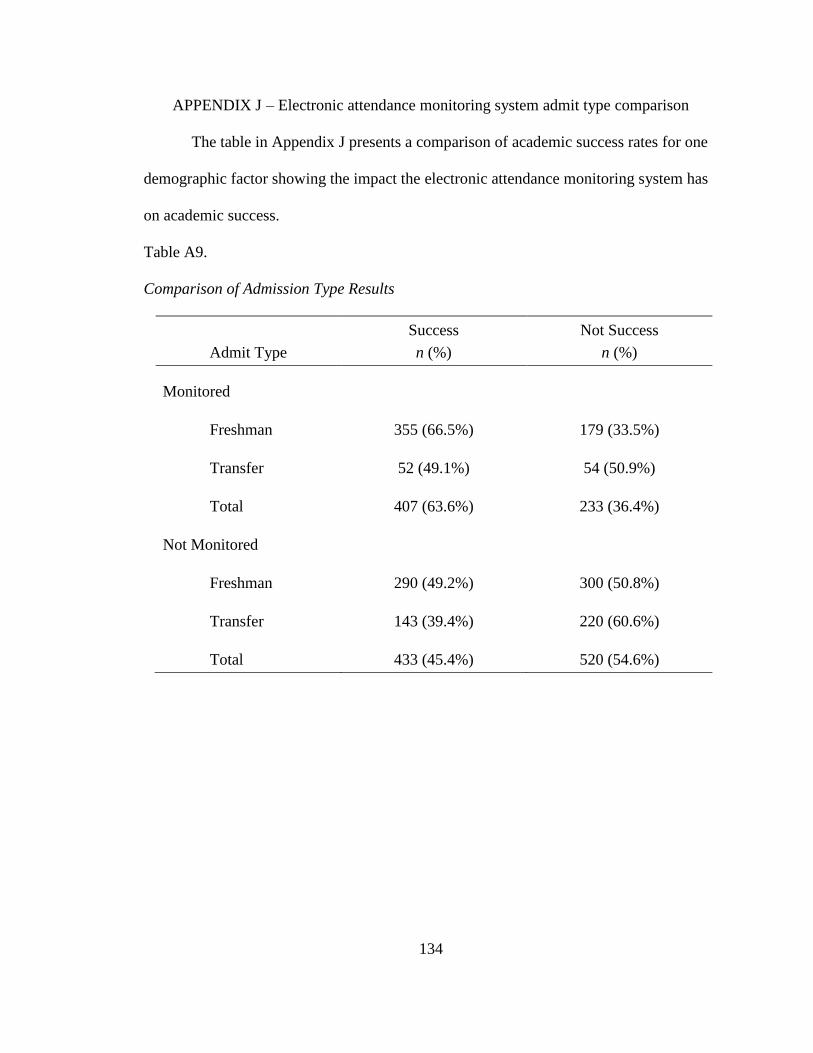
134
APPENDIX J – Electronic attendance monitoring system admit type comparison
The table in Appendix J presents a comparison of academic success rates for one
demographic factor showing the impact the electronic attendance monitoring system has
on academic success.
Table A9.
Comparison of Admission Type Results
Admit Type
Success
n (%)
Not Success
n (%)
Monitored
Freshman 355 (66.5%) 179 (33.5%)
Transfer 52 (49.1%) 54 (50.9%)
Total 407 (63.6%) 233 (36.4%)
Not Monitored
Freshman 290 (49.2%) 300 (50.8%)
Transfer 143 (39.4%) 220 (60.6%)
Total 433 (45.4%) 520 (54.6%)

135
APPENDIX K – Electronic attendance monitoring system cumulative GPA comparison
The table in Appendix K presents a comparison of academic success rates for one
demographic factor showing the impact the electronic attendance monitoring system has
on academic success.
Table A10.
Comparison of Cumulative GPA Results
Cumulative GPA
Success
n (%)
Not Success
n (%)
Monitored
Below 2.50 67 (31.8%) 144 (68.2%)
2.50 and Above 329 (82.9%) 68 (17.1%)
Total 407 (63.6%) 233 (36.4%)
Not Monitored
Below 2.50 102 (27.3%) 271 (72.7%)
2.50 and Above 284 (60.4%) 186 (39.6%)
Total 433 (45.4%) 520 (54.6%)

136
APPENDIX L – Electronic attendance monitoring system age comparison
The table in Appendix L presents a comparison of academic success rates for one
demographic factor showing the impact the electronic attendance monitoring system has
on academic success.
Table A11.
Comparison of Age Results
Age
Success
n (%)
Not Success
n (%)
Monitored
Traditional (18-24) 386 (63.4%) 223 (36.6%)
Non-Traditional (>24) 21 (67.7%) 10 (32.3%)
Total 407 (63.6%) 233 (36.4%)
Not Monitored
Traditional (18-24) 353 (46.1%) 412 (53.9%)
Non-Traditional (>24) 80 (42.6%) 108 (57.4%)
Total 433 (45.4%) 520 (54.6%)

137
APPENDIX M – Electronic attendance monitoring system classification comparison
The table in Appendix M presents a comparison of academic success rates for one
demographic factor showing the impact the electronic attendance monitoring system has
on academic success.
Table A12.
Comparison of Classification Results
Classification
Success
n (%)
Not Success
n (%)
Monitored
Underclass 336 (64.5%) 185 (35.5%)
Upperclass 71 (59.7%) 48 (40.3%)
Total 407 (63.6%) 233 (36.4%)
Not Monitored
Underclass 290 (49.2%) 299 (50.8%)
Upperclass 143 (39.3%) 221 (60.7%)
Total 433 (45.4%) 520 (54.6%)

138
APPENDIX N – Electronic attendance monitoring system ethnicity comparison
The table in Appendix N presents a comparison of academic success rates for one
demographic factor showing the impact the electronic attendance monitoring system has
on academic success.
Table A13.
Comparison of Ethnicity Results
Ethnicity
Success
n (%)
Not Success
n (%)
Monitored
White 264 (74.4%) 91 (25.6%)
Black 111 (48.3%) 119 (51.7%)
Other Ethnicity 32 (58.1%) 23 (41.8%)
Total 407 (63.6%) 233 (36.4%)
Not Monitored
White 256 (52.1%) (47.9%)
Black 134 (35.4%) 244 (64.6%)
Other Ethnicity 43 (53.0%) 41 (47.0%)
Total 433 (45.4%) 520 (54.6%)

139
APPENDIX O – Electronic attendance monitoring system enrollment status comparison
The table in Appendix O presents a comparison of academic success rates for one
demographic factor showing the impact the electronic attendance monitoring system has
on academic success.
Table A14.
Comparison of Enrollment Status Results
Enrollment Status
Success
n (%)
Not Success
n (%)
Monitored
Part-Time 6 (40.0%) 9 (60.0%)
Full-Time 401 (64.2%) 224 (35.8%)
Total 407 (63.6%) 233 (36.4%)
Not Monitored
Part-Time 40 (48.8%) 42 (51.2%)
Full-Time 393 (45.1%) 478 (54.9%)
Total 433 (45.4%) 520 (54.6%)

140
REFERENCES
Adelman, C. (1999). Answers in the tool box: Academic intensity, attendance, patterns
and Bachelor's degree attainment. Washington, DC: U.S. Department of
Education. Retrieved from http://www.ed.gov
Allen, W., Epps, E., & Haniff, N. (1991). College in black and white: African american
students in predominantly white and in historically black public universities.
Albany, N.Y.: State University of New York Press.
Altermatt, E. (2007). Coping with academic failure: Gender differences in student's self-
reported interactions with family members. The Journal of Early Adolescence, 27,
479-508. doi:10.1177/0272431607302938
Altonji, J., Blom, E., & Meghir, C. (2012). Heterogeneity in human capital investments:
High school curriculum, college major, and careers. Cambridge, MA: National
Bureau of Economic Research.
American College Testing. (2010). Fourth national survey. What works in student
retention? Report for all Colleges and Universities. Retrieved from
http://www.act.org
Argyris, C., & Schon, D. (1982). Theory in practice: Increasing professional
effectiveness. San Francisco, CA: Jossey-Bass.
Arredondo, M., & Knight, S. (2005). Estimating degree attainment rates of freshman: A
campus perspective. Journal of College Student Retention: Research, Theory &
Practice, 7(1), 91-115. doi:10.2190/EG5X-LN6A-JL8X-CJ0W
Astin, A. (1975). Preventing students from dropping out. San Francisco, CA: Jossey-
Bass.

141
Astin, A. (1984). Student involvement: A developmental theory for higher education.
Journal of College Student Development, 25(4), 297-308. Retrieved from
http://www.myacpa.org/journal-college-student-development
Astin, A. (1993). What matters in college? Four critical years revisited. San Francisco,
CA: Jossey-Bass.
Astin, A., & Oseguera, L. (2005). Degree attainment rates at American colleges and
universities. Los Angeles, CA: Higher Education Research Institute, University of
California Los Angeles.
Bailey, K., & Morais, D. (2005). Exploring the use of blended learning in tourism
education. Journal of Teaching in Travel & Tourism, 4, 23-36.
doi:10.1300/j172v04n04_02
Bean, J., & Metzner, B. (1985). A conceptual model of nontraditional undergraduate
student attrition. Review of Educational Research, 55(4), 450-540.
doi:10.3102/00346543055004485
Becker, G. (1993). Human Capital (3rd ed.). Chicago, IL: University of Chicago Press.
Behar, H. (2010). The effects of gender, perceived social support and sociometric status
on academic success. Procedia - Social and Behavioral Sciences, 2, 3801-3805.
doi:10.1016/j.sbpro.2010.03.593
Benzing, C., & Christ, P. (1997). A survey of teaching methods among economics
faculty. Journal of Economic Education, 28, 182-188. doi:10.2307/1182912
Berger, J., & Braxton, J. (1998). Revising Tinto's interactionalist theory of student
departure through theory elaboration: Examining the role of organizational

142
attributes in the persistence process. Research in Higher Education, 39, 103-119.
doi:10.1023/A:1018760513769
Berger, J., & Milem, J. (1999). The role of student involvement and perceptions of
integration in a causal model of student persistence. Research in Higher
Education, 40(6), 641-664. doi:10.1023/A:1018708813711
Berrett, D. (2015, January 26). The day the purpose of college changed. Retrieved from
The Chronicle of Higher Education: www.chronicle.com
Blackwell, A., Bowes, L., Harvey, L., Hesketh, A., & Knight, P. (2001). Transforming
work experience in higher education. British Educational Research Journal,
27(3), 269-285. doi:10.1080/01411920120048304
Bligh, D. (1998). What's the use of lectures? (5th ed.). San Francisco, CA: Jossey-Bass.
Board of Trustees of State Institutions of Higher Learning. (2014). IHL System Profile.
Jackson, MS: Author.
Borland, M., & Howsen, R. (1998). Effect of student attendance on performance:
Comment on Lamdin. Journal of Educational Research, 91(4), 195-197.
doi:10.1080/00220679809597542
Bureau of Labor Statistics. (2015). Labor force statistics from the current population
survey. Retrieved from www.bls.gov/cps
Caldas, S. (1993). Re-examination of input and process factor effects in public school
achievement. Journal of Educational Research, 86(4), 206-214.
doi:10.1080/00220671.1993.9941832

143
Campbell, J., & Fuqua, D. (2008). Factors predictive of student completion in a collegiate
honors program. Journal of College Student Retention: Research, Theory &
Practice, 10(2), 129-153. doi:10.2190/CS.10.2.b
Cappelli, P. (2011, October 24). Why companies aren't getting the employees they need.
Retrieved from Wall Street Journal: http://www.wsj.com
Chalofsky, N. (1992). A unifying definition for the human resource development
profession. Human Resource Development Quarterly, 3(2), 175-182.
doi:10.1002/hrdq.3920030208
Chickering, A. (1974). Commuting versus resident students: Overcoming the educational
inequities of living off campus. San Francisco, CA: Jossey-Bass.
Chickering, A., & McCormack, J. (1973). Personality development and college
experience. Researching Higher Education, 1, 43-70. doi:10.1007/bf00991565
Chimka, J., Reed-Rhoads, T., & Barker, K. (2007). Proportional hazards models of
graduation. Journal of College Student Retention, 9(2), 221-232.
doi:10.2190/CS.9.2.f
Church, R. (2002). The effective use of secondary data. Learning and Motivation, 33(1),
32-45. doi:10.1006/lmot.2001.1098
Crede, M., Roch, S., & Kieszczynka, U. (2010). Class attendance in college: A meta-
analytic review of the relationship of class attendance with grades and student
characteristics. Review of Educational Research, 80(2), 272-295.
doi:10.3102/0034654310362998
Creswell, J. (2014). Research design: Qualitative, quantitative, and mixed methods
approaches (4th ed.). Thousand Oaks, CA: Sage.
144
Crisp, G., Horn, C., Dizinmo, G., & Barlow, L. (2013). The long-term impact of
admission policies: A comparative study of two emergent research institutions in
Texas. Journal of College Student Retention: Research, Theory & Practice, 15(3),
433-454. doi:10.2190/CS.15.3.g
De Gregorio, J., & Lee, J. (2002). Education and income inequality: New evidence from
cross-country data. Review of Income and Wealth, 48(3), 395-416.
doi:10.1111/1475-4991.00060
Dicle, M., & Levendis, J. (2013). Using RFID technology to track attendance. Journal for
Economic Educators, 13(1), 29-38. doi:10.2139/ssrn.1926847
Dychtwald, K., Erickson, T., & Morison, R. (2006). Workforce crisis. Boston, MA:
Harvard Business School Press.
Education Commission of the States. (2011). College completion in Mississippi: The
impact on the workforce and the economy. Denver, CO: Author.
Edwards-Stewart, A., Prochaska, J., Smolenski, D., Saul, S., & Reger, G. (2017). Self-
Identified problem behaviors and stages of change among soldiers. Military
Behavioral Health, 5(3), 203-207. doi:10.1080/21635781.2016.1272023
Epstein, J., & Sheldon, S. (2002). Present and accounted for: Improving student
attendance through family and community involvement. Journal of Educational
Research, 95, 308-318. doi:10.1080/00220670209596604
Farsides, T., & Woodfield, R. (2003). Individual differences and undergraduate academic
success: The roles of personality, intelligence, and application. Journal of
Personality and Individual Differences, 34, 1225-1243. doi:10.1016/S0191-
8869(02)00111-3

145
Federal Student Aid, An Office of the U.S. Department of Education. (2016, June 20).
Federal Pell Grants. Retrieved from Federal Student Aid:
https://studentaid.ed.gov
Field, A. (2009). Discovering statistics using SPSS (3rd ed.). Thousand Oaks, CA: Sage.
Fike, D., & Fike, R. (2008). Predictors of first-year student retention in community
college. Community College Review, 36(2), 68-88.
doi:10.1177/0091552108320222
Florida, R. (2004). The rise of the creative class and how it's transforming work, leisure,
community and everyday life. New York, NY: Basic Books.
Fraenkel, J., & Wallen, N. (2006). How to design and evaluate research in education.
New York, NY: McGraw-Hill.
Fuller, J. (1997). Managing performance improvement projects: Preparing, planning,
implementing. San Francisco, CA: Jossey-Bass.
Gerdes, H., & Mallinckrodt, B. (1994). Emotional, social, and academic adjustment of
college students: A longitudinal study of retention. Journal of Counseling and
Development, 72, 281-288. doi:10.1002/j.1556-6676.1994.tb00935
Gianoutsos, D. (2011). Comparing the student profile characteristics between traditional
residential and commuter students at a public; research-intensive, urban
community university. (Doctoral dissertation, University of Nevada-Las Vegas).
Retrieved from http://digitalscholarship.unlv.edu/thesesdissertations/925
Gilley, J., & Eggland, S. (1989). Principles of human resource development. Reading,
MA: Addison-Wesley.

146
Goodwin, C. (2009). Research in psychology: Methods and design. Hoboken, NJ: John
Wiley & Sons.
Great Schools Partnership. (2014, August 26). The glossary of education reform.
Retrieved from Grade Point Average: http://edglossary.org/grade-point-average/
Gump, S. (2006). Guess who's (not) coming to class: Student attitudes as indicators of
attendance. Journal of Educational Studies, 32(1), 39-46.
doi:10.1080/03055690500415936
Handel, M. (2003). Skills mismatch in the labor market. Annual Review of Sociology, 29,
135-165. doi:10.1146/annurev.soc.29.010202.100030
Institutions of Higher Learning Board, State of Mississippi. (2013, April 18). IHL press
release: Board of trustees approves new allocation model for university system.
Retrieved from http://www.mississippi.edu/ihl/newsstory.asp?ID=1013
Institutions of Higher Learning Board, State of Mississippi. (2014). IHL system profile: A
report from the board of trustees of state institutions of higher learning. Jackson,
MS: Author.
Jones, S., Crandall, J., Vogler, J., & Robinson, D. (2013). Classroom response systems
facilitate student accountability, readiness, and learning. Journal of Educational
Computing Research, 49(2), 155-171. doi:10.2190/EC.49.2.b
Kanfer, R., & Ackerman, P. (1989). Motivation and cognitive abilities: An
integrative/aptitude-treatment interaction approach to skill acquisition. Journal of
Applied Psychology, 74(4), 657-690. doi:10.1037/0021-9010.74.4.657
147
Kaplan, R. (2017, April 12). Bloomberg. Retrieved from America has to close the
workforce skills gap: https://www.bloomberg.com/view/articles/2017-04-
12/america-has-to-close-the-workforce-skills-gap
Kautonen, T., Gelderen, M., & Fink, M. (2015). Robustness of the theory of planned
behavior in predicting entrepreneurial intentions and actions. Entrepreneuirship
Theory and Practice, 39(3), 655-674. doi:10.1111/etap.12056
Kelly, P. (2005). As America becomes more diverse. Boulder, CO: National Center for
Higher Education Management Systems Report.
Kolb, A., & Kolb, D. (2005). Learning styles and learning spaces: Enhancing experiential
learning in higher education. Academy of Management Learning and Education,
4(2), 193-212. doi:10.5465/AMLE.2005.17268566
Kotter, J. (2008). A sense of urgency. Boston, MA: Harvard Business School Press.
Kotter, J. (2008). A Sense of Urgency. Boston, MA: Harvard Business School Press.
Kuh, G., Cruce, T., Shoup, R., & Kinzie, J. (2008). Unmasking the effects of student
engagement on first-year college grades and persistence. Journal of Higher
Education, 79(5), 540-563. doi:10.1353/jhe.0.0019
Kuykendall, J. (2008). The impact of background, academic preparation, college
experiences, major choice, & financial aid on persistence for African-American
and White students in the Indiana public higher education system (Doctoral
Dissertation). Retrieved from Retrieved from ProQuest Dissertations and Theses
database. (UMI No. 3297939)

148
Lakey, B., & Cohen, S. (2000). Social support theory and measurement. In S. Cohen, L.
Underwood, & B. Gottlieb (Eds.), Social support measurement and intervention
(pp. 29-52). New York, NY: Oxford University Press.
Lau, L. (2003). Institutional factors affecting student retention. Education, 124(1), 126-
136. Retrieved from http://www.uccs.edu
Longhurst, R. (1999). Why aren't they here? Student absenteeism in a further education
college. Journal of Further and Higher Education, 23(1), 61-80.
doi:10.1080/0309877990230106
Lopez-Bonilla, J., & Lopez-Bonilla, L. (2015). The multidimensional structure of
university absenteeism: An exploratory study. Journal of Innovations in
Education & Teaching International, 52(2), 185-195.
doi:10.1080/14703297.2013.847382
Lowis, M., & Castley, A. (2008). Factors affecting student progression and achievement:
Prediction and intervention. A two-year study. Innovations in Education and
Teaching International, 45(4), 333-343. doi:10.1080/14703290802377232
Mackinnon, S. (2012). Perceived social support and academic achievement: Cross-lagged
panel and bivariate growth curve analyses. Journal of Youth Adolescence, 41,
474-485. doi:10.1007/s10964-011-9691-1
Markham, T., Jone, S., Hughes, I., & Sutcliffe, M. (1998). Survey of methods of teaching
and learning in undergraduate pharmacology within UK higher educaiton. Trends
in Pharmacological Sciences, 19, 257-262. doi:10.1016/s0165-6147(98)01221-8

149
Markle, G. (2015, April 20). Factors influencing persistence among nontraditional
university students. Adult Education Quarterly, 1-19.
doi:10.1177/0741713615583085
Marsick, V., & Watkins, K. (1994). The learning organization: An integrative vision for
HRD. In A. Brooks, & K. Watkins (Ed.), Academy of Human Resource
Development Conference Proceedings (pp. 129-134). San Antonio, TX: Academy
of Human Resource Development.
McLean, G., & McLean, L. (2001). If we can't define HRD in one country, how can we
define it in international context? Human Resource Development International,
4(3), 313-326. doi:10.1080/13678860126441
Miller, C., & Ireland, R. (2005). Intuition in strategic decision making: Friend or foe in
the fast-paced 21st century. Academy of Management Perspectives, 19(1), 19-30.
doi:10.5465/AME.2005.15841948
Mississippi Community College Board. (2016). Mississippi board for community
colleges. Retrieved April 21, 2016, from http://www.sbcjc.cc.ms.us/
Mitchell, M., Palacios, V., & Leachman, M. (2014, May 01). Center on budget and
policy priorities. Retrieved from http://www.cbpp.org/research/states-are-still-
funding-higher-education-below-pre-recession-levels
Moore, R. (2003). Attendance and performance: How important is it for students to
attend class? Journal of College Science Teaching, 32, 367-371. Retrieved from
http://www.nsta.org

150
National Center for Education Statistics. (2017, April). Undergraduate retention and
graduation rates. Retrieved from The condition of educaiton - postsecondary
education: https://nces.ed.gov
National Center for Educational Statistics. (2005). Postsecondary participation and
attainment among traditional age students. Student Effort and Educational
Progress Indicator 22. Retrieved from
http://nces.ed.gov/programs/coe/2005/section3/indicator22.asp
Newman-Ford, L., Fitzgibbon, K., Lloyd, S., & Thomas, S. (2008). A large-scale
investigation into the relationship between attendance and attainment: a study
using an innovative, electronic attendance monitoring system. Studies in Higher
Education, 33(6), 699-717. doi:10.1080/03075070802457066
Newsom, M. (2016, January 19). Attendance tracking gets upgrades, changes this
semester. Retrieved from University of Mississippi News: www.news.olemiss.edu
Noel, L., Levitz, R., & Saluri, D. (1985). Increasing student retention. San Francisco,
CA: Jossey-Bass.
O'Connor, M. (2010, May 24). Northern arizona university to use existing RFID student
cards for attendance tracking. Retrieved from RFID Journal:
http://www.rfidjournal.com/
Olson, M., & Hergenhahn, B. (2013). An Introduction to Theories of Learning. New
York, NY: Psychology Press, Taylor & Francis Group.
Ong-Dean, C., Hofstetter, C., & Strick, B. (2011). Challenges and dilemmas in
implementing random assignment in educational research. American Journal of
Evaluation, 32(1), 29-49. doi:10.1177/1098214010376532
151
Organization of Economic Co-operation and Development. (2014). Education at a
Glance: OECD Indicators. Retrieved from
http://www.oecd.org/education/eag.htm
Pascarella, E., & Terenzini, P. (1991). How college affects students: Findings and
insights from twenty years of research (Vol. 1). San Francisco, CA: Jossey-Bass.
Pascarella, E., & Terenzini, P. (2005). How college affects students. San Francisco, CA:
Jossey-Bass.
Patton, L., Renn, K., Guido, F., & Quaye, S. (2016). Student development in college:
Theory, research, and practice. San Francisco, CA: Jossey-Bass.
Peng, C., & So, T. (2002). Logistic regression analysis and reporting: A primer.
Understanding Statistics, 1(1), 31-70. doi:10.1207/S15328031US0101_04
Pfeffer, J., & Salancik, G. (1978). The external control of organizations: A resource
dependence perspective. New York, NY: Harper and Row.
Praxis Strategy Group. (2010a, May 11). Enterprising states: Creating jobs, economic
development, and prosperity in challenging times. Retrieved June 19, 2016, from
NewGeography: http://www.newgeography.com/content/001559-enterprising-
states-creating-jobs-economic-development-and-prosperity-challenging-tim
Praxis Strategy Group. (2010b, May 11). The states and economic development,
identifying top performers. Retrieved June 19, 2016, from NewGeography:
http://www.newgeography.com/content/001565-the-states-and-economic-
development-identifying-top-performers

152
Prochaska, J., Butterworth, S., Redding, C., Burden, V., Perrin, N., Lea, M., & Robb, M.
(2008). Initial efficacy of MI, TTM tailoring, and HRI's in multiple behaviors for
employee health promotion. Preventative Medicine, 46, 226-231.
Quinton, S. (2016, January 25). What are states going to do to make college more
affordable. Retrieved from Huffington Post: http://www.huffingtonpost.com
Reason, R. (2003). Student variables that predict retention: Recent research and new
developments. NASPA Journal, 40(4), 172-191. doi:10.2202/1949-6605.1286
Roberts, C. (2010). The dissertation journey: A practical and comprehensive guide to
planning, writing, and defending your dissertation (2nd ed.). Thousand Oaks, CA:
Corwin.
Roberts, J., & Styron, R. (2010). Student satisfaction and persistence: Factors vital to
student retention. Research in Higher Education Journal, 6(2), 1-18. Retrieved
from www.aabri.com
Robertson, J., Hurst, T., Williams, K., & Kieth, L. (2017). The potenital return on
investment of the recruitment strategies for an academic unit focused on
agricultural sciences. Journal of Applied Communications, 101(2), 59-71.
doi:10.4148/1051-0834.1005
Rodgers, R. (1990). Recent theories and research underlying student development. In D.
Creamer, College Student Development (p. 228). Lanham, MD: American College
Personnel Association.
Rodgers, T. (2013). Should high non-completion rates amongst ethnic minority students
be seen as an ethnicity issue? Evidence from a case study of a student cohort from

153
a British University. Journal of Higher Education, 66, 535-550.
doi:10.1007/s10734-013-9620-1
Romer, D. (1993). Do students go to class? Should they? Journal of Economic
Perspectives, 7(3), 167-174. doi:10.1257/jep.7.3.167
Rothwell, W. (2005). Effective succession planning. New York, NY: AMACOM Div
American Mgmt Association.
Russell, L. (2007). Ten steps to successful project management. Alexandria, VA: ASTD.
Sadler-Smith, E. (2015). Communicating climate change risk and enabling pro-
environmental behavioral change through human resource development.
Advances in Developing Human Resources, 17(4), 442-459.
doi:10.1177/1523422315601087
Sauers, D., McVay, G., & Deppa, B. (2005). Absenteeism and academic performance in
an introduction to business course. Academy of Educational Leadership Journal,
9(2), 19-28. Retrieved from http://www.alliedacademies.org/
SB 2851. (2013, April). Mississippi Legislature. (E. Clarke, T. Burton, W. Hopson, G.
Jackson, & P. Lee, Editors) Retrieved from
http://www.legislature.ms.gov/Pages/default.aspx
Schiller, T. (2008). Human capital and higher education: How does our region fare?
Retrieved from www.philadelphiafed.org/research-and-
data/publications/business-review/2008/q1/schiller_human-capital-and-higher-
education.pdf
Schultz, T. (1961). Investment in Human Capital. American Economic Association,
51(1), 1-17. Retrieved from https://www.aeaweb.org/

154
Sellingo, J. (2015, February 2). What's the purpose of college: A job or an education?
Retrieved from The Washington Post: https://www.washingtonpost.com
Shadish, W., Cook, T., & Campbell, D. (2002). Experimental and quasi-experimental
designs for generalized causal inference. Belmont, CA: Wadsworth.
Singell, L., & Wadell, G. (2010). Modeling retention at a large public university: Can at-
risk students be identified early enough to treat? Research in Higher Education,
51(6), 546-572. doi:10.1007/s11162-010-9170-7
Slanger, W., Berg, E., Fisk, P., & Hanson, M. (2015). A longitudinal cohort study of
student motivational factors related to academic success and retention using the
college student inventory. Journal of College Student Retention: Research,
Theory & Practice, 17(3), 1-25. doi:10.1177/1521025115575701
Smith, R. (1988). Human resource development: An overview. Washington, DC: Office
of Educational Research and Improvement. Retrieved from ERIC Database.
(ED291013)
Southern Association of Colleges and Schools Commission on Colleges. (2015).
Commission on Colleges. Retrieved from SACSCOC: www.sacscoc.org
Stanca, L. (2004, December 4). The effects of attendance on academic performance:
Panel data evidence for introductory microeconomics. doi:10.2139/ssrn.625442
Statistic Solutions. (2013). Data analysis plan: Bivariate (Pearson) Correlation.
Retrieved from http://www.statisticssolutions.com
Sternberg, R. (2013, February 7). Essay on the use of research to improve student
retention. Retrieved from Inside Higher Ed:

155
https://www.insidehighered.com/views/2013/02/07/essay-use-research-improve-
student-retention
Stewart, S., & Rue, P. (1983). Commuter students: Definitions and distribution. New
Directions for Student Services, 24, 3-8. doi:10.1002/ss.37119832403
Stewart, S., Merrill, M., & Saluri, D. (1985). Students who commute. In L. Noel, R.
Levitz, & D. Saluri (Eds.), Increasing student retention: Effective programs and
practices for reducing the dropout rate (pp. 162-182). San Fransisco, CA: Jossey-
Bass.
Swanson, R. (1999). The foundations of performance improvement and implications for
practice. Advances in Developing Human Resources, 1(1), 1-25.
doi:10.1177/152342239900100102
Swanson, R., & Gradous, D. (1986). Performance at work. New York, NY: Wiley.
Swanson, R., & Holton, E. (2009). Foundations of human resource development (2nd
ed.). San Francisco, CA: Berrett-Koehler.
Tanner-Smith, E., & Wilson, S. (2013). A meta-analysis of the effects of dropout
prevention programs on school absenteeism. Prevention Science, 14(5), 468-478.
doi:10.1007/s11121-012-0330-1
Tharp, J. (1998). Predicting persistence of urban commuter campus students utilizing
student background characteristics from enrollment data. Community College
Journal of Research and Practice, 22(3), 279-294.
doi:10.1080/1066892980220307
The Carnegie Classification of Institutions of Higher Education. (2016). Size & setting
methodology. Retrieved from http://carnegieclassifications.iu.edu

156
The University of Southern Mississippi. (2014). Student Success Steering Committee
Suggestions. Hattiesburg, MS: Author.
The University of Southern Mississippi. (2015). Fact Books The University of Southern
Mississippi. Retrieved from University of Southern Mississippi Insitutional
Research: https://www.usm.edu/institutional-research
The University of Southern Mississippi. (2015, November 20). Office of Greek Life.
Retrieved from Office of Greek Life: www.usm.edu/greeklife
The University of Southern Mississippi. (2016). University of Southern Mississippi Office
of Financial Aid. Retrieved from Satisfactory Academic Progress:
https://www.usm.edu/financial-aid/satisfactory-academic-progress-sap
The University of Southern Mississippi. (n.d.). Institutional Review Board. Retrieved
from https://www.usm.edu/research/institutional-review-board
The University of Southern Mississippi Office of Institutional Research. (2015).
Retention of first-time full-time degree seeking freshman. Retrieved from
http://www.usmir.org/campus/retention/PR_2015_2016_Graduation_RetentionRa
tes_USMandColleges.pdf
Thomas, P., & Higbee, J. (2000). The relationship between involvement and success in
developmental algebra. Journal of College Reading and Learning, 30(2), 222-
232. doi:10.1080/10790195.2000.10850097
Thurow, L. (1993). Head to head: The coming economic battle among Japan, Europe,
and America. New York, NY: Warner.

157
Tinto, V. (1975). Dropout from higher education: A theoretical synthesis of recent
research. Review of Educational Research, 45, 89-125.
doi:10.3102/00346543045001089
Tinto, V. (1985). Theories of student departure revisited. In J. Smart (Ed.), Higher
education: A handbook of theory and research (Vol. 2;, pp. 359-384). New York,
NY: Agathon.
Tinto, V. (1993). Leaving college: Rethinking the causes and cures of student attrition
(2nd ed.). Chicago, IL: The University of Chicago Press.
Tinto, V. (2006). Research and practice of student retention: What's next? Journal of
College Student Retention, 8(1), 1-19. doi:10.2190/c0c4-eft9-eg7w-pwp4
Tolman, E. (1948). Cognitive maps in rats and men. Psychological Review, 55(4), 189-
208. doi:10.1037/h0061626
Torpey, E., & Watson, A. (2014, September). Education level and jobs: Opportunities by
state. Retrieved from Bureau of Labor Statistics: www.bls.gov
Trochim, W. (2006). The research methods knowledge base. Retrieved from
http://www.socialresearchmethods.net/kb
U.S. Census Bureau. (2006). Majority of undergrads and grad students are women,
census bureau reports. Retrieved from http://www.census.gov/Press-
Release/www/releases/archives/education/007909.html
U.S. Department of Education, National Center for Education Statistics. (2016). The
Condition of Education 2016. Washington, DC: U.S. Department of Education.
Retrieved from https://nces.ed.gov/fastfacts/display.asp?id=40

158
Vidler, D. (1980). Curiousity, academic performance, and class attendance.
Psychological Reports, 47(2), 589-590. doi:10.2466/pr0.1980.47.2.589
Watkins, R. (2010). Handbook of improving performance in the workplace - The
handbook of selecting and implementing performance interventions (Vol. 2). San
Francisco, CA: Jossey-Bass.
White House, Office of the Press Secretary. (2009, February 24). Remarks by the
President to Joint Session of Congress. Retrieved from
http://www.whitehouse.gov/the_press_office/Remarks-of-President-Barack-
Obama-Address-to-Joint-Session-of-Congress
Wiley, D. (2013, January 16). Attendance tracking scanners for UM classrooms.
Retrieved from The University of Mississippi TECHNews:
www.technews.olemiss.edu
Wong, G., & Mason, W. (1985). The hierarchical logistic regression model for multilevel
analysis. Journal of the American Statistical Association, 80(391), 513-524.
doi:10.2307/2288464
Woodfield, R., Jessop, D., & McMillan, L. (2006). Gender differences in undergraduate
attendance rates. Studies in Higher Education, 31(1), 1-22.
doi:10.1080/03075070500340127
Yu, C., DiGangi, S., Jamnasch-Pennell, A., & Kaprolet, C. (2010). A data mining
approach to identifying predictors of student retention from sophomore to junior
year. Journal of Data Science, 8, 307-325. Retrieved from www.jds-online.com

159
Zea, M., Reisen, C., Beil, C., & Caplan, R. (1997). Predicting intention among ethnic
minority students. The Journal of Social Psychology, 137(2), 149-160.
doi:10.1080/00224549709595426