A survey of the use of electronic resources at seven universities in Wuhan, China
Upload
khangminh22Category
view
1download
0
NOVATEUR PUBLICATIONS
INTERNATIONAL JOURNAL OF INNOVATIONS IN ENGINEERING RESEARCH AND TECHNOLOGY
[IJIERT] ISSN: 2394-3696 Website: ijiert.org
VOLUME 8, ISSUE 6, June. -2021
127 | P a g e
THE USE OF ELECTRONIC SYSTEM FOR MONITORING WATER
QUALITY IN KAINJI LAKE Oluborode, G.B
National Institute for Freshwater Fisheries Research,
P. M. B. 6006, New Bussa, Niger State.
*Email: [email protected]
Afolabi, O. M.
Department of Physics and Electronis,
Adekunle Ajasin University, Akungba Akoko, Ondo State
Tomiwa, A. C.
Department of Physics and Electronis,
Adekunle Ajasin University, Akungba Akoko, Ondo State
Agbi, J. I.
Department of Physics and Electronis,
Adekunle Ajasin University, Akungba Akoko, Ondo State
ABSTRACT
Monitoring of water quality in lakes to meet the requirement of the water framework directive poses a
significant financial burden using conventional sampling and laboratory based techniques. This observed
situation prompted the development of this locally made low cost multi-parameter monitoring system based
on wireless network to achieve remote real-time monitoring of water quality in order to improve the quality
of lakes, dams and rivers.
The developed monitoring system consisted of five units: data monitoring nodes, data base station, remote
monitoring center, power supply unit and display unit. The power supply unit consisted of solar cells and
lithium cells. The dissolved oxygen sensor, pH electrode, temperature sensor, turbidity sensor, conductivity
sensor and depth sensor present in data monitoring mode were used to measure and monitor the water
quality parameters on Kanji Lake in Nigeria. A microcontroller chip was used for processing data collected,
GPRS modules were also used for data transmission to the remote monitoring center; where the data were
stored and displayed on the Liquid Crystal Display (LCD) unit. Various parameters of the lake such as
dissolved oxygen, temperature, electrical conductivity, pH, turbidity and depth were successfully logged into
the memory card and sent through GSM module for auto-monitoring.
The water pH was found to range from 7.1 to 7.43 with a mean temperature range of 27.3°C to 29.8°C.
Other physicochemical parameters values monitored did not exceed the recommended values for surface
water quality. The comparison between the physicochemical parameters studied in Kanji Lake and the
standard values showed that all the parameters exhibited positive relationship. Experimental results obtained
using this locally developed low cost multi-parameter monitoring system showed that the system is more
reliable for large scale deployments on water quality in lakes. The cost ($23,423= #8,409,622) of imported
ones is 30 times in price compared with the cost ($708.33= #255,000) of locally made multi-parameter
monitoring system. It is recommended that locally made multi-parameter should be used by water
researchers instead of the imported ones so as to reduce and avoid unnecessary financial burden due to
conventional sampling and laboratory based techniques.
Keywords: Multi-parameters, water quality, real-time monitoring, measurements, wireless sensor network.
NOVATEUR PUBLICATIONS
INTERNATIONAL JOURNAL OF INNOVATIONS IN ENGINEERING RESEARCH AND TECHNOLOGY
[IJIERT] ISSN: 2394-3696 Website: ijiert.org
VOLUME 8, ISSUE 6, June. -2021
128 | P a g e
INTRODUCTION
Population growth, urbanization and industrialization have led to the decline of quality of surface
waters globally (Martinez et al., 2011; Walakira and Okot-okumu, 2011; Owa, 2013). The quality of surface
water has deteriorated in many countries in the past few decades due to extensive anthropogenic inputs of
nutrients and sediments (Tessema et al., 2014). Most rivers in the urban areas of the developing world are
the end points of discharges from the municipal and industrial treatment facilities (Bernard, 2010; Suthar et
al., 2010; Ljee, 2011) rendering surface waters the most polluted water resources (Kadewa et al., 2005).
According to the Pan African Chemistry Network (PACN), Africa’s population exceeded 1.1 billion in 2014
and continues to increase at a rate of 2.4 % annually (PACN, 2015). Of this population, more than 341
million lack access to clean drinking water and a further 589 million have no access to adequate sanitation,
resulting in loss of productivity due to water-related illnesses (PACN, 2015).
Water for human use requires sustaining an adequate water quality standards and changes in water quality
threatens human health (Massoud, 2012). The effects of environmental factors such as climate change make
the challenge of conserving water resources even more difficult (PACN,
2010). Climate change has a major impact on water quality and water management. Increases in
water temperature produce unfavourable changes in surface-water quality, which has detrimental
effects on human and ecosystem health (IPCC, 2008). Africa’s water resources are being degraded due to
discharge of untreated wastewater from industrial and domestic sources (Corcoran et al., 2010). Pollution
from natural and anthropogenic processes also threatens available fresh water resources in most Africa
countries (Nyakungu et al., 2013).
In Zimbabwe, Lake Chivero is polluted due to nutrient loadings from sewage discharges
through its main tributary, Manyame River ( Masere et al., 2012; Nyakungu et al., 2013; Kibena
et al., 2014). Ngerengere River in Wami/Ruvu basin in Tanzania is polluted due to agricultural
and industrial wastewater from upstream sources (Mero, 2011) and with most affected
communities located downstream of the catchment (Mero, 2011). Botswana’s water resources are also under
threat from various pollution sources that mainly include pit latrines, solid waste, agriculture, industrial and
domestic wastes (DWA, 2013). River water quality is deteriorating due to pollutant loads from point and
nonpoint sources, such as agricultural runoff, solid waste disposal, sewage and industrial effluent. Motloutse
River has been polluted by discharges from mine effluent (Masamba and Mazvimavi 2006). Notwane River
is heavily polluted with sewage effluent from Glen Valley and Mochudi wastewater treatment plants
(Mladenov et al., 2005) rendering water from these rivers unfit for human use and in some cases not
conducive for irrigation and environmental consumption. The Dikgathong Dam, located within the Limpopo
River Basin (LRB), in the north east part of Botswana, is also under pollution threat from anthropogenic
activities (EHES, 2002). The LRB main pollution threat comes from anthropogenic activities such as
agriculture, mining and urbanization (MRC, 2009).
Water quality monitoring is essential for identifying sources of contaminants entering water
resources (PACN, 2010). Monitoring offers key information for detecting and dealing with water
quality problems, by identifying trends over time and comparisons between different water bodies (UNEP,
2010). The quality of water bodies is determined by its physicochemical features, hence the importance of
long and short term analysis of water quality status (Adakole et al., 2003). There is inadequate information
for water quality around the world, especially in developing countries. The little available information has
challenges of inconsistency, rendering it not very useful for those who want to use it (UNEP, 2010). Water
quality monitoring methods includes biological indicators, physicochemical analysis, water quality indices
and use of water quality monitoring techniques. The use of GIS and multiparameter sensors in water quality
monitoring has been long acknowledged (Usali and Ismail, 2010). The strength of multiparameter sensors
NOVATEUR PUBLICATIONS
INTERNATIONAL JOURNAL OF INNOVATIONS IN ENGINEERING RESEARCH AND TECHNOLOGY
[IJIERT] ISSN: 2394-3696 Website: ijiert.org
VOLUME 8, ISSUE 6, June. -2021
129 | P a g e
techniques is their capability to capture the spatial and temporal variability of water quality parameters
(Mohamed, 2015) and has been demonstrated to be effective at reduced cost (Schaeffer et al., 2013).
Traditional methods of water quality monitoring are costly and time consuming. Traditional methods
provide accurate measurements because of the direct measurements, but it is only at discrete points, not
covering the entire water body (He et al., 2008). Thus it is advocated for the use of GIS and remote sensing
to improve water quality monitoring. Besides climate change effects mentioned earlier, landuse changes
have great impacts on water resources (Wagner et al., 2013). Land use classifications can be analysed to
identify changes over a past period of time (Wagner et al., 2013). Understanding the relationship between
upstream land use and water quality is useful for identifying principal threats to water quality (Ding et al.,
2015). Landuse usually defines the concentrations of contaminants that flow into rivers and lakes (Larkin,
2014). Pollution is related to anthropogenic practices which can be measured in terms of population density
and land use type (Yaakub et al., 2012). It is important to constantly determine point and nonpoint source of
pollution loads for proper management of water quality (Yaakub etal., 2012). Urbanization, agricultural
runoff, industrial and sewage disposal have affected the quality of water around the world and making it
unfit for domestic purpose ( Kadewa et al., 2005; Chatterjeeet al., 2010; Choudhary et al, 2011; Ullah et al.,
2013). The Kainji Dam lies downstream from expanding urban, industrial and mining areas, which poses
threats to the dam’s water quality. It is imperative for the Kainji Dam to continue to sustain its water quality
in order to serve its purpose of supplying drinking water. Measures need to be put in place to monitor the
water quality of this dam with deliberate interventions to ensure it does not continue to deteriorate. The use
of traditional methods for monitoring water quality alone is not adequate (Ritchie et al., 2003). Integration of
traditional methods and remote sensing has demonstrated the practicality of remote sensing in monitoring of
water quality Dlamini et al., 2016).
Previous studies on remote sensing applications on water quality have used empirical algorithms for
predicting water quality parameters. The limitations of empirical methods of remote sensing applications in
water quality are that the algorithms work best when applied to the site where sampling data was collected
and the formulas derived and may not be applicable to other water bodies (Chang et al., 2014). The
traditional method for water quality determination and monitoring is the laboratory method, in which
samples from different location are collected and these samples are taken to laboratory followed by
laboratory analytical technique for detecting the contamination in the water. This method however is
tedious, expensive and time consuming (leading to delayed detection of and response to contaminants).
Because of the economic value of some of the water bodies there is need for effective and efficient
monitoring and control of water quality in Lakes and dams. So an advanced low cost multi-parameters
electronic instrument for automatic monitoring and measurements water quality in lakes, reservoirs and
dams will be developed.
STUDY AREA
River Niger is a principal river in Western Africa with the length of 2,600 miles (4,200 km), it is the third
longest river in Africa, after the Nile and the Congo.
The River rises from Guinea ( 9°05′ N, 10°47′ W ) on the eastern side of the Fouta Djallon highlands, 150
miles (240 km) inland from the Atlantic Ocean. It flows due north over the first 100 miles (160 km). It then
follows a northeasterly direction, during the course of which it receives its upper tributaries and enters Mali.
From Mali, the river takes a more east-northeasterly direction, and its bed becomes fairly free from
impediments for about 1,000 miles (1,600 km) and flows about 1,100 miles (1,770 km) in all to enter Niger.
From Niger it flows flowing east-southeast and enter Nigeria through Kebbi state. In Nigeria, the river was
dammed in New Bussa which results into kainji dam. Kainji Dam is a dam across the Niger River in Niger

NOVATEUR PUBLICATIONS
INTERNATIONAL JOURNAL OF INNOVATIONS IN ENGINEERING RESEARCH AND TECHNOLOGY
[IJIERT] ISSN: 2394-3696 Website: ijiert.org
VOLUME 8, ISSUE 6, June. -2021
130 | P a g e
State of Northern Nigeria. It was one of the longest dams in the world. The dam was 136 km (84 mi) long,
about 30 km (19 mi) wide; it was the first dam to be built in Nigeria as shown in figure 1. Construction of
the dam was carried out by Impregilo (a consortium of Italian Civil Engineering Contractors) to designs by
Joint Consultants, Balfour Beatty and Nedeco, and began in 1964 to be completed in 1968. The total cost
was estimated at US$209 million (equivalent to about US$1.3 billion in 2018 dollars), with one-quarter of
this amount used to resettle people displaced by the construction of the dam and its reservoir.
Figure 1: Map of the the study area
General structure of the system
The system consists of power supply, sensor detection part, controller, data transmission part, remote
monitoring center, etc. The sensor detection part comprises the sensors for dissolved oxygen, pH value,
temperature turbidity conductivity and depth. The controller is made up of Arduino microconroller and its
peripheral circuits, and is responsible for processing the parameters of water quality acquired by the sensors
and controlling the whole system to work properly in order. The data transmission part is composed of GSM
and GPRS module, which transmits the parameters detected by the sensors to the user mobile phone number
and www.thingspeak.com network.
Power supply module
The power supply module consists of Lead acid battery, solar panels, lead battery charge-managing circuit
and DC/DC step-up/step-down converter circuit.
Power supply by LEAD battery
The polymer lead battery (nominal voltage: 7.2 V, cell capacity: 4.5 Ah) manufactured by New Energy
Technology Co., Ltd. was used. In order to fulfill the requirement of working voltage of every module, step-
NOVATEUR PUBLICATIONS
INTERNATIONAL JOURNAL OF INNOVATIONS IN ENGINEERING RESEARCH AND TECHNOLOGY
[IJIERT] ISSN: 2394-3696 Website: ijiert.org
VOLUME 8, ISSUE 6, June. -2021
131 | P a g e
up and step-down converters were used to change the output voltage of the Lead battery [15, 16]. Maximum
power consumption of the system:
Psys = Psen + PGSM + PGPRS + Pmcu 1
Where, Psys is the maximum power consumption of the system, expressed in W; Psen is the total maximum
power of the sensors, expressed in W; PGSM is maximum power of GSM module, expressed in W; PGPRS is
the maximum power of GPRS module, expressed in W; Pmcu is the maximum power of the controller,
expressed in W.
Psys = (PDsen+PTsen+PDOsen+PCsen+PTUsen+PPHsen)+PGSM+PGPRS + Pmcu 2
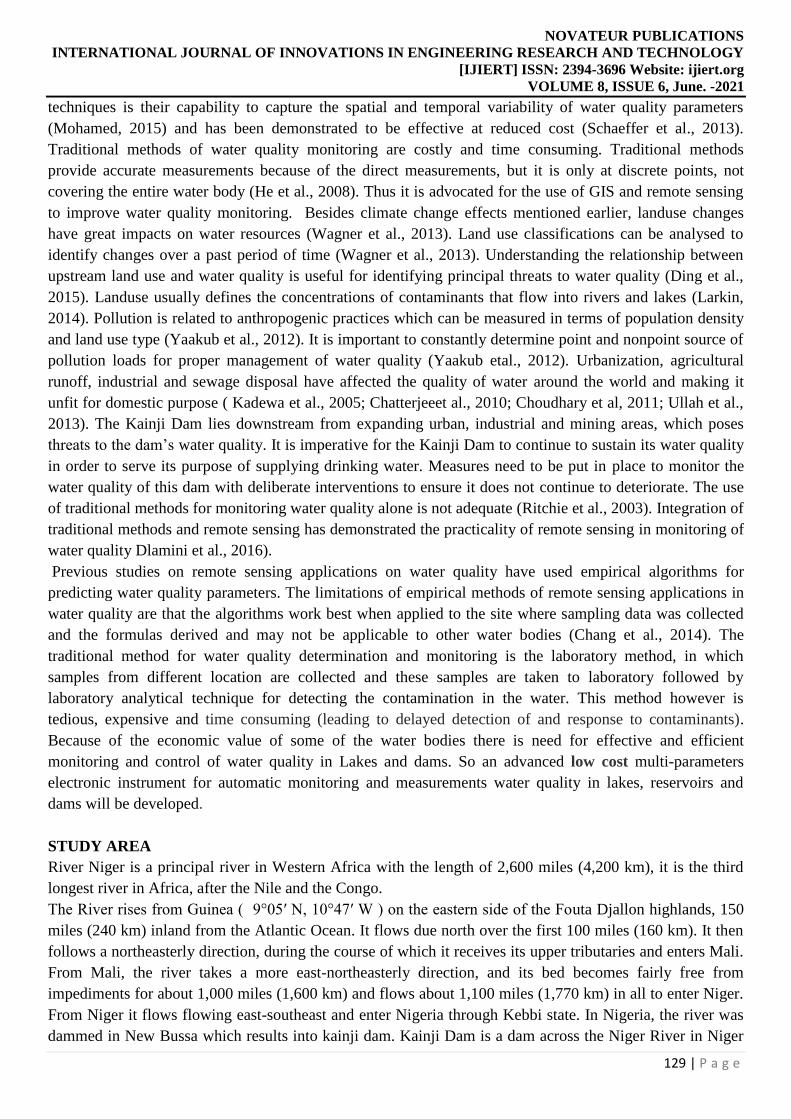
The structure diagram of power supply is shown in Figure 2.
Figure 2: The structure diagram of power supply
Since the working voltage of the sensors are 5 V and working current is 100 mA, Psen=3.0 mW. When GSM
module is working properly, its working voltage is 3.6 V, the maximum working current is 100 mA, so PGSM
= 3.60 mW. When GPRS module is working properly, its working voltage is 5 V and the maximum working
current is 500 mA, so PGPRS = 2.5mW. When the controller is working properly, its working voltage is 5 V
and working current is 15 mA, so Pmcu= 7.5 mW.:
The mean total power of the system is 10.231 mW. Based on 7.2 V voltage of the lead battery, the average
load current of the system is calculated to be 3.1 mA. The correlation between load current and working
duration is expressed by C=I × t × λ (where C is battery capacity, λ is safety factor of service duration of the
battery, which is taken as 1.2), so a 3. Ah battery can sustain 920 hrs operation of the system.
Solar panels
Polycrystalline silicon solar cells (max. current: 0.34 A, max. voltage: 9 V) manufactured by Guangdong
Zhaotian Company is used as solar panel. The power output by the solar panel is charged into the led battery
under the control of charging circuit.
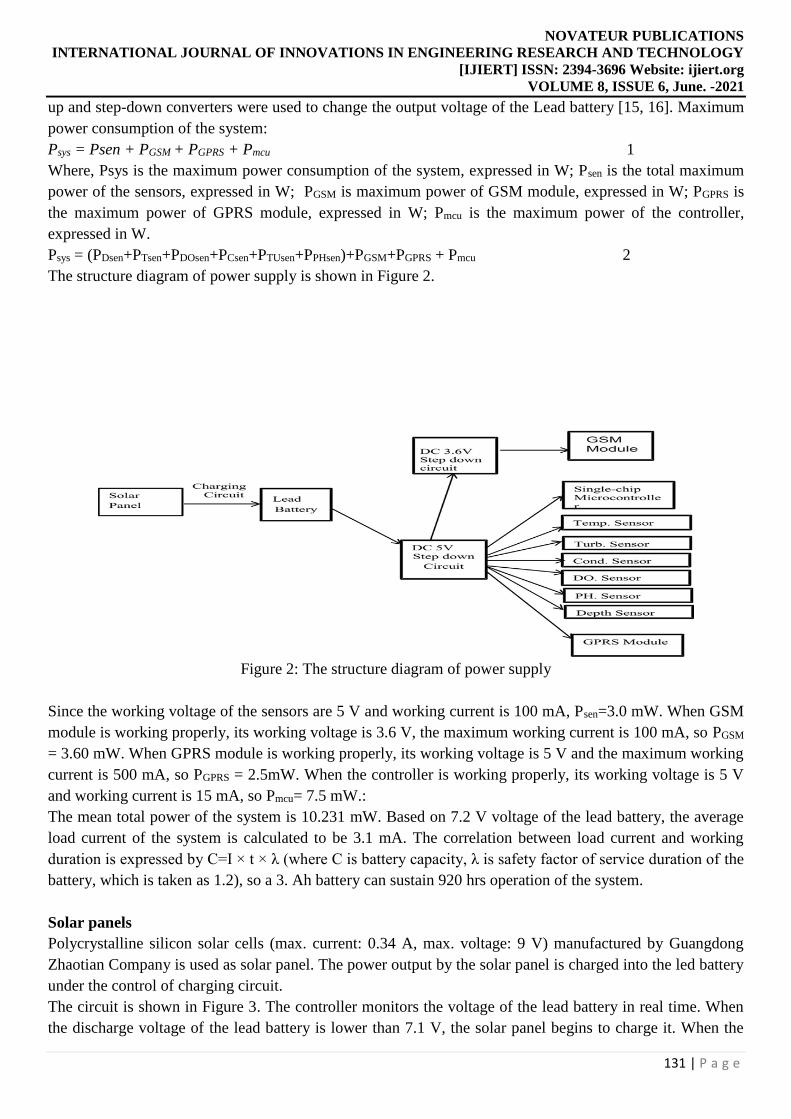
The circuit is shown in Figure 3. The controller monitors the voltage of the lead battery in real time. When
the discharge voltage of the lead battery is lower than 7.1 V, the solar panel begins to charge it. When the
NOVATEUR PUBLICATIONS
INTERNATIONAL JOURNAL OF INNOVATIONS IN ENGINEERING RESEARCH AND TECHNOLOGY
[IJIERT] ISSN: 2394-3696 Website: ijiert.org
VOLUME 8, ISSUE 6, June. -2021
132 | P a g e
voltage reaches 7.4V, charging stops. The average charge current output by solar panel is 0.13 A.
Calculating according to correlation expression C= I × t × λ, and taking 0.8 as the safety factor of charging
duration, the average charge duration of the lead battery is 35 hrs, and it varies with weather condition.
Figure 3 Charging circuit of a lead battery
The power supply module consists of lead battery, solar panels, lead battery charge managing circuit and
DC/DC step-up/step-down converter circuit
Field Trials
Several field trials were conducted from February 2019 to April 2019 on Kainji dam in Niger State. Some of
these trials were conducted between 11:00 am and 11:40 am. First of all, the system was switched on to take
the ambient temperature before deployed it into the water. Two sites were selected for trials. Site S1 was the
inlet and S2 was the outlet of the lake
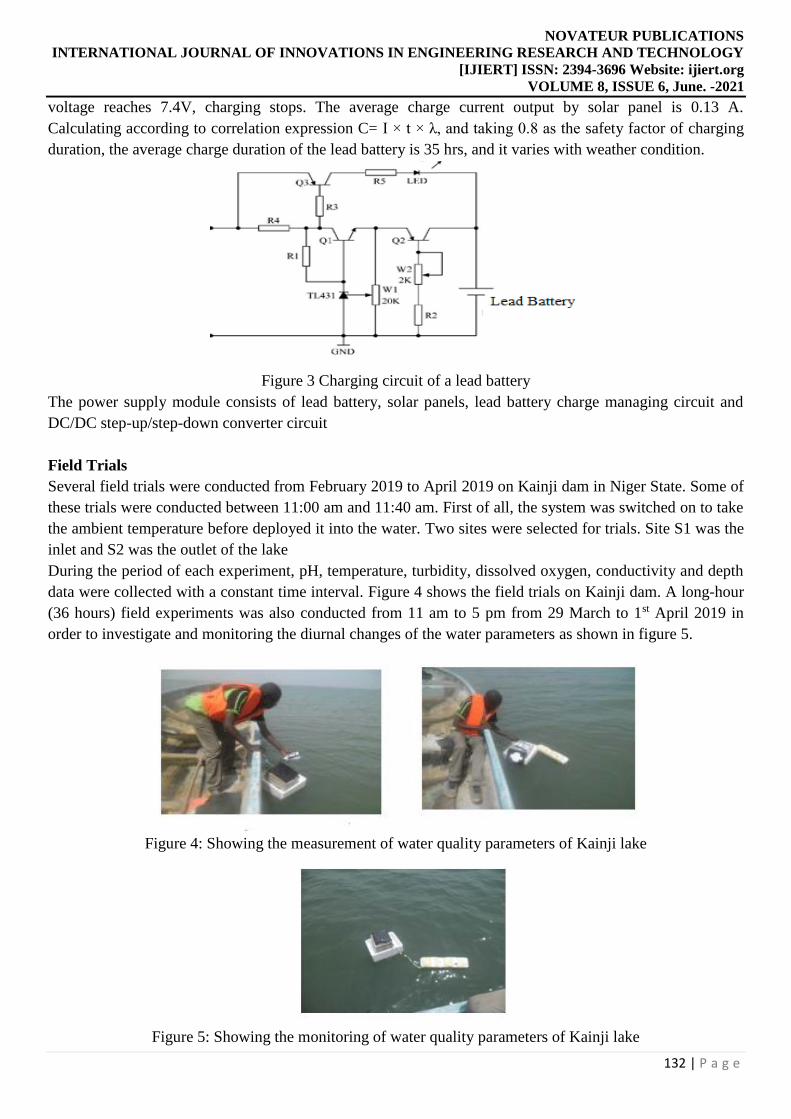
During the period of each experiment, pH, temperature, turbidity, dissolved oxygen, conductivity and depth
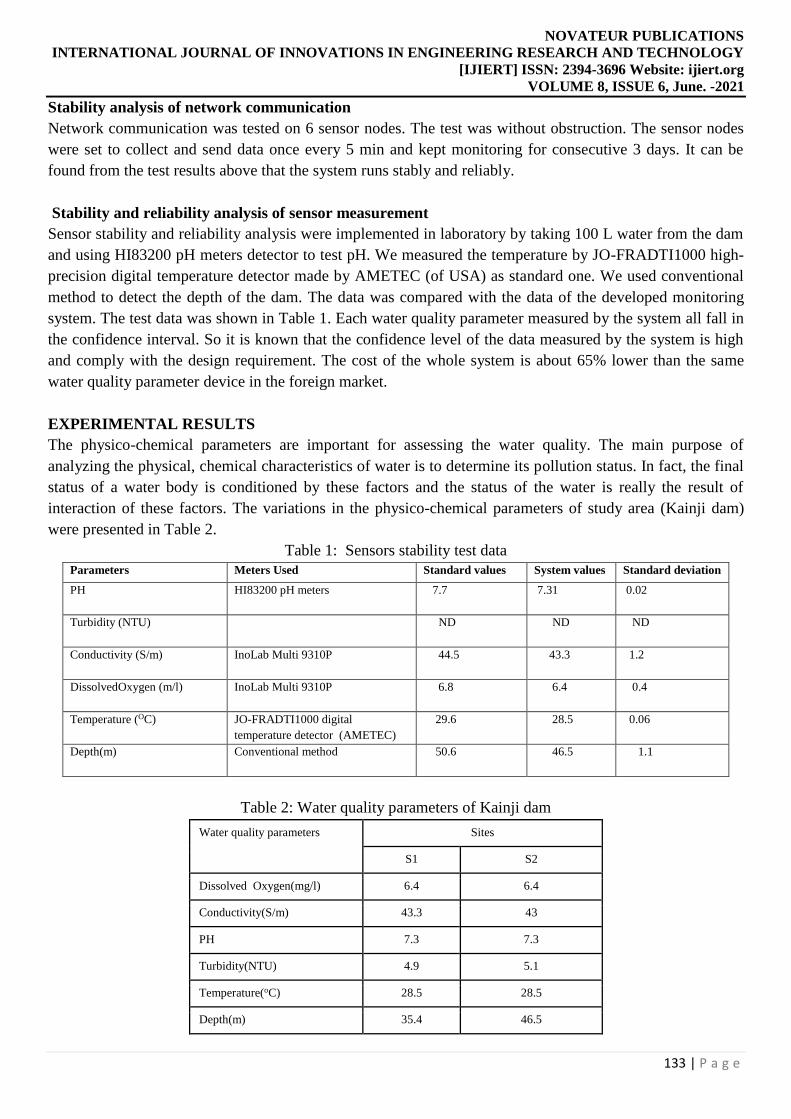
data were collected with a constant time interval. Figure 4 shows the field trials on Kainji dam. A long-hour
(36 hours) field experiments was also conducted from 11 am to 5 pm from 29 March to 1st April 2019 in
order to investigate and monitoring the diurnal changes of the water parameters as shown in figure 5.
Figure 4: Showing the measurement of water quality parameters of Kainji lake
Figure 5: Showing the monitoring of water quality parameters of Kainji lake
NOVATEUR PUBLICATIONS
INTERNATIONAL JOURNAL OF INNOVATIONS IN ENGINEERING RESEARCH AND TECHNOLOGY
[IJIERT] ISSN: 2394-3696 Website: ijiert.org
VOLUME 8, ISSUE 6, June. -2021
133 | P a g e
Stability analysis of network communication
Network communication was tested on 6 sensor nodes. The test was without obstruction. The sensor nodes
were set to collect and send data once every 5 min and kept monitoring for consecutive 3 days. It can be
found from the test results above that the system runs stably and reliably.
Stability and reliability analysis of sensor measurement
Sensor stability and reliability analysis were implemented in laboratory by taking 100 L water from the dam
and using HI83200 pH meters detector to test pH. We measured the temperature by JO-FRADTI1000 high-
precision digital temperature detector made by AMETEC (of USA) as standard one. We used conventional
method to detect the depth of the dam. The data was compared with the data of the developed monitoring
system. The test data was shown in Table 1. Each water quality parameter measured by the system all fall in
the confidence interval. So it is known that the confidence level of the data measured by the system is high
and comply with the design requirement. The cost of the whole system is about 65% lower than the same
water quality parameter device in the foreign market.
EXPERIMENTAL RESULTS
The physico-chemical parameters are important for assessing the water quality. The main purpose of
analyzing the physical, chemical characteristics of water is to determine its pollution status. In fact, the final
status of a water body is conditioned by these factors and the status of the water is really the result of
interaction of these factors. The variations in the physico-chemical parameters of study area (Kainji dam)
were presented in Table 2.
Table 1: Sensors stability test data
Parameters Meters Used Standard values System values Standard deviation
PH HI83200 pH meters 7.7 7.31 0.02
Turbidity (NTU) ND ND ND
Conductivity (S/m) InoLab Multi 9310P
44.5 43.3 1.2
DissolvedOxygen (m/l) InoLab Multi 9310P
6.8 6.4 0.4
Temperature (OC) JO-FRADTI1000 digital
temperature detector (AMETEC)
29.6 28.5 0.06
Depth(m) Conventional method 50.6 46.5 1.1
Table 2: Water quality parameters of Kainji dam
Water quality parameters Sites
S1 S2
Dissolved Oxygen(mg/l) 6.4 6.4
Conductivity(S/m) 43.3 43
PH 7.3 7.3
Turbidity(NTU) 4.9 5.1
Temperature(oC) 28.5 28.5
Depth(m) 35.4 46.5
NOVATEUR PUBLICATIONS
INTERNATIONAL JOURNAL OF INNOVATIONS IN ENGINEERING RESEARCH AND TECHNOLOGY
[IJIERT] ISSN: 2394-3696 Website: ijiert.org
VOLUME 8, ISSUE 6, June. -2021
134 | P a g e
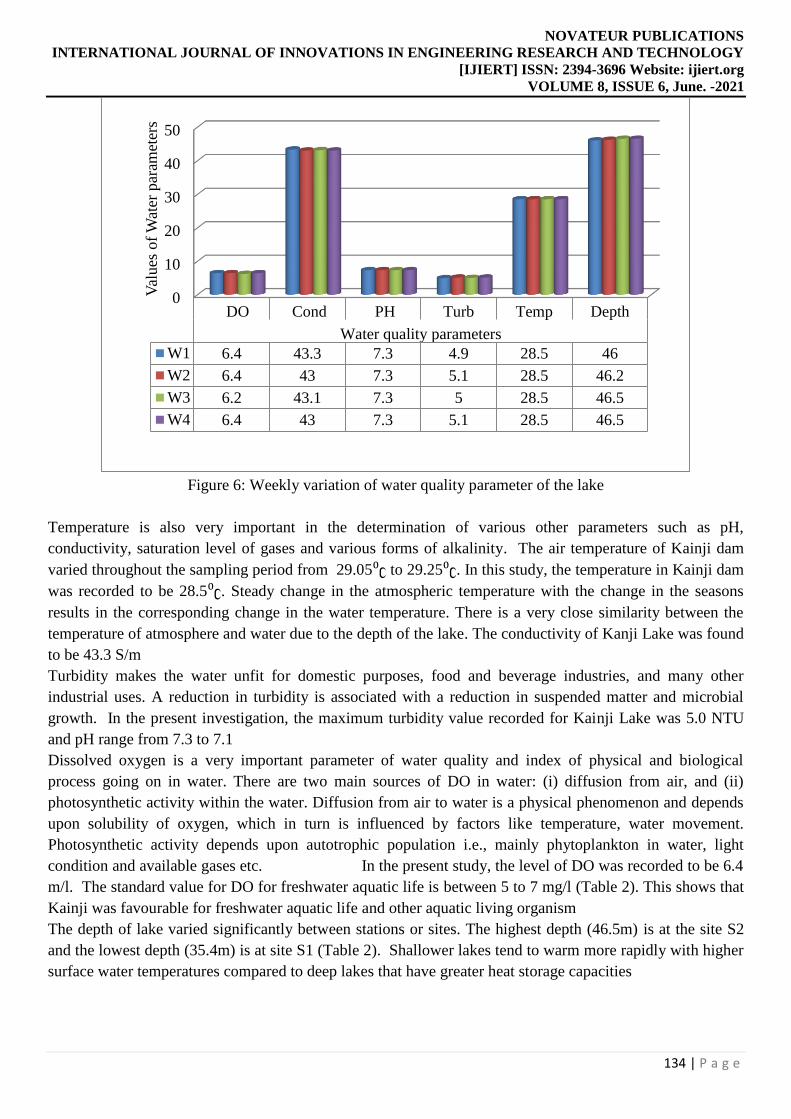
Figure 6: Weekly variation of water quality parameter of the lake
Temperature is also very important in the determination of various other parameters such as pH,
conductivity, saturation level of gases and various forms of alkalinity. The air temperature of Kainji dam
varied throughout the sampling period from 29.05⁰ʗ to 29.25⁰ʗ. In this study, the temperature in Kainji dam
was recorded to be 28.5⁰ʗ. Steady change in the atmospheric temperature with the change in the seasons
results in the corresponding change in the water temperature. There is a very close similarity between the
temperature of atmosphere and water due to the depth of the lake. The conductivity of Kanji Lake was found
to be 43.3 S/m
Turbidity makes the water unfit for domestic purposes, food and beverage industries, and many other
industrial uses. A reduction in turbidity is associated with a reduction in suspended matter and microbial
growth. In the present investigation, the maximum turbidity value recorded for Kainji Lake was 5.0 NTU
and pH range from 7.3 to 7.1
Dissolved oxygen is a very important parameter of water quality and index of physical and biological
process going on in water. There are two main sources of DO in water: (i) diffusion from air, and (ii)
photosynthetic activity within the water. Diffusion from air to water is a physical phenomenon and depends
upon solubility of oxygen, which in turn is influenced by factors like temperature, water movement.
Photosynthetic activity depends upon autotrophic population i.e., mainly phytoplankton in water, light
condition and available gases etc. In the present study, the level of DO was recorded to be 6.4
m/l. The standard value for DO for freshwater aquatic life is between 5 to 7 mg/l (Table 2). This shows that
Kainji was favourable for freshwater aquatic life and other aquatic living organism
The depth of lake varied significantly between stations or sites. The highest depth (46.5m) is at the site S2
and the lowest depth (35.4m) is at site S1 (Table 2). Shallower lakes tend to warm more rapidly with higher
surface water temperatures compared to deep lakes that have greater heat storage capacities
0
10
20
30
40
50
DO Cond PH Turb Temp Depth
Water quality parameters
W1 6.4 43.3 7.3 4.9 28.5 46
W2 6.4 43 7.3 5.1 28.5 46.2
W3 6.2 43.1 7.3 5 28.5 46.5
W4 6.4 43 7.3 5.1 28.5 46.5
Val
ues
of
Wat
er p
aram
eter
s
NOVATEUR PUBLICATIONS
INTERNATIONAL JOURNAL OF INNOVATIONS IN ENGINEERING RESEARCH AND TECHNOLOGY
[IJIERT] ISSN: 2394-3696 Website: ijiert.org
VOLUME 8, ISSUE 6, June. -2021
135 | P a g e
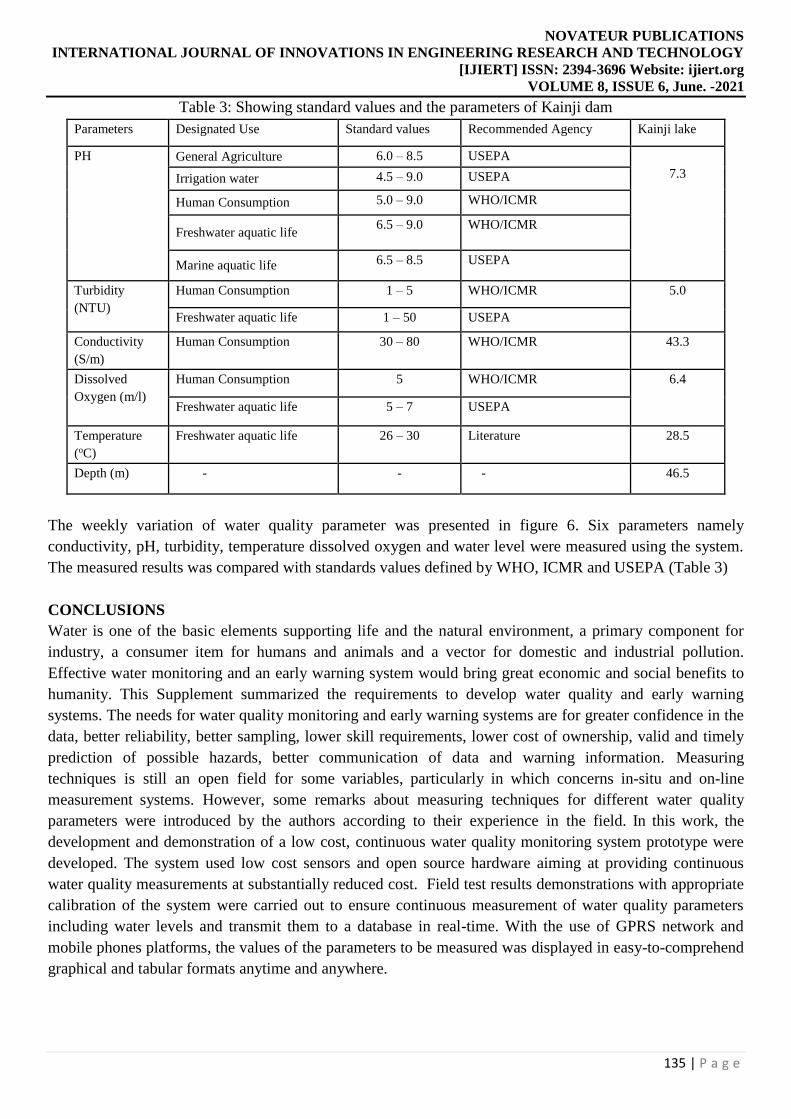
Table 3: Showing standard values and the parameters of Kainji dam
Parameters Designated Use Standard values Recommended Agency Kainji lake
PH General Agriculture 6.0 – 8.5 USEPA
7.3 Irrigation water 4.5 – 9.0 USEPA
Human Consumption 5.0 – 9.0 WHO/ICMR
Freshwater aquatic life 6.5 – 9.0 WHO/ICMR
Marine aquatic life 6.5 – 8.5 USEPA
Turbidity
(NTU)
Human Consumption 1 – 5 WHO/ICMR 5.0
Freshwater aquatic life 1 – 50 USEPA
Conductivity
(S/m)
Human Consumption 30 – 80 WHO/ICMR 43.3
Dissolved
Oxygen (m/l)
Human Consumption 5 WHO/ICMR 6.4
Freshwater aquatic life 5 – 7 USEPA
Temperature
(oC)
Freshwater aquatic life 26 – 30 Literature 28.5
Depth (m) - - - 46.5
The weekly variation of water quality parameter was presented in figure 6. Six parameters namely
conductivity, pH, turbidity, temperature dissolved oxygen and water level were measured using the system.
The measured results was compared with standards values defined by WHO, ICMR and USEPA (Table 3)
CONCLUSIONS
Water is one of the basic elements supporting life and the natural environment, a primary component for
industry, a consumer item for humans and animals and a vector for domestic and industrial pollution.
Effective water monitoring and an early warning system would bring great economic and social benefits to
humanity. This Supplement summarized the requirements to develop water quality and early warning
systems. The needs for water quality monitoring and early warning systems are for greater confidence in the
data, better reliability, better sampling, lower skill requirements, lower cost of ownership, valid and timely
prediction of possible hazards, better communication of data and warning information. Measuring
techniques is still an open field for some variables, particularly in which concerns in-situ and on-line
measurement systems. However, some remarks about measuring techniques for different water quality
parameters were introduced by the authors according to their experience in the field. In this work, the
development and demonstration of a low cost, continuous water quality monitoring system prototype were
developed. The system used low cost sensors and open source hardware aiming at providing continuous
water quality measurements at substantially reduced cost. Field test results demonstrations with appropriate
calibration of the system were carried out to ensure continuous measurement of water quality parameters
including water levels and transmit them to a database in real-time. With the use of GPRS network and
mobile phones platforms, the values of the parameters to be measured was displayed in easy-to-comprehend
graphical and tabular formats anytime and anywhere.

NOVATEUR PUBLICATIONS
INTERNATIONAL JOURNAL OF INNOVATIONS IN ENGINEERING RESEARCH AND TECHNOLOGY
[IJIERT] ISSN: 2394-3696 Website: ijiert.org
VOLUME 8, ISSUE 6, June. -2021
136 | P a g e
REFERENCES
1) Adakole, J. A., Mbah, C. E.,and Dalla, M. A. (2003). Physicochemical limnology of Lake Kubanni,
Zaria-Nigeria. Presented at the 29th WEDC International Conference, Abuja
Nigeria. http://wedc.lboro.ac.uk/resources/conference/29/Adakole.pdf.04/06/2016
2) Bernard, A. (2010). Assessing the performance of Dompoase wastewater treatment plant and its effect
on water quality of the Oda River in Kumasi. Unpublished MSc Thesis, Kwame Nkrumah University of
Science and Technology, Ghana http://wwwdatad.aau.org/handle/123456789/8636. 06/12/2015.
3) Corcoran, E., C. Nellemann, E. Baker, R. Bos, D. Osborn, H. Savelli (eds). 2010. The central role of
wastewater management in sustainable development. A Rapid Response Assessment. United Nations
Environment Programme, UN-HABITAT, GRID-Arendal. www.grida.no.ISBN: 978-82-7701-075-5.
21/05/2016
Chatterjee, S. K., Bhattacharjee, I and Chandra, G. (2010). Water quality assessment near an industrial
site of Damodar River, India. Environmental Monitoring and Assessment, February 2010, Volume 161,
Issue 1, pp 177-189
4) Chithra, S. V, Nair, M. V. H., Amarnath, A., and Anjana, N. S. (2015). Impacts of Impervious
Surfaces on the Environment. International Journal of Engineering Science Invention, 4(5),
2319–6726.
5) Choudhary, R., Rawtani, P., and Vishwakarma, M. (2011). Comparative study of Drinking Water
Quality Parameters of three Manmade Reservoirs i.e. Kolar , Kaliasote and Kerwa Dam,
Current World Environment, an International Research Journal of Environmental Science,
6(1), 145–149.
6) DWA. (2013). Republic of Botswana Botswana Integrated Water Resources Management & Water
Efficiency Plan (Vol. 1). http://www.gwp.org/Global/IWRMWEPlan.pdf. 29/07/2015.
7) Ding, J., Jiang, Y., Fu, L., Liu, Q., Peng, Q., and Kang, M. (2015). Impacts of Land Use on Surface
Water Quality in a Subtropical River Basin: A Case Study of the Dongjiang River Basin,
Southeastern China. Water, 7, 4427-4445.
Dlamini,S. Nhapi, I. Gumindoga, W. Nhiwatiwa, T and Dube, T. (2016). Assessing the feasibility of
integrating remote sensing and in-situ measurements in monitoring water quality status of Lake Chivero,
Zimbabwe. Physics and Chemistry of the Earth, 93 (2016) 2 -11
8) EHES (Pty) LTD. Consulting Engineers, Hydrologists and Environmentalists in association with
Mantswe Natural Resources (2002). Republic of Botswana Department of Water Affairs EIA study in
respect of detailed design of lower Shashe Dam final EIA report. Gaborone,
Botswana. EHES (PTY) LTD. Consulting Engineers, Hydrologists and Environmentalists.
9) He, W., Chen, S., Liu, X., and Chen, J. (2008). Water quality monitoring in slightly-polluted inland
water body through remote sensing . Guanting Reservoir , Beijing , China. Environmental Science and
Engineering (2008)1. http://citeseerx.ist.psu.edu/viewdoi=10.1.1.469.91.pdf.
26/10/2015
10) IPCC. (2008). Climate Change and Water. Climate change and water.
http://doi.org/10.1016/.2010.08.039. 21/05/2016.
11) Kadewa, W., Moyo, H. ., Phiri, O., & Mumba, P. (2005). Assessment of the Impact of Industrial
Effluents on Water Quality of Receiving Rivers in Urban Areas of Malawi, (September).
http://doi.org/10.1007/BF03325882. 02/09/2015
Kibena, J., Nhapi, I., and Gumindoga, W. (2014). Assessing the relationship between water quality
parameters and changes in landuse patterns in the Upper Manyame River, Zimbabwe. Physics and
Chemistry of the Earth, 67-69, 153–163
NOVATEUR PUBLICATIONS
INTERNATIONAL JOURNAL OF INNOVATIONS IN ENGINEERING RESEARCH AND TECHNOLOGY
[IJIERT] ISSN: 2394-3696 Website: ijiert.org
VOLUME 8, ISSUE 6, June. -2021
137 | P a g e
12) Larkin, J. (2014). Detecting Long Term Trends in Water Quality Parameters Using Remote
Sensing Techniques. Unpublished MSc Thesis. University of Illinois at Urbana-Champaign
13) Ljee,T. (2011). Revue scientifique et Technique. Décembre 2011. Revue Scientifique Et
Technique, 100–115.
14) Martinez, F. B., Mijares, M. B. B., and Galera, I. C. (2011). Assessment of the Water Quality of Mamba
River of Mts . Palaypalay / Mataasna Gulod , Southern Luzon , Philippines, 2011
presented at the International Conference on Chemistry and Chemical Process IPCBEE vol.10 (2011)
IACSIT Press, Singapore
15) Masamba, W. R. L., and Mazvimavi, D. (2006). Water Quality Thamalakane River. An outlet of the
Okavango delta. http://www.ubrisa.ub.bw/bitstream/handle/10311/740/. 06/12/2015.
16) Masere, T. P., Munodawafa, A., & Chitata, T. (2012). Assessment of human impact on water
quality along Manyame River. International Journal of Development and Sustainability, 1(3),
754–765.
17) Massoud, M. A. (2012). Assessment of water quality along a recreational section of the Damour River in
Lebanon using the water quality index. Environmental Monitoring and Assessment. 2012 Jul; 184
(7):4151-60.
18) Mero, R. (2011). Assessment of water quality and spatial distribution of the major pollutants in
Ngerengere River Catchment, Tanzania. MSc Thesis, University of Zimbabwe, Harare.
www.ir.uz.ac.zw/jspui/bitstream/10646/789/1/Rose%20thesis-27.7.11.p
19) Mladenov, N., Strzepek, K., and Serumola, O. M. (2005). Water quality assessment and modeling of an
effluent-dominated stream, the Notwane River, Botswana. Environmental Monitoring and Assessment.
http://doi.org/10.1007/s10661-005-5842-8. 06/12/2015
20) Mohamed, M. F. (2015). Satellite data and real time stations to improve water quality of Lake Manzalah.
Water Science, 29(1). http://doi.org/10.1016/j.wsj.2015.03.002. 23/11/2016
21) MRC. (2009). The Limpopo Challenge Program. Baseline Study of the water chemistry of the Limpopo
Basin : Country studies from Botswana, Mozambique, South Africa and Zimbabwe
A report prepared by the Mineral Resources Centre , University of Zimbabwe .
22) Nyakungu, T., Wuta, M., and Mudyazhezha, S. (2013). Assessment of the Impact of Waste
Disposal on the Concentration of Anions in Ruwa River , Zimbabwe, 4(2), 11–16.
23) Owa, F.D, (2013). Water Pollution : Sources, Effects, Control and Management, Mediterranean Journal
of Social Sciences, 4(8), 65–68
24) PACN (2015). Pan African Chemistry Network Ritchie, J. C., Zimba, P. V, and Everitt, J. H. (2003).
Remote Sensing Techniques to Assess Water Quality, Photogrammetric engineering and remote sensing
69(6), 695–704
25) Suthar, S., Sharma, J., Chabukdhara, M., and Nema, A. K. (2010). Water quality assessment of river
Hindon at Ghaziabad, India: Impact of industrial and urban wastewater. Environmental
Monitoring and Assessment. http://doi.org/10.1007/s10661-009-0930-9. 06/12/201
26) Tessema , Mohammed, B. T. (2014). Assessment of Physico-chemical Water Quality of Bira Dam, Bati
Wereda. J Aquac Res Development, 5(6), 1–4
27) Ullah, Z., Khan, H., Waseem, A., Mahmood, Q., and Farooq, U. (2013). Water Quality Assessment of
the River Kabul at Peshawar, Pakistan: Industrial and Urban Wastewater Impacts. Journal of Water
Chemistry and Technology, Vol. 35, No. 4, pp. 170–17
28) UNEP. (2010). Clearing the waters. A focus of water quality solutions. Nursing times (Vol. 96).
http://www.unep.org/PDF/Clearing_the_Waters.pdf. 04/06/2016.

NOVATEUR PUBLICATIONS
INTERNATIONAL JOURNAL OF INNOVATIONS IN ENGINEERING RESEARCH AND TECHNOLOGY
[IJIERT] ISSN: 2394-3696 Website: ijiert.org
VOLUME 8, ISSUE 6, June. -2021
138 | P a g e
29) Usali, N and Hasmadi Ismail, M. (2010). Use of Remote Sensing and GIS in Monitoring Water Quality.
Journal of Sustainable Development, 3(3). pp. 228 – 238
30) Wagner, P. D., Kumar, S and Schneider, K. (2013). An assessment of land use change impacts on the
water resources of the Mula and Mutha Rivers catchment upstream of Pune, India. Hydrology and Earth
System Sciences, 17(1), 2233–2246
31) Walakira, P and Okot-okumu, J. (2011). Impact of Industrial Effluents on Water Quality of
Streams in Nakawa-Ntinda, Uganda. Applied Science Environmental Management, 15 (2)
289 – 296
32) Yaakub, A., Norulaini, N and Ab, N. (2012). Water Quality Status of Kinta River Tributaries Based on
Land Use Activities, 33,
Copyright © 2022 FDOKUMEN