implementation of a training program in the use of the electronic
92
IMPLEMENTATION OF A TRAINING PROGRAM IN THE USE OF THE ELECTRONIC MEDICAL RECORD TO IMPROVE PERFORMANCE ON QUALITY MEASURES AND REDUCE BURNOUT AMONG HEALTHCARE PROVIDERS By Mary M. Nara Bachelor of Science in Nursing Ursuline College 1997 Master of Science in Nursing University of Nevada, Las Vegas 2003 A doctoral project submitted in partial fulfillment of the requirements for the Doctor of Nursing Practice School of Nursing The Graduate College University of Nevada, Las Vegas May 2020
-
Upload
khangminh22 -
Category
Documents
-
view
5 -
download
0
Transcript of implementation of a training program in the use of the electronic
IMPLEMENTATION OF A TRAINING PROGRAM IN THE USE OF THE ELECTRONIC
MEDICAL RECORD TO IMPROVE PERFORMANCE ON QUALITY MEASURES
AND REDUCE BURNOUT AMONG HEALTHCARE PROVIDERS
By
Mary M. Nara
Bachelor of Science in Nursing
Ursuline College
1997
Master of Science in Nursing
University of Nevada, Las Vegas
2003
A doctoral project submitted in partial fulfillment
of the requirements for the
Doctor of Nursing Practice
School of Nursing
The Graduate College
University of Nevada, Las Vegas
May 2020
ii
Doctoral Project Approval
The Graduate College
The University of Nevada, Las Vegas
March 31, 2020
This doctoral project prepared by
Mary M. Nara
entitled
Implementation of a Training Program in the Use of the Electronic Medical Record to
Improve Performance on Quality Measures and Reduce Burnout among Healthcare
Providers
is approved in partial fulfillment of the requirements for the degree of
Doctor of Nursing Practice
School of Nursing
Kathryn Hausbeck Korgan, Ph.D. Graduate College Dean
Alona D. Angosta, Ph.D. Examination Committee Chair
Cheryl Maes, Ph.D. Examination Committee Member
Jay Shen, Ph.D. Graduate College Faculty Representative
iii
Abstract
Rapid adoption and implementation of the electronic medical record (EMR) in health
care has contributed to worsening burnout among healthcare providers (HCPs), particularly
primary care physicians. Other HCPs such as nurse practitioners (NPs) and physician assistants
(PAs) who provide primary care have been equally affected by the increased clerical burden
related to the increasing documentation requirements from payers and are at risk for burnout.
Rates of burnout in NPs are currently not well known. Burnout has been linked to decreased
quality of care for patients. Inadequate training and lack of skills in the use of the EMR have
contributed to HCP and burnout. Lack of awareness of specific quality measures and lack of
documentation of clinical quality outcome measures have affected provider, organizational and
health plan performance in value-based payment models.
The purpose of the Doctor of Nursing (DNP) project was to implement a training
program for HCPs to increase EMR functionality to improve performance on quality measures
and ultimately, quality of care. Improving efficiency through training and improvement of
workflow is part of an ongoing support for HCPs to reduce information technology-related
stress and burnout. The project’s setting was a local medical group in the southwest part of
the United States consisting of physicians, NPs, and PAs. The medical group participated in
value-based payment models and significant revenue was dependent on how well the clinical
quality measures were met.
The technology acceptance model (TAM) was the theoretical framework used for
development of the training program content. The model positively related use of a
technology application to the user’s perception of ease of use and perception of usefulness.
The Maslach multidimensional theory of burnout provided the theoretical basis for the construct
iv
of the burnout phenomenon. The Physician Work-Life Single Item Questionnaire was developed
from this theory and was used to assess perceived burnout among healthcare providers.
Twenty-four participants completed an online survey assessing perceived ease of use
and usefulness, self-reported skill and use of the quality functionality, and perceived burnout.
HCPs in the medical group (n =33) attended one of three training sessions led by the DNP
student. The training sessions took place between September 1, 2020 and October 4, 2020.
The training included a brief presentation followed by demonstration of click by click
workflows for use of the quality tab function and quality measure report. An evaluation tool
based on the Kirkpatrick model was completed by the providers immediately following the
training session. Participants completed the same online survey following completion of the
training program. Performance reports for the medical group as a whole were obtained prior
to the training implementation and then again following completion of healthcare provider
training.
Descriptive statistics and independent t-test were used to analyze data obtained from
the pre- and post-implementation surveys. Results showed improvement in self-reported skill
in the use of the quality functionality in the EMR. The evaluation tool responses indicated
participants felt the training was appropriate in content, applicability, and presentation. The
learning objectives were felt to be relevant and the learning objectives of the training session
were achieved. Perceived burnout did not demonstrate a statistically significant change in this
small sample. There were small improvements in performance on most of the nine quality
measures, most significantly on microalbumin/creatinine ratio for diabetics.
This DNP project supported that HCPs related EMR stress to increasing burnout. The
training program was successful in achieving its learning objectives, but performance

v
measures did not improve as much as hoped, perhaps due to the rapid new patient visit
volume seen by the medical group and records lag. The conclusion was system changes and
ongoing organizational support for reducing clerical burden for HCPs were needed to truly
address burnout, so HCPs are able to provide high quality care and improved outcomes for
their patients.
vi
Acknowledgements
I would like to extend my gratitude to the Chair of my Committee, Dr. Alona Angosta,
Ph.D., APRN, whose guidance and support throughout my DNP journey proved to be invaluable.
Special thanks as well to Dr. Cheryl Maes, Ph.D., APRN and Dr. Jay Shen, Ph.D. for their
participation in my project committee. Dr. Huaxin Song, Ph.D. graciously spent many hours
helping me with data management and analysis so that the best possible results were captured.
Thank you for your patience, Dr. Song. Many thanks to Joy Ramiro for all your help with the
IRB. Finally, I would like to thank Elizabeth Gardner for putting up with my incessant emails
and helping me get through the whole program.
I would also like to acknowledge Tracy Wakefield, MD whose support removed many
barriers for the implementation of my project in the medical group. Jeffery Wagner, MD, Excel
Wizard, assisted me greatly with data organization and management. I am grateful for the
support and encouragement from my colleagues, Roopa Dani, MD and Ashley McDowell, PA-C
and the rest of the team at the “Best Sunset” clinic. Another big thank you to all my colleagues
who participated in my project.
Finally, thank you to my family, Kirk and Natalie, for allowing me the time to pursue and
complete this degree.
vii
Table of Contents
Abstract .................................................................................................................................. iii
Acknowledgements ................................................................................................................ vi
List of Tables ......................................................................................................................... x
List of Figures ........................................................................................................................ xi
Chapter I: Introduction ............................................................................................................. 1
Significance of the Problem ............................................................................................. 4
Problem Statement........................................................................................................... 5
Purpose Statement ........................................................................................................... 7
Chapter II: Review of Literature .............................................................................................. 8
Electronic Medical Record Adoption ............................................................................. 8
Needs Assessment and Description of the Project ........................................................ 18
Project Sponsors and Key Stakeholders ........................................................................ 18
Organizational Assessment ............................................................................................. 19
Scope of the Project ......................................................................................................... 19
Goals and Objectives of the Project ............................................................................... 20
Chapter III: Theoretical Underpinning .................................................................................... 22
Technology Acceptance Model ....................................................................................... 22
Maslach Multidimensional Theory of Burnout ............................................................. 24
Chapter IV: Project Plan .......................................................................................................... 27
Setting................................................................................................................................ 27
Population of Interest ...................................................................................................... 27
Measures, Instruments, and Activities ........................................................................... 28
viii
Timeline and Project Tasks............................................................................................. 31
Personnel ........................................................................................................................... 31
Resources and Supports .................................................................................................. 31
Risks and Threats ............................................................................................................ 32
Financial Plan ................................................................................................................... 32
Institutional Review Board ............................................................................................. 33
Evaluation Plan ................................................................................................................ 33
Chapter V: Summary of the Implementation and Results ...................................................... 35
Precis of the Phenomenon of Interest, Problem, and Purpose of the Project ........... 35
Threats and Barriers ...................................................................................................... 35
Monitoring the Project ................................................................................................... 36
Data Collection and Analysis ......................................................................................... 36
Results of the Project ..................................................................................................... 38
Qualitative Data .............................................................................................................. 42
Limitations ...................................................................................................................... 44
Discussion ........................................................................................................................ 44
Relation to Literature and Theory ................................................................................ 46
Contribution and Potential for Sustainability ............................................................. 48
Utilization and Dissemination of Results...................................................................... 51
Conclusion ....................................................................................................................... 51
Appendix A: Provider Demographics Survey Tool ................................................................. 53
Appendix B: Perceived Usefulness and Perceived Ease of Use Survey Questions ................. 54
Appendix C: Physician Work-Life Single Item Questionnaire ............................................... 57
ix
Appendix D: Project Evaluation .............................................................................................. 58
Appendix E: Creating a Performance Report on Quality Measures ........................................ 62
Appendix F: Step by Step Training Guide for Quality Tab Functions .................................... 63
Appendix G: Tables 6 and 7 .................................................................................................... 69
References ................................................................................................................................ 72
Curriculum Vitae……………………………………………………………………………..81
x
List of Tables
Table 1 Demographics ............................................................................................................. 38
Table 2 Self-Assessment of Burnout ......................................................................................... 39
Table 3 Self-Reported Electronic Medical Record Skill and Use of Quality Tab
Functionality ............................................................................................................................ 40
Table 4 Results of Training Evaluation Questionnaire ........................................................... 41
Table 5 Pre and Post Implementation Performance Report on Quality Measures ................. 41
Table 6 Sample Performance Report on Quality Measures .................................................... 69
Table 7 Detailed Project Timeline and Procedures ................................................................ 70

xi
List of Figures
Figure 1. Technology acceptance model ................................................................................. 23
Figure 2. Maslach multidimensional theory of burnout’s six areas of job-person fit
(Maslach & Leiter, 2016) ......................................................................................................... 25
1
Chapter I: Introduction
Occupational burnout is an alarmingly common problem among healthcare providers
(HCPs). First coined in the 1970s, burnout (2018) is currently defined by Merriam Webster
Dictionary as “exhaustion of the physical and emotional strength or motivation usually
because of prolonged stress or frustration” (Def.2a). Maslach and Leiter (2016) defined
burnout as a psychological syndrome that involved an individual’s response to prolonged stress.
They identified three key dimensions of burnout: “overwhelming exhaustion, feelings of
cynicism and detachment from the job, and a sense of ineffectiveness and lack of
accomplishment.” (Maslach & Leiter, 2016, p. 103). The primary impact of burnout is on the
mental health of the HCP, herein to include physicians, NPs, and PAs, but the secondary
impact is on patients and the healthcare system. Jha et al. (2018) described burnout as a crisis
and stated one cannot have a high-performing healthcare system if healthcare providers within
it are not well themselves.
According to the Institute for Healthcare Improvement (IHI; 2018), the Triple Aim in
health care refers to a national initiative to improve the patient experience of care, improve
the health of populations, and reduce the per capita cost of health care. Implementation of
health information technology, primarily the electronic medical record (EMR), was mandated
in 2009 with the Health Information Technology for Economic and Clinical Health (HITECH)
Act. This was critical to achieve the Triple Aim because of the potential of shared information,
clinical decision support, and data for research and tracking of population health. The term
meaningful use was defined by Centers for Medicare and Medicaid Services (CMS, 2010) as
using certified EMR technology in a manner that provides for the electronic exchange of health
information to improve quality of care. It requires that HCPs submit information on quality of
2
care to the Secretary of Health and Human Services (Centers for Disease Control and Prevention
[CDC], 2019).
Providing expanded access and data management have increased the burden of work
for primary care providers, contributing to burnout. The implementation and use of the EMR
are frequently cited as significant contributors to healthcare provider burnout. The EMR was
fully implemented in the majority of outpatient medical settings (72%) only in 2012 and is
still evolving (Babbott et al., 2014). The perception is that the HCP was mandated to perform
many administrative functions in the EMR including data entry, i.e., medical histories,
documentation, order entry, and a variety of other tasks. These administrative tasks are time-
consuming and are generally and more appropriately in the scope of other clerical staff.
Shanafelt et al. (2016) reported that about 85% of physicians were using an EMR but 43.7%
were dissatisfied with the amount of time spent on clerical tasks. Additionally, 41%
disagreed that EMR improved patient care, 62.5% disagreed that EMR improved efficiency,
and nearly half believed the amount of time they spent in EMR functions was unreasonable.
(Shanafelt et al., 2016).
The EMR implementation process influences HCPs’ views and use of the EMR with
training one of the most frequently cited factors in the literature (O’Donnell, Kaner, Shaw, &
Haighton, 2018). Inadequate training was identified as an important barrier to EMR use.
Downing-Peck (2013) pointed out that most training was completed in block sessions by
reviewing large amounts of EMR function and capability in a very short period. Retention of
this information by providers was poor. This might lead to increased frustration for HCPs.
Rosemarie Nelson, a healthcare information technology (HIT) expert, stated, “Ask any physician
3
or nurse about the training they received on their EMR and most will express dissatisfaction,
unhappiness or harsh complaints” (McBride, 2012, p. 41).
Studies also supported the need for ongoing training after implementation of the EMR
(O’Donnell et al., 2018). Training in the EMR introduced system features and functionality that
assisted the user to understand how the system was applied and leveraged in clinical practice,
improving provider engagement and decreasing risk of burnout. Edwards, Kitzmiller, and
Breckenridge-Sproat (2012) stated that user training in health information technology is integral
to effective use in care settings. The EMR is a powerful tool with the potential to improve
quality, reduce cost, and increase patient safety. Effective use could support a medical group’s
participation in payers’ new reimbursement models but only if HCPs were well-trained in how to
use that technology (McBride, 2012). With technology and the EMR constantly evolving, there
is a need not only for adequate training of users during implementation but ongoing training to
improve HCPs’ skills in daily workflow tasks. The recent call to action to address the crisis of
physician burnout identified three priority areas for improvement. Pertinent to the phenomenon
of interest, Jha et al. (2018) called for an ongoing commitment to reducing burnout by reducing
clerical burden of documentation and measurement in the EMR as well an increasing physician
engagement in the design and implementation of health information technology.
It is important to include HCPs in the implementation and development of workflows
within an EMR as well as in the ongoing training for HCPs. Workflow in the EMR is a sequence
of steps involved in completing a task. HCPs have unique knowledge of the workflow, clinical
needs of their patients, and performance measures of their practice or organization. HCPs are
ultimately held accountable for documentation and quality of patient care. Increasingly,
reimbursement will be tied to pay-per-performance on quality measures. HCPs must be able to
4
document efficiently and accurately to achieve meaningful use as mandated by CMS (2010).
McBride (2012) and Downing-Peck (2013) both highlighted the strategy of establishing EMR
superusers within a practice to provide ongoing education to other HCPs at regular intervals.
They also advocated for small, focused, hands-on training completed in shorter time frames (less
than 10 minutes) on EMR functions of high priority to HCPs.
Significance of the Problem
Current rates of burnout are well documented among physicians, ranging from 30 to
78% and varying among gender, age, and specialty. Recent surveys found rates of physician
burnout between 48-49% with family practice and internal medicine practitioners ranked in
the top five (Medscape, 2019). Shanafelt et al. (2016) reported that 63% of family practice
physicians were experiencing burnout. Rates of burnout among physicians are higher than in
the general population and can have adverse effects on the personal lives of physicians ,
contributing to broken relationships, substance abuse, depression, and suicide (Shanafelt et
al., 2012).
The economic cost of burnout is challenging to quantify and only recently has begun to
be formally investigated. Han et al. (2019) provided a conservative estimate of $4.6 billion/year
directly attributable to physician burnout including physician turnover and lost productivity. At
a mesosystem or organizational level, this translates to a cost of $7.600 per physician per year.
Indirect costs such as reputation, effect on other team members, and quality of patient care were
unable to be captured. The authors provided metrics demonstrating the substantial cost of
physician burnout. They suggested there was economic value for expenditures in the macro and
mesosystems to address and mitigate physician burnout (Han et al., 2019).
5
Evidence also linked burnout to decreased quality of care with increasing levels of
burnout correlating to increased risk of medical error (Wallace, Lemaire, & Ghali, 2009; West et
al., 2006). Improving patient experience with the healthcare system is also part of the Triple
Aim. Studies have shown a positive relationship between burnout and suboptimal patient care
behaviors such as lack of empathy, decreased response to patient questions, and less thorough
discussion of treatment options (Shanafelt, Bradley, Wipf, & Back, 2002; Williams, Manwell,
Konrad, & Linzer, 2007)
Fewer studies have included NPs and PAs even though these providers perform a
significant percentage of patient care in the United States. Roles and responsibilities of the NP,
for example, are comparable to those of physicians, especially in primary care. According to the
American Academy of Nurse Practitioners (2019), 87% of NPs are providing primary care with
the number of NPs increasing to more than 270,000. Thus, it would be a reasonable conclusion
that NPs are also at risk for burnout. Harris, Haskell, Cooper, Crouse, and Gardner (2018)
published one study in which about 50% of NPs agreed the EMR added to frustration with about
33% reporting insufficient time for documentation. While physician studies were more
numerous and robust, the outcomes might be applicable to NPs given the similarity of roles.
Problem Statement
Quality health care is a high priority for the Centers for Medicare and Medicaid
Services (2018). Quality measures are tools that quantify healthcare processes, outcomes, and
systems associated with quality goals in health care. A 2018 report from CMS assessed the
impact of quality measures on patient outcomes and indicated improved blood pressure
control, improved diabetes control, fewer hospitalizations, and fewer readmissions would
avoid an overall cost of about $47 billion. Ideally, all users would utilize the functionality
6
and workflow established by the EMR system (Athena) to document and manage each quality
measure for each patient on their panel.
Currently, there are few HCPs in a medical group located in the southwest part of the
United States who are utilizing the quality measures function in the EMR (Athena). Initial
training on EMR did not elaborate on nor emphasize the workflow functionality of the quality
measures in Athena. Therefore, it was not incorporated in the routine workflow of HCPs for
each patient encounter. The full capability of the quality measures function is powerful. If
utilized, it would decrease manual entry of data and provide timely alerts, assisting the HCP
to optimize patient outcomes and thereby improve quality of care and reduce risk of burnout.
Importantly, organizational reports on quality measures largely utilize the information from
this quality function. If measures are not documented in an accurate and appropriate manner,
the actual performance of an HCP on quality measures would not be accurately portrayed to
the organization nor payers and CMS (2018).
Healthcare providers’ lack of knowledge of quality functions in the EMR is a barrier to
effective management of the quality measures for their patient panel. Poor understanding of
this function and how it would affect themselves as well as their patients could contribute to
low use of EMR functionality and potentially increase risk of burnout. Some quality
functions in EMR (Athena) require manual data entry, which is in the scope of other clinical
staff such as HCP’s’ medical assistants. Ideally, providers and their assistant would co-
manage the quality functions. Data entry could be delegated to the team while the HCP
focuses on clinical decision-making and ordering. This would further decrease clerical
burden on the provider in alignment with the goal of reducing provider burnout related to the
EMR.
7
Purpose Statement
The purpose of the Doctor of Nursing (DNP) project was to increase the use of
functionality in the EMR to improve performance on quality measures and quality of care
through implementation of a training program for HCPs. Their perceptions of EMR
efficiency and burnout were also evaluated.
8
Chapter II: Review of Literature
Electronic Medical Record Adoption
Due to financial incentives and regulatory changes, the EMR has been adopted in most
healthcare settings and has become the primary electronic and communications system in the
healthcare system. This is often perceived as an macrosystem factor outside of a provider’s
control. Gold and McLaughlin (2016) provided a global evaluation of the impact of the
HITECH Act, a policy enacted in 2009 that promotes the adoption and use of the EMR to
improve quality of care and decrease healthcare costs. The goals of the HITECH Act are
improved individual and population outcomes, increased transparency and efficiency, and
improved ability to study and enhance care delivery (Gold & McLaughlin, 2016).
One of the central concepts of the HITECH Act (2009) is to encourage meaningful use of
EMRs with the intent of changing how care is delivered and how patients and HCPs interact.
Implementation of the policy occurred in a short time frame on multiple fronts. Federal funding
was allocated for adoption of the EMR to offset some of the cost. Support for the exchange of
health information at the state and local levels was put in place. Programs were developed to
spur research around security of health information, patient centered support, network
architecture, and the use of EMRs to illustrate the value of meaningful use of health information
technology to improve health outcomes. Meaningful use was implemented in three stages. Gold
and McLaughlin (2016) noted the stages for meaningful use took longer than anticipated;
challenges were created by lack of interoperability and differences in capabilities between
current and early EMRs. Meaningful use requirements move reimbursement toward value-based
payment models. The Medicare Access and Child Health Insurance Program (CHIP)
Reauthorization Act of 2015 (MACRA) mandates integration of meaningful use for the incentive
9
payment system. While most HCPs have access to systems that meet meaningful use criteria,
many do not use these capabilities and it is unclear if there is provider support for these functions
in the EMR. Gold and McLaughlin concluded federal legislation is a powerful stimulus for
change but to ultimately be successful, health information technology must satisfy the users that
its functionalities address the goals of the policymakers to promote better care, improve
outcomes, and reduce costs. The exchange infrastructure and current EMR functionalities fall
short in their ability to support reform initiatives. Ideally, the infrastructure and systems would
have been established prior to employing it to support delivery reform but currently HCPs are
being asked to do both at once (Gold & McLaughlin, 2016).
As demonstrated above, delivery of high-quality primary care by all HCPs is paramount
to improving the patient health and outcomes as well as decreasing cost. This has been
supported by recent legislature including the HITECH Act (2009), the Affordable Care Act
(2010), and MACRA (2015). The CMS has set many quality measures and practices are
required to report them. Reimbursement is increasingly tied to performance on quality measures.
Meehan, Kelvey-Albert, Van Hoof, Ruth, and Petrillo (2014) examined to what extent primary
care practices were utilizing the EMR toward quality improvement. Despite impressive
increases in adoption of EMR systems and achievement of selected meaningful use objectives
since HITECH implementation, they found most primary practices were not ready to bring about
improvement in processes or outcomes of care as they did not have the required quality
improvement knowledge or skill. Healthcare providers have not implemented the appropriate
quality improvement-related EMR processes and faced numerous barriers to quality
improvement. The most common barriers were inadequate number of support staff and
insufficient knowledge and skill of quality improvement capabilities and functionality (Meehan
10
et al., 2014). This is important for all HCPs as payers continue to move toward pay-for-
performance and away from fee-for-service models of payment. Furthermore, the Meehan et al.
study demonstrated that few practices used electronic data consistently to measure performance.
Patient-centered medical homes were found to be more likely to be utilizing data and receiving
financial reimbursement for performance on quality measures. Although not directly measured,
it was noted the primary motivation for adoption and use of health information technology to
meet meaningful use criteria was financial incentives. The study concluded quality of care in the
primary care setting would be improved by formal alignment of EMR processes as well as
ongoing technical assistance to practices (Meehan et al., 2014).
Burnout and the Use of Electronic Medical Record
The EMR is a digital version of the patient chart and contains all the traditional
information about a patient that would be found in a paper chart including medical history,
allergies, treatments, and medications. The EMR has replaced the paper chart in the majority
of primary care practices within the last decade and has been linked to increasing rates of
burnout in HCPs.
Burnout (2018) is defined as “exhaustion of the physical and emotional strength and/or
motivation usually because of prolonged stress or frustration” (Def.2a). Healthcare providers
are professionals particularly at risk for burnout due the nature of their work. Three
recognized dimensions of the burnout experience are exhaustion, cynicism, and inefficacy.
The exhaustion dimension is usually described as loss of energy, fatigue, and depletion. The
cynicism dimension involves feelings of depersonalization, irritability, negative attitudes
toward clients, and loss of idealism. Inefficacy refers to perceptions of reduced productivity
and capability, low morale, and inability to cope (Maslach & Leiter, 2016). Contributors to
11
burnout include workload and lack of control while autonomy and reward are associated with
less burnout. Impacts of burnout in HCPs include erosion of professionalism, decreased
quality of care, and increased risk of medical error (Shanafelt et al., 2016). Since
implementation of the EMR, level of burnout among HCPs has increased dramatically.
Physicians identify EMR as an important contributor to burnout. Electronic medical records
contribute to burnout for several reasons including challenges in navigating the systems
efficiently, the amount of data that might be accessed, and the increased number of clerical
tasks. Health information technology stress is measurable and independently predictive of
burnout, especially in primary care physicians (Gardner et al., 2019). Most of the research
around burnout and the EMR has focused on physicians. Over 50% of family practice and
internal medicine providers have reported symptoms of burnout (Shanafelt et al., 2016). It is
unknown if NPs experience the same problem.
Over 80% of NPs are employed in primary care and comprise a crucial segment of the
healthcare workforce in this area as the physician shortage continues to grow (Hoff, Carabetta, &
Collinson, 2019). Nurse practitioners are required to utilize the same health information
technology as their physician colleagues but very few studies have examined the effect of EMR
on burnout in this population (Hoff et al., 2019). Since the roles and responsibilities of the NP in
primary care mirror those of the physician provider, it is useful to examine the available
literature to apply what has been learned with the physician population to the practice of NPs
who are also at risk for burnout.
The body of research associated with burnout and the EMR really began with Linzer et
al.’s (2005) study entitled Minimizing Error, Maximizing Outcome (MEMO. The MEMO study
sought to evaluate the impact of structure and culture in the primary care workplace on physician
12
stress and burnout as well as the quality of care experienced by their patients. Key findings from
their study included a positive correlation between organizational climate and negative reactions
among physicians. Organizational factors included insufficient resources, diminished trust, and
perceived loss of control in the workplace--all of which contributed to negative physician
responses. Chaotic work environment emerged as a strong, independent predictor of physician
stress and job dissatisfaction. Increased stress was correlated with increased risk of error by the
participants. It was concluded that safety in primary care would be improved by using
information systems, fostering cultures that prioritized quality of care, and improving the hectic
work environment (Linzer et al., 2005).
Babbott et al. (2014) used data from the MEMO study to examine the EMR as a
contributor to chaotic work environments, physician stress, and patient outcomes. The level of
EMR function was assessed and then the number of functions was correlated to measures of
physician stress and burnout. The investigators then examined practice characteristics like
productivity expectations that created time pressure and physician work control since these
factors could modify the correlation between the EMR functions and physician stress. Time
pressure was perceived when there was a mismatch between amount of work required and time
allotted in which to complete the work. Findings reinforced the MEMO findings—that
organization cultures that emphasized quality, communication, workplace cohesiveness, and
alignment of goals between physicians and leadership were correlated with lower levels of
physician stress, burnout, and job dissatisfaction (Babbott et al., 2014). They concluded that
moderate quantities of EMR functions were associated with increased stress and less satisfaction.
Physicians in the high EMR function clusters were found to have higher levels of stress and
dissatisfaction. Time pressure was found to be positively related to physician stress, burnout,
13
and intent to leave the practice but only for physicians who had a high number of functions in the
EMR (Babbott et al., 2014).
Multiple other studies provided evidence for the association between EMR use and
provider burnout. Primarily, clerical burden, time requirements, and distraction from patient’s
care were noted as the most frequent issues that produced stress and decreased satisfaction
(Ardnt et al., 2017; Harris et al., 2018; Shanafelt et al., 2016). Studies of primary care physicians
found that HCPs spent more time working in the EMR than face-to-face time with patients with
the majority also working during lunch and after hours to complete their work (Tai-Seale et al.,
2017; Young, Burge, Kumar, Wilson, & Ortiz, 2018). In their qualitative study, Spinelli,
Fernstrom, Britt, and Pratt (2016) sought to understand the lived experiences of HCPs and their
perceptions of its causative factors. Three major themes evolved: the perceived impact of the
work environment, work tasks, and “e-stress.” Three competing tensions that contributed to
provider burnout were described as originating from clinician experience of management
practices, tension between direct patient care and non-direct patient care work tasks, and “e-
stress” caused by the digital presence in HCPs’ work lives (Spinelli et al., 2016).
Electronic Medical Record Training
Lack of training during EMR adoption and on a continuing basis plays an important role
in an HCP’s lack of satisfaction with EMR and poor work-life balance further contributing to
burnout. A systematic review by Boonstra and Broekhuis (2010) developed a taxonomy of
barriers to EMRs. Under the technical category, lack of computer skills and lack of training and
support as well as complexity of the EMR were found to be significant barriers to effective
adoption and use. Under the time category, providers consistently were found to spend a great
deal of time and effort to learn the EMR, slowing their workflow and increasing the workload.
14
Furthermore, research showed mastery of the EMR would improve efficiency, indicating most
HCPs had not been able to achieve this level of skill. The literature also supported that change
process and lack of leadership were significant barriers for HCPs during and after
implementation of an EMR (Boonstra & Broekhuis, 2010). Many HCPs were forced to change
their own unique working styles when EMRs were implemented. Organizations that strongly
supported HCPs with adequate time and training and utilized EMR “champions” to influence,
encourage, and lead the implementation fared better in this change process (Boonstra &
Broekhuis, 2010).
Miller and Sims (2004) summarized that the greatest financial and quality benefits of
EMR were realized when HCPs used EMR capabilities. Currently, physicians only utilize a
fraction of available EMR capabilities, resulting in achieving only a fraction of the potential
quality and financial benefits. Additional training and support are needed to transform low end
EMR users into advanced users who are able to maximize efficiency and benefits (Miller &
Sims, 2004). A more recent study by Paré et al. (2015) found most primary care providers did
not use available advanced functionalities in their EMR systems.
Most past studies on EMR training focused on the needs of users during implementation
but new users were often overwhelmed and achieved only basic proficiency rather than
efficiency and mastery. The requirements for meaningful use now require additional knowledge
in the EMR, particularly functionality, to improve population health and pay-for-performance.
Interventional studies are now underway to explore the effect of ongoing training utilizing a
variety of methods. A blended learning method was used in a study at Kaiser Permanente by
Bredfeldt, Awad, Joseph, and Snyder (2014). The content of training was decided upon based on
analysis of EMR support requests from providers. The training focused on improving HCPs’
15
skills at daily workflow tasks. Training was led by a physician with advanced EMR skills and
included hands-on exercises. Data were extracted from the EMR itself and from study
participants. The study demonstrated that ongoing training might increase the use of specifically
taught EMR functionality and improved two key EMR skills integral to meaningful use
(Bredfeldt et al., 2014).
Provider Burnout Related to Electronic Medical Record
The EMR contribution to HCP burnout is a relatively new area of interest and research.
Inconsistencies have been reported regarding the rates of burnout among physicians and very
little data are available for NPs and other primary care providers (Hall, Johnson, Watt, Tsipa, &
O’Connor, 2016; Medscape, 2019; Shanafelt et al., 2016). Burnout is a multifactorial
phenomenon. Thus, it is challenging to quantify how heavily the EMR contributes to burnout;
however, the literature supported a positive correlation. Organizational culture is also associated
with levels of burnout (Babbott et al., 2014; Ehrenfeld & Wanderer, 2018; Linzer et al., 2005;
Williams, Manwell, Konrad, & Linzer, 2007).
Literature on HCP burnout generally involved cross sectional studies and longitudinal
studies are needed. Few studies have assessed long-term and post intervention effects.
Additional research is needed to understand consequences of physician burnout on patient
outcomes and safety, physician practice behaviors, healthcare costs, and population management.
Most studies shared similar weaknesses including voluntary samples and self-report. Causality
between physician reports of increased tendency to err and actual error rates and patient outcome
could not be established (West, Dyrbye, & Shanafelt, 2018). Hall et al. (2016) reported in a
systematic review that most studies found poor wellbeing and moderate to high levels of burnout
16
were associated with poor patient safety measures such as medical error. However, there was a
lack of prospective studies (Hall et al., 2016).
There are many gaps in knowledge regarding the best way to train HCPs in the EMR.
Few data were available for ongoing EMR support after initial training and most focused on the
technology–not the individual users. Dastagir et al. (2012) surveyed providers and found the
clear majority favored peer-led training. They implemented an intensive training program led by
healthcare providers who were superusers of the EMR. The training included both didactic and
hands-on methods. The authors found significant improvement in EMR efficiency and
satisfaction as well as significant improvement in self reports of job satisfaction and work-life
balance following completion of the training program (Dastagir et al., 2012).
Continuing their work from the Physician Work Life Study, Linzer et al. (2015)
completed the Healthy Workplace Study. In this study, the authors hypothesized that measures
of burnout would decrease with improved communication between clinicians and organization
leaders about work conditions as well as implementing quality improvement projects and
targeted workflow improvements. One workflow improvement in the study was decreasing
clinician data entry in EMR by training and utilizing medical assistants for this task. Quality
improvement projects included setting up dashboards for the clinicians including key metrics for
their patient panels and implementing regular meetings to discuss patient cases, review metrics
and performance, and improve collegiality. These organizational changes were found to reduce
stress and improve burnout in HCPs in the study. The intervention with the strongest effect was
redesigning clinician-identified inefficient workflow. Quality improvement projects addressing
achievement of pay for performance quality measures, an area challenging to HCPs, also
improved clinician wellbeing in this study (Linzer et al., 2015)
17
Robinson and Kersey (2018) described the education approach that was implemented at
Kaiser Permanente to address retention and reinforcement of training as well as HCP burnout
related to time spent in the EMR. The goal was to ensure high quality documentation and reduce
stressors linked to physician burnout. They developed a strategy for EMR advanced training to
reduce EMR time by five minutes per hour, improve EMR skills among HCPs, and educate them
about wellness. Most of the training was presented electronically but there were didactic
sessions as well. Instruction used very interactive methods such as demonstration, group
discussion, and hands-on practice. The education interventions were continuously analyzed
using a combination of real time feedback, surveys at end of day and post activity, as well as
performance data tracked in the EMR. Multiple variables were tracked including clinical
performance, patient safety, quality of care, as well as HCP wellness. The authors concluded
that optimizing HCP skills had a significant impact on patient safety and lessened the burden of
daily EMR workload and time spent interfacing with the EMR. Combining EMR education with
wellness approaches resulted in improved performance and well-being (Robinson & Kersey,
2018).
Relatively few studies have examined advanced training in EMR and its impact on
meaningful use in the EMR and HCP burnout. Continued training is required to improve
efficient and effective use of the EMR, which should theoretically improve quality of care,
reduce health care costs, and decrease burnout among HCPs. Studies consistently recommended
using provider superusers to train their peers but differed in how that training was delivered
(Panagiotti et al., 2017; Pantaleoni, Stevens, Mailes, Goad, & Longhurst, 2015).
Provider training on advanced EMR functionality after initial implementation has been
demonstrated to increase performance and improve job satisfaction among HCPs. Value-based
18
models require much documentation about quality measures but most HCPs’ knowledge and use
of these EMR features is limited, preventing them from realizing the financial and health
outcome benefits. Mastery of EMR systems is associated with improved HCP efficiency; thus, it
would follow that increasing knowledge, skill, and utilization of the EMR would reduce the risk
of HCP burnout to some degree.
This project aimed to implement a training program that would increase the use of
functionality in the EMR and improve performance on quality measures in an effort to reduce
HCP risk of burnout.
Needs Assessment and Description of the Project
The target population identified for this project is a medical group composed of HCPs
located in the southwest part of the United States. This medical group includes physicians, NPs,
and PAs who provide primary care services to seniors enrolled in traditional Medicare and
Medicare Part C, also referred to as Medicare Advantage. Medicare Advantage are health plans
provided by private insurance companies contracted with Medicare. This medical group also
participates collectively in a merit-based incentive payment system (MIPS) that provides
financial incentives based on group performance on quality measures for Medicare Advantage
patients.
Project Sponsors and Key Stakeholders
Key stakeholders of this DNP project were HCPs who were recipients of this project’s
EMR training intervention. Other internal stakeholders were administrative staff and medical
assistants. In the clinic, the practice administrators and medical assistants are involved with data
gathering, entry, and management. Medical assistants are also involved directly with patient care
and communication. At the organizational level, there are multiple teams of internal

19
stakeholders. The medical group is financially accountable for performance on the quality
measures. Organization-level stakeholders included multiple executives, committees such as the
Quality Utilization Committee, as well as all the administrative team members involved in
gathering and reporting data to the organization and to the payers. Payers, including Medicare
and Medicare Advantage plans, are external stakeholders sharing financial accountability for
performance and health outcomes related to the quality measures. The medical group is part of a
local Accountable Care Organization, which was also identified as an external stakeholder.
Finally, the patients are stakeholders since, ultimately, patient experience and health outcomes
might be affected by HCP performance on quality measures.
Identified DNP project sponsors included the President of the medical group and the
Director of Operations. The project sponsors worked with the project leader, the DNP student, to
ensure established project goals, outcomes, and timeline were met.
Organizational Assessment
The medical group was established in May of 2018. There were no standardized
workflows around use of the quality function in the EMR of the medical group. This included
HCPs and medical assistant workflows to capture data and address gaps in quality measures as
well as clinic level monitoring and workflows to assist with gap closure. Athena Clinicals is the
EMR system in use by all HCPs in the medical group. The organization currently captures data
through the EMR and reports to external payers and organizations but had not established
programs to assist the clinics with data management and gap closure.
Scope of the Project
The scope of this DNP project included development and implementation of HCP
training on the quality function in the EMR. Provider/clinic level workflow for management of
20
quality measures and gap closure was developed, implemented, and evaluated. Performance on
quality measures was evaluated before and after implementation of training intervention and
workflows. The project included all HCPs and the medical group’s nine clinics in which they
provided primary care services to Medicare and Medicare Advantage patients.
Goals and Objectives of the Project
The ultimate goal was to improve health outcomes and reduce cost of health care across
the healthcare system. Additional goals of the DNP project were:
1. To improve healthcare provider utilization of the quality function in the EMR and
job performance on quality measures and
2. To reduce risk of healthcare provider burnout by increasing skills and efficiency in
the EMR.
Objectives for the DNP project were divided into process and outcome objectives. The
outcome objectives are to
1. Increase healthcare provider utilization of the quality function in the EMR by 50%
or more.
2. Increase reported comfort with the quality tab functions by 25%.
The process objectives are to
1. Improve perceived usefulness, and perceived ease of use of the quality function in
the EMR by healthcare providers. Current utilization was measured through self-
report pre and post training (see Question 2 in Appendix A).
2. Measure self-reported level of burnout in healthcare providers.
3. Develop training program for healthcare providers on the quality function and
workflows for management of quality measures for their patient panels.
21
4. Implement training program for healthcare providers on the quality tab functions
and efficient workflows for management of quality measures.
5. Measure post-implementation utilization of the quality function in the EMR by
healthcare providers.
6. Measure post-implementation self-reported level of burnout in healthcare providers.
22
Chapter III: Theoretical Underpinning
Technology Acceptance Model
This DNP project aimed to increase HCP use and comfort level with the quality function
in the EMR, thereby improving performance and decreasing risk of burnout. The technology
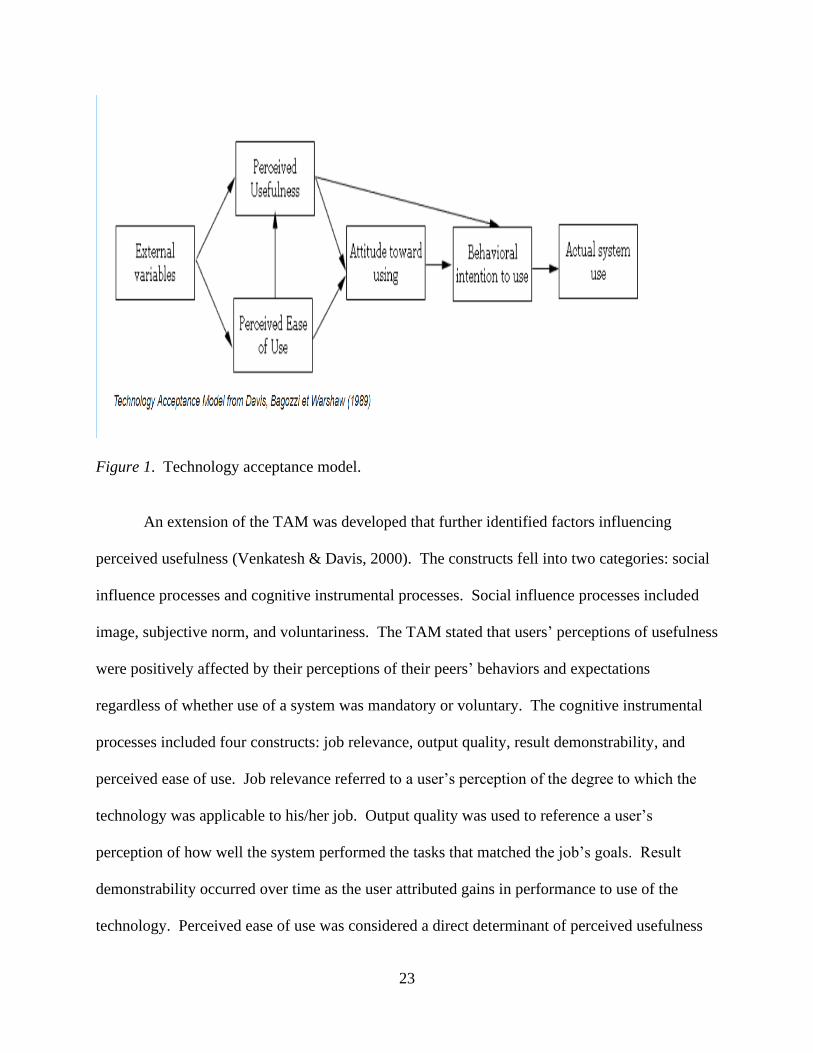
acceptance model (TAM) guided the project. It is a predictive model that identifies critical
factors affecting adoption of any technology or application (Davis, 1989). The TAM purported
that actual use of a technology was dependent on the user’s perception of two factors: usefulness
and ease of use. Perceived usefulness was defined as “the degree to which a person believes that
using the system will enhance job performance” (Davis, 1989, p. 319). Performance was often
tied to positive incentives such as bonuses; thus, a system high in perceived usefulness would be
one the user believes would positively affect job performance. Perceived ease of use was
defined as “the degree to which the person believes the system is free of effort” (Davis, 1989, p.
319). An application perceived as easy to use was theorized to be more likely accepted by users.
Davis (1989) then developed scale questions to measure both perceived usefulness and perceived
ease of use and correlated responses with system use. The scales were found to have strong
psychometric properties and showed empirical evidence of strong relationships between the
measures and self- reported usage of technology. Davis also found perceived usefulness was
much more strongly correlated to usage than perceived ease of use. This indicated the functions
a system performed were the primary reason for adoption by the user (Davis, 1989). A diagram
of the basic components of the TAM are presented in Figure 1.
23
Figure 1. Technology acceptance model.
An extension of the TAM was developed that further identified factors influencing
perceived usefulness (Venkatesh & Davis, 2000). The constructs fell into two categories: social
influence processes and cognitive instrumental processes. Social influence processes included
image, subjective norm, and voluntariness. The TAM stated that users’ perceptions of usefulness
were positively affected by their perceptions of their peers’ behaviors and expectations
regardless of whether use of a system was mandatory or voluntary. The cognitive instrumental
processes included four constructs: job relevance, output quality, result demonstrability, and
perceived ease of use. Job relevance referred to a user’s perception of the degree to which the
technology was applicable to his/her job. Output quality was used to reference a user’s
perception of how well the system performed the tasks that matched the job’s goals. Result
demonstrability occurred over time as the user attributed gains in performance to use of the
technology. Perceived ease of use was considered a direct determinant of perceived usefulness
24
and intention of use (Venkatesh & Davis, 2000). The TAM has been widely applied in
examining users' acceptance and usage of technology.
The training intervention for this DNP project was hypothesized to positively affect both
perceived usefulness and perceived ease of use, and thus intention to use the quality function.
The training deliberately educated the medical group providers about how the quality function
would be used to gauge quality of patient care as well as measure performance, thereby
increasing their perception of its usefulness. The training would also improve perceived ease of
use by increasing knowledge and comfort using the function and decreasing stress associated
with use of the quality function.
Maslach Multidimensional Theory of Burnout
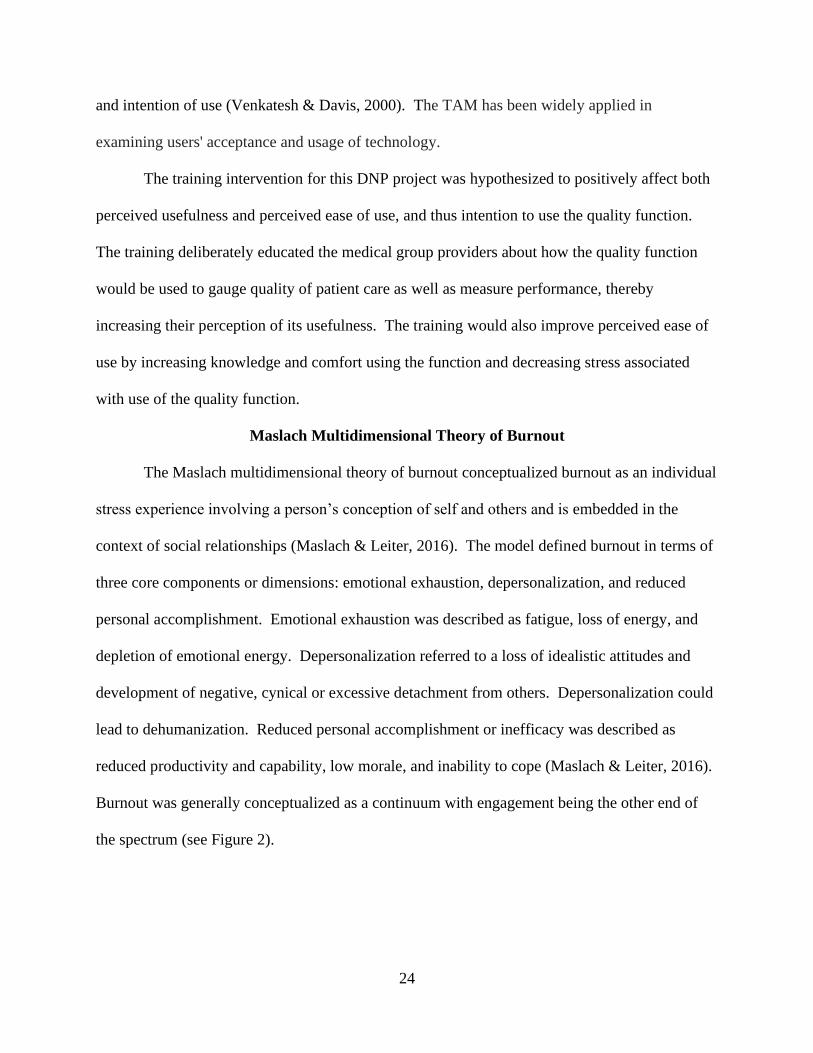
The Maslach multidimensional theory of burnout conceptualized burnout as an individual
stress experience involving a person’s conception of self and others and is embedded in the
context of social relationships (Maslach & Leiter, 2016). The model defined burnout in terms of
three core components or dimensions: emotional exhaustion, depersonalization, and reduced
personal accomplishment. Emotional exhaustion was described as fatigue, loss of energy, and
depletion of emotional energy. Depersonalization referred to a loss of idealistic attitudes and
development of negative, cynical or excessive detachment from others. Depersonalization could
lead to dehumanization. Reduced personal accomplishment or inefficacy was described as
reduced productivity and capability, low morale, and inability to cope (Maslach & Leiter, 2016).
Burnout was generally conceptualized as a continuum with engagement being the other end of
the spectrum (see Figure 2).
25
Figure 2. Maslach multidimensional theory of burnout’s six areas of job-person fit (Maslach &
Leiter, 2016).
According to the theory, both personal and organizational factors contributed to burnout.
Organizational factors included six key domains, the most pertinent to the DNP project were
workload, lack of control, reward, and community. Figure 2 above illustrated how the key
domains influenced burnout and engagement. A chronic mismatch between amount of work and
time available to complete the requirements of a job left no time for rest and restoration of
balance, thus contributing to burnout (Maslach & Leiter, 2016). Perceived lack of control was
also linked to burnout whereas a perceived ability to influence decisions and gain access to
resources necessary to be efficacious in job performance were positively correlated with
engagement (Maslach & Leiter, 2016). Institutional, financial, and social rewards reinforced and
shaped behavior; if the reward was perceived as insufficient, there was a sense of decreased
value and thus an increased vulnerability to burnout (Maslach & Leiter, 2016). Finally, ongoing
relationships and organizational support decreased the risk of burnout (Maslach & Leiter, 2016).
The DNP project aimed to decrease workload by increasing skill and efficiency in the
EMR, provide additional resources to HCPs to support them in performance on quality measures,
and improve perceptions of reward and organizational support.
W orkload Control Rew ard Community F a irness Values
Mis match Congruence
B urnout Engagement
26
The Maslach Burnout Inventory (MBI) surveys were designed through exploratory
research by the authors of the Maslach multidimensional theory of burnout (Maslach & Leiter,
2016) and are recognized to be the leading measures of burnout. There are several versions
including the MBI for human services (MBI- HS). The MBI-HS survey consists of 22 items
used to measure each of the three core dimensions of burnout in healthcare personnel. A meta-
analysis of 45 empirical studies concluded the MBI demonstrated an average reliability of .71-
.88 Cronbach alpha coefficients on the three dimensions of burnout (Vargas, Fuente, Aguayo, &
Lozano, 2011). A stand-alone item on the emotional exhaustion scale has also been validated as
a reliable and valid measurement of burnout (West, Dyrbye, Sloan, & Shanafelt, 2009). The
MBI is proprietary and carries licensing fees, making its repeated use potentially quite
expensive. Dolan et al. (2015) sought to compare a single item nonproprietary measure
previously used in the MEMO study and previously referenced to the MBI single emotional
exhaustion item. The conclusion was a single item measure would be a reliable substitute for the
MBI (Dolan et al., 2015). Thus, the Physician Work Life Single Item Questionnaire offered
logistical advantage over the MBI.
27
Chapter IV: Project Plan
Healthcare provider (HCP) burnout is a multifactorial problem that has worsened
significantly since the implementation of the EMR. Lack of advanced training and expertise in
EMR functionality for healthcare providers decreases productivity, increases risk of burnout, and
limits the vast potential of the EMR to improve HCP efficiency and health outcomes for patients.
The purpose of the DNP project was to increase the use of the quality tab function in the EMR
to improve performance on quality measures and quality of care through implementation of a
training program for HCPs.
Setting
The DNP project setting included nine primary care clinics in a privately-owned medical
group located in the southwest part of the United States.
Population of Interest
The population of interest identified for the DNP project included 33 HCPs and clinic
personnel. Data regarding quality measures for patients attributed to the medical group were
examined through the medical record. Healthcare providers included physicians, NPs, and PAs.
Clinic personnel included medical assistants and practice administrators/managers. All patients
under the care of HCPs in the medical whose age, gender or medical condition (s) resulted in
inclusion in one or more of the nine core quality measures were included as a cohort, not
individually.
The EMR systems used by the medical group is Athena, a cloud-based billing platform
that supports meaningful use and has robust functionality in the area of quality management and
population health.
28
Measures, Instruments, and Activities
The DNP project is a quality improvement project. A snapshot of HCP burnout levels
and attitudes toward and use of the quality function in the EMR were obtained pre and post
training interventions. Two sets of data were collected, and responses compared before and after
training was completed.
Training Intervention
Training consisted of a single session led by the DNP student. A total of three training
sessions were held at two clinics between September 1, 2020 and October 4, 2020. Each HCP
was asked to bring his/her laptop. Baked items, coffee, and water were served for refreshment.
The training session took between 30-40 minutes including hands-on training and the question
and answer period. By the end of the training session, the attendees would be able to (a)
articulate the purpose and importance of the quality tab in Athena, (b) generate a report
displaying their performance on quality measures, (c) satisfy each quality measure following the
efficient workflow presented, and (d) demonstrate to another teammate how to perform the
functions of the quality tab.
There were three components to the training. The first two components were intended to
positively influence HCPs’ perceptions of usefulness of the quality tab function. The first
presentation was an overview of how CMS calculates HCPs’ performance on quality measures
and how this translated to financial incentives. This was presented by the DNP student and
consisted of a very brief PowerPoint presentation.
The second section consisted of the DNP student demonstrating how to build a
personalized report of each individual HCP’s performance on the quality measures using the
report building functionality within Athena. A detailed description of this process is provided in
29
Appendix E. The DNP student projected the screen on a closed-circuit so the HCPs could
simultaneously see the process and/or go through the steps in tandem on their laptops. The
meeting rooms were not so large as to require a microphone. This same report was generated by
senior leadership to measure provider performance. A reproduction of the report generated is
presented in Table 1.
Next, the DNP student demonstrated the following five quality tab functions, again
sharing the screen with attendees:(a) satisfying quality measures, (b) changing frequency of a
measure, (c) annotating a measure, (d) excluding a measure, and (d) correcting data entered in
error. Healthcare providers were able to practice these functions on a test patient if they chose to
do so during this section of the training. This component was intended to positively influence
perceived ease of use. A brief question and answer session followed.
Measures and Instruments
A demographics survey questionnaire was used to capture demographics and
characteristics of the sample. Demographic questions included gender, age, education, degree,
credential(s), and years of experience. Descriptive statistics were used to analyze and report the
aggregated demographic data.
Provider self-report of burnout level, provider current comfort level with and current
usage of the quality functionality in the EMR, and attitude toward the quality functionality in the
EMR were assessed using the survey questionnaire (see Appendix A). The central idea of the
technology acceptance model (Davis, 1989) is a user’s behavioral intent ultimately determines
acceptance of any given technology. Behavioral intent is influenced by perceived usefulness
(PU) and perceived ease of use (PEU). A positive correlation exists between these two measures
and actual use of a technology or application. The reliability and validity of the TAM was
30
established by two studies conducted by Davis (1989). Cronbach’s alpha was reported at 0.98
for PU and 0.94 for PEU. High factorial, discriminant, and convergent validities were also
reported for both PU and PEU scales (Davis, 1989).
The TAM (Davis, 1989) has been used in multiple studies involving healthcare provider
application of the EMR (Abdekhoda, Ahmadi, Dehnad, Noruzi, & Gohari, 2016). In their
literature review of recent research of the TAM, Chen, Li, and Li (2011) noted the TAM
questionnaires generally contained at least three questions to measure PEU and PU; however, the
original research by Davis (1989) involved a 10-item scale for both PEU and PU. The survey
item questions substituted the technology or application the person was testing. The survey
measured PEU and PU utilizing scale item questions from TAM with quality function in Athena
being the application of interest. The TAM scales measured each construct with 7-point Likert
scales where 1 = Strongly disagree and 7 = Strongly agree (Venkatesh & Davis, 2000). The PU
and PEU scale items for the DNP project are presented in Appendix B.
To measure burnout, a nonproprietary Physician Work-Life Study single item (PWLS;
Dolan et al., 2015) questionnaire was used. This tool has been used to measure burnout in HCPs
in diverse healthcare settings and has been found to be reliable (Dolan et al., 2015). The PWLS
was found to have a sensitivity of 83.2% and specificity of 87.4% with area under the curve of
0.93 in a large study involving veterans (Dolan et al., 2015). Additionally, the PWLS single item
burnout characterization was associated with lower job satisfaction, greater time pressure, poor
work control, and intent to leave the medical practice in a univariate analysis study of primary
care physicians (Waddimba et al., 2016). The PWLS questionnaire is provided in Appendix C.
The DNP project aimed to increase use of the quality function in the EMR and improve
HCPs’ performance on quality measures. The project utilized the nine core measures for
31
which each provider was held accountable: blood pressure control (140/90), breast cancer
screening, colorectal screening, disease modifying anti-rheumatic drug use for rheumatoid
arthritis, osteoporosis management in women with fractures, diabetic dilated eye exam,
hemoglobin A1Cc control <9.0 %, microalbumin/creatinine ratio in diabetics, and statin use for
diabetics. A performance report for all measures was generated in real-time using report
building functionality in Athena. Aggregate scores for each measure were reported pre- and
post-implementation of the training program.
Timeline and Project Tasks
The timeline for the DNP project was extended from May 2019 to March 2020. Table 2
in the appendices provides a detailed timeline with associated tasks and activities.
Personnel
The project involved the DNP student as the EMR trainer on quality function. The DNP
student also collected survey and EMR data with the assistance of the President of the medical
group and the data analytics team at P3 Health Partners. The Director of Operations as well as
clinic administrators were involved in planning and scheduling training sessions for HCPs and
clinic team members.
Resources and Supports
The resource of most importance to the project was time. The training session was
approximately 30 minutes in length including hands-on practice time for healthcare providers.
The survey measurement took approximately five minutes to complete each time it was taken
(once before and once after the training program). Quality measures reports were generated by
the DNP student utilizing report building technology already in place in the EMR. The DNP
student was granted superuser access to report building in Athena prior to initiation of the DNP
32
project. Support for the proposed project had been secured through senior executives at the
medical group who granted the DNP student the time and access to accomplish the objectives.
Risks and Threats
There were minimal risks and threats to the success of this DNP project. The first was
attendance and completion of the training by HCPs as well as completion of the survey
instrument. To mitigate this risk, training sessions were offered on both the east and west side of
town and four dates were proposed and planned. The convenience of location, time, and date
allowed all HCPs in the medical group to attend one of the first three sessions; thus, the fourth
training was unnecessary and was cancelled. The survey instrument was completed by HCPs
utilizing Qualtrics on their personal laptops or personal devices such as cell phones. Follow-up
email was employed to remind healthcare providers to complete the survey instrument.
Another risk was team communication and collaboration with HCPs in the quality
measures management and workflow. To mitigate this risk, the DNP student enlisted practice
managers to drive implementation of the workflow through team member education and huddles.
The lead medical assistant was instrumental in training medical assistants on the quality tab
workflow and continued to provide oversight to help ensure the workflow continued to be
included in the intake process during each patient encounter. Team member education included
quality function in EMR and planned shared incentives based on HCPs’ performance on the
quality measures.
Financial Plan
The cost of the DNP project was minimal. There was no cost to the HCPs. Both survey
instruments were public and did not require express consent nor any fees for their use in
scholarly activities. Neither instrument was copyrighted, and written permission was not
33
required. Access to the Statistical Program for the Social Sciences (SPSS), version 26 software
for data analysis was rented by the student. The largest cost to the medical group’s organization
was the time involved to train healthcare providers on the quality function in the EMR. The
training required that healthcare providers’ schedules were appropriately blocked, resulting in
about two hours of lost productivity and revenue for each provider. The two hours included time
to travel from their home clinics to the training sites and back. The principal sponsor of the
project was the president of the medical group.
Institutional Review Board
Prior to the project’s implementation, approval from the University of Nevada, Las
Vegas’ Institutional Review Board (IRB) was secured. The project involved education and
training of HCPs for the purpose of quality improvement. The project was deemed as exempt
research.
Evaluation Plan
The DNP project utilized the Kirkpatrick model to evaluate training programs in diverse
settings and has been the industry standard. The model consisted of four levels of training
course evaluation: reaction, learning, behavior, and results. Reaction measured how favorably
the participants responded to the training and included reaction to the instructor, the material, and
the venue. To evaluate learning, the Kirkpatrick model measured how well the learning
objectives were met. An evaluation tool based on the Kirkpatrick model was developed to assess
participant reaction and evaluate if the learning objectives were achieved.
The goal of the third level (behavior) was to measure if participants had changed
behavior as a result of the training. Results referred to the degree of success achieving the
identified outcomes as a result of training (Kirkpatrick Partners, 2019). For the DNP project, this
34
third level was measured by comparing pre and post training in the use of the quality function in
EMR, pre and post training provider burnout rating, and pre and post training performance by
HCPs on quality measures. Qualitative feedback on the training program was sought from the
HCPs as well as other stakeholders in order to revise and improve the training on the quality
function in the future (see Appendix D).
35
Chapter V: Summary of the Implementation and Results
Precis of the Phenomenon of Interest, Problem, and Purpose of the Project
Burnout is prevalent among HCPs in primary care, affecting the quality of health care
delivered to patients and resulting in substantial direct and indirect healthcare costs. Mandatory
health system data reporting and management through meaningful use spurred rapid adoption
and implementation of the EMR. The EMR has contributed to HCP burnout by increasing
clerical burden and decreasing the time spent face-to-face engaging with patients. Inadequate
organizational investment for ongoing training in the EMR, improvement of workflow and
processes using the EMR, and peer support for HCPs related to the EMR have further
contributed to HCP burnout. The purpose of this DNP project was to implement a training
program to increase use of specific functionality within the existing EMR among HCPs in the
medical group, improve their performance on clinical quality measures, and decrease their risk of
burnout by improving workflows and decreasing clerical burden.
Threats and Barriers
The threats and barriers encountered were the resistance by HCPs and other team
members to the change in process and workflow around the quality tab functionality. The
resistance was overcome by the support of management at the clinic and corporate levels
including practice managers, the lead medical assistant, the director of operations, and the
President of the Nevada Market. The training sessions were mandatory for all HCPs. This
resulted in all HCPs attending one of the three training sessions led by the DNP student;
however, not all HCPs participated in the actual study.
As participation was voluntary and no financial incentive was provided, fewer HCPs than
expected were recruited for the project. Fewer participants completed the post implementation
36
surveys than the pre implementation surveys. Dropouts were anticipated but further impacted
certain aspects of the DNP project, particularly measurement of perceived burnout.
Current functionality and EMR capability did not always directly support the DNP
project. It was challenging at times to get answers from Athena support staff regarding
workflows and functionality. An example of this occurred when the question was raised how to
remove an inaccurate exclusion. Athena support was contacted by email and responded with the
steps needed to document an exclusion. The workflow for exclusion removal was eventually
uncovered in a technical document by the DNP student after many queries.
The final barrier was the DNP student’s own inexperience and lack of knowledge
regarding all aspects of the DNP project—from planning to implementation to evaluation.
Substantial investments of time and effort were made to ensure the timely completion of the
project. Multiple human and written resources were consulted throughout the DNP project
process.
Monitoring of the Project
The DNP project was monitored from inception to completion by the DNP student.
Monitoring of the project also occurred at an organizational level throughout the planning and
implementation stages by the Director of Operations at the medical group and by the President of
the Market.
Data Collection and Analysis
Initial provider performance data (the Quality Management Report or QMR) on the nine
core quality measures—blood pressure control (140/90), breast cancer screening, colorectal
screening, disease modifying anti-rheumatic drug use for rheumatoid arthritis, osteoporosis
management in women with fractures, diabetic dilated eye exam, hemoglobin A1Cc control
37
<9.0 %, microalbumin/creatinine ratio in diabetics, and statin use for diabetics—were
collected. The QMR was generated from the EMR and exported electronically onto an Excel
spreadsheet. This provided a baseline level of performance that could be compared to provider
performance following the training program. All HCPs in the medical group were invited to
participate in the project.
Prior to attending a training session, the participants completed an anonymous electronic
survey that included demographics, a single item burnout measure, and questions regarding
perceptions of knowledge and use of the EMR. The electronic survey was sent by group email
that contained an anonymous link to the survey on Qualtrics. The participants then attended one
of three training session presented by the DNP student. Immediately following the training
session, the evaluation form (see Appendix D ) was completed by participants to measure
participant reaction learning and gauge how well the objectives had been met.
One month following completion of the training program, participants were once again
asked to complete the same Qualtrics survey. Survey data were exported electronically from
Qualtrics to Excel and SPSS, version 26. Iterative provider performance reports on the quality
measures were obtained each month following training sessions. Performance reports were
exported directly from Athena to Excel spreadsheets.
Data analysis was carried out utilizing the SPSS version 26 software and Excel.
Descriptive statistics were used to characterize the sample demographics and calculate burnout
rate. The participants’ perceived skill and current use of the quality tab functionality were also
determined using descriptive statistics. Pre and post training responses were compared using an
independent t test. The QMR reports were analyzed using raw data and descriptive statistics.
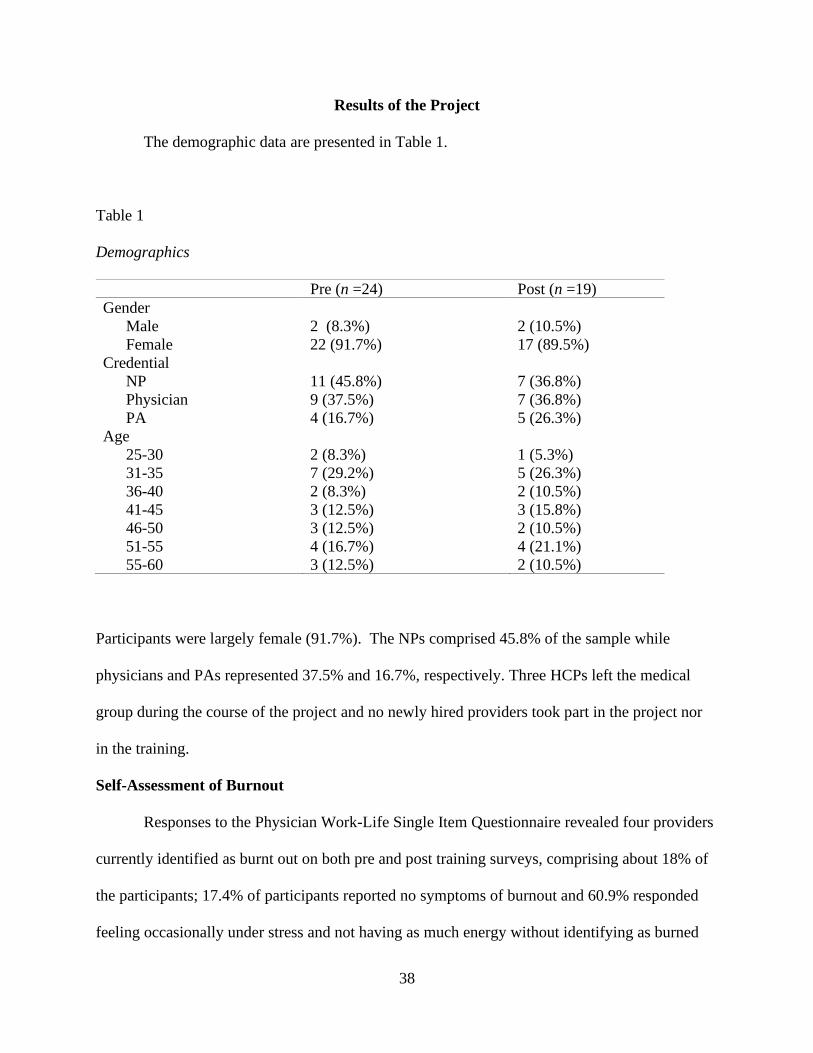
38
Results of the Project
The demographic data are presented in Table 1.
Table 1
Demographics
Pre (n =24) Post (n =19)
Gender
Male
Female
2 (8.3%)
22 (91.7%)
2 (10.5%)
17 (89.5%)
Credential
NP
Physician
PA
11 (45.8%)
9 (37.5%)
4 (16.7%)
7 (36.8%)
7 (36.8%)
5 (26.3%)
Age
25-30
31-35
36-40
41-45
46-50
51-55
55-60
2 (8.3%)
7 (29.2%)
2 (8.3%)
3 (12.5%)
3 (12.5%)
4 (16.7%)
3 (12.5%)
1 (5.3%)
5 (26.3%)
2 (10.5%)
3 (15.8%)
2 (10.5%)
4 (21.1%)
2 (10.5%)
Participants were largely female (91.7%). The NPs comprised 45.8% of the sample while
physicians and PAs represented 37.5% and 16.7%, respectively. Three HCPs left the medical
group during the course of the project and no newly hired providers took part in the project nor
in the training.
Self-Assessment of Burnout
Responses to the Physician Work-Life Single Item Questionnaire revealed four providers
currently identified as burnt out on both pre and post training surveys, comprising about 18% of
the participants; 17.4% of participants reported no symptoms of burnout and 60.9% responded
feeling occasionally under stress and not having as much energy without identifying as burned
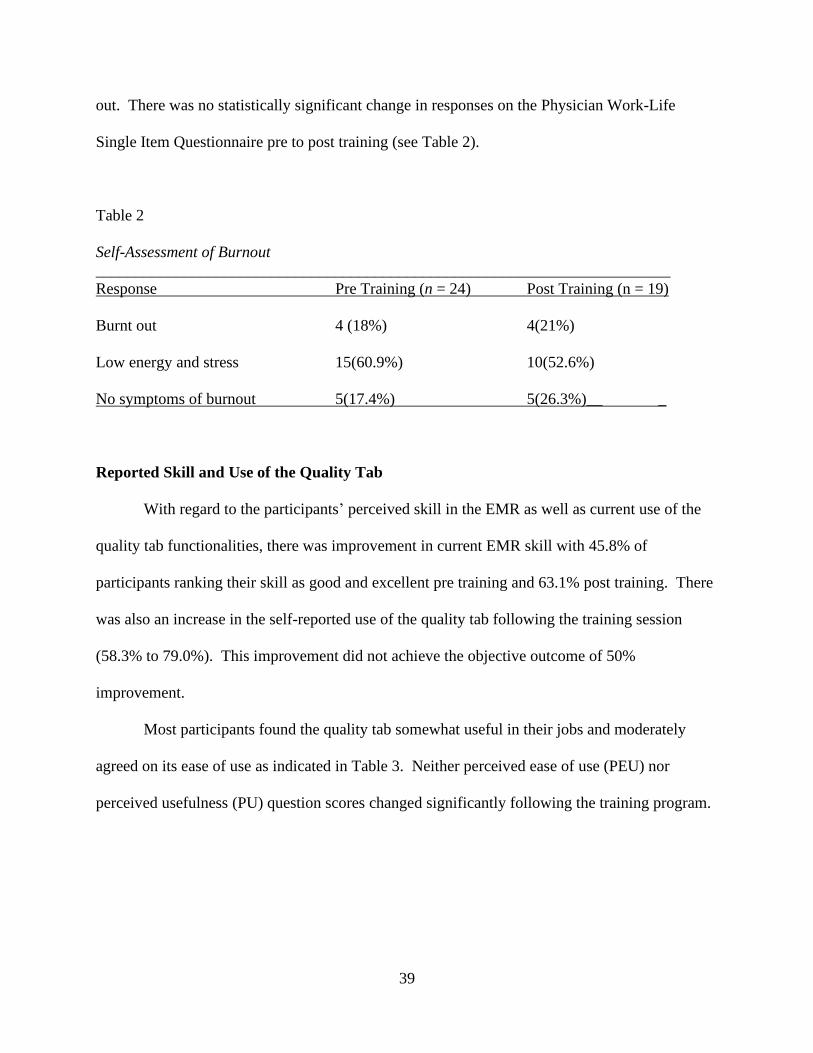
39
out. There was no statistically significant change in responses on the Physician Work-Life
Single Item Questionnaire pre to post training (see Table 2).
Table 2
Self-Assessment of Burnout
________________________________________________________________________
Response Pre Training (n = 24) Post Training (n = 19)
Burnt out 4 (18%) 4(21%)
Low energy and stress 15(60.9%) 10(52.6%)
No symptoms of burnout 5(17.4%) 5(26.3%)__ _
Reported Skill and Use of the Quality Tab
With regard to the participants’ perceived skill in the EMR as well as current use of the
quality tab functionalities, there was improvement in current EMR skill with 45.8% of
participants ranking their skill as good and excellent pre training and 63.1% post training. There
was also an increase in the self-reported use of the quality tab following the training session
(58.3% to 79.0%). This improvement did not achieve the objective outcome of 50%
improvement.
Most participants found the quality tab somewhat useful in their jobs and moderately
agreed on its ease of use as indicated in Table 3. Neither perceived ease of use (PEU) nor
perceived usefulness (PU) question scores changed significantly following the training program.
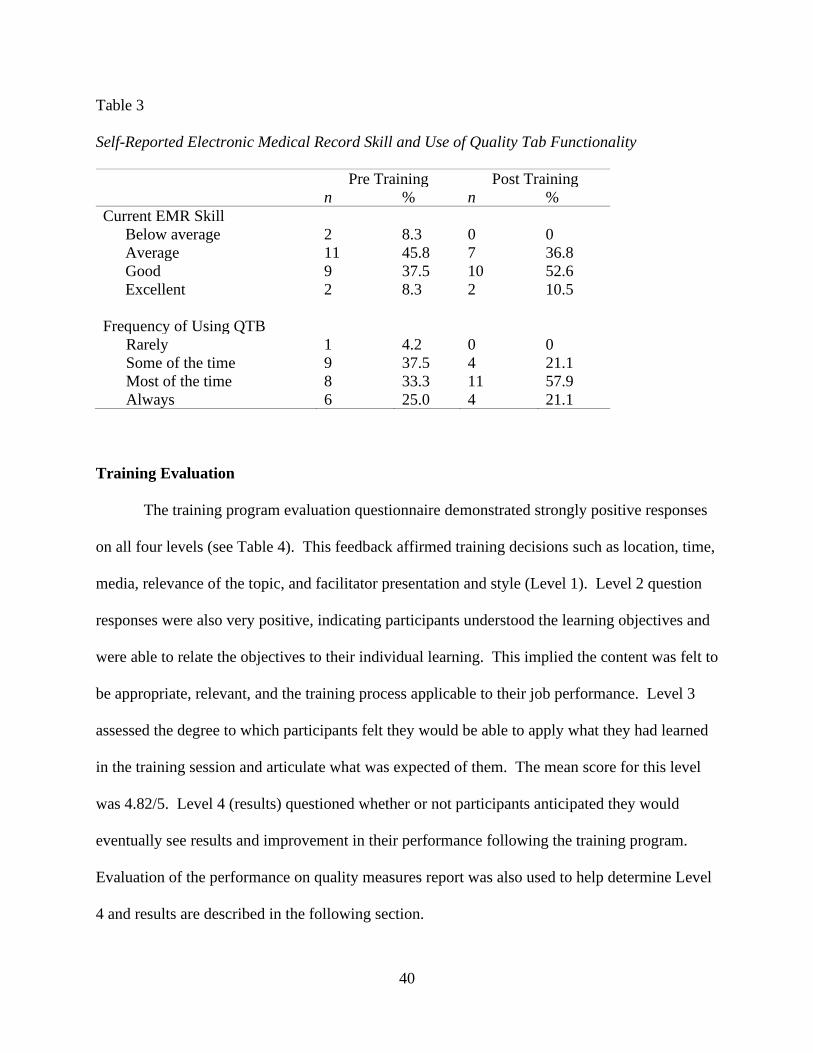
40
Table 3
Self-Reported Electronic Medical Record Skill and Use of Quality Tab Functionality
Pre Training Post Training
n % n %
Current EMR Skill
Below average 2 8.3 0 0
Average 11 45.8 7 36.8
Good 9 37.5 10 52.6
Excellent 2 8.3 2 10.5
Frequency of Using QTB
Rarely 1 4.2 0 0
Some of the time 9 37.5 4 21.1
Most of the time 8 33.3 11 57.9
Always 6 25.0 4 21.1
Training Evaluation
The training program evaluation questionnaire demonstrated strongly positive responses
on all four levels (see Table 4). This feedback affirmed training decisions such as location, time,
media, relevance of the topic, and facilitator presentation and style (Level 1). Level 2 question
responses were also very positive, indicating participants understood the learning objectives and
were able to relate the objectives to their individual learning. This implied the content was felt to
be appropriate, relevant, and the training process applicable to their job performance. Level 3
assessed the degree to which participants felt they would be able to apply what they had learned
in the training session and articulate what was expected of them. The mean score for this level
was 4.82/5. Level 4 (results) questioned whether or not participants anticipated they would
eventually see results and improvement in their performance following the training program.
Evaluation of the performance on quality measures report was also used to help determine Level
4 and results are described in the following section.
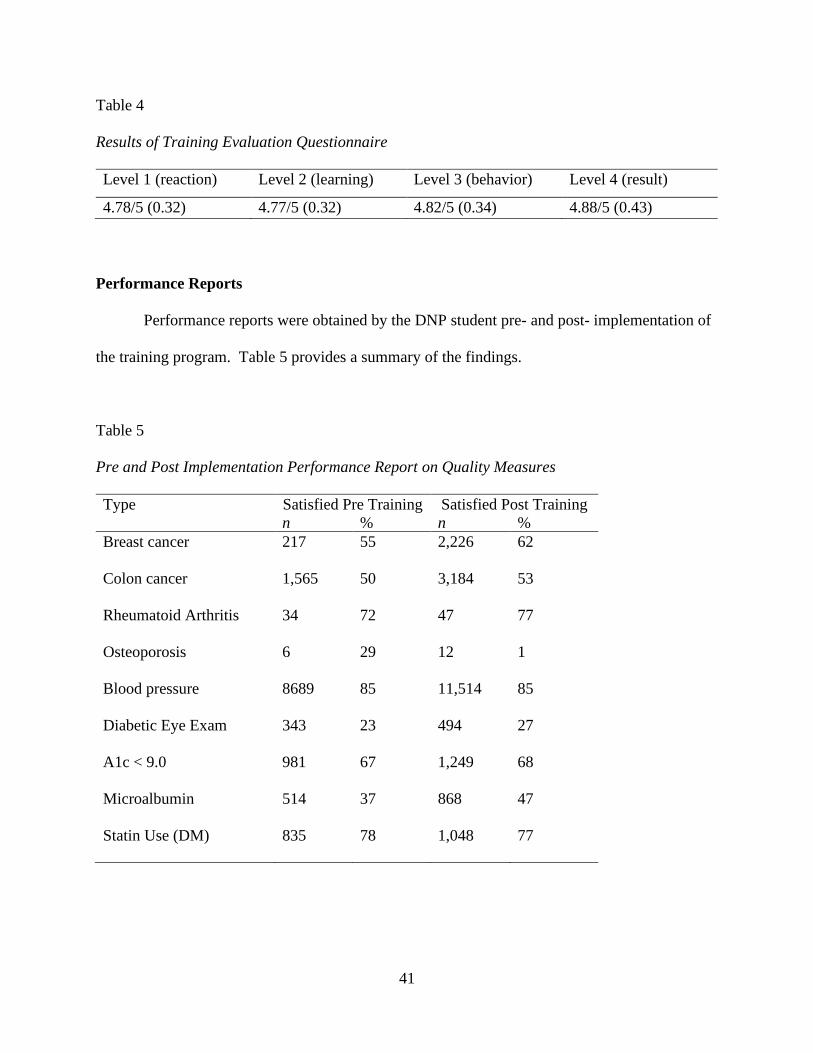
41
Table 4
Results of Training Evaluation Questionnaire
Level 1 (reaction) Level 2 (learning) Level 3 (behavior) Level 4 (result)
4.78/5 (0.32) 4.77/5 (0.32) 4.82/5 (0.34) 4.88/5 (0.43)
Performance Reports
Performance reports were obtained by the DNP student pre- and post- implementation of
the training program. Table 5 provides a summary of the findings.
Table 5
Pre and Post Implementation Performance Report on Quality Measures
Type Satisfied Pre Training Satisfied Post Training
n % n %
Breast cancer 217 55 2,226 62
Colon cancer 1,565 50 3,184 53
Rheumatoid Arthritis 34 72 47 77
Osteoporosis 6 29 12 1
Blood pressure 8689 85 11,514 85
Diabetic Eye Exam 343 23 494 27
A1c < 9.0 981 67 1,249 68
Microalbumin 514 37 868 47
Statin Use (DM) 835 78 1,048 77
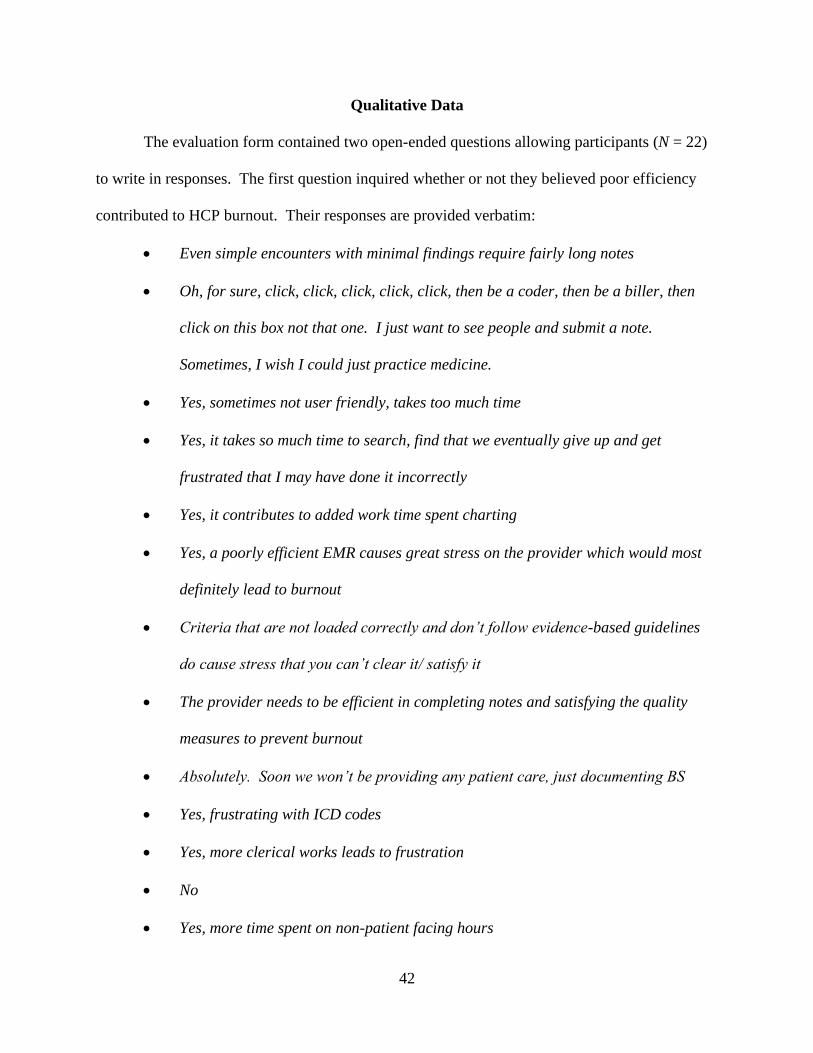
42
Qualitative Data
The evaluation form contained two open-ended questions allowing participants (N = 22)
to write in responses. The first question inquired whether or not they believed poor efficiency
contributed to HCP burnout. Their responses are provided verbatim:
• Even simple encounters with minimal findings require fairly long notes
• Oh, for sure, click, click, click, click, click, then be a coder, then be a biller, then
click on this box not that one. I just want to see people and submit a note.
Sometimes, I wish I could just practice medicine.
• Yes, sometimes not user friendly, takes too much time
• Yes, it takes so much time to search, find that we eventually give up and get
frustrated that I may have done it incorrectly
• Yes, it contributes to added work time spent charting
• Yes, a poorly efficient EMR causes great stress on the provider which would most
definitely lead to burnout
• Criteria that are not loaded correctly and don’t follow evidence-based guidelines
do cause stress that you can’t clear it/ satisfy it
• The provider needs to be efficient in completing notes and satisfying the quality
measures to prevent burnout
• Absolutely. Soon we won’t be providing any patient care, just documenting BS
• Yes, frustrating with ICD codes
• Yes, more clerical works leads to frustration
• No
• Yes, more time spent on non-patient facing hours
43
• Yes, due to tedious tasks or documenting in multiple/ incorrect locations
• Yes, tips and tricks increase workflow as our patient population grows giving less
time to chart
• Yes, sometimes it can be time consuming if you are not sure how to navigate. Often
times, it is due to having technical difficulty-dragon not working, internet
connections
• Yes, duplication in charting takes time away from patient care
• Yes, lack of organized data and records makes it difficult to efficiently and
effectively manage complex patients
• Yes, I do! Most providers want to take excellent care of their patients but get
overwhelmed with documentation procedures. An inefficient EMR is a complete
time suck
• Yes, poor efficiency can slow down or hinder patient care and frustrates providers
• Unknown at present, ten- hour shifts would help provider burnout.
The DNP project indicated the ongoing peer-led training was well-received and
perceived as useful by the HCPs. This led to self-reported increased HCP awareness and
use of the quality functionality in the EMR. Additional iterative data are needed to
determine whether or not there is a positive trend in provider performance on the quality
measures. Even then, many variables might have contributed to such a trend and
causality could not be determined. Burnout levels were static and did not change during
the six-month course of the DNP project. Subjectively, an overwhelming majority felt
the EMR contributed to burnout.
44
Limitations
The implementation of the training program was limited to a relatively small number of
HCPs in a single medical group in southern Nevada under specific conditions. Thirty-three
HCPs completed the training session but participants in the data collection numbered 24. Five of
the participants did not complete the post-training survey, further limiting the sample size and
reducing confidence in applicability to the HCP population as a whole.
Discussion
Self-reported skill and frequency of use of the quality tab functionality did improve
following the intervention, suggesting participants did perceive a benefit as a result of the
training session. The evaluations of the training program were very positive as described in the
previous section. It could be concluded the training program was effective in achieving its
objectives. This finding was consistent with the literature that continuing peer-led EMR training
is valued and increases HCP efficiency and confidence in the EMR (Dastagir et al., 2012; Kadish
et al., 2018; Robinson & Kersey, 2018). Improving inefficient workflow and development of
quality improvement project such as the DNP training program to address pay for performance
quality measures have been found to improve HCP performance and decrease burnout (Linzer et
al., 2015).
The training program did not translate into as much improvement in performance on the
nine core quality measures as anticipated. There are several possible explanations for this result.
The unique number of Medicare patients under the care of HCPs for whom the nine core quality
measures were tracked more than doubled during the months in which the project took place.
The number of total patients increased considerably. With increasing patient volume, there was
increased time pressure and EMR clerical burden for the HCPs and their teammates. EMR tasks
45
related to new patient care include extensive data entry to create the patient chart.
Documentation of each patient visit, responding to telephone messages, test results management,
refills, review of consultations, and emails all contribute to the daily EMR workload for the HCP
(Baron, 2010). Furthermore, the large influx of new patients could have affected the ability of
the HCPs to satisfy certain measures within the timeframe of the project. For example,
satisfying annual diabetic eye exam requires documentation from ophthalmology or optometry.
Releases for medical information must be obtained, faxed to the eye professional, and then
records obtained, reviewed, and documented.
Another possible explanation is that of a ceiling effect in EMR assimilation, which is
described as a limited assimilation of available features or functionality of any particular EMR
because of individual and organizational factors (Trudel et al., 2017). After adoption and initial
training, basic functionality is achieved and continuous learning might be undervalued by both
individual HCPs and by organizations. EMR training and support for HCPs’ decreases in
frequency and time constraints further limit the ability of HCPs to explore additional
functionality in their EMR on their own. Trudel et al. (2017) found advanced functionalities
related to evaluation and monitoring that would include population health management and
quality clinical outcomes measures such as those in the DNP study were not assimilated in any of
the primary care practices involved in their study.
Implementation of interventions to address HCP burnout are relatively few and results are
inconsistent (Kalani, Azadfallah, Oreyzi, & Adibi, 2018). There is a scarcity of research,
particularly controlled interventions, in the area of HCP burnout. Interventions might be
categorized as individual or organizational. While multiple individuals and organizations have
shown improvements in burnout (Panagiotti et al., 2017; West, Dyrbe, Erwin, & Shanafelt,
46
2016), interventions were not homogenous in samples and suggested many complex factors
might play a modifying role in development and improvement of burnout in HCPs. These
factors could limit the reproducibility of results and validity of current research in this area.
Furthermore, there is a strong possibility of publication bias favoring studies that showed
statistical significance and positive outcomes. This could lead to underrepresentation of other
studies in the literature (Kalani et al., 2018). The DNP project was an organizational
intervention with mixed outcomes. Multiple unique personal and organizational factors specific
to the HCPs who were involved in the project likely influenced the results and might not be
generalizable to the HCP population as a whole.
Relation to Literature and Theory
The DNP project supported the literature findings that HCPs felt EMR functions
significantly contributed to dissatisfaction and burnout. The responses by clinicians spoke for
themselves as frustration and exasperation were evident. This finding added to the still growing
body of literature connecting increased levels of HCP burnout with the implementation and use
of the EMR (Ardnt et al., 2017; Babbott et al., 2014; Gardner et al., 2019; Harris et al., 2018;
Shanafelt et al., 2016).
Continuing HCP training in EMR functionality has been shown to increase efficiency and
improve job satisfaction (Boonstra & Broekhuis, 2010; Downing-Peck, 2013; Edwards et al.,
2012; O’Donnell, Kaner, Shaw, & Haighton, 2018). Furthermore, research supported the
leadership of clinician and peer-led EMR training (Bredfeldt et al., 2014; Dastagir et al., 2012;
Panagiotti et al., 2017). The DNP project provided support for ongoing EMR training of HCPs
with participants giving positive feedback on the appropriateness, content, and format of the
implemented EMR training program and led by a peer clinician.
47
The TAM model predicted increased adoption and acceptance of technology if users
perceived the technology to be easy to use and useful in their job (Davis, 1989). Previous studies
supported that increasing HCP perception of ease of use and usefulness improved adoption of the
technology (Abdekhoda, Ahmadi, Dehnad, Noruzi, & Gohari, 2016). Pre and post
implementation surveys did not show a statistically significant change in participants’
perceptions of ease of use or usefulness but did indicate increased comfort and use of the quality
tab functionality. The DNP project findings neither supported nor refuted the proposed
relationship between adoptions of the quality tab functionality as predicted by the TAM model.
This might be because the HCP perceptions of ease of use and usefulness were unexpectedly
high prior to implementation of the training, leaving little room for improvement.
The lack of any demonstrable improvement in burnout was supported by the literature
that burnout is a complex and multifactorial phenomenon that would require sustained macro and
meso system changes to ameliorate. Maslach and Leiter (2016) acknowledged six organizational
factors play an important role in development or prevention of burnout: workload, control,
reward, community, fairness, and values. Values referred to the ideals and motivations that call
people to any profession or vocation; they are the “motivating connection between the worker
and the workplace” (Maslach & Leiter, 2016, p. 105). When there is imbalance or misalignment
in any of these domains, there is increased risk of burnout (Maslach & Leiter, 2016). Multiple
other burnout studies also identified organizational factors and culture as a significant
contributing factor to burnout (Babbott et al., 2014; Ehrenfeld & Wanderer, 2018; Linzer et al.,
2005; Williams, Manwell, Konrad, & Linzer, 2007).
The ever-increasing mandates for data reporting and management from the healthcare
system have driven the adoption of the EMR and increased clerical work for HCPs and
48
organizations. The Preserving Access to Medicare Act of 2014 recently resulted in the
requirement that HCPs utilize a “qualified medical decision support mechanism” (generally a
certified technology application) and document the appropriate use criteria in the patient record
when they order any advanced imaging such as a computed tomography scan. Once again, many
current EMR systems do not have functionality around this documentation requirement. A busy
HCP might order several of these exams in the course of one day, necessitating a multistep
workflow in more than one system. This is another example of the health system’s imperative to
control costs, inadvertently creating increased documentation and clerical burden to
organizations and ultimately the HCP. Organizational and individual factors aside, to truly
address the EMR component of burnout, all stakeholders must be committed to decreasing the
burden of measurement documentation. Usability of the EMR, improved interoperability,
improved application interfaces, and reform of certification standards are critical to this aim.
Physicians’ and other HCPs’ engagement in the design and implementation of the EMR would
optimize customizations and workflows more aligned with actual provider practice.
Organizations are encouraged to actively assess burnout and risk of burnout in their clinicians
and provide access to appropriate health and wellness programs (Jha et al., 2018).
Contribution and Potential for Sustainability
The IHI (2020) uses the model for improvement to guide improvement projects with the
aim of improving healthcare outcomes and processes. In this model, an objective is reached by
employing a series of plan-do-study-act (PDSA) cycles. These action and change oriented cycles
help determine whether a change leads to an improvement in a real work environment (IHI,
2020). The completed DNP project, implementation of an EMR training program, might be
49
viewed as a single PDSA cycle and the conclusions used to develop and implement further
changes to address burnout through improving EMR training and processes.
Subsequent to the completion of the DNP project, at an organizational level, ongoing
efforts have improved EMR workflow development and improvement. Medical assistants have
been trained on functionality and use of the quality tab and are now responsible for data entry
input for most of the quality measures. HCPs no longer manually enter any data into the quality
tab with the exception of exclusions (removing a patient from the measure through medical
history, i.e., excluding a female with bilateral mastectomy from mammogram screening) since
this was determined to be outside the scope of medical assistants. This process change removed
clerical burden from the HCPs in alignment with the goal of alleviating EMR stress and burnout.
Repeated or longitudinal measurement of HCP burnout subsequent to this additional workflow
modification might demonstrate improvement in burnout over time.
The QMR reports are being used at a clinic to generate pursuit lists for patients with
upcoming appointments who have not satisfied each measure. The use of the pursuit lists alerts
clinic staff including the HCP of a gap in patient care in real time. This facilitates discussion
between the HCP and patient and the care plan is modified to improve the health outcome for the
patient. At an organizational level, the QMR reports, which directly reflect the use of the
functionality tab, will be used as a data feed to populate a provider/patient dashboard that
remains in development at this time. In the interim, continued monitoring of provider
performance reports on the nine core quality measures might continue to show an upward trend
over time. The reports might be used to develop additional quality improvement projects. For
example, specific interventions could be developed to improve colon cancer screening, a
50
measure that is particularly challenging in meeting national thresholds for high performance.
The QMR reports are also reported to and audited by multiple payers.
Raising the awareness of organizational leadership regarding the importance of relieving
clerical burden for HCPs in the use of the EMR has contributed to organizational efforts to
continually assess workflows and processes. An EMR superusers committee meets monthly to
address and ameliorate issues in the EMR. HCPs often text, email, or call during clinic hours
with documentation or EMR-related questions. Additional projects implemented in the medical
group in which the DNP student was involved included development and training on encounter
plans and templates for specific patient interactions that required onerous amounts of
documentation. Encounter plans are the Athena version of the SOAP note and were used for
HCPs to document each visit. Encounter plans could be customized, labeled, and prepopulated
with relevant information including billing codes. Standardized encounter plans have been
found to satisfy CMS and health plan requirements, particularly for certain services. The
Medicare Annual Wellness Visits, the Transition of Care, and Comprehensive Visit encounter
plans are all examples of such encounter plans developed and implemented by EMR superusers
with the support of the organization. Currently, the group is developing a workflow to satisfy
PAMA requirements among other projects.
Increasing HCP and organizational awareness of burnout through the project contributed
to development of initiatives to assess and address HCP burnout. A Provider Engagement and
Advocacy Committee (PEAC) has been formed. The committee’s mission is to improve HCP
engagement and assess and address burnout for the medical group. The committee represents the
HCPs to all departments that have direct impact on providers’ or HCPs’ workflow. This could
be related to workload, autonomy, incentives, or communications. The committee serves as an
51
output point for consultation prior to implementation of processes so the viewpoints of HCPs are
represented and considered throughout the organization. The committee also serves as a neutral
contact for any HCP and staff who might be having problems or issues related to workflow,
patient care improvement, etc.
Raising the awareness of organizational leadership regarding the importance of relieving
clerical burden for HCPs in the use of the EMR has contributed to organizational efforts to
continually assess workflows and processes.
Utilization and Dissemination of Results
Workflow and training materials produced through the DNP project are currently in use
by HCPs in the organization. They have been published to the organization’s intranet and are
available to any team member as references. The DNP project will be disseminated to
organizational stakeholders and senior leadership, highlighting the need for organizational
structure and culture to support HCPs in the six key burnout domains.
Further dissemination might occur through publications and presentations through
national and international professional medical and NP organizations.
Conclusion
Healthcare provider (HCP) burnout is a significant issue in the U.S. healthcare system,
impacting HCP health and patient care at a significant cost. The development of national value-
based payment models and implementation of the EMR has increased documentation and clerical
burden for HCPs and contributed to burnout. Organizational efforts such as ongoing training,
workflow improvements, and peer support are important to help address the HCP burnout
epidemic. Health organizations should recognize the long-term value of programs to assess and
address HCP burnout. Healthcare policy should focus on decreasing documentation burden by
52
standardizing and centralizing reporting, improving interoperability between information
systems, and engaging HCPs in all aspects of the healthcare system.

53
Appendix A: Provider Demographics Survey Tool
Demographics
Please check the appropriate box
Gender: Male_______ Female_______
Age: 25-30____ 31-35____36-40____ 41-45____46-50____ 51-55____56-60____ 61-
65____ > 65
Credential: MD______ DO_______ NP_______ PA______
1. How do you rate your current skill level using the quality tab in the EMR??
1. Excellent
2. Good
3. Average
4. Below average
5. Poor
2. How often do you use the quality tab function in the EMR?
1. Always
2. Most of the time
3. Some of the time
4. Rarely
5. Never
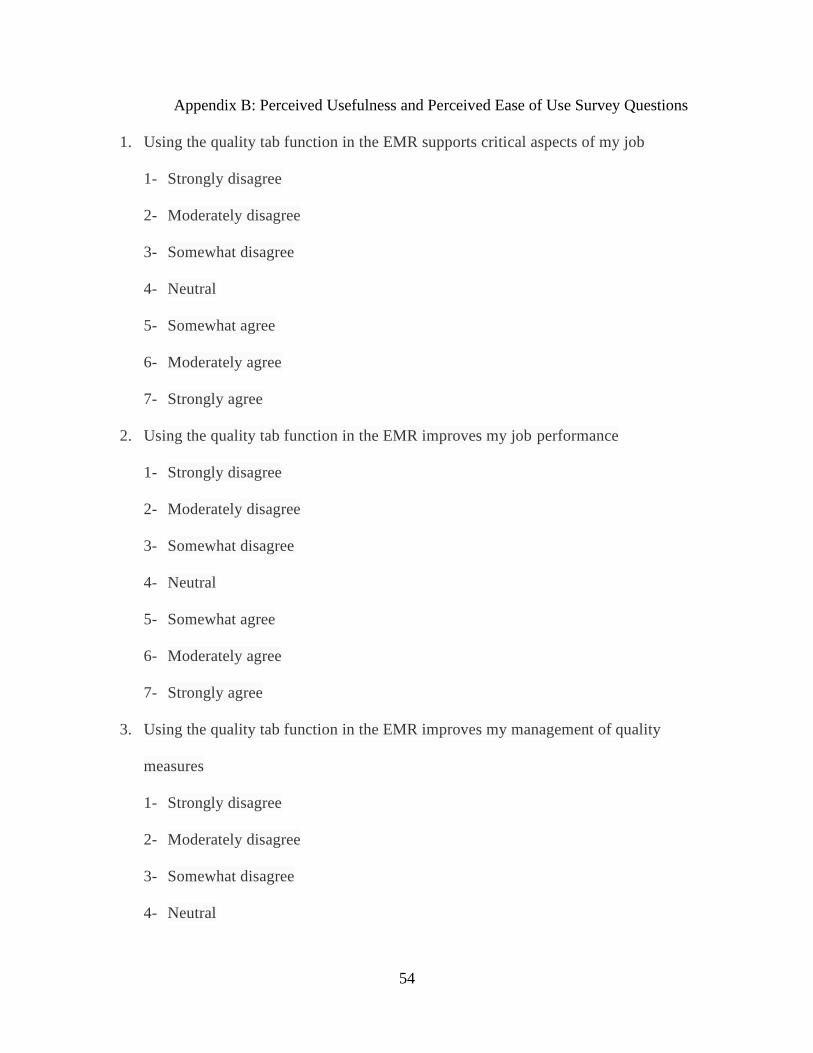
54
Appendix B: Perceived Usefulness and Perceived Ease of Use Survey Questions
1. Using the quality tab function in the EMR supports critical aspects of my job
1- Strongly disagree
2- Moderately disagree
3- Somewhat disagree
4- Neutral
5- Somewhat agree
6- Moderately agree
7- Strongly agree
2. Using the quality tab function in the EMR improves my job performance
1- Strongly disagree
2- Moderately disagree
3- Somewhat disagree
4- Neutral
5- Somewhat agree
6- Moderately agree
7- Strongly agree
3. Using the quality tab function in the EMR improves my management of quality
measures
1- Strongly disagree
2- Moderately disagree
3- Somewhat disagree
4- Neutral
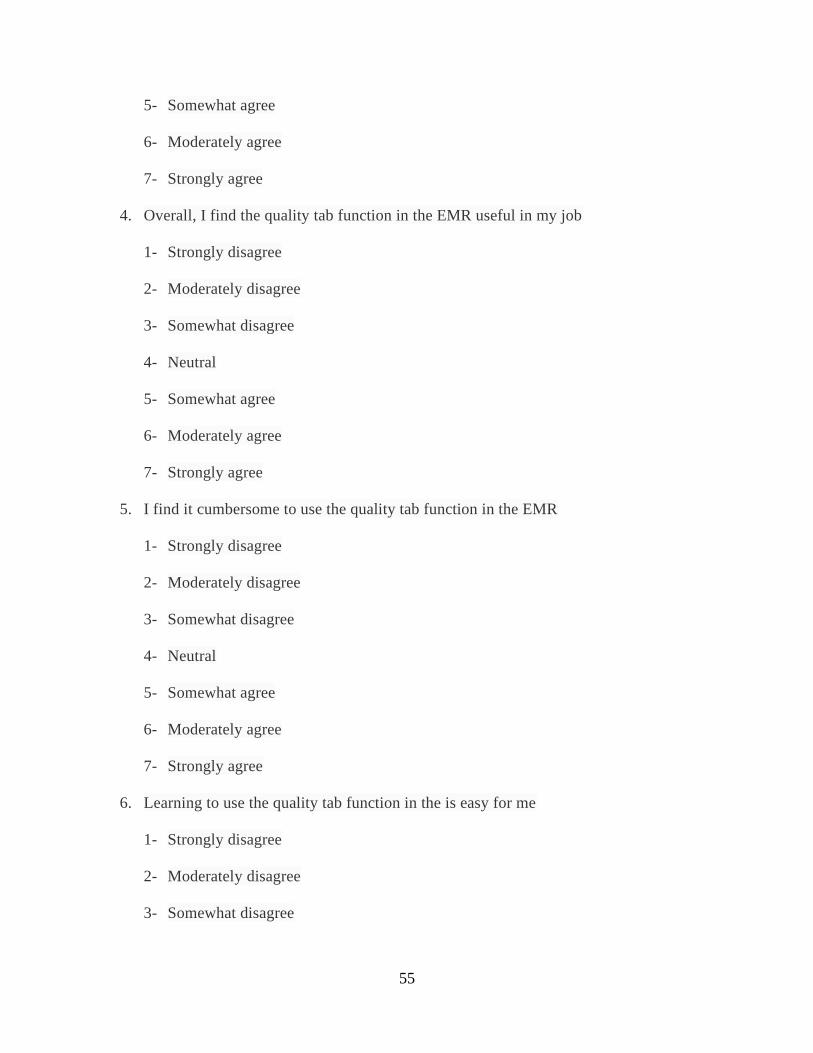
55
5- Somewhat agree
6- Moderately agree
7- Strongly agree
4. Overall, I find the quality tab function in the EMR useful in my job
1- Strongly disagree
2- Moderately disagree
3- Somewhat disagree
4- Neutral
5- Somewhat agree
6- Moderately agree
7- Strongly agree
5. I find it cumbersome to use the quality tab function in the EMR
1- Strongly disagree
2- Moderately disagree
3- Somewhat disagree
4- Neutral
5- Somewhat agree
6- Moderately agree
7- Strongly agree
6. Learning to use the quality tab function in the is easy for me
1- Strongly disagree
2- Moderately disagree
3- Somewhat disagree
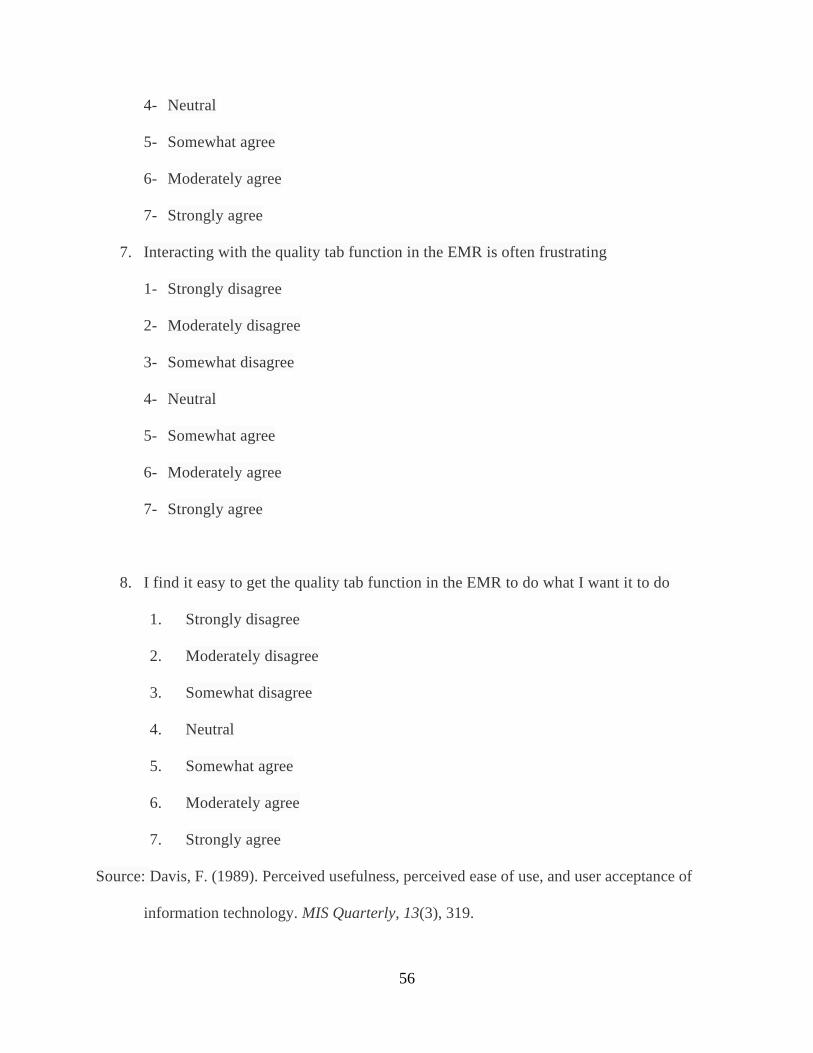
56
4- Neutral
5- Somewhat agree
6- Moderately agree
7- Strongly agree
7. Interacting with the quality tab function in the EMR is often frustrating
1- Strongly disagree
2- Moderately disagree
3- Somewhat disagree
4- Neutral
5- Somewhat agree
6- Moderately agree
7- Strongly agree
8. I find it easy to get the quality tab function in the EMR to do what I want it to do
1. Strongly disagree
2. Moderately disagree
3. Somewhat disagree
4. Neutral
5. Somewhat agree
6. Moderately agree
7. Strongly agree
Source: Davis, F. (1989). Perceived usefulness, perceived ease of use, and user acceptance of
information technology. MIS Quarterly, 13(3), 319.
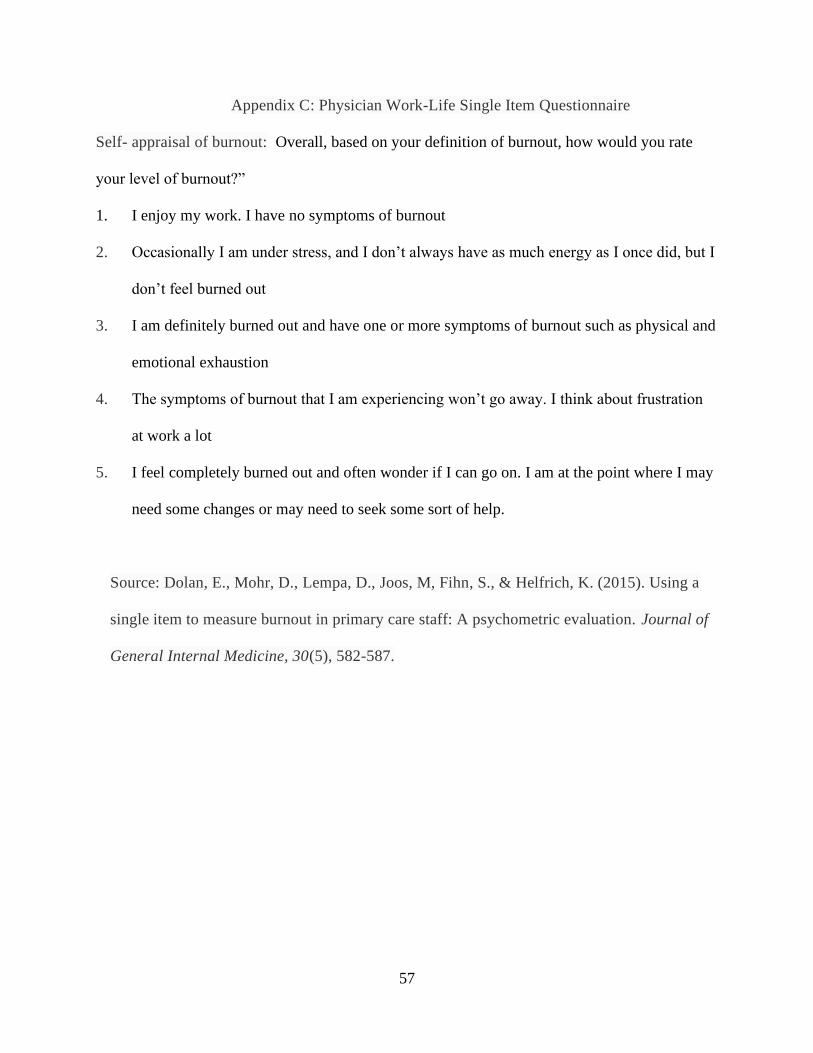
57
Appendix C: Physician Work-Life Single Item Questionnaire
Self- appraisal of burnout: Overall, based on your definition of burnout, how would you rate
your level of burnout?”
1. I enjoy my work. I have no symptoms of burnout
2. Occasionally I am under stress, and I don’t always have as much energy as I once did, but I
don’t feel burned out
3. I am definitely burned out and have one or more symptoms of burnout such as physical and
emotional exhaustion
4. The symptoms of burnout that I am experiencing won’t go away. I think about frustration
at work a lot
5. I feel completely burned out and often wonder if I can go on. I am at the point where I may
need some changes or may need to seek some sort of help.
Source: Dolan, E., Mohr, D., Lempa, D., Joos, M, Fihn, S., & Helfrich, K. (2015). Using a
single item to measure burnout in primary care staff: A psychometric evaluation. Journal of
General Internal Medicine, 30(5), 582-587.
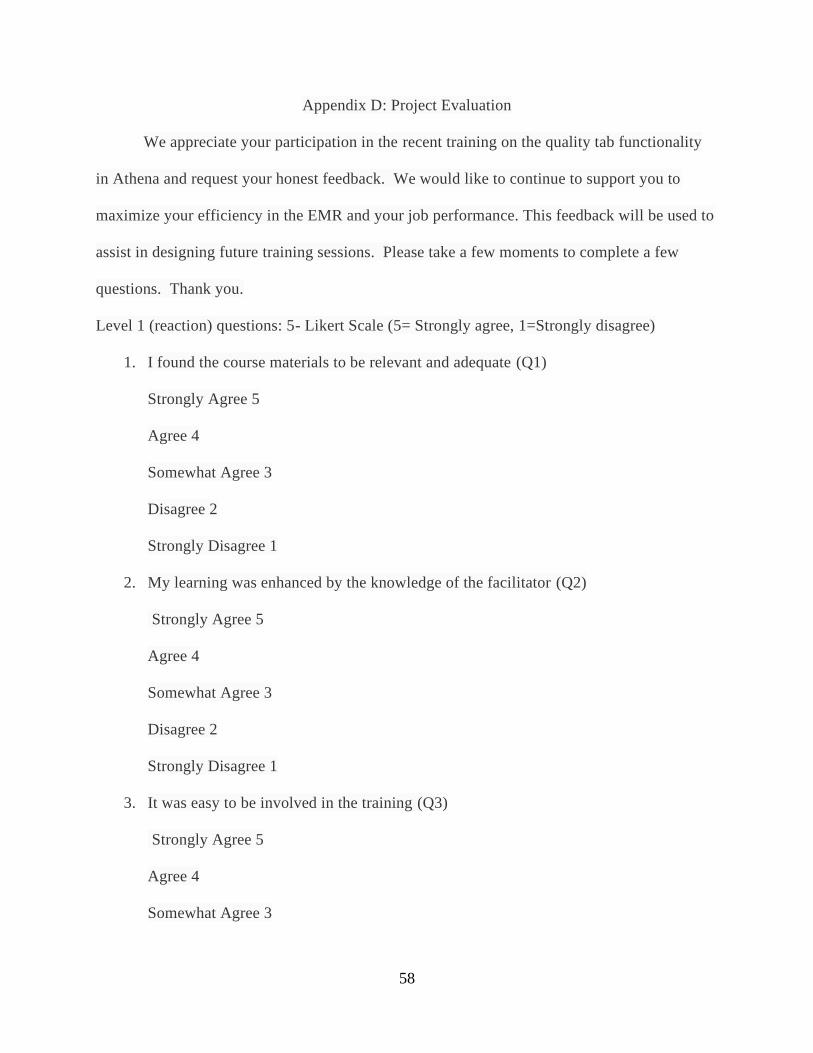
58
Appendix D: Project Evaluation
We appreciate your participation in the recent training on the quality tab functionality
in Athena and request your honest feedback. We would like to continue to support you to
maximize your efficiency in the EMR and your job performance. This feedback will be used to
assist in designing future training sessions. Please take a few moments to complete a few
questions. Thank you.
Level 1 (reaction) questions: 5- Likert Scale (5= Strongly agree, 1=Strongly disagree)
1. I found the course materials to be relevant and adequate (Q1)
Strongly Agree 5
Agree 4
Somewhat Agree 3
Disagree 2
Strongly Disagree 1
2. My learning was enhanced by the knowledge of the facilitator (Q2)
Strongly Agree 5
Agree 4
Somewhat Agree 3
Disagree 2
Strongly Disagree 1
3. It was easy to be involved in the training (Q3)
Strongly Agree 5
Agree 4
Somewhat Agree 3
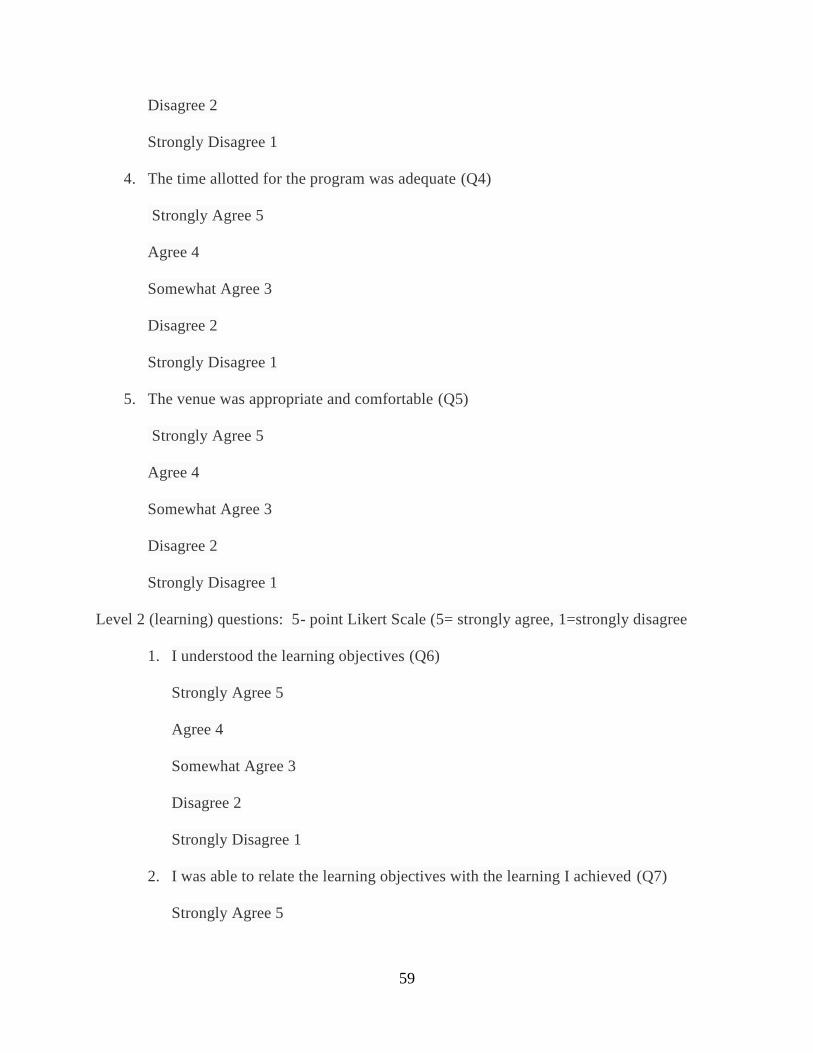
59
Disagree 2
Strongly Disagree 1
4. The time allotted for the program was adequate (Q4)
Strongly Agree 5
Agree 4
Somewhat Agree 3
Disagree 2
Strongly Disagree 1
5. The venue was appropriate and comfortable (Q5)
Strongly Agree 5
Agree 4
Somewhat Agree 3
Disagree 2
Strongly Disagree 1
Level 2 (learning) questions: 5- point Likert Scale (5= strongly agree, 1=strongly disagree
1. I understood the learning objectives (Q6)
Strongly Agree 5
Agree 4
Somewhat Agree 3
Disagree 2
Strongly Disagree 1
2. I was able to relate the learning objectives with the learning I achieved (Q7)
Strongly Agree 5

60
Agree 4
Somewhat Agree 3
Disagree 2
Strongly Disagree 1
3. I was given ample opportunity to demonstrate my knowledge (Q8)
Strongly Agree 5
Agree 4
Somewhat Agree 3
Disagree 2
Strongly Disagree 1
Level 3 (behavior) questions: 5-point Likert Scale (1=strongly agree, 5=strongly disagree)
1. I will be able to apply what I learned (Q9)
Strongly Agree 5
Agree 4
Somewhat Agree 3
Disagree 2
Strongly Disagree 1
2. I am clear about what is expected of me as a result of going through this training
(Q10)
Strongly Agree 5
Agree 4
Somewhat Agree 3
Disagree 2
61
Strongly Disagree 1
I do not anticipate any barriers to applying what I learned (Q11)
Strongly Agree 5
Agree 4
Somewhat Agree 3
Disagree 2
Strongly Disagree 1
Level 4 ( result) question:
5- point Likert Scale (5= strongly agree, 1= strongly disagree
1. I anticipate that I will eventually see positive results as a result of using the quality
tab (Q12)
Strongly Agree 5
Agree 4
Somewhat Agree 3
Disagree 2
Strongly Disagree 1
Do you feel that poor efficiency in the EMR contributes to health care provider burnout? If
yes, please explain briefly.
What EMR topics of functionality would you like presented in future training sessions?
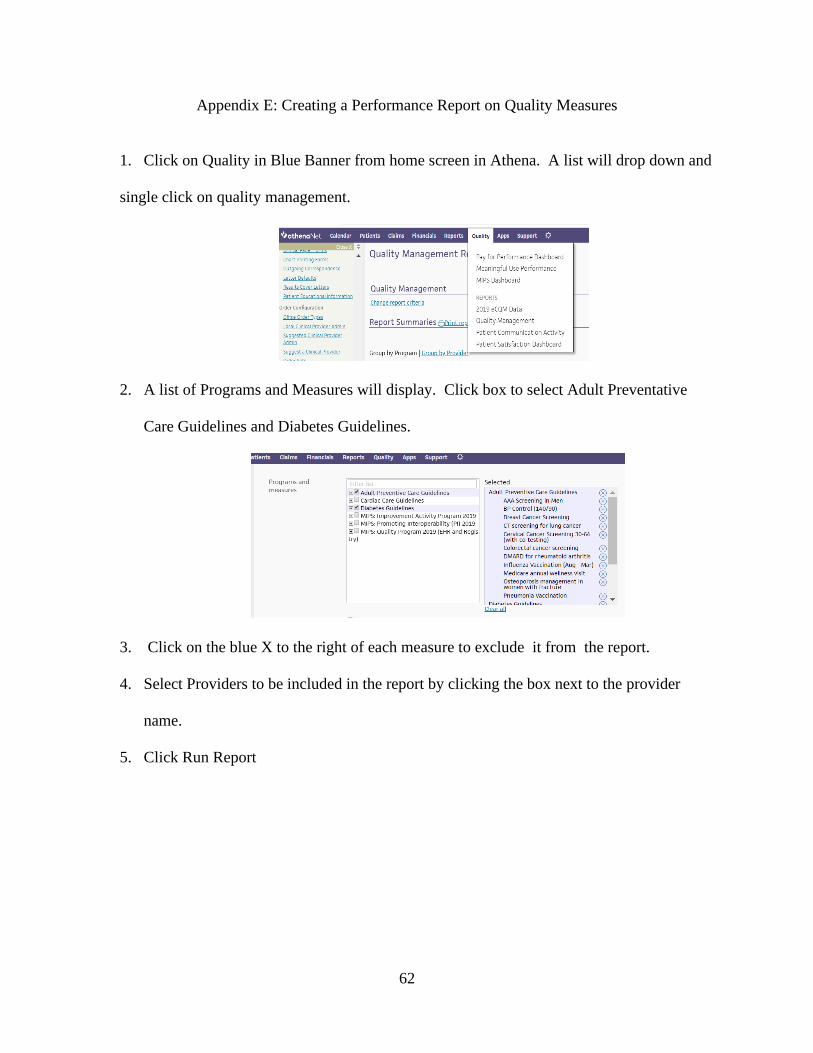
62
Appendix E: Creating a Performance Report on Quality Measures
1. Click on Quality in Blue Banner from home screen in Athena. A list will drop down and
single click on quality management.
2. A list of Programs and Measures will display. Click box to select Adult Preventative
Care Guidelines and Diabetes Guidelines.
3. Click on the blue X to the right of each measure to exclude it from the report.
4. Select Providers to be included in the report by clicking the box next to the provider
name.
5. Click Run Report
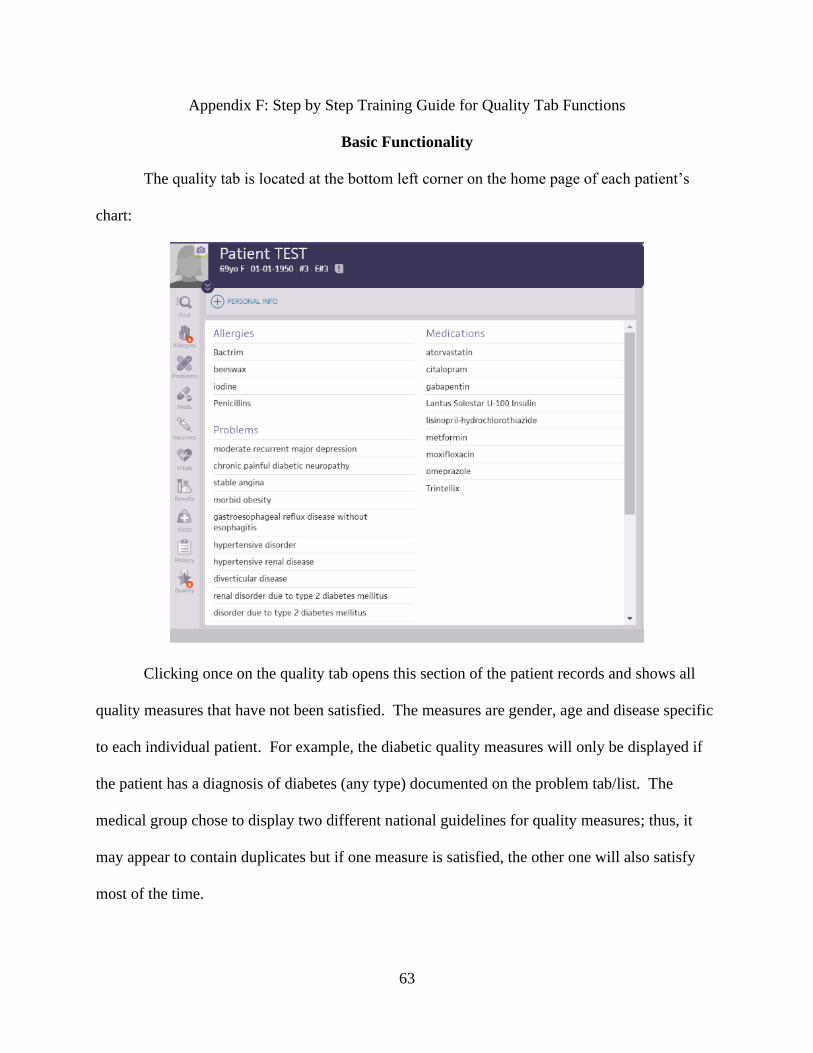
63
Appendix F: Step by Step Training Guide for Quality Tab Functions
Basic Functionality
The quality tab is located at the bottom left corner on the home page of each patient’s
chart:
Clicking once on the quality tab opens this section of the patient records and shows all
quality measures that have not been satisfied. The measures are gender, age and disease specific
to each individual patient. For example, the diabetic quality measures will only be displayed if
the patient has a diagnosis of diabetes (any type) documented on the problem tab/list. The
medical group chose to display two different national guidelines for quality measures; thus, it
may appear to contain duplicates but if one measure is satisfied, the other one will also satisfy
most of the time.
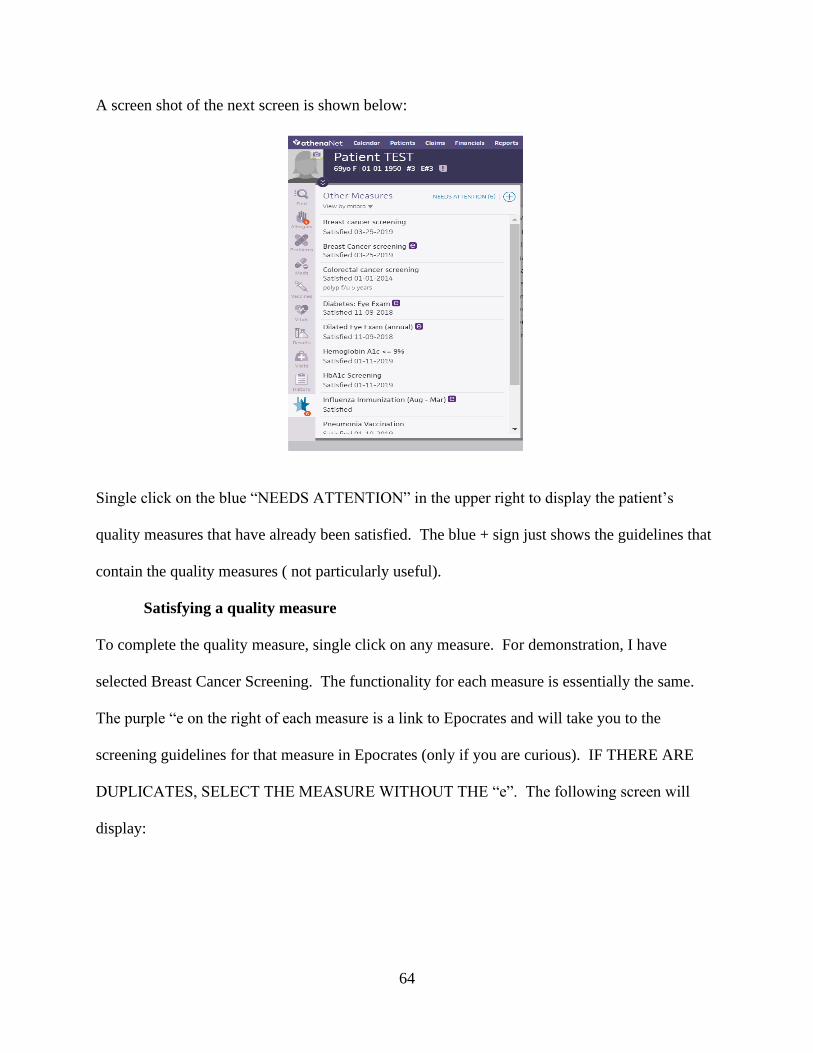
64
A screen shot of the next screen is shown below:
Single click on the blue “NEEDS ATTENTION” in the upper right to display the patient’s
quality measures that have already been satisfied. The blue + sign just shows the guidelines that
contain the quality measures ( not particularly useful).
Satisfying a quality measure
To complete the quality measure, single click on any measure. For demonstration, I have
selected Breast Cancer Screening. The functionality for each measure is essentially the same.
The purple “e on the right of each measure is a link to Epocrates and will take you to the
screening guidelines for that measure in Epocrates (only if you are curious). IF THERE ARE
DUPLICATES, SELECT THE MEASURE WITHOUT THE “e”. The following screen will
display:
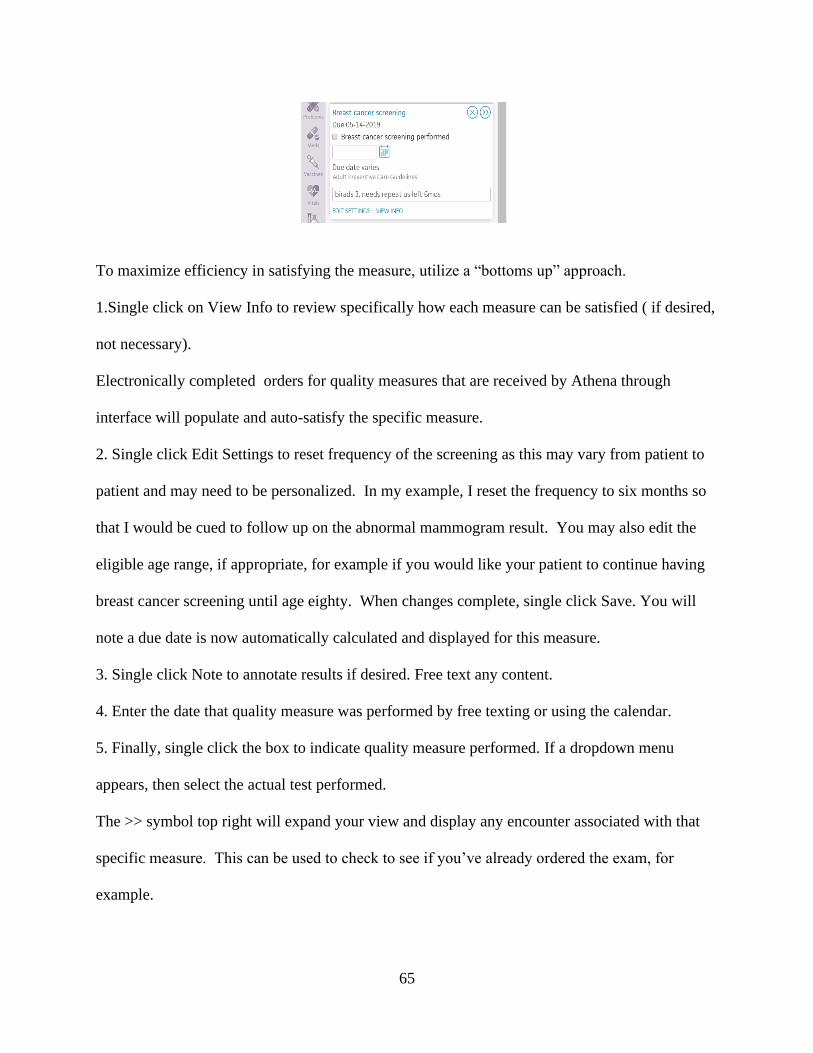
65
To maximize efficiency in satisfying the measure, utilize a “bottoms up” approach.
1.Single click on View Info to review specifically how each measure can be satisfied ( if desired,
not necessary).
Electronically completed orders for quality measures that are received by Athena through
interface will populate and auto-satisfy the specific measure.
2. Single click Edit Settings to reset frequency of the screening as this may vary from patient to
patient and may need to be personalized. In my example, I reset the frequency to six months so
that I would be cued to follow up on the abnormal mammogram result. You may also edit the
eligible age range, if appropriate, for example if you would like your patient to continue having
breast cancer screening until age eighty. When changes complete, single click Save. You will
note a due date is now automatically calculated and displayed for this measure.
3. Single click Note to annotate results if desired. Free text any content.
4. Enter the date that quality measure was performed by free texting or using the calendar.
5. Finally, single click the box to indicate quality measure performed. If a dropdown menu
appears, then select the actual test performed.
The >> symbol top right will expand your view and display any encounter associated with that
specific measure. This can be used to check to see if you’ve already ordered the exam, for
example.
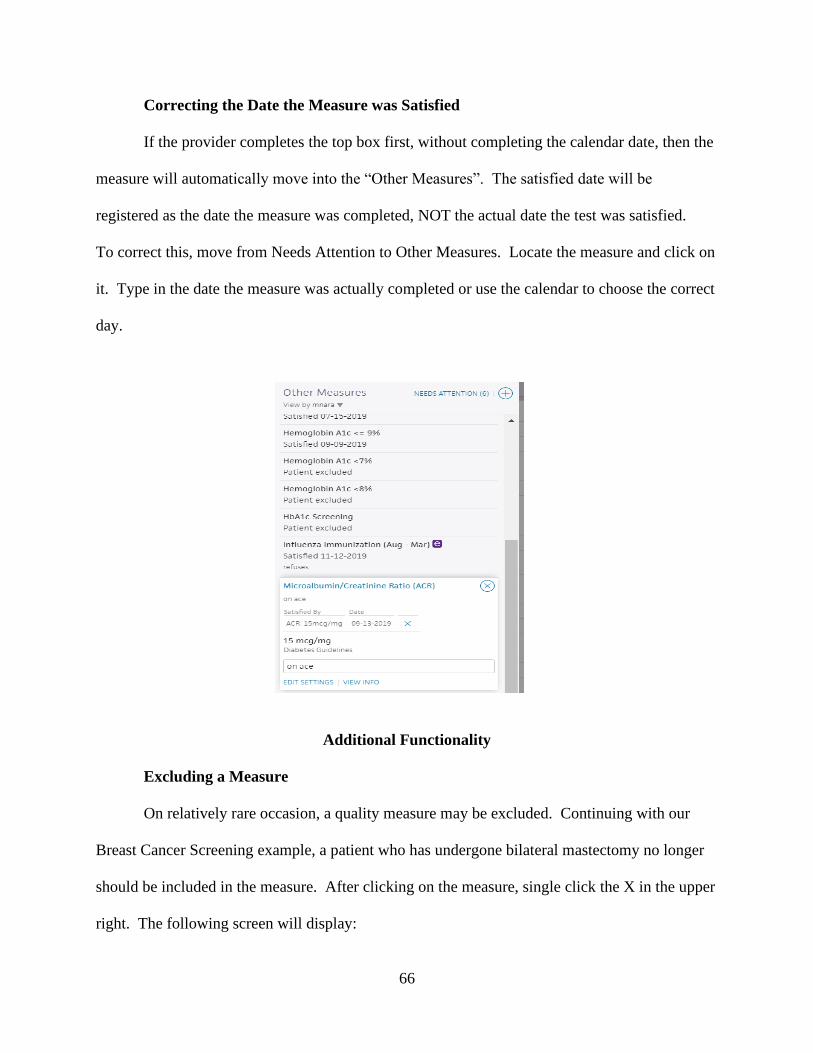
66
Correcting the Date the Measure was Satisfied
If the provider completes the top box first, without completing the calendar date, then the
measure will automatically move into the “Other Measures”. The satisfied date will be
registered as the date the measure was completed, NOT the actual date the test was satisfied.
To correct this, move from Needs Attention to Other Measures. Locate the measure and click on
it. Type in the date the measure was actually completed or use the calendar to choose the correct
day.
Additional Functionality
Excluding a Measure
On relatively rare occasion, a quality measure may be excluded. Continuing with our
Breast Cancer Screening example, a patient who has undergone bilateral mastectomy no longer
should be included in the measure. After clicking on the measure, single click the X in the upper
right. The following screen will display:
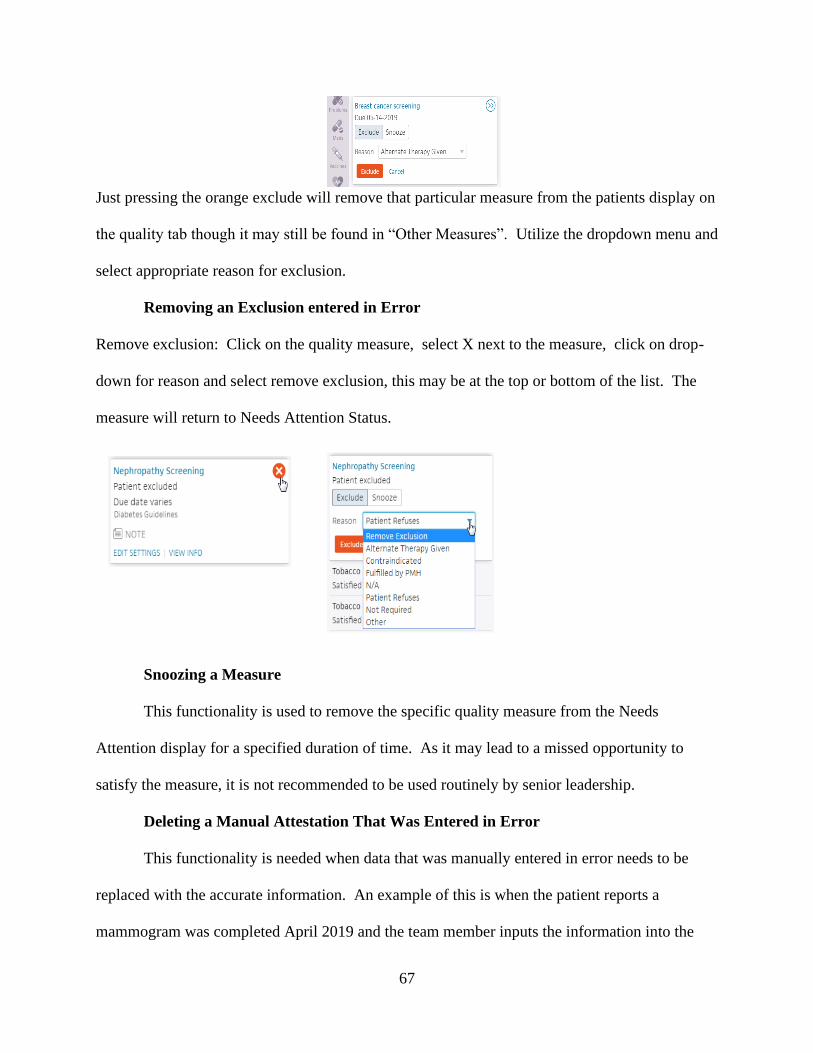
67
Just pressing the orange exclude will remove that particular measure from the patients display on
the quality tab though it may still be found in “Other Measures”. Utilize the dropdown menu and
select appropriate reason for exclusion.
Removing an Exclusion entered in Error
Remove exclusion: Click on the quality measure, select X next to the measure, click on drop-
down for reason and select remove exclusion, this may be at the top or bottom of the list. The
measure will return to Needs Attention Status.
Snoozing a Measure
This functionality is used to remove the specific quality measure from the Needs
Attention display for a specified duration of time. As it may lead to a missed opportunity to
satisfy the measure, it is not recommended to be used routinely by senior leadership.
Deleting a Manual Attestation That Was Entered in Error
This functionality is needed when data that was manually entered in error needs to be
replaced with the accurate information. An example of this is when the patient reports a
mammogram was completed April 2019 and the team member inputs the information into the
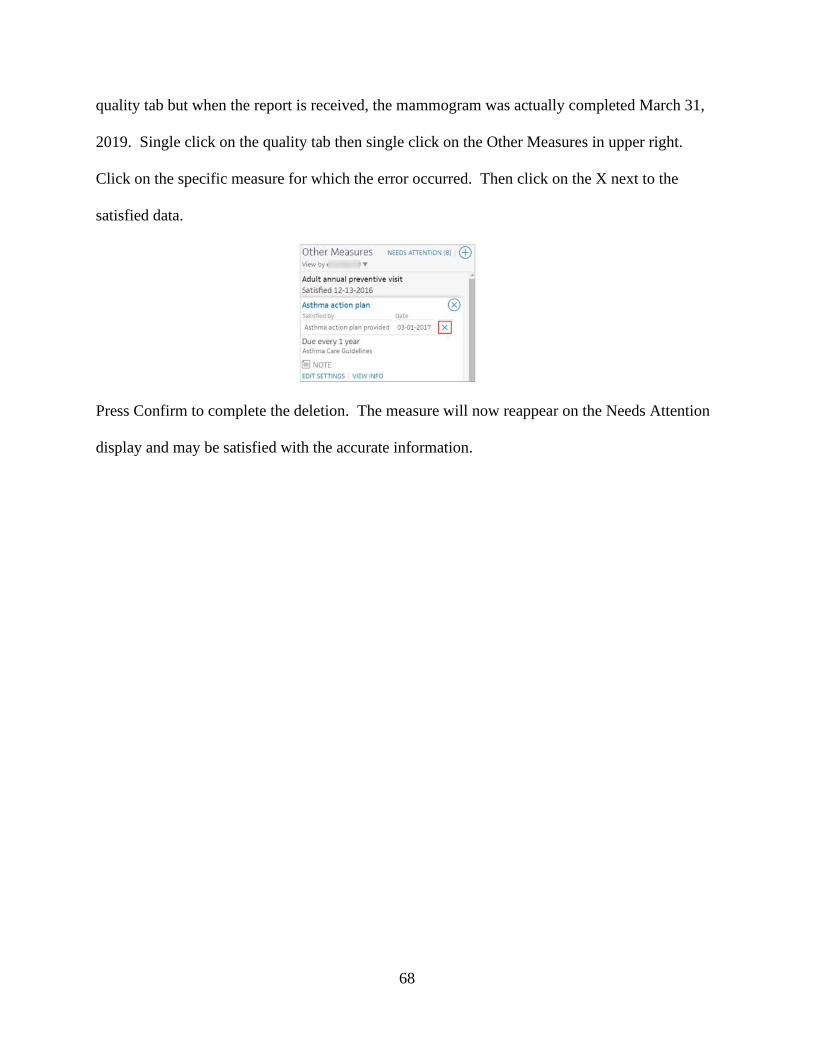
68
quality tab but when the report is received, the mammogram was actually completed March 31,
2019. Single click on the quality tab then single click on the Other Measures in upper right.
Click on the specific measure for which the error occurred. Then click on the X next to the
satisfied data.
Press Confirm to complete the deletion. The measure will now reappear on the Needs Attention
display and may be satisfied with the accurate information.
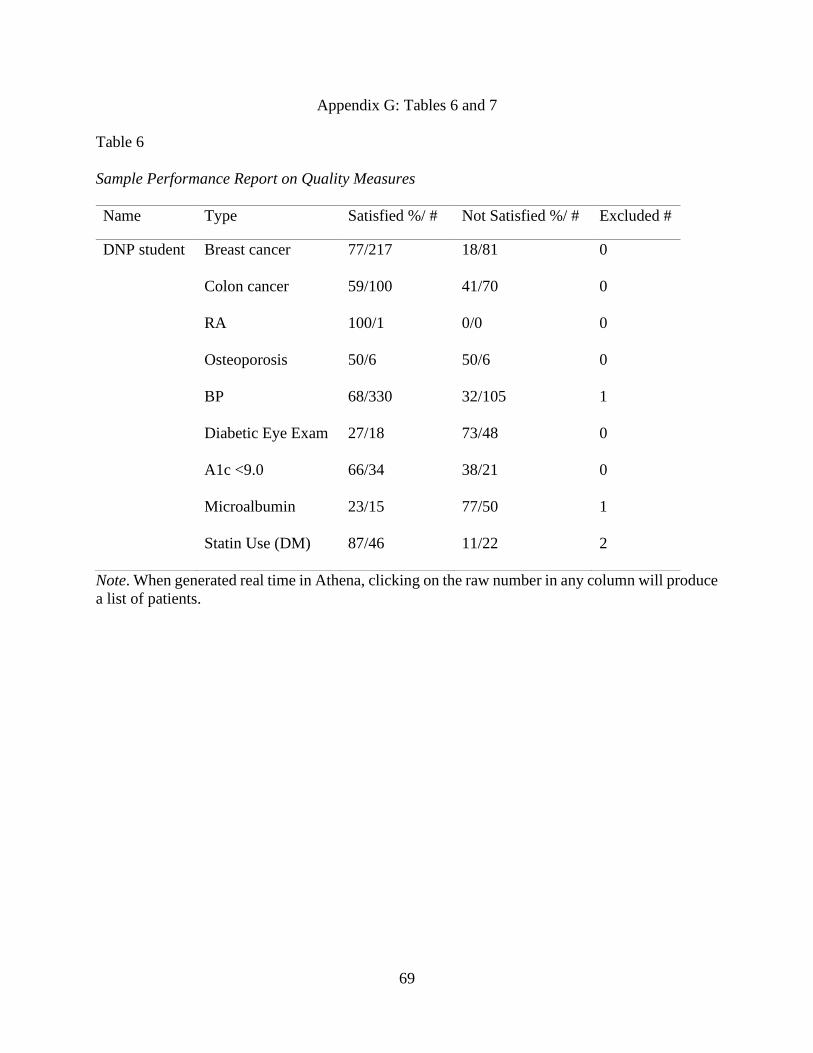
69
Appendix G: Tables 6 and 7
Table 6
Sample Performance Report on Quality Measures
Name Type Satisfied %/ # Not Satisfied %/ # Excluded #
DNP student Breast cancer 77/217 18/81 0
Colon cancer 59/100 41/70 0
RA 100/1 0/0 0
Osteoporosis 50/6 50/6 0
BP 68/330 32/105 1
Diabetic Eye Exam 27/18 73/48 0
A1c <9.0 66/34 38/21 0
Microalbumin 23/15 77/50 1
Statin Use (DM) 87/46 11/22 2
Note. When generated real time in Athena, clicking on the raw number in any column will produce
a list of patients.
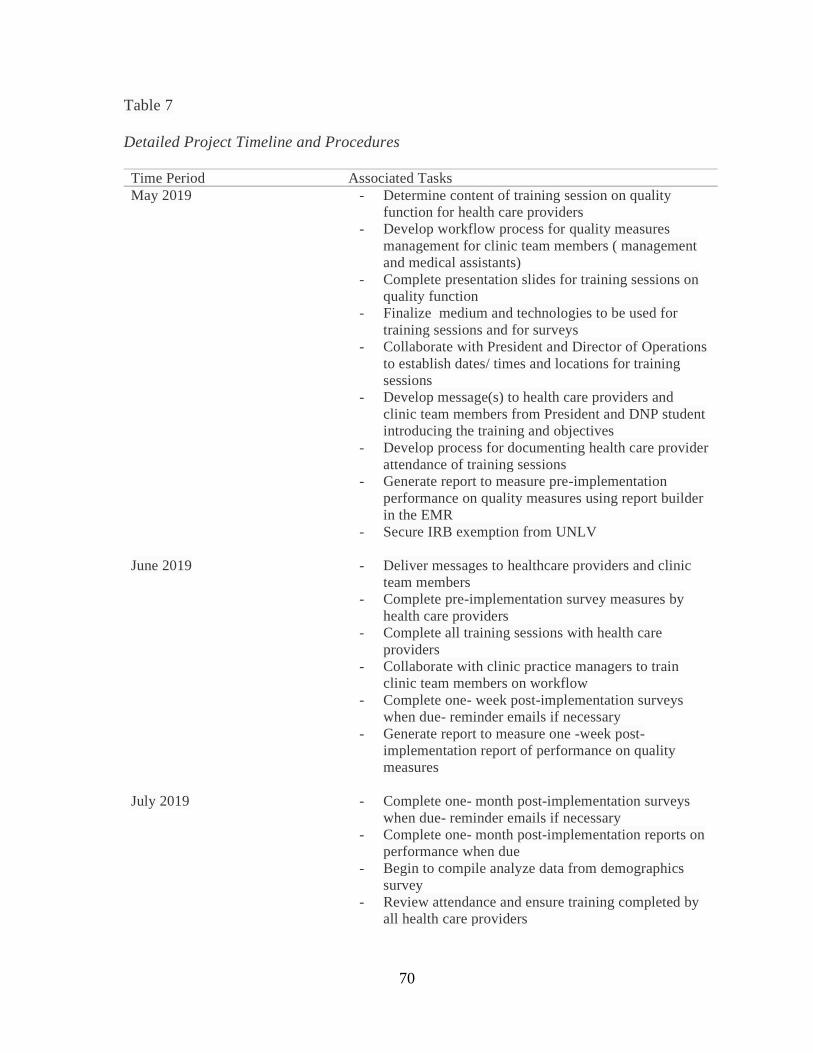
70
Table 7
Detailed Project Timeline and Procedures
Time Period Associated Tasks
May 2019 - Determine content of training session on quality
function for health care providers
- Develop workflow process for quality measures
management for clinic team members ( management
and medical assistants)
- Complete presentation slides for training sessions on
quality function
- Finalize medium and technologies to be used for
training sessions and for surveys
- Collaborate with President and Director of Operations
to establish dates/ times and locations for training
sessions
- Develop message(s) to health care providers and
clinic team members from President and DNP student
introducing the training and objectives
- Develop process for documenting health care provider
attendance of training sessions
- Generate report to measure pre-implementation
performance on quality measures using report builder
in the EMR
- Secure IRB exemption from UNLV
June 2019 - Deliver messages to healthcare providers and clinic
team members
- Complete pre-implementation survey measures by
health care providers
- Complete all training sessions with health care
providers
- Collaborate with clinic practice managers to train
clinic team members on workflow
- Complete one- week post-implementation surveys
when due- reminder emails if necessary
- Generate report to measure one -week post-
implementation report of performance on quality
measures
July 2019 - Complete one- month post-implementation surveys
when due- reminder emails if necessary
- Complete one- month post-implementation reports on
performance when due
- Begin to compile analyze data from demographics
survey
- Review attendance and ensure training completed by
all health care providers
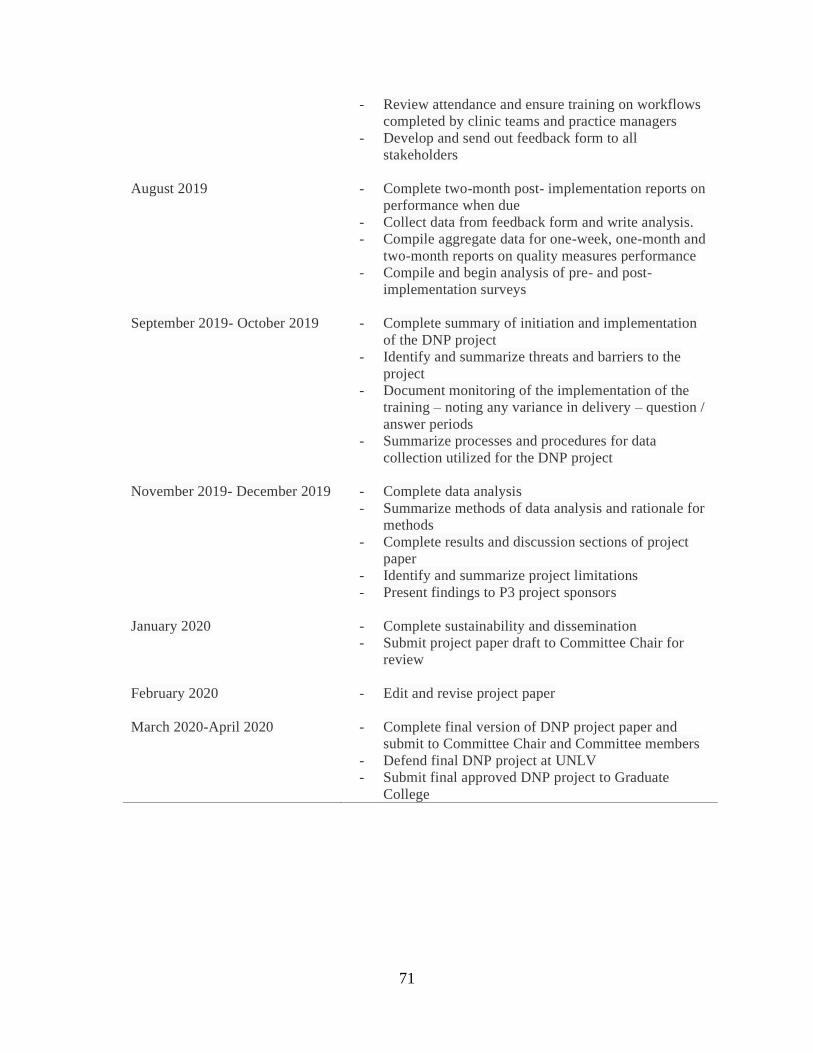
71
- Review attendance and ensure training on workflows
completed by clinic teams and practice managers
- Develop and send out feedback form to all
stakeholders
August 2019 - Complete two-month post- implementation reports on
performance when due
- Collect data from feedback form and write analysis.
- Compile aggregate data for one-week, one-month and
two-month reports on quality measures performance
- Compile and begin analysis of pre- and post-
implementation surveys
September 2019- October 2019 - Complete summary of initiation and implementation
of the DNP project
- Identify and summarize threats and barriers to the
project
- Document monitoring of the implementation of the
training – noting any variance in delivery – question /
answer periods
- Summarize processes and procedures for data
collection utilized for the DNP project
November 2019- December 2019 - Complete data analysis
- Summarize methods of data analysis and rationale for
methods
- Complete results and discussion sections of project
paper
- Identify and summarize project limitations
- Present findings to P3 project sponsors
January 2020 - Complete sustainability and dissemination
- Submit project paper draft to Committee Chair for
review
February 2020 - Edit and revise project paper
March 2020-April 2020 - Complete final version of DNP project paper and
submit to Committee Chair and Committee members
- Defend final DNP project at UNLV
- Submit final approved DNP project to Graduate
College
72
References
Abdekhoda, M., Ahmadi, M., Dehnad, A., Noruzi, A., & Gohari, M. (2016). Applying electronic
medical records in health care: Physicians’ perspective. Applied Clinical Informatics, 7,
341–354. http://dx.doi.org/10.4338/ACI-2015-11-RA-0165
Affordable Care Act, 124 Stat. 119 through 124 Stat. 1025, Publ. L. 111-148 (2010).
Ardnt, B. G., Beasley, J. W., Watkinson, M. D., Temte, J. L., Tuan, W., Sinsky, C. A., &
Gilchrist, V. J. (2017). Tethered to the EHR: Primary care physician workload
assessment using EHR event log data and time-motion observations. Annals of Family
Medicine, 15, 419-426. Retrieved from https://doi.org/10.1370/afm.2121
Babbott, S., Manwell, L. B., Brown, R., Montague, E., Williams, E., Schwartz, M., … Linzer, M.
(2014). Electronic medical records and physician stress in primary care: Results from the
MEMO study. Journal of the American Medical Informatics Association, 21, e100-e106.
doi:10.1136/amiainl-2013-001875
Baron, R. (2010). What's keeping us so busy in primary care? A snapshot from one practice. The
New England Journal of Medicine, 362(17), 1632-1636. doi:10.1056/NEJMon0910793
Boonstra, A., & Broekhuis, M. (2010). Barriers to the acceptance of electronic medical records
by physicians from systematic review to taxonomy and interventions. BMC Health
Services Research, 10(1), 231. Retrieved from http://www.biomedcentral.com1472-
6963/10/231
Bredfeldt, C., Awad, E., Joseph, K., & Snyder, M. (2013). Training providers: Beyond the basics
of electronic health records. BMC Health Services Research, 13(1), 503.Retrieved from
http://www.biomedcentral.com/1472-6963/13/503
73
Burnout. (2018.) In Merriam Webster online. Retrieved from https://www.merriam-
webster.com/dictionary/burnout
Centers for Medicare and Medicaid Services. (2010). CMS finalizes definition of meaningful use
of certified electronic health records (EHR) technology. Retrieved from
https://www.cms.gov/newsroom/fact-sheets/cms-finalizes-definition-meaningful-use-
certified-electronic-health-records-ehr-technology
Centers for Medicare and Medicaid Services. (2018). National impact assessment of the Centers
for Medicare & Medicaid Services (CMS) quality measures report. Retrieved from
https://www.cms.gov/Medicare/Quality-Initiatives-Patient-Assessment-
Instruments/QualityMeasures/Downloads/2018-Impact-Assessment-Report.pdf
Centers for Disease Control and Prevention. (2019). Meaningful use. Retrieved from
https://www.cdc.gov/ehrmeaningfuluse/introduction.html
Chen, S. C., Li, S. H., & Li, C. Y. (2011). Recent related research in technology acceptance
model: A literature review. Australian Journal of Business and Management Research,
1(5), 124-127. Retrieved from http://www.ajbmr.com/articlepdf/AJBMR _19_
04i1n9a14.pdf
Dastagir, M., Chin, H., Mcnamara, M., Poteraj, K., Battaglini, S., & Alstot, L. (2012). Advanced
proficiency EHR training: Effect on physicians' EHR efficiency, EHR satisfaction and
job satisfaction. AMIA ... Annual Symposium Proceedings. 2012, 136-43.
Davis, F. (1989). Perceived usefulness, perceived ease of use, and user acceptance of information
technology. MIS Quarterly, 13(3), 319.
74
Dolan, E., Mohr, D., Lempa, D., Joos, M., Fihn, S., Nelson, S., & Helfrich, K. (2015). Using a
single item to measure burnout in primary care staff: A psychometric evaluation. Journal
of General Internal Medicine, 30(5), 582-587.
Downing-Peck, A. (2013). EHR implementation: Training pays dividends: Thoroughly
understanding your system before going live will save money and minimize practice
disruption later. Medical Economics, 90(14), 53-56.
Edwards, G., Kitzmiller, R. R., & Breckenridge-Sproat, S. (2012). Innovative health information
technology training: Exploring blended learning. Computers Informatics Nursing, 30(2),
104-109. https://doi.org/10.1097/NCN.0b013e31822f7f7a
Ehrenfeld, J. M., & Wanderer, J. (2018). Technology as friend or foe: Do electronic health
records increase burnout? Current Opinions in Anesthesiology,31(3), 357-360.
doi:10.1097/ACO.0000000000000588
Gardner, R. L., Cooper, E., Haskell, J., Harris, D. A., Poplau, S., Kroth, P. J. & Linzer, M.
(2019). Physician stress and burnout: The impact of health information technology.
Journal of the American Medical Informatics Association, 26(2), 106-114. doi:
10.1093/jamia/ocy145
Gold, M., & McLaughlin, C. (2016). Assessing HITECH implementation and lessons: 5 years
later. Milbank Quarterly, 94(3), 654-687. Retrieved from https://doi-
org.ezproxy.library.unlv.edu/10.1111/1468-0009.12214
Hall, L. H., Johnson, J., Watt, I., Tsipa, A., & O’Connor, D.B. (2016). Healthcare staff
wellbeing, burnout, and patient safety: A systematic review. PLoS ONE, 11(7),
e0159015. doi:10.1371/journal. pone.015901588
75
Han, S., Shanafelt, T., Sinsky, C., Awad, K., Dyrbye, L., Fiscus, L., . . . Goh, J. (2019).
Estimating the Attributable Cost of Physician Burnout in the United States. Annals of
Internal Medicine, 170(11), 784-790. doi: 10.7326/M18-1422
Harris, D. A., Haskell, J., Cooper, E., Crouse, N., & Gardner, R. (2018). Estimating the
association between burnout and electronic health record-related stress among advanced
practice registered nurses. Applied Nursing Research, 43, 36-41. Retrieved from
https://www-sciencedirect-com.ezproxy.library.unlv.edu/science/article/pii/
S0897189718301356
Health Information Technology for Economic and Clinical Health Act, 111 Public Law 5 (2009).
Hoff, T., Carabetta, S., & Collinson, G. (2019). Satisfaction, burnout, and turnover among nurse
practitioners and physician assistants: A review of the empirical literature. Medical Care
Research and Review, 76(1), 3-31. Retrieved from https://doi-org.ezproxy.library
.unlv.edu/10.1177%2F1077558717730157
Institute for Healthcare Improvement. (2018). Initiatives. Retrieved from
http://www.ihi.org/Engage/Initiatives/TripleAim/Pages/default.aspx
Institute for Healthcare Improvement. (2020). Model for improvement. Retrieved from
http://www.ihi.org/education/ihiopenschool/Courses/Documents/QI102-
FinalOnePager.pdf
Jha, A. K., Iliff, A. R., Chaoui, A. A., Defossez, S, Bombaugh, M. C., & Miller, Y. R. (2018). A
crisis in health care: A call to action on physician burnout. Retrieved from
http://www.massmed.org/News-and-Publications/MMS-News-Releases/Physician-
Burnout-Report-2018/
76
Kalani, S., Azadfallah, P., Oreyzi, H., & Adibi, P. (2018). Interventions for physician burnout: A
systematic review of systematic reviews. International Journal of Preventive Medicine,
9(1), 81. doi: 10.4103/ijpvm.IJPVM_255_18
Kirkpatrick, J. The new world level 1 reaction sheets. Retrieved from
https://kirkpatrickpartners.com/Resources
Kirkpatrick Partners. (2019). The Kirkpatrick model. Retrieved from
https://kirkpatrickpartners.com/Our-Philosophy/The-Kirkpatrick-Model
Linzer, M., Manwell, L. B., Mundt, M., Williams, E., Maguire, A., McMurray, J., …Agency for
Healthcare Research Quality. (2005). Organizational climate, stress, and error in
primary care: The MEMO study. Rockville, MD: Agency for Healthcare Research and
Quality.
Linzer, M., Poplau, S., Grossman, E., Varkey, A., Yale, S., Williams, E., . . . Barbouche, D.
(2015). A Cluster Randomized Trial of Interventions to Improve Work Conditions and
Clinician Burnout in Primary Care: Results from the Healthy Work Place (HWP) Study.
Journal of General Internal Medicine, 30(8), 1105-1111. DOI: 10.1007/s11606-015-
3235-4
Maslach, C., & Leiter, M. P. (2016). Understanding the burnout experience: recent research and
its implications for psychiatry. World Psychiatry, 15(2), 103–111.
doi:10.1002/wps.20311
McBride, M. (2012). Technology training: An investment for success. Medical Economics,
89(20), 35-42.
Medicare Access and CHIP Reauthorization Act of 2015, Publ. L. 114-10 (2015).
77
Medscape. (2019). Medscape physician burnout and depression report, 2018. Retrieved from
https://www.medscape.com/slideshow/2018-lifestyle-burnout-depression-6009235
Meehan, T., Kelvey-Albert, M., Van Hoof, T., Ruth, S., & Petrillo, M. (2014). The path to
quality in outpatient practice: meaningful use, patient-centered medical homes, financial
incentives, and technical assistance. American Journal of Medical Quality ,29(4), 284-
291. doi:10.1177/1062860613500334
Miller, R., & Sims, I. (2004). Physicians' use of electronic medical records: Barriers and
solutions. Health Affairs (Project Hope), 23(2), 116-126. doi:10.1377/hlthaff.23.2.116
Neuman, B., & Fawcett, J. (2011). Neuman systems model (5th ed.). Upper Saddle River, NJ:
Pearson.
O’Donnell, A., Kaner, E., Shaw, C., & Haighton, C. (2018). Primary care physicians’ attitudes to
the adoption of electronic medical records: A systematic review and evidence synthesis
using the clinical adoption framework. BMC Medical Informatics and Decision Making,
18(1), 101.
Panagiotti, M., Panagopoulou, E., Bower, P., Lewith, G., Kontopantelis, E., Chew-Graham, C.,
… Esmail, A. (2017). Controlled interventions to reduce burnout in physicians: A
systematic review and meta-analysis. JAMA Internal Medicine, 177(2), 195-205.
doi:10.1001/jamainternmed.2016.7674
Pantaleoni, J. L., Stevens, L. A., Mailes, E. S., Goad, B. A., & Longhurst, C. A. (2015).
Successful physician training program for large scale EMR implementation. Applied
Clinical Informatics, 6, 80–95. Retrieved from http://dx.doi.org/10.4338/ACI-2014-09-
CR-0076
78
Paré, G., Raymond, L., Guinea, A., Poba-Nzaou, P., Trudel, M., Marsan, J., & Micheneau, T.
(2015). Electronic health record usage behaviors in primary care medical practices: A
survey of family physicians in Canada. International Journal of Medical Informatics,
84(10), 857-867. doi:10.1016/j.ijmedinf.2015.07.005
Robinson, K. E., & Kersey, J. A. (2018). Novel electronic health record (EHR) education
intervention in large healthcare organization improves quality, efficiency, time, and
impact on burnout. Medicine, 97(38), 1-5. Retrieved from http://dx.doi.org/10.1097/
MD0000000000012319
Shanafelt, T., Boone, S., Litjen, T., Dyrbye, L., Sotile, W., Satele, D., …Oreskovich, M. (2012).
Burnout and satisfaction with work-life balance among US physicians relative to the
general US population. Archives of Internal Medicine, 172(18), 1377-1385.
doi:10.1001/archinternmed.2012.3199
Shanafelt, T., Bradley, K., Wipf, J., & Back, A. (2002). Burnout and self-reported patient care in
an internal medicine residency program. Annals of Internal Medicine, 136(5), 358-367.
doi:10.7326/0003-4819-136-5-200203050-00008
Shanafelt, T. D., Dyrbye, L. N., Sinsky, C., Hasan, O., Satele, D., Sloan, J., & West, C. P.
(2016). Relationship between clerical burden and characteristics of the electronic
environment with physician burnout and professional satisfaction. Mayo Clinic
Proceedings, 1(7), 836-848. Retrieved from http://dx.doi.org/10.1016/j.mayocp.2016.
05.007
Spinelli, W. M., Fernstrom, K. M., Britt, H., & Pratt, R. (2016). “Seeing the patient is the joy:” A
focus group analysis of burnout in outpatient providers. Family Medicine, 48(4), 273-
278. Retrieved from http://www.Stfm.org/FamilyMedicine/Vol48Issue4/Spinelli273
79
Tai-Seale, M., Olson, C., Li, J., Chan, A., Morikawa, C., Durbin, M., …Luft, H. (2017).
Electronic health record logs indicate that physicians split time evenly between seeing
patients and desktop medicine. Health Affairs (Project Hope), 36(4), 655-662.
doi:10.1377/hlthaff.2016.0811
Trudel, M., Marsan, J., Paré, G., Raymond, L., Ortiz de Guinea, A., Maillt, E., & Micheneau, T.
(2017). Ceiling effect in EMR system assimilation: A multiple case study in primary care
family practices. BMC Medical Informatics and Decision Making, 17, 46 (2017).
https://doi.org/10.1186/s12911-017-0445-1
Vargas, P. C., Fuente, S., Aguayo, E. I., & Lozano, F. (2011). A meta-analytic reliability
generalization study of the Maslach Burnout Inventory. International Journal of Clinical
and Health Psychology, 11(2), 343-361. Retrieved from
https://doaj.org/article/46d358e37a6d4bbfbb1460135a203b70
Venkatesh, V., & Davis, F. D. (2000). A theoretical extension of the technology acceptance
model: Four longitudinal field studies, Management Science, 46 (2), 186-204.
Waddimba, A., Scribani, M., Nieves, M., Krupa, N., May, J., & Jenkins, P. (2016). Validation of
single-item screening measures for provider burnout in a rural health care network.
Evaluation & the Health Professions, 39(2), 215-225.
Wallace, J., Lemaire, J., & Ghali, W. (2009). Physician wellness: A missing quality indicator.
The Lancet, 374(9702), 1714-1721. DOI: 10.1016/S0140-6736(09)61424-0
West, C. P., Dyrbye, L., & Shanafelt, T. D. (2009). Single item measure of emotional
exhaustion and depersonalization are useful for assessing burnout in medical
professionals. Journal of General Internal Medicine, 24(12), 1318-1321. Doi:
https://doi.org/10.1007/s11606-009-1129-z
80
West, C., Dyrbye, L., Erwin, P., & Shanafelt, T. (2016). Interventions to prevent and reduce
physician burnout: A systematic review and meta-analysis. The Lancet, 388(10057),
2272-2281. doi:10.1016/S0140-6736(16)31279-X
West, C. P., Dyrbye, L., & Shanafelt, T. D. (2018). Physician burnout: Contributors,
consequences and solutions. Journal of Internal Medicine, 283(6), 516-529. Retrieved
from https://doi.org/10.1007/s11606-009-1129-z
West, C., Huschka, M., Novotny, P., Sloan, J., Kolars, J., Habermann, T., & Shanafelt, T. (2006).
Association of Perceived Medical Errors With Resident Distress and Empathy: A
Prospective Longitudinal Study. JAMA, 296(9), 1071-1078. doi:10.1001/jama.296.9.1071
Williams, E. S., Manwell, L. B., Konrad, T. R., & Linzer, M. (2007). The relationship of
organizational culture, stress, satisfaction, and burnout with physician-reported error and
suboptimal patient care: Results from the MEMO study. Health Care Management
Review, 32(3), 203-212.
Young, R., Burge, S., Kumar, K., Wilson, J., & Ortiz, D. (2018). A time-motion study of primary
care physicians' work in the electronic health record era. Family Medicine, 50(2), 91-99.
81
Curriculum Vitae
Mary M. Nara, DNP
Department of Nursing
University of Nevada, Las Vegas
Email: [email protected]
Education
University of Nevada, Las Vegas
Doctorate of Nursing Practice, 2020
University of Nevada, Las Vegas
Master’s of Science in Nursing, 2003
Ursuline College
Bachelor’s of Science in Nursing, 1997