When Do We Eat? An Evaluation of Food Items Input into an Electronic Food Monitoring Application
10
Open Research Online The Open University’s repository of research publications and other research outputs When do we eat? An evaluation of food items input into an electronic monitoring application Conference Item How to cite: Siek, Katie A.; Connelly, Kay H.; Rogers, Yvonne; Rohwer, Paul; Lambert, Desiree and Welch, Janet L. (2006). When do we eat? An evaluation of food items input into an electronic monitoring application. In: Proceedings of the First International Conference on Pervasive Computing Technologies for Healthcare (Pervasive Health), 29 November - 1 Decemeber 2006, Innsbruck, Austria. For guidance on citations see FAQs . c 2006 The Authors Version: Accepted Manuscript Link(s) to article on publisher’s website: http://dx.doi.org/doi:10.1109/PCTHEALTH.2006.361684 Copyright and Moral Rights for the articles on this site are retained by the individual authors and/or other copy- right owners. For more information on Open Research Online’s data policy on reuse of materials please consult the policies page. oro.open.ac.uk
Transcript of When Do We Eat? An Evaluation of Food Items Input into an Electronic Food Monitoring Application

Open Research OnlineThe Open University’s repository of research publicationsand other research outputs
When do we eat? An evaluation of food items inputinto an electronic monitoring application
Conference ItemHow to cite:
Siek, Katie A.; Connelly, Kay H.; Rogers, Yvonne; Rohwer, Paul; Lambert, Desiree and Welch, JanetL. (2006). When do we eat? An evaluation of food items input into an electronic monitoring application.In: Proceedings of the First International Conference on Pervasive Computing Technologies for Healthcare(Pervasive Health), 29 November - 1 Decemeber 2006, Innsbruck, Austria.
For guidance on citations see FAQs.
c© 2006 The Authors
Version: Accepted Manuscript
Link(s) to article on publisher’s website:http://dx.doi.org/doi:10.1109/PCTHEALTH.2006.361684
Copyright and Moral Rights for the articles on this site are retained by the individual authors and/or other copy-right owners. For more information on Open Research Online’s data policy on reuse of materials please consultthe policies page.
oro.open.ac.uk

2904
1
Abstract— We present a formative study that examines what,
when, and how participants in a chronic kidney disease (stage 5) population input food items into an electronic intake monitoring application. Participants scanned food item barcodes or voice recorded food items they consumed during a three week period. The results indicated that a learning curve was associated with barcode scanning; participants with low literacy skills had difficulty describing food items in voice recordings; and participants input food items depending on when they had dialysis treatment. Participants thought this electronic self monitoring application would be helpful for chronically ill populations in their first year of treatment.
Index Terms—Human Factors, Interactive Computing,
Medical Services
I. INTRODUCTION
R esearchers and clinicians use food diaries, 24 hour recalls, and food frequency questionnaires to gain a deeper understanding of what people consume [1-3]. Unfortunately, these methods assume the participant has high literacy and memory recall skills. Furthermore, researchers must invest a significant amount of time in administration and evaluation of the results. We work with chronic kidney disease (CKD) stage 5 patients who must rigorously monitor their fluid and nutrient consumption. In general, patients must limit themselves to one
Manuscript received June 15, 2006. Katie A. Siek was supported in part by
the NPSC and SNL/CA during this study. This work was supported by NSF grant EIA-0202048, a grant from the Lilly Endowment, and Grant R21 EB007083 from the National Institute of Biomedical Imaging and Bioengineering to J.L. Welch.
K.A. Siek, Ph.D., is with the Department of Computer Science, University of Colorado, Boulder, CO 80309 USA (corresponding author, phone: 303-492-7514; fax: 303-492-2844; e-mail: [email protected]).
K.H. Connelly, Ph.D., and P. Rohwer, M.S., are with the Computer Science Department, Indiana University, Bloomington, IN 47405 USA. (e-mail: {connelly, prohwer}@indiana.edu).
Y. Rogers, Ph.D., is with the Computing Department, Open University, Milton Keynes, Buckinghamshire MK76BJ UK. (e-mail: [email protected]).
D. Lambert, M.S., R.D., C.D., is with the Nephrology Dietetics Department, Indiana University Hospital, Indianapolis, IN 46202 USA (e-mail: [email protected]).
J.L. Welch, D.N.S., is with the School of Nursing, Indiana University, Indianapolis, IN 46202 USA (e-mail: [email protected]).
to two liters of fluid, three grams of sodium, three grams of potassium, and limit phosphorus intake. Many people in our user group cannot perform simple calculations and have varying literacy levels [4]. We recruit participants from an urban, public dialysis facility where most patients are from low socioeconomic families. Thus, traditional methods for nutrition monitoring are difficult to administer. We are creating a PDA application to help chronically ill people monitor and maintain their nutritional intake. We chose to use a PDA because it has sufficient computational power and memory to create an application that can automatically compute and record dietary intake; a computer screen to easily show non-textual information; the ability to provide real-time feedback to patients to make improved decisions about diet on a prospective basis; and quick input mechanisms for patients to record information anywhere, anytime. For our application, the primary method to input food is by scanning the barcode on the food item package. In this paper, we present a formative study in the iterative development of our nutritional monitoring application. For this study, participants were asked to scan food item barcodes or voice record food items they consumed during a three week period. We wanted to identify when and what type of nutritional data people collect with an electronic monitoring application. More specifically, we are interested in:
• The frequency of barcode scans versus voice recordings
• The types of food items participants input • The ability of participants to accurately voice
record food items • Comparing what participants think they eat with
what they actually record • Discover when participants record food items
The findings from our initial study suggest that there was a learning curve for participants to find, identify, and successfully scan a barcode. However, once participants learned how many foods had barcodes, they were more interested in voice recording what they consumed to decrease monitoring time. Since participants consumed foods specific to the low-cost stores closest to their homes, only 60% of the barcodes were readily available in the open source database we used. Participants with low literacy skills had difficulty accurately voice recording food items for researchers to
When Do We Eat? An Evaluation of Food Items Input into an Electronic Food Monitoring Application
Katie A. Siek, Kay H. Connelly, Yvonne Rogers, Paul Rohwer, Desiree Lambert, and Janet L. Welch

2904
2
quickly identify. Overall, CKD patients and a renal dietitian thought the application was useful for monitoring personal nutritional intake.
II. RELATED WORK There are many PDA applications that can assist users in self-monitoring their nutritional intake. The United States Department of Agriculture (USDA) has a web-based and PDA nutrient database application that allows people to look up nutritional information of specific food items [5]. Intille et al. created a PDA application where people could scan two food items and compare the values for specific nutrients [6]. Neither of these applications store food items input for later review by researchers. DietMatePro [7] and BalanceLog [8] use the USDA database along with other fast food nutritional information to create a PDA program that allows users to save consumption information for a set of specific nutrients. Researchers at Indiana University let three CKD patients use DietMatePro over a three month period to see how nutritional consumption fluctuated with the use of an electronic diary. They found that the participants were within their recommended dietary limitations using the device; however participants were compliant before beginning the study. Their results indicated that the participants preferred using a large PDA screen with large, touch sensitive icons [9]. Sevick et al. had five CKD patients use BalanceLog over a four month period of time and found that nutritional intake was improved with the use of the electronic diary system [10]. Both of the applications described here require significant literacy and cognition skills. Some research has looked at underserved populations’ use of PDA technology in health care administration [11, 12], however there has not been significant research in studying how patients in underserved, low literacy, and low income populations can use technology to monitor their nutritional intake. Our study is unique because we are examining what type of data a low literacy, low income, and underrepresented population input into an electronic nutritional intake monitoring application.
III. METHODOLOGY In this section, we discuss why we selected the hardware and application used for this study. Detailed information about the experiment design can be found in our full report [13]. Additional information about this study can be found in our workshop paper [14].
A. Hardware We chose an off-the-shelf Palm OS Tungsten T3 PDA for our study. The Tungsten T3 has an expandable screen, large buttons, voice recorder, SDIO slot, 52 MB of memory, and Bluetooth. We chose an off-the-shelf PDA so the results could be useful to the consumer health informatics community for future studies. The Socket In-Hand SDIO card scanner (Socket Scanner) was chosen as the barcode scanner because it was small, easy to use, and gave visual and audio feedback to users. As shown in Figure 1, participants must press the predefined scanning button, line up the scanning light perpendicular to the barcode, and hold the PDA and object steady. The PDA beeps and shows appropriate feedback when participants have successfully scanned a barcode. Previous studies have shown that CKD patients can use the Tungsten T3 and Socket Scanner [15].
B. Application Design We created a simple application, Barcode Ed, because we wanted to isolate participants' ability to scan and yet have an alternative input mechanism (e.g., voice input) for participants to record all food items they consumed. In initial interviews, half of the CKD patients said they did not eat any foods with barcodes. However, once they were prompted, we found they primarily ate frozen, canned, and prepared foods. Thus, in order for participants to use an easy input mechanism like scanning, they would have to learn how to identify barcodes and use the scanner. We only used scanning and voice recording in this study because we did not want to overburden novice computer users who have a history of decreased cognitive function [16] with a multiple screen interface.
(a)
(b)
Figure 1 (a) Example of participant scanning food item with Socket Scanner. (b) Participant has successfully scanned a food item.
2904
3
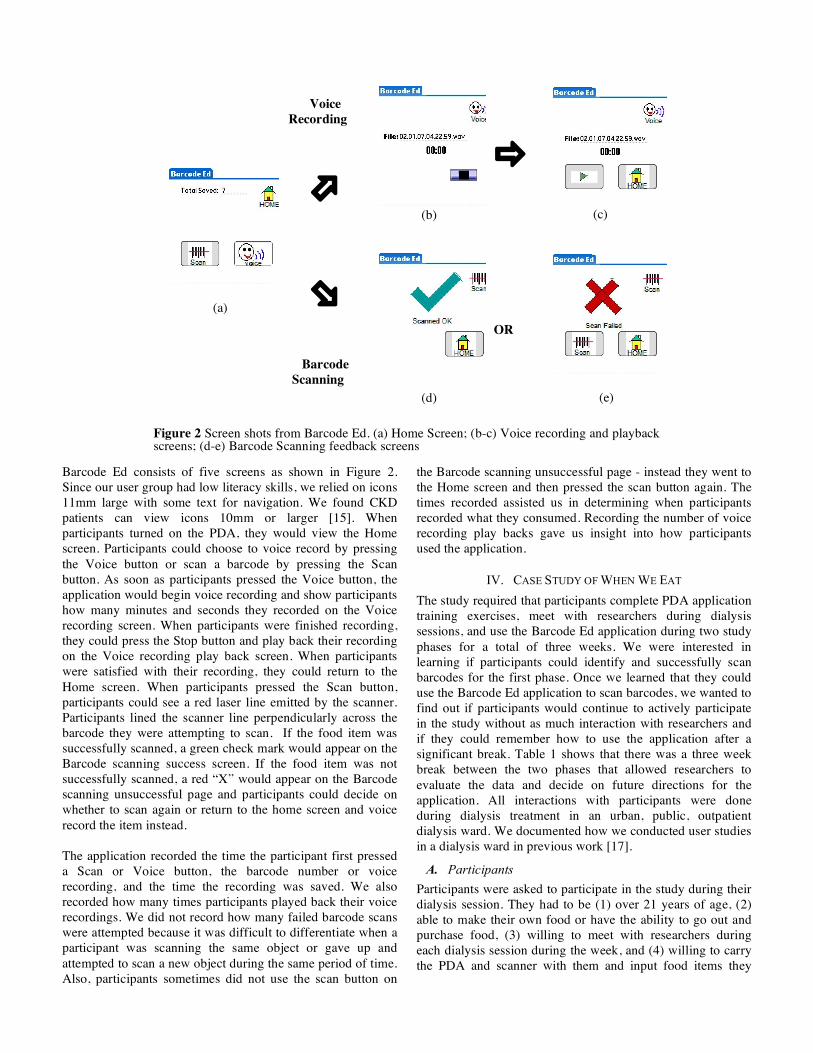
Barcode Ed consists of five screens as shown in Figure 2. Since our user group had low literacy skills, we relied on icons 11mm large with some text for navigation. We found CKD patients can view icons 10mm or larger [15]. When participants turned on the PDA, they would view the Home screen. Participants could choose to voice record by pressing the Voice button or scan a barcode by pressing the Scan button. As soon as participants pressed the Voice button, the application would begin voice recording and show participants how many minutes and seconds they recorded on the Voice recording screen. When participants were finished recording, they could press the Stop button and play back their recording on the Voice recording play back screen. When participants were satisfied with their recording, they could return to the Home screen. When participants pressed the Scan button, participants could see a red laser line emitted by the scanner. Participants lined the scanner line perpendicularly across the barcode they were attempting to scan. If the food item was successfully scanned, a green check mark would appear on the Barcode scanning success screen. If the food item was not successfully scanned, a red “X” would appear on the Barcode scanning unsuccessful page and participants could decide on whether to scan again or return to the home screen and voice record the item instead. The application recorded the time the participant first pressed a Scan or Voice button, the barcode number or voice recording, and the time the recording was saved. We also recorded how many times participants played back their voice recordings. We did not record how many failed barcode scans were attempted because it was difficult to differentiate when a participant was scanning the same object or gave up and attempted to scan a new object during the same period of time. Also, participants sometimes did not use the scan button on
the Barcode scanning unsuccessful page - instead they went to the Home screen and then pressed the scan button again. The times recorded assisted us in determining when participants recorded what they consumed. Recording the number of voice recording play backs gave us insight into how participants used the application.
IV. CASE STUDY OF WHEN WE EAT The study required that participants complete PDA application training exercises, meet with researchers during dialysis sessions, and use the Barcode Ed application during two study phases for a total of three weeks. We were interested in learning if participants could identify and successfully scan barcodes for the first phase. Once we learned that they could use the Barcode Ed application to scan barcodes, we wanted to find out if participants would continue to actively participate in the study without as much interaction with researchers and if they could remember how to use the application after a significant break. Table 1 shows that there was a three week break between the two phases that allowed researchers to evaluate the data and decide on future directions for the application. All interactions with participants were done during dialysis treatment in an urban, public, outpatient dialysis ward. We documented how we conducted user studies in a dialysis ward in previous work [17].
A. Participants Participants were asked to participate in the study during their dialysis session. They had to be (1) over 21 years of age, (2) able to make their own food or have the ability to go out and purchase food, (3) willing to meet with researchers during each dialysis session during the week, and (4) willing to carry the PDA and scanner with them and input food items they
Voice Recording
(b)
(c)
(a) Barcode
Scanning
(d)
OR
(e)
Figure 2 Screen shots from Barcode Ed. (a) Home Screen; (b-c) Voice recording and playback screens; (d-e) Barcode Scanning feedback screens

2904
4
consume. Ten participants volunteered for the study. During the first phase, one participant could not participate anymore because of a medical emergency and another participant dropped out because he did not want to record what he was eating (n = 8). We lost two participants during phase two for similar reasons (n = 6). The average age of participants was 52 years old (s.d. = 16.28). Half of the participants were male; all of the participants were black. One participant completed an associate degree, four participants graduated from high school, and one participant completed 10th grade. Participants had been receiving dialysis treatments on average of five years (s.d. 3.5 years). Only four participants reported using a computer. Usage frequency ranged from every couple of months to once a week for a half hour. Participants primarily played games and played on the Internet. Only two of the participants owned a cell phone that they used for emergencies only. Participants described having good and bad days depending on when they had dialysis. During bad days, participants reported they typically had 1.5 meals accounting for three food items. During good days, participants reported they typically ate two meals accounting for five food items. The participants were equally divided about how many food items they consumed had barcodes - some thought all and some did not think any food items had barcodes. Five patients said they did not have to monitor any nutrients or fluid. However, by the end of the first phase, the researcher had established a trusting relationship with the participants and found that all of them had to monitor fluid and nutrient(s) such as sodium, potassium, phosphorus, and protein. None of the patients recorded their fluid or nutrient consumption prior to the study.
B. Design and Procedure We met with participants during dialysis sessions four times during each phase of the study for approximately 30 minutes. During the first session, we collected background information and taught participants how to turn the PDA on, insert the scanner, and use the application. Participants practiced scanning various food items and voice recording messages. Researchers met with participants during the study sessions to discuss any problems participants may have had with the PDA, retrain participants how to do certain tasks (e.g., barcode scanning), and collect recordings and barcodes from the PDAs via Bluetooth. The researchers played back the voice recordings to ensure the correct information was transcribed
and advised participants if they voice recorded a food item that could have had a barcode. Participants returned the PDAs at the end of each phase of the study, talked to researchers about their experience, and verbally completed a modified Questionnaire for User Interface Satisfaction (QUIS) [18] survey. Participants received ten dollars (U.S.) for every time they met with researchers for a total of thirty dollars during phase 1. For phase 2, participants received five dollars each time they met with the researcher for a total of fifteen dollars. Competency skills tests were administered at the end of the second and fourth meeting of the first phase and during the first and last meeting of the second phase to test basic Barcode Ed skills - turning the PDA on; inserting the scanner; scanning three to five objects with different physical qualities; voice recording with play back; and do a combined barcode scanning and voice recording sequence. The items participants had to scan ranged from a cardboard soup mix box that is easy to scan because of the material; a can of chips that is somewhat difficult to scan because of material and barcode orientation; and a bag of candy that is difficult to scan because it is amorphous and made of shiny material. Researchers measured how many times it took participants to successfully complete each task. We measure the time it took to complete each competency skill with the Barcode Ed application. Participants were instructed to scan or voice record food items when they consumed the items. Participants should attempt to scan the barcodes on food items first and only voice recording items if they could not scan the barcode or a food item did not have a barcode. When participants mastered scanning and voice recording, researchers encouraged participants to note via voice recording how much they were consuming and the portion size. Each participant was given a phone number of a researcher to contact if they had any questions during the study. Participants were given a visual state diagram of the application to assist them with any questions they may have about how to use the application that had images similar to those shown in Figure 2.
V. FINDINGS The key findings of our study were:
• Participants preferred voice recording once they mastered the application
• Participants barcode scanned items from specific discount stores that were not in our open source barcode database
• Participants with low literacy skills needed extra instruction on how to sufficiently describe food items for voice recordings
Study Phase #
Length of Phase Motivating Research Question(s)
Phase 1 1 week 1. Can participants find, identify, and successfully scan barcodes on food items? Break 3 weeks Phase 2 2 weeks 1. Will participants remember how to use this application after a 3 week break?
2. Will participants actively participate without meeting with researchers every other day? Table 1 Description of the two study phases.

2904
5
• Participants reported more individual food items with the Barcode Ed application than what they thought they consumed\
• The time they had dialysis treatment affected when they consumed food items.
In this section, we present the results in more detail.
A. Barcode Scanning and Voice Recording Frequency One of the motivating factors for the first phase of the Barcode Education study was to teach participants how to identify and scan barcodes. In Figure 3, we see that there was a learning curve associated with identifying and scanning barcodes during the first study phase. Participants voice recorded more individual food items during the first few days of the study because they were either unsure of where the barcode was located on the food item or were unable to scan the barcode. Gradually during the week, we noticed an increase of barcode scans until the last day of the first study phase when participants barcode scanned more than they voice recorded. A goal of the second study phase was to see if this trend of increased barcode scans would persist and if participants would continue actively participating in the study without meeting with researchers every other day. The first two days of the second study phase were promising because participants were scanning everything they consumed and only voice recorded items without barcodes (e.g., fresh produce). However, after the second day, participants realized everything had barcodes and were overwhelmed with the amount of time it took to scan every individual food item. Thus, during the third and fourth day of the study, participants began voice recording food items they had previously scanned to save time. The lack of items input at the end of phase one shown in Figure 4 can be attributed to not seeing a study researcher to encourage them to participate and the end of the week. Indeed, three participants acknowledged that they had forgotten to input foods on more than one occasion because they had not been visited by a researcher. Participants were more likely to
forget to input foods on weekends (days six, seven, thirteen, and fourteen). During the second week of the second study phase, participants rarely scanned barcodes and typically voice recorded what they consumed. The voice recordings listed multiple food items in an unstructured manner. For example, one participant recorded, “I ate a small apple, a lunch meat sandwich, and a boost for lunch. I ate … eggs, and bacon for breakfast. Tonight for dinner I am planning on eating…” When we asked participants why they scanned more on the 13th day of the study, they told us that they had remembered they would see a researcher on the following day to finish the study. Of course, the researchers called the participants to remind them to bring the PDAs to the last day of the study.
B. Identifying Barcodes We attempted to identify each barcode participants input with the Barcode Ed application to help dietitians and clinicians learn what participants were consuming. Since there is not a freely available, complete barcode database available, we used the Internet UPC Database [19], an open source database containing 622,363 identified barcodes. Anyone with internet access and an email address can register and input barcodes and associated product information. We were only able to identify 60.29% (s.d. =31.77%) of the barcodes input by participants with the open source UPC database.
Figure 3 Graph of the number of voice recordings and barcode scans participants input over the
two barcode education study phases (dotted line denotes study break). Faces underneath each day denote when researchers met with participants.
Figure 4 Total number of food items input during Phase 1. Faces underneath each day denote when researchers met with participants.
2904
6
C. Voice Recording Food Items We thought voice recording food items was an easy alternative, backup input method when participants could not scan. However, participants with low literacy skills were initially unable to give sufficient identifying information in their voice recordings. Since the participants were unable to read the name on the food item, they were not able to say what they were eating (e.g. Lucky Charms cereal). Instead, participants said, “I had cereal for breakfast.” When we met with participants and played the recordings for transcription, we were able to suggest ways for the participant to be more descriptive (e.g., describe what is on the box) to assist us identify the food items. After two to three sessions, the low literacy participants recorded more descriptive input (e.g., I ate the cereal with the leprechaun and rainbow on the box) and it was easier to identify what they were eating. However, even with descriptive input, we were unable to identify three of the items mentioned in the 195 recordings.
D. Barcode Ed versus Self Reported Food Items In pre-study interviews, participants told us they had good and bad days that affected how much they consumed and discussed how many meals they typically consumed on each of these days. The participants usually had a good and bad day fairly recently and could easily describe to us the exact number of items they consumed. We asked participants if they had a good or bad day each time we met during the first study phase. We then compared how many items they electronically input to how many items they said they would consume including the type of day they were having in the calculation. Participants ate more than they estimated for an average of three days (s.d. = 2.875) during the seven day period. When participants did consume more than they estimated, they typically consumed on average 3.5 more items than estimated
– nearly doubling their normally recorded intake of 4.4 items (s.d. = 3.27)1.
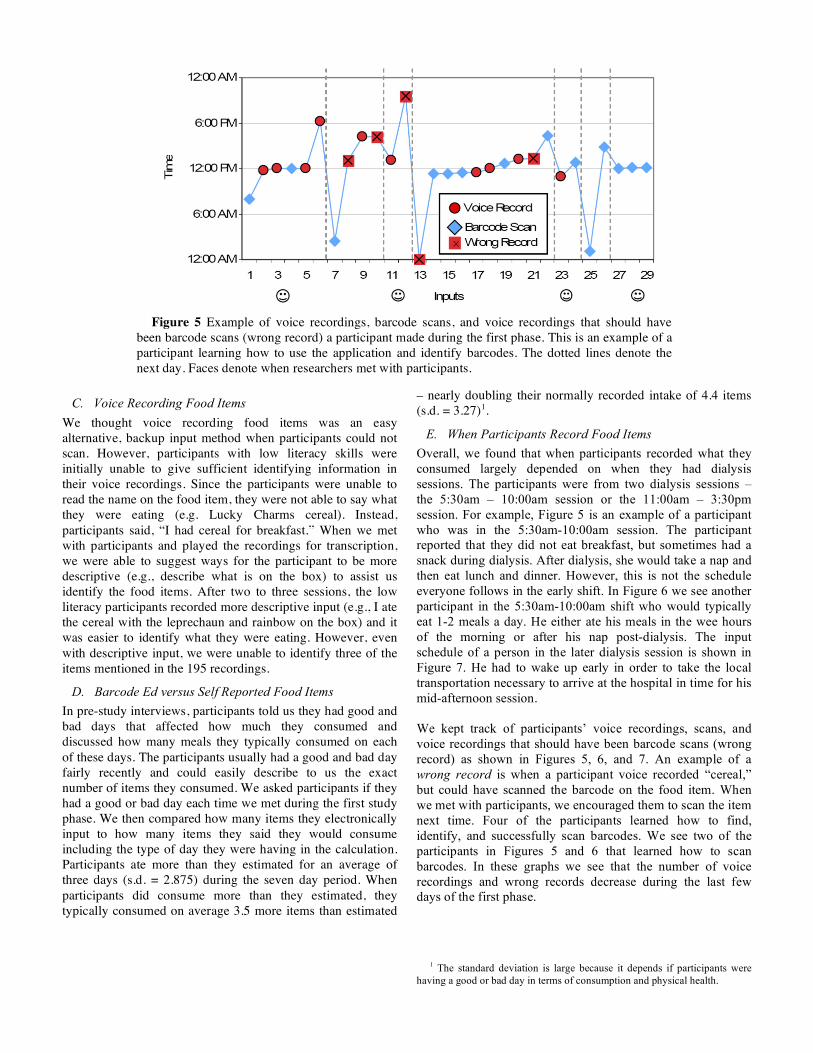
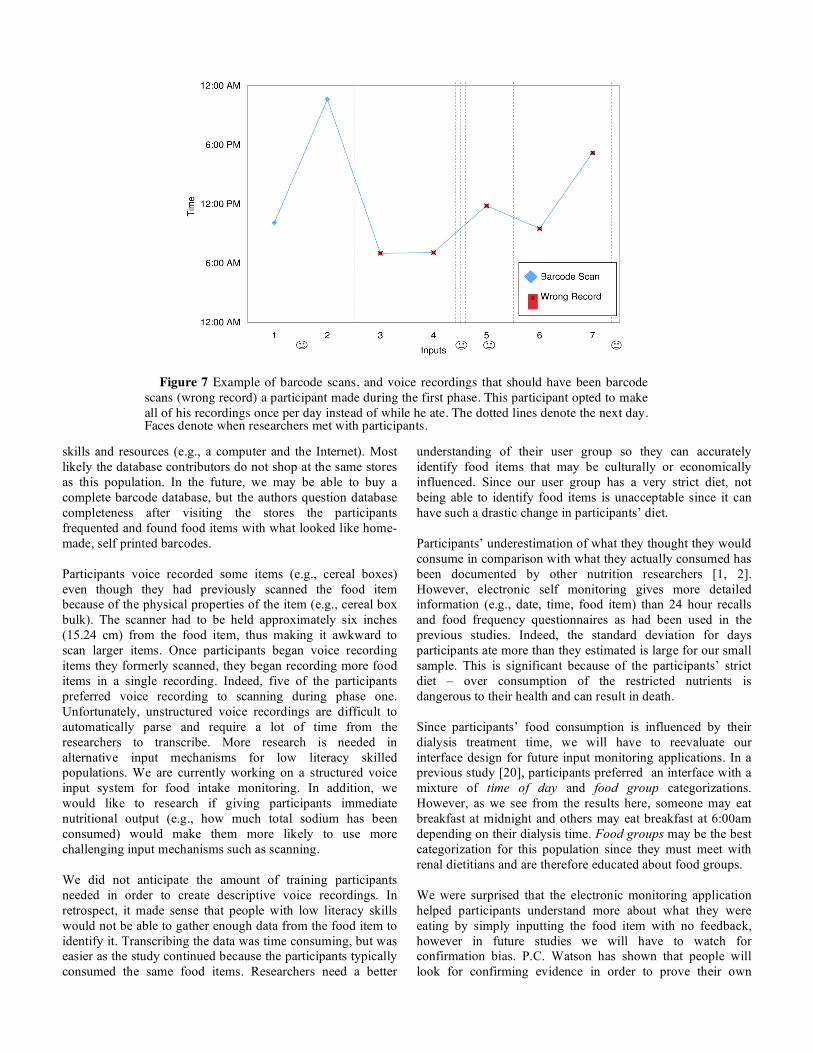
E. When Participants Record Food Items Overall, we found that when participants recorded what they consumed largely depended on when they had dialysis sessions. The participants were from two dialysis sessions – the 5:30am – 10:00am session or the 11:00am – 3:30pm session. For example, Figure 5 is an example of a participant who was in the 5:30am-10:00am session. The participant reported that they did not eat breakfast, but sometimes had a snack during dialysis. After dialysis, she would take a nap and then eat lunch and dinner. However, this is not the schedule everyone follows in the early shift. In Figure 6 we see another participant in the 5:30am-10:00am shift who would typically eat 1-2 meals a day. He either ate his meals in the wee hours of the morning or after his nap post-dialysis. The input schedule of a person in the later dialysis session is shown in Figure 7. He had to wake up early in order to take the local transportation necessary to arrive at the hospital in time for his mid-afternoon session. We kept track of participants’ voice recordings, scans, and voice recordings that should have been barcode scans (wrong record) as shown in Figures 5, 6, and 7. An example of a wrong record is when a participant voice recorded “cereal,” but could have scanned the barcode on the food item. When we met with participants, we encouraged them to scan the item next time. Four of the participants learned how to find, identify, and successfully scan barcodes. We see two of the participants in Figures 5 and 6 that learned how to scan barcodes. In these graphs we see that the number of voice recordings and wrong records decrease during the last few days of the first phase.
1 The standard deviation is large because it depends if participants were
having a good or bad day in terms of consumption and physical health.
Figure 5 Example of voice recordings, barcode scans, and voice recordings that should have
been barcode scans (wrong record) a participant made during the first phase. This is an example of a participant learning how to use the application and identify barcodes. The dotted lines denote the next day. Faces denote when researchers met with participants.

2904
7
One benefit of electronic self-monitoring is that researchers get to see exactly what, when, and how participants input their consumption. In Section V.A, we discussed a learning curve associated with using the Barcode Ed nutrition monitoring application. In Figure 5, we see an example of this learning curve. The participant voice records more than she scans during the first few days of the study. During the fourth day of the study, she only voice recorded prepared food items she had at a church social. Finally, during the last three days of the first phase, she does not eat that much because she had undergone some minor surgery, but has learned to identify and scan food items properly. When we showed the participant a graph similar to the one in Figure 5 and played back her voice recordings, she began to make connections with what she ate and how she felt. For example, she noticed that her protein and sodium was high and that could be caused by her eating two fast food burritos. In post-study interviews, she told us that she would often rethink what she was consuming once she had to physically scan or voice record what she was eating. Indeed, all six participants thought the application helped them understand how much food they consumed. For this study, we loosely defined compliance as inputting at least one food item a day. Similar to traditional monitoring methods, participants can back fill and modify their compliance record. However, unlike traditional methods, with electronic nutrition monitoring, researchers can identify this behavior quicker. For example, a participant back filled entries in Figure 6 (green circle) by recording what he had consumed for the last two days since he had not actively participated. Another indicator of back filling is the number of wrong records in the short time period since participants cannot scan items that have been consumed and discarded. Participants were unaware that we were recording the date and time of inputs and thus assumed if they said, “Today, on February 11, I ate…” the researcher would not know that it
was recorded on February 12. When we showed participants similar graphs as shown here, participants attempted to decrease backfilling or were more truthful in disclosing lack of participation. In addition to backfilling, we see in Figure 6 an example of End-Of-Study compliance where the participant realizes the end of the study is near and increases participation in hopes the researcher will not notice. We discussed in Section V.A that once participants realized everything had a barcode on it, participants began to voice record more. We see this behavior in Figure 7 – the participant starts to scan items, but then starts to hoard consumption information in one voice recording a day. The participant told us in a post-study interview that reporting everything he ate in one voice recording was more time efficient.
VI. DISCUSSION Even though barcode scanning is a quick method for inputting individual food items, our results show that it is not usable over an extended period of time. Participants were overwhelmed with the amount of work associated with scanning every food item they consumed. However, participants did think that this application would be helpful for CKD patients who have recently been diagnosed with the chronic illness to assist them in learning about the strict diet. Participants thought CKD patients in their first year of dialysis treatment would be more likely to spend extra time scanning barcodes if it meant clinicians could give them better feedback about their diet and health. Another possibility for an electronic self monitoring application would be to have people use it periodically (e.g., quarterly when dietitians are conducting nutritional assessments with patients) to raise awareness and help them stabilize their diet. Identifying the barcodes participants input was difficult for us because we used an open source database. Identification may become easier as the database is propagated with more data, however this may be a socioeconomic resource issue. Those who contribute to the open source database have high literacy
Figure 6 Example of voice recordings, barcode scans, and voice recordings that should have been barcode scans (wrong record) a participant made during the first phase. The participant did back filling as shown by the green circle and increased input during the end of the study. The dotted lines denote the next day. Faces denote when researchers met with participants.
2904
8
skills and resources (e.g., a computer and the Internet). Most likely the database contributors do not shop at the same stores as this population. In the future, we may be able to buy a complete barcode database, but the authors question database completeness after visiting the stores the participants frequented and found food items with what looked like home-made, self printed barcodes. Participants voice recorded some items (e.g., cereal boxes) even though they had previously scanned the food item because of the physical properties of the item (e.g., cereal box bulk). The scanner had to be held approximately six inches (15.24 cm) from the food item, thus making it awkward to scan larger items. Once participants began voice recording items they formerly scanned, they began recording more food items in a single recording. Indeed, five of the participants preferred voice recording to scanning during phase one. Unfortunately, unstructured voice recordings are difficult to automatically parse and require a lot of time from the researchers to transcribe. More research is needed in alternative input mechanisms for low literacy skilled populations. We are currently working on a structured voice input system for food intake monitoring. In addition, we would like to research if giving participants immediate nutritional output (e.g., how much total sodium has been consumed) would make them more likely to use more challenging input mechanisms such as scanning. We did not anticipate the amount of training participants needed in order to create descriptive voice recordings. In retrospect, it made sense that people with low literacy skills would not be able to gather enough data from the food item to identify it. Transcribing the data was time consuming, but was easier as the study continued because the participants typically consumed the same food items. Researchers need a better
understanding of their user group so they can accurately identify food items that may be culturally or economically influenced. Since our user group has a very strict diet, not being able to identify food items is unacceptable since it can have such a drastic change in participants’ diet. Participants’ underestimation of what they thought they would consume in comparison with what they actually consumed has been documented by other nutrition researchers [1, 2]. However, electronic self monitoring gives more detailed information (e.g., date, time, food item) than 24 hour recalls and food frequency questionnaires as had been used in the previous studies. Indeed, the standard deviation for days participants ate more than they estimated is large for our small sample. This is significant because of the participants’ strict diet – over consumption of the restricted nutrients is dangerous to their health and can result in death. Since participants’ food consumption is influenced by their dialysis treatment time, we will have to reevaluate our interface design for future input monitoring applications. In a previous study [20], participants preferred an interface with a mixture of time of day and food group categorizations. However, as we see from the results here, someone may eat breakfast at midnight and others may eat breakfast at 6:00am depending on their dialysis time. Food groups may be the best categorization for this population since they must meet with renal dietitians and are therefore educated about food groups. We were surprised that the electronic monitoring application helped participants understand more about what they were eating by simply inputting the food item with no feedback, however in future studies we will have to watch for confirmation bias. P.C. Watson has shown that people will look for confirming evidence in order to prove their own
Figure 7 Example of barcode scans, and voice recordings that should have been barcode scans (wrong record) a participant made during the first phase. This participant opted to make all of his recordings once per day instead of while he ate. The dotted lines denote the next day. Faces denote when researchers met with participants.
2904
9
hypotheses correct [21]. Researchers at Georgia Tech have also come across potential confirmation bias dangers in their work with diabetes patients monitoring their exercise levels and consumption [22]. Backfilling and hoarding are subject to retrospective biases and may not completely be accurate. In addition, researchers have shown that memory recall is undependable – thus participants may not be able to accurately describe what they had consumed during the past days even if they are attempting to be accurate [3]. The end of study compliance we discussed is similar to Rand’s parking lot compliance where participants attempt to be compliant by complying with the study procedure in the parking lot of the research facility [23]. Since it is difficult to scan food items once they are consumed (or disposed of), participants increased participation before the end of each study phase with voice recording or wrong records. It is difficult to determine if patients were increasing participation before dialysis sessions where they met with researchers because participants may have been having a bad day (e.g., not feeling well due to dialysis session recovery). One weakness that all monitoring methods have is that we are not sure if participants are truthfully recording what they consume. Without subjecting participants to costly blood work or requiring participants to wear an invasive device that could detect what a person is eating, we can only assume participants are being truthful. As we discuss above, electronic self monitoring can help researchers identify noncompliant, untruthful trends quicker and discuss non-compliance with participants, but this is not a fault proof method.
VII. CONCLUSION We have presented a formative study that examines what, when, and how participants in a chronically ill population input into an electronic intake monitoring application. Participants were asked to scan food item barcodes or voice record food items they consumed during a three week period. We found that there was a learning curve for participants to find, identify, and successfully scan a barcode. Participants preferred voice recording in order to decrease the burden of self monitoring. A more complete barcode database is required to identify all food items participants input via barcode scanning. Participants with low literacy skills had difficulties in accurately describing voice recording food items for researchers to quickly identify. In addition, participants were more likely to input food items based on their scheduled dialysis times. More research is needed in the area of alternative input for nutritional monitoring applications in order for populations with strict diet regimes to quickly and efficiently self monitor.
ACKNOWLEDGMENTS We would like to thank our participants from Indiana University Hospital Outpatient Dialysis Center.
REFERENCES [1] K. Resnicow, et al., "Validation of Three Food Frequency
Questionnaires and 24-Hour Recalls with Serum Carotenoid Levels in a Sample of African-American Adults," American Journal of Epidemiology, vol. 152, pp. 1072-1080, 2000.
[2] J. Dwyer, et al., "Estimation of Usual Intakes: What We Eat in
America - NHANES," The American Society for Nutritional Sciences J. Nutr., vol. 133, pp. 609S-623S, 2003.
[3] A. A. Stone, et al., "Patient compliance with paper and electronic diaries," Controlled Clinical Trials, vol. 24, pp. 182-199, 2003.
[4] K. H. Connelly, et al., "Designing a PDA Interface for Dialysis Patients to Monitor Diet in their Everyday Life," presented at HCI-I, 2005.
[5] I. H. Tech, "USDA Palm OS Search," United States Department of Agriculture. http://www.nal.usda.gov/fnic/foodcomp/srch/search.htm
[6] S. S. Intille, et al., "Just-in-time technology to encourage incremental, dietary behavior change," presented at AMIA Annual Symposium Proceedings, 2003.
[7] "DietMatePro," http://www.dietmatepro.com. [8] HealtheTech, "BalanceLog." http://www.healthetech.com/ [9] S. A. Dowell, et al., "Piloting the Use of Electronic Self
Monitoring for Food and Fluid Intake," Nephrology Nursing Journal, 2006.
[10] M. A. Sevick, et al., "A Preliminiary Study of PDA-Based Dietary Self-Monitoring in Hemodialysis Patients," Journal of Renal Nutrition, vol. 15, pp. 304-311, 2005.
[11] S. Grisedale, et al., "Designing a graphical user interface for healthcare workers in rural India," presented at Conference on Human Factors in Computing Systems, 1997.
[12] V. Anantraman, et al., "Handheld Computers for Rural Healthcare, Experience in Large Scale Implementation," presented at Development by Design 2002, Bangalore, India, 2002.
[13] K. A. Siek, "Design and Evaluation of an Assistive Application for Dialysis Patients," in Computer Science, vol. Ph.D. Bloomington: Indiana University, 2006.
[14] K. A. Siek, et al., "The Food We Eat: An Evaluation of Food Items Input into an Electronic Food Monitoring Application," presented at Submitted to UbiHealth 2006, 2006.
[15] K. A. Moor, et al., "A Comparative Study of Elderly, Younger, and Chronically Ill Novice PDA Users," Indiana University June 2004.
[16] M. Martin-Lester, "Cognitive Function in Dialysis Patients: Case Study of the Anemic Patient," ANNA Journal, vol. 24, pp. 359-365, 1997.
[17] K. A. Siek, et al., "Lessons Learned Conducting User Studies in a Dialysis Ward," presented at Adjunct Proceedings of CHI 2006: Reality Testing Workshop, 2006.
[18] J. P. Chin, et al., "Development of an instrument measuring user satisfaction of the human-computer interface," presented at CHI 88, Washington, D.C., 1988.
[19] "Internet UPC Database." http://www.upcdatabase.com [20] K. Siek, et al., "Pride and Prejudice: How Chronically Ill People
Think about Food," presented at CHI 2006, 2006. [21] P. C. Watson, "On the Failure to Eliminate Hypothesese in a
Conceptual Task," The Quarterly Journal of Experimental Psychology, vol. 12, pp. 129-140, 1960.
[22] L. Mamykina, et al., "Investigating health management practices of individuals with diabetes," presented at Proc. CHI 2006, 2006.
[23] C. Rand, et al., "Long-term metered-dose inhaler adherence in a clinical trial," Am J Respir Crit Care med, vol. 152, pp. 580-588, 1995.