THE IMPORTANCE OF SOLID WASTE MANAGEMENT FOR SUSTAINABLE DEVELOPMENT: A STUDY OF SOLID WASTE...
339
i SRI LANKA ECONOMICS RESEARCH CONFERENCE SLERC-2014 PROCEEDINGS of The 3 rd International Economics Research Conference of the Sri Lanka Forum of University Economists Volume III Chief Editor Dr. A. J. M. Chandradasa Co-Editors Prof. D Atapattu Mr.I. R. Priyantha Mr. Nisantha Kurukulasooriya Mr.Chandika Gunasinghe Mr. Nandasiri Keembiyahetti Mr. Indrajee de Zoysa Mrs. Udari Kariyawasam Department of Economics, University of Ruhuna, Matara, Sri Lanka 19 th and 20 th December 2014
-
Upload
independent -
Category
Documents
-
view
0 -
download
0
Transcript of THE IMPORTANCE OF SOLID WASTE MANAGEMENT FOR SUSTAINABLE DEVELOPMENT: A STUDY OF SOLID WASTE...
i
SRI LANKA ECONOMICS RESEARCH CONFERENCE
SLERC-2014
PROCEEDINGS
of
The 3rd International Economics Research Conference
of the Sri Lanka Forum of University Economists
Volume III
Chief Editor
Dr. A. J. M. Chandradasa
Co-Editors
Prof. D Atapattu
Mr.I. R. Priyantha
Mr. Nisantha Kurukulasooriya
Mr.Chandika Gunasinghe
Mr. Nandasiri Keembiyahetti
Mr. Indrajee de Zoysa
Mrs. Udari Kariyawasam
Department of Economics, University of Ruhuna, Matara,
Sri Lanka
19th and 20th December 2014
Emerging Trends in Post- Conflict Societies: Challenges and the Way Forward Sri Lanka Economics Research Conference 2014
ii
Copyright© December 2014 Sri Lanka Forum of University Economists
National Library of Sri Lanka-Cataloging-In-Publication Data
Proceedings of Sri Lanka Economics Research Conference-2014
ISSN 2279-2406
Published by Sri Lanka Forum of University Economists (SLFUE)
Department of Economics,
University of Ruhuna,
Matara, Sri Lanka
Tel: +94412227014
All rights reserved. No part of this publication may be reproduced,
stored in a retrieval system or transmitted by any means, electronic,
mechanical, photocopying, recording or otherwise, without the written
permission of the publisher.
This publication is sponsored and printed by
The Ministry of Mass Media and Information
163, Polhengoda Road, PO Box 544, Colombo 5, Sri Lanka.
Telephone : +94-11-2513467
Fax : +94-11-2513458
Email : [email protected]

iii
Contents
MESSAGE FROM THE VICE CHANCELLOR V
MESSAGE FROM THE DEAN VI
MESSAGE FROM THE CHAIRPERSON VII
EDITORIAL PREFACE VIII
ORGANIZATION COMMITTEE X
PANEL OF REVIEWERS XI
SESSION-1 AGRICULTURE AND FOOD SECURITY 1
[S1/01] MAIZE CONTRACT FARMING IN SRI LANKA; ADOPTION, IMPACT AND POLICY IMPLICATION ............ 3 [S1/02] ECONOMICS OF CLIMATE CHANGE ADAPTATION: A CASE WITH THREE RURAL COMMUNITIES IN DRY
ZONE, SRI LANKA ............................................................................................................. 9 [S1/03] DEVELOPMENT OF PINEAPPLE (ANANASCOMOSUS) AND WATERMELON (CITRULLUSLANATUS)
BLENDED READY-TO-SERVE BEVERAGE .............................................................................. 17 [S1/04] AGRICULTURAL INNOVATION: THE ROLE OF MICRO-INVENTIONS BY RURAL FARMERS IN MINOR
CROP INDUSTRY WITH A SPECIAL REFERENCE TO THE MEERIGAMA D.S DIVISION ....................... 27
SESSION-2 EDUCATION IN KNOWLEDGE ECONOMY 33
[S2/01] THE DIFFERENCE IN EMPLOYABILITY OF GRADUATES IN PUBLIC AND PRIVATE SECTOR MANAGEMENT
EDUCATION INSTITUTES IN SRI LANKA ................................................................................ 35 [S2/02] COST COMPETITIVENESS OF SRI LANKA’S STATE UNIVERSITY SYSTEM IN HIGHER EDUCATION SERVICE
DELIVERY ..................................................................................................................... 43 [S2/03] WOMEN ENTREPRENEURIAL “FAILURES”: UNDERLYING CHARACTERISTICS AND POSSIBLE CAUSES- AN
EXPLORATORY CASE-BASED SURVEY ................................................................................... 55 [S2/04] CREDIBILITY OF THE Z SCORE IN PREDICTING THE CHOICES OF STUDENTS IN SELECTING DEGREE
OFFERING INSTITUTES IN SRI LANKA .................................................................................. 65 [S2/05] CONSERVATION OF AGRICULTURAL BIODIVERSITY: DOES EDUCATION MATTER? ........................ 71
SESSION-3 ENERGY AND THE ECONOMY 83
[S3/01] FINANCIAL FEASIBILITY ANALYSIS OF A SMALL HYDRO POWER PLANT WITH RESPECT TO
UNCERTAINTY VARIABLES ................................................................................................ 85 [S3/02] MULTIPLIER EFFECT OF FOREIGN EXCHANGE ECONOMIES ON THE COMPARATIVE VIABILITY OF
RENEWABLE ENERGY-BASED POWER PROJECTS IN SRI LANKA ................................................. 97 [S3/03] THE AMBIVALENCE OF ELECTRICITY TARIFF SETTING IN SRI LANKA: A REFLECTION OF A DEEPER
CRISIS NEEDING STRATEGIC SYSTEMIC INTERVENTION ......................................................... 107
SESSION-4 ENVIRONMENT AND SUSTAINABLE DEVELOPMENT 119
[S4/01] THE IMPORTANCE OF SOLID WASTE MANAGEMENT FOR SUSTAINABLE DEVELOPMENT: A STUDY OF
SOLID WASTE MANAGEMENT FOR SOUND ENVIRONMENTAL DEVELOPMENT IN HAMBANTOTA
MUNICIPAL COUNCIL, SRI LANKA. ................................................................................... 121 [S4/02] EXCESSIVE USAGE OF CHEMICAL FERTILIZER IN THE PADDY SECTOR OF SRI LANKA: AN ECONOMIC
ARGUMENT FOR ENVIRONMENTALLY SUSTAINABLE POLICY INTERVENTION ............................. 129

Emerging Trends in Post- Conflict Societies: Challenges and the Way Forward Sri Lanka Economics Research Conference 2014
iv
[S4/03] EFFECTIVENESS AND ECONOMICS OF CARBON FOOT-PRINT REDUCTION IN AVIATION: AN ANALYSIS
OF MEASURES ADOPTED BY THE SRI LANKAN AIRLINES ........................................................ 141 [S4/04] POTENTIAL OF WILD-LIFE TOURISM DEVELOPMENT IN SRI LANKA: AN ECONOMIC ANALYSIS ...... 151
SESSION-5 INDUSTRY AND SERVICE SECTOR 161
[S5/01] MEASURING INDUSTRIAL INTERDEPENDENCE TO FIND AN EFFECTIVE DEVELOPMENT STRATEGY FOR SRI
LANKA: AN INPUT-OUTPUT MODELING APPROACH .............................................................. 163 [S5/02] AN INVESTIGATION OF THE TREND ORIENTATION OF SRI LANKAN VALUE FASHION RETAILERS AND
CONSUMERS ............................................................................................................... 181 [S5/03] PUBLIC–PRIVATE WAGE DIFFERENTIAL IN SRI LANKA: APPLICATION OF ENDOGENOUS SWITCHING
REGRESSION MODEL .................................................................................................... 187 [S5/04] IDENTIFYING CONSUMER PERCEIVED VALUE OF TOURISM PRODUCT ...................................... 195
SESSION-6 MONEY IN THE ECONOMY 203
[S6/01] LONG-RUN RELATIONSHIP BETWEEN EXCHANGE RATE AND TRADE BALANCE OF SRI LANKA ........ 205 [S6/02] SECURITIZATION AND THE GLOBAL FINANCIAL CRISIS (GFC): WHAT WENT WRONG? ............... 215 [S6/03] ARE MONETARISTS’ ARGUMENTS ON THE DEMAND FOR BROAD MONEY VALID IN THE SRI LANKAN
CONTEXT? .................................................................................................................. 223 [S6/04] IMPACT OF INTEREST RATE ON INVESTMENT, IN THE SRI LANKAN CONTEXT: A STUDY ON THE
EFFECTIVENESS OF MONETARY POLICY ............................................................................. 235 [S6/05] EFFECTIVENESS OF THE CREDIT CHANNEL FOR CURBING INFLATION IN SRI LANKA ..................... 243
SESSION-7 PEACE AND DEVELOPMENT 249
[S7/01] POST WAR RESETTLEMENT AND SOCIAL COHESION IN SRI LANKA .......................................... 251 [S7/02] HOUSEHOLD ENTITLEMENTS IN THE EASTERN PROVINCE OF SRI LANKA: WITH SPECIAL REFERENCE TO
FEMALE HEADED HOUSEHOLDS ...................................................................................... 257 [S7/03] BUDDHISM AS A WAY OF RECONCILING POST WAR SRI LANKA ............................................. 267 [S7/04] FOREIGN AID VS. ECONOMIC DEVELOPMENT: EXPLORING THE EMPIRICAL LINKAGE FOR INDIA AND
SRI LANKA .................................................................................................................. 275
SESSION-8 STATISTICAL MODELS FOR AGRO-PRODUCTS 287
[S8/01] ASSESSING THE PRODUCTION VS. PRICE OF BLACK TEA IN SRI LANKA: AN APPLICATION OF KOYCK’S
GEOMETRIC-LAG MODEL .............................................................................................. 289 [S8/02] ARE HEALTHY FOODS EXPENSIVE IN SRI LANKA? IMPLICATIONS FOR FOOD TRADE POLICY ......... 295 [S8/03] FORECASTING FISH PRICES IN COLOMBO WITH SARIMA MODEL .......................................... 303 [S8/04] ESTIMATING TECHNICAL EFFICIENCY OF VEGETABLE FARMERS IN THE ANURADHAPURA DISTRICT IN SRI
LANKA ....................................................................................................................... 313
v
MESSAGE FROM THE VICE CHANCELLOR
University of Ruhuna
After two successful Conferences on Economics, the Sri Lanka Forum of
University Economists (SLFUE) is now planning to hold the 3rd
International Conference on Sri Lanka Economic Research in 2014 with the
patronage of Department of Economics, University of Ruhuna. The theme of
this Conference is “Emerging Trends in Post-Conflict Societies: Challenges
and the Way Forward”. Therefore it is my great pleasure to write this message
to the proceedings of the conference. First of all, I, as the Vice Chancellor of
University of Ruhuna, wish to offer my heartiest congratulations to the Head
of the Department of Economics of the University of Ruhuna and the
organizers of conference for their efforts to make this event a success.
Conferences provide an opportunity for transmission of knowledge based on
latest research and are considered as an essential part of academic
programmes of all good universities. As the Vice Chancellor, I am happy to
see that the University of Ruhuna through organizing this type of conferences,
is now working according to the professional norms of an academic institute.
I am also glad to learn that many economists form different universities in
Sri Lanka are participating in this conference.
The role of the knowledge on economics in the development of modern
societies is widely accepted. It is important to know about emerging
economic trends not only for economists, but also for policy makers and
decision makers. Particularly in discussing Sri Lankan post-conflict economy
it is essential to pay attention to the subthemes such as knowledge economy,
resource sharing, infrastructure development economic modeling etc.
Therefore, I consider this Conference provides an appropriate and well-timed
platform for the university academics to present their findings and exchange
ideas on different topics related to the theme.
Organizing an International Conference is always a big challenge and I am
confident that the Department of Economics would hold this conference to
the expectations of the Sri Lankan academic community. I extend my
congratulations to the organizers of the Conference and wish them all success.
Prof. Gamini Senanayake
Vice Chancellor
University of Ruhuna

Emerging Trends in Post- Conflict Societies: Challenges and the Way Forward Sri Lanka Economics Research Conference 2014
vi
MESSAGE FROM THE DEAN Faculty of Humanities and Social Sciences, University of Ruhuna
It is with great pleasure that I write this message to the proceedings of the 3rd
International Economics Research Conference of the Sri Lanka Forum of
University Economists.
I am happy to learn that the conference theme “Emerging Trends in Post-
Conflict Societies: Challenges and the Way Forward” is a timely topic that
gives birth to creative ideas of Sri Lankan economists to reconsider economic
policies that have been in practice in the past and to be practiced in the future.
This will undoubtedly create a platform for the young economists to
exchange their ideas, share new knowledge gained through innovative
research, and have a healthy dialogue on policy implications.
Also I am pleased to congratulate the Department of Economics that has been
elected to the chair of Sri Lanka Forum of University Economists for year
2014. The opportunity of hosting an international conference of this nature is
indeed a privilege not only to the Department of Economics but also to the
Faculty of Humanities and Social Sciences.
Hosting an international conference is not an easy task. I greatly appreciate
the dedication of the organizing committee of this conference, sponsors and
well-wishers.
Finally, let me warmly welcome all paper presenters, reviewers and
participants from overseas and the entire university system of Sri Lanka, who
are spending productive two days with us in Ruhuna.
I wish the conference all success!
Prof. Sumanasiri Wawwage
Dean, Faculty of Humanities and Social Sciences
University of Ruhuna

vii
MESSAGE FROM THE CHAIRPERSON
Sri Lanka Forum of University Economists (SLFUE)
It is a great pleasure for me to issues a message for the 3rd Sri Lanka
Economic Research Conference of the Sri Lanka Forum of University
Economists (SLFUE). This is Sri Lanka’s largest annual event devoted to the
research of economics, and it will give researches and participants an
intellectual platform to exchange ideas and broaden their knowledge. The
theme of the Sri Lanka Economic Research conference – 2014 is “Emerging
Trends in Post Conflict Societies: Challenges and the Way Forward” and it
is hoped that it will broadly cover all disciplines of economics while
highlighting socio-economic issues and challenges of post conflict societies.
On behalf of the organizing committee I am delighted to welcome you all to
the Sri Lanka Economic Research Conference – 2014 which brings together
scholars and academics from different fields. We are pleased to have
Emeritus Professor D. Atapattu and Professor Sumanasiri Liyanage as the
plenary speakers. I particularly express my gratitude to senior Professor
Gamini Senanayake, our Vice – Chancellor who contributed and helped in
numerous ways to make this conference a success. I would also like to
acknowledge the tremendous efforts of the coordinator of this conference Dr.
A.J.M. Chandradasa and the conference secretary Mrs. K.T. Udari Niranjala
who for their hard work and diligence in organizing this conference. The
success of this conference would have not been possible without the
dedication and efforts of the members of the organizing committee. They
deserve a lot of thanks.
I also take this opportunity to thank all our sponsors. The invaluable financial
support given by University of Ruhuna, Bank of Ceylon Southern Regional
Office, Peoples Bank –Matara Uyanwatta Branch, Chief Minister of the
Southern Provincial Council, and Chartered Institute of Management
Accountants (CIMA) is thankfully acknowledged. It is my honour to warmly
welcome you all to this conference. I hope that this conference will be
stimulating and informative to all who attend it.
Dr. B.M. Sumanaratne
Head of the Department of Economics-University of Ruhuna
Chairman-Sri Lanka Forum of University Economists
Emerging Trends in Post- Conflict Societies: Challenges and the Way Forward Sri Lanka Economics Research Conference 2014
viii
Editorial Preface
It is with great pleasure that I welcome you to the 3rd International Conference
on Sri Lanka Economic Research organized by the Sri Lanka Forum of
University Economists held from 19th - 20th of December 2014 at the
Department of Economics, University of Ruhuna. The SLFUE was formed
in 2012 at the University of Colombo aiming at inculcating a research culture
among university economists whilst contributing to the national development
process of the country. Organising an annual international conference is an
important activity which will enable the members to share professional and
research experience. The previous Sri Lanka Economic Research
Conferences were a chain of intellectual forums which addressed emerging
issues pertaining to contemporary developing economies. The themes of the
1st international conference of SLFUE: “Global economic outlook and
challenges to developing economies” and the 2nd conference “Growth pole
shift towards Asia: Opportunities and Challenges” clearly proved this.
The theme “Emerging Trends in Post-conflict Societies: Challenges and the
Way Forward” was selected for the 3rd Conference as the present social,
economic and political conditions which are in a dilemma, needs a
comprehensive review and analysis to direct the country on a correct path.
Responding to the announcement which appeared in the poster and the web
sites a total of 85 extended abstracts were submitted by researchers who hail
from various disciplines. They not only represented economics but also
hailed from various other fields. The independent double-blind review
process retained 49 submissions for minor corrections by authors and finally,
this publication of conference proceedings contains 33 extended abstracts.
Due to the diversity of the contents represented in the extended abstracts, 8
specific sub themes were identified for parallel technical sessions.
ix
I extended my sincere thanks to all members of the editorial committee who
sacrificed their time to make this publication a reality today.
Hope that this conference will be a great success!
Dr. A.J.M.Chandradasa
Senior Lecturer
Department of Economics
University of Ruhuna
Chief Editor and Coordinator of SLFUE 2014

Emerging Trends in Post- Conflict Societies: Challenges and the Way Forward Sri Lanka Economics Research Conference 2014
x
SRI LANKA ECONOMICS RESEARCH CONFERENCE (SLERC) -2014
The 3rd International Economics Research Conference of the Sri Lanka
Forum of University Economists
Organized by
Department of Economics, University of Ruhuna, Sri Lanka
Organization Committee
Chairperson- SLFUE
Dr. B.M. Sumanarathne
Coordinator- SLERC 2014
Dr. A .J. M. Chandradasa
Committee Members
Prof. D. Atapattu Prof. P. M. Dayananda
Prof. Piyasiri Vithanage Mr. Sarath Katukurunda
Mr. K. K.S. Udayakantha Mr. E.G.Wijesiri
Mr. S.K. Derwin Mr.L.K.Kapila Peiris
Mr. K.A.Nisantha Mr. A.P.Santhasiri
Mrs. Soma Rajapaksha Mrs E.I.Lelwala
Dr.Upul Abeyrathna Mr.I.R.Priyantha
Mr.Nandasiri Keembiyahetti Mr. W.N.D. Wijesinghe
Mr.K.E.D.Perera Ms. Indi Akurugoda
Dr. Shammika Liyanage Mr. A.A Santha
Mr. W.I.C.S.Gunasinghe Mrs Udari Neranjala
Mr. E.G.Wijesiri Ms. N.P.R. Mendis
Mr. Y.P. de Silva Ms.Nadeeka de Silva
Ms. D.D.S. Hemamali Ms. K.D. Gayani
Mr. A.T. Thilak Nandana Ms. C.P. Abeygunawardhane
Mr. K.M.Liyanage Mr. A.H. Rohitha
Mr. Y.K.C. Dinesh Ms. M.S. Rasika

xi
Panel of Reviewers
Prof. Clement Tisdell University of Queensland, Australia
Prof. L.M.Abyewickrama
Department of Agricultural Economics,
University of Ruhuna
Dr. O.G. Dayarathne Banda
Department of Economics and
Statistics, University of Peradeniya
Dr. Nanditha Hettiarachchi
Department of Mechanical and
Manufacturing Engineering, University
of Ruhuna
Dr. T.L. Gunaruwan
Department of Economics, University
of Colombo
Dr.Ranil Abayasekara
Department of Economics and
Statistics, University of Peradeniya
Dr. Wasantha Athukorala
Department of Economics and
Statistics, University of Peradeniya
Prof. Athula Ranasinghe
Department of Economics, University
of Colombo
Dr. H.M.W.A. Herath
Department of Economics and
Statistics, University of Peradeniya
Prof. Danny Atapattu
Department of Economics, University
of Ruhuna
Dr. Chandradasa
Department of Economics, University
of Ruhuna
Prof. Sarath Amarasinghe
Department of Sociology, University of
Ruhuna
Dr. Nisha Arunathilake
Institute of Policy Studies
Prof. Sirimal Abayarathne
Department of Economics, University
of Colombo

Emerging Trends in Post- Conflict Societies: Challenges and the Way Forward Sri Lanka Economics Research Conference 2014
xii
Dr. Manjula K.
Wanniarachchige
Department of Accounting and
Finance, University of Ruhuna
Dr. P.A.P. Samantha
Kumara
Department of Marketing, University of
Ruhuna
Dr. T.S.L.W. Gunawardena
Department of Marketing, University of
Ruhuna
Dr. Ananda Jayawickrama
Department of Economics and
Statistics, University of Peradeniya
Prof. Jayadeva Uyangoda
Department of Political Sicence and
Public Policy, University of Colombo
Dr. A.D.H.K. Kankanamge
Department of Economics and
Statistics, University of Peradeniya
Dr. Aminda Methsila Perera
Wayamba University of Sri Lanka
Prof. Clevo Wilson
Queensland University of Technology,
Australia
Dr.P.L.N. Lakshman
Department of Food Science and
Technology, University of Ruhuna
Prof. S. Subasinghe
Department of Crop Science,
University of Ruhuna
Dr. Thilak Bandara
Department of Geography, University
of Peradeniya
Prof. J.M.S.J. Bandara
Department of Civil Engineering,
University of Moratuwa
Mr.Chandika Gunasinghe
Department of Economics, University
of Ruhuna
Mr. Nishantha
Kurukulasooriya
Department of Economics, University
of Ruhuna
Dr. B.M. Sumanarathne
Department of Economics, University
of Ruhuna
Mr. Nandasiri
Keembiyahetti
Department of Economics, University
of Ruhuna

xiii
Prof. L.P. Jayatissa
Department of Botany, University of
Ruhuna
Dr. Shantha Abeysinghe
Department of Social Studies, The
Open University of Sri Lanka
Mr. S. Sivarajasingham
Department of Economics and
Statistics, University of Peradeniya
Dr. Amirthalingam
Department of Economics, University
of Colombo
Mr. K. Suresh
Department of Economics, Eastern
University
Dr. M.B.F. Mafasia
Department of Management and
Entrepreneurship, University of
Ruhuna
Dr. N. Morais
Department of Social Studies, The
Open University of Sri Lanka
Dr. A.S. Chandrabose
Department of Social Studies, The
Open University of Sri Lanka
Mr. T.Rajeswaran
Department of Economics and
Statistics, University of Peradeniya
Dr. T. Bhavan
Department of Economics, Eastern
University
Mrs. Jeyapraba Suresh
Department of Economics, Eastern
University
Mr. A.M.M. Mustafa
Department of Management, South
Eastern University
Prof. Jayathilake
Bandaralage
Nathen Campus, Griffith University,
Australia

Emerging Trends in Post- Conflict Societies: Challenges and the Way Forward Sri Lanka Economics Research Conference 2014
xiv
Prof. R.K.L.M. Dharmasiri
Department of Geography, University
of Kelaniya
Prof. Vijith S. Jayamanne
Department of Food Science and
Technology, University of Ruhuna
Dr. W.A. Wijewardena Former Deputy Governor CBSL
Prof. S.A. Norbert
Department of Geography, University
of Colombo
Dr. S.M.M. Ismail
South Eastern University
Prof. Sumanasiri Liyanage SANASA University
Dr. S.K.M.Ali
Department of Geography, University
of Ruhuna
Dr. M.M.Jayawardena
Sir John Kothalawala Defense
University
Prof. Dileni Gunewardena
Department of Economics and
Statistics, University of Peradeniya
Prof. P. Liyanarachchi
Department of Geography, University
of Ruhuna
Prof. Udith Jayasinghe
Department of Agribusiness
Management, Wayamba University

Agriculture and Food Security
1
Session-1 Agriculture and
Food Security

Emerging Trends in Post- Conflict Societies: Challenges and the Way Forward Sri Lanka Economics Research Conference 2014
2

Agriculture and Food Security
3
[S1/01] Maize Contract Farming in Sri Lanka; Adoption,
Impact and Policy Implication
Champika,P.A.Ja, AbeywickramaL.Mb
aHector Kobbekaduwa Agrarian Research and Training Institute,
Colombo, Sri Lanka.
[email protected] b. Faculty of Agriculture, University of Ruhuna, Mapalana, Sri Lanka.
Abstract
This paper attempted to examine the existing maize Contract Farming
(CF) system in Anuradhapura district of Sri Lanka as a strategy of
market stabilization through public - private partnership (PPP). Study
applied principal component analysis (PCA) to explain the factors
affected in adoption. It was revealed that full time farmers who have
higher proportion of agricultural income, higher agricultural land
holdings as well as agricultural experience and family labour
participation were more prominent in adopting the contract farming
system. Moreover, statistically significant higher yield by maize
contract farmers over non - contract farmers was believed to be
achieved due to efficient input delivery mechanism of the buyer.
Further, adopters have earned about two times higher agricultural
income than non-adopters. Inability to sell the whole harvest through
CF system was the main obstacle faced by the contract farmers.
Among the constraints faced by contract farmers, price instability was
not a significant problem. In contrast, non-contract farmers have
mentioned price instability as the most critical problem they have
encountered. Therefore, it appears that, contract farming system has
been effective as a market based instrument of price stabilization, in
the context of maize contract farming in Sri Lanka. Further, it was
revealed that unavailability of an authorized body to regulate the
contract farming process and lack of a crop insurance scheme have
slowed down the progress of spreading the contract farming system
throughout the country.
Keywords: Contract farming, Principal Component Analysis,
Price Stabilization,

Emerging Trends in Post- Conflict Societies: Challenges and the Way Forward Sri Lanka Economics Research Conference 2014
4
Introduction and research problem
The key advantages of market-based instruments over price
stabilization schemes were providence of certainty of future revenues,
comparatively low cost of implementation and shifting the risks to
traders in industrialized countries who are willing to take the price risk
(Varangis, P. and Larson, D. (1996). The Contract Farming (CF) has
been implemented widely in developing countries as a means to reduce
risks related to price and quality and as a way to reduce coordination
costs within the food supply. As an alternative to the conventional
government intervention in agricultural marketing, the Central Bank
of Sri Lanka (CBSL), introduced Forward Sales Contracts (FSCs)
under the ‘Govi-Sahanaya’ purchasing/pledge loan scheme in 1999.
A forward sales contract (FSC) is an agreement between the seller and
buyer to deliver a specified quantity of a commodity to the buyer at
some time in the future for a specified price or in accordance with a
specified pricing formula (Kang, G. M. and Nayan, M. 2006). A
Forward contract can be either extended to contract farming system by
delivering inputs and extension service or confined to forward contract
as it is. (Eaton, C. and Shepherd, A.W. 2001). The CBSL facilitated
and monitored the implementation of FSCs process at the initial stage.
After completion of ten years’ direct involvement of the CBSL ended
in 2009 and the system was left to its own operation, without further
involvement of the CBSL. Since then, FSCs between farmers and
buyers have altered to different forms and shapes and a few have
developed to CF System. With this background the present study
focuses on evaluating the critical success and failures of the existing
CF system and to assess the factors affecting the adoption of CF in the
Agriculture and Food Security
5
selected area. Further, this research study is an attempt to fill the gaps
in an effective future policy direction in planning of CF as a strategy
of market stabilization through public private partnership.
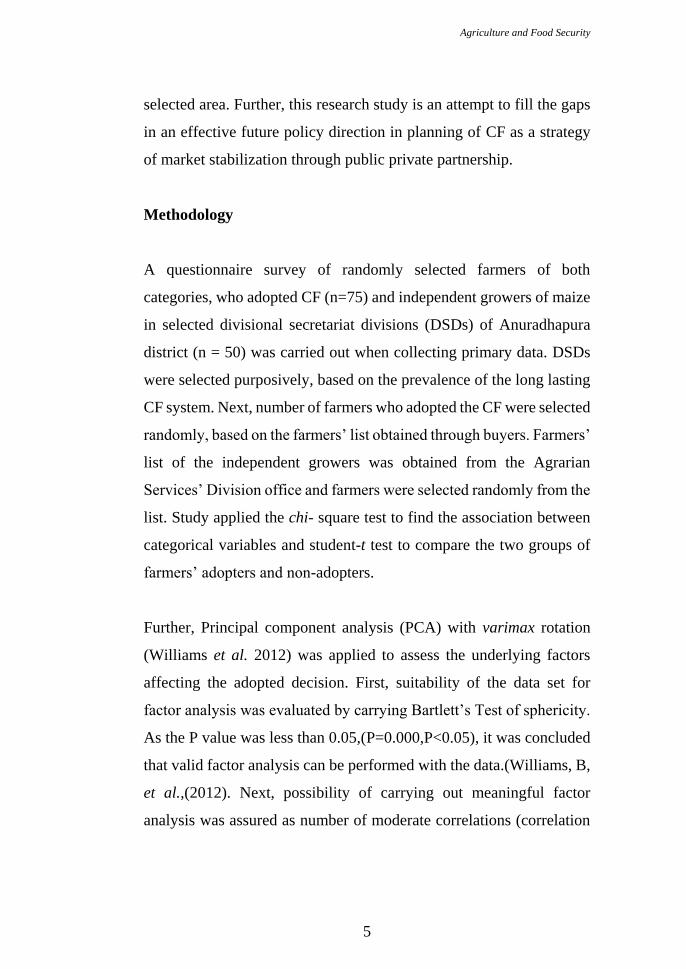
Methodology
A questionnaire survey of randomly selected farmers of both
categories, who adopted CF (n=75) and independent growers of maize
in selected divisional secretariat divisions (DSDs) of Anuradhapura
district (n = 50) was carried out when collecting primary data. DSDs
were selected purposively, based on the prevalence of the long lasting
CF system. Next, number of farmers who adopted the CF were selected
randomly, based on the farmers’ list obtained through buyers. Farmers’
list of the independent growers was obtained from the Agrarian
Services’ Division office and farmers were selected randomly from the
list. Study applied the chi- square test to find the association between
categorical variables and student-t test to compare the two groups of
farmers’ adopters and non-adopters.
Further, Principal component analysis (PCA) with varimax rotation
(Williams et al. 2012) was applied to assess the underlying factors
affecting the adopted decision. First, suitability of the data set for
factor analysis was evaluated by carrying Bartlett’s Test of sphericity.
As the P value was less than 0.05,(P=0.000,P<0.05), it was concluded
that valid factor analysis can be performed with the data.(Williams, B,
et al.,(2012). Next, possibility of carrying out meaningful factor
analysis was assured as number of moderate correlations (correlation

Emerging Trends in Post- Conflict Societies: Challenges and the Way Forward Sri Lanka Economics Research Conference 2014
6
coefficients in the range of 0.2 - 0.8) were observed between selected
variables in the communalities tables.
Results and findings
There was a significant difference between adopters and non-adopters
in relation to experience (in years, t value = 4.448, P<0.05),
agricultural income (Rs/month, t value =7.201,P<0.05), average yield
(Kg/Ac, t value = 4.631, P<0.05) and extension services (Number of
visits/season, t value=13.43, P<0.05). Further, there was a significant
difference between adopted farmers and non-adopted farmers in
relation to the level of education, where reported chi-square value
(7.724, P<0.05) was significant at 5% level. Majority of adopted
farmers have attained secondary education while, majority of non-
adopters had only primary education. The major constrain faced by
CFs (59.1* percent) was, non-procurement of the whole harvest.
Difficulty in obtaining formal credit facilities (47.7* percent) was the
second most important bottleneck, which CFs have faced. Regarding
non contract farmers, the most critical problem they faced (61.2*
percent) was the uncertainty of obtaining reasonable price in the next
season. Both contracted and non-contracted farmers (36.3* and
35.1*percent respectively) mentioned lack of crop insurance scheme
as a main constrain they faced. (*Multiple responses hence cumulative
% can be above 100). The results of the principal component analysis
showed that full time farmers who gained more agricultural
experience, supported by more family labour participation were more
prominent in adopting contract farming system.
Agriculture and Food Security
7
Conclusions, implications and significance
It seemed that the interaction of package of service provided by the
buyer, such as input and extension have positively and significantly
affected for the higher productivity (Yield/Ac) achieved by the
contract farmers.Even though it was found out that the contractual
agreement had increased access for formal credits in other developing
countries, the impact was not much beneficial for the Sri Lankan
context. The results of the principal component analysis showed that
full time farmers who gained more agricultural experience and
supported by more family labour participation were more prominent in
adopting the contract farming system.Among the constrains faced by
contract farmers, price instability was not a significant problem. In
contrast, non-contract farmers have mentioned price instability as the
most critical problem they have encountered. Therefore, it appears
that, contract farming system has been effective as a market based
instrument of price stabilization, in the context of maize contract
farming in Sri Lanka. As the CF agreement is developed based on
mutual understanding of farmers and buyers, development of specific
legislation and guidelines for contract farming practices in Sri Lanka
is a prerequisite for further spreading of the system.
References
1. Eaton,C. and Shepherd, A.W. (2001).A guide; contract farming
partnership for growth. Agricultural Service Bulletin, Food
and Agriculture Organization the United Nations, Rome.
2. Kang, G.M. and Mahajan, N. (2006). An introduction to market-
based instruments for agricultural price risk management,
Emerging Trends in Post- Conflict Societies: Challenges and the Way Forward Sri Lanka Economics Research Conference 2014
8
Agricultural management, marketing and finance working
document. Food and Agriculture Organization of the United
Nations, Rome.
3. Robin,B. (2012). An introduction to Principal Component
Analysis and Factor Analysis Using SPSS 19 and R [on line].
[Accessed on 23.05.2013]. Available at
http://www.floppybunny.org/robin/web/virtualclassroom/stats/sta
tistics2/pca1.pdf.
4. Varangis, P. and Larson, D. (1996).Dealing with commodity
price uncertainty. World Bank Working paper No.1667.
Washington DC, USA.
5. Williams, B.,et al.(2012). Exploratory factor analysis: A five-step
guide for novices Australasian Journal of Para – medicine.
Volume 8 Issue 3. [on line]. [Accessed on 22.10.2013].Available
at http://ro.ecu.edu.au/jephc/vol8/iss3/1

Agriculture and Food Security
9
[S1/02] Economics of Climate Change Adaptation: A
Case with Three Rural Communities in Dry Zone, Sri
Lanka
Hasara Rathnasekaraa, L.H.P. Gunaratneb
a Department of Agricultural Economics and Business Management, Faculty of
Agriculture, University of Peradeniya, Sri Lanka
[email protected] b Department of Agricultural Economics and Business Management, Faculty of
Agriculture, University of Peradeniya, Sri Lanka
____________________________________________________
Abstract
Climate change is one of the most pressing problems affecting
mankind today.Climate change Adaptation is the most promising
option in minimizing costs of climate change in the context of the
developing world. Agriculture, fisheries and forestry are earmarked
as the most vulnerable sectors in relation to climate change. Against
this backdrop, the objective of the study was to capture the local
context of adaptation of the rural communities namely Thambapanni,
Maradankalla and Rathriwewa in North western, North central and
Uva province respectively. Data was collected from 450 households.
More specifically the study identifies the factors influencing climate
change adaptation and cultivation choices.A Binomial logistic model
and a multinomial logistic model were estimated to identify the
variables affecting climate change adaptation and cultivation choices
respectively.
Results revealed changing patterns of rain fall, drought, warming and
deepening of ground water level were major climate problems and
majority perceived present situation is worse compared to last 10
years. Food self-sufficiency, income, education, land ownership and
social capital were found as significantly affecting factors for
adaptation. Estimation of Multinomial logistic model revealed that
majority shift to non-agricultural activities during dry season.
Conversely, the farmers rich in market access, education and social
capital were found as more likely to cultivate OFC depicting higher
level of adaptation.

Emerging Trends in Post- Conflict Societies: Challenges and the Way Forward Sri Lanka Economics Research Conference 2014
10
The study emphasizes mainstreaming adaptation is important as rural
communities are at higher vulnerability. Food self-sufficiency,
income, education, strengthening social capital, improving market
access should prioritize in implementing strategies to enhance
adaption.
Keywords: Adaptation, Climate change, Cultivation choices,
Social capital
__________________________________________________________________
Acknowledgement
Authors like to thank Director, Agriculture Education Unit, Faculty of Agriculture,
University of Peradeniya for the support given in accessing the data set and Base line
survey report on Seasonal Climate Forecasting and Food Security, 2013. All errors
are solely the responsibility of author and should not be ascribed to any of the
institutions or persons mentioned above.
__________________________________________________________________
Introduction and research problem
Climate change is one of the most pressing problems affecting
mankind today.More specifically, primary production sectors such as
agriculture, fisheries and forestry are earmarked as most vulnerable
sectors to its consequences (IPCC, 2007b). Climate change adaptation,
making adjustments in natural or human systems in response to actual
or expected climate stimuli is appearing as the best and most viable
option to minimize the costs of climate change especially in the context
of the developing world since climate change mitigation cannot be
considered as promising and applicable solution.
Tackling environmental challenges and climate change has also been
highlighted as a key socio-economic policy area which has to be
addressed immediately by all South Asian countries (6th South Asian
Economic Summit, 2013). Although a number of studies have been
conducted at global level on climate change adaptation, vulnerability
Agriculture and Food Security
11
and adaptation are the least studied areas in the local context and dearth
of knowledge in adaptation results in inefficient policy formulation
(Eriyagama, 2009).
Against this backdrop, the objective of the study was to capture the
local context of adaptation of rural communities namely Thambapanni,
Maradankalla and Rathriwewa in North western, North central and
Uva province respectively, representing dry zone, Sri Lanka. More
specifically the study identifies the factors influencing climate change
adaptation and cultivation choices.
Methodology
The study was based on data collected from 450 respondents for
Seasonal climate forecasting and food security base line survey, 2013.
Data were collected on demographic and socio-economic variables,
perceptions and experiences to climate change and their adaptation
strategies. A comparison of demographic and socio-economic status of
the three rural communities was done using descriptive statistics. One-
way ANOVA test was employed to compare the mean income levels
of the households. Kruskal-Wallis test was used to identify the major
climate related problems faced by three rural communities and also to
identify perceptions of villagers on climate related problems.
Further a Binomial logistic model was estimated to establish the
relationship between wealth, capital, food self-sufficiency and climate
change adaptation. Basis of crop selection, a binary variable (climate
or non-climate basis) was considered as a proxy for climate change
adaptation (Seo and Mendelsohn, 2008).The dichotomous response

Emerging Trends in Post- Conflict Societies: Challenges and the Way Forward Sri Lanka Economics Research Conference 2014
12
variable was equal to 1, if the crop selection is based on climate related
variables such as anticipated rains or drought, water availability in the
tanks etc. The dichotomous variable was equal to 0, if the crop
selection is based on non-climate related variables such as profits,
market conditions, community decision or agreements with buyers.
Accordingly, if a farmer relies on climate related variables for crop
selection, he/she is considered as less adapted to climate change
whereas if a farmer relies on non-climate related variables for crop
selection he/she is considered as highly adapted to climate change.
In addition, a Multinomial logistic model was estimated to analyze
cultivation choices of farmers at a changing climate scenario since crop
choice can be considered as a proxy for adaptation (Kurukulasuriya
and Ajwad, 2007). Three crop choices of not-to-cultivate, cultivate
paddy and cultivate Other Field Crops (OFC) in the dry season were
treated as the dependent variable (three options are mutually exclusive)
and independent variables were input variables, market access, human
capital, social capital and demographic variables.
Results and findings
Results of the descriptive analysis revealed that majority of farmers in
the study area were full time farmers. i.e Maradakalla 71.62%,
Rathriwewa 84.62% and Thambapanni 68.42%. Raring livestock was
not a popular activity among the farmers. On average farmers were in
their middle forties and had education up to primary or secondary
level. Mean income level was LKR 11,087 which was higher than the
official poverty line (LKR 3567.25) of the survey period. Food self-

Agriculture and Food Security
13
sufficiency was measured by number of months that the household can
meet their food demand by crop production and it was 11 (10.84)
months. On average around 15% of farmers were entitled to the
Samurdhi program which can be considered as a safety net. With
respect to social capital, farmers were active members of at least 3
community level organizations on average.
According to the results, climate related problems, drought, warming
and deepening of ground water levels were appeared as the major
problems. All three rural communities perceived situation of changing
rain fall pattern, drought, floods, pest and disease problems were worst
compared to the situation prevailed 10 years ago.
62% of farmers relied on climate related variables to make the decision
on crop selection whereas 38% relied on non-climate related variables.
Accordingly highest percentage of farmers in the community showed
less adaptation to climate change. Results of the Binomial logistic
model revealed that food self-sufficiency, monthly income, land
ownership and social capital were the factors significantly affecting for
basis of crop selection. Respondents with higher levels of food self-
sufficiency, monthly income and social capital were more likely to
depend on non-climate variables for basis of crop selection, depicting
higher level of climate change adaptation. In contrast, higher land
ownership exhibited less likely for adaptation.
Equation 01: Binomial logistic model
logit(Pi) = log (Pi
1 − Pi) = ∑βi
10
i=0
Xi + +Ui………… . . (1)

Emerging Trends in Post- Conflict Societies: Challenges and the Way Forward Sri Lanka Economics Research Conference 2014
14
Estimation of Multinomial logistic model revealed majority shift to
non-agricultural activities during dry season. 78.36% of farmers
decided not-to-cultivate during dry season, 13.46% decided to
cultivate Other Field Crops and 8.18% decided on paddy farming.
However, the respondents rich in market access, education and social
capital were found as more likely to cultivate paddy and OFC during
dry spells.
Equation 02: Multinomial logistic model
logit(Pi) = log (Pi
1−Pi) + ∑ γi
12i=1 Xi + +fi………….. (2)
Table 01:Maximum Likelihood estimates for Binomial logistic model
Independent Variable Paramet
er
Co-efficient Marginal
Effects
Constant β0 5.32(1.42)***
Samurdhi β1 -0.16(0.34) -0.04(0.08)
Food Self-sufficiency(Months) β2 -0.26(0.09)*** -0.06(0.02)
Total expenditure(LKR) β3 -0.00(0.00)*** -0.00(0.00)
Land ownership(Acres) β4 0.20(0.07)** 0.04(0.02)
No of memberships β5 -0.22(0.11) -0.05(0.02)
Age(Years) β6 -0.01(0.01) -0.00(0.00)
Education above secondary level β7 -0.60(0.36) -0.42(0.22)
Secondary education β8 -0.32(0.46) -0.14(0.20)
Primary education β9 1.13(0.93) 0.24(0.18)
Livestock index β10 0.12(0.47) 0.03(0.11)
*** for significance at 1%, ** for significance at 5%
Standard errors are in parenthesis.
Marginal effect for discrete change of dummy variable from 0-1
Log likelihood= -125.2521, Likelihood ratio chi2 (9) =89.17, Prob>chi2=0.0000, Pseudo
R2=0.2625

Agriculture and Food Security
15
Table 02: Maximum likelihood estimates for parameters in
Multinomial logistic model
Independent Variable Parameter Paddy
Coefficient Marginal Effect
Constant γ0 -22.90
Family Labour(Days) γ1 -0.00(0.00) 0.00 (2.41)
Market Access γ2 2.62(0.49) *** 0.10 (0.04)
Forecasting Ability γ3 0.11(0.59) 0.00 (0.02)
Total expenditure (LKR) γ4 0.00(0.00) 1.42e-06 (0.00)
Age (Years) γ5 0.04(0.02) ** 0.00 (0.00)
Sex γ6 -1.21(0.69) * -0.05 (0.05)
Above secondary
education
γ7 17.99(1.44) *** 0.71 (0.34)
Secondary education γ8 18.46(1.36) *** 0.48 (0.24)
Primary education γ9 17.28(1.51) *** 0.44 (0.28)
Land(Acres) γ10 0.01(0.07) 0.00 (0.00)
Ancestry γ11 -0.15(0.46) 0.01 (0.01)
No of memberships γ12 0.02(0.15) 0.00 (0.00)
Independent Variable Parameter OFC
Coefficient Marginal Effect
Constant γ0 -20.29
Family Labour(Days) γ1 -0.00(0.927) -2.00e-06 (0.00)
Market Access γ2 3.52(0.000) *** 0.30 (0.06)
Forecasting Ability γ3 -1.31(0.112) -0.03 (0.02)
Total expenditure (LKR) γ4 -0.00(0.452) -1.22e-06 (0.00)
Age (Years) γ5 0.00(0.955) -0.00 (0.00)
Sex γ6 -1.22(0.088) * -0.77 (0.06)
Above secondary
education
γ7 16.8(0.000) *** 0.26 (0.34)
Secondary education γ8 18.33(0.000) *** 0.52 (0.23)
Primary education γ9 17.44(0.000) *** 0.56 (0.28)
Land(Acres) γ10 -0.08(0.391) -0.00 (0.00)
Ancestry γ11 0.55(0.242) 0.01 (0.01)
No of memberships γ12 0.29(0.028) ** 0.01 (0.00)
*** for significance at 1%, ** for significance at 5%,*for significance at 10%
Standard errors are in parenthesis
Log likelihood= -169.2464, Likelihood ratio chi2 (24) = 166.13, Prob>chi2 =
0.0000, Pseudo R2 = 0.3292
Results are compared with the baseline choice of not-to-cultivate option
Emerging Trends in Post- Conflict Societies: Challenges and the Way Forward Sri Lanka Economics Research Conference 2014
16
Conclusions, implications and significance
The study emphasizes that it is of utmost importance to mainstream
policy agenda on enhancing climate change adaptation and adaptive
capacity of rural agricultural communities in Sri Lanka as they are at a
higher vulnerability. The study provides further evidences to
emphasize changing patterns of rain fall, drought, warming and
deepening of ground water levels are the major climate related
problems faced by farmers in the dry zone. According to the results,
food self-sufficiency, monthly income and level of education are the
factors that lead to enhance climate change adaptation. Therefore
initiatives should be stem up to improve access to education and
elevate living standards of rural communities by increasing income
level. At the same time strengthening of local and private institutions
aiming at social and human capital build up is important. Further
improving market access should be one of the substantial areas that
should be given priority in implementing strategies to enhance climate
change adaptation in the rural context.
References
1. Kurakulasuriya, P., and Ajwad, M.I.(2007). Application of the
Ricardian technique to estimate the impact of climate change on
small holder farming in Sri Lanka.Climate Change, 81(1), 39-59.
2. Mendelsohn, R., and Seo, S.N. (2008).Measuring impacts and
adaptation to climate change: A structural ricardian model of
African livestock management.
3. Mortimore,M.J., and Adams, W.M.(2001). Farmer adaptation,
change and crisis in the Sahel.Global Environment Change, 11(1),
49-57.
Agriculture and Food Security
17
[S1/03] Development of Pineapple (Ananascomosus) and
Watermelon (Citrulluslanatus) Blended Ready-To-Serve
Beverage
K. Saranyah and T. Mahendran
Department of Agricultural Chemistry, Faculty of Agriculture, Eastern University,
Sri Lanka.
_______________________________________________________
Introduction
In a horticultural sense Watermelon (Citrulluslanatus) is classified as
a vegetable crop. The crop itself is actually a fruit. The season for this
crop is rather short lasting only about two months. Its harvesting time
in Sri Lanka is from May to June. Thus, it is a real summer crop. The
consumption of watermelon is also confined to summer only. Higher
quality in watermelon is associated with high total sugar content, deep
red color and pleasant crisp texture. The maturity thus plays a very
important role in the marketing. When it is under matured, the fruit is
low in total soluble solids and light in color. But when it is over
matured, the color fades, and the texture becomes soft, although the
total soluble solids still remain high. Processing of fruits into value
added products is the best option to control the huge losses. Fresh
fruits are utilized for the preparation of jam and squash, juice, sauce
and confectionery. Present dietary scenario necessitates exploring the
possibilities of incorporating novel ingredients in commonly
consumed foods rather than developing new food product (Aleem-
Zakir et al., 2012). Juice blending is one of the best methods to
improve the nutritional quality of the juice (Awsi and Dorcus, 2012).
It can improve the vitamin and mineral content depending on the kind
and quality of fruits and vegetables used. Pineapple (Ananascomusus)
Emerging Trends in Post- Conflict Societies: Challenges and the Way Forward Sri Lanka Economics Research Conference 2014
18
belongs to the family of bromeliaceae. Its pulp is juicy and fleshy with
the stem serving as a supporting fibrous core. It is an excellent source
of antioxidant vitamin C which is required for the collagen synthesis
in the body. And it is also available in May to June at low prices in the
markets. In Sri Lanka watermelon has been grown in 159 ha while
pineapple is cultivated in 4782 ha. The annual production of
watermelon and pineapple are 8349mt and 51,611mtrespectively
(Department of Agriculture pocket book of agricultural statistics
2011).The aim of this research was to prepare and determine shelf life
of Ready-To-Serve beverage from pineapple and watermelon fruit
juices at different combinations and to determine the most suitable
combinations of juices for the commercial preparation.
Methodology
Undamaged, disease free, healthy, mature and ripe watermelon
(Variety - Thillina) and pineapple (Variety -Mauritius) fruits were
purchased from the commercial horticultural farms of the Department
of Agriculture, Sri Lanka. The drink was prepared by adding sugar,
citric acid and sodium metabisulphite, according to the Sri Lanka
Standards (1985) for RTS fruit beverages. RTS beverages were
developed using watermelon and pineapple juices at different
combinations. The prepared beverages were filtered through the
strainer (200 µm) to get a clarified juice and filled in
previously sterilized glass bottles (200 ml) leaving 2.5 cm head space
and sealed airtight by crown corking. Then in bottle sterilization was
done at105°C for 10 min and cooled to room temperature of 30±1°C.
The following treatment combinations were formulated.

Agriculture and Food Security
19
T1 - RTS beverage with 100% watermelon juice
T2 - RTS beverage with 90% watermelon juice and 10%
pineapple juice
T3 -RTS beverage with 85% watermelon juice and 15%
pineapple juice
T4 -RTS beverage with 80% watermelon juice and 20%
pineapple juice
T5 - RTS beverage with 75% watermelon juice and 25%
pineapple juice
T6 - RTS beverage with 70% watermelon juice and 30%
pineapple juice
These freshly made beverages were assessed for the nutritional,
organoleptic and microbiological qualities. The chemical evaluations
were done by using standard AOAC (2002) methods. The microbial
assessment was carried out by estimating total plate count according
to the method described by Arachchi (2003) in raw mango RTS. The
total plate count was determined by observing the colonies formed
especially bacteria.
The organoleptic qualities including colour, flavor, taste, thickness and
overall acceptability were evaluated by randomly selected 30 semi-
trained members using nine-point hedonic scale testing. A 50ml of
juice at 7C was presented to the panelists during each serving. Among
the six treatments, the most preferred three treatments were selected
for storage studies based on their quality characteristics. The samples
were stored at ambient temperature of 30+1°C and relative humidity
75 – 80% to determine the shelf life of the prepared RTS beverages.
Emerging Trends in Post- Conflict Societies: Challenges and the Way Forward Sri Lanka Economics Research Conference 2014
20
The difference between means was compared using Duncan’s Multiple
Rang Test using SAS statistical package. Tukey’s studentized range
test was used for organoleptic evaluation to compare the difference
between means.
Results and Discussion
The freshly made RTS beverages were assessed for nutritional
qualities, organoleptic characteristics and microbial quality. Samples
subjected to sensory evaluation showed that there were significant
differences (p˂0.05) between treatments of freshly made pineapple
blend watermelon RTS beverages. The titrable acidity, ascorbic acid,
total soluble solids and total sugars of freshly made pineapple blend
watermelon RTS beverages increased, while pH decreased with the
increased concentration of pineapple juice from 10 to 30%. Among all
six treatments the best three treatments were selected based on their
quality characteristics for storage studies. Nutritional, sensory and
microbial tests were carried out at two week intervals during the entire
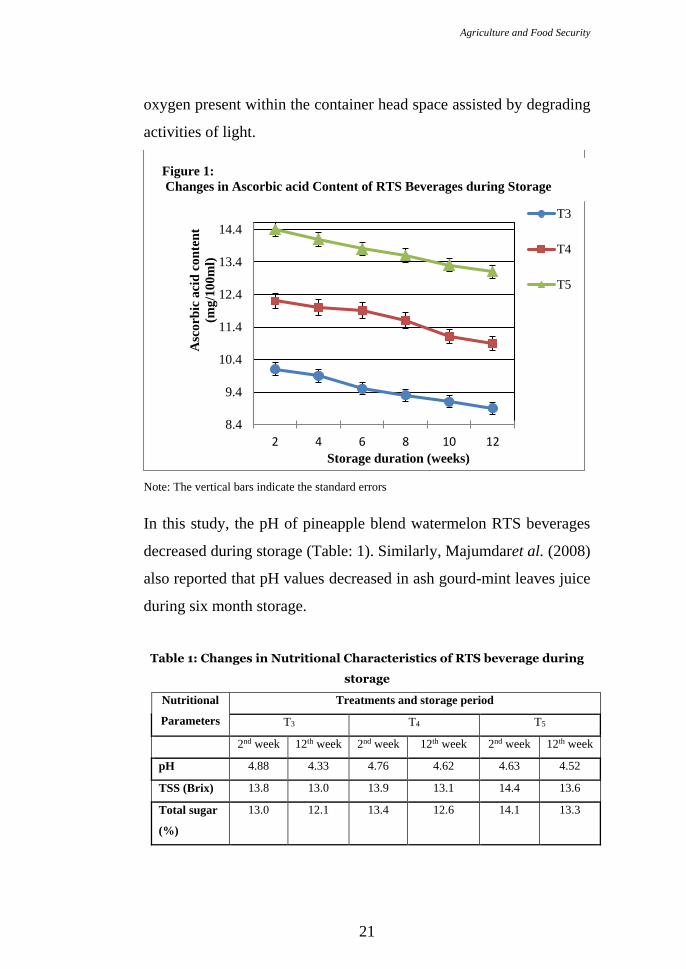
storage period. The changes inascorbic acid content of the RTS
beverages made from watermelon- pineapple during storage are shown
in Figure: 1.
The ascorbic acid content showed a significant (p<0.05) decreasing
trend to the storage period in all treatments. This reduction was due to
the oxidative degradation of ascorbic acid to dehydro ascorbic acid
during storage as the ascorbic acid is highly sensitive to the presence
of oxygen in its environment. Jawaheeret al. (2003) reported that
another principal cause of ascorbic acid decrease might be residual
Agriculture and Food Security
21
oxygen present within the container head space assisted by degrading
activities of light.
Note: The vertical bars indicate the standard errors
In this study, the pH of pineapple blend watermelon RTS beverages
decreased during storage (Table: 1). Similarly, Majumdaret al. (2008)
also reported that pH values decreased in ash gourd-mint leaves juice
during six month storage.
Table 1: Changes in Nutritional Characteristics of RTS beverage during
storage
Nutritional
Parameters
Treatments and storage period
T3 T4 T5
2nd week 12th week 2nd week 12th week 2nd week 12th week
pH 4.88 4.33 4.76 4.62 4.63 4.52
TSS (Brix) 13.8 13.0 13.9 13.1 14.4 13.6
Total sugar
(%)
13.0 12.1 13.4 12.6 14.1 13.3
8.4
9.4
10.4
11.4
12.4
13.4
14.4
2 4 6 8 10 12
Asc
orb
ic a
cid
co
nte
nt
(mg
/10
0m
l)
Storage duration (weeks)
T3
T4
T5
Figure 1:
Changes in Ascorbic acid Content of RTS Beverages during Storage

Emerging Trends in Post- Conflict Societies: Challenges and the Way Forward Sri Lanka Economics Research Conference 2014
22
High acid and low pH may be due to the production of acetic acid and
lactic acid during storage. Total sugar in all treatments had the
decreasing trend with the storage period because hydrolysis of
polysaccharides and oxidation of sugars took place during the storage
period as supported by Fennema (1996).
The TSS reduced gradually (Table: 1) which might be due to the
chemical interactions taking place among the organic constituents of
the beverage. In all treatments, titrable acidity significantly (p<0.05)
increased throughout the storage period reaching a maximum value of
0.46 was observed in RTS beverage with 85% watermelon and 15%
pineapple juice with the minimum value of 0.29 which was observed
in RTS beverage with 75% watermelon and 25% pineapple juice
(Figure: 2).
The increase in tritable acidity is due to the hydrolysis of
polysaccharides and oxidation of sugars leads to formation of organic
acids (Fennema, 1996). Among the tested treatments, the RTS
beverage formulated with 80% watermelon and 20% pineapple juice
contained 13° Brix, 0.41% titrable acidity, 12.6% total sugars, 10.9
mg/100g ascorbic acid and pH of 4.62 at the end of 12 weeks of
storage. However, titrable acidity of these beverages increased from
0.33 to 0.41% which is within acceptable range for long term storage.
Sensory evaluation was made for pineapple blend watermelon RTS
beverage after two weeks interval through panel of 30 semi-trained
panelists. The panel evaluated color, flavor, taste, thickness and overall
acceptability using a 9-point hedonic scale.

Agriculture and Food Security
23
Note: The vertical bars indicate the standard errors
Organoleptic characters of Pineapple Blend Watermelon RTS
Beverages stored at ambient temperature were changed slightly apart
from freshly made RTS beverages during the storage period (Figure:
3).
Means with the same letters are not significantly different from each
other at 5% level based on Tukey’s Test Sensory parameters which
were measured using nine point hedonic scales. The results of sensory
assessment revealed that there were no significant differences (p<
0.05) between the treatments in terms of color, taste and overall
acceptability while flavor and thickness had significant differences (p
> 0.05) among the tested treatments.
0.25
0.3
0.35
0.4
0.45
0.5
2 4 6 8 10 12
Tit
aa
ble
aci
dit
y
(as%
Cit
ric
aci
d)
Storage duration (Weeks)
T3
T4
T5
Figure 2: Changes in Tritable acidity of RTS beverage during storage

Emerging Trends in Post- Conflict Societies: Challenges and the Way Forward Sri Lanka Economics Research Conference 2014
24
Means with the same letters are not significantly different from each
other at 5% level based on Tukey’s Test Sensory parameters which
were measured using nine point hedonic scales. The results of sensory
assessment revealed that there were no significant differences (p<
0.05) between the treatments in terms of color, taste and overall
acceptability while flavor and thickness had significant differences (p
> 0.05) among the tested treatments. The findings of microbial studies
showed no total plate counts at the end of 12 weeks of storage in the
formulated beverages.
0123456789colour
flavour
tastethickness
overallacceptability
T3
T4
T5
Figure 3: Sensory characteristics of Pineapple Blend Watermelon
RTS Beverages at the end of the storage period of 12 weeks

Agriculture and Food Security
25
Conclusions
RTS beverage formulated with 80% watermelon and 20% pineapple
juice showed the best overall acceptability compared to other
combinations and could be stored at ambient conditions of 30±1°C and
relative humidity 75–80% for a minimum period of 12 weeks without
any significant changes in the quality attributes.
References
1. AOAC.(2002). Official Methods of Analysis.Association of
Official Analytical Chemists. Washington, New York, USA.
2. Awsi, K. and Dorcus, E. R (2012).Development and Quality
Evaluation of Pineapple Juice Blend with Carrot and Orange
juice.International Journal of Scientific Research
Publications.12(1): 2250-2253.
3. Aleem-Zakir, M. D., Genitha, T. R. and I.H. Sijed, I. H.
(2012).Effects of Defatted Soy Flour Incorporation on Physical,
sensorial and Nutritional Properties of Biscuits.Journal of Food
Processing and Technology.3:1-4.
4. Fennema, O. R. (1996). Food Chemistry. (3rd Edn.).CRC Press,
USA.pp. 157-412.
5. Jawaheer, V. H., Lucy, E and Cintana, S.U. (2003).Nutritional
composition and sensory properties of mango and ginger blend
RTS beverage. African Journal of Food Science and Technology.
34(3): 74 – 82.
6. Majumdar, T. K., Vasudish, C. R., Premavalli, K. S. and A.S.
Bawa. (2008). Studies on processing and storage stability of
ashgourd-mint leave juice. Journal of Food Preservation and
Processing.34: 549-556.

Emerging Trends in Post- Conflict Societies: Challenges and the Way Forward Sri Lanka Economics Research Conference 2014
26
7. Salunkhe, D. K., Bolin, H. R. and Reddy, N. R. (1991) Storage,
processing and nutritional quality of fruit and vegetables.
(2ndEdn.). CRC Press, Florida, USA. pp. 243-294.
8. Sri Lanka Standard Institute. (1985). Specifications for Ready-To-
Serve fruit drinks SLS 729:1985, Colombo.
Agriculture and Food Security
27
[S1/04] Agricultural Innovation: The Role of Micro-
Inventions by Rural Farmers in Minor Crop Industry
with a Special Reference to the Meerigama D.S Division
K.K.N.P Rathnayake
General Sir John Kotelawala Defence University, Ratmalana, Sri Lanka
______________________________________________________
Keywords: Agriculture innovation, Macro-invention, Micro-
invention, Minor crops, Rural Development, Sustainability
Introduction
Agricultural development is not only a defence against hunger for
every household but also can raise income nearly four times more
effectively than the growth in any other sector. Agricultural innovation
typically arises through dynamic interaction among the multitude of
actors involved in growing, processing, packaging, distributing, and
consuming or otherwise using agricultural products. Agricultural
innovations are primarily concerned with a need for increasing
production (of food, fodder, secondary products) as well as enhancing
quality (of produce, production process, growing conditions) (Veen,
2010). Innovations affect many areas: crops, animals, growing
conditions, implements and management practices. As main forms of
innovations, two types of inventions by various stakeholders in
agriculture can be identified. They include, ‘macro-inventions’
(radical new ideas for adoption) and ‘micro-inventions’, that are
changes or modifications (for adaptation) in tools and practices made
by skilled practitioners (farmers, craftspeople), rather than by

Emerging Trends in Post- Conflict Societies: Challenges and the Way Forward Sri Lanka Economics Research Conference 2014
28
inventors or entrepreneurs. The farmers are important stakeholder in
minor crop industry and they often apply their own-modified practices
and methods which usually are referred to as 'routine innovations, sub-
inventions or micro inventions' to enhance crop productivity. But these
modifications are not accepted and recommended by the formal
mechanism as crucial in modifying and complementing macro-
inventions. This hidden conflict between skilled and experienced
farmers and the formal mechanism may badly affect the sustainability
of the rural minor crop industry. This may create isolation and
vulnerability in reaching appropriate guidance, training and support for
potential farmers with less skills and experiences. Furthermore, the
limited application of backward and forward linkage in technology
inventions may result in a 'technological complex'(Dyer 1997; Myrdal
1997; Sherratt 1983; Watson 1983) and 'agricultural stagnation'. With
this view, the study attempts to analyse the role of Micro-Inventions
used by rural farmers in minor crop industry in Sri Lanka.
Methodology
A qualitative research was conducted in Meerigama D.S Division, with
a sample of purposely (and snowballing sampling method which was
especially useful when someone was trying to reach people who are
inaccessible or hard to find) selected 30 (both experienced and newly
entered) farmers (target population was 125) who cultivate pineapple,
betel, and/or banana for their livelihoods. Additionally, six extension
officers (Agricultural Instructors) attached to three agrarian centres
(Meerigama, Pallewela, and Pasyala) in Meerigama D.S Division to
represent the formal mechanism were selected. As data collection

Agriculture and Food Security
29
methods, focus group discussions, observations, and face to face in-
depth interviews were used. As data analysis methods, thematic
analysis and case studies were mainly adopted. Here, descriptive
analysis was undertaken with substantial description and efforts were
taken to find main themes of the discussion. Furthermore, special
characteristics and exceptional behavioral patterns of some farmers
and extension officers, and their experiences related to the objectives
of the study were identified. In this study, multiple reliability strategies
were incorporated to make sure the accuracy of the findings. They
included triangulation of different data sources of information,
member checking, and peer debriefing, spending prolonged time in the
field and presenting negative or discrepant information that runs
counter to the themes.
Results and findings
Agricultural innovations adapted by the farmers include growing
conditions (fertilizer management and land preparation), implements
(cultivation patterns and use of easy devices), and management
practices of changes relates to production and ownership. The findings
of the research show that skilled and experienced farmers use their own
methods and practices, especially in plant selection, planting, fertilizer
and weed management. Though the production is in considerable
quality and quantity, the agricultural income is not sufficient since they
lack implementing market oriented-management practices. Further,
the extension officers maintain good relationship with farmers,
knowing that farmers pay no or less attention for their guidance. But
this dependency on each other gives mutual benefits to both. The
Emerging Trends in Post- Conflict Societies: Challenges and the Way Forward Sri Lanka Economics Research Conference 2014
30
farmers with less experience follow both informal (from experienced
farmers) and formal methods (from AIs) in their cultivation processes
but they end up with mixed results. It shows that the adaptation of these
methods is not systematically developed for adoption and that there is
poor decision making. Many improvements involve adaptations to suit
the (new) local circumstances rather than the wholesale adoptions of
technologies brought from outside. Farmers are willing and able to
challenge existing ways of doing things, but the prevailing ideology
among extension officers (government mechanism) seems
discouraging the new farmers.
Conclusions, implications and significance
Innovation plays an important role in creating jobs, generating income,
alleviating poverty and driving social development. The agricultural
inventions do not frequently focus on the adoption of newly introduced
technologies, but the adaptation of existing ones. Further, as there is a
failure of the formal mechanism to establish the linkage between micro
and macro inventions, it is proven that the potential farmers with less
experience and skills are vulnerable to failures. Extension officers need
to be qualified to build the trust among farmers. For innovation to
occur interaction among diverse stakeholders in minor crop industry
need to be opened and they should draw upon the most appropriate
available knowledge. Aside from a strong capacity in R&D, the ability
to innovate is often related to collective action, coordination, the
exchange of knowledge among diverse stakeholders, the incentives
and resource available to form partnerships and develop businesses,

Agriculture and Food Security
31
and conditions that make it possible for farmers or entrepreneurs to use
the innovations. Agricultural innovations, small and large, have been
catalysts for bigger changes, such as tying people to land, land
ownership, population growth, specialization and social hierarchy,
wealth and prestige acquisition, colonization of agriculturally marginal
land, increases in production, trade and exchange, urbanization and,
ultimately, the rise of the state and our own modern world. Therefore,
it is important for stakeholder-based supportive policies for the
sustainability of rural minor crop industry along with rural
development.
References
1. Dyer, C. 1997. Medieval farming and technology: conclusion. In
Medieval Farming and Technology: The Impact of Agricultural
Change in Northwest Europe (eds G. Astill and J. Langdon).
Leiden: Brill, pp. 293–312.
2. Marijke, V.V. 2010. Agricultural Innovation: invention and
adoption or change and adaptation?. World Archaeology, 42 (1):
1-12.
3. Myrdal, J. 1997. The agricultural transformation of Sweden,
1000–1300. In Medieval Farming and Technology: The Impact of
Agricultural Change in Northwest Europe (eds G. Astill and J.
Langdon). Leiden: Brill, pp. 147–71.
4. Sherratt, A. G. 1983. The Secondary Products Revolution of
animals In the Old World. World Archaeology, 15: 90–104.
5. Watson, A. M. 1983. Agricultural Innovation in the Early Islamic
World. Cambridge: Cambridge University Press.

Emerging Trends in Post- Conflict Societies: Challenges and the Way Forward Sri Lanka Economics Research Conference 2014
32
Education in Knowledge Economy
33
Session-2 Education in
Knowledge
Economy

Emerging Trends in Post- Conflict Societies: Challenges and the Way Forward Sri Lanka Economics Research Conference 2014
34

Education in Knowledge Economy
35
[S2/01] The Difference in Employability of Graduates in
public and Private Sector Management Education
Institutes in Sri Lanka
Ambepitiya.K.Ra,
aGeneral Sir John Kothelawala Defence University, RathmalanaSri Lanka
Abstract
The rationale for carrying out this research project lies in the findings
of a survey that outlines the difference in Employability of university
graduates. This is due to the exploratory demanding nature of the job
market available for graduates of public and private higher education
sectors. The aim of this study is to identify the difference in
employability of the graduates in public and private higher education
institutes who offer management degree programmes. As education is
one of the major standards of measuring development and as human
capital is the main asset of the country, it is important to study how the
higher education of Sri Lanka is prepared to support undergraduates
to develop employable skills. Due to the heavy competition in entering
public universities in Sri Lanka, the higher education is open to private
providers and they are affiliated with foreign universities. These two
institutes in higher education follow their own ways of producing
graduates. Therefore it creates a significant requirement to identify
differences in employability of graduates of public and private higher
education institutes. This study reviewed available theoretical
literature such as Human Capital Theory, Institutional theory, Theory
of employment and unemployment and job market signalling. The
study has comprehensively reviewed different views generated by other
authors pertaining to graduate employability in general. Primary data
was collected through a questionnaire and interviews by randomly
selected121 graduates who have passed out from two selected
education institutes. An empirical survey was designed with two sets
as to study the views and experiences of graduates who are using
Facebook and google+ sites by using ‘Snowball sampling’ method
since questionnaires were distributed among the above social media
network communities. The researcher concludes that both institutes
pay their attention to develop theoretical knowledge in their students.
Public institutes were one step ahead in developing practical skills of
students. Leadership programmes, internships, industrial visits and

Emerging Trends in Post- Conflict Societies: Challenges and the Way Forward Sri Lanka Economics Research Conference 2014
36
extracurricular activities should receive further attention of both
institutes. It is found that provided support to develop enterprise skills
and interpersonal skills are not sufficient in order to fulfil the
requirements of the job market.
.
Keywords: Employability, Knowledge, Interpersonal skills,
Enterprise Skills, Technical Skills
Introduction and Research Problem
Sri Lanka has now become a victim of the forces of globalized
education industry. Up to 12,000 Sri Lankan students go abroad each
year to study (ICEF Monitor 2013), meaning Sri Lanka could be a
significant source of supplying students to universities overseas. In
recent years, Sri Lanka has spent over Rs.80 billion annually for
educational purposes and this is about 12% of Sri Lanka’s trade deficit,
18% of external reserves of the country or 25% of total capital
expenditure of the government in 2009 (Nanayakkara, 2010). This is
not a trend that favours economic development in Sri Lanka because
this expenditure does not justify the benefits of educating students who
went abroad (Nanayakkara, 2010).Therefore the government has
invited the private sector to invest in education, because some 100,000
seek further studies annually through the private sector education
system (Dissanayake, 2014). Private institutes can open colleges as
they are capable of and are more profit oriented. The private education
institutes are behind targets and they offer academic programs
differently. According to the recent advertisement displayed by Esoft
institute (2012) the students can enrol& continue higher education
without having A/L results. Therefore it is questionable whether these
Education in Knowledge Economy
37
private institutes are in line with the expected quality standards of the
country. On the other hand, the higher education sector is in a position
to supply more skilled labour and thereby promote economic growth
(Chandrasiri, 2008), but poorly managed public universities are
registered in the minds of local people for student strikes, agitations,
clashes and blood-shed and frequent closing of faculties and campuses
(Nanayakkara, 2010). Furthermore the educational institutes are
criticized for not accommodating the volume and variety of students’
demand, high unit cost arising from unproductive overheads, inflexible
curricula and teaching methods, and, lack of research output
(Vidanapathirana, 2000). The country's Higher education institutions
are charged to develop human capital through teaching and knowledge
development, building a knowledge base through research,
dissemination and use of knowledge by interacting with the users of
knowledge. Therefore, this study focuses to identify any difference in
employability of graduates in public and private higher education
institutes who offer Management degree programmes.
Methods
This study compares the employability of graduates of Public and
Private Higher Education institutes who offer Management Degree
programmes. Therefore, the graduates of the Faculty of Management
from University of Kelaniya and The Department of Management at
ICBT were selected to conduct this study. An empirical survey was
designed with two sets as to study the views and experiences of
graduates first who are using Facebook and google+ sites by using
‘Snowball sampling’ method and thee questionnaires were distributed
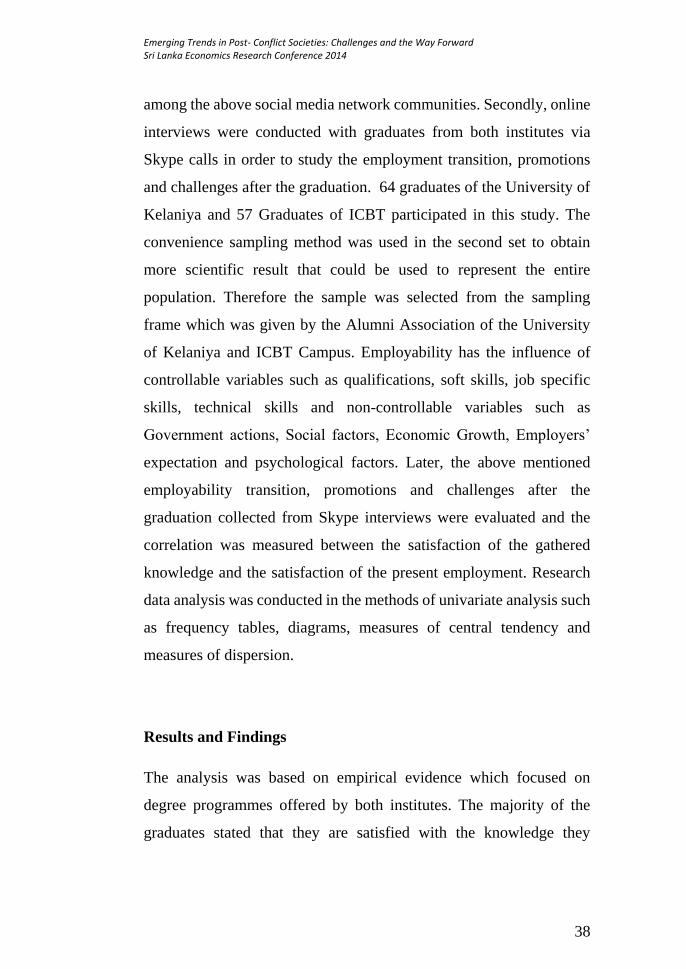
Emerging Trends in Post- Conflict Societies: Challenges and the Way Forward Sri Lanka Economics Research Conference 2014
38
among the above social media network communities. Secondly, online
interviews were conducted with graduates from both institutes via
Skype calls in order to study the employment transition, promotions
and challenges after the graduation. 64 graduates of the University of
Kelaniya and 57 Graduates of ICBT participated in this study. The
convenience sampling method was used in the second set to obtain
more scientific result that could be used to represent the entire
population. Therefore the sample was selected from the sampling
frame which was given by the Alumni Association of the University
of Kelaniya and ICBT Campus. Employability has the influence of
controllable variables such as qualifications, soft skills, job specific
skills, technical skills and non-controllable variables such as
Government actions, Social factors, Economic Growth, Employers’
expectation and psychological factors. Later, the above mentioned
employability transition, promotions and challenges after the
graduation collected from Skype interviews were evaluated and the
correlation was measured between the satisfaction of the gathered
knowledge and the satisfaction of the present employment. Research
data analysis was conducted in the methods of univariate analysis such
as frequency tables, diagrams, measures of central tendency and
measures of dispersion.
Results and Findings
The analysis was based on empirical evidence which focused on
degree programmes offered by both institutes. The majority of the
graduates stated that they are satisfied with the knowledge they

Education in Knowledge Economy
39
acquired from the University of Kelaniya. Dissatisfaction was shown
by graduates from ICBT (Figure 01).
Also 1/5 of graduates of public universities are strongly dissatisfied
and shows that the provided knowledge is insufficient. Most of the
graduates are not satisfied with the practical and job specific skills
provided by the institutes (Table 01). Based on the mean value, over
50% of graduates from both institutes agree that the acquired
knowledge has supported in employment (Table 01).
17 (27%)
21 (33%)
9 (14%)
4 (6%)
13 (20%)
10 (17%)8 (14%)
15 (26%)13 (23%)
11 (19%)
Strongly
Satisfied
Satisfied Neutral Dissatisfied Strongly
Dissatisfied
Figure 01: Satisfaction with the acquired
knowledge
KLN - Mgmt ICBT - Mgmt
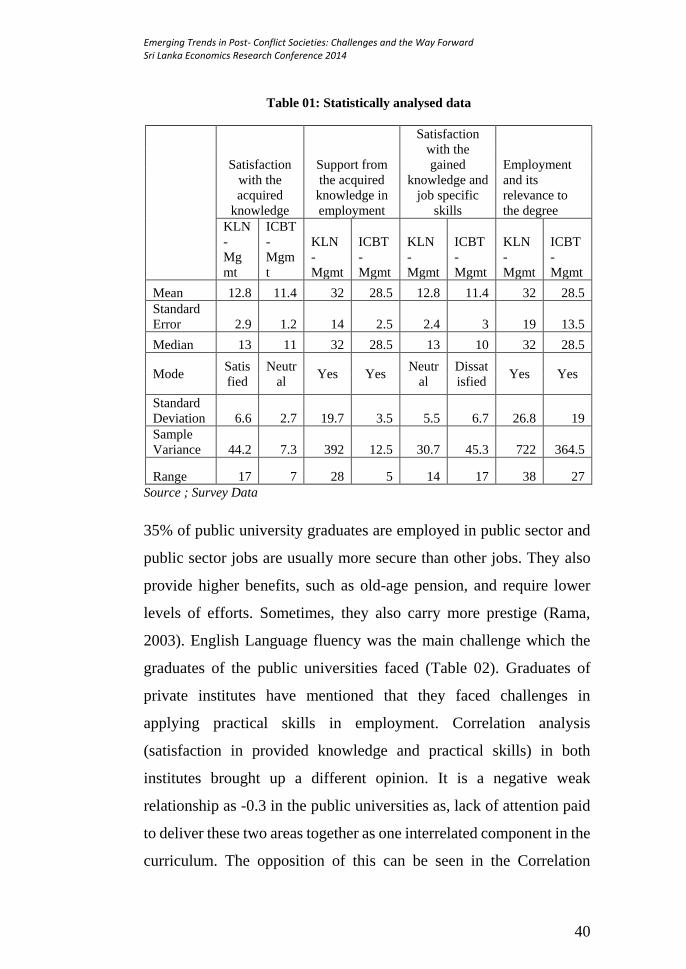
Emerging Trends in Post- Conflict Societies: Challenges and the Way Forward Sri Lanka Economics Research Conference 2014
40
Table 01: Statistically analysed data
Satisfaction
with the
acquired
knowledge
Support from
the acquired
knowledge in
employment
Satisfaction
with the
gained
knowledge and
job specific
skills
Employment
and its
relevance to
the degree
KLN
-
Mg
mt
ICBT
-
Mgm
t
KLN
-
Mgmt
ICBT
-
Mgmt
KLN
-
Mgmt
ICBT
-
Mgmt
KLN
-
Mgmt
ICBT
-
Mgmt
Mean 12.8 11.4 32 28.5 12.8 11.4 32 28.5
Standard
Error 2.9 1.2 14 2.5 2.4 3 19 13.5
Median 13 11 32 28.5 13 10 32 28.5
Mode Satis
fied
Neutr
al Yes Yes
Neutr
al
Dissat
isfied Yes Yes
Standard
Deviation 6.6 2.7 19.7 3.5 5.5 6.7 26.8 19
Sample
Variance 44.2 7.3 392 12.5 30.7 45.3 722 364.5
Range 17 7 28 5 14 17 38 27
Source ; Survey Data
35% of public university graduates are employed in public sector and
public sector jobs are usually more secure than other jobs. They also
provide higher benefits, such as old-age pension, and require lower
levels of efforts. Sometimes, they also carry more prestige (Rama,
2003). English Language fluency was the main challenge which the
graduates of the public universities faced (Table 02). Graduates of
private institutes have mentioned that they faced challenges in
applying practical skills in employment. Correlation analysis
(satisfaction in provided knowledge and practical skills) in both
institutes brought up a different opinion. It is a negative weak
relationship as -0.3 in the public universities as, lack of attention paid
to deliver these two areas together as one interrelated component in the
curriculum. The opposition of this can be seen in the Correlation
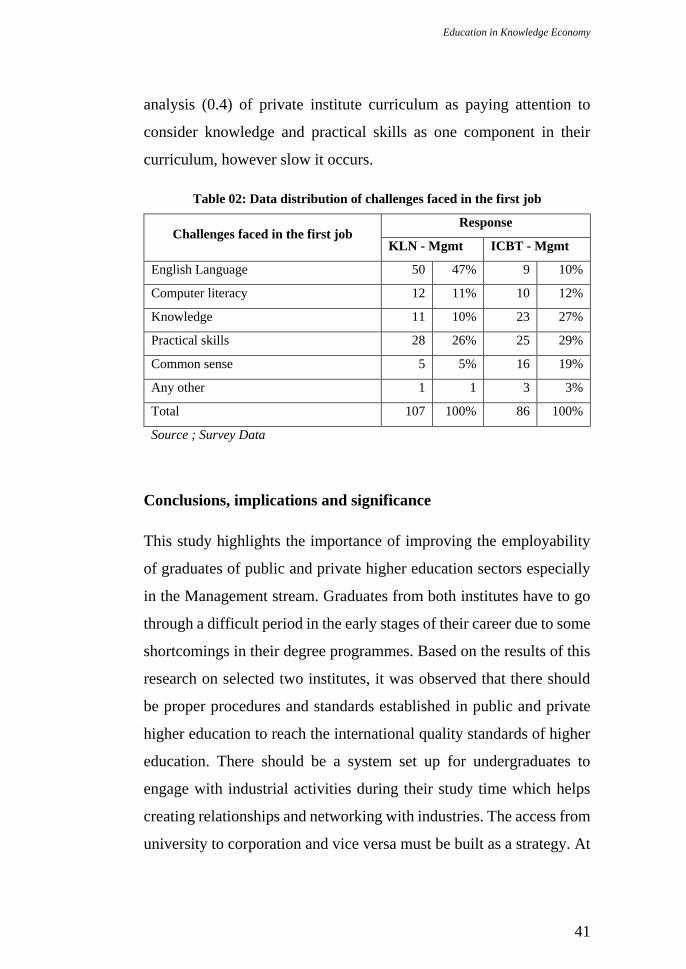
Education in Knowledge Economy
41
analysis (0.4) of private institute curriculum as paying attention to
consider knowledge and practical skills as one component in their
curriculum, however slow it occurs.
Table 02: Data distribution of challenges faced in the first job
Challenges faced in the first job Response
KLN - Mgmt ICBT - Mgmt
English Language 50 47% 9 10%
Computer literacy 12 11% 10 12%
Knowledge 11 10% 23 27%
Practical skills 28 26% 25 29%
Common sense 5 5% 16 19%
Any other 1 1 3 3%
Total 107 100% 86 100%
Source ; Survey Data
Conclusions, implications and significance
This study highlights the importance of improving the employability
of graduates of public and private higher education sectors especially
in the Management stream. Graduates from both institutes have to go
through a difficult period in the early stages of their career due to some
shortcomings in their degree programmes. Based on the results of this
research on selected two institutes, it was observed that there should
be proper procedures and standards established in public and private
higher education to reach the international quality standards of higher
education. There should be a system set up for undergraduates to
engage with industrial activities during their study time which helps
creating relationships and networking with industries. The access from
university to corporation and vice versa must be built as a strategy. At

Emerging Trends in Post- Conflict Societies: Challenges and the Way Forward Sri Lanka Economics Research Conference 2014
42
the same time public- private higher education institution collaboration
must be established in order to ensure the development of graduates
who have equal employable skills and abilities. It is required to
monitor and evaluate students’ progress continually and therefore a
suitable mechanism should be implemented with the involvement of
external parties such as industries and foreign university
representatives. The results have a significant influence on the higher
education sector of Sri Lanka as it helps both sectors to understand
how they need to develop and upgrade themselves in order to produce
employable graduates.
References
1. Chandrasiri, S. (2008) The Labour Market Experience of
University Graduates in Sri Lanka. Higher Education Policy, pp.
405-423.
2. Dissanayake, S, B. (2014)Equally important to promote private
sector education - SB 100,000 SL students going in for higher
education annually through private institutions. Lanka News
Papers .com. Accessed 14 November 2014,
http://www.lankanewspapers.com/news/2014/10/90342.html
3. Esoft (2012) Advertisement for IT degree programme
[advertisement on EAP Cinema: Savoy]. Viewed 20 July 2012.
4. Nanayakkara, G 2010. Reforming higher education for economic
development. Snday Observer Online. Accessed 14 November
2014, http://www.sundayobserver.lk/2010/11/07/fea02.asp
5. Rama, M. (2003) The Sri Lankan Unemployment Problem
Revisited; Review of Development Economics. Development
Research Group, (Washington: The World Bank), 1(7), pp. 510-
525.
6. Vidanapathirana, U. (2000) Employability and expectations of
university students: A cross faculty comparison of the attributes of
university students. Sri Lanka Association for the advancement of
Science (SLAAS), in: Proceeding of the 56th Annual Session,
Colombo, Sri Lanka, pp. 281.

Education in Knowledge Economy
43
[S2/02] Cost Competitiveness of Sri Lanka’s State
University System in Higher Education Service Delivery
T. Lalithasiri Gunaruwan1, Thilini Samarasekara2, A. P.
Erandathie Gamage3
1Senior Lecturer, Department of Economics, University of Colombo 2Assistant Lecturer, Department of Economics, University of Colombo 3Undergraduate, Department of Economics, University of Colombo
_______________________________________________________
Abstract
Though the free education in Sri Lanka has had many achievements,
the bureaucratic governance and the budgetary constraints have
limited the further development of the State-run national university
system to cater to the growing demand. This has forced candidate
students to look for alternatives offered by local and foreign private
universities. There is also a perception that the present State university
structure is cost-ineffective and thus is a burden on national coffers.
This question of cost-competitiveness of the Sri Lankan higher
education sector was subject to examination in the present study. The
results indicated that the State university system is significantly cost
effective in producing graduates of internationally acceptable quality.
An in-depth analysis on the discipline of Medical Sciences confirmed
that the Sri Lankan State university system is significantly capable of
competing cost-wise with the international universities in producing
medical graduates. Letting the State university system suffocate within
the bureaucratic governance and budgetary constraints is thereby
proven unwarranted as the system appears capable not only of cost-
effectively meeting the local demand for higher education, but also of
being internationally marketable, potentially becoming a true
knowledge-hub paving the way to earn foreign exchange to the
national economy.
Key words: State Universities, Cost Effectiveness, Foreign Exchange
Effect, International Competitiveness, Higher Education
Voucher Scheme
Emerging Trends in Post- Conflict Societies: Challenges and the Way Forward Sri Lanka Economics Research Conference 2014
44
Introduction
Compared to other countries in the region, Sri Lanka has a history of
over 70 years of free education, which has resulted in many
achievements on human development. However, the bureaucratic
governance and budgetary constraints have set obstacles to the further
development of the State-run national university system to cater to the
expanding demand. This has, since of late, compelled candidate
students to look for alternatives offered by local private universities
and also by foreign universities leading to an outward drainage of hard-
earned foreign exchange [1]. Also, there is a perception that the
present State university structure is cost-ineffective, and thus, is a
burden on national coffers. If so, the relative stagnation of the State
sector in higher education, the expansion of the private sector’s
presence, and also the increase in out-bound migration for education
purposes could be an unavoidable consequence [2]. However, if the
reality is different, the relatively shrinking trend of the State university
system would neither be justifiable, nor healthy. This question of cost-
competitiveness of the Sri Lankan higher education sector was subject
to examination in the present study in order to understand its
comparative strengths, such as the potential for internationalization of
the State university system [6], and the weaknesses, and to evolve
possible policy interventions in view of developing the sector further.
Materials and Methods
The total costs per student per year pertaining to each academic stream
in 2011 were estimated using the data published by the University
Education in Knowledge Economy
45
Grant Commission [5] on stream-based recurrent costs for the year
2011 and university-based investments over several past years.1 Cost
outliers were statistically identified and those lying outside the
acceptable limits (at 95% confidence level) were removed2 before such
estimation of stream-wise national averages. With regard to local and
foreign private universities, tuition fees for similar degree programs
were obtained by consulting their prospectus and also through direct
inquiry, as their cost data were not published. Graphical
representations, outlier investigation and statistical comparison of
means were adopted in the analysis.
Analysis and Results
The Table 1 summarizes the university-wise capital and recurrent cost
estimates for the six main academic streams, namely Medicine,
Engineering, Science, Agriculture, Management, and Arts/Law, and
the stream-wise average total cost estimates are depicted in the Box-
Plots in the Figure 1.
1University-wise capital costs were estimated by working out capital stocks as at
2011, and applying a capital depreciation rate of 5% per annum, making capital
injections prior to 1991, fully depreciated by 2011, not reflect in the capital stock.
Series of assumed and estimated investments were brought into 2011 prices using
investment deflator computed using macroeconomic data published by the Central
Bank of Sri Lanka.
2Outliers removed concerned the Uva-Wellassa University (in Management), and the
Jaffna University (in Science); the former seems a direct result of high capital
intensity and low student enrolment revels, possibly owing to that being a relatively
new university, while the latter seems caused by the extremely high recurrent cost
intensity in 2011, the root cause needs investigation.
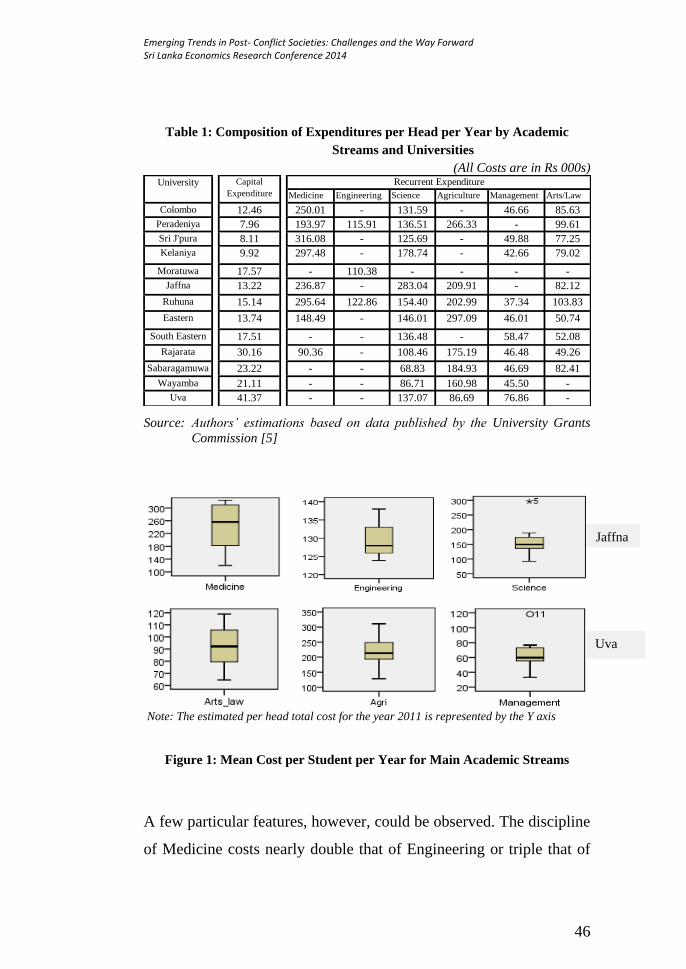
Emerging Trends in Post- Conflict Societies: Challenges and the Way Forward Sri Lanka Economics Research Conference 2014
46
Table 1: Composition of Expenditures per Head per Year by Academic
Streams and Universities
(All Costs are in Rs 000s)
Source: Authors’ estimations based on data published by the University Grants
Commission [5]
Note: The estimated per head total cost for the year 2011 is represented by the Y axis
Figure 1: Mean Cost per Student per Year for Main Academic Streams
A few particular features, however, could be observed. The discipline
of Medicine costs nearly double that of Engineering or triple that of
Medicine Engineering Science Agriculture Management Arts/Law
Colombo 12.46 250.01 - 131.59 - 46.66 85.63
Peradeniya 7.96 193.97 115.91 136.51 266.33 - 99.61
Sri J'pura 8.11 316.08 - 125.69 - 49.88 77.25
Kelaniya 9.92 297.48 - 178.74 - 42.66 79.02
Moratuwa 17.57 - 110.38 - - - -
Jaffna 13.22 236.87 - 283.04 209.91 - 82.12
Ruhuna 15.14 295.64 122.86 154.40 202.99 37.34 103.83
Eastern 13.74 148.49 - 146.01 297.09 46.01 50.74
South Eastern 17.51 - - 136.48 - 58.47 52.08
Rajarata 30.16 90.36 - 108.46 175.19 46.48 49.26
Sabaragamuwa 23.22 - - 68.83 184.93 46.69 82.41
Wayamba 21.11 - - 86.71 160.98 45.50 -
Uva 41.37 - - 137.07 86.69 76.86 -
Capital
Expenditure
University Recurrent Expenditure
Jaffna
Uva

Education in Knowledge Economy
47
Social Sciences or Law. Rajarata and Eastern Universities managing
with recurrent costs of less than 50% pertaining to the more established
Universities prompt the need to examine the causes to exclude
compromising quality. Agriculture appears a close contender to
Medicine in terms of recurrent costs. It is even costlier than Medicine
at Eastern, Rajarata and Peradeniya Universities. Agriculture imposes
relatively lesser recurrent costs at Uva, Wayamba, Sabaragamuwa and
Rajarata universities. Wayamba and Sabaragamuwa universities in
Science, and Eastern, South-Eastern and Rajarata Universities in Arts,
appear operating at much lesser recurrent costs than their respective
counterparts in other Universities. Jaffna University records an
exceptionally high recurrent cost per student in Science; to the extent
that it is almost double that of the Science streams in other universities,
more than what is incurred on their own Medical students, and nearly
two and a half times that of an average Engineering undergraduate.
The most note-worthy possibility is the clear recurrent cost
effectiveness of Management and Engineering Faculties in comparison
to Arts/Law and Science, respectively, when the inverse is what would
generally be anticipated. The capital cost structure indicates higher
capital intensities in all four relatively new institutions : Uva-Wellassa
University, for example, has nearly five times the capital cost per
student per year compared to Sri Jayawardenapura University, while
the Rajarata University is having nearly four-fold than of Peradeniya
University, which could be a combined effect of the heavy capital
injections needed in the early years of these young universities, and the
relatively lesser number of students registered. The reasons for such
characteristic differences, however, merit examination in a detailed
research.

Emerging Trends in Post- Conflict Societies: Challenges and the Way Forward Sri Lanka Economics Research Conference 2014
48
International Competitiveness
The estimated average costs pertaining to the Sri Lankan State
universities were compared against the charges levied by a selected
group of competing local and international universities offering similar
academic streams, as summarized in the Table 2.
Table2: Average Cost per Student per Year by Academic Stream–2011
Note:N/A – Non availability of the particular stream; # - No information
The results indicate that the costs (including capital costs) incurred by
the Sri Lanka’s State university system in producing a graduate of
quality are significantly less than the fees charged by the competitors,
except in the Arts stream.
University Medicine Engineering IT Science Management Arts/Law Agriculture
Colombo 262,471 N/A 75,735 144,054 59,119 98,089 N/A
Peradeniya 201,936 123,876 N/A 144,473 N/A 107,576 274,290
J’pura 324,197 N/A N/A 133,800 57,991 85,360 N/A
Kalaniya 307,401 N/A N/A 188,656 52,81 88,938 N/A
Moratuwa N/A 127,954 N/A N/A 33,409 N/A N/A
Jaffna 250,089 N/A N/A 296,263 N/A 95.339 223,130
Ruhuna 310,775 137,999 N/A 169,535 52,476 118,966 218,123
Eastern 162,230 N/A N/A 159,749 59,744 64,479 310,822
South Eastern N/A N/A N/A 153,992 75,976 69,592 N/A
Rajarata 120,526 N/A N/A 138,627 76,641 79,419 205,357
Sabaragamuwa N/A N/A N/A 92,049 69,914 105,629 208,153
Wayabma N/A N/A N/A 107,827 66,618 N/A 182,092
Uva Wellassa N/A N/A N/A 178,439 118,226 N/A 128,063
Average (Sri Lankan
State Universities)256,000 128,000 75,735 149,000 59,500 92,100 212,000
Local Private Inst # # 240,667 207,500 207,944 # #
Foreign Affiliated (L) # # 348,750 246,806 282,000 83,333 #
Foreign Affiliated (H) 1,333,000 # 424,167 422,917 475,833 456,807 #
Foreign (L) 545,350 682,500 325,000 # # 154,000 #
Foreign (H) 15,376,725 1,980,000 1,500,000 # # # #
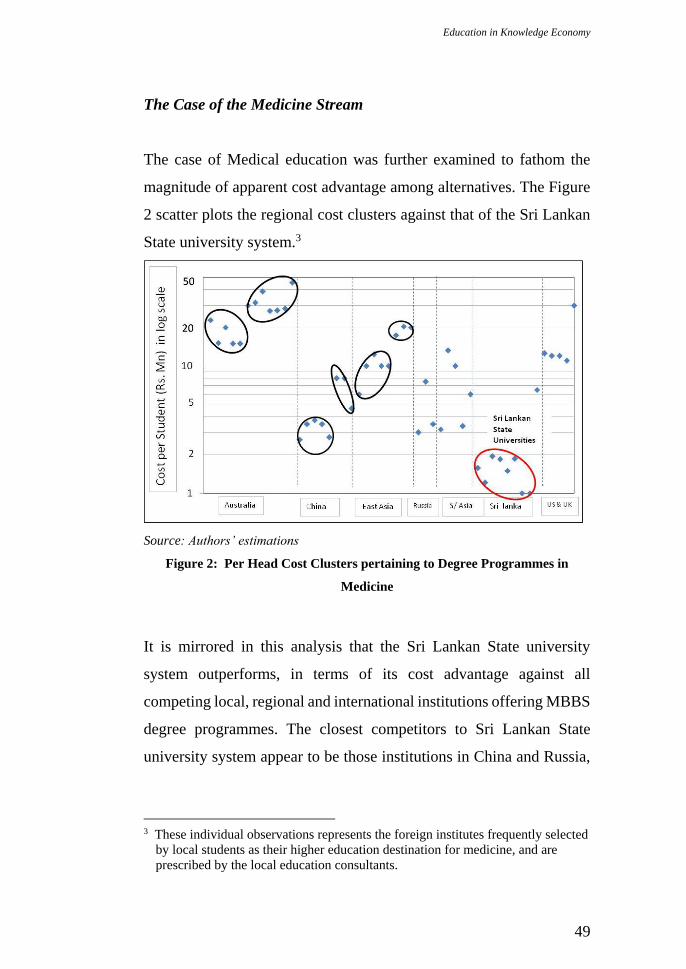
Education in Knowledge Economy
49
The Case of the Medicine Stream
The case of Medical education was further examined to fathom the
magnitude of apparent cost advantage among alternatives. The Figure
2 scatter plots the regional cost clusters against that of the Sri Lankan
State university system.3
Source: Authors’ estimations
Figure 2: Per Head Cost Clusters pertaining to Degree Programmes in
Medicine
It is mirrored in this analysis that the Sri Lankan State university
system outperforms, in terms of its cost advantage against all
competing local, regional and international institutions offering MBBS
degree programmes. The closest competitors to Sri Lankan State
university system appear to be those institutions in China and Russia,
3 These individual observations represents the foreign institutes frequently selected
by local students as their higher education destination for medicine, and are
prescribed by the local education consultants.

Emerging Trends in Post- Conflict Societies: Challenges and the Way Forward Sri Lanka Economics Research Conference 2014
50
which also are positioned significantly above the cost levels of the Sri
Lankan State university system.
The magnitude of this cost advantage is reflected in the statistical
analysis of programme costs and the significance of their differences,
as summarized in the Table 3. Accordingly, Sri Lanka could
strategically exploit this comparative advantage, not only to arrest the
current exodus of foreign exchange spent abroad to study medicine,
but also to earn foreign exchange by attracting foreign students to
study Medicine in the Sri Lankan State university system.
Table 3:
Comparison of Average Regional Costs per Degree Programmes in Medicine
Notes: Δ Ave Cost = Average Cost Difference as against the Cost of Sri Lankan
State University System
The t-values indicate the significance of the differences of costs (*** at 1%,
and ** at 5%).
Average cost for
the degree
programme
Minimum
Cost
(Rs.Mn)
Sri Lanka 1.53 0.3 - - - -
Australia - Low 17.7 3.7 16.1 9.618*** 15 80%
Australia-High 30.5 4.2 28.8 16.63*** 27.3 1684%
China - Low 3.2 0.5 1.6 6.46*** 2.64 73%
China - High 6.9 2 5.3 4.76** 4.62 202%
Russia 4.6 2.4 3 2.24** 3 96%
South Asia 8.7 5.1 7.1 2.14** 3.17 107%
East Asia - Low 10.6 1.2 9 15.29*** 6 292%
Eeast Asia -High 19.4 1.6 17.8 18.65*** 17.5 1044%
UK-USA 19.4 9.4 17.8 5.01*** 11.03 621%
Region/ Country Sdt Deviation Δ Average
Cost
Calculated
t- value
Excess compared
to SL average as a
Percentage

Education in Knowledge Economy
51
The cost differences appear holding significant even after a substantial
profit margin is charged on the total costs, possibly owing to the
excessive profit margins earned by the competitors. In that light, the
high costs in foreign exchange incurred by the national economy to
educate its citizens abroad amounts to an unnecessary erosion of
saveable resources. For instance, Rs 1.6Bn per year of foreign
exchange would be saved during the next6 years if the country could
provide facilities to produce 1500 more doctors per year enabling the
achievement, by 2020, of the current doctor:population ratio of
Singapore of 18:10000, as against the lowest possible cost incurred for
studying in China.
The results also indicate that the Sri Lanka’s State education system
offers a significant foreign exchange earning potential. Internationally
marketing the MBBS degree programme at Rs 2 Mn with a mark-up
of nearly 33%, for instance, could earn approximately Rs 2000 Mn per
year of foreign exchange for a batch of 1000 students, while still being
nearly 37% more cost attractive than the minimum cost competitor in
South Asia or 24% less costly than that of the lowest cost Chinese
competitor.
Conclusions
The study brought evidence to conclude that the commonly held belief
of Sri Lankan State university system being cost-wise inefficient is far
from reality. In fact, in many a discipline, the Sri Lankan system
appears cost-wise highly competitive. This illegitimatizes the currently
observed trend of inadequate expansion of the system and the resultant
constraints to increase the intake to Sri Lankan State universities in

Emerging Trends in Post- Conflict Societies: Challenges and the Way Forward Sri Lanka Economics Research Conference 2014
52
such competitive disciplines as Medicine, Engineering or Management
which push the local students to migrate for education at much higher
foreign exchange costs and also at the risk of brain drain.
There is no need to “protect” the State higher education system as it
appears internationally cost competitive, and the system could be
allowed to grow in the emerging global education market [3].
However, this calls for granting it the necessary autonomy and
independence. If the “free-education” right of the Sri Lankan students,
who get selected to the national universities based on their z-scores at
GCE Advanced Level examination, could be ensured by administering
a “higher education voucher scheme”, the system is likely to grow in
the market competition with no additional burden on the public coffers.
The national universities so liberated will then be able to compete
effectively based on the quality of education service delivery and earn
incomes through paid seats offered to those who do not qualify to
benefit from the free education voucher scheme.
This could possibly be the key towards sustainably developing Sri
Lanka as a knowledge hub [4] through gaining international popularity
while preserving the spirit of “free-education” by providing equal
opportunity and affordability in higher education in the long run.
In the meantime, the relatively high cost intensities identified through
the study, particularly in the disciplines of Arts and Science (compared
to Management and Engineering), need to be further examined, and
treated with appropriate policies and strategic interventions.

Education in Knowledge Economy
53
References
1. Abeyratne S, Lekamge U. "Policy Reforms in Higher Education:
Transforming Sri Lanka into an Education Hub", Proceedings of
the Workshop on Higher Education- 2012 (pp. 43-53). Colombo:
University Grants Commission, Ministry of Higher Education,
2012.
2. Chandrasiri, S. Financing of university education in Sri Lanka.
Higher Education, (pp 91-106), 2003.
3. Duncan, A. Improving Human Capital in a Competitive World—
Education Reform in the United States, 2011, (Retrieved 11 07,
2013, from World Bank: http://go.worldbank.org/EHNFQ7GB30)
4. National Higer Education Stratergic Management plan of Sri
Lanka- 2012-2015 Mid Term Paln. Colombo: Ministry of Higher
Education, 2012.
5. Sri Lanka University Statistics. Colombo: University Grants
Commission (various issues).
6. Stanly W. Samarasinghe, D.S Marshall. "Internationalising Sri
Lanka's Universities: A Review of Fiscal and Governance
Issues", Proceedings of the Workshop on Higher Education- 2012
(pp. 55-72) Colombo: University Grants Commission, Ministry of
Higher Education.

Emerging Trends in Post- Conflict Societies: Challenges and the Way Forward Sri Lanka Economics Research Conference 2014
54

Education in Knowledge Economy
55
[S2/03] Women Entrepreneurial “failures”: underlying
characteristics and possible causes- An exploratory
case-based survey
Weerawansa S, Aponsu
Department of Economics, University of Colombo, Sri Lanka
______________________________________________________
Abstract
This paper discusses the challenges of being a woman entrepreneur,
and more specifically the issue of why women have a relatively low
success rate or high failure rate as business entrepreneurs, and
possible common factors that underlie such a situation. Due to the fact
that there is almost no research on this area in Sri Lanka, any attempts
to tread into this sphere of study lacks a basic anchor and research
parameters. This research study, which is deemed an exploratory
survey, was inspired and directed by a widely assumed view that,
despite a growing and emerging trend of women entrepreneurs notably
in the SME sector, business success rate by women entrepreneurs lags
behind their male counterparts by a considerable margin. While a
growing number of professionally qualified women have reached the
top most positions of large businesses, the greatest concentration of
women entrepreneurs are found in the SME/cottage category. A
considerable proportion of women entrepreneurs have their business
origins uniquely associated with their gender positions in the society
and they are also faced to a considerable degree with gender-bias
challenges. Evidently, women have started businesses of their own
under circumstances and factors that are commonly identifiable with
the gender: such as passion associated with their innate skills, change
of circumstances or prevailing economic conditions around the
household that force upon them to undertake business responsibility
and undertaking self-employment in a business that gradually has
grown into enterprise scale. It is also evident that the struggle and the
challenges women entrepreneurs face in business growth, or in the
least, their struggle to remain afloat in business appear to be complex
than any average business challenges faced by their male

Emerging Trends in Post- Conflict Societies: Challenges and the Way Forward Sri Lanka Economics Research Conference 2014
56
counterparts. It is hoped that this piece of research will generate
further interest, and in the medium term, a critical set of policy
interventions that will create a paradigm shift that enables, inspires
and sustains women entrepreneurship as a vital input of development.
Key words: Women Entrepreneurs, Failed business enterprises,
Work-life balance, Gender-specific business challenges
Introduction: Women and business
Women owned businesses in South Asia are showing major strides
following an exponential growth of professional careers and the
opportunities created for women (Tambunan, 2009). Growth of new
sectors and product innovations and hence the economic opportunities
have created a huge attraction to women towards the business world
overshadowing the chores that are traditionally associated with them.
The expanding globalization and which resulted in bringing about
opportunities pertaining to product value chain management have
enabled non-traditional forms of business models which thereby create
an enabling environment to attract women into businesses
significantly. For instance, the growth in the apparel industry where
women display a greater synergy of skills is a case in point. In Sri
Lanka, women are playing an emerging role in education and in a range
of professional fields which shows a growing trend of women
entrepreneurship especially in the SME sector. Many women,
encouraged by easy financial opportunities which are being offered by
an array of banks and rural-based informal financial institutions, are
taking the imitative to start up business of their own. It is quite
conceivable that this trend will only grow and diversify in the times
ahead. In the West, women are increasingly turning to
Education in Knowledge Economy
57
entrepreneurship as a way of coping with the ‘glass ceiling’ that seems
to prevent them from reaching top managerial positions in
organizations. Those fighting for equity in wages, rewards and perks,
and for those who seek life-business balance, find entrepreneurship as
a vent for stress with greater self-satisfaction, professional flexibility
and space to success (Moonasinghe, 2000).
It is believed that women run businesses face far more challenges than
their male counterparts and face greater risks of failures. The statistics
on business failures general, especially those of SMEs, are difficult to
obtain while any data and information on women entrepreneurs and
their business failures are extremely few and far between. Yet, it’s a
widely held view that women entrepreneurs in the SMEs record higher
rate of failures, or in the least, women headed business predominantly
remain stagnant or do not grow into bigger businesses. While this
notion may be subjective when taken as a general principle, our
preliminary survey indicated that high rate of failure in women run
businesses is in fact a conceivable notion. Contemporary women
entrepreneurship is directly and indirectly induced by an ongoing
paradigm shift on the emerging role of women and their importance in
development. For instance, the emphasis placed upon the women in
achieving Millennium Development Goals when the challenges faced
by them in business success clearly are a matter of growing
significance.
Emerging Trends in Post- Conflict Societies: Challenges and the Way Forward Sri Lanka Economics Research Conference 2014
58
Research Problem
Why do women entrepreneurial failures are so widespread, especially
in comparison to their male counterparts, despite the fact that women
have made great strides in, for instance, global recognition as
development catalysts, education, opportunities for professional skills
and higher aptitudes, and are regarded and renowned as better
managers of economic resources in the household? Moreover, what
specific internal attributes and characteristics could be distilled from
the findings to develop a common all inclusive model of women
entrepreneurship? Could there be nature of business/firm -specific
characteristics, and how widespread are they across the segment of
women entrepreneurial failures?
Research Objectives: This research aims to identify the qualitative
innate parameters that may be fundamentally associated with women
entrepreneurial success. Also, the research aims to ascertain any
sector/industry /firm-specific characteristics that may influence the
outcomes of women entrepreneurial success.
Research rationale: Data on research or information on business
failures are rarely documented and are not easily accessible in the
public domain, and no repository of data on such failed enterprises
exists and this in an Asian context is even more evident. Information
or structured information or research on women entrepreneurial
failures is almost unheard of. Whereas there is a growing trend in
women entrepreneurship it’s unmistakably true that their role in
Education in Knowledge Economy
59
development is indispensable and this aspect is well articulated and
recognized in the MDGs. Thus, a sound understanding of commonly
observed failures women entrepreneurship is a dire need.
Methodology
Gathering information was carried out using the case study method
where triangulation method of data collection and information
extraction, namely face-to-face interviews, structured questionnaire,
and physical observation of body language were used as the primary
tiers of information. Moreover, each situation was handled with an
open mind in a very informal setting. The depth, quality and the scope
of data gathered varied significantly from case to case. 15 individuals
who consented to be interviewed and provide the required information
were the sample. However, based on the quality of the information,
data from only 9 cases were used in the final analysis.
Limitations: Given the highly sensitive and unstructured and very
informal nature of the data and information on business failures, and
in this case that of women entrepreneurial failures, it is expected that
the data will invariably have a situational and circumstantial bias.
Moreover, lack of any data repository of business failures and almost
no previous research as a guide, the conclusions inevitably tend to be
absolute without any base line material to compare them with.
Emerging Trends in Post- Conflict Societies: Challenges and the Way Forward Sri Lanka Economics Research Conference 2014
60
Literature survey: From the basis of the study, both data collection
and analysis assumes a straight forward yet adapted definition of
successful entrepreneurship as one that remains a growing concern and
creates value in both tangible and intangible variables in terms of
profits and goodwill for the benefit of primarily its owners and
secondly other stakeholders. Stated differently, it can be stated that
the former is a necessary condition while the latter is a sufficient
condition. Business failure takes place when the business fails to
realize the above basic outcomes, and also sustain a growth of the
business. In a broader definition of successful enterprises which
captures specific characteristics of women entrepreneurs, attributes
such as being in control of one’s life and economic activities that
potentially add value to resources for self-fulfilment and growth seem
appropriate. This piece of study adopts the latter definition in the
discussion and investigation in order to capture characteristics seen in
failed women entrepreneurs, and possible attributes critical for their
success. It needs to be borne in mind that each case had individuality
and unique characteristics that are subjective at micro level.
Literature from Asian countries covers a multitude of critical aspects
of women entrepreneurship. For instance, Seymour (2001), Sinha
(2003) and also Das(2000) identify three types of women
entrepreneurial sources, and they are: chance- the types of business
originates from hobbies, personal passions, part-time engagements that
develops into enterprises; forced- where they are forced into business
due to change of circumstances primarily in the household and most
common being incapacitation or demise of the husband, or commonly
due to domestic economic pressures; and created– where exposure,

Education in Knowledge Economy
61
training skills development inspires to start a business and later it was
developed into an enterprise. In our case study, we found that the
business origins of women entrepreneurs primarily emanate from the
factors as follows: forced – 2 cases; chance- 10 cases and created – 3
cases, and in the last 2 categories, more than one factor have been
predominantly relevant. Not surprisingly, those forced lacked any
basic entrepreneurial inputs for long-term business sustenance.
Research findings and conclusions
The sample survey had the following characteristics:
Garments: Fashion dresses, uniforms for school and industry ware
Handicrafts: Fancy stationary, graphic printing gift items; hand
crafted jewellery
Services: Launderette, graphic designing, accounting
Sector
No of
Garments-
non export
type
Handicrafts Services Ongoing status Driver
factors
5 -10 1 2 1 Stagnant for last 5 years Predominantly
chance
10-20
2 2 4
3 closed down; 2 are faced
with imminent closure; rest
performance below industry
averages
Mix of chance
and created
20-50
3
2 closed down after existence
of 3-5 years in business; 1 in
business but stagnant
Mainly forced
It was evident across the entire sample space that, within the domain
of business entrepreneurship which exists in a highly competitive and
complex world of male-dominated enterprises, women are placed at a

Emerging Trends in Post- Conflict Societies: Challenges and the Way Forward Sri Lanka Economics Research Conference 2014
62
disadvantageous position due to societal norms and mainstream
business practices. The samples investigated led to the conclusion that,
a widespread gender bias in the business success perpetuated by the
prevalent mainstream business culture, where going beyond the rules
and norms in order to secure competitive advantage and the existence
of “killing competition” by any means attitude, is just more than a
common daily business practice. This is something women
entrepreneurs face as extraordinary challenges in a male dominated
business environment. A possible strong corollary of this finding is
that lack of clear cut property rights and social protection. The nature
of business practices seen in this part of the world compounded by the
social esteem women perceive compel women to take extraordinary
measures to minimize business and all other forms of risks and this in
turn yields them to face extra costs thus becoming less competitive viz-
a viz their male counterparts.
Also woman entrepreneurs who have been pushed into responsibility
following sudden change of circumstances in the household, or the
economic pressures. This abrupt extraneous factors deprive women of
not only the much vital learning curve exposure but also the
opportunities to conquer it soon enough. Connected to this outcome is
yet another fact of life where the self-esteem commonly held by women
and that they are subject to stronger public opinion leaves them with
lesser leeway to learn from mistakes in an increasingly murky business
climate. Women entrepreneurs are inherently caught up with a family-
business dichotomy which places them with limitations of becoming a
self-interest driven, business like individuals who dare to take
business-focused decisions. Also evident from the findings is that there
are cases where passion-driven over enthusiasm taking precedent over
many basic parameters of successful business management practices.
Overall, a shift from being a house-hold manger to a business manager
appears to take time which a competitive business environment does
not offer easily. Finally, this piece of research hopefully will create an
awareness of women entrepreneurial fatalities, and encourage research
and policy intervention to turn this situation around to create women,
business and development synergies as a national objective.

Education in Knowledge Economy
63
On the positive side, those who have success in business are the ones
who display capacity to adapt fast, knack for leadership, out-of-the-
box thinkers, and those who could successfully segregate multitude of
responsibilities that emanates from a right combination of life-business
balance. Also, evident are the extreme cases where the women
entrepreneurs who display no-nonsense and matter of fact attitude
often command over their male counter-parts.
While the data and information gathering inherently has been
extremely complex, the above findings provide vital leads to
comprehensive research in the future, and perhaps more importantly
generate research interest. In a very dynamic business environment,
which over the recent past has characterized rapid strides of technology
adaptation, while at the same time a parallel social remake up where
women undertake complex responsibilities beyond household chores,
women entrepreneurship and their success is a virtual fact of the
business environment.
References
1. Characteristics of an Entrepreneur. (Online). Available:
http://businesscasestudies.co.uk/iet/entrepreneurship-in-
engineering/characteristics-of-an-
entrepreneur.html#axzz2feMaKtGj (retrieved on17/09/2013).
2. Cope, J. (2010). Entrepreneurial Learning from Failure: An
Interpretative phenomenological analysis. The Hunter Center for
Entrepreneurship, University of Strathclyde, United Kingdom.
3. Johnson, R. 5 Different Types of Leadership. (Online).
Available: http://smallbusiness.chron.com/5-different-types-
leadership-styles-17584.html (retrieved on 23/09/2013).
Emerging Trends in Post- Conflict Societies: Challenges and the Way Forward Sri Lanka Economics Research Conference 2014
64
4. Lauren, A. (2011). Characteristics of Women Entrepreneurs:
[Online], Available:
http://www.highachievingwomen.biz/women-entrepreneur-
challenges/5-5-characteristics-of-women-entrepreneurs-in-
business/[retrieved on 19th September 2013].
5. Longenecker, J. G., Moore, C. W. & Petty, J. W. (2003). Small
Business Management: An Entrepreneurial Emphasis. 12th ed.
Thomson- South Western.
6. Moonasinghe, B. (2000) ‘Enterprise Development and
Leadership: Sri Lankan Experience.’ Lanka Business Report, (4th
April 2000), p. 26.
7. OECD Conference (2004). Promoting Entrepreneurial and
Innovative SMEs in a Global Economy: Women Entrepreneurs
Issues & Policies. Vol. 2, June, pp. 25.
8. Schutte, S. (2013). Six Entrepreneurs who failed spectacularly
before Succeeding. (Online). Available:
http://realbusiness.co.uk/article/17736-six-entrepreneurs-who-
failed-spectacularly-before-succeeding (retrieved on 23/09/2013).
9. Tambunan T (2009)Journal of Development and Agricultural
Economics Vol. 1(2), pp. 027-040,Available online at
http://www.academicjournals.org/JDAE © 2009 Academic
Journals
Education in Knowledge Economy
65
[S2/04] Credibility of the Z Score in Predicting the
Choices of Students in Selecting Degree Offering
Institutes in Sri Lanka
Romita Devi De Silvaa, WasanthaPremarathneb
aDept. of Management and Finance, General Sir John Kotelawala Defence
University, Ratmalana, Sri Lanka
bDept. of Management and Finance, General Sir John Kotelawala Defence
University, Ratmalana, Sri Lanka
_______________________________________________________
Keywords: Higher Education in Sri Lanka, Z score, Multinomial
Logistic Regression
Introduction and research problem
University education is a critical component of human development in
developing countries. It provides high-level skills necessary for the
labour market and the training that is essential for professionals.
Although there are well established national universities in Sri Lanka,
students need high Z-scores to get into these national universities. The
University Grants Commission of Sri Lanka changed the method of
determining the cut-off scores for university admissions from raw
scores to standardized z-scores in 2001.The Z - Score depends on the
mean and the standard deviation of raw marks. The number of subjects
Emerging Trends in Post- Conflict Societies: Challenges and the Way Forward Sri Lanka Economics Research Conference 2014
66
was also reduced to three from four in the year 2000.It is not surprising
that the education system in Sri Lanka is very competitive with only a
few national universities in the country. A significant number of A/L
students who qualify for university education fail to secure a place in
the national universities of the country. Therefore, a majority of the
qualified students seek university level education from other degree
offering institutions. It is obvious that the Z-score is a good indicator
to predict the choice of students in selecting national universities in Sri
Lanka. However, in a scenario where other degree offering institutions
in the country do not pay much attention to the Z score of the students
in their enrolments, the student have a choice to select any institute for
his/her study irrespective of his/her Z score value. Therefore, the
objective of this study is to explore the credibility of the Z score in
predicting the choices of students in selecting degree offering
institutions in Sri Lanka.
Methodology
The sample consists of 112 students who are currently reading for
Logistics Management degrees from CINEC, KDU and NSBM.
Random sampling method and a questionnaire survey were used to
gather data. Quantitative as well as qualitative data were utilized in this
research. Out of 112 students selected for the study, 37.5 percent are
from KDU, 20.5 percent from NSBM and 42 percent from CINEC.
The sample includes 43 (38.4%) females and 69 (61.6%) males.
Boxplots were used to detect outliers. The following Multinomial
Logistic Regression method has been applied to analyse the credibility

Education in Knowledge Economy
67
of the Z score in predicting the choices of students in selecting degree
offering institutes.
𝐿𝑜𝑔𝑖𝑡(𝑌 = 𝑗) = 𝑙𝑜𝑔 (𝑝𝑟(𝑌 = 𝑗)
𝑝𝑟(𝑌 = 𝑗′)) = 𝛽0 + 𝛽1𝑥1 + 𝛽2𝑥2 + ⋯+ 𝛽𝑘𝑥𝑘
Where j’ is the reference.
𝐿𝑜𝑔𝑖𝑡(𝑌 = 2) = 𝑙𝑜𝑔 (𝑝𝑟(𝑌=2)
𝑝𝑟(𝑌=1)) = 𝛽0 + 𝛽1𝑍𝐶𝑂 and 𝐿𝑜𝑔 𝑖𝑡(𝑌 = 3) = 𝑙𝑜𝑔 (
𝑝𝑟(𝑌=3)
𝑝𝑟(𝑌=1)) = 𝛽0 +
𝛽1𝑍𝐶𝑂
where ZCO = S-score
McFadden R2 and P values were utilized for testing the goodness of fit
and the statistical significance of the parameters of the model. Data
was analysed using the SPSS application.
Results and findings
The average Z score of the KDU students reading for the Logistics
Management degree was 0.877. The score for NSBM was 0.9685 and
that for CINEC was 0.784.The average Z score of the sample was
0.857.
Table 1: Descriptive Statistics of the independent variable
Source: Survey Data
Table 2: Parameter Estimates of the Multinomial Logistic Regression model
Institute a B Std.
Error Wald df Sig. Exp(B)
95% Confidence
Interval for Exp(B)
Lower
Bound
Upper
Bound
2
Intercep
t -1.241 0.724 2.938 1 0.087
ZCO 0.692 0.721 0.922 1 0.337 1.998 0.486 8.213
3 Intercep
t 0.695 0.536 1.685 1 0.194
Minimum Maximum Mean S.D Skewness Kurtosis
Statistic Statistic Statistic Statistic Statistic Std. Error
Statistic Std. Error
Z-scor
e .0013 1.7100 .856913 .3712222 .007 .228 -.574 .453
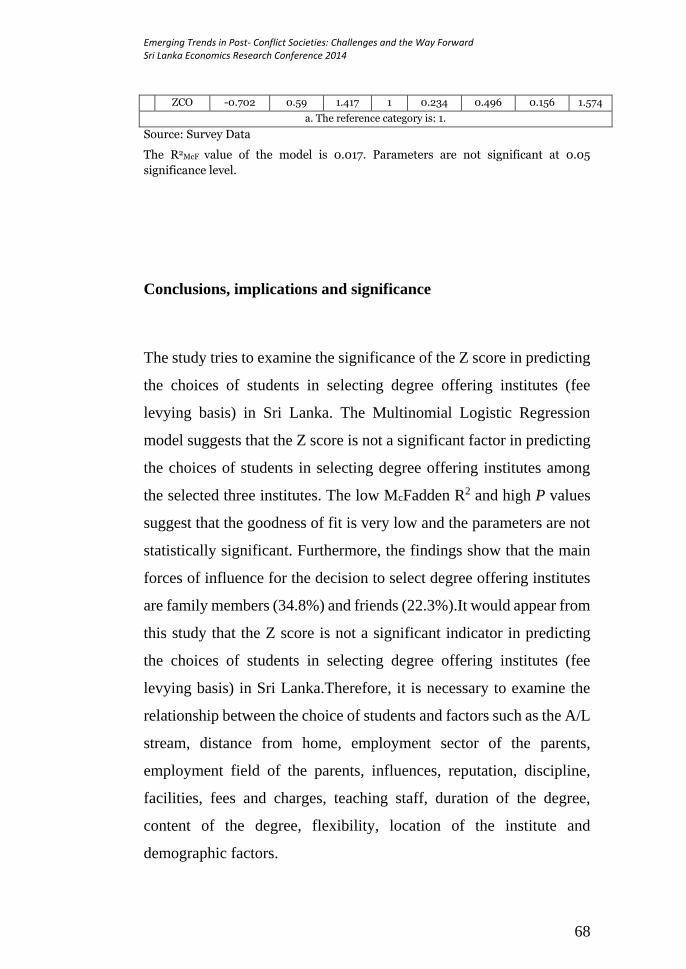
Emerging Trends in Post- Conflict Societies: Challenges and the Way Forward Sri Lanka Economics Research Conference 2014
68
ZCO -0.702 0.59 1.417 1 0.234 0.496 0.156 1.574
a. The reference category is: 1.
Source: Survey Data
The R2McF value of the model is 0.017. Parameters are not significant at 0.05
significance level.
Conclusions, implications and significance
The study tries to examine the significance of the Z score in predicting
the choices of students in selecting degree offering institutes (fee
levying basis) in Sri Lanka. The Multinomial Logistic Regression
model suggests that the Z score is not a significant factor in predicting
the choices of students in selecting degree offering institutes among
the selected three institutes. The low McFadden R2 and high P values
suggest that the goodness of fit is very low and the parameters are not
statistically significant. Furthermore, the findings show that the main
forces of influence for the decision to select degree offering institutes
are family members (34.8%) and friends (22.3%).It would appear from
this study that the Z score is not a significant indicator in predicting
the choices of students in selecting degree offering institutes (fee
levying basis) in Sri Lanka.Therefore, it is necessary to examine the
relationship between the choice of students and factors such as the A/L
stream, distance from home, employment sector of the parents,
employment field of the parents, influences, reputation, discipline,
facilities, fees and charges, teaching staff, duration of the degree,
content of the degree, flexibility, location of the institute and
demographic factors.
Education in Knowledge Economy
69
References
1. Bredo, O., Foersom, T. & Laursen, P.F. (1993). Students’ choice:
a model. Higher Education Review, Vol. 26, No. 1, pp. 64-73.
2. Hossler, D., Braxton, J. & Coopersmith, G. (1989). Understanding
Student College Choice. In J. C. Smart (ed.).Higher Education:
Handbook of Theory and Research, Vo. V, pp. 231-288
3. Kallio, R.E. (1995) Factors Influencing the College Choice
Decisions of Graduate Students. Research In Higher Education,
Vol. 36, No. 1, pp. 109-124
4. Niu, S.X.&Tienda, M. (2008). Choosing college: Identifying and
modelling choice sets. Social Science Research, Vol. 37, pp. 416-
433.
5. Sidin, S.M., Hussin, S.R. & Soon, T.H. (2003) An Exploratory
Study of Factors Influencing the College Choice Decision of
Undergraduate Students in Malaysia. Asia Pacific Management
Review, 8(3),pp. 259-280.
6. Webber, S. A. &Clinton, B. D. (1999). Using Z-scores to Evaluate
Accounting Students: a Test of Weinstein’s Suggestion. Journal of
Accounting Education, Vol. 17, pp. 407-415

Emerging Trends in Post- Conflict Societies: Challenges and the Way Forward Sri Lanka Economics Research Conference 2014
70
Education in Knowledge Economy
71
[S2/05] Conservation of Agricultural Biodiversity: Does
Education Matter?
Wasantha Athukorala
Department of Economics and Statistics, University of Peradeniya
Abstract
The overall aim of this study was to evaluate the farmer preference of
agricultural biodiversity in small-scale farms in Sri Lanka. The study
attempted to investigate farmers’ valuation of different aspects of
agricultural biodiversity and how farmers’ valuation of agricultural
biodiversity changes with the change in their education on agricultural
biodiversity. The Choice Experiment (CE) method (combined with
Randomized Control Method) was used to collect the data while
models such as Conditional Logit (CL) and Random Parameter (RP)
Logit were used to analyse the data. The results clearly show that the
farmers’ education level as well as environmental concern on
agricultural biodiversity can play a major role in the conservation of
agricultural biodiversity in small-scale farms in Sri Lanka. The overall
findings of this research study will help policy makers to implement
relevant policies to reduce degradation of agricultural biodiversity
that is increasingly posing a major impediment to agricultural growth,
environmental protection and sustainable development.
Keywords: Agricultural biodiversity, Education, Valuation
Emerging Trends in Post- Conflict Societies: Challenges and the Way Forward Sri Lanka Economics Research Conference 2014
72
Introduction
Agricultural biodiversity is a sub-set of general biodiversity which is
essential for global food production, livelihood security,
environmental protection and sustainable agricultural development. It
can be defined as the variety and variability of animals, plants and
micro-organisms that are used directly or indirectly for food and
agriculture, including crops, livestock, forestry and fisheries (FAO,
2007). It comprises the diversity of genetic resources (varieties,
breeds) used for food, fodder, fibre, fuel and pharmaceuticals. It also
includes the diversity of non-harvested varieties that support
production (soil micro-organisms, predators, pollinators), and those in
the wider environment that support agro-ecosystems (agricultural,
pastoral, forest and aquatic). The direct and indirect benefits of
conserving farm level biodiversity can be explained on the basis of
total economic value (TEV) framework (Brown, 1990). TEV consists
of use and non-use values. Benefits obtained by individuals using
agricultural biodiversity are defined as use values. Use values include,
direct, indirect, portfolio values and option values (Primack, 1993;
Swanson, 1996; Evenson et al., 1998).However, bequest values,
altruistic values, existence values and cultural values of agricultural
biodiversity are considered as under non-use values (Brown, 1990;
Primack, 1993; Evenson et al., 1998).
The objective of the present study was to investigate farmer valuation
of different aspects of agricultural biodiversity (including their
environmental concerns). Accordingly, the main research questions of
this study were (1) do farmers have positive preferences on more

Education in Knowledge Economy
73
diverse farming systems? (2) does the farmers environmental concern
affect their valuation of agricultural biodiversity? and (3) how does
farmers’ valuation of agricultural biodiversity change with the change
in their education on agricultural biodiversity. The Choice Experiment
(CE) method (combined with Randomized Control Method) is used to
estimate farmers’ preferences for agricultural biodiversity. It also
assists to measure the values that farm families attach to multiple
benefits of agricultural biodiversity. The overall findings of this
research will help to implement policies to reduce degradation of
agricultural biodiversity in rural agricultural areas in Sri Lanka.
Materials and methods
The Choice Experiment (CE) method was used to estimate farmer
preference for agricultural biodiversity. Models such as Multinomial
Logit (ML) Model, Conditional Logit (CL) and Random Parameter
(RP) Logit models (Greene, 2000)were used to analyse the data. This
study employs an experimental approach (Randomized Control
Method) to collect the data in order to answer the second and third
research questions. Firstly, 21 villages from Ampara district were
selected purposively. Then the villages were divided into three groups
(one control group and two treatment groups). Accordingly,
randomisation to select households into different groups (treatment or
control) was done at the village level. Accordingly, a ‘village’ is the
unit of randomisation in this study. A number of 20 households were
selected from each village randomly.
Emerging Trends in Post- Conflict Societies: Challenges and the Way Forward Sri Lanka Economics Research Conference 2014
74
Basic Steps of the survey
(i). Households for the survey from the district were selected using the
method explained above.
(ii). One treatment group was provided with education on agricultural
biodiversity while other treatment group was provided with
information in order to improve their environmental concerns. Control
group is not provided with any information (iii). CE survey covers all
groups in the district at the end of the cultivation season
Education program included two steps. Firstly, we met respondents
and explained the important of agricultural biodiversity and
environmental protection individually. Secondly, we provided leaflets
(but not keep with them-they can read it in front of us or we can read
it for them) showing the importance of maintaining diverse farming
system in their farms. The survey was carried out by administering a
questionnaire through a face-to-face interview with the Head or any
other working member of the households. Accordingly, the final
survey covered 420 households.
In this study the most important attributes of farms and their levels
were identified in consultation with experts from the Ministry of
Environment in Sri Lanka, drawing on the results of informal
interviews and workshops with small-scale farmers in the study sites,
focus group discussions and a thorough review of previous research in
this area in the country. After identifying the attributes for the
experiment, we assigned values or levels to each attribute. These levels
were chosen to represent the relevant range of variation in the present
or future interest of respondents. In general, focus group discussions
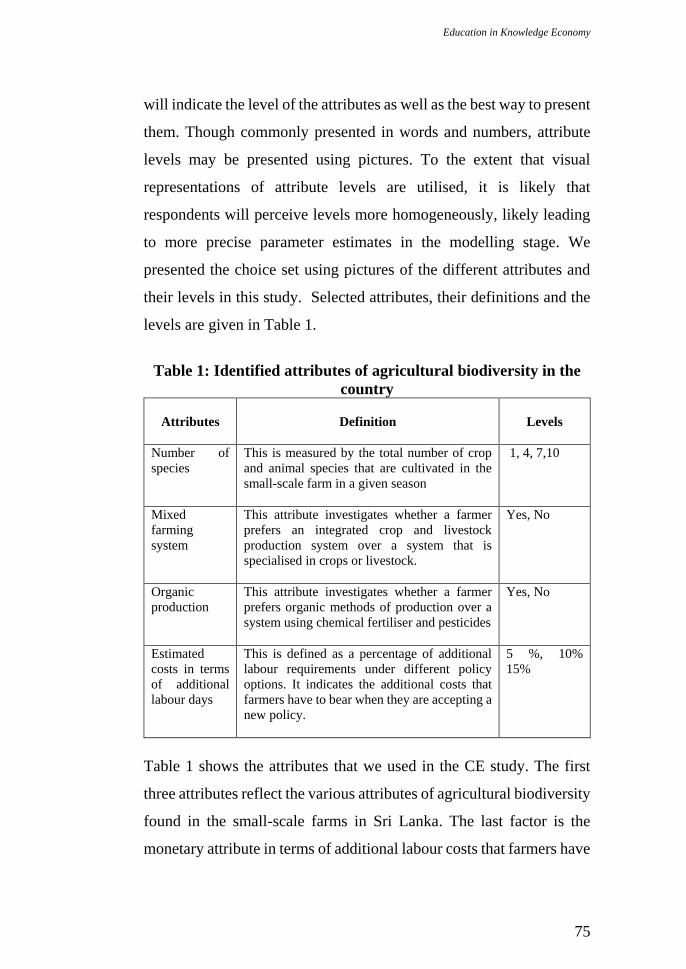
Education in Knowledge Economy
75
will indicate the level of the attributes as well as the best way to present
them. Though commonly presented in words and numbers, attribute
levels may be presented using pictures. To the extent that visual
representations of attribute levels are utilised, it is likely that
respondents will perceive levels more homogeneously, likely leading
to more precise parameter estimates in the modelling stage. We
presented the choice set using pictures of the different attributes and
their levels in this study. Selected attributes, their definitions and the
levels are given in Table 1.
Table 1: Identified attributes of agricultural biodiversity in the
country
Attributes
Definition
Levels
Number of
species
This is measured by the total number of crop
and animal species that are cultivated in the
small-scale farm in a given season
1, 4, 7,10
Mixed
farming
system
This attribute investigates whether a farmer
prefers an integrated crop and livestock
production system over a system that is
specialised in crops or livestock.
Yes, No
Organic
production
This attribute investigates whether a farmer
prefers organic methods of production over a
system using chemical fertiliser and pesticides
Yes, No
Estimated
costs in terms
of additional
labour days
This is defined as a percentage of additional
labour requirements under different policy
options. It indicates the additional costs that
farmers have to bear when they are accepting a
new policy.
5 %, 10%
15%
Table 1 shows the attributes that we used in the CE study. The first
three attributes reflect the various attributes of agricultural biodiversity
found in the small-scale farms in Sri Lanka. The last factor is the
monetary attribute in terms of additional labour costs that farmers have
Emerging Trends in Post- Conflict Societies: Challenges and the Way Forward Sri Lanka Economics Research Conference 2014
76
under different policy options. As compared to willingness to pay
(WTP), willingness to accept is measured as a benefit rather than a cost
(Freeman, 2003). In order to estimate this benefit, a monetary attribute
in terms of additional labour costs that farmers are willing to offer is
included. The size of the hypothetical small-scale farm is fixed as one
acre4 in area in each case (this is the average small-scale farm size in
Sri Lanka).
The choice experiment was designed with the assumption that the
observable utility function would follow a strictly additive form. In this
study, we explored a variety of different specifications of the utility
functions to identify the best specification of the data. Finally, CL
models were run for the three groups separately by including attributes
of the CE survey. Then CL models with interaction were run. This
specification of the model was not significantly different from the
previous specification. In particular, the model did not reveal a higher
level of parametric fit compared with the first model. Therefore, it can
be concluded that the improvement in model fit was not significant.
The Hausman-McFadden test also revealed that CL model without
interactions is a better fit for the data than the CL model with
interaction (Greene, 2000).We estimated the results using RPL model
to investigate whether there is an observable improvement of the
results. RPL model is one of the fully flexible versions of the discrete
choice models because its unobserved utility is not limited to the
4 This small-scale farm size was chosen from the agricultural census survey
conducted in 2002 (Census of Agriculture, 2002)
Education in Knowledge Economy
77
normal distribution. General specification of the CL model can be
given as follows;
)()()()( 43210 LROFMFCDU ij
Where, β0 refers to the alternative specific constant and β1-4 refers to
the vector of coefficients associated with the vector of attributes
describing farms characteristics.
Results and discussion
The mean values of age were 38, 40 and 37 of the two treatment groups
and control group, respectively. The average number of persons in the
household was 5, 4 and 5 while average education levels were 10, 9
and 9, respectively. Although agriculture was the dominant source of
household income, monthly income from non-farm activities was
approximately Rs. 1,350, Rs. 1,300 and Rs. 1,425 per household,
which accounted for almost 5 per cent of the total household income.
The mean labour usage per season was 74 man-days for three samples.
This is expected, given the tedious labour intensity for all agricultural
work in semi-subsistence economy .Rice was cultivated by almost all
households followed by various types of vegetables and cash crops.
The maximum number of crop varieties cultivated by any household
was seven. The comparison of descriptive statistics clearly indicates
that there is no difference between different groups.
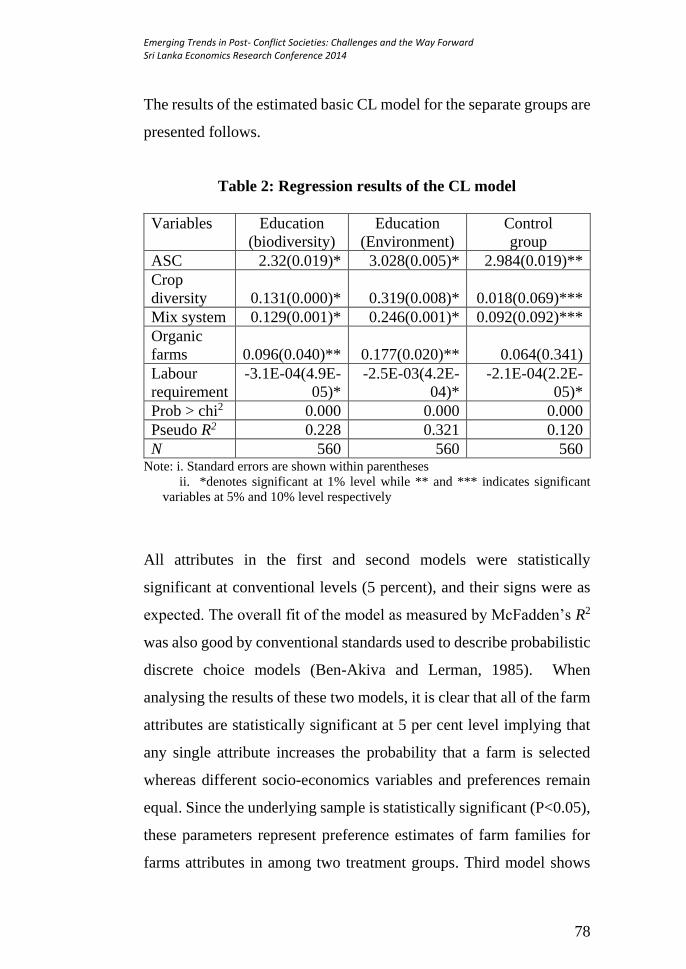
Emerging Trends in Post- Conflict Societies: Challenges and the Way Forward Sri Lanka Economics Research Conference 2014
78
The results of the estimated basic CL model for the separate groups are
presented follows.
Table 2: Regression results of the CL model
Variables Education
(biodiversity)
Education
(Environment)
Control
group
ASC 2.32(0.019)* 3.028(0.005)* 2.984(0.019)**
Crop
diversity 0.131(0.000)* 0.319(0.008)* 0.018(0.069)***
Mix system 0.129(0.001)* 0.246(0.001)* 0.092(0.092)***
Organic
farms 0.096(0.040)** 0.177(0.020)** 0.064(0.341)
Labour
requirement
-3.1E-04(4.9E-
05)*
-2.5E-03(4.2E-
04)*
-2.1E-04(2.2E-
05)*
Prob > chi2 0.000 0.000 0.000
Pseudo R2 0.228 0.321 0.120
N 560 560 560 Note: i. Standard errors are shown within parentheses
ii. *denotes significant at 1% level while ** and *** indicates significant
variables at 5% and 10% level respectively
All attributes in the first and second models were statistically
significant at conventional levels (5 percent), and their signs were as
expected. The overall fit of the model as measured by McFadden’s R2
was also good by conventional standards used to describe probabilistic
discrete choice models (Ben-Akiva and Lerman, 1985). When
analysing the results of these two models, it is clear that all of the farm
attributes are statistically significant at 5 per cent level implying that
any single attribute increases the probability that a farm is selected
whereas different socio-economics variables and preferences remain
equal. Since the underlying sample is statistically significant (P<0.05),
these parameters represent preference estimates of farm families for
farms attributes in among two treatment groups. Third model shows

Education in Knowledge Economy
79
the situation of the control group. For this group organic farm variable
is not significant (P>0.05) even under ten per cent level while all other
attributes are significant at five or ten per cent level. Relatively
significance of the attributes of this model is less when comparing with
other two models. The results clearly show that the education has some
impact on farmer’s valuation of agricultural biodiversity in study area.
Conclusions
This research is one of the first attempts to use choice modelling to
investigate farmers’ preference for different attributes of agricultural
biodiversity that can be seen in small-scale farm in Sri Lanka. We
applied the choice modelling approach with RCM to identify whether
farmers preferences on different attributes of agricultural biodiversity
are affected by the education.
In general, the findings of the choice experiment support the
assumption that small-scale farms and their multiple attributes
contribute positively and significantly to the utility of farm families in
Sri Lanka. Also their valuation is highly affected by their education on
biodiversity and environmental attitudes. The overall findings of this
research will help to implement policies to reduce degradation of
agricultural biodiversity that is increasingly posing a major
impediment to agricultural growth, environmental protection and
sustainable development. Further, the research findings will contribute
to the sustainable use of agricultural biodiversity to improve farmers’
well-being and achieve an environmental friendly farming system. It
also helps to increase awareness and generates support for investment

Emerging Trends in Post- Conflict Societies: Challenges and the Way Forward Sri Lanka Economics Research Conference 2014
80
in conservation and development of agricultural biodiversity.
Moreover, it will provide an opportunity to make necessary policies
that provide incentives to protect biodiversity at farm level that
generate regional as well as global benefits in the future.
As the results of the present study show, education is important in
determining the farmers’ valuation of agricultural biodiversity.
Designing formal and informal education programs will improve
farmers’ abilities to conserve agricultural biodiversity in the country.
Moreover, a further initiative can be taken to strengthen the capacity
of farmers through farmer-centred training workshops geared towards
conserving agricultural biodiversity. This could be done in a
collaborative manner involving the government, district assemblies
and NGOs. Government also needs to intensify its agricultural
extension service programs by training and deploying qualified
extension officers. The officers, in turn, should intensify farmer
education on agricultural biodiversity.
References
1. Brown, G. M. 1990. Valuation of Genetic Resources. In: The
Preservation and Valuation of Biological Resources, Orians, G.H.,
2. Brown, G.M., W. E. Kunin and J. E. Swierzbinski. (Eds.),
University of Washington Press, pp: 203-228.
3. Di Falco, S. and J. P. Chavas. 2009. On crop biodiversity, risk
exposure and food security in the highlands of Ethiopia. American
Journal of Agricultural Economics, 91(3): 599-611.
4. Evenson, R. E., D. Gollin and V. Santaniello. 1998. Agricultural
Values of Plant Genetic Resources. CAB International,
Wallingford.

Education in Knowledge Economy
81
5. FAO. 2007. The State of Food and Agriculture 2007. Part I: Paying
farmers for environmental services. Rome.
6. Greene, W. H. 2000. Econometric Analysis. (4th Eds.), New Jersey:
Prentice Hall.
7. Hanley, N., MacMillan, D., Wright, R. E., Bullock, C., Simpson,
I., D. Parsisson and B. Crabtree. 1998. Contingent valuation versus
choice experiments: estimating the benefits of environmentally
sensitive areas in Scotland. Journal of Agricultural Economics,
49(1): 1-15.
8. McFadden, D. and K. Train. 2000. Mixed MNL models of discrete
response. Journal of Applied Economics, 15(5): 447-470.
9. Primack, R. 1993. Essential of conservation biology, Sinauer
Sinauer Associates,Inc. Publishers: Sunderland, MA.
10. Rolfe, J., J. J. Bennett and J. Louviere. 2000. Choice modelling and
its potential application to tropical rainforest preservation.
Ecological Economics,35 (2): 289-302.
11. Swanson, T. 1996. Global values of biological diversity: the public
interest in the conservation of plant genetic resources for
agriculture. Plant Genetic Resources Newsletter, 105: 1-7.

Emerging Trends in Post- Conflict Societies: Challenges and the Way Forward Sri Lanka Economics Research Conference 2014
82
Energy and the Economy
83
Session-3 Energy and
the Economy

Emerging Trends in Post- Conflict Societies: Challenges and the Way Forward Sri Lanka Economics Research Conference 2014
84
Energy and the Economy
85
[S3/01] Financial Feasibility Analysis of a Small Hydro
Power Plant With Respect to Uncertainty Variables
Panditha I.U.
Department of Mathematics, University of Colombo, Colombo 03, Sri Lanka
Perera S.S.N.
Department of Mathematics, University of Colombo, Colombo 03, Sri Lanka
Ratnayake R.M.P.W.K.
Central Engineering Consultancy Bureau, Colombo 07, Sri Lanka
_______________________________________________________
Abstract
As a rapidly developing country, energy plays a vital role in the Sri
Lankan economy. With the depletion of fossil fuel and rising energy
costs more emphasis is given to renewable energy and alternative
power generation, especially towards Hydro Power Plants (HPP). As
Small Hydro Power Plants (SHPP) are relatively cheap and
environmental friendly compared to large scale HPP, there is an
increased investor interest towards SHPP energy generation in Sri
Lanka. However the financial feasibility of a SHPP is heavily
dependent on several uncertain external variables such as the flow of
the river, time taken for government approvals, electricity tariffs, rate
of inflation etc. The proposed hybrid method focuses to develop a
realistic technique to determine the financial feasibility of a SHPP by
incorporating uncertainty variables in to traditional Discounted Cash
Flow (DCF) methods such as the Net Present Value (NPV) and Internal
Rate of Return (IRR) using the Markov chain process. The cash inflows
of the SHPP were forecasted using the Markov chain process, while
cash outflows were linearly forecasted using several key assumptions.
The financial feasibility of the SHPP was assed using both NPV and
IRR based on these forecasted cash flows. According to the findings, it

Emerging Trends in Post- Conflict Societies: Challenges and the Way Forward Sri Lanka Economics Research Conference 2014
86
was found that the calculated NPV was positive and the IRR was
greater than the required rate of return. However, both NPV and IRR
calculated were considerably lower than the NPV and IRR calculated
in the initial feasibility study.
Keywords: Financial Feasibility, Markov Chains, Small Hydro
Power Plants, Uncertainty Variables
Introduction
Sri Lanka is a country with many hydropower resources. Hence,
increased use of hydro power energy generation can reduce the
country’s dependency on fuel imports and save foreign exchange.
Hydro Power Plants (HPP) below the capacity of 10MW are Small
Hydro Power Plants (SHPP). They are built in an isolated area and are
primarily based on the run-of-the –river principle, which means water
is not stored in a reservoir and is used only when it is available, thus
SHPP have been given prominence in recent years as they are a
cheaper and eco-friendly alternative to large scale HPP.
A prospective investor has to carry out a technical and financial
feasibility study prior to obtaining necessary government approvals to
construct a SHPP. It is crucial to estimate the financial feasibility as
accurately as possible due to the long term nature of the investment
and the decision made to invest is irreversible and includes high capital
costs (Carmichael, 2011). The approval process of a SHPP takes
approximately 3 years, while construction takes another 2 years.
However, during this time several key variables of the SHPP such as
the river flow, electricity tariffs, capital costs, etc will change. Hence,
an initial financial feasibility study conducted without considering

Energy and the Economy
87
these uncertainty factors would be unrealistic and inapplicable even
before the actual commencement of the plant. However, currently in
Sri Lanka, the financial feasibility of a potential SHPP is calculated
ignoring the effect of these uncertainty variables.
The objective of this study, therefore, is to present a realistic method
for assessing the financial feasibility of a Small Hydro Power Plant
(SHPP) taking several of these uncertain variables into account.
Data and Methodology
This case study is conducted on a 2.2MW SHPP located in the lower
reaches of Madulla Oya in Karapalagama, Walapane in the
NuwaraEliya District. The SHPP carried out its initial feasibility study
in 2010 and applied for government approvals during the same year.
However the government approvals were granted in 2013 and
construction of the plant began immediately after. This research is
carried out using the financial data in the initial financial feasibility
report which was prepared in 2010.
The daily rainfall data of catchment area was taken from the
Meteorological Department of Sri Lanka from 1993-2010. This
rainfall data was used to calculate the flow of the river. Inflation rates
forecasted by the International Monetary Fund (IMF) for Sri Lanka in
The World Economic Outlook (WEO) database for 2010 were used for
cash outflow calculations.

Emerging Trends in Post- Conflict Societies: Challenges and the Way Forward Sri Lanka Economics Research Conference 2014
88
The analytical method builds upon the traditional Discounted Cash
Flow (DCF) methods and compliments it by providing additional
insights towards the uncertainties associated with future cash flows of
a SHPP. The mathematical model is carried out in two parts. The cash
inflows of the SHPP for 20 years are forecasted using the Markov
chain process (Pfeifer and Carraway, 2000), while the cash outflows
are linearly forecasted using several key assumptions. The financial
feasibility of the SHPP is assed using both the Net Present value (NPV)
and the Internal Rate of Return (IRR) based on these forecasted cash
flows (Trowbridge, 2013).
Cash inflows of a SHPP are earned solely from the electricity
generated and sold to the Ceylon Electricity Board (CEB). Therefore
the revenue function can be shown as follows,
𝑅1 = 𝐸 ∗ 𝑇 ∗ 10 6 ………………………………………… (1)
Where 𝑅1 is the revenue earned (LKR), 𝐸 is the energy generated
(GWh) and 𝑇 is the electricity tariff (LKR/kWh) applicable through
the Standardized Power Purchase Agreement (SPPA).
The SPPA will be signed between the CEB and the investor once the
SHPP has the necessary government approvals. However, the time
taken for government approval process is an uncertain factor and
during this period the electricity tariff rates would be revised by the
Public Utilities Commission of Sri Lanka (PUCSL). The developers
have the option of selecting either a three-tier tariff or a flat tariff. If a

Energy and the Economy
89
flat tariff is selected, this rate will be valid for a period of 20 years after
signing the SPPA.
The energy generated in a particular month, 𝐸 in GWh, can be
calculated as shown below,
𝐸 =𝑃1∗𝐷∗24
109 ……………………………………………. (2)
Where 𝐷, is the number of days in that particular month while 𝑃1, is
the potential power (Watts) that can be produced by the SHPP and can
be calculated as shown below,
𝑃1 = 𝜂𝜌𝑄𝑔ℎ …………………………………………… (3)
Where, 𝜂 is the efficiency of the turbine (85%), 𝜌 is the density of
water (1000 kg/m3), 𝑄is the flow of the river or the water discharge
passing through turbines (m3/s), 𝑔 is the acceleration due to gravity
(9.81 m3/s) and ℎ is the gross head (60 m) which is the maximum
vertical distance between the water intake and turbines.
Therefore from (1), (2) and (3) we can see that the main uncertain
variables contributing to the cash inflows of a SHPP are𝑄and 𝑇. Out
of these two, 𝑇 would be uncertain only from the date an investor
applies for government approvals until the SPPA is signed. Because
after signing the SPPA a flat tariff would be applicable for the next 20
years. Therefore during the approval process 𝑇 is assumed to increase
linearly throughout the years and for this study 𝑇 is forecasted for 3
years using historical data.

Emerging Trends in Post- Conflict Societies: Challenges and the Way Forward Sri Lanka Economics Research Conference 2014
90
The flow of the river Q which has a direct impact on the future cash
inflows of the SHPP is forecasted for 20 years using the Markov chain
process 5 (Pfeifer and Carraway, 2000), while cash outflows were
linearly forecasted using several key assumptions. The financial
feasibility of the SHPP was assed using both NPV and IRR based on
these forecasted cash flows (Trowbridge, 2013).
The Markov chain process was applied to each month of the year, as
the variations in the river flow during the dry and wet seasons were
considered in order to get a realistic forecast of the annual river flow
Q. Since it takes approximately 5 years between applying for
government approvals to the actual commencement of the SHPP, the
flow data was forecasted for 25 years using the n-step transition matrix.
Then the cash inflows of the SHPP for that particular month for any
time period n depending on the current state was calculated using the
Markov property and a reward matrix. Subsequently, to forecast the
annual cash flows, the above process was carried out for each of the 12
months and the addition was calculated. This was done for 25 years.
The costs relating to a SHPP were separated in to two broad categories.
I, the initial investment costs were forecasted for 5 years using the
inflation rates forecasted by the International Monetary Fund (IMF)
for Sri Lanka while recurring costs such as operating and maintenance
5The Markov Chain method is a stochastic process and works in discrete states and
transitions from one state to another. Markov Chains has a specific property called
the Markov Property which means the next state depends only on the current state
and not on the preceding states.
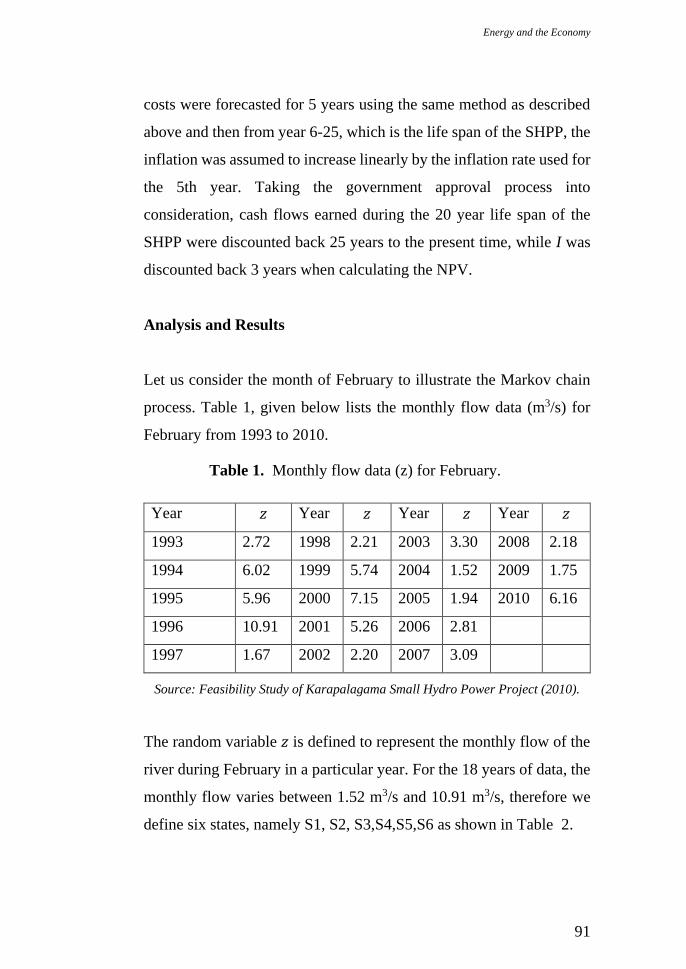
Energy and the Economy
91
costs were forecasted for 5 years using the same method as described
above and then from year 6-25, which is the life span of the SHPP, the
inflation was assumed to increase linearly by the inflation rate used for
the 5th year. Taking the government approval process into
consideration, cash flows earned during the 20 year life span of the
SHPP were discounted back 25 years to the present time, while I was
discounted back 3 years when calculating the NPV.
Analysis and Results
Let us consider the month of February to illustrate the Markov chain
process. Table 1, given below lists the monthly flow data (m3/s) for
February from 1993 to 2010.
Table 1. Monthly flow data (z) for February.
Year 𝑧 Year 𝑧 Year 𝑧 Year 𝑧
1993 2.72 1998 2.21 2003 3.30 2008 2.18
1994 6.02 1999 5.74 2004 1.52 2009 1.75
1995 5.96 2000 7.15 2005 1.94 2010 6.16
1996 10.91 2001 5.26 2006 2.81
1997 1.67 2002 2.20 2007 3.09
Source: Feasibility Study of Karapalagama Small Hydro Power Project (2010).
The random variable 𝑧 is defined to represent the monthly flow of the
river during February in a particular year. For the 18 years of data, the
monthly flow varies between 1.52 m3/s and 10.91 m3/s, therefore we
define six states, namely S1, S2, S3,S4,S5,S6 as shown in Table 2.

Emerging Trends in Post- Conflict Societies: Challenges and the Way Forward Sri Lanka Economics Research Conference 2014
92
Table 2. Transition states and 𝒛 classes for February
State Classes
S1 1.00 ≤ 𝑧< 1.95
S2 1.95 ≤ 𝑧< 2.22
S3 2.22 ≤ 𝑧< 2.82
S4 2.82 ≤ 𝑧< 3.31
S5 3.31 ≤ 𝑧< 5.97
S6 5.97 ≤ 𝑧< 11.00
We can use a transition diagram to illustrate the six states and the
transitions between each of these states as shown in Figure 1, below.
1
42
1
3
6
5
0.5000
0.3333
0.33330.3333
0.3333
0.3333
0.5000
0.5000
0.5000
0.2500
0.2500
0.2500
0.6667
0.6667
0.2500
Figure 1. Transition diagram between states

Energy and the Economy
93
Then we define the one-step transition matrix 𝑃 for the month of
February to be as follows,
𝑃 =
[ 0.2500 0.2500 0.2500 0.0000 0.0000 0.25000.3333 0.0000 0.0000 0.3333 0.3333 0.00000.0000 0.0000 0.0000 0.5000 0.0000 0.50000.5000 0.5000 0.0000 0.0000 0.0000 0.00000.0000 0.3333 0.0000 0.0000 0.0000 0.66670.3333 0.0000 0.0000 0.0000 0.6667 0.0000]
The reward matrix𝑅, for February using (1), (2) and (3) is calculated
to be as follows,
𝑅 =
[ 5,227,47910,193,58411,605,00314,741,49117,302,95644,506,383]
This shows that, in any future period during the month of February if
𝑧 is in state S1 the revenue from the SHP plant would be LKR
5,227,479. If 𝑧 is in state S2 the revenue would be LKR 10,193,584
and so on. Since the monthly flow rate for February is currently in state
S6, using the Markov property we can define𝛾,the initial probability
distribution to be as follows,
𝛾 = [0 0 0 0 0 1]

Emerging Trends in Post- Conflict Societies: Challenges and the Way Forward Sri Lanka Economics Research Conference 2014
94
Using the relationship 𝑉𝑛 = 𝛾𝑃𝑛𝑅 we can forecast the expected
cash inflows of the SHPP during February for the next 25 years as
shown in Table 3.
Table 3. Forecasted expected cash inflows (𝑽) for February.
To forecast the annual expected cash inflows we need to carry out the
above process for each of the twelve months and get the addition. This
has to be done for 25 years.
Then using the standard formulae6, the expected NPV and expected
IRR can be calculated. Though the SHPP is financially feasible from
an investor’s point of view as the NPV is positive and the IRR
calculated is greater than the required rate of return (Table 4), both the
6𝑁𝑃𝑉 = ∑𝐶𝐹𝑡
(1+𝑟)𝑡+5
20
𝑡=1−
𝐼
(1+𝑟)3
The IRR can be defined as 𝛽, the rate at which the NPV of the project is equal to
zero, as expressed below :
𝑁𝑃𝑉 = ∑𝐶𝐹𝑡
(1 + 𝛽)𝑡+5
20
𝑡=1
−𝐼
(1 + 𝛽)3 = 0
Year 𝑉 Year 𝑉 Year 𝑉
1 13,277,797 10 20,032,218 19 18,709,800
2 28,006,893 11 17,963,247 20 19,037,432
3 14,762,861 12 19,647,300 21 18,770,442
4 23,155,990 13 18,274,116 22 18,988,013
5 15,911,551 14 19,392,761 23 18,810,713
6 21,540,148 15 18,481,008 24 18,955,195
7 16,818,923 16 19,223,930 25 18,837,456
8 20,620,104 17 18,618,487
9 17,498,570 18 19,111,852
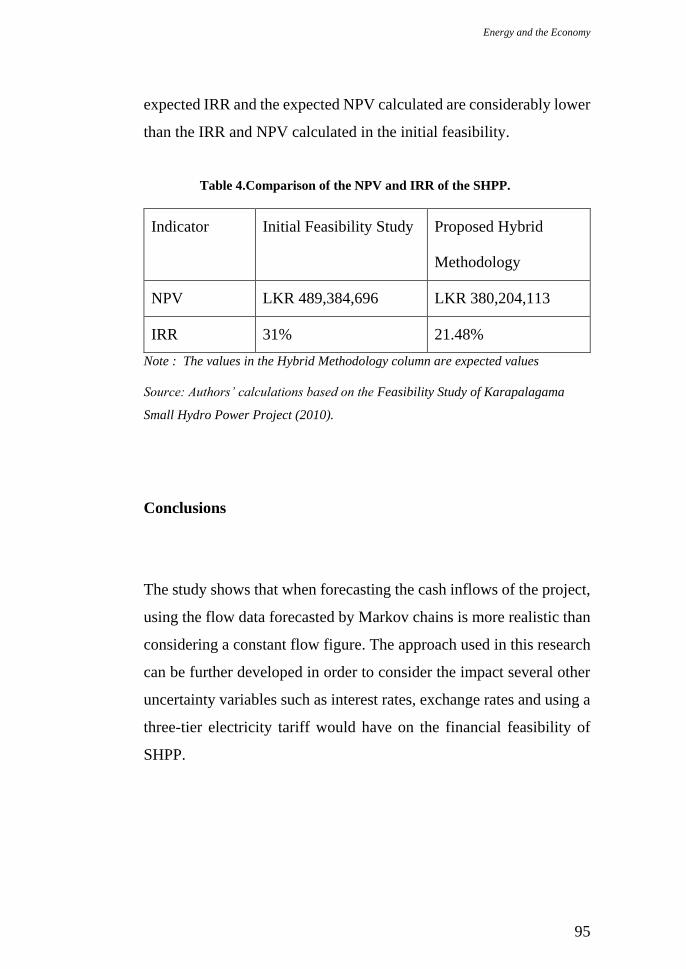
Energy and the Economy
95
expected IRR and the expected NPV calculated are considerably lower
than the IRR and NPV calculated in the initial feasibility.
Table 4.Comparison of the NPV and IRR of the SHPP.
Indicator Initial Feasibility Study Proposed Hybrid
Methodology
NPV LKR 489,384,696 LKR 380,204,113
IRR 31% 21.48%
Note : The values in the Hybrid Methodology column are expected values
Source: Authors’ calculations based on the Feasibility Study of Karapalagama
Small Hydro Power Project (2010).
Conclusions
The study shows that when forecasting the cash inflows of the project,
using the flow data forecasted by Markov chains is more realistic than
considering a constant flow figure. The approach used in this research
can be further developed in order to consider the impact several other
uncertainty variables such as interest rates, exchange rates and using a
three-tier electricity tariff would have on the financial feasibility of
SHPP.
Emerging Trends in Post- Conflict Societies: Challenges and the Way Forward Sri Lanka Economics Research Conference 2014
96
References
1. Carmichael, D.G. (2011) An Alternative Approach to Capital
Investment Appraisal. The Engineering Economist. 56 (2), 123–
139.
2. International Monetary Fund. (2010) World Economic Outlook
October 2010[Online].Washington. Available from
https://www.imf.org/external/pubs/ft/weo/2010/02/weodata/index
.aspx
3. Pfeifer, P.E. & Carraway, R.L. (2000) Modeling Customer
Relationships As Markov Chains. Journal of Interactive
Marketing. 14 (2), 43-55.
4. Sri lanka. Karapalagama small hydro power project
(2010).Feasibility Study.
5. Trowbridge, B.C. (2013) Forecasting the US Capital Gains Tax
Rate Using Markov Chains. Applied and Computational
Mathematics.2 (4).

Energy and the Economy
97
[S3/02] Multiplier Effect of Foreign Exchange Economies
on the Comparative Viability of Renewable Energy-
based Power Projects in Sri Lanka
T L Gunaruwan
Department of Economics, Faculty of Arts, University of Colombo
Introduction
In the conventional “economic analysis”, capital investments are
evaluated based on their viability to the national economy [1]. An
economically unviable venture would be discouraged by regulatory
and policy machinery even though it is financially attractive to the
investor; while a financially unviable project with sufficient economic
viability would be promoted through financial incentives granted to the
investors. In performing economic appraisal, shadow price are used
instead of market prices in order to reflect the true opportunity costs
and values to the economy of inputs and outputs.
The foundations of this methodology rest on the premise that domestic
market prices are distorted due to a number of reasons compared to the
“world price” platform, which is considered the bench-mark for
estimating distortions. This implies that the “border prices” of traded
or tradable inputs and outputs are used in estimating the net economic
benefits of a project, which amounts to working out the “net foreign
exchange effect” of such investment.
According to Keynesian logic [2], a net foreign exchange gain (an
additional foreign exchange earnings through exports or an additional

Emerging Trends in Post- Conflict Societies: Challenges and the Way Forward Sri Lanka Economics Research Conference 2014
98
foreign exchange saving through substituting for imports) securable in
a project would not stay static within the economy as long as such
savings are domestically invested or consumed. That raises aggregate
expenditure, generating additional spirals of effective demand
creation, and thereby supplementary economic value added.
This “multiplier effect” is generally ignored in the conventional
economic analysis, which gap was chosen as the focus of this research.
The study therefore was conceived to estimate, and demonstrate, the
use of multiplier as an integral aspect in economic analysis of projects
through a comparative appraisal of renewable energy-based power
generation options available for Sri Lanka.
Materials and Methods
Four renewable energy based electricity generation technologies,
namely Bio-mass, Wind, and Solar, were subject to analysis as against
the Coal power option, for comparison sake. Conventional economic
analyses were first performed to rank the projects based on their
levelized net present economic costs. 7 These levelized net present
economic costs were then adjusted by “domestic value multiplying
effect” of foreign exchange saved. The supplementary GDP effect was
accounted for as a “value bonus” given to each respective alternative,
compared to coal technology, corresponding to the amount of
7Levelized cost is the Net Cost of an energy system divided by the energy output over the
system’s life, with time value of money taken into account (Information article,
December 2011; www.dyesol.com)
Energy and the Economy
99
exchange saved. Thus the levelized present value cost to the economy
(arrived at through, conventional economic analysis) would reduce by
that much when the “import substitution benefit premium” was
deducted from the respective costs 8 , resulting in an “import
substitution adjusted levelized cost”.
The multiplier for Sri Lanka was worked out through regression
analyses using macroeconomic data, and adapting the methodology
suggested by Dwidehi [2], where Investment (Gross Domestic Capital
Formation) was considered to be exogenous. The Consumption by the
private sector (C), and the Taxation (T) were assumed determined
linearly as functions of Disposable Income (Yd), while the Government
current expenses (G) and Imports (M) were assumed linear functions
of Taxation (T), and Gross Domestic Product (Y), respectively. The
model adapted for this exercise is described below:
Macro-economic relationship: Y = C + G + I + X - M
in which, C = C* + c (Yd) ;
G = G* + k(T) ;
T = T* + t(Yd)
Yd = Y – T + S and
M = M* + m(Y)
where, C*, G*, T* and M* were constants representing “intrinsic”
Consumption, Government recurrent expenses, Taxation and Imports,
respectively; while c, k, t and m were corresponding gradients.
8 Same analysis could also be performed by assigning a “cost premium” to each
unit of foreign exchange spent, thus amplifying the “economic costs” of those
alternatives having greater “per kwh” foreign cost components.
Emerging Trends in Post- Conflict Societies: Challenges and the Way Forward Sri Lanka Economics Research Conference 2014
100
The multiplier thus would take the form,
(π) = (1+t) / [1 + t – c(1-t) –kt + m(1+t)], which represents the total
multiplied value addition to the domestic economy that could be
secured through a rupee of additional aggregate expenditure “within
the economy”, enabled in this case by foreign exchange saving on
electricity generation using renewable energy technologies.
The technical and financial information pertaining to the renewable
energy projects were sourced from a number of secondary sources,
including the expert agencies involved in appraising the renewable
energy-based power generation programmes in Sri Lanka [3]. The
macro economic data were obtained from the publications of the
Ministry of Finance and Planning [4] and the Central Bank of Sri
Lanka [5].
Results and Discussion
The Table 1 summarizes the levelized costs of three renewable energy
alternatives for power generation, appraised at “financial” and
“economic” angles. Among the assumptions made are, the discount
rates (economic: 6%, and financial: 12%), and the shadow price
conversion rates (all foreign costs: 1, local labour : 0.8, local material
0.75, local fuel : same rate as local labour, and other O&M costs : same
rate as local material, investment: 1.5).

Energy and the Economy
101
Table 1: Conventional Analysis of Power Generation Alternatives –
Financial and Economic perspectives
Biomass
Energy
Solar
Energy
Wind
Energy
Coal
Energy
Plant capacity 10 MW 10 MW 25 MW 285 MW
Life 25 Years 25 Years 25 Years 35 Years
Levelized Cost (Rs/kwh)
Financial (@ DR 12%)
Economic (@ DR 6%)
21.83
20.15
23.36
15.10
10.26
6.87
11.12
9.84
Source :Author’s estimates based on data sourced from Resource Management
Associates, Sri Lanka
The sensitivity of these results on the discount rate was examined in
order to perceive any change of relative positioning of technologies
when the opportunity cost of investment changes. It was revealed that
Wind power is likely to be the most attractive among all alternatives,
and would never become “economically” less attractive to any
competing alternative at any “economic discount rate” that could be
reasonably used.9 However, wind power could become “financially”
less attractive than coal power at discount rates greater than 14%.
Though biomass appeared financially more attractive for electricity
generation than solar energy, the relative position would reverse when
economic viability parameters are compared, and under “financial”
view point also when discount rates figure below 11%.
9Resources are available at much lower opportunity costs to the economy; thus no
reason to use higher discount rates for economic analyses. However, wind
technology would remain superior even at high discount rates as 12%

Emerging Trends in Post- Conflict Societies: Challenges and the Way Forward Sri Lanka Economics Research Conference 2014
102
Import Substitution Effect of Renewable Energies – Role Played by
the “Multiplier”
The effect of the multiplier in adjusting “economic attractiveness” of
those “import substituting” renewable energy technologies, in
comparison to coal power, at different hypothetical multiplier levels,
could be demonstrated graphically as depicted in the Figure 1.
Figure 1: Impact of Multiplier on Levelized Cost of Electricity from
Alternative Sources
Source: Author’s estimates
A number of interesting observations could be made out of this
analysis. First, it could be noted that the multiplier effect could play a
significant role in determining the relative economic preferences
among candidate renewable energy-based power project, and that the
cost estimates when multiplier equals one would correspond to
conventional levelized economic costs (Table 1). Second, Solar energy
would lose its “economic” attractiveness compared to biomass, and

Energy and the Economy
103
thus would become the least attractive among all, at multiplier levels
above 1.3. This would be because of relatively higher “foreign capital
intensity” of solar power. Third, the supremacy of wind energy would
not be challenged by other contenders under any level of multiplier
below 4. Last, the biomass based power generation, though is much
costlier in the overall sense, would secure the greatest boost from the
“multiplier” effect of exchange savings owing to its much lesser
“foreign components” compared to all other technologies; and thus,
would become superior to coal power over and above multiplier level
of 3, and also would supersede wind energy if multiplier value
increases beyond 4. The importance of estimating the multiplier
applicable for the Sri Lankan economy was thus evidenced.
Multiplier Estimation
The linear relationships assumed for macroeconomic parameter
determination were estimated using OLS methodology using statistics
for nineteen years from 1996 to 2013, sourced from the Annual
Reports of the Central Bank of Sri Lanka [5].The coefficients of
determinants so estimated were used in computing the multiplier; the
results are summarized in the Table 2.
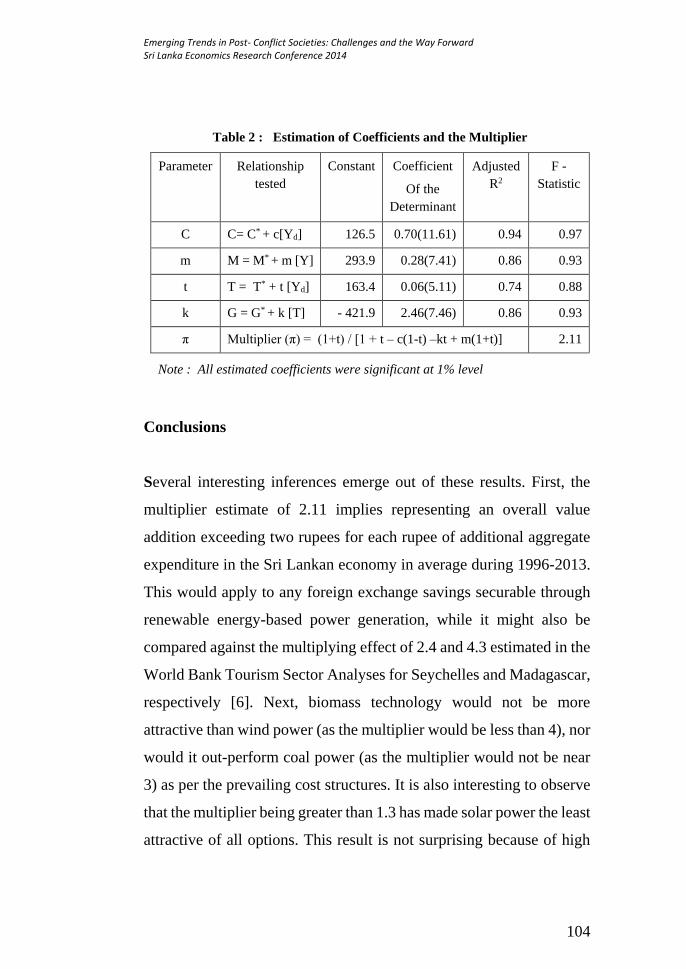
Emerging Trends in Post- Conflict Societies: Challenges and the Way Forward Sri Lanka Economics Research Conference 2014
104
Table 2 : Estimation of Coefficients and the Multiplier
Parameter Relationship
tested
Constant Coefficient
Of the
Determinant
Adjusted
R2
F -
Statistic
C C= C* + c[Yd] 126.5 0.70(11.61) 0.94 0.97
m M = M* + m [Y] 293.9 0.28(7.41) 0.86 0.93
t T = T* + t [Yd] 163.4 0.06(5.11) 0.74 0.88
k G = G* + k [T] - 421.9 2.46(7.46) 0.86 0.93
π Multiplier (π) = (1+t) / [1 + t – c(1-t) –kt + m(1+t)] 2.11
Note : All estimated coefficients were significant at 1% level
Conclusions
Several interesting inferences emerge out of these results. First, the
multiplier estimate of 2.11 implies representing an overall value
addition exceeding two rupees for each rupee of additional aggregate
expenditure in the Sri Lankan economy in average during 1996-2013.
This would apply to any foreign exchange savings securable through
renewable energy-based power generation, while it might also be
compared against the multiplying effect of 2.4 and 4.3 estimated in the
World Bank Tourism Sector Analyses for Seychelles and Madagascar,
respectively [6]. Next, biomass technology would not be more
attractive than wind power (as the multiplier would be less than 4), nor
would it out-perform coal power (as the multiplier would not be near
3) as per the prevailing cost structures. It is also interesting to observe
that the multiplier being greater than 1.3 has made solar power the least
attractive of all options. This result is not surprising because of high
Energy and the Economy
105
capital intensity of solar power plants, a large share of which is
imported; and also because of their low plant factors.
These results underline the strategic necessity to develop Wind energy-
based electricity generation in Sri Lanka, which would help the
economy grow faster while securing a greater degree of energy self-
reliance. Ways and means of reducing capital investment requirements
(particularly foreign components) of biomass and solar technologies
also would be worthwhile to explore in the long-run. Biomass in
particular could be quite promising as with a marginal augmentation
of coal costs in the world market, it could become economically more
attractive, particularly in an environment where technology and plant
efficacy are fast developing.
It must also be noted that the above economic estimations did not
consider any negative externalities associated with competing power
generation technologies. Biomass would be carbon neutral, as
firewood plantations would become an automatic necessity, while both
Solar and Wind would have no emissions altogether. Such was not
attempted in this study, as it is beyond the scope of this research.
References
1. Annual Reports (various issues) of the Central Bank of Sri Lanka,
Colombo, Sri Lanka.
2. Annual Reports (various issues) of the Ministry of Finance and
Planning, Colombo, Sri Lanka.

Emerging Trends in Post- Conflict Societies: Challenges and the Way Forward Sri Lanka Economics Research Conference 2014
106
3. Asian Development Bank, Guidelines for the Economic Analysis
of Projects. 1997 (http://www.adb.org/documents/guidelines-
economic-analysis-projects)
4. Databases of Resource Management Associates, Colombo, Sri
Lanka.
5. Macroeconomics: Theory and Policy, by D N Dwivedi, 3rd Edition,
Tata McGraw-Hill Education, 2005, pp 92-139
6. The World Bank, Tourism Sector Reviews for Seychelles (82024)
and for Madagascar (82025), July 2013.
Energy and the Economy
107
[S3/03] The Ambivalence of Electricity Tariff Setting in
Sri Lanka: A Reflection of a Deeper Crisis needing
Strategic Systemic Intervention
T Lalithasiri Gunaruwan1
H Nadeeka de Silva2
1Department of Economics University of Colombo 2Department of Management, South Eastern University of Sri Lanka
_______________________________________________________
Key words: Electricity, Affordability, Supply Economics,
Tariff Policy, Sri Lanka
Introduction
Sri Lanka, though still being a developing country, is vigorously
pursuing a strategy of “electricity for all”, and has already attained an
electrification level of 96% by 2013 (Central Bank of Sri Lanka, 2013),
quite a credible achievement compared to 29% level of electrification
by the turn of the century (Ceylon Electricity Board, 2000).
Continuous augmentation of the supply capacity is an imperative
component of such a strategy as the electricity demand grows at an
average rate of 1.5% approximately for each 1% real growth of the
country’s gross domestic product (Ceylon Electricity Board, 2010).
However, the State owned electricity supplier, the Ceylon Electricity
Board (CEB), is in financial difficulty with substantially high
continuing and accumulated losses (Morimoto and Hope, 2001), and
thus, any further expansion of the generation capacity at heavy capital
expenses is a difficult task. This is because increasing capacity under
such circumstances would imply borrowings, which would further

Emerging Trends in Post- Conflict Societies: Challenges and the Way Forward Sri Lanka Economics Research Conference 2014
108
deepen the financial crisis; and also because any current losses could
tend to amplify with expanded electricity supply unless the
profitability of electricity supply business, at least on the new
generation capacity added, cannot be ensured.
Electricity pricing occupies the centre stage of this problem. The CEB
has been supplying electricity at an average tariff level below the cost
of supply since a long time leading to accumulated losses. The gap is
still in the negative that every additional unit supplied also is at a loss.
CEB being a State enterprise is governed by the public policy which
comprises of societal welfare as well, and also comes under the
jurisdiction of the Public Utilities Commission of Sri Lanka (PUCSL)
in relation to pricing, and thus, is unable to practice “cost plus”
electricity tariffs, leading to this ambivalence.
It is this dilemma of electricity pricing and its systemic causes are
focused in this research which discusses strategic options available to
set prices with a view to ensuring supply side economics, “fairness” to
the public, and growth. Though it is difficult to achieve all these
together, potential short and medium term policy alternatives to
overcome the crisis would be evolved.
Materials and Methods
The research looks at the supply side economics of electricity tariffs.
It takes the approach of a comparative analysis of supply expansion
and tariff policies adopted over the years. Data and information on
costs of supply, tariff structure and overall supply economics are
obtained from secondary sources, including published documents from
the CEB, PUCSL, and also from various policy statements made from

Energy and the Economy
109
time to time by the Government. Techno-economic imperatives of
electricity system management and the historical evolution of policies
which have lead the system to be in the present crisis are examined at
length. The recent tariff structure proposed by the PUCSL the
subsequent political intervention to reduce the tariff conditions, and
also their justification and socio-economic implications are
particularly analysed.
Analysis and Results
Figure 1 shows the evolution of average sales price (reflecting the
average electricity tariff) in comparison to the average cost per kWh
supplied, which depicts how the CEB has run into deficit over the
years, and has accumulated losses.
Figure 1: Evolution of Selling Price (Average Tariff) and Average Cost of
Supply
Note: Average Costs are low in rainy years owing to more hydropower supply
Source: CEB Data.

Emerging Trends in Post- Conflict Societies: Challenges and the Way Forward Sri Lanka Economics Research Conference 2014
110
There are at least two main political economic reasons for which the
CEB was not allowed to increase tariff levels to cover the increasing
costs: First, the cost of production rose rapidly so that any tariff set to
cover such costs would have created socio-political problems. The
affordability of the low-end consumers in particular would not have
been adequate to pay any such cost recovery tariffs. As access to
energy is an indicator in the measurement of poverty in a country
(Morimoto and Hope, 2001), the tariffs applicable to the low-end users
belonging to low income segments should not be increased, and it is
imperative to provide at least a limited number of electricity units at a
concessional price to such low income households in developing
countries. Second, Sri Lanka is identified among the countries having
highest electricity tariff levels in the Asian region (Ferdinando and
Gunawardana, 2012) and further increase of electricity prices would
have caused local costs of production, thus leading to loss of
international competitiveness of our exports.
The political economic examination conducted in this study also found
out several other constraints against implementing cost-recovery
tariffs in the current context. The possibility of “self-generation” by
the high-end consumers, who face substantially high tariff levels
owing to the step-wise augmenting tariff structure practiced as per the
policy of ensuring electricity affordability to low-end consumers, is a
matter for concern.10 Such would be sub-optimal vis-a-vis national
10 Consumptions below 90 units per month are billed below the average cost of
supply, while those above 90 Units are charged at Rs 26.50 or higher, significantly
above the average cost of supply.
Energy and the Economy
111
interests as self-generation at small scale, though would be cheaper for
the high-end consumers facing high electricity tariffs from the grid,
would not have economies of scale and thus would be more costly per
kWh in average to the national economy, and also would be
environmentally harmful if resorted to diesel generators. On the other
hand, the socio-economic justice of granting below-the-cost tariffs for
the new low-end consumers, brought into the electricity grid supply
under the coverage expansion drive, becomes questionable, if such is
to be compensated through supplementary revenues earned by
practicing high tariffs for the existing consumers over and above 90
Units of consumption per month. While it is economically rational to
charge high from high-end consumers owing to which over-and-above
basic consumption the high cost generators have to be operated,
particularly in the peak times, a counter argument could be construed
that it would be unfair to penalise them again with high tariffs. It is
they who have been paying the CEB a tariff above the cost throughout
(at least up to mid-1990s) to expand the system to accommodate the
new entrants, and that it would be those new entrants who are
responsible for the necessity to run expensive generators in the peak
periods rather than the high-end but long-standing customers of the
CEB. It is therefore evident that the tariff setting, particularly in view
of recovering costs of supply, becomes a complex politico-economic
dilemma, which gives rise to an up-ward rigidity of electricity tariffs.
It is in this context that the domestic sector tariff increase announced
by the CEB with the concurrence of the PUCSL in 2013 was
substantially reversed under social pressure through a politically
guided concession granted on May 1st 2013. The tariff levels for
consumption between 1 to 30 Units and between 31- 60 Units

Emerging Trends in Post- Conflict Societies: Challenges and the Way Forward Sri Lanka Economics Research Conference 2014
112
stipulated by the authorities were thus reduced to Rs 3 per kWh and Rs
4.70 per kWh respectively, while the tariff levels for consumption
beyond 60 units were raised. Table 2 summarises the domestic sector
tariff structure before and after the May Day concessions.
Table 1: Tariff Structure on Domestic Sector, Before and After May 01st, 2013
Source: PUCSL
In this tariff structure, the entire range of consumptions up to 90 units
a month could be considered “subsidised” as the highest rate of Rs 12
per kWh applicable for any consumption up to that level is below the
average cost of supply.
A controversial aspect examined in this study is the proposal to charge
the total consumption at the tariff stage applicable for the highest Unit
instead of applying the (state by stage tariff for consumptions
belonging to each such block. The main argument against such a policy
would be the abrupt jump of the bill if a marginal unit is consumed
over a tariff boundary. This, according to critiques, is unfair. On the
other hand, one prominent counter-argument would be the necessity to
Consumption Block
Tariff Rate
(Rs/kWh) Consumption Block
Tariff Rate
(Rs/kWh)
All Consumption Levels Consumption upto 60 Units per Month
00 - 30 Units 5.00 00 -30 Units 3.00
31-60 Units 6.00 31-60 Units 4.70
61-90 Units 8.50
91-120 Units 15.00 Consumption above 60 Units per Month
121-180 Units 20.00 00-60 Units 10.00
181-210 Units 24.00 61-90 Units 12.00
211 -300 Units 26.00 91-120 Units 26.50
301-900 Units 32.00 121-180 Units 30.50
Over 900 Units 34.00 Over 180 Units 42.00
Tariff Structure Authorised by PUCSL on
April 20, 2013
Final Tariff Structure Implemented after
Concessions granted on May 1, 2013

Energy and the Economy
113
address the “anti-equity bias” of high end consumers paying the same
concessionary tariff on the first few blocks of consumption. Further,
the substantial jump of the bill on consumptions slightly above the cut
off levels would, at least theoretically, incentivise electricity
conservation owing to substantial savings to secure by managing
consumption below the cut off. This policy suggestion,11 though was
not fully implemented, could be observed reflected in the charging of
flat rate of Rs 10 per unit for the totality of consumption from zero,
when the consumption level surpasses 60 units per month.
The crisis is therefore evident. Welfare requirements call for low rates
applied at least on low-end consumers. Any shortfall of revenue
destroys supply economics, or, if financed through the Treasury, would
finally fall on the general public, including those who even do not have
electricity connections to their residences. If charged on the high side
consumption, including the commercial sector, the competitiveness
would be lost. The 25% reduction of tariffs across-the-board
announced in September 2014 would further aggravate this situation.
There appears no solution for this crisis in the short run; but in the
medium to long term, managing the supply cost structure and possible
economics could be explored.
The Sri Lankan electricity generating system gradually became
increasingly comprised of costly thermal power.12 The energy costs
would be Rs 40 and Rs 27 per kWh if generated by Diesel Gas
Turbines and Diesel Combined Cycle plants respectively while it
11A previous attempt to implement such a policy was once rejected by the Courts.
12 Particularly, Furnace Oil and Diesel fired power plants

Emerging Trends in Post- Conflict Societies: Challenges and the Way Forward Sri Lanka Economics Research Conference 2014
114
would be around Rs 20 per kWh for furnace oil technology. In contrast,
hydro power plants, the dominant mode of electricity generation until
early 1990s, generate electricity at almost zero energy cost.
It could be perceived that this was an outcome of the failure at policy
level to invest in low-cost power generation technologies, such as coal
power (having an energy cost of around 8 Rs per kWh), even though
such was recommended since early 1980s as per the Long Term
Generation Expansion Plan (LTGEP) of the CEB. The ideological
position that the electricity industry could be driven by the market
forces appeared to have prevented State sector investment coming into
such new power generation capacity (other than in hydro power
plants). The resultant increased dependence on private sector
Independent Power Producers (IPPs) since mid1990s led to the gradual
injection of small scale oil-fired power plants, which were less capital
intensive, even though their costs of generation were much higher.13
Such high costs were passed on to the CEB through “power purchase
agreements” signed between the CEB and the IPPs while guaranteeing
a “cost-plus” power purchase price tagged to oil prices. That amounted
to ensuring profits for IPPs, while sandwiching the CEB between the
power-purchase agreement driven cost on the one hand and the
inability to pass that cost over to the consumers by way of increased
tariffs on the other. This was a clear formula for financial disaster, as
warned by the Department of National Planning in a confidential
13Private investors naturally preferred faster pay-back periods than investing in
such technologies as coal power with high capital intensities and longer pay-back
periods in spite of their lower operating costs.
Energy and the Economy
115
policy analysis submitted to the Government in 1996 (Gunaruwan,
1996). In fact, the analysis predicted that Sri Lanka would lose its
hitherto enjoyed comparative advantage of having low electricity
tariffs owing to this increased dependence on IPPs. The subsequent
deterioration of the economic strength of the CEB (which had financial
reserves amounting to Rs 2.3 billion by 1996), its current heavy debt
stock, and down-ward rigidity of costs of generation, were results of
this choice of inappropriate strategy opted for by the policy makers
against that professional advice.
Sri Lanka lately has taken steps to invest in coal power plants, and the
first three stages of the Norochcholai system (3 x 300 MW capacity)
is now connected to the grid. While this new technology should help
bring down the average cost of generation, several intricacies
associated with the plant design and the technology has prevented the
country from securing the maximum cost reduction benefits from it.14
While the technical reasons for this sub-optimality are beyond the
scope of this study, the fact that the coal power plant is inappropriate
for peaking purposes,15 does not become a substitute for the expensive
diesel-based operation during peaks, but rather it becomes a substitute
for the less costly base-load plants. The plant designed with 300 MW
turbines, instead of many numbers of smaller turbines, also has
14 As per Minister Ranawake, the true cost per kWh generated by Norochcholai
plant in 2102 has been 27.88 Rs/kWh owing to its under-loaded operation and
technical failures. (http://www.youtube.com/watch?v=wAwlmuQdhNQ)
15 Owing to the inability to frequently shut down and re-start depending on the
daily demand patterns.

Emerging Trends in Post- Conflict Societies: Challenges and the Way Forward Sri Lanka Economics Research Conference 2014
116
significantly affected its operational loading, thus preventing the
system obtain energy at the lowest possible cost from the plant.
The coal technology itself is not free from disadvantages either. It is
import dependent as much as oil, and would be vulnerable to
international fluctuations of coal prices. Increased global demand for
coal could raise international coal prices, thus potentially negating the
economic advantages coal power has in the medium to long run. Coal
technology does not support the energy self-reliance objective either,
which should be a strategic priority for country having lost her high
degree of energy self-reliance enjoyed when the system was run almost
exclusively on hydro-power.
It is in this context that the policy focus on renewable energies
becomes important. Studies have already shown that Sri Lanka has
nearly 4000 MW of unexploited mini and micro-hydro capacity, a
substantial wind power development potential, and a competitive
advantage in going for biomass energy on a commercial scale. It has
been revealed also that biomass and wind power technologies are fast
improving in their capabilities that the specific cost of generation
through such technologies are fast coming down. Economics with
multiplier effect of foreign exchange saving for domestic consumption
or investment purposes alone would make biomass and wind
technologies supersede coal power generation in the medium run
(Gunaruwan, 2014). Solar energy also is promising in the Sri Lankan

Energy and the Economy
117
climatic conditions.16 Such innovations would enable the system to
become self-reliant, environmentally sustainable, while bringing down
the average cost of electricity generated within the economy.
Conclusions
The outcome of the policy analysis enables recommending three
strategic directions for policy consideration. First, the short-term
electricity pricing policies adopted should not be leading to further
aggravation of the crisis. The tariff structure and Treasury endowments
should be so determined that the financial health of the Utility is not
compromised, and that the basic energy empowerment of the poor
segments of the society is ensured. Second, the inefficiencies in the
system should be addressed so that the power plants operating in the
system are dispatched effectively with maximum loads to keep the
specific generation costs low. Third, reliance on the IPP model has
proven disastrous in the Sri Lankan context, and thus should not be
considered for financing future capacity additions, particularly with
regard to wind projects currently under scrutiny. It is economically
disadvantageous to bind the Utility on a power purchase contract when
it has no political or economic flexibility to determine the tariffs on a
“cost plus” basis. Last, the system should be developed along the
economically optimum path so that the average cost of power in the
system is gradually reduced, enabling it to overcome the current
financial and economic crisis. The renewable technologies,
particularly wind and biomass power generation, could be candidates
for consideration as they seem offering techno-economic feasibility
16 Solar photovoltaic for small scale remote consumption, in particular.

Emerging Trends in Post- Conflict Societies: Challenges and the Way Forward Sri Lanka Economics Research Conference 2014
118
and environmental sustenance, while, at the same time ensuring energy
security, self-reliance and lowering specific costs of power supply in
the long run.
References
1. Central Bank of Sri Lanka (2013), Annual Report, Colombo.
2. Ceylon Electricity Board (2013), “Explanatory Note: Revenue-
Electricity Tariff Revision”, Colombo.
3. Ceylon Electricity Board (1999), “Long Term Generation
Expansion Plan 1999-2013”, Colombo
4. Ceylon Electricity Board (2000 and 2010), Statistical Digest
Report, Colombo
5. Ferdinando, M.M.C and Gunawardana, R.J (2012) “Electricity
generation from renewable energy in Sri Lanka: Future
Directions”, Ceylon Electricity Board, Colombo.
6. Gunaruwan, T L (1996), Policy Analysis and Recommendations
submitted to the Government (an unpublished document),
Department of National Planning, Sri Lanka.
7. Ministry of Power and Energy (2008), “National Energy Policy
and Strategies of Sri Lanka”, Colombo.
8. Morimoto, R and Hope, C (2001) “The impact of electricity supply
on economic growth in Sri Lanka”, Judge Institute of Management,
Research paper.
Environment and Sustainable Development
119
Session-4 Environment and
Sustainable
Development

Emerging Trends in Post- Conflict Societies: Challenges and the Way Forward Sri Lanka Economics Research Conference 2014
120
Environment and Sustainable Development
121
[S4/01] The Importance of Solid Waste Management for
Sustainable Development: A Study of Solid Waste
Management for Sound Environmental Development in
Hambantota Municipal Council, Sri Lanka.
Asiri D Vitharana
University of Ruhuna, Matara, Sri Lanka
_______________________________________________________
Abstract
Sustainable development (SD) has become a catch phrase in global
development agendas. SD is a matter of environmental conservation
followed by socio- economic development. Development and
environmental practitioners see Solid Waste Management (SWM) as
a compulsory towards Sustainable development. This study explores
the importance of SWM for SD in Hambantota Municipal Council
(HMC) in Sri Lanka. A mixed methodology was used to gather
information. Findings reveal that a SWM process may have a clear
positive impact on sound environmental development as waste
management is insufficient. The community seems little aware of its
impact on the environment or/and sustainable Development in HMC.
The study further revealed that there is little synergy between local
authorities and the communities. There are challenges of limited
resources, facilities and funds and illegal dumping in HMC. The study
suggest an Integrated SWM process, with waste separation, recycling
and composting and include SWM in to Development policies for
Sustainable Development in HMC.
Keywords: Sustainable Development, Solid Waste Management,
Hambantota Municipal Council, Sri Lanka
Emerging Trends in Post- Conflict Societies: Challenges and the Way Forward Sri Lanka Economics Research Conference 2014
122
Introduction and research problem
Countries over time experience development with growth of
industrialization, trade and internationalization. To some extent a
discussion has emerged whether this development is sustainable.
Recently, most development practitioners have focused on sustainable
development (SD) as an environmental concept placing the emphasis
on intergenerational equality focus on future development of the
world (Carter, 2001). According to World Conservation Strategy
(WCS) development depends on environmental conservation (Adams,
2009, p.275). However, the human way of life has placed a lot of
pressure on the environment because of their high consuming
behaviour which is accelerating simultaneously with economic
development. Especially, the solid wastes (SW) have become a major
consequence of development. The SW affects the natural environment
to a great extent and pose a serious threat (Anand, 2010, p.5), to
achieve Sound Environmental Development (SED) or so called
Sustainable Development (SD). Therefore, sound SW management is
one of the necessaries in each and every development process. In this
respect, the study identified SW management as one of the most
important issues which should be addressed to sustain a countries
development that meets the needs of the present without
compromising the ability of future generations to meet their own
needs.
Sri Lanka has provided a better example of this issue with new
development processes, since the environment is been challenged with
rapidly generated SW. Especially, development has accelerated
consumer behaviour and has generated a significant amount of SW in
Environment and Sustainable Development
123
recent years. According to the National Environmental Action Plan
(NEAP), management of solid waste has been identified as one of the
major challenges for sound environmental development in Sri Lanka.
Therefore, it is important to identify the importance of SWM for
SED/SD in Sri Lanka.
Presently, Hambantota district is being developed under a master
development plan. Thus, it is important to lead this development
towards SED/SD. As the SW is a significant issue with this concern,
the research considers SWM practices and its impact on Hambantota
Municipal council (HMC) to identify the importance of SWM to
formulate the ongoing development process sustainable for future
generations. Therefore, the study focuses on SWMs impact on
environment and sustainable development in the study area. The main
Research Question was to investigate how solid waste management
practices have impact on sustainable development in Hambantota
Municipal council. There, the researcher tried to identify the current
solid waste management practices and how those SWM practices
affect the local environments in HMC. With the findings, the
researcher tried to find out the correlation between SWM and SED/SD
and how the SWM can be affected to SED/SD, according to the
literature review. Furthermore, the study focused on the perceptions
of local communities about the important of SED/SD and the
importance of solid waste management for SED/SD.
Methodology
The research adopted a case study design to assess solid waste
management for sustainable development in Hambantota Municipal
council, Sri Lanka. Both qualitative and quantitative methods were
Emerging Trends in Post- Conflict Societies: Challenges and the Way Forward Sri Lanka Economics Research Conference 2014
124
used. The semi structured interview, self-completion questionnaire,
focus group discussions and non-participation observation
instruments were used to collect data. Government reports, municipal
council reports and many other documents from different
organizations and academic papers regarding waste management and
its impact on the environment supported to collect secondary data.
Self-completion Questionnaires (SCQ) have been used to collect
quantitative data followed by qualitative data. Random sampling was
used to select 69 households and 59 business population for SCQ,
within 5,852 households and 412 business places with expected errors
0.12%.The sample size was determined by using a mathematic
function ( 𝒏 =𝑵
𝟏+ 𝑵(𝜶)^𝟐 ). Purposive sampling is used to select
participants for the interviews and focus groups and self observation
areas. Qualitative data were analysed with the thematic analysis
approach, where the researcher looked for patterns to build up themes.
When the final classification of the themes had been constructed, a
discussion of the findings was done with regard to the literature review
and the data from documents reviewed. The research findings were
supported by the qualitative data which were used to find relationships
such as deviations, correlations, regressions and tendencies of given
statistics.
Results and findings
The research findings revealed that the new development process in
the study area has significantly affected the environment with rapidly
generated solid waste. Due to the lack of proper solid waste
Environment and Sustainable Development
125
management practices in Hambantota Municipal Council, the natural
environment and eco-systems have been considerably affected. The
research statistics indicates that 77% of Households (HH) and 91 %
of Business Places (BP) in the study area empty SW daily. However,
there are issues with unauthorized waste disposal practices due to the
lack of proper waste management process in HMC. 81% of HH and
43% of BP dispose their waste in to unauthorized places. There are
issues with the unavailability of public waste bins (Only 4% for HH
and 17% for BP are available). HMC waste collection process was
identified as ineffective and inefficient as only 19% of the HH and
49% of BP have access to waste collection tractor. Therefore, 75% of
HH and 46% of BP are not satisfied with the waste management
process by HMC. Moreover, the lack of waste separation and
recycling practices, the absence of sanitary land filling and inadequate
processes by Hambantota Integrated Solid Waste Management Centre
are significant. The absence of practical usage of regulation and laws
is identified as a barrier to residents engaging in proper waste
management processes, because the council could not enforce these
practices.
Therefore, the lack of proper SWM practices has significantly affected
the natural environment and finally the Sound Environmental
Development (SED) in HMC. The relationship between these waste
management practices and environmental impacts were significant
with research findings. Moreover, the research revealed that the lack
of public awareness, lack of environmental education and lack of
sufficient information about SWM and its impacts has significant
correlations. Awareness about SWM impact on sound environmental
development or/and sustainable development is seemingly low. The
Emerging Trends in Post- Conflict Societies: Challenges and the Way Forward Sri Lanka Economics Research Conference 2014
126
study reveals that most of the community members do not have clear
ideas about sustainable development or sound environmental
development. It is because most of the development processes have
no concern on promoting sustainable development in action.
However, 75% of HH and 78% of BP think environmental impacts
could be minimized with proper waste management. Higher
proportion of the respondents agreed that solid waste management
practices should be developed in Hambantota area for sustainable
development. As a percentage 71% of householders and 68% of
business personnel agreed to the point. Therefore, the study identified
that lack of proper SWM practices have considerably affected the
Natural environment and ecosystem, and because of that, the SD is
been challenged. Hence, a proper SWM practices is important for the
sustainability of new development process.
Conclusions, implications and significance
The Research Study identified SWM as one of the important issues
which should be addressed for sound environmental development
contributing to knowledge by determining the importance of SWM for
SED/SD. The research implicate that SWM process in HMC should
be developed in order to sustain the ongoing development process.
Therefore, SWM practices must be improved with waste separation
from the household level, more efficient waste collection systems, and
sustainable recovery and disposal practices. Considering the nature
and components of waste generated by households and business
places, the waste reduction, reuse, recycling and composting
processes would be more suitable in managing the challenge in the
Environment and Sustainable Development
127
study area. Public education, awareness and properly planned waste
management programs also need to be introduced into the current
waste management system. Especially, awareness programmes must
be conducted in order to improve the knowledge about the importance
of sound environmental development/Sustainable development and
the impact of SWM on it. Since the development process has
accelerated the generation of SW in the study area, it is necessary to
implicate SWM policies in to development projects.
The strength of this research study is the case study’s setting which is
the newly developed area, HMC, Hambantota, Sri Lanka. Further, this
research study incorporates the views of the HMC community to
explore their level of understanding of Solid Waste Management,
environmental and sustainable development. This is strength because
community views have been largely examined with the research.
References
1. Adams, W. M., (2009). Green Development: Environment and
Sustainability in a Developing World, 3rd Ed, Routledge
Publication.
2. Anand, S., (2010).Solid Waste Management, Mital publication.
3. Carter N., (2001). The Politics of the Environment, Cambridge
University Press.
4. Hosetti, B.B., (2006). Prospects and Perspective of Solid Waste
Management, New Age International

Emerging Trends in Post- Conflict Societies: Challenges and the Way Forward Sri Lanka Economics Research Conference 2014
128

Environment and Sustainable Development
129
[S4/02] Excessive Usage of Chemical Fertilizer in the
Paddy Sector of Sri Lanka: An Economic Argument for
Environmentally Sustainable Policy Intervention
T Lalithasiri Gunaruwan
Department of Economics, University of Colombo, Sri Lanka
_______________________________________________________
Key Words: Chemical fertilizer, Subsidy, Paddy, Excessive use,
Environmental damage, Policies
Introduction
In the present day context, chemical fertilizer is considered to be an
essential input to agricultural activities, without which the
productivity of the sector and the value creation are widely believed
to be sub-optimal. This input, however, has its negative consequences
as it could pollute water, both surface and ground, and also could lead
to food contamination. Besides, it is costly and corresponds to a
significant share of cost of agriculture produce, and also is associated
with a significant annual foreign exchange outflow from the economy.
Thus, chemical fertilizer is considered to be a “necessary evil” in
agriculture.
However, the beneficial effect of chemical fertilizer is not directly
proportional to the quantities of usage. More quantities of application
in agriculture do not necessarily mean more output, more so in the
long run [8]. Thus, any excessive use, in the hope of having greater
Emerging Trends in Post- Conflict Societies: Challenges and the Way Forward Sri Lanka Economics Research Conference 2014
130
benefits, could amount to waste, and also an unwanted environmental
headache with no associated benefit.
It is this aspect of chemical fertilizer use in agriculture that was studied
in the present research. The objective was to estimate any “excess use”
of chemical fertilizer, based on the levels recommended by the
Department of Agriculture, and thereby to estimate the potential
economic benefits that could be envisaged if such excessive use could
be reduced through environmental intervention in the deployment of
fertilizer in the paddy sector.
Materials and Methods
The research gathered secondary data from the National Fertilizer
Secretariat, the Department of Agriculture, and the Central Bank of
Sri Lanka pertaining to quantities of application of fertilizer as against
the prescribed amounts by the Agriculture Department, enabling
estimation of the excessive use. It also surveyed literature to fathom
the environmental impact of chemical fertilizer use. The direct
economics corresponding to avoidance of any such excessive usage
was thus assessed. Policy directions which would lead to this end were
also discussed.
Results and Discussion
The results revealed that the usage of chemical fertilizer in the Sri
Lankan Paddy sector, is much more than the recommended quantities.
Figure 1(a), (b), (c) demonstrate the district-wise patterns of excess

Environment and Sustainable Development
131
usage of TSP, Urea and MOP, the three main fertilizer types
administered in paddy cultivation.
Figure 1(a): District-wise Excess Use of Chemical Fertilizer – 2012
Figure 1(b): District-wise Excess Use of Chemical Fertilizer – 2012
URE
A

Emerging Trends in Post- Conflict Societies: Challenges and the Way Forward Sri Lanka Economics Research Conference 2014
132
Source: Author’s estimations using data published by the Department of Agriculture [1]
Figure 1(c): District-wise Excess Use of Chemical Fertilizer – 2012
The above mirrors the over-usage of chemical fertilizer in the paddy
sector, which is disproportionately high at times, more than double the
amounts recommended by the Agriculture Department.17 Particularly
high excesses are found in the irrigated dry zone areas (with regard to
TSP and MOP) and in the Wet Zone (with regard to Urea), while the
only significant under-usage is recorded pertaining to MOP and in the
rain-fed Wet Zone. The downward revision of recommended levels
over the years tends to question the “short-term yield optimality” of
17 The amounts recommended over the years by the Agriculture Department have
been decreasing, and the present study adopted, as the basis of analysis, the
recommended levels for 2013.
MO
P

Environment and Sustainable Development
133
even the currently stipulated quantities, while the diminishing
marginal returns on incremental application at constant marginal costs
would establish the “economically optimum” levels much below the
“short-term yield optimal” levels, the combined effect of which, even
though beyond the scope of this study, could possibly put the actual
over-use even higher than these estimates. Nevertheless, any amounts
used over and above the stipulations (assuming their “yield
optimality”) would not lead to a corresponding augmentation of
yields, and such wasteful “excess use” would undoubtedly be
wasteful, and would amount to nothing but paying through scarce
resources to produce environmental ill-effects such as water pollution,
food contamination and soil degradation in the long-run.
According to Dissanayake and Chandrajith (2009), for instance,
Phosphate rocks by their very geological and mineralogical nature
contain a host of environmentally hazardous chemical elements such
as Cadmium, Lead, Mercury, Uranium and Arsenic, which, through
fertilizer use, contaminate agricultural soils [5]. This was supported
by Rajapakse (2013) who found high Phosphate and Nitrate contents
in ground water in the agricultural areas [7]. Uranium, apart from its
radiotoxicity, is chemotoxic. Cadmium is listed among the most
dangerous elements in fertilizer,18 particularly upon the discovery of
its association with the disease called ‘Itai-Itai’. Several other
diseases also are known to be caused by the excessive presence of
these toxic elements; gastrointestinal, pulmonary and kidney ailments
18 Cadmium is known to be present in pesticides as well. Jayatilake et al (2013)
concluded that chronic exposure of people to Cadmium (reflected by the
significantly high urinary excretion of Cadmium in patients) would be a potential
cause behind CKDu in largely agricultural areas of Sri Lanka [6].

Emerging Trends in Post- Conflict Societies: Challenges and the Way Forward Sri Lanka Economics Research Conference 2014
134
being noteworthy [5]. Evidence also has been found to suspect the
presence of Arsenic in ground water as a potential causal factor for
Chronic Kidney Disease of unknown etiology, or CKDu [4].
Chandrajith et al (2011) believe that the unique hydro geochemistry
of the drinking water could be closely associated with the incidence
of this disease, thereby leading to suspect water pollution as one of the
main causal factors [3].
In spite of this evidence, paddy farmers appear continuing to use
chemical fertilizer in excessive quantities. Few inducements could
possibly be behind this trend, including (a) the false belief that more
use of fertilizer, even beyond the specified levels, would produce
greater crop yields19, (b) the fertilizer subsidy20 keeping the prices
very low and driving the demand up, and (c) the long-term nature of
environmental ill-effects, thus making them ineffective as
“deterrents”. An explicit strategic action plan therefore would become
necessary to curb this wasteful excess use of chemical fertilizer. Such
will be a “win-win” strategy, as there would be no physical production
loss, while the society stands to gain all associated direct economic
(reduced wasteful expenses including import bills) and environmental
(mainly, reduced soil and water pollution) benefits.
19 Long term effectiveness of chemical fertilizer in producing high crop yields is
questionable, according to research conducted at Batalagoda-Sri Lanka. Rice yields
have shown a declining trend where Nitrogen was applied (from 7 to around 4 tons
per ha), while they remained unchanged at around 3.5 Tons per ha in plots with no
Nitrogen treatment [8]. This makes “high yields” obtained through fertilizer
applications an “unsustainable phenomenon”. Thus, cost incurred in foreign
exchange would be for “damaging” the soil quality of paddy lands in the long-run. .
20 A bag of 50 Kg of fertilizer is made available to farmers at Rs 350, the true cost
of which to the economy would be approximately Rs 3,000, implying a subsidy of
nearly 90% of the cost to the economy of such fertilizer supplies [2].

Environment and Sustainable Development
135
The research studied the direct economics associated with such a
strategy in two stages, namely the estimation of (a) avoided subsidy
bills on public coffers, and (b) potential foreign exchange savings.
Potential of Savings of Subsidy to Public Coffers
The subsidy shouldered by the public coffers on the above estimated
wasteful excessive use of fertilizer is a preventable cost, and such
prevention thereby would be potential financial saving to the Treasury
securable through a well-conceived and implemented strategy. This
potential benefit could be worked out by applying the subsidy element
of approximately Rs 2,650 per bag of chemical fertilizer, and the
results are summarized in the Table 1.
Table 1 : Savings of Subsidy by Eliminating Wasteful Excess Use of
Fertilizer in Paddy Sector
TSP UREA MOP TOTAL
Actual purchase of chemical
fertilizer in 2012 (MT)
94,046 276,934 9,488
Share of Total imports 86% 70% 66%
Excess purchase in the paddy sector
(MT) #
35,164 43,880 23,971 103,015
MT
Subsidy per MT of Chemical Fertilizer Rs
55,000
Potential savings of fiscal burden by reduction of wasteful excess
usage in 2012
Rs 5.64
Bn
Potential savings as a share of total Transfer payments in 2012 3%
Sources : (a) Central Bank Annual Report – 2013 [2], (b) Agricultural
Statistical handbook [1]
Emerging Trends in Post- Conflict Societies: Challenges and the Way Forward Sri Lanka Economics Research Conference 2014
136
Note: # All island averages were assumed applicable to districts where the
actual fertilizer usage intensity is not made available to the study.
This implies that prevention of wasteful excessive use of fertilizer in
the paddy sector could save nearly Rs 6 Billion (or nearly two-and-a-
half percent of the total transfer payments in 2012) if the excess
procurement of fertilizer in the paddy sector could be prevented.
Potential Savings of Foreign Exchange
The excess of fertilizer bought in the paddy sector also is associated
with wasteful drainage of foreign exchange as almost all chemical
fertilizers are imported. Given that the CIF price of fertilizer in 2012
was USD 486 per Metric Tons, the elimination of the wasteful use of
over 100,000 MT of chemical fertilizer would have saved nearly USD
50 Mn of foreign exchange to the economy, amounting to nearly 2%
of the total foreign debt service payments in 2012.
Moreover, the expenditure in foreign exchange is resources drainage
out of the economy, which otherwise could be spend within the
domestic economy generating a spiral of effective demand creation,
thus leading to what is called the multiplier effect. Therefore, the
actual economic effect of such foreign exchange savings on the gross
domestic product of the economy is bound to be many times greater
than the direct foreign exchange savings.

Environment and Sustainable Development
137
Political Economy of Fertilizer Use
Agriculture sector still has a very significant presence in the Sri
Lankan socio-economy and polity, even though the sector’s share in
the country’s GDP (11% in 2013) and exports (25% in 2013) has
gradually reduced over the years [2]. The provision of livelihoods to
millions of rural people, the retarding effect over the urbanization
pressure, and the role played in the domain of food security, have
made the sector (particularly the paddy sub-sector) increasingly
recognized as socio-economically and politically strategic.
Furthermore, strengthening the agriculture sector is explicitly
envisaged by the Government to enhance the living conditions of
farming communities and also to promote industries and exports based
on post-harvest economic activities.
It is therefore socio-politically important that the encouragements
provided to agriculture, particularly to paddy sector, are maintained.
Any curtailment of subsidies is bound to be politically sensitive. Thus,
a strategic reduction, and eventual elimination, of wasteful excessive
use of fertilizer appears to be the only politically feasible niche open
to the policy makers. Even the farmers would find it difficult to resist
such a strategy as wasteful use, at however much subsidized price,
would still be a cost to them as well.21
A few strategic interventions could be proposed in this regard. First,
the awareness of the potential environmental and long-term soil
21 However, it is believed that paddy farmers sell a portion of their excess
procurement of fertilizer to other agricultural activities. Resistance could thus be
anticipated as any rationalization would deprive farmers earning this undue profit.

Emerging Trends in Post- Conflict Societies: Challenges and the Way Forward Sri Lanka Economics Research Conference 2014
138
productivity damage may be created among the paddy farmers. This
could be attempted through agricultural extension services, and also
through media campaigns. Second, the paddy farmers should be
issued with chemical fertilizer at subsidized prices only up to the
techno-economically optimum levels and based on actual area
cultivated. Succeeding in this, though would be subject to the
effectiveness of managing fertilizer supply chain, would help reduce
actual deployment of fertilizer inputs in the paddy fields, and thus
would reduce environmental ill-effects. Third, an active promotion of
organic fertilizer (could be produced locally by way of municipal
waste composting) could be envisaged, to the extent that any subsidy
granted on chemical fertilizer made conditional to a certain
proportionate mixing with organic fertilizer. The Government also
may, in the medium run, attempt to reduce the gap between the
subsidized prices of fertilizer applicable to paddy and other crops, thus
discouraging any excessive procurement in view of re-selling to other
domains of agriculture.
Conclusion
According to the above analysis, avoiding wasteful use of agro-
chemicals in the paddy cultivation emerges as a policy priority. Since
over two thirds of the total amount of chemical fertilizer imported to
Sri Lanka is purchased in the paddy sector, any reduction of wasteful
use there would have a significant beneficial impact on cost
economics in addition to environmental benefits.
Environment and Sustainable Development
139
The study revealed the possibility of (a) retaining, within the national
economy, an amount of foreign exchange worth over USD 50 Mn (or,
nearly half a percent of total export earnings of the economy in 2012),
even if the multiplier effect of such foreign exchange saving is
completely ignored, and (b) easing of public coffers to the tune of Rs
6 Bn a year (or over two- and-a-half percent of the total transfer
payments shouldered by the Government) which could be diverted to
more productive use, while (c) securing significant environmental
benefits by way of reduced contamination of soil, water and
agricultural produce. It is noteworthy that no or insignificant
investment is required to realize these benefits. Environmentally
sustainable policy intervention is therefore justified even on direct
economic grounds.
It may be worthwhile, however, to note that any such policy address
on fertilizer use is likely to be politically sensitive, and a strategic
approach would be necessary to manage potential resistance and
resentment that might emerge from the farming community.
References
1. Agricultural Statistical Hand Books (Various issues),
Department of Agriculture, Sri Lanka
2. Annual Reports of the Central Bank of Sri Lanka (Various
issues)
3. Chandrajith R, Nanayakkara S, Itai K, Athuraliya T N C,
Dissanayake C B, Abeysekera T, Harada K, Watanabe T and
Koizumi A, “Chronic kidney diseases of uncertain etiology
(CKDu) in Sri Lanka: Geographic distribution and

Emerging Trends in Post- Conflict Societies: Challenges and the Way Forward Sri Lanka Economics Research Conference 2014
140
environmental implications” , Environment and Geochemical
Health (2011) 33:267–278
4. “Chronic Kidney Disease of unknown etiology (CKDu) and
Arsenic poisoning due to Illegal pesticides”, Unpublished report
compiled by the research team lead by Prof Nalin de Silva,
University of Kelaniya, Sri Lanka.
5. Dissanayake C B and Chandrajith R, “Phosphate mineral
fertilizers, trace metals and human health”, Journal of the
National.Science Foundation, Sri Lanka, 2009 37 (3):153-165
6. Jayatilake N, Mendis S, Maheepala P, Mehtha F R and the
CKDu National Research Project Team, “Chronic kidney
disease of uncertain aetiology: Prevalence and Causative Factors
in a Developing Country”, BMC Nephrology 2013, 14:180
7. Rajapakse R R G R, “Design and Establishment of Groundwater
Monitoring Network in Sri Lanka : Component 2” (Power point
slides), Dam Safety and Water Resources Planning Project,
Water Resources Board of Sri Lanka, December 2013
8. Wickramasinghe W M A D B and Wijewardena J D H, “Soil
and Nutrient Management for Increasing Soil Fertility towards
Increased Rice Productivity in Sri Lanka”,
[http://www.goviya.lk/agrilearning/Paddy/Paddy_Research/Pa
ddy_pdf/A12.pdf].
Environment and Sustainable Development
141
[S4/03] Effectiveness and Economics of Carbon Foot-
Print Reduction in Aviation: An Analysis of Measures
Adopted by the Sri Lankan Airlines
T Lalithasiri Gunaruwan1, C D Mannawaduge2
1 Department of Economics, University of Colombo 2 Civil Aviation Authority of Sri Lanka
______________________________________________________
Abstract
Aviation is a catalyst for economic growth, a vital contributor to
world trade and also a major global employer. With these benefits
comes the impact of negative environmental externalities, mainly
through fuel combustion emissions which the service providers
around the globe recognise the need to address. This paper presents
an analysis conducted to evaluate the effectiveness of the measures
adopted by the national flag carrier of Sri Lanka (Sri Lankan Airlines)
in its mission to reduce Carbon foot print. The results revealed that
the use of navigational methods such as RNAV/PBN and the operation
of A320 aircraft under ETOPS as having had the most significant
impact among many adopted by Sri Lankan Airlines. The study also
enabled quantification of fuel saving benefits and carbon emission
reduction benefits the airline has managed to secure over the past
four-and-a-half years through the implementation such strategies.
Key Words: Airline Operational Methods, Fuel Efficiency, Carbon
Emission Reduction, SriLankan Airlines
Introduction and Research Problem
Global air transportation, including domestic and international
operations, currently represents 2% of global Carbon Dioxide (CO2)
emissions, which is increasingly becoming an environmental concern
in the backdrop of air traffic expected to grow at an annual average
Emerging Trends in Post- Conflict Societies: Challenges and the Way Forward Sri Lanka Economics Research Conference 2014
142
rate of 4.5% over the next 20 years (ICAO, 2011). The Asia and
Pacific region would contribute significantly to this trend with a
projected growth rate of 6.2% between2011-2030. Therefore, the
aviation industry is considered a notable culprit behind climate
change, and tremendous pressure has been put on the sector to find
ways to limit and reduce its CO2 and non-CO2 emissions (Sgouridis,
et al., 2011). It is in this conjuncture that Sri Lankan Airlines, the
national flag carrier of Sri Lanka, embarked on a mission to reduce its
carbon foot print by implementing a gamut of operational and
technological measures since 2010.
The current research intends to examine at length the measures
implemented in this direction by the Sri Lankan Airlines, their relative
effectiveness in reducing its carbon foot-print and their impact to the
economics of the airline.
Materials and Methods
Reducing aviation emissions whilst growing the supply capacity to
cater to the demand growth is likely to require a range of economic,
operational and technological measures implemented in combination
(Dray et al, 2010). Some of the measures, , implemented by the Sri
Lankan Airlines to reduce emission levels (SriLankan, 2013) were
appraised in this research, choosing fuel consumption intensity as the
proxy to reflect the relative efficacy of each such measure
implemented. The four measures of enhancing fuel efficiency selected,
namely (i) the replacement of the aging A320 fleets with brand new

Environment and Sustainable Development
143
aircrafts, (ii) the implementation of RNAV / PBN approaches to
airports wherever possible, (iii) the adoption of the new flight
planning system called LIDO for route optimisation, and (iv) the
introduction of ETOPS operations for Airbus A320 enabling the
aircraft type to be deployed on routes hitherto unauthorised,22 were
captured against each flight for the period between 2010-2014 and the
corresponding fuel consumption and the flight distance computed
using the Rockwell Collins Distance Calculator.
The Ordinary Least Square methodology was adopted to assess the
significance of measures in reducing the fuel intensity per seat-
kilometre supplied. The flights operated by the A320 aircrafts were
used for this purpose as a case analysis.
The models tested are as follows:
FCSKTOT= A + B (NEW) + C(RNAV) + D(LIDO) + E (DIST) ……………… (1)
FCSKi = Pi + Qi (RNAV) + Ri (LIDO) + Si (DIST) for each A320 aircraft “i”... (2)
where, the first model is estimated on the totality of A320 aircrafts
and the second set of models (i=1,9) correspond to each individual
A320 aircraft identified by their codes. FCSK abbreviates fuel
consumption in litres per seat km, while NEW, RNAV and LIDO are
dummy variables representing the strategic measures (whether such
were active or not, pertaining to each flight concerned). DIST denotes
the flight distance in thousand kilometres.
22 RNAV/Performance Based Navigation (PNB) (a navigational method that permits the aircraft to
operate on any desired flight path within the coverage of the station referenced navigational aids), LIDO
(a flight planning system used by the SriLankan Airlines) and Extended Range Twin Engine Operations
(ETOPS) which is a rule that allows twin engine aircraft to fly shorter distance routes with a reach for the
nearest airport within the certification level), are fuel saving measures introduced by the International
Civil Aviation Organisation (ICAO) and International Air Transport Association (IATA).

Emerging Trends in Post- Conflict Societies: Challenges and the Way Forward Sri Lanka Economics Research Conference 2014
144
The fuel consumption economics attributable to ETOPS operations
were examined by analysing the flight operations data on Singapore
(SIN), Kuala Lumpur (KUL) and Bangkok (BKK) sectors23 for the
period from 2010 to June 2014. The data pertaining to flight
operations, aircraft type, route-wise fuel consumption, and passenger
load factors required for the analysis were sourced from the databases
of the Sri Lankan Airlines.
Analysis and Results
Cross-section regression analyses were performed using the above
forms of regression models, and the validity of the models was
verified. It was found that the variable NEW had strong correlation
with LIDO and DIST, and therefore the Model 1 was re-estimated
without the variable NEW among the independent variables. The
results of the regression analyses are summarised in the Table 1.
It is evident from the above results that the use of navigational method
RNAV/PBN has been significantly influential on the fuel savings in
A320 flights in general and in each A320 aircraft individually.
Similarly, the correct sign and the high t-value associated with the
coefficient of the variable representing the distance indicate the strong
significance of fuel saving effect per seat km of longer distance flights.
This result conforms to the general expectation that longer flights
consume lesser fuel per seat kilometre than shorter haul flights.
23 It is on these routes that ETOPS have been effective in permitting shortest
trajectory A320 operation instead of larger aircrafts (such as A330 or A340).

Environment and Sustainable Development
145
Table 1: Summary of OLS Analysis Results
Model Constant NEW RNAV LIDO DIST R2 F-
Value
Total A320
(with NEW) 0.0346
8.176
(0.47)
-0.003***
(-15.36)
0.0001
(0.49)
-
0.0045***
(-52.38)
0.366 1032.43
Total A320
(without
NEW)
0.0346 -0.003***
(-15.50)
0.0002
(0.51)
-0.005***
(-63.29) 0.366 1376.61
Aircraft G 0.0346
-
0.0019***
(-5.06)
-0.0001
(-0.35)
-0.005***
(-23.60) 0.397 186.82
Aircraft J 0.0342
-
0.0025***
(-7.20)
-0.0003
(-0.99)
-0.005***
(-24.42) 0.384 202.81
Aircraft K 0.0355
-
0.0019***
(-7.08)
-0.0003
(-1.37)
-0.004***
(-30.22) 0.437 305.27
Aircraft L 0.0353
-
0.0039***
(-11.24)
0.0009
(3.06)
-0.005***
(-29.94) 0.476 306.69
Aircraft M 0.0396
-
0.0074***
(-4.62)
0.00051
(0.49)
-0.006***
(-9.66) 0.118 35.25
Aircraft N 0.0329
-
0.0016***
(-3.49)
-
0.00038
(-1.49)
-0.003***
(-21.57) 0.480 263.30
Aircraft O 0.0321
-
0.0016***
(-4.93)
0.00002
(0.142)
-0.003***
(-26.63) 0.589 377.96
Aircraft P 0.0328
-
0.0025***
(-7.05)
-0.0001
(-0.05)
-0.003***
(-27.83) 0.574 340.85
Note : ***, ** and * stand for 1%, 5% and 10% levels of significance, respectively
The insignificance of the coefficient of the variable NEW in the Model
1 enables inference that the replacement of new A320 aircrafts for old
A320s has had no significant fuel saving effect. It is however possible
that any effect is camouflaged by the Distance variable, which is
further evidenced by the strong correlation between the two
determinant variables, necessitating the removal of one of the
variables from the analysis. The model without the variable NEW was
retained in place of the Model 1.

Emerging Trends in Post- Conflict Societies: Challenges and the Way Forward Sri Lanka Economics Research Conference 2014
146
It is noteworthy that the strategic variable LIDO did not show any
significant fuel saving influence with regard to A320 flights, and
therefore, the measure could not be considered as effective in reducing
the carbon foot-print in the Sri Lankan Airline flight operations on
A320 aircrafts. This might be owing to the fact that an actual flight
path would be largely circumstantial than the optimum plan suggested
by LIDO. Nevertheless, the reasons for such ineffectiveness, and
whether the measure has been effective on other types of aircrafts,
need further investigation.
The strategic variable ETOPS could not be tested in the above analysis
as the measure concerns permitting A320 aircrafts to operate on the
Bangkok, Kuala Lumpur and Singapore routes hitherto served by
larger aircrafts such as A340s and A330s. Besides, fuel intensity per
seat km could not be used as a comparative measure in this regard as
different types of aircraft have different seating capacities and seat-
km supply economics could not be compared in isolation without
examining the corresponding demand conditions represented by the
load factors. Therefore, the fuel consumption per aircraft kilometre in
the three routes for which ETOPS was granted was examined over the
period between 2010 and 2014, where the operation of A320 aircrafts
represent the ETOPS enabled flights. The Figure 1 summarises the
fuel consumption per aircraft kilometre in the three sectors by aircraft
type and their evolution since 2010.
It becomes clear from this analysis that the operation of A230s is much
more fuel efficient than A330s or A340s per flight in the three sectors.
Larger aircrafts (A340s or A330s) should be operated only if

Environment and Sustainable Development
147
economies of scale could be aimed at in high demand conjunctures.
The demand patterns as reflected by the load factors recorded in the
three sectors (Figure 2) indicate that the chances of such “high demand
conditions” necessitating deployment of larger capacity aircrafts
would have been minimal; the maximum load factor observed being
slightly over 70%.
Figure 1: Fuel Consumption per Aircraft Kilometre for A320, A330 and
A340 Aircraft
Figure 2:Load Factor Distribution for SIN, KUL and BKK Sectors for Year
2010-2014
Note: Higher load factors in the BKK sector for A340s and A330s as Hong-Kong
passengers are included

Emerging Trends in Post- Conflict Societies: Challenges and the Way Forward Sri Lanka Economics Research Conference 2014
148
Thus, it could be inferred that the A330and A340 aircrafts were
operated in the three sectors not because of heavy passenger demands
calling for larger craft, but because of the lack of permission for A320s
to operate across Indian Ocean over the shortest distance to these three
destinations. Hence, the Sri Lankan Airlines appear to have benefitted,
in terms of fuel economics, from the ETOPS approval to operate A320
aircrafts to fly, firstly 90 minutes and thereafter 120 minutes, away
from an airport for emergency landing, which has enabled the airline
achieve the three sectors with increasing share of operation by A320
aircrafts ever since 2012.
Table 2: Fuel Saving by Operating ETOPS on SIN, KUL and BKK Routes
Table 2 summarises the fuel economies that the Sri Lankan Airlines
would have secured over the past four-and-a-half years owing to
ETOPS authorisation. The fuel consumption on the three sectors (SIN,
KUL and BKK) would have been 1%, 30%, 40% and 27% more if the
mileage operated by the A320 aircrafts under ETOPS in 2011, 2012,
2013 and in first six months of 2014, respectively, had to be operated
by A330 aircrafts. These would have been 1%, 36%, 44% and 45%
more if the operation had to be done using A340 aircrafts. Therefore,
Year Km operated
on ETOS
Fuel Saved
Min (if A330 substituted) Max (if A340 Substituted)
Mn litres Percentage Mn litres Percentage
2010 2468 0.0013 < 1% 0.0041 < 1%
2011 148672 0.5497 1% 0.6941 1%
2012 4664204 16.899 30% 22.182 36%
2013 6511334 22.146 40% 26.944 44%
2014 (Jan-Jun) 4516531 8.885 27% 19.188 45%
Environment and Sustainable Development
149
it could be inferred that the ETOPS operation enabled Sri Lankan
Airlines save between 48 to 69 million litres of fuel, amounting to
financial savings ranging from 60Mnto 85Mn US dollars, over the
past four-and-a-half years.
Conclusion
Implementation of RNAV/PBN navigational methods and the use of
ETOPS facility have provided the airline with a significant fuel saving
over other measures. This study also has found that LIDO flight
planning method, though identified among green strategies by the
airline, has been unsuccessful in significantly economising fuel.
On ETOPS alone, the airline has been able to save 48 to 69 million
litres of fuel over the past four and a half years, corresponding to a
CO2 emission reduction of approximately 122,481 to 174,345 tonnes
of CO2. This significant reduction of carbon foot-print has enabled the
national carrier to fulfil its objective of moving towards a green airline.
References
1. Dorbian, S. C, Wolfe, J., P., Waitz, A., I, (2011), Estimating the
climate and air quality benefits of aviation fuel and emission
reduction, Journal of Atmospheric Environment, Vol. 45, pp.
2750-2759
2. Dray, L., (2013), “An analysis of the impact of aircraft lifecycles
on aviation emission mitigation policies”, Journal of Air
Transport Management, Vol. 28, pp. 62-69
Emerging Trends in Post- Conflict Societies: Challenges and the Way Forward Sri Lanka Economics Research Conference 2014
150
3. International Civil Aviation Organisation, (2010), “ICAO
environmental report 2010”, accessed on 20 September 2013,
available on http://www.icao.int/environmental-
protection/Pages/EnvReport10.aspx
4. International Civil Aviation Organisation, (2011), “Guidance
material for the development of States’ action plans”, Version 1.0,
available on http://www.icao.int/environmental-
protection/Pages/environment-publications.aspx, accessed on
28September 2013
5. Sgouridis, S., Bonnefoy, A., P., Hansman, J. R, (2011), “Air
Transport in a carbon constrained world: long term dynamics of
policies and strategies for mitigating the carbon footprints of
commercial aviation”, Journal of Transportation Research, Vol
45, pp 1077-1091
6. SriLankan Airlines, (2013), “Plant Friendly SriLanka; SriLankan
Road Map to Green Sustainability”
Environment and Sustainable Development
151
[S4/04] Potential of Wild-Life Tourism Development in
Sri Lanka: An Economic Analysis
T Lalithasiri Gunaruwan
Department of Economics, University of Colombo
_______________________________________________________
Key Words: Wild-life parks, Tourism, Carrying Capacity,
Potential Economic benefits
Introduction
Wild-life parks in Sri Lanka are one of the main foreign tourist
attractions, with over 340000 visits (or approximately 25% of the total
foreign tourist visits) in 2013. Therefore, in view of achieving the
target of hosting 2.5 million foreign tourists by 2016[5], Sri Lanka’s
wild-life parks would constitute an important motive power.
Appropriately conserving and managing her wildlife reserves, Sri
Lanka, a country endowed with rich bio-diversity [7], could look
forward to exploit wildlife tourism as one of her strategic pathways
towards economic development [1][3].
Though this hypothesis is logically advanced, no quantitative estimates
are available as yet regarding the capacity of wild-life parks in hosting
foreign tourists, and thereby the exchange earning and value addition
potential. The present study was conducted with the aim of addressing
this knowledge gap.
Emerging Trends in Post- Conflict Societies: Challenges and the Way Forward Sri Lanka Economics Research Conference 2014
152
Data and Methodology
The research examined the wild-life park visitation by foreign and
local tourists and their trends over the period from 2009 till 2013.
Expert opinion and stake-holder comments also were sought to
understand the possible causes behind such trends. Park visitation
densities were used as a yard-stick to assess their further scope of
visitation growth. Attempts were also made to estimate the potential
economic gains associated with such an achievement.
Data were obtained from the Department of Wildlife Conservation, Sri
Lanka Tourism Development Authority and other relevant
publications. Comparative tabulation, Graphical examination of data
and scenario-based projections were used as analytical methods
Analysis and Results
Statistics pertaining to visitation recorded at twelve wild-life parks
over the five years between 2009 and 2013 were subject to analysis. It
was observed that six of those (Yala, Uda-Walawe, Minneriya,
Kawudulla and Wiplattuwa) account for over 70% of the total foreign
tourist visitations by 2013. Therefore, those six parks were selected for
detailed analysis.
First, the past trends of park visitation were examined to understand
the patterns of their evolution. The Figure 1 depicts the trends of (a)
the total visitation numbers and (b) the share of foreign tourists in the
total visitation over the past five years from 2009 until 2013.

Environment and Sustainable Development
153
Source: Estimations based on data obtained from the Department of Wildlife
Conservation
Figure 1: Total Visitors attracted at the selected Parks and the share of
Foreign Visitors

Emerging Trends in Post- Conflict Societies: Challenges and the Way Forward Sri Lanka Economics Research Conference 2014
154
It is noteworthy that Wilpattuwa (the largest of all parks) and
Wasgamuwa, are dismal performers among the selected parks, even
though their rich diversity of animals and forestry, and less disturbance
from tourist visitations and vehicular movements should have made
the watching experience at these parks the greatest [2]. According to
tour operators, this would have been caused by their lack of easy access
to main tourist transit routes and to quality tourist residential facilities.
However, Wilpattuwa, together with Minneriya and Uda-Walawe,
have experienced significant up-ward trends in visitation levels over
the recent past. This might be signaling the potential they offer in
expanding wild-life based tourism. Uda-Walawe, Minneriya and
Kawudulla parks, advantaged by the high certainty they offer in
elephant watching and also by their location closer to main tourist
transit routes and quality hotel infrastructure, stand attractive to tour
operators.
In a clear contrast, Yala, the park which stood out as the most preferred
wildlife tourism destination in Sri Lanka owing to the favorable
conditions it offers, appears to be gradually approaching saturation. Its
foreign visitation share also shows a relative stagnation over the years,
possibly owing to the deterrent effects caused by the increased overall
tourist visitation and vehicular movements as opined by the experts.
The latter observation is important because it possibly reflects that
Yala is gradually approaching its sustainable tourism carrying

Environment and Sustainable Development
155
capacity, 24 if not exceeding it. In the absence of scientifically
estimated “sustainable carrying capacities” specific to the selected
parks, present study used the visitation density at “saturation level”
seemingly approached by Yala to estimate the scope for further eco-
tourism development potential at other wild-life parks chosen for the
analysis. This is based on the implicit assumptions that (a) the
sustainable carrying capacity of Yala is not significantly different to
what is indicated by the visitor saturation level observed,25 and (b) the
acceptable maximum tourist visitation levels applicable to all parks
would be proportional to their square area, implying that the thresh-
hold visitation density would be the same for all parks in Sri Lanka.
Scope for Improvement
First, the total (both foreign and local) tourist visitation densities of the
selected six national parks in 2013 were calculated. Next, Yala’s
saturating visitation density was used to estimate the visitation levels
the other parks could target at under different scenarios by 2020.The
results are summarized in the Table 2.
24Carrying Capacity of an eco-tourist destinations means the maximum number of
tourist visitations it could bear without its ecological functions as well as the
quality of visitor experience being negatively affected [6].
25What is observed in Yala might be an indication of the park’s carrying capacity
being fast approached or else a symptom of “excessive visitation”. If the latter is
the case, it corresponds to carrying capacity being exceeded, causing harm to both
wild-life conservation and eco-tourism interests.

Emerging Trends in Post- Conflict Societies: Challenges and the Way Forward Sri Lanka Economics Research Conference 2014
156
Table 2: Foreign Tourist attraction Growth Potential of National Parks in
Sri Lanka by 2020 Park
and Area
(Mile2)
Total
Visits in
2013
Density 2013
(Visits/Mile2)
Foreign
Visits in
2013
Scenario A
(Visits/Yr)
Scenario B
(Visits/Yr)
Scenario C
(Visits/Yr)
Yala
(57*) 379,414
6,656 142,714
[38%]
150,081 150,081 150,081
Minneriya
(34) 80,576
2,370 34,065
[42%]
100,619 100,619 57,299
Kawudulla
(27) 36,314
1,344 15,775
[43%]
82,102 82,102 19,258
Wilpattuwa
(508) 46,551
92 8,846
[19%]
675,740 26,538 19,895
Wasgamuwa
(143) 21,336 149 934
[ 4%]
43,820 1,868 1,185
UdaWalawe
(119) 112,414
945 41,487
[37%]
307,423 307,423 61,194
Note :
(i) * : Corresponds to the area open for tourism, which is one-fifth of the total
park size
(ii) Within square brackets are foreign tourist visitation ratios, assumed
applicable even for 2020.
(iii) Foreign and local eco-tourism in Sri Lanka are assumed grown at the same
average annual rate.26
The Scenario A represents the case where all six parks reach their
maximum capacities corresponding to the saturating visitation density
estimated for Yala. A more moderate second scenario (Scenario B)
was construed where Minneriya, Udawalawe and Kawudulla would
reach the maximum visitation density of Yala, while Wasgomuwa and
Wilpattuwa respectively would double and triple their current
densities. 27 All Parks continuing to experience a linear growth of
visitation, estimated based on their visitation data during the past five
26 It is likely that this would have led to under-estimate foreign tourist visits to
wild-life parks, and there by the corresponding tourism based revenues and value
added benefits, across all scenarios examined in this study. 27Wasgomuwa has had a 12% growth in density in the past four years, while
Wilpattuwa has tripled in three years.
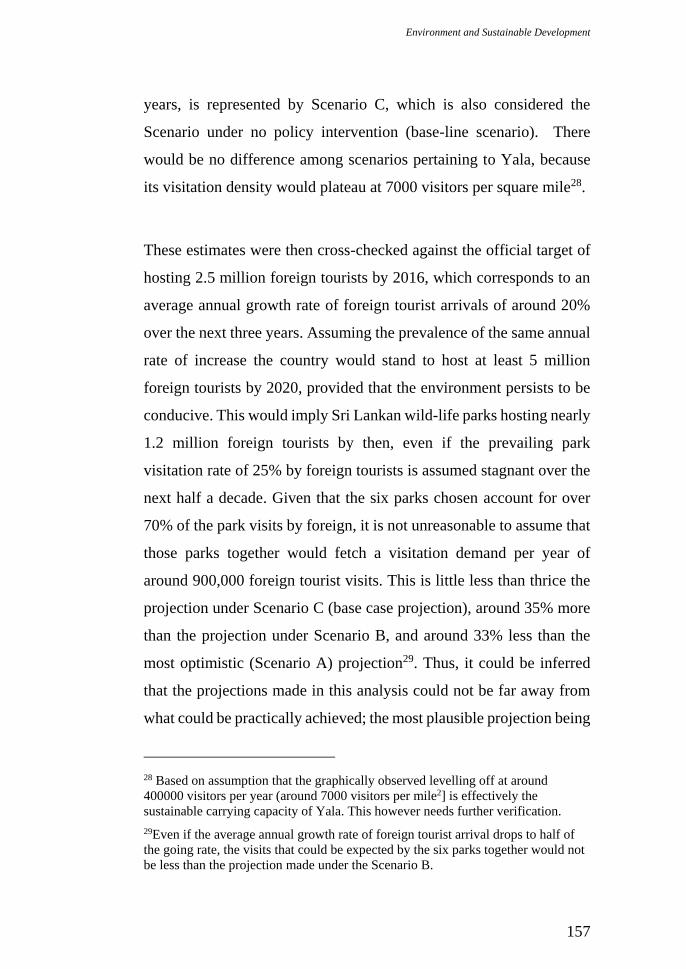
Environment and Sustainable Development
157
years, is represented by Scenario C, which is also considered the
Scenario under no policy intervention (base-line scenario). There
would be no difference among scenarios pertaining to Yala, because
its visitation density would plateau at 7000 visitors per square mile28.
These estimates were then cross-checked against the official target of
hosting 2.5 million foreign tourists by 2016, which corresponds to an
average annual growth rate of foreign tourist arrivals of around 20%
over the next three years. Assuming the prevalence of the same annual
rate of increase the country would stand to host at least 5 million
foreign tourists by 2020, provided that the environment persists to be
conducive. This would imply Sri Lankan wild-life parks hosting nearly
1.2 million foreign tourists by then, even if the prevailing park
visitation rate of 25% by foreign tourists is assumed stagnant over the
next half a decade. Given that the six parks chosen account for over
70% of the park visits by foreign, it is not unreasonable to assume that
those parks together would fetch a visitation demand per year of
around 900,000 foreign tourist visits. This is little less than thrice the
projection under Scenario C (base case projection), around 35% more
than the projection under Scenario B, and around 33% less than the
most optimistic (Scenario A) projection29. Thus, it could be inferred
that the projections made in this analysis could not be far away from
what could be practically achieved; the most plausible projection being
28 Based on assumption that the graphically observed levelling off at around
400000 visitors per year (around 7000 visitors per mile2] is effectively the
sustainable carrying capacity of Yala. This however needs further verification.
29Even if the average annual growth rate of foreign tourist arrival drops to half of
the going rate, the visits that could be expected by the six parks together would not
be less than the projection made under the Scenario B.

Emerging Trends in Post- Conflict Societies: Challenges and the Way Forward Sri Lanka Economics Research Conference 2014
158
somewhere half-way between the scenarios A and B. The results of
this analysis are depicted in the Table 3.
Table 3 : Comparison of Scenario-Based Projections against Tourism
Development Targets
2013
(Actuals)
Horizon 2016 2020
1.27 Million Total Foreign Tourists 2.5
Million
5.0 Million
341,227
(25%)
Foreign visits to national parks
(Based on the estimated total
foreign tourist visits)
625,000
(25%)
1.25 Million
(25%)
243,821
(72% of all
parks)
Foreign visits to selected six parks
(Based on the estimated total foreign tourist
visits)
900,000
(72% of all
parks)
Projections of foreign tourist visits to six parks
Scenario A (carrying capacity fully exploited)
Scenario B (less optimistic scenario)
Scenario C (Base case: Recent trends
extrapolated)
1,359,786
668,632
308,914
Thus, Sri Lankan wild-life parks could reasonably set strategies to host
around 1.2 Million foreign tourists (around 850,000 in the selected six
parks and around 350,000 in the others), while the minimum possible
fall back would be somewhere around 900,000 foreign tourists.
Potential economic gains
Economic gains associated with a wild-life tourism development drive
leading to the above projected visitation levels can be estimated in
three different stages, namely (i) direct income gains at national parks,
(ii) off-park income from tourists during their stay in the country, and

Environment and Sustainable Development
159
(iii) the multiplier effect of added foreign exchange spent within the
economy.
The above projections correspond to an additional gross foreign
exchange earning potential ranging between USD 380 Million
(minimum estimate) and USD 620 Million (most plausible estimate)
based on the same average number of days of stay (7.8) per foreign
tourist visit to Sri Lanka, and the same average foreign exchange
spending per day (USD 103) per tourist, as what was recorded in 2013.
A net foreign exchange gain of USD 300 million to USD 500Mn could
be expected if a 20% average level of foreign exchange outflow is
assumed on imported inputs.30The in-park income increase (at the
prevailing park entrance fee levels), though only a fraction of the
overall exchange gain (Rs 1 to 1.5 Billion per year), would be
substantial (between 160% and 240%) compared to current levels. The
overall positive effect on the country’s GDP of such an achievement
would be between Rs 90Bn and Rs 140Bn by 2020 in real (2013)
prices when the multiplier effect (at a multiplier of 2.2, quite closer to
the multiplier of 2.4 used on Seychelles by the World Bank [4]) also
is taken into consideration.
Conclusion
This research has successfully demonstrated that Sri Lanka has a
substantially high wildlife tourism development potential, hitherto not
30Likely to be a high side assumption, even if the outflows pertaining to capital
inputs also are included, as the outflow element on recurrent inputs is less than 10%
of the exchange earnings

Emerging Trends in Post- Conflict Societies: Challenges and the Way Forward Sri Lanka Economics Research Conference 2014
160
fully exploited. The wild-life parks, currently managed with an almost
exclusive “conservation” interest, offer significant scope for adding
economic value through sustainable wildlife tourism, to the tune of
1.3% to 2% of the country’s GDP in 2013, while the additional net
foreign exchange earning potential would be equivalent to around 1%
to 1.6% of the total foreign exchange out-flows on account of imports
to Sri Lanka in 2013, or around one-eighth to one-fifth of the total
foreign debt service payments in 2013.
The challenge, however, would be to strategies and plan for the pre-
requisites (including resources, infrastructure and marketing) for
healthy management of parks and also for hosting such high level of
foreign visitation at the wild-life parks without letting the negative
externalities nullify the eco-tourism benefits.
References
1. Environmental Sustainability in Sri Lanka – The Engine of
Inclusive Development, The World bank Group, February 2012
2. http://www.srilankainstyle.com/locations/wilpattu-national-
park/, accessed on June 16th, 2014
3. Ministry of Environment and Natural Resources, Portfolio of
Strategic Conservation Site / Protected Area Gap Analysis in Sri
Lanka, May 2006
4. Seychelles Tourism Review (2013), The World Bank
5. Sri Lanka – The Emerging Wonder of Asia: Mahinda Chinthana
– Vision for the Future, Department of National Planning,
Colombo, 2010.
6. De Silva Wijeratne, G. A Winner in the Wilds, Sunday Times
Plus, p.3, Jan 13, 2013 (www. Sundaytimes.lk/130113/plus/a-
winner-in-the-wilds-28039 html)

Industry and Service Sector
161
Session-5 Industry and
Service Sector

Emerging Trends in Post- Conflict Societies: Challenges and the Way Forward Sri Lanka Economics Research Conference 2014
162

Industry and Service Sector
163
[S5/01] Measuring industrial interdependence to find an
effective development strategy for Sri Lanka: an input-
output modeling approach
Chandika Gunasinghe
Department of Economics
University of Ruhuna, Matara, Sri Lanka
Abstract
This paper is aimed at measuring industrial interdependence using a
symmetric input-output table for Sri Lankan economy to draw relevant
policy lessons to find an effective development strategy for the country.
The input-output model is constructed for thirty aggregated industrial
sectors of the economy as a whole for the year 2006.The results
obtained for output and value added multipliers show that there are
six key industries of the Sri Lankan economy. The employment
multipliers are highest in four sectors. We found that five industries
(sectors) have strong upstream and downstream vertical integrations
with the rest of the other sectors in the economy. As the lowest average,
coefficient of variation is reported from the petroleum & chemical
products sectors andhigher prices charged on products such as petrol,
diesel etc. in this sector would probably result in higher costs to most
other sectors in the economy relatively equally. The results also reveal
that, ‘mining and quarrying, electricity, gas and water’ sector has
strong downstream linkages to other sectors in the economy, higher
prices (or taxes) charged on the products such as electricity, gas and
water would also probably result in higher costs than most other
industries in the economy. On the whole, the results emphasise the
importance of strengthening industries which have either upstream or
downstream linkages or both. However, findings should be interpreted
very carefully as the input-output model is subject to very strict
assumptions and the impact of some sectors such as education cannot
be practically measured in monetary terms only.
Keywords: an effective development strategy, input-output model,
industry multipliers, forward and backward linkages

Emerging Trends in Post- Conflict Societies: Challenges and the Way Forward Sri Lanka Economics Research Conference 2014
164
Introduction and research problem
A better understanding of the structure of a national economy is vital
for the identification and implementation of an effective development
strategy as it emphasizes the need of allocating scare resources
efficiently on sectors that generate more output, value-additions,
employment, and have linkages with the domestic economy (Frédéric,
2010). One of the best ways of developing this understanding is to
“build a data base-model (an input-output model) of the economy
which uncovers these underline structures and connections” leading to
have a complete picture of the economy (Epstein et al., 2010, p. 24-25;
Frédéric, 2010, p. 1). The multipliers (output, value added, and
employment) and linkage measures (upstream and downstream
vertical integration of sectors) derived from an input-output model are
considered as powerful tools that can be used to measure and assess
national productive system and inter-sectoral relationships of an
economy (Frédéric, 2010).
As a result of the innovation of input-output model by Professor
Wassily Leontief in the late 1930s, researchers, policy analysts and
practitioners have used (and still use) input-output models in economic
impact analysis and economic development planning specially in the
areas such as industrial, agricultural, environmental, energy,
construction, transportation, tourism and educational sectors (Xinhao
and Rainer 2007, p. 218-272). Miller and Peter (2009, p. 2) point out
that “today, in the USA alone, input–output is routinely applied in
national economic analysis by the US Department of Commerce, and

Industry and Service Sector
165
in regional economic planning and analysis by states, industry, and the
research community”. Furthermore, Baumol (2000) considers input-
output analysis as one of the most widely used applied methods in
economics. However, the studies on the use of input-output models
directed at policy related issues in Sri Lanka are, to some extent,
limited. Rameezdeen, Zainudeen and Ramachandra (2005) examined
the significance of the construction sector and its relationship between
other sectors of the economy based on input-output tables compiled
from 1970 to 2000. They argued that construction is a key sector of the
economy as the backward and forward linkage measures were
significant (above average) for this sector in forty-eight sectors of the
economy in 2000. The other studies on application of I-O analysis and
related issues include Athukorala and Bandara (1989), Hazari and
Bandara (1989) and Bandara and Kelegama (2008).
Problem statement: Aapparently, policy makers might misleadingly
tend to identify the leading sectors of the economy as the sectors whose
ratios of output and value added to GDP are high. Accordingly, they
will allocate scare resources to boost sectors based on their mere
contribution. However, it is crucial for an effective development policy
to identify channels by which a growth of a sector can support
aggregate output, income, value addition and employment creation in
the rest of the economy (Frédéric, 2010).
Following this line of reasoning, the aim of this paper is to
quantitatively measure and assess the industrial interdependence using
the latest 2006 symmetric input-output table for Sri Lankan economy
to draw relevant policy lessons to find an effective development
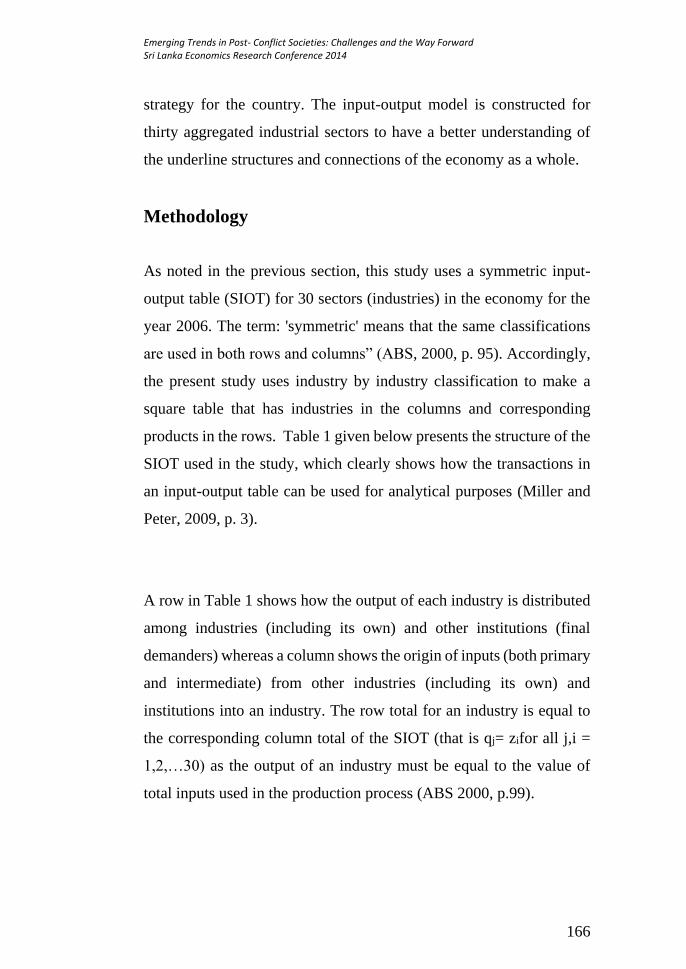
Emerging Trends in Post- Conflict Societies: Challenges and the Way Forward Sri Lanka Economics Research Conference 2014
166
strategy for the country. The input-output model is constructed for
thirty aggregated industrial sectors to have a better understanding of
the underline structures and connections of the economy as a whole.
Methodology
As noted in the previous section, this study uses a symmetric input-
output table (SIOT) for 30 sectors (industries) in the economy for the
year 2006. The term: 'symmetric' means that the same classifications
are used in both rows and columns” (ABS, 2000, p. 95). Accordingly,
the present study uses industry by industry classification to make a
square table that has industries in the columns and corresponding
products in the rows. Table 1 given below presents the structure of the
SIOT used in the study, which clearly shows how the transactions in
an input-output table can be used for analytical purposes (Miller and
Peter, 2009, p. 3).
A row in Table 1 shows how the output of each industry is distributed
among industries (including its own) and other institutions (final
demanders) whereas a column shows the origin of inputs (both primary
and intermediate) from other industries (including its own) and
institutions into an industry. The row total for an industry is equal to
the corresponding column total of the SIOT (that is qj= zifor all j,i =
1,2,…30) as the output of an industry must be equal to the value of
total inputs used in the production process (ABS 2000, p.99).

Industry and Service Sector
167
Note: Where: C.E =compensation of employees, G.O.S = gross operational surplus,
Net Tax= tax minus subsidies, TFC = total final consumption (government
+ private), GCF = gross capital formation (gross fixed capital formation
+changes in inventory), TE = Total exports, GDP(EA) = gross domestic
product (expenditure approach) and GDP(IA) = gross domestic product
(income approach).
The core of SIOT is the inter-industry transaction matrix shown in the
first quadrant (intermediate usage) where production relationships in
Table 1: Structure of the SIOT used in the present study
Industries
(outputs)
Products
Ind.
1
Ind.
2
… Ind.
30
Final
demand
Total
production
(demand) TFC GCF TE
Inte
rmed
iate
inp
uts
Industry 1 x1,1 x1,2 … x1,30 y1 z1
Industry 2 x2,1 x2,2 … x2,30 y2 z2
... … … … … … …
Industry 30 x30,1 x30,2 … x30,3
0
y30 z30
(Intermediate usage) (Final
demand)
Pri
ma
ry i
np
uts
Final
paym
ents
C.E ce1
os1
nt1
ce2
os2
nt2
…
…
…
ce30
os30
nt3
0
(Primary
inputs to final
demand)
GD
P(I
A) G.O.S
Net Tax
Imports m1m2 --- m30
(Primary inputs to
production)
Total production
(supply)
q1 q2 … q3
0
GDP (EA)
Employment e1 e2 . e3
0
Source: Constructed based on ABS (2000, p.99) and unpublished SIOT of DCS
(2006), Sri Lanka

Emerging Trends in Post- Conflict Societies: Challenges and the Way Forward Sri Lanka Economics Research Conference 2014
168
the economy are depicted by the elements, xij. For example, element
x1, 30shows how much output of the 1st industry has been absorbed by
30th industry in its current production. Final demand category made up
of elements yi shows consumption behaviour of households,
government, investors and exports. Final payment category includes
basically two variables; value added (vj)(the sum of C.E + G.O.S + Net
tax) and imports. The value added vector shows each sector’s
contribution to the GDP.
The data related to these three quadrants in the Table 1 can be
conveniently presented using matrix algebra as follows:
)1....(..................................................30
1
i
j
iji yxz
)2.........(..........30
1
jjjj
i
ijj mntgoscexq
Where zj is the total demand for output of ith industry and qjis the total
supply of jth industry. xijare sales by sector i to sector j. The row sum
of xij in equation 1 shows the total value of sales of industry ‘i’ to all
industries (including sales of industry ‘i’ as well). The column sum of
xijin equation 2is the total value of purchases done by industry ‘j’ from
all other ‘i’ industries (including purchases of output of industry ‘j’ as
well) in the economy. The next step is to obtain the direct input-output
coefficients matrix A that is made up of elements (aij). The matrix A is
obtained by dividing the elements in the industry transaction matrix
(xij) from respective column totals, qj. That is,
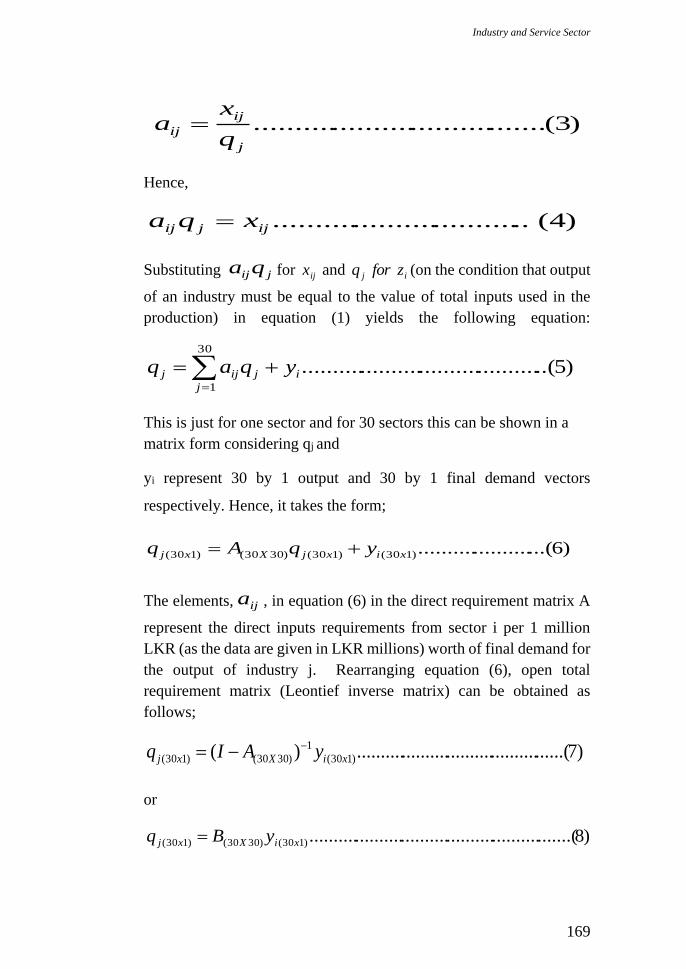
Industry and Service Sector
169
)3(.....................................j
ij
ijq
xa
Hence,
)4(................................ijjij xqa
Substituting jijqa for ijx and ij zforq (on the condition that output
of an industry must be equal to the value of total inputs used in the
production) in equation (1) yields the following equation:
)5..(........................................30
1
i
j
jijj yqaq
This is just for one sector and for 30 sectors this can be shown in a
matrix form considering qj and
yi represent 30 by 1 output and 30 by 1 final demand vectors
respectively. Hence, it takes the form;
)6...(....................)130()130()3030()130( xixjXxj yqAq
The elements, ija , in equation (6) in the direct requirement matrix A
represent the direct inputs requirements from sector i per 1 million
LKR (as the data are given in LKR millions) worth of final demand for
the output of industry j. Rearranging equation (6), open total
requirement matrix (Leontief inverse matrix) can be obtained as
follows;
)7......(........................................)( )130(
1
)3030()130( xiXxj yAIq
or
)8.......(..................................................)130()3030()130( xiXxj yBq

Emerging Trends in Post- Conflict Societies: Challenges and the Way Forward Sri Lanka Economics Research Conference 2014
170
Now the elements, ,ijb in the open total requirement matrix B in
equation (8) represent direct and indirect inputs requirements from
sector i per 1 million LKR worth of final demand for the output of
industry j.
Following the same method, but putting the row vector related to the
household sector (compensation of employees) in the primary input
matrix and the column vector of household consumption in the final
demand matrix into the industry transaction matrix (xij), closed total
requirement matrix is obtained as follows;
)9...(............................................................)131(
**
)3131()131(
*
xixxj yBq
Both B (open) and B*(closed) inverse matrices are powerful tools that
are used to measure the total impact on the economy for changes in
final demand vector y. Furthermore, these matrices are also used to
derive (open (Type I) and closed (Type II)) multipliers (output, value
added and employment) and (closed) linkage (backward and forward)
measurers.
The size of the elements of B* are larger than that of B due to the impact
of consumption induced demand on the level of output. All sectors are
required to generate increased output levels to meet the consumption
induced demand in the economy. Because of this reason, Type II
multipliers are always larger than that of Type I multipliers. However,
Miller and Blair (2009, 253) highlight that “it is generally conceded
that Type I multipliers probably underestimate economic impacts
(since household activity is absent) and Type II multipliers probably
give an overestimate (because of the rigid assumptions about labour
incomes and attendant consumer spending)”. Miller and Blair (2009,

Industry and Service Sector
171
253) further state that “some in between figure might be more realistic
but deciding exactly where these two limits may be problematic”.
Therefore, when industries are ranked based on the size of the
multipliers to identify key sectors in the economy, both Type I and
Type II multipliers are employed. The significance of industries on the
overall economic performance (leading sectors) is determined based
on the criterion that average value of both Type I and Type II
multipliers for each industries should be above its overall average
(Raufdeen et al 2005). This criterion is justifiable as its value is always
placed in between both Type I and Type II multipliers.
Results and findings
As shown in Table 2, only 12 sectors are satisfied with the criteria
designed to identify key sectors in the economy. The highest average
output multiplier (2.29) is reported from the sector called recreational,
cultural, sporting services and other services. A LKR one million
worth of final demand increase for the output in this sector would
generate an additional LKR 1.29 million worth of output in the
economy. The second leading sector in the economy is ‘the public
administration and other services to the community’ followed by
‘manufactured products of food, beverages and tobacco’ and then air
transport and so on. The education and health sector take the 7th and
the 9th places in ranking of key sectors in the economy respectively.
The significance of these sectors to the generation of output in the
economy mainly rooted from the consumption induced impact.

Emerging Trends in Post- Conflict Societies: Challenges and the Way Forward Sri Lanka Economics Research Conference 2014
172
Source: Author’s calculation using IOW software based on unpublished SIOT of
DCS (2006), Sri Lanka
Table 3 given below shows ranking of leading sectors based on the
average values of value added multipliers. Accordingly, ‘recreational,
cultural, sporting services and other services’ and ‘manufacture of
rubber & plastic products’ sectors deserve to consider as two leading
sectors of Sri Lankan economy.
Table 2: Identification of leading sectors in the economy based on estimates
of output multipliers
Industry/Sector Average output
Multiplier
[(Type I + II)/2]
Rank based on
average output
multiplier
Recreational, cultural,
sporting services and other
services
2.29 1
Public administration and
other services to the
community as a whole
2.04 2
Manufactured products of
food, beverages and tobacco 2.03 3
Air transport 1.95 4
Manufacture of Rubber &
Plastic Products 1.94 5
Hotel and restaurants 1.89 6
Education 1.84 7
Land transport; transport via
pipelines 1.83 8
Health and social work 1.83 9
Transport equipment 1.80 10
Water transport 1.80 11
Supporting and auxiliary
transport activities; activities
of travel agencies
1.78 12
Average output multiplier
(Type I and II) for 30 sectors 1.70
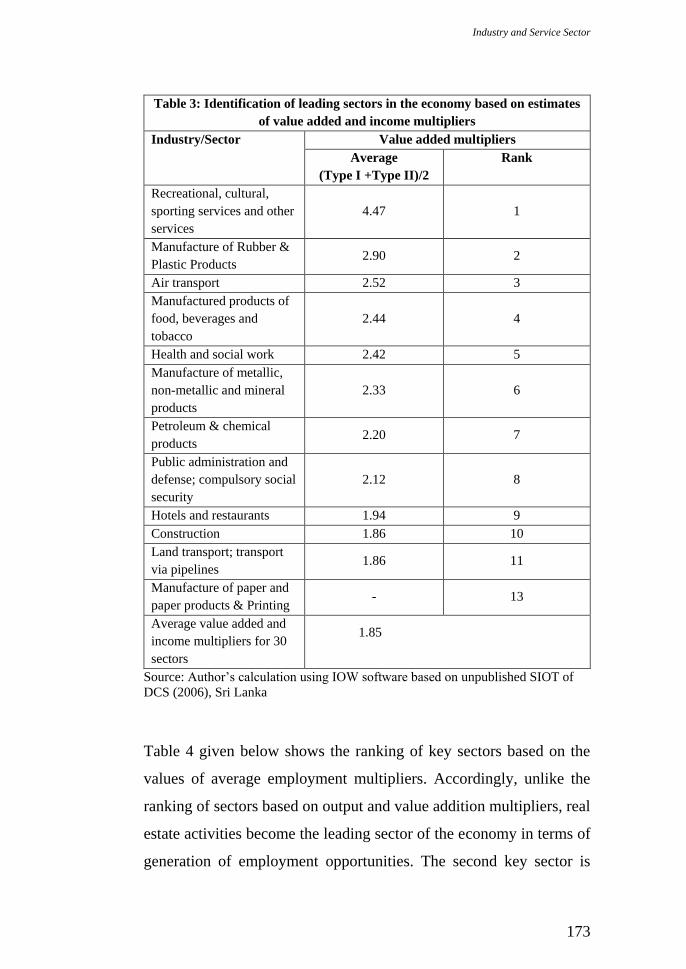
Industry and Service Sector
173
Table 3: Identification of leading sectors in the economy based on estimates
of value added and income multipliers
Industry/Sector Value added multipliers
Average
(Type I +Type II)/2
Rank
Recreational, cultural,
sporting services and other
services
4.47 1
Manufacture of Rubber &
Plastic Products 2.90 2
Air transport 2.52 3
Manufactured products of
food, beverages and
tobacco
2.44 4
Health and social work 2.42 5
Manufacture of metallic,
non-metallic and mineral
products
2.33 6
Petroleum & chemical
products 2.20 7
Public administration and
defense; compulsory social
security
2.12 8
Hotels and restaurants 1.94 9
Construction 1.86 10
Land transport; transport
via pipelines 1.86 11
Manufacture of paper and
paper products & Printing - 13
Average value added and
income multipliers for 30
sectors
1.85
Source: Author’s calculation using IOW software based on unpublished SIOT of
DCS (2006), Sri Lanka
Table 4 given below shows the ranking of key sectors based on the
values of average employment multipliers. Accordingly, unlike the
ranking of sectors based on output and value addition multipliers, real
estate activities become the leading sector of the economy in terms of
generation of employment opportunities. The second key sector is
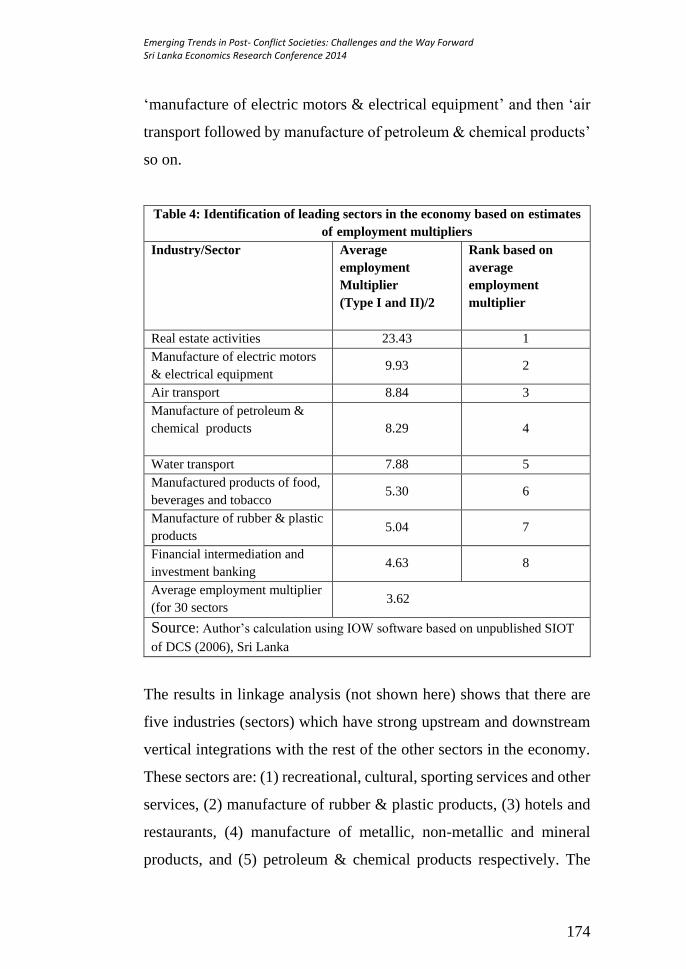
Emerging Trends in Post- Conflict Societies: Challenges and the Way Forward Sri Lanka Economics Research Conference 2014
174
‘manufacture of electric motors & electrical equipment’ and then ‘air
transport followed by manufacture of petroleum & chemical products’
so on.
The results in linkage analysis (not shown here) shows that there are
five industries (sectors) which have strong upstream and downstream
vertical integrations with the rest of the other sectors in the economy.
These sectors are: (1) recreational, cultural, sporting services and other
services, (2) manufacture of rubber & plastic products, (3) hotels and
restaurants, (4) manufacture of metallic, non-metallic and mineral
products, and (5) petroleum & chemical products respectively. The
Table 4: Identification of leading sectors in the economy based on estimates
of employment multipliers
Industry/Sector Average
employment
Multiplier
(Type I and II)/2
Rank based on
average
employment
multiplier
Real estate activities 23.43 1
Manufacture of electric motors
& electrical equipment 9.93 2
Air transport 8.84 3
Manufacture of petroleum &
chemical products
8.29 4
Water transport 7.88 5
Manufactured products of food,
beverages and tobacco 5.30 6
Manufacture of rubber & plastic
products 5.04 7
Financial intermediation and
investment banking 4.63 8
Average employment multiplier
(for 30 sectors 3.62
Source: Author’s calculation using IOW software based on unpublished SIOT
of DCS (2006), Sri Lanka

Industry and Service Sector
175
sectors with strong upstream and downstream linkages with other
industries mean that they not only utilize a large amount of
domestically produced outputs as inputs in their production processes
but also their outputs are used in a greater extent by other sectors in the
economy as inputs to produce final goods and services.
Based on the results of average coefficient of variations (not shown
here) with regard to backward and forward linkages, it is found that
relatively low variations are reported from sector 5, sector 3 and sector
1 respectively. This implies that the stimuli generated by investment in
these three sectors are relatively evenly shared amongst all sectors in
the economy. As the lowest average coefficient of variation is reported
from the sector called petroleum & chemical products, higher prices
charged on products such as petrol, diesel etc in this sector would
probably result in higher costs to most other sectors in the economy
relatively equally. Therefore, these sectors could be considered leading
sectors in the economy as they are most connected with all industries
in such a way that their output, employment, and value added
multipliers would be influenced by strong domestic linkages, although
other sector-specific factors such as the use of imported inputs, labour
intensity of production, technology, and the level of productivity could
also influence the size of these multipliers. For example, sector 4 and
5 mentioned above have relatively strong upstream and downstream
linkages to other industries. However, as these sectors use more than
one thirds of imported inputs (about 33% and 34% respectively) in
their production process, this will reduce the domestic impact of these
sectors on the Sri Lankan economy. A less dependency on imported
inputs is reported from sector 3 (5.1%), sector 2 (6.2%) and sector

Emerging Trends in Post- Conflict Societies: Challenges and the Way Forward Sri Lanka Economics Research Conference 2014
176
1(13%). As a result, the domestic impacts of these sectors on the Sri
Lankan economy are relatively high.
Conclusions, implications and significance
This paper was aimed at measuring industrial interdependence using a
symmetric input-output table for the Sri Lankan economy for 2006 to
draw policy relevant lessons to find an effective development strategy
for the country. According to the output and value added multipliers,
we found that there were six key industries of the Sri Lankan economy.
Those were; (1) recreational, cultural, sporting services and other
services, (2) manufactured products of food, beverages and tobacco
sector, (3) air transport services, (4) rubber &plastic products,
and(5)metallic, non-metallic and mineral products sectors.
The employment multipliers were highest in the (1) real estate
services, (2) electrical products, (3) petroleum & chemical products,
and (4) rubber & plastic products industries. Unlike the ranking of
sectors based on output and value addition multipliers, real estate
activities become the leading sector of the economy in terms of
generation of employment opportunities.
There are five industries (sectors) which have strong upstream and
downstream vertical integrations with the rest of the other sectors in
the economy. These sectors are: (1) recreational, cultural, sporting
services and other services, (2) manufacture of rubber & plastic
products, (3) hotels and restaurants, (4) manufacture of metallic, non-
metallic and mineral products, and (5) petroleum & chemical products
Industry and Service Sector
177
respectively.As the sector named ‘mining and quarrying, electricity,
gas and water’, has strong downstream linkages to other sectors in the
economy, higher prices (or taxes) charged on products such as
electricity and water in this sector would probably result in higher costs
to most other sectors in the economy. On the whole, the results
emphasise the importance of strengthening industries which have
either upstream or downstream linkages or both. However, the results
should be interpreted very carefully as the impact of some sectors such
as education cannot be practically measured in monetary terms and the
input-output model is subject to a set of strict assumptions.
Limitations of the study
First, I-O analysis ignores the supply-side and capacity constraints of
the economy. Second, it ignores price changes of both commodities
and factors of production and as a result input-output model might
overestimate the “true” impact following some shock in final demand
in any sector of the economy. Third, it ignores the economies of scale
in the production process. Fourth, it is based on highly aggregated
versions of sectors (30) which could in turn lead to underestimate or
overestimate of the real situation of an economy. Though these
limitations are there, input-output models are highly used in
development planning and sectorial policy designing processes.
References
1. Athukorala, P. and Bandara, J.S., (1989), - "Growth of
Manufactured Exports, Primary Commodity Dependence and Net
Export Earnings: Sri Lanka" The World Development, 17(6):897-
905.

Emerging Trends in Post- Conflict Societies: Challenges and the Way Forward Sri Lanka Economics Research Conference 2014
178
2. Australian Bureau of Statistics (ABS) (2000) Australian System of
National Accounts: Concepts, Sources and Methods, Cat. no.
5216.0. Australia: ABS. Available from
http://www.abs.gov.au/AUSSTATS/[email protected]/DetailsPage/5216.
02000?OpenDocument [Accessed: February 2014].
3. Bandara, J.S. and Kalegama, S. (2008), “Compiling Input-Output
Tables and Social Accounting Matrices (SAMs) for Sri Lanka:
Review of the Progress, Problems and Challenge” in Senanayake,
S.M.P, Wimalaratana, W. and de Silva, A. (eds), Development
Perspectives: Growth and Equity, Trade and Aid, Colombo:
VijithaYapa Publications, pp.19-41.
4. Baumol, W. (2000) Leontief’s Great Leap Forward. Economic
Systems Research.12. p. 141–152.
5. Department of Census and Statistics (DCS) (2006), Symmetric
input-output table (SIOT) for 30 sectors (industries) in the
economy, (unpublished), Sri Lanka.
6. Epstein, G., Heintz J., Ndikumana, L. and Chan, G. (2010)
Employment, poverty and economic development in Madagascar:
a macroeconomic framework. Employment working paper. No.58.
p.1-151. Geneva: ILO. Available from
http://www.ilo.org/wcmsp5/groups/public/---ed_emp/---
emp_policy/---cepol/documents/publication/wcms_161398.pdf
[Accessed: February 2014].

Industry and Service Sector
179
7. Frédéric, L. (2010)Sectoral engines of job-rich growth: Some
lessons from ILO sectoral country studies.Meeting Document. p.1-
7. Geneva: ILO. Available from
http://www.ilo.org/wcmsp5/groups/public/@ed_emp/@emp_poli
cy/@cepol/documents/meetingdocument/wcms_162759.pdf[Acce
ssed: February 2014].
8. Hazari, B.R. and Bandara, J.S., (1989), - "Basic Needs and
Linkages: A Case of Sri Lanka" Journal of Economic
Development, 14(2):99-107.
9. Miller, R.E. and Peter, D.B. (2009) Input-Output Analysis:
Foundations and Extensions. 2nd ed. UK: Cambridge University
Press.
10. Rameezdeen,R., Zainudeen, N. and Ramachandra, T. (2005) The
Role of the Construction Sector in a Developing Economy: an
Input-Output analysis.Sri Lanka Economic Journal. 6(1& 2). p.
23-39.
11. Xinhao, W. and Rainer, V. (2007) Research Methods in Urban and
Regional Planning, Beijing: Tsinghua University Press and Verlag
GmbH Berlin Heidelberg: Springer.

Emerging Trends in Post- Conflict Societies: Challenges and the Way Forward Sri Lanka Economics Research Conference 2014
180

Industry and Service Sector
181
[S5/02] An Investigation of the Trend Orientation of Sri
Lankan Value Fashion Retailers and Consumers
Herath.H.M.S.H. and Ranaweera H.R.A.T
Department of Textile and Clothing Technology, University of Moratuwa, Sri
Lanka
_________________________________________________________________
Keywords: Sri Lankan fashion industry, Vale retailers, Consumer
behaviour, Trend orientation
Introduction and Research Problem
Fashion is a skilful mechanism which gives room for people to adjust
collectively and orderly to a rapidly changing and moving world full
of possibilities of anarchy (Blumer, 1969). Further, to be in fashion,
adapting latest trends is essential. Blumer (1969) asserts that fashion
trends are highly important yet a neglected area of study.
The context of this study is the Sri Lankan fashion market .Unlike few
years back, the fashion retail sector has shown extensive growth
potentials especially due to the stable macro environmental conditions
of the country (Superbrands, 2014). According to Dias (2011) local
retailers are expanding their scale and scope whilst global retailers
continue to enter. When examining the hierarchy of fashion market
levels, it can be identified that mass market based value level market
sector plays a prominent role in the industry (Ibrahim,
2009).According to the initial research and assumptions made, female
consumers who belong to the value market level are keen on adhering
to the latest trends (Goworek, 2010). However as stated by Ibrahim
Emerging Trends in Post- Conflict Societies: Challenges and the Way Forward Sri Lanka Economics Research Conference 2014
182
(2009) majority of the value retailers pay less attention on trend
forecasting. Therefore, it is important to investigate as to what extent
value market retailers provide trend oriented clothing and whether they
have a proper mechanism to incorporate global trends for their
offering. At the same time it is equally important to examine consumer
perception towards trend orientation as well.
In this perspective the main research objectives are;
1. To examine how much Sri Lankan value retailers are trend
oriented and to explore whether they are equipped with a
mechanism to adapt to global trends.
2. To examine the extent of consumer trend awareness
Methodology
Qualitative method was adapted to analyze trendiness of clothing
offered by the Sri Lankan value retailers and check whether they are
equipped with a proper mechanism to adapt to upcoming fashion
trends. Women’s casual wear has been selected as the product category
because of the high purchase frequency. Four formal Interviews were
conducted with subject experts from selected retailers (designers/
marketing managers).
Consumer perception and opinions towards trend orientation too were
explored. Certain behavioural aspects were identified through an
observational research. Insightful data were stemmed through a
questionnaire survey. Stratified sampling method of the probability
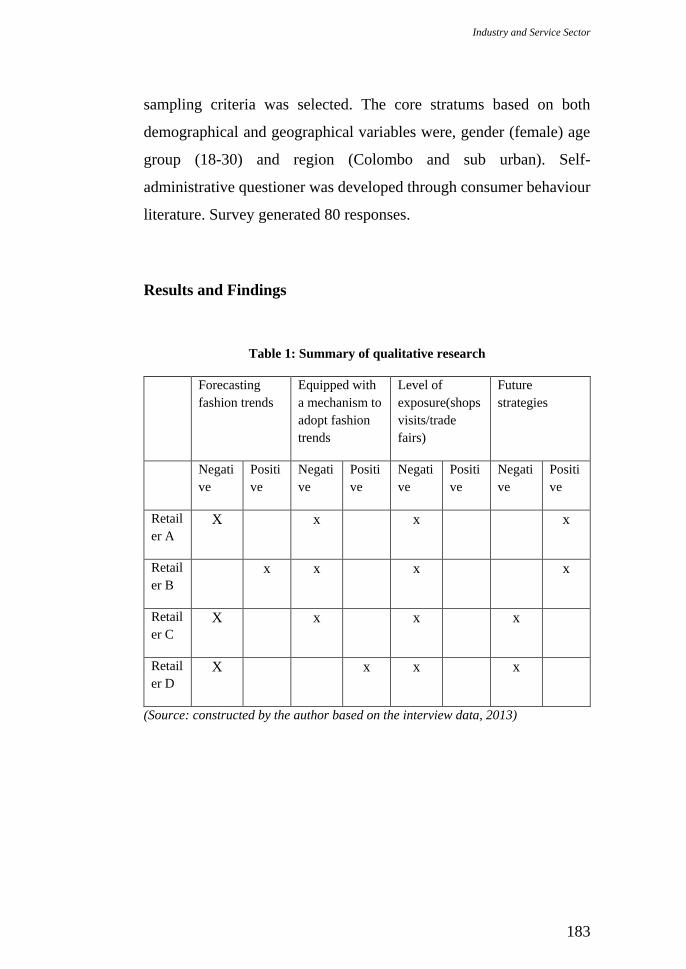
Industry and Service Sector
183
sampling criteria was selected. The core stratums based on both
demographical and geographical variables were, gender (female) age
group (18-30) and region (Colombo and sub urban). Self-
administrative questioner was developed through consumer behaviour
literature. Survey generated 80 responses.
Results and Findings
Table 1: Summary of qualitative research
Forecasting
fashion trends
Equipped with
a mechanism to
adopt fashion
trends
Level of
exposure(shops
visits/trade
fairs)
Future
strategies
Negati
ve
Positi
ve
Negati
ve
Positi
ve
Negati
ve
Positi
ve
Negati
ve
Positi
ve
Retail
er A
X x x x
Retail
er B
x x x x
Retail
er C
X x x x
Retail
er D
X x x x
(Source: constructed by the author based on the interview data, 2013)

Emerging Trends in Post- Conflict Societies: Challenges and the Way Forward Sri Lanka Economics Research Conference 2014
184
Table 2: Summary of quantitative research
Yes Sometimes No
Do you buy casual wear according to the
seasons?
54% 20% 36%
Do you think you follow trends when it
comes to casual wear?
10% 62.5% 27.5%
Do you watch any international fashion
programs?
53% 10% 37%
Do you watch local fashion programs? 35% 5% 60%
Consumer adaptation on new trends 40% 20% 40%
I am not afraid to be the first to wear
something trendy which came to the market
very recently
17.5% 22.5% 60%
Wearing trendy casual clothes is a part of
leading a good life
45% 20% 35%
I follow my fashion icon regardless of the
style not being accepted in Sri Lanka
21.25% 20% 58.75%
In this period of rising prices, spending
excessive amounts of money on trendy
casual wear clothes is a waste
36.25% 31.25% 32.5%
I am confident of my awareness about trends 26.25% 13.75% 70%
(Source: constructed by the author based on the survey data, 2013)
Results of the study reveal that value retailers are not critically
concerned on encapsulating trends into women’s casual wear.
Moreover from the study it is proven that the value retailers rarely refer
reliable trend forecasting sources (please refer table 1). Thus, it is quite
obvious that designers who design for these retailers do not design
trend oriented clothing and also the buyers of these retailers are not
concerned with buying trend-oriented fashion for their retail stores.

Industry and Service Sector
185
Moreover the study proves that these retailers are not equipped with a
proper mechanism to adapt to global trends and fit them into the Sri
Lankan market.
On the other hand female consumers who belong to the value market
sector aged between 18 and 30 in Colombo are believed to be more
fashion conscious and process with the knowledge of ongoing trends.
However the study outcome was much more different than what we
believed in. The findings proved that the majority of consumers are not
trend oriented. Furthermore, the study proves that fashion innovators
as well as early adopters in the value market are quite less (refer table
2)
Conclusion, implications and significance
The research concluded that value retailers are not equipped with a
proper mechanism to follow up coming fashion trends. One of the key
findings of this study is that value retailers rarely refer reliable trend
forecasting sources.
At the same time it concluded that the selected consumer segment for
this study does not have a thorough awareness on upcoming fashion
trends. Further, the study proves that there are only a few fashion
innovators as well as early adopters in the local marketplace.
Literature on the fashion market sector as well as consumer behavior
is largely lacking. Therefore this research fills certain gaps of the
literature and contributes to the development of the fashion retail
industry.

Emerging Trends in Post- Conflict Societies: Challenges and the Way Forward Sri Lanka Economics Research Conference 2014
186
This study can be further extended to identify a model to encourage
value retailers to introduce a mechanism to promote trend oriented
fashion. Research was limited to a certain market level of the fashion
market hierarchy. Thus it can be further expanded to other levels as
well, for an instance into the middle or luxury market levels. Moreover,
consumer perception too can be identified through various customer
segments such as male and adults. Research was limited to a core
product category. Thus it can be further expanded to various other
product categories as well for an example into things like occasional
wear or sportswear.
References
1. Blumer. (1969). Fashion: from class differentiation to collective
selection. The Sociological Quarterly , 275-291.
2. Dias, S. (2011, December 18). Sri Lankan designers eye US$500
mln fashion business. Retrieved August 2, 2014, from
Sundaytime.lk:http://www.sundaytimes.lk/111218/BusinessTime
s/bt11.html
3. Goworek, H. (2010). An investigation into product development
processes for UK fashion retailers; A multiple case study. Journal
of Fashion Marketing and Managemen , 648-662.
4. Ibrahim, Z. (2009, November 28). Sri Lankan high fashion – no
more a pipe dream . Retrieved August 4, 2014, from
lankabusinessonline.com:http://www.lankabusinessonline.com/ne
ws/sri-lankan-high-fashion-%E2%80%93-no-more-a-pipe-
dream/943976115
Industry and Service Sector
187
[S5/03] Public–Private Wage Differential in Sri Lanka:
Application of Endogenous Switching Regression Model
Mahinda Pushpakumara1, Athula Ranasinghe2
1Department of Economics, University of Colombo.
2Department of Economics, University of Colombo.
_______________________________________________________
______
Key words: Wage gap, wage differentials, returns to education,
switching model
Introduction
Understanding the wage differential between public and private sectors
is vital for labour economists as well as to policy makers in Sri Lanka.
It is vital not simply because it helps policy makers in directing
employment policy of the country. Understanding wage differential is
also important in addressing the issue of public sector job preferences
in Sri Lanka.
Assuming workers are randomly distributed between the public and
private sectors Blaise (2002), Dustman et.al (1998), Katz and Krueger
(1991), Mueller (1998), Nielsen and Rosholm (2001) have estimated
Mincer earning function using OLS method to explore the wage gap
between public and private sector. Rosen (1979), Willis (1979),
Griliches (1981), and many others have criticized this on “selectivity
bias”. It is argued that workers are not randomly distributed between
the public and private sectors. Therefore, unless the correction is done
for self-selection the wage gap between two sectors will be biased
upwards or downwards. Lee (1978) has introduced endogenous
switching regression model to correct the selectivity bias. Hartog and
Emerging Trends in Post- Conflict Societies: Challenges and the Way Forward Sri Lanka Economics Research Conference 2014
188
Oosterbeek (1993) and Morton et.al (2000) have applied this technique
to analyse Public-Private wage differences. In this paper the same
method is applied to explore the wage differentials in Sri Lanka.
Objectives: The main objective of this paper is to estimate wage
differential between public and private sectors in Sri Lanka. Specifics
objectives are,
To identify the graduate and non-graduate wage gap between
private and public sectors
To estimate the rate of returns to education in public and
private sectors
Methods
According to the Mincer (1974) earning function Public and Private
sector wage equations can be expressed as follows.
iUXw i 111ln (1)
iUXw i 22 2ln (2)
In the equation 1 and 2lnwjis natural log of wage in sector j, j
is the
vector of coefficients associated with independent variables and Uj is
a disturbance term, where j can take only two values, 1 and 2 for public
and private sectors respectively. The above two equations can be
estimated using OLS method and can predict average wages in the two
sectors. An assumption in this approach is that the expected value of
error term (Ui) is zero. This assumption may be violated when workers
are not randomly distributed between two sectors. When there is a
wage differential workers may prefer one sector over the other sector.

Industry and Service Sector
189
Equation 3 summarizes selection process between public and private
sectors. The selection decision is a function of personal characteristics
(Z) of individuals.
eZl ii (3)
0 I if )sector Public(1 il
otherwise , )sector P(0 rivateli
The predicted average wages based on the OLS estimation is unbiased
if error term of selection equation (e) is uncorrelated with iU 1 and iU 2 .
If this assumption is violated wage comparisons based on OLS are
misleading.
Data available from the Quarterly Labour Force Survey (QLFS) 2010
of Department of Census and Statistics was used to estimate the above
equations. Monthly wage from primary and secondary occupations
was the dependent variable in the wage equation where level of
education, experience and experience square were independent
variables in two wage equations. Other than the variable in wage
equation, gender was also included as an independent variable in
selecting the equation.
Results
The result of OLS model and switching model are presented in table
1. All coefficients related to level of education are significant and
positive which implies that there is a positive relationship between
monthly wage and level of education in both public and private sectors.
However the benefit of education is different between the two sectors.

Emerging Trends in Post- Conflict Societies: Challenges and the Way Forward Sri Lanka Economics Research Conference 2014
190
Table 1: Public and private sector wage equations and sector selection
function
OLS Switching Model
Public
Sector
Private
Sector
Public
Sector
Private
Sector
Selection
function
Coef. t Coef t Coef. t Coef. t Coef. t
Constant 8.28*
117.
8
8.49
* 202 7.91* 89 8.27* 173
-
2.01* 22.0
Primary
(1-5) .21* 3.0 .07* 1.98 0.21* 2.98 0.09* 2.13 0.13 1.28
Junior
secondary
(6-9)
.61* 9.0 .26* 7.07 0.63* 9.2 0.34* 8.0 0.38* 2.6
Senior
Secondar
y
(10-11)
.97* 14.7 .44* 11.95 1.02* 15.9 0.61* 14.4 0.62* 3.4
Collegiate
(12-13) 1.19* 17.9 .78* 19.88 1.32* 19.1 1.19* 26.2 1.23* 5.7
Degree
and above 1.42* 20.9 1.5* 27.5 1.62* 21.9 2.26* 36.2 1.85* 7.34
Experienc
e /100 2.56* 9.3 2.8* 16.1 3.56* 11.4 5.21* 25.5 8.52* 22.6
Experienc
e square
/100
-
2.68* 4.9
-
4.9* 15.9 -4.24* 7.2 -8.37* 23.2
-
12.85
*
18.4
Gender
-
0.45* 18.9
1 0.35* 0.05
2 0.82* 0.01
N 3,784 8,072 11,856
Wald
chi2(7) 1271.73
Log
likelihood -15939.66
Prob>
chi2 0.00
R2 .33 .19
*Significant at 5% level
According to the OLS results coefficients of primary education,
secondary and collegiate level of education are higher in public sector
compared to the private sector. This indicates that the rate of returns to
education below degree level is higher in public sector than that in the
private sector. Contrary to that, university graduates receive higher rate

Industry and Service Sector
191
of returns to education if they are employed in the private sector than
public sector. The coefficients of experience squared shows well –
know parabolic experience –wage profile in both sectors.
Except the coefficients of primary level of education in the selection
equation, all other coefficients are significant. Preference for public
sector jobs has increased with the level of education. When compared
to the individuals in other education groups, graduates prefer public
sector jobs than private sector jobs. Female are more likely to be
employed in the public sector than males.
1 and 2 are the correlation of the wage equation disturbance term in
sector i with the selection function of that sector. As the correlations
are significant the OLS estimates are biased. Therefore, comparison of
average wage between two sectors based on the OLS results is not
realistic. Following Table 2 shows the calculated conditional expected
wage in both sector using the endogenous switching regression model.
Table 2:Expected average public and private sector wage per month (Rs.)
Degree and
above
Colleg
iate
Senior
secondary
Junior
secondary
Primar
y
Public sector
workers
In public sector 24,515 19,732 16,317 11,849 8,266
In private sector 56,460 21,162 12,964 10,342 8,184
Private sector
workers
In public sector 28,282 26,108 25,848 20,537 15,677
In private sector 32,208 14,044 9,779 8,349 6,843
Table 2 compares predicted average wages between sectors and
between worker types. First two rows present average wage of workers

Emerging Trends in Post- Conflict Societies: Challenges and the Way Forward Sri Lanka Economics Research Conference 2014
192
employed in the public sector. First row reports average of actual
wages of employees in public sector. Row 2 reports the conditional
expected wage of the workers currently in the public sector if they were
employed in the private sector. The other two rows should also be
interpreted accordingly.
According to the above findings present allocation of workers over
sectors is inefficient. Public sector workers with education collegiate
level of above can increase their wages by shifting to the private sector.
Following a similar pattern, Table 2 shows that it is better for workers
without a degree qualification to shift to the public sector.
Conclusion
The wage differential between public and private sectors can be
observed in all education groups. Except at degree level, public sector
wages are higher than private sector wages. Though the wage rate of
graduates in the public sector is low as compared to the private sector,
still there is a preference for public sector jobs. This may be due to
non-wage benefits in the public sector and the certainty of wages in the
public sector compared to the uncertainty of wages in private sector.
The present allocation of workers over sectors is inefficient from the
point of view of earning maximization. At least some workers can
maximize their earning by changing their sector of employment.
Industry and Service Sector
193
References
1. Hartog ,J. and Oosterbeek, H. (1991), Public and private sector
wages in the Netherlands , European Economic Review 37 (1993)
97-114
2. Morton , J. ,(1990) , A switching Regression Model of Public –
Private Sector Wage Differential in Perue : 1985-86 , The Journal
of Human Resource XXIV.3
3. Lee, Lung-Fei, (1978) Unionism and wage rates: A simultaneous
equations model with qualitative and limited dependent variables
,International Economic Review 19, 415-998
4. Robert J. Willis and Sherwin R. (1979),Education and Self-
Selectio,Journal of Political Economy, Vol. 87, s7-S36P
5. Griliches and Adonis Y. (1981) Sample Selection Bias and
Endogeneity in the Estimation of a Wage Equation: An Alternative
Specification, Annales de l'inséé, No. 43 - 35

Emerging Trends in Post- Conflict Societies: Challenges and the Way Forward Sri Lanka Economics Research Conference 2014
194
Industry and Service Sector
195
[S5/04] Identifying Consumer Perceived Value of
Tourism Product
aRanaweera H.R.A.T, Colombo,Sri Lanka
Halwatura R.U,Colombo,Sri Lanka
Abstract
Tourism has been identified as a major growth area in post-conflict
development in Sri Lanka and it was aimed to attract 2.5 million
tourists by 2016. Consumer perceived value is a complex theoretical
construct that can be defined as the worth a particular product or
service is in the mind of the customer. Therefore in order to grasp this
extremely potential market opportunity and to gain competitor
advantage, local retailers should identify the core attributes and
benefits that tourist customer value for choosing a product, service and
vendor. In this context this research sought to examine the relationship
of customer perceived value in the tourism products (apparel and
related). Employing a multi-dimensional approach the study measured
various CPV dimensions of a purchase by conducting a quantitative
research. The identified seven value dimensions through literature
were functional, emotional, social, sacrifice, epistemic, service and
store. Judgmental sampling method of the non-probability sampling
criteria was chosen. Data stemmed from questionnaire survey
addressed to 155 tourists. The results provide insights for potential
research and theory development in value literature and tourism
retailing. Moreover the findings could facilitate Sri Lankan retailers to
understand how to put more effort to give more value to their tourist
clients.
Keywords: Consumer perceived value, Sri Lankan tourism industry,
Apparel product

Emerging Trends in Post- Conflict Societies: Challenges and the Way Forward Sri Lanka Economics Research Conference 2014
196
Introduction and research problem
The concept of customer-perceived value (CPV) can be defined as
consumer’s overall assessment of the utility of a product based on
perceptions of what is received and what is given(Zeithamal,1988). It
emerged in the 1990’s and the concept has gained extensive research
interest in the present day as the creation of CPV is one reason for the
organization’s survival and certainly for its success in the fiercely
competitive market place(Sanchez et al.,2006).
In recent years CPV has been the object of attention by researchers in
the tourism sector. Ryan (2002) described that the creation and
transmission of value to tourists has become a competitive advantage
in environments characterized by globalized competition and by
tourists who are more and more demanding. Tourism is a fast growing
industry in Sri Lanka which had been identified as a major growth area
in post-conflict development. According to SLTDA (2014) 2.5 million
tourists were aimed to be attracted by 2016. Therefore, in order to
grasp this high potential market opportunity and to gain competitor
advantage, local retailers should identify the core attributes and
benefits of the tourism consumer value for choosing a product and
vendor.
Thus, this study sought to examine the relationship of customer
perceived value in the tourism product. The selected product scope was
apparel and related products not only because of the rapidly growing
nature of the retail sector but also because of the rising consumer

Industry and Service Sector
197
demands (Superbrands, 2014). In this context the aim of this study was
to measure the CPV of a tourism product purchase via seven value
dimensions.
In this perspective the main research objectives are;
3. To examine how much Sri Lankan value retailers are trend
oriented and to explore whether they are equipped with a
mechanism to adapt global trends.
4. To examine the extend of consumer trend awareness
Methods
Marketing researchers had studied the concept of CPV in greater
depth. After going through a comprehensive empirical study on
various concepts and dimensions of CPV proposed by many theorists,
multidimensional construct has been considered to measure perceived
value of a tourism product purchase by conducting a quantitative
research. Reasons for choosing multidimensional construct are
because it attempts to explain CPV aspects by taking in to account both
the cognitive and affective behavior of perceived value (Fernandez &
Bonillo, 2007).
Judgmental sampling method of the non-probability sampling criteria
was chosen. Data stemmed from the questionnaire survey given to 155
tourists. The questionnaire consisted items that were derived from
consumer behavior literature which was designed on a five point likert
scale. The composition of the group was heterogeneous with different

Emerging Trends in Post- Conflict Societies: Challenges and the Way Forward Sri Lanka Economics Research Conference 2014
198
demographic and geographic variables such as education, socio-
economic classes as well as country and ethnicity. Questionnaire was
distributed equally when it comes to gender and age (More than 18
years of age).Two famous tourist destinations were selected which are
Sri Lanka’s business capital Colombo and down south Gall (SLTDA,
2014).
Results and findings
The research measured seven value dimensions that are applicable in
tourism retailing for apparel product while exemplifying how
important functional value (price) and emotional (experience) are in
relation to tourism retailing.(please refer table 1).
Table 1: Level of acceptance
Functional
Product
price
Product
quality
Product
styling
Product
variety
96% 86% 57% 29%
Emotional Experience
Affective
states
93% 43%
Social
Self-Image
value Acceptance Belonging
29% 16% 58%
Sacrifice Monetary
sacrifice
Time
sacrifice
Social
sacrifice
79% 83% 13%
Epistemic Experienced
curiosity Novelty
57% 80%
Service Staff
professionalism
Merchandise
knowledge of
staff
Process
efficiency
Appearance
of staff
32% 27% 32% 15%
Store Merchandise
displays Shop fittings
Window
displays
Store
location
30% 18% 22% 72%
Industry and Service Sector
199
Research validated seven value dimensions that can be applied for
apparel products. It exemplified how important the functional value
and product price is in relation to tourism retailing. Also the quality of
the tourism product is another vital aspect retailers should pay special
attention to. Furthermore research justified that leisure gain activities
such as tourism need to resort to fantasies, feelings and emotions to
explain purchasing behaviour as products contains intangible aspects
beyond quality or price. Therefore with regards to the business
implementation retailers should pay attention on factors that affect
value creation from physiological and psychological perspectives.
Research findings also proved that the level of social value in terms of
image value and acceptance value in tourist consumer buying
behaviour is considerably low. Moreover results justified the
importance of sacrifice value which is viewed as a part of the most
commonly accepted definition of value. It has validated several types
of sacrifice tourist customers have to make in order to acquire products
or services. Among them time sacrifice was the highest. However it
was revealed that monetary sacrifice was lower than time sacrifice.
Furthermore the study revealed that epistemic value which related to
experienced curiosity, novelty or gained knowledge, novelty value was
considerably high. Thus retailers must find ways to satisfy customers
who are motivated by the epistemic value. Out of all the seven value
dimensions service value was the lowest. Among the four store value
variables which are merchandise displays, shop fittings, window
displays and store locations, the value of store location was the highest.
Thus retailers should set up proper distribution channels and make
their products readily available to tourist consumers.
Emerging Trends in Post- Conflict Societies: Challenges and the Way Forward Sri Lanka Economics Research Conference 2014
200
Conclusions, implications and significance
After reviewing literature on multi –dimensional approach of CPV,
seven major CPV dimensions were identified based on both cognitive
and affective views of perceived value (Sweeney & Soutar, 2001;
Sanchez et al., 2006; Zethimal, 1988; Fernandez& Bonillo,
2007).They were functional, social, emotional, sacrifice, epistemic,
service and store .Following the method proposed by Churchill (1979)
identified CPV dimensions were validated through a quantitative
study.
The research contributes to the value literature by means of identifying
validating and measuring seven value dimensions which revealed the
worth that a product or service in the mind of the tourist consumer. On
managerial implementation it can be concluded that this study
contributes to the development of the apparel retail as well as tourism
sector. As exemplified by the study retailers should put more effort to
contribute more value to their tourist clients especially concentrating
on product price, experience and novelty. One limitation of this study
was it has taken only apparel and related products as the tourism
product. This could be further extended to other tourism products and
services as well for example handicraft souvenirs.
References
1. Fernandez,R.S., & Bonillo,M.A.I.(2007).The concept of perceived
value: a systematic review of the research,7(4),427-451.

Industry and Service Sector
201
2. Havlena.W.J & Holbrook, M.B. (1986).The varieties of
consumption experience: comparing two typologies of emotion in
consumer behavior. Jorunal of consumer research.Vol.13, pp.394-
404.
3. Ryne,C.(2002).Equality, management, power sharing and
sustainability issues f the new tourism. Tourism Management, 23,
17-26.
4. Sanchez,J .,Callarisa,L.,Rodeiguez.,R and Moliner,M(2006).
Perceived value of the purchase of a tourism product. Tourism
Management, 27, 394-409.
5. Sweeney,J.C.,&Soutar,G.(2001).Consumer perceived value: The
development of multiple item scale. Journal of Retailing, 7(2),
203-220.
6. Zethimal,V.A.(1988).Consumer perception of price, quality and
value: A means-end model and synthesis of evidence, Journal of
Marketing,52(3),2-22

Emerging Trends in Post- Conflict Societies: Challenges and the Way Forward Sri Lanka Economics Research Conference 2014
202

Money in the Economy
203
Session-6 Money in the
Economy

Emerging Trends in Post- Conflict Societies: Challenges and the Way Forward Sri Lanka Economics Research Conference 2014
204
Money in the Economy
205
[S6/01] Long-run Relationship between Exchange Rate
and Trade Balance of Sri Lanka
Nandasiri Keembiyahettige
Department of Economics, University of Ruhuna, Matara, Sri Lanka.
Athula Naranpanawa
Department of Accounting, Finance and Economics, Griffith Business
School, Griffith University, Queensland 4111,Australia
Abstract
While Sri Lanka benefitted from the open market policies in many
different ways, its trade balance continued to deteriorate year by year
after liberalizing the economy in 1977. Starting from a US Dollar 41
Million surplus in 1977, the trade balance reported a speedy downturn
of US Dollar 9,710 Million by 2012, which is almost equivalent to the
total export earnings of the country. This paper examines the long run
relationship between the trade balance of Sri Lanka and the real
exchange rate with annual data from 1960-2012 using bound testing
or autoregressive distributed lag (ARDL) and the cointegration
procedure developed by Pesaran and Smith (2001). The bounds test
result revealed the presence of a cointegration relationship suggesting
long-run equilibrium for the trade balance. Estimated long-run
coefficients suggest that 1% devaluation in the real exchange rate
causes 0.32 % improvement in the trade balance given that all the
other factors remain unchanged. Furthermore, the results conclude
that 1% increase in trade openness leads to 0.43% deterioration in the
trade balance given all the other factors reaming unchanged. This
implies that the possible gain of export promotion through currency
devaluation is partly set off by encouraging imports due to trade
openness. In the Error Correction representation for ARDL model,
the error correction term estimated to be -0.6145 at 1% per cent
Emerging Trends in Post- Conflict Societies: Challenges and the Way Forward Sri Lanka Economics Research Conference 2014
206
significant level suggests that 61% of any short-run deviation will be
corrected at one time period and converge to a long run equilibrium.
Key words; ARDL, Cointegration, Trade Balance, Trade openness, Sri
Lanka
Introduction
While Sri Lanka benefitted from the open market policies in many
different ways, its trade balance continued to deteriorate year by year
after liberalizing the economy in 1977. Starting from a US Dollar 41
Million surplus in 1977, the trade balance reported a speedy downturn
of US Dollar 9,710 Million by 2012, which is almost equivalent to the
total export earnings of the country. Using annual data from 1960-
2012, this paper examines whether a long run relationship exists
between the trade balance and its determinants using bounds testing
method. It attempts to answer whether currency devaluation would
improve country’s trade balance and whether trade openness really
matters.
The objectives of this study are of three folds: (a) To examine whether
long-run level relationship exists between trade balance of Sri Lanka
and its determinants using recent bounds testing techniques for
cointegration. (b) To examine how rapidly any short-run
disequilibrium gets back to an equilibrium position using ARDL and
EC models (c) To evaluate trade openness and exchange rate
devaluation as a solution to the balance of trade problem in Sri Lanka.
Money in the Economy
207
This study employs the standard “Two County” trade model as
stipulated by many studies in literature (see Rose and Yellen (1989);
Rose (1990); Bahmani-Oskooee (1991); Shirvani and Wilbratte (1997)
with slight variation to add the trade openness. The standard two
country trade model assumes that the demand for imports by domestic
residents (Dm) depends upon the domestic income (y) and the relative
price of imported goods to the domestically produced goods (rpm) both
expressed in home country currency terms. Additionally, we assume
that the trade balance is affected by the degree of trade openness (top)
of that economy. The supper script f denotes the foreign counterpart of
the analogous variables. Thus, the theoretical model was derived
through set of equations standing for demand and supply of both
exports and imports and eventually deduced the real trade balance to a
function of
TB=TB (yf, y, q, top) ………………………………………………. (01)
This study applies the bounds testing or autoregressive distributed lag
(ARDL) cointegration procedure developed by Pesaran and Smith
(2001). We employ bound testing method for several valid reasons.
Firstly, the bounds testing procedure does not require the pre-testing
of the variables for unit roots and the test procedure can be applied
irrespective of whether the regresses are integrated I(0), I(1) or
mutually cointegrated as long as they are not cointegrated I(2).
Secondly, the bounds testing procedure is relatively more efficient in
small or finite sample data, where the number of observations by
nature is small. Thirdly, both short-run and long-run parameters can be
estimated simultaneously. Furthermore, as opposed to other
multivariate cointegration techniques such as Johansen and Juselius
Emerging Trends in Post- Conflict Societies: Challenges and the Way Forward Sri Lanka Economics Research Conference 2014
208
(1990), the bounds test procedure is simple as the OLS can be used to
estimate cointegration relationship once the lag order of the model is
identified using appropriate information criterion.
Above theoretical model was then converted to
𝑇𝐵 = 𝑓(𝐺𝐷𝑃, 𝐺𝐷𝑃𝑊,𝑁𝑅𝐸𝑋, 𝑇𝑂𝑃, 𝑂𝐼𝐿) …………………… (02)
Where, TB is the ratio of real exports to real imports both measured in
USD millions. Measuring TB as a ratio of exports over imports
deserves at least three advantages. It becomes unit less, non-negative
allowing log transformation, and is normalized to one when trade is
balanced. GDP is Gross Domestic Product of home country and
GDPW is the sum of GDPs of the top 20 export destinations of Sri
Lanka31. NREX is the real exchange defined as the product of the
relative price of importables into nominal exchange rate measured in
terms of domestic currency price for one unit of USD. TOP is the sum
of real exports and imports defined as a percentage of GDP, which is
a proxy representing the degree of trade openness.
The model was then transformed into a double log function and
extended to include OIL dummy to capture world oil crises in 1973
and a time (T) variable for detrending data.
𝑙𝑛𝑇𝐵 = 𝛽0𝑇𝐵+𝑑1𝑇𝑡 + 𝑑2𝑂𝐼𝐿𝑡 + 𝛽1𝑙𝑛𝑅𝐸𝑋𝑡 + 𝛽2𝑙𝑛𝐺𝐷𝑃𝑡 +
𝛽3𝑙𝑛𝐺𝐷𝑃𝑊𝑡 + 𝛽4𝑙𝑛𝑇𝑂𝑃𝑡 + 𝑒𝑡………………………………. (03)
31 U.S.A.,U.K., India, Italy, Belgium, Germany, Russia, U.A.E., Japan, Iran, France,
Netherlands, Canada, Turkey, Australia, China, Syria, Hong-Kong, Mexico, Singapore,
Switzerland. These countries account for 80.77% of Sri Lanka’s total exports

Money in the Economy
209
Where, 𝑙𝑛 is natural logarithm and𝑒𝑡 is the error term which is white
noise. Based on the equation (03) the following autoregressive
distributed lag models (ARDL) were specified to identify the existence
of a long-run cointegration relationship. TB, GDP, REX, TOP were
considered endogenous variables and GDPW and dummy variables
were taken as exogenously determined.
𝑙𝑛𝑇𝐵𝑡 = 𝛽0𝑇𝐵 + 𝛽1𝑇𝐵𝑇𝑡 + 𝛽2𝑇𝐵𝑂𝐼𝐿𝑡 + 𝛽3𝑇𝐵𝑙𝑛𝐺𝐷𝑃𝑊𝑡 + ∑ 𝛼1𝑇𝐵𝑛𝑖=1 𝑙𝑛𝑇𝐵𝑡−𝑖 +
∑ 𝛼2𝑇𝐵𝑛𝑖=0 𝑙𝑛𝐺𝐷𝑃𝑡−𝑖 + ∑ 𝛼3𝑇𝐵
𝑛𝑖=0 𝑙𝑛𝑅𝐸𝑋𝑡−𝑖 + ∑ 𝛼4𝑇𝐵
𝑛𝑖=0 𝑙𝑛𝑇𝑂𝑃𝑡−𝑖 + 𝜀𝑇𝐵𝑡
(3.1)
𝑙𝑛𝐺𝐷𝑃𝑡 = 𝛽0𝐺𝐷𝑃 + 𝛽1𝐺𝐷𝑃𝑇𝑡 + 𝛽2𝐺𝐷𝑃𝑂𝐼𝐿𝑡 + 𝛽3𝐺𝐷𝑃𝑙𝑛𝐺𝐷𝑃𝑊𝑡 + ∑ 𝛼1𝐺𝐷𝑃𝑛𝑖=1 𝑙𝑛𝐺𝐷𝑃𝑡−𝑖 +
∑ 𝛼2𝐺𝐷𝑃𝑛𝑖=0 𝑙𝑛𝑇𝐵𝑡−𝑖 + ∑ 𝛼3𝐺𝐷𝑃
𝑛𝑖=0 𝑙𝑛𝑅𝐸𝑋𝑡−𝑖 + ∑ 𝛼4𝐺𝐷𝑃
𝑛𝑖=0 𝑙𝑛𝑇𝑂𝑃𝑡−𝑖 + 𝜀𝐺𝐷𝑃𝑡
(3.2)
𝑙𝑛𝑅𝐸𝑋𝑡 = 𝛽0𝑅𝐸𝑋 + 𝛽1𝑅𝐸𝑋𝑇𝑡 + 𝛽2𝑅𝐸𝑋𝑂𝐼𝐿𝑡 + 𝛽3𝑅𝐸𝑋𝑙𝑛𝐺𝐷𝑃𝑊𝑡 + ∑ 𝛼1𝑅𝐸𝑋𝑛𝑖=1 𝑙𝑛𝑅𝐸𝑋𝑡−𝑖 +
∑ 𝛼2𝑅𝐸𝑋𝑛𝑖=0 𝑙𝑛𝐺𝐷𝑃𝑡−𝑖 + ∑ 𝛼3𝑅𝐸𝑋
𝑛𝑖=0 𝑙𝑛𝑇𝐵𝑡−𝑖 + ∑ 𝛼4𝑅𝐸𝑋
𝑛𝑖=0 𝑙𝑛𝑇𝑂𝑃𝑡−𝑖 + 𝜀𝑅𝐸𝑋𝑡
(3.3)
𝑙𝑛𝑇𝑂𝑃𝑡 = 𝛽0𝑇𝑂𝑃 + 𝛽1𝑇𝑂𝑃𝑇𝑡 + 𝛽2𝑇𝑂𝑃𝑂𝐼𝐿𝑡 + 𝛽3𝑇𝑂𝑃𝑙𝑛𝐺𝐷𝑃𝑊𝑡 + ∑ 𝛼1𝑇𝑂𝑃𝑛𝑖=1 𝑙𝑛𝑇𝑂𝑃𝑡−𝑖 +
∑ 𝛼2𝑇𝑂𝑃𝑛𝑖=0 𝑙𝑛𝐺𝐷𝑃𝑡−𝑖 + ∑ 𝛼3𝑇𝑂𝑃
𝑛𝑖=0 𝑙𝑛𝑅𝐸𝑋𝑡−𝑖 + ∑ 𝛼4𝑇𝑂𝑃
𝑛𝑖=0 𝑙𝑛𝑇𝐵𝑡−𝑖 + 𝜀𝑇𝑂𝑃𝑡
(3.4)
In equation 3.1, where real trade balance is the dependent variable
𝑓𝑇𝐵(𝑇𝐵|𝐺𝐷𝑃, 𝑅𝐸𝑋, 𝑇𝑂𝑃) the null hypothesis of no cointegration
amongst the variables is 𝐻0: ∝1𝑇𝐵= ∝2𝑇𝐵=∝3𝑇𝐵=∝4𝑇𝐵= 0 against the
alternative hypothesis 𝐻1: ∝1𝑇𝐵≠∝2𝑇𝐵≠∝3𝑇𝐵≠∝4𝑇𝐵≠0. In equation
3.2, where GDP is the dependent variable, 𝑓𝐺𝐷𝑃(𝐺𝐷𝑃|𝑇𝐵, 𝑅𝐸𝑋, 𝑇𝑂𝑃)
the null hypothesis of no cointegration is 𝐻0: ∝1𝐺𝐷𝑃= ∝2𝐺𝐷𝑃=∝3𝐺𝐷𝑃=
∝4𝐺𝐷𝑃= 0 against the alternative hypothesis 𝐻1: ∝1𝐺𝐷𝑃≠∝2𝐺𝐷𝑃≠
∝3𝐺𝐷𝑃≠∝4𝐺𝐷𝑃≠ 0. In equation 3.3, where REX is the dependent
variable, 𝑓𝑅𝐸𝑋(𝑅𝐸𝑋|𝑇𝐵, 𝐺𝐷𝑃, 𝑇𝑂𝑃) the null hypothesis of no
cointegration is 𝐻0: ∝1𝑅𝐸𝑋= ∝2𝑅𝐸𝑋=∝3𝑅𝐸𝑋=∝4𝑅𝐸𝑋= 0 against the
Emerging Trends in Post- Conflict Societies: Challenges and the Way Forward Sri Lanka Economics Research Conference 2014
210
alternative hypothesis 𝐻1: ∝1𝑅𝐸𝑋≠∝2𝑅𝐸𝑋≠∝3𝑅𝐸𝑋≠∝4𝑅𝐸𝑋≠ 0.
Similarly in equation 4, where TOP is the dependent variable,
𝑓𝑇𝑂𝑃(𝑇𝑂𝑃|𝑇𝐵, 𝐺𝐷𝑃, 𝑅𝐸𝑋) the null hypothesis of no cointegration is
𝐻0: ∝1𝑇𝑂𝑃= ∝2𝑇𝑂𝑃=∝3𝑇𝑂𝑃=∝4𝑇𝑂𝑃= 0 against the alternative
hypothesis 𝐻1: ∝1𝑇𝑂𝑃≠∝2𝑇𝑂𝑃≠∝3𝑇𝑂𝑃≠∝4𝑇𝑂𝑃≠0.
This study uses annual data from 1960-2010 (keeping data for 2011-
2012 for forecasting). GDPW contains author’s calculation using GDP
data from International Financial Statistics (IFS). All the other data are
from the Annual Reports of the Central Banka of Sri Lanka. GDP and
export import data series were deflated in 2005 constant price.
The ARDL bounds approach requires the variables not to be integrated
at an order higher than one. Therefore, it is of crucial importance to
verify that the order of integration is not of I(2). To test the null
hypothesis of unit root against the alternative of stationary, two unit
root tests namely Augmented Dickey–Fuller (ADF) and Phillips–
Perron (PP) test (Phillips and Perron, 1988) were performed but results
are not reported for brevity. As per both ADF and PP test results all
the variables were found I(1) in levels, I(0) in first difference and more
importantly, no evidence were found for I(2). Hence, the variables are
qualified to be used in bound testing procedure.
Empirical Results
In the bound testing approach to ARDL, F-statistic is used to test the
existence of long-run relationships. The F-test used for this procedure,
however, does not follow standard F-distribution. Thus, the Pesaran et
al. (1996) computed two sets of critical values for any given

Money in the Economy
211
conventional significance level. One set assumes that all variables are
integrated in order I(0), and the other set assumes that they are all
integrated order I(1).
Table-1 Result of Bound Testing for Cointegration in ARDL
Model
Akaike Information Criterion
Conclusion
ARDL Model ARDL
Lag Length
F-Statistics Presence of Cointegration
𝐹𝑇𝐵(𝑇𝐵|𝑇𝑂𝑃, 𝐺𝐷𝑃, 𝑅𝐸𝑋) 1,2,2,1 6.6842*** YES
𝐹𝑇𝑂𝑃(𝑇𝑂𝑃|𝑇𝐵, 𝐺𝐷𝑃, 𝑅𝐸𝑋, ) 1,0,2,1 1.6558* NO
𝐹𝐺𝐷𝑃(𝐺𝐷𝑃|𝑇𝑂𝑃, 𝑇𝐵, 𝑅𝐸𝑋) 2,0,1,2 5.0474* NO
𝐹𝑅𝐸𝑋(𝑅𝐸𝑋|𝐺𝐷𝑃, 𝑇𝑂𝑃, 𝑇𝐵) 1,1,2,1 1.8186* NO
*** Above the 95% Upper bound critical value
** In-between the 95% bounds
* Below the 95% Lower bound critical value
If the calculated F-statistics exceeds, the upper bound critical value,
then the H0 of no cointegration will be rejected favoring the alternative
that cointegration among the variables. On the other hand, if the
calculated F-statistic is less than the lower bound critical value, then
H0 of no cointegration among the variables cannot be rejected. If F-
statistic falls within the bounds, then the test result is inconclusive and
long-run relationship is indeterminate.
As summarized in Table-1, the bounds test for cointegration concludes
that there is a long-run relationship when and only when the TB is
dependent variable. Accordingly, long-run level coefficients were
estimated and results are depicted in Table-2.

Emerging Trends in Post- Conflict Societies: Challenges and the Way Forward Sri Lanka Economics Research Conference 2014
212
Estimated long-run coefficients suggest that 1% devaluation in the real
exchange rate causes 0.32 % improvement in the trade balance given
all the other factors remain unchanged. Further the results show 1%
increase in trade openness leads to 0.43% deterioration in the trade
balance given all the other factors being equal. This implies that the
possible gain of export promotion through currency devaluation is
partly set off by encouraging imports due to trade openness.
In the Error Correction representation for ARDL model, the error
correction term (results not shown for brevity)estimated to be -0.6145
at 1%significant level suggests that 61% of any short-run deviation
will be corrected at one time period and converge to a long run
equilibrium.
References
1. Allaro, H. B. (2012). “The Impact of Trade Liberalization on the
Ethiopia's Trade Balance”, American Journal of Economics, Vol
2(5): pp 75-81
2. Bahmani-Oskoee, M and Brooks T.J, (1991) “Cointegration
approach to Estimating Bilateral Trade

Money in the Economy
213
3. Chowdhury, K. & Saleh, A.S. (2007). “Testing the Keynesian
Proposition of Twin Deficits in the Presence of Trade
Liberalisation: Evidence from Sri Lanka” Working Paper 07-09,
Department of Economics, University of Wollongong, 2007.
http://www.uow.edu.au/commerce/econ/wpapers.html
4. Islam, M. Q. (2004). “The long run relationship between openness
and government size: evidence from bounds test”, Applied
Economics, Vol. 36, pp. 995–1000
5. Johansen, S. and K. Juselius, (1990). “Maximum likelihood
estimation and inference on cointegration-with application to the
demand for money”. Oxford Bulletin of Economics and Statistics,
Vol. 52 pp169-210
6. Klasra, M. A. (2011). ‘Foreign direct investment, trade openness
and economic growth in Pakistan and turkey: an investigation
using bounds test’ Springer Science Business Media B.V. Qual
Quant (published on line) 45: pp. 223–231
7. Pesaran, M.H., Shin, Y. and Smith, R.J. (2001). “Bounds testing
approaches to the analysis of level relationships”. Journal of
Applied Econometrics, Vol.16. pp 289-326.
8. Phillips P C and Perron P (1988), “Testing for a Unit Root in Time
Series Regression”, Biometrika, Vol. 75, No. 2, pp. 335-346.
9. Rose, Andrew K, and Yellen, Janet.L. (1989), “Is There a J-
Curve?” Journal of MonetaryEconomics, vol.(24), pp 53-68.
10. Rose, Andrew K., (1990), “Exchange Rate and the Trade balance:
Some Evidence from Developing Countries”, Economic Letters,
pp 217-275
11. Shirvani, H., & Wilbratte, B. (1997). The relationship between the
real exchange rate and the trade balance: An empirical
reassessment. International Economic Journal, Vol. 11(1), pp.39-
51.

Emerging Trends in Post- Conflict Societies: Challenges and the Way Forward Sri Lanka Economics Research Conference 2014
214

Money in the Economy
215
[S6/02] Securitization and the Global Financial Crisis
(GFC): What Went Wrong?
Shanuka Senarath a, Richard Copp b
a Department of AFE, Griffith University, Nathan, Australia
[email protected] b Department of AFE, Griffith University, Nathan, Australia
Abstract
The GFC which erupted in 2007 is the worst financial hit since the
Great Depression. Much of the blame for the current GFC has been
attributed to securitisation, Credit Default Swaps (CDSs) and to the
former U.S government’s mandate to financial institutions requiring
relaxed lending criteria on U.S home loans so that voters could be
granted home loans when they could otherwise be unable to do so. The
problem lies not with securitization but securitizing “lemons” and
betting over defaults of those lemons. In contrast to conventional
insurance CDSs which are intended for sophisticated investors, lack in
the insurable interact thus results in a financial bet which ultimately
ends up with a catastrophic systemic risk. Incorporating principles of
insurance inter alia insurable interest would solve most of the problem.
Further to be on the safer side, a proper risk retention mechanism is a
must to discourage lenders assuming excessive risk as facilitated by
the modern ‘originate to distribute’ market model. Using an economic
analysis of law approach, this paper looks in to the manner as to how
the legal provisions and market provisions which existed prior to the
GFC, paved the way for a financial crisis. As far as the market
conditions which consisted then are concerned, the 5% risk retention
provisions introduced by Dodd-frank act are least capable of
answering the actual questions raised by the GFC.
Keywords: Securitization, CDS, GFC, originate-to-
distribute, AIG.

Emerging Trends in Post- Conflict Societies: Challenges and the Way Forward Sri Lanka Economics Research Conference 2014
216
Introduction and research problem
In 2002 President George W. Bush expressed his political ambition of
creating at least 5.5 million new houses by the end of 2010. The project
inter alia includes providing tax rebates for house builders together
with a fund to facilitate down payments for intended buyers (The
White House, 2002). Prior to the GFC, lenders overwhelmed by the
increasing house prices engaged in providing loans for ‘sub-prime’
applicants who would not be eligible for conventional mortgages under
normal circumstances. Lowering their conventional standards, in line
with the government’s political vision; Fannie Mae, Fannie Mae and
private banks engaged in securitizing subprime mortgages (Fishbein,
2006).
Securitization on the other hand coverts illiquid assets into liquid
securities. The process involves lender (commonly a bank) moving the
assets ( it could be home loan mortgages, commercial mortgages,
aircraft leasing etc.) to a bankruptcy remote, ‘orphan’ Special Purpose
Vehicle (SVP), deliberately setup in a tax haven (e.g: Cayman Islands,
British Virgin Islands, Bermuda). The SPV will then re-bundle all the
mortgages it has been assigned and tranche them in to Collateral Debt
Obligations (CDOs). The CDO structure typically comprise up to three
or more tranches. Since the SPV is in a different jurisdiction from its
originator, SVP will not be taxed in the originators jurisdiction (say
the originating bank is in U.S, if the SPV is established in U.S, SPV
will be taxed separately in U.S since it is a separate company from its

Money in the Economy
217
originator). The SPV will issue notes to ‘sophisticated’ investors
around the world, based on the underline assets. Credit Default Swaps
(CDSs) have been used as a means of insuring the notes issued by the
securitiser. In a CDS the lender of money buys a protection against the
default of the borrower. Thus a CDS is an agreement designed to
shifting credit risk between parties. Among other benefits of CDSs,
banks are able to reduce their capital reserve requirements, provided
their landings are protected by a CDS. Prior to the GFC, CDSs were
coupled in massive scale with mortgage backed securities and traded
all over the world. When the initial house prices started declining,
subprime borrowers started defaulting paving way for a crisis to spread
around the world (Fishbein, 2006; Legg & Harris, 2009). This paper
examines the manner in which the legal mechanism behind
securitization paved the way to the GFC. We have come up with a
regulatory framework in order to prevent a similar crisis in future.
Methodology
This paper adopts an economic-analysis-of-law, embedded in the
second best efficiency criteria, following the tradition of Mishan
(2007), Little (2002) and Kolsen (1968).The law creates incentives for
regulatory ‘arbitrage’ opportunities to which securitization schemes
are but one response. Data for this research will be actual
securitization contracts, applicable legislation, and company and
policy reports.

Emerging Trends in Post- Conflict Societies: Challenges and the Way Forward Sri Lanka Economics Research Conference 2014
218
The paper analyses actual securitization arrangements and compares
these against theoretically optimal contracting and regulatory
arrangements derived from the welfare-and financial economics
literatures, which are used as benchmarks for analysis. Significant
shortfalls between actual and theoretically optimal arrangements form
the basis of recommendations for reform to law or practice, either in
the interests of ‘better’ contractual design or (perhaps) more effective
regulatory design, whether within or between jurisdictions. The
formulated benchmark (or in other words, the theoretically best
provisions) may not be achievable in the practical world due to
constrain (i.e consumer protection considerations). Thus our analysis
essentially follows the second-best efficacy criteria.
Results and findings
A typical Securitization scheme is vulnerable to changes in asset
prices. When the borrower defaults and the house prices decline the
secured investors become partially unsecured. On one hand the
‘originate-to-distribute’ model suggests that banks lack incentives to
screen their borrowers since loans are made not to retain but to sell in
contrast to the conventional ‘originate-to-hold’ financial practice. Lack
of insurable interest associated with CDS contracts results in shifting
the mode of a CDS contract from a typical insurance to a ‘bet’.
This same phenomenon resulted in bankruptcy in big corporate players
like AIG and Lehman Brothers, ultimately spreading the financial
collapse from one company to the other and from one country to
another, resulting in the GFC. Lenders lack interest in ex-ante and ex-
Money in the Economy
219
post monitoring the borrower, due to the fact the CDSs cover the risk
of default. Further, we suggest that the 5% risk retention rule enacted
by the Dodd-frank Act is ineffective, since even prior to the GFC
lenders did not sell subordinate notes (known as toxic waste in
financial jargon) of a securitization scheme. It had been the practice
prior to the GFC for sponsoring banks to hold toxic waste in their
balance sheets, since it is not possible to gain an insurance cover for
this high risk and unrated notes. On the other hand these notes yield a
higher interest compared to other senior notes. However this practice
did not prevent the lender assuming successive risk, though the same
practice has been enacted as the Dodd-frank Act recently. Post GFC
literature on CDSs insurance (some classify it as non-traditional
insurance) identifies that CDSs result in systemic risk in financial
distress.
Conclusions, implications and significance
In this manner the mechanism behind securitization identifies two
main issues with securitization which paved the way to the current
GFC. Firstly, securitising lemons and then secondly, by betting over
securitized lemons. The first includes the disease into the system and
the latter spread the disease. Now the question arises “as to whether
there a possibility of a similar crisis again?” The answer to the question
is ‘yes’.
The GFC was fuelled by sub-prime lending in the United States.
Regulatory arbitrage, financial innovation coupled with excess
liquidity contributed in building the housing bubble. When the bubble
Emerging Trends in Post- Conflict Societies: Challenges and the Way Forward Sri Lanka Economics Research Conference 2014
220
burst the crisis spread to the rest of the world via contagion and
contractual interdependency. Fixing the contractual loopholes (in case
of contractual interdependency) and optimal regulation (in case of
contagion) are crucial to prevent a similar crisis in the future. Thus
reframing CDSs as ‘proper’ insurance which was proposed by the
Derivative Markets Transparency and Accountability Act of 2009
(which was not enacted however), with insurable interest in utmost
important to prevent CDSs business turning into a bet, which is
essential to protect the CDSs provider (e.g. AIG or Lloyds of London)
in a case of multiple defaults. Application of the principle ‘excess’
(similar to conventional insurance) would result in the lender having
skin in the game, and thus discourage to assume excessive risk as an
alternative to non-effective risk retention rule made by the Dodd-frank
Act. We further recommend a precautionary principle, similar to the
rule exercised by the Chinese regulatory authorities which prevents
any financial innovation entering the market without prior approval of
the financial authorities.
References
1. Dodd–Frank Wall Street Reform and Consumer Protection Act
2010. Derivative Markets Transparency and Accountability Act of
2009.
2. Fishbein, A. J &Wooddall, P 2006, ‘Exotic or Toxic? An
Examination of the Non-Traditional Mortgage Market for
Consumers and Lenders’, Consumer Federation of America.
3. Kolsen, H. M 1968, Economics and Control of Road-Rail
Competition, University of Queensland Press, Brisbane

Money in the Economy
221
4. Legg, M., and Harris, J 2009, “How the American Dream Became
a Global Nightmare: An Analysis of the Causes of the Global
Financial Crisis”, University of New South Wales Law Journal,
32(2): 350-389.
5. Little I.M.D 2002, Ethics, Economics and Politics: Principles of
Public Policy, Oxford University Press, Oxford UK.
6. Mishan E. J., &Quah E 2007, Cost Benefit Analysis (5th ed),
Routledge, Oxford UK.
7. The White House 2002, A home of your own: Expanding
opportunities for all Americans, retrieved from http://georgewbush
hitehouse.archives.gov/infocus/homeownership/homeownership-
policy-book-execsum.html>.

Emerging Trends in Post- Conflict Societies: Challenges and the Way Forward Sri Lanka Economics Research Conference 2014
222

Money in the Economy
223
[S6/03] Are monetarists’ arguments on the demand for
broad money valid in the Sri Lankan context?
Chandika Gunasinghe,
Department of Economics, University of Ruhuna, Matara, Sri Lanka
K.H. Nandasiri Department of Economics, University of Ruhuna, Matara, Sri Lanka
Sarath Katukurunda
Department of Economics, University of Ruhuna, Matara, Sri Lanka
Abstract
This paper examines the validity of the monetarist version of money
demand function for Sri Lanka using the quarterly data for the period
from 1988:Q1 to 2012:Q4 generated from interpolation techniques
developed by Goldstein and Khan (1976). As all the variables in the
study are integrated in order one at levels, this study uses Johansen
and Juselius (1990) multivariate method and Granger’s (1987) two-
step method to derive co-integration relationships. Our findings
suggest that broad money demand in Sri Lanka is unitary income
elastic under both co-integration approaches used and hence
coincides with monetarists’ version of money demand function. This
means that 1% change in real GDP cause equal 1% change in demand
for real money balances. Furthermore, it reveals that the real demand
for broad money decreases by 0.06%.when the inflation rate increases
by 1%. Similarly 1 % increase in Treasury bill rate leads to 0.03%
decrease in money demand. This implies that the public in Sri Lanka
tend to substitute money for more real assets than alternative financial
assets during the time of high inflation. Also, we found evidences that
the income velocity is constant over time and broad money demand
function is stable over time.
Key Words: Cointegration, Money demand, Income lasticity, income
velocity, Sri Lanka Authors are grateful to useful comments given by anaonimous referees.
Emerging Trends in Post- Conflict Societies: Challenges and the Way Forward Sri Lanka Economics Research Conference 2014
224
Introduction and Research problem
This paper is focused on the practically testing of theoretical arguments
made by monetarists on the demand for money. The income and
interest rate elasticity’s of money demand are at the core of the most
basic macroeconomic models such as the IS-LM model where the
effectiveness of monetary policy depends on the elasticity of money
demand. For any country, a stable demand for money function is
necessary to conduct an effective monetary policy if a monetary
aggregate is targeted. It helps to select correct and efficient policy
instruments in order to influence the final goal via the appropriate
intermediate targets.
A stable demand for money function helps to understand the behaviour
of the monetary transmission mechanism of the economy. This means
that the channels or mechanism whereby the monetary influences are
transmitted to other sectors of the economy particularly to both
financial and commodity markets. Furthermore, the structural
coefficients of the demand for money function give important policy
guidelines. For example, according to the quantity theory of money
(QTM), income elasticity must be unity so that the excess money
supply can operate the expenditure mechanism in the economy and to
test the constancy of velocity that is a key assumption of the monetarist
view. However it should be emphasized that although the income
elasticity equals unity, it is not a necessary condition for the velocity
to be constant over time.

Money in the Economy
225
Therefore, following three issues are addressed in this paper;
(i). Is the income elasticity of money demand unity in terms of broad
money (m2) demand relationship?
(ii). Is the inverse velocity constant over time in terms of broad
money?
(iii). Is the broad money demand function stable over time?
Estimation of money demand functions are extensively explored area
in empirical research. But a limited number of studies are available in
relation to the Sri Lankan experience. Among those studies,
Dheerasinghe (1990) had used error correction approach (Engle -
Granger (1987) two step method) to the money demand modelling in
Sri Lanka based on quarterly data from 1971-1985. Other Sri Lankan
studies in terms of money demand function have been paid only for
identifying factors that determine money demand. These studies
include Jayatissa (1984), Ranaweera (1971)Weliwita and
Ekanayake(1998), and Wijewardena (1985). However, these papers
are not focused on the important issues that are directly related to the
the monetarist arguments except the studies done by Dharmaratne
(2009) and Gunasinghe (2006).
Methods
The demand for money relevant to this paper is the aggregate demand
for broad money (m2) of the public (people, firms... etc.) as a whole.
According to Friedman the following are the key determinants of the
money demand function: total wealth (Wt), expected alternative rate

Emerging Trends in Post- Conflict Societies: Challenges and the Way Forward Sri Lanka Economics Research Conference 2014
226
of return on money (Rbt), and expected rate of return on other
assets (infe ).
That is; m2t = f (Wt, Rbt, infe)
Therefore, broad money demand function can be specified as
following;
m2t =
1yt + 2infe + 3R91TBt +
t........................................(1)
Here all the variables are in real terms except inflation. Income and
money supply are in logarithms except the three-month real Treasury
bill rate (R91TBt).The unobservable expected inflation, infe, is
replaced by an observable inft since et =inf-infe, et~I(0). Hence the
final equations take the following form;
m2t = 1yt + 2inft + 3R91TBt+ ut...................................... (2)
Where ut = t - 2et ~ IDD (0, )
Based on equation 2 four models are estimated:
m2t = 1yt + ut.............................................................. (Model -1)
m2t = 1yt + 3R91TBt+ ut.......................................... (Model -2)
m2t = 1yt + 2inft + 0+ut......................................... (Model -3)
A time variable, t, is included in the fourth model to capture the input
growth and technical progress in the financial market (Hendry and
Mizon 1993) as follows.
m2t = 1yt + 2inft + 3R91TBt+ t+ ut ....................(Model-4)
Finally, all four models mentioned above are estimated based on
following test equation;

Money in the Economy
227
)3...(..............................1
1
1 tit
p
i
itt XXX
Where Xt = (m2t, yt, inf, R91TBt, t)/ and t runs from 1 to T. is a 4 x
1 matrix of unknown
Coefficients.
1
1
p
ij
ji for 1,2,1 pi ( denotes parameters of
VAR model comprising 4 × 4 matrices). /),0(~ andt is a
4 × 4 matrix whose rank determines the number of co-integration
vectors among four variables in vector, Xt. / and are 4 × r and r
× 4 matrices respectively. r is the number of cointegration vectors to
be determined by Max and Trace testes.
The sample and data
The sample period of the study ranges from 1998:Q1 to 2012:Q4.
Quarterly data were derived from annual observations for relevant
variables using the method proposed by Goldstein and Khan (1976).
GDP deflator (1996=100) is used as the general price index to convert
nominal values into real values of respective variables and to measure
the rate of inflation of the economy. Following are the variables used
in the study:
LRM2t =Logged values of real broad money supply (M1(cash held
by public and demand deposits held by public at
commercial banks) + times and savings deposits held by
public at commercial banks)
LRGDPt = Logged values of real gross domestic product (or logged
of real income)
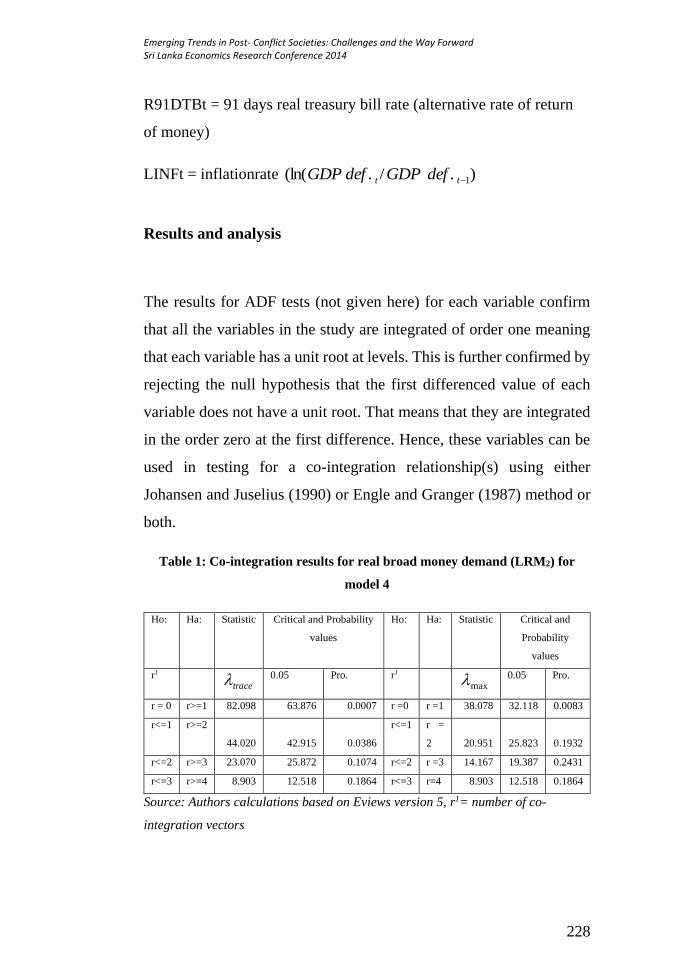
Emerging Trends in Post- Conflict Societies: Challenges and the Way Forward Sri Lanka Economics Research Conference 2014
228
R91DTBt = 91 days real treasury bill rate (alternative rate of return
of money)
LINFt = inflationrate )./.(ln( 1tt defGDPdefGDP
Results and analysis
The results for ADF tests (not given here) for each variable confirm
that all the variables in the study are integrated of order one meaning
that each variable has a unit root at levels. This is further confirmed by
rejecting the null hypothesis that the first differenced value of each
variable does not have a unit root. That means that they are integrated
in the order zero at the first difference. Hence, these variables can be
used in testing for a co-integration relationship(s) using either
Johansen and Juselius (1990) or Engle and Granger (1987) method or
both.
Table 1: Co-integration results for real broad money demand (LRM2) for
model 4
Ho: Ha: Statistic Critical and Probability
values
Ho: Ha: Statistic Critical and
Probability
values
r1 trace
0.05 Pro. r1 max
0.05 Pro.
r = 0 r>=1 82.098 63.876 0.0007 r =0 r =1 38.078 32.118 0.0083
r<=1 r>=2
44.020 42.915 0.0386
r<=1 r =
2 20.951 25.823 0.1932
r<=2 r>=3 23.070 25.872 0.1074 r<=2 r =3 14.167 19.387 0.2431
r<=3 r>=4 8.903 12.518 0.1864 r<=3 r=4 8.903 12.518 0.1864
Source: Authors calculations based on Eviews version 5, r1= number of co-
integration vectors
Money in the Economy
229
Only the results of Johansen’s cointegration test related to model 4 are
given in Table 1. The results given above show that the model has a
single long run relationship under max test whereas it has two long run
relationships under trace test.
The estimation results obtained using both Johansen’s and Granger’s
methods for four models specified before are given in Table 2 and 3.
The results of model 1, 2 and 3 given in Table 2 (first three columns)
show that not only the estimates attached to the real income variable
in the money demand function are exactly equal to one but also they
are highly significant with the correct signs. The same estimate in
model 3 is also close to one with a very high t-value meaning that it is
an extremely significant determinant in the money demand function.
This further means that when the real GDP increases by 1% per a
quarter the demand for real broad money also increases by the same
percentage per a quarter. These findings support to the monetarist’s
claim that the income elasticity of broad money demand is equal to
one.
In terms of policy, it suggests that Central Bank should keep money
supply increasing at a rate equal to the real GDP growth rate to the
maintain price level constant. Any increase of money supply in excess
to real GDP growth will be added to inflation. In other words, growth
rate of money supply follows the growth rate of nominal GDP when
income elasticity of money demand is unity. This theoretical
concussion is apparent in Sri Lankan context in most of the years
during the study period (See figure- 01).
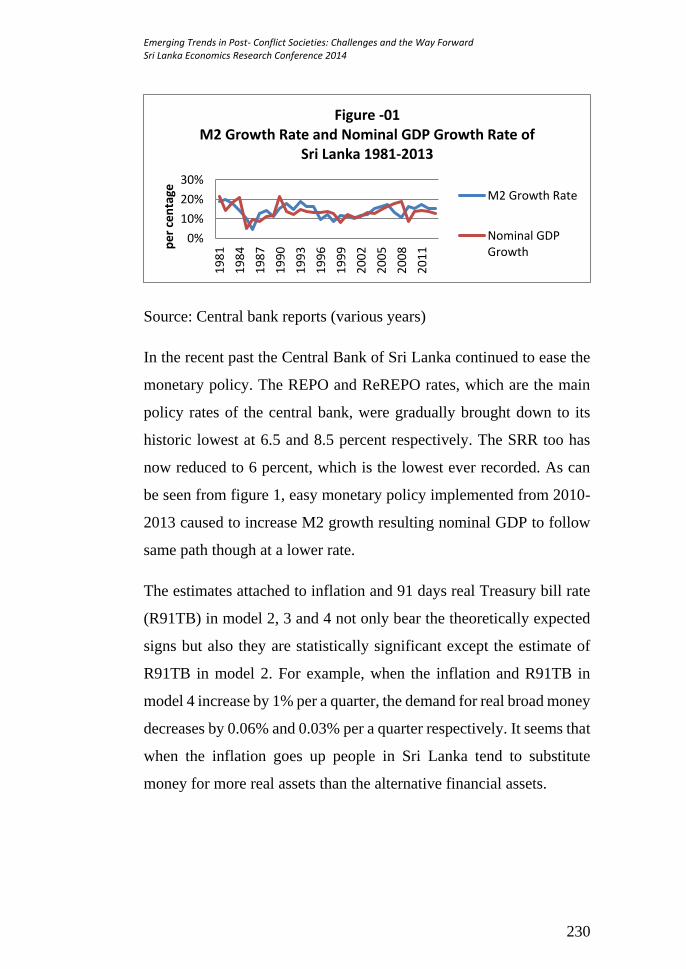
Emerging Trends in Post- Conflict Societies: Challenges and the Way Forward Sri Lanka Economics Research Conference 2014
230
Source: Central bank reports (various years)
In the recent past the Central Bank of Sri Lanka continued to ease the
monetary policy. The REPO and ReREPO rates, which are the main
policy rates of the central bank, were gradually brought down to its
historic lowest at 6.5 and 8.5 percent respectively. The SRR too has
now reduced to 6 percent, which is the lowest ever recorded. As can
be seen from figure 1, easy monetary policy implemented from 2010-
2013 caused to increase M2 growth resulting nominal GDP to follow
same path though at a lower rate.
The estimates attached to inflation and 91 days real Treasury bill rate
(R91TB) in model 2, 3 and 4 not only bear the theoretically expected
signs but also they are statistically significant except the estimate of
R91TB in model 2. For example, when the inflation and R91TB in
model 4 increase by 1% per a quarter, the demand for real broad money
decreases by 0.06% and 0.03% per a quarter respectively. It seems that
when the inflation goes up people in Sri Lanka tend to substitute
money for more real assets than the alternative financial assets.
0%
10%
20%
30%
19
81
19
84
19
87
19
90
19
93
19
96
19
99
20
02
20
05
20
08
20
11p
er
cen
tage
Figure -01M2 Growth Rate and Nominal GDP Growth Rate of
Sri Lanka 1981-2013
M2 Growth Rate
Nominal GDPGrowth

Money in the Economy
231
Table 2: Estimation results obtained using Johansen’s
multivariate method Dependent variable: Logged of real broad money (LRM2t)
Method: Johansen and Juselius (1990) multivariate cointegration technique
t-values are given in parenthesis
Independent
variables
Model-1 Model -2 Model-3 Model-4
LRGDP 1.02
(36.00)
0.97
(32.00)
1.00
(52.36)
0.86
(4.56)
LINF - - -0.07
(-5.57)
-0.061
(7.15)
R91TB - -0.017
(-1.16)
- -0.027
(3.29)
Constant - - -1.10
(-4.55)
-
Trend - - - 0.0016
(0.6)
Source: authors calculations based on Eviews version 5
The results obtained by employing Granger’s method for four models
are given in Table 3. It is very interesting to note the results in Table 3
are almost similar to those in Table 2. Furthermore, it has been proven
that when variables in levels are cointegrated in Engle and Granger
(1987) method, the OLS estimates become super consistent. Therefore,
as variables in all four models mentioned below are cointegrated, their
estimates are super-consistent.
Therefore, these results repeatedly confirm the strong acceptance of
The stability of the money demand function, which is a crucial
requirement to make correct and reliable policy forecasts, was tested
based on recursive coefficients and cumulative sum of squared
residuals (CUSUM) of model 4 which was estimated using Granger’s

Emerging Trends in Post- Conflict Societies: Challenges and the Way Forward Sri Lanka Economics Research Conference 2014
232
two-step approach to cointegration (results are not shown here). The
results revealed that the broad money demand function (Model 4)
holds the stability properties. The result also finds an important link
between the velocity of money and the stability of money demand
function.
Table 3: Estimation results obtained using Granger’s (1987)
two-step method
Dependent variable: Logged of real broad money (LRM2t)
Method: Johansen and Juselius (1990) multivariate cointegration technique
t-values are given in parenthesis
Independent
variables
Model-1 Model
-2
Model-
3
Model-4
LRGDP 1.06
(90.30)
1.05
(80.32)
1.05
(91.86)
0.90
(626.65)
LINF - - -0.013
(-2.97)
-0.012
(-2.63)
R91TB - -0.0095
(-1.99)
- -0.0068
(-1.46)
Constant -1.86
(-12.30)
-1.70
(-
10.39)
-1.76
(-12.20)
-
Trend - - - 0.002
(10.07)
Error term in
Granger’s
method:
I(0) I(0) I(0) I(0)
Conclusion Variables are cointegrated in levels in four models
Source: authors calculations based on Eviews version 5

Money in the Economy
233
Conclusions, implications and significance
This paper examines the validity of the monetarist version of money
demand function for Sri Lanka using Johansen and Juselius (1990)
Multivariate and Engle and Granger (1987) two-step methods for
cointegration. Our findings suggest that the broad money demand in
Sri Lanka is unitary income elastic and hence coincides with
monetarists’ version of money demand function. It reveals that the real
demand for broad money decreases when the inflation rate increases.
Similarly, increase in Treasury bill rate leads decrease in broad money
demand. This implies that public in Sri Lanka tend to substitute money
for more real assets than the alternative financial assets during the time
of high inflation. These findings are novel in the Sri Lankan context
and thus will be useful in monetary policy formulation. Also, this study
provides evidences that the income velocity is constant over time and
broad money demand function is stable over time.
However, these results are completely different from findings in
Dharmaratne’s (2009) study where he confirmed that broad money
demand (M2) is not cointegrated with any of the independent variables
selected such as real income and interest rate.
References
1. Annual Reports, Central bank of Sri Lanka (various years)
2. Dheerasinghe, R (1988), Error Correction Approach to the
Demand for Money in Sri Lanka,
Emerging Trends in Post- Conflict Societies: Challenges and the Way Forward Sri Lanka Economics Research Conference 2014
234
3. Staff Studies, Vol 18 (182), pp. 1-50, Central Bank of Sri
Lanka.
4. Engle R.F. and Granger, C.W.J. (1987), Co-integration and
error correction: Representation, estimation and testing,
Econometrica, Vol. 55 (2), pp. 251–276.
5. Goldstein, M. and Khan, M.S.(1976), Large Versus Small
Price Changes in the Demand for Imports, IMF Staff Papers,
23,200-225.
6. Gunasinghe, W.I.C.S (2006), The Demand for Money in Sri
Lanka: A Vector Error Correction Approach, in Proceedings of
the 9th International Conference on Sri Lankan Studies: Sri
Lanka at Crossroads: Continuity and Change’,Amarasinghe, S,
Fonseka,
7. E.A.G and Ruuskanen, D.D.K (eds) Sri Lanka: University of
Ruhuna, July 2006, pp. 096-112.

Money in the Economy
235
[S6/04] Impact of Interest Rate on Investment, in the Sri
Lankan Context: A Study on the Effectiveness of
Monetary Policy
S.N.K.Mallikahewa
Department of Economics, University of Colombo, Sri Lanka [email protected]
______________________________________________________
Abstract
The study investigates whether interest rates affect negatively on
investment led economic growth. In this study, private and public
corporation capital formation (PPCCF) is taken as the dependent
variable and Central Bank Rest (CBR) and real gross domestic income
(RGDP) are taken as independent variables. The civil war which was
experienced in the country is used for the analysis as a dummy
variable. The data from the period ranging from 1978- 2013 is used
for the study. Vector Error Correction test through Co-integration
methodology is applied to estimate the long-run model and the short-
run dynamics of investment. The variables; interest rate (CBR) and
income (RGDP) are positively related with investment in the long-run
in the Sri Lankan context. The positive coefficient of income is
significant and consistent with the hypothesis. Positive coefficient of
interest rate is significant but inconsistent with the insights. The
inverse relationship between investment and interest rate is not there
in the Sri Lankan context. According to short run dynamics represented
in the Vector Error Correction Model, 85% of the disequilibrium ) in
investment is adjusted towards equilibrium within a one year period.
Interest rate, income and the civil war jointly affected investment
expenditure in Sri Lanka.
Keywords: Interest rate, private and public corporation capital
formation, Real Income, Vector Error Correction
methodology, Co-integration methodology.

Emerging Trends in Post- Conflict Societies: Challenges and the Way Forward Sri Lanka Economics Research Conference 2014
236
Introduction and research problem
The study focuses on to investigate the effectiveness of interest rate to
encourage investment through the monetary policy for achieving
economic stability of the country. If interest rate elasticity of
investment32 is negative, expansionary monetary policy can achieve
higher economic growth through higher investments and higher
employment performance which will increase the aggregate demand.
In period of recession, policy makers consider an expansionary
monetary policy lowering interest rates to increase investment and
aggregate demand and then achieve higher economic growth. Lower
interest rates encourage investments due to the low cost of investment
funds.
To meet the expectations of monetary policy there should be a negative
relationship between interest rate and investment expenditure.
Examining whether there is a negative relationship between interest
rate and investment is important to the effectiveness of monetary
policy in the context of Sri Lanka. In the Sri Lankan experience,
expansionary monetary policy through low interest rates implemented
in the recovering period of the crisis does not make any significant
influence on investment. As the experiences show the banking sector
has been unable to expand lending on investment as expected in the
periods conducted under the expansionary monetary policy. This
situation makes a doubt as to whether investment is not sensitive to
changes in interest rate in the Sri Lankan context.
32The responsiveness of investment to changes in interest rate

Money in the Economy
237
Objectives of the study:
To investigate interest rate sensitivity of investment.
To investigate income sensitivity of investment.
To investigate whether the ethnic crisis has affected investment
or not.
To investigate the effectiveness of the interest rate channel of
monetary transmission mechanism in Sri Lanka.
This study works on the hypotheses that (1) Interest rate affects a
change in aggregate expenditure and changes output and price level
and (2) The income elasticity of investment is positive.
Methodology
The study uses the Dickey-Fuller test (DF test) 33 to confirm the
stationary of the variables and the test results show that all variables;
(PPCCF), (CBR), and (RGDP) are non-stationary (I (1)) variables. If
multiple individual time-series variables are non-stationary integrated
of order one (I(1) series), The vector error correction (VEC) model
through co-integration test is employed to estimate the both long run
relationship and the short run dynamics among the variables in the
investment model from the period 1978to 2013. VAR method does
not capture non-linear elements that exist with certainty in level
variables because a VAR is a linear model. The better way to respond
33 In statistics, the Dickey–Fuller test tests whether a unit root is present in
an autoregressive model. (To check whether series are stationary or non-stationary)
It is named after the statisticians D. A. Dickey and W. A. Fuller, who developed the
test in 1979

Emerging Trends in Post- Conflict Societies: Challenges and the Way Forward Sri Lanka Economics Research Conference 2014
238
to this problem is to linearize the data by taking the logs of the levels.
For this testing purpose, the original data of all series: PPCCF, CBR,
and RGDP were transformed to log, and the new variables are named
as log of private and public corporation capital formation (LPPCCF),
Log of Central Bank Rate (LCBR) and Log of Real Gross Domestic
Product (LRGDP). Akaike information criterion test is applied to
select the lag length and Granger Causality test is done for cross check
the causality between series.
Johansson co-integration methodology is conducted using Eviews 07
to test whether there are any long run relationships among the set of
non-stationary variables; LPPCCF, LCBR, and LRGDP.
Results and findings
According to the lag length criteria, Akaike information criterion
showed that lag length should be one, and granger causality test proved
that there is one-way causality between PPCCF and RGDP and there
is no causality between investment and interest rate. Because the Engel
Granger two way tests proved that three series are integrated, all three
variables are used to run the co-integration test and the test results are
given below.
Table 01 Result of the co-integration test 1
Hypothesized
No. of CE(s)
Eigenvalue Trace
statistics
5%critical
value
probability
None * 0.639058 46.81611 29.79707 0.0002
At most 1 0.213240 12.16884 15.49471 0.1490
At most 2 * 0.111371 4.014574 3.841466 0.0451
* denotes rejection of the hypothesis at the 0.05 level
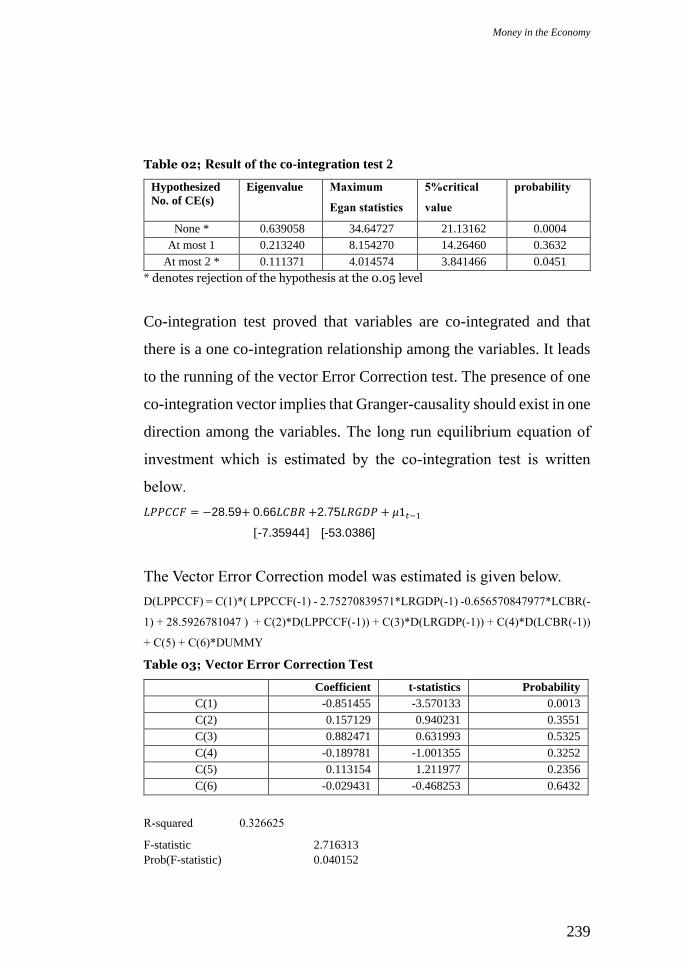
Money in the Economy
239
Table 02; Result of the co-integration test 2
Hypothesized
No. of CE(s)
Eigenvalue Maximum
Egan statistics
5%critical
value
probability
None * 0.639058 34.64727 21.13162 0.0004
At most 1 0.213240 8.154270 14.26460 0.3632
At most 2 * 0.111371 4.014574 3.841466 0.0451
* denotes rejection of the hypothesis at the 0.05 level
Co-integration test proved that variables are co-integrated and that
there is a one co-integration relationship among the variables. It leads
to the running of the vector Error Correction test. The presence of one
co-integration vector implies that Granger-causality should exist in one
direction among the variables. The long run equilibrium equation of
investment which is estimated by the co-integration test is written
below.
𝐿𝑃𝑃𝐶𝐶𝐹 = −28.59+ 0.66𝐿𝐶𝐵𝑅 +2.75𝐿𝑅𝐺𝐷𝑃 + 𝜇1𝑡−1
[-7.35944] [-53.0386]
The Vector Error Correction model was estimated is given below.
D(LPPCCF) = C(1)*( LPPCCF(-1) - 2.75270839571*LRGDP(-1) -0.656570847977*LCBR(-
1) + 28.5926781047 ) + C(2)*D(LPPCCF(-1)) + C(3)*D(LRGDP(-1)) + C(4)*D(LCBR(-1))
+ C(5) + C(6)*DUMMY
Table 03; Vector Error Correction Test
Coefficient t-statistics Probability
C(1) -0.851455 -3.570133 0.0013
C(2) 0.157129 0.940231 0.3551
C(3) 0.882471 0.631993 0.5325
C(4) -0.189781 -1.001355 0.3252
C(5) 0.113154 1.211977 0.2356
C(6) -0.029431 -0.468253 0.6432
R-squared 0.326625
F-statistic 2.716313
Prob(F-statistic) 0.040152
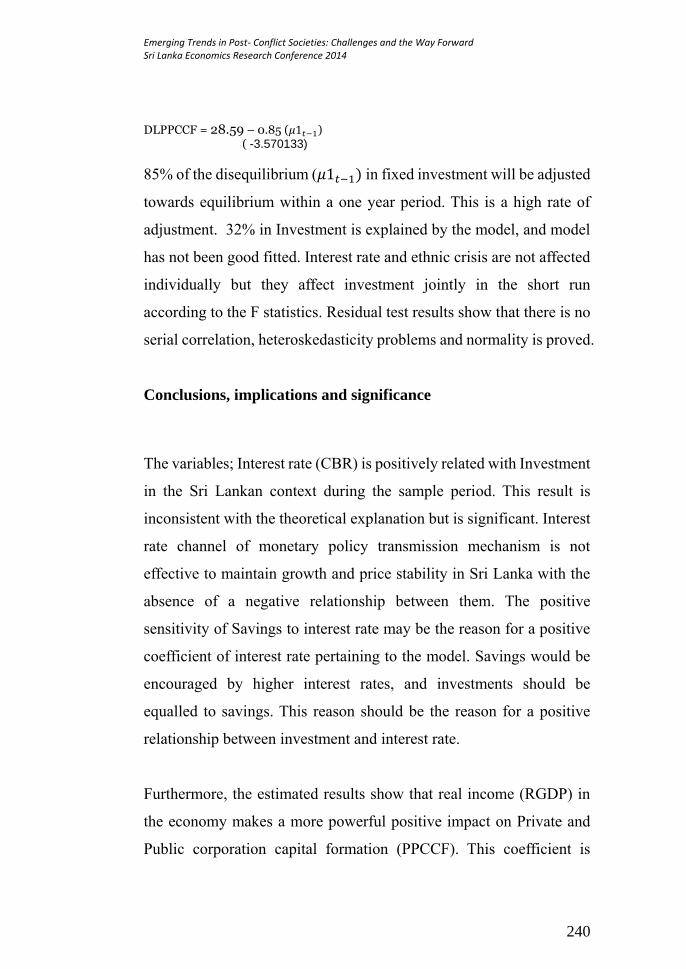
Emerging Trends in Post- Conflict Societies: Challenges and the Way Forward Sri Lanka Economics Research Conference 2014
240
DLPPCCF = 28.59 – 0.85 (𝜇1𝑡−1) ( -3.570133)
85% of the disequilibrium (𝜇1𝑡−1) in fixed investment will be adjusted
towards equilibrium within a one year period. This is a high rate of
adjustment. 32% in Investment is explained by the model, and model
has not been good fitted. Interest rate and ethnic crisis are not affected
individually but they affect investment jointly in the short run
according to the F statistics. Residual test results show that there is no
serial correlation, heteroskedasticity problems and normality is proved.
Conclusions, implications and significance
The variables; Interest rate (CBR) is positively related with Investment
in the Sri Lankan context during the sample period. This result is
inconsistent with the theoretical explanation but is significant. Interest
rate channel of monetary policy transmission mechanism is not
effective to maintain growth and price stability in Sri Lanka with the
absence of a negative relationship between them. The positive
sensitivity of Savings to interest rate may be the reason for a positive
coefficient of interest rate pertaining to the model. Savings would be
encouraged by higher interest rates, and investments should be
equalled to savings. This reason should be the reason for a positive
relationship between investment and interest rate.
Furthermore, the estimated results show that real income (RGDP) in
the economy makes a more powerful positive impact on Private and
Public corporation capital formation (PPCCF). This coefficient is

Money in the Economy
241
highly significant and consistent with the hypothesis. Higher income
affects positively on savings and investment would be equal to
investment. Ethnic conflicts situation does not affect in investment.
According to short run dynamics, 85% of the disequilibrium (𝜇1𝑡−1) in
fixed investment will be adjusted towards equilibrium within a one
year period. Estimated long run and short run models can explain the
weakness of interest to encourage investment and to conduct monetary
policy.
References
1. Amarasekara,C. (2005). “Interest Rate Pass Through in Sri Lanka
Staff Studies; Colombo, Sri Lanka.Vol. 35 No. 1& 2
2. Bader, M. & Malawi, A. I. (2010). “The Impact of Interest Rate on
Investment in Jordan:ACointegration Analysis”.JKAU: Econ. &
Adm., Vol. 24 No. 1, pp: 199-209
3. Clarida, R., Gali J. & Gertler, M. (1999). The Science of Monetary
Policy: A New Keynesia Perspective”. NBER Working Paper No.
7147 http://www.nber.org/papers/w7147.
4. Taylor J.B. (1995). “The Monetary Transmission Mechanism: An
Empirical Framework”.The Journal of Economic
a. Perspectives.Volume 9. No.4. P. 11-26GRIPS Discussion
Paper 13-13.

Emerging Trends in Post- Conflict Societies: Challenges and the Way Forward Sri Lanka Economics Research Conference 2014
242
Money in the Economy
243
[S6/05] Effectiveness of the Credit Channel for Curbing
Inflation in Sri Lanka
S.N.K.Mallikahewa
Department of Economics,University of Colombo, Sri Lanka
W.E.Piumini Perera Department of Economics, University of Colombo, Sri Lanka
Abstract
This study mainly aims to investigate the viability and the effectiveness
of credit channel of monetary policy transmission mechanism to
maintain the price stability in Sri Lanka by especially focusing on the
bank lending channel. A VECM model preceded by a co-integration
test has been developed to pursue this objective by using the annual
data for the period from 1980 to 2012. The conclusion of the study
reveals that the particular bank lending channel is effective in Sri
Lanka during the period covered by the study and further found that a
positive and statistically significant relationship exists between total
credit to private sector and the general price level. Same as it has
avowed that the effect of credit availability on the general price level
is much stronger than that of interest rate and the exchange rate on
the general price level.
Keywords: Bank Lending Channel, Co-integration Test, Price level,
Unit Root Test, Vector Error Correction Test,
Emerging Trends in Post- Conflict Societies: Challenges and the Way Forward Sri Lanka Economics Research Conference 2014
244
Introduction and research problem
Central Bank of Sri Lanka (CBSL) has as its primary goal the
maintenance of growth and price stability. In order to achieve these
goals, especially the latter, different monetary policy instruments are
used taking into consideration the channels through which the
monetary policy operations are transmitted to the macroeconomic
variables such as the rate of inflation and the GDP. In the Sri Lankan
context, the most popular and highly valued monetary transmission
channel is the interest rate channel. But recent research findings have
identified and proved empirically that the interest rate channel is less
effective. Following these observations, this study intends to test
another important channel ie. Credit channel of the monetary
transmission mechanism with special reference to Sri Lankan
experiences in the last 30 years.
Mallikahewa (2013) has evaluated the effectiveness of interest rate
channel for controlling price level in the Sri Lankan context. From this
study Mallikahewa has come to a conclusion which opposes that
conventional view on interest rate channel emphasizing that higher
fixed deposit interest rate leads to higher price level and higher interest
rates persuade people to save money in fixed deposits in Sri Lanka.
An important fact relating to the present study has been revealed by
this study. This study indicates the fact that ”credit channel of
monetary policy transmission mechanism is more effective than
interest rate channelling to achieve the price stability as well as growth
stability in relation to Sri Lanka” (Mallikahewa 2013). This study aims
to test whether the credit channel of the monetary policy is effective or

Money in the Economy
245
not in the Sri Lankan context by mainly focusing on the bank lending
channel.
Methodology
Annual data for the period ranging from 1980 to 2012 which have been
taken from various CBSL annual reports, will be used in the inflation
model of this study. The variables used as proxies to build the model
include the level data of Colombo Consumer Price Index (CCPI),
Fixed Deposit Rate (FDR), Total Credit to Private Sector (TCPS) by
the commercial banks and the Exchange Rate (Exchange Rate). CCPI
with different base years will be converted in to one specific base year
which is 2002. Exchange rate has been taken in terms of the domestic
rupee value for the US dollar. In order to avoid hetroscadasticity
problem all the variables will be converted in to log values. Time series
data will be initially subjected to unit root test in order to see whether
the time series data are stationary or non-stationary. In order to identify
the long run relationship between variables, the cointegration test will
be employed. Vector Error Correction model will be applied to build
up the model which captures both long run and short run dynamics.
Following equation shows the long run inflation function which is
based on the theoretical and empirical findings of the other related
studies.
LCPI = β0 +β1 LTCPS- β2 LFDR +β3 LER+ u t-1
β0 - Constant of the Inflation function
β1 - Credit elasticity of Inflation
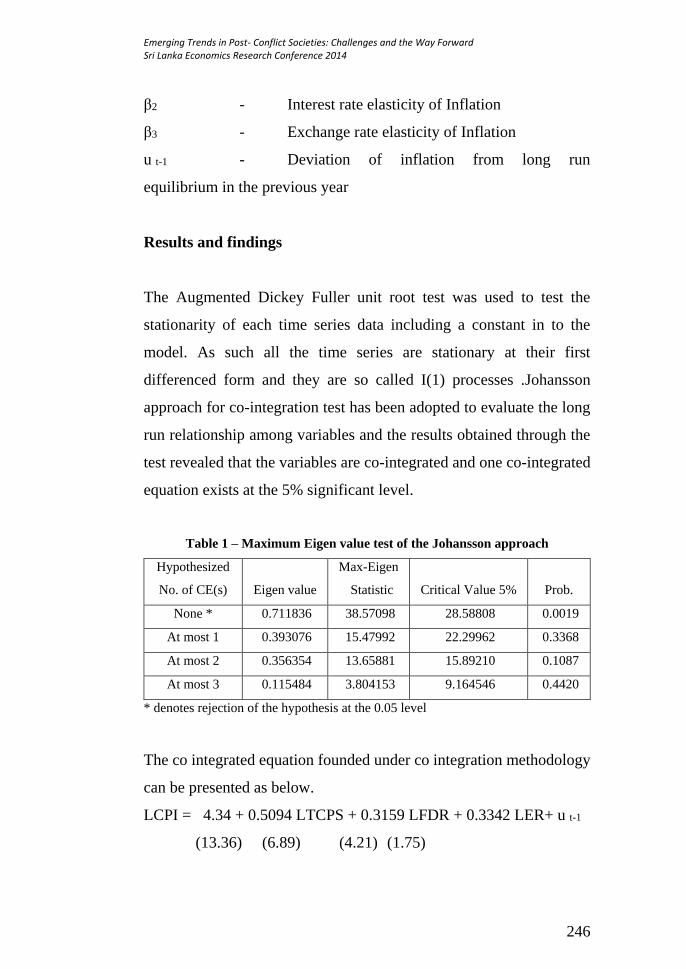
Emerging Trends in Post- Conflict Societies: Challenges and the Way Forward Sri Lanka Economics Research Conference 2014
246
β2 - Interest rate elasticity of Inflation
β3 - Exchange rate elasticity of Inflation
u t-1 - Deviation of inflation from long run
equilibrium in the previous year
Results and findings
The Augmented Dickey Fuller unit root test was used to test the
stationarity of each time series data including a constant in to the
model. As such all the time series are stationary at their first
differenced form and they are so called I(1) processes .Johansson
approach for co-integration test has been adopted to evaluate the long
run relationship among variables and the results obtained through the
test revealed that the variables are co-integrated and one co-integrated
equation exists at the 5% significant level.
Table 1 – Maximum Eigen value test of the Johansson approach
Hypothesized
No. of CE(s) Eigen value
Max-Eigen
Statistic Critical Value 5% Prob.
None * 0.711836 38.57098 28.58808 0.0019
At most 1 0.393076 15.47992 22.29962 0.3368
At most 2 0.356354 13.65881 15.89210 0.1087
At most 3 0.115484 3.804153 9.164546 0.4420
* denotes rejection of the hypothesis at the 0.05 level
The co integrated equation founded under co integration methodology
can be presented as below.
LCPI = 4.34 + 0.5094 LTCPS + 0.3159 LFDR + 0.3342 LER+ u t-1
(13.36) (6.89) (4.21) (1.75)
Money in the Economy
247
According to the results obtained by Wald Test, none of the variables
have short run causality on LCPI as shown by the p- values which are
more than 5% in each case.
Conclusions, implications and significance
The study reveals that credit channel is effective in Sri Lanka during
the period covered by the study. It found out that there is a positive and
statistically significant relationship between total credit to private
sector and the general price level. It has further revealed that the effect
of credit availability on the general price level is much stronger than
that of interest rate and the exchange rate on the general price level.
On the basis of the above conclusions, one may state that in order
achieve the principal objective of the central banks, namely, curbing
inflation, the central bank may deploy credit channel effectively. So,
direct control of credit by imposing high reserve requirements and/or
credit ceilings may produce better results than raising interest rate in
an inflationary situation.
References
1. Amarasekara,C. (2005). Interest rate pass-through in Sri Lanka. In
C. B. Lanka, Staff Studies- Volume 35. Central Bank of Sri Lanka.
2. Bernanke and Gertler, B. S. (1995). Inside the Black Box: The
Credit Channel of Monetary Policy Transmission. The Journal of
Economic Perspectives,Vol.9, No.4., 27-48.

Emerging Trends in Post- Conflict Societies: Challenges and the Way Forward Sri Lanka Economics Research Conference 2014
248
3. Mallikahewa, S. (2013). Effectiveness of the Interest Rate Channel
for Controlling Price Level. 2nd International Economic Research
Conference of the Sri Lanka Forum of University Economists.
Peradeniya,Sri Lanka: University of Peradeniya .
4. Mishkin, F. S. (2004). The economics of money, banking, and
financial markets -7th edition. United States: The Addison-
Wesley.
5. Vinayagathasan, T. ( 2013, July). Monetary Policy and the Real
Economy: A Structural VAR Approach for Sri Lanka. GRIPS
GRIPS GRIPS Discussion Paper Discussion PaperDiscussion
PaperDiscussion Paper Discussion GRIPS Discussion Paper 13-
13.
Peace and Development
249
Session-7 Peace and
Development

Emerging Trends in Post- Conflict Societies: Challenges and the Way Forward Sri Lanka Economics Research Conference 2014
250
Peace and Development
251
[S7/01] Post War Resettlement and Social Cohesion in
Sri Lanka Prasanna-Perera, W.L.
Department of Economics and Statistics, University of Peradeniya, Sri Lanka
Abstract
Relationship between the concept of social development and Social
cohesion is relatively new. Social cohesion is an end product of a good
policy of social development. At the end of the day, threats to social
cohesion stems from bad policies of social development which is one-
dimensional and exclusionist. On the contrary, sustainable policies
encompass social cohesion at its core. Social cohesion is the capacity
to ensure welfare of all citizens. This paper examines whether the
government resettlement policy of post war Sri Lanka ensures the
welfare of all citizens and thereby promotes social cohesion. To
achieve this objective, the study examined the composition of social
cohesion components and the factors defined in the notion of belonging
such as multiculturalism, trust, participation, expectation of mobility
and social solidarity in a resettled community in Suthanthirapuram
Grama Niladari Division (GND), Tellipalai District Secretariat
Division (DSD) in Jaffna District. The research collected the relevant
data through mixed methodologies which were both qualitative and
quantitative in nature. The study finds that the civilian population of
the Suthanthirapuram are dissatisfied with the governments’
resettlement policy as it lacks social cohesion components. Majority of
the respondents identified military involvement in the civil
administration associated with the resettlement process and the
exclusion of local population in developing the rural economy as the
key factors that limit social cohesion among the resettled families.
Therefore the government resettlement policy should adopt strategies
to enhance the sense of belonging among the citizens living in former
war affected areas.
Keywords: Jaffna, Resettlement policy, Social Cohesion, Sri Lanka,
Suthanthirapuram
Emerging Trends in Post- Conflict Societies: Challenges and the Way Forward Sri Lanka Economics Research Conference 2014
252
Introduction and research problem
After five years of ending the three-decade civil war, Sri Lanka’s
immediate economic plan is to reach the status of an upper middle
income country by the year 2016. The Sri Lankan Government ended
the war on May 2009 after militarily defeating the LTTE. From 2009-
2013, Sri Lanka has achieved an average annual economic growth of
6.66 percent. Immediate areas of concern for the Government of Sri
Lanka after ending the Elam war (IV) were on how to address the
psychological trauma of war affected families, issue of
accommodating large number of Internally Displace Persons (IDPs)
and their welfare issues related to the rehabilitating of ex-LTTE cadres
and reintegrating them to the society, demining and the reconstruction
of infrastructure and other basic facilities in the war affected areas. The
Sri Lankan government claims that when resettling people, it has
followed the basic norms and guidelines for IDPs, which included one
of the following options of (a) return to their place of origin, (b)
integration in the area of displacement and (c)the settlement in another
part of the country (Annual Report, 2013, p.52, Ministry of Finance
and Planning). According to the Ministry of Resettlement 225,970
families (76,2120 persons) were resettled in the war affected areas in
the Northern Province of Sri Lanka as of 31st March 2014. This study
attempts to capture the composition of social cohesion components in
the government resettlement process in post war Sri Lanka based on
the resettled community in Suthanthirapuram GramaNiladari Division
(GND), Tellipalai District (Valikamam North) Secretariat Division
(DSD) in Jaffna District. The concept of social cohesion is increasingly

Peace and Development
253
used to understand and assess sustainability of development initiatives.
Therefore, this study is important in identifying emerging and extant
issues in the government resettlement process. The findings present
key insights on the need to comprehensively address factors pertaining
to social cohesion when drafting resettlement polices in conflict
affected countries.
Methodology
Mixed methodologies were applied to analyse the objectives of the
study, which is to examine whether the government resettlement policy
of post war Sri Lanka promotes social cohesion by ensuring welfare of
all citizens. Data collection consisted of both qualitative and
quantitative tools. An individualised survey questionnaire was given
to 100 resettled people in the Suthanthirapuram GramaNiladari
Division (GND), Tellipalai District Secretariat Division (DSD) in the
Jaffna District. This questionnaire was drafted and based on the system
of social cohesion indicators, its components and factors set by Jenson
(2010). Social cohesion of belonging was measured by using the
variables of multiculturalism, trust, participation, expectation of
mobility and social solidarity. These variables were operationalized by
basing them on people’s perceptions about the level of normalcy
pertaining to life after settling in Suthanthirapuram and getting
feedback on issues about land, law and order, police protection, legal
assistance, personal safety and opportunities for participation. The
survey also examined basic facilities of water, electricity, housing and
its conditions, education, health, communications and transport
facilities offered to resettled people. Primary research also gathered
information on economic activities both at village and provincial level

Emerging Trends in Post- Conflict Societies: Challenges and the Way Forward Sri Lanka Economics Research Conference 2014
254
of those resettled. Secondary information was gathered from a
literature survey carried out by reading recent research, along with
government and donor agency reports although related material is
somewhat limited.
Results and findings
The study found that the socio economic background of resettled
communities has not changed significantly over the past few years.
Resettled communities have access to basic needs and there is progress
in obtaining housing, water, electricity, communication, education,
and transport and health facilities. While majority of the respondents
appreciated access to basic amenities, the bulk of respondents in the
resettled communities were not satisfied with the manner in which they
were involved in the resettlement processor how they were allowed to
participate in the resettlement process. They also expressed distrust of
those who lead the process including a reluctance to seek assistance
from the police, legal authorities and the military. Significantly, they
highlighted that most security structures are composed of personnel
from a different ethnic group. Furthermore, respondents did not feel a
sense of belonging as they were not part of the significant efforts to
promote multiculturism and social solidarity. Majority of the
respondents were dissatisfied with the limited access they had in
actively participating in the local economy and development. Overall,
the people are not satisfied with the manner in which the resettlement
process was implemented and hence the Government of Sri Lanka is
yet to achieve social cohesion as an outcome of its resettlement
policies.

Peace and Development
255
Conclusions, implications and significance
The study found that the civilian population of Suthanthirapuram are
dissatisfied with the government resettlement policy as it lacks the
social cohesion components of multiculturism, trust, participation,
expectation of mobility and social solidarity that define the concept of
belonging. Majority of the respondents identified military involvement
in civil administration pertaining to the resettlement process and the
exclusion of the local population in developing the rural economy as
key factors that limit social cohesion among the resettled families.
Therefore, the government’s resettlement policy should adopt more
strategies to enhance the sense of belonging among the citizens living
in formally war affected areas. Specifically consultation of local
communities and diversifying the ethnic composition of security
personnel in the region along with the creation of an economically
viable environment for the resettled families may mitigate the damages
already caused by a centralized resettlement process.
References
1. Fearon, J.D., (2009). Can Aid Contribute to Social Cohesion after
Civil War? Evidence from a Field Experiment in Post-Conflict
Liberia, American Economic Review: Papers and Proceedings,
2009, 99:2, 287-291
2. Jenson, J., (2010). Defining and Measuring Social Cohesion,
Commonwealth Secretariat and United Nations research Institute
for Social Development, Hobbs the Printers Ltd, United
Kingdom.
3. Ministry of Finance and Planning, Annual Report. (2013).
Government of Sri Lanka.
Emerging Trends in Post- Conflict Societies: Challenges and the Way Forward Sri Lanka Economics Research Conference 2014
256
4. Ministry of Resettlement, Government of Sri Lanka, Ministry of
Resettlement, Statistics, May, 2014
(http://www.resetelementmin.gov.lk)
5. LLRC. (2011). Report of the Commission of Inquiry on Lessons
Learnt and Reconciliation, Government of Sri Lanka.
Peace and Development
257
[S7/02] Household Entitlements in the Eastern Province
of Sri Lanka: With Special Reference to Female Headed
Households
Sasini T.K. Kulatunga
Department of Economics, University of Colombo, Colombo, Sri Lanka
_________________________________________________________________________________
Abstract
During periods of violent conflict, females and female headed
households face heightened levels of vulnerability and asset based
depletions. These trends have a tendency to be carried into the post
conflict periods reducing household entitlements and undermining
economic growth and development. This study focus on developing an
asset based index to study the existing levels and patterns of asset
distributions of the households form rural Trincomalee. Using a
principal components analysis (PCA) to generate household asset-
based indices the study finds that there is both gender based
inequalities and ethno-gender inequalities in asset distributions.
Uncovering and addressing such inequalities can bring about social
and economic justice and increase economic growth and
development.
Keywords: Female household headship, Principal component
analysis, Post war Sri Lanka, Trincomalee

Emerging Trends in Post- Conflict Societies: Challenges and the Way Forward Sri Lanka Economics Research Conference 2014
258
Introduction and research problem
During periods of violent conflict females and female headed
households face heightened levels of vulnerability and asset based
depletions (Cabezas, Reese, and Waller 2007; De Alwis 2002;
Ruwanpura & Humphries 2005; Tribe & De Silva 1999). These trends
have a tendency to be carried into the post conflict periods further
reducing assets and access to assets to females (Alldén 2008; Krishna
2001) and consequently increasing gender based injustice leading and
to overall underdevelopment (UN Women 2012).
This study focus on developing an asset based index to study the
existing levels of entitlements and patterns of asset distribution
amongst the households in rural Trincomalee. Assuming that female
headed households are diverse in character, the study is significant due
to several reasons. Firstly, as empirical research has found, assets in
the hands of women have the potential of increasing children’s
schooling (Katz & Chamorro 2003),reducing domestic violence
(Panda & Agarwal 2005; Srinivasan & Bedi 2007; Friedemann-
Sánchez 2006), and an increasing aggregate growth(Agarwal
1994).Understanding the existing asset distribution across gender can
help the post conflict recovery initiatives. Secondly, this study is
useful to understand both horizontal (across ethnicity and gender) and
vertical inequalities (within diverse groups of female headed
households) that could exist in post conflict societies.

Peace and Development
259
Methods
The study uses primary data collected from a sample of 144
households, in the Seruvila divisional secretariat division. This
included 85 female headed households and 59 male headed households
from Sinhalese, Tamil and Muslim ethnic groups.
The Oxford Poverty and Human Development Initiative (OPHI)
variable definitions for improved drinking water, electricity, improved
sanitation, education (Alkire et al. 2014) and United Nations and
United Kingdom’s Department for International Development’s
definitions for shelter (Gordon 2005) were used when designing
variables for the collection of data on assets. Furthermore, variables
that capture household income adequacy, livestock assets, land use
patterns and indicators for livelihood physical capital assets are used
in this analysis. Such variables are common to composite indices for
living standards and to understand household assets (Pampalon et al.
2009; Messer et al. 2006; Vyas & Kumaranayake 2006).
This study employs a principal components analysis (PCA) to generate
household asset-based proxy wealth indices. PCA is a factor analysis
methods and is an indicator reduction technique to analyse observed
variables that would result in a reasonably small number of
interpretable components (group of variables), which account for most
of the variance in a set of observed variables (Jolliffe 2005).
The method used here is justifiable in relation to this work as it has the
power to identify interpretable factors (reducing and compositing the

Emerging Trends in Post- Conflict Societies: Challenges and the Way Forward Sri Lanka Economics Research Conference 2014
260
variables) which explain the data based on their variances properly.
After examining the screen plot results and by using the eigen rule,
factors with vales greater than 1 were extracted through the correlation
coefficients. This resulted in only four factors being extracted for
analysis. Due to the nature of the variables a Varimax rotation was also
used.
Using the Factor loadings and their corresponding percentages a
standardized index was calculated. Similar methods have been used by
Brien et al. 2004, Antony & Visweswara Rao 2007 and Krishnan 2010.
Results and findings
The four factors, 1) factor1: household specific physical capital, 2)
factor2: natural capital and social capital, 3) factor3: financial and
human capital, 4) factor4: livelihood specific physical capital;
combinedly accounted for 54.3% of the total variance. The 1st, 2nd, 3rd
and 4th factor components explained 23.1%, 10.5%, 10.4% and 10.2%
of the variance respectively. Using the proportions of these
percentages as weights a Standardized Asset Index (SAI) was
developed. The index values ranged between 0-1, with 1 denoting a
higher quantity and quality of household assets.
The eta-square analysis of variance indicated a strong effect size
between household headship and the SAI (eta-square=0.45. The mean
value of the SAI for female headed households stood at 0.39 and for
male headed households at 0.47. Using these results, it can be seen that
the male headed households had more access to household assets than

Peace and Development
261
the female headed households. Among the female headed households,
this study found that Muslim female headed households possess the
least amount of assets (SAI=0.30) compared to the Tamil (SAI=0.53)
and Sinhalese (SAI=0.33) households in the Serunuwara DS division
(See Graph 1).
Across ethnicity, households headed by older females had
comparatively lower amount of assets than those headed by younger
female heads. Interestingly, households headed by de-facto household
heads also had more assets compared to de-jure female household
heads.
The weighted factor scores were used to analyse data relating to
individual factor dimensions. From these it can be found that female
headed households owned more household specific physical capital
Graph 1: SAI values across gender and ethnicity

Emerging Trends in Post- Conflict Societies: Challenges and the Way Forward Sri Lanka Economics Research Conference 2014
262
assets , natural and social capital assets (1st and 2nd factors) than male
headed households, but lower in the other two dimensions (See graph
2).
Graph2: Dimensions of assets across gender
However, ethnizied entitlements indicate that Sinhalese females
owned lesser amounts of household specific physical capital assets ,
natural and social capital assets (1st and 2nd factors) than the Muslims
and Tamils however, scored higher in livelihood specific physical
capital assets (factor 4) and human and financial capital dimensions
(factor 3) (See graph 3).
.000
.050
.100
.150
.200
.250
Householdspecific Physicalcapital (factor1)
Natural capitaland social
capital (factor 2)
Finanical capitaland Human
capital (Factor3)
Livelihoodspecific Physicalcapital (factor 4)
Dimensions of assets across gender
Female

Peace and Development
263
Graph 3: Dimensions of assets within female household headship
Conclusions, implications and significance
Data during war and post war years suggests that interventions by state
and donor organizations have been successful in increasing assets to
households and creating more access to assets. However, more
attention needs to be paid to hidden segments of the population, such
as to the households headed by females between ages of 46-60 and
above 60 years and to households headed by Muslim females.
Interventions to increase human, financial and livelihood specific
physical capital assets to Muslim and Tamil female headed households
and household specific physical capital (electricity, water, sanitation,
durable assets etc.) and natural based assets (such as access to lands)
0.00
0.05
0.10
0.15
0.20
0.25
0.30
Householdspecific Physicalcapital (factor1)
Natural capitaland social capital
(factor 2)
Finanical capitaland Human
capital (Factor 3)
Livelihoodspecific Physicalcapital (factor 4)
Dimensions of assets (within groups)
Sinhala Female Tamil Female

Emerging Trends in Post- Conflict Societies: Challenges and the Way Forward Sri Lanka Economics Research Conference 2014
264
to Sinhalese female headed households can also reduce the inter group
and intra group asset inequalities.
References
1. Agarwal, B., 1994. A field of one’s own: Gender and land rights in
South Asia, Cambridge University Press.
2. Alkire, S., Conconi, A. & Seth, S., 2014. Multidimensional Poverty
Index 2014: Brief Methodological Note and Results, Oxford
Poverty and Human Development Initiative, University of Oxford.
3. Alldén, S., 2008. Microfinancial Entrepreneurship: A tool for
peacebuilding and empowerment in Timor-Leste and Cambodia?
In International Studies Association (ISA), annual congress. pp.
26–29. Available at: http://bit.ly/1bbILB7 [Accessed November
30, 2012].
4. Antony, G.M. & Visweswara Rao, K., 2007. A composite index to
explain variations in poverty, health, nutritional status and standard
of living: Use of multivariate statistical methods. Public Health,
121(8), pp.578–587.
5. Brien, M.J., Dickert-Conlin, S. & Weaver, D.A., 2004. Widows
Waiting to Wed?:(Re) Marriage and Economic Incentives in Social
Security Widow Benefits. Journal of Human Resources, 39(3),
p.585.
6. De Alwis, M., 2002. The Changing Role of Women in Sri Lankan
Society. Social Research, 69(3), pp.675–691.
7. Friedemann-Sánchez, G., 2006. Assets in intrahousehold
bargaining among women workers in Colombia’s cut-flower
industry. Feminist Economics, 12(1-2), pp.247–269.
8. Gordon, D., 2005. Indicators of Poverty & Hunger. In Expert
Group meeting on youth development indicators. pp. 12–14.
9. Jolliffe, I., 2005. Principal component analysis, Wiley Online
Library.
10. Katz, E. & Chamorro, J.S., 2003. Gender, land rights, and the
household economy in rural Nicaragua and Honduras. In annual

Peace and Development
265
conference of the Latin American and Caribbean Economics
Association, Puebla, Mexico, October. pp. 9–11.
11. Krishna, K., 2001. Women and Civil War: Impact Organizations
and Action, Lynne Rienner Publishers.
12. Krishnan, V., 2010. Constructing an area-based socioeconomic
index: A principal components analysis approach. Edmonton,
Alberta: Early Child Development Mapping Project.
13. Messer, L.C. et al., 2006. The development of a standardized
neighborhood deprivation index. Journal of Urban Health, 83(6),
pp.1041–1062.
14. Pampalon, R. et al., 2009. A deprivation index for health planning
in Canada. Chronic Dis Can, 29(4), pp.178–191.
15. Panda, P. & Agarwal, B., 2005. Marital violence, human
development and women’s property status in India. World
Development, 33(5), pp.823–850.
16. Ruwanpura, K.N. & Humphries, J., 2005. Mundane heroines:
conflict, ethnicity, gender, and female headship in Eastern Sri
Lanka. Dilemmas of lone motherhood, p.173.
17. Srinivasan, S. & Bedi, A.S., 2007. Domestic violence and dowry:
Evidence from a South Indian village. World Development, 35(5),
pp.857–880.
18. Tribe, R. & De Silva, P., 1999. Psychological intervention with
displaced widows in Sri Lanka. International Review of
Psychiatry, 11(2), pp.184–190.
19. UN Women, 2012. Annual Report, Available at:
https://www.google.lk/search?q=UN+Women,+2012&ie=utf-
8&oe=utf-8&rls=org.mozilla:en-US:official&client=firefox-
a&channel=fflb&gws_rd=cr&ei=Iw4CVN6TC8_k8AWVk4GYA
w [Accessed August 30, 2014].
20. Vyas, S. & Kumaranayake, L., 2006. Constructing socio-
economic status indices: how to use principal components
analysis. Health policy and planning, 21(6), pp.459–468.

Emerging Trends in Post- Conflict Societies: Challenges and the Way Forward Sri Lanka Economics Research Conference 2014
266
Peace and Development
267
[S7/03] Buddhism as a Way of Reconciling Post War Sri
Lanka
Aruna Jayathilaka
Department Social and Institutional Development, Sri Lanka Foundation Institute
Abstract
Sri Lanka has reached an important juncture of the ethnic conflict after
the military victory over the LTTE. It is a very clear fact that the war
has seriously affected the social and ethnic harmony of the country in
vast spaces in recent decades. Therefore Sri Lanka is now facing the
huge challenge of bridging the gaps among ethnicities. This divided
society can only build its shared future out of its divided past by having
a well guided reconciliation process. Reconciliation is an approach
which consolidates peace, breaks the cycle of violence by preventing
the possibilities of the use of the past as the seed of renewed conflict.
It brings about the personal healing of survivors, the reparation of past
injustices, the building or rebuilding of non-violent relationships
between individuals and communities. Buddhism can play a pivotal
role for peace building in post war societies. Cambodia provides a
promising initiative for using religion as a tool of post conflict peace
building. ‘Dhammayietra’ program which is being introduced by Rev.
Maha Ghosananda is an ideal initiative for the grassroots peace
building in post war Cambodia. By critically examining the
‘Dhammayietra’ program, this paper discusses the possibility of using
such an approach for the post war reconciliation process in Sri Lanka.
Paper finds that need of Buddhism to go beyond the ethnic boundaries
by promoting interreligious linkages for achieving ethnic harmony in
post war Sri Lanka.
Keywords - Post War Reconciliation, Buddhism, Dhammayietra,
Cambodia, Sri Lanka
Emerging Trends in Post- Conflict Societies: Challenges and the Way Forward Sri Lanka Economics Research Conference 2014
268
Introduction and research problem
Sri Lanka has a strong Buddhist tradition which was introduced in the
2nd century BCE by the Venerable Mahinda. Estimates generally state
that seventy per cent of the Sinhalese are associated with the
‘Theravada’ school of Buddhism. Buddhism is a religion well known
for its teachings about nonviolence and empathy (Bilodeau, 2000).
Hence, Buddhism can be well utilized in the post war peace building
since Theravada Buddhism provides a strong foundation for peaceful
coexistence. When analyzing the above theme this paper is divided
into two major parts. In the first part of the paper, it discusses
theoretical dimensions on reconciliation and the possibility of using
Buddhism for the post conflict peace building and reconciliation. In
the second part, the paper discusses the capability of utilizing
Buddhism for the post conflict reconciliation process in Sri Lanka,
with the comparative analysis of the Cambodian experiences in post
war peace building.
Methods
This paper is mainly based on a literature research. Utilization of the
literature of the paper can be divided into four main categories. Firstly
it analyses literature on the concept of reconciliation. Secondly paper
focuses on the literature on the Buddhists analysis of reconciliation.
Thirdly it examines the literature on Cambodian reconciliation
approach. Fourthly the paper focuses on the literature on the role of
Buddhism in the post war reconciliation process in Sri Lanka.
Results and findings

Peace and Development
269
When analyzing the potentiality of using Buddhism as a mechanism of
post war peace building three main points can be considered. Firstly
Buddhism shows the potential of breaking down the vicious circle of
violence. Secondly Buddhism promotes forgiveness which can be an
essential feature of reconciliation (Collins, 1998). Thirdly by rejecting
the structural violence Buddhism provides space for the restorative
justice in the post conflict societies.
When compared with Cambodia many similarities can be observed in
the Sri Lankan context. In both countries there is a strong relationship
between the state and the religion. In Cambodia, Monks and monk
administrators (Achars) have traditionally played central roles in moral
education and conflict resolution in rural Cambodia (Adams, 2011). In
Sri Lanka also Buddhist monks traditionally played a vital role in the
day today conflict resolution processes in the rural areas (Tilakaratne,
2003).
When compared to with Sri Lanka it is a clear fact that Buddhism in
Cambodia has played a useful role in the reconciliation process.
Furthermore such peace attempts grab the international attention. This
was resulted by the training opportunities provided for them
(Brounéus, 2007). Buddhist peace workers and conflict resolution
educators trained in both Buddhism and peacemaking tended to hold
broader concepts of peace that go beyond individual peace and
harmony. But in Sri Lanka, internationalization was really lacking
since the western peace building concepts were not being welcomed
by the Sinhala nationalists. In contrast to this, Cambodian Buddhist
leaders were keen to provide conflict resolution skills and training
opportunities for their followers. One of main products of the
Emerging Trends in Post- Conflict Societies: Challenges and the Way Forward Sri Lanka Economics Research Conference 2014
270
Dhammayietra movement has been the training of a number of monks
and nuns in community conflict resolution (Ghosananda, 1992).
Accommodative nature of the Cambodian Buddhism was another great
strength in the peace attempt led by Buddhists leaders. Buddhist monks
maintained a good relationship with other religious organizations. For
example Dhammayietra program has been cooperatively sponsored by
several Christian NGOs. Furthermore they worked cooperatively with
number of NGOs such as The Cambodian Development Research
Institution (CDRI), The Active and Non-Violence Working Group
(ANVWG), The Weapons Reduction Group and several human rights
organizations. In spite of the few of attempts made by organizations
such as Congress of Religions, non- accommodative nature of the
Buddhism in Sri Lanka has been a huge barrier for having a proper
reconciliation process (Imtiyaz, 008).
The non-accommodative nature of Buddhism is caused as a result of
the Buddhist monastic tradition which has not provided any room for
the development of a civil society characterizing virtues such as
pluralism and universalism. However with the arrival of UN peace
approaches in Cambodia, many Buddhist monks have enthusiastically
learned and taught about human rights. But in Sri Lanka this was
almost absent due to the fact that there is no influential role from the
Buddhist women here. Further, in Cambodia, Rev. Maha Ghosananda
was a charismatic leader since he has had a profound influence upon
movements for peace around the globe through his advisory role in
such NGOs as the International Network of Engaged Buddhists
(INEB), the Buddhist Peace Fellowship (BPF), and the Ponleu Khmer,

Peace and Development
271
the citizens' advisory council to the Cambodian Constitutional
Assembly (Poethig ,2002).
The peace process in Cambodia nevertheless faced a number of
challenges. First there was a lack of influential and active Buddhist
leaders to encourage and direct Buddhist education. Some of the
Buddhist leaders were seen by the public as working for a political
party having a low level of Buddhist education. Some Key monk
leaders suffer from the lack of knowledge of Buddhist philosophy.
Even though some Buddhists monks made efforts for the post conflict
peace building in Cambodia, some of the efforts carried out by the
ordinary citizens failed because they didn’t have a proper knowledge
of Buddhism. Furthermore the importance of spiritual education was
not being well identified by some NGOs and funding agencies. The
resistance from the government was also identified as another
limitation of the peace process. To avoid politicization, Yos Hut
Khemacaro advocated them to follow the “Middle Path”, the
traditional metaphor for the Buddhist way - neither joining the fight
nor hiding from it (Treasury of Truth, 2013). When Sri Lankan peace
attempts faced problems due to the political polarizations, Buddhist
leaders were unable to develop such fruitful mechanisms and
strategies to tackle them (Frydenlund,2005).
Conclusions, implications and significance
The paper reveals the fact that Theravada Buddhism has a negative
view towards violence. Therefore the vision of a peaceful life
portrayed in the Pali canon can thus be useful for contemporary
Emerging Trends in Post- Conflict Societies: Challenges and the Way Forward Sri Lanka Economics Research Conference 2014
272
Buddhist communities to understand the nature of human conditioning
and realize the danger of emotional involvements in conflicts. The
Buddhist message can transform violent contexts into more creative
positive actions that are suitable for creating positive peace. In this
way, Buddhism can be a useful tool for the post conflict reconciliation.
The key issue faced by the current Sri Lankan society is how to build
on and preserve that elusive peace. The paper suggests that Buddhism
can be well utilized for building the war torn society in Sri Lanka.
Therefore Buddhist monks and Buddhist activists should play a key
role in sustaining the reconciliation process in Sri Lanka as in
Cambodia. In this task greater attention should be paid to broadening
the training of Buddhist monks regarding conflict transformation and
peace building. Furthermore since there is an insistent need of
Buddhism to go beyond the ethnic boundaries, interreligious linkages
should be further strengthen. Finally, Buddhist scholars also have an
ethical as well as an academic responsibility to interpret the clear
meaning of the Buddhist message which promotes genuine peace in
the society.
References
1. Adams, N. (2011). Cambodia’s “Quiet Movement”: Buddhist
Women in Development. World Faiths Development Dialogue,
Washington, DC
2. Bilodeau, A. (2000). The Inter-religious Peace Foundation:
Christians, Muslims, Buddhists and Hindus: Addressing the
conflict in Sri Lanka, Collaborative for Development Action,
Cambridge.
Peace and Development
273
3. Brounéus, K. (2007). Reconciliation and Development, Dialogue
on Globalization, Occasional Papers, Friedrich-Ebert-Stiftung,
Berlin.
4. Collins, Steven. (1998). Nirvana and Other Buddhist Felicities.
Cambridge: Cambridge University Press.
5. Frydenlund, I. (2005) .The Sangha and Its Relation to the Peace
Process in Sri Lanka: A Report for the Norwegian Ministry of
Foreign Affairs, International Peace Research Institute, Oslo
(PRIO)
6. Ghosananda, M. (1992).Step by Step, Meditations on Wisdom and
Compassion, Berkeley, CA: Parallax Press.
7. Imtiyaz, A. (2008).Ethnic Conflict in Sri Lanka: The Dilemma of
Building a Unitary State,Department of Political Science. Temple
University.USA.
8. Poethig, K. (2002). Movable Peace: Engaging the Transnational
in Cambodia's Dhammayietra, Journal for the Scientific Study of
Religion,Vol. 41, No. 1 pp. 19-28
9. Tilakaratne, A. (2003). The Role of the Sangha in the Conflict in
Sri Lanka, Journal of Buddhist Ethics - Vol 10.\
10. Treasury of Truth: The Elastration of Dhammapada, Buddha
Dharma Education Foundation.
http://www.buddhanet.net/dhammapada/d_twin.htm. Accessed
on: 10.01.2013

Emerging Trends in Post- Conflict Societies: Challenges and the Way Forward Sri Lanka Economics Research Conference 2014
274
Peace and Development
275
[S7/04] Foreign Aid vs. Economic Development:
Exploring the Empirical Linkage for India and Sri
Lanka
Narayan Sethi
Department of Humanities and Social Sciences,
National Institute of Technology (NIT), Rourkela,
Odisha, India
Email: [email protected]
_______________________________________________________
Abstract
This study empirically examines the causal relationships between
foreign aid (ODA) and economic development for India and Sri Lanka
using the annual data 1960-61 to 2010-11. The study also aims to test
the causal relationship among foreign aid with other macroeconomic
variables such as domestic investment, financial sector development
and trade performance of these countries. The empirical results show
that there is a long run equilibrium relationship existing between
foreign aid and economic development in both countries. However, the
direction of inter-linkage between foreign aid and economic
development contradicts to each other in case of India and Sri Lanka.
Keywords: Foreign Aid, Economic Development, India, Sri Lanka
Introduction and research problem
Foreign aid refers to external assistance from third parties - usually by
the multilateral organizations and advanced economies to support a
country’s economic growth. The form of foreign aid is classified as
humanitarian aid, where relief supplies and personnel are provided to
support the immediate needs of a nation. This generally refers to the
provision of emergency supplies of food and medicines in a war-torn
Emerging Trends in Post- Conflict Societies: Challenges and the Way Forward Sri Lanka Economics Research Conference 2014
276
or disaster-struck country. The second form of foreign aid is known as
Official Development Assistance (ODA) which supports to alleviate
poverty for a longer period. Typically, ODA comes in the form of
financial or technical support that develops a country’s physical
infrastructure such as education and health sector. There have been
some instances where the recipients of ODA have utilized these funds
to develop the nation’s primary industries or to spur sufficient
structural changes to attain long-term economic growth and
development. South Asian region is the second poorest region in the
world after Sub-Saharan Africa. It is the home of more than 1.59
billion population (22.9 % of total world population), which makes it
both the most populous and most densely populated geographical
region in the world (World Bank Report, 2011). It is a home to the half
of the worlds’ poor. Most countries of this region depend on foreign
capital in general and on foreign aid in particular for their development
process. Among these countries, India and Sri-Lanka are two major
emerging developing nations of this region that attracted foreign aid.
According to the World Bank, Sri Lanka has received a total of
USD18.2 billion of net ODA since 1960. Despite of the social
improvements, especially with regard to health and education, Sri
Lanka’s economic development still lags behind that of many of its
East Asian neighbors. Furthermore, there are pockets where poverty
has become increasingly entrenched, thus making income inequality
even more pronounced. This trend questions the role and the
sustainability of ODA in Sri Lanka’s future economic growth. This
study empirically examines the causal relationships between foreign
aid (ODA) and economic development for India and Sri Lanka using
the annual data 1960-61 to 2010-11. The study also aims to test the
Peace and Development
277
causal relationship among foreign aid with other macroeconomic
variables such as domestic investment, financial sector development
and trade performance of these countries.
Methodology
This study attempts to analyze, the impact of foreign aid on economic
development of two selected aid recipient South Asian countries
namely; India and Sri Lanka. In order to examine the impact of aid on
development, annual time series data on some selected
macroeconomic variables have been collected from 1960-61 to 2010-
11 both in India and Sri Lanka. The variables include, in case of India,
such as, Official Development Assistance (ODA), Gross Capital
Formation (GCF) as a proxy of domestic investment, Trade, Per capita
GDP (PcGDP) as an indicator of economic development, WPI as a
proxy of inflation rate and Bank Credit (BC) as the proxy of financial
development. In case Sri Lanka, the study uses same variables except
Gross Fixed capital formation (GFCF) as domestic investment and
Consumer Price Index (CPI) as inflation rate. These two countries are
lower middle income developing nations in the south Asian region.
Both the countries are dependent on foreign assistance for their
economic development. We employ Johansen and Juselius (JJ)
(Johansen and Juselius, 1990) procedure of testing for the presence of
multiple co- integrating vectors. JJ method of multivariate approach is
a well-established model to trace out co-integrating relationship
between the time series variables. We use this approach to find out the
co-integrating relationship between ODA, trade, bank credit, per capita
GDP and WPI. The maximum likelihood approach of Johansen and

Emerging Trends in Post- Conflict Societies: Challenges and the Way Forward Sri Lanka Economics Research Conference 2014
278
Juselius (1990) is used to establish whether there is a long-run
relationship between the variables in the model. The model is based on
the error correction representation.
To set the stage of causality test, the order of integration of the variable
is initially determined using the ADF test. The testing procedures of
ADF are based on the null hypothesis that a unit root exists in the
autoregressive representation of the series. The result of unit root for
all the variables in India and Sri Lanka are reported in table 3. It is
clear that all the variables of India and Sri Lanka are non-stationary at
levels and become stationary at first difference. Hence, hence all
variables are integrated in order, I (1).
Results and findings
Having established the long run relationship (Engle and Granger,
1987), the next subsequent step for our analysis is two estimate causal
relationships between our sample variables. In doing so, we have to
employ pair wise Granger-causality test (Engle and Granger, 1969).
Before that, it is necessary to select the optimal lag length by using
different criteria. While determining lag length, econometricians have
either fixed the lag length arbitrarily or chosen it through some
statistical procedure. It is advisable to choose the lag length by using
some selection criterion. Here, the study uses five lag order selection
criterion such as Likelihood Ratio (LR), Final Prediction Error (FPE),
Akaike Information Criterion (AIC), Schwarz Information Criterion
(SIC) and Hannan-Quinn Information Criterion (HQIC).

Peace and Development
279
The Granger-causality test is used to ascertain the direction of causality
between ODA, GCF, Trade, WPI, BC and PcGDP in case of India and
ODA, GFCF, BC, Trade, CP and PcGDP in case of Sri Lanka. This
test assumes that the underlying time series data are stationary, i.e.,
I(0) processes. Therefore, it is imperative to examine whether ODA,
GCF, Trade, WPI, BC, GFCF, CP and PcGDP are stationary.
Augmented Dickey-Fuller (ADF) test is employed to check the
stationary property of these two variables. The test of co-integration
ignores the effect of the past values of one variable on the current value
of the other variable. So, finally, we tried the Granger causality test to
examine such possibilities. Since the reliability of results of the
Granger causality test depends on whether the variables are stationary
or not, we first tested unit root of the variables using ADF test. The
result of the unit root test is reported in table 1. It shows that all the
variables are stationary on first difference. It is well-known that
Granger causality test is sensitive to the choice of lag length.
In this paper, we have set four hypotheses to find out the causality.
First, PCGDP has causal relationship with ODA, which indicates the
economic development of the country attract more ODA inflows. The
result shows that, we can reject the null hypothesis that PCGDP does
not Granger cause ODA at 5% level, whereas the null hypothesis that
ODA does not Granger cause PCGDP at 1% level. Thus, there is one-
way causality between two variables. This result seems to reinforce,
the hypothesis of complementarily between PCGDP and ODA for
India. On the other hand, we didn’t find any causality in either
direction between ODA and PCGDP. This result is interesting and
supports our theory. The economic development (PCGDP) in India

Emerging Trends in Post- Conflict Societies: Challenges and the Way Forward Sri Lanka Economics Research Conference 2014
280
attracts more foreign aid (ODA) inflows through and foreign aid
(ODA). It is clear that, there is an evidence of uni-direction Granger
causality between BC and ODA. This result supports our theoretical
debate. Further, it suggests that the performance of financial
development (BC) stimulates more ODA inflows in India and also
foreign aid (ODA) inflows encourage trade and economic
development of the country. The financial development in the country
encourage ODA inflows whereas, the reverse is not true.
Thus, ODA inflows into India are not motivated automatically, but
rather motivated by pull factors i.e. the development financial
infrastructure and liberalize external sector policy. Third, we find there
is bidirectional causality between trade (TR) and ODA. These results
also support our theory. It shows that, more ODA inflows encourage
trade performance of the country. The trade liberalization and trade
performance of the country attract more ODA inflows in last two
decade. Fourth, the result of Granger causality test between the
domestic investment (GCF) and foreign aid (ODA) for India indicates
that there exists uni-directional causality between two. However, the
causality between GCF and ODA indicates that the domestic
investment is stronger in India which helps to attract more ODA
inflows. On the other hand, ODA inflows into India have not much
significant impact on domestic investment. We also find the casual
relationship exist among the few pair of macroeconomic variable such
as GCF with BC, PCGDP with BC, TR with BC, WPI with BC,
PCGDP with GCF, GCF with trade, WPI with ODA and TR and
PCGDP.
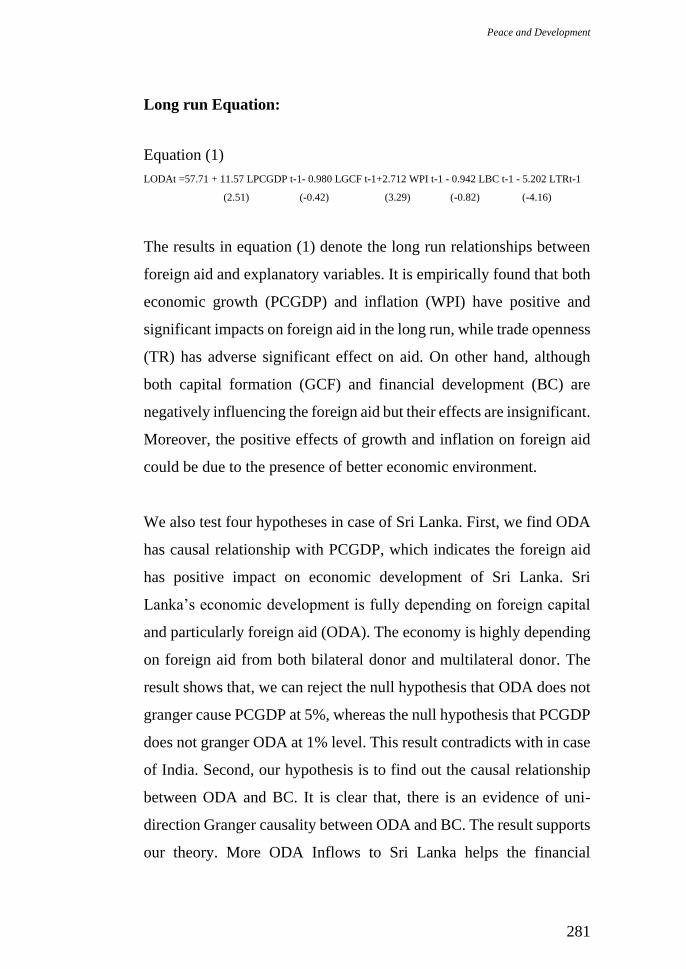
Peace and Development
281
Long run Equation:
Equation (1)
LODAt =57.71 + 11.57 LPCGDP t-1- 0.980 LGCF t-1+2.712 WPI t-1 - 0.942 LBC t-1 - 5.202 LTRt-1
(2.51) (-0.42) (3.29) (-0.82) (-4.16)
The results in equation (1) denote the long run relationships between
foreign aid and explanatory variables. It is empirically found that both
economic growth (PCGDP) and inflation (WPI) have positive and
significant impacts on foreign aid in the long run, while trade openness
(TR) has adverse significant effect on aid. On other hand, although
both capital formation (GCF) and financial development (BC) are
negatively influencing the foreign aid but their effects are insignificant.
Moreover, the positive effects of growth and inflation on foreign aid
could be due to the presence of better economic environment.
We also test four hypotheses in case of Sri Lanka. First, we find ODA
has causal relationship with PCGDP, which indicates the foreign aid
has positive impact on economic development of Sri Lanka. Sri
Lanka’s economic development is fully depending on foreign capital
and particularly foreign aid (ODA). The economy is highly depending
on foreign aid from both bilateral donor and multilateral donor. The
result shows that, we can reject the null hypothesis that ODA does not
granger cause PCGDP at 5%, whereas the null hypothesis that PCGDP
does not granger ODA at 1% level. This result contradicts with in case
of India. Second, our hypothesis is to find out the causal relationship
between ODA and BC. It is clear that, there is an evidence of uni-
direction Granger causality between ODA and BC. The result supports
our theory. More ODA Inflows to Sri Lanka helps the financial

Emerging Trends in Post- Conflict Societies: Challenges and the Way Forward Sri Lanka Economics Research Conference 2014
282
development. The financial development in Sri Lanka is so weak
which unable to attract more ODA flows. However, the more ODA
inflows directly help the financial development of the country. This
result also contradicts with India. Third, ODA has causal relationship
with trade (TR). The ODA inflows into Sri Lanka enforce the trade
performance. The trade performance and trade labialization policy in
Sri Lanka is so weak which unable to attract more ODA inflow. It
shows the trade performance in Sri Lanka is not like India. Fourth, the
result of Ganger causality test between ODA and domestic investment
(GFCF) for a Sri Lanka indicates that there exists uni-directional
causality between two. However, ODA inflows into Sri Lanka help for
the domestic investment. We also find the casual relationship exist
among the few pair of macroeconomic variable in this study such as
BC with CP, CGCF with CP, ODA with CP, TR with CP, GFCF with
BC, PCGDP with BC, TR with BC and TR with GFCF. Aid helps in
raising the GDP growth rate through structural transformation of the
economy, laid foundations of the industrial and agricultural sectors,
provided technical assistance, helps in implementing various
developmental projects, bringing various policy advice and modern
technology, assisted in overcoming the budget deficit. On the other
hand, its underutilization and unproductive uses, raises the fear of debt
burden for future.
Long run Equation
LODAt = 131.60 - 5.43 LPCGDP t-1 + 4.40 LGCF t-1 + 5.89 LCP t-1+5.80 LBC t-1- 2.71 LTRt-1 (2)
(-1.33) (-3.75) (4.15) (3.99) (-1.69)
The result in equation (2) explains the foreign aid (ODA) have no
effect on financial development, inflation (CP) and negative effect on

Peace and Development
283
capital formation (GCF). Higher the foreign aid inflows help for the
financial development and consequently it induces inflation (CP) of
the country. More foreign aid inflows have negative and significant
effect on capital formation of Sri Lanka economy. This result is very
interesting and supports the theories of foreign aid on development.
However, foreign aid (ODA) negatively affects the economic
development (PCGDP) and trade openness (TR) of the country.
4. Conclusions, implications and significance
It is clear that foreign aid is one of the major factors contributing to the
development process of both India and Sri Lanka. Both the countries
need to maintain high growth to create more employment opportunity
and to reduce poverty. Considering the long run causal linkage among
foreign aid, trade performance, financial sector development, domestic
investment and economic growth, both the countries should focus on
the efficient utilization of foreign aid where the rate of return should
be greater than rate of investment. The study suggests that the
government has to be more concerned about its efficient utilization
rather than its amount of inflows. The government of India should
further try to raise its growth rate and liberalize its external sector to
attract foreign capital i.e. foreign aid and FDI inflows. The government
of Sri Lanka should focus on the efficient utilization of foreign aid in
some productive activities, directly linked with the welfare of the
people. Both the countries adopt outward-looking development
strategy through appropriate measures such as more flexible labour
market, political stability, infrastructural facilities, human capital
generation, institutional efficiency and good macro-economic policies
Emerging Trends in Post- Conflict Societies: Challenges and the Way Forward Sri Lanka Economics Research Conference 2014
284
to attract more foreign capital. The empirical results for India reveal
that higher economic development contributes to more inflows of
foreign aid. Adding to this, financial sector development, better trade
performance and domestic investment act as motivational factors to
attract more amount of foreign aid to India. In case of Sri Lanka, the
situation is just reverse. The empirical result shows that foreign aid has
significant positive impact on economic development of Sri Lanka.
The result also shows that higher amount of foreign aid inflows lead to
higher economic development, better trade performance, development
of financial sector and supplements to domestic investment in Sri
Lanka.
References
1. Addison, T., Mavrotas, G. and McGillivray, M (2005), Aid to
Africa: An Unfinished Agenda, Journal of International
Development, 17, 981-1001.
2. Burnside, C. and Dollar, D. (1997). Aid, Policies and Growth.
American Economic Review. 90(4), 847-868.
3. Chenery, H.B. and Strout, A. (1966). Foreign Assistance and
Economic Development. American Economic Review 56(4), 679-
733.
4. Dicky, D.A and W.A Fuller (1981), Likehood Ratio Statistics for
Autoregressive Time Series with a Unit Root. Econometrica. 49,
1057-72, July.

Peace and Development
285
5. Dollar, D. and Easterly, W. (1999). The Search for the Key: Aid,
Investment and Policies in Africa. Journal of African Economies.
8(4)546-577.
6. Engle, R.F. and Granger, C.W.J. (1987). Cointegration and Error
Correction: Representation, Estimation and Testing.
Econometrica, 55, 251-276.

Emerging Trends in Post- Conflict Societies: Challenges and the Way Forward Sri Lanka Economics Research Conference 2014
286
Statistical models for Agro-Products
287
Session-8 Statistical
Models for
Agro-Products

Emerging Trends in Post- Conflict Societies: Challenges and the Way Forward Sri Lanka Economics Research Conference 2014
288

Statistical models for Agro-Products
289
[S8/01] Assessing the Production vs. Price of Black Tea in
Sri Lanka: An Application of Koyck’s Geometric-Lag
Model
M. S. K. De Silvaa, U. K. Jayasinghe-Mudaligeb, J. C.
Edirisinghec, H. M. L. K. Herathd, J. M. M. Udugamae
Department of Agribusiness Management, Faculty of Agriculture and Plantation
Management,Wayamba University of Sri Lanka, Makandura, Gonawila, Sri Lanka [email protected] [email protected]
[email protected] [email protected] [email protected]
__________________________________________________________________
Abstract
The quantity of food and agricultural products manufactured depends
on various agronomic and socio-economic factors that are exogenous
and endogenous to the production function. However, amongst all
determinants, own price of the product in concern plays a significant
role. Price analysis of key food and agricultural products involved
with trade is, therefore, crucial for economic decision making. In light
of this, tea being a major contributor of the Sri Lankan economy, the
purpose of this study was to examine the potential relationship between
the production and prices of black tea in Sri Lanka. Time series data,
on monthly basis from January 1991 to December 2011 (n=252), on
production and prices of black tea was analysed using the Koyck’s
Geometric-lag model considering the geometric decline of past and
current effects of price. STATA (version 11) statistical software was
used to evaluate the price to production responses in three main
elevations, i.e. High, Mid, and Low grown tea. The results show that
prices fetched at the Colombo auction impose a great impact on
production levels. Further, the time taken for an advance in price to
have a complete effect on production was an average lag period of two
to three months. The outcome of analysis, further, indicates that the
actual and expected levels of production were almost similar in most
of the months during this period, and the gap between actual and
estimated production increased throughout the period, i.e. an
increasing trend.
Keywords: Agricultural price analysis, Black tea,
Koyck’s Geometric-lag Model, Time-series data

Emerging Trends in Post- Conflict Societies: Challenges and the Way Forward Sri Lanka Economics Research Conference 2014
290
Introduction and research problem
Tea, being one of the main foreign exchange earning agricultural
products in Sri Lanka, is of high importance to the economy. Currently,
it accounts for about 2% of the Gross Domestic Product of the country.
Sri Lankan tea, historically, is divided into three groups based on the
geographical location as: High, Mid, and Low grown. The production
of tea in Sri Lanka in 2012 was 328.4 Mn. Kg. On average, more than
90% of tea produced in Sri Lanka is exported. Tea is primarily sold in
auctions, where the auction prices vary with both quality and quantity
on offer, and the demand at any given time. The average price for black
tea was Rs. 391.64 per Kg in 2012, and the price fetched at the auction
for a 1 Kg of black tea shows a decreasing trend during the past two
decades (Ministry of Plantation Industries, 2012).
Economic theory assumes that, under perfect market conditions, an
improvement in prices received in the market would result in an
increased output. This phenomenon, i.e. the “reaction” of agricultural
production to the market price, is considered in many different
empirical assessments carried out in the discipline of food and
agricultural economics, since it is claimed that for most of the
agricultural products, especially those plantation crops like tea that
takes a relatively long time to complete its production cycle (i.e. from
planting to plucking), this mechanism does not take place in the way it
is hypothesized, and alternatively, it might show a “cob-web” type
behaviour. In fact, historically, for the case of production of black tea,
it was evident that the production fluctuations were greater than the
prices and vice-versa for different periods of time. In light of this, the
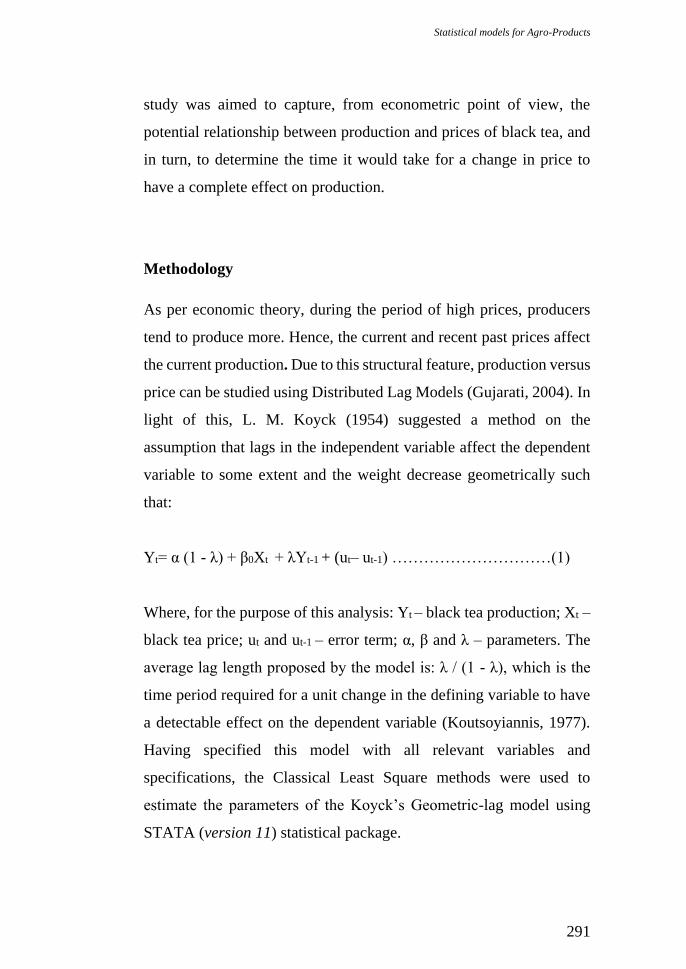
Statistical models for Agro-Products
291
study was aimed to capture, from econometric point of view, the
potential relationship between production and prices of black tea, and
in turn, to determine the time it would take for a change in price to
have a complete effect on production.
Methodology
As per economic theory, during the period of high prices, producers
tend to produce more. Hence, the current and recent past prices affect
the current production. Due to this structural feature, production versus
price can be studied using Distributed Lag Models (Gujarati, 2004). In
light of this, L. M. Koyck (1954) suggested a method on the
assumption that lags in the independent variable affect the dependent
variable to some extent and the weight decrease geometrically such
that:
Yt= α (1 - λ) + β0Xt + λYt-1 + (ut– ut-1) …………………………(1)
Where, for the purpose of this analysis: Yt – black tea production; Xt –
black tea price; ut and ut-1 – error term; α, β and λ – parameters. The
average lag length proposed by the model is: λ / (1 - λ), which is the
time period required for a unit change in the defining variable to have
a detectable effect on the dependent variable (Koutsoyiannis, 1977).
Having specified this model with all relevant variables and
specifications, the Classical Least Square methods were used to
estimate the parameters of the Koyck’s Geometric-lag model using
STATA (version 11) statistical package.
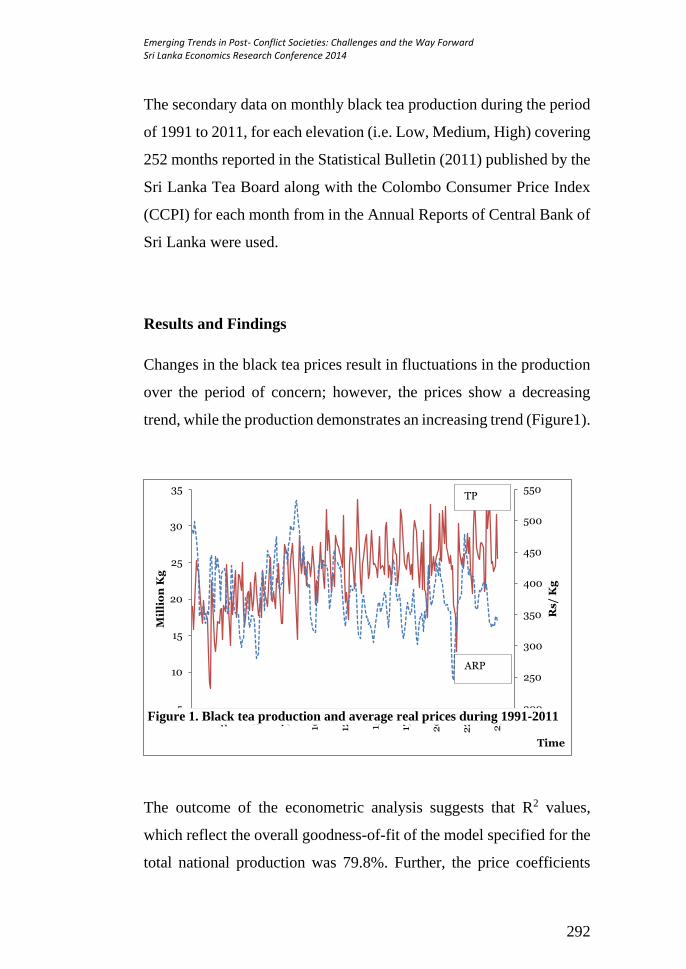
Emerging Trends in Post- Conflict Societies: Challenges and the Way Forward Sri Lanka Economics Research Conference 2014
292
The secondary data on monthly black tea production during the period
of 1991 to 2011, for each elevation (i.e. Low, Medium, High) covering
252 months reported in the Statistical Bulletin (2011) published by the
Sri Lanka Tea Board along with the Colombo Consumer Price Index
(CCPI) for each month from in the Annual Reports of Central Bank of
Sri Lanka were used.
Results and Findings
Changes in the black tea prices result in fluctuations in the production
over the period of concern; however, the prices show a decreasing
trend, while the production demonstrates an increasing trend (Figure1).
The outcome of the econometric analysis suggests that R2 values,
which reflect the overall goodness-of-fit of the model specified for the
total national production was 79.8%. Further, the price coefficients
200
250
300
350
400
450
500
550
5
10
15
20
25
30
35
1
26 51
76
101
126
151
176
20
1
22
6
25
1
Rs
/ K
g
Mil
lio
n K
g
Time
ARP
TP
Figure 1. Black tea production and average real prices during 1991-2011
Statistical models for Agro-Products
293
were positive and significant where, a 1 Rs. /Kg increase in black tea
price increased the production of which by o.01 Mn. Kg. Lagged
production coefficients were seen to have a positive and signifficant
effect on production, where, an increase of 1 Mn. Kg of black tea
production in the previous month increased the black tea production of
the current month by 0.72 Mn. Kgs.
According to the Mean Lag number, the time required for changes in
black tea prices to have a significant and detectable effect on black tea
production was 2.5 months. Overall, the outcome of analysis highlights
that black tea production responds to black tea prices within a very
short lag.
Conclusions, implications and significance
The potential relationship between black tea production and prices was
studied in this analysis for the period of 1991 – 2011 using the Koyck’s
geometric-lag model, where the amount of tea produced was taken as
the dependent variable, and black tea price and lag value of black tea
production were the defining variables. Overall, the results suggest that
the price had a positive influence and a lagged effect on production.
Black tea prices, in particular, have a significant and a detectable effect
on its production, which showed a two and a half month lag, on an
average. The average lag length of 2.57 for the total national
production suggests that, it adjusted to the average tea price within a
relatively short time as well. In conclusion, considering the average lag
period, this proves that black tea producers were responding quickly to

Emerging Trends in Post- Conflict Societies: Challenges and the Way Forward Sri Lanka Economics Research Conference 2014
294
the black tea prices; hence, price uncertainties result in fluctuations in
the black tea production industry.
References
1. Gujarati, D. N. (2004). Basic Econometrics 4th edition, The
McGraw-Hill Companies, 659-675.
2. Koutsoyiannis, A. (1977). Theory of Econometrics 2nd edition,
Mackays of Chatham PLC, Chatham, 304-310.
3. Koyck, L. M. (1954). Distributed Lags and Investment Analysis,
North Holland Publishing Company, Amsterdam, 21-50.
4. Ministry of Plantation Industries (2012), Statistical Information on
Plantation Crops, 55/75, Vauxhall lane, Colombo 2, Sri Lanka, 2-
157
5. Sri Lanka Tea Board (2011), Statistical bulletin, 574, Galle Road,
Colombo 03, Sri Lanka, 27-58.

Statistical models for Agro-Products
295
[S8/02] Are Healthy Foods Expensive in Sri Lanka?
Implications for Food Trade Policy
Hasara Rathnasekara a, Chamila Kotambageb, Jeevika
Weerahewa c
aDepartment of Agricultural Economics and Business Management, Faculty of
Agriculture, University of Peradeniya, Sri Lanka
[email protected] bDepartment of Customs, Sri Lanka
[email protected] c Department of Agricultural Economics and Business Management, Faculty of
Agriculture, University of Peradeniya, Sri Lanka
_______________________________________________________
Keywords: Healthy Food, Energy density, Energy cost,
Trade liberalization
Introduction and research problem
The developing world currently experiences a dual burden of
malnourishment, i.e., under- nourishment and over-nourishment.
Changing dietary patterns due to food trade liberalization,
urbanization, liberalization of media advertising, supermarketization
etc. is considered as one of the primary factors causing this health
burden. Popkin (1997) suggests that the world is witnessing a nutrition
transition and this rapid change in diet is linked with rapid increase in
chronic diseases specifically in the lower and middle-income
countries. Further he explains nutrition transition addresses a broad
range of socioeconomic and demographic shifts that bring rapid
changes in diet.
Emerging Trends in Post- Conflict Societies: Challenges and the Way Forward Sri Lanka Economics Research Conference 2014
296
Sri Lanka provides an interesting case in this global debate. On the one
hand, nearly half of the population(50.71%) remains on less than
minimum level of energy consumption per day and on the other hand,
71% of all deaths are due to non-communicable diseases* in 2001.
These trends suggest that chronic non-communicable disease mortality
rate is rapidly increasing over the past decades. Intake of unhealthy
diets that are high in sugar content, high in salt content, high in trans
fatty acids and saturated fat are considered as the main risk factor for
non-communicable diseases (National Policy and Strategies
Framework for Prevention and Control of Chronic Non-
Communicative Diseases, 2009). Higher dietary energy density is
associated with unhealthy food choices (Bolaric and Satalic, 2013) and
it was found that unhealthy foods such as red meat increase the risk of
heart disease, stroke and diabetes (Department of Public Health,
Harvard University, 2014).
The country is heavily depending on imports to meet its food
requirement and imports are subjected to various tariff and para-tariff
restrictions. It has been claimed that food import liberalization
increases accessibility of unhealthy food.
The objective of this study is to investigate the extent to which the
access to healthy food items is influenced by food trade policies of the
country by taking a sample of commonly consumed food items in Sri
Lanka. Energy density is considered as a proxy for healthiness of food
Statistical models for Agro-Products
297
item and cost of unit energy and the effect of tax structure on prices
are used to explain affordability in terms of price.
Methodology
A higher dietary energy density is associated with unhealthy food
choices and energy density is an indicator for food quality. Thus,
Energy density which is expressed in kJ/gram, a measure of available
energy per mass unit of a particular food is considered as a proxy to
indicate healthiness of food items (Bolaric and Satalic, 2013).Data on
Energy density of food items were collected from Nutrient data by
USDA SR-21 available at http://nutritiondata.self.com/facts. Where
appropriate, nutrition information declared on the food product was
used for the information of energy density.
Data on food prices and amount of food consumed was gathered from
the Household Income and Expenditure Survey (HIES) preliminary
report of Department of Census and Statistics 2012/2013 and calculate
the energy cost (Rs/kJ) in order to explain the food affordability in
terms of energy cost and to establish the relationship between energy
density and energy cost computing Pearson correlation. Finally, the
impact of trade taxes charged on importable food items was compiled
and the extent to which trade taxes escalated food prices was
examined. Data on import taxes was collected from publications of
Department of Customs.
*Non-communicable diseases (NCDs), mainly cardiovascular diseases, cancers,
diabetes, obesity and chronic respiratory diseases, represent a leading threat to
human health and human development in today's world (World Medical Association)

Emerging Trends in Post- Conflict Societies: Challenges and the Way Forward Sri Lanka Economics Research Conference 2014
298
Results and findings
The results of the budget share calculations reveal that rice, milk
powder, coconuts, chicken, bread, sugar, wheat, dhal and edible oil are
the top most energy sources of the country comprising with higher
budget shares. Price changes of commonly consumed food items were
calculated to understand the price fluctuations of food items in general.
Results indicate that there is a price hike for most of the food items
including wheat flour, bread, coconuts, sugar, fish and for fruits such
as mango and apple. However, there is a price dropdown for cow milk,
dhal and rice.
The analysis of relationship between energy cost and energy density
for commonly consumed food items reveal that there is a negative
correlation between energy density and energy cost. This depicts food
items that are high in energy density are cheaper compared to food
items with low energy densities. For instance, items having lower
energy densities are costly (grapes and apples) and low energy cost
items have higher energy densities (Kurakkan and cassava).
Further, a disaggregated level analysis was carried out for different
food groups according to the categories specified by HIES. Results
reveal that there is a positive relationship for energy density and energy
cost for cereals, fats and oils, meat and fish which implies higher the
energy density higher the cost in consuming above food items.
Conversely, a negative correlation is observed for milk products,
pulses, vegetables, yams, eggs, condiments, fruits and confectionary
food items.

Statistical models for Agro-Products
299
Figure 01: Relationship between energy density and energy cost for selected
food items
Energy cost (Rs/kJ)
En
erg
y d
en
sit
y (
kJ/
gra
m)
0.200.150.100.050.00
40
30
20
10
0
Mangoes
Sugar
Chili powder
Large Onion
Dried fish
Sprats (Fish)
cassava raw
Coconut oil
OrangeGrapesApple
Milk powder
Cow milk
Eggs
Chicken
Potatoes
Carrots
Beans SoyameatDhal
Bread
Kurakkan flourWheat flour
Rice flourRice
Scatterplot of Energy density(kJ/gram) vs Energy cost (Rs/kJ)
Though a similar relationship is visible for importable, the results
reveal that their consumption levels can be regulated through import
taxes.
Table 1: Food energy price and energy cost
Food category Correlation coefficient
All (n=135) -0.180**
Cereals (n=14) 0.105
Milk Products (n=7) -0.717*
Fats and oils (n=3) 0.900
Pulses (n=8) -0.073
Vegetables (n=33) -0.466***
Yams (n=6) -0.267
Meat (n=5) 0.157
Fish (n=14) 0.238
Eggs (n=2) -1.000
Fruits (n=19) -0.214
Confectionaries (n=5) -0.199
Condiments (n=11) -0.710**
*** for significance at 1%, ** for significance at 5%, * for significance at 10%
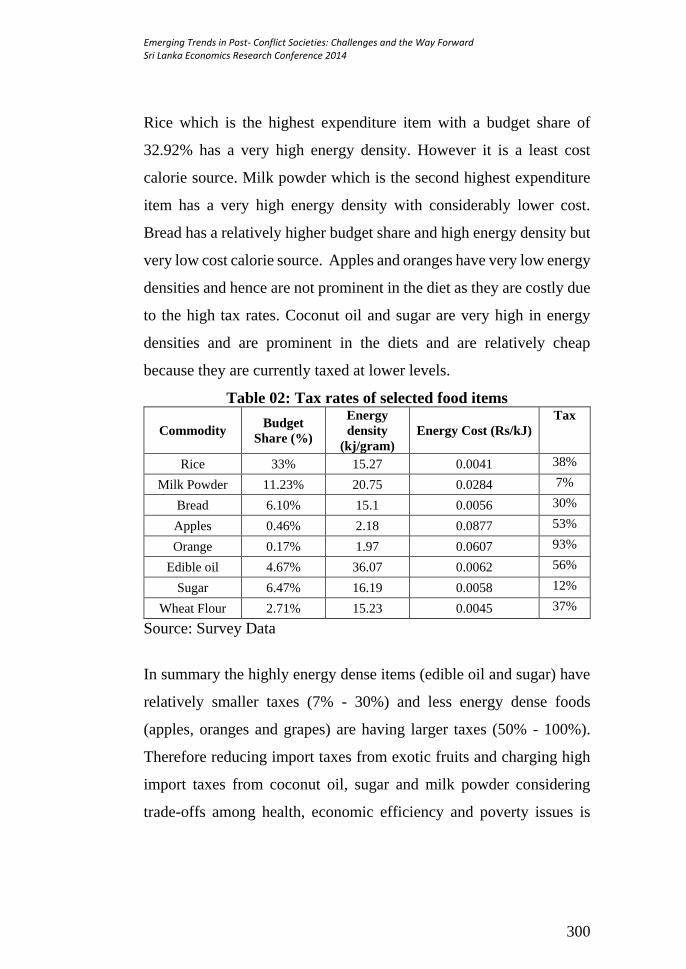
Emerging Trends in Post- Conflict Societies: Challenges and the Way Forward Sri Lanka Economics Research Conference 2014
300
Rice which is the highest expenditure item with a budget share of
32.92% has a very high energy density. However it is a least cost
calorie source. Milk powder which is the second highest expenditure
item has a very high energy density with considerably lower cost.
Bread has a relatively higher budget share and high energy density but
very low cost calorie source. Apples and oranges have very low energy
densities and hence are not prominent in the diet as they are costly due
to the high tax rates. Coconut oil and sugar are very high in energy
densities and are prominent in the diets and are relatively cheap
because they are currently taxed at lower levels.
Table 02: Tax rates of selected food items
Commodity Budget
Share (%)
Energy
density
(kj/gram)
Energy Cost (Rs/kJ)
Tax
Rice 33% 15.27 0.0041 38%
Milk Powder 11.23% 20.75 0.0284 7%
Bread 6.10% 15.1 0.0056 30%
Apples 0.46% 2.18 0.0877 53%
Orange 0.17% 1.97 0.0607 93%
Edible oil 4.67% 36.07 0.0062 56%
Sugar 6.47% 16.19 0.0058 12%
Wheat Flour 2.71% 15.23 0.0045 37%
Source: Survey Data
In summary the highly energy dense items (edible oil and sugar) have
relatively smaller taxes (7% - 30%) and less energy dense foods
(apples, oranges and grapes) are having larger taxes (50% - 100%).
Therefore reducing import taxes from exotic fruits and charging high
import taxes from coconut oil, sugar and milk powder considering
trade-offs among health, economic efficiency and poverty issues is

Statistical models for Agro-Products
301
important to promote a healthy diet through government regulations.
Conclusions, implications and significance
The relationship between energy density and energy cost is negative
for commonly consumed food items in Sri Lanka which is a common
scenario in the contemporary world and this is shown by many
researches (Drewnowski and Specter, 2004; Bolaric and Satalic,
2013). This means that healthy food items that are low in energy
density are expensive and therefore less affordable compared to
unhealthy food items that are high in energy density. High price of
unhealthy food items can be considered as an incentive to consume
unhealthy foods since consumers are primarily price sensitive in the
developing world context.
This negative relationship is true not only for locally consumed food
items but also for importable. However the price of imported food
items escalated through the imposition of taxes. According to the
findings higher tax rates are associated with low energy density food
items that are healthier. Moreover, taxes are imposed on healthy food
items (especially fresh fruits) compared to unhealthy food items and
ultimately the government is indirectly influencing the rise of demand
for unhealthy food unconsciously and unintentionally.
Therefore, a visit of import tax schedule (charging higher taxes on
unhealthy food and visa-versa) can be suggested in order to increase

Emerging Trends in Post- Conflict Societies: Challenges and the Way Forward Sri Lanka Economics Research Conference 2014
302
the healthy food consumption as a practical and applicable strategy
along with other necessary steps.
References
1. Drewnowski, A., and Specter, S. E. (2004) Poverty and obesity:
the role of energy density and energy costs. The American journal
of clinical nutrition,79(1), 6-16.
2. Monsivais, P., and Drewnowski, A. (2007). The rising cost of low-
energy-density foods. Journal of the American Dietetic
Association, 107(12), 2071-2076.
3. Bolaric, M., and Satalic, Z. (2013). The relationship between food
price, energy density and diet quality. Croatian Journal of Food
Science and Technology, 5(2) 39-45.
4. Popkin,B.(1997). The nutrition transition and its health
implications in lower-income countries. Public Health Nutrition,
1(1), 5-21.

Statistical models for Agro-Products
303
[S8/03] Forecasting Fish Prices in Colombo with
SARIMA Model
aPereraK.B.P., aHerath H.M.L.K., bWijesuriya W., aJayasinghe-
Mudalige U.K., aEdirisinghe J.C., aUdugama J.M.M., cPerera
D.A.M., dSilva K.D.R.R.
a Department of Agribusiness Management, Faculty of agriculture and Plantation
Management, Wayamba University of Sri Lanka, Makandura, Gonawila (NWP), bBiometry
Section, Rubber Research Institute of Sri Lanka, Dartonfield, Agalawatta,
cDepartment of Accounting, Faculty of Business Studies and Finance, WayambaUniversit of
Sri Lanka, Kuliyapitiya,
dDepartment of Applied Nutrition, Faculty of Livestock Fisheries and Nutrition, Wayamba
University of Sri Lanka,
_______________________________________________________
Abstract
Fish is a major animal based protein source which provides more than
50% of animal protein requirement of people in the country. However
it is claimed that fish prices are increasing day by day. Frequent price
fluctuations of fish has created many marketing issues in fish industry.
Thus studying price behaviours and forecasting future fish prices will
be very important for economists, policy makers, traders, consumers,
fishermen, importers and processors for various purposes and these
were the main objectives of this study. The time series econometric
techniques based on SARIMA models were employed in finding a
parsimonious model for better forecasts. It was found that some higher
order SARIMA models were able to parsimoniously track the dynamic
behaviour of conditional mean real fish prices with acceptably
accurate forecasts. Moreover, it was revealed that, although nominal
fish prices were increasing, real prices looked steady. A Seasonal
pattern of fish real prices were found where higher prices were
observed during the middle months of the year.
Keywords: Fish industry, Forecasting, Real prices,
SARIMA model
Emerging Trends in Post- Conflict Societies: Challenges and the Way Forward Sri Lanka Economics Research Conference 2014
304
Introduction and research problem
The fisheries sector plays a vital role in the economy of Sri Lanka
contributing to around 1.8% to the GDP (Anon, 2012). Fish products
are an important source of animal protein, providing around more than
50% of the animal protein consumed in the country. The contribution
of the marine fisheries segment to the fisheries sector is around 86%.
The major characteristics of the consumption patterns of fresh fish
reveal that most commonly preferred varieties of large pelagic were
Skip jack tuna, Sail fish and Yellowfin tuna. Among small pelagic
species, Trenched Sardinella and Sardine were the most commonly
preferred varieties. The average quantity of fresh fish consumed by a
person was reported as 18.28g per day (Anon, 2010). Moreover,
different fisheries sector sources mention that wholesale and retail
prices of fish has gradually increased over last five years and prices of
fish considerably higher than other animal based food commodities
(Anon, 2012).
Modelling and forecasting fisheries prices is important to all the
stakeholders engaged in the sector for better decision making. Various
techniques viz. decomposition techniques, Ordinary Least Square
method (OLS) and Box-Jenkins Autoregressive Integrated Moving
Average (ARIMA) models have been used to explain the forecasting
performances of prices in economics. However ARIMA model cannot
handle the seasonal variations. Although decomposition methods and
smoothing techniques have been commonly used for this purpose
rigorous theoretical justifications and underlying model structures are

Statistical models for Agro-Products
305
not available. Floros and Failler (2006) have used Seasonal
Autoregressive Integrated Moving Average (SARIMA) models for
forecasting monthly fisheries prices in UK which can handle seasonal
variations also. However there are no such rigorous and updated
models available in the literature for forecasting and studying the
dynamic behaviour of fish prices in Sri Lanka. With this background
this study was carried out with the objective of identifying appropriate
time series models for studying dynamic behaviour and forecasting of
fish prices.
Methodology
The average weekly Colombo retail prices of five commonly used fish
types, namely Sail fish, Trenched Sardinella, Seer, Sardine and
Skipjack tuna were collected during the period from 2000 to 2013 from
Hector Kobbekaduwa Agrarian Research and Training Institute
(HARTI) and used in the analysis.
Nominal prices of fish were converted into real prices to avoid impacts
of the inflation using Colombo Consumer Price Index (CCPI) as the
price deflator. However, CCPI was available in two base years; 1952
and 2006/07. CCPI of 1952 base year was converted into 2006/07 base
year using a conversion factor (γ) which is depicted in equation 1.
𝛾 =1
𝑇∑
𝐶𝐶𝑃𝐼𝑗,1952=100
𝐶𝐶𝑃𝐼𝑗,2006/7=100
𝑇𝑡=1 (1)
where, t=1,2,……, T
Suppose, nominal price at time t is pnt and real price at time t is prt,
where t = 1, 2,….T. Then prt can be defined as depicted in equation 2.
𝑃𝑟𝑡 =𝑃𝑛𝑡
𝐼𝐶𝐶𝑃𝐼𝑡 (2)

Emerging Trends in Post- Conflict Societies: Challenges and the Way Forward Sri Lanka Economics Research Conference 2014
306
where, 𝐼𝐶𝐶𝑃𝐼𝑡 =𝐶𝐶𝑃𝐼𝑡
𝐶𝐶𝑃𝐼𝑇. ICCPIt can be interpreted as the ratio between
CCPI at time t and CCPI at time T which is the most recent value of
CCPI in series.
Preliminary investigation was done using summary statistics, time
series plots, Autocorrelation Function (ACF) and Partial
Autocorrelation Function (PACF). Stationarity was checked using
Augmented Dickey Fuller (ADF) test, Kwiatkowski Phillips Schmidt
Shin (KPSS) test, AFCs and PACFs. Seasonality and stationarity with
respect to seasonality were identified using respective ACFs and
PACFs. Seasonal indices were calculated employing the
decomposition techniques.
In this study we fitted the SARIMA model (Shumway and Stoffer,
2006) to the real fish prices since it can handle the seasonal variations
over the ARIMA model. The underlying model structure can be
describe as depicted in equation 3
𝛷𝑃(𝐵𝑠)𝜙(𝐵)𝛻𝑠𝐷𝛻𝑑𝑦𝑡 = 𝛼 + 𝛩𝑄(𝐵𝑠)𝜃(𝐵)𝜀𝑡 (3)
where , εt is a Gaussian white noise process. ϕ(B)andθ(B) are the
ordinary autoregressive and moving average operators of orders p and
q. ΦP(Bs)and ΘQ(Bs) are respectively seasonal autoregressive and
moving average operators of order P and Q . Ordinary differencing
component is defined as ∇d= (1 − B)dwhile seasonal differencing
component is defined such that∇sD= (1 − Bs)D.

Statistical models for Agro-Products
307
Preliminary models were identified using respective ACFs and PACFs
while identifying appropriate order of differencing based on results of
tests for stationary. Model fitting was done using R package “tseries”.
Model selection was done based on least Corrected Akaike
Information Criterion (AICc). Diagnostic checking of the selected
model was done through a residual analysis based on residual plots,
normal probability plots of residuals, ACFs, PACFs of residuals,
squared residuals and Ljung-Box test on serial dependencies. Based on
results of diagnostic checking final models were selected. Forecasting
and forecasting efficiency based on least Mean Absolute Percentage
Error (MAPE) was obtained. For computing MAPE, data from 2000
to 2012 was regarded as the training data set while data from 2012 to
2013 was used for validation.
Results and Findings
Average real prices of Sail fish, Trenched Sardinella, Seer, Sardine and
Skipjack tuna were rupees 820.09, 334.45, 1160, 203.81 and 485.61
respectively. Seer showed the highest average prices with a high
standard deviation and Sardine was reported the least average price.
Most of the minimum fish prices were seen in the first few weeks of
2005. It might be due to “negative consumer reaction” on the domestic
consumer demand for fresh fish during the post tsunami days
(Subasinghe, 2005). Kurtosis refers to the degree of peak in a
distribution which was lesser than 3 for all types of fish. It can be
interpreted that distributions of fish prices were flatter than the
standard normal distribution which indicated wider spread of real
prices around its average price.

Emerging Trends in Post- Conflict Societies: Challenges and the Way Forward Sri Lanka Economics Research Conference 2014
308
Although nominal fish prices showed a clear increasing trend, there
was no such increasing trend in real fish prices in the time series plots.
Consequently, the trend perceived in the nominal fish prices as a
consequence of rising inflation. This matter should be considered by
the policymakers when sectorial policies are made especially regarding
pricing and regulatory policies.
According to the ADF test all real price time series were stationary.
However, KPSS test reported that except Trenched Sardinella and
Sardine series, other real price series were non-stationary. By matching
these results with ACFs and PACFs, found that except the Sardine, all
other real price series were non-stationary. Once first order differenced
real price series of fish prices, except for Sardine was investigated by
using ADF, KPSS tests and ACFs and PACFs, it was found that first
order differencing is adequate to make respective series stationary.
Moreover, the ACFs and PACFs of first order differenced series were
indicated that seasonal differencing is required for all series.
The best fitted models of Sail fish, Trenched Sardinella, Seer, Sardine
and Skipjack tuna were (4,1,3)(0,1,1)52, (3,1,3)(1,1,1)52,
(4,1,3)(0,1,1)52, (3,0,4)(0,1,1)52 and (4,1,3)(0,1,1)52 consequently.
These models selected based on least AICc were 6848.18, 6681.10,
8192.89, 6388.77 and 6953.99 respectively. Fairly high orders for
ordinary AR and MA parts of the models were indicated present real
prices are significantly serially dependent on the variability of real
prices prevailed during past few weeks. The variability of real fish
prices observed in several weeks at present would diffuse into the next

Statistical models for Agro-Products
309
week fish prices. This is very important information for stakeholders
engaged in the sector for planning and making decisions better. As
depicted in the seasonal component of models, present seasonal
variability in real fish prices was dependent on the variability observed
in the previous season where the seasonal length is 52 weeks.
Table 1. Price forecasts and actual prices
Fish Type Point Forecast Confidence Interval (95%) Actual Price
Low High
Sail fish
859.06 790.91 927.20 869.39
862.20 779.99 944.41 861.85
849.90 760.81 938.98 864.59
837.71 745.35 930.06 814.11
828.31 731.29 925.32 814.45
Trenched Sardinella
316.05 254.70 377.39 306.38
335.33 266.64 404.02 302.02
331.07 258.55 403.58 315.09
328.61 253.12 404.09 297.17
340.88 262.32 419.44 313.19
Seer
1408.00 1222.00 1594.00 1457.00
1391.00 1172.00 1611.00 1437.00
1399.00 1165.00 1633.00 1278.00
1303.00 1061.00 1544.00 1197.00
1326.00 1074.00 1578.00 1149.00
Sardine
183.97 134.68 233.26 194.31
189.53 132.73 246.32 190.96
176.29 117.58 235.00 195.66
180.68 119.26 242.09 168.44
182.16 117.95 246.37 155.42
Skipjack tuna
579.60 504.70 654.49 553.79
580.03 492.79 667.27 531.48
587.01 494.53 679.49 503.79
550.96 455.26 646.66 422.51
567.37 467.65 667.08 433.69
MAPE of Sail fish, Trenched Sardinella, Seer, Sardine and Skipjack
tuna were 8.53, 13.83, 8.26, 20.11 and 11.07 respectively. Models of
Sail fish and Seer are good indicators that these models would produce
more accurate forecasts. Models of Trenched Sardinella and Skipjack
tuna real prices have comparatively high forecasting accuracy
compared to Sardine. Price forecasts for first five week in year 2014
Emerging Trends in Post- Conflict Societies: Challenges and the Way Forward Sri Lanka Economics Research Conference 2014
310
are given in Table 1. Forecasts were acceptably close to their actual
figures. All actual prices were included in 95% confidence limits of
the price forecasts. Seasonal indices of real prices indicate the seasonal
behaviour. According to that all fish prices were tend to be high during
the middle few months of the year.
Conclusions, implications and significance
The apparent increasing trend in fish prices is governed by the rising
inflation rather than issues in the fish industry which should be
considered by policy makers. Fish prices would tend to be high during
the midyear. The findings suggest that SARIMA models can be used
for forecasting fish prices reliably. It can be concluded that the price
information available in few present weeks (3-4 weeks) would diffuse
into the next week determining fish prices of the week. This can be
utilized by stakeholders of the industry for planning and making
efficient decisions. However more research is needed to determine the
reasons for the seasonality and behaviour of prices explained by the
models and their consequences.
References
1. Anon, (2010) Food balance sheet-2010, Agriculture and
Environment Statistics Division, Department of Census and
Statistics, Sri Lanka. Available from:
http://www.statistics.gov.lk/agriculture/FoodBalanceSheet/Food
%20Balance%20Sheet%202010.pdf (Accessed 27 April 2014)
2. Anon, (2012) Fishery Industry outlook National Aquatic Research
Resources and Development Agency (NARA). Available from:
Statistical models for Agro-Products
311
http://www.nara.ac.lk/ARA/12/fisheries%20outlook/SED/Outloo
k%20Final%202012.pdf (Accessed 10 May 2014)
3. Floros, C. and Failler, P. (2006)‘Forecasting Monthly fisheries
prices model comparison using data from Cornwall (UK)’,
European Journal of scientific writing,24:23-28.
4. Subasinghe, S. (2005) Tsunami redefining seafood consumption
pattern in Sri Lanka. Ministry of fisheries and ocean resources,
Malaysia.

Emerging Trends in Post- Conflict Societies: Challenges and the Way Forward Sri Lanka Economics Research Conference 2014
312

Statistical models for Agro-Products
313
[S8/04] Estimating technical efficiency of vegetable
farmers in the Anuradhapura district in Sri Lanka
Muditha Karunarathna
Department of Economics and Statistics, University of Peradeniya
Abstract
Promotion of economic efficiency is an important policy goal for the
entire agricultural sector. This study aims at delivering empirical
evidence on the level of technical efficiency of vegetable farmers by
analysing farm level data covering approximately 450 vegetable
farmers in Anuradhapura district in Sri Lanka. The study focuses only
on commercial level vegetable farmers who cultivate only different
type of vegetables varieties in their farms. The empirical results
indicate that more than 80 % of the sampled farmers were less than
55% technically efficient. It was also found that farming experience,
household size, agricultural extension services and level of
educational attainment reduces technical inefficiency, while farmers’
age increases technical inefficiency. Policies that would improve
farmer’s educational status through adult education and agricultural
extension services would increase technical efficiency of vegetable
farms in the long term.
Key Words: Technical efficiency; Vegetable farmers; Stochastic
frontier production

Emerging Trends in Post- Conflict Societies: Challenges and the Way Forward Sri Lanka Economics Research Conference 2014
314
Introduction and research problem
Technological innovation and the more efficient use of existing
technologies are the main strategies of achieving higher level of output
in agriculture (Hoang and Coelli, 2009). However, in developing
countries most new agricultural technologies have only been partially
successful in improving productivity. This is often due to a lack of
ability or desire to adjust input levels by the producers because of their
familiarity with traditional agricultural systems or because of
institutional constraints (Binam et al., 2004). These considerations
suggest that the best option to assist developing countries to raise
productivity is increasing efficiency. If farmers are not effectively
using existing technology, then efforts designed to improve efficiency
may be more cost-effective than introducing new technologies. The
presence of shortfalls in efficiency means that output can be increased
without requiring additional conventional inputs and without the need
for new technology. If this is the case, empirical measures of efficiency
are needed to determine the magnitude of the gains that could be
obtained by improving performance in agricultural production with a
given technology. In this research farmers’ ability to select a
production system and its relationship with farm level technical
efficiency is investigated.
There are several important reasons for measuring the farm level
technical efficiency of agricultural production. Firstly, if farmers are
not making efficient use of existing technologies, then efforts designed
to improve efficiency would be more cost effective than introducing a
new technology as a means of increasing output. Secondly, measuring

Statistical models for Agro-Products
315
efficiency leads to sustainable resource savings, which has important
implications for both policy formulations and farm management.
Thirdly, it is only through measuring efficiency and separating its
effects from the effects of the production environment that one can
explore hypotheses concerning the sources of efficiency differential.
Fourthly, identification of sources of inefficiency is important to the
institution of public and private policies designed to improve
performance of agriculture.
Vegetable is an important sector in Sri Lanka as it contributes to
around 11% to the total agriculture production. Vegetables are
cultivated by more than two million family units in the island. In Sri
Lanka the total vegetable cultivated land area is approximately
150,000 hectares. It is 10.1% from the total agricultural land. This
research project aims at delivering empirical evidence on the level of
technical efficiency of vegetable farmers by analysing farm level data
covering approximately 450 vegetable farmers in Anuradhapura
district in Sri Lanka. The study focuses only on commercial level
vegetable farmers who cultivate only different type of vegetables
varieties in their farms. To the best of my knowledge, this is one of the
first attempts at investigating farm level technical efficiency of
vegetable farmers in Sri Lanka.
Methodology
Empirical model of estimating technical efficiency in this study will
be based on the stochastic production function proposed by Battese
and Coelli (1995). In the first phase of the empirical analysis, technical
efficiency effects on a cross section of farmers will be modelled in

Emerging Trends in Post- Conflict Societies: Challenges and the Way Forward Sri Lanka Economics Research Conference 2014
316
terms of input variables in the production process. We used Cobb-
Douglas production function and the estimation was performed using
Frontier version 4.1 (Coelli, 1996). Accordingly, the stochastic frontier
model to be estimated is defined by:
iii
i
ii UVXY
lnln4
1
0
where, ln represent the natural logarithm. The subscript i, indicates the
ith farmer in the sample (i = 1,2……..,n).
iYln represents the natural logarithm of the value of farm
output
1lnX represents the natural logarithm of the total area of land
(in acres) under
cultivation
2ln X represents the natural logarithm of labour in man dates
3ln X represents the natural logarithm of capital expenditure
4ln X represents the natural logarithm of other cost: raw
materials
j ’s are unknown parameters to be estimated
iV ’s are assumed to be independent and identically distributed normal
random errors having zero mean and unknown variance; ;2
v iU ’s are
non-negative random variables, called technical inefficiency effects,
which are assumed to be independently distributed such that iU is
defined by the truncation (at zero) of the normal distribution with
mean, i and variance 2
u . The model for the technical inefficiency
effects specifies that the technical inefficiency effects of the stochastic
frontier are a function of socio-economic and institutional factors (age,
education, household size, number of separate plots, agricultural
extension services, credit access, membership of a farm organization,

Statistical models for Agro-Products
317
land ownership…etc.). Some of these variables are assumed to be
directly related to farmers’ management skills, while the others could
impact on their technical efficiency through availability of labour for
timely management of farming activities or incentives for increasing
efficiency in farms. This can be written as:
iii
iiiiiiii
gZZ
ZZZZZZZU
9988
776655443322110
iZ1 is the age of the responded in years (AGE)
iZ2 is the formal education of the responded in years (EDU)
iZ3 is the household size (HS)
iZ4 is extend of irrigated area (RFH)
iZ5 is farming experience in years (FE)
iZ6 is agricultural extension services contacts(AEC):Dummy
variables if Yes 1, else 0.
iZ7 is credit access : Dummy variables if Yes 1, otherwise 2.
iZ8 is member of a farm organization : Dummy variables if
Yes 1, otherwise 2.
iZ9 is the land ownership(LO); Dummy variable if owned 1,
otherwise 0.
The econometric estimation strategy requires some of the assumption
about functional forms and distribution of error components. Given
functional and distributional assumptions, maximum-likelihood
estimates (MLE) for all parameters of the stochastic frontier
Emerging Trends in Post- Conflict Societies: Challenges and the Way Forward Sri Lanka Economics Research Conference 2014
318
production and inefficiency model will be simultaneously estimated
using the program, FRONTIER 4.1. The technical efficiency of a
farmer is between 0 and 1 and is inversely related to the level of the
technical inefficiency effects (Battese and Coelli, 1995). Technical
efficiency can also be predicted using the FRONTIER program, which
calculates the maximum-likelihood estimator of the predictor for
Equation 1 that is based on its conditional expectation, given the
observed value of (Vi-U
i) (Battese and Coelli, 1988). More details
about obtaining maximum-likelihood estimator is given by Coelli et
al. (2005).
Results and findings
The descriptive statistics show that the majority of the sample
respondents are male (94 %). The mean age was 45 years. This implies
that majority of the farmers were youth and they are in an economically
active age that can make positive contribution to agricultural
production. Most respondents (91%) are married. The household size
of most respondents (99%) ranged between 1 and 6 members and
approximately 41% of families include four members. A large
household size also means more mouths to feed, such that for a given
farm size large households could produce a smaller market surplus
(Minot et al, 2006). The literacy level among the farmers in the study
area is quite high. Most of the farmers have completed grade 11 at
school. Approximately 35 % of respondents have passed ordinary level
exam, 4 % have passed advanced level exam and 1 % are degree
holders. Further, 89 % farmers’ main occupation is farming. Average
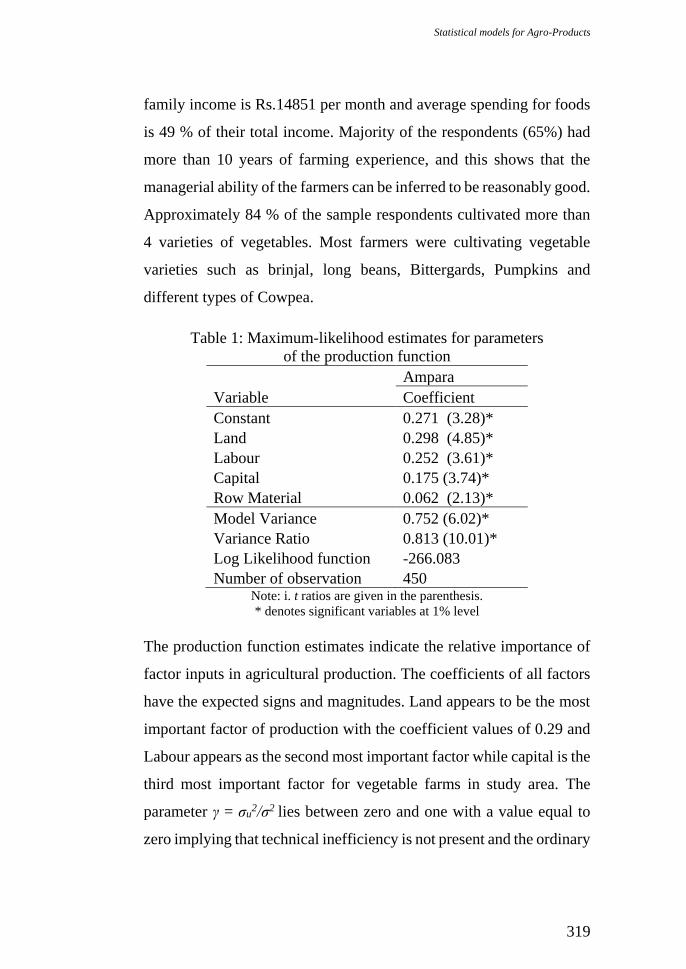
Statistical models for Agro-Products
319
family income is Rs.14851 per month and average spending for foods
is 49 % of their total income. Majority of the respondents (65%) had
more than 10 years of farming experience, and this shows that the
managerial ability of the farmers can be inferred to be reasonably good.
Approximately 84 % of the sample respondents cultivated more than
4 varieties of vegetables. Most farmers were cultivating vegetable
varieties such as brinjal, long beans, Bittergards, Pumpkins and
different types of Cowpea.
Table 1: Maximum-likelihood estimates for parameters
of the production function
Ampara
Variable Coefficient
Constant 0.271 (3.28)*
Land 0.298 (4.85)*
Labour 0.252 (3.61)*
Capital 0.175 (3.74)*
Row Material 0.062 (2.13)*
Model Variance 0.752 (6.02)*
Variance Ratio 0.813 (10.01)*
Log Likelihood function -266.083
Number of observation 450 Note: i. t ratios are given in the parenthesis.
* denotes significant variables at 1% level
The production function estimates indicate the relative importance of
factor inputs in agricultural production. The coefficients of all factors
have the expected signs and magnitudes. Land appears to be the most
important factor of production with the coefficient values of 0.29 and
Labour appears as the second most important factor while capital is the
third most important factor for vegetable farms in study area. The
parameter γ = σu2/σ2 lies between zero and one with a value equal to
zero implying that technical inefficiency is not present and the ordinary
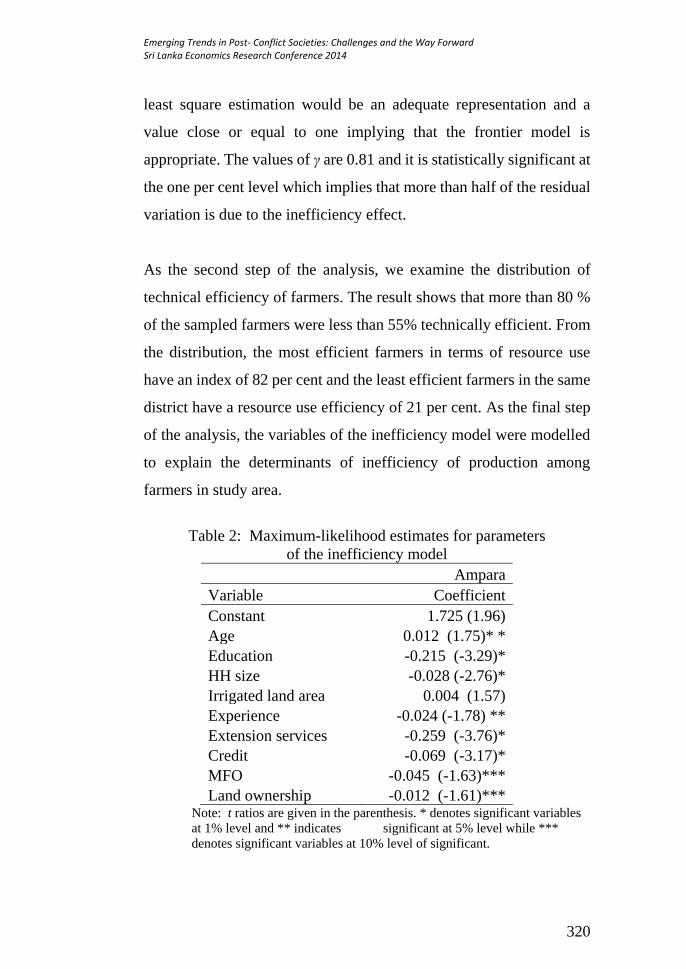
Emerging Trends in Post- Conflict Societies: Challenges and the Way Forward Sri Lanka Economics Research Conference 2014
320
least square estimation would be an adequate representation and a
value close or equal to one implying that the frontier model is
appropriate. The values of γ are 0.81 and it is statistically significant at
the one per cent level which implies that more than half of the residual
variation is due to the inefficiency effect.
As the second step of the analysis, we examine the distribution of
technical efficiency of farmers. The result shows that more than 80 %
of the sampled farmers were less than 55% technically efficient. From
the distribution, the most efficient farmers in terms of resource use
have an index of 82 per cent and the least efficient farmers in the same
district have a resource use efficiency of 21 per cent. As the final step
of the analysis, the variables of the inefficiency model were modelled
to explain the determinants of inefficiency of production among
farmers in study area.
Table 2: Maximum-likelihood estimates for parameters
of the inefficiency model
Ampara
Variable Coefficient
Constant 1.725 (1.96)
Age 0.012 (1.75)* *
Education -0.215 (-3.29)*
HH size -0.028 (-2.76)*
Irrigated land area 0.004 (1.57)
Experience -0.024 (-1.78) **
Extension services -0.259 (-3.76)*
Credit -0.069 (-3.17)*
MFO -0.045 (-1.63)***
Land ownership -0.012 (-1.61)*** Note: t ratios are given in the parenthesis. * denotes significant variables
at 1% level and ** indicates significant at 5% level while ***
denotes significant variables at 10% level of significant.
Statistical models for Agro-Products
321
The sign of the variables in the inefficiency model is very important in
explaining the observed level of TE of the farmers. A negative sign
would imply that the variable had the effect of reducing technical
inefficiency, while a positive coefficient would indicate increasing
inefficiency. The results are presented in Table 2 and indicate that all
the included variables except age had the expected sign.
The estimated coefficients in the inefficiency model are of particular
interest to this study. This is because these estimated coefficients of
the inefficiency function provide explanations for the relative technical
efficiency levels among individual farms. Most of the coefficients of
explanatory variables in the inefficiency model are found to have
expected signs. The age coefficient is positive, which indicates that the
older farmers are more inefficient than the younger ones. This variable
is significant at five per cent level. The positive coefficient of age
suggests that age led to technical inefficiency of the farmers
(Ogunyinka and Ajibefun, 2004). A possible explanation could be that
the general ability to supervise farming activities decreases as farmers
advanced in age.
The negative estimate for variables such as education, household size,
experience, agricultural extension services and credit access implies
that these variables are very important to reduce the farm level
technical inefficiency in the study area. For example education
variable implies that farmers with greater years of schooling tend to be
less inefficient. The relationship is relatively strong, because the
coefficient is very high relative to its estimated standard error. The
Emerging Trends in Post- Conflict Societies: Challenges and the Way Forward Sri Lanka Economics Research Conference 2014
322
coefficient of education is significant at one per cent level. It can
therefore be assumed that farmers with greater years of formal
schooling tend to be more technically efficient. The predicted
coefficient of household size was negative and significant at one per
cent level while the coefficient of extension contact is negative and
significant, suggesting that such contact increases farm level technical
efficiency because farmers are able to use modern techniques of
farming involving land preparation, planting, application of agro-
chemicals (for example, fertilizer) and harvesting. Other variables in
the model can also be interpreted as the same way.
Conclusions, implications and significance
This research is one of the first attempts to use the stochastic
production frontier approach to investigate the technical efficiencies
among vegetable farmers in Sri Lanka. The study provides an
economic analysis of farm household efficiency among vegetable
farmers. Using stochastic frontier analysis, the results show the
potential of increasing education as a driving force for output growth.
Econometric analysis of survey data shows that land size, labour,
capital expenditure and expenditure on raw materials are important
inputs and are strongly associated with the total output. The analysis
reports evidence of farm level technical inefficiency and its
determinants. Results of this study show the potential for large gains
in real output if technical efficiency is increased. The results depict a
wide gap between farmers who are relatively poor in their efficiency
performance (20 per cent) and those who are highly efficient (more
than 80 per cent). In particular this study shows that the output value
Statistical models for Agro-Products
323
of farms in the study area can be increased with the current levels of
inputs and technology if less efficient farmers are encouraged to follow
the resource utilization pattern as well as farm types that have already
been adopted by the most efficient farmers.
The overall findings of this research will help implement policies to
reduce technical inefficiency among vegetable farmers in Sri Lanka.
It also helps increase awareness and generates support for investment
in increasing technical efficiency in the agricultural sector. This type
of study can provide an economic analysis of farm household
efficiency among commercial vegetable farms in Sri Lanka, where
vegetable farming generates a large part of household income. The
results show the potential of encouraging the methods of increasing
more efficient farms in the country. Econometric analysis of survey
data l provides the information of current technical efficiency level as
well as the factor which determine the technical efficiency in these
farms. These determinant factors, in turn, can be used to make
policies in order to reduce technical inefficiencies among vegetable
farmers in the country.
References
1. Battese, G. E. and T. J. Coelli. 1988. Prediction of firm-level
technical efficiencies with a generalised frontier production
function and panel data. Journal of Econometrics, 38(3): 387-399.
2. Battese, G. E. and T. J. Coelli. 1995. A model for technical
inefficiency effects in a stochastic frontier production function for
panel data. Empirical Economics, 20(2): 325-332.
3. Binam, J. N., Tonye, J., Wandji, N., G. Nyambi and M. Akoa.
2004. Factors affecting the technical efficiency among smallholder
Emerging Trends in Post- Conflict Societies: Challenges and the Way Forward Sri Lanka Economics Research Conference 2014
324
farmers in the slash and burn agriculture zone of Cameroon. Food
Policy, 29(5): 531-545.
4. Brookfield, H., Padoch, C., H. Parsons and M. Stocking. 2002.
Cultivating Biodiversity: Understanding, Analysing and Using
Agricultural Diversity. The United Nations University, ITDG
Publishing.
5. Coelli, T. J. 1996. A guide to FRONTIER version 4.1: A Computer
Program for Stochastic Frontier Production and Cost Function
Estimation, CEPA Working Papers No. 7/96, Department of
Econometrics University of New England: Armidale.
6. Coelli, T. J. 1996. Recent developments in frontier estimation and
efficiency measurements. Australia Journal of Agricultural
Economics, 39(3): 219-245.
7. Coelli, T. J., Rao, D. S. P., C. J. O'Donnell and G. E. Battese. 2005.
An Introduction to Efficiency and Productivity Analysis. New
York: Springer.
8. Gunaratne, R.U.M.S. and S. Thiruchelvam. 2002. Comparative
study on technical efficiency of paddy production under major and
minor irrigation schemes in Anuradhapura district. Tropical
Agricultural Research. Vol. 14.
9. Shantha, A., Ali, A. B.G.H and R.A.G. Bandara. 2013. Technical
efficiency of Paddy farming under major irrigation conditions in
the Dry-Zone of Sri Lanka: A parametric approach, Australian
Journal of Basic and Applied Sciences, 7(6): 104-112.

Statistical models for Agro-Products
325