Municipal Solid Waste Collection Route Optimization Using ...
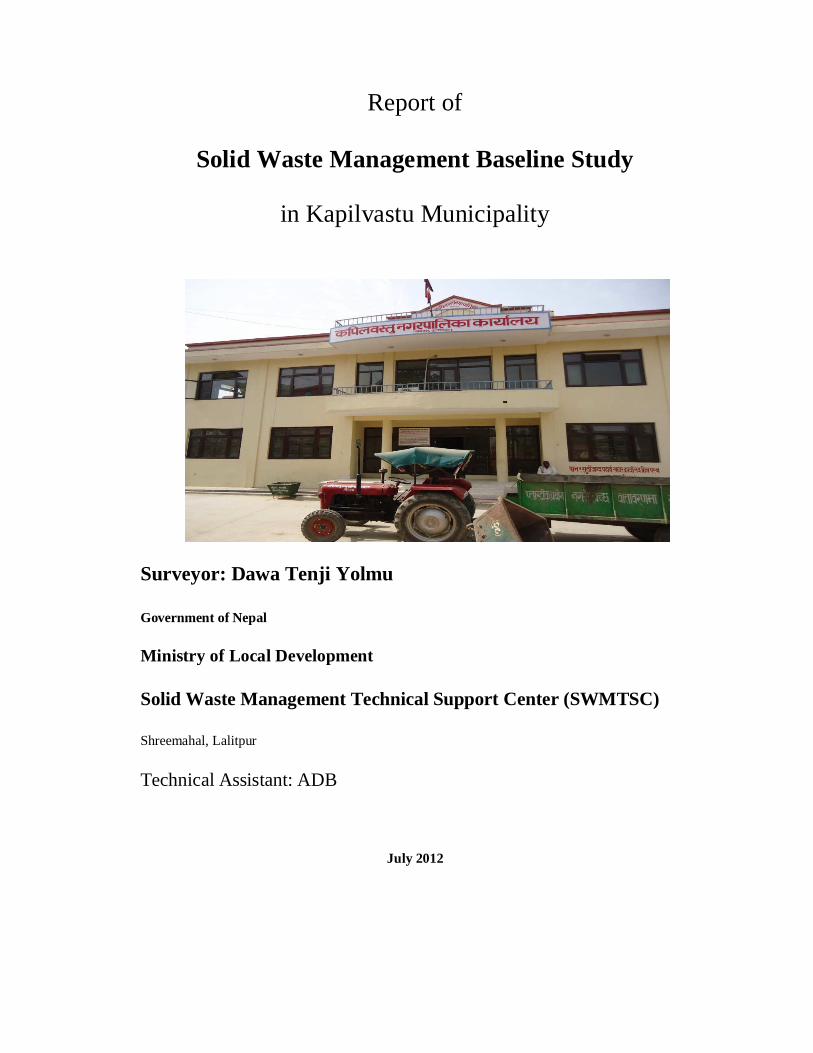
Report of
Solid Waste Management Baseline Study
in Kapilvastu Municipality
Surveyor: Dawa Tenji Yolmu
Government of Nepal
Ministry of Local Development
Solid Waste Management Technical Support Center (SWMTSC)
Shreemahal, Lalitpur
Technical Assistant: ADB
July 2012
2
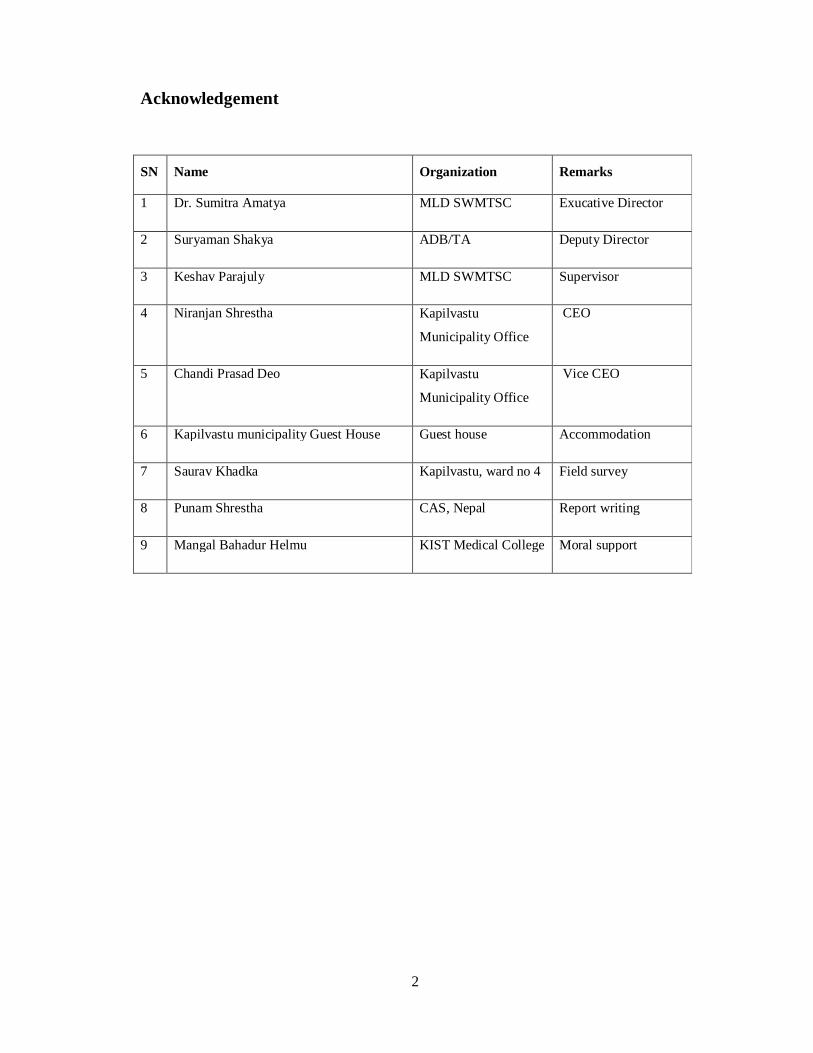
Acknowledgement
SN Name Organization Remarks
1 Dr. Sumitra Amatya MLD SWMTSC Exucative Director
2 Suryaman Shakya ADB/TA Deputy Director
3 Keshav Parajuly MLD SWMTSC Supervisor
4 Niranjan Shrestha Kapilvastu
Municipality Office
CEO
5 Chandi Prasad Deo Kapilvastu
Municipality Office
Vice CEO
6 Kapilvastu municipality Guest House Guest house Accommodation
7 Saurav Khadka Kapilvastu, ward no 4 Field survey
8 Punam Shrestha CAS, Nepal Report writing
9 Mangal Bahadur Helmu KIST Medical College Moral support
3
Summary
The baseline survey on solid waste management of Kapilvastu municipality was one of the
important platform and immense opportunity for my carrier provided by the SWMTSC
MLD/ABD-TA. During 10 days survey conducted within the municipality territory standing
on norms guided by the authority, valuable result has been recorded. Depending on the pre-
designed questionnaire the interview was conducted among the 50 household samples, 10
institutional sectors and 10 commercial sectors. Followed by the interview with respondent,
the waste for 24 hours from 50 household samples was collected as cluster (included 10
samples). After the collection the waste was characterized further to know type and amount of
waste generated from household. Likewise the waste of 24 hours from institutional and
commercial sector were collected and characterized. During the survey, the per capita per day
waste generation at the household level of the Kapilvastu municipality was recorded 112 gm
and the total Household waste generation from the municipality was 3.5 tons/day which
included 82% of organic waste, 8.2% plastic, 5.83% paper, 0.51% glass, 0.43% metal and
2.16% textile. The institutional waste was recorded as 55 kg/day from total of 104 institutional
including school/college/offices and the composition were 79.70% and 91.89% of paper and
20.29% and 8.11% plastics from school and offices respectively. The total generation from
commercial sector was 2.1 tons/day from 623 commercial sectors including
shops/hotel/restaurants. Besides the observed data, the municipality was lacking the technical,
financial and human resources for the proper management of solid waste. The public
awareness campaign and other valuable seminar on solid waste management were seldom
organized in the municipality and the current management practice scenario and the waste
generation rate was in miserable condition.
4
Table of Contents
Acknowledgement .........................................................................................................................1
Summary .......................................................................................................................................3
1 Introduction ...........................................................................................................................9
1.1 Municipality profile ........................................................................................................9
1.1.1 Basic information ....................................................................................................9
1.1.2 Geographical information........................................................................................9
1.1.3 Demographic information ..................................................................................... 10
1.1.4 Institutional, commercial and other facilities ......................................................... 10
1.1.5 Solid waste processing facilities ............................................................................ 11
1.2 Objectives of study ....................................................................................................... 11
2 Study methodologies ............................................................................................................ 12
2.1 Identification of waste generators.................................................................................. 12
2.1.1 Types of solid waste .............................................................................................. 12
2.1.2 Sources of solid waste ........................................................................................... 12
2.2 Data sources and data collection method ....................................................................... 13
2.2.1 Household SWM survey sampling ........................................................................ 14
2.2.2 Institutional and industrial survey .......................................................................... 14
2.2.3 Market waste survey ............................................................................................. 14
2.2.4 Standard questionnaires......................................................................................... 14
2.3 Secondary sources of data ............................................................................................. 14
2.4 Observation and photography ....................................................................................... 14
2.5 Quality control.............................................................................................................. 15
2.6 Study limitations ........................................................................................................... 15
3 Solid waste generation and physical characteristics ............................................................... 16
3.1 Introduction .................................................................................................................. 16
3.2 Waste characterization .................................................................................................. 16
3.2.1 Domestic waste ..................................................................................................... 16
5
3.2.2 Institutional waste ................................................................................................. 18
3.2.3 Commercial waste ................................................................................................. 19
3.2.4 Special waste ........................................................................................................ 21
4 Existing solid waste management system .............................................................................. 22
4.1 Collection and segregation ............................................................................................ 22
4.2 Primary transportation and transfer station .................................................................... 22
4.3 Final transportation and disposal methods ..................................................................... 23
4.4 Resource recovery methods .......................................................................................... 23
4.4.1 Recycling .............................................................................................................. 23
4.4.2 Composting .......................................................................................................... 23
4.5 Special waste management ........................................................................................... 23
4.6 Public awareness and community mobilization ............................................................. 24
5 Institutional and financial aspects ......................................................................................... 25
5.1 Organizational structure ................................................................................................ 25
5.2 Human resources and capacity ...................................................................................... 25
5.3 SWM service arrangements .......................................................................................... 25
5.4 SWM short-term, mid-term and long-term plan ............................................................. 26
5.5 Actors involved in SWM .............................................................................................. 26
5.6 Allocation of budget and expenditures .......................................................................... 26
5.7 Revenue from SWM service charges ............................................................................. 26
5.8 SWM acts and regulations ............................................................................................ 26
6 Major problems and issues ................................................................................................... 28
6.1 Problem and issues at municipal level ........................................................................... 28
6.2 Problems and issues at the source of generation ............................................................ 28
6.3 Problems and issues of the existing SWM practice ........................................................ 28
7 Conclusions and Recommendations ...................................................................................... 29
7.1 Conclusions .................................................................................................................. 29
7.2 Recommendations ........................................................................................................ 29

6
Abbreviations
%: Percentage
ADB: Asian Development Bank
CBO: Community Based Organization
CEO: Chief Executive Organization
EIA: Environmental Impact Assessment
GM: Gram
GOV: Government
INGO: International Non-governmental Organization
KM: Kilometer
KMO: Kapilvastu Municipality Office
MLD: Ministry of Local Development
MSW: Municipal Solid Waste
NGO: Non Governmental Organization
POPn: Population
Sq: Square
SWM: Solid Waste Management
SWMRMC: Solid Waste Management Resource Mobilization Centre
SWMTSC: Solid Waste Management Technical Support Centre
7
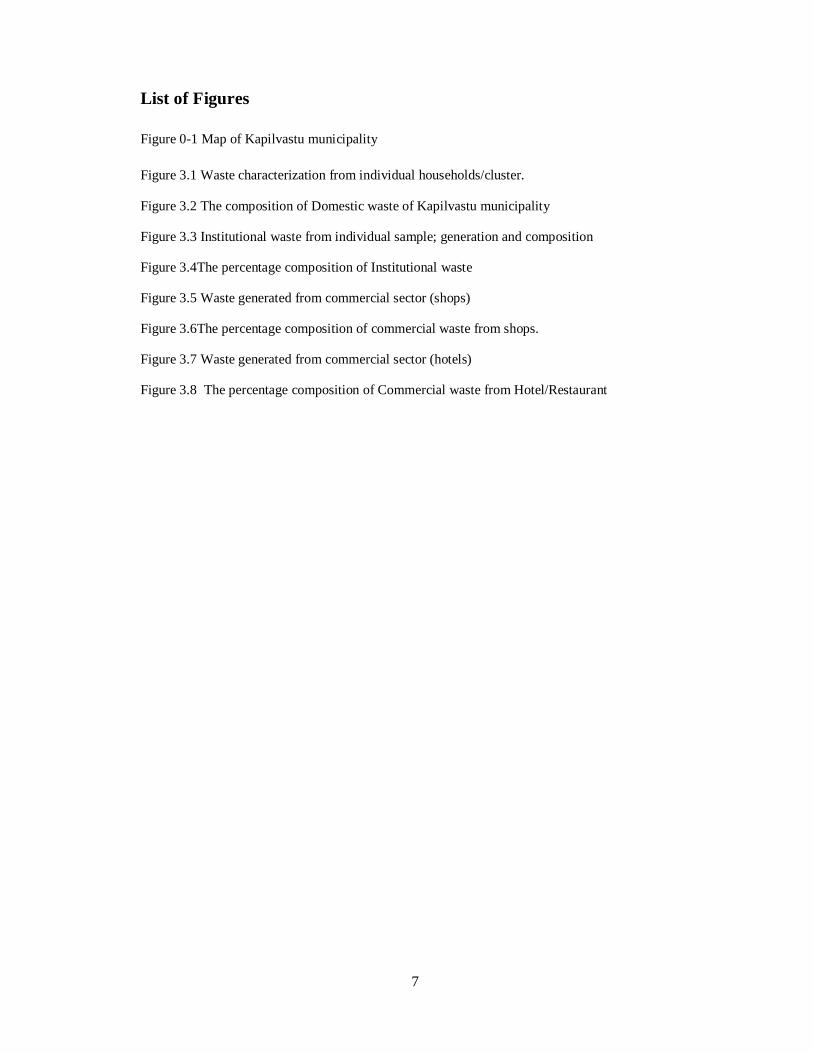
List of Figures
Figure 0-1 Map of Kapilvastu municipality
Figure 3.1 Waste characterization from individual households/cluster.
Figure 3.2 The composition of Domestic waste of Kapilvastu municipality
Figure 3.3 Institutional waste from individual sample; generation and composition
Figure 3.4The percentage composition of Institutional waste
Figure 3.5 Waste generated from commercial sector (shops)
Figure 3.6The percentage composition of commercial waste from shops.
Figure 3.7 Waste generated from commercial sector (hotels)
Figure 3.8 The percentage composition of Commercial waste from Hotel/Restaurant
8
List of Tables
Table: 1.1 Existing Road Condition of Kapilvastu Municipality
Table: 3.1The waste from individual sample; generation and composition.
9
1 Introduction
1.1 Municipality profile
1.1.1 Basic information
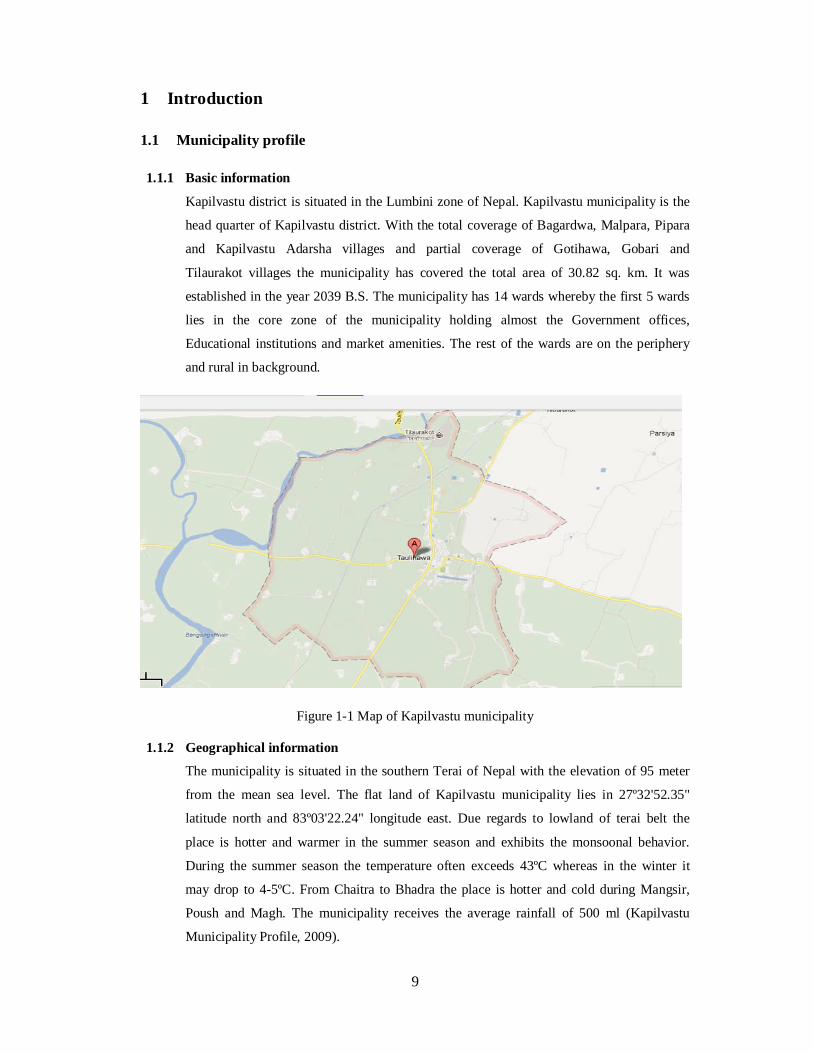
Kapilvastu district is situated in the Lumbini zone of Nepal. Kapilvastu municipality is the
head quarter of Kapilvastu district. With the total coverage of Bagardwa, Malpara, Pipara
and Kapilvastu Adarsha villages and partial coverage of Gotihawa, Gobari and
Tilaurakot villages the municipality has covered the total area of 30.82 sq. km. It was
established in the year 2039 B.S. The municipality has 14 wards whereby the first 5 wards
lies in the core zone of the municipality holding almost the Government offices,
Educational institutions and market amenities. The rest of the wards are on the periphery
and rural in background.
Figure 1-1 Map of Kapilvastu municipality
1.1.2 Geographical information
The municipality is situated in the southern Terai of Nepal with the elevation of 95 meter
from the mean sea level. The flat land of Kapilvastu municipality lies in 27º32'52.35"
latitude north and 83º03'22.24" longitude east. Due regards to lowland of terai belt the
place is hotter and warmer in the summer season and exhibits the monsoonal behavior.
During the summer season the temperature often exceeds 43ºC whereas in the winter it
may drop to 4-5ºC. From Chaitra to Bhadra the place is hotter and cold during Mangsir,
Poush and Magh. The municipality receives the average rainfall of 500 ml (Kapilvastu
Municipality Profile, 2009).
10
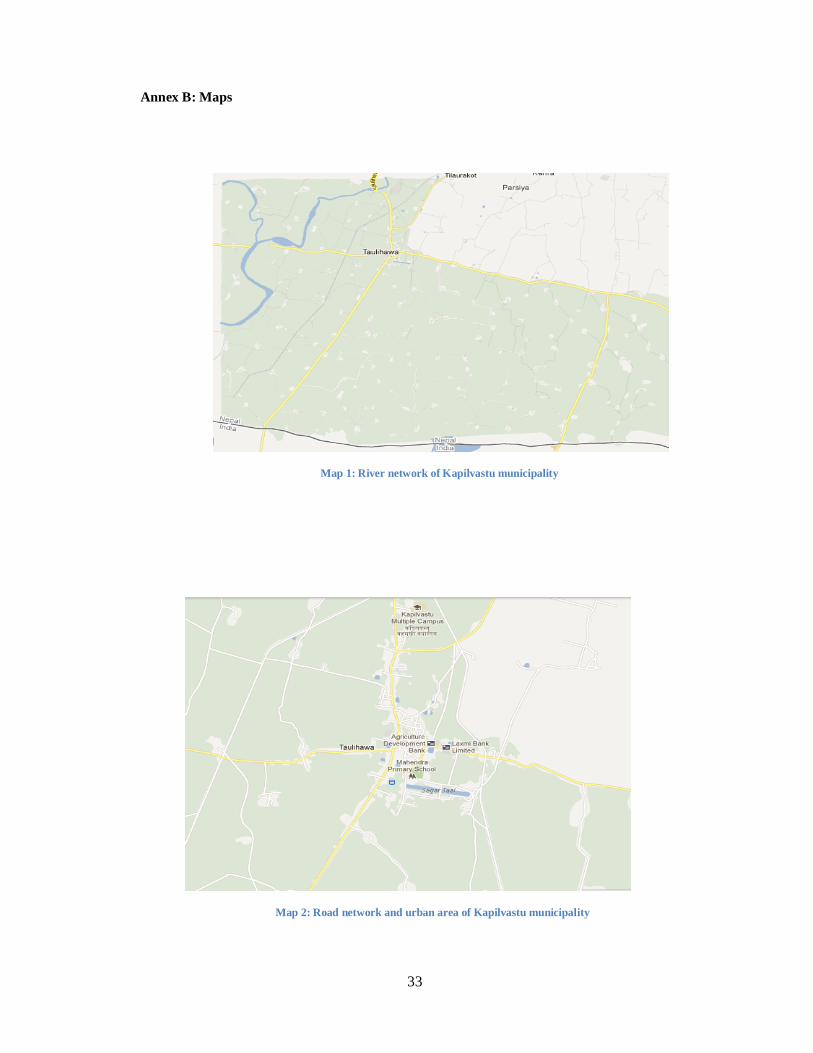
The major rivers of the municipality are Jamuhar Nala and Bangana Nadi. Besides these
rivers irrigation canals are made along 10 wards of the municipality to the Indian border.
The small ponds are artificially made in different regions of the municipality territory for
the fishery purpose. The total water bodies' coverage area of the municipality is 0.38 sq.
km (Kapilvastu Municipality Profile, 2009).
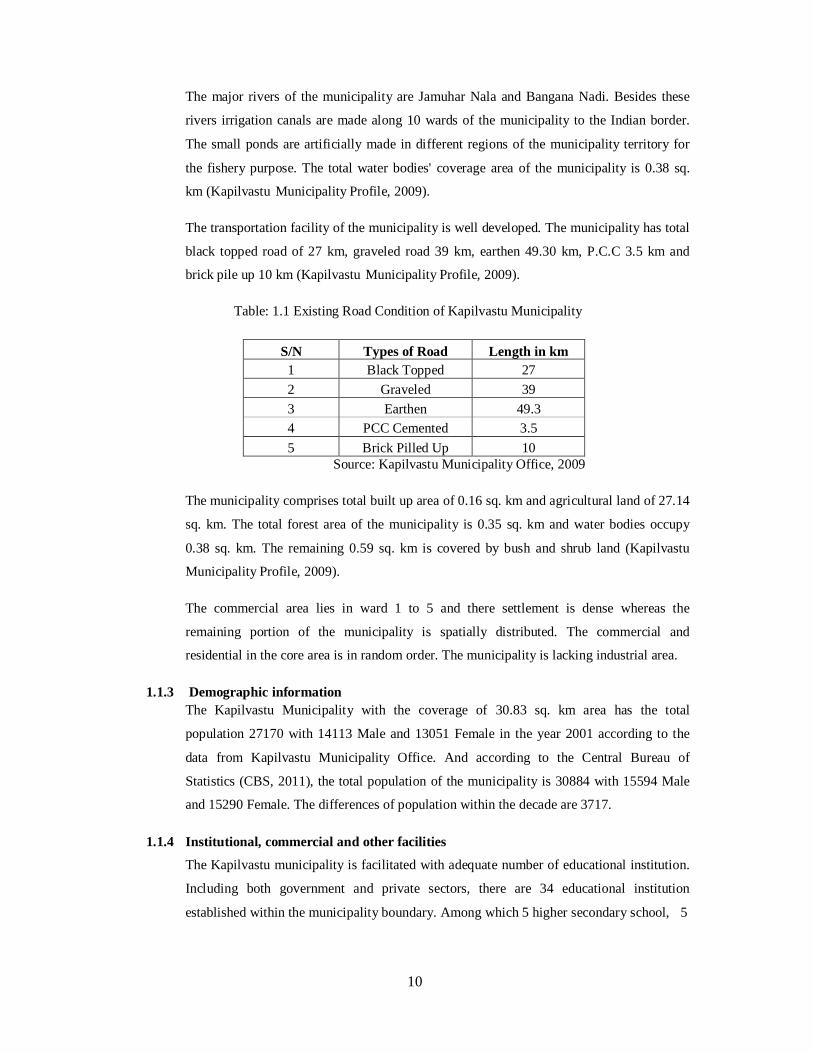
The transportation facility of the municipality is well developed. The municipality has total
black topped road of 27 km, graveled road 39 km, earthen 49.30 km, P.C.C 3.5 km and
brick pile up 10 km (Kapilvastu Municipality Profile, 2009).
Table: 1.1 Existing Road Condition of Kapilvastu Municipality
S/N Types of Road Length in km 1 Black Topped 27
2 Graveled 39
3 Earthen 49.3 4 PCC Cemented 3.5
5 Brick Pilled Up 10 Source: Kapilvastu Municipality Office, 2009
The municipality comprises total built up area of 0.16 sq. km and agricultural land of 27.14
sq. km. The total forest area of the municipality is 0.35 sq. km and water bodies occupy
0.38 sq. km. The remaining 0.59 sq. km is covered by bush and shrub land (Kapilvastu
Municipality Profile, 2009).
The commercial area lies in ward 1 to 5 and there settlement is dense whereas the
remaining portion of the municipality is spatially distributed. The commercial and
residential in the core area is in random order. The municipality is lacking industrial area.
1.1.3 Demographic information The Kapilvastu Municipality with the coverage of 30.83 sq. km area has the total
population 27170 with 14113 Male and 13051 Female in the year 2001 according to the
data from Kapilvastu Municipality Office. And according to the Central Bureau of
Statistics (CBS, 2011), the total population of the municipality is 30884 with 15594 Male
and 15290 Female. The differences of population within the decade are 3717.
1.1.4 Institutional, commercial and other facilities
The Kapilvastu municipality is facilitated with adequate number of educational institution.
Including both government and private sectors, there are 34 educational institution
established within the municipality boundary. Among which 5 higher secondary school, 5
11
secondary school, 4 lower secondary school, 1 college and 19 primary schools are built
up.
The municipality has numbers of health institutions for the well being of the dwellers,
including District health office, Taulihawa Hospital, Eye care centre, Family planning
association and numerous private clinics there are 39 health institutions.
The municipality does not have the place of rejoice such as parks, playgrounds except the
playground belonging to the school. There are 37 government offices and 36 non-
governmental offices established in the municipality.
The municipality holds large number of commercial establishments within its territory.
There are 512 shops, 41 hotels and 10 restaurants established. But in the industrial sector
there are 6 small industries and 1cottage industry been mobilizing within the
municipality.
1.1.5 Solid waste processing facilities
The municipality does not have landfill site and the waste management practices is very
poorly manage. The municipality dumps the waste by open piling on the river bank and in
little proportion they burn it.
1.2 Objectives of study The objectives of this study are as follows:
� To analyze the qualitative and quantitative municipal waste and to examine existing solid waste management practice scenario of the municipality.
� To find out people and local government perception on solid waste management practices.
� To find out the expectation of local government and local people regarding solid waste management practices from the central government and donor agencies.
� To suggest the strategies that can improve the existing condition of solid waste management practice.
12
2 Study methodologies
2.1 Identification of waste generators
2.1.1 Types of solid waste
Municipal solid waste (MSW) is solid waste from residential, commercial, institutional,
and industrial sources, but does not include such things as construction waste, automobile
bodies, municipal sludge's, combustion ash, and industrial process wastes even though
those wastes might also be disposed of in municipal waste landfill or incinerators.
Garbage or food waste is residue resulting from the preparation, cooking, and serving of
food. This waste is largely organic matter and moisture. Home kitchens, restaurants and
markets are sources of garbage.
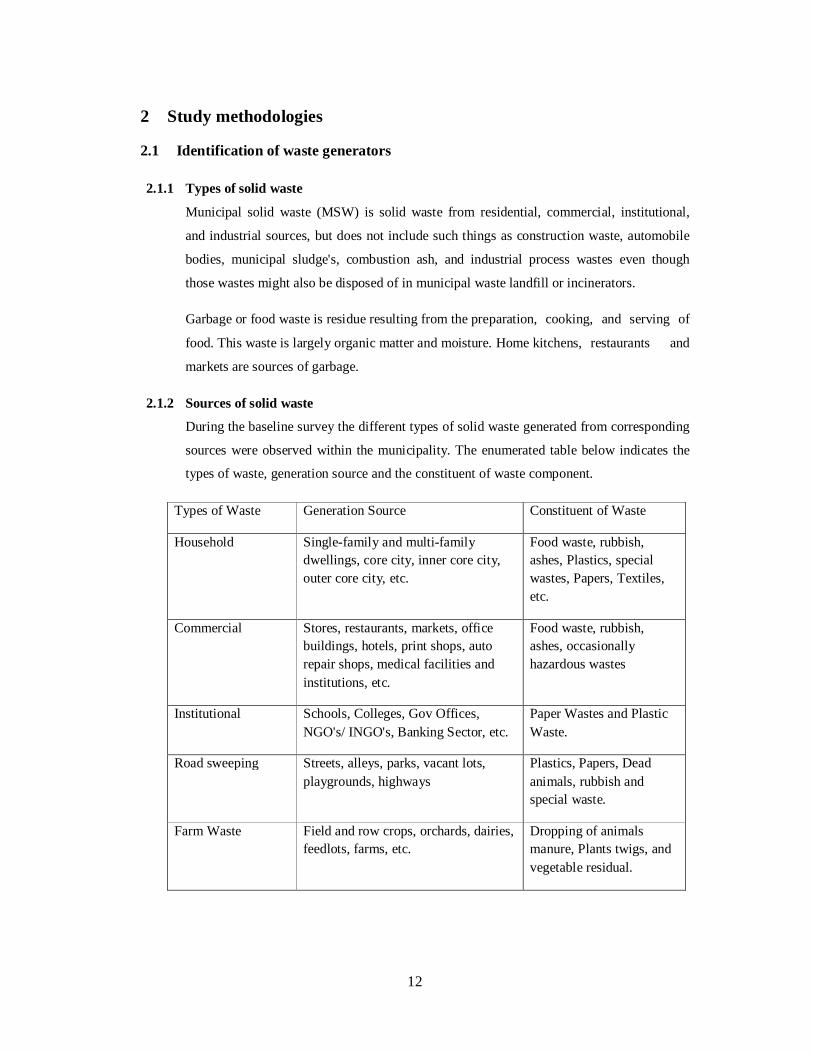
2.1.2 Sources of solid waste
During the baseline survey the different types of solid waste generated from corresponding
sources were observed within the municipality. The enumerated table below indicates the
types of waste, generation source and the constituent of waste component.
Types of Waste Generation Source Constituent of Waste
Household Single-family and multi-family dwellings, core city, inner core city, outer core city, etc.
Food waste, rubbish, ashes, Plastics, special wastes, Papers, Textiles, etc.
Commercial Stores, restaurants, markets, office buildings, hotels, print shops, auto repair shops, medical facilities and institutions, etc.
Food waste, rubbish, ashes, occasionally hazardous wastes
Institutional Schools, Colleges, Gov Offices, NGO's/ INGO's, Banking Sector, etc.
Paper Wastes and Plastic Waste.
Road sweeping Streets, alleys, parks, vacant lots, playgrounds, highways
Plastics, Papers, Dead animals, rubbish and special waste.
Farm Waste Field and row crops, orchards, dairies, feedlots, farms, etc.
Dropping of animals manure, Plants twigs, and vegetable residual.
13
2.2 Data sources and data collection method
The primary data has been collected by the direct involvement in the site, interacting with
the respondents. The data has been collected by the informal interview with the respondent
by the help of predesigned questionnaire. Five different wards have been selected those from
core region of the municipality. Random sampling was carried out for 10 samples from each
ward. Ward number 1, 2, 3, 4 and 5 were selected for the field survey. After the completion
of data entry of pre-designed questionnaire the respondents were asked to collect kitchen
waste of 24 hours. The very next day of interview the generated waste from each household
sample was weighed and 10 samples cluster was collected together and taken into the
municipality premises for the segregation. For the field survey the basic equipment provided
by the Environment & Resource Management Consultant under the coordination of MLD
SWMTSC were the digital weighing device , mask, gloves and bag for the collection of
waste and the bag was designed in such a shape that volume and density of waste was
possible to calculate. For the data collection at first municipality profile was reviewed and be
the simple random sampling wards 1, 2, 3, 4, 5 were chosen out of 14 wards of the
municipality. 10 household were taken as 10 successive sample size from each ward. The
sampling was done from those selected area because those area are located in core and
periphery of the urban region of the Kapilvastu municipality. I thought the data collected
from such sample could reflect the more reliable and all type of municipal waste result.
The process of sampling done for the field survey is listed below:
� The municipality map those containing built up area, land use area,
settlement area, river system and other important coverage were reviewed.
� First 5 wards (1-5) out of 14 wards were chosen for the survey to make task more
fruitful, to get reliable data and for minimum error as those wars lies in the core city,
periphery, holds almost all the sector namely residential, commercial, institutional
etc.
� 10 samples from each ward were chosen a sample by simple random sampling.
� Out of 10 samples the sampling was done in such a way that the households
belonging to all the economic class with different family size, caste, ethnic group to
get better result.
The supplementary data were collected from the municipality office from the employees on
SWM of the municipality and from some of the repute personnel from the city.
14
2.2.1 Household SWM survey sampling
The household SWM survey was conducted after the sampling. The pre-design
questionnaire was filled up by the informal conversation to the respondent. The
respondents were requested to collect their kitchen of 24 hour the next day ,the collected
waste from each household level were weight accordingly the cluster of 10 sample waste
were taken to the municipality office premise for the segregation and for further
characterization.
2.2.2 Institutional and industrial survey
Though MSW comprises the waste generated from industrial sector, it was not covered in
my survey. The important sources of MSW, Institutions were selected from the
municipality. Out of 10 sample,5 sample were from GOV/NGO offices and 5 samples from
schools/colleges. The 24 hours wastes from those institutions were weight and characterize
with the help of equipment provided.
2.2.3 Market waste survey
The commercial waste survey was done by sampling 10 samples, 5 from hotels\restaurant
and rest of 5 samples from shops. The waste generated in 24 hours were weighted with the
help of digital weighing device and the segregation was done on the respective premise of
the sample surveyed. The segregation was done by wearing the hand gloves and the
separated waste were again weighted for characterization.
2.2.4 Standard questionnaires
The standard pre-designed questionnaires for household level, commercial and institutional
level were provided for the baseline survey. Those questionnaires were designed in such a
way which were more significant to draw as much information needed for the baseline
survey.
2.3 Secondary sources of data
The secondary data were mainly collected from the municipality profile of Kapilvastu
municipality. Other relevant information was reviewed from journals, reports, articles,
etc. The necessary information regarding population was collected from Central Bureau
of Statistics (CBS).
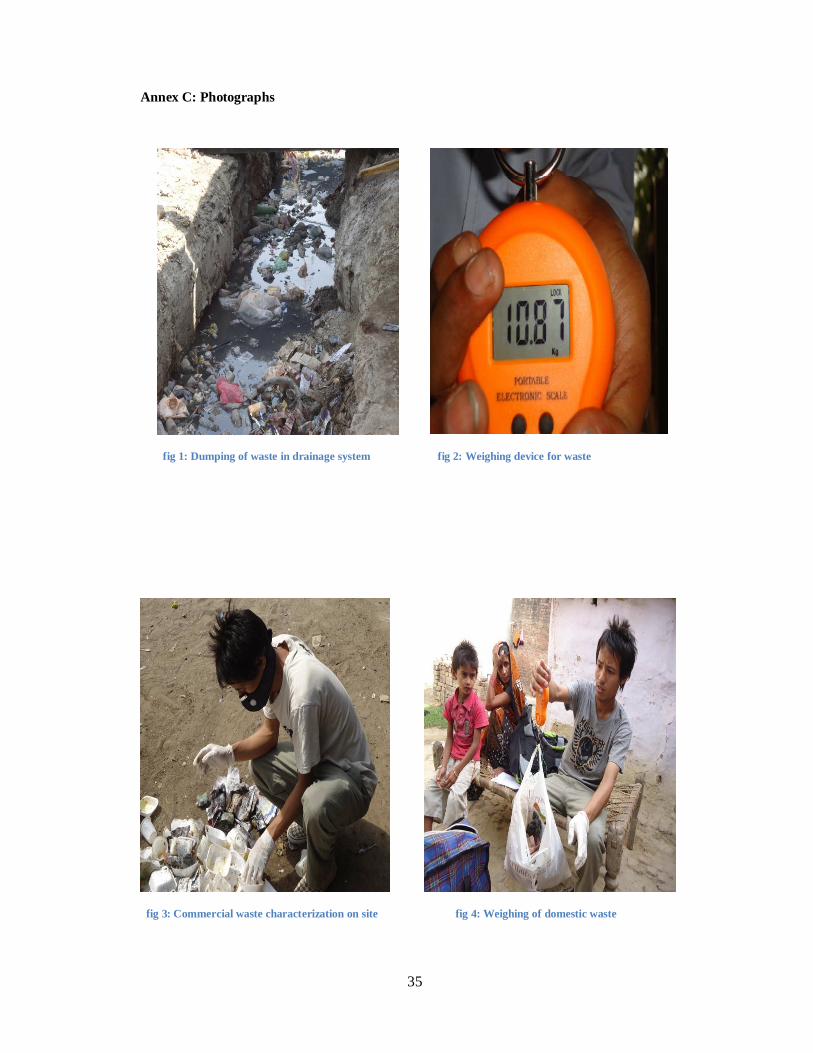
2.4 Observation and photography
During the 10 days field survey it was observed that the wastes were generally collected
by the sweeper and rickshaw were used for transportation. After collecting from the
source level it was transported to the dumping site with the help of municipality tractor.
Organic waste, Paper/Paper products, Plastic wastes were the major types of wastes

15
generated from the household level and commercial level where as from institution
sector, Paper and Plastic wastes were mainly generated. The relevant photographs are
well addressed in the annexes.
2.5 Quality control
From the field survey the per capita per day generation at household level of
Kapilvastu municipality was 112 gm and the result is less than the national average
waste generation rate of 0.25kg/capita/day (SWM&RMC, 2004b; Khanal, 2007). Here the
less consumerism and less generation are obvious. The waste composition of Kapilvastu
was 82 percent organic, 8.2 percent plastics, 5.83 percent paper/paper products, 0.57
percent glass, 0.43 percent metal and 2.16 percent textile. And this percentage composition
is somehow similar to the data from Bhaktapur municipality. Though previous data were
not found in the municipality office, the survey was carried out in absolute mechanism and
procedure provided by the SWMTSC. The procedure was repeated as per the need so as to
draw minimize error and to meet the accurate result.
2.6 Study limitations
The Municipal Solid Waste baseline survey was the best effort made by SWMTSC/ADBTA
for the analysis of existing condition of municipal waste in the country and its impact on
environment. The weather condition is one of the important limitation factors. During day
light, the study was not done due to extreme hot climate. The hazardous waste and industrial
waste were not been included in the study.
16
3 Solid waste generation and physical characteristics
3.1 Introduction
The waste of 24 hours from different sources namely; household, commercial and
institution were collected as per the guideline provided by the SWMTSC/MLD.
Cluster of 10 samples from household were collected for the characterization.
Wastes from commercial and institution were characterized in the premises of the
sample taken.
3.2 Waste characterization
Biodegradable (organic waste), plastics, paper/ paper products, glass, metal, textiles were
distinct varieties of waste generated from the Kapilvastu municipality. After
segregation individual constituents of waste was weighted for the analysis.
3.2.1 Domestic waste
The waste from household level (cluster of 10 samples), was collected and taken to the
municipality territory for characterization. The compositions of waste were segregated and
again fresh weights of each waste type were recorded. Likewise the wastes from all 50
samples were done by following the same procedure. Whereas the waste from other two
sector; commercial and institutional were characterized different than household level.
Each sample was segregated at the respective territory of the waste bearer, and it was
due to inaccessible to carry the waste.
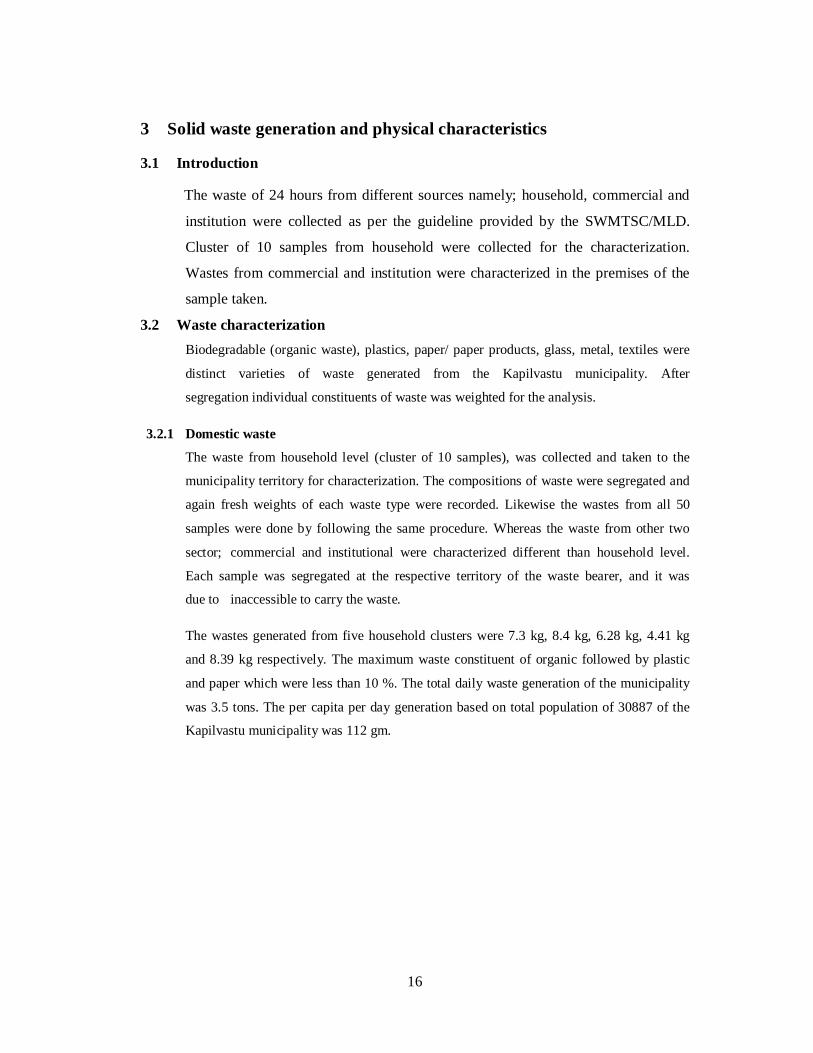
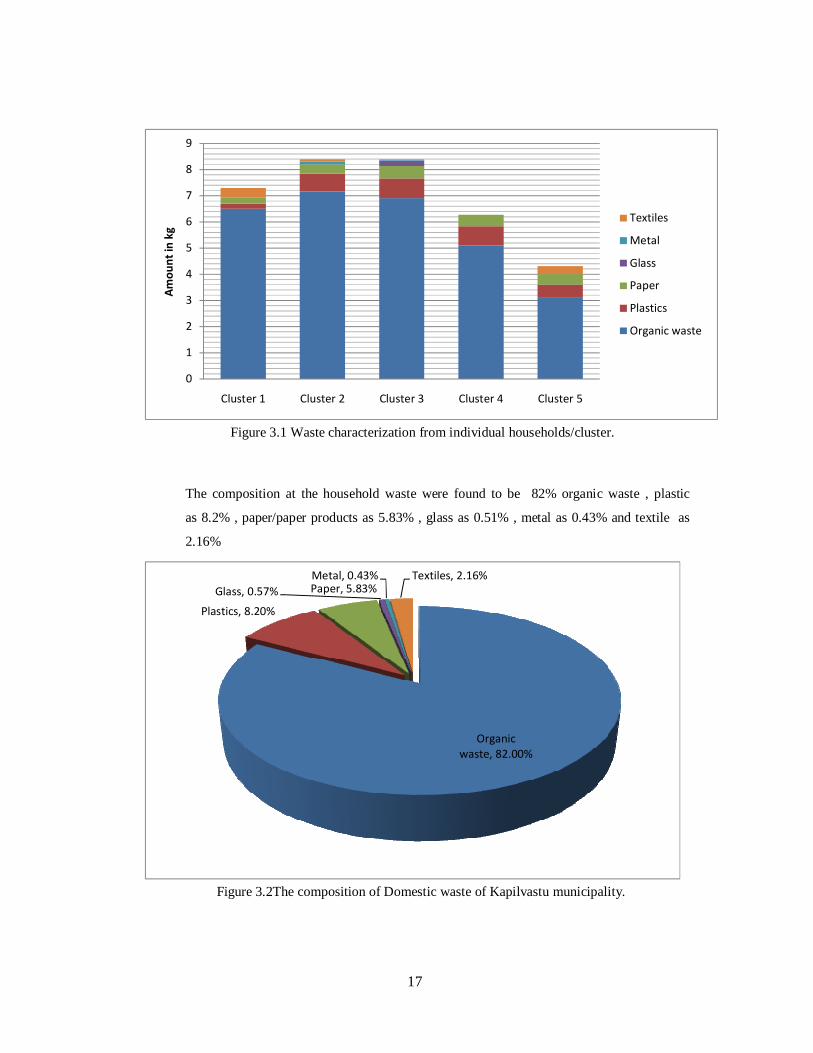
The wastes generated from five household clusters were 7.3 kg, 8.4 kg, 6.28 kg, 4.41 kg
and 8.39 kg respectively. The maximum waste constituent of organic followed by plastic
and paper which were less than 10 %. The total daily waste generation of the municipality
was 3.5 tons. The per capita per day generation based on total population of 30887 of the
Kapilvastu municipality was 112 gm.
17
0
1
2
3
4
5
6
7
8
9
Cluster 1 Cluster 2 Cluster 3 Cluster 4 Cluster 5
Am
ou
nt
in k
g
Textiles
Metal
Glass
Paper
Plastics
Organic waste
Figure 3.1 Waste characterization from individual households/cluster.
The composition at the household waste were found to be 82% organic waste , plastic
as 8.2% , paper/paper products as 5.83% , glass as 0.51% , metal as 0.43% and textile as
2.16%
Organic
waste, 82.00%
Plastics, 8.20%
Paper, 5.83%Glass, 0.57%
Metal, 0.43% Textiles, 2.16%
Figure 3.2The composition of Domestic waste of Kapilvastu municipality.
18
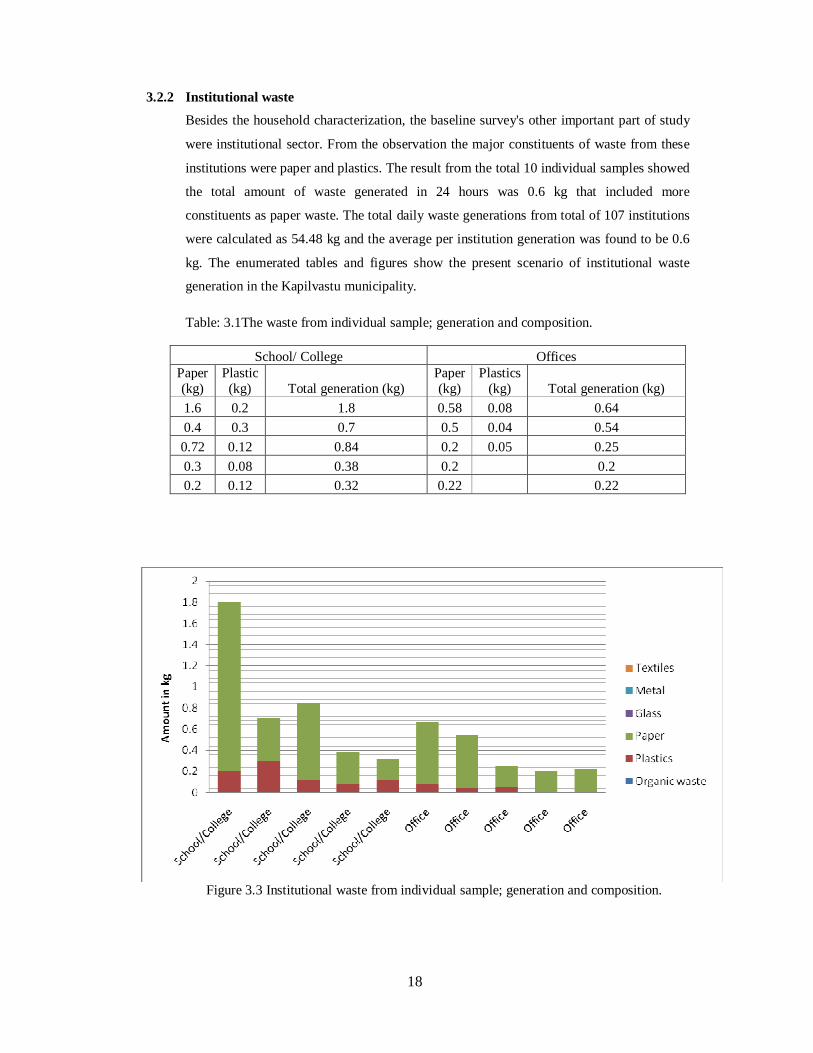
3.2.2 Institutional waste
Besides the household characterization, the baseline survey's other important part of study
were institutional sector. From the observation the major constituents of waste from these
institutions were paper and plastics. The result from the total 10 individual samples showed
the total amount of waste generated in 24 hours was 0.6 kg that included more
constituents as paper waste. The total daily waste generations from total of 107 institutions
were calculated as 54.48 kg and the average per institution generation was found to be 0.6
kg. The enumerated tables and figures show the present scenario of institutional waste
generation in the Kapilvastu municipality.
Table: 3.1The waste from individual sample; generation and composition.
School/ College Offices Paper (kg)
Plastic (kg) Total generation (kg)
Paper (kg)
Plastics (kg) Total generation (kg)
1.6 0.2 1.8 0.58 0.08 0.64
0.4 0.3 0.7 0.5 0.04 0.54
0.72 0.12 0.84 0.2 0.05 0.25
0.3 0.08 0.38 0.2 0.2 0.2 0.12 0.32 0.22 0.22
Figure 3.3 Institutional waste from individual sample; generation and composition.
19
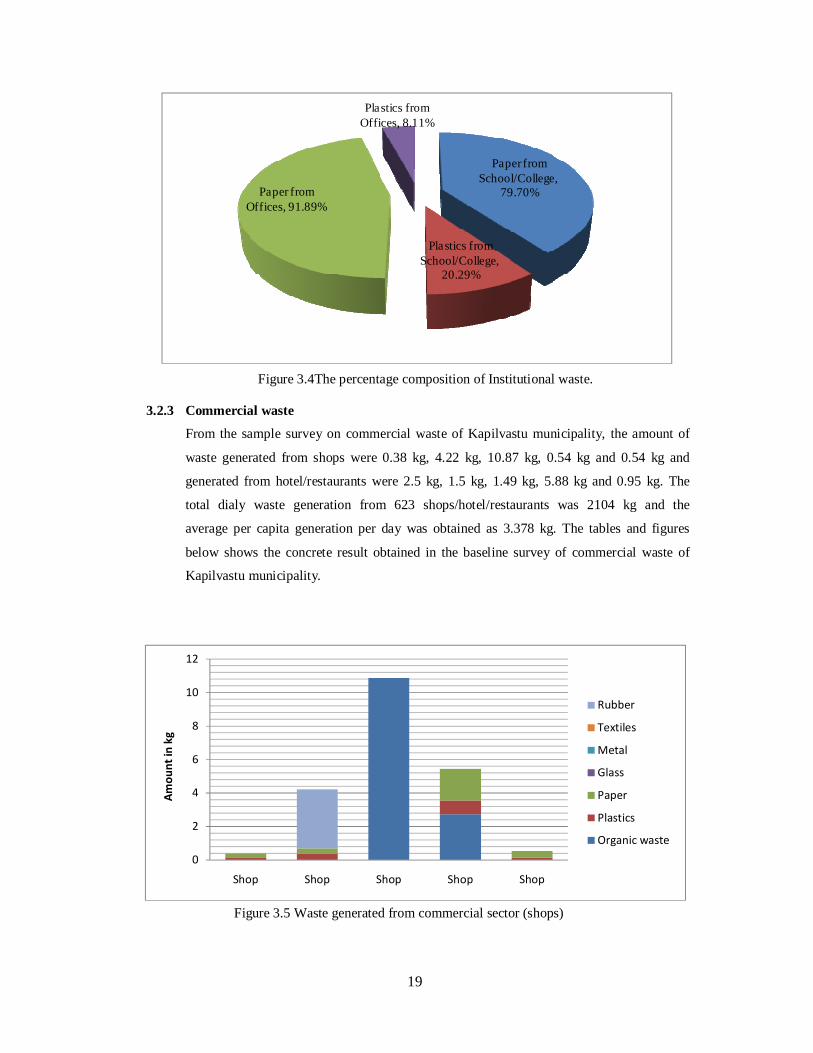
Paper from School/College,
79.70%
Plastics from School/College,
20.29%
Paper from Offices, 91.89%
Plastics from Offices, 8.11%
Figure 3.4The percentage composition of Institutional waste.
3.2.3 Commercial waste
From the sample survey on commercial waste of Kapilvastu municipality, the amount of
waste generated from shops were 0.38 kg, 4.22 kg, 10.87 kg, 0.54 kg and 0.54 kg and
generated from hotel/restaurants were 2.5 kg, 1.5 kg, 1.49 kg, 5.88 kg and 0.95 kg. The
total dialy waste generation from 623 shops/hotel/restaurants was 2104 kg and the
average per capita generation per day was obtained as 3.378 kg. The tables and figures
below shows the concrete result obtained in the baseline survey of commercial waste of
Kapilvastu municipality.
0
2
4
6
8
10
12
Shop Shop Shop Shop Shop
Am
ou
nt
in k
g
Rubber
Textiles
Metal
Glass
Paper
Plastics
Organic waste
Figure 3.5 Waste generated from commercial sector (shops)
20
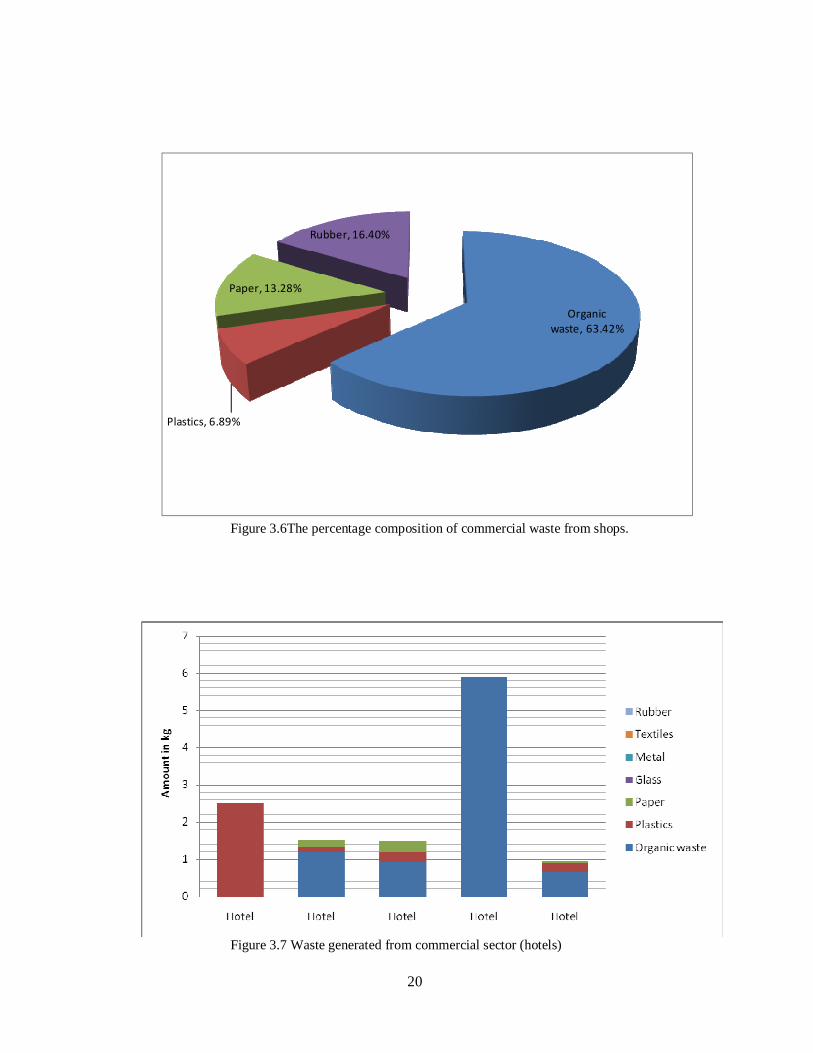
Organic
waste, 63.42%
Plastics, 6.89%
Paper, 13.28%
Rubber, 16.40%
Figure 3.6The percentage composition of commercial waste from shops.
Figure 3.7 Waste generated from commercial sector (hotels)
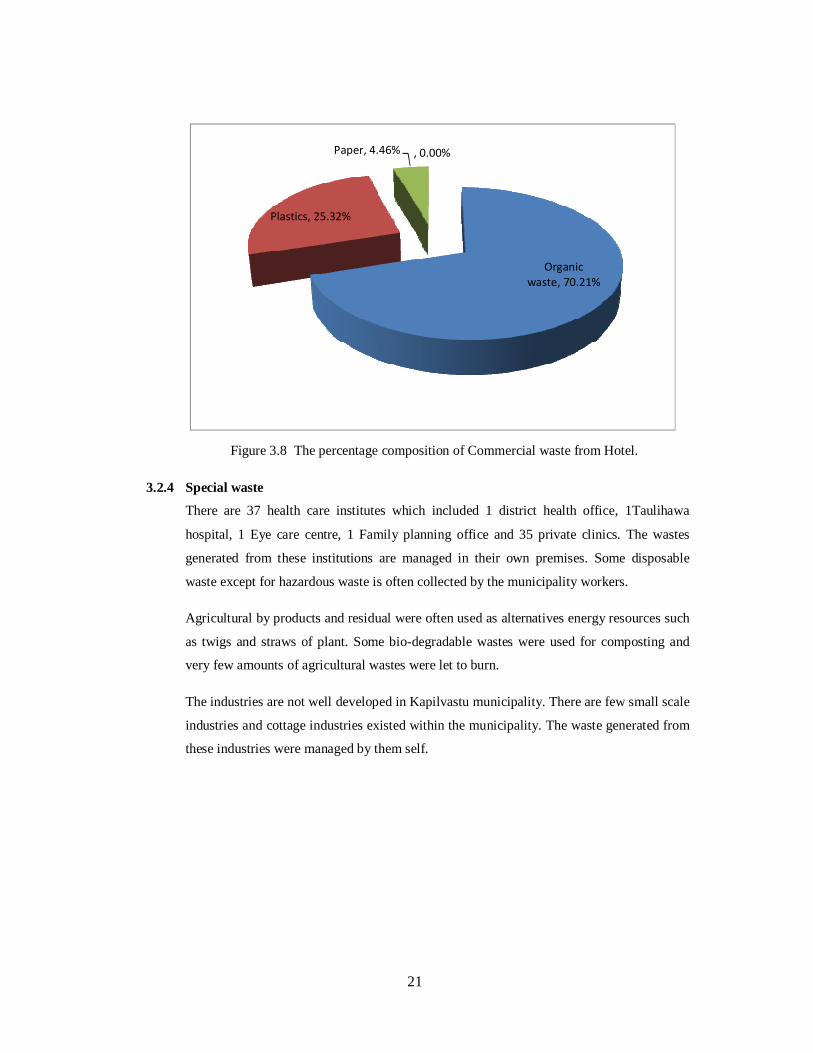
21
Organic
waste, 70.21%
Plastics, 25.32%
Paper, 4.46% , 0.00%
Figure 3.8 The percentage composition of Commercial waste from Hotel.
3.2.4 Special waste
There are 37 health care institutes which included 1 district health office, 1Taulihawa
hospital, 1 Eye care centre, 1 Family planning office and 35 private clinics. The wastes
generated from these institutions are managed in their own premises. Some disposable
waste except for hazardous waste is often collected by the municipality workers.
Agricultural by products and residual were often used as alternatives energy resources such
as twigs and straws of plant. Some bio-degradable wastes were used for composting and
very few amounts of agricultural wastes were let to burn.
The industries are not well developed in Kapilvastu municipality. There are few small scale
industries and cottage industries existed within the municipality. The waste generated from
these industries were managed by them self.
22
4 Existing solid waste management system
4.1 Collection and segregation
The Kapilvastu municipality seems one of the vulnerable spot for solid waste. The region
is covered in garbage due to lack of public awareness, proper management, technical,
human resource. The street wastes from some junction of the core city were collected by
the sweeper. The proportion of worker with respect to waste generation is very much
uneven. The municipality has some rickshaws for the waste collection and they collect the
waste from the city and transport it to the riverside for open dump. The people out there are
unaware of the proper management of solid waste. The door to door collection was not
been amended in the municipality trend. The municipality collects the wastes from ward 1,
ward 2, ward3 and ward5.
Although some containers have been kept on distances, it was not in proper used. The
people attitude of throwing wastes in the street was in practices rather to pour in container
fixed in a distance resulting in inefficiency of the waste management. The municipality
collects very few proportions of wastes due regards to lack of human resources.
During the ten days survey, the waste collection was somehow irregularly seen in the city
but the practice of segregation was very much unknown for the worker and waste related
personnel. There was no transport station ever made. Direct swept waste from the street
was taken for riverside dumping in Banganga and Jamuhar Nala.
All the organic and non-biodegradable waste were kept together ready to throw for the
next morning. The street sweepers were complaining that often people throw their faces
together with other waste in the street. These were the current trend of some communities
of the city. The practice of source segregation was very tough for them and both the people
and the municipality personnel were least interested in doing these entire task.
4.2 Primary transportation and transfer station
In regards to existed transportation services, the collected municipal solid waste was
transported by available 5 rickshaws of 1m3 volume each and 1 tractor of volume 3m3.
The frequency of sweeping of street was not more than twice in a week, due to lack in
number of employees on waste collection service.
The municipality owned not even a small space for transport station. Whatsoever the waste
collected was directly dump on open pile either on riverbank or in the open field.
23
4.3 Final transportation and disposal methods
As the waste from the street was collected, it was directly taken for riverside dumping. The
landfill site was not made by the municipality, though it was on their upcoming plans. The
generated papers and plastics waste from municipality office and from nearby sources were
burnt in backyard of municipality premise but it was not exactly incineration operation.
Unlike incineration, the container was used for burning purpose.
The municipality establishment of composting plant was on their planning but it was not on
that recent period of survey. Some useful polythene bags and plastic water bottles were re-
used at household level. Recycling exercise was not in current practice. On the overall
survey, the municipality was very much lacking the waste management in all perspectives.
4.4 Resource recovery methods
4.4.1 Recycling
Re-use practice is very common to the society like ours. In Kapilvastu municipality, re-use
practice was seen very much likely at household level rather than recycling. There were
two scarp dealers on the near side of the municipality territory. They were the only
stakeholders for recycling the plastics, glass, metal, paper wastes, etc. Nonetheless, no
other parties, municipality or any private groups were involved in recycling and re-use
practice.
The scarp dealers were the only boon for Kapilvastu municipality for the reduction of
waste. Under the recycling process waste like plastic bottles, metal, iron, glass bottle, etc
were recycled.
There were no any industries made for the recycling process. The scarp dealer collects the
waste and transports those in India for further processing. Again, that byproduct of
recycled waste emerges covering larger market of Nepal.
4.4.2 Composting
Except for the few household, the term composting was very new to them. Rare of
respondent opine their dumping of organic waste in their backyard for compost manure.
Majority of people are used to throwing household waste in the street and making mess on
it. The composting practices at community level municipality level were not in use.
4.5 Special waste management
The current practice of waste disposal may be a serious and vulnerable to the
inhabitant of the municipality. The categorization of special waste/health care waste was
not recognized by the authority level. Though the existing system is cost beneficial or low
24
cost expense the consequences on the environment may get a immense threat to the
dwellers.
4.6 Public awareness and community mobilization
To change the world one should change him first. Then only the expectation of good
and fruit full result can be drawn. Public awareness and community mobilization are the
major portions for the solid waste management which plays vital role. The
Municipality has not such kind of programmed conducted ever for the public awareness on
pros and cons of municipal solid waste management practice. None of the organization,
CBO's, local clubs, parties, local government was involve for the public awareness and
community mobilization regarding the solid waste management within the municipality.
This reflects the least interest of the authorities and public as well.
25
5 Institutional and financial aspects
5.1 Organizational structure
The Kapilvastu municipality, rural/urban based municipality is threatened by the garbage.
The solid waste management practice is least bothered by the government sector, CBO's,
NGO's, and local bodies. The minimum effort is paying by municipality office for the
waste collection. There is no solid waste management sector of the municipality except for
the few employees on waste management under the municipality. There is social
development sector in the municipality office but it is keeping an eye on other social
sector.
Though there are over 35 NGO's, CBO's and local organization established in the
municipality, none of them is currently involved in waste management. Not even a
awareness campaign has been entertained regarding issues of solid waste. The performance
for the waste management practice is miserable.
5.2 Human resources and capacity
The municipality employed 7 workers on waste management, among them 1 supervisor, 1
driver and 5 sweeper are actively participating on waste management practice. These
employees are almost lacked of education. The sweepers collect the street waste and the
driver transport the waste to the riverside for the open dumping. The entire workers are
local citizen of the municipality with majority belonging to the awadhi community.
5.3 SWM service arrangements
The waste from the street is sweep by the sweeper early in the morning before people's
movement. The door to door collection system is very much unknown to the municipality
and the household waste also is thrown haphazardly in the street. Regular sweeping of the
street is often breaking by the absence of sweeper in a week. There are few number of two
wheeler rickshaw for the waste collection. The collected waste is taken by one tractor to
the destination for the dumping. Pick and throw theory is very much ruling in the case of
waste management practice in Kapilvastu municipality. There is no any processing facility.
There is one incineration for burning paper and plastics inside the municipality office;
otherwise the waste is directly taken to the dumping site.
According to the survey the point of controversy arises regarding the conduct of public
awareness programs. Some says the municipality and other bodies undergo public
awareness campaign for the solid waste management whereas on the other hand majority of
people answered the strong opposition to the conduct of public awareness.
26
5.4 SWM short-term, mid-term and long-term plan
The personnel of the municipality often figure out short-term plan with respect to the
situation and status of waste generation. The short-term plan includes the adding of
sweeper on daily wages if incase of street waste high concentration. The short-term plan
depends solely on the employees on solid waste management rather than the higher
authority of the municipal office.
The municipality does not have further mid-term plan and long-term plan on solid waste
management in the present and for the future. From the survey it is been observed that
none of the bodies are aware of the consequences of the solid waste and they are very much
passive regarding solid waste management practice.
5.5 Actors involved in SWM
The municipality office is only working on waste management of Kapilvastu municipality.
None of the Non-governmental organization, private sector, individuals, community based
organization; local clubs, international funding organizations are involved. The sole credit
goes to only municipality office.
5.6 Allocation of budget and expenditures
According to data provide by the financial sector of the municipality, the total municipality
budget in the year 2066/07 was Rs 76813363 and actual budget was Rs 73482832. Among
this expenditure budgeted was Rs 76313363 and actual expenditure was Rs 57425265 and
expenditure on SWM was budgeted as Rs 1200000 and actual expenditure was Rs 1200723
which is 2.09% of the actual budget. Likewise in the year 2067/2068, the total municipal
budget was budgeted as Rs 98333639 and actual was Rs 76483240 with the total
expenditure of Rs 69347679 and expenditure in SWM was Rs 1506903 which is 2.17% of
the total expenditure.
5.7 Revenue from SWM service charges
On the basis of financial sector and the data provided from the municipal account section,
the collection of fee budgeted Rs 4341694 and actual budget was Rs 3730442 in the year
2066/067 and in the year 2067/068 it was budgeted Rs 5629000 and actual budget was Rs
6113853. But this above mentioned data seems to be unreliable based on my field
observation. During the household questionnaire filled up period, the respondent opined
that they do not pay any charges for the SWM service. The municipality has not amended
any such rule on charges on waste collection service.
5.8 SWM acts and regulations
a) The Solid Waste Management and Resource Mobilization Act, 1987
27
The Solid Waste Management and Resource Mobilization Act were introduced in 1987,
Outlines the duties of SWMRMC and authorities it to take action to control haphazard waste
disposal and to collect service fees. Likewise the act has provisions for various punitive
measures against those engaged in activities detrimental to the intensions of the Acts (Amatya,
1993). To facilitate implementation of the Acts, SWRMC rules were formulated in 1989, these
Rules laid down procedures to be followed by individuals and institutions designing sanitation
services, solid waste collection and operation of public toilets.
b) Municipal Act, 1992
� To make provision for municipal waste collection and disposal;
� To remove materials harmful to health;
� To fix service charges;
� To impose fines from 100 to 1500 Rupees on individuals and institutions for
haphazard disposal of waste; and
� To implement developmental and environmental management programs in
co-operation with local residents.
c) SWM Act, 2011
� Integrated and sustainable waste management systems should be promoted.
� The 3-R principle (reduce, reuse and recycle) should be promoted at all
levels.
� Waste should be segregated at source to maximize recycling.
� Open waste dumps should be replaced by controlled dumps or sanitary land
filling.
� Recycling should be maximized and only non-recyclable waste should be
landfilled.
� Environmental impacts of waste should be minimized.
� Polluters pay principle should be applied to minimize waste production,
recover cost and make the SWM system as a whole sustainable.
� Participation of local communities and private sector in SWM should be
encouraged.
28
6 Major problems and issues
6.1 Problem and issues at municipal level The Kapilvastu municipality itself being a local government for the area is well renowned
in its well empowerment, responsibility in operating all the operations within the
municipality. The municipality had administration section, account section, social welfare
section but despite all of this section the municipality was lacking the most important
section environmental section together with solid waste management section. Due
to lack of employees on solid waste management system, Kapilvastu municipality is
threatened and covered by garbage.
The municipality had recruited few employees for the solid waste management including 1
supervisor, 1 driver and 5 sweepers which seems very negligible in proportion to the waste
generation rate. There were very limited vehicles and rickshaw for the waste transportation
and the most important component for the talk of waste, landfill site was not ever made,
ever designed and ever thought by the municipality. The appreciable generated waste was
in trend of dumping on the river bank and unless and until the serious trend goes to
severity the municipality might not nod their head regarding these burning issues of solid
waste management.
6.2 Problems and issues at the source of generation
The Kapilvastu municipality being rural/urban based municipality, the influence of
education is not well developed among the public. The knowledge regarding solid
waste management was very poor and the awareness campaign were seldom conducted
regarding solid waste management issues. The public opinion on source segregation at
household level was doubtful.
6.3 Problems and issues of the existing SWM practice
The challenges and curiosity always boost for the development. The developing
Kapilvastu municipality is facing problems on various issues necessary for the
sustainability of the people. The MSW management is very important challenge for them
in recent era. Due to lack of necessary equipment, technologies, well trained human
resources on solid waste management, the place is covered in garbage. Proper drainage
system is not well managed and the wastes generated are thrown in the drainage. Dumps of
waste can be seen in the market area destroying the aesthetic value of historical Kapilvastu.
Despite all these problems the municipality is trying to improve a lot in every burning
issue and for the proper management of MSW.
29
7 Conclusions and Recommendations
7.1 Conclusions During the 10 days field survey, the per capita per day generation from household level
was concluded as 112 gm. The total daily waste generation of the municipality was
concluded as 3.5 tons. The constituents of domestic waste were 82 % organic waste, 8.2
% plastics, 5.83 % paper/paper products, 0.57 % glass, 0.43 % metal and 2.16 % textiles.
Likewise the total daily waste generation from 107 institutions of the municipality was
54.48 kg and average waste generation from individual institute was found to be 0.589 kg
per day. The constituents were 79.70 % paper and 20.29 % plastics generated from
School/Colleges and 91.89 % paper and 8.11 % plastics from Government/Non
government offices.
The average generation of waste from the commercial sector was 3.379 kg per 24 hours
with the total daily waste generation of 2.104 tons generated from total of 623 commercial
sectors within the municipality.
Paper/paper products has highest amount followed by plastics from the institutional sector.
Similarly, in commercial sector organic waste has the highest amount followed by paper,
plastics, rubber/leather, metal and glass. They also do not have adequate equipments for
waste collection and lack of a central waste treatment. Open dumping is done on the
river bank, which was unmanaged. Lack of public participation and public awareness and
mutual understanding between the local government and the local people were the major
problems seen during the baseline survey of the Kapilvastu municipality.
7.2 Recommendations The waste management is not in prior importance to the public and local government as
well. Therefore, Kapilvastu Municipality needs to start developing structures and system
for effective waste management to resolve the adversity of the waste problems.
Recommendations: � The municipality office needs to establish a solid waste management section for the proper
inspection, supervision and management of municipal solid waste.
� Well qualified employees on solid waste management should be recruited and the number
of vehicles, rickshaws and compactors should be kept.
� The door to door collection is lacking except for the street sweeping, so this exercise
should be in practical for the waste management.
30
� Public Awareness campaign regarding solid waste management should be regularly
organized within the municipality.
� There is no involvement of community and private organization for solid waste
management in the municipality. For effective solid waste management, municipality
should involve local community as well as private organization.
� Source segregation at household level should be encouraged and composting and recycling
should be promoted at the local levels and private parties.
� Municipality should prepare proper plan for establishing the landfill site.
31
References
� Solid Waste Management and Resource Mobilization Center, 2006, Solid Waste
Management in the.
� Solid Waste Management and Resource Mobilization Center, 2006,A Diagnostic Report on
State of Solid.
� SWM&RMC. 2007. Baseline information on Solid Waste Management of Kathmandu
Metropolitan City.
� Miller, G. T. 2004. Living in the Environment 14th Edition. Pacific Grove: Thomson
Learning, Inc.
� SWMRMC, (2004): A Diagnostic Report on State of Solid Waste Management in
Municipalities of Nepal, Solid Waste.
� Management and Resource Mobilization Centre, Lalitpur.
� CBS, 2001. Population Census of Nepal, 2001, Published by the Central Bureau of
Statistics,
� Government of Nepal.
� Environmental Protection Act, 1997.
� Environmental Protection Rules, 1997.
� Solid Waste Management and Resource Mobilization Act, 1987.
� Solid Waste Management and Resource Mobilization Rules, 1989.
� Local Self Governance Act, 1999.
� Municipal Act, 1992.
� SWM Act, 2011
32
Annexes
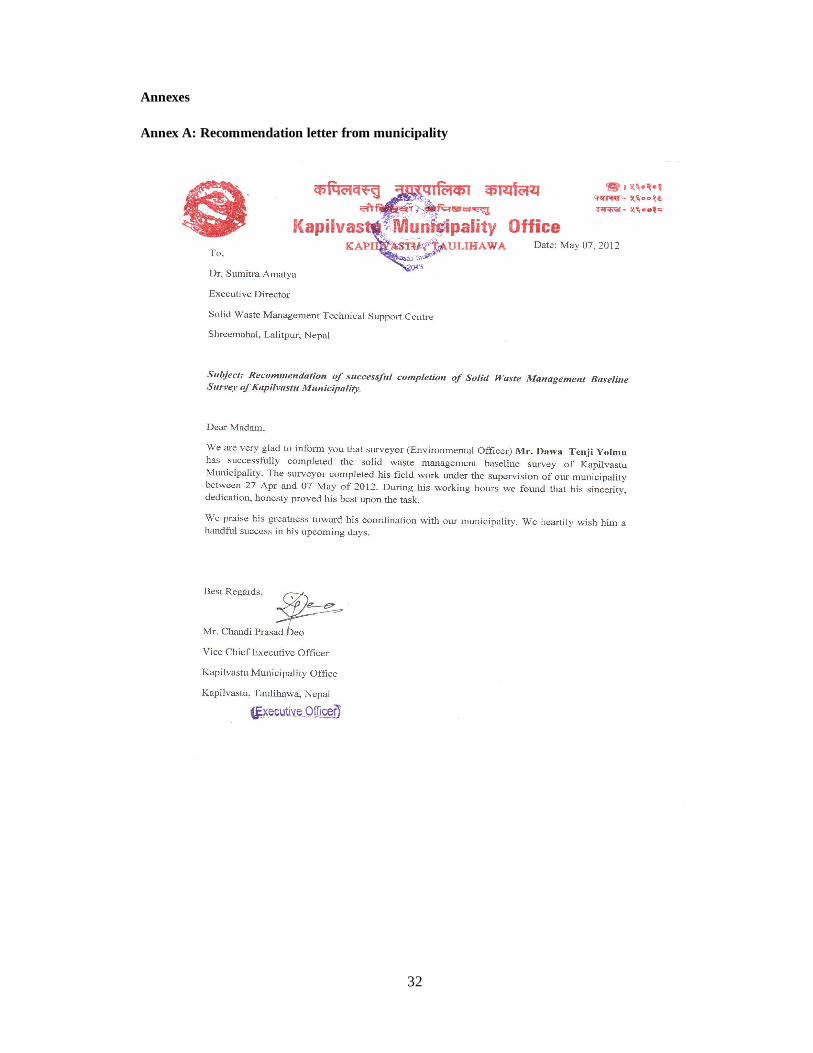
Annex A: Recommendation letter from municipality
33
Annex B: Maps
Map 1: River network of Kapilvastu municipality
Map 2: Road network and urban area of Kapilvastu municipality
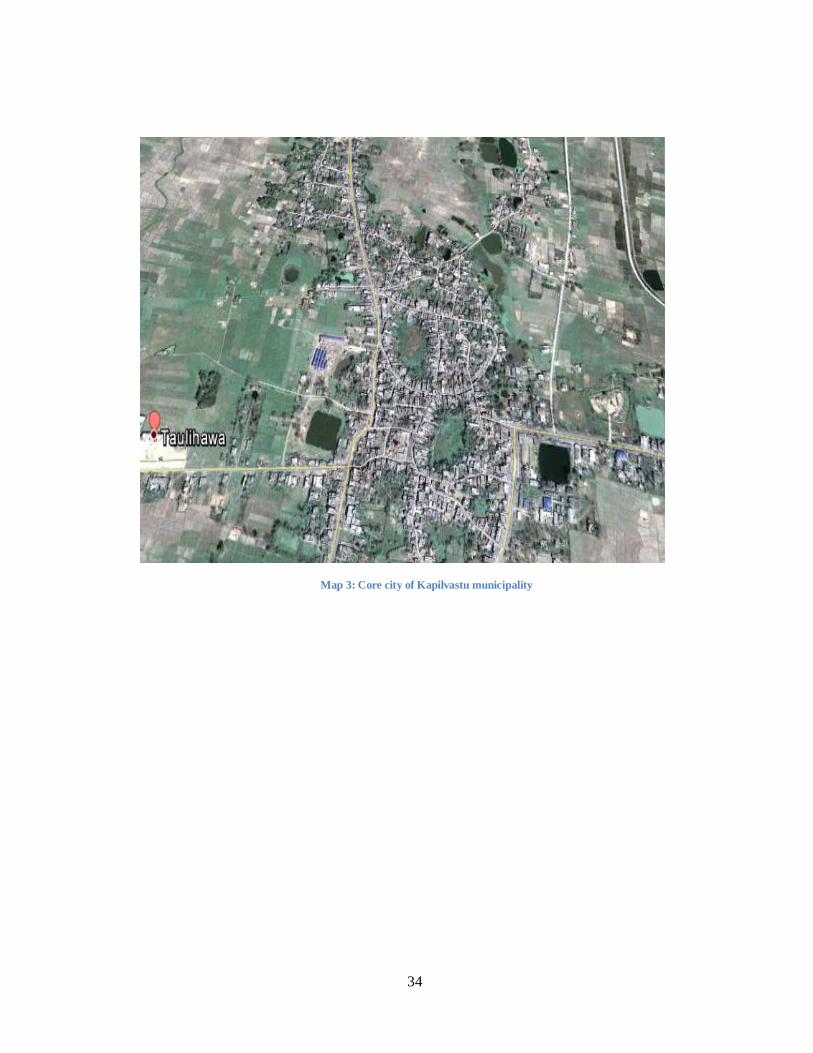
34
Map 3: Core city of Kapilvastu municipality
35
Annex C: Photographs
fig 1: Dumping of waste in drainage system fig 2: Weighing device for waste
fig 3: Commercial waste characterization on site fig 4: Weighing of domestic waste
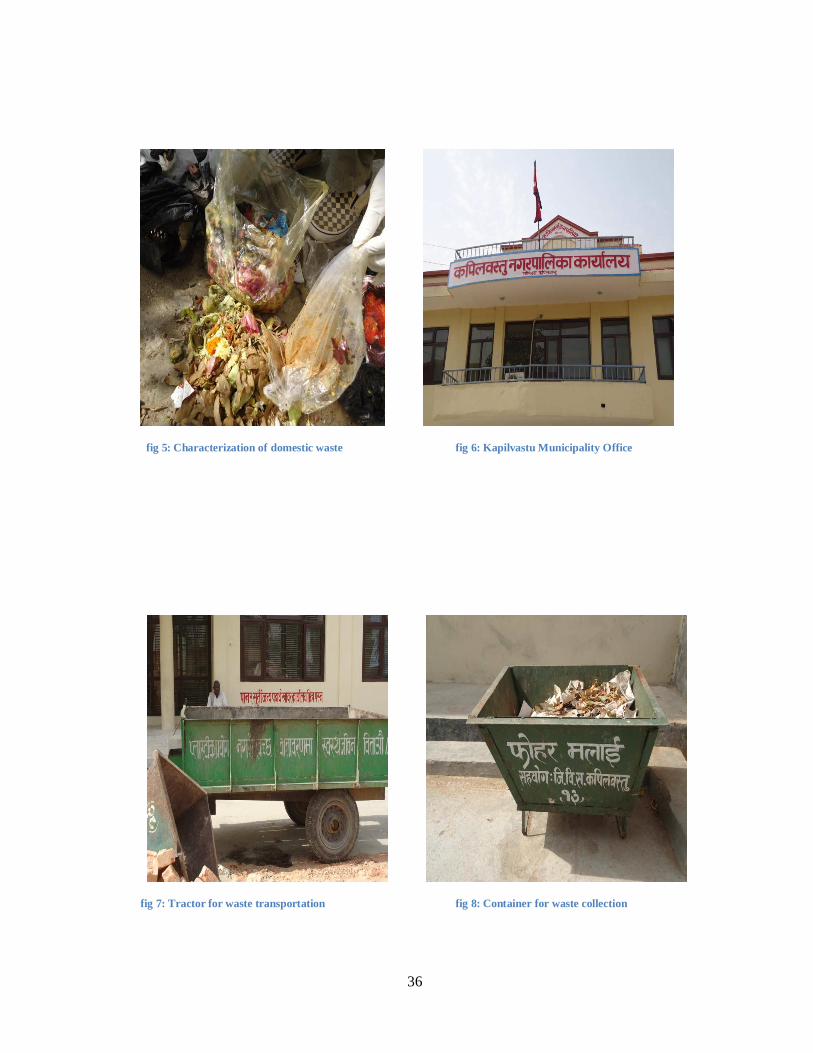
36
fig 5: Characterization of domestic waste fig 6: Kapilvastu Municipality Office
fig 7: Tractor for waste transportation fig 8: Container for waste collection
37
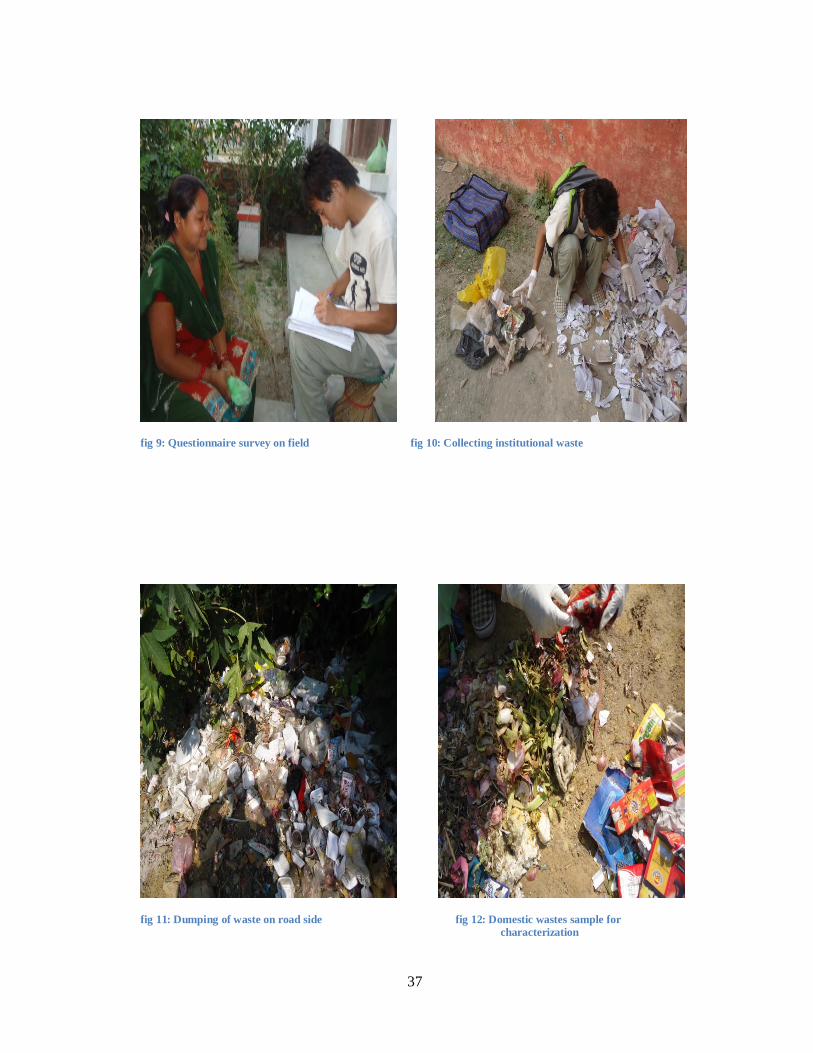
fig 9: Questionnaire survey on field fig 10: Collecting institutional waste
fig 11: Dumping of waste on road side fig 12: Domestic wastes sample for characterization
Copyright © 2022 FDOKUMEN