The importance of incorporating reliability of supply criteria in a regulatory system of electricity...
41
The Importance of Incorporating Reliability of Supply Criteria in a Regulatory System of Electricity Distribution: An Empirical Analysis for Austria. Johannes Reichl, Andrea Kollmann, Robert Tichler, Friedrich Schneider Energieinstitut GmbH, Altenberger Strasse 69, 4040 Linz, 0732 24 68 5652, [email protected], www.energieinstitu-linz.at
-
Upload
continental -
Category
Documents
-
view
4 -
download
0
Transcript of The importance of incorporating reliability of supply criteria in a regulatory system of electricity...
The Importance of Incorporating Reliability of Supply
Criteria in a Regulatory System of Electricity
Distribution: An Empirical Analysis for Austria.
Johannes Reichl, Andrea Kollmann, Robert Tichler, Friedrich Schneider
Energieinstitut GmbH, Altenberger Strasse 69, 4040 Linz, 0732 24 68 5652, [email protected], www.energieinstitu-linz.at
6. Internationalen Energiewirtschaftstagung an der TU Wien IEWT 2009
2
Abstract:
Grid tariffs are the main source of income for distribution system operators (DSOs). Reductions of tariffs increase the cost pressure on DSOs; assuming they work efficiently tariff reductions potentially lead to a decrease of the electricity system's quality if no reliability of supply criteria are incorporated in the regulatory system. Our statistically analysis shows that the correlation between grid tariffs and electricity supply interruptions in a regulatory regime neglecting this incorporation is significant and that furthermore decreasing tariffs harm the reliability of supply even in the short run. Our econometric analysis of the influence of tariffs on reliability of supply shows a significant correlation between the grid tariffs and the duration of power outages in the Austrian electricity grid; an annual average interruption duration per installed capacity of a specific grid increases ceteris paribus by 1.36 minutes if the grid tariff of this specific grid is decreased in the previous year by 1€ per MWh.
Keywords: regulation, grid tariffs, security of supply
6. Internationalen Energiewirtschaftstagung an der TU Wien IEWT 2009
3
1 Introduction
In the Austrian electricity sector, the first stage of the liberalisation process was initiated by the
EU Directive 96/92/EC on electricity liberalisation in 1996 (European Parliament and the Council,
1997). In 1999 the Electricity Business and Organisation Act (ElWOG) in combination with the
formal implementation of the EU directive in 1998 in Austria, a standardised law for the
organization and regulation of the Austrian electricity sector, was established. After various
intermediate steps, the Austrian electricity sector was fully opened to competition and
consumers were given the possibility to switch freely between electricity suppliers in October
2001. While the competitive electricity market now covers generation, trade and supply of
electricity, the transmission and distribution of electricity1 are regulated by the energy regulating
authority, E-Control. Distribution is subject to economies of scale and the existence of a natural
monopoly in this part of the energy sector does not allow its full liberalisation from a theoretical
point of view. The introduction of a regulator, who provides incentives for cost-efficient grid
operation, is considered to be the second-best solution to deal with the natural monopoly.
Before market liberalisation took place in 2001, distribution of electricity in Austria was regulated
according to a rate-of-return (RoR) system, which is typically applied in monopoly regulation.
RoR regulation offers utilities a refunding of their operating expenditures and the employed
capital additional to a rate-of-return. Shortly after market liberalisation in 2001, RoR regulation
was replaced by an incentive-orientated regulation regime. This regime primarily follows a price-
cap regulation, but prices are determined at fixed values and are not only given an upper limit
(for an excellent review of the different models of incentive regulation and their theoretical
properties see Joskow (forthcoming)). The Austrian electricity grid is partitioned into 7 levels, of 1 In the following only the distribution of electricity is discussed.

6. Internationalen Energiewirtschaftstagung an der TU Wien IEWT 2009
4
which 3 levels are high voltage grids, 2 levels are medium voltage grids and 2 levels are low
voltage grids. 4 tariffs (summer-high, summer-low, winter-high and winter-low) are assigned to
each of the grid levels. Shortly after his appointment, the regulator started to cut grid tariffs which
was unsurprisingly opposed by the Distribution System Operators (DSOs). As grid tariffs are the
main income of DSOs under the new regime, in their opinion a cut in tariffs would lead to the
erosion of the grid's quality, to a danger for security of supply and thus to a threat for Austria's
economy (VEÖ, 2003).
The term security of supply is used in a broad range of different meanings which can basically
be divided into economic and technical aspects of the overall supply with energy. From an
economic point of view security of supply can be improved by reducing energy import
dependence and by guaranteeing long-run capacity generation, whereas a more technical
access highlights the importance of grid stability and short-run operational reliability of the grid.
The latter, reliability of supply (as a component of the quality of service), is the aspect of the
overall security of supply that we focus on in this paper. Reliability of supply describes the
undisturbed functioning of parts of the grid as well as of the whole electricity grid within a given
region. Our empirical analysis does not differ between planned and unplanned power outages
because only aggregated data is available on DSO-level.
Despite strong opposition, the regulator cut grid tariffs by nearly 250 million altogether in the
years 2001 to 2003, which resulted in a 12% decrease of overall electricity prices (Kratena,
2004).
But not only the regulatory changes of the electricity market but also the first experiences with
market liberalisation seemed to keep their promises. In 2002 the regulator already stated that
electricity pricing had become more efficient and that the productivity of market players had
grown (Haberfellner, 2002). Similar effects were seen in other European countries, which - like
6. Internationalen Energiewirtschaftstagung an der TU Wien IEWT 2009
5
Austria - liberalised their energy markets according to Directive 96/92/EC (European Parliament
and the Council, 1997) concerning common rules for the internal market in electricity. Jamasb
and Pollitt (2005) show that between 1997 and 2003 average real electricity prices declined for
European households, small industrial customers and large industrial users by 6, 20 and 9.5
percent, respectively. By now, the promising pace of the implementation of a competitive and
efficient energy market in the European Union as a whole and in the single member states has
significantly slowed down. A recent communication from the European Commission to the
Council and the European Parliament about the prospects for the internal gas and electricity
market clearly describes the problems that have come along with liberalisation: The European
Commission observes ”[…] a continued lack of competitive pressure and high levels of
concentration in wholesale markets […] as well as a lack of market transparency […]” (European
Commission, 2006b, p.3). The decline in prices seen at the beginning of the liberalisation has
also stopped, leading to an increase of wholesale electricity prices while household prices have
remained fairly stable.
Apart from these efficiency and competitiveness concerns the communication lays major
emphasis on security of supply. Already in EU directive 2003/54/EC (European Commission,
2003) security of supply was addressed and measures for it were recommended. Opposed to
some European countries, Austria has not adopted a legal framework for incorporating concerns
of reliability of supply in its regulatory system. The importance of a clear focus on service
reliability has been demonstrated by the pan-European blackout of 4 November 2006, which has
shown the potential weaknesses of the European electricity supply. The commission concludes
that while investment in generation capacity clearly responds to price signals (European
Commission, 2006b), not enough progress is made in the development of networks (European
Commission, 2006a). The latter point is an urgent one, as the physical limits of the existing
networks are nearly exhausted which increases the probability of temporary supply interruptions

6. Internationalen Energiewirtschaftstagung an der TU Wien IEWT 2009
6
(European Commission, 2006a). The continuous growth of electricity demand adds further
pressure to increasing network investments as does the connection of electricity from renewable
energy sources. The Commission notes that the necessary investments shall be made by the
“economic operators concerned” (European Commission, 2006a, p.13) and highlights the
importance of “a stable and attractive regulatory framework allowing the private sector to predict
the successful completion of its investment and guaranteeing stable rates of return, while
offering a high level of service to customers” (European Commission, 2006a, p.14). The weight
that the European Commission now puts on issues of security of supply clearly shows that the
liberalisation of electricity markets cannot only be evaluated with declines in prices but must also
incorporate the possible effects liberalisation has on reliability of supply.
We take up the claim of the European Commission that a stable and attractive regulatory
framework needs to be guaranteed so that investments in security of supply are undertaken at
an optimal rate. It is well known that security of supply covers a wide range of aspects of
electricity supply from import dependence to short-run operational reliability.
We focus on one aspect of security of supply, the reliability of supply, and benchmark the
stability of the regulatory framework using the grid tariffs set by the regulator. We analyse the
short-run effects of tariff changes on supply interruptions in an incentive regulation that neglects
setting incentives for maintaining or improving the level of supply reliability.
The paper is organized as follows: chapter 2 presents some theoretical considerations about
(de-)regulation. Chapter 3 contains the framework for measuring reliability of supply. Chapter 4
presents the empirical investigation whereas part 4.1 discusses the data and the empirical
modeling. Part 4.2 shows the empirical model and 4.3 the econometric results. Chapter 5 draws
a conclusion.
6. Internationalen Energiewirtschaftstagung an der TU Wien IEWT 2009
7
2 Theoretical Considerations and Literature Review
The switch from rate-of-return regulation to incentive regulation is carried out mainly to improve
operational efficiency of distribution system operators. Cost reductions are then intended to be
passed on to the customers. In the rate-of-return regulatory framework utilities’ profits are
determined by the returns on the employed capital. This creates incentives for exaggerated
investments in grid capacity and maintenance, resulting in poor efficiency in the distribution of
electricity (this effect of monopoly regulation is referred to as Averch-Johnson effect (Averch and
Johnson, 1962)). Incentive regulation relaxes this relation of employment of capital and profits
and motivates DSOs to implement actions improving their efficiency. On the one hand, fixing the
grid tariffs, as conducted in Austria, clearly leads to increasing profits when the costs for the
distribution decrease, hence incentives for efficiency improvements are given. On the other hand
less attention might be payed to maintaining reliability of supply under this regulatory regime,
when quality indicators or benchmarks are not incorporated in the incentive regulation. Concerns
about reliability of supply in incentive regulation are discussed broadly in literature, see e.g.
Jamasb and Pollitt (2007) and Giannakis et al. (2005) in the electricity sector or Uri (2003) and
Sappington (2003) for the telecommunication sector.
In a comprehensive empirical analysis of quality of supply in electricity networks for the USA
Ter-Martirosyan (2003) finds, that incentive regulation harms service reliability if it is not directly
addressed by the regulatory regime. In her study she uses panel data of 78 investor-owned
utilities in 23 states of the USA over the period 1993 to 1999. In her main equation she
estimates the quality variables SAIDI and SAIFI using a dummy for the regulatory regime in a
state (either incentive regulation or no incentive regulation), a quality standards dummy (either
6. Internationalen Energiewirtschaftstagung an der TU Wien IEWT 2009
8
quality standards are explicitly incorporated in the regulation regime or not) and utility specific
and time specific variables as explanatory variables. Furthermore an error term and a vector for
other explanatory variables are included. The estimation outcome supports her hypothesis that
incentive regulation negatively influences quality of supply if no quality standards are defined.
Also the duration of outages increases under incentive regulation when no quality standards are
set, but decreases when quality standards are implemented. If incentive regulation is combined
with quality standards the average duration of power outages is reduced by 11% according to
her model.
Jamasb and Pollitt (2007) discuss that quality regulation generally aims at achieving equilibrium
between benefits and costs of the system. Thus, a central point of quality regulation is to
determine an optimal level of requested service quality, as exceeding the requested level of
service quality leads to further inefficiencies. Theoretically, the optimal level of quality is found
when the marginal costs of improving quality equal the economic value of the quality
improvements. Practically, both factors are hardly observable and measurable, so that the
optimal level is hardly ever known. Identifying the economic value of the service quality
improvements is challenging on several levels. Besides data issues, a comprehensive
determination of the economic value has to translate the social value into monetary units and
add it up with the pure financial costs to obtain the total economic value of service reliability
improvements. Additional challenges arise as such a comprehensive determination of the
economic value needs to incorporate all concerned sectors of the economy. For the household
sector this is usually carried out by estimation of the willingness to pay (WTP). Estimates of WTP
among households to avoid power outages have e.g. been calculated by Carlsson and
Martinsson (forthcoming, 2007), Layton and Moeltner (2004) and Beenstock et al. (1998). In the
firm sector cost estimates of the value of reliability of supply can be calculated by more
straightforward approaches, see e.g. Moeltner and Layton (2002). Methods for the determination
6. Internationalen Energiewirtschaftstagung an der TU Wien IEWT 2009
9
of the economic value of quality improvements of distribution networks for the agricultural sector,
the public service sector or for the armed forces are not known to the authors. For the
identification of the costs of improving service quality, information becomes a central issue. The
regulator has an information deficit about the associated costs of improvements, whereas the
operating utility has superior information. This deficit in information on part of the regulator may
lead to two possible outcomes. Firstly, if the grid tariffs are set too low, service quality
maintenance or improvements fall behind in the DSOs' objectives. Secondly, if the grid tariffs are
set too high, expenditures for service quality may exceed the optimal level.
As a matter of fact, costs of quality differ among distribution system operators because of the
existing heterogeneity of the characteristics of end-users and different quality objectives. For that
reason, the basic principles of quality regulation are the determination and objective evaluation
of reliability of supply in a certain regulatory regime (Yu et al., 2007).
As a an example of incentive regulation incorporating service quality broadly discussed in
literature, the efficiency and performance of the UK distribution network are analysed by e.g.
Waddams Price et al. (2003), Jamasb and Pollitt (2007) and Giannakis et al. (2005). In the
Nineties impressive cost reductions were realized and service reliability was simultaneously
improved. In Phase I (1991-2000) of the service quality incorporated incentive regulation in the
UK guaranteed standards of performance were introduced, entitling consumers to
compensations for violations of that standards. From 1991/92 to 1998/99, distribution charges
for domestic users have fallen by about 9% (adding up to a price reduction of the total price for a
kWh of 29%). Minutes lost per customer gradually decreased from about 100 in 1991/92 to
below 80 in 1999/2000 and the number of interruptions per 100 customers decreased from
about 90 to slightly below 802. The Nineties were followed by tightened standards and a one-off
2 For comparison, these figures are still double the Austrian outage indicators,
6. Internationalen Energiewirtschaftstagung an der TU Wien IEWT 2009
10
cut in distribution revenue in 2000/01 of 23% followed by a 3% p.a. fall in unit revenue until 2005
(Phase II) (Jamasb and Pollitt, 2007). At the beginning of Phase II both indicators for service
reliability deteriorated noticeable: in 2003 the minutes lost per customer even exceeded the level
at the beginning of Phase I3.
Towards the end of Phase II these indicators returned to their levels of 2000. A further
development of the regulatory regime started in 2005 with the initiation of Phase III and will run
until 2010. Despite the temporary decrease in service reliability observed between 2000-2003,
the overall trend of an increasing service reliability continued. Of course, weather conditions and
other external effects can not be neglected when analysing outage durations.
In the case of Austria, a very special feeling and high sensitivity are asked for when defining grid
tariffs, because Austria, even though being a geographically small country, has a large number
of geographical, demographic and especially climatic sources of heterogeneity among supply
areas4.
With respect to these literature findings, it is remarkable, that the Austrian regulator has not
established any quality criteria in his regulatory regime up to now. But, the regulator has
announced that an incorporation of quality criteria in his regulatory regime will begin in 2010. In
2006, he has started to define quality standards and to develop a system for incentives and
penalties if the DSOs exceed these standards or fall behind them. What these quality criteria will
look like or how the incentives and penalties will be shaped has not yet been made public by the
regulator.
see table 1.
3 Naturally, not all variations in power quality indicators can be assigned to the regulatory regime.
4 For a descriptive overview of the different supply areas characteristics see table 1.
6. Internationalen Energiewirtschaftstagung an der TU Wien IEWT 2009
11
Besides this delayed adoption of quality regulation, some concerns remain regarding the
customer-related rights of this regime. The ElWOG (see chapter 1) defines the collection of the
data relevant for the determination of the current quality indicators. All data has to be submitted
to the regulator, who is legally obligated to immediately make these data anonymous when the
company-related information is not essential for further statistical analysis. The obligation of
confidentiality is codified in § 52 of the ElWOG, which refers to § 19 para. 2 of the federal
statistics law (for further details see Hauer und Oberndorfer (2007)). According to this, only
highly aggregated statistics are made public, which do not allow the customer any insights in the
quality of the services he is provided with. In the authors’ opinion the customer should clearly
have access to this information and have full disclosure of the activities of the monopolists.
From the last paragraphs we resume that incentive regulation incorporating service quality
potentially improves service reliability, while setting incentives for cost reductions only (as it has
been conducted in Austria in the observation period from 2002-2005) may harm reliability of
supply. Therefore our core hypothesis is, if simultaneously incentives for maintaining and
improving the network are neglected, intensified cost pressure on DSOs leads to a deterioration
of service reliability, ceteris paribus. For the Austrian regulatory regime between 2002 and 2005
this means, that grid tariffs and service quality should be positively correlated.
Even when our hypothesis is found quite often in literature (see e.g. Giannakis et al. (2005), Yu
et al. (2007) and specific for the Austrian case Haber and Rodgarika-Dara (2005)), the work of
Ter-Martirosyan (2003) on service quality in the electricity sector in the USA is the only empirical
paper giving evidence towards it. In our opinion there are two reasons for the lack of empirical
studies about this topic: Firstly, the data needed for such an analysis is highly sensitive, which
makes it difficult to collect; secondly, liberalisation of electricity markets is still in its infancy in
most European countries so that the analysis of external effects i.e. the deterioration of reliability
of supply, has only recently become an issue.

6. Internationalen Energiewirtschaftstagung an der TU Wien IEWT 2009
12
6. Internationalen Energiewirtschaftstagung an der TU Wien IEWT 2009
13
3 Framework for Measuring Reliability of Supply
3.1 Power Quality Indicators
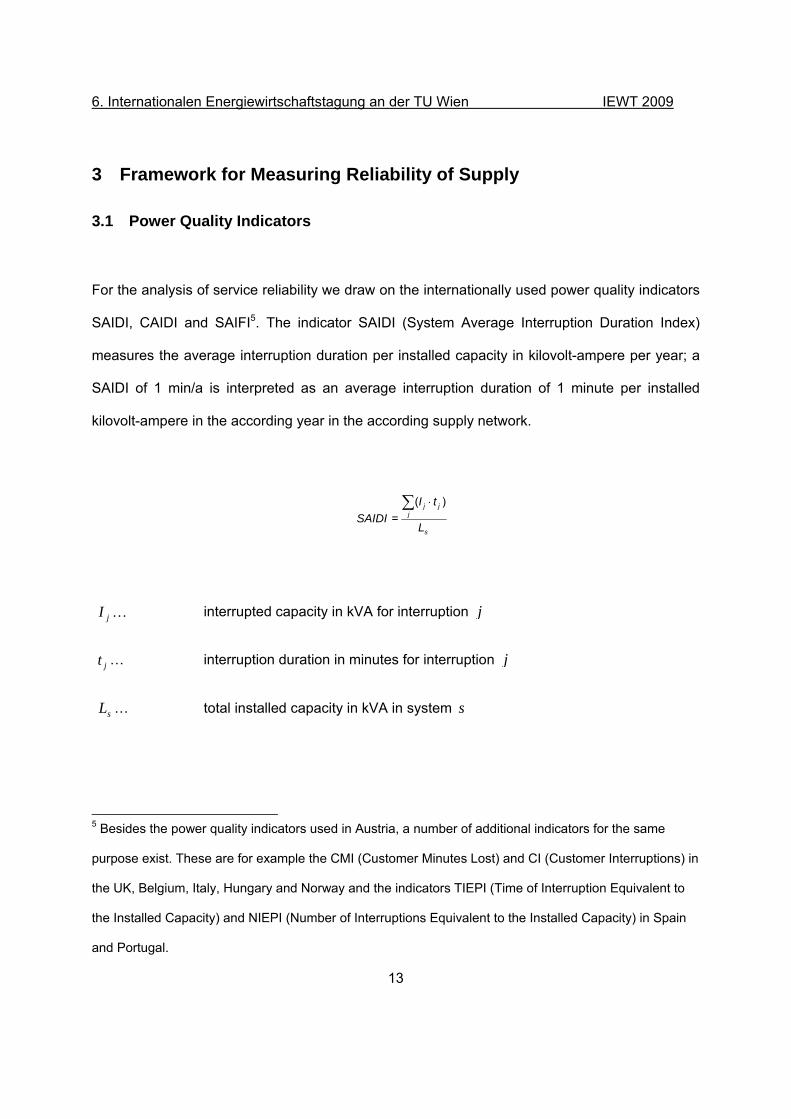
For the analysis of service reliability we draw on the internationally used power quality indicators
SAIDI, CAIDI and SAIFI5. The indicator SAIDI (System Average Interruption Duration Index)
measures the average interruption duration per installed capacity in kilovolt-ampere per year; a
SAIDI of 1 min/a is interpreted as an average interruption duration of 1 minute per installed
kilovolt-ampere in the according year in the according supply network.
s
jjj
L
tISAIDI
)(=
⋅∑
KjI interrupted capacity in kVA for interruption j
jt … interruption duration in minutes for interruption j
sL … total installed capacity in kVA in system s
5 Besides the power quality indicators used in Austria, a number of additional indicators for the same
purpose exist. These are for example the CMI (Customer Minutes Lost) and CI (Customer Interruptions) in
the UK, Belgium, Italy, Hungary and Norway and the indicators TIEPI (Time of Interruption Equivalent to
the Installed Capacity) and NIEPI (Number of Interruptions Equivalent to the Installed Capacity) in Spain
and Portugal.

6. Internationalen Energiewirtschaftstagung an der TU Wien IEWT 2009
14
The indicator CAIDI (Customer Average Interruption Duration Index) is the average duration of
an interruption if an outage is experienced. Two different reference points are in use for the
interruption durations on the customer level: a.) the number of customers, henceforth CAIDI
Type I and b.) the interrupted capacity, henceforth CAIDI Type II. In our analysis the interrupted
capacity is used as reference point, since the Austrian regulator requests DSOs to provide their
values for CAIDI with respect to this mode of calculation. Therefore the power quality indicator
CAIDI in this paper is calculated according to the following formula, i.e. CAIDI (Type II):
j
j
jjj
I
tICAIDI
∑∑ ⋅ )(
=
jI … interrupted capacity in kVA for interruption j
jt … interruption duration in minutes for interruption j
The indicator SAIFI (System Average Interruption Frequency Index) measures the average
frequency of outages per installed capacity per year and a SAIFI of 1 means that each installed
kilovolt-ampere, on average, is interrupted once in the according year.
s
jj
L
ISAIFI
∑=
jI … interrupted capacity in kVA for interruption j
sL … total installed capacity in kVA in system s
6. Internationalen Energiewirtschaftstagung an der TU Wien IEWT 2009
15
The duration indicator SAIDI is increasing, whenever sjj LtI Δ⋅Δ∑ >)( 6. This is the case when
the number of loss minutes )( jj tI ⋅∑ increases faster (or decreases slower) than the total
installed capacity sL . Therefore a decrease in SAIDI ceteris paribus has three different kinds of
origin: a.) decreasing interruption durations, b.) decreasing interrupted capacity and/or c.) an
increase in the total installed capacity, where the new capacity is less vulnerable to interruptions
as the previous capacity.
The second duration indicator CAIDI increases, when jjj ItI ∑∑ Δ⋅Δ >)( (which is only possible
when at least one jt is greater than 1). A decrease in CAIDI is therefore ceteris paribus caused
by a.) a decrease in the interruption durations, b.) an increase of the interrupted capacity in short
outages ( 1<jt ) and/or c.) a decrease in the interrupted capacity in longer outages ( 1>jt ).
For the frequency indicator SAIFI an increase will be observed when sj LI ΔΔ∑ > . A decrease
in SAIFI is therefore ceteris paribus caused by a.) a decreasing interrupted capacity and/or b.)
an increasing total installed capacity.
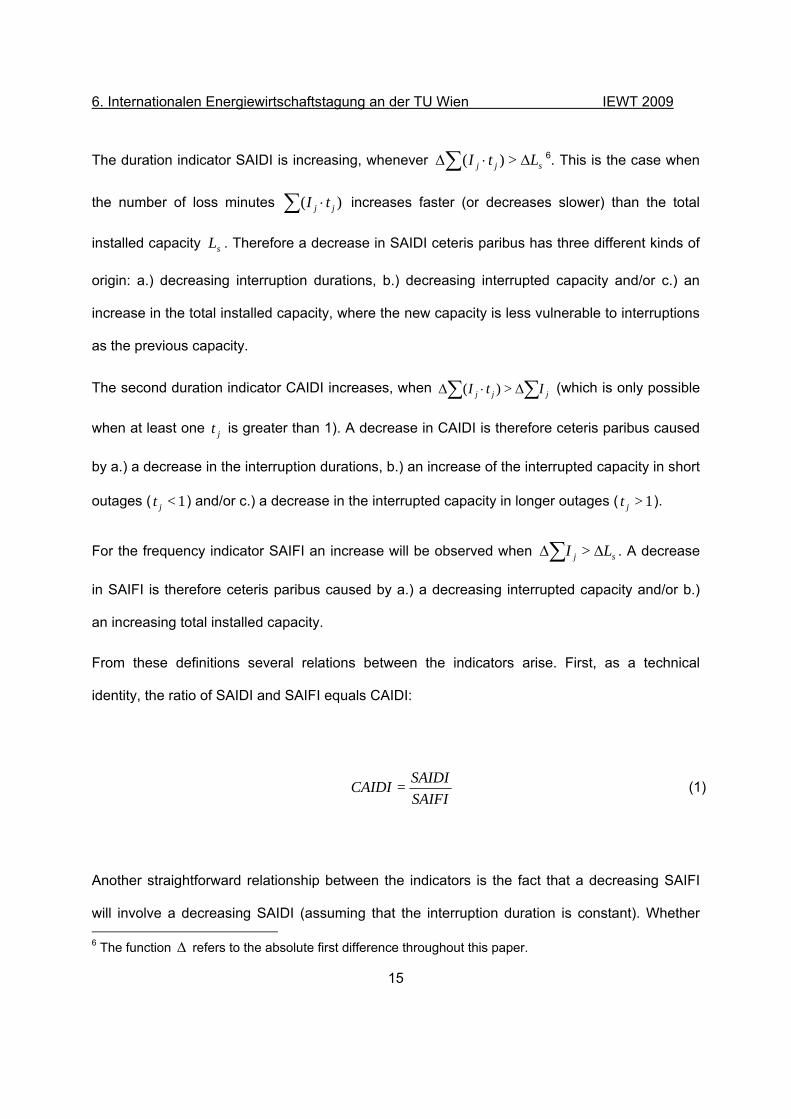
From these definitions several relations between the indicators arise. First, as a technical
identity, the ratio of SAIDI and SAIFI equals CAIDI:
SAIFISAIDICAIDI = (1)
Another straightforward relationship between the indicators is the fact that a decreasing SAIFI
will involve a decreasing SAIDI (assuming that the interruption duration is constant). Whether 6 The function Δ refers to the absolute first difference throughout this paper.
6. Internationalen Energiewirtschaftstagung an der TU Wien IEWT 2009
16
CAIDI is decreasing or increasing when reliability improvements are conducted, depends on
whether the improvements have more effect on the frequency or the duration of outages.
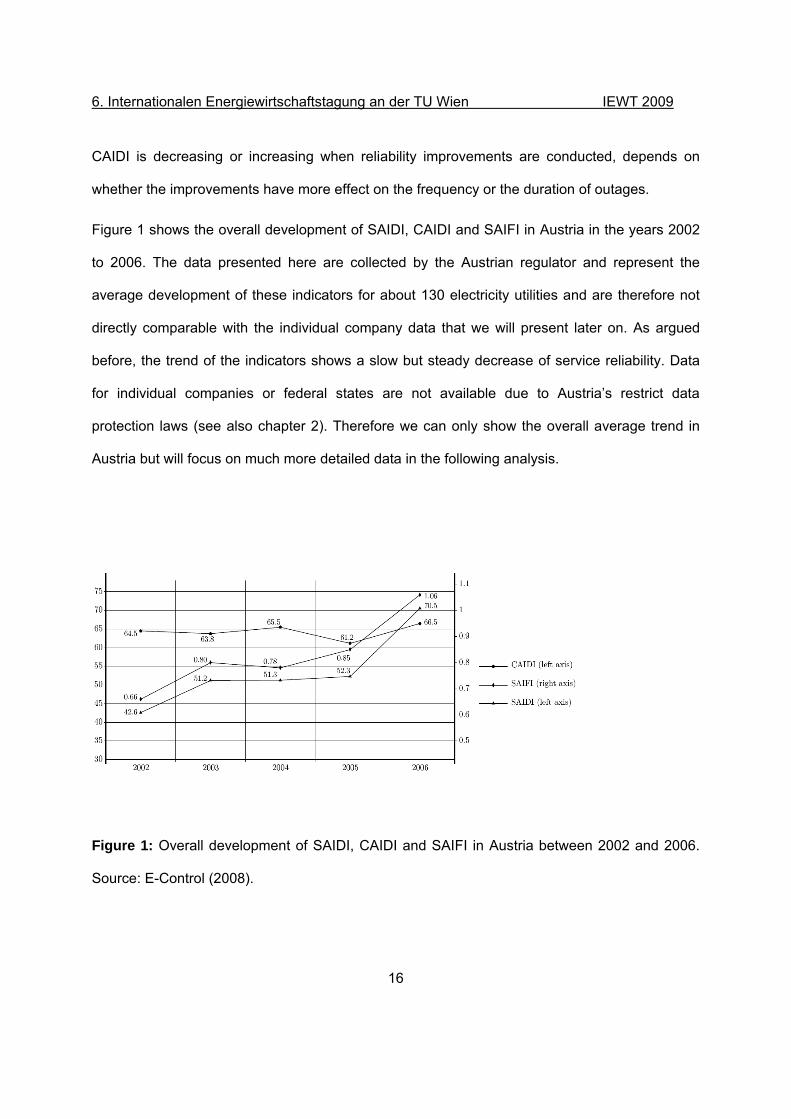
Figure 1 shows the overall development of SAIDI, CAIDI and SAIFI in Austria in the years 2002
to 2006. The data presented here are collected by the Austrian regulator and represent the
average development of these indicators for about 130 electricity utilities and are therefore not
directly comparable with the individual company data that we will present later on. As argued
before, the trend of the indicators shows a slow but steady decrease of service reliability. Data
for individual companies or federal states are not available due to Austria’s restrict data
protection laws (see also chapter 2). Therefore we can only show the overall average trend in
Austria but will focus on much more detailed data in the following analysis.
Figure 1: Overall development of SAIDI, CAIDI and SAIFI in Austria between 2002 and 2006.
Source: E-Control (2008).
6. Internationalen Energiewirtschaftstagung an der TU Wien IEWT 2009
17
Furthermore, the analysis of the origins of the decrease of reliability of supply has not been
empricially analysed before for Austria. The lack of scientific literature on this topic is also mainly
due to overly tight data protection laws. Specific data about the activities of the DSOs are the
basis for assigning causes to outages. As there is no reliable data base and no reliable literature
on this topic, our analysis needs to stay theoretic, because otherwise we could only be
speculative.
3.2 Influences on Reliability of Supply
For the discussion of the expected market reaction as a response to changing tariffs we first
describe the composition of the Austrian end user electricity price. The end user price consists of
seven components, which are, ranked according to their magnitude (exemplarily for the supply
area Vienna in 2006):
• the pure energy price 34.31% (incl. a settlement price for green electricity of 2.5 - 3.5%)
• grid tariff 33.26%
• value added tax 16.70%
• energy surcharge 9.80%
• usage surcharge 3.17%
• renewables surcharge 2.80%.
As mentioned in the introduction, grid tariffs are the main source of revenues for distribution
system operators. From a revenue reduction as a consequence of a reduction in the grid tariffs,
several risks for reliability of supply arise. Under the assumption that grid tariffs have already
6. Internationalen Energiewirtschaftstagung an der TU Wien IEWT 2009
18
been established with respect to actual distribution costs in the past, firms will have to cut costs
under reduced grid tariffs, which is the main objective of incentive regulation. In the context of
reliability of supply, DSOs have two cost intensive functions:
a.) to provide sufficient capacity for distribution and to ensure an undisturbed distribution in
the future by preventive maintenance and upgrading the existing network
and
b.) to restore service in the case of interruptions.
Under cost cutting we expect point a.) to be especially problematic in the long run, since a short-
dated lack in preventive maintenance or the delay of necessary network upgrades are not likely
to affect reliability of supply immediately on a large scale. While under point b.), that is to cut
expenditures for the restoration unit, we expect negative consequences for the reliability of
supply even in the short run. A badly maintained or overstrained network is more vulnerable to
interruptions and therefore we expect a rise in the frequency of interruptions, which is observed
via the indicator SAIFI. In the case of cuts in expenditures for the restoration unit, the capacity to
act is shortened and delays in resolving the interruptions are likely to occur, which is observed
through the indicators SAIDI and CAIDI. Resuming the last paragraph, we expect cuts in grid
tariffs to significantly influence the power quality indicators SAIDI and CAIDI in the short-run and
to influence the power quality indicators SAIFI, SAIDI and CAIDI in the long-run. Unfortunately,
only data for the analysis of short-run effects is available to us.
6. Internationalen Energiewirtschaftstagung an der TU Wien IEWT 2009
19
4 Empirical Investigation
4.1 Data and Empirical Modeling
The Austrian regulator publishes yearly data on electricity supply interruptions which are highly
aggregated and do neither include grid specific data nor characteristics of the distribution system
operators. Therefore, data for our study had to be collected from the distribution system
operators directly, as open source data on such vulnerable aspects as supply interruptions on
company level are usually not published anywhere 7.
12 out of 13 contacted distribution system operators provided data on electricity interruptions.
These 12 companies are not only the largest players on the market they also serve 60.1% of the
Austrian territory and operate in all 9 federal states of Austria. The interruption indices could not
be differentiated between planned and unplanned supply interruption, which does not severely
influence the quality of the regression outcomes.
For most grids, statistical data was available for the whole estimation period from 2002 to 2005,
but, some distribution system operators provided their power quality indices only for the most
recent years 2004 and 2005. Our sample contains 9 observations for the year 2002, 11
observations for 2003, 12 observations for 2004 and 11 observations for 2005. Mainly this is due
to the fact, that consistent Austria-wide guidelines for the calculation of these indices where
firstly established in 2002. Prior to this, not all Austrian distribution system operators had
calculated their indices based on common standards. Only values calculated according to this
7 As data on the performance of a certain distribution network is confidential to the public, only results and
statistics can be presented in this paper, that do not reveal any specific information on the distribution
system operators.
6. Internationalen Energiewirtschaftstagung an der TU Wien IEWT 2009
20
common standard where included in our sample, resulting in a total number of observations of
43.
The inclusion of the grid tariffs in the regression analysis requires aggregations because of the
high number of small deviations within a specific grid. The calculation of the average grid tariffs
of a certain grid is based on the determination of the share of the different seasonal tariffs in the
Austrian grid. In addition, grid tariffs differ between the grid areas; so that e.g. private household
customers pay other tariffs than industrial ones. As a consequence, each aggregated grid tariff
of a certain grid is not only based on an average of the legitimated tariffs of the energy regulator
for the grid region but is also weighted with the specific seasonal electricity consumption and
with the different electricity consumption of the certain grid areas.
Within our sample, eight out of twelve electricity distribution system operators are faced with a
decrease of reliability of supply regarding the power quality indicators SAIDI and SAIFI in the
observation period. In the case of CAIDI only for five DSOs a steadily negative development is
observed (for a discussion of CAIDI see part 3.1).
In general, extreme weather events can strongly influence data on reliability of supply of power
grids. As a consequence, we excluded two data points and modified one data point that has
been influenced by extreme weather events. First, the western part of Austria suffered from
damages of flood water in the year 2005. The most affected federal state was Vorarlberg.
Therefore the data point for Vorarlberg for 2005 is excluded from our sample due to being a
single outlier in reliability of supply as a result of flood water. Second, Austria was faced with
considerable flood water also in 2002. The centre of this natural disaster and therefore most of
the damage costs were situated in the northern part of the federal state Lower Austria. Actually,
we could not include the power grid of the northern part of this federal state into our analysis due
to the fact that the resident DSO declined to transfer data of the reliability of supply of this power
6. Internationalen Energiewirtschaftstagung an der TU Wien IEWT 2009
21
grid. Third, in October 2003, the federal state Burgenland suffered from wet snow that
repeatedly interrupted the electricity power supply of the area. Persistent degrees around the
freezing point and a simultaneous heavy precipitation caused wet snow conditions, which
affected the land line. The resident DSO therefore adjusted the transmitted data series by
excluding the interruptions caused by these snow conditions.
Beyond it, Austria did not suffer from additional natural disasters from 2002 until 2005 which
could influence reliability of supply in a way that cannot be captured within the regression
analysis. The results of the regressions therefore are assumed to reflect the unbiased and
consistent influences of the grid tariffs on the power quality indicators.
6. Internationalen Energiewirtschaftstagung an der TU Wien IEWT 2009
22
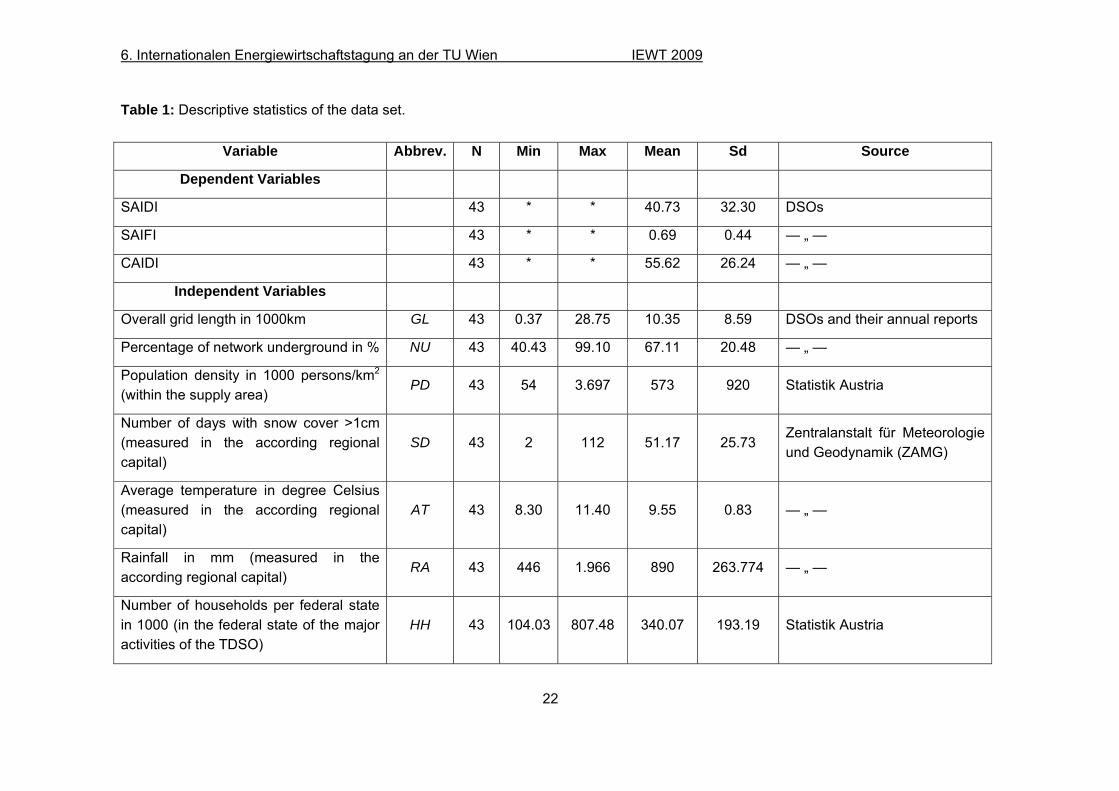
Table 1: Descriptive statistics of the data set.
Variable Abbrev. N Min Max Mean Sd Source
Dependent Variables
SAIDI 43 * * 40.73 32.30 DSOs
SAIFI 43 * * 0.69 0.44 — „ —
CAIDI 43 * * 55.62 26.24 — „ —
Independent Variables
Overall grid length in 1000km GL 43 0.37 28.75 10.35 8.59 DSOs and their annual reports
Percentage of network underground in % NU 43 40.43 99.10 67.11 20.48 — „ —
Population density in 1000 persons/km2 (within the supply area)
PD 43 54 3.697 573 920 Statistik Austria
Number of days with snow cover >1cm (measured in the according regional capital)
SD 43 2 112 51.17 25.73 Zentralanstalt für Meteorologie und Geodynamik (ZAMG)
Average temperature in degree Celsius (measured in the according regional capital)
AT 43 8.30 11.40 9.55 0.83 — „ —
Rainfall in mm (measured in the according regional capital)
RA 43 446 1.966 890 263.774 — „ —
Number of households per federal state in 1000 (in the federal state of the major activities of the TDSO)
HH 43 104.03 807.48 340.07 193.19 Statistik Austria
6. Internationalen Energiewirtschaftstagung an der TU Wien IEWT 2009
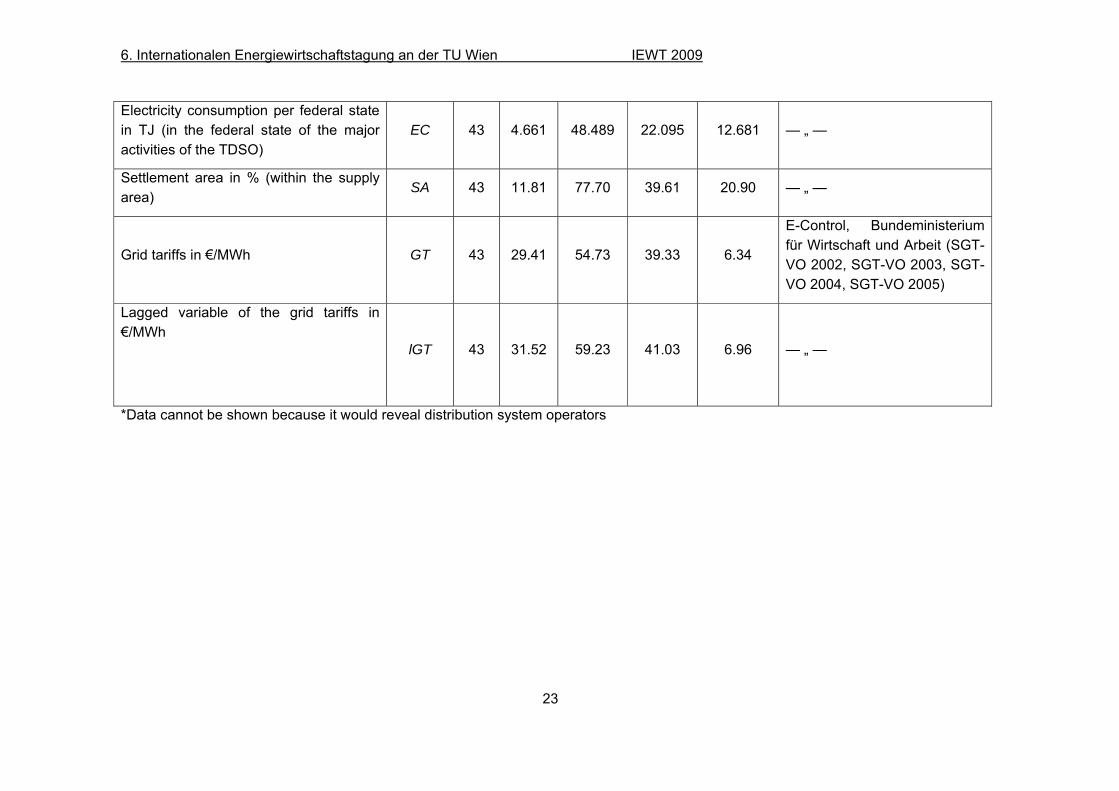
23
Electricity consumption per federal state in TJ (in the federal state of the major activities of the TDSO)
EC 43 4.661 48.489 22.095 12.681 — „ —
Settlement area in % (within the supply area)
SA 43 11.81 77.70 39.61 20.90 — „ —
Grid tariffs in €/MWh GT 43 29.41 54.73 39.33 6.34
E-Control, Bundeministerium für Wirtschaft und Arbeit (SGT-VO 2002, SGT-VO 2003, SGT-VO 2004, SGT-VO 2005)
Lagged variable of the grid tariffs in €/MWh
lGT 43 31.52 59.23 41.03 6.96 — „ —
*Data cannot be shown because it would reveal distribution system operators
6. Internationalen Energiewirtschaftstagung an der TU Wien IEWT 2009
Seite 24 von 41
4.2 The Econometric Model
In order to fulfill the ceteris paribus conditions while estimating the effect of grid tariffs on the
power outage indicators, an accurate selection of the additional explanatory variables is
important. Literature on the influence of grid characteristics on number and frequency of
power outages does not exist to our knowledge. A survey among the persons in charge of
the reliability of supply with DSOs (Reichl et al., 2007) clearly shows, that the most important
variable is the percentage of network underground as a fraction of the overall grid length,
because network underground, opposed to land line, is independent from bad weather
conditions such as heavy snowfall and storms, which are responsible for a significant number
of outages in Austria. As a second important variable, the overall grid length was identified as
influential too, which needs no further explanation. A total number of 11 variables (see table
1 for descriptive statistics of these 11 independent variables) were identified as candidates
potentially influencing the frequency and duration of supply interruptions in a certain supply
area. Due to the small sample and the high correlation between some of the independent
variables, not all variables enter the regression. Variables to enter the model were selected
according to the information obtained by the survey among the DSOs. Additional to the
reportedly most decisive variables overall grid length and percentage of network
underground, a variable to describe the habitat density in the supply area was included.
Therefore, additional to the variable of main interest, that is the lagged variable of the grid
tariffs, the variable population density enters the model. There is no evidence that the three
evaluated power quality indices depend on different variables. Therefore and for
transparency, we apply the same model to all power quality indices.
6. Internationalen Energiewirtschaftstagung an der TU Wien IEWT 2009
Seite 25 von 41
The longitudinal structure of the data implies accounting for firm-specific heterogeneity8
between the subjects. In our case this heterogeneity is likely to be caused by a wide variety
of origins where most of them are unobserved and/or unknown. This is due to the fact, that
the supply areas are very diverse regarding their reliability relevant characteristics. Not only
the topographic and demographic situation but also variables such as different management
philosophies could have an impact on reliability of supply. Because of the restrictive sample
size and the impossibility to treat all origins of heterogeneity separately, we will apply a fixed
effects approach. The fixed effects approach, in contrast to the random effects approach, is
appropriate since one can not assume without doubt that the unobserved heterogeneity is
uncorrelated with the observed explanatory variables. Resuming the last two paragraphs, our
model KGT ,M for the power quality indices is
,= ,,15,4,3,2,1,, KitKiitKitKitKitKKKit uGTPDNUGLQI ++++++ − αβββββ (2)
where ,.GTM is our model specification with the lag of the grid tariffs as explanatory variable
and K is assigned to a specific reliability indicator. i refers to the supply area and t
identifies the year of observation. KQI ., refers to the power quality index K , GL is the
overall grid length, NU is the percentage of network underground, PD refers to the
population density and GT to the grid tariffs. Grid tariffs are included as lagged value since
effects of changing tariffs are expected to become observable earliest in the following year.
iα is the unobserved heterogeneity and u is an error term, assumed to be normally
8 For a discussion of firm-specific heterogeneity in the electricity sector see e.g. Farsi et al. (2006). In
their paper they compare a new parametric panel data model with two other models in measuring
productive efficiency of the electricity distribution sector. While their model deals with several origins of
heterogeneity the specification of the firm-specific component is identical to ours.
6. Internationalen Energiewirtschaftstagung an der TU Wien IEWT 2009
Seite 26 von 41
distributed with mean 0. For the indicators SAIDI and SAIFI we expect a negative sign for all
slope coefficients except for the overall grid length. For the indicator CAIDI hardly any
propositions can be made, since whether CAIDI is decreasing or increasing under improved
reliability of supply depends on whether the improvements have more influence on the
duration or the frequency of outages, as discussed in section 3.1.
Additional to KGT ,M we formulate a second model to examine whether the grid tariffs give
crucial information about the origins of supply interruptions and therefore effect the quality of
supply significantly or not. For reasons of comparability, we choose the nested model KR ,M
which is exactly the same model as KGT ,M , but without the lag of the grid tariffs as
explanatory variable. Thus the nested models KR ,M are
,= ,,4,3,2,1,,'
Kit'
Kiit'
Kit'
Kit'
K'
KKit uPDNUGLQI +++++ αββββ (3)
where ,.RM refers to the reduced model specification without the grid tariffs as explanatory
variable. For the comparison of models KGT ,M and KR ,M the adjusted 2 as well as the
information criteria AIC and BIC are used and can be found in table 1. We expect the same
signs for the coefficients of the restricted model ,.RM as for our model ,.GTM , discussed in the
last paragraph.
4.3 The Econometric Results
6. Internationalen Energiewirtschaftstagung an der TU Wien IEWT 2009
Seite 27 von 41
The econometric analysis shows a statistically significant short-run influence of the grid tariffs
on reliability of electricity supply9. The coefficients of the independent variables in the
equations of the power quality indicators SAIDI, SAIFI and CAIDI are shown in table 1.
Generally it can be stated that a decrease of grid tariffs ceteris paribus leads to an increase
in the duration of supply interruptions in Austria, observable through the duration indices
SAIDI and CAIDI. In contrast, there is no significant influence of the grid tariffs on the
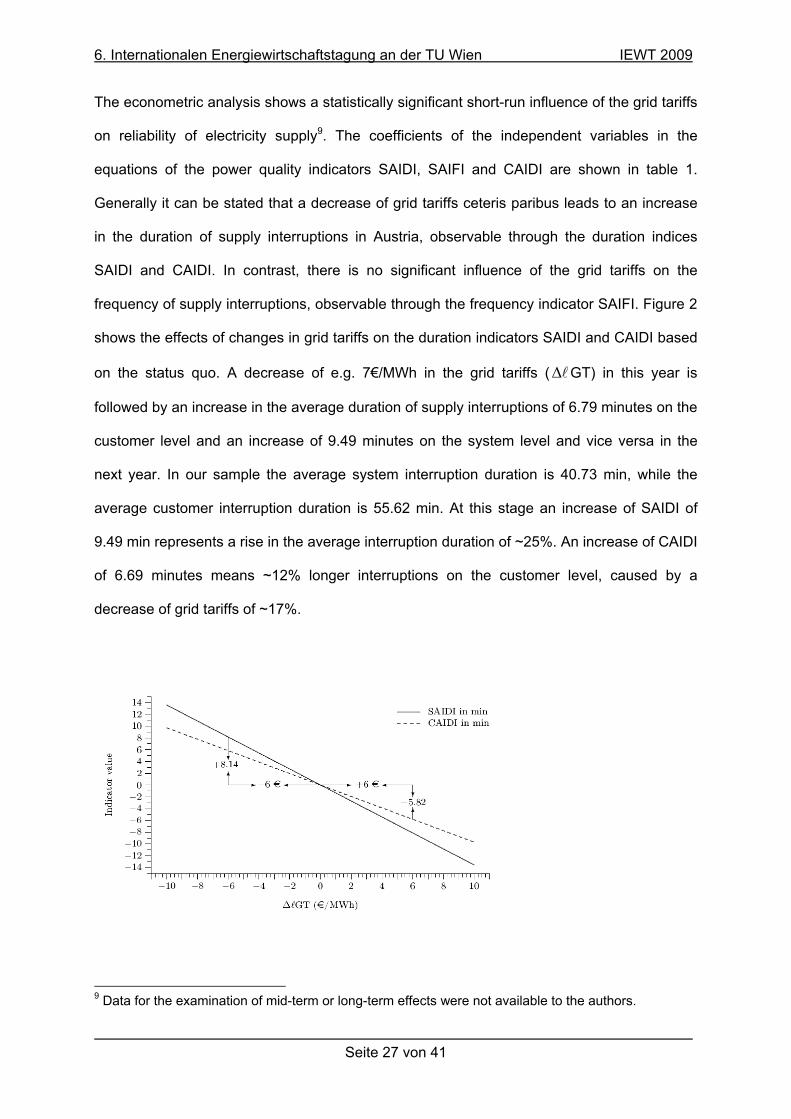
frequency of supply interruptions, observable through the frequency indicator SAIFI. Figure 2
shows the effects of changes in grid tariffs on the duration indicators SAIDI and CAIDI based
on the status quo. A decrease of e.g. 7€/MWh in the grid tariffs ( lΔ GT) in this year is
followed by an increase in the average duration of supply interruptions of 6.79 minutes on the
customer level and an increase of 9.49 minutes on the system level and vice versa in the
next year. In our sample the average system interruption duration is 40.73 min, while the
average customer interruption duration is 55.62 min. At this stage an increase of SAIDI of
9.49 min represents a rise in the average interruption duration of ~25%. An increase of CAIDI
of 6.69 minutes means ~12% longer interruptions on the customer level, caused by a
decrease of grid tariffs of ~17%.
9 Data for the examination of mid-term or long-term effects were not available to the authors.

6. Internationalen Energiewirtschaftstagung an der TU Wien IEWT 2009
Seite 28 von 41
Figure 2: Changes in grid tariffs in the previous year and their influence on the interruption
duration indices in the actual year.
Other important variables for the explanation of the variations of supply interruptions are the
percentage of network underground, the overall grid length as well as the population density.
For all indicators the overall grid length has a positive influence, expressing that the risk of an
outage is rising with the length of the grid. Grid length is measured in 1.000 kilometers; an
extension of the grid of 500 km causes an increase in the indicator SAIDI of one point. The
percentage of network underground is, as expected, most decisive for the robustness against
power outages. A rise of the percentage of network underground of one percentage point is
followed by a decrease in the duration indicators SAIDI and CAIDI of about one point. For the
indicator SAIFI we see that an increase of percentage of network underground of 10
percentage points would be followed by a decrease of the frequency of outages of 0.05.
Under consideration of an indicator value for all of Austria for the year 2005 of 0.81 (E-
Control, 2006), this would lead to the mitigation of about each fifteenth outage10. Also
significant for all indicators (at least at the 10% level) is the influence of the population
density. Interestingly the signs differ between the system indicators SAIDI and SAIFI and the
customer indicator CAIDI. From the definitions of the indicators in section 3.1 an
interpretation can be given. A decrease in SAIDI and SAIFI along with an increase in CAIDI
is observed if a change in an independent variable effects the components of the dependent
variables with respect to the following relation: jjjs ItIL ∑∑ Δ⋅ΔΔ >)(> . First of all, in case
of population density as the independent variable we expect 0>sLΔ , which represents an
increase in the total installed capacity in areas with higher population density. Secondly the
relation jjj ItI ∑∑ Δ⋅Δ >)( holds when a.) the duration of outages jt is increasing or b.) the
10According to the definition of the indicator SAIFI (see section 3.1) this represents only an
approximation.
6. Internationalen Energiewirtschaftstagung an der TU Wien IEWT 2009
Seite 29 von 41
interrupted capacity of short outages jt is decreasing or c.) the frequency of such short
interruptions decreases. Thirdly the relation )(> jjs tIL ⋅ΔΔ ∑ reflects the response of the
total installed capacity and the loss minutes to an increase in population density. This relation
is valid in case of a decreasing frequency or duration of interruptions or an increasing total
installed capacity, where the additional capacity on average faces interruptions < 1 minute.
The last relation js IL ∑ΔΔ > reflects a decreasing interruption frequency or, for the
increased total installed capacity, an average frequency of interruptions < 1, which is valid for
most data points in our sample where the indicator SAIFI has a mean of 0.69 and a standard
deviation of 0.44 (see table 2). Taking into account these analysis we conclude that
population density and the frequency of (at least) short outages are negatively correlated,
which involves a higher relative (not absolute) proportion of longer outages in areas with
higher population density and therefore an increasing population density involves an
increasing CAIDI and a decreasing SAIDI and SAIFI.

6. Internationalen Energiewirtschaftstagung an der TU Wien IEWT 2009
Seite 30 von 41
Table 2: MLE estimates for SAIDI, SAIFI and CAIDI using the specifications of our model
GTM an the reduced model RM with data from 12 of the 13 largest Austrian distribution
system operators for the period 2002-2005.
MGT MR
Parameter SAIDI SAIFI CAIDI SAIDI SAIFI SAIDI
143.231*** 1.028*** 143.087*** 79.606*** 0.901*** 100.950***intercept
(4.99) (3.39) (6.43) (4.90) (5.67) (8.05)
1.681*** 0.027*** 0.411*** 1.139*** 0.026*** 0.132*** GL
(3.73) (5.62) -1.201 (3.06) (5.86) (0.39)
-0.912*** 0.006*** -0.962*** -0.771*** -0.006***
-0.892*** NU
(-4.69) (-2.96) (-6.31) (-3.75) (-2.94) (-5.58)
-6.81* -0.191*** 18.305*** -3.869 -0.184 20.709*** PD
(-1.73) (-4.75) (6.06) (-0.97) (-4.77) (7.00)
-1.356** -0.003 -0.970** GT
(-2.42) (-0.47) (-2.19)
N 43 43 43 43 43 43
R2 0.6018 0.6779 0.6193 0.5797 0.67925 0.6048
¯R2 0.5480 0.6345 0.5678 0.5355 0.6455 0.5632
AICα 376.420 36.173 357.094 381.957 27.917 361.566
BICα 382.970 42.724 363.644 388.612 34.571 368.220
*/**/*** significant at the 10%/5%/1% confidence level
αmodel with smaller values of Akaike (1973) and Bayes (Geweke and Meese, 1981)
Information Criterion is supposed to fit the data better than the compared model; t-Statistic in
parenthesis
Table 2 shows that a decrease of the grid tariffs in year 1−t ( lGT) has a significant and
negative influence on SAIDI and CAIDI in year t , which indicates rising supply interruption
6. Internationalen Energiewirtschaftstagung an der TU Wien IEWT 2009
Seite 31 von 41
durations in case of decreasing grid tariffs. There is no statistically significant influence of the
lag of grid tariffs on SAIFI, but nevertheless the lag of grid tariffs has the expected negative
sign. Our interpretation of this result is that on the short term grid tariffs do not effect the
frequency of supply interruptions, but may well influence the duration of the interruptions.
This interpretation is supported by the fact that the origins of supply interruptions in Austria
are in the majority of cases natural phenomena. Protection from these kind of origins can
mainly be achieved by an increase of the percentage of network underground which can
never be a short-run measure due to time constraints in planning, financing and construction.
Measures to achieve a shortening of the durations of interruptions can in contrast be
implemented in the short-run. Economic literature on measures for the reduction of
interruption durations was not found by the authors, but interviews with DSOs and technical
experts revealed that the duration of interruptions is partially determined by the budget spend
for maintenance by the distribution system operators. For the engineering aspects on this
topic see e.g. Grigsby (2001; 2007), Fritz and Riechmann (2002).
The financial situation for the maintenance units may determine the replacement rate of
resigned or retired personal and influence the stock of spare parts, resulting in delayed
reparation and maintenance durations. The financial situation can, in contrast to structural
measures on the grid itself, shift in the short run and show effects (positive or negative)
within the observed period of one year.
Table 2 also shows the coefficients of the nested models KR ,M . All coefficients of the
remaining variables have the same sign as in KGT ,M and have the same levels of
significance except for the variable PD (population density). A comparison between the
models with the grid tariffs as explanatory variable and the nested models based on the 2
and the information criteria AIC and BIC shows superiority of our model formulation for the
duration indicators SAIDI and CAIDI and therefore goes along with our interpretation of the

6. Internationalen Energiewirtschaftstagung an der TU Wien IEWT 2009
Seite 32 von 41
non-significance of the lag of the grid tariffs as explanatory variable for the frequency
indicator SAIFI.

6. Internationalen Energiewirtschaftstagung an der TU Wien IEWT 2009
Seite 33 von 41
Table 3: Properties of the coefficients of the lag of the grid tariffs under the restricted data
sets.
dependent variable
ID of excluded
Utility SAIDI SAIFI CAIDI
P-valueα signα P-
valueα signα P-valueα
signα
1 0.039 - 0.513 - 0.030 -
2 0.150 - 0.844 + 0.098 -
3 0.160 - 0.843 + 0.160 -
4 0.020 - 0.620 - 0.058 -
5 0.010 - 0.085 - 0.027 -
6 0.000 - 0.325 - 0.001 -
7 0.059 - 0.550 - 0.099 -
8 0.070 - 0.980 + 0.023 -
9 0.029 - 0.739 - 0.036 -
10 0.046 - 0.882 + 0.056 -
11 0.026 - 0.325 - 0.042 -
12 0.042 - 0.702 - 0.028 -
α P-values and signs of the coefficients of the lag of the grid tariffs
To examine the stability of our findings we repeated the estimation procedure for models
KGT ,M twelve times, but each time with the sample reduced by one utility. For all 36
estimations we monitor the behavior of the coefficient of the lag of the grid tariffs. Table 3
reports the P-value and the sign for all 36 estimated coefficients. For the duration indicators
SAIDI and CAIDI all signs of the coefficients of the grid tariffs are the same as for the full
sample estimators in table 2. For SAIDI four of the twelve coefficients are not significant on

6. Internationalen Energiewirtschaftstagung an der TU Wien IEWT 2009
Seite 34 von 41
the 5% level, while two coefficients are not significant on the 10% level. For the indicator
CAIDI five coefficients are not significant on the 5% level, while only one coefficient is not
significant on the 10% level. When estimating the indicator SAIFI, all coefficients of the grid
tariffs show the expected non-significance at the 5% level and only after the exclusion of the
utility with ID-number 5 this coefficient becomes significant at the 10% level. From this we
conclude that our empirical findings (that there is a short term correlation between the grid
tariffs and the duration of supply interruptions and no such correlation between the grid tariffs
and the frequency of supply interruptions) are stable for all indicators.
6. Internationalen Energiewirtschaftstagung an der TU Wien IEWT 2009
Seite 35 von 41
5 Conclusion
The liberalisation of the European energy market was interconnected with declines of
electricity grid tariffs by the regulating authorities, leading to lower energy costs for end-
consumers. This paper shows that the focus on cost reductions comes to short for finding an
optimal structure for the energy market, reliability of supply has to be considered as well, as it
considerably influences the quality of the energy market. The results of the empirical analysis
show that an increased pressure on the Austrian DSOs in the form of commanded reductions
of grid tariffs lead to a deterioration of reliability of supply if no incentives for improving or
maintaining service reliability are provided. The correlation between grid tariffs and electricity
supply interruptions is statistically significant so that we conclude that decreasing tariffs in
this regulatory regime harm the reliability of supply even in the short run. Emanating from the
actual levels of grid tariffs and power quality indicators we find that a decrease of the grid
tariffs of 10% in this year leads to an increase of the interruption duration of 15% on the
system level and an increase of the interruption duration of 7% on the customer level in the
next year.
In Austria, the regulator has only now realised the importance of the incorporation of quality
indicators and benchmarks as essential part of the regulatory framework. The first
implementation phase of a new incentive regulation regime in Austria started in January
2006 (which is after the observation period of this article) and will end in December 2009.
Within this first phase, the regulator announced that for incorporating quality regulation within
this new regulation regime he will define certain standards for reliability of supply and
develop a bonus-malus system for utilities that either comply with these standards or violate
them. The bonus-malus system will enter into force in the second regulation period beginning
in the year 2010. Until then, utilities can voluntarily publish data on their reliability of supply.
The regulator has compiled a standardised paper that can be used for that purpose. Within
the second regulation period the individual standards of utilities will be published by the
6. Internationalen Energiewirtschaftstagung an der TU Wien IEWT 2009
Seite 36 von 41
regulator. At the moment, details of the bonus-malus system are not available as they still
are under discussion. Also there is no agreement on the carry-over mechanism yet, but
utilities have already demanded that at least 50% of their efficiency gains achieved between
2006 and 2009 shall remain with the utilities in the second regulation phase.
From the previous sections the authors conclude that a comprehensive regulation regime
needs to provide incentives not only for improving efficiency but also for sufficient investment
in grid capacity and maintenance. Besides monetary incentives the regulatory framework
should be able to guarantee planning reliability for the utilities in the sense that transparency
and consistency of the incentive regime allow the development and implementation of
foresighted strategies to integrate operational objectives and quality of service.
References
Akaike, H., 1973., Information theory and an extension of the maximum likelihood principle,
in Petrov, B. N., Csaki F., (Eds), The second international symposium on information theory,
Akad´emiai Kaido, Budapest.
Averch, H., Johnson, L.L., 1962. Behavior of the firm under regulatory constrain. American
Economic Review, 52 (5), 1052-1069.
Beenstock, M., Goldin, E., Haitovsky, Y., 1998. Response bias in a conjoint analysis of
power outages. Energy Economics, 20 (2), 135-156.
Carlsson, F., Martinsson, P., 2007. Willingness to pay among swedish households to avoid
power autages – a random parameter tobit model approach. Energy Journal, 29 (1), 75-89.

6. Internationalen Energiewirtschaftstagung an der TU Wien IEWT 2009
Seite 37 von 41
Carlsson, F., Martinsson P., 2008. Does it matter when a power outage occurs? – a choice
experiment study on willingness to pay to avoid power outages. Energy Economics 30 (3),
1232-1245.
E-Control, 2006. Ausfalls- und Störungsstatistik für Österreich - Ergebnisse 2005. Technical
report, E-Control GmbH, Source (08.07.2008): http://www.e-
control.at/portal/page/portal/econtrol_home/strom/zahlendatenfakten/netz_und_kw/netz/
European Commission, 2003. Directive 2003/54/EC of the European Parliament and of the
Council. Official Journal of the European Union, L 176, 37-56.
European Commission, 2006a. Priority interconnection plan. Communications from the
Commission to the Council and the European Parliament, SEC (2006) 1715.
European Commission, 2006b. Prospects for the internal gas and electricity market.
Communications from the Commission to the Council and the European Parliament, SEC
(2006) 1709.
European Parliament and the Council, 1997. Directive 96/92/EC of the European Parliament
and of the Council of 19 december 1996 concerning common rules for the internal market in
electricity. Official Journal of the European Union, L 027, 20-29.

6. Internationalen Energiewirtschaftstagung an der TU Wien IEWT 2009
Seite 38 von 41
Farsi, M., Filippini M., Greene W., 2006. Application of panel data models in benchmarking
analysis of the electricity sector. Annals of Public and Cooperative Economics, 77 (3), 271-
290.
Fritz, W., Riechmann, C., 2002. Strategische Netzplanung - Rentabilitätsbewertung von
Netzinvestitionen durch Simulationsmodelle. Energiewirtschaftliche Tagesfragen, 52 (1), 70-
73.
Geweke, J., Meese R., 1982. Estimating regression models of finite but unknown order.
International Economic Review, 22 (1), 55-70.
Giannakis, D., Jamasb T., Pollitt M., 2005. Benchmarking and incentive regulation of quality
of service: An application to the UK electricity distribution networks. Energy Policy, 33 (17),
2256-2271.
Grigsby, L., (Ed), 2001. The Electric Power Engineering Handbook. The electrical
engineering handbook series, CRC Press LLC, Boca Raton.
Grigsby, L., (Ed), 2007. Power System Stability and Control. Electric Power Engineering
Handbook, second ed., CRC Press LLC, Boca Raton.
Haber, A., Rodgarika-Dara, A., 2005. Qualitätsregulierung – Theorie und internationale
Erfahrungen. E-Control, Working Paper No. 16.
6. Internationalen Energiewirtschaftstagung an der TU Wien IEWT 2009
Seite 39 von 41
Haberfellner, M., 2002. Liberalisierung und Regulierung des österreichischen Strommarktes.
E-Control, Working Paper No. 1.
Hauer, A., Oberndorfer; K., 2007. ElWOG – Elektrizitätswirtschafts- und –
organisationsgesetz – Kommentar. proLibris.at, Linz.
Jamasb, T., Pollitt. M., 2005. Electricity market reform in the European Union – review of
progress toward liberalization & integration. Massachusetts Institute of Technology, Center
for Energy and Environmental Policy Research, Working Papers No. 0503.
Jamasb, T., Pollit, M., 2007. Incentive regulation of electricity distribution networks: Lessons
of experience from Britain. Energy Policy, 35 (12), 6163-6187.
Joskow, P.L. (forthcoming), Incentive Regulation in Theory and Practice: Electricity
Distribution and Transmission Networks. in: Rose, N.L. (Ed), Economic Regulation and Its
Reform; What Have We Learned?, The University of Chicago Press, Chicago.
Kratena, K., 2004. Makroökonomische Evaluierung der Liberalisierung im österreichischen
Energiemarkt. Österreichisches Institut für Wirtschaftsforschung, Working Paper.
Layton, D.F., Moeltner, K., 2004. The Cost of Power Outages to Heterogenous Households –
An Application of the Mixed Gamma-Lognormal Distribution. in: Scarpa, R., Alberini, A.A.,
(Eds), Applications of Simulation Methods in Environmental and Ressource Economics,
Kluwer Academic Press, New York.
6. Internationalen Energiewirtschaftstagung an der TU Wien IEWT 2009
Seite 40 von 41
Moeltner, K., Layton D.F., 2002. A censored random coefficients model for pooled survey
data with application to the stimation of power outage costs. The Review of Economic and
Statistics, 84 (3), 552-561.
Reichl, J., Kollmann, A., Schneider, F., Tichler, R., 2007. Umsorgte Versorgungsicherheit:
Eine empirische Analyse für den Strommarkt in (Ober-) Österreich, Trauner Verlag, Linz.
Sappington, D.E.M., 2003. The effects of incentive regulation on retail telephone service
quality in the United States. Review of Network Economics, 2 (4), 355-375.
Ter-Martirosyan, A., 2003. The effcts of incentive regulation on quality of service in electricity
markets. George Washington University, Department of Economics, Working Paper.
Uri, N.D., 2003. The impact of incentive regulation on service quality in telecommunications
in the United States. Journal of Media Economics, 38 (3), 265-280.
VEÖ, 2004. VEÖ Tätigkeitsbericht 2004, Source (08.07.2008): http://www.veoe.at/532.html
Waddams Price, C., Brigham, B., Fitzgerald, L., 2003. Service quality in regulated
monopolies. University of East Anglia, Centre for Competition and Regulation, Working
Paper CCR 02-4.
6. Internationalen Energiewirtschaftstagung an der TU Wien IEWT 2009
Seite 41 von 41
Yu, W., Jamasb, T., Pollitt, M., 2007. Incorporating the price of quality in efficiency analysis:
the case of electricity distribution regulation in the UK. University of Cambridge, Faculty of
Economics, Working Paper CWP 0736.