Final Report - ERA Portal Austria
344
30 November 2010 Final Report Evaluation of Austrian Support Structures for FP 7 & Eureka and Impact Analysis of EU Research Initiatives on the Austrian Research & Innovation System Authors in alphabetical order: Erik Arnold Patries Boekholt Barbara Good Alfred Radauer James Stroyan Brigitte Tiefenthaler Niki Vermeulen www.technopolis-group.com
-
Upload
khangminh22 -
Category
Documents
-
view
2 -
download
0
Transcript of Final Report - ERA Portal Austria

30 November 2010
Final Report
Evaluation of Austrian Support Structures for FP 7 & Eureka and
Impact Analysis of EU Research Initiatives on the Austrian
Research & Innovation System
Authors in alphabetical order:
Erik Arnold Patries Boekholt Barbara Good Alfred Radauer James Stroyan Brigitte Tiefenthaler Niki Vermeulen
www.technopolis-group.com


Final Report i
Table of Contents Executive summary v
Deutsche Zusammenfassung xi
1. Methodology 3
2. Analysis of impacts of European RTDI initiatives on the Austrian RTDI system 9
2.1 Major European RTDI initiatives 9
2.1.1 Introduction 9
2.1.2 Analysis of developments in the European Framework Programmes 9
2.1.3 The Seventh Framework Programme 10
2.1.3.1 Cooperation Programme 11
2.1.3.2 Ideas Programme 14
2.1.3.3 People Programme 15
2.1.3.4 FP intervention logics 21
2.1.4 European Regional Development Fund 22
2.1.5 Competitiveness and Innovation Framework Programme (CIP) 23
2.1.6 EUREKA 24
2.1.6.1 EUREKA individual R&D projects 24
2.1.6.2 EUREKA Umbrellas 24
2.1.6.3 EUREKA Clusters 25
2.1.6.4 Eurostars 25
2.1.6.5 EUREKA intervention logics 27
2.1.7 COST 27
2.1.8 European Science Foundation 27
2.1.8.1 EUROCORES 28
2.1.8.2 Research Networking Programmes 28
2.1.9 ERA Initiatives 29
2.1.9.1 Joint Programming 29
2.1.9.2 Research Infrastructures 30
2.1.9.3 Knowledge Sharing (IP Management) 30
2.1.9.4 Researchers‟ Partnership 30
2.1.9.5 International Science and Technology Cooperation 30
2.1.10 Conclusions 31
2.2 Austrian and European RTDI initiatives – a success story? 33
2.2.1 Motives and barriers for participating in major European RTDI initiatives 33

ii Final Report
2.2.1.1 Relevance of different funding schemes for the sampled Austrian researchers 33
2.2.1.2 Motives for participating in the Framework Programme 36
2.2.1.3 Barriers to FP participation 41
2.2.1.4 Motives for participation in EUREKA 46
2.2.1.5 Barriers to participation in EUREKA 49
2.2.1.6 Conclusions 50
2.2.2 Take-up of European initiatives by Austrian actors in the RTDI system 52
2.2.2.1 Austrian participation in FP6 and FP7 52
2.2.2.2 Austrian participation in EUREKA and other European initiatives 71
2.2.3 Impacts of European RTDI initiatives at actor level 75
2.2.3.1 Outputs of the Framework Programmes 75
2.2.3.2 Impact of the Framework Programmes 81
2.2.3.3 Institutional case studies: using the FP to internationalise 91
2.2.3.4 Impacts of EUREKA 95
2.2.3.5 Impact of the Framework Programme and other European initiatives on strategy 98
2.2.4 On impacts of European RTDI schemes at system and programming level in Austria 105
2.2.5 On possible synergies between the ERDF, CIP and FP7 funding schemes 108
2.2.5.1 Overview 108
2.2.5.2 Slide-in: The ERDF funds and RTDI in Austria 109
2.2.5.3 ERDF, FP and CIP – a modular system for funding and supporting RTDI? 115
2.2.5.4 Conclusions 123
2.2.6 Impacts on selected science & technology fields and industries 125
2.2.6.1 Automotive 125
2.2.6.2 Information and Communication Technologies (ICT) 130
2.2.6.3 Life sciences 134
2.2.6.4 SSH: Socio-economic sciences, humanities, the FP and Austrian R&D policy 137
3. Evaluation of the Austrian support structures for FP7 and EUREKA, with particular
focus on FFG-EIP 143
3.1 The system of support structures for FP7 and EUREKA in Austria 143
3.1.1 Organisational set-up and work division 143
3.1.2 Assessment of the interaction within the Austrian Support Structures and with major policy stakeholders 148
3.2 The demand side – need for support with European RTDI initiatives in general, and FP7 and EUREKA in particular 154

Final Report iii
3.2.1 Support needs 154
3.2.2 Usage of different types of service providers 161
3.3 The supply side – a closer look at FFG–EIP 167
3.3.1 Main features and characteristics of FFG-EIP 167
3.3.1.1 Tasks, governance and funding 167
3.3.1.2 Organisation and staff 170
3.3.1.3 Mission, objective, activities – a Logic Chart of FFG-EIP 171
3.3.2 Analysis of selected FFG-EIP services 182
3.3.2.1 Awareness raising: Publications, mailings and newsletters 182
3.3.2.2 Events: from awareness raising to group consulting 184
3.3.2.3 Consultancy and advice services 187
3.3.2.4 Proposal check 197
3.3.2.5 Proposal grant 202
3.3.2.6 Target group specific activities 210
3.3.2.7 EU Initiatives: NCP projects and beyond 212
3.3.2.8 The EUREKA Office 215
3.3.2.9 Beyond „core‟ FP and EUREKA: The role of FFG-EIP for new instruments and ERA initiatives 218
3.3.2.10 FFG-EIP as a learning organisation and part of FFG 224
3.4 The international experience – support structures for FP7 and other European initiatives outside of Austria 227
3.4.1.1 Switzerland 227
3.4.1.2 Sweden 231
3.4.1.3 Ireland 233
3.4.1.4 Finland 238
3.4.1.5 The Netherlands 241
3.4.1.6 Lessons learned 245
3.5 Overall view on FFG-EIP 247
3.6 Conclusions on FFG-EIP 249
4. Conclusions and recommendations 252
4.1 The European Context 252
4.2 Learning to Play at the European Level 254
4.3 The Austrian Support Structure 255
4.4 Recommendations 256
5. Sources used 259
Appendix A - Survey specifics: Response rates for surveys conducted and usage of
INNOMAN data 265
Appendix B - Austrian participation data for FP6 and FP7 268

iv Final Report

Final Report v
Main results
Executive summary
Study aims
A consortium of Austrian Ministries and the Austrian Chamber of Commerce, led by the Austrian Federal Ministry of Science and Research (BMWF), commissioned Technopolis to perform an impact analysis of EU research initiatives on the Austrian research and innovation system as well as an evaluation of the Austrian support structures for the 7th European Framework Programme (FP7) and EUREKA. The first part of the study identifies the effects of European research initiatives on the Austrian research and innovation system, while the second part of the evaluation is related to the support delivered to Austrian R&D performers by the Department for European and International Programmes (EIP) of the Austrian Research Promotion Agency (FFG) from 2007 to date.
The study aims to produce recommendations about improving the quality and relevance of the activities of FFG-EIP (and the Austrian support system as a whole) and how to influence future EU initiatives for RTDI. It is also intended to provide input into the development of the Austrian position in pending revisions to European RTDI initiatives, in particular the transition from FP7 to FP8.
Methodology
We employed a mixture of quantitative and qualitative methods to address the evaluation questions. In particular, we used:
Document and literature analysis. Documents studied were mainly about the services and activities of EIP (e.g. annual reports) or about the experiences in other countries with European RTDI initiatives (e.g. evaluation and impact assessment studies).
Logic diagrams and logical framework analysis. We established a thorough understanding of EIP, its mission and objectives, the instruments used, the activities performed and their outputs and outcomes in a 1.5 day workshop with senior staff from FFG-EIP. We also did logical framework analysis for the FP and EUREKA.
Five group interviews with staff from various FFG-EIP units and levels within the hierarchy.
Individual semi-structured interviews (face-to-face or by telephone) with a variety of stakeholders including representatives from ministries, FFG (excluding EIP), regional and university support structures and FP/EUREKA participants.
Eight focus groups with specific user groups of FFG-EIP and European RTDI initiatives, in particular the FP and EUREKA.
Two standardised surveys. The first was an online survey addressed to users of FFG-EIP and to FP/EUREKA participants. The second was an online survey of a control group consisting of actors actively conducting R&D and predominately using national funding schemes, which we treated as being representative of potential users of European RTDI initiatives.
Secondary data analysis, especially of participation data for the European RTDI initiatives, analysing the pattern of Austrian participation and comparing it with that of others.

vi Final Report
Case studies of R&D performing organisations (universities, non-university research institutions, universities of applied science), of selected science and technology fields (ICT, life science, automotive, and social sciences and humanities (SSH)) as well as support structures in other European countries (Finland, Ireland, Netherlands, Sweden, Switzerland).
The use of a range of data collection and analysis tools allowed us to compare the results we obtained from different sources, thus improving the validity and robustness of the study results.
Impacts of the Framework Programme
Austria does well in terms of FP participation. The rate of return for FP6 was 130%. In FP7, so far participation rates are particularly high in seven areas: Coherent Development of Research Policies, Activities of International Cooperation, ICT, SSH, Science in Society, Security and Space. High participation rates can be due to two reasons: an above average number of applications, increasing the probability of success, or particularly successful applications. In the first five areas listed, participation rates are above average as Austrian researchers submit an above average number of applications. In contrast, high participation rates in Security and Space are driven by high success rates. Conversely, the low number of applications drives the relatively low level of involvement in the European Research Council (ERC) – despite the fact that Austrian success rates in ERC competitions were significantly above average.
Researchers generally consider national programmes, such as the FFG General Programmes, FWF support or fiscal support, more relevant to their needs than European programmes. Of the European programmes collaborative FP projects were considered the most relevant. The newer FP instruments such as JTIs and ERA-NETs barely figure on the agendas of even the most experienced FP participants.
Researchers participate in the FP primarily to get research funding. The FP is very complex, with high administrative barriers and low success rates. However, if researchers want to obtain public funding for international research projects there are few alternatives. Further, the FP is by far the most important programme that funds international cooperative research.
Participants consider follow-up projects the most important result of FP projects, though these need not necessarily be FP projects or even be tied to a funding programme. They consider research outputs more important than innovation outputs. This is because the FP is a pre-competitive programme in which universities and research institutes are the major players. The most important impact of the FP are new and improved relationships, R&D collaborations, and the building and maintaining of research partnerships. Other important impacts are enhanced reputation, increased scientific and technological capabilities and the capacity to conduct R&D. Radical innovations are not an important impact of FP projects. In fact, most participants felt that the FP could not systematically produce radical innovations due to programme design and the selection procedure employed.
International research collaboration has become an everyday occurrence. The control group shows that a substantial amount of international R&D cooperation takes place outside international R&D programmes, mainly funded from own sources. However, the FP remains the most significant public funding source for this type of activity. Researchers participate because it suits the needs of themselves or their organisation– not for idealistic reasons. We have also observed a professionalisation of users, resulting in altered demand for EIP services.
Industry experiences more commercial impacts from FP projects, while universities report higher impacts in scientific and human resource orientated areas, emphasising the importance of the FP for training and developing young researchers in Austria. It is important to note that training of young researchers not only occurs in the human

Final Report vii
resources oriented measures (People Programme and ERC Starting Grant) but also in the „traditional‟ cooperative FP projects.
Almost two thirds of Austrian FP users reported that the benefits of participation outweighed the costs. Interestingly, researchers from different types of organisations (universities, institutes, companies) gauged the costs and benefits in similar ways. This is also true for SMEs, suggesting that Austrian SMEs know how to position themselves in the FP.
The FP is highly competitive so only the strong can participate successfully. This strength is typically built in national programmes, testifying to the complementarity of national and European projects. However, the degree of complementarity varies among fields. For example in Austria, in ICT and automotive there are close thematic links, while there are few, if any national programmes in the Social Sciences and Humanities so many researchers from these fields use the FP instead.
Three quarters of Austrian research organisations have a strategy or set of principles for using national and regional programmes, while two thirds have one for using the FPs. Percentages are much lower for other European schemes or EUREKA, suggesting that strategy is a function of the visibility of R&D funding, i.e. of programme size and funding available. Firm strategies tend to be uniform across the whole organisation, while universities tend to have different strategies at different levels, due to different thematic strategies at institute or department levels and academic freedom.
Impacts of EUREKA
83% of EUREKA participants also participated in FP6 or FP7 indicating that the target groups of the two programmes overlap, although EUREKA is more market-orientated than the FP. With less than 50 projects per year, Austrian take-up of EUREKA is smaller by orders of magnitude compared to the FP. EUREKA is reported to be less administratively cumbersome than the FP, especially if comparing EUREKA Clusters with FP7‟s Joint Technology Initiatives. However, EUREKA suffers from synchronisation problems – both at national level when participants try to obtain national funding for a EUREKA project and at international level where the proportion of cost covered by grants vary.
The most important impact of EUREKA is new and improved relationships and collaborations. This is also the most important motive for participating. Other important impacts are increased technological and scientific capabilities and know-how. As would be expected from a more market-orientated programme, participants generally report greater commercial impacts in EUREKA than in the FP.
Enhanced reputation is another impact. It is worth while taking a closer look at the issue of reputation as EUREKA (with the exception of Eurostars) awards no financing but a “prestigious label”. However, both interviewees and the control group suggest that EUREKA does not enhance participants‟ reputation and image compared to autonomous international R&D cooperation. In fact, comparison with the control group suggests that the EUREKA programmes do not produce any additional impacts compared to autonomous international R&D cooperation, implying that its additionality may be limited. Nonetheless, the cost benefit ratio for EUREKA is positive, with more than half of participants saying that the benefits of participating in EUREKA outweigh the costs.
Compared with the Framework, the impacts of EUREKA in Austria seem lacklustre. The programme itself lacks strategy and a clear brand. It is often not clear what the added value of the EUREKA label is compared to autonomous R&D projects. Another issue is that EUREKA (except Eurostars) does not fund research. There is no standard procedure at national level for EUREKA participants to obtain funding and the programme appears to fit poorly with Austrian national funding patterns. In the light of these factors, Austria should take a position on either reducing commitment to the programme or on increasing efforts in EUREKA, especially by giving a valid answer to

viii Final Report
what the value added by EUREKA is, and by providing administrative arrangements that better fit with EUREKA needs.
Evaluation of Austrian support structures
In general, FFG-EIP‟s performance is excellent, shown by very high customer satisfaction. FFG-EIP has committed highly motivated staff and systematically extends and improves services. It enjoys a high level of resources. However, as in the provision of free health care, EIP‟s provision of free advice services tends to ensure that demand is high, irrespective of the degree of value being provided to the beneficiary.
EIP‟s mission – a high, successful and sustainable participation of Austrian organisations in European and international programmes – has not changed over the years but EIP has extended its range of services and activities, adapting them to new needs and circumstances. Two such new services are “strategy talks” and the FFG Academy. EIP conducts strategy talks with leading Austrian firms, universities and research organisations to explore their strategy and potential to increase participation in the FP (and other European programmes). This is useful because the talks address organisations rather than individual researchers, helping them to professionalise their strategic planning. Also, the strategy talks counteract the Austrian tendency in research promotion to focus on programmes and projects and to neglect institutions. The FFG Academy offers courses that provide standard information to groups of people rather than to individuals, realising efficiency gains in comparison to offering individual advice.
Based on its contracts, EIP‟s focus is on the FP – in particular the collaborative projects – and on EUREKA. However, for the future we expect the FP instruments currently more at the margin – JTIs or ERA-NETs – and the instruments currently emerging – Joint Programming – to gain in importance. Both EIP and the contracts will have to change to accommodate this.
EIP‟s role as the central node in the regional network of publicly funded support providers (RKS) has become well established. The division of labour is working well. The next step towards a coherent Austrian support structure with the flexibility to adjust to changing international cooperation opportunities is to integrate EIP and the RKS as one network of players with a joint strategy.
Many of EIP‟s activities should be continued, especially general information services (events, mailings, information material) as well as the new instruments strategy talks and FFG Academy. EIP is also using the right strategies and instruments to identify „untapped potential‟. Indeed, we do not think there is much untapped potential left in Austria. EIP‟s activities for identifying new R&D performers (e.g. young researchers, new firms) are appropriate to cope with changes over time. We have identified some room for improvement of specific services, such as partner searches, international activities and NCP projects.
Just like the services related to the FP the services offered by the EUREKA Office - a small, separate unit in FFG-EIP - are generally excellent. However, there is some indication that signposting clients to other FFG departments to obtain funding for EUREKA projects could be improved. To this end, cooperation across FFG departments should be enhanced.
Furthermore, both the proposal grant for science and the proposal grant for industry, exhibit remarkably high levels of free riding. They should be discontinued. However, we have also identified a minority of actors – in particular non-university research institutions – who lack the organisational slack or internal resources to prepare FP proposals and for whom the proposal grant does have additionality. The structural problems of these institutions need to be tackled directly by the ministries in charge, not through proposal subsidy.
Finally, there is evidence that EIP services discourage universities from the development of fully rounded research management capabilities. Hence, a priority for

Final Report ix
universities and EIP will be to agree to a re-division of labour. At the same time, EIP should increase activities that support the further professionalisation of research performing institutions, especially the universities, and their research management capabilities. We expect the professionalisation of research management services of universities and research organisations to free EIP resources for a re-focusing of activities, particularly on the provision of „strategic intelligence‟ and inducing learning by focusing services on newcomers and first-time participants in international R&D initiatives. „Strategic intelligence‟ is intelligence that gives orientation and informs strategy: understanding the changes in the FP and understanding the unwritten rule of international cooperation. However, provision of strategic intelligence is not limited to beneficiaries. There are strong indications that the experience gathered and the observations made by FFG-EIP‟s staff could be tapped into more systematically and they could serve as a valuable source of information for programme delegates and other officials in the ministries. Therefore, EIP should take on a leading role in understanding and analysing the changing opportunities in R&D cooperation at European and global level. EIP is uniquely placed as a provider of strategic intelligence, as it is in touch with both the research community and the European Commission.
Recommendations
Our recommendations do not only take our empirical findings from our field work into account.
They are based on current theoretical thinking about the rationales for state intervention. The state should not subsidise activities that actors would undertake anyway or that actors are able to do by themselves. It should rather aim to create added value („additionality‟) and induce learning in actors („behavioural additionality‟).
They accommodate the on-going developments at EU level. In particular, we expect the currently more peripheral new instruments to become more important in FP8.
They take into account the key targets of Austrian RTDI policy, in particular the University Law of 2002 with its main goal: re-inventing the universities as strong, autonomous institutions.
Overall, this has created a set of recommendations which, to a large part, aim at strengthening institutions and inducing sustainable learning effects in the system.
Our analysis implies the need for three significant changes in strategic direction for Austrian research and innovation policy
Rejecting the idea of FP participation as a goal in itself and therefore abandoning the goal of maximising participation
Mainstreaming internationalisation in research and innovation policy and re-conceiving it as „globalisation‟ rather than just „Europeanisation‟
Unlocking and adapting the internationalisation support apparatus to focus on promoting behavioural additionality: that is, learning how to understand and participate in new international activities, rather than subsidising the continued performance of activities that have (or should have) been learnt or that should be taken over by other actors. EIP‟s original mission of teaching the Austrian research community how to participate in the FP and EUREKA is now largely accomplished.
At the ministerial level, Austrian research and innovation policy needs a single focal point for overall coordination („Gesamtkoordinationsstelle‟) in (and for all) the ministries that

x Final Report
Analyses, understands, coordinates and communicates national needs for international cooperation, both at European and at global levels
Communicates Austrian national needs and positions to EU policy
Encourages the mainstreaming of internationalisation
Explains European and global dimensions of research and innovation policy, threats and opportunities to Austria, thus taking on more of an agenda-setting role
Acts as a „principal‟ or „intelligent customer‟ for the work of the support system, for internationalisation.
EIP needs a new strategy that gives it a greater role in understanding and analysing the changing opportunities in R&D cooperation at the European and global levels and using this information to support policymaking as well as the research and innovation communities. It should negotiate a relationship with the universities where it withdraws from routine service provision and becomes a „wholesaler‟ of strategic intelligence (and to other customers, notably industry) and focuses on beneficiaries where it can induce behavioural additionality, i.e. on organisations and individuals that need to learn. Both proposal grant schemes should be stopped but at the same time the structural problems of the minority of institutions from whom the proposal grant is essential need to be tackled directly by the ministries in charge.
EIP is staffed at a level consistent with its original task, which is now largely accomplished. The amount of resource EIP receives should be reviewed in light of the new strategy and activities. The RKS regional contact points should be functionally integrated into EIP. Last but not least, EIP should focus on tasks and knowledge that are generic to internationalisation. Thematic internationalisation should be mainstreamed into other relevant parts of the research and innovation funding system, whether these are inside or outside FFG.
EIP should itself play a central role in developing its strategy, making this an „offer‟ to its sponsoring ministries. To make this possible, the current contracting arrangement between FFG-EIP and its principals should be treated as a rolling framework with annual renegotiations about activities within an agreed and more or less fixed financial envelope. That will help ensure that EIP continually „rolls over‟ from tasks that have essentially been completed and customer segments where necessary learning has been achieved to tackle new and emerging support needs.

Final Report xi
Zentrale Ergebnisse
Deutsche Zusammenfassung
Zielsetzungen der Studie
Die vorliegende Studie wurde im Auftrag des Bundesministeriums für Wissenschaft und Forschung (BMWF) und einer Reihe weiterer Ministerien sowie der öster-reichischen Wirtschaftskammer vom Forschungs- und Beratungsbüro Technopolis durchgeführt. Die Studie analysiert einerseits die Wirkungen von europäischen Forschungsinitiativen auf das österreichische Forschungs-, Technologie- und Innovationssystem und evaluiert anderseits die österreichischen Betreuungs-strukturen für das 7. Europäische Forschungsrahmenprogramm (7. RP) und EUREKA. Die Evaluation der Betreuungsstrukturen bezieht sich dabei primär auf den Bereich Europäische und Internationale Programme (EIP) in der österreichischen Forschungsförderungsagentur (FFG).
Ziel der Studie war es, Empfehlungen zur Verbesserung der Qualität und Relevanz der Dienstleistungen des EIP (sowie der gesamten österreichischen Betreuungsstruktur) sowie zur Einflussnahme auf zukünftige europäische Forschungsinitiativen aufzu-stellen. Die Studie sollte auch Input liefern für die Entwicklung einer österreichischen Position zu anstehenden Änderungen im europäischen Forschungsraum, insbesondere zum Übergang vom 7. RP zum 8. RP.
Methodisches Vorgehen
Zur adäquaten Beantwortung der verschiedenen Evaluationsfragen wurde ein Mix von quantitativen und qualitativen Methoden verwendet. Dies waren:
Dokumentenanalyse: Die untersuchten Dokumente bezogen sich hauptsächlich auf Serviceleistungen und Aktivitäten des EIP (z.B. Jahresberichte) oder auf Erfahrungen mit europäischen Forschungsprogrammen in anderen Ländern (z.B. Evaluationen und Wirkungsanalysen).
Logic Charts und Logic Framework-Analyse: In einem eineinhalbtägigen Work-shop wurde gemeinsam mit leitenden EIP-Angestellten ein detailliertes Bild des EIP, seiner Mission, seiner Aufgaben und Ziele, seiner Instrumente und Aktivitäten sowie der angestrebten Wirkungen erarbeitet. Ebenso wurde eine Logic Framework-Analyse für das RP und EUREKA erstellt.
Fünf Gruppeninterviews mit Personen aus verschiedenen Referaten und Hierarchiestufen des EIP.
Mehr als siebzig individuelle leitfadengestützte Interviews (persönlich oder tele-fonisch) mit Stakeholdern, wie Vertreter/innen von Ministerien, Regionalen Kontaktstellen, Forschungsservicestellen der Universitäten, der FFG (außerhalb der Abteilung EIP) sowie EUREKA- und RP-Teilnehmer/innen.
Acht themenspezifische Fokusgruppen mit Kund/innen des EIP sowie mit Teil-nehmer/innen an europäischen Forschungsprogrammen, namentlich dem RP und EUREKA.
Zwei standardisierte Online-Befragungen: Die erste Befragung richtete sich an Teilnehmer/innen des RP und EUREKA. Die zweite Befragung richtete sich an eine Kontrollgruppe bestehend aus forschungsaktiven Akteuren, die primär nationale, nicht aber RP- und EUREKA-Förderungen in Anspruch nehmen. Die

xii Final Report
Kontrollgruppe konnte als repräsentativ für potentiellen Teilnehmer/innen am RP und EUREKA angesehen werden.
Sekundäre Datenanalyse, insbesondere von Beteiligungsdaten von europäischen Forschungsprogrammen, namentlich des RP. Analyse der österreichischen Betei-ligung und Vergleich mit der Beteiligung anderer Länder.
18 Fallstudien von forschungsaktiven Organisationen (Universitäten, außer-universitäre Forschungseinrichtungen, Fachhochschulen), von ausgewählten Wis-senschafts- und Technologiefeldern (IKT, Lebenswissenschaften, Automobil, Geistes- und Sozialwissenschaften) sowie von Betreuungsstrukturen in anderen europäischen Ländern (Finnland, Irland, Niederlande, Schweden, Schweiz).
Die Verwendung von verschiedenen Instrumenten zur Erhebung und Analyse von Daten ermöglichte einen Vergleich der mit den verschiedenen Methoden erzielten Resultate. So konnte die Gültigkeit und Verlässlichkeit der Studienergebnisse erhöht werden.
Die Wirkungen der Europäischen Forschungsrahmenprogramme
Österreichs Beteiligung am RP ist hoch. Im 6. RP betrug der Rückfluss 130%. Im 7. RP zeigt Österreich bislang besonders hohe Beteilungsquoten in sieben Bereichen: Kohärente Entwicklung von Forschungspolitiken, Spezielle Aktivitäten internationaler Zusammenarbeit, Informations- und Kommunikationstechnologien, Sozial-, Wirt-schafts- und Geisteswissenschaften, Wissenschaft und Gesellschaft, Sicherheit, Welt-raum. Hohe Beteilungsquoten entstehen auf zwei Wegen: durch eine überdurch-schnittlich hohe Anzahl an Anträgen, oder durch überdurchschnittlich erfolgreiche Anträge (oder beides). In den ersten fünf der sieben Gebiete ist Österreich überdurch-schnittlich stark, weil österreichische Forschende besonders viele Anträge einreichen. Im Gegensatz dazu sind die hohen Beteiligungsraten in den Bereichen Sicherheit und Weltraum auf überdurchschnittlich hohe Erfolgsquoten bei den Anträgen zurück-zuführen. Die relativ niedrige Beteiligung am European Research Council (ERC) wiederum sind auf eine geringe Anzahl an österreichischen Anträgen zurückzuführen – die Erfolgsquoten der österreichischen Anträge an den ERC ist überdurchschnittlich hoch.
Nichtsdestotrotz bezeichnen österreichische Forscher/innen die nationalen Programme als relevanter als die europäischen Programme. Von den verschiedenen europäischen Programmen sind die Kooperationsprojekte des RP am relevantesten. Die neueren RP-Instrumente wie Gemeinsame Technologieinitiativen (Joint Techno-logy Initiatives JTIs) und ERA-Nets hingegen werden selbst von sehr erfahrenen RP-Teilnehmer/innen kaum wahrgenommen.
Die Hauptmotivation für Forschende, am RP teilzunehmen, liegt im Zugang zu For-schungsgeldern. Das RP ist zwar ein sehr komplexes Programm, mit hohen administrativen Hürden und tiefen Erfolgsquoten, aber wenn Forschende öffentliche Gelder für ein internationales Forschungsprojekt benötigen, dann gibt es kaum Alternativen. Das RP ist also das mit Abstand wichtigste Programm, das internationale Forschungszusammenarbeit finanziert.
RP-Teilnehmer/innen betrachten Nachfolgeprojekte als wichtigstes Resultat von RP-Projekten, die durchaus auch außerhalb des RP oder anderer öffentlicher Förderungen umgesetzt werden. Für die RP-Teilnehmer/innen sind Forschungsoutputs wichtiger als Innovationsoutputs. Dies hängt damit zusammen, dass das RP ein vorwett-bewerbliches Programm ist, an dem bevorzugt Universitäten und außeruniversitäre Forschungsinstituten teilnehmen.
Die wichtigste Wirkung des RP sind eine stärkere Vernetzung mit neuen oder bereits bekannten Partnern sowie der Aufbau und die Pflege von europäischen Forschungs-partnerschaften (Netzwerkeffekt). Andere wichtige Effekte sind eine erhöhte Reputation sowie eine Erhöhung des wissenschaftlichen und technologischen Know-hows und der Fähigkeit, F&E durchzuführen. Radikale Innovationen sind kein

Final Report xiii
wichtiger Effekt des RP. Die meisten befragten Teilnehmer/innen meinten, dass das RP aufgrund seines Designs und der verwendeten Auswahlverfahren gar nicht systematisch radikale Innovationen hervorbringen könne.
Internationale Forschungszusammenarbeit ist heute etwas Alltägliches geworden. Die Kontrollgruppe zeigt, dass auch außerhalb von internationalen Forschungs-programmen viele internationale Forschungskooperationen stattfinden, oft aus eige-nen Mitteln finanziert. Das RP bleibt aber die attraktivste öffentliche Finanzierungs-quelle für solche Aktivitäten. Forschende nehmen am RP teil, weil es ihren Bedürfnis-sen (und denen ihrer Organisation) entgegenkommt – nicht aus idealistischen Gründen. Zudem konnte eine Professionalisierung der RP-Teilnehmer/innen beobachtet werden, was sich in einer veränderten Nachfrage nach Dienstleistungen des EIP ausdrückt.
Firmen berichten häufiger von marktnahen Effekten ihrer RP-Teilnahme, während Universitäten häufiger wissenschaftliche Effekte und Ausbildungseffekte erfahren. Letztere unterstreichen die Wichtigkeit des RP für die Entwicklung von Nachwuchs-forscher/innen. Dabei gilt zu beachten, dass Ausbildungseffekte nicht nur im Rahmen der humanressourcen-orientierten Maßnahmen (People Programm oder ERC Starting Grants) entstehen, sondern auch in ‚traditionellen‟ Kooperationsprojekten.
Beinahe zwei Drittel der österreichischen RP-Teilnehmer/innen sagen aus, dass der Nutzen der Teilnahme am RP die Kosten übersteigt. Interessanterweise beurteilen Forscher/innen aus verschiedenen Organisationen (Universitäten, Forschungs-institute, Firmen) das Kosten-Nutzen-Verhältnis ähnlich. Dies gilt auch für KMUs, die offensichtlich wissen, wie sie sich im RP positionieren müssen, um auf ihre Kosten zu kommen.
Das RP ist hoch kompetitiv, so dass nur die ‚Fitten‟ erfolgreich teilnehmen können. Im Allgemeinen findet die Qualifizierung zur Teilnahme an europäischen Programmen in nationalen Programmen statt, was als Hinweis für die Komplementarität zwischen nationalen und europäischen Programmen gelten kann. Allerdings variiert die Komplementarität je nach Disziplin. Während in Österreich in IKT und im Auto-mobilsektor ein enger thematischer Link besteht, gibt es in den Geistes- und Sozial-wissenschaften kaum nationale Programme, so dass viele Forscher/innen speziell aus den außeruniversitären Forschungsinstituten auf die RP ausweichen.
Drei Viertel der österreichischen Forschungsorganisationen verfügen über eine Strategie zur Nutzung von nationalen und regionalen Programmen, und zwei Drittel zur Nutzung des RP. Für andere europäische Programme und für EUREKA sind die Anteile viel tiefer. Dies deutet darauf in, dass das Vorhandensein einer Strategie von der Sichtbarkeit der F&E-Förderungen abhängt, d.h. von der Programmgröße und den verfügbaren Mitteln. Firmen haben meist eine Strategie für die ganze Organisation. Universitäten hingegen haben wegen der unterschiedlichen thematischen Ausrichtung der Institute und der akademischen Freiheit der Forscher/innen tendenziell unter-schiedliche Strategien auf unterschiedlichen Ebenen.
Die Wirkungen von EUREKA
83% der EUREKA-Teilnehmer/innen nahmen auch am 6. oder 7. RP teil. Damit überlappen die zwei Zielgruppen, obschon EUREKA marktorientierter ist als das RP. Mit weniger als 50 Projekten pro Jahr ist die österreichische Beteiligung an EUREKA verglichen mit der Beteiligung am RP gering. EUREKA ist laut Gesprächs-partner/innen administrativ weniger schwerfällig als das RP. Dies gilt insbesondere für die EUREKA Cluster im Vergleich mit den JTIs. EUREKA hat jedoch Synchro-nisationsprobleme – auf nationaler Ebene, wenn Forscher/innen versuchen, nationale Fördermittel für ihr EUREKA-Projekte zu erlangen, und auf internationaler Ebene wegen der je nach Land unterschiedlichen Förderhöhe.
Der wichtigste Effekt von EUREKA ist eine stärkere Vernetzung mit neuen oder bereits bekannten Partnern und der Aufbau und die Pflege von europäischen Forschungspartnerschaften. Dies ist auch die wichtigste Motivation, an EUREKA

xiv Final Report
teilzunehmen. Andere wichtige Effekte sind eine Erhöhung des technologischen und wissenschaftlichen Know-hows. Wie bei einem marktorientierten Programm zu erwarten, berichten die Teilnehmer/innen an EUREKA häufiger von marktnahen Effekten als die Teilnehmer/innen am RP.
Eine erhöhte Reputation ist ein weiterer Effekt. Es lohnt sich, einen näheren Blick darauf zu werfen, denn (Eurostars ausgenommen) vergibt EUREKA keine Finanzierung, sondern ein (nach eigenen Angaben) „prestigereiches Label“. Allerdings zeigt ein Vergleich mit der Kontrollgruppe, dass die Teilnahme an EUREKA die Reputation der Forscher/innen nicht stärker erhöht als autonome F&E-Kooperation. Darüber hinaus zeigt ein Vergleich mit der Kontrollgruppe, dass die EUREKA-Programme, verglichen mit autonomer F&E-Kooperation, gar keine zusätzlichen Effekte nach sich ziehen. Dies stellt den Mehrwert (Additionalität) von EUREKA in Frage. Indes weist EUREKA ein positives Kosten-Nutzen-Verhältnis auf, geben doch mehr als die Hälfte der EUREKA-Teilnehmer/innen an, dass der Nutzen die Kosten der EUREKA-Teilnahme übersteigt.
Verglichen mit dem RP erscheinen die Effekte von EUREKA in Österreich blass. Dem Programm fehlen eine Strategie und eine eindeutige Marke. Es ist oftmals nicht klar, was der Mehrwert von EUREKA für die Teilnehmer/innen ist verglichen mit F&E-Kooperationen auf eigene Faust. Dazu passt, dass EUREKA – mit Ausnahme von Eurostars – keine Forschung finanziert. Auf nationaler Ebene gibt es zudem kein standardisiertes Verfahren, das es EUREKA-Teilnehmer/innen erlauben würde, nationale Fördermittel zu beantragen. Auch scheint EUREKA relativ schlecht in die österreichische Förderlandschaft zu passen. Angesichts dessen sollte Österreich seine Position zu EUREKA neu definieren: entweder sein Engagement bei EUREKA reduzieren oder im Gegenteil sein Engagement bei EUREKA verstärken, indem der Mehrwert von EUREKA herausgearbeitet und das Programm besser in die nationale Förderlandschaft eingepasst wird.
Evaluierung der österreichischen Betreuungsstrukturen
Im Großen und Ganzen sind die Leistungen der Abteilung EIP-FFG hervorragend, wie auch aus der sehr hohen Kundenzufriedenheit hervorgeht. EIP-FFG verfügt über engagierte und hoch motivierte Mitarbeiter/innen und erweitert und verbessert systematisch seine Dienstleistungen. EIP verfügt über ein hohes Ressourcenniveau. Wie bei kostenlosen Leistungen im Gesundheitswesen ist die Nachfrage nach den kostenlosen Beratungsleistungen des EIP hoch, unabhängig vom Nutzen, den die Leistung beim Empfänger stiftet.
Die Mission des EIP – eine hohe, erfolgreiche und nachhaltige Beteiligung von öster-reichischen Organisationen an europäischen und internationalen Programmen – hat sich über die Jahre nicht verändert, aber EIP hat seine Dienstleistungen und Aktivitäten ausgedehnt und an neue Bedürfnisse und Umstände angepasst. Zwei sol-che neue Dienste sind die Strategiegespräche und die FFG-Akademie. EIP führt Strategiegespräche mit führenden österreichischen Firmen, mit Universitäten und mit Forschungseinrichtungen, um Strategie und Potential der Organisation für eine ver-stärkte Teilnahme am RP (und anderen europäischen Programmen) auszuloten. Wir begrüßen die Strategiegespräche, denn sie befassen sich mit Organisationen, nicht mit Individuen, und sie tragen dazu bei, deren strategische Planung zu verbessern. Zudem wirken die Strategiegespräche der Tendenz der österreichischen Forschungsförderung entgegen, sich auf Programme und Projekte unter Vernachlässigung von Institutionen zu konzentrieren. Die FFG-Akademie bietet Kurse an, in denen Standard-informationen an Gruppen von Personen vermittelt werden, was im Vergleich zu Ein-zelberatungen einen Effizienzgewinn bedeutet.
Wie in den Beauftragungen festgelegt, fokussiert das EIP auf das RP – und dabei ins-besondere auf die Kooperationsprojekte – und auf EUREKA. Für die Zukunft erwarten wir allerdings, dass die momentan eher peripheren Instrumente, z.B. JTIs und ERA-Nets, und neue Instrumente, insbesondere das Joint Programming, an Bedeutung ge-

Final Report xv
winnen. Sowohl die Beauftragungen als auch das EIP werden sich in diesem Falle an die veränderten Verhältnisse anpassen müssen.
Das EIP hat sich in der Rolle als zentraler Knoten im Betreuungsnetzwerk mit den Regionalen Kontaktstellen (RKS) hat gut etabliert. Die Arbeitsteilung funktioniert gut. Der nächste Schritt in Richtung eines kohärenten österreichischen Betreuungs-systems, das flexibel genug ist, um sich an veränderte internationale Kooperations-möglichkeiten anzupassen, ist eine funktionelle Integration des EIP und der RKS zu einem einzigen Netzwerk mit einer gemeinsamen Strategie.
Viele der Aktivitäten des EIP sollten weitergeführt werden. Dies betrifft insbesondere die allgemeinen Informationsdienstleistungen (Veranstaltungen, Aussendungen, Informationsmaterial) und die neuen Instrumente Strategiegespräche und FFG-Akademie. EIP verfügt über die richtigen Strategien und Instrumente, um sogenann-tes „ausbaufähiges Potential“ zu identifizieren. Es gibt zudem Hinweise, wonach es in Österreich nicht viel unausgeschöpftes Potential gibt. Die Aktivitäten des EIP zur Identifizierung von neuen F&E-Akteuren (z.B. Nachwuchsforscher/innen, neuen Firmen) sind ausreichend, um den Veränderungen über die Zeit gerecht zu werden. Bei einzelnen spezifischen Aktivitäten, wie der Partnersuche, den internationalen Aktivitäten und den NCP-Projekten, wurde jedoch Verbesserungsbedarf identifiziert.
Die Dienstleistungen des EUREKA-Büros, einer kleinen Abteilung innerhalb des EIP, sind wie die anderen Dienstleistungen des EIP ausgezeichnet. Indes gibt es Anzeichen, dass das Weiterleiten von Kund/innen an andere Bereiche der FFG zur Erlangung von nationalen Fördermitteln verbessert werden könnte. Dazu sollte die Zusammenarbeit über die FFG-Bereiche hinweg verbessert werden.
Die Anbahnungsfinanzierung Wissenschaft und Wirtschaft weisen beide bemerkens-wert hohe Mitnahmeeffekte auf. Darum sollten sie beendet werden. Wir haben aller-dings eine Minderheit von Akteuren – insbesondere außeruniversitäre Forschungs-einrichtungen – identifiziert, denen die internen Mittel fehlen, um einen RP-Antrag vorzubereiten. Bei diesen generiert die Anbahnungsfinanzierung durchaus Addi-tionalität. Die strukturellen Probleme dieser Institutionen sollten aber von den ver-antwortlichen Ministerien direkt behoben werden und nicht über die Anbahnungs-finanzierung.
Schließlich gibt es empirische Evidenz, dass die Dienstleistungen des EIP die Universitäten und Forschungseinrichtungen davon abhalten, die notwendigen internen Kapazitäten für das Forschungsmanagement aufzubauen. Darum ist prioritär, dass die Universitäten (und andere Forschungseinrichtungen) und das EIP ihre Arbeitsteilung neu definieren. Gleichzeitig sollte das EIP diejenigen Aktivitäten ausweiten, die der Professionalisierung der Forschungsmanagements, speziell an den Forschungsservicestellen, der Universitäten dienen.
Wir gehen davon aus, dass die Professionalisierung der Forschungsservices an den Universitäten und Forschungseinrichtungen Ressourcen im EIP freigibt. Damit kann das EIP seine Aktivitäten neu ausrichten und sich vermehrt auf die Bereitstellung von „strategic intelligence“ und das Erzielen von Lerneffekten bei Neukunden und Erst-teilnehmern an internationalen F&E-Initiativen konzentrieren. „Strategic intelligence“ ist Orientierungswissen bzw. Wissen, das zur Strategiebildung benötigt wird. Im Kon-text des RP heißt dies, die Veränderungen im RP und die ungeschriebenen Regeln der internationalen Zusammenarbeit verstehen. Dabei ist die Bereitstellung von ‚strategic intelligence‟ nicht auf die Forscher/innen beschränkt. Es gibt klare Hinweise, wonach die Erfahrungen und Beobachtungen von Mitarbeitenden des EIP systematischer als Ressource für Programmdelegierte und andere Ministeriumsangehörige genutzt werden könnten. Darum sollte das EIP eine zentrale Rolle spielen, wenn es darum geht, die sich ändernden Chancen und Konstellationen von internationaler F&E-Kooperation zu verstehen und zu analysieren, und zwar auf europäischer wie auf globaler Ebene. Das EIP eignet sich bestens als Erzeuger und Lieferant von „strategic intelligence“, da es sowohl mit der wissenschaftlichen Gemeinde wie auch mit der Europäischen Kommission in Kontakt ist.

xvi Final Report
Empfehlungen
Unsere Schlussfolgerungen beruhen nicht nur auf den empirischen Resultaten unserer Arbeit im Feld, sondern beziehen auch den Kontext ein, in dem das RP und das EIP operieren. Konkret berücksichtigen die Schlussfolgerungen
aktuelle theoretische Überlegungen zur Legitimierung von staatlichen Eingriffen. Dabei wird insbesondere davon ausgegangen, dass der Staat nichts fördern sollte, was die Geförderten ohnehin unternehmen würden oder was sie ohnehin beherr-schen. Vielmehr sollte der Staat darauf achten, dass bei den Geförderten ein Mehrwert (Additionalität) geschaffen wird und Lerneffekte bei den Geförderten erzielt werden (Verhaltensadditionalität).
laufende Entwicklungen auf EU-Ebene. Dabei wird insbesondere davon ausge-gangen, dass im 8. RP die momentan eher peripheren neuen Instrumente ein stärkeres Gewicht bekommen.
zentrale Ziele der österreichischen Forschungs- und Innovationspolitik, insbeson-dere das Universitätsgesetz 2002 mit seinem Hauptziel, starke, autonome Uni-versitäten zu schaffen.
Diese Vorgehensweise führt zu Empfehlungen, die in erster Linie darauf abzielen, Institutionen zu stärken und nachhaltige Lerneffekte im System zu erzielen.
Unsere Analyse zeigt, dass drei wichtige Veränderungen in der strategischen Aus-richtung der österreichischen Forschungs- und Innovationspolitik notwendig sind.
Die Teilnahme am RP ist kein Wert an sich. Daraus folgt die Aufgabe des Ziels, die österreichische Beteiligung am RP zu maximieren.
Die internationale Orientierung ist keine abgegrenzte, separate Spezialität, sondern muss zum „Mainstream“ der nationalen Forschungs- und Innovations-politik werden.
Die öffentliche Förderung der Internationalisierung (mit Information, Beratung, Geld) muss auf Verhaltensadditionalität ausgerichtet werden. Die Forschenden und die Institutionen sollen lernen, wie man neue internationale Initiativen ver-steht und daran teilnimmt. Insbesondere sollten keine Aktivitäten subventioniert werden, welche die Geförderten bereits beherrschen bzw. die von anderen Akteuren angeboten werden sollten. Die ursprüngliche Aufgabe des EIP – der österreichischen Forschungsgemeinde beizubringen, wie man am RP und an EUREKA teilnimmt – ist größtenteils erfüllt.
Auf ministerieller Ebene benötigt die österreichische Forschungs- und Innovations-politik eine Gesamtkoordinationsstelle für alle Ministerien. Die Hauptaufgaben dieser EU-Gesamtkoordinationsstelle sind:
Den nationalen Bedarf nach internationaler Kooperation analysieren, verstehen, koordinieren und kommunizieren – national wie international;
Der europäischen Ebene die österreichischen Bedürfnisse und Positionen ver-mitteln;
Die europäischen und globalen Dimensionen der Forschungs- und Innovations-politik sowie ihre Bedrohungen und Möglichkeiten den Akteuren in Österreich vermitteln und damit zur Themensetzung beizutragen
Als Prinzipal oder „intelligent customer“ dafür sorgen, dass die nationalen Betreu-ungsstrukturen adäquat ausgestaltet sind.
Das EIP benötigt eine neue Strategie, die ihm eine gewichtigere Rolle dabei zuweist, die sich verändernden Chancen und Konstellationen in der F&E-Kooperation auf europäischer und globaler Ebene zu verstehen und zu analysieren. Gleichzeitig sollte das EIP die Politik und Verwaltung sowie die Forschungs- und Innovationsgemeinden

Final Report xvii
besser mit entsprechenden Informationen versorgen. Das EIP sollte sich auf eine Ab-machung mit den Universitäten verständigen, wonach es sich als Einzellieferant von Routineinformationen und -dienstleistungen immer mehr zurückzieht und zum „Großhändler“ von „strategic intelligence“ wird – auch an andere Kunden wie Firmen. Zudem sollte sich das EIP auf Kund/innen konzentrieren, bei denen es Verhaltens-additionalität erzeugt – also auf Organisationen und Einzelpersonen, die noch lernen müssen. Beide Varianten der Anbahnungsfinanzierung – Wirtschaft und Wissenschaft – sollten gestoppt werden, gleichzeitig sollten aber die strukturellen Probleme der-jenigen Minderheit von Akteuren, für welche die Anbahnungsfinanzierung eine not-wendige Bedingung für einen RP-Antrag ist, direkt von den verantwortlichen Ministerien angegangen werden.
Das EIP verfügt über ein Ressourcenniveau, das für seine ursprüngliche Mission angemessen ist. Diese ist nun größtenteils erfüllt. Die Ressourcen des EIP sollten im Licht der neuen Strategie und Aktivitäten überprüft und angepasst werden. Die RKS sollten funktional ins EIP integriert werden. Schließlich sollte sich das EIP auf Auf-gaben und Aktivitäten konzentrieren, die sich mit Internationalisierung allgemein be-fassen. Thematische Internationalisierung sollte im Sinne eines „Mainstreaming“ in das Forschungs- und Innovationsfördersystem integriert werden, unabhängig davon, ob diese Teile innerhalb oder außerhalb der FFG angesiedelt sind.
Das EIP sollte eine zentrale Rolle im Entwickeln seiner neuen Strategie spielen und diese aktiv den auftraggebenden Ministerien anbieten. Dazu sollten die derzeit beste-henden Beauftragungen zwischen dem EIP und seinen Auftraggebern als rollender Rahmen betrachtet werden: Jährlich sollen die Aufgaben des EIP neu und innerhalb des vereinbarten finanziellen Rahmens mit den auftraggebenden Ministerien neu ver-handelt werden. Dieser „rollende Ansatz“ wird dazu beitragen, dass das EIP nach und nach jene Aufgaben, die im Großen und Ganzen abgeschlossen sind, und Kunden-segmente, bei denen die notwendigen Lerneffekte schon stattgefunden haben, aufgibt, um sich neuen Betreuungsaufgaben zu widmen.


Final Report 1
Introduction This is the Final Report for the study Evaluation of Austrian Support Structures for FP 7 and EUREKA, and Impact Analysis of EU Research Initiatives on the Austrian Research and Innovation System. It has been prepared in accordance with the terms of reference for the investigation.
A consortium of Austrian Ministries1 and the Austrian Chamber of Commerce, led by the Austrian Federal Ministry of Science and Research, has commissioned Technopolis to perform an evaluation of Austrian support structures for the 7th European Framework Programme for Research (FP7) and for EUREKA as well as an impact analysis of EU research initiatives on the Austrian research and innovation system. On the one hand, the evaluation part of this study assesses the support delivered to Austrian R&D performers, primarily by the Department for European and Inter-national Programmes (EIP) of the Austrian Research Promotion Agency (Österreichische Forschungsförderungsgesellschaft mbH, FFG) – FFG-EIP – from 2007 to date. The impact analysis, on the other hand, scrutinises the impacts which the European Framework Programmes for Research and other research related European initiatives have had on the Austrian RTDI system.
Against this backdrop, the objectives of the study were to
Identify effects of European research initiatives on the Austrian research and innovation system
Assess the effectiveness and efficiency of support provided domestically to Austrian participants in the EU Framework Programmes for RTDI and EUREKA
by the Austrian support structures, in particular the EIP department of FFG.2
Recommend how to improve the quality of services of FFG-EIP (and of the system of Austrian supporting structures as a whole)
Recommend how to influence future EU initiatives for RTDI with respect to enhancing synergies in the combined usage of national and international/Euro-pean RTDI initiatives
The rationale for undertaking such an analysis now is seen in the context of pending revisions to a number of European RTDI initiatives (including the transition from FP7 to FP8), ongoing activities in Austria to define a national RTDI initiative and also a national position as regards the revision of European RTDI initiatives in Brussels and budget considerations.
1 The Federal Ministry of Science and Research BMWF; the Federal Ministry for Transport, Innovation and Technology BMVIT; the Federal Ministry of Agriculture, Forestry, Environment and Water Management („Lebensminsiterium‟); the Federal Ministry of Health (BMG); and the Federal Ministry of Economy, Family and Youth (BMWFJ).
2 The evaluation of Austrian supporting structures for FP7 and EUREKA focused foremost on FFG-EIP. The other elements of the supporting structures were mostly reviewed to the extent of analyzing their functioning as a system (e.g. in order to answer the question whether work division is sensible and efficient). Individual parts of the supporting structures other than FFG-EIP – especially the system of Regional Contact Points (see chapter 3.1) – were subject to other recent evaluation assignments.

2 Final Report
The report is structured as follows:
Section 1 describes the methodology.
Section 2 first provides an outline of the European RTDI initiatives in place. It then scrutinises the impacts of the European schemes on the Austrian RTDI system.
Section 3 is devoted to an analysis of the support structures for FP7 and EUREKA with a strong focus on the department European and Internal Programmes (EIP) within the Austrian Research Promotion Agency FFG.
Section 4 provides the conclusions and recommendations. Particularly, in this chapter we take a concise look at the history of European RTDI schemes, current trends and possible implications for future Austrian RTDI policy.
The report includes an appendix where we provide additional data on return rates for our surveys as well as a detailed analysis of and tables for Austrian FP6 and FP7 participation (the synopsis being detailed in chapter 2).

Final Report 3
1. Methodology
In order to address the research objectives in an adequate manner, a mixture of quantitative and qualitative methods was applied. This approach ensures a maximum degree of validity in the results as weaknesses of one method can be offset with the strengths of other methods. In addition, some of the research questions that the study had to answer allocate specific investigative methods. This furthered the need for a differentiated methodological design.
In particular, the following methods were used:
document and literature analysis
logic chart and logical framework analysis
group interviews with staff from FFG-EIP
individual semi-structured interviews
focus groups with specific user groups of FFG-EIP and European RTDI initiatives
two standardised surveys
secondary data analysis (especially with respect to participation data for the European RTDI initiatives under investigation) and
case studies of R&D performing organisations, of selected science / technology fields, and of support structures in other countries.
Document analysis was used, on the one hand, to review the services and activities of the Austrian support structures, especially of FFG-EIP. On the other hand, a range of documents and studies were analysed with regard to European and national RTDI policies and the impacts they have had on (national) innovation and R&D activities. The set of documents reviewed comprised policy and strategy documents, evaluation and impact assessment studies, results of customer satisfaction surveys, contracts or reports (such as annual reports) as well as monitoring data. These and other documents were partially retrieved from the internet and literature searches, and partially provided by the respective authorities in charge of FFG-EIP (as well as by FFG-EIP itself). A full list of the documents considered is given in the references chapter of this study.
Logic chart (LC) analysis was used following preliminary document analysis and interviews with the EIP management. Within the scope of a 1.5 day LC Workshop with senior employees at EIP, it was sought to gain a thorough understanding of the intervention logic of the support structure, its rationale and scope of the activities. Logic Chart analysis was used as a descriptive tool in order to understand EIP, its mission and objectives, the instruments used, the activities performed and their outputs, outcomes and impacts. It also served to identify possible gaps, overlaps or inconsistencies, and as a tool to discuss EIP and its activities in the course of the project, especially with the consortium of clients.
Five group interviews were performed with staff of FFG-EIP from different departments and hierarchy levels. The purpose of these interviews was to capture the internal views from FFG-EIP on its portfolio of services and activities. Each group focused on a particular theme. The themes for each group were selected on the basis of the results of the preceding document and the Logic Chart analysis for FFG-EIP. The selection was accorded with the contracting ministries. The interviewed participants had to have similar (and relevant) experience with regard to the selected themes and were to discuss them accordingly. Each group interview lasted two to three hours and was conducted on the basis of interview guidelines transmitted to the participants in advance. The main intention of the group interviews was to get a thorough

4 Final Report
understanding of FFG-EIP and its development during the evaluation period. Figure 1 shows the themes and group composition for each group.
Figure 1 Group interviews with FFG-EIP staff
No. Group composition/theme Number of participants
1 National Contact Points (NCPs) 9
2 Strategic activities tailored to specific target groups 6
3 EUREKA and EUROSTARS 6
4 Special instruments of FP7 and other European initiatives 8
5 Assistants to the various departments 6
TOTAL NUMBER OF PARTICIPANTS *) 35
*) There were some overlaps in participants between the groups, depending on the level of involvement of certain FFG-EIP staff in more than one topic/theme Source: Technopolis
Semi-structured interviews with different types of stakeholders (representatives from ministries, FFG excluding EIP, regional and university support structures etc.) as well as users of either FFG-EIP and/or European RTDI programmes played an important role for this study. They were performed over the whole running time of the study either face-to-face or by phone. 89 persons were interviewed. The interviews were based on a comprehensive interview guideline which covered the two main fields of inquiry, the evaluation and the impact analysis.
Focus groups (FG) with users of FFG-EIP and European RTDI programmes (foremost FP7 and EUREKA) were conducted. Eight such groups were constituted. Each provided a moderated forum where the participating users could mutually discuss the motives for participating in and the main impacts of European RTDI programmes, the effectiveness of support provided by FFG-EIP (and other supporting structures) and possible improvements for the future. The results of the focus groups were of particular relevance for the design of the questionnaires of the standardised surveys (see below), in order to identify the most relevant questions and answer categories. The composition of the discussants was different for every group and reflected a particular and important target audience for FFG-EIP. The selection was accorded with the client ministries and took different factors into account (in brackets the focus group(s) that addressed the respective issue most):
Considerable experience levels of core target groups (FG5, FG6)
Core target groups for the specific EUREKA commissioning contract between FFG-EIP and the ministries (FG1)
Small and medium sized enterprises (SME) (FG4)
Emerging or new users or stakeholders of FFG-EIP (FG2)
Researchers new to the FP (new participants were represented in several FG)
Special stakeholders / user groups (FG8, FG3).
The respective group composition is given in Figure 2.

Final Report 5
Figure 2 Focus groups with users and target groups of FFG-EIP
No. Group composition/theme Number of participants
FG1 EUREKA 5
FG2 Private consultants 8
FG3 Vice-rectors for research and representatives of research management units at universities
7
FG4 SME participants to FP7 5
FG5 FP project coordinators group I 5
FG6 FP project coordinators group II 7
FG7 Participants to the FFG Academy 6
FG8 Extra-university institutions 10
TOTAL NUMBER OF PARTICIPANTS *) 53
*) The participants were selected in such a way that no overlap between different groups would occur (i.e. nobody participated in more than one focus group). Source: Technopolis
Two standardised surveys were conducted. The first, more elaborate survey addressed users of FFG-EIP and/or European RTDI programmes who had to fulfil either one of the following criteria:
used specific services offered by FFG-EIP, i.e. the so-called „detailed advice‟ for FP7, FP6 or EUREKA within the past five years; see chapter 3.3.2.3 for more information about this service)
participated in FP6 or FP7, i.e. they should have been part of a submitted proposal, either in a partner or coordinator role
participated in EUREKA, i.e. they should have been part of a submitted proposal for EUREKA within the past five years.
The source of contact data used was the INNOman customer database of FFG-EIP. This proprietary database was developed in-house by FFG-EIP (and its preceding organisation BIT) as a CRM (customer relation management) tool. It not only stores contact details of customers who have been in touch with FFG-EIP, but provides a detailed account of the services used. Furthermore, FFG-EIP draws also on the official E-Corda database of the European Commission (a dedicated database listing all participations in the FP programmes) and the EUREKA project database. It merges the participation data complied there with customer data from INNOman. Taking the example of the Framework Programmes this means that whenever there is evidence that an Austrian organisation participated in a proposal for the FPs, the (contact) persons listed in the proposals are looked up in INNOman and the respective number of project submissions, successful projects, coordinator role(s) and partner role(s) are added. INNOman also stores structural data, such as the type of organisation or size categories for firms. This has led to combining the different information available for the design of the questionnaire. Important implications arising from and explanations of this particular approach are described in Annex A.1.
FFG-EIP forwarded contact details and structural data from INNOman for 5,774 customers fulfilling the three eligibility criteria described above. The survey itself was executed in the timeframe of June 13, 2010 to August, 15 2010. Respondents were contacted via internet and forwarded a link to the electronic questionnaire in two waves: Those who had not responded by July, 5 2010 received a reminder on that date. The survey itself was administered by drawing on the external IT service provider „Survey Monkey‟.
The questionnaires obtained were further validated and processed in state-of-the-art statistical packages. Eventually, 432 valid questionnaires were received. Appendix A.1

6 Final Report
lists the response rates according to different structural characteristics and participation data variables. While the overall response rate seems to be rather low (7.5%), the response rate increases significantly if participation data is used as reference. In this case, response rates vary between 10.0% and 18.7% (FP) or even 28.0% (EUREKA). This result shows that a bias is present towards more experienced users and participants of the FPs and EUREKA – an expected result, given the size of the questionnaire. More importantly, Appendix A.1 shows that in practically all relevant break-down variables (be it structural or participation data), there is a sufficiently high number of responses to conduct statistically meaningful and sufficiently representative analyses.
The second standardised online survey executed addressed a control group for which the selection criteria of the main online survey did not apply, i.e. should not have participated in FP6, FP7 or EUREKA. Nonetheless, the respondents should still actively conduct R&D and use predominantly national or regional R&D funding schemes. Putting together the control group, we followed the results from our
interviews and focus groups that institutions consciously3 using European RTDI initiatives were at the „upper-end‟ of the spectrum of Austrian users of R&D support programmes. Many of these users possess plenty of experience with national schemes. In other words, the control group we put together is representative of those organisations who can be considered potential users of European RTDI initiatives rather than the Austrian research and innovation system as a whole. This observation
is in line with the results of the recent systems evaluation.4
Against this background, we built a database of researchers to be surveyed from two sources: On the one hand, we used the FFF-2004 database, which is FFG's central funding database. Participation in FFG‟s General Programmes is in particular considered a reasonable proxy for the number of all firms conducting R&D in Austria. For the universities and non-university research institutions we reverted to the project database of the FWF Austrian Science Fund. We obtained the contact details of all researchers who have led a project funded by the Fund (individual projects, priority research programmes („Schwerpunktprogramme‟) or international programmes).
FFG provided us with 5,928 contacts from the FFF-2004 database. The figure is a result of the time period under investigation (projects executed since 2005) and an attempt by FFG to eliminate all redundant contacts with the INNOman contact database provided for the main online survey. From this base, we subtracted firms which participated only in very small projects (termed by FFG as „kleinteilige Maßnahmen‟, i.e. users of the innovation voucher scheme or of feasibility studies) and eliminated all contacts for which there was evidence that the (host) company participated in the FPs or EUREKA. Similar data cleaning was performed on the dataset retrieved from the FWF Austrian Science Fund (initially 2,190 contacts). As a result, the number of eligible contacts was reduced to 1,118 contacts for the FWF and 4,762 for the FFF-2004 (FFG) dataset.
An additional safeguard, a control question, was put in the survey. This question ensured that only those researchers responded to the control group survey that were actually never part of an FP6, FP7 or EUREKA project and also not in touch with FFG-EIP for detailed advice in the given time frame. Of those who responded, 9.3%
3 Several European funding schemes – and especially the ERDF – act as co-funding tools to regional programmes, projects or institutions. These programmes are frequently marketed as support programmes offered by the respective region. Researchers may hence not recognize that they draw (also) on European funds. Furthermore, the term „usage‟ is not as straightforward as in the case of FP7 or EUREKA, as funding can be used not only for R&D projects but also for the financing of institutions or other types of (heterogeneous) activities.
4 Karl Aiginger et al., Evaluation of Government Funding in RTDI from a Systems Perspective in Austria. Synthesis Report, 2009.

Final Report 7
eventually stated not to fulfil the eligibility criteria for the control group, i.e. that they had participated in either a FP6, FP7 or EUREKA project. These persons were excluded from the control group.
The control group survey was executed between July 15, 2010 and August 25, 2010 again in two waves. Those who did not respond by August, 6, 2010 received a reminder. Overall, 644 valid questionnaires were received. The overall response rate amounted to 13.5%. The higher response rate – if compared to the main online survey – can be attributed to the much shorter questionnaire which enquired only into reasons of non-usage of European RTDI initiatives and general patterns of engagement in international R&D collaboration. Figure 108 and Figure 109 in Appendix A.2 show the response rate and the composition of the sample.
For the European RTDI initiatives touched in this review, we performed secondary data analysis to capture and review Austrian participation in the programmes. The most elaborate of these investigations concerned FP6 and FP7. The analyses presented were first constructed using E-Corda data supplied by the European Commission. The figures were then revised and updated based on data supplied by PROVISO unit in order to ensure consistency between the results and
those already published by PROVISO5 under contract to BMWF. In the main text, the predominant trends and results are presented. The full list of figures and tables are presented in Appendix B.
Case studies were performed to illustrate and highlight specific aspects of dealing with European RTDI programmes and/or the supporting structures in a „real life‟ context. Eight such case studies were conducted for institutions (universities and non-university research institutions) and four case studies for selected fields of science and technology. Figure 3 lists these case studies and their main focus.
Figure 3 Subjects of institutional and sectoral case studies and main focus
Case study Main focus / highlight of the case study
Institutional case studies
University of Vienna The university's approach to the ERC
University of Innsbruck The strong and comprehensive internal project management and service unit
Innsbruck Medical University The "start-up" situation of a newly established university
Vorarlberg University of Applied Sciences
A University of Applied Sciences as a small regional actor and its approach to internationalisation
Austrian Institute of Technology The perspective of Austria's largest applied non-university research institute
Joanneum Research A large applied research institute participating in FPs with a mission to generate benefits for the regional economy
Centre for Social Innovation A private research institute in the social sciences with an explicit focus on FP participation, making it one of the most active Austrian participants
Centre for Virtual Reality and Visualisation Research
A 'competence centre' with a national focus in collaboration
5 PROVISO is a project contracted by a consortium of Federal Ministries to monitor Austrian FP participation (see also chapter 3.1).

8 Final Report
Case study Main focus / highlight of the case study
Sectoral case studies
Automotive Role of the FP for the automotive sector in Austria
Information & Communication Technologies
Role for European Programmes for the ICT sector in Austria
Life Sciences Role for European Programmes for the Life Sciences in Austria
Social Sciences and Humanities A small but highly successful group of FP participants, their structural characteristics and national framework conditions, with a focus on non-university research institutes
Source: Technopolis
The institutional case studies are descriptive in nature and demonstrate different approaches institutions have developed in dealing with FP participation; they have been authorised by the institutions described.
A second set of case studies concerned foreign support structures comprising five studies from Finland, Ireland, The Netherlands, Sweden, and Switzerland. One further case looked at specific instances of how synergies between ERDF and FP7 funding can be realised. All case studies have been integrated in different places of the report – either as text boxes or separate chapters – where they were useful for highlighting or backing certain arguments in the discussion.
International comparisons played an important role for all research methods applied. This concerned in particular the document analysis (where we looked at international evaluation and impact assessment studies), the interviews (performed also with experts from abroad), the standardised surveys (where certain question batteries were adapted from other studies, in order to allow comparisons among countries) or – of course – the participation statistics analysis.

Final Report 9
2. Analysis of impacts of European RTDI initiatives on the Austrian RTDI system
2.1 Major European RTDI initiatives
2.1.1 Introduction
This chapter gives an overview of important European RTDI initiatives. It outlines the structure of the European RTDI landscape and describes the objectives, activities, governance, budget and target audience for each of the programmes and their sub-programmes. The chapter is targeted to those readers who are not very familiar with the European RTDI landscape and want to get a good overview of European RDTI initiatives. Chapters can also be read individually by those who want to read up on a certain scheme.
2.1.2 Analysis of developments in the European Framework Programmes
The Framework Programmes date from the mid-1980s. The first (FP1) took place from 1984 to 1987 and the second (FP2) from 1987 to 1991. The First Framework Programme was an amalgamation of existing initiatives throughout the Commission in an attempt to develop a coherent research and development strategy. The initial focus was nuclear energy but by the second Framework Programme this had shifted towards IT – as part of an OECD-wide push to increase IT research that followed the successes of Japanese industry of the later 1970s. Over time, the Framework Programmes‟ scope have tended to widen, so that they now cover a very wide range of themes, and the repertoire of instruments has increased from the early focus on collaborative research to areas like human mobility. FP3 introduced the Human
Capital and Mobility of Researchers as a new theme.6
One strand in the programmes has been strongly driven by the desire to achieve social and economic impacts, which is sometimes informally described as „the Commission‟s industry policy‟. FP4 was well geared to industry oriented applied research in traditional industries as well as in new technology domains, with a large share of funding to ICT Research (28%), followed by Energy (18%) and Industrial and Materials Technologies (16%).
Up to and including FP4, European Added Value in the form of networking, cohesion, scale benefits and so on was largely seen as sufficient justification for the FPs. FP5 increased the emphasis on „horizontal‟ themes that were less focused on collaborative research in particular domains: international collaboration with Third Countries, promotion of innovation and encouragement of SME participation, an increase in human capital mobility, and socio-economic research.
FP 6 was designed at the time when the Commission launched the European Research Area (ERA) policy, to create a system to compete with the U.S. and Japan, which resulted in focus on scale, concentrating research resources and including larger instruments (Integrated Projects and Networks of Excellence). This made FP6 better geared to large rather than to small actors. The more traditional industrial technologies and materials no longer appeared as separate research themes in FP6 and it became a more „high-tech‟ oriented programme. FP6 also marked the creation
6 This section is based on the following reports: Boekholt, Patries et al., Impact Europese Kaderprogramma‟s in Nederland, Syntheserapport, 2009; Arnold, Erik et. al, Impacts of the Framework Programme in Sweden, Vinnova Analyses VA 2008:11, 2008; Tekes, Finns in the EU 6th Framework Programme, Evaluation of Participation and Networks, Tekes Programme Report 6, 2008.

10 Final Report
of Technology Platforms and ERA-NETs, in which groupings within the Union where encouraged to self-organise across-borders to drive R&D and innovation for their sectors or technologies. The ERA-Nets in particular opened up the FP to a new sort of participant – research funders and R&D policy makers.
With the establishment of the Technology Platforms industry was given a channel to define the research agenda for FP7. However, academia did not have its „own‟ domain in the Framework Programme, apart from the Marie Curie Fellowships and the Networks of Excellence providing networking money but no research funding. To accommodate basic research, the European Research Council was launched in FP7. With 15% the ERC takes a considerable share of the total EC budget, the second largest component after ICT (18%).
Figure 4 Breakdown of FP7 budget (in € million, 2007-2013)
64%
15%
9%
8%4%
Cooperation € 32,413 Ideas € 7510 People € 4,750
Capacities € 4,097 Joint Research Centre € 1,751
Source: Decision No. 1982/2006/EC of the European Parliament and the Council
2.1.3 The Seventh Framework Programme
FP 7 consists of five Specific Programmes: Cooperation, Ideas, People, Capacities, and
non-nuclear actions of the Joint Research Centre78. Each of these Specific
Programmes has a number of different sub-programmes.9 We will describe them for each of the Specific Programmes.
7 The JRC provides customer driven scientific and technical support to the Community policy making process („Ressortforschung‟). With a budget of €1.751 m, non-nuclear actions of the Joint Research Centre are a small part of the FP. Given its mission and its small budget we will not describe the JRC and its non-nuclear research further.
8 The European Atomic Energy Community (Euratom) adopts a separate Framework Programme for nuclear research and training activities.
9 This section is based on the following sources: http://ec.europa.eu/research/fp7/index_en.cfm, http://cordis.europa.eu/technology-platforms/, http://ec.europa.eu/research/fp7/understanding/marie-curieinbrief/home_en.html, http://cordis.europa.eu/fp7/coordination/, http://cordis.europa.eu/coordination/home.html, http://erc.europa.eu/, http://cordis.europa.eu/fp7/jtis/about-jti_en.html, http://cordis.europa.eu/fp7/art185/home_en.html, and the documents available there.

Final Report 11
2.1.3.1 Cooperation Programme
The core of FP7 is the Cooperation Programme, which represents two thirds of FP7‟s budget (see Figure 4). The main component of the Cooperation Programme is Collaborative Research. Collaborative Research aims to establish collaboration through research projects and networks that attract researchers and investments from Europe and the entire world. Its target audience are research organisations, universities, industry including SMEs and end-users. Collaborative research funds international collaborative projects across the EU in different themes. Each of these themes have their own specific objectives and issue regular calls.
Health
Food, agriculture and biotechnology
Information and communication technologies (ICT)
Nanosciences, nanotechnologies, materials & new production technologies (NMP)
Energy
Environment (including climate change)
Transport (including aeronautics)
Socio-economic sciences and humanities
Security
Space
Figure 5 Breakdown of Collaborative Research (in € million, 2007-2013)
28%
19%
13%
11%
7%
6%
6%
4%4%
2%
ICT €9,050 Health €6,100
Transport €4,160 NMP €3,475
Energy €2,350 Food, Agriculture, and Fisheries € 1,935
Environment € 1,890 Space €1,430
Security €1,400 Social Sciences and Humanities € 623
Source: http://ec.europa.eu/research/fp7/index_en.cfm?pg=cooperation
With 28% of the Cooperation budget, ICT is by far the largest thematic area, followed by health (19%), and transport (13%) (Figure 5).
Collaborative Research also includes support to Networks of Excellence, that is a Joint Programme of Activities implemented by a number of research organisations integrating their activities in a given field, carried out by research teams in the framework of longer term cooperation.

12 Final Report
Joint Technology Initiatives (JTI) are another component of the Cooperation Programme. Set up under Article 171 of the Treaty (now Article 187), JTIs are public private partnerships that support industry-driven, large-scale co-operative research across Europe in fields of key importance for industrial research, with common technological and economic objectives, supported by a mix of public and private funding. A JTI implements a common Strategic Research Agenda, which details the research and development challenges that need to be addressed. JTIs have a dedicated budget and staff and provide a framework for the public and private players to work and make decisions together. They organise calls for proposals, oversee selection procedures and put in place contractual arrangements for projects set up to implement the JTI research agenda. They thus allow funds from different sources to be jointly managed and they are responsible for the related communication and dissemination activities.
JTIs are independent legal entities that define a detailed Work Programme and directly manage all aspects of the implementation of the JTI programme. Each JTI includes a Governing Board, an Executive Director as well as other bodies, including advisory bodies, depending on its specific operational and governance needs. From a practical point of view, members can vote, participate in key decisions, and shape the policies and evolution of the Strategic Research Agenda.
Founding members of JTIs are the European Commission, not-for-profit industry-led associations, and Member States. SMEs, research organisations (including universities) and corporate members can join the associations.
Industry contribution to research through a JTI can be higher than with the traditional instruments of the Framework Programme. For example, in IMI (Innovative Medicines Initiative), the industry partners will pay 100% of their research costs, whereas under the FP instruments, industry only pays 50% of its costs. Also, JTIs allow funding from the FP to be combined with other public funding sources, including, where appropriate, the Structural Funds and the Risk-Sharing Finance Facility and, at times, national funds. This can have a significant leverage effect on private investment in JTIs and related economic activity. By facilitating increased networking between large companies and SMEs, JTIs is expected to facilitate greater investment in research by SMEs.
JTI aim at
ensuring coherent implementation of European research efforts in the strategic technological fields for the future
accelerating the generation of new knowledge, innovation and the uptake of research into strategic technologies, leading to enhanced productivity and strengthened industrial competitiveness
concentrating efforts on key projects that can help meet Europe‟s industrial competitiveness goals
enhancing the technology verification process in order to identify and remove obstacles to future market penetration
pooling user requirements to guide investment in research and development towards operational and marketable solutions.

Final Report 13
The following figure shows the five JTIs currently in place.
Figure 6 List of currently established JTIs
Nr. Acronym Full title Stated deliverables
1 IMI Innovative Medicines Initiative
Provide new tools and methodologies to remove major bottlenecks in drug development.
2 ARTEMIS Embedded Computing Systems
ARTEMIS aims to deliver the essential technology building blocks for the next generation of embedded computing systems including design methods, hardware and software.
3 CLEAN SKY
Aeronautics and Air Transport
Demonstrated technologies and concepts for environmentally-friendly, cost efficient aircraft.
4 ENIAC Nanoelectronics Technologies 2020
Development of the capabilities of nanoelectronics in Europe through the creation of an attractive R&D and human capital environment for investment.
5 FCH Fuel Cells and Hydrogen New generation of prototypes and demonstrators for testing and validation in the fields of transport, stationary and portable applications.
Source: http://cordis.europa.eu/fp7/jtis/ind-jti_en.html
Joint Technology Initiatives are a means to implement the Strategic Research Agendas of a number of European Technology Platforms (ETPs). European Technology Platforms were first introduced in the EC Communication „Industrial Policy in an Enlarged Europe‟ in December 2002. The ambition was to bring together R&D-relevant stakeholders, led by industry, to define medium to long-term research and technological development objectives and lay down markers for achieving them. The platforms also had a mandate in helping to further mobilize private and public R&D investments (cf. Barcelona target of 3% GERD by 2010). The set up of an ETP follows a bottom-up approach in which the stakeholders take the initiative and where the European Commission evaluates and guides the process.
The Commission participates as an observer in meetings of ETPs. To ensure that the European dimension is properly addressed, it provides advice and guidance on issues such as transparency and openness. During the initial setting-up phase, the role of the Commission is to promote the concept. It encourages the process of defining a long-term vision and Strategic Research Agenda (SRA). This process is mostly owned by the stakeholders and by industry in particular. Nonetheless, the supportive involvement of the Commission is often important in encouraging potential stakeholders to commit to the work of the platform. Relevant stakeholders are e.g. regulatory bodies at various geo-political levels, industry, public authorities, research institutes and the academic community, the financial world and civil society.
In general, the stakeholders fund their own costs in participating in ETPs. Where appropriate and in line with European research priorities, the Commission provides limited Community financial support for operational entities, such as secretariats. Also, the Commission funds, where appropriate, existing collaborative research projects that are integrated into European Technology Platforms as they are set up.
The financial needs of the ETPs exceed the financial capacity of FP7. Contributions from national/regional initiatives, with financing that can be complemented by financing from EU cohesion policy programmes (Structural Funds) or international initiatives like EUREKA will be instrumental in order to gather the necessary investments. Industry is also expected to provide significant contributions to the realisation of ETPs.
Technology Platforms focus on strategic issues where achieving Europe‟s future growth, competitiveness and sustainability depends upon major technological advances. They play a key role in better aligning EU research priorities to industry‟s needs. They cover the whole economic value chain, ensuring that knowledge generated

14 Final Report
through research is transformed into technologies and processes, and ultimately into marketable products and services. The policy objectives of the ETPs can be summarized as follows:
Support the development and deployment of those key technologies in Europe that are vital to address major economic and societal challenges.
Define a European vision and a strategic agenda for the development and deployment of these technologies.
Support the objective of increasing European private research investment by bringing research closer to industry and improving markets for innovative products.
ERA-NETs provide a framework for actors implementing public research programmes to coordinate their activities e.g. by developing joint activities or by mutually supporting joint calls for trans-national proposals. ERA-NET Plus provide, in a limited number of cases with high European Added Value, additional EU financial support to facilitate joint calls for proposals between national and/or regional programmes. The objective of the ERA-NET scheme is to develop and strengthen the coordination of national and regional research programmes.
The involved partners identify research programme themes. Eligible partners are national and regional authorities, research councils, and funding agencies. There has to be a minimum of three independent legal entities financing or managing publicly funded national or regional programmes. The EU funds networking, not the research undertaken. The research itself will normally be funded from national or regional sources. Funding also comes from associated countries, international organisations of European interest, and international cooperation partner countries.
Article 185 initiatives (formerly Article 169 initiatives) build on the ERA-NET scheme. Article 185 enables the Community to participate in research programmes undertaken jointly by several Member States. The recipient of the Community funding in each Article 185 initiative is a Dedicated Implementation Structure (DIS). The DIS is responsible for the administrative, financial and contractual management of the joint research programme.
Article 185 initiatives are set up individually through a Decision of the European Parliament and of the Council, via the co-decision procedure, following a proposal from the Commission. The Decision setting-up an Article 185 initiative is addressed to the Member States. Other countries, in particular FP7 Associated Countries, may join the joint programmes, in accordance with criteria laid out in each Decision.
So far four initiatives under Article 185 have been identified. Three of these are under the Cooperation programme of FP7:
AAL, a joint research programme on „Ambient Assisted Living‟;
Bonus-169, a joint research programme in the field of Baltic Sea research;
EMRP, a joint research programme in the field of Metrology (the science of measurement).
One is under the Capacities programme:
Eurostars, a joint research programme for research-performing SMEs and their partners. Eurostars is also a EUREKA programme (see below).
2.1.3.2 Ideas Programme
Newly introduced in FP7, the Idea Programme consists of the European Research Council (ERC). The ERC is a funding body that supports investigator-driven frontier research. ERC Advanced Grants support excellent frontier research projects by leading researchers, while ERC Starting Grants support independent careers of outstanding

Final Report 15
young researchers. Proposals are evaluated on the sole criterion of scientific excellence through a process of peer review. The ERC‟s target audience are junior and senior researchers from the public and the private sectors.
ERC‟s main aim is to stimulate scientific excellence by supporting and encouraging the very best, truly creative scientists, scholars and engineers. Scientists are encouraged to go beyond established frontiers of knowledge and the boundaries of disciplines.
In the long term, however, ERC looks to substantially strengthen and shape the European research system. It expects to do so through high quality peer review, the establishment of international benchmarks of success, and the provision of up-to-date information on who is succeeding and why. The hope is that these processes will help universities and other research institutions gauge their performance and encourage them to develop better strategies to establish themselves as more effective global players. The ERC expects that its grants will help to bring about new and unpredictable scientific and technological discoveries – the kind that can form the basis of new industries, markets, and broader social innovations of the future. Ultimately, the ERC aims to make the European research base more prepared to respond to the needs of a knowledge-based society and provide Europe with the capabilities in frontier research necessary to meet global challenges.
The ERC is a body of academic self-governance and operates with autonomy guaranteed by the European Commission, to which it is accountable. The ERC consists of a Scientific Council and a Dedicated Implementation Structure. The Scientific Council defines the scientific funding strategy and methodologies, whereas the Dedicated Implementation Structure implements and applies these strategies and methodologies in the management and operations of the ERC activities. The Dedicated Implementation Structure has been legally established as the ERC Executive Agency and has been fully operational since 15 July 2009.
With a budget of €7,510 million, The ERC is the second largest Programme after the Cooperation Programme (Figure 4). It has to be noted, however, that the ERC is a budget line in the FP7 budget not a permanent institution.
2.1.3.3 People Programme
The aim of the People Programme is to stimulate individuals to take up a career as a researcher, to encourage European researchers to stay in Europe, to attract researchers from the entire world to Europe, and to make Europe more attractive to the best researchers. To these ends, a series of Marie Curie Actions support the on-going training, research and mobility of highly qualified scientists within Europe and the rest of the world. These are:
Initial training of researchers is offered through the Marie Curie Initial Training Networks which will improve their research skills and help them join established research teams. In parallel, complementary training will enhance their career prospects in both public and private sectors.
Lifelong training and career development through individual fellowships and co-financing programmes at international, national and regional level. These offer experienced researchers the opportunity to acquire new skills, enhance their mobility and re-integrate them into research.
An international dimension is addressed through international outgoing and incoming fellowships aiming to increase research talent outside Europe and fostering mutually beneficial research collaboration with researchers from outside Europe. The activity also includes measures to counterbalance „brain drain‟ and create networks of European researchers working abroad.
Specific actions have been implemented to support the creation of a genuine European labour market for researchers, such as the removing of obstacles to mobility and enhancing their career perspectives. Public institutions will be

16 Final Report
offered incentives to promote the mobility, quality and profile of their researchers, as well as awards in order to improve the public awareness of Marie Curie actions and their objectives.
The main target group of the People Programme are researchers. Other target groups are organisations such as universities, research institutions, industry and SMEs. Industry participates in particular through actions directed at the initial training of researchers.
With a budget of €4,750 million, the People Programme accounts for 9% of the total FP budget (Figure 4).

Final Report 17
Figure 7 Important European RTDI in a glance, compiled by Technopolis

18 Final Report
Capacities Programme
The Capacities Programme consists of a number of activities, all aiming to build capacity in various areas.
Accounting for 8% of the total FP budget, the Capacities Programme has a budget of €4,097 m. It is divided in seven sub-programmes. With 42% and 33% of the total Capacities budget respectively, the sub-programmes targeting research infrastructures and SMEs are by far the largest (Figure 8).
Figure 8 Breakdown of Capacities Programme (in € million, 2007-2013)
42%
33%
8%
8%
4%
3% 2%
Infrastructures €1,715
SME €1,336
Research Potential €340
Science in Society €330
International Cooperation € 180
Regions of Knowledge € 126
Support to the development of research policies € 70
Source: http://ec.europa.eu/research/fp7/index_en.cfm?pg=cooperation
1. Research infrastructures
This programme supports both existing research infrastructures, including e-infrastructures, and the construction of new infrastructures and major upgrades of existing ones. The latter includes design studies through calls for proposals and builds primarily on the work conducted by the European Strategy Forum on Research Infrastructures (ESFRI).
The programme aims at optimising the use and development of research infrastructures and helping to create in all fields of science and technology new research infrastructures of pan-European interest.
2. Research for the benefit of SMEs
The programme consists of two dedicated measures:
(i) Research for SMEs: support to small groups of innovative SMEs in solving common or complementary technological problems.
(ii) Research for SME associations: support to SME associations and SME groupings in developing solutions to problems common to large numbers of SMEs in specific sectors.
The two schemes provide financial support to SMEs and SME associations to outsource research and technological development. In addition, support is granted to national schemes providing financial means to SMEs or SME associations to prepare proposals for actions under „Research for the benefit of SMEs‟. The measures are bottom-up.

Final Report 19
The target audience is mainly low to medium-tech SMEs with little or no research capability who want to outsource research to specialised RTD performers. Research intensive SMEs may participate as providers of research services or outsource research to complement their core research capability.
The aim is to strengthen the innovation capacity of European SMEs and their contribution to the development of new technology-based products and markets.
3. Regions of knowledge and support for regional research-driven clusters
The programme aims at strengthening the research potential of European regions, in particular by encouraging and supporting the development, across Europe, of regional „research-driven clusters‟ associating universities, research centres, enterprises and regional authorities. Activities include:
Analysis, development and implementation of research agendas for regional or cross-border clusters
Mentoring of regions with a less-developed research profile by highly developed ones
Various initiatives to improve integration, such as increasing researcher mobility and improving and sharing RTD infrastructure etc.
Dissemination activities: conferences, workshops, publications, web-based initiatives.
The target audience are clusters of research organisations, enterprises (large firms, SMEs), regional or local authorities and local entities such as chambers of commerce, savings banks and banks, operating in a particular scientific and technological domain or economic sector.
4. Research potential of Convergence Regions
The programme aims at stimulating the realisation of the full research potential of the enlarged Union by unlocking and developing existing or emerging excellence in the EU's convergence regions and outmost regions and at helping researchers in convergence and outermost regions to strengthen the capacities of their researchers to successfully participate in research activities at Community level. Activities include:
Transnational two-way exchanges of research staff between selected organisations in the convergence regions, and one or more partner organisations; support to selected centres of existing or emerging excellence for the recruitment of incoming experienced researchers from other European countries.
Acquisition and development of research equipment and the development of a material environment enabling the exploitation of the intellectual potential to be found in the selected centres of existing or emerging excellence in the convergence regions.
Organisation of workshops and conferences to facilitate knowledge transfer; promotional activities as well as initiatives aiming at disseminating and transferring research results in other countries and international markets.
„Evaluation facilities‟ through which any research centre in the convergence regions can obtain an international independent expert evaluation of the level of their overall research quality and infrastructures.
Target audiences are researchers and institutions in EU convergence regions and outermost regions both in the public and private sector.
5. Science in society
With a view to building an effective and democratic European knowledge-based society, the aim of „Science in Society‟ is to stimulate the harmonious integration of

20 Final Report
scientific and technological endeavour and associated research policies into European society, to bridge the gap between science professionals and those without a formal science education and to promote a taste for scientific culture in the public at large.
The initiatives undertaken in this field provide support for:
A more dynamic governance of the relationship between science and society
Research on ethics in science and technology
The reciprocal influence of science and culture
Conditions for an informed debate on ethics and science
Strengthening potential, broadening horizons
Strengthening the role of women in scientific research
Supporting formal and informal science education in schools as well as through science centres and museums and other relevant means
Reinforcing links between science education and science careers
Science and society communication
Encouraging a European dimension at science events targeting the public
Science prizes
Trans-national cooperation among National Contact Points (NCPs). FFG-EIP participates in NCP projects as well.
6. Support to the coherent development of research policies
The programme aims at enhancing the effectiveness and coherence of national and Community research policies and their coordination with other policies. The programme consists of two lines of activities:
Monitoring and analysis of research-related public policies and strategies: providing qualitative and quantitative information and analyses in support of the design, implementation, evaluation and trans-national coordination of public research-related policies and strategies.
Coordination of research policies: strengthening, on a voluntary basis, the coordination of research policies. Through this action line, European platforms are provided to share and validate good practices, bringing together the relevant stakeholders and encouraging peer reviews.
Target audience is mainly policy makers.
7. International co-operation
Initiatives under this programme include:
Bi-regional coordination of S&T cooperation including priority setting and definition of S&T cooperation policies; bringing together policy makers, scientific community, civil society and private sector stakeholders from the EU and third countries to identify priorities and define policy orientations; implementing specific activities dedicated to strengthening participation from targeted countries and regions in FP7, in particular the Western Balkan area, the Mediterranean area, EECA countries, Latin America, ACP and South Africa, and Asia.
Bilateral coordination for the enhancement and development of S&T partnerships:
Improving the provision of information on programs and funding designed to promote cooperation between Europe and specific third countries

Final Report 21
Better identifying and demonstrating mutual interest and benefit in S&T cooperation between the EU and specific third countries
Sharing best practices via joint forums such as workshops and presenting the state of the art and the prospects for cooperation in particular fields.
Supporting the coordination of national policies and activities of EU Member States and associated countries on international S&T cooperation through the ERA-NET „International cooperation‟ and the ERA-NET PLUS „International cooperation‟.
Figure 9 Logic Chart for the Cooperation Programme (FP7)
Source: http://ec.europa.eu/research/fp7/index_en.cfm, own compilation
2.1.3.4 FP intervention logics
While EU documents are quite explicit about the objectives that the Framework
Programme should achieve (although they are a bit „all over the place‟)10, they are less clear about the mechanisms by which these objectives (or impacts) should be achieved. We established intervention logics for the different components of FP7
based on existing EU documents11 but found that documents were not very explicit about the mechanisms that should lead to objectives or impacts. For example, the ultimate impacts of strengthening the scientific and technological knowledge base of Europe, ensuring Europe‟s transformation from a resource-intensive to a knowledge-
10 For example in: Decision No 1982/2006/EC of the European Parliament and of the Council of 18 December 2006 concerning the Seventh Framework Programme of the European Community for research, technological development and demonstration activities (2007-2013), 30.12.2006.
11 Main sources were the website http://ec.europa.eu/research/fp7/index_en.cfm, the links it provided, and the documents available there, in particular: Decision No 1982/2006/EC OF the European Parliament and of the Council of 18 December 2006 concerning the Seventh Framework Programme of the European Community for research, technological development and demonstration activities (2007-2013), Official Journal of the European Union, 30.12.2006, pp. 412.

22 Final Report
intensive industry, improving competitiveness and contributing to sustainable development are to be achieved through progress of knowledge and technology and creating synergies in European research (Figure 9). Of course, logic charts are more specific for the key thematic areas and the other components of the FP7 but in essence the experience was the same.
2.1.4 European Regional Development Fund
The ERDF aims to strengthen economic and social cohesion in the European Union by correcting imbalances between its regions. It supports programmes addressing regional development, economic change, enhanced competitiveness and territorial co-operation throughout the EU. The Fund operates in all Member States, co-financing investments, but is heavily concentrated in the regions with lowest GDP per capita.
The ERDF is owned by DG Regio.12
Funding priorities include research, innovation, environmental protection and risk prevention, while infrastructure investment retains an important role, especially in the least-developed regions.
Between 2007 and 2013, EU Cohesion Policy instruments provides some €86.4 billion – almost 25% of its total budget – to R&D and innovation. These investments represent more than a tripling of absolute financial resources dedicated to innovation and R&D compared to the previous period (2000-2006). This amount largely exceeds the budget of FP7 (€50.5 billion) and of the CIP (€3.6 billion).
Activities dedicated to research and innovation are:
R&D and innovation in the narrow sense (€50.5 billion): support to RTD infrastructure and centres of competence; investment in firms directly linked to research; R&TD activities in research centres; assistance to R&TD, particularly in SMEs; technology transfer and the improvement of cooperation of networks; developing human potential in the field of research and innovation; and assistance to SMEs for the promotion of environmentally-friendly products and production processes
Entrepreneurship (€8.3 billion): advanced support services for firms and support to self-employment and business start-ups
Innovative information and communication technologies to foster the demand side of ICT (€13.2 billion): in particular support to services and applications for citizens (e-health, e-government, e-learning, e-inclusion, etc.) and services and applications for SMEs (e-commerce, education and training, networking, etc.)
Human capital (€14.5 billion): support for the development of life-long learning systems and strategies in firms; training and services for employees to step up their adaptability to change, promoting entrepreneurship and change; support to development of special services for employment; training and support in connection with restructuring and development of systems anticipating future skills needs; and support to the design and dissemination of innovative and more productive ways of organising work.
12 This section is based on http://ec.europa.eu/regional_policy/funds/feder/index_en.htm and http://ec.europa.eu/regional_policy/themes/research/index_en.htm.

Final Report 23
2.1.5 Competitiveness and Innovation Framework Programme (CIP)
The Competitiveness and Innovation Framework Programme (CIP) supports innovation activities (including eco-innovation), provides better access to finance and delivers business support services in the regions. It encourages a better take-up and use of information and communication technologies (ICT) and helps to develop the information society. It also promotes the increased use of renewable energies and
energy efficiency. The CIP runs from 2007 to 2013 with a total budget of €3,621m.13
Various European initiatives, some of them going back some 20 years, have been grouped in the CIP, making the programme rather heterogeneous.
CIP is jointly managed by five Directorates-General in the European Commission: DG Enterprise and Industry; DG Economics and Financial Affairs; DG Environment; DG Information Society and Media; and DG Energy and Transport. Implementation of parts of CIP is delegated to the Executive Agency for Competitiveness and Innovation, the European Investment Bank and the European Investment Fund.
The CIP‟s overarching aim is to contribute to the enhancement of competitiveness and innovation capacity in the Community, the advancement of the knowledge society, and sustainable development based on balanced economic growth.
The CIP is divided into three operational programmes. Each programme has its specific objectives, aimed at contributing to the competitiveness of enterprises and their innovative capacity in their own areas, such as ICT or sustainable energy:
The Entrepreneurship and Innovation Programme (EIP) aims to improve the competitiveness and innovativeness of European enterprises and particularly, small and medium sized enterprises (SMEs). Measures funded through the EIP include: financial instruments designed to facilitate access to SME financing and investment for innovation activities; the Enterprise Europe Network which provides information and advice to SMEs on common market opportunities and Community issues; support for innovation; and support for policy making.
The Information and Communication Technologies Policy support Programme (ICT-PSP) aims to stimulate innovation and competitiveness through wider uptake and best use of ICT and digital content by citizens, governments and businesses. It provides funding for operational demonstrations of technological and organisational solutions for ICT-based services, notably in the areas of public interest (like low-cost ICT access to elderly residents or people in deprived communities, projects linked to telemedicine, projects using ICT to help reduce energy consumption). This helps open a wide range of new business opportunities in particular for innovative SMEs that provide such solutions.
The Intelligent Energy – Europe Programme (IEE) aims to foster energy efficiency and the rational use of energy resources; promote new and renewable energy sources and to support energy diversification; and promote energy efficiency and the use of new and renewable energy sources in transport. The programme addresses non-technological barriers to take-up sustainable energy through the provision of support for „soft measures‟, such as awareness raising and information provision; building and spreading of know-how; development of skills and methods; exchanges of experience; capacity building; development of market and intelligence; education and training; and policy input.
13 This section is based on http://ec.europa.eu/cip/ and the documents available thereon, in particular: GHK and Technopolis, Interim Evaluation of the Competitiveness and Innovation Framework Programme (2007-2010), Manchester, March 2010.

24 Final Report
SMEs are the main target group of the CIP. However, depending on the topic of specific measures, other relevant target groups are public authorities, policymakers, energy agencies, education and training providers, industry associations etc.
2.1.6 EUREKA
2.1.6.1 EUREKA individual R&D projects
Created as an intergovernmental initiative in 1985, EUREKA currently has 40 full members: EU-27 and EFTA countries (excluding Liechtenstein), neighbouring European countries (including Russia and Turkey), and Israel. Two countries, Albania and Bosnia-Herzegovina, participate in EUREKA projects through a network of National Information Points. South Korea has the status of an associated country. EUREKA's mission is to increase the competitiveness of European industry by supporting close to the market industrial R&D.
EUREKA individual R&D projects are the core activity of EUREKA. Individual projects are market-oriented R&D projects labelled – but not funded – by EUREKA based on its bottom-up approach and involving partners from at least two EUREKA member
countries14. Through a EUREKA individual project a consortium develops a new project, technology and/or service for which they agree the Intellectual property rights and build partnerships to conquer new markets. EUREKA projects are always led by industry, often by SMEs. Projects are nationally funded – either by participants themselves and/or by national funding bodies.
The target group are SMEs, large companies, universities, research institutes and government administrations across all technological sectors.
2.1.6.2 EUREKA Umbrellas
EUREKA umbrellas are thematic networks within the EUREKA framework which focus on a specific technology area or business sector. At least five partners are needed to set up an Umbrella. All umbrella activities are coordinated and implemented by a working group consisting of EUREKA representatives and industrial experts. Currently, there are seven Umbrellas in the following six areas:
Information technology
Medical and biotechnology
Transport
Laser
New materials
Robotics
EUREKA Umbrellas define a four-year action plan to generate R&D projects between actors in EUREKA member states, e.g. through partner database or road shows. They also give partners advice on how to plan and conduct such a project. The main goal of an umbrella is to facilitate the generation of EUREKA projects in its own target area.
14 However, some member countries have earmarked funding for EUREKA participants.

Final Report 25
2.1.6.3 EUREKA Clusters
EUREKA Clusters are long-term, strategically significant industrial public-private initiatives. They usually have a large number of participants, and aim to develop generic technologies of key importance for European competitiveness, primarily in ICT and, more recently, in energy, manufacturing, and water.
Initiated by industry in close collaboration with national funding authorities, each Cluster defines a technological roadmap setting the most important strategic domains. Specific goals are achieved through scores of individual projects.
EUREKA Clusters are legal entities. They have their own Secretariat, which is in charge of administrating the projects and communicating with the actors involved in the projects. The Clusters normally organise a yearly thematic call for proposals.
EUREKA Clusters are very similar to JTIs, for which reason the two instruments get coordinated at European level. The overlap concerns mainly the EUREKA Clusters Catrene and ITEA2 and FP7‟s JTIs Artemis and Eniac.
Clusters aim to exploit the technologies developed through existing national and European programmes and play an important role in defining European standards and interoperability. They also aim to contribute to increased competitiveness of the European industry. They are targeted at groups of companies and research organisations willing to set up a cluster.
2.1.6.4 Eurostars
The Eurostars Programme aims at stimulating research-intensive SMEs to lead international collaborative research and innovation projects by easing access to support and funding, enabling them to compete internationally and become leaders in their sector. The big difference between Eurostars and the other EUREKA programmes is that for Eurostars, all participating countries have earmarked funds, whereas in the other EUREKA programmes research is funded nationally, i.e. each participant has to obtain funding from national sources or from own funds.
Eurostars projects are market-driven and collaborative, meaning they must involve at least two participants (legal entities) from two different Eurostars participating countries. In addition, the main participant must be a research-performing SME (10% or more of full-time equivalent or annual turnover in research activities) from one of these countries. The role of the SME participants in the project should be significant. At least 50% of the project‟s core activity should be carried out by SMEs. However, any type of organisation (SME, large company, university, research institution) can participate in a Eurostars project consortium.
The consortium should be well balanced, which means that no participant or country is allowed to invest more than 75% of the total project costs. A typical Eurostars project has a total value of €1.3–1.5 million and involves between two and three SMEs, a larger company and sometimes also a research institute or a university.
EUREKA's Eurostars Programme is an Article 185 initiative. This has to be seen against the background of Member States having called for a strengthened EU-EUREKA cooperation. Eurostars falls within the 'Research for the benefit of SMEs' part of the Capacities Programme. Hence, the Community financial contribution is taken from the budget appropriation allocated to that part. The Community funds go to the Dedicated Implementation Structure (DIS). The original amount of public funding committed for Eurostars is €400 million for the period 2007-2013, €300 million provided by Eurostars member states and €100 million from FP7. Meanwhile, some member states have increased their contribution.

26 Final Report
Figure 10 Logic Chart for EUREKA programmes
Source: www.eurekanetwork.org, own compilation

Final Report 27
2.1.6.5 EUREKA intervention logics
We developed logic charts for the different parts of the EUREKA programme. For this we relied solely on the EUREKA website, whose information content is somewhat
scarce15. As with the logic charts produced for the FP, the mechanisms by which the four EUREKA programme produce effects are only sketchily described (Figure 10). Nonetheless, the logic charts give a good idea of the primary concern of EUREKA – increasing the competitiveness of European industry, in particular SMEs.
2.1.7 COST
COST stands for Scientific Cooperation in Science and Technology16 and like EUREKA is an intergovernmental initiative. COST was established in 1971 and is the oldest of the networking mechanisms through which European researchers collaborate. COST currently has 36 member countries. Like EUREKA, COST membership goes beyond the EU, consisting not only of EU-27 countries but also EFTA countries, neighbouring Eastern European countries and Israel.
COST is distinct from the EU Framework Programme in that it provides money to support networking rather than itself funding research. As such, it allows the coordination of nationally-funded research on a European level. COST‟s aim is to group national research projects in so-called Actions, thus making better use of knowledge, equipment and resources available in Europe and creating sustainable, innovative and interdisciplinary networks.
Each COST Action is a network centred on nationally-funded research projects in fields that are of interest to at least five COST countries. Like EUREKA, COST is bottom-up. Compared to EUREKA, it is more orientated towards basic research but always use-orientated. COST provides COST Actions with financial support for joint activities such as conferences, short-term scientific exchanges, training schools for early-stage researchers, and publications. COST is funded by FP7 despite not being an FP7 instrument and having its own governance structures.
COST‟s main target groups are researchers from universities, research institutes and firms. However, industry participation in COST Actions is low, ranging between 5%
and 25%, depending on the sub-field.17
A recent evaluation18 found that COST builds and nurtures networks which often go on to submit FP proposals. Being bottom-up, it is ideal for new scientific fields and emerging technologies, to develop topics and build new agendas. As such, it is complementary to the FP, which is more about reflecting current thinking.
2.1.8 European Science Foundation
The European Science Foundation (ESF) is an association of 79 member organisations devoted to scientific research in 30 European countries. It was established in 1974, as a result of a Franco-German initiative, providing a European arena for its member organisations and for the scientific communities that in practice govern them. History dictates that the member organisations are heterogeneous. Around two thirds of member organisations are research-funding organisations („research councils‟), approximately a quarter are research-performing organisations and the rest are
15 The large amount of information we were given by the Austrian representatives of EUREKA, though very useful, did not extend to policy documents, while the European expert we consulted told us that policy documents were confidential.
16 More precisely for: Coopération Scientifique en Science et Technologie 17 Good, Barbara et al., COST in Deutschland, Vienna/Brighton, August 2010. 18 Good, Barbara et al., COST Comprehensive Impact Assessment, Final report, Vienna/Brighton,
December 2009.

28 Final Report
academies. Differences in national practice mean that some academies are not only research funders but also research performers while others are „learned societies‟ or focus on celebrating and rewarding scientific excellence or providing advice.
One pillar of ESF‟s strategy is Science Synergy – essentially networking operations involving the scientific community. The main instruments are EUROCORES and the Research Networking Programmes.
2.1.8.1 EUROCORES
EUROCORES are large-scale collaborative research programmes dealing with broad and complex topics that are thought to be best addressed through multinational cooperation. ESF is running the scheme on behalf of the participating ESF member organisations. The research funding as well as funding for coordination and networking come from the national funding organisations, that is, ESF member organisations. However, EUROCORES are not nationally or strategically driven but rather researcher-lead and developed in consultation with the participating funding organisations. The target audience are national funding organisations and the scientific community.
As part of a structured approach to EUROCORES development, the ESF invites new and challenging ideas for EUROCORES Programmes from the scientific community. Such „bottom-up‟ EUROCORES themes can be submitted to the ESF once a year. The scheme has currently around 40 programmes running in various stages of development.
The EUROCORES Scheme was funded for five years and a half by FP6. Under the 5-year contract between ESF and the Commission, which ended in March 2009, the cost of scientific coordination and networking for all 23 running EUROCORES
programmes was borne by the Commission.19 The research grants for each of the participating Individual Projects was directly granted by a participating ESF member organisation (national research funding or performing organisations and academies).
The aim of EUROCORES is to enhance synergy at a pan-European level by providing a framework to bring together national research funding organisations and supporting interdisciplinary research in non-traditional areas, thereby opening new horizons in science.
2.1.8.2 Research Networking Programmes
An ESF Research Networking Programme (RNP) is a networking activity bringing together nationally funded research activities for four to five years, to address a major scientific issue or a science-driven topic of research infrastructure, at the European level with the aim of advancing the frontiers of science.
Programmes are funded by ESF member organisations. A Programme includes the following activities: science meetings (workshops, conferences or schools), short and exchange visits, publication of information brochures and leaflets, DVDs and CD-Roms, scientific books and meeting proceedings; creation and management of dedicated websites; creation and maintenance of scientific databases at the European level. RNPs are very similar to COST Actions.
The target audience are ESF member organisations and the European scientific community. The overall goal of RNPs is to advance scientific knowledge and research. Other objectives include creating interdisciplinary fora, sharing knowledge and expertise, developing new techniques, and training young scientists.
19 Marc Heppner/ESF, EUROCORES Scheme (European Collaborative Research), Specific Support Action. Final Activity Report, 2009.

Final Report 29
2.1.9 ERA Initiatives
As a result of the 2007 stakeholder consultation on the European Research Area (ERA), the European Commission published five follow-up ERA initiatives to speed up
its implementation.20 The ERA initiatives have led to a process of increased cooperation between Member States and the European Commission. They represent regulatory and coordination efforts rather than research-funding programmes – perhaps with the exception of Joint Programming which will eventually lead to joint calls.
2.1.9.1 Joint Programming
Joint Programming is a structured and strategic process whereby Member States define, through a voluntary and à la carte process, common visions and strategic research agendas to address major societal challenges. The overall aim of Joint Programming is to make better use of Europe's public R&D resources by pooling national research efforts and to foster a structuring effect so as to increase the efficiency and impact of public research funding. Joint Programming builds on the experience gained from existing schemes that coordinate national programmes such as the ERA-NET scheme and Article 185 initiatives, as well as from the agenda setting practices of European Technology Platforms.
A High Level Group (GPC21) consisting of nominees from Member States identify suitable Joint Programming areas, following a thorough consultation of stakeholders. The GPC identified the first themes for Joint Programming Initiatives (JPI) in November 2009:
Agriculture, food security and climate change
A healthy diet for a healthy life (formerly known as „Health, food and prevention of diet-related diseases‟)
Cultural heritage & global change (formerly known as „Cultural heritage, climate change and security‟)
The GPC identified a „second wave‟ of themes for JPI in May 2010:
Urban Europe (suggested by Austria)
Climate Knowledge for Europe (CliK'EU)
More years, better lives
Antimicrobial resistance
Water challenges
Healthy & productive seas and oceans
Once the initiatives have been identified, they will start with developing a vision for the area, defining a Strategic Research Agenda (SRA) and objectives, and preparing for implementation of the SRA.
Membership in Joint Programming is voluntary, emphasis is on pooling only public research funds. Eligible members are national governments. Joint Programming does not involve Community funding a priori. It is first and foremost about Member States defining common strategies and putting together national resources. The Commission is mainly a facilitator, although EU funds may be available to certain initiatives depending on their added value and European dimension.
20 This section is mainly based on http://www.era.gv.at/space/11442/directory/11766.html and http://ec.europa.eu/research/era/areas/areas_of_action_en.htm.
21 Groupe de haut niveau pour la Programmation Conjointe

30 Final Report
2.1.9.2 Research Infrastructures
This initiative will consider providing a legal framework to assist Member States to develop and fund pan-European research infrastructures that their national legal instruments might not be able to facilitate. The proposed regulation will facilitate the joint establishment and operation of European research facilities among several Member States and Associated States.
This activity is in addition to the implementation of research infrastructures in FP7‟s Capacities Programme. The Community legal framework for a European Research Infrastructure Consortium (ERIC) entered into force on 28 August 2009. This new legal form is designed to facilitate the joint establishment and operation of research facilities of European interest.
2.1.9.3 Knowledge Sharing (IP Management)
In April 2008 the Commission adopted a Recommendation on the management of Intellectual Property Rights in knowledge transfer activities and a Code of Practice for universities and other public research organizations (IP-Recommendation, often also referred to as „IP-Charta‟). The – voluntary – Recommendation and the Code of Practice offer a coherent framework for the management of IP in agreement between public research organisations and the private sector, in order to promote knowledge transfer at national, European and international levels. They comprise a set of key policy recommendations to Member States, and an annex containing examples of good practice from several Member States.
The objective is to facilitate and promote the optimal use of intellectual property created in public research organisations to increase both knowledge transfer to industry and the socio-economic benefits resulting from publicly funded research.
2.1.9.4 Researchers‟ Partnership
The European Commission released its Communication entitled „Better careers and more mobility: a European partnership for researchers‟ in May 2008. The Commission proposed to develop a Partnership (for three years) between the Member States and the Commission to jointly drive forward a number of targeted priority actions in key areas for securing adequate and excellent human resources for R&D in Europe. Key areas for action are the systematic opening up of recruitment, meeting the social security and pension needs of mobile researchers, providing fair employment and working conditions, and ensuring that researchers have the right training and skills. As a result, Member States are establishing common guidelines for the implementation of the Partnership, identifying best practices and developing respective national actions plans.
The partnership aims to make the EU a more attractive place for researchers, and allow researchers to be more mobile between countries, institutions, and between the academic and private sectors.
2.1.9.5 International Science and Technology Cooperation
One of the overriding features of the research landscape is the increasing globalisation of R&D. Cooperation based on mutual benefit with third countries is crucial to the Community's scientific, political and economic objectives. However, the efforts of the Member States and the Commission are often not well coordinated and lead to duplication of activities. It was therefore necessary to agree on and implement a common policy framework for international S&T cooperation. To support these goals, a high level group, the Strategic Forum for International S&T Cooperation, has also been established.
The objective of this initiative is to develop a partnership between Member States and the Commission with regard to setting up common priorities and initiatives in the area of international scientific and technological cooperation. Activities and positions of

Final Report 31
Member States and the Commission vis-à-vis third countries should be better coordinated or even developed together.
2.1.10 Conclusions
First, it is evident that the FP is a complicated programme. This chapter was originally called „European RDTI initiatives at a glance‟. However, we decided to drop the „at a glance‟ when we discovered we needed 23 pages to describe the major European RTDI initiatives, of which 14 pages alone describe the basics of FP7! It is not a surprise that Member States – even the less affluent ones – have large support structures to help researchers navigate through the FP. For this reason, it is absolutely vital for stakeholders at all levels to avoid any actions that would further contribute to a lock-in, i.e. create (additional) parties that have an interest in maintaining a complicated FP. If more parties have an interest in maintaining a complicated FP then it is less likely the simplification agenda will be realised.
Second, in European RTDI policy the European Commission has a finger in more or less every pie. The Commission‟s sphere of influence is not limited to the EU programmes alone – the FP, CIP, and, most importantly given its budget, ERDF. COST‟s networking activities are paid for by FP7, the scientific coordination and networking of a part of ESF‟s EUROCORES are paid for by FP6, and with Eurostars EUREKA has also succumbed to Brussels‟ money. We agree with the FP6 evaluation that argued that this concentration of power risked a monotony of thinking and ideas,
precluding the benefits of diversity in the European research system22.
Third, the logic charts show that European players have certainly given a great amount of thought to objectives and rationales of the FP (and EUREKA) but less so about mechanisms through which impacts arise. In order to maximise benefits of various RTDI programmes, it would be useful to think more carefully about the channels through which benefits arise. Because thinking about them, one might realise that the expected objectives are very difficult to achieve with the activities planned or carried out or that time frames are so long that unexpected events are likely to interfere. Thinking more carefully about programmes‟ intervention logics might also help improve the European RTDI landscape as a whole. As this chapter has shown, many issues are tackled by more than one initiative, resulting in overlaps between (sub-) programmes, me-too-programmes and unclear programme identities.
Fourth, there are various developments going on in FP7, some of them started in FP6:
The ERA-Net scheme, Article 185 Initiatives and Joint Programming show clear tendencies towards the Commission influencing Member State research and innovation budgets and imposing forms of governance that involve actors at the level of Member States but often bypass the agents of the states themselves so that the Member States are involved but disempowered. The ERA-Net and ERA-NET Plus schemes are precursors of Joint Programming that delegates agenda setting to Member State agencies while the Commission retains some control of what is started and the number of organisations in the coalitions through funding competitions and its use of subsidy.
The Joint Technology Initiatives testify to the recent FPs‟ trend to delegate administration from the Commission to research performers and promote self-organisation by established interest groups. In other words, the stakeholders involved do the governance but the Commission and to a more variable degree the Member States hold the purse strings.
22 Rietschel, Ernst T.H. (chair), Evaluation of the Sixth Framework Programmes for Research and Technological Development 2002-2006, Report of the Expert Group, Brussels, European Commission, 2009.

32 Final Report
The introduction of the European Research Council (ERC) in FP7 provided an extension of traditional academic self-governance into the FP. This may explain why it was so readily embraced by the scientific community.
The European Technology Platforms launched in the latter part of FP6 allow actors – especially industry – to self-organise to define research strategies, which they then look to the Commission and to the Member States to fund. This reinforces the trend of the FP as an instrument that reflects current thinking and does not set new directions in research (a „consensus-reinforcing mechanism‟): while the process of FP design is not very transparent, it is nonetheless clear that established lobby groups take an important role and that the Commission understandably reacts cooperatively when offered coherent visions and road maps that show what the FP should do in the future. However, according to the FP6 evaluation, the FP needs to be more than a reflection of what competing beneficiary or stakeholder communities want at the outset.
However, beyond the ERC, there is little in the FP that encourages exploration of new possibilities in a way that is detached from established interest groups. This is to a certain extent offset by COST and ESF‟s EUROCORES and Research Networking Programmes, which are bottom-up and researcher-driven, and – closer to the market – by EUREKA, which is bottom-up and market-driven.

Final Report 33
2.2 Austrian and European RTDI initiatives – a success story?
2.2.1 Motives and barriers for participating in major European RTDI initiatives
2.2.1.1 Relevance of different funding schemes for the sampled Austrian researchers
In order to capture the relevance of various funding programmes to Austrian researchers, we asked participants in both online surveys to rate the schemes on a scale from 1=not relevant to 5=highly relevant. Figure 11 shows the results for national schemes broken down by type of organisation for the main online survey as arithmetic means of the responses. As all respondents either participated in a European project or have at least shown interest in them (by obtaining advice from FFG-EIP), this figure reflects usage patterns of national programmes from the point of view of users active in European programmes.
As can be expected, considerable differences exist between the types of organisations analysed. For the respondents from industry, fiscal support and the General Programmes offered by FFG are the most important channels for RTDI funding. For large firms, fiscal support is rated, on average, with 4.3 on the stated 5-tier scale, and with 4.2 for the General Programmes. For SMEs, the mean ratings given for fiscal support and FFG General Programmes are 3.7 and 3.9, respectively. For large firms, FFG Structural Programmes (3.3) and FFG Thematic Programmes (3.5) are also relevant but not the programmes offered by aws (2.0) and, not surprisingly, the FWF (1.9). SMEs value the Structural and Thematic Programmes only slightly less (rating of 3.0, respectively). For them, however, aws programmes (average rating of 2.9) are of more value than for large firms. Innovation support provided by the provinces is quite important, on average, to both SMEs and large firms – they are more relevant than the programmes offered by aws.
Figure 11 Relevance of various types of national research funding programmes*)
3,3
3,7
3,1
1,8
3,2
2,8
1,9
3,4
3,7
3,5
2,2
4,5
2,9
1,9
4,2
3,5
3,3
2,0
1,9
3,2
4,3
3,9
3,0
3,0
2,9
2,3
3,5
3,7
1,0 1,5 2,0 2,5 3,0 3,5 4,0 4,5 5,0
FFG General Programmes
FFG Thematic Programmes
FFG Structural Programmes
aws Programmes
FWF support
Innovation support by Federal States
Fiscal support
SMEs Large firms Universities Non-university R&D organisations
*) Arithmetic means on an average from 1=no relevance to 5=high relevance Source: Main online survey, n = 364
For researchers from universities, the picture looks quite different. By far the most important source of funding among the enquired schemes are the funds provided by the FWF with an average rating of 4.5 on the 5-tier scale. The programmes offered by

34 Final Report
the FFG are all rated with medium to rather high relevance in a bandwidth between 3.4 and 3.7, while innovation support offered by the provinces (2.9) and aws programmes (2.2) are relevant only for a comparably small share of university researchers. The non-university research sector values, on average, FFG Thematic Programmes most (rating of 3.7), followed by the General Programmes (3.3) and FWF funding (3.2). None of the funding channels listed has received very high average relevance ratings among the non-university researchers.
We interpret this – in line with the findings from the focus groups - in the way that these institutions draw on a variety of funding channels at the same time with none particularly sticking out, out of a need to obtain considerable shares of third party funding. All together these results corroborate one important finding of the systems
evaluation23, namely the strong reliance of this sector on direct public research funding.
As for the whole of the sample of researchers surveyed, it becomes clear that the majority of the actors in European programmes are also highly (and generally even more) involved in national programmes.
We now turn our attention to the relevance of European schemes to the researchers sampled. Figure 12 indicates two important results already at a glance: First, that among the European programmes it is especially the Framework Programme that is on average seen as relevant; and, secondly, that the scientific community (university researchers, and to slightly lesser extent the non-university research sector) considers European initiatives – foremost the FP programme and related offers – as more relevant than researchers in industry do.
For university researchers, the most important European funding schemes are the traditional RTD collaboration projects in the FP, followed by specific instruments in the FP for the development of human resources, special instruments in FP6 and the ERC grants. Interestingly, special instruments in FP7 (such as the JTIs) are valued considerably lower than the special instruments of the sixth FP. This could be explained by the higher accessibility of the special instruments in FP6 (i.e. Networks of Excellence, Integrated Projects) when compared to FP7.
Apart from the FP, university researchers also gauge COST, ESF programmes, the ERA-Nets and the ERC grant schemes relevant to some degree. Other initiatives are rather not relevant. It is especially the ERC grant scheme that has been drawing considerably more attention lately, mainly for two reasons: Its principal functions are well known and proven in basic research, and its bottom-up approach makes the Framework Programme accessible to fields of research which have been, until now, barely addressed if at all.
To interpret the results it is also important to acknowledge that the number of valid responses for this question decreases with average relevance of the scheme (i.e. the less relevant the scheme is perceived to be, the higher is the number of respondents ticking „don't know‟). If one interpreted the share of don't knows as an indicator of (ir)relevance, then the general picture displayed in Figure 12 would be more accentuated than it already is. Such an accentuated picture would be in line with the results from interviews and our focus groups where there was a consensus among university representatives “[...] that the by far most important European programme is the Framework programme, especially because of the funding volumes involved, while the other initiatives are „side dishes‟ at best” (focus group participant).
The response pattern of researchers in the non-university research sector follows by and large that of the university researchers, notable exceptions being FP instruments fostering Human Resources, ERC grants, COST and ESF/Eurocores. These initiatives
23 Sabine Mayer et al., Das Angebot der direkten FTI-Förderung in Österreich, Teilbericht 5, Systemevaluierung 2009.

Final Report 35
are less relevant for non-university researchers than for university researchers. Taking into account that the relevance ratings for other European schemes such as the EUREKA programme family or the CIP are also toward the lower end of the scale, it becomes evident that the Framework Programme projects (and mainly the traditional RTD collaboration projects) are by far the most important type of European project for non-university research organisations in Austria.
As for industry respondents, it is interesting to note that none of the European schemes obtain particularly high relevance ratings. In comparison, large firms attain the most benefits in traditional collaboration projects in FP7 (average rating of 3.3, which is also the highest rating given among industry respondents for any of the European schemes). Apart from collaboration projects in the FP, all other schemes received average relevance ratings from large firms of less than 2.5. This includes special initiatives such as JTI, and the results may be attributed to the young age of these initiatives. However, as the JTIs can be of particular importance for selected large firms and industry players, an average may not do the JTIs fully justice.
The results for SMEs are not very encouraging either. Again, traditional collaboration projects in FP7 fare - by comparison - best (average relevance rating: 2.7), and some relevance is also seen in special instruments as well as EUREKA. For EUREKA it is interesting to note that Eurostars is seen, on average, as highly irrelevant and also as less relevant than the classic EUREKA projects. This may point to a visibility problem especially of the „new‟ EUREKA scheme Eurostars, a fact corroborated also by the interviewed experts (given that Eurostars is explicitly addressing SMEs). Overall, the pictures outlined in Figure 11 and Figure 12 – with average ratings among SMEs for all schemes less than 2.7 - deliver the first indication that European RTDI initiatives may be only relevant for a small slice of the (innovating) SME population (see also below the results of the control group). Even for these they seem to be on average more of an added benefit to other (national) sources of funding than a substantial pillar within the funding system.

36 Final Report
Figure 12 Relevance of European RTDI initiatives to the researchers surveyed*)
3,4
3,5
2,6
3,6
2,4
2,7
2,1
2,7
1,9
1,8
1,7
1,4
1,9
1,9
2,5
3,2
3,5
3,4
3,7
2,6
3,5
3,2
2,8
2,5
2,2
2,2
2,1
2,2
2,9
3,1
2,8
2,4
1,7
3,3
2,3
1,9
1,5
2,1
2,4
2,3
1,8
1,9
2,0
1,6
1,9
2,6
2,5
1,6
2,7
2,3
1,8
1,3
1,7
2,4
1,6
1,7
2,0
1,5
1,4
1,7
1,0 1,5 2,0 2,5 3,0 3,5 4,0 4,5 5,0
Classic RTD cooperation projects in FP6
Special instruments and initiatives within FP6
Specific instruments for HR in FP6
Classic RTD cooperation projects in FP7
Special instruments and initiatives within FP7
Specific instruments for HR in FP7
ERC Grants
ERA-Nets and calls within ERA-Nets
EUREKA
EUREKA-Eurostars
EUREKA-Umbrellas
EUREKA-Clusters
CIP
Eurocores and Research Networking Programme of the ESF
COST
SMEs Large firms Universities Non-university R&D organisations
*) Arithmetic means on an average from 1=no relevance to 5=high relevance Source: Main online survey, n = 283 to 364, depending on the scheme (Note: Lower average relevance ratings correlate with lower n and with a higher share of „don't know‟ responses)
2.2.1.2 Motives for participating in the Framework Programme
Survey results show that the most important motive for participating in the FP is „to access research funding‟ (Figure 13). 68% of respondents stated that access to research funding was very important, 24% stated it was quite important (mean 4.5). This is followed by the motive „to develop new or improved relationships and networks‟, which 58% regard as very important and 31% as quite important (mean 4.4). In other words, FP participants may be keen on EU funding but they also appreciate and identify with one of the main objectives of the FP, namely to network researchers in Europe. This result may not invalidate the statement of one interviewee who had the distinct impression that FP consortia are like “packs of wolves in search of food” but it qualifies it.

Final Report 37
We often heard in interviews and focus groups that if researchers want to obtain public funding for their international research projects, there is hardly a way around the FP. Among public funding sources, none is anywhere as attractive as the FP for international R&D projects, because it works as one-stop-funding for the entire project. It was also very obvious that researchers want to work internationally and if they manage to define their topics and consortia according to the rules of FP they go there, no matter how bad its reputation might be – see the main barriers below (chapter 2.2.1.5)
Figure 13 Motives for participating in the FP*)
2,6
2,7
2,8
2,9
2,9
3,0
3,2
3,2
3,3
3,5
3,7
3,7
3,9
4,2
4,3
4,3
4,4
4,5
1,0 1,5 2,0 2,5 3,0 3,5 4,0 4,5 5,0
To develop new or improved regulations or policies
Access to new markets
Usage of mobility schemes (To facilitate the mobility of researchers)
To create new or improved facilities or infrastructures
To develop new or improved commercial products or services
To provide training
To share the risks/costs associated with the project
To access research facilities/ infrastructure that do no exist in Austria
To improve the coordination of research
To create or secure jobs
To access capabilities that do not exist in Austria (complementary expertise)
To tackle issues that are not adequately addressed by national programmes
To develop new or improved tools, methods or technqiues
To tackle problems that have a European or international dimension
To develop and extend internal knowledge and capabilities
To address specific scientific or technical questions, problems or issues
To develop new or improved relationships and networks
To access research funding
*) Arithmetic mean on a scale from 1=not important to 5=very important Sources: Main online survey, n=319
Other motives that follow are more intrinsic such as „to address specific scientific or technical questions, problems or issues‟ (mean 4.3), „to develop and extend internal knowledge and capabilities‟ (mean 4.3), and „to tackle problems that have a European or international dimension‟ (mean 4.2). The least important motive is „to develop new or improved regulations or policies‟ (2.6).

38 Final Report
Figure 14 Motives for participating in the FP compared to the control groups‟ motives for engaging in international R&D cooperation *)
4,5
4,3
4,4
4,3
3,7
3,2
3,2
4,2
3,3
3,0
2,8
3,9
2,9
2,6
3,7
2,9
2,7
3,5
3,0
4,5
4,2
4,5
3,8
3,1
2,8
3,1
2,6
2,4
2,2
4,1
3,6
2,0
2,6
2,5
3,0
3,1
1,0 1,5 2,0 2,5 3,0 3,5 4,0 4,5 5,0
To access research funding
To develop and extend internal knowledge and capabilities
To develop new or improved relationships and networks
To address specific scientific or technical questions, problems or issues
To access capabilities that do not exist in Austria (complementary expertise)
To access research facilities/ infrastructure that do no exist in Austria
To share the risks/costs associated with the project
To tackle problems that have a European or international dimension
To improve the coordination of research
To provide training
Usage of mobility schemes (To facilitate the mobility of researchers)
To develop new or improved tools, methods or technqiues
To develop new or improved commercial products or services
To develop new or improved regulations or policies
To tackle issues that are not adequately addressed by national programmes
To create new or improved facilities or infrastructures
Access to new markets
To create or secure jobs
Control group FP participants
*) Arithmetic mean on a scale from 1=not important to 5=very important Sources: Main online survey, n = 319; control group survey, n = 175
International R&D cooperation is a common activity among the members of our control group: out of 479 respondents, 205 (43%) respondents have been engaged in international R&D cooperation projects in the last five years, albeit not in FPs or in EUREKA. They normally finance these projects from their own source, partly with
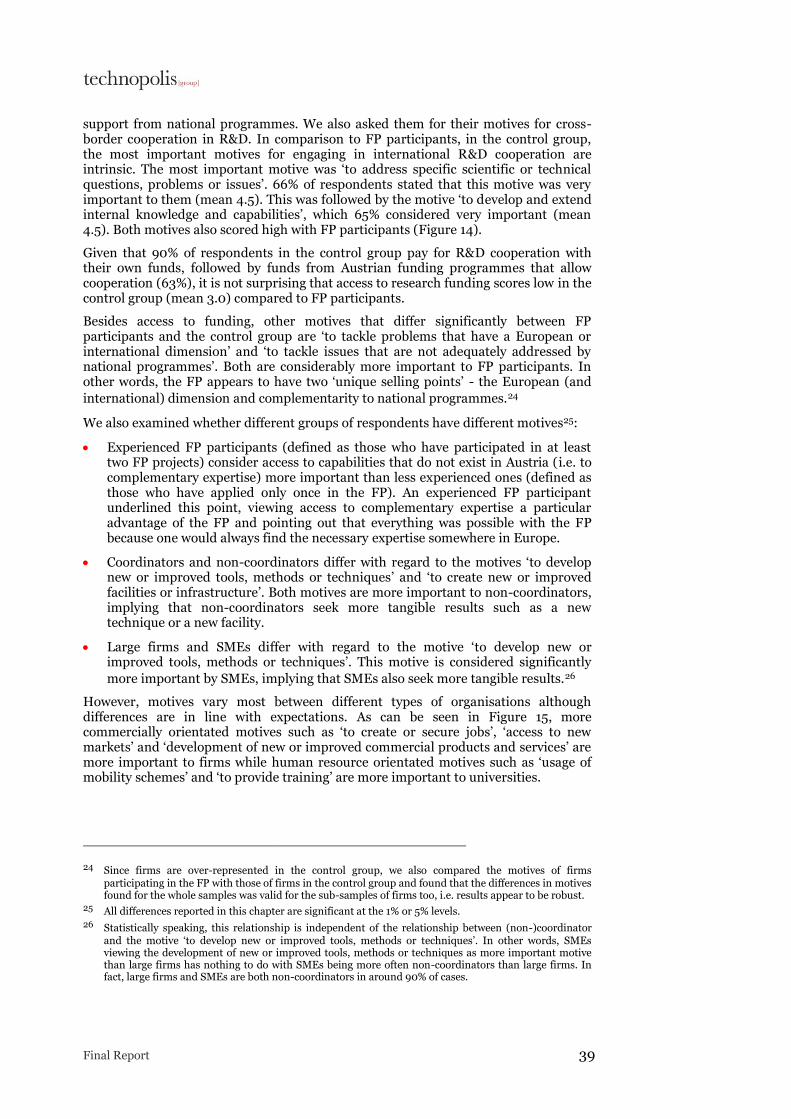
Final Report 39
support from national programmes. We also asked them for their motives for cross-border cooperation in R&D. In comparison to FP participants, in the control group, the most important motives for engaging in international R&D cooperation are intrinsic. The most important motive was „to address specific scientific or technical questions, problems or issues‟. 66% of respondents stated that this motive was very important to them (mean 4.5). This was followed by the motive „to develop and extend internal knowledge and capabilities‟, which 65% considered very important (mean 4.5). Both motives also scored high with FP participants (Figure 14).
Given that 90% of respondents in the control group pay for R&D cooperation with their own funds, followed by funds from Austrian funding programmes that allow cooperation (63%), it is not surprising that access to research funding scores low in the control group (mean 3.0) compared to FP participants.
Besides access to funding, other motives that differ significantly between FP participants and the control group are „to tackle problems that have a European or international dimension‟ and „to tackle issues that are not adequately addressed by national programmes‟. Both are considerably more important to FP participants. In other words, the FP appears to have two „unique selling points‟ - the European (and
international) dimension and complementarity to national programmes.24
We also examined whether different groups of respondents have different motives25:
Experienced FP participants (defined as those who have participated in at least two FP projects) consider access to capabilities that do not exist in Austria (i.e. to complementary expertise) more important than less experienced ones (defined as those who have applied only once in the FP). An experienced FP participant underlined this point, viewing access to complementary expertise a particular advantage of the FP and pointing out that everything was possible with the FP because one would always find the necessary expertise somewhere in Europe.
Coordinators and non-coordinators differ with regard to the motives „to develop new or improved tools, methods or techniques‟ and „to create new or improved facilities or infrastructure‟. Both motives are more important to non-coordinators, implying that non-coordinators seek more tangible results such as a new technique or a new facility.
Large firms and SMEs differ with regard to the motive „to develop new or improved tools, methods or techniques‟. This motive is considered significantly
more important by SMEs, implying that SMEs also seek more tangible results.26
However, motives vary most between different types of organisations although differences are in line with expectations. As can be seen in Figure 15, more commercially orientated motives such as „to create or secure jobs‟, „access to new markets‟ and „development of new or improved commercial products and services‟ are more important to firms while human resource orientated motives such as „usage of mobility schemes‟ and „to provide training‟ are more important to universities.
24 Since firms are over-represented in the control group, we also compared the motives of firms participating in the FP with those of firms in the control group and found that the differences in motives found for the whole samples was valid for the sub-samples of firms too, i.e. results appear to be robust.
25 All differences reported in this chapter are significant at the 1% or 5% levels. 26 Statistically speaking, this relationship is independent of the relationship between (non-)coordinator
and the motive „to develop new or improved tools, methods or techniques‟. In other words, SMEs viewing the development of new or improved tools, methods or techniques as more important motive than large firms has nothing to do with SMEs being more often non-coordinators than large firms. In fact, large firms and SMEs are both non-coordinators in around 90% of cases.

40 Final Report
Figure 15 Motives of FP participants by organisational type *)
4,7
4,3
4,5
4,3
3,7
3,3
3,2
4,4
3,5
2,8
2,5
3,9
2,8
2,7
4,0
2,7
2,7
3,8
4,2
4,2
4,6
4,2
3,5
2,8
2,9
4,3
3,3
2,4
2,5
3,3
2,6
3,2
3,7
2,7
2,8
3,5
4,7
4,3
4,3
4,4
3,6
3,3
2,9
4,1
3,2
3,9
3,6
3,9
2,4
2,4
3,6
3,0
2,1
3,2
4,3
4,4
4,4
4,3
3,8
3,2
3,6
4,0
3,2
2,4
2,1
4,1
4,0
2,6
3,5
3,0
3,6
3,9
1,0 1,5 2,0 2,5 3,0 3,5 4,0 4,5 5,0
To access research funding
To develop and extend internal knowledge and capabilities
To develop new or improved relationships and networks
To address specific scientific or technical questions, problems or issues
To access capabilities that do not exist in Austria (complementary expertise)
To access research facilities / infrastructure that do no exist in Austria
To share the risks/costs associated with the project
To tackle problems that have a European or international dimension
To improve the coordination of research
To provide training
Usage of mobility schemes (To facilitate the mobility of researchers)
To develop new or improved tools, methods or technqiues
To develop new or improved commercial products or services
To develop new or improved regulations or policies
To tackle issues that are not adequately addressed by national programmes
To create new or improved facilities or infrastructures
Access to new markets
To create or secure jobs
Industry Universities Others Non-university R&D institutions
*) Arithmetic mean on a scale from 1=not important to 5=very important Sources: Main online survey, n=319
Non-university research institutions have a distinct and interesting role: They seem to be the most Europe-oriented. For them the motive „to tackle issues that are not adequately addressed by national programmes‟ and „to tackle problems that have a European or international dimension‟ are more important than to other players. We

Final Report 41
will illustrate this point in our case study below on the role the FP plays for the Austrian social science and humanities community.
Furthermore, non-university research institutions sometimes „side with‟ firms in the more commercially orientated motives (e.g. „to create and secure jobs‟ or „to develop new or improved commercial products or services‟), at other times they „side with‟ universities in the more human resource orientated motives (e.g. „to provide training‟). This is not very surprising given that non-university research institutions sometimes act like firms while at the same time training early-stage researchers.
2.2.1.3 Barriers to FP participation
We asked respondents to assess barriers to participation in the FP. It turned out – perhaps not quite surprisingly – that the most important barriers are administrative in nature (Figure 16): „administrative burden for preparing the proposal‟ (mean 3.3), followed by „administrative burden for managing the project‟ (mean 3.3) and „administrative burden for reporting‟ (mean 3.1).
International studies27 show that in other countries the greatest barriers for participation in the FPs, once again, is the complexity they bring on an administrative level. Although this has been a major concern and subject of complaint for a number of years it is also a barrier that some countries and participants have accommodated over the years. Irish participants, for example, expressed reasonably high levels of satisfaction with FP6 administrative processes and procedures, and the balance of opinion was that these were better in FP6 than in FP5. However, in Sweden quite a number of interviewees complained that FP projects were scientifically less „productive‟ than „normal‟ Swedish projects. This was a result of the administrative, networking and travel overheads that FP projects entail which divert effort from research. In Denmark, the high administrative burden and complexity associated with FP participation – both in terms of applying for, managing and administering the projects – is seen as a possible reason behind the decline in FP participation and a general lack of demand for FP projects.
The first non-administrative barrier is „little chances of getting the project proposals approved‟. This barrier is not unexpected,as it refers to the success rates as low as 10% in some calls.
While the motives „administrative burden for preparing the proposal‟ and „too little chances of getting the project proposals approved‟ are equally important to all types of organisations, this is not the case for „administrative burden for managing the project‟
27 For the international comparison, we have used the following studies: Arnold, Erik, What the Evaluation Record tells us about Framework Programme Performance, Technopolis, 2005; Bachtler, J. Vironen, H. and Michie, R., EU Funding Programmes 2007-2013: A Comparative Analysis of EU Funding and Policy Support Structures, Report from the European Policies Research Center of the University of Strathclyde, Glasgow, 2007; Rietschel, Ernst T.H., Evaluation of the Sixth Framework Programmes for Research and Technological Development (2002-2006). Report of the Expert Group on the ex-post Evaluation of the Sixth Framework Programmes, February 2009; SER, Effects of Swiss participation in EU Research Framework Programmes, Interim Report of the State Secretariat for Education and Research of the Federal Department of Home Affairs of the Swiss confederation, 2009; SER, Switzerland‟s Participation in the 7th European Research Framework Programme. Stocktaking report 2007–2008 State Secretariat for Education and Research of the Federal Department of Home Affairs, 2009; Arnold, Erik et al., Impacts of the Framework Programme in Sweden, Vinnova Analyses VA 2008:11, 2008; Technopolis, Evaluation of Framework Programme 6 in Ireland, Final Report, 2009; Technopolis, Evaluation of Framework Programme 6 in Ireland, Condensed version of the final report, 2009; Technopolis, Evaluation of Danish Participation in the 6th and 7th Framework Programmes, Final report, 2009; Technopolis, Evaluation of Danish Participation in the 6th and 7th Framework Programmes, Appendix to the final report, 2009; Boekholt, Patries et al., Impact Europese Kaderprogramma‟s in Nederland, Syntheserapport, 2009; Boekholt, Patries et al., Impact Europese Kaderprogramma‟s in Nederland, Deel II, thematische gebieden, 2009; Boekholt, Patries et al, Impact Europese Kaderprogramma´s in Nederland, Deel III, bijlagen, October 2009; Tekes, Finns in the EU 6h Framework Programme, Evaluation of Participation and Networks, Tekes Programme Report 6, 2008.

42 Final Report
and „administrative burden for reporting‟, which are less relevant as barriers to non-university research institutes and firms. We discuss these differences in detail below.
These barriers are very much in line with what FP participants told us in the focus groups and interviews.
Figure 16 Barriers to participation in the FP *)
1,8
1,8
1,9
2,0
2,1
2,1
2,6
2,6
2,7
2,8
3,1
3,1
3,3
3,3
1,0 1,5 2,0 2,5 3,0 3,5 4,0
Existence of international support which acts as good substitute for the FP
Too little information on the EU FP
Conflicting schedules between the FP and other support programmes (e.g., similar …
Too high risk for repayment obligations
Unclear or inadequate exploitation resp. continuation of research
Existence of national support which acts as good substitute for the FP
Too high requirements regarding composition and size of consortia
Too little coverage of costs by grant (e.g., overheads)
Aspects related to timing (e.g., too long duration between application and project …
Insufficient thematic fit between own needs and themes defined by the EC
Too little chances of getting the project proposals approved
Administrative burden for reporting
Administrative burdes for managing the project
Administrative burden for preparing the proposal
*) Arithmetic mean on a scale from 1=not relevant to 4=highly relevant Sources: Main online survey, n=349
We also asked respondents in the control group why they did not participate in the FP. Interestingly, the respondents in the control group cited exactly the same three barriers as the FP participants (Figure 17). The most frequently cited barrier was „administrative burden for preparing the proposal‟ (mean 3.3), followed by „administrative burden for managing project‟ (mean 3.2) and „administrative burden for reporting‟ (mean 3.1). Hence, the experience of the FP and the perception of the FP

Final Report 43
coincide. The FP evidently has a reputation of creating a high administrative burden
throughout the life of a project, and this reputation appears to be justified.28
However, there were some differences in assessment between FP participants and respondents in the control group. Low success rates („too little chances of getting the project proposals approved‟) were considered more of a barrier by FP participants, presumably because they are more aware of how low success rates actually are. „Conflicting schedules between the FP and other support programmes‟ was also more of a barrier to FP participants, again presumably because they are more aware of such conflicts. Generally, however, this barrier can be considered fairly irrelevant.
In contrast, not quite unexpectedly, „too little information on the EU FP‟ and „existence of national support which acts as good substitute for the FP‟ are considered more of a barrier by respondents in the control group. This suggests that they make use of national programmes and are happy with them.
In a similar vein, the barriers „too high requirements regarding composition and size of consortia‟ and „insufficient thematic fit between own needs and themes defined by the EC‟ seem to be more important for the control group. The former may have something to do with the international R&D cooperation often being bilateral, especially companies contracting researchers. With regard to the latter, the thematic fit (or misfit) has affected many scientific fields in a systematic way – some disciplines such as archaeology hardly have an opportunity to submit an FP proposal. This has been particularly relevant for „full universities‟. Since the establishment of the ERC, which is bottom-up, the FP has become more interesting especially to them.
Respondents in the control group were asked whether negative experience with participation in earlier FPs was a barrier to FP participation. It turned out not to be an important barrier (mean 1.5). The same was true for the barrier „no need for funding for international R&D cooperation‟, meaning that funding for international R&D cooperation would indeed be welcome.
We also asked respondents in the control group about the barriers to participation in international R&D cooperation in general. Here the results are very different from results relating to the FP participants. Respondents in the control group consider lack of time (mean 3.0) and lack of funding (mean 2.9) the most relevant barriers to international R&D cooperation. The least important barriers are language and/or cultural barriers (mean 1.8). Lack of funding is in line with funding for international R&D cooperation being welcome.
Barriers to FP participation are assessed differently by different groups of respondents. Most importantly, „administrative burden for managing the project‟ and „administrative burdens for reporting‟ are more of a barrier to non-coordinators (compared to coordinators), while „administrative burden for preparing the proposal‟ and „administrative burden for reporting‟ are more of a barrier to inexperienced respondents (compared to experienced respondents). In other words, administrative burdens become less relevant the better respondents know the FP.
Similarly, „the risk for repayment obligations‟ is considered a greater barrier by non-coordinators and inexperienced respondents as compared to coordinators and experienced respondents. And not surprisingly, „too little information‟ is more of a
barrier to non-coordinators.29
28 Since firms are over-represented in the control group, we also compared the barriers experienced by firms participating in the FP with those perceived by firms in the control group and found that the differences in barriers found for the whole samples were valid for the sub-samples of firms too. I.e. results appear to be robust.
29 In fact, any other result would actually make us doubt the robustness of the data.

44 Final Report
In a nutshell, a clear pattern emerges: As respondents become more professional the FP becomes less difficult. This result was confirmed by interviewees and focus group participants. In the Netherlands, a similar pattern emerged: While newcomers report difficulties, active involvement in the FP makes it easier for participants to deal with the FP‟s complexity. However, this does not mean that they find the FP straightforward and unfussy, one just gets accustomed to its cumbersomeness.
Figure 17 Barriers to FP participation: comparison between FP participants and FP non-participants *)
3,3
3,3
3,1
2,8
2,6
2,6
2,0
2,1
1,8
1,9
2,7
2,1
1,8
3,1
3,3
3,2
3,1
3,0
3,0
2,8
2,3
2,7
1,7
1,5
2,7
2,1
2,6
2,6
1,0 1,5 2,0 2,5 3,0 3,5 4,0
Administrative burden for preparing the proposal
Administrative burden for managing the project
Administrative burden for reporting
Insufficient thematic fit between own needs and themes defined by the EC
Too high requirements regarding composition and size of consortia
Too little coverage of costs by grant (e.g., overheads)
Too high risk for repayment obligations
Existence of national support which acts as good substitute for the FP
Existence of international support which acts as good substitute for the FP
Conflicting schedules between the FP and other support programmes (e.g., similar …
Aspects related to timing (e.g., too long duration between application and project …
Unclear or inadequate exploitation resp. continuation of research
Too little information on the EU FP
Too little chances of getting the project proposals approved
Control group FP participants
*) Arithmetic mean on a scale from 1=not relevant to 4=highly relevant Sources: Main online survey, n=349; control group survey, n=312
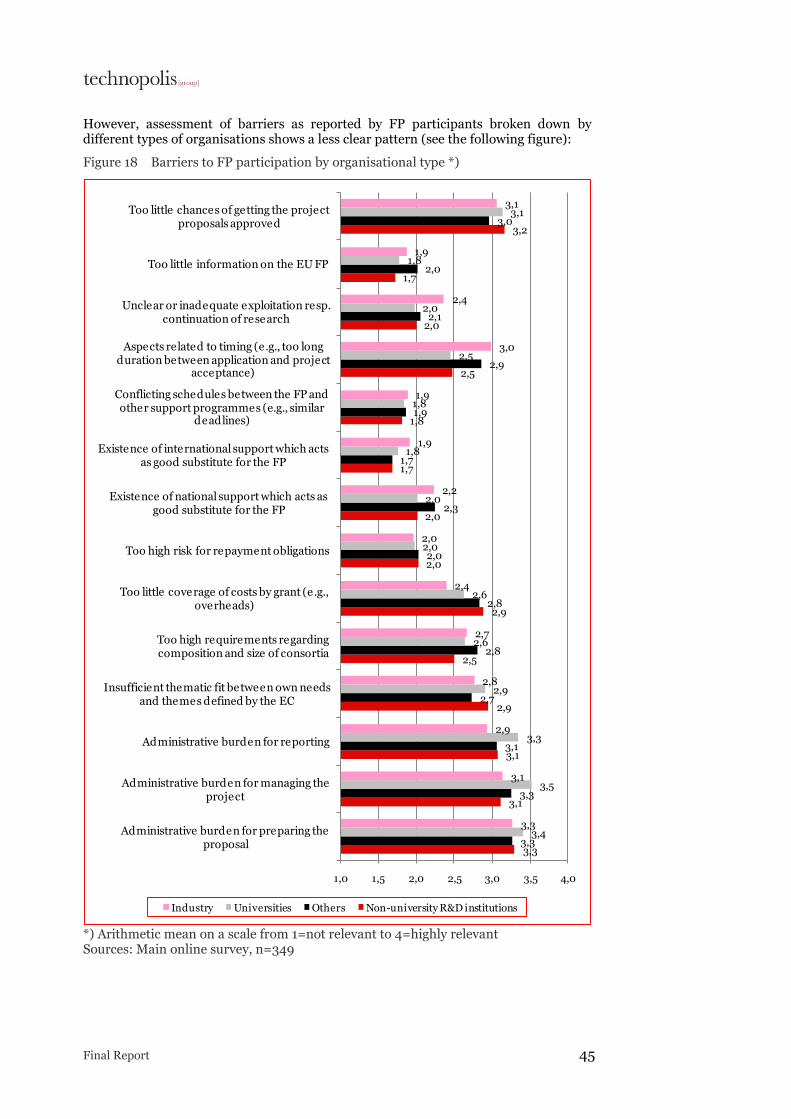
Final Report 45
However, assessment of barriers as reported by FP participants broken down by different types of organisations shows a less clear pattern (see the following figure):
Figure 18 Barriers to FP participation by organisational type *)
3,3
3,1
3,1
2,9
2,5
2,9
2,0
2,0
1,7
1,8
2,5
2,0
1,7
3,2
3,3
3,3
3,1
2,7
2,8
2,8
2,0
2,3
1,7
1,9
2,9
2,1
2,0
3,0
3,4
3,5
3,3
2,9
2,6
2,6
2,0
2,0
1,8
1,8
2,5
2,0
1,8
3,1
3,3
3,1
2,9
2,8
2,7
2,4
2,0
2,2
1,9
1,9
3,0
2,4
1,9
3,1
1,0 1,5 2,0 2,5 3,0 3,5 4,0
Administrative burden for preparing the proposal
Administrative burden for managing the project
Administrative burden for reporting
Insufficient thematic fit between own needs and themes defined by the EC
Too high requirements regarding composition and size of consortia
Too little coverage of costs by grant (e.g., overheads)
Too high risk for repayment obligations
Existence of national support which acts as good substitute for the FP
Existence of international support which acts as good substitute for the FP
Conflicting schedules between the FP and other support programmes (e.g., similar
deadlines)
Aspects related to timing (e.g., too long duration between application and project
acceptance)
Unclear or inadequate exploitation resp. continuation of research
Too little information on the EU FP
Too little chances of getting the project proposals approved
Industry Universities Others Non-university R&D institutions
*) Arithmetic mean on a scale from 1=not relevant to 4=highly relevant Sources: Main online survey, n=349

46 Final Report
„Administrative burden for managing project‟ and „administrative burden for reporting‟ are more relevant barriers to universities and to some extent other types of originations. This suggests that non-university research institutions and firms are more advanced in management professionalisation and administration (although they still do perceive administrative burdens relevant). According to focus groups because universities have started to professionalise their research management services, we can expect this to change in the future.
„Too little coverage of costs by grant‟ is most relevant a barrier to non-university research institutes and other types or organisations. This is not unexpected as we know from the focus groups and interviews that the former tend to struggle to come up with the funds for the part of the project not covered by the grant. However, this barrier is of least concern to firms.
„The existence of national support which acts as a good substitute for the FP‟ is most relevant a barrier to other types of organisations and industry. This is an expected result when one considers the number of programmes that FFG offers for industry.
„Aspects related to timing‟ are most relevant a barrier to firms and to some extent other organisations. This result is expected given that time-to-market is getting shorter and shorter in many branches of industry.
There are no significant differences between large firms and SMEs in their assessment of barriers, although we have qualitative information that some SMEs participating in FP find the coverage of costs by grant („Förderquote‟) so low as to almost render the FP unattractive.
2.2.1.4 Motives for participation in EUREKA
As can be seen in Figure 19, the most important motive for participating in EUREKA is „to develop new or improved relationships and networks‟ (mean 4.2); this motive ranks second with FP participants. The second most important motive for participating in EUREKA is „to address specific scientific or technical questions, problems or issues‟ (mean 4.1) – a motive that ranks first in the control group. The third most important motive is „to access research funding‟ (4.0), which we know is the most important motive for FP participants. In short, the most important motives for participating in EUREKA, the FP or other international R&D cooperation projects are rather similar.
The same is true for the least important motive „to develop new or improved regulations or policies‟, which also ranks last with EUREKA participants.
EURKEA participants are a bit „bland‟ in the sense that they did not score highest with any of the motives we submitted to respondents (Figure 20). Rather, the pattern is that FP participants and EUREKA participants move in tandem, with FP participants leading and EUREKA participants lagging behind. As such, they differ from the control group, especially in motives such as „to tackle issues that are not adequately addressed by national programmes‟, „to tackle problems that have a European or international dimension‟, „to access research funding‟ and „to improve the coordination of research. We also compared the motives of different groups of EUREKA participants. We did not find any significant differences in motives between different organisational types. This may partly be due to the low number of respondents.
We did, however, find some differences in motives between large firms and SMEs. The motive „to develop new or improved commercial products or services‟ was more
important to SMEs than to large firms30, again suggesting that SMEs seek more tangible results. Similarly, the motive „to tackle issues that are not adequately
30 At the 10% level of significance (p<0.1) (exact test)

Final Report 47
addressed by national programmes‟ is more important to SMEs31, suggesting that SMEs turn to EUREKA if they do not find a suitable programme at national level.
Figure 19 Motives for participating in EUREKA*)
2,1
2,4
2,8
2,9
3,1
3,1
3,2
3,2
3,6
3,8
3,8
3,9
4,0
4,0
4,1
4,2
1,0 1,5 2,0 2,5 3,0 3,5 4,0 4,5 5,0
To develop new or improved regulations or policies
To create new or improved facilities or infrastructures
To use possibilities for training (e.g., for doctoral candidates)
To improve the coordination of research
To access research facilities / infrastructure that do no exist in Austria
To tackle issues that are not adequately addressed by national programmes
To share the risks/costs associated with the project
Access to new markets
To tackle problems that have a European or international dimension
To access capabilities that do not exist in Austria (complementary expertise)
To develop new or improved commercial products or services
To develop new or improved tools, methods or technqiues
To develop and extend internal knowledge and capabilities
To access research funding
To address specific scientific or technical questions, problems or issues
To develop new or improved relationships and networks
*) Arithmetic mean on a scale from 1=not important to 5=very important Sources: Main online survey, n=47
31 At the 5% level of significance (p<0.05) (exact test)

48 Final Report
Figure 20 Comparison of motives for participating in EUREKA, FP or other international R&D cooperation*)
4,0
4,0
4,2
4,1
3,8
3,1
3,2
3,6
2,9
3,9
3,8
2,1
3,1
2,4
3,2
4,3
4,4
4,4
4,3
3,8
3,2
3,6
4,0
3,2
4,1
4,0
2,6
3,5
3,0
3,6
2,9
4,6
4,1
4,5
3,8
3,1
3,0
2,9
2,5
4,1
4,2
2,1
2,5
2,6
3,6
1,0 1,5 2,0 2,5 3,0 3,5 4,0 4,5 5,0
To access research funding
To develop and extend internal knowledge and capabilities
To develop new or improved relationships and networks
To address specific scientific or technical questions, problems or issues
To access capabilities that do not exist in Austria (complementary expertise)
To access research facilities / infrastructure that do no exist in Austria
To share the risks/costs associated with the project
To tackle problems that have a European or international dimension
To improve the coordination of research
To develop new or improved tools, methods or technqiues
To develop new or improved commercial products or services
To develop new or improved regulations or policies
To tackle issues that are not adequately addressed by national programmes
To create new or improved facilities or infrastructures
Access to new markets
Control group FP participants EUREKA participants
*) Arithmetic mean on a scale from 1=not important to 5=very important Sources: Main online survey and control group survey; n=47 (Eureka), n=319 (FP participants) n=175 (control group)

Final Report 49
2.2.1.5 Barriers to participation in EUREKA
We did not ask EUREKA participants about what they perceive to be the barriers to
participation in EUREKA32. Instead, we asked the control group why they did not participate in EUREKA, giving us an external view of barriers to participation.
Control group members cite very similar reasons for not participating in EUREKA as for not participating in the FP. Control group members also viewed the same three barriers as most relevant to participation in EUREKA as for the FP. These are administrative in nature, suggesting that respondents in the control group shun the paperwork associated with European schemes. 44% of respondents cited the „administrative burden for preparing the proposal‟ as a highly relevant barrier (mean 3.1), 39% cited „administrative burden for managing the project‟ (mean 3.0) and „administrative burden for reporting‟ (mean 3.0), respectively. These barriers are considered highly relevant by universities, non-university research institutes and firms.
As far as we know, EUREKA administrative procedures are not over duly taxing. In fact, experts tell us that administrative barriers are markedly lower than in comparable EU programmes, notably comparing the EUREKA Cluster Catrene and ITEA2 with FP7‟s JTIs Artemis and Eniac. So we suspect that these results indicate that respondents do not know EUREKA very well. This hypothesis is underpinned by the next barrier, „too little information on EUREKA‟, which ranks forth.
Of course we welcome the lower level of administrative burden compared to the FP. However, we would also wish for a bit more information about EUREKA on its website (http://www.eureka.be). For example, the website does not explain exactly how the selection procedure works or what criteria are involved.
Experts and EUREKA users also mention the synchronisation of different national funding streams as another important problem of the EUREKA model. For example, Austrian EUREKA participants can apply for funding in the Thematic Programmes but an appropriate thematic call may only come half a year later. Then it may be too late for the international consortium carrying out the EUREKA project. Indeed, Austrian EUREKA participants have been known to not be able to participate because of synchronisation problems. Another synchronisation problem mentioned was that the proportions of cost covered by grants vary.
32 Mainly to keep the questionnaire as short as possible and because we considered the external view more relevant.

50 Final Report
Figure 21 Barriers to participation in EUREKA as viewed by the control group *)
1,7
1,8
2,1
2,2
2,4
2,5
2,6
2,8
2,9
3,0
3,0
3,1
1,0 1,5 2,0 2,5 3,0 3,5 4,0
No need for project funding for international R&D cooperations
Existence of international support which acts as good substitute for EUREKA
Unclear or inadequate exploitation or continuation of research
Too little chances of getting the project proposals approved
Too little coverage of costs by grant
Aspects related to timing (e.g. too long duration between application and project
acceptance)
Existence of national support which acts as good substitute for EUREKA
Too high requirements regarding composition and size of consortia
Too little information on EUREKA
Administrative burden for reporting
Administrative burden for managing the project
Administrative burden for preparing the proposal
*) Arithmetic mean on a scale from 1=not relevant to 4=highly relevant Source: control group survey; n=238
2.2.1.6 Conclusions
It has become clear in the course of this evaluation and impact assessment that the FP has become a fact of life. It is one research funding programme among many other competitive research funding programmes. What makes it different compared to most other research funding programmes is that it is European. Researchers use the FP if it suits their needs. Nevertheless, if another programme suits their needs better, they opt for another programme. Researchers are not in the FP for philosophical reasons they are in the FP because it funds their international research activities. What is more, international research activities are no longer something special needing promotion but an everyday phenomenon.
The FP is obviously a very attractive funding source because researchers from all over Europe participate in large numbers, and they do so although it has a really bad reputation for some of the (non-scientific) participation requirements. Consequently, success rates (although different in different calls and programmes) are often low, sometimes as low as 5%. One of the aims of the FP is to promote European

Final Report 51
networking. Considering how over-subscribed the FP is, it is fair to assume that this
characteristic is well known amongst researchers33.
Nonetheless, national authorities all over Europe seem to keep advertising the FP, in an effort to persuade and incentivise „their‟ non-participant researchers to attain funding there, presumably to boost the country‟s return rates. Given that the FP is a fact of life, that international research activity has become an every-day occurrence, and that success rates in the FP are already very low we question whether such an advertising approach makes sense.
33 …although an analysis of FP participation by type of organisation does not satisfy political expectations, e.g. with respect to the participation of industry and of SME in particular.

52 Final Report
2.2.2 Take-up of European initiatives by Austrian actors in the RTDI system
2.2.2.1 Austrian participation in FP6 and FP7
Overview
The analyses presented here were first constructed using E-CORDA data supplied by the European Commission. The figures were then revised and updated based on data supplied by PROVISO in order to ensure consistency between the results of this exercise and those already published by PROVISO under contract to BMWF.
The chapter presents the main components of Austrian participation in FP6 and FP7, focusing on the following aspects:
Overall statistics on Austrian participation in FP6 and FP7, covering projects, participations and funding
An analysis of Austria‟s FP6 and FP7 funding in comparison to other EU Member States, and factored by GDP, population size, GERD and numbers of FTE researchers
Austria‟s patterns of participation by FP6/7 Priority Area
Austria‟s patterns of participation by FP6/7 Instrument
Austrian participation in FP6/7 by type of organisation
The role of Austrian participants within their FP6 and FP7 projects
Austria‟s collaboration patterns within FP6/7
Austria‟s demand for participation within FP6 and FP7 as expressed through its involvement in proposals
Austria‟s success rates in applying to FP6 and FP7
An analysis of how levels of demand and success rates drive Austria‟s relative performance within each FP6 and FP7 priority area
The full results of our analysis of Austrian participation in FP6 and FP7 are presented in Appendix B. These provide a much more comprehensive body of data relating to Austrian participation in the two programmes, and also detail the instances where the data has been cleaned and verified by PROVISO and where it has been taken straight from the Commission‟s official data sets.
Technopolis would like to express its gratitude to PROVISO for the assistance it provided in helping to construct the analyses presented here.
The methodological approach in greater detail
It was agreed at the outset that the approach to the analysis of Austrian participation in FP6 would be carried out as follows:
Technopolis Group would conduct an initial analysis of Austrian participation in FP6 based on the E-CORDA database provided by the European Commission.
The results of the Technopolis analysis would then be transferred to PROVISO with an invitation to update and amend the data as necessary in order to bring it into line with PROVISO‟s own data sets, which are considered (at national level at least) to be more accurate and detailed than the official data provided by the EC.
Having received the updated results from PROVISO, Technopolis Group would then present and describe the FP6 data as modified by PROVISO in a full report.
The official data provided by the Commission allowed us to analyse the patterns of Austrian participation in comparison to the overall profiles (i.e. against the aggregate

Final Report 53
patterns of all countries) and to identify the areas in which Austrian participation is comparatively high or low. These analyses have been carried out in relation to (i) Austria‟s patterns of participation within the different priority areas and instruments deployed in FP6 and FP7, (ii) the level of demand for participation (as expressed through the numbers of proposals submitted by Austrian applicants), and (iii) Austria‟s success rates when applying to the programmes.
The agreed approach to the analysis of Austrian participation in FP7 was slightly different because it was clear from the outset that PROVISO held a larger data set than available at the time from E-CORDA. It was also expected that, having reviewed and updated the FP6 data tables supplied by Technopolis, PROVISO would be able to „repeat‟ the analysis for FP7 without the need for Technopolis to construct the full analysis first. Thereby, the analysis of FP7 data could be carried out with fewer iterations (and hence in a more efficient way) than was necessary in the case of the FP6 data. Therefore, it was agreed that, on completion of the FP6 analysis, PROVISO would provide Technopolis with equivalent FP7 results (data tables), which would then be presented and described by Technopolis in its report.
The approach adopted was in line with that agreed at the outset. The perceived benefits of this approach over a straightforward analysis of E-CORDA data only is that it would be provide a more comprehensive, detailed and accurate perspective on Austrian FP6/7 participation that is in line with data already published at a national level. A potential disadvantage is that the data reported here is not fully consistent with that reported by the Commission or in other national FP evaluations.
For the purpose of our analysis, in most cases, the differences between the official E-CORDA data and the data supplied by PROVISO were minor and we have not yet identified any areas where the conclusions that can be drawn from the analyses would be significantly different depending on which data set is used. As a result we can be reasonably confident of the findings presented here.
Overall statistics
Figure 22 and Figure 23 below presents an overview of Austrian participation in FP6
and FP7 respectively, based on data provided by PROVISO34. The key features of this data are:
Projects: In FP6 Austrian organisations were involved in 1,324 projects, out of 9,802. Austrian organisations were therefore involved in 13.51% of all FP6 projects. In FP7, Austrian organisations have been involved in 813 projects out of a total of 6,806, or 11.95% of the projects approved to date. This is a slightly lower share than in FP6.
Participations: The total number of Austrian participations in FP6 was 1,972, out of 75,951, so Austria‟s share was 2.60% of the FP6 total. In FP7 Austria has had 1,137 participations to date, out of 45,392, representing a 2.50% share. This is slightly below the level achieved in FP6 but Austria has retained its ranked position (10th) out of all participating countries from FP6 to FP7, suggesting that the fall is attributable to a broadening of the participant base more generally rather than a fall in performance vis-à-vis other leading countries.
Funding35: Austrian organisations were allocated a total of €425.4 million in funding from FP6, out of a total allocation of €16.6 billion. Austrian organisations
34 PROVISO FP6 data includes the calls ACC/SSA and HYDROGEN and the project contemplated in article 169 but excludes Euratom. PROVISO FP7 data includes the participation of individuals (fellows) but excludes participation in General Activities (Annex IV), Fusion Energy, and Nuclear Fission and Radiation Protection. Most of the data regarding number of FP7 participations and projects refers to successful (approved) projects whether or not they have passed the contract stage. A footnote clearly states where the data is limited to contracted projects only.
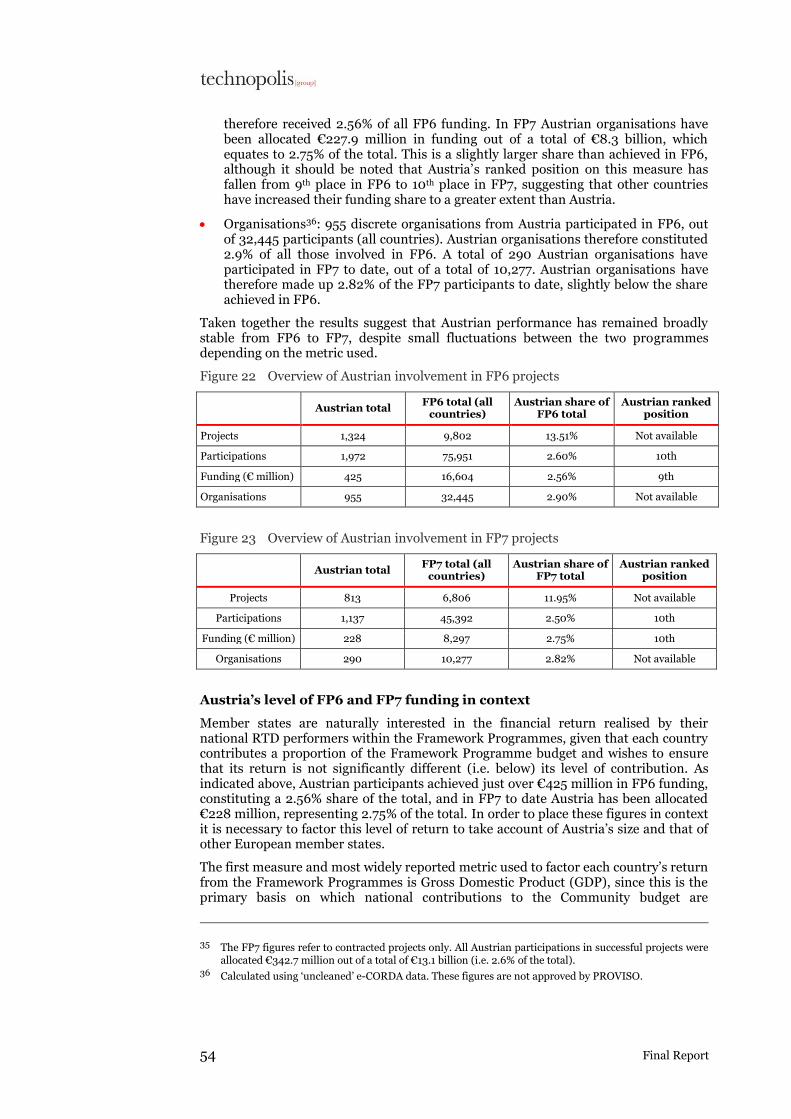
54 Final Report
therefore received 2.56% of all FP6 funding. In FP7 Austrian organisations have been allocated €227.9 million in funding out of a total of €8.3 billion, which equates to 2.75% of the total. This is a slightly larger share than achieved in FP6, although it should be noted that Austria‟s ranked position on this measure has fallen from 9th place in FP6 to 10th place in FP7, suggesting that other countries have increased their funding share to a greater extent than Austria.
Organisations36: 955 discrete organisations from Austria participated in FP6, out of 32,445 participants (all countries). Austrian organisations therefore constituted 2.9% of all those involved in FP6. A total of 290 Austrian organisations have participated in FP7 to date, out of a total of 10,277. Austrian organisations have therefore made up 2.82% of the FP7 participants to date, slightly below the share achieved in FP6.
Taken together the results suggest that Austrian performance has remained broadly stable from FP6 to FP7, despite small fluctuations between the two programmes depending on the metric used.
Figure 22 Overview of Austrian involvement in FP6 projects
Austrian total FP6 total (all
countries) Austrian share of
FP6 total Austrian ranked
position
Projects 1,324 9,802 13.51% Not available
Participations 1,972 75,951 2.60% 10th
Funding (€ million) 425 16,604 2.56% 9th
Organisations 955 32,445 2.90% Not available
Figure 23 Overview of Austrian involvement in FP7 projects
Austrian total FP7 total (all
countries) Austrian share of
FP7 total Austrian ranked
position
Projects 813 6,806 11.95% Not available
Participations 1,137 45,392 2.50% 10th
Funding (€ million) 228 8,297 2.75% 10th
Organisations 290 10,277 2.82% Not available
Austria‟s level of FP6 and FP7 funding in context
Member states are naturally interested in the financial return realised by their national RTD performers within the Framework Programmes, given that each country contributes a proportion of the Framework Programme budget and wishes to ensure that its return is not significantly different (i.e. below) its level of contribution. As indicated above, Austrian participants achieved just over €425 million in FP6 funding, constituting a 2.56% share of the total, and in FP7 to date Austria has been allocated €228 million, representing 2.75% of the total. In order to place these figures in context it is necessary to factor this level of return to take account of Austria‟s size and that of other European member states.
The first measure and most widely reported metric used to factor each country‟s return from the Framework Programmes is Gross Domestic Product (GDP), since this is the primary basis on which national contributions to the Community budget are
35 The FP7 figures refer to contracted projects only. All Austrian participations in successful projects were allocated €342.7 million out of a total of €13.1 billion (i.e. 2.6% of the total).
36 Calculated using „uncleaned‟ e-CORDA data. These figures are not approved by PROVISO.

Final Report 55
calculated. Other relevant measures that we have used to factor FP income are (i) population size, (ii) Gross Expenditure on R&D (GERD) and (iii) number of FTE researchers. Eurostat data was used to calculate these „scale‟ measures.
For the analysis, each Member State‟s share of FP funding has been compared to its share of GDP, etc. and a ratio calculated. So, for example, in FP6 Austria‟s share of EU-25 FP6 funding was 2.9% and its share of GDP was 2.2%, giving a ratio between the two of 129%. Put another way, Austria‟s funding return from FP6 was 29% higher than might have been expected based on the size of its GDP alone. By performing the same calculation for each Member State it is possible to construct ranked lists based on the size of the ratio.
Figure 24 shows the ratios of Austria‟s share of EU-25 FP6 funding to its share of EU-25 GDP, population, GERD and FTE researchers, and also lists the ranked position out of the EU-25 achieved by Austria on each of the measures. It reveals that on each indicator Austria achieved a higher share of EU-25 FP6 funding than we might expect given its scale. More specifically:
The measure that provides the most favourable outcome is population size, where Austria received a 61% greater share of EU-25 FP6 funding than we might have expected. Austria was placed sixth out of the EU-25 on this measure.
Austria‟s FP6 funding returns were also very strong in relation to the number of FTE researchers employed in the country. Based on this measure Austria‟s share of EU-25 FP6 funding was 33% greater than we might have expected, placing it 9th out of the EU-25.
Austria‟s share of FP6 funding in comparison to its share of GDP also provided a strongly positive result. Austria‟s FP6 funding share was 29% greater than expected based on the size of its GDP, placing it 11th out of the 25 Member States.
The indicator that produces the least favourable (but still positive) result is the ratio of EU-25 FP6 funding achieved by Austria in comparison to its share of EU-25 GERD. Here the level of funding achieved was 5% above the level that we might have expected, placing Austria 19th out of the EU-25. However, several other „leading‟ research performing Member States were ranked below Austria on this measure, including the UK, Germany, France, Sweden, and Finland.
Figure 25 shows the equivalent data for FP7 to date, and confirms that once again Austrian funding returns are above the „expected‟ or „normalised‟ levels on each measure. The ratios of FP7 funding to GDP and population are slightly higher than was the case in FP6, suggesting a stronger performance, although it can be seen from the table that Austria‟s ranked position out of the 27 Member States has remained unchanged at 11th and 6th place respectively. The ratio of FP7 funding share to share of GERD is slightly below the ratio achieved in FP6, and this has led to a fall in the ranked position from 19th to 21st place, although again many other leading RTD performing nations are placed below Austria in the ranked list of countries. The ratio of Austria‟s FP7 funding share to its share of FTE researchers is also very slightly lower than was the case in FP6, but Austria has nonetheless improved its ranked position from 9th to 8th place across the two programmes.
Overall, these data demonstrate that Austria has achieved a creditable level of return from FP6 and FP7 to date, given its relative share of GDP, population and FTE researchers. Its performance in comparison to its Gross Expenditure on R&D is less strong, although still healthy and ahead of other leading RTD performing nations within the EU.

56 Final Report
Figure 24 Ratio of Austrian share of EU-25 FP6-funding to share of EU-25 GDP, population, GERD and FTE researchers
Ratio of Austrian share of EU-25 FP6 funding to Austrian
share of EU-25 GDP / population / GERD / FTE
researchers
Ranked position within EU-25 based on this measure
Gross Domestic Product (GDP) 129% 11th
Population 161% 6th
Gross Expenditure on R&D (GERD) 105% 19th
FTE researchers 133% 9th
Figure 25 Ratio of Austrian share of EU-27 FP7-funding to share of EU-27 GDP, population, GERD and FTE researchers
Ratio of Austrian share of EU-27 FP7 funding to Austrian
share of EU-27 GDP / population / GERD / FTE
researchers
Ranked position within EU-27 based on this measure
Gross Domestic Product (GDP) 140% 11th
Population 184% 6th
Gross Expenditure on R&D (GERD) 101% 21st
FTE researchers 132% 8th
Austria‟s participation in FP6 and FP7, by Priority Area
Our analysis of Austria‟s participation in FP6 and FP7 has also looked at its absolute and relative level of involvement in the different sub-programmes or priority areas that are used to structure the FPs. This gives an indication of the most important research fields or areas for Austria, both in terms of the absolute volume of participations or funding, and in terms of its relative participation rate in each area as compared to the profile of FP6 and FP7 participation overall (i.e. for all countries).
Austrian participation in FP6 by Priority Area
The E-CORDA database structures FP6 projects into 17 Thematic Priority Areas, each of which has a different number of projects, number of participations and volume of funding associated with it.
In absolute terms the „largest‟ or most significant Priority Areas from Austria‟s perspective were as follows:
Information Society Technologies (IST), where Austria had 418 participations across 266 different projects, and realised just over €217 million in funding. The IST area accounted for around 20% of all of Austria‟s FP6 participations and just over 25% of its FP6 funding.
Sustainable development, where Austria had 308 participations within 191 different projects, and achieved just over €70 million in FP6 funding, accounting for around 14% of Austria‟s participations and almost 17% of its FP6 funding.
Life sciences, genomics and biotechnology, where Austria had 182 participations across 117 projects and realised almost €53 million in funding, accounting for 9% of all Austrian participations and just over 12% of its funding.
Nanotechnologies and Nanosciences, where Austria had 153 participations in 92 projects and achieved almost €47 million in funding. This area accounted for almost 8% of Austria‟s participations and 11% of its FP6 funding.

Final Report 57
Human Resources and mobility, where Austria had 210 participations in 180 projects and realised almost €38 million in FP6 funding. This area accounted for almost 11% of Austria‟s participations and 9% of its FP6 funding.
Collectively the five areas above accounted for 64% of Austria‟s FP6 funding and 64% of Austria‟s FP6 participations.
While the areas listed above were the most significant for Austria in scale terms it is not possible to conclude anything about Austrian performance based on these data alone, due to the fact that FP priority areas vary significantly in terms of the number of projects, participations and funding allocations that they contain. We have therefore used normalised data to establish the priority areas that Austria performed most strongly in.
As indicated above, Austria realised a 2.60% share of all FP6 participations and a 2.56% share of all FP6 funding allocations. Analysis of the relative share of participations and funding achieved within each priority allows us to identify areas where the level of involvement by Austria was higher or lower than these overall averages. Looked at from this perspective, the FP6 priority areas where Austrian performance (in terms of involvement / funding) has been strongest are as follows:
Support for the coordination of activities, where Austria accounted for the 5.4% of the participations and received 6.1% of the funding;
Science and society, where Austria accounted for 4.3% of the participations and received 5.2% of the funding;
Development of R&I policies, where Austria accounted for 4.2% of the participations and received 5.0% of the funding;
Citizens and governance, where Austria accounted for 3.4% of the participations and received 3.8% of the funding.
The Priority Areas with low involvement by Austria in relative terms were as follows:
Research Infrastructures, where Austria accounted for just 1.7% of the participations and 0.8% of the funding;
Aeronautics and space, where Austria accounted for just 1.8% of the participations and 1.3% of the funding;
Food quality and safety, where Austria accounted for just 1.9% of the participations and 1.4% of the funding.
Figure 26 shows the volume of FP6 funding and the share of FP6 funding received by Austrian participants in each of the main priority areas (excluding Euratom). It indicates that many of the areas where Austria received a relatively high share of the FP6 funding were areas where the volumes of funding involved were relatively small. For example, in achieving a 6% share of all FP6 funding allocations to the Support for coordination of activities area Austria only received around €12 million in funding. However, while it only received 2% of the funding in the Life Sciences area, this was sufficient to generate over €50 million in funding. It is therefore clear that some areas offer greater potential than others in terms of the scale of the financial returns that could be realised through strengthened Austrian involvement.

58 Final Report
Figure 26 Austrian FP6 funding, by Priority Area
Austrian participation in FP7 by Priority Area
FP7 is organised into 22 Thematic Priority Areas, a slightly larger set than in FP6. In absolute terms the „largest‟ or most significant Priority Areas from Austria‟s perspective to date are as follows:
Information and Communication Technologies, where Austria has had 268 participations across 192 different projects, and realised just over €76 million in funding. The ICT area has accounted for almost 24% of Austria‟s FP7 participations and almost 34% of its FP7 funding to date, suggesting it has become a more significant area in scale terms than was the case in FP6.
Marie Curie Actions (mobility), where Austria has had 173 participations across 121 projects, and realised just over €5 million in funding. This represents only 2.3% of its FP7 funding returns (significantly less than in FP6), but accounts for approximately 15% of its participations and projects.
Health, where Austria has had 107 participations across 76 projects and realised just over €35 million in funding. This area has accounted for 15.5% of Austria‟s FP7 funding to date, 9.4% of its participations, and 9.3% of its projects.
Transport (including Aeronautics), where Austria has had 105 participations across 72 projects and realised almost €22 million in funding. This area has accounted for 9.5% of Austria‟s FP7 funding to date, 9.2% of its participations, and 8.9% of its projects.
European Research Council, where Austria has had 37 participations in 27 projects and received almost €26 million in funding to date. While not significant in terms of the number of participations and projects (3.3% of Austria‟s total respectively), it is very significant in monetary (and prestige) terms, making up more than 11% of Austria‟s funding returns from FP7 to date.
Collectively the five areas above have accounted for 72% of Austria‟s FP7 funding to date, 61% of its participations and 60% of its projects.

Final Report 59
As indicated above, Austria has realised a 2.50% share of all FP7 participations and a 2.75% share of all FP7 funding allocations to date. Analysis of the relative share of participations and funding achieved within each priority allows us to identify areas where the level of involvement by Austria is higher or lower than these overall averages. Looked at from this perspective, the FP7 priority areas where Austrian
performance (in terms of involvement / funding) has been strongest are as follows37:
Activities of International Cooperation, where Austria has accounted for 5.0% of the participations and received 7.5% of the funding allocations to date;
Coherent development of research policies, where Austria has accounted for 3.7% of the participations and received 5.6% of the funding allocations to date;
Socio-economic sciences and humanities, where Austria has accounted for 3.5% of the participations and received 4.4% of the funding allocated to date;
Information and Communication Technologies, where Austria has accounted for 3.5% of the participations and received 3.9% of the funding to date;
Austria has also performed well on some measures in (i) Science in Society, where Austria has achieved 5.1% of the funding allocations to date, and (ii) Regions of knowledge, where Austria has achieved 4.0% of the FP7 funding allocations to date.
The areas of strength listed above mirror closely the areas of strong performance by Austria in FP6.
The FP7 Priority Areas with low involvement by Austria in relative terms to date are:
Research potential, where Austria has accounted for just 0.5% of the participations and 0.1% of the funding allocated to date;
Research for the benefit of SMEs, where Austria has accounted for just 1.3% of the
participations and 1.5% of the funding38;
Food, agriculture and biotechnology, where Austria has accounted for just 1.7% of the participations and 1.5% of the funding;
Research Infrastructures, where Austria has accounted for just 2.0% of the participations and 1.0% of the FP7 funding allocations to date.
Figure 27 shows the volume of funding and the share of funding received by Austrian participants in 19 of the 22 FP7 priority areas (data on General Activities – Annex IV, Fusion energy and Nuclear fission & radiation protection were not available). It indicates, as was the case in FP6, that many of the areas where Austria has received a relatively high share of the FP6 funding are areas where the volumes of funding involved are relatively small. However, the very significant scale of the ICT priority, coupled to a very strong performance by Austria in this area (3.9% share of the funding) has generated significant income for Austria, amounting to a third of all its FP7 funding to date.
37 We have selected some thematic areas for case studies where we have a closer look at the possible reasons and structures behind these quantitative findings (see chapter2.2.6).
38 We have a closer look at these SME related findings in the impact analysis (see chapter 2.2.3.)

60 Final Report
Figure 27 Austrian FP7 funding, by Priority Area
Austria‟s participation in FP6 and FP7 by type of Instrument
Austrian participation in FP6 by Instrument
The FPs utilise a variety of different types of Instrument (or types of project construction) to implement their priorities. Within FP6, nine main instrument types were employed, the most significant of which in scale terms as viewed from an Austrian perspective were:
Specific Targeted Research Projects (STREPs), accounting for 588 of Austria‟s participations and €133.8 million in funding allocations;
Integrated Projects (IPs), accounting for 437 of Austria‟s participations and €162.1 million in funding allocations.
In total, 52% of Austria‟s FP6 participations and 70% of its FP6 funding were associated with these two types of instrument (combined). However, as with the Priority Areas these „raw‟ figures give no indication as to where Austria had a relatively high or low level of involvement in the different types of Instrument. In these terms, the Instruments where Austria‟s level of involvement was highest relatively were:
Coordination Actions, where Austria accounted for 3.1% of all participations and received 4.3% of all funding allocations;
Cooperative Research Projects and Collective Research Projects, where Austria accounted for 2.9% of the participations and 3.7% of all funding allocations;
Specific Targeted Research Projects (STREPS), where Austria accounted for 2.7% of all participations and 3.0% of all funding allocations.
Austrian participation in FP7 by Instrument
FP7 has used nine main Instrument types to implement its priorities. Of these, the most significant for Austria in scale terms were:
Collaborative Projects, accounting for 653 of Austria‟s participations and €261.5 million in funding allocations

Final Report 61
Coordination and support actions, accounting for 230 of Austria‟s participations and €28.2 million in funding allocations
Support for frontier research (ERC), accounting for only 35 of Austria‟s participations but €30.8 million of its funding
In total, 81% of Austria‟s FP7 participations and 94% of its funding allocations to date have been associated with these three instruments.
In proportionate (or share) terms, the FP7 Instruments where Austria has had a high relative share of the participations and funding are Coordination and support actions (with 3.2% of all participations and 3.5% of all funding) and Collaborative projects (with 2.7% of the participations and 2.8% of the funding).
Austrian participation in FP6 and FP7 by type of organisation
Austrian participation in FP6 by type of organisation
The Commission‟s standard classification of FP6 participants by activity (organisation) type involves four main groups: HEIs, Research Institutes, Industry and „others‟. It is known that the coding of each participant (and participation) by activity type is inconsistent and hence incorrect in a significant number of cases. However, it is still of potential interest to see how the profile of Austrian participations by activity type compares to the overall profile of FP6 participations.
Figure 28 compares the breakdown of Austrian FP6 participations by activity type with the overall profile for FP6 as a whole, and reveals that Austrian participation is very much in line with the overall profile, except in the case of Research Institutes where in Austria they account for a relatively smaller share of the participations and „others‟ where in Austria they account for a slightly higher share. Otherwise, the profile of Austrian participation by activity type is very much in line with the overall FP6 profile.
Figure 28 Breakdown of Austrian FP6 participations and all FP6 participations, by Activity Type
Activity Type Number of participations - Austria
Number of participations – FP6 overall
Higher Education 702 (37%) 26,490 (36%)
Industry 343 (18%) 13,908 (19%)
Research Institutes 479 (25%) 20,621 (28%)
Other 386 (20%) 12,371 (17%)
Total 1,945 (100%) 74,400 (100%)
Source: FP6 participation data (E-CORDA, September 2009)
Austrian participation in FP7 by type of organisation
The Commission‟s standard classification of FP7 participants by activity (organisation) type involves five main groups as shown in Figure 29 below. Once again we cannot be confident that all organisations have been correctly coded to the correct activity type, but it is nonetheless useful to check whether the profile of participation by each group in Austria compares to the overall profile for all countries. Figure 29 reveals that Austrian participation in FP7 by organisation types is again very much in line with the overall profile, except in the case of Private commercial where the Austrian participation share is slightly above the FP7 average and Research organisations where the Austrian share is slightly below average.

62 Final Report
Figure 29 Breakdown of Austrian FP7 participations and all FP7 participations, by Activity Type
Activity Type Number of participations - Austria
Number of participations – FP7 overall
Higher or secondary education establishments
288 (38%) 10,525 (36%)
Private commercial 213 (28%) 7,359 (25%)
Research organisations 154 (20%) 7,182 (24%)
Public bodies excluding research and education
47 (6%) 1,602 (5%)
Other 52 (7%) 2,791 (9%)
Total 754 (100%) 29,459 (100%)
Source: EC/E-CORDA, processed by PROVISO (11/2009), data not validated by PROVISO
Based on these data there is no reason to suggest that any specific categories of Austrian organisation are significantly under-represented in terms of their FP participation.
Austrian participants‟ roles in FP6 and FP7 projects
Two main indicators can be used to help to assess the role of Austrian participants in their FP projects. The first is the extent to which Austrian participants are occupying the role of coordinator (or project leader) as opposed to simply being listed as a partner or participant in the project. The second is the volume of funding allocated to the Austrian participants as compared to their partners in the same projects or as compared to all participants in all projects.
Austrian coordination rates in FP6 and FP7
In FP6, Austrian participants occupied the role of coordinator in 213 cases, which equates to 10.8% of Austrian participations. In FP6 as a whole, 8.4% of participations were in the role of coordinator, so the Austrian coordination rates are significantly above the average. Analysis of Austrian coordination rates by priority area revealed that in a small number of areas Austrian coordination rates were very high (e.g. 36% in Support for International cooperation and 27% in Science and Society) and that they were the same as, or above average, in 14 out of the 16 priority areas for which data was available.
In FP7, Austrian participants have occupied the role of coordinator in 137 cases to date, which equates to 12.0% of all Austrian participations. This is well above the average coordination rates for FP7 as a whole, which has been calculated at 8.6%, again suggesting that Austrian participants tend to occupy a central and leading role in their projects. Further analysis has shown that Austrian coordination rates are currently above the average in 12 out of the 18 FP7 priority areas where data is available, and are particularly high in the Coherent development of research policies (25%), Socio-economic sciences and humanities (23%), Regions of knowledge (23%) and Science in Society (22%) areas. Austrian coordination rates are also above average in the „major‟ priority areas where Austria has strength (ICT, Health, Transport).
These data indicate that Austrian participants are taking a leading role in a significant proportion of FP projects and at least in line with expectations, given Austria‟s scale.
Austrian funding per participation in FP6 and FP7
In FP6, Austrian participants were awarded an average of €216k in EC funding per participation, very slightly below the average level of funding per participation across FP6 as a whole (€219k), and significantly below the average amount of funding awarded to other participants in Austrian projects (€236k). This is a surprising finding, given the high coordination rates achieved by Austrian participants. However,

Final Report 63
this apparent contradiction is largely explained by a more detailed analysis which shows that in some priority areas the level of funding achieved by Austrian participants was far below that achieved by their partners in the same projects or by other participants in other projects. This was particularly so in the Research infrastructures, Aeronautics and space, Life Sciences, and Food quality and safety areas. This has significantly reduced Austria‟s average funding per participation. However, it should also be noted that Austrian funding per participation were well above average in several other priority areas, particularly those where Austrian coordination rates were high.
In FP7, Austrian participants have been awarded an average of €301k in EC funding per participation, which is very slightly above the average amount obtained by their partners in the same projects and also above the average amount obtained by all participants across all projects. While the differences are relatively small, the data confirm that Austrian participants have occupied a strong role in their FP7 projects to date. In comparison with the overall FP7 averages, Austrian funding amounts per participation were highest in the Science in Society (+60%), Regions of knowledge (+48%), and Socio-economic sciences and Humanities (+24%) areas.
Austria‟s collaboration patterns within FP6 and FP7
One of the main objectives of the FPs is to promote and support collaboration between European actors and, to a lesser extent, with third countries. These collaboration patterns can be analysed to determine the extent to which Austrian participants have partnered with actors from different countries.
FP6 collaboration between Austrian actors and other Member States
The number of participations in FP6 projects with Austrian involvement excluding the Austrian participations was 18,865. Of these 16,412 or 87.3% were participations by (other) EU-25 Member States.
Figure 30 presents data on the number and share of participations by actors from the other EU-25 Member States within FP6 projects in which Austria was also involved. Each country‟s share of participations in Austrian projects (excluding Austria) has been compared to its share of all FP6 participations (excluding Austria) to produce the ratios shown in the final column. A ratio of >100% indicates that the country has a higher level of participation in Austrian projects than we might expect given its level of participation within FP6 as a whole. Similarly, a ratio of <100% indicates that the country in question has a lower share of the participations in Austrian projects than it does within FP6 as a whole.
Figure 30 reveals that while Germany, the UK and France have the highest numbers of participations in Austria‟s FP6 projects, the EU-25 Member States with the highest relative level of collaboration with Austrian actors were Slovenia, Slovakia, Luxembourg and Hungary. Each of these countries had a participation rate in Austrian projects that was between 28% and 41% higher than their participation rates in FP6 overall. The countries with the lowest relative level of participation within Austrian projects were Spain, France, the UK and Portugal.
Based on this analysis it seems that geographical proximity is one of the main drivers of FP6 collaboration patterns, at least when scale factors are removed, with four of Austria‟s top five collaboration partners (from the EU-25) being neighbouring countries. This pattern is further confirmed by the fact that Switzerland, despite its relatively small size, accounted for the largest number of collaborations between Austria and any other non-EU country.

64 Final Report
Figure 30 Austrian FP6 collaboration with other EU Member States
Country Participations in Austrian projects
Share of all non-Austrian
participations in Austrian projects
Ratio of participation in
Austrian projects to overall level of FP6
participation
Slovenia 222 1.2% 141%
Slovakia 156 0.8% 138%
Luxembourg 35 0.2% 133%
Hungary 413 2.2% 128%
Czech Republic 330 1.7% 123%
Latvia 66 0.3% 120%
Malta 39 0.2% 119%
Finland 426 2.3% 118%
Germany 3,180 16.9% 117%
Estonia 105 0.6% 108%
Belgium 831 4.4% 107%
Cyprus 68 0.4% 107%
Sweden 711 3.8% 106%
Netherlands 1,086 5.8% 103%
Poland 533 2.8% 103%
Denmark 429 2.3% 102%
Greece 597 3.2% 98%
Lithuania 85 0.5% 95%
Ireland 224 1.2% 94%
Italy 1,638 8.7% 94%
Portugal 275 1.5% 90%
United Kingdom 2,010 10.7% 90%
France 1,798 9.5% 88%
Spain 1,155 6.1% 85%
Source: FP6 participation data processed and revised by PROVISO (PROVISO, June 2010)
FP7 collaboration between Austrian actors and other Member States
The number of participations in FP7 projects with Austrian involvement excluding the Austrian participations was 9,049. Of these 7,822 or 86.4% were participations by (other) EU-27 Member States.
Figure 31 presents data on the number and share of participations by actors from the other EU-27 Member States within FP7 projects in which Austria was also involved. Each country‟s share of participations in Austrian projects (excluding Austria) has again been compared to its share of all FP7 participations (excluding Austria) to produce the ratios shown in the final column. The results indicate that while Germany, the UK and France have again had the highest numbers of participations in Austria‟s FP7 projects in absolute terms, the EU-27 Member States with the highest level of collaboration with Austrian actors in relative terms were Luxembourg, Malta, Slovenia, and Slovakia. Each of these countries has had a participation rate in Austrian projects between 43% and 104% higher than their participation rates in FP7 overall. The countries with the lowest relative level of participation within Austrian projects are Spain, the UK, Bulgaria and Latvia.
This analysis again confirms that geographical proximity is an important driver of FP collaboration. In the case of FP7, five of Austria‟s top ten collaboration partners (from the EU-27) are neighbouring countries.

Final Report 65
Figure 31 Austrian FP7 collaboration with other EU Member States
Country Participations in Austrian projects
Share of all non-Austrian
participations in Austrian projects
Ratio of participation in
Austrian projects to overall level of FP7
participation
Luxembourg 25 0.3% 204%
Malta 25 0.3% 157%
Slovenia 96 1.1% 145%
Slovakia 62 0.7% 143%
Estonia 55 0.6% 127%
Germany 1,509 16.7% 127%
Romania 111 1.2% 123%
Czech Republic 132 1.5% 122%
Finland 233 2.6% 121%
Hungary 151 1.7% 119%
Poland 207 2.3% 115%
Cyprus 72 0.8% 112%
Sweden 345 3.8% 108%
Belgium 418 4.6% 107%
Netherlands 519 5.7% 101%
Denmark 179 2.0% 98%
Lithuania 30 0.3% 98%
Italy 806 8.9% 96%
France 856 9.5% 95%
Greece 275 3.0% 94%
Portugal 140 1.5% 93%
Ireland 103 1.1% 92%
Latvia 21 0.2% 86%
United Kingdom 914 10.1% 84%
Spain 513 5.7% 76%
Bulgaria 25 0.3% 73%
Source: EC, processed and revised by PROVISO (11/2009)
Intra-Austrian collaboration within FP6 and FP7 projects
With 1,972 participations across 1,324 FP6 projects it is clear that in some cases there were two or more Austrian participants in the same project. In fact, almost one-third (31%) of Austrian FP6 projects involved two or more Austrian organisations. This is a very healthy level of intra-Austrian collaboration within FP6 projects and suggests that the programme provides a good platform for collaboration between Austrian actors as well as with other countries.
In FP7, the level of intra-Austrian collaboration has fallen slightly. To date, 27% of Austria‟s FP7 projects have involved more than one Austrian participant. The decrease may be partly attributed to adjustments to the types of instrument used which has led to a decrease in the average number of participants in each FP7 project (6.7) as compared to FP6 (7.7). In particular, the very large project constructions employed in FP6 are used less widely now, which may mean that there are fewer opportunities to involve multiple partners from the same country. This is partly confirmed by the fact that 4% of Austria‟s FP6 projects involved four or more Austrian partners, while the equivalent figure for FP7 to date is only 2%.
It should also be noted that in the section below on success rates we report data suggesting that proposals with more than one Austrian participant fare less well in the competition than those with only one Austrian organisation involved. Therefore, while intra-Austrian collaboration within the FPs can improve the potential for knowledge

66 Final Report
transfer between Austrian organisations, it may also reduce chances of success at the
bidding stage39.
Austria‟s demand for participation within FP6 and FP7
There is no simple way to determine whether and to what extent Austria‟s overall level of demand for participation is high or low in comparison to that of other countries. However, it is possible to identify the (priority) areas of the programme where demand for participation, as expressed through Austrian involvement in proposals, is relatively high or low.
Austrian demand for participation in FP6
Commission data indicates that Austrian participants were named in 5,724 proposals
out of a total of 47,749 proposals submitted to FP6 calls40. We can therefore say that Austrian actors were involved in 12.0% of all FP6 proposals.
In volume terms, the FP6 priority area receiving the highest level of demand from Austria was Information society technologies (IST) with 1,285 proposals, or 22.4% of all Austrian proposals submitted to FP6. The next most significant priority area was Human resources and mobility, with 879 Austrian proposals (15.4% of Austria‟s total).
The FP6 Priority Areas where Austria‟s involvement rate in the submitted proposals was highest were as follows:
Support for the coordination of activities (where 37.6% of all proposals submitted to that area involved one or more Austrian partners)
Citizens and governance (34.8%)
Sustainable development (23.1%)
Information Society Technologies (19.9%)
Nanotechnologies and nanosciences (18.1%)
Austrian demand for participation in FP7
Because reliable proposal level data is not available for FP7, we used proposal participation-level data instead. This means that the percentages are not directly comparable however will provide us with the best available data for comparison between FP6 and FP7.
In FP7 to date, 5,801 Austrian participations in proposals within the overall set of 231,482 FP7 participations in proposals received to date, so Austrian participations in proposals formed 2.5% of the total, which is slightly below the level achieved in FP6 (2.6%).
In absolute terms the largest numbers of Austrian participations in proposals have been submitted to the ICT area, where 1,381 Austrian participants are named in proposals, almost a quarter of all Austrian participations in proposals. The next greatest number of participations in proposals was submitted to the Marie Curie (mobility) actions (684 participations in proposals). The equivalent FP6 areas were also those with the largest number of Austrian proposals.
39 According to FFG-EIP's experience, less experienced participants tend to be involved with more Austrian partners than experienced researchers who have higher success rates. This might explain the data.
40 These data exclude ineligible proposals and those submitted to the first stage of calls running a two-stage process.

Final Report 67
In proportionate terms, the FP7 priority areas where Austria‟s involvement rate in proposals has been highest are as follows:
Coherent development of research policies
Science in society
Energy
Socio-economic sciences and humanities
Activities of International Cooperation
Austria‟s success rates in applying to FP6 and FP7
Austrian success rates in FP6
Austria‟s ultimate participation rate in FP6 projects is driven partly by demand (as summarised above) and partly by its success rates when applying for funding. Success rates when applying to the competition can be expressed either in terms of proposal success rates or in terms of participation success rates. In the case of Austria these two different measures reveal slightly different results:
Austria was involved in 5,724 proposals and participated in 1,303 projects41, giving a proposal-level success rate of 22.8%. This is above the FP6 average of 21.1% and indicates a good level of success for proposals with Austrian involvement.
Austria had 8,302 participations in FP6 proposals and had 1,945 project participations, giving a participation-level success rate of 23.4%. This is very slightly below the FP6 average of 23.5% and indicates only an average level of success within the competition.
The difference between the two indicators suggests that Austrian proposals fared slightly worse in those cases where there were two or more Austrian participants in the same proposal (see footnote 39 on page 66).
An analysis of Austria‟s proposal-level success rates within each of the 17 Priority Areas of FP6 revealed that the success rates varied markedly from one area to the next. The highest success rate was in the Support for Coordination of Activities area where 57% of the proposals with Austrian involvement were successful. The lowest success rate was in the Horizontal research activities – SMEs area where just 12.8% of the proposals with Austrian participation were supported.
As with all of our analyses, the most meaningful results are obtained when we place Austria‟s data in context. In order to understand where Austrian proposals enjoyed the highest relative success rates we have to compare the success rate of Austrian proposals in each area to the success rates for all proposals in that area. In these terms we have found that Austrian proposal success rates were relatively highest in the following areas:
Development of R&I policies, where Austria‟s proposal success rates were almost three times higher than the FP6 average (37.5% as compared to 13.5%);
Science and Society, where Austria‟s proposal success rates were 65% higher than the FP6 average (19.5% as compared to 11.8%);
Food quality and safety, where Austria‟s proposal success rates were 26% higher than the FP6 average (22.4% as compared to 17.7%);
Sustainable development, where Austria‟s proposal success rates were 25% higher than the FP6 average (29.0% as compared to 23.2%);
41 E-CORDA data are used here.

68 Final Report
Support for international cooperation, where Austria‟s proposal success rates were 25% higher than the FP6 average (16.4% as compared to 13.1%).
Austria‟s success rates were below the FP6 averages in four areas: Human resources and mobility; Research and innovation; Horizontal research activities – SMEs; Policy support / S&T needs.
Austrian success rates in FP7
Because reliable proposal level success rates are not available for FP7, we used participation-level success rates instead. This means that the percentages are not directly comparable but will provide us with the best available data for comparison.
Austria‟s overall success rates in FP7 mirror to a large degree the situation in FP6. At the point that this report was produced, Austria has achieved 1,137 participations in funded projects against a total count of 5,801 participations in submitted proposals, giving a participation-level success rate of 19.6%. This is almost identical to the overall average for FP7 to date. This suggests that Austrian proposals repeat the pattern found in FP6.
Analysis of Austria‟s participation-level proposal success rates within each of the 22 Priority Areas of FP7 again revealed that the success rates vary markedly from one area to the next. The highest success rate was in the Activities of International Cooperation area where 60% of the participations proposals with Austrian involvement were successful. The lowest success rate was in the Research Potential area where just 4% of the proposals with Austrian participation have been supported.
The areas where Austrian participations in proposals enjoyed the highest relative success rates (compared to all FP7 participations in proposals in those areas) were as follows:
Activities of international cooperation, where Austria‟s proposal success rates are 62% higher than the FP7 average (60% as compared to 37%)
Coherent development of research policies, where Austria‟s proposal success rates are a third higher than the FP7 average (57% as compared to 43%)
European Research Council, where Austria‟s proposal success rates are almost by a third higher than the FP7 average (8% as compared to 6%)
Regions of knowledge, where Austria‟s proposal success rates are 30% higher than the FP7 average (30% as compared to 23%)
Space, where Austria‟s proposal success rates are 15% higher than the FP7 average (40% as compared to 35%)
Austria‟s participation-level success rates are currently below the FP7 averages in eight areas: NMP, Health, Research Infrastructure, Science in Society, Food Agriculture and Biotechnology, Energy, Research for benefit of SMEs and Research Potential.
Austrian FP6 and FP7 participation rates explained
It is possible to use Austria‟s relative demand and relative success rates in combination to further explain why it is that Austria has a relatively high or low involvement in the different FP6 and FP7 priority areas.
Figure 31 presents the data on Austrian demand, success and participation rates by priority area in FP6, relative to FP6 rates overall. Figure 32 presents the corresponding analysis for FP7 and was constructed in the same way.
The percentages shown in column 2 are calculated by dividing Austria‟s share of its participations in each area by the overall share of FP6 participations in each area. So, if 20% of Austria‟s participations fall in the IST area but only 10% of all FP6 participations are in IST, then we can say that Austria has double the „normal‟ participation rate in IST. The relative participation rate in that area is 200%.

Final Report 69
The percentages shown in column 3 are calculated by dividing Austria‟s demand in each area by the overall FP6 demand in each area. So, if 20% of Austria‟s participations in proposals fall in the IST area but only 10% of all FP6 participations in proposals are in IST, then we can say that Austria has double the „normal‟ demand rate in IST. This gives a relative rate of demand in that area of 200%.
The percentages shown in column 4 are calculated by dividing Austria‟s success rate in each area by the overall FP6 success rate in that area. So if Austria‟s success rate in IST is 20% and the average FP6 success rate in that area is only 10%, then we can say that Austria has double the „normal‟ success rate in IST. This gives a relative success rate of success rate in that area of 200%.
Austrian participation rates in FP6 priority areas
Figure 32 shows how Austria‟s relative levels of demand and relative success rates have acted in combination to drive Austria‟s relative participation rate in each of the FP6 priority areas. The priority areas listed in the table have been sorted according to the second column so that the areas where Austria‟s relative participation rate is highest appear at the top of the list. It can be seen that in most cases Austria‟s high relative participation rate is explained by a combination of medium-high demand and medium-high success rates. However, the pattern is not completely uniform. For example, in the case of the Development of R&I policies area, the very high participation rate for Austria is explained not by levels of demand (which were in fact slightly below average) but by extraordinarily high success rates within the competition. In the case of Sustainable development the reverse is true – the relatively high level of participation is explained not by success rates (which were slightly below average) but by a relatively high level of demand for participation in that area.
Figure 32 Austria‟s relative participation rates, by FP6 priority area, explained by the interplay of demand and success rates
Priority Normalised
participation rate Normalised
Demand Normalised
Success Rate
Development of R & I policies High (272%) Medium (92%) High (295%)
Support for the coordination of activities
High (200%) High (204%) Medium (98%)
Science and society High (168%) High (106%) High (158%)
7. Citizens and governance High (133%) High (137%) Medium (97%)
2. Information society technologies High (115%) High (104%) High (110%)
6. Sustainable development High (113%) High (120%) Low (96%)
Horizontal research activities – SMEs Medium (108%) High (116%) Low (93%)
1. Life sciences, genomics & biotechnology
Medium (101%) Medium (97%) High (104%)
3. Nanotechnologies and nanosciences Medium (100%) Medium (93%) High (108%)
Research and innovation Medium (100%) Medium (98%) Medium (101%)
Policy support / S&T needs Medium (91%) Medium (99%) Low (92%)
Human resources and mobility Low (75%) Low (89%) Low (84%)
5. Food quality and safety Low (73%) Low (72%) Medium (102%)
Support for international cooperation Low (70%) Low (64%) High (110%)
4. Aeronautics and space Low (66%) Low (63%) Medium (104%)
Research infrastructures Low (66%) Low (77%) Low (87%)
Euratom Low (32%) Low (62%) Low (52%)
Total 100% 100% 100%

70 Final Report
Austrian participation rates in FP7 priority areas
Figure 33 shows how relative levels of demand and relative success rates have acted in combination to drive Austria‟s relative participation rate in each of the FP7 priority areas. As was the case with FP6, in most cases Austria‟s high relative participation rate in FP7 can be explained by a combination of medium-high demand and medium-high success rates. However, the pattern is again not completely uniform. For example, in the case of the Science in Society area high levels of demand alone explain the high participation rate for Austria, as success rates in this area were below average.
The analysis is also useful in understanding why Austria‟s relative performance has been low in some areas. For example, in the Energy area relatively high levels of demand have not been converted into a high level of participation, due to the very low success rates for Austrian proposals in this area. Conversely, it is low levels of demand that drive the relatively low level of involvement in the European Research Council area – Austrian success rates here were significantly above average.
These findings should be useful for Austrian policymakers and RTD funding agencies in determining whether Austrian performance and involvement in FP projects is above or below expectations, given Austria‟s known strengths and weaknesses in the different subject areas.
Figure 33 Austria‟s relative participation rates, by FP7 priority area, explained by the interplay of demand and success rates
Priority Normalised participation rate
Normalised Demand
Normalised Success Rate
Coherent development of research policies
High (225%) High (169%) High (133%)
Activities of International Cooperation High (200%) High (123%) High (162%)
Information & Communication Technologies
High (139%) High (122%) High (114%)
Socio-economic sciences and Humanities
High (139%) High (127%) Medium (109)%
Science in Society High (118%) High (140%) Low (84%)
Security High (118%) Medium (103%) High (115%)
Space High (117%) Medium (102%) High (115%)
Environment (including Climate Change)
Medium (115%) High (112%) Medium (102%)
Regions of Knowledge Medium (115%) Low (88%) High (130%)
Transport (including Aeronautics) Medium (106%) Medium (96%) Medium (110%)
Health Medium (94)% Medium (101%) Low (94%)
Marie-Curie Actions Medium (89%) Low (88%) Medium (102%)
Energy Low (83%) High (140%) Low (59%)
European Research Council Low (83%) Low (63%) High (132%)
Research Infrastructures Low (79%) Low (87%) Low (92%)
Nanosciences, Nanotechnologies, etc. Low (72%) Low (74%) Medium (98%)
Food, Agriculture, and Biotechnology Low (70%) Low (87%) Low (81%)
Research for the benefit of SMEs Low (52%) Medium (101)% Low (52%)
Research Potential Low (20%) Low (46%) Low (43%)
General Activities (Annex IV) Not available Not available Not available
Fusion Energy Not available Not available Not available
Nuclear Fission and Radiation Protection
Not available Not available Not available
Total 100% 100% 100%

Final Report 71
2.2.2.2 Austrian participation in EUREKA and other European initiatives
In the following we present participation statistics for selected RTDI initiatives other than the FPs (or, to say, other than the „core‟ FPs with their thematic priorities).
On a general level, availability and quality of data varies greatly across initiatives. Especially in terms of timely availability of reliable participation data at Member State level, the FP‟s e-Corda leaves many of the other monitoring systems behind – despite the higher complexity of the e-Corda system and the greater amount of data.
EUREKA
Figure 34 shows the number of newly approved EUREKA projects with Austrian participation broken down by type of project for the time frame of 2005 to 2009. It is immediately evident that the absolute number of projects is very low compared to FP6 or FP7. In 2005, there were 21 individual projects and 11 cluster projects with Austrian participation. In 2006, 30 new individual EUREKA projects were approved, and Austrian participation in clusters grew slightly to 12. Since then, there has been a steady decline of traditional individual EUREKA projects – from 15 projects in 2007 to only nine in 2009. Part of the decline was absorbed by Eurostars projects: 21 Eurostars projects with Austrian participation received a funding decision in the two Cut-off-Dates in 2008, and a further seven in the one cut-off date in 2009. Overall, the number of newly established EUREKA projects with Austrian participation has varied in a bandwidth from 24 projects p.a. to 42 projects p.a. in the time period observed.
Figure 34 New EUREKA projects with Austrian participation, absolute numbers, 2005 to 2009 by type of projects
21
30
1512
9
11
12
9
68
21
7
0
5
10
15
20
25
30
35
40
45
2005 2006 2007 2008 2009
Individual projects Cluster projects Eurostars projects
N
*) Note: Figures for Eurostars projects based on results of Cut-Off Dates 1 through 3 and the projects shown as receiving funding (see also Figure 36) Source: EUREKA office in FFG-EIP, own compilation.
For the time frame 2005 and 2009 and for all project types, 43% of the organisations participating were SMEs. 24% were large firms, 15% were universities, 14% institutions from the non-university R&D sector and 4% were „other‟ organisations.
Figure 36 shows the evaluation results and funding decisions for Eurostars in more detail. In 2008 to 2010, there were four cut-off dates for applications. A total 0f 1,470 proposals were received in that time frame. The number of applications increased from 215 on the first cut-off date, to 343 on the fifth cut-off date. The 1,470 projects represented 4,875 participations, with an average SME share of 72%.

72 Final Report
Figure 35 Type of Austrian organisations participating in EUREKA projects, aggregate for 2005 to 2009
43%
24%
15%
14%
4%
SMEs Large firms Universities Non-university R&D organisations Other
Source: EUREKA office in FFG-EIP, own compilation
938 Eurostars proposals were eligible (or around 64% of all proposals – a figure which seems quite low). Of these, 92 had Austrian participants. 458 proposals were above the threshold, 48 of them with Austrian participation. In the end, 325 Eurostars projects received funding in Europe overall, of which 35 in Austria, in the time frame 2008 to 2010. Austrian project participation as a share of all projects funded amounted, on average, to 10.8%. Austrian success rate for eligible proposals amounted to 38.0%, compared to the European average of 34.6%.
As of November 9, 2010 there were 660 running EUREKA „individual‟ projects. 37
projects (around 5.6%) had Austrian participation.42 Furthermore there were 16 on-going cluster projects with Austrian participation (22% of the total of 72 ongoing clusters in Europe). Austrian organisations participate in the clusters
CATRENE/MEDEA+, ITEA-2, CELTIC and EURIPIDES.43 The number of ongoing Eurostars projects corresponded to the figures for the funded projects presented in Figure 36.
Figure 36 Results for Eurostars applications in Europe and for Austria, 2008 to 2009
Cut-Off 1 Feb 08
Cut-Off 2 Nov 08
Cut-Off 3 Sep 09
Cut-Off 4 Feb 10
Cut-Off 5 Sep 10
TOTAL
Application phase
Number of proposals 215 317 279 316 343 1,470
Total Volume [€ million] 300 446 385 421 495 2,047
Number of participations
667 1,098 957 1,061 1,092 4,875
SME share in % of participants
74% 73% 71% 71% 72% 72%
42 Data based on a query of the public database of the EUREKA secretariat homepage, performed by the EUREKA office of FFG-EIP.
43 EUREKA Project Portfolio Results 2002 – 2009.

Final Report 73
Cut-Off 1 Feb 08
Cut-Off 2 Nov 08
Cut-Off 3 Sep 09
Cut-Off 4 Feb 10
Cut-Off 5 Sep 10
TOTAL
Evaluation phase
Eligible applications 189 245 236 268 n.a. 938
Eligible proposals with AT participation
17 25 21 29 n.a. 92
Eligible proposals above threshold
133 111 112 102 n.a. 458
Eligible proposals above threshold with Austrian participation
14 14 7 13 n.a. 48
Projects funded 90 86 85 64 n.a. 325
Projects funded with AT participation
11 10 7 7 n.a. 35
Austrian participation in % of projects
12.2 11.6% 8.2% 10.9% n.a. 10.8%
Source: EUREKA office in FFG-EIP
COST
Between January 2004 and March 2009 there were 424 COST Actions44. In this period, Austrian researchers participated in 286 out of 424 Actions (67% of all Actions). The United Kingdom leads the list with 416 participations, followed by Germany with 411 and Spain with 397 participations. There are only EU15/EFTA countries in the top ten places (Figure 37). However, if we normalise country
participations, dividing participations by government-financed GERD45, thus taking into account the size of the public research systems, the situation looks different: In the first ten places, mostly small Southern European and Central and Eastern European countries appear and Austria ranks only 24th.
Figure 37 Country participations in COST
Country No. of
participations Country
No. of participations
Country No. of
participations
UK 416 Norway 295 Slovakia 145
Germany 411 Sweden 291 Israel 144
Spain 397 Austria 286 Turkey 109
France 392 Portugal 277 Serbia 108
Italy 391 Hungary 260 Croatia 102
Belgium 362 Czech Republic
242 Latvia 89
Switzerland 339 Ireland 220 Estonia 73
Netherlands 337 Slovenia 214 Iceland 48
Finland 323 Romania 179 FYR of Macedonia
45
Denmark 321 Bulgaria 177 Luxemburg 40
Poland 311 Cyprus 150 Malta 36
Greece 306 Lithuania 148 Total 7,984
Source: COST monitoring data
44 A COST Action is a network of researchers gathered around a certain topic. 45 PPS at 2000 prices, source: Eurostat.

74 Final Report
Joint Technology Initiatives (JTIs)
Data available for participation was retrieved from the publicly accessible respective websites for each JTI, and partly from FFG-EIP. Most of the JTIs had one to two calls performed at the time of writing of this report and were often in the process of preparing the third. Data quality (form and content) varied considerably across JTIs. It became evident, though, that only few Austrian players were involved so far, mostly larger well known firms and some research institutions and universities.
ARTEMIS: ARTEMIS had two calls carried out, one in 2008 and 2009. A third call is being carried out in 2010, results are not available. Results presentations on the two calls vary on the ARTEMIS homepage. For the 2008 call, the homepage lists 12 funded projects (overall funding volume: €196.52 million); two projects had Austrian participation. In each of these two projects there were three Austrian participations, and in both cases Austria had the coordination role. As for the 2009 call, there have been 56 proposals and, eventually, 13 projects got funded. However, publicly available data on participation is incomplete. We found Austrian participation documented only in one project, where eight Austrian partners participated. For both calls, a focus on ICT research in the automotive sector became visible.
ENIAC: The first call in 2008 yielded seven funded projects. Three projects showed Austrian involvement. There were 12 Austrian participations overall. The second call yielded 11 projects. Five projects had Austrian participation. The overall number of participations was 16. A third call is underway.
IMI: Results are only available for the first call of 2008. The second call of 2009 is not yet completed, a third call for 2010 under development. The first call saw 150 applications. Eventually, 15 projects received funding. The EC‟s contribution to all 15 projects amounts to €110 million and is backed by industry with another €110m. Within the 15 projects, five show Austrian participation – for the most part universities and R&D institutions. Overall, we counted eight participations.
Clean Sky: Between June 15, 2009 and July, 27 2010 a total of six calls have been launched. Results are available for the first three calls. There were348 proposals, of which 119 obtained funding. Of these 119 projects, four had Austrian participation. In three of these cases, Austria had a coordinator role. There were a total of 218 participations, four of which originated in Austria. Total funding provided amounted to €31.4 million. The Austrian participants obtained around €485,500 overall. This corresponds to a return rate of 1.55%.
Fuel Cells and Hydrogen (FCH): For the JTI FCH, official results are only available for the first call of 2008. A total of 16 projects were selected for funding. These 16 projects comprised a total of 126 participations, of which a total of two were from Austria, in two distinctive projects. Both Austrian participations were in a partner role. The total budget for the first call amounted to €28.1 million.
Conclusions
Despite issues with availability and quality concerning participation data for many European schemes, the participation data available is in line with our quantitative and qualitative results. RTDI schemes other than the collaborative projects in thematic priorities of the FP are by comparison of marginal importance in terms of the number of research projects and researchers participating.
The investigation of the JTIs has revealed that only few select and well-known players in Austria (can?) participate in the JTIs. JTIs are also characterised by a small number of rather large projects involving many participants. Hence, it is not a surprise that the JTIs are frequently described as „close clubs‟. Further analysis is needed whether the element of competition – which is one key driver for research excellence in the FPs – is sufficient in the JTI context.

Final Report 75
2.2.3 Impacts of European RTDI initiatives at actor level
2.2.3.1 Outputs of the Framework Programmes
Importance of outputs
The most important output of FP projects is follow-up projects (see Figure 38). Follow-up projects can have different formats. They need not necessarily be FP projects, as they are just one – though important – mode of cooperation. Indeed, follow-up projects do not have to be tied to a research funding programme at all. Often follow-up projects are used to develop results further towards application, often in the framework of a national programme, or in an international programme albeit more rarely, sometimes on a bilateral and private basis between FP partners. One FP participant told us in an interview of an FP6 project whose results were developed into an application in a CIP project. Or a components manufacturer underlined that by working together with a user in a FP consortium, the user got to know the manufacturer better and learnt to appreciate the firm‟s qualities, which subsequently lead to a bilateral development project.
Follow-up projects are more important to coordinators compared to non-coordinators, with 91% of coordinators stating that follow-up projects are of high importance as
compared to 66% of non-coordinators.46 Interestingly, follow-up projects have the same importance to different types of organisations, although most other outputs differ in importance by type of organisation (see below).
Interestingly, follow-up projects are not mentioned as the most important output in the impact studies produced in the benchmark countries (Netherlands, Ireland, Sweden, Finland, Germany, Switzerland), although still ranking high. Main outputs of FP projects mentioned in international studies are:
Scientific conferences, seminars and workshop
Publications in refereed journals
New or improved tools, methods and techniques
Other (non-refereed) publications
These „scientific‟ outputs also rank high in Austria-after follow-up projects (see Figure 38). This is not really surprising as universities and non-university research institutes dominate Austrian participation in the FPs.
In contrast, the more commercial outputs such as „patent applications‟, „invention disclosures‟, and „new license agreements‟ are at the bottom of the list. This pattern is also found in other countries: The Danish study, for example, underlined that most of the outputs sought and produced through FP projects were research outputs (publications, conferences, trained personnel etc.). Also in Ireland, academic outputs were rated the most important types of output. All participants irrespective of the type of organisation they were affiliated placed some of the more commercially orientated outputs (i.e. invention disclosures, license agreements, patent applications and patents granted, etc.) towards the bottom of their „importance‟ list.
46 All differences reported in this chapter are at the level of 0.05 or lower (p<0.05) unless stated otherwise.

76 Final Report
Figure 38 Importance of outputs of the Framework Programmes*)
2,1
2,1
2,2
2,2
2,2
2,3
2,4
2,5
2,7
2,9
3,0
3,2
3,3
3,4
3,6
1,0 1,5 2,0 2,5 3,0 3,5 4,0
Exchange of personnel (in or out)
New license agreements
Invention disclosures
Patent applications
Awards and prizes
New or significantly improved regulations and policies
New or significantly improved technical standards
New or significantly improved commercial products or services
New or significantly improved scientific or industrial processes
Newly trained/qualified personnel
Other publications
Articles in refereed journals or books
New or significantly improved tools, methods or techniques
Scientific conferences, seminars or workshops
Follow-up projects
*) Arithmetic mean on a scale from 1=no importance to 4=high importance Sources: Main online survey, n=291
The fact that commercial outputs are of smaller relevance to participants is, on the one hand, due to academic organisations – universities and non-university research institutions – being the main participants in the FP. On the other hand, it is due to the positioning of FP projects, which are pre-competitive. At the pre-competitive stage commercial outputs and IPR simply are deemed very relevant. The fact that FP projects are mostly pre-competitive has a great deal to do with IPR. Or as an interviewee said: “At this stage, you always find a solution for IPR”. Another interviewee observed that: “The closer to application you get, the smaller the consortia and the more „national‟ projects become.” Many Austrian interviewees confirmed this observation.
Realisation of outputs
We also asked respondents whether outputs had been realised to the extent they had expected in their FP projects. As can be seen in Figure 39, „follow-up projects‟ may be a very relevant output to many respondents but more than a third of respondents (35%) indicated that follow-up projects had been realised to a lower extent than expected. Other outputs whose realisation was lower than expected are „new or significantly improved regulations and policies‟ (38%), „new license agreements‟ (36%), „invention disclosures‟ (33%) and „patent applications‟ (31%) – all outputs that respondents do not view as very important. Nonetheless, it is striking that among the top group of hard-to-realise outputs are mostly IPR related outputs. However, given the positioning

Final Report 77
of FP projects as pre-competitive and the possibility of IPR conflicts at later stages of research, this is not surprising.
In comparison, more „scientific‟ outputs like „scientific conferences, seminars or workshops‟ and „other publications‟ were rarely below expectation, presumably because of their easy access.
This pattern is confirmed by international studies. For example, the Finnish impact study underlines that patents and licenses (and new business activities) are among the business related objectives that are most often not reached at all, while the Danish study reports far less activity in relation to the production of „innovation‟ outputs (such as new products, patents, licences etc.) than to research outputs.
The so-called other types of organisations (agencies, NGOs, ministries etc.) seem to realise outputs less frequently than expected, compared to universities, non-university research institutes, and industry. This is particularly true for „other publications‟ and „new or significantly improved commercial products and services‟. The latter output is presumably not very relevant to the category of organisations so we assume this is not a cause for concern. However, „new or significantly improved commercial products and services‟ are also below expectation by industry, which is more worrisome.
Moreover, „new or significantly improved regulations‟ are below expectation by large
firms. „Articles in refereed journals or books‟ are below expectations by SMEs47, implying that SMEs find access to scientific outputs more difficult.
Last but not least, coordinators find realisation of „new or significantly improved scientific or industrial processes‟, „new or significantly improved tools, methods or
techniques‟, „new or significantly improved technical standards‟48 easier than non-coordinators, suggesting that the larger effort made by coordinators also brings higher pay-offs. We consider this a positive and unsurprising result. Indeed, we would hope that coordinators would stop coordinating if their benefits were not larger than partners‟. Any other behaviour would not be rational given the extent ofwork required to coordinate an FP project.
47 p<0.1 48 p<0.1

78 Final Report
Figure 39 Outputs of the FP, realised below expectation, respondents in %
8
13
17
17
17
18
22
24
24
24
31
33
35
36
38
0 20 40 60 80 100
Scientific conferences, seminars or workshops
Other publications
Articles in refereed journals or books
New or significantly improved tools, methods or techniques
New or significantly improved technical standards
New or significantly improved scientific or industrial processes
Awards and prizes
New or significantly improved commercial products or services
Newly trained/qualified personnel
Exchange of personnel (in or out)
Patent applications
Invention disclosures
Follow-up projects
New license agreements
New or significantly improved regulations and policies
Lower than expected, in %
%
Sources: Main online survey, n=181
Control Group
A comparison of FP participants with the control group shows that a number of outputs are considerably more important to FP participants than to the control group. These are „scientific conferences, seminars or workshops‟, „articles in refereed journals or books‟, „other publications, „new or significantly improved regulations and policies‟ and „follow-up projects‟. The outputs with the largest difference between FP participants and the control group are the first three – i.e. the scientific outputs.
Since the control group contains a large number of SMEs, we compared control group members from industry with FP participants from industry. Nonetheless, the above mentioned outputs are still more important to FP participants than to the control group, although to a lesser extent. A notable exception is ‟newly trained/qualified personnel‟ which has the same importance for both FP participants and control group members. Hence, it is fair to conclude that FP participants, including industry, tend to be geared toward scientific and policy orientated outputs than their counterparts in the control group. The same is true for follow-up projects. „New or significantly improved commercial products and services‟, „new or significantly improved technical standards‟ and „patent applications‟ were considerably more important to the control group than to FP participants. This is also true if only industry participants are compared. Hence, mirroring the result above, control group participants appear to be more orientated towards commercial outputs in their international cooperation.

Final Report 79
Figure 40 Outputs: comparison between FP participants and control group *)
3,2
3,0
2,9
2,1
2,2
3,4
3,6
2,2
2,2
2,1
3,3
2,5
2,7
2,4
2,3
2,7
2,5
2,5
2,1
2,2
2,8
3,2
2,5
2,6
2,3
3,4
3,2
3,0
2,8
1,9
1,0 1,5 2,0 2,5 3,0 3,5 4,0
Articles in refereed journals or books
Other publications
Newly trained/qualified personnel
Exchange of personnel
Awards and prizes
Scientific conferences, seminars or workshops
Follow-up projects
Invention disclosures
Patent applications
New license agreements
New or significantly improved tools, methods or techniques
New or significantly improved commercial products and services
New or significantly improved scientific or industrial processes
New or significantly improved technical standards
New or significantly improved regulations and policies
Control group FP participants
*) Arithmetic mean on a scale from 1=no importance to 4=high importance Sources: Main online survey, n=291; control group survey, n=180
These results are not surprising because, as shown above, FP projects are primarily pre-competitive. Moreover, we know from interviews with control group members that their international research cooperation is often close to the market and bilateral. Another piece of evidence that supports this conclusion is that international R&D cooperation is mostly paid for by participants themselves. Hence, the different relevance of outputs is a logical consequence of the positioning of the FPs and international research cooperation respectively.
Break-down of FP participants by subgroups
When breaking down outputs by type of organisation, we find a similar pattern as in the previous chapter on motives and barriers (see chapter 2.2.1). As can be seen in Figure 41, the more scientific and human resources orientated outputs are more important to universities and to a lesser degree also to non-university research institutions than to industry and other types of organisations. This is particularly true of outputs such as „articles in refereed journals or books‟, „newly trained/qualified personnel‟, „exchange of personnel‟, and „awards and prizes‟. „Other publications‟ is most relevant for non-university R&D institutions, while „scientific conferences, seminars and workshops‟ are more important to non-university institutions, universities, and other types of institutions but significantly less so to industry.
Patent applications only have medium importance (see Figure 41), presumably because FP projects are mainly pre-competitive. Interestingly, however, patent

80 Final Report
applications have the same relevance to universities and industry. This may, on the one hand, be due to the European Commission „pushing‟ patents. On the other hand, it could indicate that the incentives and support structures promoting patenting established in Austria have been effective with university members. New IP regulations for universities and specific support structures to encourage the exploitation of research and IP protection were introduced after the new University Law of 2002. Interest in patents by industry and universities may lead to clashes between them so it is probably good that FP projects are mainly pre-competitive.
In contrast, the more commercially orientated outputs such as „new or significantly improved commercial products or services‟ and „new or significantly improved technical standards‟ are significantly more important to industry than other actors. Last but not least, „new or significantly improved regulations and policies‟ are most important to other types of organisations. This is not surprising as the residual category of organisations contains actors close to policy-making such as agencies, ministries, NGOs, etc.
Other types of organisations are an interesting category of actors. The international studies note an increasing trend of participation of public and private administrative organisations such as hospital associations, local authorities, foundations, and industrial associations. This trend became particularly noticeable with FP6 and also applies to Austria. In FP6, more than 50% of other types of organisations participated in the Thematic Programmes, mostly in research projects. They encompass such diverse actors as libraries, associations, municipalities, the Austrian National Broadcasting Company (ORF), and other actors not clearly categorised as „higher education sector‟, „research organisations‟, or „industry‟. Around 15% participated in support actions for the coordination of activities, i.e. mostly ERA-nets. Here we find many national agencies like FFG and FWF as well as ministries. Another 10% participated in the „Research and Innovation‟ line, e.g. Innovation Relay Centres. These were mostly regional agencies like the Regional Contact Points (see chapter 3.1.1). In FP6, FFG had more than 60 participations, mostly in NCP projects and ERA-Nets, while the Environmental Agency (“Umweltbundesamt”), the Federal Ministry for Transport, Innovation and Technology (BMVIT), and the Federal Ministry for Education, Arts and Culture (BMBWK) each had nearly 20 participations. In FP7, by November 2009, we again find FFG with nearly 20 participations, the Federal Ministry for Science and Research (BMWF) with nearly 10 participations and various government agencies with more than five participations.
We also tried to find out whether outputs varied by other break-down variables. We found, however, that other subgroups (e.g. large firms vs. SMEs or coordinators vs. non-coordinators) varied considerably less in their assessment of outputs.
New license agreements are more important to SMEs than to large firms, with 28% of SMEs giving this output high importance as compared to 8% of large firms. This result ties in with results from the previous chapter which showed that SMEs are more interested in more immediate, tangible results. In contrast, new or significantly improved technical standards are more important to large firms. While 58% of firms considered technical standards an output of high importance, only 21% of SMEs did. This result is in line with the literature that shows that large firms are more interested and able to set standards than SMEs because of their size and/or market power.
Although generally of fairly low importance, „new or significantly improved technical standards‟ are more important as outputs to non-coordinators than to
coordinators. This is due to large firms mostly being non-coordinators49, to whom improved technical standards are particularly important. At the same time,
49 The share of large Austrian firms coordinating an FP project is 4%, while their overall participation share is 9%.

Final Report 81
however, coordinators achieve this objective more frequently than non-coordinators, implying that those who really want „new or significantly improved technical standards‟ do not necessarily get them. Furthermore, new license agreements, although again of fairly limited importance, are more important to coordinators.
Figure 41 Relevance of outputs by organisational type*)
3,4
3,4
2,8
2,1
2,1
3,6
3,8
2,1
2,1
2,0
3,3
2,1
2,7
2,3
2,4
3,9
3,1
3,6
2,5
2,7
3,5
3,6
2,4
2,4
2,1
3,3
2,1
2,6
2,3
2,0
2,5
2,6
2,3
1,6
2,0
3,1
3,4
2,3
2,4
2,4
3,5
3,5
3,0
2,8
2,1
2,7
2,8
2,4
2,0
2,0
3,5
3,5
1,8
1,9
1,9
3,1
2,2
2,4
2,2
2,9
1,0 1,5 2,0 2,5 3,0 3,5 4,0
Articles in refereed journals or books
Other publications
Newly trained/qualified personnel
Exchange of personnel (in or out)
Awards and prizes
Scientific conferences, seminars or workshops
Follow-up projects
Invention disclosures
Patent applications
New license agreements
New or significantly improved tools, methods or techniques
New or significantly improved commercial products or services
New or significantly improved scientific or industrial processes
New or significantly improved technical standards
New or significantly improved regulations and policies
Other Industry Universities Non-university R&D institutions
*) Arithmetic mean on a scale from 1=no importance to 4=high importance Source: Main online survey, n=291
2.2.3.2 Impact of the Framework Programmes
As can be seen in Figure 42, the most important impact of the FPs are „improved relationships and collaborations with partners already known‟ (mean 3.6), closely followed by „improved relationships and collaboration with new and previously unknown partners‟. In other words, the FPs‟ goal of creating and strengthening networks among European research actors is achieved. Researchers use the FPs for what it is intended for: building and maintaining research partnerships.
The result ties in with the very strong impression we gained in the course of this evaluation that international research partnerships have become an every-day

82 Final Report
occurrence. This is not only true for FP participants but also non-FP participants, which became evident in our control group survey: A large majority of the control group (73%) stated that international R&D cooperation was of high (26%) or fairly high importance (47%) for their work. Moreover, in the last five years, 43% of control group respondents have been engaged in R&D cooperation. A more detailed analysis showed that universities (64%) and large firms (58%) have been engaged in international R&D cooperation more frequently than non-university research institutions (44%) and SMEs (36%). In other words, a substantial amount of international R&D cooperation takes place outside international R&D programmes. This suggests that the FP is no longer the proxy for international research cooperation it (presumably) used to be.
Compared to non-coordinators, coordinators experience higher impact with regard to „improved relationships and collaborations with partners already known‟, presumably because they form the hub of the FP network. The same is true for SMEs compared to large firms: SMEs seem to profit more from being in an FP network than large firms, presumably because they have fewer (close) contacts than large firms.
From interviews with Austrian FP users and stakeholders we know that many FP participants have a core of long-standing partnerships dating back to earlier FPs. When establishing a consortium for an FP proposal, they start out with this core of partners and add other partners according to “technological and political necessities” (an interviewee). Some interviewees even talked of „research cliques‟ (“Forschungsseilschaften”), suggesting that FP consortia tend to be closed shops. This is evidently a problem if participation in „research cliques‟ is linked to various research and business opportunities – which our findings suggest it is. However, results also show that FPs improve relationships with new and previously unknown partners. While this counteracts the closed shop effect, new partners often are partners‟ partners. This is not really surprising as consortia need to have some criterion when taking up a new partner and a previous working relationship with one of the existing partners certainly is a good one. This probably also explains why databases for partner search are of limited usefulness, as we were told repeatedly.
Improved relationships and networks, fostering internationalisation and globalisation of research, are also the primary benefit of the FPs in the benchmark countries. FP projects are especially valued as they are a means to coordinate and integrate research on a European level. They are said to have an added value compared to national projects due to their cross-border dimensions. The role of the FP in internationalisation is also documented for many Austrian FP participants. The case studies at the end of this chapter illustrate how different Austrian actors use the FP to pursue their internationalisation strategies (see chapter 2.2.3.3). It became evident that many participants consider FP funding essential for internationalisation.
Other important impacts are „enhanced reputation and image‟ (mean 3.5) and „increased scientific capabilities and know-how‟ (mean 3.4). Enhanced reputation is an important impact for FP users, as they frequently pointed out (see also the case studies on Joanneum Research, chapter 2.2.3.3, and on VRVis, chapter 2.2.3.5) Because the programme is very competitive with many requirements, FP projects enjoy a good reputation. Consequently, FP users gain in reputation and visibility when winning an FP project. Participating in an FP project can also be an important reference when winning new clients for whom to do contract research. Not unexpectedly, coordinators enjoy an increase in reputation and image in comparison to non-coordinators. „Increased scientific capabilities and know-how‟ is an anticipated impact, as can be seen in the logic chart we established (see chapter 2.1) and different result would be surprising.

Final Report 83
Figure 42 Impacts of FPs*)
2,1
2,2
2,4
2,4
2,5
2,6
2,6
2,6
2,7
2,8
2,9
2,9
3,0
3,1
3,1
3,4
3,5
3,5
3,6
1,0 1,5 2,0 2,5 3,0 3,5 4,0
Development of radical innovations - new disruptive technologies
Higher turnover or market shares
Acess to new markets
Development of radical innovations - within technological trajectories
Improved business opportunities
Improved competitive position nationally
Improved mobility of researchers
Improved career development of researchers
Improved ability or capacity to provide training in general
Improved competitive position internationally
Improved possibilities to attract highly-trained scientific personnel
Improved ability or capacity to train young researchers
Improved abaility to attract staff in general/increased employment
Improved capability or capacity to conduct R&D
Increased technological capabilities and know-how
Increased scientific capabilities and know-how
Enhanced reputation and image
Improved relationships and collaboration with previously unknown partners
Improved relationships and collaboration with partners already known
*) Arithmetic mean on a scale from 1=no impact to 4=high impact Sources: Main online survey, n=286
Not surprisingly, the FPs also have a positive impact on the reputation, image, scientific capabilities and know-how of FP participants in other countries. The Swedish study reports that participation in European programmes increased the international positioning and visibility of individual researchers and research groups. In addition, FP participation helped to strengthen participants‟ research strategies, enabling them to extend their capabilities and pursue new lines of research.
However, interviews showed that acquiring key capabilities and know-how in FP projects is often difficult. Indeed, in order to win an FP proposal, applicants already need to possess the necessary capabilities and know-how. This is especially true for coordinators who need to show a track record in a given area. This may be less true for partners for whom there is some evidence that it may be easier to develop capabilities

84 Final Report
and know-how in a new thematic field. A couple of interviewees reported that they had been able to qualify themselves in new areas but in both cases they considered themselves lucky and talked about unusual circumstances and coincidence. In other words, FP projects are more about developing key capabilities and know-how rather than acquiring them.
Similarly, as interviewees tell us, FP projects are also about staying tuned with international scientific development. In fact, there can be costs involved in not participating in the FP. “If one‟s thematic field is covered by the FP, one has to consider carefully whether one can afford not to participate [in the FP]”.
According to interviewees, qualification for European programmes in certain thematic areas is sometimes done in national programmes, showcasing the complementarity of national and European projects. However, it would be wrong to talk about a logical sequence, as not all national funding recipients apply for an FP project, and not all of those who go on to use European research programmes opt for the FP. Moreover, the degree of complementarity varies for different fields, if it exists at all. We have examined this point in more detail in the sectoral case studies below (see chapter 2.2.6) For example, in ICT there is a close thematic link between national and international programmes, while in the SSH national programmes hardly exist so that researchers use the FP instead.
Other important impacts relate to human resources: „improved ability to attract staff in general/increased employment‟, „improved ability or capacity to train young researchers‟ and „improved possibilities to attract highly-trained. We will discuss the training effects later. With regard to employment effects of the FP, we think these should not be overestimated. On the one hand, from a methodological point of view, the item „increased ability to attract staff in general/increased employment‟ does not allow one to distinguish whether either has increased. And even if respondents meant increased employment, the employment created is probably not due to increased competitiveness as a result of participation in the FP. Rather, FP projects directly create jobs. Although jobs are fixed-term and often not full-time they are a direct output of FPs.
Not surprisingly, direct employment effects also occur outside Austria. The Dutch study shows that annually 1,200 researchers in the public sector are funded by the FPs, which makes FP research often an important factor to guarantee the continuity of research groups. In Switzerland too, every participation in a European project directly creates around two jobs. The number of people employed in Switzerland as a result of FPs can thus be estimated at 3,000 for FP5, and 4,000 for FP6.
Respondents rated „development of radical innovations – disruptive technologies‟ as the least relevant impact (mean 2.1). This result was confirmed by interviewees who tended to be rather sceptical when asked whether the FP contributes to radical innovation. Most interviewees expressed the opinion that the FP does not promote radical innovation – and could not do so due to programme design and selection procedure: The process of Work Programme design involves a large number and a large variety of stakeholders, while the selection procedure based on peer review inherently has a mainstream bias. Both features are not conducive to radical innovation. Finally, innovations as a result of FP projects have to be set out in the application already. Evidently, an innovation cannot be radical if it can be spelt out a few years in advance. A possible exception is the Future and Emergent Technologies (FET) scheme in ICT, which allows bottom-up proposals, thus acting as an incubator and pathfinder for new ideas and themes for long-term research. Some interviewees also underlined that an applicant‟s innovativeness is a pre-condition for participating in the FP.
Control group
Comparing FP participants with the control group, we found that a number of impacts are considerably more important to FP participants than to the control group. These are „improved possibilities to attract highly-trained scientific personnel‟, „improved

Final Report 85
career development of researchers‟ and „improved mobility of researchers‟ – i.e. human resources orientated impacts. Since the control group contains a large number of SMEs, we also compared FP participants from industry with control group members from industry only. Yet, the above mentioned impacts are still larger for FP
participants than for the control group, although less so.50
In comparison, the control group experiences greater impacts with regard to more commercially orientated outputs: „improved business opportunities‟ and „higher turnover or market shares‟. These results remain stable if we look at industry only.
As we saw above, scientific and policy orientated outputs seem to be more important to FP participants while commercial outputs more to the control group (Figure 40). Comparing impacts for the two groups, we find similar results: While FP participants experience more human resource orientated impacts, the control group report more commercial impacts.
What tends to be forgotten is that one of the most important effects of research is the qualification of (young) people. They go out into the world, using their knowledge in firms, government, research organisations, and universities to create impact. We will discuss this aspect in the next few paragraphs.
50 Indeed, if we look at industry only, the differences between FP participants and the control group remain the same for all types of impacts, although the strength of the difference varies a little. For example, „access to new markets‟ is more important to the control group than to FP participants, both if we look at the whole sample and if we look at industry only.

86 Final Report
Figure 43 Impacts: comparison between FP participants and control group*)
2,1
2,2
2,4
2,4
2,5
2,6
2,6
2,6
2,7
2,8
2,9
2,9
3,0
3,1
3,1
3,4
3,5
3,5
3,6
2,4
2,9
2,8
2,7
3,0
2,9
2,1
2,1
2,4
3,2
2,4
2,5
2,7
3,1
3,2
3,3
3,2
3,1
3,3
1,0 1,5 2,0 2,5 3,0 3,5 4,0
Development of radical innovations (new disruptive technologies)
Higher turnover or market shares
Acess to new markets
Development of radical innovations (within technological trajectories)
Improved business opportunities
Improved competitive position nationally
Improved mobility of researchers
Improved career development of researchers
Improved ability or capacity to provide training in general
Improved competitive position internationally
Improved possibilities to attract highly-trained scientific personnel
Improved ability or capacity to train young researchers
Improved abaility to attract staff in general/increased employment
Improved capability or capacity to conduct R&D
Increased technological capabilities and know-how
Increased scientific capabilities and know-how
Enhanced reputation and image
Improved relationships and collaboration with new previously unknown partners
Improved relationships and collaboration with partners already known
Control group FP participants
*) Arithmetic mean on a scale from 1=no impact to 4=high impact Source: Main online survey, n= 286; control group survey, n=171
Breakdown of FP participants by subgroups
Differences in impact are most frequently observed between different types of organisations. Universities report higher impacts in scientific and human resource orientated areas: „increased scientific capabilities and know-how‟, „improved possibilities to attract highly-trained scientific personnel‟, „improved ability or capacity to train young researchers‟, „improved career development of researchers‟, and „improved mobility of researchers‟ (see Figure 44).
The last three impacts in particular show that the FPs play an important role in training and developing young researchers – a result confirmed above where we showed the high additionality of the FP with regard to human resources. Similarly, the result is confirmed by Figure 41, which shows the importance of newly trained/qualified personnel as outputs for universities and non-university research institutions. Indeed, FP projects are a popular way to employ and fund PhD students. The People Programme and the ERC Starting Grants both aim at qualifying early-stage

Final Report 87
researchers directly, the former by promoting their mobility, and the latter by supporting up-and-coming research leaders who are about to establish a research team and to conduct independent research in Europe. Finally, the case study on the University of Applied Sciences Vorarlberg (see 2.2.3.3) shows how FP results are used in teaching.
Interviewees – some of them PhD students themselves – told us that an FP project is a particularly good way to qualify as a PhD student, one reason being that PhD students get more opportunities to publish as co-authors owing to the large number of partners in the consortium. Moreover, PhD students learn project management skills in FP projects – a transferable skill that can also be used in other jobs, also outside academia. Of course, this does not mean that simplification of FP procedures is not necessary; a multi-annum international project with a large number of partners and a high budget also trains project management skills after all the administrative burdens have been removed!
All international impact studies mention the importance of the FPs for human resources, especially in terms of training. For example, in Sweden the practice of staffing FP projects largely with PhD students ensures that they play an important role in doctoral training. In the FP projects students are exposed to the international partnerships, with beneficial effects on their research and career prospects.
Looking at industry, we found that industry reports higher impacts in more commercially orientated areas: „access to new markets‟, „increased technological capabilities and know-how‟, „improved business opportunities‟, „higher turnover or market share‟, and „improved competitive position internationally‟.
Other types of organisations and non-university research institutions are generally situated somewhere between the two „extremes‟ of universities and industry.
In conclusion, a similar pattern as seen above with regard to outputs (chapter 2.2.3.1) emerges, with universities experiencing m0re scientific and human resources orientated impacts and industry more commercial impacts. These impacts are in line with organisations‟ missions (and hence not really surprising). They also imply that universities and industry know how to use the various sub-programmes of the FPs so as to achieve these impacts.

88 Final Report
Figure 44 Impacts by organisational type*)
1,9
2,5
3,7
3,6
2,4
2,4
2,9
2,7
2,8
3,2
3,7
2,7
2,7
2,4
2,6
3,5
3,0
3,3
2,3
2,3
2,4
3,6
3,5
3,2
3,2
3,4
2,8
3,2
2,9
3,5
2,4
2,5
1,7
1,9
3,5
3,1
3,0
1,9
2,2
2,6
3,6
3,5
2,0
2,1
2,5
2,6
2,6
3,0
3,3
2,6
3,1
2,6
3,1
3,3
3,5
3,2
2,9
1,9
2,2
3,7
3,6
2,4
2,5
2,6
2,5
2,6
2,9
3,5
2,8
2,8
2,3
2,7
3,1
2,8
2,9
2,6
1,0 1,5 2,0 2,5 3,0 3,5 4,0
Development of radical innovations - new disruptive technologies
Development of radical innovations - within technological trajectories
Improved relationships and collaboration with already known partners
Improved relationships and collaboration with new previously unknown partners
Improved mobility of researchers
Improved career development of researchers
Improved ability or capacity to train young researchers
Improved ability or capacity to provide training in general
Improved possibilities to attract highly-trained scientific personnel
Improved abaility to attract staff in general / increased employment
Enhanced reputation and image
Improved competitive position nationally
Improved competitive position internationally
Higher turnover or market shares
Improved business opportunities
Increased scientific capabilities and know-how
Increased technological capabilities and know-how
Improved capability or capacity to conduct R&D
Acess to new markets
Other Industry Universities Non-university R&D institutions
*) Arithmetic mean on a scale from 1=no impact to 4=high impact Source: Main online survey, n=286
Differences in impact are also visible between coordinators and non-coordinators. As mentioned above, coordinators tend to enjoy higher impacts than non-coordinators.
This is particularly true for the following types:
Improved relationships and collaboration with partners already known
Enhanced reputation and image
Improved competitive position internationally
Improved mobility of researchers

Final Report 89
Development of radical innovation within technological trajectories
This result suggests that coordinators profit more from FP projects than non-coordinators. This is not really surprising as the former are closer to the FP project than the latter. In fact, for coordinators the FP project is often more important than to partners. That is why they coordinate it. Being coordinator means being better able to influence the direction of the research conducted in the FP project. However, there are also other strategies: We have identified actors who do not coordinate FP projects on principle because coordination simply binds too many institutional resources (see for example the VRVis case study in chapter 2.2.3.5). In other cases, a closely knit consortium regularly submits several FP proposals, so as to boost success rates. For each proposal, another consortium partner volunteers as coordinator. As a result, coordination falls to whatever proposal gets accepted. In general, given the larger effort that coordinators put into an FP project, a larger pay-off appears justified.
As for differences in impact between larger firms and SMEs, SMEs report higher impacts with regard to „improved relationships and collaboration with partners already known‟ and „improved business opportunities‟. Given that SMEs tend to seek more immediate and more market-orientated benefits, we assume that SMEs take part in projects that promise more immediate benefits.
Cost benefit relation of FP participation with particular focus on SMEs
We also asked respondents whether or not the benefits of their FP participation outweighed the costs. This is a very useful indicator for assessing the general impact of FP participation. It also gives an impression of respondents‟ general satisfaction with their FP participation, as we can assume that if costs outweigh benefits FP participants are not happy.
All in all, a majority consisting of 63% of respondents stated that the benefits of their FP participation outweighed the costs, while 19% stated that benefits equalled costs and an almost as large share, 18%, stated that costs outweigh benefits. From the interviews we know that one important factor influencing the cost benefit ratio is the funding height (“Förderquote”). An SME told us that “[...] under FP6 with a funding height of 50% the cost benefit relation was negative. We would not have participated in FP7 if the funding conditions had remained the same.”
The Danish FP study shows very similar results: While in Denmark more than two thirds (68%) of Danish FP6 and FP7 participants have realised a positive benefit to cost ratio from their FP projects, the rest, like in Austria, is split between those who stated that the costs and benefits were evenly balanced, and those who stated that the costs of participation had outweighed the benefits. Those reporting a negative benefit to cost ratio pointed to problems associated with the high levels of administration and bureaucracy involved, the limited amount of funding received, difficulties in securing co-funding to support their participation and failure to achieve the scientific objectives of the projects.

90 Final Report
Figure 45 Benefits vs. costs of FP participation, in %
3
3
12
19
24
20
19
0 5 10 15 20 25 30
(-3) Benefits below costs
(-2)
(-1)
(0) Benefits equal to costs
(+1)
(+2)
(+3) Benefits outweigh costs
%
Source: Main online survey, n=304
In line with earlier results, coordinators more often feel that the benefits of their FP participation outweigh the costs. Moreover, when assessing the cost-benefit relation coordinators more often mention that benefits strongly outweigh costs: While 35% of coordinators tick (+3) and 28% tick (+2), only 16% of non-coordinators tick (+3) and 19% (+2) respectively.
Interestingly, different types of organisations do not assess the cost benefit ratio differently. The same is true for large firms and SMEs. This means that for Austrian participants – be they universities, non-university research institutes, large firms, SMEs, or other types of organisations – in almost two thirds of cases benefits outweigh costs. Admittedly, we have seen (and described above) that SMEs tend to be more interested in immediate, tangible results but, evidently, they seem to get them. This is an encouraging result as some studies suggest that for SMEs the cost benefit ratio is worse than for other types of participants.
For example, an impact assessment of the SME-specific measures under FP5 and FP6
shows that for only around 25% of SMEs benefits are higher than costs.51 Of course, this concerns only the part of the FP tailored to technologically less capable SMEs – the precursor of what today is the sub-programme „Research for the benefit of SMEs‟
in the Capacities Programme.52
51 IDEA Consult in collaboration with Ecorys Nederland BV, CSIL, Ecotec Research and Consulting: Impact assessment of the SME-specific measures of the Fifth and Sixth Framework Programmes for Research on their SME target groups outsourcing research, D6 – Final evaluation report, Prepared for: European Commission, Research Directorate-General Directorate T – Implementation of Activities to outsource – SME, Brussels, January 8th, 2010.
52 As mentioned in the previous chapter (2.1), the sub-programme “Research for the benefit of SMEs” has two strands: “Research for SMEs” and “Research for SME associations”. A recent study found that at the beginning of FP7, Austrian participation in the first strand was low but picked up over time and has reached slightly above average participation. In contrast, Austria does not participate very successfully in the second strand but this is due to the way collective research is structured in Austria, see Ohler, Fritz, Geyer, Anton, KMU-Verbände organisieren Forschungsleistung. Strukturen und Bedingungen in Österreich und Optionen für die Zukunft, 2009.

Final Report 91
The situation is different for SME participating in „mainstream‟ instruments of the FP:
a study53 evaluating the participation of SMEs in the Thematic Programmes of FP5 and FP6 is more positive. SMEs were found to bring overall added value to research collaborations, and approximately 80% of research projects saw SME contributions as being „crucial‟ or „important‟. In addition, more than 70% of SMEs report a positive impact on their operations, processes, methods, tools or techniques as a result of their research project. However, SMEs were not optimistic about exploitation and economic impact of their FP project. The study also found that the sheer number of participating SMEs was no longer a key issue. Rather, efforts to increase participation should not be continued but providing (economic) impact should become the important strategic issue.
Indeed, over time there has been a growing trend to try to ensure SME participation in the FPs. However, from the studies quoted we conclude that SMEs are in fact a very heterogeneous group and should not be considered one single target group of policy measures. Many technology-based SMEs are fully capable of participating in the mainstream instruments of the FPs and make valuable contributions to such FP projects. In other words, as we clearly observed, the FP is primarily useful for research intensive, science or technology based SMEs and SMEs already experienced in R&D cooperation.
However, there is also a desire to address the perceived deficits in international networking and R&D co-operation of less technologically capable firms. Hence, specific SME measures have been established (e.g. “Research for the benefit of SMEs” in FP7). Despite the high administrative barriers to participation and the unfavourable cost benefit ratio, this measure is over-subscribed to the same extent as the FP on
average54, indicating a need for international R&D cooperation by SMEs. However, the FP requires SMEs to cooperate internationally with both research organisations and other firms. Our evidence shows that this tends to overburden SMEs not used to R&D cooperation. Hence, support for this kind of SME is best delivered nationally or regionally although national and regional actors tend to lack the international networks needed to provide the European Added Value sought for FP projects. This dilemma remains unresolved in the FP.
In conclusion, we question the usefulness of boosting SME participation in the FP as a target per se – be it in the Thematic Programmes or in the SME-specific part of the FP. Concerning the former, there is strong evidence that technologically capable SMEs for whom the FP is right find their way into it and are served well with the „standard‟ advisory services offered by the Austrian support structures. Concerning the SME-specific measures, support for technologically less capable SMEs is best administrated regionally or nationally, with the possibility of internationalisation (like e.g. in FFG‟s COMET programme).
2.2.3.3 Institutional case studies: using the FP to internationalise
The following case studies all illustrate how different players in the Austrian research and innovation system use the FP to promote the internationalisation of their activities. We selected AIT as a large national player (Box 1), Joanneum Research as a large regional player (Box 2), and the University of Applied Sciences Vorarlberg as a small and young regional player (Box 3). The common message in these case studies is that these players consider the FP an indispensable part of their internationalisation strategies.
53 AVEDAS et al., Impact assessment of the participation of SMEs in the Thematic Programmes of the Fifth and Sixth Framework Programmes for RTD, Final Report, 2010.
54 We do consider an average selection rate of some 17% of all proposals selected low.

92 Final Report
Box 1 Austrian Institute of Technology (AIT)
The Austrian Institute of Technology (AIT) it is not only the largest applied research institute in Austria but also one of the biggest Austrian participants in European FP.
The former Austrian Research Centres (ARC) were transformed into the Austrian Institute of Technology in June, 2009 after a thorough reform of both governance and strategy. Although the thematic focus has shifted over time, AIT / ARC has been performing use-oriented research ever since its foundation some 50 years back.
AIT‟s R&D activities are organised in five thematic departments: (i) health & environment, (ii) energy, (iii) mobility, (iv) safety & security, and (v) foresight & policy development.
The common focus of all but the latter department is on technologies related to infrastructures. AIT‟s R&D staff engage in all stages of research, ranging from basic and applied research to proof of concept, engineering and prototype development. AIT employs 716 people (excluding subsidiaries), 439 of them are researchers55.
AIT (or ARC in this case) first participated in European Framework Programmes as early as 1990, already in FP3. AIT took part in approx. 50 projects in FP4, FP5 and FP6 respectively, i.e. this number remained more or less stable. However, the total number of collaborative research projects in the FP as a whole declined drastically from FP4 to FP6, which means that in relative terms, AIT became increasingly present in FP projects56. In the ongoing FP7, AIT researchers participate in approx. 50 projects so far.
FP projects traditionally play different roles for the different departments at AIT due to their thematic specialisation. Across all fields, collaborative research projects are the most important mode of participation. AIT is also involved in several European Technology Platforms and has even been among the founding members of one of them, ARTEMIS. Other project types (e.g. Marie Curie Fellowships) play a comparatively minor role. Regarding thematic priorities, AIT is most active in the information and communication technologies (ICT), followed by nanotechnologies, materials and production technologies (NMP), sustainable development, and aeronautics. AIT‟s researchers in the foresight and policy development department also approach the FPs as objects of their research, e.g. by investigating the characteristics of R&D networks in the FP.
AIT participates in FP projects as a partner and, especially in the ICT priorities as a coordinator. AIT‟s project partners are located at universities, research institutes and companies alike and many projects rely on long-standing working relationships, some of which even date back to FP3. Due to the thematic spread of research topics dealt with by AIT‟s different departments, there is no such thing as „the typical FP project‟: in some fields, e.g. in transport, projects normally involve partners from industry, whereas projects in other fields tend to be dominated by scientific institutions, e.g. in health or in environment.
AIT‟s general management encourages the individual approaches of its departments towards competitive funding and to FP participation. Therefore the related support structures, some of which are still in their early stage, are also positioned at the level of departments and are (going to be) organised according to the needs of each department. All in all, participation in FP so far has often been driven bottom-up within AIT. Given the new orientation of AIT as a whole, more strategic approaches are being developed.
AIT has to earn 30% of its income from competitive research funding at national or international level. Projects in FP and in other international competitive programmes together account for about 7% of AIT‟s total income in 2009, or for 28% of competitive research funding. For AIT, the FPs are clearly more important than COST, Eureka, CIP etc.
55 AIT, Intellectual Capital Report 2009 56 Knoll, Wolfgang, Fröhlich, Josef, Das AIT Austrian Institute of Technology: „Vorne ist auch viel Platz“
Ein österreichisches Spitzeninstitut der angewandten Forschung auf dem Weg nach Europa, in „Hinaus aus dem Schrebergarten. Die Europäisierung der österreichischen Forschung“, Herlischka, Sabine (Hg.), 2010.

Final Report 93
AIT has explicitly set itself the target to become a major player at the international level in its thematic priorities. Therefore, participating in FP projects is not only a source of income, but much more a matter of positioning AIT in the international scientific communities and research networks. Cooperation is also considered crucial for getting access to knowledge, for expanding AIT‟s own competences, and for making them visible. Moreover, FP projects allow for a longer-term approach to research topics compared to national competitive project funding or to typical contract research done for industry. AIT increasingly strives to play an active role not only as a participant in R&D projects but also in shaping future priorities at the European level, as for instance through its involvement in the ETPs or in the European Energy Research Alliance.
All in all, internationalisation is both, the main driver and the most important effect of participating in European FP.
Box 2 JOANNEUM RESEARCH
Joanneum Research (JR) is one of the largest non-university research institutes in Austria. It is driven by a strong mission to serve the regional economy in Styria and at the same time it is among the 10 most active Austrian participants in the FP. How does JR balance international and regional perspectives?
Joanneum Research focuses on applied research and technology development in five main thematic priorities. The organisational structure has recently been reorganised57 along these specialisations:
Materials: Institute of Surface Technology and Photonics
Health: Institute of Biomedicine and Health Sciences
Digital: Institute of Information and Communication Technologies
Resources: Institute of Water, Energy and Sustainability
Policies: Centre for Economic and Innovation Research
JR is owned by the Province of Styria (90%) and by the Dutch research institute TNO, (10%). It employs 430 people and is located in 5 Styrian cities and has an office in Vienna. JR works for customers from both the private and the public sector and collaborates with scientific partners from Austria and abroad, with a traditionally strong link to the universities based in Styria. 31% of the income from research contracts come from the business sector, 47% from public administration and 22% from international organisations.
Joanneum Research started participating in the FPs in FP4. JR researchers took part in 46 projects in FP5 and 63 projects in FP6. In FP7, JR was involved in some 35 successful projects by September 2010. Not only the number of projects increased but, more importantly, the success rates have. Participation patterns differ widely between the different thematic areas and also between individual research groups. The largest number of projects is in the information and communication technologies with approx. one third of JR's. The nanoscience (including health issues), projects tend to be fewer in number but larger in size. Space and sustainable development are further important thematic priorities, and there are also some projects in the social sciences. JR participates as partner and as coordinator, the latter especially in ICT projects.
Participation in FP (or other programmes) is planned at the level of institutes and has to be considered in their annual budgetary planning. Every proposal has to be accepted by the general management prior to submission. The key criterion for all planned projects is their "strategic fit": only projects that clearly contribute to the respective institute's core tasks and to JR's common objectives will be accepted in this internal assessment. With this approach, JR ensures that the institutional funding needed to co-fund the FP projects is invested efficiently.
JR also participates in other international programmes, e.g. CIP, EuropeAid, Interreg etc., but the FPs are the most relevant mode of international research cooperation. International contracts account for 28% of operating income, which shows that national sources are more important.
JR's owners expect JR to do research at an internationally competitive level and to turn this knowledge into R&D services that ultimately benefit the regional economy. In fact, scientific research at an international level is considered a precondition for the more application oriented work at the regional or national level. Participating in the FP is the most important way of staying tuned with international scientific developments and of getting access to knowledge, partners and networks. Potential customers and JR's owners alike take JR's FP experience as an indicator of competence and scientific qualification – a research institute that relied on regional networks only would soon loose credibility.
57 Reorganisation as of July 2010.

94 Final Report
The training of researchers in another driver of JR's FP participation: temporary staff exchange is a common practice in many research projects. It has proven a valuable means of strengthening research partnerships. Finally, the FPs are an attractive source of research funding, especially with the increased funding rates in FP7.
Collaborative research projects are the dominant mode of participation in the FPs. Increasingly, JR aims at involving its partners from the application sphere, especially SMEs, into its FP consortia, although companies often shy the administrative burdens and difficult IPR issues. To a smaller extent, JR participates in other project types, e.g. human resources, specific support actions etc.
Scientific publications, patents and licenses are important 'tangible' outputs and are considered indicators of success. However, patents are rarely the direct output of an FP project but rather the result of follow-up developments. According to JR, participation in the FPs has had a number of positive effects: it has increased JR's reputation and visibility in the related international scientific communities, it has established contacts and partnerships lasting beyond FP projects, and research outputs from FP projects have lead to follow-up projects and income from related contracts.
Box 3 University of Applied Sciences Vorarlberg: A regional actor successfully internationalising
We selected the University of Applied Sciences (FHV) as a case study because despite being a small regional actor with only a short research tradition, it has been active both in FP6 and FP7 projects. This made us curious.
The FHV was established in 1999. It has six departments: applied languages and intercultural studies, computer science, design and media communication, engineering, management and business administration, and management and social sciences. It offers 14 educational programmes in the areas of business, technology, design and social work, seven of which are Bachelor and the rest Master programmes. Master programmes were introduced in 2007. Currently, 1,054 students are studying at FHV; approximately 2000 students have graduated from FHV so far.
Research was institutionalised at FHV in 2004. At national level, the most important funding agency is FFG, in particular the programmes COIN and Bridge. Habilitated researchers also have FWF projects.
At international level, FHV had four FP projects in FP6, two in information society technologies, one in nanotechnologies and nanosciences, and one in life sciences. In FP7, FHV has been active in three projects so far, all in ICT. While FHV normally is a partner in FP projects, it acted as the coordinator in the life sciences project.
On the one hand, owing to the Lake Constance region being very active in Interreg projects, European Structural Funds – ERDF – have allowed to access the FP, in particular in the areas of traffic/logistics and ICT. FHV is also situated in other, non ERDF-related regional networks. For example, FHV teaches a programme in micro and nanotechnology together with HEIs and research organisations in neighbouring Switzerland. The regional networks have opened doors to the FP by putting FHV in contact with actors active in the FP.
On the other hand, researchers at FHV, in particular those with habilitation, have their own networks, often from the time when they worked at university, and frequently teach at other HEIs as well. In general it is up to them to decide whether or not they want to participate in the FP.
The proportion of FP projects and ESF/ERDF projects is roughly the same.
Motivations for participating in FP projects are twofold. First, FHV wants to position itself in the international scientific community. Second, participation in the FP is part of FHV‟s internationalisation strategy, a strategy that has to be seen against the background of 80% of production in Vorarlberg going into export. The internationalisation strategy also extends to students: the student exchange rate at FHV is 50%, with about the same number of students incoming and outgoing.
FHV‟s FP projects are generally set at the pre-application stage. They are not about applying research results, they are about technology development. In contrast, national projects are used for applying research results. Thus, national and European projects complement each other.
According to FHV, FP projects have various effects. First and most importantly, FP projects have extended FHV‟s international networks. Second, the FP projects also contribute to training students. Master students increasingly write their Master thesis in the framework of a research project, and PhD students typically write their thesis in the framework of a research project. Obviously, these research projects are often FP projects. A third effect is the use of research results from FP projects in teaching. This is important for an institution whose focus is still on teaching.

Final Report 95
2.2.3.4 Impacts of EUREKA
Of the 59 respondents who reported having participated in a EUREKA programme in the last five years, 49 or 83% also participated in either FP6 or FP7, indicating that the target groups of the two programmes overlap.
As with the FPs, the impact „improved relationships and collaborations with partners already known‟ ranks first, while „improved relationships and collaborations with new, previously unknown partners‟ ranks third (see Figure 46). Interviewees tell us that EUREKA is just another possibility to cooperate internationally, but they underline that, compared to the FP, EUREKA has the advantage of higher success rates and lower administrative burden.
The second and fourth most important impacts are „increased technological capabilities and know-how‟ and „increased scientific capabilities and know-how‟ – impacts we would expect to rank high in any research (funding) programme.
„Enhanced reputation and image‟, ranking fifth (mean 3.0), is an important impact to examine because EUREKA (with the exception of Eurostars) is a label rather than a funding programme. Interviewees have questioned the value of the EUREKA label, wondering whether the EUREKA label really increases reputation and image. Indeed, if we look at the impacts the control group experiences (Figure 47), then we discover that „enhanced reputation‟ through international cooperation scores slightly higher with the control group (mean 3.2) than with EUREKA participants. This suggests that EUREKA does not convey additional reputation and image compared to autonomous international R&D cooperation. In other words, the EUREKA label does not appear to have any additionality in terms of enhanced reputation and image.
For a market-orientated programme we would expect commercial impacts to rank higher than in the FPs, which mainly funds pre-competitive research. Indeed, „improved business opportunities‟, „improved competitive position internationally‟, „higher turnover or market shares, „access to new markets‟, „development of radical innovations – within technological trajectories‟ and „improved competitive position nationally‟ all rank somewhere in the middle, while in the FPs they come at the bottom. Interviewees also mentioned risk sharing as another attractive impact of EUREKA projects.
Many of the impacts reported here are also anticipated in the logic chart for EUREKA (mainly for the individual R&D projects). This concerns risk sharing, enhanced visibility, access to new markets, and improved business opportunities. The logic charts also stress development of standards. However, this is an effect that no one mentioned in the course of this impact assessment.
A word of caution: The comparison between EUREKA‟s impacts and the FPs‟ impacts should not be over-stretched. They are different programmes, positioned differently and with vastly different resources, hence producing different impacts. For this reason we have refrained from comparing the strength of the values (means). Suffice it to say that the values are in more or less the same range for both the FP and EUREKA.

96 Final Report
Figure 46 Impacts of EUREKA programmes*)
1,0 1,5 2,0 2,5 3,0 3,5 4,0
Improved career development of researchers
Improved mobility of researchers
Improved possibilities to attract highly-trained …
Development of radical innovations - new …
Improved ability or capacity to provide …
Improved ability or capacity to train young …
Improved competitive position nationally
Development of radical innovations - within …
Acess to new markets
Higher turnover or market shares
Improved capability or capacity to conduct R&D
Improved competitive position internationally
Improved abaility to attract staff in general / …
Improved business opportunities
Enhanced reputation and image
Increased scientific capabilities and know-how
Improved relationships and collaboration with …
Increased technological capabilities and know-…
Improved relationsips and collaboration with …
*) Arithmetic mean on a scale from 1=no impact to 4=high impact Sources: Main online survey, n=41
A comparison between EUREKA participants and the control group is particularly appropriate as they are structurally similar. In both cases, industry, in particular SMEs, are the main participants though EUREKA participants are more often non-university research organisations and other types of organisations. Another similarity between the two groups is that both EUREKA participants and control group members typically engage in international R&D cooperation in relatively small consortia with two to five partners.
Comparing impacts of EUREKA with impacts the control group experiences in their international R&D cooperation, we are struck by how similar they are (see Figure 47). Differences are never larger than 0.3 and concern „improved capacity or capacity to conduct R&D‟, „increased scientific capabilities and know-how‟, „improved competitive position internationally‟, and „improved competitive position nationally‟, where the control group consistently scores higher. These results tell us that the EUREKA programmes do not produce any additional impacts compared to autonomous international R&D cooperation, questioning the additionality of EUREKA.

Final Report 97
Figure 47 Impacts: comparison of EUREKA participants with control group*)
2,3
2,6
3,3
3,1
2,1
2,1
2,5
2,3
2,3
2,9
3,0
2,6
2,9
2,7
2,9
3,0
3,2
2,8
2,7
2,4
2,7
3,3
3,1
2,1
2,1
2,5
2,4
2,4
2,7
3,2
2,9
3,2
2,9
3,0
3,3
3,2
3,1
2,8
1,0 1,5 2,0 2,5 3,0 3,5 4,0
Development of radical innovations - new …
Development of radical innovations - within …
Improved relationships and collaboration with …
Improved relationships and collaboration with …
Improved mobility of researchers
Improved career development of researchers
Improved ability or capacity to train young …
Improved ability or capacity to provide training …
Improved possibilities to attract highly-trained …
Improved ability to attract staff in general / …
Enhanced reputation and image
Improved competitive position nationally
Improved competitive position internationally
Higher turnover or market shares
Improved business opportunities
Increased scientific capabilities and know-how
Increased technological capabilities and know-…
Improved capability or capacity to conduct R&D
Acess to new markets
Control group EUREKA
*) Arithmetic mean on a scale from 1=no impact to 4=high impact Sources: Main online survey, n=41; control group survey, n=171
Just like FP participants, we asked EUREKA participants whether or not the benefits of their FP participation outweighed the costs. Results were fairly positive: All in all, a majority of 55% of respondents stated that the benefits of their EUREKA participation equalled costs, 24% stated that benefits equalled costs and 20% stated that costs outweighed benefits (Figure 48). In comparison, results for the FP were slightly more positive: 63% of respondents said that the benefits of their FP participation outweighed the costs, while 19% stated that benefits equalled costs and 18% reported that costs outweigh benefits.

98 Final Report
Figure 48 Benefits vs. costs of EUREKA participation, in %
4
7
9
24
20
24
11
0 5 10 15 20 25 30
(-3) Benefits below costs
(-2)
(-1)
(0) Benefits equal to costs
(+1)
(+2)
(+3) Benefits outweigh costs
%
Source: Main online survey, n=45
During the course of this impact assessment, we encountered a diffuse feeling of unease with regard to EUREKA. We have the impression this feeling had a great deal to do with policy at programme level. As one expert put it: “I am afraid there is no such thing as one EUREKA. There are many parts of EUREKA, each with their own logic and dynamics. […] That's why they need a strategy: they are everything and nothing.” Put differently, EUREKA, though a small scheme, has four strands, which makes the scheme not very transparent to users. Moreover, the different position of EUREKA in the individual member states exacerbates the problem.
Another reason for this unease seems to be that EUREKA – with the exception of Eurostars – does not fund research. Rather, it awards a quality label called „EUREKA status‟. However, many participants look for a funding programme rather than a label and are disappointed when they realise that EUREKA does not fund the project they have in mind. What makes the situation even more difficult is that in Austria (unlike in some other countries) there is no standard procedure for EUREKA participants to obtain national funding. The low demand for EUREKA in Austria may reflect part of this unease.
Eurostars has a special position within EUREKA because it is an Art. 169/185 initiative and funds research. Eurostars was said to have given EUREKA a boost. This, of course, suggests that EUREKA was in a bit of a „low‟ before Eurostars – a hypothesis that ties in with what we said above.
Experts considered Eurostars an important instrument for a country like Austria, whose economy relies heavily on SMEs. Some of them expect Eurostars, after a revision of its programme design, to become a programme of FP8.
2.2.3.5 Impact of the Framework Programme and other European initiatives on
strategy
We asked respondents whether their organisation had a strategy or guiding principle for using R&D funding. As we can see in Figure 49, 73% of organisations have a strategy for national and regional programmes and 67% for the FPs. We consider this a rather high percentage. Only about a fourth (26%) has a strategy for EUREKA, and about a third (35%) for other European programmes. „Don‟t knows‟ were quite common when we asked about strategy for EUREKA and other European programme, indicating that respondents were not very familiar with these programmes.

Final Report 99
Strategy appears to be a function of the visibility of the R&D programme, while visibility appears to be a function of size and financial volume of programmes. In other words, the larger a programme (or a set of programmes) and the more money available, the more likely an organisation has a strategy for it.
Figure 49 Share of organisations with strategies for different programmes, in %
26
35
67
73
0 10 20 30 40 50 60 70 80
Strategy for EUREKA
Strategy for other European programmes
Strategy for the Framework Programmes
Strategy for national and regional programmes
%
Source: Main online survey; n= 309
SMEs are often said to lack a strategy for using R&D programmes. Indeed, SMEs are said to be deficient in all sorts of manners. However, in this instance we did not find a significant difference between SMEs and large firms: SMEs are as likely as large firms to have a strategy for national and regional programme, and as unlikely to have one for EUREKA and other European programmes as large firms. This indicates that the SMEs we are dealing with belong to the „„upper echelon‟ of SMEs.
However, there are significant differences between the different types of organisations – universities, non-university research organisations, industry and other types of organisations – with regard to strategy. Most notably, the residual category of other types of organisations is less likely to have a strategy for national and regional programmes, the Framework Programmes, and EUREKA as the rest of organisations. This is not really surprising as other types of organisations are often not research actors but actors close to policy-making or users of research results who conduct no or very little R&D. For both of them, it makes perfect sense not to have a research strategy and to participate on a case-by-case basis.

100 Final Report
Figure 50 Share of organisations with strategies for different programmes in place, by type of organisation, in %
20
33
73
75
11
35
50
57
35
44
72
75
34
32
66
78
0 10 20 30 40 50 60 70 80 90
Strategy for EUREKA
Strategy for other European programmes
Strategy for the Framework Programmes
Strategy for national and regional programmes
Industry Universities Other types of organisations Non-university R&D institutions
%
Please note that the differences in % as shown for the item „Strategy for European programmes‟ are not significant, while the differences reported for all other items are significant at the 95% level (p<0.05) Source: Main online survey; n= 309
We also asked our various interviewees about their strategy for the Framework Programmes. The answers gave us a much richer picture. But first of all, let us use a simple story to define what we mean by strategy: “If you are called up at four o‟clock in the morning (alternative version: if you are in a bar at four o‟clock in the morning) and asked whether or not you want to participate in an FP project, you know how to answer.” In other words, you know your guiding principle or the criteria on which you will base your decision. They need not necessarily be written down.
The first thing that struck us when talking to FP users was that strategy occurs at different levels: at individual level, at departmental or institute level, and at organisational level.
Individual strategy must not be underestimated. It is of crucial importance in universities and – perhaps to a lesser degree – in non-university research organisations where researchers enjoy academic freedom. Strategies are as different as the individuals who work in these organisations. One university researcher has the personal ambition to participate in as many FP projects as possible, wanting to achieve some sort of personal record. Another tells us his strategy is to lobby in time in Brussels for a topic or specific call. He does so with researcher colleagues from all over Europe. He maintains that if they did not do so, there would never be an appropriate call. Other researchers tell us they lobby through their professional associations. Still another insists it is useless to set up an individual strategy because an appropriate call only occurs every few years.
At universities and non-university research institutes, there typically is a thematic strategy at institute or departmental level. At the same time, there often is a funding strategy, specifying where institute or department funding for research should come from. The three different sources typically are institutional funding, external competitive research funding, and contract research. Within these parameters, researchers are free to decide what R&D programme they will apply for. Within universities the institute or department level is very heterogeneous. For some institutes only Marie Curie Actions and the ERC are of interest because the

Final Report 101
„traditional‟ collaborative projects do not cover their topics. Other institutes have a long history of participating in the FP, and have established (small) internal support structures.
Universities have developed considerably since they were granted autonomy as a
result of the University Law of 2002 (UG 2002)58. Some universities already had external funding strategies and small research management structures before 2002. But since 2002, the share of external funding has been an indicator in the formula-based budget, with FP funds explicitly mentioned as source of external funding and having the same weight as national funds by FWF. Evidently, this gives universities an incentive to establish a strategy for acquiring external funding, including FP funding.
At the same time, it gives universities an incentive for professionalizing their research management capacities. How far universities have advanced in their professionalisation of research management structures differs among universities. The Medical University of Innsbruck (see case study in chapter 3.2.2) as a young university is still in the process of building up such structures, while the University of Innsbruck has already proceeded far in its professionalisation (see case study in chapter 3.2.2). Evidently, professionalisation not only occurs at organisational level. We have also observed it at an individual level as well as at the level of institutes and departments. We welcome the professionalisation of research management functions at universities as befitting modern universities and in line with the University Law of 2002. However, we would not necessarily plead for a centralised research management structure. Whether research management functions should be centralised or more decentralised, depends on a university‟s make-up.
With the introduction of the ERC the FP has become more attractive for universities, especially „full universities‟ which host a myriad of disciplines that have been neglected in the traditional FP. Also, with its bottom-up approach and focus on research excellence, the ERC functions like a research council (although it is only a budget line in FP7), fitting the logic of the science system. Our case study on the University of Vienna illustrates a full university‟s strategy to the ERC below (Box 6).
The case studies below show two very different approaches to the FP by non-university research institutes. VRVis (Box 4) has developed a highly selective strategy, going either for „cutting edge‟ projects in a small consortium, typically funded under the Future and Emerging Technologies (FET) scheme, or for „networking projects‟ that aim to establish partnerships as a basis for cooperation also beyond FP projects. Moreover, VRVis participates as a partner only because it believes that the costs for
coordinating are too high.59 In contrast, the ZSI (Box 5) is a „heavy FP user‟ and pursues a strategy mainly driven by content: ever since its foundation, the ZSI has been particularly interested in topics of European scope and relevance for which the FP is an essential source of funding.
Firms usually have a more monolithic strategy. Their researchers are tied to the corporate strategy. Corporate strategy can be quite simple: It may simply consist of participating in FP projects that, from a thematic point of view, fit into the firm‟s portfolio or research strategy, while at the same time only (or predominately) participating as partner. An SME told us that as a young spin-off it had no strategy, sometimes conducting FP projects for the sake of conducting them, to obtain references, to build up contacts and to be able to keep staff. In time, however, it has been able to position itself in a network of 30 to 40 firms, out of which consortia are formed when an appropriate call comes. Some also tell us that they only use FP projects to develop networks and know-how because they find them cumbersome.
58 This Act aims at positioning the Austrian Universities as strong, autonomous institutions and we will come back to this in our overall conclusions and recommendations.
59 However, we have seen above coordinators tend to experience higher impacts and the cost benefit ratio tends to be more positive for them than for non-coordinators.

102 Final Report
Indeed, we have encountered a number of firms whose strategy it is not to participate or to participate only very selectively in the FP. They do so for various reasons: They prefer to cooperate in smaller consortia on the basis of contract research; they shun IPR issues; or the timing/topics of the FP are not suitable. These firms are firms with high research capacity, and they know what they are doing. They do not need persuading to participate in the FP.
Box 4 VRVis - Centre for Virtual Reality and Visualisation Research GmbH
VRVis is one of some 30 young research institutions in Austria which have been established through the so-called Competence Centre funding programmes since 1998. Next to basic and industrial research, and consulting in visual computing, VRVis has explicitly included the provision of expertise on national and international research funding into its portfolio of activities.
VRVis was established in 2000 within the K-plus programme and was also selected for funding in the follow-up programme COMET in 2009. Like all Austrian competence centres funded through these programmes, VRVis links partners from science and industry in a jointly defined 7-year research programme. The groups of scientific partners and of company partners each hold 50% of the voting rights in the association owning VRVis.
VRVis focuses on visual computing, where it performs research on transforming data into meaningful visual images through novel software algorithms and on optimizing the interaction between software and hardware. VRVis structures its activities in four topical fields: (i) visualisation, (ii) rendering, (iii) computer vision, and (iv) visual analysis.
At present, VRVis employs approx. 56 people, 50 of them as researchers. This places VRVis together with the Institute for Computer Graphics at the Vienna University of Technology among the largest European research groups in computer graphics. Since its foundation in 2000, 1 habilitation, 15 PhD and over 60 master theses have been completed at VRVis and its researchers have published more than 300 publications in international journals. The turnover in 2009 was €3.3 million. VRVis financed mainly (approx. 95%) through co-operative research programmes, with COMET governing 2/3 of the budget. Approx. 5% of the budget income is from consulting.
VRVis is currently engaged in 5 FP collaborative research projects, mostly in the ICT programme. VRVis always participates as a partner and does not coordinate any FP projects because the costs would outweigh benefits for VRVis.
FP is by far the most important international programme for VRVis, others (e.g. Eureka, ERDF) have played a negligible role so far. National programmes are far more relevant for VRVis because most of its industrial partners are located in Austria, while its scientific network is international. VRVis employs an innovation manager who, at the strategic level, supports the management in making annual plans on the use of research funding programmes, and who supports the researchers in applying for funding in these programmes. VRVis also offers its funding expertise to its (industrial) partners and routinely handles the preparation and writing of proposals for joint projects to be submitted in competitive programmes.
VRVis has three main motives for participating in FP: VRVis wants to cooperate with international scientific partners and the European FP is by far the most attractive source of funding for such projects. Moreover, the centre gains reputation through participating in key projects. Finally, the Austrian national and provincial authorities that finance the COMET centres expect these centres to be visible also at an international level.
VRVis participates in „traditional‟ FP research projects only and it distinguishes two different project types: in content driven „cutting edge‟ projects a small consortium is working on highly demanding scientific-technical topics (typically funded under the „Future and Emerging Technologies (FET)‟ scheme), whereas in „networking‟ projects the focus is more on getting certain institutions together and on establishing partnerships as a basis for cooperation also beyond FP projects. The more „sensitive‟ the content of a project is in terms of intellectual property, the smaller the consortium is likely to be and the more appropriate VRVis considers national funding programmes compared to the FP.
According to VRVis its FP participation has had several effects: VRVis‟s international visibility and reputation have increased, it has expanded and consolidated its international partnerships, and it has increased know-how.

Final Report 103
Box 5 Zentrum für Soziale Innovation (ZSI) – A small big player in the FP
The „Centre for Social Innovation (ZSI)‟ is among the most active Austrian participants in the FPs: with a staff of more than 60 people it participates in more projects than many a university. Moreover, ZSI is the most successful FP participant among Austrian social sciences institutes.
ZSI is a private research institute in social sciences, founded in 1990, and organised as a private non-profit association. Its activities have always been internationally orientated and geared towards practical needs and application. ZSI works in three fields: (i) labour market and equal opportunities, (ii) research policy and (societal) development, (iii) technology and knowledge. Next to research, ZSI also engages in education and training, it offers consulting services for public authorities and it manages and coordinates networks. ZSI employed 63 people at the time of this study, which makes it one of the largest Austrian players in non-university social sciences research.
ZSI started participating in the FPs as early as 1991, in FP360, i.e. even before SSH became a thematic priority. So far ZSI has taken part in more than 70 FP projects. At the beginning of 2010, ZSI staff was involved in 23 FP7 projects in several thematic priorities: information and communication technologies (ICT), nanosciences, materials and production technologies (NMP), social sciences and humanities (SSH), research infrastructures and international cooperation. ZSI acts as a partner and also as a coordinator in about one quarter of its ongoing FP projects.
ZSI earns almost its entire budgets from competitive funding programmes; a small institutional subsidy from the Federal Ministry of Science and Research accounts for less than 2% of the annual budget. In terms of volume share, national programmes are less important for ZSI than international programmes. ZSI has been involved in numerous projects funded from international sources (e.g. Leonardo, Grundtvig, European Social Fund, National Authorities abroad etc.) but the FPs are clearly the most important programmes and actually of vital importance for ZSI: the ongoing 23 FP7 projects have a total funding volume of €4.5m for ZSI and approx. half the ZSI staff is involved in these projects to some extent.
ZSI‟s participation in the FP is mainly driven by the content and orientation of its work: ever since its foundation, ZSI staff has been particularly interested in topics of European scope and relevance and the FPs are one of the most relevant sources of funding for the kind of activities ZSI engages in. This is true especially for its research activities, as funding options for applied social sciences research in Austria are rare61.
ZSI typically takes part in two types of FP projects: about one third of its participations are in collaborative research projects and the others are mainly coordination and support actions (CSA). The latter are particularly attractive as 100% of project costs are funded62 while it is a permanent challenge for ZSI to raise the complementary funds for FP research projects which are funded up to 75%. ZSI has diversified its FP participation not only by project types but also by taking part in other thematic priorities than the dedicated SSH programme only, namely in ICT and NMP.
ZSI has participated in the FPs for nearly 20 years and in addition, FP projects account for a large share of its activities and funding. Hence ZSI in its entirety – its size, its thematic orientation, its competences and its international networks – has clearly been shaped by the FPs. It is fair to say that ZSI would not exist in its present form without its FP related activities. Moreover, impulses from this international work have inspired ZSI‟s projects with and for national clients.
60 Hochgerner, Josef, Positionierung der Sozialwissenschaften im Europäischen Forschungsraum: Internationale Kooperation und Konkurrenz unter neuen gesellschaftlichen Bedingungen in „Hinaus aus dem Schrebergarten. Die Europäisierung der österreichischen Forschung“, Sabine Herlitschka (Hg.), 2010.
61 See also the case study about social sciences in this report. 62 …albeit without fully covering actual overhead costs due to the 7% limit to the funding of overheads.

104 Final Report
Box 6 The University of Vienna‟s approach to ERC Grants
The University of Vienna ranks second in terms of successful FP7 proposals after the Technical University of Vienna.63 A significant part of the university‟s income comes from ERC Grants. Currently, the University of Vienna hosts eight ERC Grantees, of which five have an Advanced Grant and three a Starting Grant. Of these eight Grants, six are in the sciences and two in the SSH. The university is expecting three more Grants within the current ERC Call (2010).
The strategy the University of Vienna pursues with regard to ERC Grants has been developed in discussion between the Rector‟s Office and the Research Services (research management unit). It is not fully formalised in the sense that it is written down. This ensures flexibility.
The Rector‟s Office, together with the Research Services, selectively contacts professors who might qualify for an ERC Advanced Grant. The strategy is to have a few selected high-quality ERC applications rather than a mass of perhaps less qualified applications. This approach also ensures that the Research Services have enough capacity to professionally advise applicants if requested.
With regard to Starting Grants, three approaches have emerged. First, interested researchers contact the Research Services directly. As FWF Start Prize applicants are required also to submit an ERC Starting Grant application, this happens fairly frequently. The Research Services also get contacted directly by researchers abroad who would like to work at the University of Vienna. Second, some researchers are required to submit an ERC Starting Grant proposal. However, this is true only for the Max Perutz Laboratories (molecular biology). Third, the Research Services approach potential applicants – researchers who are at the University of Vienna or researcher who are on a Marie Curie Fellowship – directly. Or professors are asked whether they know someone who might want to come to the University of Vienna on a ERC Starting Grant (or a Marie Curie Fellowship). In other words, ERC Starting Grants (and Marie Curie Fellowships) are also used as a recruitment instrument.
ERC Grants are very attractive because of the high reputation they have, both for the Grantee and his or her host organisation. They are also lucrative, with the Grants paying 100% of project costs over five years plus 20% overhead. Last but not least, ERC Grants are thematically open. The bottom-up character of ERC Grants is not only attractive to researchers because it allows them to pursue their research interests. It is also important for „full‟ universities who host a number of disciplines that, for thematic reasons, have little chance of participating in the FP‟s regular collaborative research projects.
63 PROVISO report 11/2009.

Final Report 105
2.2.4 On impacts of European RTDI schemes at system and programming level in
Austria
In this chapter, we will outline general impacts of European RTDI initiatives64 at the systemic level, level of ministries and national funding agencies. We will also address the interplay between national programming and European RTDI measures, and tackle issues related to governance.
General impacts at systems level
Impacts of European RTDI programmes are visible already at a very general systemic level, without differentiating between different ministries or other actors of the system. From a historic point of view, it is especially Austria‟s EU accession that induced considerable change to Austrian science and technology policy. Three main
effects have been noted and are documented in literature:65
First, due to the newly available funding possibilities, the principles and structures of funding research have changed fundamentally. The agencies supporting basic and applied research at that time, FWF and FFF (now FFG General Programmes), lost one of their unique characteristics.
Secondly, many features of the European RTDI schemes have strongly shaped the design of technology policy and that of funding programmes. Cases in point are the structural and/or thematic specifications of the European schemes such as collaboration requirements or specifications in the area of research management. Thematically, Austrian policy alternated to an extent between a notion of „anything goes‟ to conscious picking of areas, where Austrian strengths were to be developed further with the help of European schemes.
Thirdly, EU policies, committees and discussions took “[...] the role of a fitness
centre for representatives of Austrian ministries.”66 The said EU forums provided arguments and self confidence for ministry representatives in negotiations with the funding agencies. They contributed to a shift of power between ministries and agencies, initially to the detriment of the latter, followed by a strong (ongoing) trend of „agencification‟.
As many interviewees underlined, the exchange with European partners frequently led also to the adoption of new concepts and ideas for designing and governing funding programmes. The current practice of evaluation for RTDI projects, programmes, institutions and policies is just one example.
The extent of influence of the European RTDI schemes – foremost the FP - is also reflected in a comparison of R&D budgets between the EU and the Member State level. The budget of FP7 of €50bn appears big at first sight, but pales against the share of the scheme against total funding of R&D in the EU. In fact, only 6% of public research expenditure can be attributed to the FP, 94% are borne by the Member States. But this is only one side of the story. If one were to look only at those expenditures which relate to project funding – funds which are usually paid out under competition - the FP would account for a substantial share of 20% to 30% of public R&D expenditure
depending on the Member State.67
64 This chapter does not discuss respective impacts of the ERDF. The ERDF is addressed in the next chapter 2.2.5.
65 Pichler, Rupert et al., Forschung, Geld und Politik – die staatliche Forschungsförderung in Österreich 1945-2005, 2007.
66 Pichler, Rupert et al., Forschung, Geld und Politik – die staatliche Forschungsförderung in Österreich 1945-2005, 2007.
67 Herlitschka, Sabine et al., Hinaus aus dem Schrebergarten – die Europäisierung der österreichischen Forschung, 2010.

106 Final Report
At the level of ministries, a governance system has established itself where certain ministries and within them departments or units govern each European scheme relevant for Austria. For some schemes there is „co-ownership‟ of several ministries, most notably for the FP which has five ministries governing the scheme, with different shares according to thematic foci (the ministries are identical to the ministerial contracting entities for this study). Others are the responsibility of only few or only one ministry: EUREKA has been governed both by BMVIT and BMWFJ. Collaboration agreements between these two ministries have led to a concentration of competences for EUREKA with BMWFJ. The CIP is the sole responsibility of BMWFJ, COST is governed by BMVIT, etc. While this set-up provides by and large well-defined correspondence between specific European RTDI schemes and specific ministries and ministerial departments, interviewees noted also an important drawback: The set-up incentivises ministries and ministry departments to appropriate „their‟ European programmes, to push for higher take-ups and to defend these programmes and related national measures against criticism even if – viewed at a systemic level – there would be good reason change priorities based on overall systemic/policy considerations.
One particular strong impact of the FP and EUREKA at systems level is the development of the respective Austrian support structure for these initiatives and the division of labour between the key actors in this structure: the programmes delegates at ministry level, the organisation hosting the NCPs, FFG-EIP, the Regional Contact Points in the provinces and the monitoring unit PROVISO as well as all related governance and dissemination activities. As the support structure is treated extensively in chapter 3, we will not discuss these structures further here.
Impacts at agency and (national) programming level
Austria‟s innovation system has undergone a process of „agencification‟ in the past decades. In this process, programme management for RTDI funding programmes and for related support services to applicants has been increasingly outsourced from ministries to agencies with the obligations being written down in commissioning contracts. European as well as national programmes have been subjected to this development. Furthermore, in this process several smaller agencies and service providers have been merged to form larger one-stop shops which are to benefit from synergies and economies of scale. Today, as preliminary culmination point, there are three agencies largely visible at national level: The Austrian Science Fund FWF for basic research, the Austrian Research Promotion Agency FFG for applied research and the funding bank Austria Wirtschafts Service GmbH (Austria business service) which is concerned with general purpose business support, including the topic of innovation.
The impacts of European RTDI initiatives on national programming become most visible when looking at the programme portfolios and their operation and governance within the three agencies. Hence, we will now discuss the exposure of the three agencies and funds to European RTDI schemes and the related impacts.
We start our analysis by looking at the Austrian Science Fund FWF. The exposure of the Austrian Science Fund to the Framework Programmes concerns primarily the IDEAS programme (i.e. the ERC) and to a lesser extent the programme PEOPLE. Furthermore, the FWF is also active in some of the ERA-Nets.
FWF has already been involved in transnational funding activities before FP7, e.g. in the European Science Foundation‟s EUROCORES, in the D-A-CH initiative with its partner research councils in Germany and Switzerland, and also in some ERA-Nets, through which “[...] the transnational aspects – mainly through the ERA-Nets – have increased.” (expert interview). FWF‟s exposure to the Framework Programme was limited because the FPs are traditionally geared more towards applied research and less towards basic research which is in turn FWF‟s responsibility. This has changed in FP7, when for the first time an FP has launched a specific programme for the support of „frontier research‟ at European level. With its bottom-up funding approach and its strong emphasis on scientific excellence, the ERC resembles the well-established (national) modes of competitive funding for investigator-driven basic research.

Final Report 107
The link between FWF and ERC is particularly close in one funding measure: the target group and the instrument employed for the ERC‟s Starting Independent Research Grants are very similar to the national „START‟ programme, a programme which the FWF has been operating since 1996. Despite the similarities, the FWF regards the START programmes and the ERC grant programmes as complementary offerings. The ERC is said to be a „significant enrichment‟ for the portfolio of programmes targeting basic research, and one of its main advantages is, according to the FWF, that it helps increase visibility of researchers and research institutions in Europe. The complementary approach is in practice realised through requiring applicants of the START programme to also apply for an ERC grant in a later ERC call (if the eligibility criteria are met, of course).
The similarities of the programmes make it possible that the proposal can be, with some modifications, used twice. This approach entails several advantages: First, reputation of the ERC programme is catered for and researchers are actively encouraged to apply for funds in the European programme. Secondly, researchers can hence not avoid the European programme for the reason of higher administrative burdens and for the fact that “[...] national funds are available anyway”. (expert interview). Thirdly, chances for success – in terms of getting either the START or the ERC grant – are maximised. There is no double funding: If the later ERC proposal is accepted and the respective grant is paid out, the prior START grant is discontinued. Questioned on whether the START grant could be perceived in this context as a „second best‟ type of grant if compared to the ERC yields a clear “no” by the FWF: High standards of review involving international panels are used in both grant schemes and acceptance rates are also quite similar.
With regard to PEOPLE (Marie Curie measures), FWF is also a user and participant of FP7. FWF successfully applied for funds in this scheme to co-fund its „Erwin Schrödinger‟ scholarship programme.
Eventually, FWF is also involved in around ten ERA-Nets, mostly as project participant. FWF states to get involved only in such ERA-Nets where there is a scientific community for which ERA-Net is of benefit, e.g. where the research groups have realistic and high chances of success (as, for example, in the humanities, see the related case study on SSH).
The exposure of the Austrian Research Promotion Agency FFG to European RTDI schemes and its programme portfolio is highest among the three agencies. On the one hand, this is, of course, due to the department European International Programmes (EIP) as the central national support structure for FP7 and EUREKA. On the other hand, several of the national programmes have links to and interplay with European schemes in their design and operation. The degree of alignment and interdependency varies greatly across the funding schemes. In the Thematic Programmes, we have seen thematic areas where there is strong alignment and interplay (especially in the ICT area, with the Thematic Programmes FIT-IT and BENEFIT at national level; another example is the national security programme KIRAS) but also themes with little alignment (e.g. in the life sciences). The General Programmes have links to Eurostars from the EUREKA programme and the proposal grants on offer for FP7 applicants. Equally, ERA-NETs and JTIs have led to inter-weaving of national and European offerings involving several FFG departments.
As various parts of this report analyse different aspects of the handling of European programmes and the way this affects national programmes in FFG, we will refrain from further scrutinising this topic (and FFG) at this point and refer readers to the respective chapters in this report: our science and technology field case studies (chapter 2.2.6 where we detail interdependencies and the interplay between the national and European levels for the automotive sector, ICT, the life sciences and the SSH), our chapter on the interaction within the Austrian Support Structures and with major policy stakeholders (chapter 3.1.2), the chapter on the role of FFG-EIP for new instruments and ERA initiatives (3.3.2.9), and the chapter on FFG-EIP as a learning organisation and part of FFG (3.3.2.10).

108 Final Report
As concerns the funding bank aws, interviewees told us that the exposure of this agency to European RTDI programmes is fairly limited. aws has a portfolio of technology and R&D-related programmes in the area of start-up funding and support as well as for networking, promoting and disseminating information on certain technology fields (particularly the life sciences sector). A dedicated department deals with IPR-related service offerings, e.g. advice on commercialisation and IP strategies both for firms and universities. This department is itself also active as research performing unit and has applied for FP7 and structural funds projects. There is some exchange of staff between FFG and aws, mostly in the form that speakers from one agency are invited to events of the other agency. aws also has a function as monitoring unit for the ERDF funds in Austria. Most notable, though, is that the design and operation of the technology and IPR programmes is hardly affected by or specifically aligned with European RTDI initiatives such as the FP.
2.2.5 On possible synergies between the ERDF, CIP and FP7 funding schemes
2.2.5.1 Overview
In the following, we will discuss possible synergies between the ERDF, the CIP and FP7. The rationale for looking especially at synergies is rooted in current discussions on how to more effectively combine the three funding schemes.
The BMWF has dealt with the issue of realising synergies also in the course of other recent assignments, accounting for different points of view. An earlier assignment
tendered out to ÖAR Regionalberatung68 examined the usage of ERDF, had interviews conducted with some 20 stakeholders in the provinces and a study visit performed with the BMWF in four Austrian provinces. A still on-going assignment carried out by FFG-EIP is to analyse decision patterns and available instruments that help users decide between funding programmes under different circumstances.
Against this backdrop, the purpose of this chapter is to provide complementary evidence to these other studies. In this sense our work is to achieve synergies, too. We will foremost try to answer the following five key questions:
1. What is considered as innovation and research in the provinces when drawing on ERDF funds, as opposed to FP7?
2. Following this, are there any complementarities and interfaces among the three programmes which would favour the realisation of synergies? Are there any examples of good practice to that end in Austria?
3. What type of actors plan, implement and apply ERDF funds and how is the governance among this cast of actors organised?
4. What types of impacts are visible and/or could be expected from using ERDF funds?
5. How do these impacts relate to the ones discussed for FP7?
The methodology for answering the five key questions were basically (i) an analysis of available literature, foremost international literature and the Weber & Scheer study, (ii) complementary interviews with 13 experts knowledgeable in the field of enquiry and (iii) one case study to showcase combined usage of the three funding schemes and the rationales for doing so from an end-user/institutional point of view.
68 Weber, Michael, Scheer, Günter, Bezüge zwischen EU-Strukturfonds /EFRE / RWB - Konvergenz und EU-Forschungsinitiativen / 7. RP in den österreichischen Bundesländern, 2010.

Final Report 109
2.2.5.2 Slide-in: The ERDF funds and RTDI in Austria
Actors and programming
There are three objectives of the ERDF programme in the programming period 2007-2013: (i) convergence (in the programming period 2000-2006 „objective 1‟), (ii) regional competitiveness and employment (formerly „objective 2‟ and „objective 3‟), and (iii) European territorial cooperation (formerly known as the INTERREG programme family).
In Austria, the province of Burgenland may draw on funds for the convergence objective. The other eight provinces are eligible for ERDF funds under the „regional competitiveness and employment‟ objective.
Implementation and programming is performed on several levels:
The strategic framework, i.e. the „National Strategic Reference Framework‟, for using ERDF funds in Austria is the „STRAT.AT‟ plan for 2007-2013. The strategic process accompanying the implementation of STRAT-AT is called „STRAT.ATplus‟. The Austrian Conference on Spatial Planning (Österreichische Raumordnungskonferenz, ÖROK) provides the platform for this process.
The STRAT.AT provides the basic strategic framework for nine so-called „operational programmes‟. It is important to understand that each of the nine provinces can define its own operational programme and elaborate on different focal fields of activities also in different ways. Besides these nine operational programmes for the said objectives, there are also other programmes for the two remaining objectives, creating a total of 21 such operational programmes.
Notwithstanding the fact that each province has a high degree of autonomy for defining its operational programmes, the European Union requires each operational programme to appoint (i) a managing authority („Verwaltungs-behörde‟ – a national, regional or local public authority managing the operational programme); (ii) a certification body (Bescheinigungsbehörde‟, to certify the statement of expenditure and the payment applications before their transmission to the Commission) and (iii) an auditing body. The operational programmes provide the framework for the actual projects funded. These projects are implemented by (iv) the „responsible funding organisations‟ such as regional (and also national) development agencies. For the type of projects to be funded in the area of RTDI, see below.
The fact that 23 different operational programmes are implemented for the whole of the ERDF system (including the Operational Programmes for European Territorial Cooperation) has led to a very heterogeneous system of institutions involved in the programming and implementation of ERDF funds. Figure 51 shows the respective structures for Austria, limited only to the nine ERDF programmes for convergence and regional competitiveness.
With regard to „responsible funding organisations‟, there are up to seven in each province, furthermore the provinces themselves as well as four federal organisations. There are nine management authorities (one for each province), one certification body (BKA, Federal Chancellery Austria) which has outsourced some of its tasks to the Federal funding bank aws), one monitoring unit and, not to forget, the Austrian Conference on Spatial Planning. The latter acts as coordination platform and at athe same time as common secretariat for the monitoring committees for the regional Programmes of the Objectives Convergence and Regional Competitiveness and Employment.
Taking all institutions with considerable ERDF involvement into account, there may be, according to interviewed experts, “[...] as many as 50 to 100 individual actors in the provinces and about a dozen at national level.” (expert interview). Another expert estimated the number of RTDI-relevant actors to be even in the range of 200 to 300 organisations.
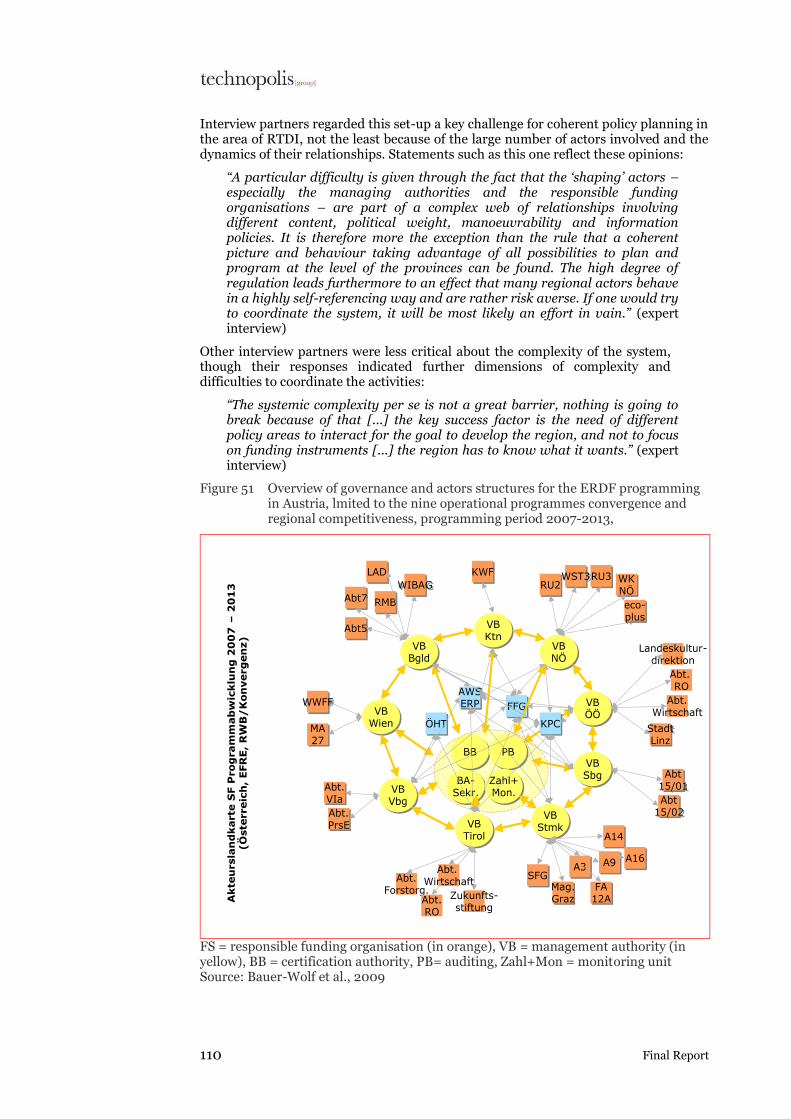
110 Final Report
Interview partners regarded this set-up a key challenge for coherent policy planning in the area of RTDI, not the least because of the large number of actors involved and the dynamics of their relationships. Statements such as this one reflect these opinions:
“A particular difficulty is given through the fact that the „shaping‟ actors – especially the managing authorities and the responsible funding organisations – are part of a complex web of relationships involving different content, political weight, manoeuvrability and information policies. It is therefore more the exception than the rule that a coherent picture and behaviour taking advantage of all possibilities to plan and program at the level of the provinces can be found. The high degree of regulation leads furthermore to an effect that many regional actors behave in a highly self-referencing way and are rather risk averse. If one would try to coordinate the system, it will be most likely an effort in vain.” (expert interview)
Other interview partners were less critical about the complexity of the system, though their responses indicated further dimensions of complexity and difficulties to coordinate the activities:
“The systemic complexity per se is not a great barrier, nothing is going to break because of that [...] the key success factor is the need of different policy areas to interact for the goal to develop the region, and not to focus on funding instruments [...] the region has to know what it wants.” (expert interview)
Figure 51 Overview of governance and actors structures for the ERDF programming in Austria, lmited to the nine operational programmes convergence and regional competitiveness, programming period 2007-2013,
BA-Sekr.
BA-Sekr.
VBWien
VBWien
VBBgld
VBBgld
VBKtn
VBKtn
VBNÖ
VBNÖ
VBÖÖ
VBÖÖ
VBSbg
VBSbg
VBStmk
VBStmkVB
Tirol
VBTirol
VBVbg
VBVbg
BBBB PBPB
Zahl+Mon.
Zahl+Mon.
RU2RU2RU3RU3WST3WST3 WK
NÖ
WKNÖ
AWSERP
AWSERP FFGFFG
eco-plus
eco-plus
KPCKPCÖHTÖHT
LADLAD
Abt7Abt7
Abt5Abt5
WIBAGWIBAG
RMBRMB
KWFKWF
Landeskultur-direktion
Abt.Wirtschaft
StadtLinz
StadtLinz
Abt. RO
Abt15/01
Abt15/01
Abt15/02
Abt15/02
SFGSFGA3A3
Mag.Graz
Mag.Graz
FA12A
FA12A
A9A9
A14A14
A16A16
Abt.Forstorg.
Abt. Wirtschaft
Abt.RO
Zukunfts-stiftung
Abt.VIa
Abt.VIa
Abt.PrsE
Abt.PrsE
MA27
MA27
WWFFWWFF
Akte
ursla
nd
karte
SF P
rog
ram
mab
wic
klu
ng
20
07
–2
01
3(Ö
ste
rreic
h,
EFR
E,
RW
B/
Kon
verg
en
z)
FS = responsible funding organisation (in orange), VB = management authority (in yellow), BB = certification authority, PB= auditing, Zahl+Mon = monitoring unit Source: Bauer-Wolf et al., 2009

Final Report 111
RTDI activities funded by ERDF in Austria
Especially in the programming period of 2007-2013 with its increased focus on innovation and R&D, the ERDF can be used to fund a variety of activities related to RTDI. The measures that are funded depend on the type objective for which the region qualifies:
Regions covered by the Convergence objective may draw on ERDF funds for „research and technological development‟ and „innovation and entrepreneurship‟. Other areas tackled by the convergence objective may also lead to „innovative‟ activities being funded (e.g. information society, environment, risk prevention).
Under the „regional competitiveness and employment objective‟, „innovation and knowledge-based economy‟ is one of three types of activities which are eligible for funding. Respective fundable actions could be “[...] in the areas of strengthening regional capacities for research and technological development, fostering innovation and entrepreneurship and strengthening financial engineering notably for companies involved in knowledge-based economy.” (DG REGIO Homepage, 2010)
For monitoring purposes, types of activities funded by the ERDF are classified through numeric codes. Figure 52 lists the respective codes denoting fields of intervention in the area of RTDI. One may distinguish between „core RTDI‟ activities and fields of intervention related to more general „business innovation‟. The working definition for RTDI developed by the Austrian Conference on Spatial Planning uses a classification which combines codes 1 through 7, code 9 and code 14. There are definitions slightly
different than the one displayed in Figure 52.69 Looking at the field of intervention, it becomes quite clear that the notion of innovation is considerably broader in the ERDF than in FP7 with its focus on R&D.
Figure 52 RTDI codes: fields of intervention in the ERDF in the programming period 2007-2013
Code Type of activity
Core RTDI
01 R&TD activities in research centres
02 R&TD infrastructure and centres of competence in a specific technology
03 Technology transfer and improvement of cooperation networks
04 Assistance to R&TD, particularly SMEs /including access to R&TD services in research centres)
14 Services and applications for SMEs (e-commerce, education and training, networking, etc.)
Business innovation
05 Advanced support services for firms and groups of firms
06 Assistance to SMEs for the promotion of environmentally-friendly products and production processes
07 Investment in firms directly linked to research and innovation
09 Other measures to stimulate research and innovation and entrepreneurships in SMEs
Source: Weber & Scheer 2010
Figure 53 shows the expenditure of ERDF funds on core RTDI and business innovation activities in Austria as programmed in the Austrian provinces. With a total of €193.6 million, the Austrian provinces spend around 29% of all ERDF funds available to them for the objective-2 programme in core RTDI projects for the period
69 See for example Rivera León, Lorena et al., Cohesion policy and regional research and innovation Potential An analysis of the effects of Structural Funds support for Research, Technological Development and Innovation 2000-2010, 2010.

112 Final Report
2007-201370; €217.2 million (around 33%) are earmarked for business innovation activities. Overall, slightly above 60% of ERDF funds are earmarked for RTDI.
Programming varies significantly between provinces: Styria and Upper Austria are, in absolute terms, the two provinces investing most in core RTDI (SUM I for codes 1,2,3,4, 14: €45.7 million and €42.6 million, respectively). While Upper Austria is the only province which invests heavily in research centres (around €27 million), Styria places its focus in core RTDI on codes 04 (assistance to R&TD, particularly SMEs, including access to R&TD services in research centres) and 03 (technology transfer and improvement of cooperation networks).
In relative terms Carinthia ranks first with 80% of ERDF funds available to the province used for RTDI. Styria and Upper Austria devote around 63% and 69% of their ERDF funds to RTDI. On the other end of the scale, relatively little funds are earmarked for core RTDI in Vienna (€3.2 million or 30% of the ERDF funds) or Tyrol (€9.3 million or approximately 46% of ERDF funds).
Figure 53 Programmed funds for different intervention codes, in € million, according to Austrian provinces, programming period 2007-2013
Code B C LA UA S St T V VIE AT
01 0.0 7.0 3.7 27.2 0.0 1.7 0.0 0.6 0.0 40.2
02 6.0 2.6 11.0 0.2 0.0 3.3 0.0 1.8 1.6 26.5
03 5.3 1.6 6.8 8.0 0.9 17.9 3.3 1.8 1.6 47.2
04 7.0 12.1 14.2 6.7 3.18 21.3 5.4 2.7 0.0 73.0
14 1.5 0.0 2.6 0.5 0.0 1.5 0.6 0.1 0.0 6.7
SUM I 19.8 23.3 38.3 42.6 4.08 45.7 9.3 7.0 3.2 193.6
5 6.5 1.8 17.6 1.3 0.69 8.7 1.8 0.2 3.6 42.2
6 3.7 0.7 8.2 5.6 0.68 10.3 1.2 0.6 1.0 32.0
7 23.3 20.0 27.6 12.0 1.47 30.6 3.6 2.7 0.0 121.1
9 7.5 6.7 0.0 4.0 0.25 2.7 0.0 0.7 0.0 21.9
SUM II 41.0 29.2 53.4 22.9 3.1 52.3 6.6 4.2 4.6 217.2
TOTAL 60.8 52.5 91.7 65.5 7.2 98.0 15.90 11.2 7.8 410.8
Source: Weber & Scheer 2010, based on the most current versions of the operational programmes
The ERDF is, after FP7, the second most important European source of funding for RTDI activities in Austria (see Figure 54) in monetary terms. According to a model calculation of Weber & Scheer (2010), and based on the assumption that Austria will get projects in FP7 funded with a total funding volume of €1,248 billion, ERDF funds will amount to about one third of the funding volume of FP7. However, it is imperative to underline that the RTDI definition employed in the ERDF is considerably broader than the notion of R&D used in FP7. The comparison depicted in Figure 54 has to be interpreted very carefully, taking due account of the different notions of innovation and the nature of the figures presented for the FP (estimations) and the ERDF (plan figures).
70 Weber, Michael, Scheer, Günter, Bezüge zwischen EU-Strukturfonds /EFRE / RWB - Konvergenz und EU-Forschungsinitiativen / 7. RP in den österreichischen Bundesländern, 2010.

Final Report 113
Figure 54 Comparison of estimated FP7 returns and planned ERDF funding for RTDI by Austrian provinces
ERDF FP7 Relation FP7 to ERDF RTDI funding
Province RTDI funding
[€ million] *)
Approved projects (till 11/09) [€ million]
Estimation for 2007-2013 **)
[€ million]
Share of FP7 to ERDF funds [%]
Burgenland 60.71 0.60 4.17 7%
Carinthia 52.64 11.30 35.83 68%
Vorarlberg 11.00 2.80 10.00 91%
Lower Austria 91.60 29.50 107.50 117%
Upper Austria 65.57 20.70 86.67 132%
Styria 97.90 79.20 278.75 285%
Salzburg 7.17 9.20 35.42 494%
Tyrol 16.01 30.20 106.67 666%
Vienna 7.82 158.70 583.33 7,460%
AUSTRIA TOTAL 410.42 342.80 1,248.33 304%
*) planned expenditures; ERDF funds without national co-funding **) The estimation model employed by Weber & Scheer for the whole of FP7 is based on the following assumptions: An overall budget of €50 billion for FP7; a return rate of 2,5%; up until 11/2009, approved projects were funded with around €13 billion with a share of Austrian participation of around €340 million. The attribution of returns to provinces corresponds to their current shares (up until 11/2009) of Austrian returns from FP7. Past performance of the provinces of FP6 was also considered. Note: Differences between this Figure and Figure 53 are due to rounding errors. Source: Weber & Scheer 2010
Some of the points of Weber & Scheer71 are particularly noteworthy and in line with our qualitative observations:
The provinces follow some basic considerations with regard to RTDI strategies in their regions. However, the elements of strategic approaches differ in terms of integration/relationship of RTDI to other areas of intervention, the approach taken (one leading strategy with RTDI embedded vs. several strategies followed in parallel), R&D/Innovation-orientation and the timeframe in which the strategies were conceived (older vs. new/current ones)
21 institutions receive more than €1 million of ERDF-based funding (ERDF funding and national co-funding) for the running time of 2007-2013 within the objective „regional competitiveness and employment‟. Four institutions receive more than €5 million. The list of all institutional beneficiaries with more than €1 million approved ERDF co-funding is given in Figure 55.
There are few (documented) strategic considerations with regard to realising
synergies between the ERDF funds and FP7. Respective recommendations72 have hardly entered discussions and considerations. However, experts interviewed also noted that the CREST document is not specific enough and “[...] has a certain tendency to re-iterate the problem and present it as solution (in the sense of “find the synergies yourself”)” (expert interview).
71 Weber, Michael, Scheer, Günter, Bezüge zwischen EU-Strukturfonds /EFRE / RWB - Konvergenz und EU-Forschungsinitiativen / 7. RP in den österreichischen Bundesländern, 2010.
72 CREST guidelines, Coordinating the research Framework Programme and the Structural Funds to support Research and Development, 2007.

114 Final Report
In terms of impacts, the evidence collected through literature analysis and expert interviews indicates that there are considerable variations in impacts across the Austrian provinces:
Some experts upheld as an impact that the provinces were forced, in many cases for the first time, to think about a strategic approach to RTDI.
Despite the enormous effort for monitoring the implementation of ERDF programmes there is very little evidence of impacts at the level of ERDF co-funded subsidies for single-firm projects.
The project approach of ERDF and the regional set-up were said to have contributed in itself to the described institutional complexity. This clearly limits the amount of likely positive impacts, as a too complex institional set-up is detrimental to achieving strong positive impacts.
The possibility to have higher funding levels for projects funded by the General Programmes of FFG is hardly drawn upon because the additional benefits often do not match the accruing administrative burdens. In addition, FFG has had to repay – in the programming period of 2000 to 2006 - some of the ERDF funds it paid out to firms after being audited. Since then, FFG seems to be, according to interviewed experts, reluctant to come forward with ERDF co-funding in the General Programmes. For these reasons, FFG is said to even advise explicitly against the usage of the ERDF co-funding possibility in some cases.
The under-usage of ERDF funds in the General Programmes has led to a re-allocation of some of the ERDF funds in some provinces. Compared to the original plans, around
€20 million have been re-allocated for non-RTDI initiatives.73 This corresponds to a 5% decrease of ERDF funds available for RTDI in Austria. Within RTDI activities, the re-allocation has seen a shift towards technology-transfer related activities. These changes are already reflected in Figure 53.
The administrative burdens for reporting in ERDF are heavily criticised by most of the experts interviewed and do not only concern FFG‟s General Programmes. It appears that the rules are so complex and the following audits and reviews in Austria so strict that the reporting requirements are actually a barrier to a higher usage of ERDF funds for RTDI activities. However, there is evidence that a considerable share of the
experienced complexity is essentially self-imposed.74
73 Weber, Michael, Scheer, Günter, Bezüge zwischen EU-Strukturfonds /EFRE / RWB - Konvergenz und EU-Forschungsinitiativen / 7. RP in den österreichischen Bundesländern, 2010.
74 Bauer-Wolf, Stefan et al., ÖROK-Projekt „Governance Check“, 2009.

Final Report 115
Figure 55 Ranking of Austrian beneficiaries of ERDF funding with more than €1m public funding (approved ERDF and national co-funding) under the objective „regional competitiveness and employment‟, 2007-2013, as of Jan 2010 *)
Nr. Province Funded institution ERDF + national
co-funding [€]
1 Upper Austria Profactor 12,000,000
2 Lower Austria TFZ Technologie- und Forschungszentrum Wr. Neustadt
8,000,000
3 Carinthia Lakeside Labs 7,288,882
4 Upper Austria Upper Austrian Research 5,924,811
5 Upper Austria Transfercenter für Kunststofftechnik 3,803,226
6 Upper Austria RECENDT 3,765,872
7 Lower Austria TZT Technologiezentrum Tulln 3,748,545
8 Upper Austria Software Competence Centre Hagenberg 3,005,752
9 Lower Austria AIT Austrian Institute of Technology 2,827,528
10 Upper Austria LKR Leichtmetallkompetenzzentrum Ranshofen 2,788,500
11 Upper Austria Asamer Basaltic Fibers 2,572,000
12 Upper Austria Kompetenzzentrum Holz 2,503,791
13 Upper Austria FH OÖ Forschungs & Entwicklungsgesellschaft 2,420,000
14 Lower Austria TZT Technologiezentrum Tulln 2,398,545
15 Lower Austria TZ Technologiezentrum Wieselburg-Land 2,300,000
16 Upper Austria LCM Linz Center of Mechatronics 2,284,527
17 Lower Austria BTZ Biotechnologiezentrum Krems 1,750,000
18 Lower Austria Austrian Academy of Sciences, Forschungsstelle für integrierte Sensorsysteme, Wr. Neustadt
1,500,000
19 Lower Austria Donau Universität Krems 1,386,433
20 Lower Austria Österreichisches Forschungsinstitut für Chemie und Technik (ofi)
1,220,719
21 Lower Austria Universität für Bodenkultur 1,045,638
TOTAL (projects with more than €1 million public funding (ERDF + national)
74,534,769
*) For some beneficiaries, the figure presented is the sum of several ERDF projects undertaken by and approved for the beneficiaries. Source: Weber & Scheer 2010
2.2.5.3 ERDF, FP and CIP – a modular system for funding and supporting RTDI?
Theoretical considerations
To answer the question to what extent „synergies‟ between the ERDF, FP7 and CIP are possible, different levels of planning and implementation have to be considered.

116 Final Report
At the top planning level, it is the legislative framework behind the three funding
schemes that provide a theoretical framework for possible synergies. Reid et al.75 examined the legislative situation in this context and reached the following conclusions on what type of synergies would be in principle possible:
“The three programmes share the broad Lisbon and Gothenburg objectives but primary focus on different actors and different phases of the innovation process;
Structural Funds should ideally be used by regions to build up research and innovation capacity, enabling them to take part in European consortium and networks in these field;
The CIP should focus on the commercialisation phase of innovation projects, whereas the FP7 focuses on encouraging R&D activities. This should help to avoid financing gaps between research, development and application of results;
Regions eligible under the Structural Funds should take part in the networking activities and exchange of good practices promoted by the CIP, so that their specific situations are taken into account in the identification of good practices adapted to their needs;
The CIP should provide support to networks of intermediaries and national schemes for actions to encourage and notably facilitate the participation of SMEs in the FP7;
Close co-operation between the European Commission and the European Investment Bank (EIB) and the European Investment Fund (EIF) should ensure an enhanced support for start-ups and micro-enterprises, through technical assistance, grants, loans, equity, venture capital and guarantees.”
While Reid et al. describe the factual space for possible synergies, the CREST paper from 2007 calls for the exploitation of synergies and identifies an even larger number
of opportunities to combine ERDF and FP7 funds for RTDI.76
In the current discussion on synergies, it is the „enabling‟ function of the ERDF that is considered the most promising interface for synergies between the two schemes.
As a conclusion, one may say that at a legislative level the proposed model for creating „synergies‟ is the well coordinated usage of the respective funding channels. However, the relative contributions of the three funding schemes differ: synergies between FP7 and the ERDF are much more in the spotlight of the discussion than synergies of either two with the CIP. This is likely due to the budgets involved.
Practical considerations
In „theory‟, the creation of synergies is thus a matter of well-conducted coordination. But what does it mean in practice? A respective analysis needs to take an institutional perspective into account. It is the organisation, which acts, which collaborates with other organisations, which makes decisions, which disposes on budgets etc. Given the multitude of set-ups (framework conditions, types of organisations, organisational structures), the answer to this question is far from straight-forward.
A preferred approach to explore answers to the question of combined use and co-ordination is to create and analyse different scenarios for different types of R&D performing and using organisations and examine under what circumstances and for what tasks ERDF, CIP, and FP7 funds can be used.
75 Reid, Alasdair et al., Synergies between the EU 7th Research Framework Programme, the Competitiveness and Innovation Framework Programme and the Structural Funds, 2007.
76 CREST guidelines, Coordinating the research Framework Programme and the Structural Funds to support Research and Development, 2007.

Final Report 117
For this purpose, Reid et al. have examined three scenarios: One for a newly established ICT research centre, one for a biomedical research-intensive spin-off company, and one for a regional cluster in renewable energies. To illustrate the approach, we take the example of the ICT research centre. A series of assumptions were first made: (i) The centre is located in a region which is eligible for ERDF funding; (ii) there is an operational programme for the region in place which aims at strengthening R&D infrastructures; (iv) the centre is new and small; and, finallyy, (v) the centre is pursuing a specific research goal (in this model, development of a new internet protocol).
Following these assumptions, Reid et al. analysed if and how ERDF, CIP and ERDF funds can be used to contribute through funding to different development stages of the centre. The development stages defined in this model were (i) (first-time) information with respect to funding opportunities, (ii) capacity building, (iii) research, (iv) results
dissemination and commercialisation and internationalisation.77 Against this backdrop, Reid et al. then mapped principle funding opportunities in all three schemes for each of the four development phases. These are the major observations:
The resulting table for the ICT centre is provided in Figure 56. The Figure implies that combining the different schemes is a rather complicated matter and necessitates good knowledge of the particular schemes.
Two reasons stand out: EU legislation, which does not allow the same type of activity to be funded twice; and the complexity created. Furthermore, selecting the right funding mechanism for different types of activities also requires the ICT research centre to have also a good idea of what it is trying to achieve. Strategies and goals of the centre are hence a key factor for the successful combination of funding schemes.
The regional context, structure and content of the operational programme play an important role. Changing the regional context and the foci of the operational programme affect the possible choices for the centre greatly, and hence also the possibility to realise „synergies‟.
A principle conclusion – which is fully supported by our expert interviews – is that it is the region, and within the region the research performing organisation that should have control and decision power over the selection of funding mechanisms. Carefully aligning operational programmes with the strategies and goals of the mainly affected research performing organisation(s) can be in this context considered a main requirement for successfully realising synergies.
77 The described scenario is a particular model selected for the purpose of analysis. By no means do we advocate this scenario as a role model for developing a specific type of R&D organisation, namely to build the establishment and operation mainly on availability of European funds as this will likely lead to „funding artefacts‟.

118 Final Report
Figure 56 Case scenario - using FP7, CIP and SF for developing a ICT research centre – model approach
Source: Reid et al., 2007
Our case study findings on real-life examples corroborate the model results of Reid et al. and add some subtle additional insight. In the following, we present a case study for the region of Güssing and its European Centre for Renewable Energy EEE.
The case study shows that decisions to realise synergies are taken primarily at the level of the principal acting research performing organisation. Against this backdrop, it helps that this actor has to a large extent autonomy and decision-making ability for selecting among the various funding opportunities. Furthermore, the case study also shows that embedding a research strategy into a regional development strategy is a decisive success factor. In Güssing, putting R&D at the service of broader regional development goals ensures support from the regional population and creates – in conjunction with other regional activities taken – added value. The necessity to have clear goals and strategies in place is underlined. Eventually, the case study also shows

Final Report 119
a development path, i.e. how purely regional goals, unrelated to R&D, develop further until they also capture RTDI activities.
Box 7 Case study: The European Centre for Renewable Energy EEE in Güssing as an example of how synergies between ERDF, FP7, CIP (and other initiatives) can be realised from a regional perspective
The European Centre for Renewable Energy (German abbreviation EEE) is located in Güssing, a small town with around 3,700 inhabitants in the province of Burgenland. Burgenland is the most eastern of the Austrian provinces and is still – despite catching up – the province which is economically least developed. Against this backdrop, Burgenland was defined as an objective-1 region in the mid 1990s,
Güssing was at that time facing rather grim economic prospects. Located in Southern Burgenland and close to the Hungarian border, it was “…one of the last corners in Europe” (expert interview), a result of the cold war. Employment opportunities in the region were scarce, and the economic situation of the farmers and agricultural firms dominating the local economy was deteriorating. A large part of the population had to commute to work to other areas, such as Vienna. Güssing was also disadvantaged because of the lack of transportation infrastructure. To date, the town has no railway station and the ability to reach thereby car was and is difficult. Outward-migration was a logical consequence, and with it there was a decline in local tax income for the town.
Against this backdrop, the town authorities had to develop a strategy for making Güssing more attractive. As part of the first stock taking exercise, a SWOT analysis for living and working in Güssing was performed. It found that the inhabitants of Güssing had to pay considerable amounts of money for heating, as most of the households used oil-fired systems. At the same time, one of the strengths identified was a large availability of biomass in the region. The idea was hence to develop a local system for the production of district heating (in German “Fernwärme”). Using national funds (communal loans) and ERDF funds, the first prototype and demonstration facilities were established in 1996 in order to convince the population to take part in the initiative. In parallel, the EEE was established. The response from the population was excellent, and in the course of seven stages of expansion (the last in 2006), not only the production facilities were enlarged but also an extensive network of pipes for district heating was set up. An intended and positive outcome was also that local agriculture and forestry firms found new (local) demand for their products.
Encouraged by the success of the approach taken (i.e. developing demonstration/prototype facilities for renewable energy production with subsequent take-up through local households, which then pushes demand for local biomass products and services), Güssing wanted to repeat this success in other areas of renewable energy production. A whole series of demonstration and prototype facilities were established for further study, including a power station utilising biomass as a source of energy. The novel process employed is based on the gasification of biomass and allows all waste material to be recycled. Other demonstration facilities concerned biodiesel fuels or biogas. While not all of the facilities were commercially successful, some were. One impact visible was that results from demonstration runs in Güssing were also used for similar facilities operating in neighbouring regions in Burgenland. The co-funding through ERDF funds was and is considered essential for closing funding gaps with respect to development of the prototype and demonstration facility and for initiating further investment.
The investment, and in particular the biomass electric plant, attracted demand for R&D. Researchers from various organisations asked the town and the EEE about possibilities to use the renewable energy facilities for their projects, Güssing recognised that R&D could not only help the town solve particular technological problems, but also maintain the lead as innovator among regions in using and exploring the possibilities of renewable energy sources. This has helped the settlement of production facilities of foreign firms active in the renewable energy sector, sparked the development of eco-tourism and the demand from other regions for know-how from Güssing. Güssing now cultivates this „habitat‟ for renewable energy activities, is actively collaborating with many national and international R&D organisations, and is also developing and offering training and education in the renewable energy sector. A case in point is training on the new profession of „Solarteur‟ in the solar (photovoltaic) field, a technology field now also tackled by Güssing,
The EEE with its currently 14 employees is instrumental for Güssing‟s strategy. The centre is organized as an association and has around 60 members, such as local firms, private persons but also the province of Burgenland. The centre's main aim is to contribute to regional development by developing “[…] lasting regional and community-based concepts for energy conservation and for the generation and use of renewable energy” (EEE Homepage, English section, as of Oct 22 2010). Against this backdrop, EEE manages the demonstration facilities

120 Final Report
(administration, access control, and accounting) as a service to its users. It is also involved to a small extent in R&D projects. The participation in R&D projects is, however, for the most part limited to a management function. Actual research is carried out by dedicated research partners such as the University of Technology Vienna or the University of Technology Graz. Respective labs and offices have been established at the biomass plant and in newly established office buildings. It is also noteworthy that Güssing hosts a branch of the research centre „BioEnergy 2020+‟, a centre funded by the national COMET programme and headquartered in Graz.
The EEE does not have any institutional funding. It attempts to finance 30% to 40% of its financing needs by drawing on several funding channels. These include at the national level FFG‟s Structural Programmes (COMET – Energy 2020+ as stated before, protecnet, COIN) and FFG‟s General Programmes. At international level, Structural Funds are particularly drawn upon (LEADER and LEADER+). Programmes used comprise former INTERREG, the Central Europe programme, and the South Eastern Europe (SEE) programme. EEE has also been involved in the Framework Programmes, namely in „traditional‟ cooperation projects, and in the EU‟s Lifelong Learning programme.
Questioned on how the EEE selects among the various schemes, EEE officials answered that the main selection criterion was “[…] that drawing on a particular programme should make sense from our strategic point of view”. Against this backdrop, the concept of „synergies‟ between different funding programmes – in particular between FP7 and ERDF funds – would be hard to define because, eventually, “[…] all that is possible and feasible in terms of combining funding schemes is being pursued by us in practice”. The impacts of using the various R&D, and especially the EU funds are hard to quantify and to assign to particular projects, However, Güssing officials feel that, without the European programmes, “[…] a large part of what Güssing constitutes today would not exist”. In particular, Güssing is rather sceptical whether without European programmes it would have been possible to engage in transnational collaboration, to learn and get to know distinctive partners or to obtain access and learn about certain technologies to the realised extent. These aspects can be hence considered to be the main areas of impact of European RTDI programmes (with the said role of the ERDF in particular being important for setting up prototype and demonstration facilities). The interviewed experts also underlined that Güssing‟s development is only in parts due to Güssing being located in a former objective-1 region: “There are plenty of funding opportunities out there, and it is because people do not know about them – and do not attempt to take the administrative hurdles if they happen to be aware of opportunities – that many possibilities are foregone”.
A dedicated success factor for R&D funding schemes identified is the possibility to have the EEE (or better: the region) define many of the activities bottom-up and have as much decision power in the region to pursue its strategy accordingly. A constant barrier are differing rules for similar activities in different programmes, such as the de-facto requirement for each project in certain programmes to install project-specific web pages (which few persons read and which go offline after the running time of the project) or the setting-up of networks (which may already exist). Similarly, different requirements for calculating and reporting costs (e.g. travel expenses, overheads) are also not facilitating take-up of the respective funding schemes.
The expert interviews underlined some specific strengths of the ERDF:
Most often, the significance and advantages of the bottom-up approach were highlighted. The relative freedom, especially in the former objective-2 programme, to be able to define activities in line with one's own goals, is said to lead to simpler planning, less uncertainty about future developments (independence of thematic policy fads) and less needs to artificially combine other funding schemes for the
same purpose.78
As in the Güssing case study, many experts asserts that depending on the operational programmes and a sound goal system in place, R&D performing organisations would be able to achieve most of the possible synergies by themselves. They would achieve that by drawing on the „menu‟ of support and funding channels selectively and according to the needs arising.
78 To give another example, if the network would wish to run a collaborative project with the neighbouring regions in the Czech Republic, Hungary and Slovakia, and there would be at that particular time only calls open for bilateral collaboration, an applicant for such schemes would need to apply for three different projects, would have three times the amount of administrative burdens and still would run the risk that not all three projects would be approved.

Final Report 121
In our interviews we were confronted also with some suggestions for improvements which we strongly oppose. Ideas such as having an ERDF bonus for winning FP7 projects, or the abolishment of the prohibition of double funding of the same project activity would inevitably be detrimental. Research organisations in the applied field would have an incentive to depend almost entirely on a permanent supply of public money. However, such research performing organisations use the funds for their intended purpose: as an aid to becoming successful on the private market. Thus the spending of public money has to be linked to performance in the private sector / contract research market.
Synergies through coordinated and joint planning and strategy development between FP-activities and structural funds
While the preceding examples and analyses have shown the importance of having decision autonomy at regional and organisational level, we now turn our attention to the question to what extent coordinated planning and programming between FP and the regional level (ERDF) can help improve the realisation of synergies. We focus the respective considerations on the situation in Austria, and here especially on the question on opportunities of combining FP-related activities at national level with ERDF programming at regional level.
While the analysis of the legislative structure79 has shown that synergies between ERDF and FP should be possible, all experts interviewed pointed to a series of difficulties in practice. These challenges are due, on the one hand, to subtle differences in the characteristics and the operation of the FP and ERDF programmes. On the other hand, the specific Austrian situation amplifies in many ways barriers to the possible forms of coordinated/aligned planning.
Figure 57 shows the main differences between the FP and ERDF. One of the most striking differences is the overall goal of the programmes:
Whereas FP is focused on fostering excellence in research, ERDF is to support regional development. Research excellence and regional development goals can be clearly in conflict with each other – what may be sensible for developing a certain region may have nothing or little to do with research excellence. The case of Güssing has shown that R&D and FP7 became a viable field of activity (i) only after the region reached a certain development stage and (ii) because the theme chosen by Güssing (renewable energy) had a certain intrinsic R&D component.
Against this backdrop, the second distinction between FP7 and ERDF is also notable: FP7 focuses almost entirely on R&D, while the definition of innovation within the ERDF is considerably broader. Due to the different goals of the programmes, it also makes sense to have two notions of innovation. For a region, it might be for example particularly useful to offer „new advanced services‟ to firms without actually engaging in R&D. As one expert put it “… the discussion on synergies between ERDF and FP leads to a situation where FP7 may be a viable option for only a small share of ERDF funded activities within a region […] to the point where FP7 is irrelevant.” (expert interview),
Another important difference to consider is the level at which the funds are programmed. The fact that FP is centrally programmed at EU level – of course, Member States have to agree –, while ERDF programming is ultimately in the hands of the regional level, leads to the question whether the national level has adequate possibilities to involve itself in combined regional/FP7 programming. While it is true that the national level is pegged into the programming process,
79 Reid, Alasdair et al., Synergies between the EU 7th Research Framework Programme, the Competitiveness and Innovation Framework Programme and the Structural Funds, 2007.

122 Final Report
issues are present with respect to decision-making power of the actors at federal level.
Furthermore, for synergies in the specification processes of both programmes, the windows of opportunity must be open at the same time. So even if both actors at national and regional level are willing to cooperate on specifying FP and ERDF activities, it stands to judgment whether an alignment and coordination is possible and sensible.
Figure 57 Comparison of important differences between programme logics of FP7 and the ERDF
Features compared FP7 ERDF
Overall goal Excellence in research Regional development
Definition of innovation employed
Narrow (R&D) Broad
Programming Centrally at EU level Regionally (in Austria, at level of provinces)
Thematic approach Predominantly top-down Predominantly bottom-up
International aspects and collaboration
International collaboration predominantly required
Predominantly regional projects, elements of internationalisation especially within certain defined cross-border regions in European Territorial Cooperation
Funding decisions Taken at EU level, based on jury assessment
Taken at regional level; different approaches for different measures
Competitive character Strong (main principle, implemented through Call system)
Existing, but more limited if compared to FP7
Activities eligible for funding
Narrowly defined (R&D projects)
Wide range of activities eligible for funding
Visibility of programme with end-users (i.e. researchers)
Very high Limited; difficulty to tell regional and ERDF (co-funded) measures apart
Administrative burdens for reporting
High High and even higher than in FP7
Source: Technopolis
The specific system in Austria with its complex set-up of actors involving nine different provinces, about a dozen actors at the national level at least a higher two-digit number of actors at the regional level aggravates the situation further. In such a set-up, there are clear limits to national coordination. Accordingly, joint national/regional planning and coordination of FP and ERDF activities will be the exception rather than the rule.
Synergies through better coordinated usage of available structural and research funds by its end-users (R&D performing organisations) without involvement of intermediaries
Against the backdrop of the limits of national and regional coordination, and after presenting the theoretical model considerations and the case studies, one may be inclined to leave the realisation of synergies to (regional) users of the programmes, the R&D performing organisations. However, certain requirements have to be met in order to consider this approach the best one.
Foremost, the R&D performing organisations have to have a convincing strategy for utilising the funds, aligned with goals of the regional operational programmes. This has been also shown in the case study on Güssing. In such instances, all available incentives work as they should and no intermediaries are necessary. Universities and R&D organisations with a functioning goal and incentive system fall into this category, as do also larger firms with differentiated RTDI structures.

Final Report 123
Synergies through better coordinated usage of available structural and research funds by its end-users (R&D performing organisations) with involvement of intermediaries
However, it is frequently not possible to have this kind of coherent strategy developed and/or implemented by the R&D performing organisations. This is where the different support and development agencies come into play. At the level of provinces there are more than 100 such intermediaries. Lower Austria, Upper Austria and Styria have over 30 such intermediaries, respectively. If one considers other types of organisations (for example technology centres or private firms acting on behalf of public authorities), the number of such intermediaries may increase, according to interviewed experts, “Without doubt to 200, perhaps even 300 which follow a broad notion of innovation, and where hence innovation is supported at different levels and with different exposure to R&D.”
The question now becomes whether these intermediaries can be used and involved in coordinated planning of FP and ERDF funds. The decisive factor is whether these intermediaries are able to act according to demand, or whether they are supply-driven, i.e.”[...] try to sell their – often small – portfolio of own services to R&D performing organisations”. It is especially those intermediaries which act according to demand, which try to find the best „mix‟ of support available for their customers which are then the most promising partners for joint planning and coordination of FP, ERDF and CIP actions. These organisations can facilitate access of R&D performing organisations to FP, CIP or ERDF actions, if any of these schemes turn out to be useful in the context of the supported organisation.
A case in point is, for example, regional clusters. Austria can be considered a leading nation in Europe in the context of cluster-oriented regional policy. In fact, clusters hold much potential that can be rather easily mobilised, particularly to cover the pre- and post-project activities, thus finding the right partners for the right project and
ensuring a proper dissemination of results with respect to context and timing.80 If the national level establishes good and systematic relationships with, say, two dozen confident clusters who have strong implementation capacities – 20 out of 60 clusters in Austria are of this type – a large chunk of possible synergy work for ERDF, FP7 and
the CIP may have been already achieved.81 A participant in a focus group has put it more radically:
“To date, all SMEs that I have advised and who were in a situation to take part in FP7 – and I mean all – have been member of a cluster of some kind.”
We generalise these remarks on the role of clusters to other types of intermediaries, whereby the generalisation also implies opportunity-seeking behaviour: On the one hand, collaboration with those intermediaries and authorities who are willing to cooperate, and on the other hand collaboration in activity fields where collaboration is possible and realistic. This means, after all, that it is highly unlikely that all provinces, all agencies or all themes can be treated the same, and that coordinated planning and collaboration needs likely to focus on specific issues, themes and actors.
2.2.5.4 Conclusions
Our analysis has shown that while synergies between the ERDF, the CIP and FP7 may be theoretically possible, the difficulties involved in trying to coordinate (national) FP and CIP planning with (regional) ERDF programming are considerable. We believe that expectations regarding the possibilities of coordination are too high. Steering and coordination possibilities by the national level are in practice limited to the complexity of the institutional set-up in Austria.
80 Ohler, Fritz, Geyer, Anton, KMU-Verbände organisieren Forschungsleistung, 2009. 81 Ohler, Fritz, Geyer, Anton, KMU-Verbände organisieren Forschungsleistung, 2009.

124 Final Report
Having said that, the following key points emerge:
Region as decision-making nexus: The nexus for decision making is the region and, within the region, the R&D performing institutions involved. The evidence collected shows that this is a prime success factor. Decision making at the regional level can assure that the choice of the right mix of support and funding programmes is in line with (i)regional development requirements (where R&D is likely to be just one component of a broader set of topics addressed) and (ii) with
the strategy of the R&D-performing organisation.82
Sound strategies: However, the requirement is also that such sound strategies exist, and that they are followed accordingly. If these requirements are met, the maximum extent of synergies possible may be achieved in a given field by the relevant R&D performing organisations who select among the „menu‟ of support programmes according to their needs.
Intermediaries and the special role of clusters: As R&D performing institutions may for various reasons not have such strategies in place, intermediaries and agencies of all types involved in innovation activities may take a facilitating role for realising synergies. A particularly promising type of actor is regional clusters. However, there are also considerations with respect to such intermediaries.
Demand instead of supply-driven modes of offering services and support: The main problem in the context of intermediary involvement is the distinction between supply and demand-driven support. We believe that only the latter is a likely candidate for coordinated planned activities for the realisation of synergies between the ERDF, CIP and FP7.
Opportunity-seeking role of the national level and all other actors involved: The national level can play a definitive but moderate role in facilitating the realisation of synergies. It can assist in the definition of regional goals and target figure corridors which are in line with nationally pursued objectives. The key approach is opportunity-seeking in nature: The national level should seek collaboration with those actors at a regional level which could help implement the national RTDI priorities best through drawing on ERDF funds. At the same time, regional policy making actors are well advised to exert the same opportunity-seeking approach for their goals and strategies. Like R&D performing organisations, actors at the policy level should also perceive the European RTDI programmes as a „menu‟ to select from, for achieving their own strategies and goals.
Explore opportunities to reduce administrative burdens of reporting in ERDF: We recommend exploration of possibilities to lower the administrative burdens for reporting in the ERDF and find working solutions in Austria. The respective burdens identified seem to be much higher than in FP7, which is also notorious for its issues with project administration. However, it might be wise to mind the self-made burdens first.
No fear of repayment obligations: Notwithstanding this call for simplification in the ERDF, we nonetheless argue that agencies should not be afraid of eventual repayment obligations. The benefits of being able to draw on funds for numerous projects are worth the costs of a small number of projects with repayments.
82 However: What is left out from the discussion here is the notorious question of whether a given regional layout is a priori a good one. Cf. the periodical debate about the legal status and autonomy of the Austrian provinces or the one-to-one definition of regions as political-administrative entities rather than as entities better described in spatial or economic terms. A good explication here is the the question, whether East Tyrol should be better linked with Carinthia or with some sort of an Alps-Adreatic Area.

Final Report 125
2.2.6 Impacts on selected science & technology fields and industries
2.2.6.1 Automotive
Economic significance of the automotive sector in Austria
Although no car manufacturer is explicitly associated with Austria, the automotive industry is an important industrial sector. There is a strong automotive supply industry, as well as leading automotive research institutes and engineering companies. Automotive manufacturers and components suppliers that are active worldwide, such as BMW, Opel, Saab, Magna and MAN, have plants in Austria. In addition, there are several hundred, mostly medium-sized and mostly export orientated suppliers. Technological highlights of the automotive industry in Austria include diesel engine design, design of all-wheel powertrain systems and the development of special-purpose vehicles. Moreover, a number of ICT firms have a focus in Intelligent
Transport Systems.83
In 2007, the automotive industry‟s turnover was €15.3 billion (5.6% of GDP), it
employed 33,850 people84 and produced 228,066 commercial vehicles85. This places Austria below the EU average in terms of turnover as percentage of GDP and below such car-producing countries as Italy and the UK (see Figure 58).
Like in many other countries, the Austrian automotive sector has been hit hard by the economic crisis. In 2008, employment dropped to 30,896, and in 2009 to 28,338.
Similarly, car production dropped to 151,277 in 2008 and 72,334 in 200986.
Having said this, the sector is highly competitive, as testified by its export ratio of 83%
(2008)87. It represents approximately 6% of Austrian employment and almost 15% of Austrian exports in manufacturing. With regard to total shares, the sector represents almost 2% of total Austrian value added, approximately 1% of total employment in
Austria and close to 10% of total exports (2007 or latest figures).88
R&D in the Austrian automotive sector
In 2007, the automotive sector employed 2,819.3 research staff (FTEs), of which 1,234.3 scientists and engineers (44%). This figure represents 8% of total researchers in industry. The sector spent €401m on R&D, again representing 8% of total R&D expenditure by industry. About 75% of R&D is financed by the private sector, 15.5% by
foreign sources, and 9.5% by the public sector (including EU financing).89
The automotive sector is characterised by a high degree of international division of labour in a complex value chain involving numerous suppliers and (relatively few) car manufacturers, none of which are based in Austria. For suppliers it is vital to be part of international value chains. R&D is to a large degree integrated in the supply chains, i.e. suppliers often do their own R&D while requirements typically come top-down from the automotive manufacturer. As a consequence, one of the main drivers for cross-
83 Holleis, Alexander et al., Publicly funded automotive research in Austria, country report written in the framework of the European Assessment of Global Publicly Funded Automotive Research EAGAR, Graz/Delft, 2010.
84 Statistik Austria, figures refer to organisations listed in NACE Ref 2 code C29 (motor vehicles and motor vehicle parts).
85 International Organization of Motor Vehicle Manufacturers 86 International Organization of Motor Vehicle Manufacturers 87 Statistik Austria 88 Haugh, David et al., The Automobile Industry in and beyond the Crisis, OECD Economics Department
Working Papers No. 745, 2010. 89 Statistik Austria

126 Final Report
border co-operation is the simple fact that sometimes no partner with a certain
specific qualification exists in Austria, especially for multi-firm projects.90
The automotive sector considers the FP a very appropriate instrument to position oneself in a value chain. Nowadays it is no longer possible for a single firm to bring a product to the market. Several partners are needed to tackle a topic in an effective manner. From this point of view, the FP is actually more important to small countries than to large ones.
Figure 58 Automotive sector turnover, as % of GDP (2007)
Source: EAGAR (European Assessment of Global Publicly Funded Automotive Research), Benchmarking Analysis Report, 2010
FP participation
R&D in the automotive sector is difficult to depict at the FP level as it can be part of different thematic priorities. For example, ICT research can be about Intelligent Transport Systems and so would be under the ICT priority rather than the Transport priority. Data presented below for FP6 covers the whole Transport priority while data for FP7 covers Sustainable Surface Transport (SST). Since powertrain systems make up a substantial part of these areas we considered this a legitimate approach.
In FP6, the Transport priority had a budget of €655.9m (3.7% of the total FP6 budget). There were 104 Austrian participations, which ranks Austria ninth in terms of absolute number of participations per country. Austria obtained €26.1 million funding (3.8% of
90 For example, no manufacturer of gear-boxes is located in Austria.

Final Report 127
total funding for the Transport priority). Austrian success rate at the level of participations was 33.4%, a little below the average success rate of 36.4%.
Around half of participation was by industry. Compared to other priorities, where industry participation is around one third, this is fairly high. By far the highest participation was by large firms (34%), followed by higher education institutions and public research organisations (both 16%), other types of organisations (15%), SMEs (14%), public sector (3%), and international organisations (3%).
In FP7‟s SST programme there have been 75 Austrian participations so far, worth €24.8 million. Again, almost half of participations are by industry (45%), with 29% large firms and 16% SMEs. 24% are by other types of organisations, 17% by research organisations and 13% by higher education institutions. So far the highest proportion of Austrian proposals and the highest proportion of Austrian participations are in the fields of „Greening of Surface Transport‟ and „Encouraging and Increasing Modal Shift
and Decongesting Transport Corridors‟. 91
What is striking is the high percentage of „other‟ types of organisations that participate in the Transport priority. Experts tell us that the increasing participation of non-technical actors such as municipalities or the Austrian Road Safety Board (Kuratorium für Verkehrssicherheit) is due to changes in the FP. While there used to be two thematic and separate strands in earlier FPs – one for transport planning and one for vehicle technology -, since FP5 the European Commission has made efforts to integrate these two strands.
Apart from the Transport priority, the Austrian automotive sector is also seen in the ICT priority. Indeed, interviewees tell us this is the priority with most Austrian participations from the automotive sector. Energy and NMP are other priorities in which the Austrian automotive sector participates. The background of Austria having traditionally been strong in the areas of road safety and powertrain systems as well as in materials technologies is relevant for this.
According to interviewees, the Joint Undertakings/JTIs ENIAC (nanoelectronics) and Artemis (embedded computer systems) are quite important to the automotive sector as this is where the most important Austrian players from industry and the research sector take part. In contrast, participation in Fuel Cells and Hydrogen (FCH) is limited.
There is small but regular participation of the automotive sector in EURKEA, mostly in production technologies. While large firms tend to participate in EUREKA projects and clusters, smaller firms are more likely to participate in the Eurostars programme (which gives funding). Austrian participation in EUREKA and Eurostars is particularly strong in ICT. Since production technologies and ICT increasingly go hand in hand, there is also some participation of the automotive sector in ICT projects.
Motivation for and effects of participating in the FP
An important motivation for participating in the FP is networking. Once an actor is part of a network, they regularly cooperate and give rise to a variety of research and business opportunities. According to experts, non-participation in the FP results in an opportunity cost from not being part of a network. Further, it is difficult to access
these networks once a firm or a research organisation is out.92
Networking is also in important effect of participating in the FP. However, some firms tell us that they are internationally networked anyway. No firm can survive in the automotive sector if it is not internationally active. However, this does not necessarily
91 Proviso, Transport. Österreichische Ergebnisse im 6. Und 7. RP. ExpertInnenrunde Vorbereitung 8. RP, 13.09.2010.
92 See the example of Saab, cf. Arnold, Erik et al., Impacts of the Framework Programme in Sweden, Vinnova Analyses VA 2008:11, 2008.

128 Final Report
mean participating in the FP. For a small firm, it can be perfectly rational to work as a subcontractor to a large Austrian firm that has international contacts.
Firms also pointed out that the FP is important for technology development and developing know-how. This has to be seen against the background of FP projects becoming longer-term and thus tackling future-orientated topics. As such, they are less attractive to SMEs who seek more immediate benefits (see participation figures above).
Another important effect of the FP is its role of coordinating R&D at the European level, in the sense of defining thedirection the European automotive industry is going to take. This has to be seen against the background of the FP being strongly influenced
by the European automotive industry93.
National programmes vs. the FP
Experts tell us that the dedicated national programmes, in particular the thematic programmes such as A3Plus, are complementary to the FP. Their strategy is to qualify national research actors to enable them to participate in European and other international programmes. Indeed, participation in national programmes has often been a stepping-stone to FP participation. This is said to be particularly true for larger firms (see participation figures above).
Challenges for the road transport sector identified at EU level are fuel efficiency and greenhouse gas (GHG) emissions; pollution and noise; mobility; safety and security; competitiveness. However, there is a clear focus on the improvement of fuel efficiency and the reduction of GHG emissions. In general, Austria follows the EU‟s vision and targets for road transport, and the vision‟s topics and stated targets are matched with corresponding funding programmes. In the past four years, national programmes have had a clear focus on technologies which improve energy efficiency of vehicles and
reduce GHG emissions.94 In other words, national funding programmes are more or less in line with EU priorities. Given that national programmes are designed to qualify national research actors, this is not very surprising.
Dedicated national programmes and calls are developed by the relevant ministries based on an informal consultation process with the leading centres of competence, institutes and companies and also via active involvement in European international initiatives such as the European Technology Platform ERTRAC, Era-Net Transport or
the OECD Implementing Agreement groups. 95
There are also thematically open programmes such as FFG‟s general programmes that are relevant for the automotive sector. These are complementary in the sense that projects are shorter, can be conducted alone or with just a handful of partners and are closer to the market. Structural programmes play a role in the automotive sector as well, e.g. Competence Centres in the materials sectors, even if they are not explicitly
93 According to the EAGAR study, the highest level of consultation is conducted by the European Commission with its public consultation processes and the close relation it entertains with the European Technology Platforms, in particular ERTRAC, and stakeholder associations such as EUCAR (representing car manufacturers), CLEPA (representing the supply industry) and EARPA (representing research organisations). Such an extensive consultation process, which considers all stakeholder groups, is observed nowhere else. The influence of industry is said to be very large, while the influence of the Member States is limited. Of course, this is not necessarily negative, as it ensures the relevance of FP research in the automotive sector.
94 Holleis, Alexander et al., Publicly funded automotive research in Austria, country report written in the framework of the European Assessment of Global Publicly Funded Automotive Research EAGAR, Graz/Delft, April 2010.
95 Holleis, Alexander et al., Publicly funded automotive research in Austria, country report written in the framework of the European Assessment of Global Publicly Funded Automotive Research EAGAR, Graz/Delft, April 2010.

Final Report 129
about the automotive sector. This is due to ever more generic technologies being integrated in cars.
However, due to different lengths of the projects and different requirements in terms of number of partners, permeability between national programmes and the FP is often low. It is often difficult for FFG-EIP to pass a researcher with a certain project in mind on to a national programme. Similarly, it may be difficult for EUREKA projects to get funding from a thematic programme because there may not be an appropriate call at
the national level at that time.96
National programmes relevant for the automotive sector are typically collaborative. Although funding of foreign organisations is very limited, in around half of Austrian programmes participation is open to foreign organisations if their expertise is needed
or does not exist in Austria.97 In fact, it was – among others – the automotive sector that contributed to the opening up of national programmes to foreign participation: A few years into the Austrian K-plus programme, several K-plus centres, some of them active in the automotive sector, attracted potential partners from abroad. The funding authorities reacted, and if the centres provided solid arguments that the involvement of these companies or research institutes was beneficial, the funding agency accepted these extensions. Following this experience, the follow-up programme COMET has been opened up to international participants from the very beginning. It was recognised that for highly competitive research, international cooperation is de rigueur.
Conclusions
The automotive sector in Austria is an internationally active sector strongly integrated in international value chains. This case study shows that the FP is one way to be internationally active and position oneself in a value chain. The FP has different weight for different actors but in terms of FP participations the sector is generally showing a good performance. Nonetheless, we gained the impression that with some notable exceptions the FP was not overly important to Austrian actors in the automotive sector.
In general, the most important motivation (and effect) of the FP is networking, technology development and building up know-how. This is important taking into account that FP projects are more long-term and hence tackling future-orientated topics. This is also in line with overall findings of this study. Another important effect is coordination of European R&D in the automotive sector. This has to be seen in connection with the FP Working Programmes and Calls being strongly influenced by the automotive industry.
National programmes have contributed to strengthening research actors for the FP and other international programmes. There is complementarity but little permeability between European and national programmes.
96 And a large companies will think twice before getting funding from the general programmes as the funding they receive from FFG has an upper limited.
97 Holleis, Alexander et al., Publicly funded automotive research in Austria, country report written in the framework of the European Assessment of Global Publicly Funded Automotive Research EAGAR, Graz/Delft, April 2010.

130 Final Report
2.2.6.2 Information and Communication Technologies (ICT)
Economic significance of the Information Communication Technology (ICT) sector in Austria
According to the OECD definition of the ICT sector (which uses NACE codes), there
were around 14,400 ICT firms in Austria in 2005.98 These firms had 110,500 employees. About 99,000 of the employees were in a dependent employment relationship. The sector achieved a turnover of €28.4b and gross added value of €9.9b in 2005. With these figures, the ICT sector accounted for 5.2% of Austrian enterprises, for 4.4% of employment, 5.2% of turnover and 6.9% of gross value added in the market-oriented economy. These numbers indicate that the ICT sector is of high economic importance to Austria.
Within Austria, there are clear agglomeration effects. Of the 14,400 firms, around 8,300 are located in the Vienna Region (Vienna, Lower Austria and Burgenland). 5,290 firms are headquartered in Vienna. Vienna accounts for about 60% of employment, approximately 70% of sector turnover and about 71% of gross added
value of the Austrian ICT sector99.100
It is also worth taking a look at some structural characteristics of the ICT sector. The OECD distinguishes between an ICT manufacturing and an ICT service sector. A respective break-down indicates that most firms are active in the service sector. The manufacturing sector holds only around 670 firms in Austria. These represent, however, around 26% of overall employment (27% of dependently employed persons), 22% of sector turnover and 23% of gross value added. It is hence evident that firms in the manufacturing sector are on average larger than in the services sector.
Turning our attention to the service sector, a concentration effect is seen once again. While telecommunication firms represent only 1.6% of the firms, they account for around 33% of employment, 46% of sector turnover and 51% of gross value added in the ICT services. The second most important sub-sector with ICT services is the category „data processing and databases‟. While this sub-sector represents 91% of firms in ICT services, it only accounts for 53% of overall employment, 27% of turnover in services and 34% of gross value added. Notable is the high share of sole-proprietor businesses: Around 63% are sole proprietor firms which achieve 9.2% of turnover in the sector „data processing and databases‟.
If we look at the ICT sector in Austria in more qualitative terms, we can distinguish between a large bulk of firms which are mostly providing general-purpose IT services such as network administration and maintenance, IT consulting, training on software products, etc. Only a small share is actually active in specific technology fields which one might consider „high-tech‟ and are research intensive. A quantitative assessment of the division lines between these two groups is only available for the Vienna Region
and based on a survey conducted among 702 ICT firms.101 The most important activity fields mentioned are „general purpose‟ IT services (for 47% of the surveyed business) and other type of IT services. Firms active in selected „high-tech‟ fields (embedded systems, chipcard technologies, etc.) appeared only in single-digit percentage shares indicating that such firms are low in number when compared to the whole ICT sector.
98 Radauer, Alfred et al., IKT Standort Wien im Vergleich, 2007. 99 Some bias may be present because some of the larger firms are counted in official statistics - with all
their subsidiaries in the provinces - as Viennese firms if they are headquartered in Vienna. However, model calculations show that the picture does not change dramatically if this bias is accounted for.
100 It is interesting to note that there are more persons employed in the ICT sector in Vienna than in tourism (9.7% of employment in the market-oriented economy in Vienna as opposed to 6.9% in tourism). Gross value added is more than seven times higher.
101 Radauer, Alfred et al., IKT Standort Wien im Vergleich, 2007.

Final Report 131
Finally, it is worth mentioning that the OECD definition only captures what one may label „core‟ ICT industries. It neither takes into account large ICT service departments in firms (such as in insurance companies or the banking sector), nor does it account for ICT-related R&D activities in sectors predominantly occupied with other technologies (e.g. in the automotive industries; see also case study in chapter 2.2.6.1). The generality of ICT as a technology field and its horizontal, enabling function is always a challenge for policies that address „ICT‟.
R&D in the Austrian ICT sector
Official statistics show that 454 reporting entities (roughly equivalent to firms) were
conducting R&D in the OECD-defined ICT sector in Austria in 2007.102 These firms reported to have spent €866 million on R&D and to have employed approximately 7,100 Full Time Equivalents (FTEs) in R&D. R&D expenditures in the ICT sector hence account for 17.9% of all Austrian industry R&D expenditures. The majority of R&D expenditures were recorded in NACE code 32 (radio, television and communications engineering, €466m) and NACE code 72 (data processing and databases, with R&D expenditures of €255m).
The official R&D statistics – with around 454 firms conducting R&D out of 14,400 – grossly underestimate the number of R&D performing ICT businesses. The reason for this is that while the official statistics have full coverage of larger firms, they sample small and micro-enterprises only partially. For the Vienna Region, and based on the said survey of 702 firms, there is evidence that as much as one third of the firms engage in R&D activities (for the most part less research and more development
oriented activities).103 Extrapolating these figures to Austria one could expect by and large 4,800 ICT firms to engage in R&D.
ICT research is among the most important research fields in Austria.104 The most R&D-intensive large, domestic firms are either directly or indirectly related to ICT. There are areas of significant strength in the Austrian ICT R&D landscape: embedded systems. mobile communication, visual computing, artificial intelligence and semantic systems, electronics and – and in the field of basic science - mathematics and electronic core sciences. Only few areas, such as embedded systems, excel both in basic and applied research.
Between some of these areas there are clear overlaps and potential to realise synergies. The analysis of Prem indicates, however, that these areas of strength may be well known among ICT researchers, but that marketing and dissemination of information in these areas can be improved. Further challenges have been identified to be the treatment of the topic of Intellectual Property Rights (especially in the context of R&D collaborations) and the availability of sufficiently qualified R&D personnel
FP participation
In the following, we take a specific look at Austrian participation in FP6 and FP7 in the
ICT-focused thematic priorities.105 In FP6, this concerned the thematic priority „information society technology‟ (IST). Furthermore, relevant content can be also found in the thematic priority „citizens and governance in a knowledge-based society.‟ In FP7, the priority area is „information and communications technology‟ (ICT)
102 Statistik Austria 2009. 103 Radauer, Alfred et al., IKT Standort Wien im Vergleich, 2007. 104 Prem, Erich et al. (2007): Grundlagen einer IKT Forschungsstrategie für Österreich, 2007. 105 Because of the horizontal nature of ICT, one may find respective projects in almost all thematic
priorities of the FPs. However, such projects cannot be scrutinised in the scope of this case study.

132 Final Report
The following points emerge, based on data provided by PROVISO and e-Corda (see also Annex B):
In FP6-IST, Austria was involved in 266 projects with a total of 418 participations. The overall EC funding amounted to €117,233,069. In absolute terms, IST was the most significant thematic priority for Austria in FP6 with the highest number of projects (75 more than the second ranked „sustainable development‟), the highest number of participations (119 more than in „sustainable development‟) and the highest EC funding (around €47 million more than „sustainable development‟). In relative terms, Austria was present in 25% of all IST projects in FP6, accounted for 3.0% of participations and obtained 3.1% of the EC funds earmarked for this thematic priority. These figures are either within the range of the averages for Austria in FP6 (overall participation share: 2.60%) or above (overall average project share in FP6: 13.5%; overall average EC funding share: 2.56%). In IST, Austrian participations in FP6 proposals were slightly more successful than on average in IST (proposal success rate: 22.6% vs. 20.6%).
In FP6-citizens and governance, Austria was involved in 54 projects with 68 participations and a total EC funding of €9,323,180. The share of projects with Austrian involvement in this thematic priority amounted to 37%, the participation share to 3.4% and the EC funding share to 3.8% - all these figures are clearly above Austrian averages for overall involvement in FP6. The success rate of Austrian participations in proposals participation is slightly lower than the average (18.3% vs. on average 18.8%).
In FP7-ICT, Austria‟s recorded involvement up until 11/2009 indicates presence in 192 approved projects. 268 participations were on file. The total EC funding amounted to €76,390,984. The share of projects with Austrian involvement in ICT amounted to 23% and the participation share to 3.5%. These figures are clearly above overall Austrian FP7 values (share of projects: 11.9%; participation share: 2.5%). The same holds true for the EC funding share, which amounts to 3.9% in ICT (vs. 2.7% FP7 overall). The success rate of Austrian participations in proposals is higher than the average ICT proposal success rate (19% vs. 17%).
Impacts of participating in European programmes
Overall, experts assert a clear positive development of Austrian participation in the ICT priority areas from FP5 to FP7. In fact, ICT is one of the driving forces of Austria‟s overall performance in the FPs. The experts interviewed told us that 300 to 500 key individuals are behind this development, and that these individuals have improved considerably over the past years in the way they handle the FP. We have come across R&D performing institutions which take part in the FP extensively, and others which do so only occasionally and/or deliberately only as partners (see for example case study on vrvis in chapter 2.2.4).
Due to the broadness of the subject of ICT and its horizontal nature, it is hard to depict impacts in ICT at researcher level in Austria that would stand out as sector qualitatively against the mainstream results. However, the ICT sector is probably the best example in Austria of how national programmes can interact with programmes at FP/EU level to leverage impact. It is particularly the national programme „FIT-IT‟ which is in the spotlight in this context.
FIT-IT is a thematic programme which aims to develop radically new IT up to the point of a functioning prototype in Austria; to improve competitiveness of Austrian ICT research and industry through increased collaboration of research with industry, thematic foci and the establishment of clusters; to educate Austrian researchers and to foster top-notch R&D; and to improve visibility, standing and networking of Austrian ICT researchers in Europe and internationally. Fundable projects have to be conceived as collaborative projects, involving at least one partner from research.
FIT-IT has five programme lines. In 2004, the three funding lines „embedded systems‟, „semantic and intelligent systems and services‟ and „systems-on-chip‟ were introduced.

Final Report 133
In 2006, „Visual Computing‟ and „Trust in IT Systems‟ were added. The five programme lines reflect to a large extent ICT priorities set at FP level. Experts told us that the decision for FIT-IT was a response to the FP and an attempt to maintain and strengthen national capability.
As a result of the leveraging activities of FIT-IT, Austria was one of the few countries that conceived the JTI ARTEMIS. Systems-on-Chip was launched in response to Infineon setting up in Villach, Carinthia. The line is a mirror for the JTI ENIAC. In relation to semantic systems, BMVIT – as the responsible ministry – decided to build a programme around the University of Innsbruck and various national firms. Visual Computing and Trust-in-IT were particular results of stakeholder consultations and national expression of interest calls. Since 2008, FIT-IT is also handling the JTIs ARTEMIS and ENIAC.
Besides FIT-IT, another example in ICT where a national programme mirrors and complements a European scheme is the national programme BENEFIT. According to interviewed experts, it was conceived as the counterpart to the Ambient Assisted Living (AAL) Art. 185 initiative. Both initiatives aim to increase living quality of elderly people by drawing on ICT technologies. AAL is administered within the framework of the BENEFIT programme.
There is wide-spread consensus among interviewees that the Framework Programmes and related schemes have by far the most impact on Austrian ICT research among the European RTDI schemes. A small exception may be EUREKA and its clusters CATRENE and ITEA-2 which are strikingly similar to ENIAC and ARTEMIS. The overlaps between the clusters and the JTIs are addressed at European level through a delineation process.
The interaction of national with European programmes is said to “[...] have contributed to the development of strong(er) players in Austria in the respective thematic fields” (expert interviews), and these actors are also influential in the development of the ICT programmes and initiatives at EU level (ARTEMIS being the most noted example). A particular success factor is often seen in the high interaction between the ministry and the EC.
Conclusions
This case study has firstly shown the significance of the ICT sector for the Austrian economy, and some features of the ICT research taking place in Austria. One observation is that Austria has some specific fields of strength in ICT research.
Secondly, we illustrate how aligning national programmes with European research foci can help leverage Austrian capacities in selected (ICT) research fields. These activities have helped strengthen the actors in ICT research who have professionalised themselves accordingly, especially with respect to the handling of the FP. As a result, Austrian performance in the ICT-related thematic priorities is considered more than satisfactory.
The ICT sector case study may also be a showcase for things to come in future programming periods of European RTDI initiatives. New initiatives such as JTIs are accommodated and complemented in national planning, and strategies for specialisation – such as the focus of the national programmes on selected technology fields within the ICT research - pursued.

134 Final Report
2.2.6.3 Life sciences
Economic significance of the Life Sciences sector in Austria
The OECD definition describes the life sciences as “[...] the application of sciences and technology to living organisms, as well as parts, products and models thereof, to alter living or non-living materials for the production of knowledge, goods and
services”.106 This definition is rather broad, leading to a variety of definitions for a firm active in the life sciences. Commonly, a colour coding scheme is used for
classifying life sciences businesses.107 Unfortunately, there is no clear correspondence of such a classification to the NACE systematic of industries used by statistical offices.
Notwithstanding the methodological difficulties of singling out life sciences firms in the NACE systematic, it was possible to identify 347 Austrian firms in 2007 which are
active in the life sciences sector.108 The sector employs around 28,000 persons. Sector turnover amounts to €8.6b with a gross added value of €3.3b. While most of the firms (270) are SMEs with less than 50 employees, the 30 large firms (with more than 249 employees) account for 70% of employment (19,975 employees). These figures corroborate the high significance of the life sciences as an industry in Austria.
One feature that is interesting to note is that most firms in the pharma sector have been established before 1999, while the majority of firms in biotechnology field were set up after 2000. Hence, the biotech sector is a rather „young‟ business sector. The start-ups use predominantly private capital and public funds for establishing their business and only to a small extent venture/risk capital. Vienna and the Vienna Region (VR) are leading as location of life sciences firms. Since 2000, more than 130 firms have been set up in the VR. The availability of national funding is seen as instrumental for this development.
R&D in the Austrian life sciences sector
176 firms have been identified in 2007 to conduct R&D.109 These firms report R&D expenditures of €814m representing around 17% of R&D expenses of the corporate sector overall. R&D intensity amounts, on average, to 9.4% of turnover. The sector employs approximately 5,000 staff in R&D. A concentration effect is also visible: 27 firms account for 70% of R&D expenditures.
About one third of R&D expenses concern the field of biotechnology. Around 58% of the R&D expenses are funded by the corporate sector itself, 27% is funding from abroad (mainly from affiliated firms) and public funding amounts to 15%.
Looking at the science sector, R&D expenditures amounted to €763.7m in 2007. This figure is the sum of R&D expenditures in codes 14 (biology, botany, zoology), 45 (veterinary science) and 3 (human medicine) of the classification of scientific fields used by the Austrian Science Fund FWF. The expenditures increased considerably between 2004 and 2007 (+18.9%). Expenditures by universities account for most of the R&D expenses and also for the rise of expenditures. Among the different scientific fields, the field of human medicine stands out: It spent €568.5m on R&D in 2007.
106 OECD Biotechnology Statistics 2009. 107 Red biotechnology refers to research and application of biotechnological methods in medicine, from
diagnosis to therapy (medicine and pharmacy). Green biotechnology denotes research and application of biotechnological methods in agriculture, food production and plant breeding. White biotechnology analogously refers to the optimisation of industrial processes by utilising bio-molecules and micro organisms. Grey biotechnology is used in the context of research and application of biotechnological methods in the area of environmental protection and waste disposal (and also for the integration of biotechnology with other technology fields). Eventually, blue biotechnology is used to define biotechnology in the context of research and application involving aquatic organisms.
108 Schibany, Andreas et al., Österreichischer Forschungs- und Technologiebericht 2010, 2010. 109 Schibany, Andreas et al., Österreichischer Forschungs- und Technologiebericht 2010, 2010.

Final Report 135
FP participation
In the following, we take a specific look at Austrian participation in FP6 and FP7 in the Life Sciences-focused thematic priorities. For FP6, life sciences had their own thematic priority „life sciences, genomics and biotechnology‟ (LIFESCIHEALTH – LSH). In FP7, a corresponding focal area for funding was provided with the priority area HEALTH. Another area where biotechnology projects are explicitly found is the area „food, agriculture and biotechnology‟.
With respect to participation in these two priority areas, the following points are noteworthy (see Annex C, data based on PROVISO and e-Corda):
In FP6, there were 117 projects with Austrian involvement. These projects had some 182 Austrian participations. The total EC funding made available to Austrian participations amounted to €52,598,999. Austrian involvement in LSH ranked third with respect to the three indicators project share, share of participations and EC funding share (behind IST and sustainable development). In relative terms, Austrian R&D performing organisations were involved in 20% of the LSH projects which is clearly above the Austrian average for all of FP6 with 13.5%. The participation share reached 2.70% (around the same as average Austrian participation share in FP6). The EC funding share (the „return‟) amounted to 2.0%, which is also in the range of average Austrian FP6 performance. Austria‟s success rate for participations in FP6 proposals was slightly higher than the EU average (26.8% compared to 25.7%).
In FP7, there were 76 projects recorded with Austrian participation in HEALTH up until November 2009. These projects showed 107 Austrian participations. EC funding amounted to €35,257.377. In absolute terms, these figures place HEALTH second after ICT for Austrian participation in FP7 across all thematic priorities. In relative terms, Austrian involvement was observed in 18% of the projects within HEALTH. This is considerably more than the average Austrian project share of 11.0% in overall FP7. In terms of participation share and EC funding shares, Austrian performance in HEALTH was more or less on a par with average Austrian performance in FP7. The success rate of participations in FP7 proposals amounted to 19% for Austrian participations in proposals which is 2%-points less than the EU average in HEALTH.
In FP7, there were further 29 projects so far recorded in „food, agriculture and biotechnology‟. There were a total of 42 participations, and EC funding was recorded to be €5,819,665. The project share, participation share and EC-funding share amounted to 15%, 1.7% and 1.5%, respectively. Participation share and EC funding shares were, as opposed to the project share, below EU average.
As most of the take-up of the FPs is borne by the university sector, ERC starting grants are increasingly in the spotlight for the life sciences: “67 projects with Austrian participation were submitted in the funding line Starting Grant 2009. Of these, seven projects were successful including with nine Austrian participations six Austrian host institutions and three Austrian researchers [...] by comparison, eight projects with Austrian [researchers] were approved in connection with the Starting Grant 2007 announcement and seven in connection with the Advanced Grant 2008
announcement.”110
Impacts of participating in European programmes
Life sciences are well supported in Austria through national funding programmes.
According to the Austrian Council for Research and Development111, the life sciences
110 Schibany, Andreas et al., Österreichischer Forschungs- und Technologiebericht 2010, 2010. 111 Austrian Council for Research and Technology Development, Strategy 2020, 2009.

136 Final Report
had the largest share of funding volume for a focal theme in 2007. Drawing on the definition of the Council, relevant funding agencies and research institutions invested
some €104m. in 2007. According to Schibany112, “life sciences is thus clearly in the first place in thematic research promotion.” The areas of nano and material (€63m) and ICT (€62m) come second and third, respectively.
One key observation is that the national Austrian funding system is not specifically aligned to European schemes (such as FP7 and the JTI IMI). As one interviewed expert put it “the impact of European RTDI initiatives on national programme design in the life sciences is moderate” (expert interview). This concerns FFG‟s thematic programme GEN-AU (GENome Research AUstria) - the main thematic programme in that field -, but also the business-oriented offerings of the funding bank aws (Austria Wirschafts Service). aws runs a portfolio of programmes aiming at the promotion of start-up formation, information dissemination on the life sciences and the promotion of the sector abroad. aws officials stated that interaction with European programmes such as FP7 is minimal (see also chapter 2.2.4).
Among the European programmes, the Framework Programme is said to be overall the most important funding scheme, and herein especially the collaborative projects in LIFESCI (FP6) and HEALTH (FP7) “[...] because there is considerable money there” (expert interview). Further main reasons to participate are the development of know-how and capabilities, to develop networks, to address specific scientific questions and to tackle problems of a European dimension. Especially for the life sciences firms some experts assert that the „softer‟ motives may count more than monetary returns.
The motivations mirror also the main dimensions where impacts are experienced: In improved relationships with known and previously unknown partners (networking effects), increased technical and scientific capabilities and know-how, access to new markets (particularly for firms) and enhanced reputation and image. Positive impacts are also felt with respect to the ability to attract staff.
An important issue in the field of life sciences for later commercialisation is the topic of intellectual property rights (IPR) and patenting. Especially for small biotech firms and start-ups the value of the patent portfolio determines company value. In this context, IPR may be a barrier to participation in European programmes and collaborative research projects:
A larger size of consortia also increases risks for unwanted know-how transfer and the efforts necessary for protecting IP. This applies to collaborative projects in the FP.
IP protection certainly is a big issue in the JTI IMI (Innovative Medicines), where the IPR regulations currently used seem to favour big pharmaceutical firms. The problem encountered is “[...] essentially that the rules require that not only the foreground IPR (IPR developed in the course of a collaborative project) be shared but also the background IPR (those IPR/patents that have been developed beforehand by the company)” (expert interview).
Another IPR-related problem appears in the context of firms financed by Venture Capital: “IPR regulations in the FP are frequently in conflict with contracts with the Venture Capital investor. Therefore, many life sciences firms that could theoretically participate in the FP have to limit collaboration and FP involvement to non-core areas of business activity”. (expert interview). It must be said though that not all interviewed experts share this opinion.
As regards SME participation, experts also noted that many life sciences SMEs have considerable experience with the funding system and collaborative R&D projects because many of them are university spin-offs. Lack of resources – especially in the
112 Schibany, Andreas et al., Österreichischer Forschungs- und Technologiebericht 2010, 2010.

Final Report 137
start-up phase – are an issue that conflicts with administrative burdens or other requirements of FP projects (number of consortial partners, etc.)
In this context, interviewed experts consider the ERA-Net concept a possible alternative, as “[...] they are more specific and project consortia smaller”. (expert interview). A drawback of ERA-Nets is, however, their fragmented nature: “I had one company which I thought would be a perfect fit for a particular ERA-Net. Then I found out that Austrian access to the Austrian ERA-Net was provided only by the province of Lower Austria. The firm was located in neighbouring Styria”. (interviewed expert). ERA-Nets in the life sciences relevant for Austria are said to be Plant Genomics (ERA-PG), Pathogenomics (PathoGenoMics) in the basic sciences as well as Eurotransbio and ERA Industrial Biotechnologies (ERA-IB) in the more applied sciences.
Experts pointed to a contradiction between RTDI policy and regulation which limit impacts of R&D funding in the life sciences. It was the area of regulation that was specifically mentioned and where more harmonisation was called for: “[...] to give an example: What sense does it make to foster R&D in certain areas of genomics, if regulations ban the application of the results on the market?” (expert interview)
As far as specific challenges for the Austrian life sciences are concerned, our interviewees noted – despite the strong figures introduced at the beginning – signs of stagnation. A considerable issue is said to be „brain drain‟ towards the U.S.
Conclusions
The main conclusions to draw are (i) the life sciences sector is a fairly strong scientific and technological field in Austria and (ii) it is particularly well supported through the national funding system. The biotechnology firms are quite young. While the national funding system has been designed less with the FP in mind, uptake of the FP is satisfactory. The FP is seen foremost as a source of funding, and also as an instrument to achieve know-how gains which would not be realisable by drawing on national funding alone. A key issue in the life sciences is patenting. Especially the JTI IMI has rather unfavourable IPR regulations in place which make the scheme not very attractive to SMEs.
2.2.6.4 SSH: Socio-economic sciences, humanities, the FP and Austrian R&D policy
Some FP statistics first
The starting point for this case study is statistics113: Any analysis of Austrian FP participation shows that Austrian institutions have been particularly active and successful in the SSH related priorities of FP6 and FP7:
In the "Citizens and governance in a knowledge-based society" priority of FP6, Austrian organisations participated in 37.2% of all funded projects and they coordinated 6.9% of these projects. For comparison: across the whole of FP6, Austrian institutions were involved in 13.5% of all projects funded and coordinated 3.3% of them. They received about 3.5% of the funding available for
this priority (FP6 average for Austrian participants: 2.7%)114.
In the "Socio-economic Sciences and Humanities (SSH)" priority of FP7, the situation so far is similar: by spring 2010 Austrian organisations took part in 27.1% of all funded projects (Austrian FP7 average 20.7%) and they coordinated
113 Further to data analysis, this case study is based on interviews and focus group discussions with FP participants and stakeholders, and document analysis.
114 All data in this paragraph: PROVISO Final Report on FP6.

138 Final Report
6.8% of SSH projects (Austrian FP7 average 3.7%) and received 4% of all funding
in the priority (Austrian FP7 average 2.57%)115.
This is nothing new to the FP community as the data has been published repeatedly, e.g. in PROVISO's regular reports, in the Austrian Research and Technology Report 2010 and, of course, also in chapter 2.2.2 of this report. Above average successful participation and above average shares of funding are generally interpreted as indicators of specialisation. Two groups of Austrian researchers display high specialisations in the thematic priorities: the ICT participants and the SSH participants. In FP6, Austrian ICT participants received €117.2m of funding, SSH participants €9.3m, all Austrian FP6 participants together gained €425.4m. Still, the SSH success story is rarely told beyond the inner circles of the FP or SSH– what could be the reason? Clearly, size is one explanation why SSH does not gain as much attention as ICT (see the ICT case study in 2.2.6.2).
Looking only at the dedicated SSH thematic priority actually underestimates the participation of SSH researchers in the FP because they do not only participate in "their" dedicated thematic priority: Other thematic programmes also address research topics that need knowledge from one or several SSH fields to be answered. In fact, the earliest participations of Austrian SSH researchers date back to FP3 (see the example of ZSI in this study), while a specific SSH-related thematic programme was first introduced in FP4. The most relevant other thematic fields in terms of (possible) participation for the SSH are environment, sustainable development, health, and food. Some institutions also contribute to projects in more technical fields like ICT and nanotechnologies. Other activities and horizontal priorities also play a role, especially Science and / in Society and Research for Policy Support, Specific Support Actions etc. However, these scattered opportunities are not yet well known among the SSH communities and participation of the SSH communities is concentrated on the SSH thematic priority. To widen the scope of participation, SSH NCPs screen other work
programmes and alert their customers of these wider possibilities116.
A look at the Austrian SSH players in the FP
There are basically two types of participation patterns in the SSH priority: On the one hand, there is a comparatively large number of organisations that participate in only one project. In FP6, for instance, some 31 distinct institutions took part in the Citizens priority; about 18 of them were involved in one project, six in two projects and seven in three or more projects. On the other hand, some SSH research organisations explicitly diversify their participation, not (only) participating in the respective priority but (also) in other thematic or horizontal programmes within the FP. They do so, partly because of their thematic specialisation, partly because it is a strategy to enhance rates of success and funding.
There is no such thing as "the typical Austrian SSH participant". Therefore we pick out two very distinct groups for further analysis. Among all Austrian SSH participants, the non-university research institutes are by far the largest group, accounting for 49% of Austrian participations in "Citizens" and for 65% in SSH, while in most other European countries, universities tend to dominate in these fields.
There are several reasons why Austrian universities participate less often: the SSH studies at Austrian universities attract the majority of students (55% of first-year
bachelor students in 2007117), which means that researchers in some of these fields have to cope with high teaching loads and do not have much time left for research.
115 All data in this paragraph: PROVISO Status Report on FP7, Spring 2010. 116 Göksu, Seda, Opportunities for Researchers from the Socio-economic Sciences and Humanities.
Analysis of SSH Relevant Topics in Areas other than Theme 8 Socio-economic Sciences and Humanities Work Programmes 2011, Tubitak / Net4Societey, August 2010.
117 BMWF, Universitätsbericht 2008.

Final Report 139
Moreover, until recently incentives to apply for third-party research funding have been fairly low for many university scientists. For those who did go for competitive funding, the Austrian Science Fund (FWF) was and is the most important address. This holds
especially for the humanities: they do well in FWF programmes118, but for them the FP priorities seem to be less attractive. Where FP related activities address researchers in the humanities explicitly, universities are the most active participants, as can be seen in the projects funded through the ERA-Net HERA. The situation is different for the social and economic sciences at universities, especially those orientated towards application, although with its Translational Research Programme, FWF offers new opportunities for this type of research. Still university researchers in the socio-economic sciences participate less actively in the FWF programmes as those in the humanities, and they are less active in the FP compared to their non-university colleagues.
The existence of a strong Austrian non-university research community in the (applied) social sciences is closely linked to the development of these disciplines at the Austrian
universities119 and dates back to the 1990s, when a rapidly growing numbers of (PhD) graduates (e.g. sociology) faced rather limited perspectives for pursuing a scientific career at a university. Consequently, some of them took the entrepreneurial path and established their own (small) research institutes, mainly multidisciplinary in their orientation and with a strong focus on applied SSH research from the outset. These institutes depend on third party funding to a large degree. While some have found their national niches, for others, FP funding plays a vital role, especially if they are active in research on labour market, migration, diversity, citizenship, and human rights. Some of the institutes get institutional funding from the BMWF, the so-called "Basisfinanzierung". Though accounting for only a small share of the institutions' total budget, these subsidies are important because they can be used flexibly, as they are not assigned to a specific project contract. On the downside, the present system is based on annual funding decisions without clear and transparent decision-making criteria and procedures, mainly following historical trajectories. This makes planning and continuous development difficult for the institutes – a problem that could be overcome with an institutional subsidy allocated on the basis of multi-annual performance contracts.
Stakeholders expressed concerns about the future participations of the SSH community in FP7: Rejection rates in the SSH thematic programme are among the highest in FP7, with approx. 90% of all applications rejected (many of them clearly above thresholds, i.e. of very high quality), and for many participants it is difficult to cover the costs of in-vain applications (see also chapter 3.3.2.5 on proposal grants). What is more, raising funds to match FP funding has become very difficult after the so-called "Zusatzfinanzierung" (literally, additional funding) was terminated by the
BMWF in 2009120. Some (small) institutes face a further problem caused by the low chances of getting funded: some react by submitting as many proposals as possible. If, however, they depend on FP funding to a high extent, maintaining and developing their thematic profile is difficult because they have to submit proposals to whatever call more or less fits and to make do with what they can get. Evidently, this is not the best way to develop and sharpen one's profile. It seems quite likely that these perspectives will oblige some participants to stop applying for FP projects. Certainly, they will not encourage those who haven't taken part so far to overcome their reluctance.
118 FWF, FWF-Diskussionspapier zur Situation der Geistes-, Sozial- und Kulturwissenschaften, Mai 2008. 119 Fleck, Christian, Die Entwicklung der Soziologie in Österreich, in: Pichler, Rupert et al.
(Hg.):,Steuerung von Wissenschaft? Die Governance des österreichischen Innovationssystem, 2010. 120 This funding was granted to universities and non-university research institute that could not co-fund
their FP projects. Initially, the measure was intended as an incentive for participation. It was stopped for budgetary reasons.

140 Final Report
Austrian R&D policy and SSH
What has been the situation of SSH in the Austrian R&D policy during the timeframe of our study? Above all, what is striking is the blatant disparity between political rhetoric on SSH, and action. SSH feature prominently in several highly ranking policy documents:
The Austrian Council for Research and Technology Development has repeatedly listed SSH as one of the Austrian thematic priorities in R&D policy. Moreover, it has developed specific recommendations, together with stakeholders, that also
address some of the structural problems121.
In its official programme122 the Austrian Federal Government states that it “intends to support mission-oriented research with a view to addressing socially important questions (e.g. demographic trends, migration, climate change) in the form of key new national research focuses” and that “the Federal Government proposes to systematically support the social and cultural sciences and humanities”.
The Federal Ministry of Science and Research published strategic fields of action for Austria‟s so-called “frontrunner strategy” and identified as one key field “to strengthen the social and cultural sciences and humanities” through “structural measures (e.g. infrastructure, quality assessment)” and “fostering cooperation
between universities and research institutes”123.
The other fields of research that have met similar levels of “official” political attention in recent years, such as ICT, transport, security, nanotechnology, and life sciences, are funded through targeted measures, typically through thematic or mission orientated research funding programmes.
The situation for SSH is completely different. During the past decade, three SSH related initiatives have been launched by the BMWF, one programme tackling the structural problems of research institutes (“Dynamische Qualitätssicherung”), and two programmes funding application oriented inter- and transdisciplinary research
(NODE and TRAFO124), also involving actors from civil society as users of the results. All these measures were positively received by stakeholders and the research
community125 but discontinued, presumably for budgetary reasons.
At present, publicly funded support measures that explicitly addresses the SSH as a
priority field are rare126. At the national level, the Ludwig Boltzmann Society, founded in 1960, supports their own interdisciplinary applied research institutes in the SSH as well as in the medical sciences. At the regional level, the „Vienna Impulse Programme for the Humanities, Social and Cultural Sciences‟ was launched in 2008 by the Vienna Science and Technology Fund (WWTF)with a planned duration of three years. Looking closer into thematic funding, one finds some niches for SSH research. The Austrian security research programme KIRAS requires the participation of “at least one SSH partner” in technology development projects, mainly with reference to societal acceptance of the technologies. The genomics research institute GEN-AU
121 Last in its “Strategy 2020” 122 Programme of the Austrian Federal Government for the 24th Legislative Period, 2008-2013 123 BMWF, Zukunftsbotschaften des Forschungsministeriums. Strategische Handlungsfelder für
Österreichs Frontrunner Strategie 2020, 2009. 124 See http://www.node-research.at and http://trafo-research.at 125 NODE was also evaluated by external evaluators who assessed the programme favourably. 126 Of course, like all other disciplines, SSH are also financed through institutional funding (above all, the
General University Fund and the Academy of Science) and the competitive programmes of the Austrian Science Funds. However, what is of more interest here is specific, targeted support vis-à-vis „verbal‟ political priority setting.

Final Report 141
funds projects dealing with the ethical, legal and socio-economic aspects of genomics research and its impacts on society. The Austrian Nano-Initiative requires research projects to address risk and safety issues and has established a dedicated support measure in order to keep track of the state of knowledge about potential health and
safety risks127.
It is definitely a step in the right direction to address societal issues in the course of technology development. However, it is certainly not sufficient as it restricts SSH to a subordinate role. This also happens in the government‟s programme, which, as quoted above, calls for dedicated support for SSH „because they are part of our country's cultural wealth‟ – which is certainly true, but also an understatement. The underlying assumption seems to be that only the natural and medical sciences and engineering are capable of producing innovations and solutions for the benefit of society, while the SSH are needed only to make these innovations more acceptable to society. This is all the more remarkable as political expectations for research as the solver of economic and societal problems fly high (see for instance the „Grand Challenges‟ debate). While
these expectations are probably demanding too much of the scientific community128, genuine SSH research will certainly be needed.
Further structural issues of SSH in Austria
There are several recent studies and papers about (aspects of) SSH research in Austria. Although some of them focus on description rather than on assessment, two points have unanimously been identified as critical (in addition to the institutional issues outlined above): critical mass and cooperation both within the research community and between researchers and users of research results.
As a matter of fact, one of the big successes of Austrian R&D policy during the past 10-15 years has been the creation of an unprecedented culture of cooperation between science and industry. This is the result (and ongoing effort) of numerous measures, above all the structural programmes such as the competence centre programmes, the Christian Doppler Laboratories, or COIN, and also the collaborative research projects funded through literally all thematic research programmes. One of the key objectives of the competence centre programmes has been to establish lasting partnerships between researchers and the users of results, based on a common research plan. These programmes have required and encouraged a great deal of learning, mutual understanding, and capacity building. Though (mostly) thematically open, the structural programmes have by and large failed to address SSH researchers and their application partners. The only exception from this rule are about half of the new Ludwig Boltzmann Institutes, established after 2004, which deliberately followed the rationale of bringing together producer and users of research in the SSH in semi-institutional settings. Without speculating about the reasons for this failure, the fact is that the SSH community at large has not benefited from such targeted support for the development of their capacities. In addition, many of the potential users of SSH research results do not perform their own R&D (unlike industry) and they are hence less capable of specifying their needs and of adopting research results. This puts application orientated SSH research at a further disadvantage.
Conclusions
Our analysis of Austrian SSH researchers' participation in the FPs has shown that there is an active, capable and ambitious research community in Austria which manages to succeed in one of the most selective FP priorities. Contrary to
127 Programme websites: http://www.lbg.ac.at/, http://www.wwtf.at/programmes/ssh/, http://www.kiras.at, http://www.gen-au.at, http://www.nanoinitiative.at
128 In our experience, research cannot solve societal and economic problems. That is the genuine and foremost role of the res publica. Evidently, research can inform the political process and offer possible solutions to problems, but these solutions have to go through a political – and democratic – process. We find the view that research can solve societal and economic problems technocratic and naïve.

142 Final Report
commitments at the level of policy documents, national R&D policies have neither systematically developed nor tapped into this proven potential to the extent they have done in other thematic fields.
We and many others have been using the term "SSH". However, it can be misleading to assemble disciplines and research cultures as diverse as economics, history, law, linguistics, philosophy, political sciences, psychology, sociology, etc. and assume that they are somehow "the same". Further policy making should build on a more differentiated and clearer understanding of the "SSH universe".
A more differentiated understanding of SSH and the respective players involved would be a necessary step to overcome the perceived fragmentation. While there are certainly common issues of critical mass and cooperation culture, "richness and diversity should perhaps be the most appropriate opening phrase in describing the landscape of
SSH research institutes"129.
R&D policy in Austria so far has neglected the possible genuine contributions of SSH research for societal and economic development. It has pinned its hopes and expectations mainly on the natural and medical sciences and engineering in a narrow understanding of innovation as "technological innovation", underestimating the genuine social dimensions of innovation and the independent potential of SSH research to develop solutions. We consider it crucial that Austrian R&D policy overcomes this self-set restriction.
Parts of the SSH community, especially the non-university research institutes struggle with structural and financial problems. FP participation is neither their cause nor their solution (see also our recommendation made regarding the Proposal Grant Scheme in chapter 3.3.2.5). We recommend a thorough analysis of these problems and, consequently, the development of solutions, in particular, a redesign of the so-called “Basisfinanzierung”.
In Austria, a set of substantial structural programmes has dramatically improved the culture of cooperation between science and industry. SSH related fields have largely been excluded from such measures and researchers and potential users alike lag behind in their ability for application orientated research cooperation, all the more as the potential user base is less affine to research as industry. We think there is urgent need for an initiative (within or beyond existing structural programmes) that mobilises collaboration between the SSH research performers and their application partners with comparable commitment and continuity.
129 Smith, John H., Mapping Austrian Social and Human Science Research with a View to Participation in the European Research Area / 6th EU Research Framework Programme, Study for the Federal Ministry of Education, Science and Culture, Vienna, April 2002.

Final Report 143
3. Evaluation of the Austrian support structures for FP7 and EUREKA, with particular focus on FFG-EIP
3.1 The system of support structures for FP7 and EUREKA in Austria
As outlined in the introduction, one of the main tasks of this study is to evaluate FFG-EIP and the services they provide towards FP7 and EUREKA from 2007 to date. However, FFG-EIP is not the only publicly funded part of the Austrian support structure and therefore we begin with a brief description of the organisations involved and their tasks and responsibilities. We also assess the interaction between the different players in this complex organisational set-up.
3.1.1 Organisational set-up and work division
At the policy level, several ministries are involved in the implementation and preparation of European Framework Programmes: the Federal Ministries of Science and Research (BMWF), of Transport, Innovation and Technology (BMVIT), of Economy, Family and Youth (BMWFJ), of Agriculture, Forestry, Environment and Water Management (BMLFUW), and of Health (BMG). BMWF acts as a coordinator and represents Austria at European level in matters related to European research policies. All Austrian programme delegates to FP7 come from one of these ministries.
At the operational level, a substantial support system at the national and the regional level has been set up by the ministries responsible for R&D issues in Austria. The main organisations involved are
at the national level, FFG-EIP: the department for European and International Programmes at FFG, formerly an independent organisation known as BIT, Bureau for International Research and Technology Cooperation (Büro für internationale Forschungs- und Technologiekooperation) and a unit of FFG since its foundation in 2004; FFG-EIP hosts all National Contact Points (NCP) for FP7.
at the regional level, five Regional Contact Points (RKS, Regionale
Kontaktstellen130) which provide information services in the Austrian provinces
at the institutional level, organisational contact points, such as research service units at Austrian universities and other research performers, which have become partners in the Austrian support network.
Moreover, the ministries have also set up a specific support system in order to continuously monitor Austrian participation in the European Framework Programmes: the PROVISO project, which serves mainly the programme delegates and policy makers by providing data and analyses.
Let us now have a closer look at the responsibilities and tasks of these players:
The programme delegates
The programme delegates officially represent Austria in the different programme committees of FP7. The ministries nominate delegates according to their responsibilities for thematic or horizontal priorities. In addition, a number of experts have been nominated for each programme committee. Some of these experts are also working at ministries, especially in cases when more than one ministry has a stake in the issue, and also FFG-EIP staff is represented in many programme committees, usually the NCP. In some programmes, experts have also been recruited from other
130 The RKS are also called „Regionale Beratungs- und Betreuungszentren, RBBZ‟ (Regional Consulting and Support Centres) in some documents. We stick to the term Regional Contact Point / RKS in our report.

144 Final Report
departments at FFG, from PROVISO, the Austrian Academy of Sciences, the Umweltbundesamt and the Vienna University of Technology.
Figure 59 provides an overview of programme delegates and experts by institutional affiliation and specific programme within FP7. In total five different ministries have nominated 21 programme delegates and they are supported by approx. 40 persons nominated as Austrian experts. Moreover, many programme delegates also work with other experts in their field of responsibility and with scientists and researchers.
Information exchange is at the core of this cooperation: The programme delegates provide strategically relevant information about developments at the European level and receive information about research priorities at the Austrian level in order to prepare the Austrian positions in the programme committees. There is no standard format for this interaction between the policy level of the programme delegates, FFG-EIP and the research communities. While in some programmes, groups of experts meet on a regular basis, interaction in other programmes relies more on one-to-one contacts or written exchange. As a matter of fact, many FP participants consider this kind of background knowledge from „inside the FP‟ of great importance for the preparation of proposals. We will come back to this later.
Figure 59 Programme delegates and Austrian experts by programme by institutional affiliation
Programme / Priority Organisation of origin of Austrian…
Delegates Experts
Cooperation SP specific configuration BMWF BMVIT FFG-EIP
Health BMWF FFG-EIP
Environment BMWF BMLFUW FFG-EIP PROVISO Austrian Academy of Sciences
Socioeconomic Sciences and Humanities BMWF FFG-EIP
Ideas SP BMWF BMWF Austrian Science Fund FWF
People SP BMWF FFG-EIP
Research Infrastructures BMWF BMVIT FFG-EIP
Regions of Knowledge, Research Potential and Coherent development of policies
BMWF FFG-EIP ÖAR Regionalberatung
Science in Society BMWF FFG-EIP
International Cooperation BMWF BMVIT FFG-EIP PROVISO
Fission BMWF BMLFUW Umweltbundesamt
Fusion BMWF, BMLFUW
Vienna University of Technology
Food, Agriculture and Biotechnology BMLFUW FFG-EIP PROVISO
ICT BMVIT BMVIT FFG-EIP
NMP BMVIT BMWF FFG-EIP PROVISO
Security BMVIT BMVIT FFG-EIP FFG-TP

Final Report 145
Programme / Priority Organisation of origin of Austrian…
Delegates Experts
Space BMVIT FFG-EIP PROVISO FFG-ASA
Transport BMVIT FFG-EIP FFG-ASA
Energy BMWFJ BMVIT FFG-EIP PROVISO
SME BMWFJ BMWFJ FFG-EIP PROVISO
Source: Federal Ministry of Science and Research, own compilation
The national level: FFG-EIP
FFG-EIP will be introduced in greater detail in chapter 3.3, hence we will focus on some basic facts in this chapter, in particular on FFG‟s role within the Austrian Support Structure. FFG-EIP hosts the National Contact Points for the entire FP7 as well as the Austrian EUREKA office. It is the largest service point for these international research programmes in Austria and unique in its specialisation on these programmes. It (or rather its predecessor BIT) was founded in the early days of Austrian participation in the EU Framework Programmes, during FP4. FFG-EIP/BIT has, of course, developed it activities, services and staff over time, yet its core mission has basically remained the same: to provide information and support to all Austrian researchers who want to participate in the FP or in EUREKA regardless of their institutional affiliation. More recently, services related to parts of the Competitiveness and Innovation Programmes (CIP) and the European Institute of Technology (EIT) have been included in this portfolio, while COST remains excluded.
Vis-à-vis the regional players, FFG-EIP‟s tasks and responsibilities have changed significantly in FP7: It has been commissioned with the management and coordination of this support network (see chapter 3.3.1.1 on FFG-EIP‟s contracts).
The regional level: Regional Contact Points (RKS)
Regional contact points provide services to research performing organisations in the Austrian provinces, based on the intention that information should be available in a short distance. The first RKS were established during FP4, i.e. at approximately the same time as FFG-EIP‟s predecessor BIT. For their tasks as RKS they are commissioned by the Federal Ministry of Science and Research, and they are normally co-funded by the provincial governments.
At present, five organisations operate as RKS in seven Austrian provinces, with a total of approx. 10 people providing FP related services:
BEP Büro für Europäische Programme (together with WISTO GmbH) in the provinces of Tyrol and Vorarlberg
CATT Innovation Management GmbH in Upper Austria
ITG Innovations- und Technologietransfer Salzburg GmbH in Salzburg
SFG Steirische Wirtschaftsförderungsgesellschaft mbH in Styria and Carinthia
TIP Technologie- und InnovationsPartner in Lower Austria131
131 This is the only regional contact point not co-funded by BMWF; in relation to FP it fulfils the same tasks as the other RKS.

146 Final Report
Researchers in Vienna and Burgenland are served directly by FFG-EIP.
FFG-EIP and the Regional Contact Points together form the Austrian Support Structure for FP7 as far as it is commissioned specifically for this task by ministries and regional authorities.
While FFG-EIP‟s activities are almost exclusively focused on European Framework Programmes and EUREKA, the RKS usually offer a wider portfolio of information and advice, albeit normally not at the same level of specialisation. Therefore, their mode of operation is different: They mainly act as providers of basic information located in the neighbourhood and they signpost their clients to the specialist organisations (e.g. to FFG-EIP or a national funding agency) for more in-depth advice or funding. Amongst themselves, RKS differ in their organisational set-up, in their other tasks and responsibilities beyond FP-related services, their level of experience and specialisation, and also in their history: In recent years, RKS or RKS functions in the provinces Salzburg, Styria and Lower Austria have been re-organised. However, the RKS and their activities are not subject of this evaluation, as they were evaluated in
2008132, therefore we will not go into greater detail here.
The institutional level: organisational contact points
Many (larger) research performing institutions and companies have professionalised their approaches to competitive research funding. As a common feature of this professionalization, they have tasked a person or a unit specifically with the provision of related services internally, such as identifying, monitoring and communicating funding opportunities, supporting proposal preparation and project management, training researchers etc.
FFG-EIP cooperates with these organisations at different levels: (i) at the level of the individual researcher who needs advice, typically for preparing a proposal (see chapter 3.3.2.3), and (ii) with the research service units. The latter have been included in FFG-EIP‟s concept of an „Austrian Support Network‟ as so-called „Kontaktstellen‟ (KS, contact points).
The universities‟ research service units account for the lion‟s share of the organisational contact points; hence we will have a closer look at their situation. Austrian public universities have experienced a profound reform of their legal status and their relationships with the responsible ministry, the BMWF: The University Law 2002 granted far-reaching autonomy to the 21 public universities in Austria and the related transformations especially in the management of universities are not yet completed. Among other changes, universities are increasingly depending on competitive funding to finance research activities and consequently, most of them have established central research service units that serve the entire university. Many of these units are still young and have limited capacities but they are systematically developing and expanding their services. The mix of services provided is different among universities, but with respect to Framework Programmes they often act as the provider of general information and sign-post to FFG-EIP for in-depth support although the more experienced units consider themselves well capable of offering e.g. proposal checks themselves. In the course of this professionalization, increasingly specialised staff is being developed to take over the (administrative) parts of proposal writing and / or project management and to handle legal and financial issues. At several larger universities, these central research services are complemented by smaller structures at the level of departments or institutes, which have often been established bottom-up by the more active participants in the FP who typically have hired somebody to support researchers by taking over project administration for several projects.
132 Weber, Michael et al., Evaluierung Regionale Beratungs- und Betreuungszentren, Endbericht, ÖAR Regionalberatung, Linz, August 2008.

Final Report 147
The PROVISO project
PROVISO‟s mission is to assist Austrian ministries and programme delegates through monitoring the participation of Austrian organisations and researchers in the EU Framework Programmes. The PROVISO analyses serve as one basis for developing Austrian positions concerning the FP in general or parts of them.
Although officially called a project, PROVISO can indeed be called an „institution‟ within the Austrian support network, with a history which goes back to FP4. At present, PROVISO is (similarly to FFG-EIP) contracted by a consortium of ministries, i.e. the Federal Ministries of Science and Research (BMWF), of Economy, Family and Youth (BMWFJ), of Agriculture, Forestry, Environment and Water Management (BMLFUW), and of Transport, Innovation and Technology (BMVIT).
The PROVISO team currently consists of 8 people. Their main tasks are
To harmonise and standardise the FP participation data obtained from the EC and to establish a data base and information infrastructure
To visualise data and information for the clients
To continuously survey and monitor Austrian participation in FP7.
PROVISO regularly produces a set of standardised reports and, solely by order of the contracting ministries, also additional analyses on specific issues.
The „Austrian Support Structure‟ as a network
Although RKS and FFG-EIP (and BIT) have been commissioned to provide services related to FP ever since FP4 and although they all have been (co-)funded by the same Federal Ministry of Science and Research, they were actually formally independent actors in the fulfilment of their contracts until 2007, and cooperation between them was based entirely on goodwill and individual working relationships. Finally, at the beginning of FP7, the set-up of the overall support structure was reformed, assigning new roles to FFG-EIP and the RKS in their mutual relationship: In 2007, BMWF commissioned FFG-EIP with the task of transforming the loose network of individual institutions into a coherent Austrian Support Structure. With this contract, FFG-EIP was installed as the coordinating body of this Support Structure. The contract comprises the following tasks
To implement a coherent Austrian Support Structure for FP7 based on complementarities and clear responsibilities
To supervise the implementation of the Regional Contact Points‟ contracts
To train and qualify partner organisations
To manage knowledge and information flows within the National Support Structure, to merge consulting related data and to expand the cooperation with PROVISO
To secure the quality of the consulting and advisory services within the Austrian Support Structure.
In the initial phase of this contract, the focus was on defining the roles of the different players and their mutual relationships. The general division of work is such that the RKS provide general information at the regional level while detailed consulting of applicants is FFG-EIP‟s task or done in cooperation. One key feature of the new set-up is that FFG-EIP supervises the content of all Regional Contact Points‟ work plans and annual reports, which provides the basis for a coherent service portfolio.
A number of measures have been put in place to safeguard quality and a high service standard at all levels. These measures include the definition of common service standards (e.g. checklists for advisory sessions, standardised formats for events etc.), training, regular exchange of experience and coaching of (new) employees, a common

148 Final Report
web-based pool of information, joint organisation of events, and the direct consulting of network partners by FFG-EIP.
The Austrian Support Structure outlined so far can be considered „the inner circle‟ of organisations that are commissioned by one or several ministries to provide services to FP participants and that have their mutual relationships contractually defined. In a wider definition, the concept of the Austrian Support Structures also comprises institutional contact points, which are mainly research service units within universities and large research institutes. The most important objective behind the inclusion of these institutions into the Austrian Support Structure is to provide them with first hand information and to further qualify them through training measures offered by FFG-EIP, thus supporting them to fulfil their roles within their home institutions. However, these organisational contact points have no contractual links with FFG-EIP.
In an even wider understanding of a network of service providers, also the private consultants have to be mentioned. For FFG-EIP there are two main reasons to launch a specific offer for private consultants: (i) EIP is repeatedly asked for services, such as proposal writing or project management, which it does not (and should not) offer, and (ii) FFG-EIP has made the observation that the level of experience and know-how related to FP among private consultants was often insufficient although they would offer related services to their clients. Therefore, for FP7 FFG-EIP has developed a new way of actively working with private consultants and of involving them into the Austrian support network.
For that purpose, FFG-EIP offers a specific training programme for consultants under the roof of the „FFG Academy‟. This programme comprises regular training workshops as well as exchange circles. Consultants that participate on a regular basis are listed on the FFG-EIP website as a service to customers who seek support beyond FFG-EIP‟s portfolio.
The majority of consultants listed at present offer their FP-related services as part of a larger portfolio of management consulting activities. In a focus group discussion with such consultants, many explained that they normally build on long-standing working relations with their clients and decide on an individual basis whether and at what time an FP project is the best option for their client. Moreover, they reported to draw upon FFG-EIP‟s own consulting services in addition to the trainings.
All in all, both sides FFG-EIP and the consultants assess this working mode positively.
3.1.2 Assessment of the interaction within the Austrian Support Structures and with
major policy stakeholders
The national level: programme delegates, FFG-EIP, PROVISO
The key features of the cooperation between the programme delegates and FFG-EIP have basically remained the same throughout different Framework Programmes. The cooperation between programme delegates and FFG-EIP is very much shaped by specifics of the respective programme or topic, by the individual work styles, and, not least, by the (sometimes long-standing) working relationships between the individuals involved, but some element are standard: Each unit within FFG-EIP produces its own annual plan and annual report and agrees on this with the respective programme delegate. Programme delegates are involved in the decision making about applications for proposal grants in their field of responsibility (see chapter 3.3.2.5) and both sides regularly work together in the organisation of information events related to calls for proposals. Moreover, FFG-EIP can get access to PROVISO analyses via the programme delegates.
In general, programme delegates work closest with the respective NCP at FFG-EIP, and in most of the specific programmes and thematic priorities of FP, the NCPs accompany the programme delegates to Programme Committee meetings. Getting direct access to Programme Committee discussions and information is a big advantage for the NCPs‟ work: they learn about future trends and developments at the European

Final Report 149
level, they know about forthcoming calls for proposals, and they understand the intentions behind the calls much better if they hear about them first hand in the discussions between programme delegates and the EC. Customers, experienced FP participants in particular, rated this as one of the major assets of FFG-EIP and also as one key factor for succeeding in the FP. Although they could, in principle, also contact the programme delegates directly, only relatively few actually do so. They perceive and use FFG-EIP as their single entry point to any kind of information related to the FP.
What‟s more, many customers also expect FFG-EIP to communicate strategically relevant information to responsible bodies, i.e. the ministries. In this respect we got the impression that the flow of information between FFG-EIP and programme delegates and other policy stakeholders (e.g. other departments in ministries) could be improved. For instance, university representatives had the impression that information they had given to FFG-EIP about structural problems affecting all universities was either not passed on by FFG-EIP or not picked up adequately by the ministry. On the other hand, some programme delegates had the impression that through the positioning of FFG-EIP as a one-stop-shop for the FP, they were getting cut off from „their‟ research community. Without questioning the division of labour between programme delegates and FFG-EIP, we think there is room for improvement here. Above all, we have the impression that there are missed opportunities: the experience gathered and the observations made by FFG-EIP‟s staff could be tapped into more systematically and they could serve as a valuable source of information, not only for programme delegates, but also for other officials in the ministries.
Overall, the relationship between FFG-EIP NCPs and programme delegates is said to be good and the division of responsibilities clear, though the exact mode of operation differs – as stated above – across thematic areas. There is also hardly a redundancy in this set-up, with the exception of the SPACE area: The programme delegate there has to deal with two agencies, both located within FFG: FFG-EIP for FP7 and the Austrian Aeronautics and Space Agency, for other space related international activities (the European Space Agency, Galileo etc.). The delegate would therefore like to see only one agency in charge.
PROVISO is the third player in this national FP service network. PROVISO‟s role and its expertise as „the FP participation data centre‟ is widely recognised among stakeholders. However, we have gained the impression that the relevance, practical usability and the actual use of the PROVISO data have not been assessed and discussed sufficiently in the past four years, since the evaluation of PROVISO, especially with respect to a more efficient use of participation data for planning and decision making.
Therefore, we recommend establishing a more systematic and organised sharing and discussing of information, beyond formal reporting. Understanding the participation patterns of Austrian players in the FP is important and this applies to programme delegates (and other ministry officials), FFG-EIP and PROVISO alike. However, in order to gain a thorough and (above all) shared understanding, various sources of information need to be combined better and discussed more intensely between these stakeholders. In addition to face-to-face communication, an enhanced reporting system could contribute to this goal. We propose that FFG-EIP‟s reporting should be more analytic and less descriptive, inspired by the example of some of the „memo
reports‟ prepared by FFG-EIP for this evaluation, e.g. those on SME participation133 or
on customer satisfaction134 and that these inputs should be discussed thoroughly among stakeholders. We believe such an approach to be beneficial in order to avoid
133 FFG-EIP, memo report KMU im 7. RP, 2010. 134 FFG-EIP, memo report Bewertung der Ergebnisse der durchgeführten KundInnenzufriedenheits-
analysen zum 7. RP, 2010.

150 Final Report
information loss and to allow for stakeholders not directly involved in the activities (e.g. specific thematic areas) to tap in to information.
Regarding other groups of stakeholders, in particular participants in the FP, there is a clear surge in demand for „strategic‟ information, too. This concerns very short lines of communication (i.e. users who want to know fast what the Commission is planning to implement), interpretation of calls, texts or – where feasible – influencing the design of work programmes. While there are clear limits to such demands, FFG-EIP as a central support structure nonetheless possesses, together with the programme delegates, the closest link to the Commission. We recommend that programme delegates and FFG-EIP work together to further strengthen such strategic intelligence collection for and from the user base in order to improve both, FFG-EIP‟s information services and ministries policy making.
Linking national and regional levels: FFG-EIP and the Regional Contact Points
Unlike the relations between FFG-EIP and the programme delegates, those between FFG-EIP and the Regional Contact Points have changed significantly. The former set-up of the Austrian support structures for FP with its formally independent players had a number of drawbacks, the main issues being a lack of coordination and coherence, a lack of quality control and suboptimal service delivery as well as missed
opportunities due to competition rather than collaboration135. The different service providers coexisted but hardly any systematic cooperation took place, i.e. if cooperation took place it was primarily on a case by case basis. Despite some attempts to improve the situation (e.g. by appointing RKS staff as NCPs in FP6), competition rather than cooperation was the rule for more than 10 years.
By commissioning FFG-EIP with the design and management of a harmonised Austrian Support Structure, the BMWF has ultimately addressed this long-standing problem and for the first time, tasks, responsibilities and work flows have been defined in a coherent manner. A first evaluation of this new system has already been
carried out by Weber et al., who drew favourable conclusions136. While it was explicitly not our task to evaluate the RKSs‟ activities again, we did re-assess FFG-EIP‟s performance as the coordinator of the Austrian Support Structure. This role was assessed positively by our interviewees: the cooperation between FFG-EIP and RKS has improved through a clear division of labour, systematic and regular contacts between the people involved and certainly also as a result of new contractual obligations. Both sides, FFG-EIP and the RKS report that the working relationships are increasingly based on cooperation instead of competition.
Now that the initial set-up between FFG-EIP and the RKS has been completed successfully, we suggest further pursuing the path towards a coherent Austrian Support Structure as a network of players with complementary (rather than duplicate) tasks and activities. Therefore, instead of commissioning FFG-EIP separately with the management of the Support Structure beyond the duration of the current contract, we recommend implementing this as a core task of FFG-EIP within the FP7 commissioning contract, where it is actually already listed as one of FFG-EIP‟s tasks (see chapter 3.3.1.1 for more information about the contracts). Moreover, BMWF should maintain co-operation within the Support Structure a condition for financing FP related services also for the RKS. Efficiency, coherence and cooperation between
135 Most of these were already identified in the evaluation of the support structures for FP6 in 2004 (Sheikh, Sonja et al., Evaluierung der österreichischen Betreuungsstrukturen für das 6. EU-Rahmenprogramm für Forschung, technologische Entwicklung und Demonstration, Endbericht, KMU Forschung Austria, Wien, 2004).
136 Weber, Michael et al., Evaluierung Regionale Beratungs- und Betreuungszentren, Endbericht, ÖAR Regionalberatung, Linz, August 2008.

Final Report 151
related service providers should not depend on people‟s preference to cooperate (or not) but be a key feature of such publicly funded services.
The role of organisational contact points
From the perspective of the organisational contact points, i.e. the research service units at universities and research institutes, the main partner within the Austrian Support Structure is FFG-EIP and not the RKS. This is because of the scope and kind of the information needed. However, there are instances where in addition to FFG-EIP, RKS also plays a role e.g. for some universities outside Vienna. All in all, organisational contact points rate their cooperation with FFG-EIP positively and satisfaction with the services provided is generally high. However, universities sometimes felt misunderstood in their position as a type of institution in a very specific situation, with the still ongoing transformation after the university reform and with specific requirements which differ from the needs of companies.
We positively assess the ongoing professionalisation of universities and other public research institutions in their approach to competitive funding and research management as well as their individually designed approaches to the provision and development of internal research services, because it demonstrates the (self-) empowerment of these institutions as research performers and managers (see also case studies on organisations in this report). With respect to universities, we think that in the wake of the University Law 2002 any R&D support measure in Austria relevant to universities has to put itself into the service of strengthening them as autonomous
research institutions137. This holds also for the support provided from FFG-EIP and the RKS. Therefore, we recommend fostering activities within the Austrian Support Structure that help the professionalisation of universities (and also other research institutions), their research management capabilities and their research service units. This is a medium- to long-term project; the actual activities and the resulting division of labour will have to be defined together with the institutions and will differ, depending on the relative importance of the FP and the capacities at each institution. There is a solid basis for these activities: the cooperation between FFG-EIP, the
„Österreichische Universitätskonferenz‟138 and the universities‟ research management units, and the strategy talk approach developed by FFG-EIP.
The set-up and division of labour within the Austrian Support Structure will have to be assessed and possibly redefined, as research institutions and their organisational contact points grow stronger and their demand for external services as well as their role in the region changes. We expect such a process of professionalisation to lead to a re-assessment and a re-definition of the division of labour within the public support structure, i.e. FFG-EIP and the Regional Contac Points. To take it to the extreme: ultimately, FFG-EIP‟s goal should be to make itself dispensable in certain respects, as many universities and research institutes develop their own research management. This would free resources for a re-focusing of activities, e.g. on providing „strategic‟ intelligence (i.e. intelligence that gives orientation and feeds into strategy) to various players in the system – beneficiaries and stakeholders. The role of strategic intelligence can be expected to become more important as European instruments get more complex and diverse (see chapter 2.1.). What is more, this trend at FP level will put many organisations and researchers experienced in the traditional FP instruments in the position of „newcomers‟ because of many of the new instruments and initiatives. This will enable FFG-EIP to focus its services more on clients who need to learn rather than on FP participants who are already very good at handling the FP, as EIP is.
137 This focus on institutions and their development instead of a „project focus‟ should, in fact, be a general guideline, also towards companies, other R&D performers and users of R&D results.
138 I.e. the former Austrian Rector‟s Conference, now named „Universities Austria‟

152 Final Report
FFG-EIP and FWF
An important stakeholder to be considered which interfaces with FFG-EIP is also Austrian Science Fund FWF. The task of providing support to prospective applicants in the ERC grant scheme is shared between FFG-EIP and the FWF. The rationale for this approach is two-fold: On the one hand, it was perceived that all operative support activities with respect to the FP should be concentrated in one organisation (which is FFG-EIP). On the other hand, the FWF is the institution which traditionally provides support to the target groups of the ERC grants – which makes it clear that it could and should play a vital role in supporting researchers, too.
Against this backdrop, FWF and FFG signed a formal cooperation agreement in early 2007. The responsibilities are such that FFG-EIP takes the role of the NCP for the ERC system, while the FWF is the primary national expert and takes part in programme committee meetings.
There was no indication in our interviews that anyone considered the design of the support structure for the ERC as disadvantageous or redundant between FFG-EIP and the FWF. Quite to the contrary, all experts and parties interviewed underlined the benefits of the system:
Both the FWF and FFG-EIP emphasise the functional relationship with one another. Some problems that arose in early 2007 seem to have been all solved. Exchange of information is “swift” and “frequent”, and both sides seem to benefit from receiving (slightly different) information gathered at programme committee meetings with FWF participation and NCP meetings with FFG-EIP participation.
Work distribution between the FWF and FFG-EIP at the operational level is informal and well working. Some researchers may contact the FWF, others FFG-EIP and both agencies state to be in a position to provide relevant information on the ERC.
Both agencies collaborate on the organisation of information events for the ERC. This includes invitations for speakers from FWF to FFG-EIP events and vice versa. One of the main aims is to illustrate the complementary character of support
programmes offered139. The two agencies also offer and coordinate ERC-focussed activities: FFG-EIP organises dedicated „ERC Proposal Writing days‟, and the FWF organises a „workshop on START and ERC starting grants‟ once a year.
Signposting is in some aspects institutionalised between the two agencies. In particular, all START applicants are informed on the possibilities of the ERC starting grant (following the requirement to submit a proposal) and are, according to FFG-EIP, advised by the FWF to also obtain support from FFG-EIP. This is said to have particularly led to a good coverage of prospective ERC starting grant applicants (i.e. a high share of advised researchers among all applicants). As for applicants for „advanced grants‟, there has been the notion that the respective persons do not need much support other than for two related reasons: First, because they are thematically complementary and experienced (at the required stage of career, presumably also in writing grant proposals). And second, because the scientific quality (expressed in the person of the Principal Investigator and the presented project) is a decisive factor for a funding decision: “[...] the thing about the ERC is that this scheme is not susceptible to background noise which is present in other FP areas [such as accounting for the goals of the programme or interpretation of call texts, ed.] [...] it is only the scientific quality that counts[...] and this is something that shows in the proposals which are very straight forward, focussed on scientific content only [...] and it is also the reason why one
139 FFG-EIP memo report 06a

Final Report 153
does not need the type of „subtle‟ advice/consultancy necessary in all the other parts of the FP” (expert interview)
FFG-EIP documents140 have identified a number of possible improvements for supporting researchers in the ERC scheme. The suggestions include, amongst others: improvements in the quality of data on ERC grants (such as analysis of points given to ERC applicants), more feedback on evaluation results if they are to yield significant improvements in the 2nd evaluation round, more systemised and person-oriented information flows and material as well as systemised feedback rounds with evaluators and panel members. Another strain of foreseen future activities (and also a future goal) refers to attracting foreign researchers to move to Austria, and the usage possibilities of ERC grants as an instrument to achieve that goal. A third strain and goal is “[...] the improvement of the quality of the proposals of Austrian ERC candidates” which necessitates “an improvement of FFG-EIP´s service quality and higher collaboration with the FWF and the internal support structures at universities”.
The evidence collected indicates that prospective ERC applicants are well supported in Austria by both FFG-EIP and the FWF, and that both agencies collaborate well with each other. The improvements suggested by FFG-EIP are hard to put into perspective, given the positive feedback received on the support provided on the ERC by FFG-EIP. It certainly shows the commitment of the FFG-EIP staff. Some of the improvements are logical consequences of experiences gathered in the field (such as the improvement of information flows and material), and we of course welcome such initiatives.
We are, however, a bit more sceptical on the viability of the two other proposed activities. We acknowledge a value of ERC grants in attracting foreign researchers, but it is doubtful that through the grants alone it will be possible to achieve the type of „brain influx‟ foreseen. These necessitate much more efforts on various levels – it certainly calls for activities on the side of research organisations which they are actually also pursuing - and ERC grant related information can be only one of many building blocks. It is questionable whether FFG-EIP as a support structure can achieve anything more than it does now – which is informing universities and stakeholders on how ERC grants can be used for this goal, especially in the course of strategy talks – in this respect. We are even more sceptical about possibilities to improve the quality of the proposals through better services, given first the weight scientific quality has in the proposals. Secondly, teaching proposal writing to prospective researchers has to be seen as a core task of universities. Where they are not yet coming up to this task, capacity building at universities should have priority over the development of external services. Consequently, in the long run, these recommendations tie in into our general recommendation that universities are to handle the management of competitive funding increasingly by themselves, given their knowledge of researchers and their need for strategically developing and positioning themselves as universities.
Throughout our analysis we have observed that the international perspective has increasingly become an integral part of national R&D policy measures. Therefore we doubt if the present strict „monopoly‟ of FFG-EIP on the FP will be a suitable solution in the future. With the ERC, research council style of funding has entered the FP stage and we consider it crucial to enable national research councils to position themselves against these radical changes. From this more systemic point of view we recommend considering the FWF taking over all ERC related national functions at the agency level. Such considerations should first be played to FWF.
140 FFG-EIP memo report 12e

154 Final Report
3.2 The demand side – need for support with European RTDI initiatives in general, and FP7 and EUREKA in particular
3.2.1 Support needs
In the online survey, the focus groups and the interviews, we have enquired into the specific support needs of participants in European programmes, and foremost in the EU Framework Programmes. The guiding research hypothesis was that such demand has changed over time. The Framework Programmes have been in existence for more than two decades, and the principal functioning has stayed basically the same (at least with regard to the core, the collaborative R&D project in thematic calls). Given their increased experience with the FPs one could expect that researchers would have different needs today compared to five or ten years ago.
In the main online survey, respondents were asked to grade their needs on a 4-tier scale – from 1=no need to 4= high need – for a number of aspects which usually arise when dealing with the FPs. Figure 60 shows the respective answers as arithmetic means for the four different types of organisations considered. We found that the needs are quite similar across organisation types. The most pronounced needs concern the two areas of „assessing future trends within the FP‟ and „specific advice regarding the FP‟. These were rated, on average, with values slightly below or above 3.0. By contrast, there is significantly less demand for „basic information‟ on the FP. With average ratings in a bandwidth between 2.3 and 2.6 this aspect is ranked in the middle of the field of the enquired-into aspects. One may interpret this result as a first indication of changed needs due to higher experience levels. Fitting this picture is also the comparatively high demand for advice regarding alternative international funding and – especially – the pronounced demand for interpreting call texts with respect to the strategic goals of the European Commission. This is in line with results from our focus groups and interviews where the need for consulting and advice on such a „strategic‟ level was voiced as a significant factor especially by experienced researchers. We will get back to this argument.
On the lower end of the scale with rather low needs on average, we find aspects such as support for writing „parts of the proposals„, „project management issues‟, „exploiting research results and IPR issues‟ or „partner searches‟. The low demand in the domain of IPR may be in parts attributed to the focus on basic research of parts of the FPs where the market introduction of innovation does not play too much of a role. Furthermore, the IPR regimes are quite clearly regulated in the FP. However, one reason might also be a lack of awareness among the respondents for the importance of the management of intellectual property which goes beyond the mere protection of IP. The low demand for partner searches reflects the finding in the impact assessment part that networking at the international level is nowadays an every day phenomenon and that respective shortcomings observed in the past are not as pronounced as they used to be – researchers, for the most part, know their potential partners already or know how to find them (mainly through existing partners).
In general, the demand patterns are similar for different organisation types, yet for certain aspects demand from universities is higher than from other organisation types. This concerns especially proposal writing (average: 2.5), project management (2.5) and reporting issues (2.9). Interestingly, the demand stemming from universities is clearly different and higher if compared to the non-university research sector. The more applied character of the non-university research sector and its often higher need for acquiring third-party funding explain such a result.

Final Report 155
Figure 60 Demand for consulting and advice concerning different aspects when dealing with FP7 by type of organisation*)
1,9
1,9
2,0
2,2
2,2
2,2
2,3
2,4
2,5
2,5
2,7
2,7
2,9
3,0
2,5
2,5
2,2
1,9
2,5
2,9
2,3
2,6
2,7
2,6
2,7
2,8
3,1
2,9
2,2
2,0
2,2
2,2
2,2
2,4
2,2
2,3
2,5
2,6
2,5
2,7
2,8
2,8
2,2
2,2
2,0
2,2
2,2
2,5
2,2
2,5
2,4
2,6
2,5
2,6
2,9
2,9
1,0 1,5 2,0 2,5 3,0 3,5 4,0
Writing (parts of) proposals
Project management issues
Exploiting research results and IPR isssues
Partner searches
Drafting consortial agreements
Reporting issues
Special instruments of the FP
Basic information
Explaining (negative) evaluation results
Alternative national funding or support
Interpreting call texts for EC strategic goals
Alternative international funding or support
Specific questions regarding the FP
Assessing future trends within the FP
Other Industry Universities Non-university R&D institutions
*) Arithmetic means on a scale from 1=no demand to 4=high demand Source: Main online survey, n = 309
A break-down among industry participants according to firm size reveals – unsurprisingly – that SMEs need more support than large firms (see Figure 61). It is especially in the domains of advice for alternative funding, interpreting call texts, drafting consortium agreements, exploiting research results and IPR issues and project management issues that such needs were voiced more than in large firms. The only aspect where (slightly) more demand arises from large companies is in the domain of assessing future trends within the FP. This finding reflects the potential and interest of larger entities to influence planning and programmes of FP actions according to their needs – as opposed to SMEs where the general picture indicates a lower level of know-how concerning the handling of international RTDI programmes.

156 Final Report
Figure 61 Demand for consulting and advice concerning different aspects when dealing with FP7, by firm size (industry participants only) *)
1,7
2,2
2,2
2,0
1,9
2,2
1,8
2,2
2,3
2,2
3,0
2,3
2,2
2,5
2,1
2,2
2,2
2,3
2,4
2,4
2,4
2,4
2,5
2,7
2,8
2,8
2,9
3,0
1,0 1,5 2,0 2,5 3,0 3,5 4,0
Project management issues
Writing (parts of) proposals
Special instruments of the FP
Partner searches
Exploiting research results and IPR isssues
Basic information
Drafting consortial agreements
Reporting issues
Explaining (negative) evaluation results
Interpreting call texts for EC strategic goals
Assessing future trends within the FP
Alternative national funding or support
Alternative international funding or support
Specific questions regarding the FP
SMEs Large firms
*) Arithmetic means on a scale from 1=no demand to 4=high demand Source: Main online survey, n (SMEs) = 46; n (large firms) = 23
Further insights into different and changing advice/consulting needs arise when levels of experience are used as break-down variables for the analysis (see Figure 62). Two such measures are available: a differentiation between coordinators of FP projects and non-coordinators and a distinction according to the number of times persons have participated in FP projects. With respect to the latter, we compare the advice needs as reported by first time applicants (those who have applied only once in the FP, whether as coordinator or partner) and experienced applicants (defined as those who have participated at least in two projects funded through the FP). In the following, we use the distinction between first time and experienced applicants as the resulting picture resembles that of coordinators vs. non-coordinators. As can be expected, demand profiles differ greatly. First time applicants need considerably more support concerning reporting, basic information, writing (parts of) proposals, project management and IPR issues (differences statistically significant at the 5% level, p<0.05). Demand is quite similar with respect to specific questions, assessing future trends and only slightly higher with regard to alternative (international or national) funding.

Final Report 157
Figure 62 Demand for consulting and advice concerning different aspects when dealing with FP7, first time applicants vs. experienced applicants *)
2,2
2,2
2,2
2,3
2,3
2,3
2,4
2,5
2,5
2,6
2,6
2,6
2,9
2,9
1,8
1,7
1,8
2,1
2,0
1,6
2,0
2,3
2,4
2,4
2,4
2,2
2,8
2,9
1,0 1,5 2,0 2,5 3,0 3,5 4,0
Exploiting research results and IPR isssues
Project management issues
Partner searches
Special instruments of the FP
Drafting consortial agreements
Writing (parts of) proposals
Basic information
Explaining (negative) evaluation results
Interpreting call texts for EC strategic goals
Alternative national funding or support
Alternative international funding or support
Reporting issues
Assessing future trends within the FP
Specific questions regarding the FP
Experienced applicants First time applicants
*) Arithmetic means on a scale from 1=no demand to 4=high demand Source: Main online survey, n (first time applicants) = 84; n (experienced applicants) = 39
Questioned on the needs according to phases of an FP project, respondents reported quite clearly that demand would be – on average – rather high in the proposal preparation phase (see Figure 63). To a lesser degree, consulting may be needed in the contract negotiation phase. Respective demand is rather low in other phases. This pattern of demand for the different phases is similar across all used break down variables (organisation type, large and small firms, coordinators/non-coordinators, first time applicants and experienced applicants).

158 Final Report
Figure 63 Demand for consulting and advice by project phases *)
1,9
2,1
2,4
2,8
2,2
1,0 1,5 2,0 2,5 3,0 3,5 4,0
Phase after project finish
Phase of project execution
Contract negotiation phase
Proposal preparation phase
Phase of decision for/against submission
*) Arithmetic means on a scale from 1=no demand to 4=high demand Source: Online survey, n = 309
The interesting question – following the basic assessment of support needs – was to ask whether the consulting/advice needs of the respondents have changed over time (see Figure 64). Almost half (49%) reported that their demand had changed. 25% reported no such changes, due to too little experience with the FP. 26% stated that their needs stayed the same, despite the know-how build up with the FPs.
Figure 64 Change of consultancy needs with time
49%
25%
26%
Consultancy needs have changed over time
Consultancy needs have not changed (too little experience with the FP)
Consultancy needs have not changed (despite considerable experience build up with the FP)
Source: Main online survey, n = 362
While the demand profiles described before already hinted at changes in demand, Figure 64 provides now solid empirical evidence for the aforementioned research hypothesis.
Those who said that their consultancy needs have changed have – compared to the past – more demand in the area of „future trends within the FP‟. Figure 65 shows that the respective share of users reporting increased needs is 31%-points higher than the share of users reporting lower demand in that area. Needs have also increased with respect to „specific information„(+21%-points) and „alternative international funding‟ (+16%-points). On the other hand, demand for „general information‟ has decreased by

Final Report 159
34%-points, for support for „writing (parts of) proposals‟ by 26%-points and for „project management‟ and the drafting of consortia agreements by 23%-points, respectively. Interestingly, very little demand changes are visible with respect to „reporting‟. This reflects the discussion and findings on administrative burdens (see chapter 2.2.1) and highlights that reporting remains to a rather large extent a hot spot when applying for FP funds.
Figure 65 Changes in demand for different aspects of support for the FPs, difference in %-points between those reporting higher and those with lower demand for support in the given areas.
3121
168 8
-2 -3 -6 -10
-23 -23 -26-34
-80
-60
-40
-20
0
20
40
60
Fu
ture
tre
nd
s w
ith
in t
he
FP
Sp
ec
ific
info
rma
tio
n
Alt
ern
ati
ve
inte
rna
tio
na
l fu
nd
ing
a
nd
su
pp
ort
sc
he
me
s
Alt
ern
ati
ve
na
tio
na
l fu
nd
ing
an
d
sup
po
rt s
ch
em
es
Sp
ec
ial i
nst
rum
en
ts o
f th
e F
P
Ne
ga
tiv
e e
va
lua
tio
n r
esu
lts
Inte
rpre
tati
on
of
stra
teg
ic g
oa
ls o
f th
e E
C
Re
po
rtin
g
Ex
plo
ita
tio
n o
f re
sea
rch
re
sult
s a
nd
IP
R
Co
nso
rtia
ag
ree
me
nts
Pro
jec
t m
an
ag
em
en
t
Wri
tin
g o
f (p
art
s o
f) p
rop
osa
ls
Ge
ne
ral i
nfo
rma
tio
n
%-Points
Source: Main online survey, basis: respondents reporting changes in demand, n = 140, base sample: users reporting changed needs overall
In a next step, we enquired whether there are differences among sub-groups of researchers stating that their consultancy needs had changed. Break-downs according to organisation type and firm size tested negative – i.e. the recorded differences were not statistically significant at the 5% level of significance. We interpret this as the researchers having the same mix of experience levels and following similar paths and milestones for learning how to deal with the FPs.
However, one needs to differentiate between the demand of individual researchers and the demand for support at organisational/institutional level. The introduction of dedicated internal research management/service units (organisational contact points) – for example, at universities – can (and actually should) influence the demand pattern of researchers. For example, if a research management unit succeeds in taking administrative burdens from individual researchers, such researchers will – sometime after the unit has been established – report „changed‟ demand and with respect to administrative issues likely „lower demand‟. If administrative burdens have actually increased, then it is going to be the research management unit that has to deal with this fact – the need for external support for this unit might therefore increase. Hence, changes in demand might be different at institutional level – they also depend on the development of internal support structures. Therefore, no demand changes reported across individual researchers need not necessarily mean that there are no changes in demand at institutional level.

160 Final Report
For the distinction between coordinators/non-coordinators, the statistical tests showed highly significant differences. This is of course not too big a surprise, as this distinction differentiates by definition between researchers with different levels of know-how. In the group of coordinators, 61% reported changed and 34% unchanged needs despite of know-how build up. 22% said to have too little experience for such changes.
Figure 66 shows the change of demand for different types of support for the FP by coordinator and non-coordinators. The group of coordinators follows the general trend described above in Figure 65 in a much more accentuated manner. To note is also that the coordinators seem to handle – by comparison – reporting much better than non-coordinators. We interpret this finding in such a way that reporting is a particularly persistent issue (see also chapter 2.2.1.2 on barriers) necessitating support, except for the very experienced users.
Figure 66 Change of consultancy needs with time, difference in %-points between those reporting higher and those reporting lower demand for support in the given areas, coordinators vs. non-coordinators
38
17 14 13 13
-10 -11-17
-29-35 -38
-43-52
-61
3019
135 4
-4-11 -7
-32
-3
-23-28
-22-33
-80
-60
-40
-20
0
20
40
60
Fu
ture
tre
nd
s w
ith
in t
he
FP
Sp
ec
ific
info
rma
tio
n
Alt
ern
ati
ve
inte
rna
tio
na
l fu
nd
ing
a
nd
su
pp
ort
sc
he
me
s
Sp
ec
ial i
nst
rum
en
ts o
f th
e F
P
Alt
ern
ati
ve
na
tio
na
l fu
nd
ing
an
d
sup
po
rt s
ch
em
es
Ne
ga
tiv
e e
va
lua
tio
n r
esu
lts
Ex
plo
ita
tio
n o
f re
sea
rch
re
sult
s a
nd
IP
R
Inte
rpre
tati
on
of
stra
teg
ic g
oa
ls o
f th
e E
C
Pa
rtn
er
sea
rch
es
Re
po
rtin
g
Co
nso
rtia
ag
ree
me
nts
Wri
tin
g o
f (p
art
s o
f) p
rop
osa
ls
Pro
jec
t m
an
ag
em
en
t
Ge
ne
ral i
nfo
rma
tio
n
Coordinators Non-Coordinators
%-Points
Source: Main online survey, basis: respondents reporting changes in demand, n (coordinators) = 24, n (non-coordinators) = 110; base: user reporting changed needs overall
As concerns the phases of FP projects, need for consulting/advice has decreased in all FP project phases with experience build-up. This concerns in particular the phases after the project has started. Again, the changes are more pronounced with coordinators than with non-coordinators (see Figure 67).

Final Report 161
Figure 67 Change of consultancy needs with time, difference in %-points between those reporting higher and those with lower demand for support in different FP project phases, coordinators vs. non-coordinators
-8
-33
-57 -55 -50
-16 -11 -14 -13
-29
-80
-60
-40
-20
0
20
40
60P
ha
se o
f re
ac
hin
g a
d
ec
isio
n t
o s
ub
mit
a
pro
po
sal o
r n
ot
Ph
ase
of
wri
tin
g a
p
rop
osa
l
Ph
ase
of
co
ntr
ac
t n
eg
oti
ati
on
s
Ph
ase
of
pro
jec
t e
xe
cu
tio
n
Ph
ase
aft
er
the
pro
jec
t h
as
fin
ish
ed
Coordinators Non-Coordinators
%-Points
Source: Main online survey, n (coordinators) = 24, n (non-coordinators) = 110; base = only users reporting changed needs overall
3.2.2 Usage of different types of service providers
After having investigated the support needs of researchers we turn our attention to which types of service providers researchers use once FP- (or EUREKA)-related issues arise. Figure 68 shows the responses with respect to different service providers, broken down by type of organisation. The picture implies a pivotal role of FFG-EIP in this system: 93% of all researchers in non-university R&D institutions, 72% of those in universities and 74% of industry researchers refer to FFG-EIP directly. Of course, a bias may be given through the sampling. This is because INNOMAN data – FFG-EIP‟s CRM system – is used as source for addresses for this survey. However, given (i) the many outreach activities of FFG-EIP and its predecessor BIT in this field over the past years, (ii) that our findings in qualitative interviews are in line with this chart as well, and (iii) that FFG-EIP enters data of FP participants in its system even if no contact exists with the respective persons (i.e. also non-customers of FFG-EIP received our survey and responded to it), we believe this to be a fairly accurate picture.
Internal support structures play a significant role: 55% of researchers in the non-university R&D sector make use of such a structure. The respective usage levels are even more pronounced for the universities, where more than two thirds of the university researchers use their university‟s research management service unit. 39% of university researchers also report to make use of „other internal support structures‟ which indicates that several relevant internal supporting structures can exist within some universities, as we found out in interviews and focus groups. Of course, this picture does not reveal the level of involvement of internal units with the FP or the type of tasks they are overall charged with – a common solution found at universities is that at institute or department level certain persons are specialised in aspects of the FP (or funding issues overall) and support the researchers at that unit with proposal writing, project administration, etc. But it could also be that regular departments (legal departments, accounting department) have developed FP expertise and/or need to be involved anyway when applying for third-party funding. The overall finding is hence that within organisations there are frequently multiple layers of (specialised) support dealing with FP and funding issues, each with a different know-how set on the FP, and each of these levels might draw upon FFG-EIP services.

162 Final Report
Figure 68 Usage of different service providers *)
0
7
8
11
13
22
55
93
8
4
68
18
11
16
39
72
7
5
10
23
24
30
35
74
9
11
18
14
11
26
56
77
0 20 40 60 80 100
No supporting structure used
Other EXTERNAL organisations
Research management units at universities
Private Consultants
EUREKA office
Regional contact points
Other INTERNAL supporting structures
FFG-EIP
Other Industry Universities Non-university R&D institutions
%
*) multiple responses allowed Source: Main online survey, n = 348
The use of private consultants is lower than we had expected before the execution of the survey, based on anecdotal evidence. However, the survey shows that there is a market for private consultants in Austria, and 23% of respondents from companies make use of their (paid) services, followed by no less than 18% of universities and 14% of other organisations. However, as we have already outlined in chapter 3.1 in FFG-EIP‟s work with private consultants, many of these consultants are not so much specialised in FP related services, but make use of FP participation if they consider it beneficial for their client, based on long-standing working relationships in business development. Next to such an integrated approach, also a market for specialised consultancy firms has developed, who base their business models on writing proposals on behalf of researchers, managing projects (and being a project partner for this purpose, or even coordinating FP projects) and obtaining a share of the funding (if the project is accepted) in return. Both types of consultants might themselves use FFG-EIP‟s services before or while they consult their (paying) customers.
Eventually, one should also note that only few actors used no type of support structure (internal or external) at all. For universities, industry participants (here mainly large firms) and „other‟ organisations, 9% and less were „non-users‟. In the group of non-university research institutions, nobody reported to not draw on some form of institutionalised internal/external support (sample size: n=76). The typical picture is hence (i) that researchers make use of support structures for the FP and EUREKA, frequently of different types at the same time, but for different purposes and that (ii) FFG-EIP is a significant actor within this system (we discuss the different functions and roles of the various types of support and implications arising from this division of labour below).

Final Report 163
Performing break-downs of Figure 68 by region (researchers located in Vienna and researchers not located in Vienna) reveals the extent to which Regional Contact Points are drawn upon by non-Viennese organisations. The findings indicate that four out of 10 researchers outside of Vienna make use of the Regional Contact Points (see Figure 69). At the same time, utilisation of FFG-EIP is only lower by 6%-points compared to researchers in Vienna. The main conclusion to draw is that a large share of researchers
in the Austrian provinces uses both the Regional Contact Points and FFG-EIP.141
Figure 69 Usage of different service providers by location of researchers *)
6
5
11
16
30
8,1
47
81
6
7
19
19
29
40
41
75
0 20 40 60 80 100
Other EXTERNAL organisations
No supporting structure used
EUREKA office
Private Consultants
Research management units at universities
Regional contact points
Other INTERNAL supporting structures
FFG-EIP
not located in Vienna located in Vienna
%
*) multiple responses allowed Source: Main online survey, n (Viennese) = 81, n (non-Viennese) = 75
Differences in the usage of service providers exist between experienced users and first-time applicants (see Figure 70). The former tend to draw more on FFG-EIP, „other‟ internal support structures and are – interestingly –by comparison heavier users of support structures overall: While only 2% of experienced users have not used institutionalised support, it is 9% of the first time applicants which have not drawn upon respective offerings and have submitted their proposals without external services. First time applicants are more frequently in touch with Regional Contact Points, draw more often on the research management units at universities and are somewhat more frequently in touch with private consultants. Obviously, the less experienced applicants will first refer to service providers in their immediate vicinity, and – once more fit – use specialist know-how on the FP in FFG-EIP.
141 Interestingly, there is also a share of 8% of Viennese researchers who utilized the Regional Contact Points. This finding may be in parts explained by network effects (personal contacts between researchers) and a margin of error inherent to surveys.

164 Final Report
Figure 70 Usage of different service providers by level of experience *)
69
7
26
16
33
8
42
9
77
16
12
12
19
7
54
2
0 20 40 60 80 100
FFG-EIP
EUREKA office
Regional contact points
Private Consultants
Research management units at universities
Other EXTERNAL organisations
Other INTERNAL supporting structures
No supporting structure used
Experienced applicants First time applicants
%
*) multiple responses allowed Source: Main online survey, n (experienced applicants)=43, n (first time applicants) = 75
In the following, we provide two case studies on universities and how they have been professionalising their research management through the establishment of dedicated organisational contact point (research management units). The two universities are at different levels of development: While one university has implemented a comprehensive support structure which takes on many of the functions of external organisations such as FFG-EIP, the other became an independent university in 2004 and has started to do the same. This latter university draws on variety of external service providers, not only for consulting individual researchers but also for developing its institution and research management. Both case studies not only illustrate how professionalisation and experience can lead to changed consultancy needs (in line with our quantitative findings), they also indicate compelling rationales as to why certain support functions can be handled by the universities themselves. This raises questions as to the work division between internal and external support organisations, whereby ideally external support should support institutional learning. In the long run, a shift of duties – more decentralised support for researchers – seems to be the most sensible set-up.
The first case study examines the University of Innsbruck and its comprehensive support structure:
Box 8 The University of Innsbruck and its „project.service.büro‟
The University of Innsbruck (UIBK) has 15 faculties from a variety of fields (ranging from architecture, theology, technical faculties, mathematics, computer science and physics to humanities). The faculty for medicine was separated from the University of Innsbruck during the reform of the university sector in 2004 to form the dedicated Innsbruck Medical University. In 2009, 25,740 students were enrolled in one of the 101 study courses offered at UIBK. 2,860 scientific (and artistic) staff were employed, of which 167 were professors.
For UIBK, European RTDI programmes are an important source of third party funding. The significance of the European programmes is – according to UIBK representatives – high. The FP acts as an important complementary funding channel to national funding, which is considered too low by the university. The European programmes are said to be “a stroke of luck for Austria” because they are an alternative to national funding and a means to meet foreign competitors at the same level. While securing funding is an important goal, securing the international standing of the university is the primary goal. Internationalisation (and collaboration) as such is not a primary goal in this context, but rather a “derivative from the other more important goals [achieving excellence in research,

Final Report 165
obtaining sufficient research funding, and being on par at the international level with foreign competitors, ed.]”.
European programmes account for about half of third party funding at UIBK. The most important European programme – especially in terms of funding volume – is the Framework Programme (FP7). Other programmes of less relevance but still used comprise COST or the offerings of the European Science Foundation (ESF). Up to November 2009, UIBK took part in more than 30 projects in FP7 and ranked fifth among Austrian organisations participating in FP7 with respect to this indicator (PROVISO report 11/2009).
UIBK caters for third party funding in their internal incentive systems for researchers. Such incentive systems are negotiated and implemented at faculty level and on a voluntary basis. Not all faculties have yet implemented such systems, but where they have been, preference is given to sources of third party funding based on independent evaluation. This is considered part of quality assurance for research activities. Despite the significance of the FP7, it is viewed only as one possible source of (third party) funding of research activities. The heterogeneity of the faculties also entail that some faculties find it easier to participate in FP7 than others.
In order to support researchers, UIBK has established an internal research service and management unit called „projekt.service.büro‟ (project service office). Reporting to the vice-rector for research, the main goals of this office are to relieve researchers from administrative burdens and to make sure “[...] that nothing goes wrong”. The unit supports researchers at UIBK with developing project concepts, selecting the right type of funding programme, the writing and submission of proposals, contract negotiations, IPR issues and it also helps out during the project implementation and administration phases. The office started in 2000 with a staff of two persons and now counts 12 employees (nine FTEs). To summarise, the office is in several aspects a „one-stop-shop‟, employing people with legal, IPR background (hence also fulfilling in part the function of a technology transfer office; part of this is also handled by the UIBK owned transfer company “transidee”, which acts as go-between between university research and regional companies) and specialists for funding programmes, especially FP7. The research management unit has been developed and designed from scratch without significant outside support, as UIBK found it difficult to identify a role model suitable for its purposes. The current staffing levels are considered sufficient, with another two employees it would be at an „optimum level‟. A key milestone was the establishment of a project database covering the whole of UIBK which lists all university research participations and acts also as a management tool for administrating running projects (e.g. sending out reminders, etc.).
The fundamental idea behind establishing a strong research service and management unit at the university is to fully realise benefits arising from the proximity to the researchers. In fact, having offerings tailored to the needs of the individual researchers is seen as prime success factor for research proposals in the FP7, together with the possibility to steer and strategically define the activities at university level. Against this backdrop, UIBK finds it important – for a university of its size – that the university is able to handle all types of support activities related to the preparation of proposals itself. External support is consequently needed more at the level of representing and safeguarding Austria's interests as a whole (e.g. an information channel function to/from Brussels), and less with regard to consultancy at the individual researcher's level.
The second case study looks at the Innsbruck Medical University and its development of a research management unit:
Box 9 Professionalising research management – Innsbruck Medical University
Innsbruck Medical University (I-MED) is the successor of the medical faculty of the University of Innsbruck. It became a university of its own after the university reform in 2002. The university has a staff complement of 1,700, of which 1,200 are scientific personnel. Around 3,500 students are currently enrolled in one of the three study programmes IMU is offering (human medicine, dentistry, PhD programme in the medical sciences).
I-MED´s exposure to European programmes i sprimarily related to FP7, and herein the „traditional‟ collaborative projects, especially within the HEALTH scheme. However, for the university other programmes are also interesting. In particular the PEOPLE scheme within FP7, the IMI initiative, ESF programmes or COST. According to I-MED officials, researcher feedback on and take-up of the latter programmes seems to be improvable. I-MED officials attribute the reluctance to participate to two factors: i) as with many universities, some type of general reluctance to obtain third party funding because of administrative burdens anticipated and ii) the fact that many researchers are not adequately informed about the characteristics and possibilities of these programmes.
In this context, I-MED officials mentioned also existing untapped potential regarding the FP7 „traditional‟ collaboration programmes. Notwithstanding this general call for high take-up of European initiatives, I-MED also points to researchers at the university who are enthusiastic about the EU and the research programmes. An official summarised the situation with the words: “There are fans of the EU, and there are those who want to become fans”. As per November 2009, I-MED participated in 17 projects in FP7 (Source: PROVISO 11/2009).

166 Final Report
The relatively young age of I-MED is also considered an explanatory factor for yet still to be identified and activated potential for using European programmes. A vice rectorate for research was established in 2009, and an internal research management unit („Servicenter Forschung‟) - now subordinated to the vice-rectorate - set up in 2008. The rationale for establishing a research management unit is seen against the backdrop of decreasing funding available from the FWF, and hence a necessity to draw more on third party/EU funding. The research management unit is tasked with providing information and advice on third party funding (primarily EU funds, FP7), improving the administration of third party funds as well as with the administration of internal support programmes. The unit is currently intensifying measures to motivate researchers to participate in European RTDI schemes.
For topics related to IPR and technology transfer, researchers are signposted to the external organisation CAST Tyrol (Centre for Academic Spin Offs Tyrol).
The unit currently has a staff of three: One administrative staff, two staff with an academic background and the manager of the unit (who, however, also has other duties).
The research management unit and the individual researchers at I-MED seem to draw on a variety of external service providers for the delivery of the services. There is a strong cooperation with the regional contact point in Tyrol , the BEP (Bureau for European programmes). The expertise present in one person at BEP in the medical field is particularly valued for new information on European programmes (often disseminated in an open day on European programmes („Europasprechtage‟) and for executing proposal checks. Collaboration with FFG-EIP is sought for a variety of reasons: First, for the delivery of general news on the FP. Secondly – and also more importantly – for know-how transfer from FFG-EIP to the university on how to support researchers best. For the latter purpose, staff from the research management unit is sent to Vienna to attend the FFG academy, and the service offering of having FFG-EIP staff visiting the premises of I-MED in the course of the FFG-EIP is also highly welcome. A strategy talk held with FFG-EIP was considered highly beneficial. Further to BEP and FFG-EIP, I-MED also collaborates with two private consultants: CEMIT and ADT Consulting support I-MED in two matters: project management and the actual writing of proposals. According to I-MED, all coordinator projects of I-MED are serviced by CEMIT.
A lot of emphasis of the research management unit, given its young age, is focussed on learning. The aim is to develop into a „department for research‟. In the medium-term, the unit seeks to take over the project management activities currently outsourced to the private consultants.

Final Report 167
3.3 The supply side – a closer look at FFG–EIP
This chapter is dedicated to FFG-EIP. We start with a portrait of FFG-EIP, describing tasks assigned, sources of funding, organisation and staff, activities and self-image. In a second step we provide an in-depth analysis and assessment of FFG-EIP‟s main activities, based on the results of interviews, focus groups and the online surveys.
3.3.1 Main features and characteristics of FFG-EIP
3.3.1.1 Tasks, governance and funding
The core task of EIP is to promote international research co-operation through the provision of information, awareness-raising activities and the provision of support for Austrian researchers in universities, research institutes and companies. FFG-EIP inherited this function from the former Bureau for International Research and Technology Co-Operation (BIT). BIT was an independent organisation before it was merged with other research-supporting organisations to form the Austrian Research Promotion Agency FFG in 2004.
Despite now being a department within this agency, the main assignment has stayed the same: providing information and support to all Austrian parties with an interest in the EU Framework Programme for Research and Technological Development and EUREKA. The supporting activities related to FP7 are funded and governed through the EIP-FP7 commissioning contract with a consortium of Federal ministries and the Austrian Federal Chamber of Commerce for the duration of FP7 (i.e. for 7 years, from 2007 to 2013). The consortium of ministries is led and coordinated by BMWF. The other funding ministries are BMVIT, BMWFJ; BMLFUW and BMG. Unlike the other departments of FFG, EIP is governed by a separate steering committee comprising representatives of these funding ministries and the Federal Ministry of Finance. The steering committee approves the annual planning and receives the related reports.
The total funding volume of this contract amounts to a maximum of €25,450,100 for the full running time of seven years. Of this, €14,525,772 is earmarked for the first four years of FP7. The funding volume of €25,450,100 is governed by the EIP-FP7 commissioning contract and corresponds to around 80% of the budget available to the EIP department of FFG.
Figure 71 shows the funding shares of all involved Federal ministries and the Austrian Federal Chamber of Commerce as indicated in the FFG-EIP commissioning contract. The three ministries in charge of the largest research related portfolios also account for the largest share of funding (27.1%, respectively). The two sector ministries are involved due to their responsibility for the related thematic priorities in FP7. The share of the Austrian Federal Chamber of Commerce covers also the chamber‟s funding of information, consulting and advisory services for EUREKA. According to the contract, the Chamber– in addition to supplying monetary funds –also lends personnel on a temporary basis.
The EIP-FP7 commissioning contract covers a variety of tasks, such as:
The provision of general information, consulting and support services to all Austrian researchers and to intermediaries on all aspects of FP7 and throughout the entire lifetime of projects and their generation
Quality assurance for other Austrian service providers in the field of FP support, i.e. the Regional Contact Points (RKS), universities, other stakeholders
The provision of specific support services for selected target groups, such as newcomers, experienced participants the Framework Programmes, individual researchers, intermediaries, project co-ordinators or SME)
Information and advice as regards legal and financial affairs during all phases of project preparation, implementation and closing

168 Final Report
Main responsibility and co-ordination of SME-related measures in FP7
Services related to Technology Platforms and Joint Technology Initiatives (JTI)
Implementation of measures related to networking activities (such as ERA-Net, ERA-Net+, Article 169/185)
Partner search support (incoming and outgoing)
Close co-operation and co-ordination with the Austrian FP7 Programme Delegates
Co-operation and co-ordination with FWF related to the support of Austrian applicants for ERC funding.
In addition, EIP has been commissioned by Austrian Federal Ministries with other (partly temporary) tasks related to FP7, EUREKA, and the Competitiveness and Innovation Framework Programme (CIP). Moreover, EIP as the Austrian National Contact Point for FP7 routinely participates in international NCP projects funded by the European Commission.
Figure 71 Shares of funding of FFG-EIP for main FP7 support activities according to funding sources, 2007 to 2013
27,1%
27,1%
27,1%
0,7%
2,1%15,9%
BMWF
BMWFJ
BMVIT
BMG
BMLFUW
WKÖ
Source: EIP-FP7 commissioning contract
Next to the EIP-FP7 commissioning contract, the following other contracts between FFG-EIP and the Federal Ministries are noteworthy:
Commissioning contract for the Austrian Support Structures for FP7: This contract has been signed with the Austrian Ministry of Science and Research. It tasks FFG-EIP with the implementation of a Austrian Support Structure with clear responsibilities and complementary character. More specifically, the contract requires FFG-EIP to exercise thematic supervision of the activities of the regional contact points (RKS), to align the activities of these regional centres with those of FFG-EIP, to provide trainings to them and to other partner organisations, to enhance collaboration with the PROVISO participation data analysis service and – ultimately – to ensure the quality of supporting activities provided by the stated service providers. The aim of this assignment is to increase overall service quality and efficiency by overcoming the shortcomings identified in previous evaluations, especially the lack of co-operation among the different service providers. Other shortcomings tackled the different levels of qualification and service quality, and the lack in efficiency (see also chapter 3.1 on the Austrian Support Structures). The main part of this project –pertaining to the quality of service delivery by the RKS and the collaboration with FFG-EIP – was positively evaluated in 2008. The contract has an overall volume of €600,000 for the running time of 2007 to 2010.

Final Report 169
Proposal grant for science: FFG has been tasked by BMWF and BMVIT to manage the science track of the proposal grants (“Anbahnungsfinanzierung Wissenschaft”) on behalf of these two ministries. These subsidies are to support scientists who wish to write a proposal in FP7. This administrative and management task is a novelty for FFG-EIP, as before FP7, the ministries managed the funds themselves (see also chapter 3.3.2.5). The corresponding contract has a total volume of
€779,520 for the 7-year period of 2010 to 2013142.
Contracts related to EUREKA: Besides providing support for FP7, FFG-EIP is also responsible for supporting applicants in the EUREKA, covering all initiatives under the scope of EUREKA, such as EUROSTARS, EUREKA-Clusters, EUREKA-Umbrellas, etc. A special unit within FFG-EIP – the EUREKA office – has been set up for that purpose. For the period of 2007 to 2008, the respective activities were jointly funded by BMVIT and BMWFJ with a total volume for the core supportive activities of €171,000 each for 2007 and 2008. In addition, €35,000 were supplied by BMWFJ for selected EUREKA-Clusters and EUREKA-Umbrella projects as well as EUROSTARS. In 2007, special activities (such as review activities) were funded by BMWFJ with €30,000. From 2009 on, EUREKA support has been integrated into the overall framework contract between FFG and BMVIT and BMWFJ. There is hence not a separate commissioning contract for EUREKA any more, and the budget is agreed upon in the annual planning. The respective figures show that for 2009 BMWFJ and BMVIT agreed to supply €221,017, while for 2010 the budget was set to €279,798. The spike of the budget for 2010 was due to special activities to be organised in the course of the 25-year anniversary of EUREKA. Budgets for the periods after 2010 are still to be decided.
Contract related to the Framework Programme for Competitiveness and Innovation (CIP): Another programme for which FFG-EIP is to offer consulting and advisory services is the Framework Programme for Competitiveness and Innovation (CIP). More precisely, FFG-EIP‟s services extend to two of the three pillars of the CIP programme: the Entrepreneurship and Innovation Programme and the ICT-PSP programme. The third pillar, Intelligent Energy Europe, is supported by the Austrian Energy Agency. The total volume of the contract for FFG-EIP is €807,603 for the period of April 1, 2008 to December 31, 2010.
Contract related to the European Institute for Technology (EIT): FFG-EIP is also tasked by BMWFJ to offer support for Austrian participation in the European Institute for Technology (EIT). There are two commissioning contracts for this purpose: First, the original commissioning contract with a running time from September, 2008 to December, 2010. This contract specifies a total budget of €260,554 with the possibility to call on additional funds covering travel expenses with up to €76,000. Secondly, there is an extension of the original contract which offers additional €21,000 for activities in 2011 and 2012 that aim to increase Austrian participation in the EIT.
For each of these (and further smaller) contracts, separate planning and reporting systems have been established, for example:
For the overall EIP-FP7 services contract EIP submits annual plans and activity reports both on the level of the department and the individual units; all documents use the same basic structure throughout the years; the four main areas cover (i) the general services for FP7, (ii) the specific services for FP7, (iii) national and international networking activities, and (iv) other European programmes covered by EIP (i.e. CIP); for each of these areas, tasks and objectives are defined or reported on. EIP‟s reports also contain statistical overviews of customers,
142 This amount covers only the costs for administration of the funds and not the funding available for the grants themselves.

170 Final Report
information events, individual consulting, and selected other activities (e.g. strategy talks). In the documents at unit level, each unit of EIP uses the same structure for their activities.
NCP projects all follow their own timeline of activities and reporting. As in terms of content, NCP projects are a part of the general FP7 activities, FFG-EIP as a whole and each unit covers them in their plans and reports in the context of the overall EIP-FP7 contract.
For the commissioning contract related to the Austrian Support Structure, FFG-EIP has to submit annual plans and reports to the BMWF.
For the proposal grants for science the reports describe the work done for the implementation of the programme and also the outputs in terms of projects funded plus some statistical analysis (e.g. regional and thematic spread, staff distribution by gender etc.). EIP reports separately to BMWF and BMVIT, the two contracting ministries.
EUREKA reports and planning documents have their own scope and structure and differ somewhat from the system used for the two main RP related contracts.
3.3.1.2 Organisation and staff
An important input measure to examine is that of human resources employed. In 2007, the FFG-EIP employed 49 persons which corresponded to 44.23 full-time equivalents (FTEs). By 2010, the number of staff has grown to 56 persons or 46.18 FTEs. This means, the number of employees has grown by around 14% from 2007 to 2010 and the number of FTEs by around 4.4% during the same time frame.
Staff turnover is, as corroborated in several expert interviews, low, especially if compared to pre-FP7 and earlier BIT times. The reports of FFG-EIP document that around 80% of staff employed in 2007 by FFG-EIP are still working in the department in 2010. In fact, many of the staff have already worked at BIT in earlier times. This result has to be assessed positively, as low turnover means that knowledge can be accumulated and long-term relationships are established between individual EIP employees and key users.
Approximately two thirds of the staff is female. This share has remained more or less constant during the evaluation period. The share of women is particularly high among experts and assistants, among heads of unit the situation is balance, and the department is lead by two women (head of department and her deputy).
Figure 72 shows a break-down of staff numbers in FTE according to the different commissioning contracts. As can be expected, the distribution of staff numbers according to commissioning contract correlates to the different magnitudes of the contracts. Being the largest contract, the EIP-FP7 service contract provides funding for on average 29.30 FTEs each year or around two thirds of all FTEs. All other commissioning contracts are much smaller in scope. Among these smaller sources of funding, in 2010 NCP projects finance 5.51 FTEs and the CIP programme finances 5.07 FTEs. For EUREKA, the number of staff amounts to 2.88 FTEs. The commissioning contract for proposal subsidies accounts for 1.34 FTEs in 2010, and for the contract governing the Austrian Support Structures 1.20 FTEs have been earmarked in 2010. The commissioning contract for the European Institute of Technology funds 0.55 FTEs in 2010.
Taken together, 45.31 FTEs are funded by the depicted sources and commissioning contracts in 2010. The discrepancy to the figure quoted above (46.18 FTEs) is due to peculiarities of the accounting system utilised within FFG. In this accounting system, every employee is assigned to one single department, while their activities are assigned to commissioning contracts. Hence, as EIP staff works for other departments (e.g. for the „Thematic Programmes‟) to a small extent, the number of FTEs according to the

Final Report 171
organigram is slightly larger than the number of FTEs funded through the contracts listed. The difference is funded through the contracts ruling the respective activities.
Figure 72 Staff working at FFG-EIP according to main commissioning contracts
Contract 2007 [FTE] 2008 [FTE] 2009 [FTE] 2010 [FTE]
EIP-FP7 commissioning contract 29.46 29.21 29.79 28.72
Commissioning contract for Austrian Support Structures for FP7
1.20 1.26 1.04 1.20
EU initiatives FP6 4.34 2.76 0.52 0.04
NCP projects 0.00 2.92 3.92 5.51
Proposal grant for science (BMWF) 1.06 1.24 1.17 1.16
Proposal grant for science (BMVIT) 0.17 0.18
Commissioning contracts EUREKA 2.06 1.97 2.62 2.88
Commissioning contract CIP 4.40 4.20 5.13 5.07
Commissioning contract EIT 0.99 0.55
TOTAL 42.52 43.56 45.35 45.31
Source: Compilation from different commissioning contracts and planning documents
3.3.1.3 Mission, objective, activities – a Logic Chart of FFG-EIP
In this chapter, we describe FFG-EIP‟s mission, objectives and activities based on a Logic Chart (LC) which we developed on the basis of a LC workshop with FFG-EIP, interview statements and information retrieved from documents supplied to us. A logic chart should ideally be able to depict a policy intervention – be it a support programme, a policy or an institution – completely in one single graphical illustration on a single page. In this illustration, all levels from overall goals, to sub-goals, used instruments, activities, outputs, outcomes and impacts are logically linked with each other in the sense that the content of one level leads (or is predated) to the respective entry in the next level in a coherent manner.
The logic chart for FFG-EIP falls short of describing all the instruments and activities of FFG-EIP on one single page due to their broad range and diversification. However, this in itself should not be considered a negative result as the breakdown of the chart on three pages provides a detailed overview of all FFG-EIP‟s activities and thus serves the purpose of a logic chart very well. We believe that splitting the chart into distinctive components is of more value to the reader than cutting on the information content in order to fit the graph on one page.
Figure 73 describes the upper part of the logic chart detailing the mission statement and the main objectives that need to be addressed in order to accomplish the mission. A mission statement should be very concise and summarise the overall goal of the institution in one or two single sentences. The mission statement developed for FFG-EIP reads as follows:
“As a competence and service centre and as National Contact Point (NCP) for European and International Programmes, EIP enhances the position of Austrian actors in the European Research Area (ERA) in a sustainable manner. Successful Austrian participation in transnational collaborative programmes is a central goal, and EIP contributes substantially to its achievement through offering a broad range of customer-oriented services.”

172 Final Report
Against the backdrop of this mission, which highlights EIP‟s self definition as service and competence centre for Austrian actors in the RTDI system, three objectives were defined:
Objective 1: High, successful and sustainable participation of Austrian organisations in European and international programmes
Objective 2: Improvement of competence and expertise in the ERA and active provision of input to the ERA
Objective 3: Improvement and maintenance of a high-quality service standard
The first objective pertains to the main and also traditional function of FFG-EIP of providing information and support to researchers in various organisations. The second goal pertains mainly to relatively new types of activities which could be considered to a degree strategic in nature, and also capacity and know-how building. Their main target groups can be found within FFG (staff and units tasked with developing strategies) as well as among policy stakeholders. The third goal is very much inward- and process oriented and has a horizontal support function for the other two objectives. However, FFG-EIP decided to define a separate goal for such activities in order to underline the significance and scope of the respective actions taken.
Figure 73 FFG-EIP‟s mission and objectives
Mission
As a competence and service centre and as National Contact Point (NCP) for European and International Programmes, EIP enhances the position of Austrian actors in the European
Research Area (ERA) in a sustainable manner. Successful Austrian participation in transnational collaborative programmes is a central goal, and EIP contributes substantially to
its achievement through offering a broad range of customer-oriented services.
Objective 1
High, successful and sustainable participation of Austrian organisations
in European and international programmes
Objective 2
Improvement of competence and expertise
in the ERA and active provision of input to the
ERA
Objective 3
Improvement and maintenance of a high-quality service standard
Source: Technopolis
Under all objectives, FFG-EIP has specified the instruments it applies and the related activities it has developed and implemented. In the following, we will describe the each of the objectives and related activities in greater detail.
Objective 1: High, successful and sustainable participation of Austrian organisations in European and international programmes
High, successful and sustainable participation of Austrian organisations in European and international programmes can be regarded as the (traditional) core objective of FFG-EIP. This goal pertains to the servicing of (potential) applicants to international and European programmes.
In order to achieve this goal, FFG-EIP employs five different instruments (Figure 74).

Final Report 173
Awareness raising
In the scope of awareness raising, FFG-EIP publishes information in order to reach out to potential applicants:
Own publications include folders, information leaflets, the presentation of success stories on projects and organisations which illustrate how successful projects can lead to benefits, and a dedicated newsletter for the EUREKA programme. These pieces of information are available in printed form.
FFG-EIP also collaborates with external media, especially for the ICT-related programmes. On a regular basis, FFG-EIP staff writes articles for professional ICT journals and newspapers.
Information is also distributed through electronic mailings. Several electronic newsletters exist: FFG-EIP contributes to the FFG newsletter (the newsletter of the whole Austrian Research Promotion Agency) and it issues EIP-specific mailings addressing selected target groups directly. Moreover, newsletters on legal and financial affairs as well as programme-specific newsletters are published.
For an assessment on FFG-EIP‟s activities for awareness raising see chapter 3.3.2.1. In addition to publications, events and web-services often have an awareness raising function, too. They are described under the headline of consulting.
Consulting, advice and direct support
Consulting, advice and direct support of Austrian applicants in international and European programmes is perhaps the most important core activity of FFG-EIP and it is primarily delivered through information events, direct advice to applicants and web services. Events and web services also serve the awareness raising activities to some (various) degrees. These are FFG-EIP‟s consulting activities in more detail:
FFG-EIP organises different types of information events: events related to calls where information on the particulars of certain calls are provided, workshops on specific topics, such as proposal writing, reporting or accounting, and events organised in the course of the FFG Academy.
Applicants have access to support and consulting services with FFG-EIP staff on a 1:1 basis during all project phases. For internal monitoring purposes, FFG-EIP classifies these activities into short advisory sessions lasting less than 15 minutes and long advisory sessions with a duration of more than 15 minutes. The distinction between long and short advisory sessions is not visible for applicants. As one special service, applicants can have their proposals reviewed by FFG-EIP in the course of a so-called „proposal check‟ (see also chapter 3.3.2.4).
Web services such as the website of FFG-EIP on FP7 and the so-called competence catalogue database(s) have a supportive function and therefore they are listed under the instrument consulting, although they also have a strong awareness raising function. Competence catalogue databases are directories of Austrian firms, research institutions and other types of organisations who would in principle be available as partners for international research projects. These organisations have the opportunity to present their core competences in the databases. The FFG website currently provides access to four competence catalogues: the Austrian Life Sciences Directory, the Food Company Directory,
ICTprofiles.at and the database ECO Research Austria.143
FFG-EIP provides partner search services to organisations that need additional partners for their international R&D projects. These services are closely linked to
143 http://rp7.ffg.at/partnersuche_kataloge, as of September 13, 2010

174 Final Report
the competence catalogues, which are, as they are directly accessible and usable by applicants over the web, listed under the web services (see previous paragraph).
Support is provided regarding the mobility of researchers: FFG, together with OeAD (the Austrian Agency for International Mobility and Cooperation in Education, Science and Research), supports the EURAXXESS database which offers information for ingoing and outgoing researchers on jobs, social security, legal provisions, etc.
We provide an assessment of most of FFG-EIP‟s consulting and advisory activities in chapter 3.3.2.3., with a closer look at the proposal checks in chapter 3.3.2.4; events are assessed in chapter 3.3.2.2.
Strategic activities tailored to specific target groups
Target group-tailored strategic activities are a relatively new among FFG-EIP‟s activities. Their aim is to identify, motivate and support yet untapped Austrian research potentials to participate in the FP through the provision of services tightly tailored to the needs of key players in the Austrian RTDI system. This aim makes it necessary to gather intelligence on such key players beforehand in order to understand their motivations as regards, for example, usage or non-usage of international programmes. FFG-EIP singles out such key players or key player groups by analysing participation data for international and national programmes.
These are the main activities following such analysis:
Strategy talks with leading Austrian firms, universities and research organisations aim “[...] to enhance the concrete strategic orientation of the respective organisations, in accordance with their own goals and aims, with respect to their participation in international R&D programmes and their positioning in the
European Research Area (ERA)”144. In these talks, director-level staff of FFG-EIP and the respective organisations discuss the strategic approaches of the organisations towards European research programmes, strategies as regards participation in FP7 and other European programmes and specific support needs to be provided by FFG-EIP.
Key-Player concepts are similar to the strategy talks in that they also aim to be more tailored services for promising target groups. While strategy talks focus on single organisations, the key player concepts address groups of relevant actors with similar characteristics, and the concepts are developed by the individual units within FFG-EIP.
Workshops for specific target groups / organisations: based on the interaction with a specific target group or organisation, FFG-EIP tailors workshops and training to their needs; such workshops are often organised as a follow-up to a strategy talk.
A different activity to address new untapped research potential in Austria is the honouring of successful Austrian coordinators of FG projects in the course of the event „Austrian Champions for European Research‟. The rationale behind this activity can be seen in increasing visibility of successful coordinators, who can serve as role models for other researchers, and in providing additional motivation for the „champions‟.
EU Networking extends the targeted activities to the international level and it refers to a concept whereby FFG-EIP intends to analyse and optimise how it is going to collaborate with various networks at EU level. For this purpose, FFG-EIP foresees a five-step process: Identification of relevant EU networks, identification
144 FFG-EIP memo report 01

Final Report 175
of Austrian actors in these networks, generating network-specific measures and, eventually, executing them. The intention is, however, not to increase participation of Austrian experts in these networks per se. The respective concept note available to Technopolis reflects the state of play of the activities as of January 2009, where first networks have been identified and proposals for activities and a future time plan are put out to discussion.
For an assessment of some selected strategic and target-group oriented activities see chapter 3.3.2.6. However, target-group orientation is not restricted to the activities listed here but is reflected also in other services, e.g. the FFG Academy.
Monetary funds – proposal grants
The fourth instrument at FFG-EIP‟s disposal for achieving high, successful and sustainable participation of Austrian organisations in European and international R&D programmes are proposal grants (“Anbahnungsfinanzierung”). There are two types of proposal grants: A proposal grant for science and a proposal grant for industry. Both grants support activities for the preparation of proposals in FP7. The proposal grant for science also provides the option of funding the preparation of project contracts. While the two grant schemes share similar goals, they have different target groups and differ slightly in terms of eligibility of costs, funding intensity, types of projects within FP7 addressed and the assessment criteria. A more detailed description and analysis of the proposal grant schemes is provided in chapter 3.3.2.5.
National networking
The fifth instrument for achieving objective 1 refers to national networking. The overall expected outcome of this instrument is a well adjusted, aligned and complementary network of supporting structures, based on common and high quality service standards and achieved through close collaboration with key actors. Four sets of activities are distinguishable.
Expertise pools and expert commissions act as national expert groups in the various programmes and thematic fields.
Programme committees are established at EU-level and are comprised of the national Programme Delegates for FP7. These committees draft the work programmes for FP7. FFG-EIP supports the activities of the Austrian Programme Delegates, and NCPs also accompany the Delegates to committee meetings in their role as experts.
The commissioning contract for the Austrian Support Structures for FP7 tasks FFG-EIP with the coordination of the Austrian network of support structures and quality assurance of the services delivered by the network partners. In particular, the services of Regional Contact Points and those of FFG-EIP are to be aligned.
Special collaboration patterns and agreements exist between FFG-EIP and a number of key stakeholders in the Austrian research and innovation system. A particular case in point is the Austrian Science Fund (FWF) with which FFG-EIP has signed a dedicated cooperation agreement. Under this agreement, FFG-EIP and FWF agree to collaborate especially with respect to the FP7 specific programme Ideas (ERC). For reaching out and involving regional multipliers (technology centres, clusters, etc.), FFG-EIP cooperates closely with the Regional Contact Points.
We discuss the interaction of FFG-EIP with the other stakeholders in the Austrian support network in chapter 3.1.

176 Final Report
Figure 74 Logic Chart for Objective 1
Customer satisfaction: above average according to school marks
Objective 1:High, successful and sustainable participation of Austrian organisations in European and international programmes
Cooperation with media
Strategy talksEvents Pools of expertise &
expert commissions
Folders
Eureka-Newsletter
Success Stories
Information leaflets
Articles in professional
journals / newspapers
(ICT mainly)
INNOmanmailings
FFG-Newsletter
Competence catalogue databases
Webpage
Honouring of coordinators
Inst
rum
en
tsO
bje
ctiv
eO
utp
uts
Act
ivit
ies
Imp
act
sO
utc
om
es
Awareness raising Consulting – Advice to and support for applicants Target-group oriented strategic
activities
Monetary support
National networking
Programme Committees
Services for applicants
FFG-Academy
Proposal grants science
Proposal grants
industry
National support
structure
EU-Networking
Key-player concepts
Cooperation (FWF etc)
Informed customers
Lower entrance barrier
Call specific events
Workshops• Proposal
Writing• Reporting• Accounting
Consulting in all stages of projects
Partner search
Electronic mailings
Own publications
Web-Services
By target groups, number, type, delivery channels
Articles published
Mailings sentPublications produced
Up-to-date, user-friendly
website
Proposals / grants
handled (by number,
type, time to contract)
Partner searches made
/ consulting sessions held
Events organised (by number, type,
number of participants)
Reach 60% of participants and 90% of Coord.
High, successful and sustainable participation of EIP customers in the programmes serviced
Above average
success rate
Activities implemented (by number, type, result)
Visibility
Motivation
Strategy based
participation
New target groups
High quality services
Complementary national
service network
Newsletter legal &
financial affairs
Progr. specific newsletters
Workshops for specific target
groups / organisations
EURAXESS services
Above average success rate of
projects consulted
Source: Technopolis

Final Report 177
Objective 2: Improvement of competence and expertise in the ERA and active provision of input to the ERA
EIP‟s second objective relates to capacity and know-how building and to generating input for the European Research Area (ERA). The main expected impact is an increase of visibility of Austrian expert know-how in the ERA (see Figure 75). EIP distinguishes four instruments which are to contribute to the accomplishment of this objective:
Interaction between national and international programmes
This instrument comprises, on the one hand, intelligence gathering activities on how and why Austrian RTDI actors choose between various national and international funding activities. On the other hand, the supportive function FFG-EIP is tasked with for certain special funding instruments which require the combined application of national and/or international funding measures means that FFG-EIP needs to be already able to exercise and manage several funding instruments at national and international level in a pooled manner. Cases in point are ERA-Net, Joint Technology Initiatives (JTIs) or the Eurostars programme.
The intelligence gathering activities for analysing usage patterns of national and international programmes in the depicted form have their roots in efforts to merge two main customer databases of the Austrian Research Promotion Agency: the FFF-2004 database, which stores participation data on national FFG programmes and the INNOman CRM system of FFG-EIP. The fact that two distinctive databases are in use has historical roots: both systems were developed and used by the formerly independent institutions now united within FFG. The merging efforts have resulted in first analysis of the use patterns of national and international programme in the fields of nanotechnologies, materials and production (NMP), later also in the thematic fields „security‟ and „energy‟. Recently, FFG-EIP has created an overall comparative analysis of participation in national programmes and international programmes. However, validity checks of the conclusions and methodology are still underway. Therefore this analysis was, at the time of report submission, for internal purposes only.
Representation at international level
The second instrument is being represented in international committees and bodies. The most outstanding such fora are for FP7 the NCP activities as well as participation in and support of the Programme Delegates in programme committees. Similarly, fora for EUREKA comprise the actions of the National Project Coordinators (NPC) and providing input in the EUREKA High Level Group. These activities are to lead to an active influence on the design of programmes, to knowledge transfer to the Austrian RTDI system and to a more effective lobbying of Austrian interests in Europe.
Active provision of input to the EU
Activities under the third instrument comprise the drafting of position papers and opinion pieces or input at programme level (e.g. in NCP meetings). This instrument closely interacts with the representativeness activities described above. Perhaps most interesting to mention are the two activities listed separately: in August 2009, FFG-EIP submitted a 6-page position paper on possibilities for simplification of FP7 to the European Commission, in the course of the Commission‟s online call for suggestions. And FFG-EIP ran – together with the Swiss support structure EUResearch, the Istanbul Technical University and Hungarian science policy advisor – the campaign „Trust Researchers‟, which also calls for simplification of European research programmes, basically by asking the authorities to trust researchers more. Around
13,700 researchers in Europe have signed this declaration by September 2010145.
145 Source: http://www.trust-researchers.eu, September 14, 2010

178 Final Report
EU Initiatives
The fourth instrument refers to so-called EU initiatives, comprising two main lines of activity: NCP projects and strategic networking in selected fields or with selected regions, i.e. the U.S. and Russia. In many EU initiatives, FFG-EIP is itself in the role of a beneficiary of FP funded projects. By running their own projects, NCPs get to know better how it feels to run FP projects. There is also a thematic aspect: NCPs increase their qualification due to the incorporation of project results into day-to-day work. Therefore, NCP projects have also been listed under objective 3 (see next section). Participation in EU initiatives is also said to pave the ground for new or further internationalisation activities. By the end of July 2010, FFG-EIP was involved in 21 on-going NCP projects. We further describe and analyse the EU initiatives in chapter 3.3.2.7.

Final Report 179
Figure 75 Logic Cart for Objective 2
Objective 2:Improvement of competence and expertise in the ERA and active provision of input to the ERA
Interaction between national & international programmes
Representation at international level
Active provision of input to the EU EU Initiatives
Inst
rum
ents
Ob
ject
ive
Ou
tpu
tsA
ctiv
itie
sIm
pac
tsO
utc
om
es
Analyses ERA initiatives• ERA-NET• JTI• Eurostars• AAL
FP: NCP activities
FP: Programme committees
(expert level)
(Contributions to) Statements, position papers,
expert groups
Initiatives:• Consultation
Simplification• „Trust
Researchers“E!: NPC activities
E!: High Level Group
Visibility and perception of Austrian expertise in the ERA
Stronger Cooperation with attractive
regions (for projects with USA, RUS)
Defined project by project
Results for• NMP• Security• Energy• (others)
Understanding of customers, usage patterns usage, reaching of target groups input to
programme design
More coherence between programmes
FFG strengthened as an agency for ERA initiatives
„critical mass“ for certain topics
Experiences about the interaction between nat. & internat. programmes
Participations realised (by type, number, content)
Papers and contributions made (by number, type, content)
Co-design of programmes Committees / panel in charge deal with the contributions
Transfer of knowledge to Austria
Lobbying
Actual participation in committees (by number, type, content)
Simplified procedures
Implementation of proposals made Strengthened strategic research
cooperation in priority areas
Input at programme level (e.g. in
NCP meetings)
Strategic participation• USA (coord. by EIP)• Russia• FET-Flagship
NCP projects ( see
Objective 3)
Contribution to EU-Policy (for FET-
Flagship)
Source: Technopolis

180 Final Report
Objective 3: Improvement and maintenance of a high-quality service standard
For FFG-EIP this objective has, as stated above, a horizontally enabling and supportive function. Some instruments listed under objective 3 have also been named for other goals because they serve both objectives. The overall outcome of these activities is for FFG-EIP to professionalise and improve the services provided by all partners within the Austrian support structure towards higher customer orientation and practical relevance. In practical terms, the activities under objective 3 have shaped the instruments and activities under the other two objectives as FFG-EIP has used them in order to do both, to improve existing services and to design and implement new tools.
The following instruments are used (see Figure 76):
NCP projects, as described for goal 2 above under the headline of EU initiatives, serve also for qualification, capacity building and learning.
Customers are regularly surveyed on their satisfaction. For events, feedback forms are collected; as the forms are standardised, FFG-EIP also assesses overall performance in this regard by aggregating the feedback from different surveys.
The introduction of process management as a management instrument is something new for FFG-EIP and for the FFG as a whole. It can be regarded as an attempt to strengthen synergies among the various departments of the FFG by identifying common processes.
Checklists are used for advisory sessions in order to secure a minimum standard of the service.
Analyses are carried out in order to assess the performance of applicants. Several such analyses are conducted regularly and respective statistics computed: Firstly, on early-stage researchers (ESR), and secondly, on the diverse calls of the FP and other programmes. Information is exchanged between FFG-EIP staff in two institutionalised fora: an exchange round concerning projects in general, and an SME platform for all staff and NCPs with dedicated SME supportive duties.
FFG-EIP staff participates in internal training, EIP specific offers as well as in the internal part of the FFG Academy which is open to all FFG staff. Moreover, internal exchange of experience on an ad hoc basis is taking place.
The activities listed so far are discussed in chapter 3.3.2.10. on EIP as a learning organisation.
The most important activity under the headline of „Austrian support network‟ is certainly the work carried out under the assignment for Austrian Support Structures for FP7. Most importantly FFG-EIP acts as a coordinator and manager of the Austrian Support Structure; the related activities comprise the harmonisation of working plans and reports of the Regional Contact Points (RKS) with those of FFG-EIP, the exchange of data and information, and the joint provision of services. Trainings and meetings for the exchange of experience involve not only the RKS but also the organisational contact points at universities and research institutes. For a detailed description and analysis of these activities, see chapter 3.1.
In a wider concept of the network of support providers, FFG-EIP provides a forum of exchange and regular training for private consultants via the FFG Academy. The outcome is a list of „qualified consultants‟. This particular offer is described in chapter 3.1 on the Austrian support network.

Final Report 181
Figure 76 Logic Cart for Objective 3
Higher participation of Austrian organisations in European and international programmes and higher juste retour
Inst
rum
en
tsO
bje
cti
ve
Ou
tpu
tsA
cti
vit
ies
Objective 3:Improvement and maintenance of a high-quality service standard
Customer survey Process management ChecklistsNCP projects
Participate in various NCP projects as a
partner
Annual customer survey
Collect participants„feedback on events
Consulting checklists
EIP process ownership:• Design & implementation
of support for FP7• Activities of delegates,
national experts & NCP• Implementation of
Enterprise Europe Network
• Management of Eureka• Implementation of EU-
Initiatives
Analyses
Early stage researchers
Calls
Imp
acts
Ou
tco
me
s
“Exchange round” for
project experience
SME platform
Training & professional development
internally
Internal exchange of experience (ad hoc)
FFG Academy (internal FFG-wide
programme)
Trainings
Professionalization and improvement of services (at national and regional level) :• of higher practical relevance• customer oriented• know-how based• systematic and standardised• quality assured
Higher qualification of staff at EIP and in the support network
„best practice in Europe“
Shared Tools (e.g. for partner
search)
Analysis of questionnaires
Knowledge about customers‟ view on
EIP‟s services
Definition of tasks and activities
Minimum standards
for consulting
Specific outputs for individual processes
Analyses reports & statistics
Knowledge about the
subject studied
Participation in training (by #, content, scope)
Perception as a professional service provider ( prerequisite for reaching objective 1)Positioning in the NCP network
National support network
Trainings
Exchange of data & information
Coordination of work plans & reports of Regional Contact
Points
Qualification of private consultants
Complementary support for customers
List of qualified consultantsDefinition of indicators
Defined project by project
Support safeguarded at national level
Source: Technopolis

182 Final Report
3.3.2 Analysis of selected FFG-EIP services
3.3.2.1 Awareness raising: Publications, mailings, and newsletters
Distributing information about and raising awareness for the European Framework Programmes among Austrian researchers is certainly the most traditional of FFG-EIP‟s tasks – its predecessor BIT was actually founded mainly for this purpose. The main channels to reach (large) groups of target persons are publications, in digital or printed form, the website, and various kinds of events (see chapter 3.3.2.2).
As far as publications are concerned, FFG-EIP uses different channels and media to reach out to its target groups:
Printed information published by FFG-EIP itself comprise folders and information leaflets on different FP related aspects, “success stories”, i.e. descriptions of projects and organisations which illustrate how successful projects can lead to benefits, and a dedicated newsletter for the EUREKA programme. These pieces of information are also available in printed form and normally distributed to clients in the course of consulting sessions or events. Only the EUREKA newsletter is mailed to subscribers by regular mail.
FFG-EIP also uses external media to spread information, especially for the ICT-related audiences, where FFG-EIP staff writes articles for professional ICT journals and newspapers on a regular basis.
Information on specific topic is normally distributed through electronic mailings, either to FFG-EIP‟s specific target groups or to the wider audience of the FFG newsletter. The FFG newsletter is the newsletter of the whole Austrian Research Promotion Agency. FFG-EIP can use this vehicle to present its activities and important information on international programmes to potential FP-newcomers.
As stated in chapter 3.3.1, FFG-EIP uses the INNOman database for its own mailings. Because of the stock and level of detail of information stored in INNOman, the servicing staff has a variety of possibilities to tailor mailings to tightly defined target groups, and users can subscribe to the newsletter of their interest, such as the newsletters on legal and financial affairs or to programme-specific newsletters or mailings which typically inform about calls for proposals.
In our online survey, we asked the researchers on their satisfaction with FFG-EIP‟s information material. Aspects which we enquired into were completeness, usefulness, frequency of dispatch, up-to-dateness and content. Figure 77 shows that between 86% and 94% of the respondents were either „satisfied‟ or „rather satisfied‟ with the material provided. The share of users (rather) not satisfied is generally small, ranging between 4% and 7%. It is only in the category of „usefulness‟ where more than 10% (14%) of the users were dissatisfied or rather dissatisfied.

Final Report 183
Figure 77 Users‟ satisfaction with FFG-EIP‟s information material in %
1
1
0
2
1
5
3
7
1 2
6
55
41
47
50
54
38
56
46
36
39
0% 20% 40% 60% 80% 1 00%
Content
Up-to-dateness
Frequency of dispatch
Usefulness
Completeness
Not satisfied Rather not satisfied Rather satisfied Satisfied
Source: Main online survey, n = 257
These findings are confirmed by the results of our qualitative investigations: Participants in interviews and focus groups were generally satisfied with the quality of the publications received. The most cherished type of information seems to be related to calls for proposals and is more of a consulting character: to be alerted of coming calls for proposals and their expected contents as early as possible. Due to both their NCP status as well as their expert status in many programme committee, FFG-EIP staff is well capable of satisfying this need. This has also been found in FFG-EIP‟s own
customer satisfaction surveys146.
The qualitative inputs provide also some information on the sources of dissatisfaction with the aspects noted above. It has to be taken into account, though – as described above – that criticism is voiced only in a small group of the user base:
Several users complained about the information material requiring too much prior knowledge on the Framework Programmes. „FP talk‟ would make it difficult to understand the relevance of the information: “The subject of the newsletter is frequently not mentioned [...] and too much prior knowledge is assumed”.
Another small group of respondents and interviewees were concerned about the mailings being sent too frequently and / or being too unspecific: “Too much material which is not tailored enough to the needs of the target groups – the watering can principle” (survey respondent)
While FFG‟s website is generally well received, there have been also complaints that some pages could be updated more frequently. According to interviewed experts, this seems to be a particular issue with the sections on EUREKA. FFG itself has performed an analysis of usability of the specific FP7 homepage147 which turned out favourably. Generally, in our interviews there were little concerns being voiced on the website.
146 FFG-EIP memo report 04 147 FFG-EIP memo report 02

184 Final Report
Some users complained about redundant mailings received from both FFG-EIP and a Regional Contact Point which indicates that the harmonisation of mailing lists and mailings as such has not been completed. For example, an expert interviewed stated “[...] that in our case, researchers get informed three times: one time by FFG-EIP, one time by the RKS and one time by us [ed.: internal supporting unit] [...] we know our users best so it should be us to inform them on open occasions”
Generally speaking we see little need of action for FFG-EIP regarding their publications and information material. The main reason is that the share of dissatisfaction is overall very low, and it is questionable whether the marginal cost of achieving higher satisfaction (if even possible at all) is worth the possible benefit. Nonetheless, in its quality control procedures, FFG-EIP should keep an eye on a potential issue of „FP-talk‟. Eventually, in harmonising newsletters and information material within the Austrian support network, efforts should be invested in reducing the level of redundancy. This concerns not only the Regional Contact Points, but also the internal supporting units at research organisations which are partners in the Austrian Support Structure, and among them especially the research management units at university – perhaps a topic for the strategy talks (we will discuss the latter in chapter 3.3.2.6 on target group activities).
3.3.2.2 Events: from awareness raising to group consulting
Organising different kinds of events is another long-standing core activity of FFG-EIP. Between 2007 and 2009, FFG-EIP has organised no less than 230 events (including FFG Academy), reaching some 7,740 participants, and co-organised or contributed to
237 events related to the FP148. The joint planning and implementation of events in the provinces and for individual institutions has also become an established feature of the Austrian Support Structure. Figure 78 shows an overview of the numbers of events FFG-EIP has either organised, co-organised or supported with speakers.
Figure 78 Overview of FFG-EIP‟s events
Year Organised by FFG-EIP* Co-organised by FFG-EIP
Organised by others, FFG-EIP represented
with speaker(s)
Number of events / participants
Number of events** Number of events**
2007 59 / 2,200 47 69
2008 52 / 2,100 25 33
2009 72 / 2,500 31 32
Total 183 / 6,800 103 134
* Including FFG Academy ** Numbers of participants for these categories are not available separately. Source: FFG-EIP, Annual reports 2007, 2008, 2009, compiled by Technopolis
The numbers of participants for events organised by other organisations are not available separately, but according to FFG-EIP‟s annual reports, another 2,500 people participated in these events during the years 2007 t0 2009.
Interestingly, in its Logic Chart Analysis, FFG-EIP subsumed only the various modes of publications and mailings under the headline of „awareness raising‟, while events were allocated to the consulting activities (see chapter 3.3.2.3). This is the result of two trends: firstly, a shift away from the broad general information events of the „early
148 FFG-EIP, Annual Reports 2007, 2008, 2009

Final Report 185
days‟ towards a more target-group specific concept of events, which is also reflected in the comparatively high number of trainings and workshops among all events. FFG-EIP‟s events tend to be more focused both in terms of contents and in the „homogeneity‟ of the participants with respect to the subject of the event. Secondly, FFG-EIP has also started to convey frequently requested standard information to groups of people rather than to individuals in face-to-face consulting through the FFG Academy trainings.
The rationale for this development follows two arguments: First, FFG-EIP saw that considerable resources were spent on 1:1 advisory services for providing basic information on the FP. Secondly, FFG-EIP noted that a large part of its user base became more experienced in handling international programmes and required more specific information. Based on this observation, FFG-EIP has developed a set of trainings and launched them in 2007, each covering one set of basic information for different target groups: for newcomers to the FP, for applicants, for successful participants or co-ordinators, and for Marie-Curie-Actions. These types of events are
subsumed under the heading „FFG Academy‟.149 By re-routing groups of clients with a shared information need to the FFG Academy, FFG-EIP aims to cover the provision of general information more efficiently and to free resources for more project-specific in-depth consulting.
While the FFG Academy is a new addition to FFG-EIP‟s portfolio, they also offer more „traditional‟ types of events, most importantly the information events related to calls for proposals. For more in depth information to selected target groups, workshops on specific topics, such as proposal writing, reporting, or accounting, are offered. Such workshops for large research organisations in-house have also become a common feature of follow-up activities after strategy talks (and are therefore listed under the target-group oriented strategic activities in the Logic Chart above).
Notwithstanding this relatively new and more consulting-orientated approach, events have been and still are an important mode of spreading awareness and addressing potentially new participants to the FP. In order to reach organisations and persons not yet in its customers' database, FFG-EIP systematically cooperates with other organisations, most notably with other agencies (e.g. FWF, AWS), with Austrian thematic clusters (e.g. automotive, rail technology), with the network of technology centres (VTÖ), etc., either by co-organising events or by sending speakers, thus tapping into the networks of these partners. FFG-EIP also screens the participants of programmes managed by other departments within FFG and addresses them either directly through targeted offers or by participating in the respective department's information activities. FFG-EIP reports on how many new persons or institutions it identifies in the course of such activities in it annual reports and dedicated analyses for the steering committee. According to these data, roadshows and events with network partners are the richest source of previously unknown participants in international programmes. FFG-EIP has systematically analysed national programmes for potential newcomers, even the innovation vouncher (“Innovationsscheck”) funding scheme, a low-threshold bottom-up funding scheme aimed at companies that have not or not regularly engaged in R&D with external partners. EIP selected those companies and research performers among all participants with medium to high innovation potential. The list of the related contact persons (1209 in total, 275 of them researchers) was checked for entries already in the INNOman database. This left a list of 65 researchers and 650 SME representatives previously unknown to EIP who were invited to participate in the information events organised in the course of the SME roadshow in 2010. Only 16 out of the 715 people contacted expressed their interest.
149 In addition to the target groups listed above, FFG Academy addresses private consultants and offers specific trainings and exchange rounds. We deal with this branch of the FFG Academy in the chapter about the Austrian Support Structure, as in a wide definition, private consultants can be subsumed there (see chapter 3.1).

186 Final Report
For comparison: in the same roadshow 130 new persons from no less than 70 organisations previously not registered by FFG-EIP expressed an interest in FP and were consequently included in EIP‟s CRM database INNOman and service offers.
This example, together with the fact that FFG-EIP has been systematically working on the identification of potential FP participants in Austria since FP4, shows that FFG-EIP‟s efforts to identify Austrian R&D performing companies and research institutions that have the capacity and interest to participate in an FP project are as complete as they can be. There will, over time, always be some change in the customer base, e.g. (start-up) companies „growing into‟ FP projects, changes of personnel at existing institutions, or (especially with the development of new instruments at European level) new opportunities for players previously not addressed. We consider FFG-EIP‟s approaches to and activities for the identification of new customers adequate and sufficient to cope with that change. In other words, we do not think there are large undiscovered research potentials „out there‟ in terms of unknown R&D performing organisations of any kind.
How do participants assess the quality of FFG-EIP‟s events? We asked for users‟ satisfaction in our online survey. The results are presented in Figure 79:
Figure 79 Users‟ satisfaction with FFG-EIP‟s events in %
0
0
0
0
0
0
1
4
4
5
9
1 0
5
4
33
33
46
41
42
42
34
63
63
49
50
48
52
62
0% 20% 40% 60% 80% 1 00%
Public announcement of ev ents
Up-to-dateness of information presented
Freuency of ev ents
Usefulness of ev ents
Completeness of information prov ided at
ev ents
Understandability of information receiv ed
Venue
Not satisfied Rather not satisfied Rather satisfied Satisfied
Source: Main online survey, n = 227
The respondents of our survey expressed generally very high satisfaction with FFG-EIP‟s events: In all categories, 90% or more were satisfied or rather satisfied with the offer. Only for the categories „completeness of information‟ and ‟usefulness‟, the shares of not and rather not satisfied respondents were higher than 5%, reaching 10% and 9% respectively – still a rather small share.
These findings corroborate FFG-EIP‟s own results from surveying participants. FFG-EIP asks participants to fill in event feedback forms on a regular basis. We were provided with an analysis based on 3,675 feedbacks received by January 2010. The data shows that nearly two thirds of the participants in FFG-EIP‟s events have already participated in the FP, only 36% have not. Various categories of satisfaction were inquired on a five-tier scale from ‟very good‟ to ‟very bad‟, and in literally all categories

Final Report 187
– timeliness, relevance, information content, speakers, organisation – did some 90%
or more of respondents tick „very good‟ or „good‟ 150. In our own survey we did not find any evidence that the generally good perception would differ across the break down variables we used. The only exception where there was enough evidence to support a claim that differences exist at the 5% level of significance was the venue of the events. For this aspect, participants from organisations not located in Vienna were in the majority „rather satisfied‟ and not „satisfied‟ like their Viennese colleagues. However, the shares of „dissatisfied‟ and „rather dissatisfied‟ was similarly low.
We also discussed the quality and relevance of FFG-EIP‟s events with participants in interviews and focus groups. Again, the level of satisfaction was high. Participants of the FFG Academy praised the practical relevance of the trainings: “it was very hands-on, the calculations were demonstrated on real examples – that‟s far better than 60 Power-Point slides…”. Overall, FFG-Academy offers are assessed as being useful and well organised. Moreover, stakeholders and users agreed that the two-fold approach – FFG Academy for general information, 1:1 advice for special questions related to concrete projects – is a sensible and successful approach in today‟s „FP world‟. Several organisational contact points (i.e. internal research management units at universities and research institutes) either send new employees for training and qualification to the FFG Academy or have FFG-EIP staff hold sessions on site, at the premises of the organisation. The only criticism voiced more frequently was that the term „FFG Academy‟ is inappropriate to describe the type of activities of FFG-EIP as it is “[...] too much hammed up”. (expert interview).
To sum up, user satisfaction with FFG-EIP‟s events is very high, with some 90% of the respondents giving positive marks. Although we have heard few critical voices, we refrain from calling for specific improvements. Based on its long experience and on the systematic reaction to users‟ feedback, FFG-EIP has professionalised the planning and organisation of events and has adapted the scope and content of events offered to the perceived needs of its clients. We suggest continuing in this sense: build on the established know-how and keep eyes open for changing needs and requirements.
3.3.2.3 Consultancy and advice services
One of the core activities of FFG-EIP is the provision of consulting services to potential applicants to the FPs and EUREKA. The INNOman customer database and CRM system allows the monitoring of the number of times FFG-EIP staff has actually consulted researchers on matters related to the FPs and EUREKA. The system distinguishes between short and long advisory sessions, whereby a long session is defined as a discussion which lasts more than 15 minutes. As every advisory session is assigned to a specific customer and as for every customer additional information (e.g. on the type of organisation he/she represents) is stored, it is possible to provide detailed break-downs of the frequency of interaction between FFG-EIP and advised individual researchers.
Figure 80 shows the development of the number of long advisory sessions between 2007 and 2010. In 2007, 5,252 such advisory sessions were recorded in the INNOman database. In 2008, the number of long advisory sessions decreased to 3,974. It stayed at that level in 2009, when 4,020 sessions were recorded. The higher demand for long advisory sessions in 2007 is likely attributable to the start of FP7 when researchers needed more detailed information on the then new programme (and on changes with respect to FP6). Industry demand (i.e. all firms taken together) for long advisory sessions amounted to 1,848 such sessions, or 26% of the total, between 2007 and 2009. Universities account for 34%, research organisations for 19.1%, and 21.3% of all long advisory sessions are consumed by other types of institutions.
150 FFG-EIP, memo report KundInnenzufriedenheit, Appendix „Veranstaltungsfeedback“

188 Final Report
Figure 80 Number of long advisory sessions provided by EIP for FP, 2007-2008
Type of institution 2007 2008 2009 TOTAL Share of Total
University 1,067 702 686 2,455 34.0%
SME 695 403 420 1,518 21.0%
Large firm 68 53 73 194 2.7%
Firm of unknown size 57 30 49 136 1.9%
Research organisations 623 346 410 1,379 19.1%
Other types of institutions 735 432 373 1,540 21.3%
TOTAL 3,254 1,966 2,011 7,222
Source: INNOman query, database entries as of May 31, 2010
The corresponding picture for short advisory sessions is depicted in Figure 81 and shows the opposite trend if compared to the long sessions. Overall demand for short (less than 15 minutes sessions) advisory sessions resulted in 2,987 such sessions in 2007. Demand then increased to 5,098 sessions in 2008 and, eventually, to 5,571 sessions in 2009. Again, this picture is in line with the assumption that in the beginning of FP7 more detailed information and consulting is needed (meaning fewer short sessions), while in later stages more frequent but also shorter advice is required for dealing with very specific issues, such as eligibility of certain types of costs, specific legal inquiries, reporting requirements, etc. Talks held with industry (and herein especially with SMEs) account for 26% of all talks, which is similar to the share of industry and SMEs in FP participation. Again, universities are the most eager users, with 33% of all advisory sessions, which is also in line with their participation in FP.
Figure 81 Number of short advisory sessions provided by EIP for FP, 2007-2009
Type of institution 2007 2008 2009 TOTAL Share of Total
University 936 1,687 1,910 4,533 33.2%
SME 672 1,052 1,242 2,966 21.7%
Large firm 106 138 165 409 3.0%
Firm of unknown size 74 67 86 227 1.7%
Research organisations 485 919 1,096 2,500 18.3%
Other types of institutions 714 1,235 1,072 3,021 22.1%
TOTAL 2,987 5,098 5,571 13,656
Source: INNOman query, database entries as of May 31, 2010
According to FFG-EIP, it is not possible to create a break-down of the number of advisory sessions according to researchers‟ experience level with FP proposals in a meaningful manner. This is due to the fact that project specific variables – such as the number of times someone submitted a proposal (usable a proxy for experience) or success rates – are not captured in the course of advisory sessions, but rather are imported ex-post from official participation statistics (i.e. eCorda) into INNOman. The linking of project specific variables with person-specific data from two distinct data sources provides considerable challenges.
To illustrate this issue, we assume that within a company two researchers, A and B, write a proposal for FP7. A – the project leader and coordinator – would ask B to get in touch with FFG-EIP in order to obtain information on certain issues. After having sorted out the issues with FFG-EIP, we further assume that the company will submit the proposal, naming A as the only contact. Furthermore, we assume that A has never and will never be in touch with FFG-EIP (for example, because only B is used as contact person to FFG-EIP). In such a case, in FFG-EIP‟s database, B would be a person with no experience in FP proposal writing (because he has never been named in a submitted FP proposal), while A would be a „non-consulted‟ person. A would only

Final Report 189
show up as applicant with no ties to FFG-EIP. If we now strengthen the argument and assume that A and B have repeatedly worked together on FP proposals and have used FFG-EIP in the same way as described above (and are hence both highly experienced), a breakdown of advised persons according to experience level from INNOman would come to the totally misleading conclusion that B would have no experience. A would not even be considered in the statistics at all.
For the purpose of linking the utilisation of advisory services to project-specific data and for overcoming problems such as the one described above, FFG-EIP performs calculations at the project level and aggregates different records of person-specific information. These aggregations of person-specific information have led to the definition of three levels of intensity with which projects receive advice:
General advice („Allgemeinberatung‟): A project is said to have received general advice, if questions have been asked about the submission of a proposal, regardless who from the consortium has asked the question(s). However, FFG-EIP has little to no knowledge of project specifics and does not have access to the proposal. Further, a project does also qualify for having been „generally advised‟ if the applicant is known to participate in other projects and has received „detailed advice‟ (see below) for any of these other projects.
Detailed advice („Detailberatung‟): A project is said to have received detailed advice if FFG-EIP staff has been actively providing information and advice for the very project and at least parts of the proposal are known to FFG-EIP before submission. Detailed advice can be considered full scale consulting without the execution of a so-called proposal check.
Proposal check: A proposal check is a special service where the proposal of the applicant is reviewed and recommendations for improving the quality of the to-be submitted proposal are provided (see also chapter 3.3.2.4). A proposal check is the highest intensity of advice FFG-EIP can provide to FP applicants, as executing such a review necessitates and includes also detailed advice.
It is important to re-iterate that general advice and detailed advice are not the same as short and long advisory sessions. Whereas the latter refer to the length of a session provided to a specific person, the former are an assessment of the intensity and specificity of advice provided for a specific project. General/detailed advice can hence be an aggregate of short and long advisory sessions provided to different people in the project consortium, or of repeated advisory sessions to the same persons, as long as these sessions can be somehow linked to one specific project proposal.
The concepts of general and detailed advice are significant as FFG-EIP uses them to calculate one important performance indicator against which FFG-EIP assesses its own performance as a service provider. The so-called advisory service effectiveness („Beratungseffektivität‟) compares the success rates of proposals which have received any kind of advice against the success rates of proposals which have been submitted without support from FFG-EIP. FFG-EIP keeps track of this indicator and reports about the results in its annual reports for the FP7 commissioning contract. Moreover, it is certainly the indicator most often quoted by FFG-EIP in its communication with (potential) customers.
Figure 82 provides the figures for all submitted proposals with Austrian participation for FP7. According to FFG-EIP, by May 31, 2010, a total of 579 projects with Austrian
involvement were recorded in INNOman151 has having received „general advice‟. A further 246 were „advised in detail‟ and yet another 728 received a proposal check. This adds up to a total of 1,553 projects in FP7 for which FFG-EIP advice was drawn
151 These „labels‟ are assigned to projects only after the FP selection procedures, i.e. with a certain time lag.

190 Final Report
upon in the preparation of the proposals. By contrast, 2,404 projects were submitted with Austrian partners but without contact with and involvement of FFG-EIP.
Overall, projects which received „general advice‟ had a success rate of 23.1% and 32.1% of projects which have been advised „in detail‟ were selected for funding. Interestingly, drawing on a proposal check was associated with a slightly lower probability of success (26.0%), which was nonetheless still higher than for proposals only „generally advised on‟. If proposals were prepared without involvement of FFG-EIP, their chances of success were, according to FFG-EIP estimations, about equal to the EU average, i.e. around 16%.
All in all, the data presented in Figure 82 look like compelling evidence for the effectiveness of FFG-EIP advisory activities, and the data contained in the summary line of Figure 83 is regularly monitored and presented (e.g. in FFG-EIP‟s annual reports as well as in its public relations). However, it is worth taking a closer look at the mechanics of how advisory services by FFG-EIP lead to the quoted higher success rates before making a final judgment.
We explored this issue further by looking at coordinators and partners separately, focusing on the Cooperation programme, where this distinction is most appropriate due to the type of projects funded. The data displayed in Figure 83 shows that projects receiving some kind of FFG-EIP advice on average have higher success rates than projects without such support and, in most cases, than the EU average. Surprisingly, the effect is more pronounced for partners than for coordinators. Taking all categories of advice together, coordinators consulted by FFG-EIP reach a success rate of 21.5% while consulted partners succeed in 28.5% of proposals. Now, this is certainly a surprise, given the obvious assumption that coordinators have more influence in a consortium and on a proposal than partners do.
How could this phenomenon be explained? The share of projects with partners advised by FFG-EIP among all „Cooperation‟ projects with Austrian partners is 34.7%, while among coordinators no less than 80% have been advised by FFG-EIP. This suggests that the partners looking for advice are not representative for the total of all partners: We assume that they take a more active role in the preparation of the proposal than partners normally do, which they demonstrate by actively getting support. Our online survey has shown that experienced applicants tend to assign greater importance to consulting than inexperienced applicants (see chapter 3.2), that they draw more actively upon FFG-EIP‟s services and value them more. This suggests that a high share of partners consulted by FFG-EIP is among the more experienced FP participants. These researchers are likely to base their FP participation on established and „field-tested‟ partnerships and their consortia enter the competition of a call with a better chance of winning from the start. This challenges FFG-EIP‟s interpretation of the causality between consulting and success rates, which is much more likely to be, at least in parts, a correlation.
Moreover, Figure 82 also shows the relatively wide spreads across programme or thematic priority with regard to participation and success rates. Therefore, any indicator summing up across the FP‟s priorities is of obviously limited explanatory power. This holds also for the specific indicator FFG-EIP calculates by summing up across the thematic priorities (i.e. the entire Cooperation programme). It seems that the actually measured values of „Beratungseffektivität‟ are determined by the characteristics of the clients at least as much as by the capabilities of the advice giving body and by the characteristics of the programme and call. Moreover, the conclusions to be drawn from high or low success rates will also have to take into account the national situation in the particular field. As we have seen in the case study on SSH (see 2.2.6.4), high success rates at EU level are not necessarily an indicator for an appropriate policy at national level, and – vice versa – low success rates in one particular FP priority do not necessarily call for action on the side of the FP support structures as national programmes might have kept the same target audience busy at the same time.

Final Report 191
Finally, we want to address a somewhat critical issue which came up in the interviews: Several interviewees criticised FFG-EIP in connection with the „Beratungseffektivität‟ More precisely, they supposed that in order to attain large target values for „advisory service effectiveness‟, FFG-EIP staff focussed their advisory activities (especially the more intensive ones) on projects which had very high probabilities of success anyway, while projects with medium or low-level chances of success received less attention. In this way, FFG-EIP was said to „massage‟ their effectiveness figures to some extent. We found no evidence in support of such allegations: first of all, FFG-EIP does not turn down any requests for consulting. What FFG-EIP does, however, is adjust the intensity of its consulting according to the potential for success of a particular project idea. FFG-EIP‟s strategy in project related services is to focus on „high potential‟ ideas, i.e. ideas that fit the requirements of a call well, irrespective of the level of experience of the customers, and to invest less in projects with little chances of success. This strategy was agreed upon also by FFG-EIP‟s steering committee in 2009.
This is only one possible approach to providing NCP services: an NCP could also decide to focus their service on newcomers and less experienced participants, encouraging them to learn, as for example the Swiss support structure Euresearch does, in which case „Beratungseffektivität‟ would no doubt be lower (see chapter 3.4.1.1 on Switzerland). Hence, „Beratungseffektivität‟ depends very much on the target groups chosen by an NCP because more experienced participants / consortia will, on average, do better in FP calls than the total of participants and probably also better than newcomers, even if they come up with a „high potential‟ idea. To conclude this issue: we have no indications that FFG-EIP „massages‟ figures for the sake of high values of „Beratungseffektivität‟ but we suggest FFG-EIP and its contracting body to re-assess the appropriateness of this particular performance indicator, as it is used today.
What are the conclusions from this tour through the success rates? We have dwelled on the issue of „Beratungseffektivität‟ for so long because we consider it misleading to build too much on this indicator, especially as it is so crude in its present summative form. It is used as a performance indicator between FFG-EIP and its steering committee, but it contradicts FFG-EIP‟s strategy to strengthen target-group specific approaches because it conceals differences between target groups and thematic areas. Hence, we consider it more rewarding to deal with success rates (and other indicators) at the level of target groups, thematic fields or other suitably selected units of analysis in order to better understand the reasons and causalities behind such results. Such analysis is done by FFG-EIP and feeds into the NCP‟s activities but it should also feed into the strategic consideration at the ministerial level (see also our recommendation in chapter 3.1.2 on the interaction at national level).
We will take another brief look at the issue of „Beratungseffektivität‟ when examining the proposal check in the next chapter, and we will describe and assess EIP's other performance indicators in chapter 3.6.

192 Final Report
Figure 82 Projects submitted and success rates in individual programme lines of FP7, according to use of advisory services of FFG-EIP
General advice Detailed advice Proposal check No contact with EIP EU average
Programme/Thematic area Applications (#) Success rate Applications (#) Success rate Applications (#) Success rate Applications (#) Success rate Applications (#) Success rate
Health 27 33.3% 7 28.6% 72 25.0% 290 16.2% 2,416 17.8%
Food 20 20.0% 8 12.5% 34 23.5% 125 12.8% 1,245 15.1%
ICT 167 20.4% 49 14.3% 94 25.5% 409 15.4% 5,233 15,9%
Nano 17 35.3% 12 16.7% 40 25.0% 97 24.7% 2,245 11.0%
Energy 30 23.3% 17 35.3% 30 13.3% 83 9.6% 994 15.5%
Environment 40 30.0% 3 0.0% 70 22.9% 175 17.1% 1,259 15.8%
Transport 95 16.8% 59 59.3% 18 88.9% 73 9.6% 1,345 23,8%
Socio 38 23.7% 5 40.0% 73 17.8% 177 5.1% 1,351 9.7%
Space 8 37.5% 11 45.5% 5 80.0% 11 18.2% 198 22.7%
Security 33 24.2% 8 37.5% 23 30.4% 60 21.7% 520 15.2%
People 15 26.7% 19 36.8% 114 32.5% 427 26.0% 8,961 29.6%
Capacities 86 23.3% 41 19.5% 84 23.8% 248 16.5% 4,240 16.6%
Ideas 3 66.7% 7 14.3% 71 16.9% 229 6.1% 13,236 6.2%
TOTAL 579 23.1% 246 32.1% 728 26.0% 2,404 16.0% 43,243 15.7%
Source: Own computations from data obtained by FFG (INNOman queries), based on records on file by May 31, 2010
Figure 83 Projects submitted and success rates for coordinators and partners in „COOPERATION‟, according to use of advisory services of FFG-EIP
Cooperation Programme General advice Detailed advice Proposal check No contact with EIP EU average
Role in the consortium Applications (#) Success rate Applications (#) Success rate Applications (#) Success rate Applications (#) Success rate Applications (#) Success rate
Coordinators‟ projects 65 12.3% 41 29.3% 261 22.6% 92 12.0% n/a n/a
Partners‟ projects 410 24.4% 138 37.0% 199 31.2% 1408 14.8& n/a n/a
TOTAL 475 22.7% 179 35.2% 460 26.3% 1,500 14.6% 16,805 15.6%
Source: Own computations from data obtained by FFG (INNOman queries), based on records on file by May 31, 2010

Final Report 193
Following this excursion into the effectiveness of advice given, we now focus on user satisfaction. In the online survey, we have enquired into the overall satisfaction with the advice and consultancy services received, broken down by different needs for advice, covering project specific issues like the exploitation of results and IPR and proposal writing as well as general information about FP or future trends.
As displayed in Figure 84, the overall satisfaction with FFG-EIP‟s services is high: On a four-tier scale from 1=not satisfied to 4=satisfied, the mean level of satisfaction is never lower than 2.9 and reaches values as high as 3.6. Within this generally (very) positive assessment, users seem to be least happy with the advice received for alternative funding at national as well as international levels, both reach 2.9. The score is highest for general and detailed information about the FP (3.6 and 3.4 respectively) and with advice on reporting and cost statements (3.4). Such results are in line with the customer satisfaction surveys conducted by or on behalf of FFG-EIP.
These findings are also corroborated by the assessment of FFG-EIP‟s consulting activities through focus group participants and interviewees: “EIP‟s consulting is very comprehensive…it is perfect and it should not be changed”. Moreover, they add a similarly positive assessment on the accessibility of these services: “Individual advice is a valuable offer, one can talk with FFG-EIP‟s staff quickly and easily” (both statements: focus group participants).
Figure 84 Satisfaction with different contents of FFG-EIP‟s consulting services*
3,6
3,4
3,3
2,9
2,9
3,1
3,0
3,3
3,2
3,2
3,4
3,0
3,1
3,1
1 ,0 1 ,5 2,0 2,5 3,0 3,5 4,0
General information on the FP
Specific (detail) information on the FP
Interpretation of calls regarding strategic
goals of the EU
Adv ice on alternativ e national funding
Adv ice on alternativ e international funding
Consulting about special instruments of the
FP (e.g. JTI)
Support with partner searches
Support for the writing of (parts of) of
proposals
Consulting/adv ice on consortium agreements
Consulting for project management
Adv ice on reporting and cost statements
Interpretation of (negativ e) ev aluation
results
Adv ice on exploitation of results and IPR
Consulting/adv ice on future trends in the FPs
* Arithmetic mean on a scale from 1=not satisfies to 4=satisfied Source: Main online survey
To get a more differentiated picture we now look at the percentages of users at the different levels of satisfaction as shown in Figure 85. This picture shows the spread of assessments given by respondents. It reveals that for some service aspects up to one third of users were „rather not satisfied‟ or „not satisfied‟. The number of respondents (N) which is given on the right hand side of the graph also reflects the actual use of

194 Final Report
FFG-EIP‟s advisory services: The further one moves away from immediate FP related information, the lower the numbers of respondents get: general and specific information on FP, the interpretation of calls regarding strategic goals, and information on future trends receive the highest numbers of responses, while e.g. project management and IP issues have been named by far less respondents. We will now have a closer look at some of the issues that were rated critically by a certain share of respondents.
While any critical assessment should of course be taken as the starting point for improvement, it is indispensible to first analyse the service in question before taking action, building also on qualitative findings. The reason for dissatisfaction might well be external factors or the limits of feasibility. We take the example of the support for partner search to demonstrate this: 5% of respondents were not satisfied with these services, 25% were rather not satisfied, and partner search has also been assessed critically in the international cases (see chapter 3.4). However, we doubt whether investing in improving partner searches would really solve the problem:
FFG-EIP provided us with a analysis of its partner search activities152 and also of some of the difficulties this involves: Most notably, good consortia tend to know their partners already, which was confirmed by our interviewees, and many partner search requests are to vague and not specific enough in the description of what is needed / offered. As one interviewee put it: “I am very sceptical about partner search services, particularly through databases. It might work if the consortium is almost complete and only a partner with a very particular profile is sought. It certainly will not work out well to just enter one‟s profile into a database and wait to be found. I even consider this a negative selection of those not well networked.” Partner search was
also found out to be of minor importance to the users of the dedicated FP7 website153
run by FFG-EIP: According to a usability assessment of this website done in 2009154, only 10% of experienced and 15% of less experienced FP participants used the related web-services and they scored it least favourably of all EIP's web services. This is in line with our own findings in the demand analysis (chapter 3.2).
There are some major problems with many dedicated partner search databases presently offered in the FP7 context, not only by FFG-EIP: (i) They are mainly supply driven but there is little demand. (ii) Setting up and maintaining a database costly and time-consuming they have a tendency never to by quite up to date. (iii) They are aligned with FP priorities and structures which normally makes them short-lived and prone to irrelevance because they are often detached from existing professional networks or clusters with their informal information flows within established relationships – which, as interviewees told us, are the most trusted pathways to yet unknown partners as they do not just convey contact details but also references based
on experience155.
All in all, we do acknowledge that there is a small demand for support with partner search and that FFG-EIP as the host of Austrian NCPs has to offer related services but we recommend further streamlining of these activities:
No new databases: We strongly recommend refraining from the design and implementation of a “central highly effective, thematically open partner search
152 FFG-EIP memo report 08 153 http://rp7.ffg.at 154 Mühlmann, Kay, Usability-Untersuchung des FFG Webportals zum 7. EU-Rahmenprogramm,
Endbericht, 2009. 155 There is one exception to this: the partner search services established by "the mother of NCP networks,
Ideal-ist, which has existed continuously since its foundation in FP4. It was beyond the scope of our study to assess this particular tool in detail but we have gained the impression that due to its continuity this network has actually managed to become a relevant professional network for the ICT research community.

Final Report 195
and brokering tool”, as outlined by FFG-EIP in its Memoreport 08. Although the large number of existing databases is inefficient and ineffective, the “partner search database” as such is the problem, as outlined above; hence the solution is not to be found in an improved database.
Only partner searches for concrete projects: We recommend limiting partner searches strictly to applicants with an eligible project idea, i.e. to eligible consortia in search of one or very few well defined „missing partners‟. FFG-EIP has already set certain standards for the partner search requests it is willing to process. We strongly encourage FFG-EIP to be strict in the application of these standards and to communicate them clearly to all potential users of the service. All services for the advertising of research capabilities or general expressions of interest in FP participation without a concrete project concept should be stopped.
Make more (efficient) use of existing networks: when searching Austrian partners, the NCP‟s typically use of their existing personal network and knowledge about the respective research community, which we consider appropriate. In addition, instead of building and using isolated databases or posting partner searches online, we recommend that FFG-EIP makes more use of its knowledge of and contacts with (especially thematic) intermediaries by sign-posting partner searches to these institutions directly, thus providing access for „partner searchers‟ to established professional networks. This is no completely new approach but we recommend exploiting it better.
Management of expectations: Established partnerships are the best basis for any joint undertaking, including FP projects. It is highly unlikely that an organisation interested in and capable of FP participation has no professional networks to build on. Moreover, chances of success in the FP for a partnership „out of the blue‟ are low. FFG-EIP should actively communicate this on its partner search portal and in consulting, thus adjusting overly high expectations in the possibilities of partner search services some customers might have.
We move on to other services where a certain share of respondents expressed low satisfaction: Advice on alternative funding at the national as well as the international level was also received rather critically. This might partly be biased by some respondents‟ experience that for some project ideas there simply is no alternative public funding. As regards international funding, the critical voices might also be due to a lack of similarly large funding opportunities as the FP. To improve signposting of clients to national funding with its highly differentiated set of programmes and initiatives is a challenge not only for FFG-EIP. However, EIP is a department of FFG, the agency administering a substantial share of Austrian competitive research funding and should therefore not attempt to tackle this challenge on its own but in collaboration within the FFG and, jointly, with other funding agencies.
Consulting related to „the interpretation of calls with respect to the strategic goals of the EU‟ and on „future trends of the FP‟ also display a certain share of less or not satisfied clients. Interviewees and focus group participants, in particular the more experienced players, expressed a growing demand for such kinds of information: „they are the NCP, they have direct links to „Brussels‟, hence we expect to get first hand information there” (focus group participant). This confirms the need for a more strategic approach to consulting in the sense that FFG-EIP moves its focus from individual researchers to the bigger picture of an entire unit or organisation, providing support to them as they develop more strategic approaches to research funding. This approach will become increasingly important as European research initiatives can be expected to become even more complex and divers (see chapter 2.1). Consequently, customers will need more advice on how to navigate through this system and on how to tackle a new instrument, no matter whether they have participated in the FP or not and irrespective of their potential for international cooperation: with respect to new instruments, most customers are and will be newcomers.

196 Final Report
Advice on IPR and exploitation related issues has been rated critically by 22% of survey respondents and also in the qualitative steps of our research. Although the overall assessment was positive, particularly the experienced participants expressed a growing need for such services (see also chapter 3.2 on demand), it was also criticised that the information provided was sometimes not more specific than „what is written in the guidelines anyway‟ (focus group participant). IPR issues are usually very complex issues which require specific industry/field know-how, business know-how, legal know-how and technical know-how. It is likely that FFG-EIP does not have this type of expertise in house for all the various fields served, and the usage of the EC‟s IPR helpdesk for FP7 may not solve the individual questions (it can provide more general IPR information on FP7 for SMEs, though). It is interesting to note that the links between FFG and institutions in the funding world who have dedicated support programmes for IPR seem to be – stemming from qualitative interviews but also evidenced partly in the online survey – improvable. This concerns especially the funding bank aws with its departments on patents and licensing. Stronger networking and signposting in this area may lead to an improvement of the situation.
Figure 85 Satisfaction with different contents of EIP‟s consulting services, users in %
6
0
5
1
2
3
5
5
3
6
5
2
1
1
1 9
22
29
8
1 7
1 3
1 2
25
26
27
26
1 4
7
2
33
43
24
44
47
48
30
34
33
39
41
39
39
31
42
35
41
47
35
35
53
36
38
28
28
44
53
65
0% 20% 40% 60% 80% 1 00%
Consulting/adv ice on future trends in the FPs
Adv ice on exploitation of results and IPR
Interpretation of (negativ e) ev aluation
results
Adv ice on reporting and cost statements
Consulting for project management
Consulting/adv ice on consortium agreements
Support for the writing of (parts of) of
proposals
Support with partner searches
Consulting about special instruments of the FP
(e.g. JTI)
Adv ice on alternativ e international funding
Adv ice on alternativ e national funding
Interpretation of calls regarding strategic
goals of the EU
Specific (detail) information on the FP
General information on the FP
Not satisfied Rather not satisfied Rather satisfied Satisfied
N
165
164
145
110
106
72
77
98
62
60
77
92
49
106
Source: Main online survey
To sum up: FFG-EIP‟s consulting services are eagerly asked for, as reflected in the high number of advisory sessions across all types of organisations. Users assess the service very favourably: The level of overall satisfaction is high. Where the number of critical voices is somewhat larger, we have identified room for improvement in some

Final Report 197
respects as well as insurmountable limits to feasibility in others. As one focus group participant put it, “FFG-EIP and the users of its advisory services have co-evolved”. EIP has shown that it learns from changes in the „frequently asked questions‟ and adapts its services accordingly. The internal tools established for this purpose (see chapter 3.3.2.10) seem to serve their purposes well.
However, we also had the impression that too much emphasis was put on the crude summative indicator of „Beratungseffektivität‟ by making it a performance indicator for FFG-EIP‟s main FP7 commissioning contract. We will come back to the question of useful performance indicators in chapter 3.6.
3.3.2.4 Proposal check
In the following, we describe some particular and interesting characteristics of the „proposal check‟ service. From 2007 to May 2010, FFG-EIP statistics show that 728 proposal checks have been recorded (see Figure 82). Proposal check are perhaps the single most time consuming mode of providing assistance at the project level: according to FFG-EIP, one proposal check lasts up to 5 working hours.
In the online survey, we have first enquired into the reasons for using the proposal check. The most important reason for using the proposal check is to have FFG-EIP examine its formal aspects and their correctness (see Figure 86). 66% of its users state this reason to be of high relevance and 26% of rather high relevance. The second most important reason is the hope to benefit from informal information flows between FFG-EIP and the European Commission – this result is again in line with the general expectation towards FFG-EIP in this regard. The fact that the service is offered for free, is of „high relevance‟ for 55% of the users and of „rather high‟ relevance for another 27%.
Obtaining last-minute information is still a relevant reason for a total of 77% of its users (rather high or high relevance) but not a factor as strong in explaining demand for proposal checks as the ones described above. The reason is a design issue inherent in all proposal checks: proposal checks can only be sensibly carried out once the proposals have reached a certain level of maturity. In practice, such a state is only achieved close to the deadline – a time at which significant alterations of a project's structure or content are hardly possible any more. In this respect it is interesting to note one researcher saying that “…FFGs setting of a deadline quite before the actual one has proven for us and our discipline very beneficial” (interviewed researcher).
Having the proposal examined with regard to technical-scientific content ranks last among the reasons of usage (for 40% of rather low and for 13% of low relevance). This is not surprising. As one interviewed researcher put it: “We are the researchers and the experts in the field. FFG staff can hardly possess this type of know-how.” Still, a substantial share of respondents turn to FFG-EIP for a check of the scientific-technical content of their proposal: 17% have „high‟ and another 29% of the proposal check users „rather high‟ expectations in this regard.
There have been a few respondents who ticked the box „other‟ reasons. They referred mainly to the linkages between the proposal check and the proposal grant: “A proposal check is required for a proposal grant even if one would have the feeling not to need it” (respondent to the online survey). We interpret statements like these as an indication that some proposal checks may be performed for which there is actually no demand and which produce no learning effects , i.e. have no behavioural additionality.
However, there are also users who comment favourably on having grants linked to the checks. Proponents of linking proposal grants with proposal checks within the group of stakeholders and FFG-EIP see the grant as an opportunity to get hold of researchers and provide them with in-depth consultancy services (which would then lead to better proposals). In essence, the argument continues that an „additional benefit‟ is being provided which would otherwise not be realized, at least not for less experienced applicants who still need to learn and, hence, some of the criticism concerning the low additionality of the proposal grant is to be put into perspective.

198 Final Report
We do not find explanations such as these particularly convincing. Our main issue – besides our critical remarks concerning „consultancy effectiveness„ which also plays into these arguments (see previous chapter on advice and consulting services) – is that by adding value for some users, deadweight losses are produced for others in the sense of proposal checks which entail no learning effects and behavioural additionality.
Figure 86 Reasons for using the proposal check, proposal check users in %
13
5
10
1
1
2
40
19
9
13
9
6
29
31
27
27
31
26
17
45
55
58
59
66
0% 20% 40% 60% 80% 100%
To check the scientific-technical content of the proposal
To obtain a last-minute examination
Because it is free
To obtain an independent, third party opinion
To cater for informal information flows between FFG-EIP and the EC
To check formal aspects of the proposal
No relevance Rather low relevance Rather high relevance High relevance
Source: Main online survey, n = 140.
The usage patterns described in Figure 86 are stable across most of the usual break-down variables used in the online survey, i.e. there are no clear differences between types of organizations or large firms vs. small firms. There is one interesting exception though: The distinction between first time applicants and experienced applicants reveals that the former value the proposal check less (see Figure 87). It is especially the aspect of obtaining independent third party opinion that is far more important for experienced applicants to use the proposal check than for first-time applicants, with an average value of 3.7 (!) vs. 3.0 for the group of first time applicants. We interpret this result in the context of the general finding that more experienced FP participants use support more often and in a far broader manner (see chapter 3.2 on demand) than inexperienced users. With respect to the proposal check, we also see this as evidence that FFG-EIP has valuable know-how to offer which experienced users value highly.

Final Report 199
Figure 87 Reasons for using the proposal check by experienced applicants and first-time applicants *)
2,2
2,9
3,1
3,4
3,3
3,0
2,3
3,0
3,3
3,4
3,5
3,7
1,0 1,5 2,0 2,5 3,0 3,5 4,0
To check the scientific-technical content of the proposal
To obtain a last-minute examination
Because it is free
To check formal aspects of the proposal
To cater for informal information flows between FFG-EIP and the EC
To obtain an independent, third party opinion
Experienced applicants First-time applicants
*) arithmetic mean of answers on a scale from 1=no relevance to 4 = high relevance Source: Main online survey, n (experienced users) = 25, n (first time applicants) = 23
In a next step, we enquired into two issues: The frequency of using the proposal check and the extent to which its use has led to improved proposals. The respective results are shown in Figure 88 and Figure 89. 59% of the proposal check users attempt to use the service for every proposal they write and 39% only for selected proposals.
Figure 88 Frequency of using the proposal check, proposal check users in %
59%
39%
3%
Proposal Check used preferably for every proposal
Proposal Check used preferably only for some proposals
Don´t know/No answer possible
Source: Main online survey, n = 147
Questioned on the extent to which the proposals checks have helped improve the quality of the submitted texts, 67% reported „some‟ improvement and 27% „significant‟ improvement. Only 6% stated that most of the time no improvement occurred. It is not possible to determine whether „some‟ improvements have led to proposals being accepted which otherwise wouldn‟t have been. Nonetheless – and despite the crude assessments – users rate the proposal check very favourably.

200 Final Report
Figure 89 Extent to which using the proposal checks have led to improvements of the proposal, proposal check users in %
27%
67%
6%
Most of the time significant improvement Most of the time some improvement
Most of the time no improvement
Source: Main online survey, n = 139
For both frequency of usage of proposal checks and the extent to which improvements are achieved there is not enough evidence (at the 5% level of significance ) that differences among organization types, level of experience or other of the usual break down variables employed exist.
It is interesting to compare the extent to which proposal checks have produced higher quality proposals across the dimension of frequency of use (see Figure 90). The share of users reporting significant improvements is considerably higher in the group of researchers attempting to use the service for every proposal (34% vs. 15%), and the share of users reporting no improvement is lower (3% vs. 11%) (p<0.05). Obviously, those respondents who use the proposal check more regularly rate it more positively.
Figure 90 Extent to which using the proposal checks have led to improvements of the proposal, differentiated by frequency of usage
34%
15%
63%
74%
3%
11%
0% 20% 40% 60% 80% 100%
Usage of Proposal Check prefered for every proposal
Usage of Proposal Check prefered only for some proposals
Most of the time significant improvements Most of the time some improvement
Most of the time no improvement
N
53
86
Source: Main online survey, n (every time users) = 86, n (selective users) = 53
At the same time, the lower level of users reporting „no improvement‟ is an indication of effectiveness, as otherwise researchers would not return for the service. Against this backdrop, we would recommend FFG-EIP to analyse the group of researchers who

Final Report 201
repeatedly take the proposal check and to find out why they still need support to „significantly‟ increase the quality of their proposals. After all, they are experienced FP participants and (unless they chose a different project type every time) one would expect the need for this service to decrease with growing levels of experience and their demand to shift to getting answers on specific project-related questions (e.g. regarding the strategic fit of the idea with the call).
According to Figure 91, chances of success of proposal drafts are by and large regularly discussed before proposal checks are carried out. 48% of proposal check users report that respective discussions took place most of the time and 35% reported at least occasional discussions. Only in 17% of the cases did a discussion never take place. This means that for the majority of users – and FFG-EIP – there is an opportunity to discuss and decide on a „go or no go‟ decision regarding the proposal check. FFG-EIP considers this an important step in project specific consulting as a no-go decision for a project idea which does not fit the chosen call saves resources on both sides, FFG-EIP and their customers.
Figure 91 Discussion of chances of success of proposal drafts/ideas before a proposal check was carried out, proposal check users in %
48%
35%
17%
Discussion took place most of the time Discussion took place occasionally
Discussion took never place
Source: Main online survey, n = 147
As can be seen in Figure 92, the sample of respondents is biased towards proposals that have been deemed successful before a decision to execute a proposal check has been reached. We interpret this finding to be at least partly in line with a self selection process of FFG-EIP users, namely that the more proficient users draw also more frequently on FFG-EIP. Most importantly (and as also explained in 3.3.2.3), we did not find any quantitative evidence to the claim of some interviewees that FFG-EIP would „massage‟ their figures in order to boost „Beratungseffektivität‟ figures (i.e. try to „sell‟ proposal checks to good proposal writers and avoid conducting proposal checks for proposals which are likely not going to be successful). The main reason – which is also in-line with the aforementioned self selection process – is that, according to FFG-EIP, the agency is not turning down any requests for a proposal check.

202 Final Report
Figure 92 Circumstances under which a proposal check was executed, following an initial discussion on the chances of success of a proposal (based on a first draft), number of proposal check users in % *)
30
36
5
62
24
3
0 10 20 30 40 50 60 70 80
Execution of Proposal Check when proposal had a rather low chance of success
Execution of Proposal Check when proposal had a rather low chance of success, but after
improvements
No execution of Proposal Check when proposal had a rather low chance of success
Execution of Proposal Check when proposal had a rather high chance of success
Execution of Proposal Check when proposal had a rather high chance of success, but after
improvements
No execution of Proposal Check when proposal had a rather high chance of success
%
*) multiple responses possible Source: Main online survey, n = 66 (base: number of respondents)
Conclusions
For the time being, we recommend to continue doing proposal checks. It is, of course, always useful to have a third person with expert knowledge read a proposal and such feedback will always improve a text. We do not doubt that FFG-EIP‟s proposal checks improve proposals most of the time. We do doubt, however, whether consulting is actually decisive for the success of a proposal and we will come back to this issue below (see Figure 106). Moreover, the proposal check is free at the moment (funded by taxpayers) and consequently demand is (theoretically) indefinite – i.e. there is an issue of incentives. In particular, we argue that as universities and large research institute will further professionalise their research management services, they will increasingly do (parts of) proposal checks internally. We would then expect FFG-EIP to provide proposal checks for such institutions as an exception rather than a rule.
3.3.2.5 Proposal grants
Besides providing advisory services and support, FFG-EIP also administers a funding instrument for applicants to FP7, the so-called proposal grants.
The strategic aims of these subsidies are threefold, according to the guidelines for proposal grants issued by FFG-EIP:
To strengthen Austrian participants in FP7 through financing activities related to the initiation of projects
To increase the chances of success of FP7 proposals, either of Austrian universities and other research-oriented organisations or of Austrian firms and industry-oriented research institutions.
To increase the linkages between the utilisation of proposal grants and advisory services of FFG-EIP.

Final Report 203
A discrepancy between these official goals and some fairly widespread expectations became obvious in interviews and workshops, where policy stakeholders have regularly defined the goals in a narrower sense, namely as a means to incentivise FP-reluctant researchers or FP newcomers to write their first proposals for FP7.
Two funding schemes are available: A proposal grant for industry and a proposal grant for science. The proposal grant for industry targets firms (or experts contracted by firms), competence centres and extra-university research industry-oriented institutions. Individual researchers, universities (with the exception of private universities), universities of applied science, other science-oriented organisations as well as public institutions constitute the group of eligible organisations for the science-oriented funding scheme.
Both schemes subsidise costs related to the initiation and preparation of project proposals in FP7, both for coordinators and for project partners. The proposal grant for science also covers costs related to contract negotiations for project coordinators whose proposals to FP7 are selected for funding. For each type of activity and for both
schemes, the maximum funding amounts to 75% of eligible costs156. Ceilings for the amount of eligible costs exist and are presented below in Figure 93.
Figure 93 Maximum funding for activities sponsored by proposal subsidies
Type of activity Maximum amount of funding
Maximum amount of funding for justified exceptional cases
Project coordination €15,000 €20,000
Project partnership €7,000 €12,000
Contract negotiations by coordinators*
€1,000 -
* for proposal grant for science only Source: FFG, Guidelines for proposal subsidies
There are also other differences between the two grant schemes, e.g. related to funding intensity, eligible project types in FP7, eligible costs and assessment criteria. Figure 94 provides an overview of these differences.
Figure 94 Differences between the two schemes of the proposal grants
Subject Proposal grant for science Proposal grant for industry
Funding intensity 75% 100%, if only travel costs are to be funded
75% 65%, if the organisation applying is not an SME
Type of supported FP7 projects
All types of FP7 project except for those targeted at individual researchers (Ideas and People Programmes)
Eligible project types:
Research for the benefits of SMEs
Research for the benefits of SME associations
Smaller and larger joint research projects
Networks of Excellence Non-SMEs are only allowed to be coordinators of large joint projects and Networks of Excellence
Eligible costs Travel and subsistence of applicant
Costs for additional staff (“Drittmittelpersonal”)
Consulting services of third parties
Work documentation Workshop costs
Travel and subsistence of applicant
Staff costs Consulting services of third parties
Work documentation
Workshop costs
156 Some organisations like e.g. the University of Vienna top up the amount by the missing 25%.

204 Final Report
Subject Proposal grant for science Proposal grant for industry
Travel and subsistence costs for other project participants
Thematic focus and assessment criteria
All projects which fit the respective thematic focus of the EU Call are supported
Commercial exploitability of the results of the planned EU project is an important assessment criterion.
Selection procedures
Programme delegates and the funding ministries have a say in the funding decisions.
Funding decisions are taken entirely within FFG, i.e. in coordination between FFG-EIP.
Source: FFG, Memoreport 09b, Technopolis
The differences in the funding conditions reflect the history of the proposal grants in Austria: The two grant schemes existed already in FP6 and were administered by two distinct organisations, i.e. the proposal grant for science by BMWF and the proposal grant for industry by former FFF (Forschungsförderungsfonds), now the department "General Programmes" within FFG.
As of mid-2007 FFG-EIP has been tasked with the full management of the proposal grant for science, and the proposal grant for industry is now jointly administered by the departments General Programmes (FFG-BP) and European and Internal Programmes (FFG-EIP) within FFG. FFG-EIP acts as the single entry point for all applicants, regardless of their organisational affiliation. Evidently, the attempts to fully merge the two schemes for FP7 have not been completely successful, although the installation of a single entry point has certainly improved the situation for applicants.
The two funding schemes are funded from different sources: proposal grants for science are jointly funded by BMWF and BMVIT, and proposal grants for industry are funded from the budget of FFG‟s General Programmes. BMVIT started co-funding the proposal grants for science in mid-2008, as it had turned out that the eligibility criteria for applicants applied in the two funding schemes unintentionally left some institutions and projects unsupported: projects of industry-oriented organizations which submitted a non-industry focused proposal were not eligible for funding under the proposal grant scheme for science. Similarly, projects submitted by research organizations which BMWF considered outside its sphere of responsibility (such as research organisations active in transport related research or ICT) were not eligible under the science proposal grant scheme either. Both kinds of cases would be rejected under the industrial scheme for lack of expected economic impact. BMVIT solved this issue by providing additional funds for the proposal grants for science which was consequently opened to institutions / cases previously excluded. For applicants, there is no difference in the sources of funding – FFG-EIP serves as single entry point for all applicants to proposal grants. In the internal handling of proposals, however, each application for proposal grants for science is allocated to one of the two funding ministries‟ budgets – a trace of former Austrian funding practices based on patronage.
The two proposal grant schemes also differ in the way funding decisions are taken: Proposal grants for industry are decided entirely within FFG, namely in collaboration of the departments EIP and GP, involving the team in charge of managing the proposal grants, the NCP and GP staff. In contrast, the selection procedure for proposal grants for science also includes representatives from ministries. The first steps towards a funding decision are the same, most importantly the responsible NCP checks each application and makes a recommendation for / against funding. For the industrial proposal grants, the formal funding decision is taken by the GP Advisory Body. By contrast, in the case of proposal grants for science, a list of projects with the NCP‟s recommendations is submitted to the respective programme delegate. Only upon their approval, an application is presented to a specific selection committee consisting of senior FFG executives and representatives of the commissioning ministries, and this committee finally takes the decision. This seems a very heavy procedure for allocating small sums of money.

Final Report 205
Now let us have a look at the actual use of the proposal grants. We base the following description of the patterns of usage on data covering all proposal grants decided between January 2007 and June 2010. In total, 1,263 applications were submitted and 1,149 of these were accepted for funding (see Figure 95). A breakdown by types of organizations shows that universities and R&D institutes account for most proposal grants accepted (48% and 30% respectively). These two groups are also the most eager participants in FP 7.
Figure 95 Use of proposal grants by type of organisation
PG Science
[No. of proposals…] PG Industry
[No. of proposals…] Total
[No. of proposals…]
filed accepted filed accepted filed accepted
Universities 588 553 0 0 588 553
R&D Institutes 326 309 47 39 373 348
Industry 49 39 202 162 251 201
Others 38 35 13 12 51 47
Total 1,001 936 262 213 1,263 1,149
Source: Data provided by FFG-EIP, analysed by Technopolis; period covered: Jan. 2007 – June 2010
Some organisations or persons applied more than once for a proposal grant: the 1,263 applications were submitted by 799 distinct persons from 426 distinct organizations, and the 50 most active organisations account for approx. 60% of all applications. Leaving aside universities (because some universities are counted as one single organisation in this statistics, although several different sub-units might have applied) it is still fair to say that some institutions (even smaller ones) have become regular users with more than 10 and up to 30 proposal grants approved.
Figure 95 shows the number of proposal grants requested and granted between January 2007 and June 2010, broken down by the two main grant schemes and by gender of the project leader. These observations are notable:
The demand for science-focused proposal grants is significantly higher than demand for proposal grants for industry (1001 vs. 262 applications respectively) which largely reflects the pattern of participation in FP 7 overall.
Success rates are high in both funding schemes. The share of accepted applications amounted to 81.3% for industrial grants and even 93.5% for science grants.
All in all, some 80% of the projects were submitted by men and 20% by women, and the share of women in the science scheme was somewhat higher than in the industry scheme (20.8% vs. 17.9%). For comparison: the share of women among scientific employees in Austria reached 26.5% in 2007, with only 14.3% in the business sector and 36.5% in the higher education sector. Against these ratios, it is rather surprising to see so relatively few women among the applicants for scientific proposal grants.
Overall success rates do not differ significantly between male and female applicants. Women do better than men in the proposal grants for industry but the difference is not statistically significant (Figure 96).

206 Final Report
Figure 96 Use of proposal grants by gender of project leader
Proposal grant for
industry Proposal grant for
science All proposal grants
Total Men Women Total Men Women Total Men Women
Number of applications filed
262 215 47 1,001 792 209 1,263 1,007 256
Number of applications accepted
213 172 41 936 743 193 1,149 915 234
Success rate [% of applications accepted]
81.3% 80% 87.2% 93.5% 93.8% 92.3% 91% 90,9% 91,4%
Source: Data provided by FFG-EIP, analysed by Technopolis; Jan. 2007 – June 2010
The rates of applications accepted for funding is outstandingly high if compared to other funding programmes. On the one hand, this is due to the nature of the proposal grant which is no instrument of competitive research funding but a subsidy to facilitate the participation in FP. Consequently, the selection decision is based mainly on criteria related to the eligibility of the intended project for the targeted FP call. On the other hand, FFG-EIP attributes the high success rates to the linkage of the grant to its consulting and advisory services, which “[...] is to increase the accuracy („Treffsicherheit‟) of the instrument of proposal grant which is linked to a high success rate. High success rate is in turn a confirmation of accuracy of the
instrument”157. In other words, most applicants for proposal grants have received advice on whether or not their project idea fulfils the basic funding requirements of the proposal grants prior to the formal application.
We will now explore the interaction between motives for usage, additionality and the role of consulting services for the success of a proposal under the proposal grant schemes by analysing the users‟ perspective. We assessed the users‟ perspective on the proposal grants in interviews, focus group discussions and the online survey.
The proposal grants are very well known among the participants in the recent FPs and EIP customers, which is illustrated by the survey results: among all respondents including the non-users of proposal grants, only 11% did not know the offer.
As depicted in Figure 97, by far the most important motive for the use of proposal grants is to generally cover the costs of preparing a proposal to the FP. For recipients of the industrial proposal grants, minimising the risk for the first application is the second most important motive, named by 63% of this group. 44% of respondents want to improve their proposals with the help of the funding. For scientific proposal grants, these motives score differently: 54% named improving proposals among their motives and 40% ticked minimising risks, which is clearly less than among the industrial group. All other motives – finding partners, incentive to participate at all, access to EIP-services – score far lower.
157 FFG-EIP memo report 09b

Final Report 207
Figure 97 Motives for the use of proposal grants (multiple answers possible)
63
90
4
17
15
6
40
94
54
16
13
11
0 20 40 60 80 100
To minimise risks for the first framework project that is/was submitted
To generally cover costs that arise while writing a proposal
To improve the proposal(s)
For projects for which new partners have to be found (partner search)
To have an incentive for projects for which there would be no proposals otherwise (e.g., due to
low acceptance rates)
To have better access to (consulting/advice) services provided by FFG-EIP
Proposal Grant for science Proposal Grant for industry
%
Source: Main online survey, n=166
This motivation is also expressed in the frequency of application for a proposal grant: 55% of „industry‟ respondents and 59% of „science‟ respondents stated that they use the proposal grant for every proposal (if possible), while 34% and 37% respectively use it for only some of their proposal (the remaining users did not know). Some (frequent) users reported to follow a selective approach, e.g. by applying only for projects they consider of top importance and by using the additional money to invest more effort in the preparation of the FP proposals, while others do without such assessment and simply restrict themselves to applying for every third of their FP proposal.
We also asked the applicants for proposal grants about the additionality of this funding, i.e. whether or not they would have submitted an FP proposal without receiving a proposal grant. Nearly 55% stated that they would have submitted their FP proposal also without a proposal grant most of the time while 22.6% would not have done so. The share of respondents that ticked „did not know/no answer possible‟ is equally high (Figure 98). If we only look at the respondents who answered the question, percentages are even higher: 70% stated that they would have written the proposal also without the grant most of the time. There are no statistically significant differences between different types of organisations, but as a trend, free-riding is slightly higher among companies including SMEs and other types of organisations as compared to universities and R&D institutions (we will come back to this in our conclusions). From experience we know that a percentage of 10-15% of free riders – i.e. programme participants who display zero additionality „(Mitnahmeeffekt‟) – is more or less normal. However, in the case of the proposal grants, the percentage is much higher, implying that the additionality of the instrument is indeed low.
This result is underpinned by the frequency with which applicants apply for proposal grants (see above). Indeed, we heard in the focus groups and interviews that many applicants apply for a proposal grant as a matter of course. Certainly, one has to consider that an instrument used as an incentive for the preparation of another larger proposal – especially if newcomers are addressed – should not have, by their very intervention logic, high thresholds. Nonetheless, based also on other interview results we suspect that this instrument also has rather low additionality in the sense of attracting additional participants to the FP.

208 Final Report
Figure 98 Additionality of proposal grants
55%
22%
23%Project submission most of the time even without proposal grant
No project submission most of the time without proposal grant
Don´t know/no answer possible
Source: Main online survey, n=164
As far as the management of the proposal grant schemes is concerned, overall, users‟ satisfaction is high, although some aspects were criticised. Most obviously, this concerned the implementation of the proposal grants. Several users complained about the long delay until funding decisions were taken and until payment was effected. Unnecessary administrative burdens for preparing the application and, even more so, for reporting and accounting were issues of complaint as well as a lack of clarity and relevance regarding eligible costs, i.e. some users pointed out that some relevant types of costs are not eligible. The example named most often was costs for permanent staff which are eligible in the proposal grants for industry but not in the proposal grant for science. One of our focus group participants even refrained from applying a second time because the procedure was so cumbersome, and survey respondents named administrative burdens and the too shorts periods for submission (accounting for 24% and 18% of all answers respectively) as the most important obstacles to applying. Together with the large share of repeated participants, this indicates that the current procedures actually favour the „old hands‟. Moreover, other (procedural) differences between the proposal grant for science and that for industry were criticised.
Despite these critical remarks, satisfaction with the proposal grant, at least in the sense of the general existence of that instrument, was high. Discussants highlighted especially factors such as risk minimizing, linkages to advice provided (i.e. the requirement to have a proposal check conducted beforehand) and – not the least – cost/value considerations.
“The proposal grant really reduces risk, even if not all costs are covered”. (Focus group participant)
How well does the proposal grant funding perform with respect to its objectives?
The first objective of the proposal grants is to strengthen Austrian participants in FP7 through facilitating finance of activities related to the initiation of projects. While, as outlined above, the majority of FP proposals would have been submitted anyway, there are some indications that the funding obtained actually helps the recipients to engage in the preparation of the FP proposal in a more active way and thus also to play a more decisive role among their partners.
The second objective is to increase the chances of success of FP7 proposals with Austrian participants. According to the internal monitoring performed by FFG-EIP, by July 2010 the success rate for projects with a proposal grant was, on average, two to three percentage points above the average success rate of all projects with Austrian participation. This means that they are not doing better than the average project receiving advice from FFG-EIP.
The third objective, to increase the linkages between the utilisation of proposal grants and advisory services of FFG-EIP, has actually already been achieved by the new

Final Report 209
funding conditions: applicants have to present a confirmation of advice given upon invoicing and they will not be funded if they fail to do so.
Conclusions: free-riding and structural problems
We appreciate the efforts made to develop the proposal grant scheme according to well established standards of programme design and implementation in Austria, and substantial progress has been made towards this end, in comparison with past practice. Interviews and focus group result show that there seems to be some additionality in terms of proposal being actually submitted to FP calls (rather than not), of proposals being improved with the help of additional money (and support), and even of some examples of new, additional participants. However, our main online survey has revealed a substantial share of free riding. 55% of all respondents would have submitted their FP proposal anyway (or 70% if we leave out those who answered „don‟t know‟). While every funding measure has to accept a certain degree of free riding, 55% is far higher than what is generally considered acceptable (10-15%).
Despite these clear findings, coming to a final conclusion about the proposal grant schemes is not easy: in interviews and focus groups we also got robust indications that a number of institutions actually do not have enough „organisational slack‟ (i.e. free resources) to raise the funding needed for the costly proposal preparation internally and that many of these would reduce their participation in the FP without proposal grants. Among them, we find many researchers from universities or from research institutes, many of which are in a (more or less) permanently precarious funding situation, especially in the social sciences. It seems that in most cases where proposal grants actually do make a difference, the real reason behind the need for such support is less the high cost of proposal preparation per se, but rather the structural and financial problems of the institution concerned. Simply doing away with the proposal grants for the reason of low overall additionality would harm these players most.
In other words: the analysis of the proposal grants, their use and additionality have directed our attention towards institutional problems of a type and scope that could not be analysed in depth in the course or this study. Nonetheless, we suggest to pursue the following approaches in combination:
To stop funding proposal grants (in both funding schemes!) and
To tackle the structural problems at the institutions concerned as far as they are within the sphere of influence of the ministries, the BMWF above all (possibly making alternative use of funds that are currently financing the proposal grants).
Many of the organisations that would be affected most negatively by stopping the proposal grant scheme are small to medium-sized non-university research institutes. Although they have often been founded as private initiatives, they do
have a special relationship to a ministry, mostly the BMWF158, because they receive some (sometimes small amounts of) institutional funding. This link implies a certain degree of responsibility and could serve as a starting point for these ministries to enter into a profound discussion with the institutions concerned about the institutional set-up, the financial situation and the role of these players in the Austrian research system and to develop solutions for the structural problems, of which we have spotted some traces (see also the case study on Social Sciences and Humanities in this report, chapter 2.2.6.4). Any solution should include a transparent framework for the “Basisfinanzierung” based on
bespoke performance contracts159, and address capacity building.
158 But other ministries, too, e.g. for some sectoral research institutes (Ressortforschungsinstitute). 159 This particular recommendation anticipates the implementation of performance-based budgeting at the
federal level, i.e. for all federal ministries, in 2013.

210 Final Report
As far as universities are concerned, we suggest addressing the issues of research management and related internal services in the performance contract negotiations between BMWF and each university on an individual basis (the same refers to other pairs of ministries and research organisations linked through performance contracts or similar agreements). Although we have identified universities as one group of players with probably too little organisational slack, we are convinced that ultimately they should be capable of handling such issues internally. The ongoing professionalization of universities and other public research institutions in their approach to competitive funding as well as their individually designed approaches to the provision and development of internal research management services provides the basis for further considerations. This recommendation is related to what we recommended for the organisational contact points in chapter 3.1.2.
We also gained the impression that some competitive research funding system today applies costing models that do not adequately take into account the autonomy of Austrian universities after the University Law 2002 (e.g. by not funding overheads). This issue deserves further investigation and, should the impression be confirmed, action because such shortcomings could further limit necessary organisational slack at research institutions.
Box 10 A comment on the „Gender Impact Assessment (GIA)‟
We suggest stopping the proposal grant scheme, yet we still want to add a comment on the „Gender Impact Assessment‟. Currently, BMWF requires all recipients of the proposal grants for science financed by BMWF to complete a so-called Gender Impact Assessment form upon invoicing; this form is in no way linked to the actual cost statement. The data are used for no other purposes but a statistical analysis in FFG-EIP‟s annual report to BMWF. The data do not inform any decision making process or larger database or analysis, neither at the BMWF nor at the FFG.
We are convinced that collecting data at the level of individuals always has to be gender specific, not least to inform Gender Mainstreaming. However, such reporting must not be detached from the „real‟ data used in the process concerned and, above all, data collected should be used. Hence, we recommend avoiding such practices as they nurture possible resistance against gender-sensitive monitoring and pose unnecessary and avoidable burdens on researchers without adding value. Instead, regular (funding) monitoring data collected at the level of individuals should be gender-specific and feed into analyses and decision making.
3.3.2.6 Target group specific activities
FFG has increasingly developed strategic activities targeted to specific target groups. In this chapter we focus on the two selected activities: the honouring of coordinators and the strategy talks with leading Austrian firms, universities and research organisations aim. EU networking is mentioned in chapter 3.3.2.7 where we also discuss other international activities EIP is engaged in.
From our perspective, the FFG Academy trainings offered by FFG-EIP can also be considered an important new target-group specific activity (see chapter 3.3.2.2). This shows that target group specific approaches are not limited to one uniform category of instruments and activities but shape different types of FFG-EIP‟s services.
Honouring of coordinators – Austrian champions in European Research
At the beginning of FP7, FFG-EIP launched the award „Austrian Champions in European Research‟. The award is granted to successful Austrian coordinators. It is not competitive, meaning that all coordinators whose FP projects was approved receive the award. The aim is to increase the visibility of successful coordinators, who can serve as role models for other researchers, and to motive them.
So far, „Austrian Champions in European Research‟ has been celebrated four times – in April 2008, in December 2008, in September 2009, and in June 2010. According to FFG-EIP, the award is very popular. FFG-EIP has suggested to the European NCP

Final Report 211
network to establish such an award at European level – a suggestion that has been favourably received (see chapter 3.3.2.7).
However, a few critical comments were made during the interviews, namely that the award distracts FFG-EIP from attending to its core business – advising and consulting researchers. Moreover, a number of interviewees had the distinct impression that some researchers, dependant on FFG-EIP, did not dare not to attend the event although they would have preferred not to e.g. for lack of time.
The award honours an activity that is not normally highly rated in the scientific community. The incentive structure in the science system places publications on top, not coordinating and managing a network. However, if European networks are to be created and to do high-quality work, someone has to coordinate them. Hence, in this context, coordination is an essential task. Admittedly, it is too early to say what the effect of the honouring will be – whether the award will be favourably viewed by the labour market or in nomination committees. Nonetheless, at least theoretically, we welcome the award as a kind of corrective to the incentive structure in the science system.
However, the criticism voiced is not ungrounded. The award is not part of EIP‟s core business and takes up time – not only EIP staff‟s but also researchers‟. Hence, it is an activity that should be limited to „times of affluence‟ and never be organised at the expense of information and consulting services.
Strategy talks
FFG-EIP introduced strategy talks in October 2007. The rationale is to increase organisations‟ strategic approach to participating in international and European R&D programmes, in particular the FP, in accordance with organisations‟ objectives. So far more than 60 strategy talks have been conducted with leading Austrian R&D performers, among them most universities, the Academy of Science, the Austrian Institute of Technology, Joanneum Research, and Salzburg Research as well as with (large) R&D performing companies in various branches.
FFG-EIP offers strategy talks to organisations with particularly strong and successful participation in FP5 and FP6, to R&D active organisations with weak participation in the FPs, and to organisations with strong but unsuccessful participation in FP 5 and FP6. This is in line with EIP‟s so-called „key accounting‟ approach which identifies „high potentials‟ based on institutions‟ R&D expertise and participation histories in European and national programmes. EIP is convinced there is untapped potential for more active participation in the FP, especially in large firms and universities.
Set at directors‟ level, strategy talks take place between the institution‟s top management (managing director, vice rector etc.) and, on FFG‟s side, the managing director, the unit leader or NCP (if available) and the representative from the Regional Contact Point (if there is one in the province) The talks typically last two hours, with the following topics being discussed.
The organisation‟s performance in the FP (input by FFG-EIP)
Organisation‟s objectives with regard to European R&D programmes (taking into account national programmes)
Strategy and potential with regard to participation in FP7 and other European and international programmes
Support required from FFG-EIP
An important output of strategy talks are the minutes taken and follow-up actions such as workshops taught by EIP at the organisation or more in-depth advice on certain topics.
According to FFG-EIP, demand for strategy talks is high, and clients find the information they receive useful. The strategy talks have confirmed EIP‟s hypothesis

212 Final Report
that many organisations do not have a strategic approach to the FP. However, first impacts are visible: There is the example of an organisation that used to participate in the FP in a uncoordinated manner („Streubomben‟) and that now takes a much more strategic approach, thinking about what calls to participate in. As a result participation
rates are higher, and representatives of the organisation contact EIP much earlier.160 In other cases, strategy talks mainly raise an organisation‟s awareness of the FP but have not (yet) lead to higher participation rates. This may be due to FP participation by universities and large non-university research institutions still being very much a decision taken by individual researchers or research groups. FFG-EIP is planning to conduct an impact assessment on the strategy talks this year.
According to FFG-EIP, strategy talks have also been adopted by other NCPs in Europe.
Strategy talks are consulting and thus belong to FFG-EiP‟s core business. What‟s more, they are set at a „higher‟ level than the usual project related consulting EIP does, thus differing in quality. On the one hand, they are more „strategic‟, taking a strategic approach to participation in the FP, on the other hand, they are focused on the institution rather than the individual project or researcher.
We look upon them favourably mostly because they focus on developing strategies for institutions. This is an exception in Austrian research promotion, which focuses more on programmes and projects, and has a tendency to ignore institutions. We also look upon them favourably because they help to professionalise research organisations, in this instance not at an operative level but at the level of strategic planning. In this report, we have repeatedly welcomed such a development as necessary for modern universities, research institutes, and companies alike.
Of course, strategy talks could be criticised for being restricted to the FP. This can be perceived to be a problem, because some institutions might actually need a more strategic approach to third-party research funding in general and not just to the FP. However, such a problem cannot be solved at the level of FFG-EIP. We therefore welcome the ongoing discussions within FFG towards a wider scope of strategy talk to include national funding together with other departments. Moreover, we expect FFG-EIP to cover the new European instruments, too, as they become operational.
3.3.2.7 EU Initiatives: NCP projects and beyond
This chapter gives a short overview of EIP‟s main international activities, with a particular focus on EIP‟s EU initiatives.
FFG-EIP is involved in a number of EU initiatives. EU initiatives comprise NCP projects, EU initiatives with third countries, as well as EIP participations in other EU projects. According to FFG-EIP, EIP gets regularly invited to participate in EU initiatives, testifying to EIP‟s high reputation in the European NCP network.
By the end of July 2010, FFG-EIP was involved in 21 on-going EU initiatives, most of
them NCP projects161. Moreover, FFG-EIP was intending to participate in seven planned EU initiatives.. The most active unit was „International cooperation‟ with seven European projects, followed by „Environment, SSH, Security and S&S‟ and „Industrial technologies, energy and transport‟ with five projects respectively, while „Bio and food‟ and „ICT‟ had two projects each. FFG-EIP concedes that European initiatives differ in quality. How strongly FFG-EIP staff get involved in European projects, depends on the content of the project as well as the core team working on it.
160 This is of course in line with results that show that more professionalised FP participants use EIP more frequently and differently compared with inexperienced users.
161 Other EIP documents mention participation in 20 EU initiatives in November 2009 but do not list them.

Final Report 213
NCP projects finance 5.51 FTEs in 2010 (12% of all FTEs in 20210), as compared to 3.92 FTEs in 2009 and 2.92 FTEs in 2008 (Figure 72). In comparison, the FFG-EIP commissioning contract provides funding for on average 29 FTEs each year (63% of all FTEs in 2010). Hence, NCP projects make up a noteworthy and increasing portion of EIP‟s budget.
EU initiatives existed already in earlier FPs, starting in FP4 with the so-called multinational stimulation actions, typically in support of the SME specific parts of the FP. During FP6, they were called „Eigenprojekte‟ and also had a co-financing function for the predecessor organisation BIT. These „Eigenprojekte‟ were a big topic of discussion with the ministries funding BIT and later on FFG-EIP, the main (and in essence correct) concern being that too much focus on such projects would divert the support structure from its core activities and lead to engagements which would have no other benefit for the institution than providing money.
For FP7, an agreement on the participation in NCP projects has been concluded with the financing ministries: Every NCP project now needs to get approval by the steering committee which implies that the contracting ministries should have a good overview of the type of activities foreseen. According to FFG-EIP, every potential NCP project is thoroughly examined whether it is in line with the overall objectives of FFG-EIP and what benefits it yields. They are kept, overall, at a sensible level. This is also supported by the intention of the EC to fund only one NCP project per specific / thematic programme. Still, there is an issue of co-financing from national sources, i.e. the FP7 commissioning contract, because overhead costs are not covered by EC funding.
In the context of further internationalisation activities this has led especially to a re-focussing of project activities away from „development aid‟ with focus on countries in the West Balkans and the former accession states which have become EU member states in the meantime, with presumably little benefits for Austria, to „excellence collaborations‟ with countries like Russia or the U.S. In Russia, FFG-EIP helped build a NCP system and was subsequently also invited to evaluate the structure. Irrespective of the expertise that EIP undoubtedly has to do such a job, it raises the question of independence, i.e. should the actor who created the structure also evaluate it? EIP also acts as a contact point for Russian NCPs, contributing to their networking with European counterparts and their training. The U.S. project aims to mutually increase participation of EU researchers in the U.S. programmes (and vice versa). Interestingly, project activities with China were axed, due to, according to FFG-EIP, recurring problems in the field of Intellectual Property Rights (IPR).
Also worth noting were remarks of FFG-EIP staff who were at the time of holding the interviews disappointed with the “[...] low level of feedback and reaction” to these international projects on the side of BMWF. But then again it has to be noted that the evaluation team was not provided with any documents showing the benefits of the projects. The available documentation is merely a list of projects and key descriptive data relating to them (objectives, running time, FFG budget, etc.).
There is a structured process for how NCP initiatives are to be conducted, which is valid for the whole of FFG. It defines the target groups („Kunden‟), outputs, inputs, the first and last steps in the process, interfaces, resources, as well as success factors. Interestingly, funds from the European Commission are considered the main output
(and not learning effects162).
According to EIP, NCP projects create learning effects as NCPs can experience the same challenges as other FP participants who have to apply for and manage projects. Focus group participants confirmed these learning effects, underlining that EIP staff “[...] knew exactly what they were talking about because they had experienced the same problems as EIP users had” (focus group participant). NCP projects also
162 But then again, learning effects are an impact rather than an output.

214 Final Report
contribute to establishing and strengthening contacts with NCPs in other countries. This is particularly important for the People Programme where procedures and processes differ considerably from the other Specific Programmes and where exchange with EIP colleagues is of limited effect. Hence, exchange with colleagues at European level is of particular importance.
In 2009, EIP also introduced „project exchange fora‟ („Projektaustauschrunde‟) to promote internal exchange of experiences with EU initiatives. The evaluation team was in possession of a summary of the first event entitled „Creating synergies in EIP: implementation of EU initiatives‟ and taking place in November 2009. Project exchange fora are planned to take place every four months, focusing on a different topic each time. Results of the fora are to feed into a „lessons learnt‟ document, which lists the strengths and weaknesses of the different EU initiatives as well as EIP staff‟s
perception of other NCPs in Europe163. The aim is to produce a document containing best practices and synthesising the results of the different EU initiatives.
Moreover, EIP plays an active role in the NCP network. In particular, EIP has suggested to introduce a Europe-wide certificate for „European Champions‟ to honour successful coordinators, similar to the Austrian model „Austrian Champions in European Research‟, to develop training modules for NCPs and researchers, as well as define service standards and quality criteria for NCP activities. Activities to this effect are currently being coordinated across the European NCP network.
Amongst others, EIP has also stepped up exchange with Austrian experts who take part in advisory groups or expert groups at European level. In a first step, EIP listed the Austrian experts, trying to involve them in workshops, presentations, and seminars. Events with expert participation, e.g. panel discussions with evaluators, were piloted in the FFG Academy. The aim is to better harness experts‟ expertise for consulting and advisory services, to the benefit of Austrian FP applicants, and to motivate other researchers to volunteer as FP evaluators. We know from interviews with FP users who acted as FP evaluators, that being an FP evaluator can help the person develop his or network to a considerable extent.
Conclusions
EIP‟s involvement in EU initiatives was hardly ever an important topic in the stakeholder interviews, be the NCP projects or other projects. It seems to be an activity that gets little attention, presumably because it is not contested or no longer considered in any way problematic. Indeed, EIP seems to have given some thought to its international activities. It prioritises participation in EU initiatives and it has developed structured processes for conducting NCP projects as well as for learning from them. Moreover, these activities do appear to have learning effects, as testified to by EIP users. The question is whether these learning effects are sufficiently communicated to stakeholders – especially given FFG-EIP‟s discomfort with the low level of reactions from outside. Furthermore, one may wonder whether there is perhaps a little too much „organisational slack‟ in EIP to allow such extensive involvement. However, there does not appear to be too much reason for worrying as long as the following criteria are met: i) there are visible/documented positive (learning) effects, ii) the number of projects undertaken is only a healthy fraction of the overall budget and activities of the support structure and iii) as a fundamental prerequisite that there is a clear strategy in line with the overall goal and mission of FFG-EIP concerning utilisation and participation in such projects. These conditions seem by and large to be met.
163 Since many EIP NCPs have taken part in staff exchange programmes, they are familiar with different NCPs in Europe.

Final Report 215
3.3.2.8 The EUREKA Office
In this chapter we briefly discuss the EUREKA office. The EUREKA office is the unit within FFG-EIP responsible for providing support for the EUREKA/Eurostars programmes. The rationale for having a separate chapter on this unit is the peculiarities of the EUREKA family of initiatives. These characteristics – focus on SMEs, bottom-up character, the role of national funding, focus more on market-driven R&D etc. – shape a distinctive target group with special needs if compared to FP7 and its predecessor programmes.
As can be seen in chapter 2.2.2.2 on Austrian participation statistics for EUREKA, EUREKA is a rather small initiative and plays a much smaller role than FP7. The size of the EUREKA office reflects this (2.9 FTEs in 2010, of which three part-time assistants; see also chapter 3.3.1.1). Other countries with higher national involvement in EUREKA, such as the Netherlands, also have larger support structures for this programme in place. A key issue of EUREKA and for the EUREKA office – as we will see also below – is the level of national funding available for EUREKA projects. It is important to remember that EUREKA projects do not receive funding directly through EUREKA but have to draw on national funding schemes or participants‟ own resources. The only exception is Eurostars where projects are actually funded.
The goal of the EUREKA office in Austria – in line with the general mission of FFG-EIP – is to “[...] achieve an as high as possible and successful participation of
Austrian partners in EUREKA and Eurostars projects”.164 The office acts as the National Project Coordinator (NPC) and its main tasks are – according to the Annual Report 2008 – the provision of information, advice and consultancy services for likely
participants as well as support to the High Level Group Representative165 in his/her strategic functions. The unit is fully integrated into FFG-EIP, which means that it also uses the INNOMan CRM system and offers by and large the same types of services to researchers. These are, in particular, short and long advisory sessions as well as proposal checks, partner searches, etc. Proposal grants are not offered for EUREKA.
For the Eurostars programme, there is a work division between the department of the General Programmes of FFG and the EUREKA office: the EUREKA office provides the support to the applicants, while the General Programmes department administers the funds. The rationale for this approach is to use the expertise of the General Programmes in managing funds and respective opportunity cost considerations if one were to build up equivalent expertise in the EUREKA office.
Figure 99 shows data on the activities of the EUREKA office between 2007 and 2009. The figures once again reflect the different scope of EUREKA if compared to FP7. Between 2007 and 2009, the office participated in 140 meetings and events, 19 of which were information events, the others were, for example, public authority meetings, etc. During the same period, the office performed 1,137 advisory sessions (long and short sessions taken together). The spike in 2009 is likely due to the higher demand for Eurostars, which is also corroborated in interviews. Besides providing support, the office pubishes, among others, two printed newsletters four times a year (the EUREKA AT newsletter and the EUREKA news international) and also offers services for participants after the project has finished (e.g. EUREKA success stories or market impact reports).
164 FFG-EIP, Annual report EUREKA for 2008, 2009, p. 13. 165 The High-Level Group is the key decision-making body of EUREKA. The ministry responsible for
EUREKA in each member country names its High-Level Representative (HLR) which in turn endorses new EUREKA projects, takes decisions on the management of EUREKA and prepares new EUREKA policy discussions for the Ministerial Committee.

216 Final Report
Figure 99 Overview on advisory sessions and meeting/event participation of the EUREKA office, 2007 to 2009
Year Meetings and events Number of advisory sessions (long and short)
2007 41 (of which 9 information events) 319
2008 52 (of which 4 information events) 293
2009 47 (of which 6 information events) 525
TOTAL 140 (of which 19 information events) 1,137
Source: Annual reports of the EUREKA office 2007 to 2009
Figure 100 shows the satisfaction of the researchers with different aspects of consulting and advisory services delivered to parties interested or participating in EUREKA. As can be seen, overall satisfaction is very high, especially with the provision of general information, the execution of proposal checks and advice/consultancy regarding the writing of EUREKA proposals.
Figure 100 Satisfaction with different aspects of advice delivered by the EUREKA office, EUREKA office users in %
3
3
9
9
3
6
4
0
0
0
3
10
3
6
9
23
15
0
0
15
45
49
48
48
48
45
44
81
67
60
50
38
39
36
39
26
37
19
33
25
0% 20% 40% 60% 80% 100%
General information
Information on special instruments (e.g., cluster, etc.)
Information on alternative national funding
Information on alternative international funding
Special aspects of writing an E! proposal
Brokering of financial funds for E!
Partner search services
Advice/consultancy regarding the writing of EUREKA proposals
Quality and execution of proposal checks for E! proposals
Project accompaniment services
Not satisfied Rather not satisfied Rather satisfied Satisfied
N22
24
26
27
31
33
33
33
39
40
Note: Lower N correlate to researchers not having made use of the particular service Source: Main online survey
Still very positive, but with an observable share of (rather) dissatisfied users are the aspects of information on alternative national and international funding. A yet larger issue seems to be present with respect to the brokering of financial funds for EUREKA. This aspect shows a share of rather not satisfied and satisfied users of 29%. The

Final Report 217
EUREKA office routinely screens all options for public funding, but unlike in some other countries there is no standard solution to this and some participants end up financing their project themselves because their activities receive no funding, e.g. because there idea is not eligible for funding in any programme or the timing of calls is inadequate for their plans. In other words, this relatively high share of dissatisfied users is likely not addressed to the EUREKA office but due to the perceived lack of national funding for such projects.
In some of our interviews, SMEs complained about a lack of clarity in the communication policy of EUREKA. They accuse the programme of not highlighting enough the fact that EUREKA is not a funding programme but a label, requiring national funding, and the implications that may arise from that:
“What's not running well is access to the right information [...] EUREKA does not communicate clearly enough what their projects can do and what they cannot.“ (focus group participant)
“It's frustrating to see that a EUREKA project gets approved and then there are no national funds for it” (respondent in the main online survey).
Focus group discussants attributed this especially to deficiencies in the national programmes and the interfaces to EUREKA:
“There is a ‟chewy‟ attitude of the national programmes in Austria towards the internationalisation possibilities of EUREKA. Once a EUREKA project gets approved, things may start to become really slow on the national side [...] this concerns the search for the right as well as alternative programmes if the one preferred cannot be used [...] the lack of „transparency‟ of national programmes concerning internationalisation options in EUREKA shows also that FFG-EIP [ed.: the EUREKA office] acts in an isolated manner within FFG”. (focus group participant).
Hence, such statements may also indicate non-realised synergies between different FFG departments. Within the department of FFG-EIP, the available evidence does not support such a notion. The EUREKA office takes part in the SME road shows, and there are also regular exchanges among all SME relevant units. According to the EUREKA office, there is good exchange between the office and the relevant ICT programmes for the relevant EUREKA clusters. However, feedback concerning the relationship between the EUREKA office and the department „General Programmes‟ of FFG is mixed, pointing to an area of possible improvement.
In addition – and despite the marketing activities pursued by the EUREKA office – interviewees noted deficiencies concerning pro-actively informing the key target group about EUREKA/Eurostars. The main reasons suggested were the low number of staff in the EUREKA office, and once again the reluctance of national programmes to consider EUREKA more. Interestingly, one interviewee was also positive about deficiencies in out-reach activities, as “[...] this helps secure the attractiveness of the programme. Otherwise, there would be too many applications and correspondingly low success rates”.
Figure 101 shows the satisfaction with general aspects of service delivery of the EUREKA office. Despite a small number of negative statements in focus groups, the findings do not indicate any area of concern. EUREKA staff is generally considered to be committed, friendly, competent and available when needed. One particular advantage and success factor is seen in personal contact. EUREKA projects seem to require quite some efforts when being set up, due to the need of finding the right partners and to the national funding situation of these partners which needs to be considered, too. Personal contact is said to help as these issues can be thoroughly discussed. However, some of the satisfied interview partners noted changes for the worse lately (in terms of reachability, timeliness of responses, etc.) and attributed this to the increasing demand for Eurostars.

218 Final Report
Figure 101 Satisfaction with general aspects of service delivery of the EUREKA office, EUREKA office users in %
3
3
3
3
3
0
0
3
56
49
44
38
38
49
53
57
0% 20% 40% 60% 80% 100%
General reachability
Competence of staff
Timeliness of responses
General quality of advice on E!
Not satisfied Rather not satisfied Rather satisfied Satisfied
Source: Main online survey, n = 35
Conclusions
The general – favourable – assessment of FFG-EIP is also reflected in the findings for the EUREKA office, which appears to be a committed team providing well-founded information and advice on EUREKA at the operational level. Signposting EUREKA projects to national funding schemes seems to be challenging, and some evidence shows that the interfaces between the EUREKA office and other FFG departments and units could be improved, especially with the General Programmes as these are likely to be the most suitable national funding schemes in Austria for EUREKA for a variety of reasons (no calls, bottom-up design, etc.). We recommend that opportunities for better interaction are explored.
Current staffing levels of the EUREKA office seem to be roughly in line with the long-year demand for EUREKA. If demand for EUREKA (for example, resulting from Eurostars) is to rise further, increasing the number of staff can be contemplated. However, such an increase should primarily be met through re-assignment of duties within the different FFG-EIP units.
3.3.2.9 Beyond „core‟ FP and EUREKA: The role of FFG-EIP for new instruments and
ERA initiatives
In this chapter we take – in line with the terms of reference - a look beyond the traditional instruments of FPs and EUREKA, at FFG-EIP‟s current and potential role in the major ERA instruments and initiatives. In particular, we analyse FFG-EIP‟s role
in the European Technology Platforms (ETP), Article 187166 initiatives, i.e. the JTIs,
the Article 185167 initiative AAL168, ERA-Net and ERA-Net Plus. These initiatives and their principal intervention logics have been outlined in chapter 2.1.3.1. Furthermore, FFG-EIP‟s involvement in the five ERA initiatives is discussed (for a description of ERA initiatives, see chapter 2.1.9), as is also FFG-EIP‟s role in GMES (Global Monitoring for Environment and Security).
166 former Article 171 167 former Article 169 168 The Article 185 initiative Eurostars is discussed in the previous chapter on the activities of the EUREKA
office.

Final Report 219
Traditionally, European RTDI initiatives have focused on encouraging and supporting cross-border collaboration of R&D performing institutions, a feature considered key for „European value-added‟. The existence of the spectrum of schemes listed above is a (preliminary) culmination point of a development of the system towards more self-organisation of the involved research actors (see also chapter 2.1).
However, these measures are currently rather at the fringes of the attention among many Austrian stakeholders and participants in the FP, compared to the „traditional‟ instruments, above all the collaborative R&D projects. The new/ERA instruments and initiatives differ widely in terms of governance, the possibilities and modes of participation and also in terms of objectives (some have structuring effects on the ERA, others – such as the ERC discussed in chapter 2.1.3.2 – focus on research excellence).
One could assume that FFG-EIP is tasked with the provision of services and support for these newer measures as they evolved in many ways out of or around the FP. It turns out that FFG-EIP‟s level of involvement is highly different across the initiatives. It ranges from a simple observational role in some initiatives to active involvement in governing and steering boards and the provision of the full portfolio of tools (proposal checks, proposal grants, etc.) for prospective applicants in others. As a common trait, the NCPs (and their respective units) who are responsible for a certain thematic area of the FP are mostly also tasked with the provision of support for a thematically related „other‟ initiative. For a number of initiatives, there is a division of labour between FFG-EIP and other departments of FFG (e.g. Thematic Programmes, General Programmes).
With respect to European Technology Platforms and JTIs, the situation is as follows:
European Technology Platforms (ETPs): The commissioning contract for EIP tasks FFG-EIP to support Austrian actors within the ETPs, e.g. by managing the
contacts to the ETP and by supporting a working group on ETPs.169 The latter working group is organised by BMWFJ and supported by BMVIT, its main task being the exchange of information between ministries, funding agency and industry associations who have a close relationship with ETPs. FFG-EIP employees maintain contacts with Austrian representatives in the ETPs bilaterally. One person is tasked with coordinating all FFG-EIP‟s ETP-related activities. FFG-
EIP maintains an overview of the – currently 38 – ETPs on the web170 and organised an event in 2009 in order to discuss developments with the ETPs.
Austria´s representation in ETPs differs for each ETP. At the European level, ETPs may have different abilities and success with positioning themes in calls in FP7 (see e.g. automotive case study 2.2.6.1).
JTIs ARTEMIS and ENIAC: FFG-EIP is member of the Public Authority Board (PAB) for both ICT-related JTIs. Furthermore, FFG-EIP provides its standard set of consulting services (including proposal grants) to participants of the initiatives when preparing their proposals. FFG-EIP actively markets the two JTIs in events and by distributing respective information material.
ARTEMIS and ENIAC are noteworthy for the particular division of labour between FFG-EIP and the FFG department of Thematic Programmes (FFG-TP). In a dedicated commissioning contract for the two JTIs, FFG-EIP is commissioned with the said tasks and FFG-TP is to manage ARTEMIS and ENIAC core funding activities as part of the national programme FIT-IT. The existence of this commissioning contract is viewed favourably by FFG-EIP, as it is said to provide funds to perform the stated tasks adequately in addition to the core FP7 ICT tasks.
169 FFG-EIP memo report 12a 170 http://rp7.ffg.at/etp_bestehende_etps, as of November 1, 2010.

220 Final Report
JTI IMI (Innovative Medicines): With respect to the JTI IMI, FFG-EIP provided standard consulting support to prospective participants for the first call. Moreover, FFG-EIP participates in a dedicated IMI working group of the BMWF which organises meetings twice a year with stakeholders, and provides a back-up function to the Austrian programme delegate in the IMI Member States Representatives Group. The department is in regular exchange with the Austrian chair of the IMI scientific committee. For disseminating information on IMI, FFG-EIP has organised two dedicated information events and promoted the JTI on the homepage of FFG and in newsletters. In relation to the specific issue of IPR in the IMI initiative (see chapter 2.2.6.3), FFG-EIP prepared input to the IMI IPR working group and had a survey conducted among vice-rectors for R&D at Austrian universities on this topic.
Unlike for ARTEMIS and ENIAC, there is no specific commissioning contract for IMI. According to FFG-IMI, this puts a limit to the extent of support possible. Most demand for support by FFG-EIP is seen in the phase of proposal preparation (advice, proposal checks, etc.).
JTI FCH (Fuell Cells and Hydrogen): FFG-EIP activities for this JTI comprise promotion, advice and support of prospective participants, including proposal grants. According to FFG-EIP, demand for this JTI is rather low in Austria. This can be attributed to the industry structure with very few players in this technology field. There is no dedicated commissioning contract for FCH.
JTI Clean Sky: FFG-EIP officials describe this JTI as a particularly interesting case as it has “[...] its own rules of the game”. Because of the oligopolistic structure of the European aerospace industry – which is dominated by a rather small number of large and well-established firms – many of the projects are, to a large degree, already specified before actual calls are launched. As a consequence, support activities concentrate more on relationship-building, i.e. trying to support Austrian firms new to the system getting in touch with key players or helping existing Austrian players deepen their relationships in industry. There is no dedicated commissioning contract for Clean Sky.
As concerns the Article 185 initiative AAL, FFG-EIP activities are regulated in a
commissioning contract between BMVIT and FFG-TP.171 Services rendered by FFG-EIP in this context are allocated to FFG-TP and do not show up in FFG-EIP‟s budget (see chapter 3.3.1). FFG-EIP‟s main activities for AAL were the definition and identification of the relevant AAL target groups in Austria for the programme (including identifying likely key players). For this purpose INNOMan data were analysed. FFG-EIP has organised information events. Other activities include participation in various AAL association meetings, working groups and participation/membership in the forum committee. A total of 592 short and long advisory sessions have been held on AAL since until February 2010.
GMES is a sub-priority in the Space programme in FP7 and is supported by FFG-EIP together with other sub-priorities in this programme (FFG-EIP memo-report 12d). The services drawn upon for GMES comprise the usual portfolio of FFG-EIP offers. In the context of GMES and the SPACE programme it is, however, important to note that organisational redundancies between FFG-EIP and the Austrian Space agency ALR were noted in interviews – despite efforts to create clear division of labour. There was a wish of relevant policy stakeholders to have all support activities integrated into the ALR which is the traditional agency nexus for the space community in Austria. Following this logic, this would also hold true for GALLILEO, the European satellite navigation programme.
171 FFG-EIP memo report 12b

Final Report 221
With regard to ERA-Nets, one can notice the complexity of their implementation which results from the higher number of such ERA-Nets and their different objectives/content. There are currently 44 ERA-Nets and four supporting activities. Of these, FFG is involved in 14 ERA-Nets, mostly as a partner. In one case, FFG is an associated partner. For two ERA-Nets, ministries involved have contracted FFG to administer the measures (FFG-EIP memo report 12c). One member of staff in Thematic Programmes (TPs) coordinates all issues related to ERA-Nets within the agency. This person also heads the internal FFG ERA-Net „exchange group‟. While all ERA-Nets are built on top of national programmes, the exact way of embedding the measures with the national programmes differs. Three models can be distinguished: i) A national programme takes part in one ERA-Net, ii) a national programme takes part in several ERA-Nets and iii) – a special case – several ERA-Nets are handled by the General Programmes (and there is also collaboration with some Thematic Programmes).
FFG-EIP‟s role for the ERA-Nets – based on the main commissioning contract for FP7 – is to support the ERA-Nets, disseminate information on calls within the ERA-Nets and to depict Austrian participation in the scheme. Staff from the FFG-EIP department also maintains contacts to the ERA-Net secretariats, participates in the said internal working group from FFG and provides input to strategy and reflection papers on this subject. Furthermore, FFG-EIP maintains also dedicated information sections on its FP7 website, containing (i) calls for ERA-Nets (which has programme managers/designers as target groups), (ii) an overview on available ERA-Nets and (iii) an overview of current joint calls.
While the ERA-Nets are in general considered a success, they also pose challenges. One key challenge is the number of ERA-Nets: The high number of measures is, for an agency the size of FFG and the resources disposable, hardly manageable. It also makes it difficult to present a coherent and sufficiently simple funding portfolio to (partly overlapping) target groups of researchers. This is also the main reason why FFG undertakes to develop a strategy concerning ERA-Nets and has created a check list for participation.
Turning now our attention to the so-called ERA initiatives, the following points are noteworthy concerning FFG-EIP activities:
Joint Programming (JP) is probably the most important of the five ERA initiatives. According to expert interviews, it is very high on the agenda of policy makers and will influence national as well as European programming (aligning both).
There are expectations that JP Initiatives (JPI) will be simpler in administrative terms than ERA-Nets and Art. 185 initiatives (because of common funding criteria and common administration), and that they will provide for a „common pot‟ of funds. This would make JP initiatives potentially very attractive. Austria participates in all JP initiatives except for „Alzheimer‟ and „Cultural Heritage‟ and it co-ordinates „Urban Europe‟. Having been introduced as recently as 2008, JP is not mentioned in the main commissioning contract for FFG-EIP of 2007. However, activities concerning coordination between national and European programmes are covered in chapter B7 of the main commissioning contract which provides a basis for FFG-EIP activities in the field of JP.
So far, FFG-EIP acted only by request or on nomination of the contracting ministry, which is in line with the current state of affairs in the development of
JP.172 The task of coordinating JP input by FFG as a whole has been assigned to the FFG-TP department, as the coordinating activities are seen in the context of administrating national thematic programmes. Experience in dealing with
172 FFG-EIP memo report 13a

222 Final Report
thematic programmes and knowledge of the actor landscape in the different thematic areas have been key for the decision to task the Thematic Programmes with coordinating JP activities.
FFG-EIP has been involved in a national stakeholders‟ group on JP and has provided input for the Austrian JP proposal on „Urban Europe‟. FFG-EIP staff has been nominated by BMVIT to join the working group on framework conditions for JP. According to FFG-EIP, the know-how of FFG-EIP can be of high value when defining the content of JPs and – for future activities – in providing guidance for participation opportunities for prospective applicants.
The nature of JP implies a discussion on the future governance of the new initiatives as each JP initiative is to have an administrating unit, and the necessity
to combine national and EU funding173 makes it clear that FFG‟s departments must consider new ways of collaboration internally as well as with other agencies. Comments received by experts indicate that an activity important in the future will be training staff in (national/regional) funding agencies on the logic, programming and administration of combined international/national funding (i.e. training in research management). This could perhaps be a viable field of future activity for FFG-EIP.
For the ERA initiative European Partnership for Researchers (EPR), FFG-EIP acts as national mobility centre for the operative instrument of the EPR, EURAXESS. The majority of activities set by FFG-EIP together with ÖAD and BMWF concern
Austria‟s web portal for EURAXXESS174.175 This web portal provides information on academic jobs in Austria and information on social security and employment issues. On a strategic level, FFG-EIP provided written input to the national „Platform human resources‟ initiated by BMWF and the „Draft on a National Action Plan for Researchers‟. FFG-EIP collaborates with the national programme „Brainpower Austria‟, run by the Structural Programmes department within FFG. For the future, FFG-EIP plans to increase the promotion of the EURAXESS portal in order to increase its usage.
Knowledge Transfer (IP): This ERA initiative is not covered by FFG-EIP. The Commission recommendation („IP Code of Practice‟) behind this initiative calls for specific structures and particular attitudes towards usage and appropriation of IPR by different types of research organisations. At funding/support level, this topic is predominantly addressed by the funding bank Austria Wirtschafts Service (AWS). An NCP on this matter has been nominated within BMWF. So far, the NCP has organised two workshops on the progress of implementation of the Commission recommendation.
Research infrastructures: Activities for this ERA initiative are embedded in the general support of FFG-EIP for the FP7 Capacities programme „Infrastructures‟. FFG-EIP points especially to its actions in the course of the NCP project EuroRIs-
Net.176 The project aims to network RI-NCPs and to provide opportunities for training of these NCPs. Added value of this project for Austria as seen by FFG-EIP, comprise, amongst others, (i) the promotion of Austrian success stories at European level (such as the project BBMRI - Biobanking and Biomolecular Resources Research Infrastructure -by the Graz Medical University) and (ii) learning effects of NCP trainings for trainings of applicants to the FP7 infrastructure programme.
173 It must be stressed, that currently EU-level funding is only secured for three JPIs. This funding, however, covers only secretariat and management costs, not research funding.
174 FFG-EIP memo report 13b 175 http://www.euraxess.at, as of November 2, 2010 176 FFG-EIP memo report 13c

Final Report 223
According to FFG-EIP, there is yet untapped potential in Austria for participation in the FP7 Infrastructure programme. Against the backdrop of the high requirements for proposals, the main challenge is at the proposal stage. For this reason, FFG-EIP favours tailored training sessions for prospective applicants rather than, say, the information events usually used for other programmes.
In 2009, the calls of the Infrastructure programme changed their operation from a thematically bottom-up approach to a top-down policy. Against this background, the opportunities for stakeholders to submit suggestions for future work programmes have increased. Greater alignment and coordination with foreign NCPs is seen by FFG-EIP as necessary, to avoid similar projects being submitted or to reach critical mass. Another interesting issue is increasing demand for NCPs (such as FFG-EIP) to support existing infrastructures by looking for new users and user groups. Such activities would indicate a shift in the way FFG-EIP operates towards more content-related advice and activities during the running time of a project – a type of activity that is not yet covered by existing commissioning contracts.
Conclusions
The description of the current role of FFG-EIP in relation to the various ERA instruments and initiatives reveals a number of issues: First, the sheer number and diversity of the initiatives is a challenge. Each of these initiatives differs in terms of topics and target groups addressed, participation and (if applicable) funding criteria, governance at national and/or EU level. It is clear that this heterogeneity is in itself a challenge for researchers who have to find their ways around in this jungle, for a support structure and for the political governance of these initiatives in Austria. It stands to judgement whether Austria has the resources available to serve each and every initiative adequately, especially at the level of the governing ministries. Evidence from other small countries shows that prioritisation becomes more and more necessary.
Second, the level of involvement by FFG-EIP varies. In some initiatives, EIP plays a pivotal role in Austria while in others it may be considered– at best – an observer. Two things have to be considered in this context: On the one hand, a low level of involvement by FFG-EIP may be justified if other organisations/agencies are better suited to handle the tasks, especially if they have operated similar programmes or are closer to the target groups. Cases in point include: the issue of intellectual property (ERA initiative), where AWS has the know-how; GMES and other SPACE initiatives (which should be handled solely by the Austrian Space Agency ALR, given also that it traditionally is the agency nexus of the well networked space industry and research scene). On the other hand, at the moment there is no strategy in place that would provide the rationale why certain initiatives are to be pursued by the FFG-EIP and others not or at a lower level of involvement.
Third, and due to the heterogeneity of the initiatives, not only the level of involvement of FFG-EIP differs across initiatives, but also the nature of involvement and the type of support required by researchers. In Clean Sky, relationship building is most important in order to be considered a player. For research infrastructure, there is a shift towards training and there are voices calling for additional new types of support such as searching for and identifying users for research infrastructures. Notwithstanding the question whether all of these calls for change of the type of support are sensible, the evidence shows that the activity spectrum has broadened for FFG-EIP and has created higher requirements for the service-operating staff. We expect – against the light of current discussions at European level – this trend of diversification, decentralisation and 'policy entrepreneurship' to continue in the future.
For this reason we see a decreasing demand for the traditional, almost exclusive focus of FFG-EIP on the FP and consulting services linked to the traditional FP instruments. This is further supported by our observations related to the professionalising user base. The increased demand will likely be in the areas of „strategic‟ intelligence,

224 Final Report
signposting to the „right‟ initiatives, explaining differences and commonalities of different European research programmes, networking support and other types of support activities which have been described in this chapter.
Fourth, the new trend towards a broader spectrum of support activity types raises the question of governance and work organisation among FFG‟s departments and beyond. It is already apparent that the new initiatives require work distribution among various departments within FFG. This issue has to be decided on a case by case basis, based on some guiding principles: Not all tasks related to international/European research programmes have to be handled by one single organisation (i.e. FFG-EIP). As described above, certain institutions – due to their closeness to the target groups or due to the experience with managing certain types of programmes – might be better equipped for handling certain tasks or initiatives. This implies in particular that no new support structures should be set up.
Moreover, FFG-EIP should not manage / administer funding programmes (e.g. in future Joint Programmes), lack of experience and vast experience elsewhere being one argument, another being the potential conflict of interest arising from advising researchers and at the same time making funding decisions.
In such a changed and more complex environment, FFG-EIP‟s role would then be –because of systemic considerations - much more of a sign-poster, a decision aider, an intelligence collecting and distributing unit.
3.3.2.10 FFG-EIP as a learning organisation and part of FFG
FFG-EIP has dedicated one of its three main objectives to the improvement and maintenance of a high-quality service standard. The related instruments combine different approaches:
Analysis: FFG-EIP systematically collects and analyses customer feedback, and it analyses calls and other relevant data (there is a strong link to the analyses under objective 2). Both serve as inputs to the development of new/better services;
Processes: FFG-EIP has analysed various key processes for its services and has put them down in process descriptions and checklists in order to safeguard minimum standard;
Networking: FFG-EIP cooperates internationally within the NCP network and with its partners in the Austrian support network. Both activities support exchange of information and mutual learning. The Austrian networking activities also aim at a coordinated and harmonised service delivery within the entire support structure;
Training and professional development takes place both in a formal way through the participation of staff in training courses (often within FFG as a whole) and in a more informal manner through ad hoc exchange of experience among EIP staff and within the support network.
We have already discussed and assessed two main instruments under this objective in preceeding chapters: the NCP projects are dealt with in chapter 3.3.2.7 and the national support network in chapter 3.1. In this section we will comment on the remaining instruments under this objective as well as on FFG-EIP's position and relationships within FFG-EIP.
FFG-EIP keeps track of customer satisfaction in different ways, namely through annual customer satisfaction surveys, through collecting feedback forms at information events, and – as a unique exercise performed in 2009 – through an assessment of the dedicated FP7 webservices. A larger customer satisfaction survey was executed in 2007. 248 persons who had used the proposal check service received an electronic questionnaire. 104 answered the questions, yielding a return rate of 33%. Another customer satisfaction survey was performed in 2009 among 1,300 persons who had received long advisory sessions for FP7 since mid-2007. 430 (or 33%)

Final Report 225
responded. FFG-EIP has set target minimum levels for customer satisfaction in all categories surveyed. Overall, the customer satisfaction surveys drew a very positive picture of the performance of FFG-EIP. The online survey performed in the context of this study replaced FFG-EIP‟s own customer satisfaction survey this year (see chapter 1 for methodological details). In the preceding chapters and also in chapter 3.5 we have presented the related findings which basically confirm the overall positive assessment of FFG-EIP‟s services by its customers.
While EIP‟s practice of assessing customer satisfaction is unique within FFG, process management is a joint undertaking within FFG. In a first step, a „process landscape‟ covering the whole of the FFG was created with the help and involvement of all departments and units. The EIP department took ownership of a couple of these processes: (i) the design and implementation of support for FP7, (ii) activities of delegates, national experts & NCP, (iii) implementation of the Enterprise Europe Network, (iv) the management of EUREKA, and (v) the implementation of EU initiatives. In a next step, the processes were subjected to a target-performance analysis. Currently, process handbooks are being developed. As these activities were not completed at the time of this study we did not assess them. Interview partners from FFG-EIP stated, however, that they would not expect considerable impact on the current organisational structure in the medium term.
As regards cooperation with other FFG departments, the intensity of cooperation differs and depends on the actual task of the individual departments and units:
Some thematic programmes have a close link with FP thematic programmes, e.g. in ICT, security, transport, or energy. In these fields, the respective units within FFG-EIP and FFP-TP communicate on a regular basis, they exchange information, and realise joint activities (e.g. mutual participation in information events);
The situation is a bit more difficult with respect to space: space-related (international) activities are dealt with by two different units within two different departments, i.e. FFG-EIP and the Austrian Agency for Aeronautics and Space – here an extra player needs to be involved in the communication and exchange of information between NCP and programme delegate;
The main link with the General Programmes department is related to EUREKA and especially Eurostars (see separate assessment in the Eureka chapter 3.3.2.8).
One of EIP‟s tasks, the consulting of applicants whose FP proposal has been rejected on alternative funding sources, requires not only good access of EIP staff to their colleagues in other departments (and other agencies) but also a shared understanding of the task at hand, i.e. the consulting of such customers needs to be as important for the other departments as for EIP. EIP can do a first screening of possible funding programmes but for details, the respective colleagues have to take over with the same ambition for providing service. However, and as outlined in chapter 3.3.2.3, there is a limit to this kind of service because not every project idea is eligible for funding.
We expect that the required scope of inter-department interaction increases in the future: first, international cooperation is „mainstreaming‟ into what used to be purely national research promotion activities. ERA-Nets have been a major driver behind this, and the new ERA instruments can be expected to have similar effects. Therefore, „thinking internationally‟ will become increasingly necessary for national programme managers. Secondly, the concept of “Themenmanagement” (management of themes) for R&D promotion is currently under discussion at the level of ministries and FFG as a whole. The idea behind this concept is to think beyond project funding in the thematic priorities of R&D policy and to include other issues such as regulation, standardisation, etc. The international dimension will necessarily have to be taken into account in each case.
All interviewees confirmed that working relationships between the different departments have improved in the course of time and, above all, through concrete joint projects. Still, the other departments and the management of FFG sometimes

226 Final Report
seem to consider EIP as something „different‟ or even „overhead‟ because all other departments manage (substantial) amounts of R&D funding and EIP provides „only‟ services (apart from the comparatively small amount of proposal grant funding). History might also play a role: the other large departments / their predecessors were acting at the national level only and still do to a large extent, although ERA-Nets, JTIs and other international activities have now spread all across FFG. Still, a sense of "unease" became evident in interviews and it is also reflected in FFG‟s annual report, where the monetary value of services provided by EIP (and other units) is not reported, while the volume of project funding is listed in some detail. We consider this a narrowing down of what research promotion is and of the variety of instruments it applies, which clearly go beyond direct financial support. After all, FFG stands for “Austrian Research Promotion Agency” and not “Austrian Research Funding Agency” and the Austrian term “Förderung” includes more options than just “Finanzierung”.
Overall, the high customer satisfaction can be taken as an indicator that FFG-EIP‟s activities for the development and improvement of its services serve their purpose. Moreover, FFG-EIP has chosen new approaches for some of the instruments developed in recent years, most notably the strategy talks and the FFG Academy. The FFG Academy makes consulting more efficient by conveying information and advice of a generic nature (as opposed to project-specific issues) to groups of people rather than individuals, and the strategy talk shift FFG-EIP‟s focus from the isolated project to the level of the institution and its strategy. We welcome both new approaches.
A look at FFG EIP‟s Logic Chart with its complexity and the sheer number of instruments and activities hints at possible risks of „too effective‟ self-development: We have gained the impression that all innovations of FFG-EIP‟s service portfolio have
been added to the existing services rather than replacing (less effective) services177 and too many activities seem to enjoy the same high level of priority. Moreover, there might be problems and challenges for which the solution is not a new or improved service offered by FFG-EIP but something beyond the (sole) control and responsibility of EIP. We have already pointed out such issues in the context of partner search and its intrinsic limitations and for consulting about alternative funding, and we will come back to this in our conclusions regarding FFG-EIP.
177 Apart from the reorientation of international activities, where „development aid‟ has largely been stopped.

Final Report 227
3.4 The international experience – support structures for FP7 and other European initiatives outside of Austria
3.4.1.1 Switzerland
From 1987 on, researchers in Switzerland had, in principle, the possibility to participate in the FP. In 2004, Switzerland obtained the status of an Associated State. Since then, Swiss researchers have been able to participate without any restrictions and with the same rights in the FPs as their colleagues in EU Member States. The overall performance of Swiss participation in the FPs is very good: In FP6, the return rate for the Swiss contribution to the overall FP budget amounted to 114%. Preliminary estimations for FP7 suggest a likely return rate of 145%, underlining the
competitiveness of the Swiss R&D sector.178
Switzerland has established a support structure under the brand of „Euresearch‟.
Euresearch is organised under the legal form of an association.179 Euresearch is quite a young support structure. It has been delivering support for the FP and COST since
2001180 and was enacted in the current form as an association in 2004.181
The aims of the association are:182
“To support Swiss participation in international research projects and research programmes.
Provide information, motivation, and coaching to interested stakeholders and organisations, especially in science and enterprise.
Formation of a network of regional support organisations in close collaboration with institutions from universities and industry.”
Institutions and organisations who participate in international R&D collaboration can sign up as members of the association. In 2008, the association had 15 members. Among the members, there are several universities and universities of applied sciences, the Swiss Academy of Engineering Sciences SATW, the Swiss National Science Foundation, the association of Swiss Mechanical and Electrical Engineering Industries as well as Spider Town, an innovation and incubator centre.
In order to fulfil its objectives, Euresearch is mandated by a number of authorities under certain commissioning and performance contracts. It also engages in projects at European level, such as NCP projects.
The most important mandate is that from the State Secretariat for Education and Research (SER). Under the respective performance contract (running time 2007 to 2010), Euresearch is to provide support with respect to FP7 and COST. The following duties have been specified for the support structure:
Information, advice and support of Swiss researchers with respect to participation in FP7 and COST
Dissemination of information on COST actions
178 State Secretariat for Education and Research, Auswirkungen der Beteiligung der Schweiz an den Europäischen Forschungsrahmenprogrammen – Zwischenbericht 2009, 2009.
179 Interface, Evaluation Euresearch – report to the hands of the State Secretariat for Education and Research SER, 2010.
180 Interface, Evaluation Euresearch – report to the hands of the State Secretariat for Education and Research SER, 2010.
181 http://www.euresearch.ch/index.php?id=300, as of Nov, 19, 2010 182 http://www.euresearch.ch/index.php?id=300, as of Nov, 19 2010

228 Final Report
Organisation of information and training events on the FPs and COST
Motivation to participate in the FP and COST
Production and dissemination of publications and other support tools for parties interested in the FP and in COST.
Besides the SER mandate, there are also other mandates which are smaller in scope. Euresearch is coordinating the Swiss Enterprise Europe Network (EEN) and is contracted by the Federal Office for Professional Education and Technology (OPET) for the part dealing with innovation. Another contract has been signed with Liechtenstein which gives researchers from Liechtenstein the same access to services and support as Swiss researchers.
At the operational level, the outstanding feature of the Euresearch support structure is its organisation as a network. The organisational mode combines elements of centralisation and decentralisation. Services are provided at three geographical levels:
Head office: The central component is the head office located in Berne. The head office assembles all national contact points (NCPs) in one place and provides important services centrally (such as the website/intranet, customer relation management, etc.). The NCPs are the experts for detailed questions and advice on COST and FP7. The head office hoste as well the innovation part of the EEN.
Regional offices: The regional offices act as regional contact points (RCPs). For well defined geographic areas, regional offices are to act as a first drop-in centre for advice and information for researchers. There are currently ten such regional offices.
SwissCore: SwissCore is the third element of the Swiss support structure. It is the Swiss contact office of the Swiss National Science Foundation for all matters related to European research and innovation in Brussels. SwissCore offers its services also to the network Euresearch.
Interestingly, all regional offices are located at or within universities. Euresearch provides funding for their staff at universities. Duties and tasks of the regional offices are specified in performance contracts with each regional contact office. The funding provided by the Euresearch head office varies considerably across regional offices, as it distinguishes between a fixed base component (available for all regional offices) and a variable component computed as a function of FP/COST participation in that region.
In essence, the regional component of Euresearch is a support network structure superimposed on the research management units of the main universities in Switzerland.
This particular set-up has advantages and drawbacks:
On the one hand, the approach ensures similar quality standards for all service providers within the network. To this end, the specifications of the performance and commissioning contracts for collaboration seem to be more stringent then the collaboration agreements found between BMWF, FFG-EIP and the Austrian RKS. All elements of the network have the same webpage, operate under the same brand, most have a common domain name for their email addresses, use the same customer relation management tools and databases, participate in regular common trainings, etc. From the outside, the appearance is that only one single organisation is providing support for FP7 and COST in Switzerland.
As the staff in the regional offices is employed by the universities (but paid by Euresearch), universities still have control over them. They can task the staff with further duties. In fact, several universities have taken up this opportunity and expanded their regional contact offices with their own funds (for the same or other duties) and/or had them integrated with other (research management) units.

Final Report 229
On the other hand, the drawback is a potential conflict of interests between the university and Euresearch network objectives. In particular, the regional contact points are not only responsible for their host university, but for all researchers in their regions. This includes industry and, specifically, SMEs. It is clear that the university set-up is not ideal for reaching out to SMEs, also in terms of visibility or of general experience with servicing SMEs. As a matter of fact, the area of SME
support has been identified as a weakness in the latest evaluation of Euresearch.183
At the end of 2009, Euresearch employed 21 persons (17.9FTEs) in its head office.184 In the regional offices, there were a total of 36 persons employed which corresponded to 19.7 FTEs. The funding contribution of the support network for the staff employed at the regional offices/universities corresponded to 11.4 FTEs. The remainder was funded by third parties (mostly the host organisations/universities themselves). This means that a total of 29.3 FTEs (17.9 FTEs plus 11.4 FTEs) are directly funded through the mandates provided to the support structure.
The services offered by Euresearch to researchers are grouped into the two categories „information and training‟ and „advice and help‟. The following are the services subsumed under „information and training‟:
Euresearch INFO: EU Research Info is a monthly newsletter (also available in hardcopy) on latest developments with respect to European research programmes.
Euresearch E-ALERT: The e-alert service sends regular customised emails with information corresponding to a stored profile of interest (based on keyword choices). The alerts cover calls for proposals, events, news and partner searches.
Euresearch NET: This service refers to the webpage of Euresearch and the downloadable material there.
Euresearch EVENTS: Like FFG-EIP, Euresearch organises a range of events (such as conferences, seminars, courses) which inform and disseminate information on FP7 and COST.
With regard to the area „advice and help‟, the following services are offered:
Help line: The help line is to answer questions and queries on FP7.
Idea Check: Idea Check is a service where researchers can discuss project ideas with Euresearch staff. The staff of the support structure aims to identify the best funding opportunities.
Partner search: Euresearch offers also partner search services. For this purpose, the support structure draws also on the main partner search tools offered at European level (e.g,, Cordis, IDEALIST, etc.)
Project preparation and prescreening: The „Proposal prescreening‟ is the equivalent to the Proposal Check offered by FFG-EIP. Depending on the status of the proposal, the screening examines the fit of the proposal with call objectives, the consortium, project management, proposal objectives, scientific and technological approach, potential impact, exploitation and dissemination, EU added value, comparison with other national and international (EU) research activities and horizontal issues such as gender and ethical questions. Proposals are to be submitted 20 days before the call deadline (at the latest 10 days before deadline, but then Euresearch cannot guarantee that a screening can be performed in time). Responses are delivered within five working days.
183 Interface, Evaluation Euresearch – report to the hands of the State Secretariat for Education and Research SER, 2010.
184 Euresearch Annual Report, Berne, 2009.

230 Final Report
Contract negotiation and IPR: Under this heading, support and advice is given with respect to contract negotiation and ways to best protect IP.
Administrative support & project management: Support and advice is also provided in the project management phase (for reporting and audits as well as for issues related to payments)
As of 2009, the Euresearch customer database lists 13,200 clients.185 Unsurprisingly, university researchers are the biggest customer group. They account for 37% of the entries in the Customer Relation Management (CRM) system. By contrast, industry researchers represent only 22% of the registered customer base. In the time frame of 2007 to 2009, there have been on average around 1,060 face-to-face consultancy sessions, 6,300 e-mail enquiries and 1,900 phone enquiries. The amount of face-to-face advisory sessions stayed constant in the analysed time frame, while the number of enquiries by phone was decreasing and the number of e-mail consultations increasing. A total of 956 proposal prescreenings and 1,172 „idea checkings‟ were performed between 2007 and 2009. When comparing these figures to those of FFG-EIP, the different character of the support structure (in Switzerland, in addition to the central unit a network of university research management units at regional level) has to be kept in mind, though.
A key element in the work of a support structure is, according to Euresearch officials, that the structure aims to find the best solution/funding possibilities for a customer. It does not aim to „sell‟ participation in European programmes, it is prepared to advise against participation in the FP or COST under certain circumstances, and also to signpost researchers to other funding opportunities. This function is considered to contribute to the success of Swiss participation in the European programmes: The high return rates are said to leave enough leeway and ease pressure for a too strong orientation on quantitative return indicators alone. Quoting the Euresearch official “[...] in the end, it is what‟s best for the researchers what counts and not participation per se”.
Performance indicators are an issue not only for FFG-EIP, but also for Euresearch. The latest evaluation report states that the goals defined do not meet some of the
common requirements (such as being concrete, realistic, etc.).186 The corresponding indicators used are said to be restricted to quantitative output measures (such as the number of events) and to not take qualitative aspects (such as customer satisfaction) sufficiently into account. As a result, the performance indicator system is under discussion.
We asked Euresearch officials about their views on the suitability of the indicator „Beratungseffektivität‟ (effectiveness of advice) as defined by FFG-EIP. While interested in the concept, there was some reluctance to apply this indicator in the way FFG-EIP is using it to the specific situation of Euresearch.
The reason provided was that demand for services is so high, and given the current resources it would not be possible to service all potential demand. Against this backdrop, Euresearch activities aim to make the proposal writers fit to write their proposals on their own. Once the researchers are able enough, intense support from Euresearch should not be needed anymore.
However, this set-up entails that Euresearch deals more with the less-fit of the proposal writers and to a smaller extent with the „pros‟. „Effectiveness of advice‟ would then not be a suitable indicator as it would show no or even negative effectiveness, if the two groups of the less experienced (but supported) proposal writers and the
185 Euresearch Annual Report, Berne, 2009. 186 Interface, Evaluation Euresearch – report to the hands of the State Secretariat for Education and
Research SER, 2010.

Final Report 231
unsupported „pros‟ are compared. The advantage of such an approach is that Euresearch focuses on producing learning effects, thus maximising behavioural additionality.
Euresearch officials also made a distinction between coordinators and partners in this context, and a differentiation between an approach that would increase success rates and one more focused on the administrative issues, to save time. Euresearch feels that it could increase sucsess rates for coordinators through providing in-depth advice. As for normal partners, the focus would be, however, on time saving activities (i.e. saving time to find the right information, help in filling in forms, etc.).
Despite some few points of criticism, the latest evaluation of Euresearch paints a very positive picture of the support structure. The evaluators confirmed the appropriateness of the organisational structures and underlined that the expectations spelled out in the performance contracts have been met by the work of the operating staff. Euresearch is well known among researchers active in FP7 or COST, and customer satisfaction with the services delivered is very high. 86% of the respondents of the online survey conducted in the course of the evaluation stated that having support and services for handling European RTDI programmes is, generally, important. This figure is 15%-points higher than in the previous evaluation and indicates that Swiss researchers find the existence of services such as the one rendered by Euresearch nowadays even more important than in the past.
3.4.1.2 Sweden
Sweden has done quite well in the FPs in the last decades although participation numbers dropped from FP5 to FP6. According to a calculation by Vinnova in 2008, Sweden is the top beneficiary of FP6 funding in terms of FP resources per capita. The Swedish participation is overwhelmingly university participation. Industry has received approximately 22% of the Swedish FP6 funding while the universities and the public research sector received 70%. An impact assessment was conducted on the
Impacts of EU Framework Programmes in Sweden in 2008.187 It took a longitudinal approach to the FP participation from the very first FPs. It found that the impact varies considerably between thematic domains and sectors. The university sector is increasingly aware of the strategic importance of the FPs and universities have stepped up their own actions to increase participation. Industry participation was strong particularly in the vehicle and ICT sectors, but relatively weak in areas such as health and environmental technologies. The impact assessment did analyse the organisation and effectiveness of Swedish FP support structure. However the extensive studies in the field show that a lack of strategic involvement in influencing the European research agenda‟s is a weakness in the Swedish system.
Today the Swedish international R&D collaboration support system has a central core coordinated by Vinnova and eight other organisations that fulfil a support role: the Swedish Research Council Formas (Environment & Bio), Swedish Energy Agency, Swedish Civil Contingencies Agency (crisis management), Environmental Protection Agency, Swedish Defence Research Agency, Swedish Radiation Safety Authority, Swedish Agency for Economic and Regional Growth and the Swedish Research Council. While Vinnova does most of the first line support work, the representatives of the Agencies provide expertise from their fields, for instance to brief the programme delegates from the Ministries. VINNOVA has the national responsibility for providing information and advice on EU's Framework Programme for Research and Technical Development, is the national co-ordinator (NCC) for COST, is the Swedish co-ordinator for both EUREKA and Eurostars and runs the national EUREKA office. In general the Vinnova NCP‟s are the primary contacts for the potential participants, the Agency members are secondary.
187 Arnold, Erik et al. Impacts of the EU Framework Programmes in Sweden, Vinnova, Stockholm, 2008.

232 Final Report
Even before Sweden entered the European Union there were close contacts with the European Commission and the FPs. The first big research programmes ESPRIT and RACE were important for the Swedish ICT industry. Sweden funded participation of Swedish participants with national money. When Sweden – just as Austria - received the associated status from the 1990s, the country started to set up its own national support structure at the predecessor organisation of Vinnova. The head of the Swedish support structure built close contacts with support structures of other small countries such as The Netherlands, the Nordic Countries and Austria. The big difference with other countries was that the associated countries only had an observer role. Their access to information (such as the lists of successful and unsuccessful proposals) was more difficult. Once Sweden got EU membership in 1997 an EU-office was set up with 14-15 people including a location in Brussels (with 1-2 people).
Today a range of services are provided to the potential participants. Financial support to write proposals is available from the various Swedish agencies. There is no central system, each agency has its own rules. It typically helps SMEs in their proposal stage.
Training is provided by the central FP support unit on issues such as how to deal with EU-contracts. Vinnova already in an early stage hired a lawyer to train potential participants on contractual issues and IPR. Each year Vinnova organises 10 roadshows in the regions. These roadshows are tailored to the specific needs in the region both thematic (e.g. focused on bio-technology) and horizontal (e.g. Marie Curie fellowships). Vinnova organises programme specific information days, mostly held in the capital but also in southern Sweden. Rather than organising many call specific information days, Vinnova encourages participants to take part in the information days provided by the Commission in Brussels. If Vinnova sees a specific need in an area where they consider that Sweden could improve its participation (e.g. researchers in the social sciences and humanities) they will launch dedicated information activities.
The Vinnova FP support system has approximately 12 people full time, including the Brussels office. This team also deals with EUREKA and COST as well as collaboration with third countries. In comparison with other small countries an interviewee considered this as a lack of critical mass. In addition there are 8 people (approximately 2-3 FTEs) from various agencies who act as experts to support the Programme Committee delegates. They are usually involved in running national programmes in a similar thematic area. They are responsible for setting up national reference groups and prepare for the programme delegate meetings. Some spend 5% of their time to European matters, others up to 30%.
The Swedish NCP organisation is an active member of IGLO, the informal network of national NCPs, in Brussels. A Brussels presence is regarded as crucial to establish good contacts with EC officials in the many domains. The Swedish NCP has chosen not to engage in FP Support Actions and other FP-projects related to NCP type work.
The Swedish programme delegates (PD) are officials from the Swedish ministries. However this causes issues of staffing and expertise as Sweden has relatively small ministries and large agencies. The domain knowledge and stakeholder networks are thus with the agencies rather than the Ministries. The solution chosen – although varying between domains - is that agency experts support the ministry delegates, join them as experts to meetings in Brussels and brief them on specific contents. Recently there have been pilots to develop a closer interaction between the programme delegates and the NCPs to have a more pro-active approach rather than react to finalised work programmes. So the communication and discussion of work programmes in their early stages is being encouraged. The collaboration between NCP and PD needs time to develop.
In addition to the state support system many of the Swedish universities have set up their support systems in house. As Swedish FP participation is very much university based this is a necessity for Vinnova to rely on given the small size of their team. The impact study showed that the larger universities such as Chalmers, Lund and

Final Report 233
Karolinska Institute typically have an EU-grants office with 3-7 people providing information, grants and support in proposal writing and contractual matters.
There is one person dedicated to gather and analyse the FP-participation data. The challenge is to look at the data in an intelligent manner and beyond the simple „just retour‟ calculation. Today more and more an analysis is made on the correlation between the strengths and weaknesses of Swedish research system and the participation in the FPs.
It has appeared very difficult to develop measurable goals or performance indicators for the support structure. There is a broad national goal to increase Swedish participation and particularly in industry by 30%. There is also the goal to improve the synergy between national and international programmes. This will need a specific strategic decision that will be different for each area in the FP. This requires a national strategy first.
The relatively centralised system in Sweden is considered an advantage as they have a good coordination between all actors who are all based in Stockholm. With the involvement of various thematic agencies there is less risk of getting isolated in the system. Given the Swedish governance structure with small ministries the levels of hierarchy are quite narrow. The dialogue with the higher political levels on Sweden‟s approach to FP matters is quite easy to arrange from the agency position. The disadvantage of that is that the Ministries have very few people actually engaged in the international R&D arena.
Challenges and actions for the future are:
Getting industry more involved and particularly the SMEs that have no contacts with universities
Launching the stakeholder consultation on FP8 (scheduled to start mid-November)
Developing a system that relies more on the universities to give direct help to their researchers, Vinnova providing the university grant offices with the appropriate information, so that more efforts can go to the companies.
3.4.1.3 Ireland
The support structure in Ireland to promote and provide help in establishing involvement in the Framework Programmes is highly decentralised, consisting of a network – the National Support Network (NSN) – led by Enterprise Ireland and involving all of the national funding agencies. The National Support Network was introduced for FP7. This new support system has been designed to overcome a number of recognised weaknesses in the old network with the organisation and management of FP6 support, including a lack of coherence as to the involvement and roles of the different national agencies, the limited amounts of training for National Contact Points, and insufficiently clear links between national research funding and Framework participation. In addition, the new NSN has sought to strengthen the range of financial supports on offer to assist both academics and industry in becoming involved in FP7 proposals and projects.
A number of elements make up the new NSN, each of which are aimed at disseminating relevant information to relevant groups, supporting potential FP7 participants to establish networks and identify potential research projects, and supporting the development of proposals.
Dissemination of information and raising awareness of FP7 is achieved via a dedicated
National Support Network website188, and through the work of the National Contact
188 http://www.fp7ireland.com/Page.aspx?SP=216

234 Final Report
Points (NCPs) – dedicated professionals from the major funding bodies in Ireland who are part of the NSN and attached to specific areas of the programme. There is at least one NCP per thematic priority area, and one for each of the other parts of the programme, such as the Marie Curie Actions, Research Infrastructures, Research for the benefit of SMEs, Research Potential, Science in Society, and Activities of International Cooperation.
Behind the coordinated network there are quite a number of organisations involved in the NCP network:
Health Research Board
Department of Agriculture, Fisheries and Food
Higher Education Authority (Research Infrastructures)
Sustainable Energy Ireland
Science Foundation Ireland (Ideas /ERC)
Irish Universities Association
Environmental Protection Agency
Irish Research Council for Humanities and Social Sciences
Irish Research Council for Science Engineering and Technology
Department of the Environment, Heritage & Local Government
The NCPs run information days, seminars and other promotional events to advertise FP7 opportunities and to assist prospective applicants and are available to answer specific questions and provide dedicated assistance to individual companies and research groups. This direct support is usually focused around understanding the calls and the associated requirements, the development of partnerships and the preparation and submission of proposals. The network of NCPs introduced for FP7 draws upon experts from a wider range of national funding bodies, and ensures that each NCP attends to the needs of all types of actor within their area of the programme, rather than serving just the academic or industrial (indigenous and multinational alike) communities.
As part of the NSN, the programme delegates (PDs - Ireland‟s representatives on FP7 programme committees) also provide support to prospective participants, and are able to identify opportunities that are of importance for Irish participation in the programme. They have a potentially more strategic role in that they are more closely involved in discussions about the nature and content of forthcoming FP calls, and have closer insight into the opportunities that exist and how Ireland may maximise its strategic „positioning‟ with regard to those calls and the major consortia that are expected to become involved. In some cases the same individual occupies the role of PD and NCP in relation to a particular part of the programme.
In addition to the NCPs and PDs, Enterprise Ireland has established the Irish Liaison Office in Brussels as a contact point for all Irish R&D. The office manager is a member of the Informal Group of Brussels-based R&D Liaison Offices (IGLO), which facilitates interaction, information exchange and cooperation between its members, their national research systems and the relevant European institutions on EU RTD issues, with a focus on FP7. In this way the Irish Liaison Office acts as a contact point for Irish researchers and industry with the European Commission, as well as potential collaborators.
The new National support system also includes, for the first time, an appointed Director for FP7 support, based in Enterprise Ireland, and a set of targets for Irish participation in FP7 in terms of the volume of funding that it is hoped will be secured by Irish partners. The Director and her team have been monitoring closely the early involvement of Irish participants in proposals submitted to FP7, applicant success

Final Report 235
rates within the various calls, and early levels of participation and funding received by Irish partners, and have been adjusting and extending the range and nature of support available where possible based on the emerging results. Once a month, the whole network, including the Brussels representative, meets to share experiences and information.
The role of Enterprise Ireland as the coordinator of the network has also helped to facilitate a more „joined-up‟ approach, wherein the network of support providers meets on a monthly basis for (i) training on new developments, (ii) the sharing of experiences, and (iii) discussions about the effectiveness of the support and ways to improve it. This „team-based‟ activity helps to ensure that the network learns and improves over time and is able to offer a more coordinated approach. This has for instance related to more standardised support to potential participants, with central financial proposal writing support, thematic expertise and expertise on for instance issues concerning Marie Curie Fellowships.
The support for EUREKA, CIP and COST is not integrated into this network. Other Enterprise Ireland staff – not in the FP7 network - are responsible for those programmes. The coordination with the FP team has room for improvement according to an interviewee.
Thus in Ireland the role between NCP and PD is often mixed or at least closely integrated. This is not considered an issue, on the contrary the fact that both NCPs and PDs are from organisations with strong networks with their stakeholders and a good domain expertise is considered a strength. A small country like Ireland otherwise would not have the human and financial resources to build up a network to replicate this type of expertise. While this gave coordination problems in previous FPs, the stronger coordination role taken over by Enterprise Ireland is aimed to overcome the fact that information is dispersed and support fragmented.
Through the sister organisation Forfás a close link is made between FP-support and national policy development. In FP7 Ireland has sought to build a much better synergy between EU-policy and national research and innovation policy.
The coordinating unit is responsible for monitoring the (financial) support and acts as a central liaison point to the European Commission for participation data.
There is no overview of exactly how many FTEs are involved in the FP support network as so many agencies are involved. For many agencies the NCP and PD work is only part of their many tasks. Overall there are 35 people involved in the network. At Enterprise Ireland there are 14 FTEs involved in the FP7 network.
The NSN provides a service to applicants by reviewing and giving advice on proposals, and offers general support in all stages of the lifecycle of a project. It also assists prospective participants who do not have prior experience of existing networks or EU projects to find suitable partners both nationally and across the EU.
The NSN network provides free of charge training (generic proposal writing and specific contract negotiations and project management). It outsources part of this training to specialised private sector consultancies. Only when some specific expertise is needed the will NCPs do part of the training session. NSN members – mostly the Brussels office - accompany coordinators when negotiating with the Commission.
The NSN has also extended and improved the range of financial supports on offer to Irish applicants. Researchers based in Irish companies, public research bodies and higher education institutions with an ambition to participate in any FP7 project are now eligible to receive financial assistance from Enterprise Ireland, as follows:
Coordination support for academics to facilitate preparatory work for FP7 proposals where the Irish partner intends to occupy the role of coordinator. Under this support line the maximum grant for academic coordinators in any publicly funded research performing institution is €12,500 (was €25.000). Proposals for support are evaluated by the members of the NSN according to: conformity of the

236 Final Report
proposal to the FP7 call, appropriateness and mix of proposed partners, actual costs that are necessary to prepare and submit a proposal, and the potential benefits of the proposed project to the Irish economy
Travel grants for applicants: researchers based in all Irish research performing organisations can apply to facilitate multiple visits abroad to meet research partners in other countries. Eligible costs include travel expenses and subsistence up to €150 per day for visits of typically 3 days duration. The funding does not cover overheads, sabbaticals, conferences, or course work. The application process is very simple and the aim has been to provide these small supports to assist as many applicants as possible, and with the minimum of administrative burden and time delays
Feasibility and Training support Scheme supported by IDA189. The IDA provides financial support to its (multinational) client companies towards the cost of preparing an FP7 proposal. Applications for IDA funding are assessed on the proposed project‟s relevance under one of the FP7 themes, the importance of its scientific contribution to the community, the number and relevance of academic and industrial partners, and the strategic benefits to the company and the Irish
economy190
Support for indigenous companies. The FP7 Feasibility Support Scheme is available to Enterprise Ireland clients (indigenous firms) and aims at financially assisting companies in preparing joint R&D proposals for submission to the EU. The grant support covers the cost of preparing an FP7 proposal. Prior to submission, all applications for funding must be discussed with company assigned Enterprise Ireland Development Advisors. Applicants are also asked to discuss proposed projects with the relevant programme delegate and / or National Contact Point in order to secure closeness of fit with current EU calls for proposals. Eligible costs include salaries, up to a maximum of €1,000 per week, consultancy fees (up to €900 per day and 50% of total expenditure), prototype expenditure (up to 25% of total grant), travel and subsistence (according to conditions), overheads and sundry expenses (up to 30% of wage/salary costs). Eligible groupings are Enterprise Ireland clients who are manufacturing and internationally traded services companies, high potential start up companies, and individuals or groups
Applications for the financial supports listed above are reviewed and assessed by Enterprise Ireland with input from the NCPs and PDs, and the aim so far at least has been to support all „viable‟ applications. The aim has been to significantly enhance the level of support available in order to achieve a measurable and meaningful increase in Ireland‟s involvement in FP7 proposals (in comparison with FP6) and in their success rates in terms of both project participations and funding received. However, more recent analyses of the figures shows that those who have used support from the network receive far larger FP budgets than those who have not sought support.
In addition to the four main types of financial support listed above, the National Support Network has also issued five ‟pilot‟ awards to key national research centres and groups in order to help them to develop a more strategic approach to FP7. These awards are of up to €100k and represent a slightly different tactic in helping research centres rather than individuals with regard to their approaches to FP participation. These larger awards are helping the five recipients (Teagasc, Tyndall, DERI, TSSG,
189 IDA Ireland has national responsibility for securing new investment from overseas in manufacturing and international services sectors and for encouraging existing foreign enterprises in Ireland to expand their businesses.
190 Ireland, knowledge is in our nature (2008) http://www.idaireland.com/business-in-ireland/research-development-and-/incentives-in-rdi/#comp000049c77aab0000001bfc44c2

Final Report 237
and DCU) to develop their own strategies and to recruit dedicated individuals to help with implementation of those strategies.
The Irish support system, through its financial grants, actively supports the use of private sector consultants to help preparing bids. Experience with the schemes have led EI to be more restrictive in the share of funding that these consultancies receive from the grant. Experience shows that lack of involvement from the firm leads to unsuccessful proposals. Nevertheless if the quality of the consultancy is good it can clearly help the firms to get better proposals and thus a better chance of winning. The last few years have seen a growth of private sector activity on this domain, where they are also moving from helping proposal writing to also offering project management support. While some are highly specialised and of high quality, more and more consultancies are broadening their scope into areas outside their expertise or capacities. When assessing proposals for financial support EI does take a critical view on the match between the firm and the suggested private sector consultant. It would persuade a company to change their consultant if a lack of quality or mismatch is obvious from the point of view of the funders.
There is no specific target group, although there is a tendency to spend more efforts on the most advanced partners and areas where Ireland has most to offer. A shortage of resources asks for a more targeted approach. The support systems at universities is also getting more professional so this helps reducing the amount of support needed for individual academic researchers and more focus on the private sector. The network has made an effort to get the Vice-Chancellors more involved in EU-programmes and that is also showing an increase.
The financial and economic crisis did not have a direct impact on the Irish support network (no budget cuts) but due to restrictions on hiring staff some agencies and councils have experienced difficulties to fill vacant NCP places. In addition due to a cut in national budgets Irish researchers show a larger interest in FP-funding thus increasing the demand for information and support.
The NSN also takes part in Commission support actions such as ERA-NETs or dedicated FP-projects (such as on SME-participation).
A presence in Brussels is seen as very beneficial as it allows the network to establish contacts with Commission staff and other national representatives. The Brussels office provides meeting rooms for Irish project coordinators and participants for project meetings.
The FP6 impact assessment has conducted surveys amongst Irish participants and non-participants to ask their opinion on the support. As regards the ratings of the support provided, the feedback is very positive on the whole, with all of the most actively used providers satisfying the vast majority of their customers, and with only a very small minority stating that they were not satisfied with the help given. The support or assistance provided by the various public agencies appearing in the bottom half of the list attracted neutral ratings from the majority of respondents, but in all cases there was a greater number of satisfied recipients of the support than dissatisfied ones. Even unsuccessful proposers were quite satisfied with the support they had received from various Irish support organisations. A point of concern that the evaluation raised was whether the NCPs could support all actors of all types within a given area of the programme. It is felt that while some NCPs are very experienced and are able to do this, others lack the breadth of experience and understanding to offer a truly effective service, and this can mean that the support in some areas is less effective than in others. Another concern was the concentration of most support in the capital and the perceived focus on a small number of highly successful organisations, while at the same time too little effort to target the less successful target groups.

238 Final Report
Figure 102 FP6 participants‟ use of and satisfaction with FP7 support providers (n=114)
Usage level (share of
respondents)
Dissatisfied or very
dissatisfied
Neutral Satisfied or very
satisfied
National contact points 65% 6% 15% 79%
University Research Offices 57% 14% 14% 71%
Programme delegates 53% 7% 22% 71%
Enterprise Ireland 50% 6% 22% 72%
European Commission 49% 6% 32% 62%
Source: Technopolis, 2009
One of the key challenges for the support network is to take a more strategic approach to FP involvement. The evaluation showed there seems to be a good level of awareness among the PDs and NCPs as to what more needs to be done within their areas and more generally to improve the functioning of the support network. Even among the less experienced NCPs there seems to be a strong sense that the aim is to move beyond the provision of information and one-to-one assistance and towards a more proactive and strategic approach. In particular it is recognised that the FPs remain very competitive and that working only in response mode, reacting to calls as they are issued, places you at a disadvantage vis-à-vis other actors who have been more involved behind the scenes.
3.4.1.4 Finland
The evaluation of Finns in EU FP6 shows a pattern similar to that of Sweden: a relatively high level of funding won by the Higher Education sector and public research sector and relatively low funding won by the industry sector. In addition, participations and projects dropped from FP4 to FP6 but funding increased, so fewer participants are involved in larger projects. However, resources measured by capita show that Finland comes fourth after Sweden, Denmark and Belgium.
The Finnish support structure is decentralised rather than centralised and National Contact Points reside in a number of Finnish organisations. Figure 103 shows how the network has been organised from 2010.
The Finnish Secretariat for EU R&D is the key organisation responsible for promoting information about the EU Framework Programmes. In addition, the National Contact Points (NCPs) and officials at universities and research institutes are working on communication in this field.
Figure 103 Set-up of the Finnish support structure
Source: Secretariat for EU R&D, 2010.

Final Report 239
In 2010 the government funded Finnish support structure consists of 80 people:
30 National Contact Points, mostly in either Tekes or Academy Finland
30 programme delegates and advisory members
4 people at the Finnish Secretariat for EU R&D
14 people in Regional Centres advising on EU
The Finnish Secretariat for EU R&D, which is located at Tekes, offers services to all stakeholders in companies, universities, research institutes, governmental agencies and municipalities free of charge. The Secretariat has a staff of four people full time. One of these staff is a financial expert, another a legal expert at TEKES. One of their main functions is to give general information and advice on EU R&D Framework Programmes. The office also coordinates the Finnish NCP system and monitors Finnish participation in the EU R&D programmes. The network meets four times a year to coordinate activities and share experiences. The Secretariat meets every two weeks and has permanent electronic contacts with the rest of the NCP network.
The official functions of the Secretariat are191:
To inform and advise on FP7 funding opportunities
To answer general questions related to FP7
To communicate relevant information via webpages and electronic newsletter
To publish guides and brochures
To support thematic NCPs
To maintain thematic web pages
To give presentations at seminars
To teach tutor sessions (in cooperation with NCPs)
To coordinate the National Contact Point network in Finland
To analyse statistics on FP participations
To train Finnish stakeholders on general issues related to FP7
To network with the European Commission and other groups
To assist the Ministry of Employment and the Economy (MEE) with questions related to EU policy issues
Two changes have been introduced recently: the establishment of regional advisors, particularly for SMEs in the regions. Another addition to the network is the Ministry of Defence dealing with the security domain.
Although a network of 30 NCPs seems large, most of them work part-time (typically 5-15% of their time) on EU matters and in the rest of their time deal with national programmes and policies. The NCP network outside the Secretariat would consist of 6-8 FTEs in total. The contact persons for EUREKA and COST fall outside this network. However, they are TEKES staff and do have close contacts with the Secretariat within the TEKES organisation.
The reason for this decentralized system is a choice to have NCPs who have thematic expertise and have close relationships with customers. The advantage of this set-up is that the NCPs are also closely related to the national programmes in their fields, so
191 Powerpoint presentation on Finnish EU-Secretariat, 2010 made available by Marja Nykänen

240 Final Report
they know the potential candidates for EU programmes from their national customer base. There is currently a debate on how Finland should position its national policy alongside EU research and innovation policies (e.g. complementarity versus co-funding EU projects). There is a clear movement towards having a more explicit synergy between the two, starting for instance with synchronising funding cycles. This debate is however still ongoing.
The PDs are from the same organizations as the NCPs. Although there is a division of labour between the individual persons, there is no debate about a distinction between a more expert oriented or operative role and a more policy oriented or strategic role.
Finland does not have an NCP or dedicated FP office in Brussels. It is the role of the PD to maintain relations in Brussels. There is however a representative joint office of TEKES and the Academy of Finland in Brussels. They can do support work for the FP network in Finland.
Both the Secretariat and the NCPs provide services and training. While there was a stronger need for practical advice at the start of FP7, today the need for advice is shifting towards more strategic questions: how to influence the work programmes, how to shape the agenda of FP8.
It is the responsibility of the NCP to organize information events on each call in their era, at least two months after the call has opened. General two-day training session with information on how to write good proposals, contracts, how to make budgets and so on, are provided by the Secretariat. This has up to now been mostly done on an ad-hoc basis when there has been demand for it. The Secretariat is shortly moving to a more systematic approach – following the Austrian example – of organising these training sessions throughout the year with fixed dates. Most of the support is given ad-hoc based on bilateral relations between NCPs and the customers; this can be help with partner search or with understanding the programme.
The Secretariat is considering introducing a service where potential applicants can hire a private consultant for their proposal writing. One idea is that these consultants would be certified by the Secretariat, and the network would then communicate the list of certified organisations. There has been no debate on public sector support crowding out private sector consultancies, and this does not seem to be an issue in Finland.
There used to be financial support for proposal writing for coordinators available both at TEKES and the Academy of Finland. It has been decided, however, to stop this funding as it was too small money (5-15K) with relatively lots of bureaucracy. The funding opportunity was hardly used. SMEs still have the opportunity to get some financial support from their regional support centres.
Approximately half the NCPs are involved in some kind of ERA-NET or support action. This is not necessarily related to their NCP function but mainly in their thematic capacity in national programmes.
A strength of the Finnish system is its strong roots in the organisations that also run similar programmes nationally so that the staff involved have thematic experience in the field. Proximity to the customers is considered very important in the Finnish system. The weakness of the Finnish lies in the same decentralised network: the system is fragmented. Many NCPs spend only a fraction of their time (10%) on their FP tasks, which makes a good service impossible.
According to one interviewee an ideal system would have the NCP expertise more concentrated in a smaller number of people, with maybe 5-8 full time NCPs in both TEKES and the Academy of Finland. Another improvement would be stronger ties with the managerial staff of the agencies so that they know what is happening on the European front when they plan and design their national policies.
As in other countries the universities are starting to become more professional and strategic about their FP presence. A small number of the big universities have set up

Final Report 241
good EU support functions. The University of Helsinki for example has ten members of staff dedicated to this. Slowly university management is becoming more interested in integrating EU research policies and funding opportunities in their research planning. This is however a recent trend that has only started to lead to actions.
The financial and economic crisis has mainly effected the participation of the private sector: due to cuts in R&D budgets it is more difficult to convince them to take part in FP projects. It has had no direct effect on the support structure as such. The universities seem to be even more interested. Thus, it is feared that the share of private sector participation will drop even more.
Finland is awaiting the results of the FP7 Mid-term evaluation to publish its own response (likely to be at the end of the year 2010). Stakeholder consultations have already been held.
It is difficult to identify quantifiable measures for the success of the support structure. Of course, participation data are monitored but they are much more affected by other factors such as the economic crisis. The activities of the individual NCPs are monitored. The Secretariat is always looking for better ways to do this and is active in learning from other smaller countries such as Austria, Ireland, the Netherlands, and Switzerland.
3.4.1.5 The Netherlands
The Netherlands is of a similar R&D development level and size as Austria (although twice the size in population) and therefore an interesting comparison for the FP-evaluation in terms of the national support structure. A difference with Austria is that STI-policy is mostly centralised in the Netherlands. Regional authorities and organisations hardly play a role in this policy area and in the (formal) linkages with the Framework Programmes in particular. Thus for this review regional initiatives have not been taken into account.
The Netherlands has demonstrated a strong presence in the successive European
Framework Programmes for Research and Technological Development.192 Despite its small size, the country takes a leading European position in the return on financial investment („juste retour‟) and the absolute number of participations and coordinators. In addition, researchers from Dutch public and private sector organisations have acquired a recognised position in thematic areas such as Life Sciences and Health, Food and Food Safety, ICT and Sustainable Energy.
Compared to other EU countries, the Netherlands‟ participation consists predominantly of public sector organisations based on the number of participations and project coordinators. When looking back from FP6 to earlier FPs, on the whole the share of private sector participations has decreased in line with overall EU developments. Many companies – and in particular SMEs - that participated in earlier FPs (FP4, FP5) did not returned to FP6. At the same time, a smaller group of newcomers from the business sector replaced them in FP6 projects, indicating a dynamic private sector participation composition.
The Dutch EU-support structure is considered to have contributed to the relative success of Dutch participation in consecutive FPs. The following country report gives a sketch of the organisation of the support structure.
While more than one organisation exists for the support for international STI collaboration, in essence the Dutch support system is centralised. Responsibility for support is located in NL Agency, previously known as SenterNovem. The specific unit for support for the European Framework Programmes is called EG Liaison (EGL) and is part of NL Innovation, one of the five divisions of NL Agency.
192 Boekholt, Patries et al., Impact Europese Kaderprogramma‟s in Nederland, Technopolis Group, 2009.

242 Final Report
The International Unit within NL Innovation has three focus areas: EG Liaison for matters concerning the European Commission (FP but also CIP), the EUREKA office and a unit for collaboration outside Europe. The EG Liaison office, which is comparable with FFG-EIP in Austria, employs approximately 29 FTEs (35 people). The Unit is mostly organised around specific FP thematic areas with 1-3 advisors per area. The advisors are domain experts who know the research communities in a particular field. In total, together with the EUREKA and the „other countries‟ units, the international support division has 49 FTEs. The Netherlands has a relatively strong position in EUREKA and therefore this part of the structure is larger than the Austrian EUREKA team.
There is no central budget for EG Liaison Office nor the International Unit of NL Innovation. Budget information on the entire activity is not made public. EGL works on the basis of specific assignments from different ministries. For instance the FP support work it conducts in the area of Food and Food Safety research is funded by the Ministry of Agriculture, Nature and Food Quality. General tasks of EGL are funded by the Ministry of Education, Culture and Science and the Ministry of Economic Affairs. Thus EGL has to serve various „masters‟ and consequently has to report to each of these separately. For some programmes such as the Marie Curie programmes, EGL works together with the Research Council NWO to manage the support actions.
The NL Innovation Agency or Dutch Research Council have no office in Brussels.
EG Liaison offers a number of services to researchers from the public and private sector interested in certain aspects of the Framework Programme. On offer are:
Information events mostly connected to specific thematic calls
Training sessions
Cooperation How-to-Write training (per thematic area)
FP7 coordinator & project manager training
Legal-financial training
Marie Curie Individual Fellowships training
Marie Curie IAPP training
Marie Curie ITN training
ERC Starting grant training
In house training (customized to the client organisation)
Partner search
Publications of which the annual overview on how the Netherlands scored in the FPs by thematic area is the major publication
Knowledge mapping, i.e. an analysis of one multi-user organisation (e.g. a university) on the achievements/patterns of their FP actions (e.g. proposals submitted per thematic are, success rates, ..)
In 2008 EG Liaison organised 22 Information Events with 1125 participants. EG Liaison considers the training sessions as their most important support tool. The highest demand in 2008/2009 is for the training on legal and financial issues and for the ERC Grant applications. Participants are asked a fee for training sessions, varying from €125 to €350.
Partner search is not often used and considered one of the least effective tools by EGL.
While there are many private consultancies offering services for applicants to help them with proposals, it is not considered as „competition‟ as private support is very costly (as a percentage of the proposed budget is required as a fee regardless of success

Final Report 243
or failure) and therefore not often used. Because of this, the role of the public sector to support is still seen as addressing a market failure. The support from private sector consultants to manage consortia and big projects is seen as something that should be kept in the private sector market and is not an area where the public sector will step in.
A service that has come up recently and is considered very successful is the mapping of FP achievements of single organisations, mostly universities. On the basis of historical FP data (proposals, contracts) EGL makes a map for a university, which shows which faculties and departments have submitted proposals, how successful they were in their proposals and whether there are clear thematic patterns (e.g. strengths and weaknesses) emerging from these maps.
The head of EGL sees a number of future developments in the delivery of support:
A stronger focus on the private sector in particular SMEs
A stronger focus on newcomers and downsizing of support to frequent users
A closer interaction with the other support organisations such as the university support offices where they take up the more administrative tasks – e.g. proposal writing, project management - and EGL „strategic intelligence‟ tasks, i.e. providing information that feeds into strategy
The FP support functions at universities are becoming more and more professionalised and embedded in the university management structures. There are however large differences between universities, with some universities having very well resourced units (e.g. Wageningen, Delft University), while others have no coordinating or support units. A strategic interest in EU-funding from university management is increasing, demonstrated also by the interest in having a mapping of EU performance by university department made by EGL.
In addition to support to direct users, another element of the support structures deals with politically influencing choices made on research programmes. This can take shape at different levels, e.g. influencing the shape of the Framework Programme (e.g. influencing FP8), appointing representatives in key advisory boards, taking part in programme committees, mobilising the stakeholders to take part in programming bodies such as Technology Platforms etc.
Formally the political representation of the Netherlands is done by the Permanent Representation (PV) to the EU, based in Brussels. Civil servants from various ministries are seconded to this organisation that is run by the Foreign Office. Two people in the PV deal with research policy. Their home contacts are mainly with the ministries in the Netherlands, not with the FP users. The various ministries with an interest in research have an inter-ministerial working group that mostly aims to inform each other on developments, but has no decision making power.
A principle decision was taken that the Ministries should appoint representative on Programme Committees. EGL considers it a „conflict of interest‟ situation if they on the one hand supported all potential stakeholders and on the other hand took part in more strategic influencing. So formally they do not have a role in, for instance, Programme Committees or other advisory boards. However in practice in some programmes they support the official ministry representatives with their domain knowledge.
The Ministry for Education, Culture and Science and the Ministry of Economic Affairs sponsor the lobby organisation „Nether‟ (Netherlands house for Education and Research), which represents the universities, further education colleges, the Academy of Sciences, the research organisation TNO, the research funding agency NWO, and the organisation of business training centres. Its mission is 1) to enhance the influence of the Dutch institutions on the European policy formulation in the fields of education, research and innovation and 2) to maintain, and where possible to increase, the participation and share of Dutch institutions in European education, research and innovation programmes.

244 Final Report
Its main services are to provide news on developments in research and education and to help their members get into contact with relevant parties in the Commission. The organisation has 2-3 fixed members of staff. However, while increasingly universities make use of the services of Nether to „open doors‟ in Brussels, Nether mostly operate individually when opportunities arise.
The evaluation of the impact of FPs on the Netherlands came to the following conclusions regarding the support structure:
Overall, EU participants were satisfied with the national support infrastructure, and particularly with SenterNovem/EG Liaison (EGL). However, satisfaction varies by thematic area, which is related to the degree of interaction between stakeholders, EG Liaison and the FP community in Brussels. New EGL products – e.g. mapping thematic strength and weaknesses - help organisations such as universities to position their organisation more strategically and are appreciated.
The Dutch EU participants have large expectations of the national support infrastructure with regards to influencing the European Commission in the early stages of defining the thematic areas, the work programmes, the use of instruments, and so forth. The evaluation found there is room for boosting and improving this more strategic support (getting ideas and interests on the FP agenda). The division of labour between ministries and the inter-ministerial activities were non-transparent for many of the stakeholders. For instance who represents the Netherlands on Programme Committees and specific advisory boards is not very well communicated
A presence in the early phases of agenda-setting was considered to become more important as the character of the European RTD activities will change after FP7, for instance in favour of grand challenges and more strategic and programmatic instruments. The Netherlands‟ science and technology community expects a stronger and pro-active role of the Dutch government in this respect. The stakeholder community foresees that a clearer national research agenda will help get across Dutch issues on the European research agenda. This requires a good dialogue with the relevant stakeholder communities. Thus on those more strategic issues it was recommended to develop a more strategic approach.
Partly on the basis of the evaluation a number of actions have been set in motion:
The Netherlands it using its influencing channels to push for simplification
It is revising its policy to only provide information when it is „official‟
It will provide larger transparency as to how the Dutch ministries have organised the representation in Brussels
A review of how to interest industry for the FPs again will be made
A more strategic approach will be taken for instance with Joint Programming Initiatives, JTIs, the Knowledge and Innovation Community (KICS) of the European Institute of Technology etc. and more stakeholder consultations organised around these thematic programmes

Final Report 245
3.4.1.6 Lessons learned
There are a number of challenging topics that each of the national support structures is dealing with:
Finding the right balance between, on the one hand, providing support to the sectors, organisations and researchers that have good chances of winning FP proposals and thus bringing in considerable international funding and, on the other hand, specific attention to newcomers and stakeholders in niche areas (e.g. social sciences, regions of knowledge). The countries in the benchmark for the majority skew in favour of a small number of larger universities and research organisations taking a dominant position in participation numbers. While there is a growing number of experienced FP-participants, the gap between the insiders and outsiders still remains large. It is a tactical decision to either spend the most resources on the successful ones (and thus increasing the chances for success in the short term) or shifting attention to the target groups that have not been interested or successful. Most networks at this moment tend to the former rather than the latter.
In Switzerland, Sweden, the Netherlands, Finland and Ireland the support units within the universities have increased their capacities, resources and professionalism. First line support to individual researchers can be dealt with by these units, rather than the national NCP network. This leaves more room for targeting other stakeholders. However, the degree of professionalism varies considerably from university to university so there is still a need to maintain general support for individual researchers. Many national networks are seeking different ways to support the capabilities of the universities thus freeing up resources for other target groups. The Swiss case is notable as its national support structure is superimposed on the research management units of universities, creating a rather unique network of a national head office and of regional university research management units (who also provide support to outside firms in the respective regions).
All countries are contemplating ways of improving the participation rates of industry and SMEs in particular. No real success stories or good practices of how to approach this can be reported from any of the countries. This may of course have something to do with the FP being primarily suited to research intensive, science-based SMEs and SMEs experienced in R&D cooperation rather than to technologically less capable SMEs. In Finland a principle decision has been taken that the NCPs are also the people who run the national programmes in a particular theme. They thus have strong customer relationships with R&D-funding users.
Domain expertise, customer relationships and good networks in Brussels seem to be key ingredients for the people involved in the support network. Ireland has opted for a very decentralised network in order to have close relationships with national stakeholders and policymakers. The art of establishing good relationships in Brussels is tackled very differently: On the one hand, with a dedicated liaison person or office from the support network in Brussels (person for Ireland, Sweden; office for Switzerland) whose most important task is to network, on the other hand, with programme delegates with good contacts in Brussels who visit Brussels regularly. Also important is a good interaction and collaboration between the PD and NCP in their own countries. This seems to work quite differently in different thematic areas. While Austria and the Netherlands seem to have opted for a deliberate formal split in these roles, Ireland, Sweden and Finland try to create close synergy between the roles.
All support structures are in the process of making a shift in balance from FP information oriented support to more „strategic‟ support. „Strategic‟ support, however, has a double meaning: on the one hand, it refers to influencing work programmes and the FP8 agenda. On the other, strategic support refers to

246 Final Report
consulting clients at a more „strategic‟ level. For example, as in Austria with the strategy talks, support structures in the Netherlands, Sweden and Ireland have began to offer more „strategic‟ consulting to top management of universities and research centres in their countries, to spur them to take a more strategic approach to international collaboration within their organisations. In addition, Ireland and Sweden are trying to make their researchers and companies more aware of the role they could play in strategic forums and expert panels. There is a general awareness that the character of the FP and European research policy has changed, asking for a much more strategic approach rather than relying on good performance through bottom-up proposal success. This puts the national support structure in a different position.
All countries are in a process of deciding how to integrate EU activities and thematic support better with national policies and programmes. Dedicated centralised EU support units – such as those in Austria and the Netherlands - have the advantage of a coherent support structure with critical mass. The disadvantage of such a centralised structure is that it can become isolated from the various ministries and thematic agencies responsible for national policy in various domains. This may be less of an issue in Austria, where the centralised support structure is part of FFG, which administers national RTDI programme. In Ireland, Finland and Sweden the EU support network is positioned closely to the decision makers at the policy level, partly because strong agencies are in charge of policy design and planning.

Final Report 247
3.5 Overall view on FFG-EIP
After having introduced FFG-EIP and its role within the support structure (chapter 3.1), having gone into details of service delivery for various offers (chapter 3.2), we now close the circle with this final chapter on FFG-EIP by looking back at FFG-EIP in its entirety. The focus of this chapter is an overall assessment from the outside (researchers, stakeholders, international experts from foreign NCPs), irrespective of the individual services they may have taken advantage of.
Figure 104 shows the general satisfaction of the researchers with generic aspects of service delivery. Ascan be seen, overall findings are excellent and corroborate earlier user satisfaction analyses conducted by or on behalf of EIP. There is no explicitly expressed dissatisfaction higher than 3% of the user base in any category and the share of users being rather satisfied or satisfied ranges from 89% to 94%. The picture is also independent of organisation type, experience level, role in a project consortium and also location (i.e. there are no statistically significant differences at the 5%-level of confidence).
Figure 104 Satisfaction with generic aspects of service delivery of FFG-EIP, FFG-EIP users in %
3
2
2
1
2
6
4
6
7
9
40
33
34
27
39
51
61
59
65
50
0% 20% 40% 60% 80% 100%
Reachability of staff
Competence of staff
Quality and apporiateness of information provided
Time needed to answer enquirues
Completeness of service portfolio
Not satisfied Rather not satisfied Rather satisfied Satisfied
Source: Main online survey, n = 266
Our qualitative work corroborates these survey findings. Practically all interviewed persons and discussants were very satisfied with the services delivered and the way FFG-EIP handles its tasks. According to them, FFG-EIP staff excelled in terms of commitment, know-how, availability, response time and overall customer-orientation. Questioned right ahead, a large part of the interviewees and discussants had little to no issues at all with FFG-EIP. The following statements reflect this stance:
“FFG-EIP staff always has the right information at the right time.” (focus group discussant)
“It is not unusual to get e-mails from FFG-EIP on Sundays at 21h00”. (focus group discussant)
“The consultants in FFG are excellent even if they do not know everything” (focus group discussant)
“It is as good as it gets for institution involved with the Framework Programmes on a daily basis. But definitely very good.” (respondent in the main online survey)
The work done by FFG-EIP has also led to a high reputation of the support structure within the NCP network, as our international case studies have showed.

248 Final Report
An interesting observation is that the user base is so satisfied with FFG-EIP that many contrast the satisfaction with FFG-EIP to other departments of FFG or other national or regional funding agencies. There were plenty of statements like these:
“I really have nothing negative to say about this department [...] I wish other departments within FFG (and other agencies and authorities) would be as customer-oriented [...] definitely the best part of the whole Austrian Research Promotion Agency [...] .you should rather evaluate [department of FFG]” (respondent of the main online survey)
“An excellent team, but sub-critical if compared to other FFG departments” (respondent in online survey
“When you get to FFG-EIP or the EUREKA office, you feel comfortable and that people want to help you [...] going to other departments you do not see, by a large margin, the same level of commitment [...] perhaps this has something to do with FFG-EIP´s aim of increasing success rates” (focus group participant)
We feel that we need to comment on statements like these – given their high occurrence – and come to the help of the „other‟ departments and funding agencies. The views taken by FFG-EIP customers do not take account of the fact that in the case of FFG-EIP the support unit and the evaluating/funding-decision reaching body are not the same. In the case of „other‟ agencies or agency departments which reach actual funding decisions providing support at the level of FFG-EIP would likely lead to instances of conflict of interest (this is not to say that customer friendliness and service orientation should not be an issue for all agencies). The right unit for such comparisons would be the Commission itself.
For an overall assessment, we also asked FFG-EIP in the main online survey to gauge the extent to which they believed that drawing on the services FFG-EIP has helped increase the quality of the proposals written. Figure 105 shows the results for the question. Around half of the users reported that the quality of proposals had somewhat improved, and 23% reported substantial improvements. 5% stated that most of the time there has been no improvement at all, and 22% stated that it was not possible to gauge the effect.
Figure 105 Extent to which using EIP services have improved the quality of proposals, FFG-EIP users in %
23%
50%
5%
22%
Yes, the quality has improved most of the time substantially.
Yes, the quality has somewhat improved most of the time.
No, most of the time the quality has not improved.
Don´t know/no answer possible
Source: Main online survey, n = 266
We also asked for a general view on the role of different generic factors for a successful proposal. Figure 106 reveals the most important factors for the quality of a proposal to be the fit of the proposal with strategic goals of the Commission (mean value of 3.7 on

Final Report 249
a 4-tier scale from 1=no relevance to 4= high relevance), followed by the experience of the coordinator, the quality of the scientific content (3.6), the reputation of the partners within the consortium (3.5), sufficient time for preparation (3.4) and the quality of the content of the proposal (3.4). All these factors are rated similar (and very high) in importance. By contrast, usage of external advice (such as provided by FFG-EIP) is a significantly lower-rated factor for explaining quality of proposals. However, EIP services help establish and improve the fit if the proposal with the strategic goals of the EU. Hence, the influence of EIP services on the quality of proposals might be higher than the somewhat low figure achieved.
Figure 105 and especially Figure 106 should provide a feeling of what a support structure can at best achieve. The conclusion is that it is still the proposal itself, the people behind it, the quality of the content and the time available that decides its fate. Consulting may lead to improvements, but in the majority of cases these are not (deemed) substantial.
Figure 106 Relevance of different factors for the success of a proposal in the FP or EUREKA *)
2,6
3,4
3,4
3,5
3,6
3,6
3,7
1,0 1,5 2,0 2,5 3,0 3,5 4,0
Usage of external advice (e.g., FFG-EIP)
Quality of general content of the proposal
Sufficient time for preparation
Reputation of partners within the consortium
Quality of scientific content of the proposal
Experience of the coordinator
Fit of the proposal with strategic goals of the EU
*) Arithmetic mean of answers from a scale from 1 = no relevance to 4 = high relevance Source: Main online survey, n = 266
3.6 Conclusions on FFG-EIP
Concluding on FFG-EIP, we assess that FFG-EIP performs very well in delivering services. There are only few reasons for concern in this respect and we have detailed possible improvements at the level of individual services in the preceding chapters, e.g. related to partner search. In essence, this means that FFG-EIP „does things the right way‟ within the current system of institutions and incentives.
The system of incentives for FFG-EIP is manifest in the key performance indicators agreed on between the funding ministries and FFG-EIP in the main FP7 commissioning contract, most notably (i) customer satisfaction, (ii) the scope of customer contacts (i.e. the share of FP projects advices), and the advisory effectiveness („Beratungseffektivität‟; already discussed in chapter 3.3.2.3.).
Collecting customer feedback in a systematic way has evidently helped FFG-EIP to fine-tune its services towards the needs of Austrian researchers and the high levels of satisfaction especially concerning the core activities – information, events, consulting – demonstrate the effectiveness of the chosen approach. There is, however, a certain risk of a lock-in, as the best solution for a problem might sometimes be beyond the scope of FFG-EIP‟s tasks and responsibilities, although the problem might have been identified by EIP.

250 Final Report
The scope of customer contacts is linked to two performance targets: FFG-EIP, together with its regional partners, the RKS, and the organisational contact points, aims at giving advice to 90% of all projects submitted to the FP with an Austrian coordinator and to 60% of projects with Austrian partners. By May 2010, 67% of coordinators and 30.4% of partners had received some kind of advice from FFG-EIP alone. Before we are tempted to search for the respective data from the other institutions involved, we will first have a second look at the indicator. How would the “ideal world” look like according to this indicator?
Obviously, 90% or more of coordinators and 60% or more of partners, i.e. more or less every Austrian participant would be using consulting services, either from FFG-EIP, from a Regional Contact Point or from an organisational contact point. In chapter 3.2.2 we have seen that less than 10% of FP participants do not use some kind of support. As a matter of fact, the targets seem to be reached, more or less – but is this really a useful performance indicator in the relationship between FFG-EIP and its contracting bodies? We think it is not, for the following reasons:
It goes beyond the scope of FFG-EIP‟s activities by including other parties‟ activities. While the RKS are contractually linked with FFG-EIP this is not true for the organisational contact points. No actor should be measured against a performance indicator that measures things beyond the control of the actor.
It is a volume target for a free service which provokes „indefinite‟ demand and which does not contain any incentives for individual and institutional learning.
It conceals the categorical differences between FFG-EIP and the RKS on the one hand and the organisational contact points at universities and research institutes. The first are a public support measure for the latter, but the (from our perspective) key target and direction of this support is not reflected by the indicator: institutional learning and capacity building. A sustainable research system has to be built on strong and independent R&D performers. This idea is also clearly expressed in some of the key R&D policy decisions taken in Austria during the past decade, most notably in the reform of the Austrian university system and in the increasing number of research organisations that are governed through (multi-
annual) performance contracts193. A modern research performer should be capable of managing R&D and R&D funding in-house, seeking assistance only for exceptional rather than for everyday questions – and proposal writing, doing proposal checks, managing projects etc. are (or should become) everyday questions for universities, research institutes (and also for many companies). Our study shows that many of these players have already professionalised and should continue doing so.
The present quantitative performance targets make no distinction between support provided by FFG-EIP and the RKS, and, on the other side, by the research organisations‟ own internal services – when in fact, demand for the former should decrease over time, leading to a re-assessment also of the RKS‟ role, and demand for the latter increase.
Guided by these volume targets, target-group orientation actually turns into market segmentation with the ambition to define at least one target-group for every potential customer: beginners and experienced participants; coordinators and partners; universities, research institutes, large companies, SME (including different kinds of SMEs), and others; individuals, service units, institutions; etc.
To sum up, the issues of performance indicators: we do welcome the idea of moving away from (a large number) of output indicators towards a small number of
193 Of course, neither the law nor the existing performance contracts are ‚perfect‟ but this should not distract us from the greater objective, i.e. strong, autonomous research institutions.

Final Report 251
performance targets. This approach is valuable and effective. However, the present indicators stand for targets that are prone to cause a lock-in situation and to inhibit the desired institutional development in the Austrian research community, especially of experienced research institutes and universities. Moreover, they are not specific enough to actually serve as a basis for decision making (which any performance indicator should!). We recommend that FFG-EIP and its contracting bodies first agree on desirable performance targets and then define indicators suitable to assess progress towards these targets.

252 Final Report
4. Conclusions and recommendations
4.1 The European Context
While this study focuses on impacts of European programmes in Austria and the effectiveness of national support structures during the time of FP6 and FP7, this is the culmination of much longer processes.
We can think of three distinct periods in European research and innovation policy: before 2000, when the Commission aimed mainly to network and stimulate activities at the Member State level; 2000-2010, when building the European Research Area (ERA) and enhancing competitiveness via the Lisbon Agenda and the Open Method of Coordination (OMC) came onto the agenda; and the period from the present, when the Commission is moving towards stronger coordination of research and innovation policy across the Member States but increasingly decentralising this coordination.
At the European level, before 2000 both the Framework and EUREKA were essentially networking instruments, serving to internationalise EU R&D. Since its earliest days the European Union has been expected to justify its R&D support actions in terms of the „added value‟ they might have over the actions of individual Member States. This principle of „subsidiarity‟ implies that actions could be funded at European level only if they could not be sufficiently achieved through actions at national level – or could however be better achieved at European level. The principle of proportionality specified that the EU actions should not go beyond what was needed to fulfil the objectives of the Treaty. In this period, European Added Value was essentially networking – and has clearly resulted in a much more coherent and networked set of R&D communities across Europe.
The year 2000 marked the start of a period in which the Commission has aimed to articulate a European level research policy. However, the idea of ERA has been evolving since it was introduced in 2000. Today the idea is, in effect, to build a globally competitive research and innovation system optimised at the European level.
The creation of an „internal market‟ for research – an area of free movement of knowledge, researchers and technology, which would contribute to an increasing co-operation, and would stimulate competition and a better allocation of resources
A restructuring of the European research fabric; in particular by improved co-ordination of national research activities and policies
The development of a European research policy which would not only address the funding of the research activities, but also all relevant aspects of other EU and
national policies194
FP6 involved increased concern with research (as against the earlier industry policy and impact focus), which should be excellent and in which Europe should build scale. FP6 therefore included new, larger instruments as well as Technology Platforms and ERA-NETs, in which the Commission encouraged groupings within the union to self-organise and try to develop cross-border groupings that would drive R&D and innovation policies for their sectors or technologies. By and large, these bring together existing strong interests and the thrust of the Technology Platforms is continued in FP7‟s JTIs (Joint Technology Initiatives) and increased interest in Article 169/185 consortium arrangements. Key features of these newer initiatives include that
194 COM(2002)565 of 16/10/2002, p. 4.

Final Report 253
They involve stakeholders in selecting themes and in developing programmatic
strategies, as distinct from the apparently more top-down approach195 of the Framework Programme
They rely on variable geometry – not all Member States need to be involved. Where the Commission detects a significant European interest in something that involves a sub-set of Member States, it may intervene.
FP7 marked a significant shift in the Framework. The Treaty text that provides the legal basis for the FP was changed to indicate that it could pursue competitiveness in research as well as economic competitiveness. Launching the ERC also introduced for the first time NSF-style funding of individual Principal Investigators rather than consortia.
DG-ENTR brought its innovation programmes together in the Competitiveness and Innovation Framework Programme (CIP). It has been supplemented with six Lead Market Initiatives, where demand-side stakeholders as well as various EU R&D groupings (such as the ETPs) have been consulted about how to create demand conditions that will encourage innovation in areas where Europe has the potential to supply the innovations. These conditions include public procurement. Both ICT-PSP and the Lead Markets Initiative aim to provide links to the Framework Programme. The linkage is not strong, and in this decade the policies for research and innovation have been developed separately, but these nonetheless do represent some steps towards the kind of „holistic‟ research and innovation policy sought at home by increasing numbers of Member State governments.
EUREKA has moved during the period from a focus on SMEs to include large clusters (e.g. ITEA, MEDEA) with some similarities to the Technology Platforms in their use of self-organisation to define research agendas.
Currently, the strong move towards Joint Programming translates the self-organisation principle from the level of R&D stakeholders to the level of the Member States.
The effect of ERA policy and the shift in focus from networking to restructuring has been to create a very complex European-level funding scene, in which membership of stakeholder groupings is increasingly important and where national governments individually have a reduced influence but need to act more in concert. The new European selection environment increasingly favours the strong, established and well networked. „Structuring‟ the ERA clearly means building on existing strengths to create continental scale and competitiveness, forcing the Member States – especially smaller ones – towards a policy of national specialisation and therefore to develop national research and innovation strategies that are thematically focused. Choices have to be made about where countries are to be strong and where not, and these choices will have to be increasingly conscious. There are many uncertainties about the directions European policy will take – for example, the shape of FP8 is still unclear – but the importance of national prioritisation and strength seems likely only to increase.
One important warning emerges from looking at the nature and development of the European cooperation, which is that – like almost any cooperation – this is consensus-based. Any sensible R&D policy mix must balance the things that can be programmed against those that should not be programmed. The ERC apart, EU cooperation leans heavily towards programming. Our respondents do not associate radical innovation with the Framework Programmes. Some radical innovations may indeed be associated with it, but they will not be unexpected. EU cooperation is no
195 In fact, the design of the FP and its Work Programmes involves a great deal of stakeholder consultation, but the final proposals for programmatic activity come from the Commission Services rather than the other stakeholders.

254 Final Report
substitute for national funding that encourages radical research and disruptive innovation.
4.2 Learning to Play at the European Level
Austrian accession to the EU involved many learning processes, of which learning to make use of and succeed in EU R&D cooperation is but one. The barriers to entry are high, not only in the form of administrative complexity but more importantly because new players must find their way into the social networks involved in participation. This means gradually establishing relationships and credibility, initially by participating as a minor player in FP and EUREKA projects but over time demonstrating capabilities and building the trust needed to participate as a full partner and eventually to coordinate projects. Austrian participation has built up over time and is now strong, with Austria being among the countries that take a greater proportion of the money out of the Framework pot than they put in. Naturally, there are still areas where Austrian participations are small and probably peripheral but there are also areas of significant strength. Overall, Austria has slightly more coordinators than would be expected, suggesting that Austrian FP participants now know well how to play the FP game. Austria‟s major partners in the FP are neighbouring countries, so European collaboration has proved to be a good way to reassert old relations following the fall of communism.
The impact study shows Austrian R&D participants responding to questions in the same way as their colleagues abroad, indicating that they have converged into the mainstream of the programmes. They participate in order to get money, access networks, acquire knowledge and to do things that are not possible at the national level. They produce papers, patents and the other paraphernalia of collaborative research. As in other countries, the expectations of industry and the research sector about what projects will achieve and their accounts of the achieved impacts have converged. The FP, especially, is largely a pre-competitive mechanism in which money, „intermediate knowledge goods‟ and relationships change hands. Industry still emphasises the generation of processes and products more than the research sector, but the difference is far less than earlier in the Framework. Industry and the research sector largely make the same judgements about the ratio of benefit to costs in participation, whereas in the past the companies tended to be distinctly less satisfied than the researchers. Our interpretation is that those who will not benefit from participation now tend to stay out of the collaborations, and this is consistent with the long, slow decline in industrial participation at the European level over FP4-7. There is also a wider group who see no need to go to the European level because their needs are nationally satisfied.
Participants emphasise the importance of the FP as a source of money – though it is clear that they continue to struggle with the administrative burdens involved. The FP is in a certain sense the „funder of last resort‟ – national money is easier to get and to spend – but one has to resort to European cooperation in order to act at the international level or, in some rare cases, to access thematic funding that is not available at national level.
For many, European cooperation has become part of „research business as usual‟. The high degree of international cooperation within our control group clearly shows that the instruments considered here do not hold a monopoly. There is evidence from
elsewhere196 that the gap in international networking (expressed as co-publication by university researchers) between FP participants and non-participants is closing. This suggests there are diminishing marginal returns to further FP „collaboration‟ funding and that the Commission‟s desire to redefine EU R&D policy has some justification. If
196 Arnold, Erik et al., Impacts of the Framework Programme in Sweden, VA 2008:11, Stockholm: VINOVA, 2008

Final Report 255
„structuring‟ the ERA means networking R&D workers, then policy has succeeded. From the European perspective it is time to move on to more radical forms of (re)structuring.
From this study and elsewhere, a rather obvious conclusion emerges: to do well in the competition for R&D resources at European level, you have to be good. „Good‟ means doing high-quality research, connecting to the priorities of the programmes, coping with the administration and managing well. Austrian coordinators get more from the programmes than ordinary participants. There are clear benefits to competence, over and above an increased probability of writing proposals that win. But from this obvious conclusion emerges a non-trivial policy requirement: namely, to develop a strategy and to focus national R&D resources on building areas of national capability, which will serve the national interest as well inside as outside international cooperation.
4.3 The Austrian Support Structure
Like other countries, Austria put in place an organisation – originally BIT, now FFG-EIP – to help the national R&D community learn how to participate in the Framework Programmes and other European cooperation opportunities. Our mandate has not been to evaluate the earlier period, but it seems clear from the current level and quality of Austrian participation and from EIP‟s high reputation among its international peers and customers that this has been a job well done.
BIT/EIP‟s tasks have been modified in the detail over the years, but the core mission has not changed despite the dramatic changes in participation and competence that emerges from looking at Framework Programme participation and impacts. EIP continues to provide advice and subsidy to a grateful R&D community, which rates its services very highly. As with free health care provision, the demand for EIP services seems large –and uncontrollable. On the supply side, this is fuelled rather than controlled by two of EIP‟s own performance indicators, namely to reach 90% of coordinators and 60% of partners participating in FP. Although this includes services provided by the partners in the Austrian support network, it directs attention towards volume. EIP has a high level of resources, compared to other countries‟ organisations performing the same or similar tasks. The key question becomes: Has EIP co-evolved with the Austrian research and innovation system as it has learnt to cooperate internationally or is it overly locked into its original mission? The evidence favours the „lock-in‟ hypothesis.
University reform came only recently to Austria, so the universities are in many respects latecomers to the need to professionalise research management. Leading universities are nonetheless making considerable progress in doing this. In some cases this means they effectively substitute internal service for some of what EIP does; in other cases, they simply do not develop EIP-like capacity, preferring to exploit the free offer from EIP. A priority is for EIP and the universities to agree a re-division of labour, which will no longer discourage the development of fully rounded research management capabilities at the universities. This issue will also have to be addressed in performance contract negotiations between the universities and the BMWF.
The evidence from this study is that proposal grant now chiefly attracts free riders. It should clearly be discontinued. While there is an argument that this subsidy is useful to a minority of institutes, which lack the organisational slack or internal resources to cover the costs of preparing FP proposals, the proposal grant is an inadequate sticking plaster on this large wound. The structural deficiencies in the funding of these institutes need to be tackled directly and with far larger resources, if it is desirable for these institutes to continue. (The only evidence we can add here is that some of these institutes are among Austria‟s leading players in the FP.)
The synthetic „Beratungseffektivität‟ indicator, which is misleading and whose high value is to some extent an artefact, has for a long time been said to drive much EIP activity. While beneficiaries appreciate advice and proposal checks from EP, these

256 Final Report
address non-research aspects of proposals that can and should be addressed by the applicants themselves, based on learning from EIP. Experienced beneficiaries tend to use EIP as an insurance policy: It effectively costs nothing, so why not get the quality check? There is evidence that EIP advice helps the first-time participants learn how to be successful.
The evidence from this evaluation shows that the areas where beneficiaries would most value EIP support involve strategic intelligence: understanding the changes in the Framework Programme; understanding the unwritten rules of international cooperation; gaining influence over parts of the Work programmes. To some extent this reflects a naïve belief that it is possible to gain influence over the Framework – whether its design or the detail of project assessment and resource allocation. But mostly it reflects the need to learn about changes in the funding and cooperation environment.
The overall implications for EIP are thus significant. EIP should refocus its efforts in two directions
Address primarily those segments of the existing customer base who need to learn
Increase efforts in understanding the evolution of international cooperation – not least the plethora of ERA instruments but also the emerging opportunities outside Europe – and interpret these for the Austrian R&D community, so that it can participate as well as possible in activities where rules and circumstances are changing.
4.4 Recommendations
Our recommendations do not only take our empirical findings from our field work into account.
They are based on current theoretical thinking about the rationales for state intervention. The state should not subsidise activities that actors would undertake anyway or that actors are able to do by themselves. It should rather aim to create added value („additionality‟) and induce learning in actors („behavioural additionality‟).
They accommodate the on-going developments at EU level. In particular, we expect the currently more peripheral new instruments to become more important in FP8.
They take into account the key targets of Austrian RTDI policy, in particular the University Law of 2002 with its main goal: re-inventing the universities as strong, autonomous institutions.
Overall, this has created a set of recommendations which, to a large part, aim at strengthening institutions and inducing sustainable learning effects in the system.
Our analysis implies the need for three significant changes in strategic direction for Austrian research and innovation policy
Rejecting the idea of FP participation as a goal in itself and therefore abandoning the goal of maximising participation
Mainstreaming internationalisation in research and innovation policy and re-conceiving it as „globalisation‟ rather than just „Europeanisation‟
Unlocking and adapting its internationalisation support apparatus to focus on promoting behavioural additionality: that is, learning how to understand and participate in new international activities, rather than subsidising the continued performance of activities that have (or should have) been learnt or that should be taken over by other actors.

Final Report 257
European – like global – international cooperation is increasingly essential for success in research as it is in innovation. The reconceptualisation of European research and innovation policy as „optimising at the European level‟ combined with the increasing role of competition at that level means that all European countries must prioritise the development and strength of their own research and innovation systems. Compromising national interests no longer (if it ever did) serves European solidarity; rather, a more globally competitive Europe is being built through the agglomeration of strong national positions. Only the strong can contribute, so strength is a requirement both for European and for national reasons. Weakness implies exclusion from the new Europe as surely as it does from the rest of the world.
It follows that Austria needs to take an instrumental view of the FP and the many other opportunities available for internationalisation. In many cases, we would expect the FP to be a good instrument; but there will just as surely be other cases where going alone or joining forces with Canada, China or Brazil may result in a stronger Austrian position and hence in a stronger European whole. These tactics will emerge at the level of industries, research communities and cross cutting „knowledge collectives‟ and the nature of the tactics will vary from case to case. From the funding perspective, these clusters of interest and stakeholders will often appear as themes or groups of technologies. They will each require thematic strategies and at the national level it will be necessary to decide which are more important and which are less so. The long, slow decline of industrial participation in the FP suggests strongly that strategy needs to take account of industry and not focus solely on research.
To operate these themes effectively and in the national interest requires mainstreaming internationalisation policy and instruments. As the Finnish Research and Innovation Council realised a decade ago, when it demanded that internationalisation be made a part of all research and innovation instruments, the time when it made sense to consider international activities in research and innovation as „nice to have‟ is long gone. And in the context of the increasing marginalisation of Europe in global research and innovation, it would be foolish to limit „internationalisation‟ to the European context. This requires a significant re-think at the policy level and has significant implications at the level of research and innovation instruments.
Re-thinking the goal of internationalisation and mainstreaming it in policy at the national level requires a national debate that goes beyond the „business as usual‟ of dealing with Brussels. Important as the current machinations and consultations about Joint Programming, FP8 and the Grand Challenges are, the Austrian Ministries need to create a space in which to discuss the rest of the world and how Austria‟s research and innovation system will relate to it in the future. They should create a national platform and hold such a debate.
At the more operative level, Austrian research and innovation policy needs a focal point („Koordinationsstelle‟) in the ministries that
Analyses, understands, coordinates and communicates national needs for international cooperation, both at European and at global levels
Communicates to the EU policy level about Austrian national needs and positions
Encourages the mainstreaming of internationalisation
Explains European and global dimensions of research and innovation policy, threats and opportunities to Austria
Acts as a „principal‟ or „intelligent customer‟ for the work of the support system for internationalisation
The Ministries that fund EIP, under the coordination of BMWF, already in many respects collectively perform this role but the function needs to be stronger and to tackle much more than Europe.

258 Final Report
It follows that a new strategy is needed for EIP:
EIP should take on a leading role in understanding and analysing the changing opportunities in R&D cooperation at the European and global levels and using this information to support policymaking as well as the research and innovation communities.
EIP should negotiate a relationship with the universities where it withdraws from routine service provision and becomes a „wholesaler‟ of strategic intelligence to them (and to other customers, notably industry).
EIP should focus its services on those beneficiaries where it can induce behavioural additionality. It can do this partly by rationing or by setting prices for repeat users of its services.
Both proposal grant schemes should be stopped and the resources saved should be reallocated to other activities of the ministries responsible, such as temporary support for the universities in building research management capacity.
EIP is staffed at a level consistent with its original task, which is now largely accomplished. The amount of resource EIP receives should be reviewed in light of the new strategy and activities.
The RKS regional contact points should be functionally integrated into EIP, so that there is a single support system sharing common intelligence and scale and able to tackle not only the European but also the global level. To the extent that these need to have a regional presence, EIP should negotiate locations and financial conditions with the relevant regions.
Last but not least, EIP should focus on tasks and knowledge that are generic to internationalisation. Thematic internationalisation should be mainstreamed into other relevant parts of the research and innovation funding system, whether these are inside or outside FFG.
EIP should itself play a central role in developing its strategy, proactively making this an „offer‟ to its sponsoring ministries. To make this possible, the current contracting arrangement between FFG-EIP and its principals should be treated as a rolling framework with annual renegotiations about activities within an agreed and more or less fixed financial envelope. That will help ensure that EIP continually „rolls over‟ from tasks that have essentially been completed and customer segments where the needed learning has been achieved to tackle new and emerging support needs.

Final Report 259
5. Sources used
Study reports, monitoring data and policy documents
Austrian Institute of Technology, Intellectual Capital Report, 2009
Arnold, Erik, Aström, Tomas, Boekholt, Patries, Brown, Neil, Good, Barbara, Holmberg, Rurik, Meijer, Ingeborg, Mostert, Bastian and van der Veen, Geert, Impacts of the Framework Programme in Sweden, Vinnova Analyses VA 2008:11, Stockholm, 2008
Arnold, Erik, What the Evaluation Record tells us about Framework Programme Performance, Technopolis, Brighton, 2005
Artemis Call Results 2008 and 2009, http://www.artemis-ju.eu/call_2008_projects and http://www.artemis-ju.eu/projects, as of November 30 2010
Austrian Council for Research and Technology Development, Strategy 2020, Vienna, 2009
AVEDAS, CM International, Logo Tech, GOPA, Impact assessment of the participation of SMEs in the Thematic Programmes of the Fifth and Sixth Framework Programmes for RTD, Final Report, March 2010
Bachtler, J., Vironen, H., and Michie, R., EU Funding Programmes 2007-2013: A Comparative Analysis of EU Funding and Policy Support Structures, Report from the European Policies Research Center of the University of Strathclyde, Glasgow, 2007
Bauer-Wolf, Stefan, Scherer, Roland, Zumbusch, Kristina, Ohler, Fritz, ÖROK Projekt „Governance Check“, Ergebnisbericht, 2009
BMWF, Universitätsbericht 2008, Bericht des Bundesministers für Wissenschaft und Forschung an den Nationalrat gemäß § 11 Universitätsgesetz 2002, Vienna, 2008
BMWF, Zukunftsbotschaften des Forschungsministeriums. Strategische Handlungs-felder für Österreichs Frontrunner Strategie 2020, Vienna, 2009
Boekholt, Patries, Bodewes, Hanneke, Enzig, Christien, von Giessel, Jan-Frens, Meijer, Ingeborg, Mostert, Bastian, van der Veen, Geert and Zuijdam, Frank, Impact Europese Kaderprogramma´s in Nederland, Deel II, thematische gebieden, Amsterdam, 2009
Boekholt, Patries, Bodewes, Hanneke, Enzig, Christien, von Giessel, Jan-Frens, Meijer, Ingeborg, Mostert, Bastian, van der Veen, Geert and Zuijdam, Frank, Impact Europese Kaderprogramma´s in Nederland, Deel III, bijlagen, Amsterdam, October 2009
Boekholt, Patries, Bodewes, Hanneke, Enzig, Christien, von Giessel, Jan-Frens, Meijer, Ingeborg, Mostert, Bastian, van der Veen, Geert and Zuijdam, Frank, Impact Europese Kaderprogramma‟s in Nederland, Syntheserapport, Amsterdam, 2009
CREST guidelines, Coordinating the research Framework Programme and the Structural Funds to support Research and Development, 2007
EAGAR (European Assessment of Global Publicly Funded Automotive Research), Benchmarking Analysis Report, 2010
Ehardt-Schmiederer, M., Postl, V., Wimmer, B., Schoder-Kienbeck, M. , Brücker, J., Schleicher, L., Kobel, C. , Boulmé, F. and Milovanović, D., 6. EU-Rahmenprogramm für Forschung, technologische Entwicklung und Demonstration (2002–2006), PROVISO-Bericht, Wien, November 2009

260 Final Report
Ehardt-Schmiederer, Margit et al., 7. EU-Rahmenprogramm für Forschung, tech-ologische Entwicklung und Demonstration (2007–2013), PROVISO-Überblicksbericht, Wien, Herbst 2009
Ehardt-Schmiederer, Margit et al., 7. EU-Rahmenprogramm für Forschung, tech-nologische Entwicklung und Demonstration (2007–2013), PROVISO-Überblicks-bericht, Wien, Frühjahr 2010
ENIAC, Call 2008 projects, based on document GB 65-09, 2008
ENIAC, Call 2009 projects, based on document GB 88-10, 2009
EUREKA Project Portfolio Results 2002 – 2009
Euresearch, Annual Report, Berne, 2009
European Parliament and European Council, Decision No 1982/2006/EC of the European Parliament and of the Council of 18 December 2006 concerning the Seventh Framework Programme of the European Community for research, technological development and demonstration activities (2007-2013), Official Journal of the European Union, 30.12.2006
FCH-JTI, Projects selected for funding: FCH JU Call for Proposals 2008, http://ec.europa.eu/research/fch/index_en.cfm?pg=projects, as of November 30, 2010
Fleck, Christian, ‚Die Entwicklung der Soziologie in Österreich‟, in Rupert Pichler, Michael Stampfer, Wolfgang Polt (Hg.), Steuerung von Wissenschaft? Die Governance des österreichischen Innovationssystem, Wien: Studienverlag, 2010
FWF, FWF-Diskussionspapier zur Situation der Geistes-, Sozial- und Kultur-wissenschaften, Vienna, May 2008
GHK and Technopolis, Interim Evaluation of the Competitiveness and Innovation Framework Programme (2007-2010), Manchester, March 2010
Göksu, Seda, Opportunities for Researchers from the Socio-economic Sciences and Humanities. Analysis of SSH Relevant Topics in Areas other than Theme 8 Socio-economic Sciences and Humanities Work Programmes 2011, Tubitak / Net4Societey, August 2010
Good, Barbara, Arnold Erik and Geyer, Anton COST in Deutschland, Technopolis Vienna/Brighton, August 2010
Good, Barbara, Arnold, Erik, Carlberg, Malin, Javorka, Zsuzsa and Pitsaros, Effie, COST Comprehensive Impact Assessment, Final Report, Technopolis: Vienna/Brighton, December 2009
Haugh, David, Mourougane, Annabelle and Chatal, Olivier, The Automobile Industry in and beyond the Crisis, OECD Economics Department Working Papers No. 745, Paris, 2010
Heppner, Marc, EUROCORES Scheme (European Collaborative Research), Specific Support Action, ESF Final Activity Report, 2009
Holleis, Alexander, Hou, Yue, Hofegger, Werner and Muller Michiel, Publicly funded automotive research in Austria, Country report written in the framework of the European Assessment of Global Publicly Funded Automotive Research EAGAR, Graz/Delft, April 2010
IDEA Consult et al., Impact assessment of the SME-specific measures of the Fifth and Sixth Framework Programmes for Research on their SME target groups outsourcing research, D6 – Final evaluation report, prepared for: European Commission, Research Directorate-General Directorate T – Implementation of Activities to outsource – SME, Brussels, January 2010
IMI, 1st Call Projects, http://www.imi.europa.eu

Final Report 261
Interface, Evaluation Euresearch, Report to the hands of the State Secretariat for Education and Research SER, Lucerne, 2010
León, Lorena Rivera, Miedzinski Michal and Reid, Alasdeir, Cohesion policy and regional research and innovation potential An analysis of the effects of Structural Funds support for Research, Technological Development and Innovation 2000-2010, Brussels: Technopolis Group, 2010
Mayer, Sabine, Fischl, Iris, Ruhland, Sascha and Sheikh, Sonja, Das Angebot der direkten FTI-Förderung in Österreich, Teilbericht 5 – Systemevaluierung der österreichischen Forschungsförderung und -finanzierung, Wien, 2009.
Mühlmann, Kay, Usability-Untersuchung des FFG Webportals zum 7. EU-Rahmenprogramm rp7.ffg.at, Endbericht, Krems, 2009
OECD, OECD Biotechnology Statistics, Paris, 2009.
Ohler, Fritz and Geyer, Anton, KMU-Verbände organisieren Forschungsleistung. Strukturen und Bedingungen in Österreich und Optionen für die Zukunft, Vienna: Technopolis, 2009
Pichler, Rupert, Stampfer Michael and Hofer, Reinhold, Forschung, Geld und Politik – die staatliche Forschungsförderung in Österreich 1945-2005, 2007
Prem, Erich, Wohlkinger, Bernd, Pölz, Patrick M. and Eysin, Ursula, Grundlagen einer IKT Forschungsstrategie für Österreich, 2007
Radauer, Alfred, Streicher, Jürgen, Steiner Roald, Kremser, Sigfrid, Baier, Elisabeth and Hemer, Joachim, IKT Standort Wien im Vergleich, Vienna/Karlsruhe: KMU FORSCHUNG AUSTRIA and FhG ISI, 2007
Reid, Alasdeir, Miedzinski, Michal, Bruno, Nelly and le Gars, Gaelle, Synergies between the EU 7th Research Framework Programme, the Competitiveness and Innovation Framework Programme and the Structural Funds, Brussels: Technopolis Group, 2006
Republik Österreich, Regierungsprogramm 2008-2013.Gemeinsam für Österreich, Regierungsprogramm für die XXIV. Gesetzgebungsperiode, 2008
Rietschel. Ernst T.H. (chair), Evaluation of the Sixth Framework Programmes for Research and Technological Development 2002-2006, Report of the Expert Group, Brussels, European Commission, 2009
Sabine Herlitschka (Hg.), Hinaus aus dem Schrebergarten, Die Europäisierung der österreichischen Forschung, Wien: Studienverlag, 2010
Schibany, Andreas et al., Österreichischer Forschungs- und Technologiebericht 2010, 2010
Sheikh, Sonja and Radauer, Alfred, Evaluierung des Projektes PROVISO 2003-2007, Endbericht, KMU Forschung Austria, Wien, 2005
Sheikh, Sonja, Mandl, Irene and Radauer, Alfred, Evaluierung der österreichischen Betreuungsstrukturen für das 6. EU-Rahmenprogramm für Forschung, technologische Entwicklung und Demonstration, Endbericht, KMU Forschung Austria, Wien, 2004
Smith, John H. Mapping Austrian Social and Human Science Research with a View to Participation in the European Research Area / 6th EU Research Framework Programme, Study for the Federal Ministry of Education, Science and Culture, Vienna, April 2002
Staatssekretariat für Bildung und Forschung, Auswirkungen der Beteiligung der Schweiz an den Europäischen Forschungsrahmenprogrammen, Zwischenbericht, Bern, 2009

262 Final Report
State Secretariat for Education and Research, Effects of Swiss participation in EU Research Framework Programmes, Interim Report of the State Secretariat for Education and Research of the Federal Department of Home Affairs of the Swiss confederation, Berne, 2009
State Secretariat for Education and Research, Switzerland‟s Participation in the 7th European Research Framework Programme, Stocktaking report 2007–2008 State Secretariat for Education and Research of the Federal Department of Home Affairs, Berne, 2009
Technopolis, Evaluation of Danish Participation in the 6th and 7th Framework Programmes, Final report, 2009
Technopolis, Evaluation of Danish Participation in the 6th and 7th Framework Programmes, Appendix to the final report, 2009
Technopolis, Evaluation of Framework Programme 6 in Ireland, Condensed version of the final report, Brighton, 2009
Technopolis, Evaluation of Framework Programme 6 in Ireland, Final Report, Brighton, 2009.
Tekes, Finns in the EU 6h Framework Programme, Evaluation of Participation and Networks, Tekes Programme Report 6, Helsinki, 2008
Weber, Michael and Scheer, Günter, Bezüge zwischen EFRE/RWB-Konvergenz und EU-Forschungsinitiativen/z. RP in den österreichischen Bundesländern, 2010
Weber, Michael, Melidis, Konstantin, Scheer, Günter and Pöchtrager, Gerda, Evaluierung Regionale Beratungs- und Betreuungszentren, Endbericht, ÖAR Regionalberatung, Linz, August 2008
Planning documents, contracts and memo reports197
Agreement between BMVIT and BMWFJ on joint contracting of FFG regarding EUREKA support, BMVIT-527.030/00002-III/I1/2008
Annual planning 2007, 2008 and 2009 by FFG-EIP on support activities for FP7 overall
Annual planning 2007, 2008, 2009 and 2010 by FFG-EIP on EUREKA activities
Annual planning 2007, 2008, 2009 and 2010 by FFG-EIP on support activities, broken down by units
Annual planning 2007, 2008, 2009 and 2010 by FFG-EIP on work planned for the network of support structures
Annual report 2008 by FFG-EIP on EUREKA „Special Contract‟
Annual reports 2007, 2008 and 2009 by FFG-EIP on activities related to EUREKA
Annual reports 2007, 2008 and 2009 by FFG-EIP on the proposal grant „science‟ (for 2008 and 2009 separate for BMVIT and BMWF)
Annual reports 2007, 2008 and 2009 by FFG-EIP on work performed for the network of support structures
Annual reports on activities 2007, 2008 and 2009 by FFG-EIP on support activities for FP7 overall
197 In most instances, the memo reports had also annexes such as programme documents or guidelines. For the sake of better readability, these documents have not been listed separately but are subsumed under the respective memo reports

Final Report 263
Annual Reports on activities 2007, 2008 and 2009 by FFG-EIP on support activities for FP7 by different units
Commissioning contract between the Republic of Austria „Special activities concerning selected EUREKA Clusters and umbrellas, as well as the Art. 169 initiative Eurostars‟, GZ 98.231/00002-C1/12/2008
Commissioning contract between the Republic of Austria and FFG on „Austrian Support Structures for FP7‟, GZ BMWF-360.024/4-II/5/2007
Commissioning contract between the Republic of Austria and FFG on „Proposal Grant Science‟, GZ BMWF-360.057/0093-II/5/2006
Commissioning contract between the Republic of Austria and FFG on „EIP-FP7‟, GZ BMWF-360.024/0006-II/5/2007
Commissioning contract between the Republic of Austria and FFG on „support services for the CIP programme‟, GZ 98.182/0003-C1/11/2008
Commissioning contract between the Republic of Austria and FFG on „advice and support of the European technology initiative EUREKA‟, BMVIT GZ 527.031/0002-III/I1/2008 and BMWA-GZ 98.230/0006-C1/12/2007
Contract for execution between the Republic of Austria and FFG-EIP on „executing Eurostars project funding 2009 (Cut-Off Date 2)‟, BMWA GZ 98.230/0015-c1/12/2009
Contract for execution between the Republic of Austria and FFG-EIP on „executing Eurostars project funding 2008 (Cut-Off Date 1)‟, BMWA GZ 98.230/0010-c1/12/2008 and BMVIT GZ 611.774/0002-II/12/2008
FFG Process descriptions 2.5 through 2.9.1 on defined working processes for recurring tasks at FFG-EIP
FFG-EIP memo report 01 „Proaktive Aktivitäten zur Identifizierung und Förderung ausbaufähiger österreichischer Forschungspotenziale‟ (pro-active activities to identify and foster expandable Austrian research potential)
FFG-EIP memo report 02, „KMU im 7. RP‟ (SMEs in FP7)
FFG-EIP memo report 03, „FFG Akademie‟ (FFG-Academy)
FFG-EIP memo report 04, „Kundenzufriedenheit‟ (customer satisfaction)
FFG-EIP memo report 05, „Zusammenarbeit mit nationalen Programmdelegierten, Aufgabenteilung zwischen EIP, Delegierte im Bezug auf die Förderung der Teilnahmen österreichischer Forscher/innen im 7. RP; Informationsflüsse zwischen EIP, Delegierten und PROVISO (Kooperationsverhalten und Interaktion)‟ (Collaboration and division of labour between EIP, programme delegates and PROVISO)
FFG-EIP memo report 06a, „Zusammenarbeit FWF‟ (collaboration with FWF)
FFG-EIP memo report 06b, „Zusammenarbeit mit ÖÄW und anderen‟ (collaboration with the Austrian Academy of Sciences and other institutions)
FFG-EIP memo report 06c, „Kooperation, Abstimmung und Vernetzung mit Universitäten‟ (collaboration and networking with universities)
FFG-EIP memo report 06d, „Kooperation, Abstimmung und Vernetzung mit Advisory Groups und EvaluatorInnen‟ (cooperation and networking with advisory groups and evaluators)
FFG-EIP memo report 07, „Qualitätssicherung im nationalen Betreuungssystem für das 7. EU-Rahmenprogramm‟ (quality assurance in the national support structures for FP7)

264 Final Report
FFG-EIP memo report 08, ‟Partnervermittlung In- und Ausland‟ (matchmaking activities domestically and abroad)
FFG-EIP memo report 09a, „Management abgelehnte Anträge‟ (management of rejected proposals)
FFG memo report 09b, „Anbahnungsfinanzierung‟ (proposal grants)
FFG-EIP memo report 10, „EUREKA auf Basis des Vertrages‟ (EUREKA on the basis of the commissioning contract)
FFG-EIP memo report 11, „EIP im europäischen NCP Netzwerk‟ (EIP within the European NCP network)
FFG-EIP memo report 12a, „Aktuelle Rolle und mögliche zukünftige Entwicklung zur Umsetzung der EFR-Instrumente ETP und JTI‟ (current role and possible future development as regards implementation of the ERA instruments ETP and JTI)
FFG-EIP memo report 12b, „Aktuelle Rolle und mögliche zukünftige Entwicklung zur Umsetzung der EFR-Instrumente Art. 185 Eurostars, Ambient Assisted Living Joint Programme‟ (current role and possible future development as regards the ERA instruments Art. 185 Eurostars, AAL)
FFG-EIP memo report 12c, „Aktuelle Rolle und mögliche zukünftige Entwicklung zur Umsetzung der EFR-Instrumente ERA-Net, ERA-Net plus‟ (current role and possible future development as regards the ERA instruments ERA-Net, ERA-Net Plus)
FFG-EIP memo report 12d, „Kopernikus‟
FFG-EIP memo report 12e, „European Research Council (ERC)‟
FFG-EIP memo report 13a, „Joint Programming‟
FFG-EIP memo report 13c, „Research Infrastructures‟
FFG-EIP memo report 13d, „Einschätzung der Rolle EIP in Bezug auf die ERA-Initiative International Cooperation‟ (assessment of the role of EIP with respect to the ERA initiative International Cooperation)
FFG-EIP memo report 14, „EUREKA Umsetzung‟ (EUREKA implementation)
FFG-EIP Proposal to the ministries concerning general support to FP7, 2007
FFG-EIP Proposal to the ministries concerning support within the network of support structures, 2007
High-Level Group Adoption of the EUREKA Strategic Roadmap 2010-2014, 23/24 June 2010-+

Final Report 265
Appendix A - Survey specifics: Response rates for surveys conducted and usage of INNOMAN data
A.1 Rationale for and implications arising from using INNOMAN data in the main online survey
In creating the survey, it was decided to take advantage of the situation that INNOMAN stores structural data (such as type of organisation, based on research and observations of FFG-EIP staff while providing advice) and participation data (from E-Corda and the EUREKA project database) in INNOMAN. We used this information for identifying the type of organisation the respondent is representing and for determining the role (coordinator vs. non-coordinator) and experience level with the FP and EUREKA programmes. That way, surveyed persons had to answer fewer questions, and consequently – given the thorough schedule of issues that the study team had to enquire into – higher response rates could be anticipated.
However, this approach also has its drawbacks: As FFG-EIP uses data at the post-evaluation, but also pre-contract stage to determine the coordinator role within a project, coordinator changes occurring at the contract stage are not accounted for. This is said to be a negligible source of error. A larger source of error is the fact that persons who have worked on certain FP projects, were in touch with FFG-EIP but have not been named in the proposals are not correctly identified as having participated in FP or EUREKA projects. Hence, INNOMAN systematically underestimates the „true‟ level of participation in FP and EUREKA project at person level. Further sources of error are incorrectly inputted data (during the manual transfer process into INNOMAN) and time lags (arising, from example, from the delay between the time a call has closed and the respective data is made available in E-Corda).
Several safeguards are in place in order to improve the quality of the data. The most important measure is the cleaning of the data received from E-Corda and the programme delegates by FFG-EIP staff. For example, if the person coordinating a project is not named or if the name makes no sense, FFG-EIP calls up the respective organisation and corrects the entry accordingly. Not the least because of this procedure, the quality of the data – especially with respect to distinguishing coordinators from non-coordinators – is considered to be fairly high. Within the Technopolis survey (and despite the fact that the usage of the structural data in INNOMAN was to avoid additional questions) control and filter questions have been used especially in those places where they could further limit the amount of questions for the respondents. These questions served hence a double role and were particularly useful in accounting for participants not named directly in proposals. Eventually, data pertaining to type of organisation and firm size was validated for the sample of respondents by Technopolis staff. Against this backdrop, we consider the structural data used to be fairly reliable for break-downs – not the least as drawing on survey responses alone would have induced other considerable sources of error.
A2. Response rates for the main online survey conducted
Figure 107 Response rates for main online survey, according to different break-down variables (structural data and participation data)
Contacted [n]
Answered [n]
Response rate [%]
TOTAL 5,774 432 7.5
...Non-university R&D institutions 857 99 11.6
...Universities 2,071 137 6.6
...Industry 2,006 124 6.2

Final Report 266
Contacted [n]
Answered [n]
Response rate [%]
...Other types of institutions 840 72 8.6
...Large firms (more than 249 employees) *) 514 38 7.4
...SMEs (up to 249 employees) *) 1,492 86 5.8
...located in Vienna 2.922 227 7.8
...located in Lower Austria 512 39 7.6
...located in Burgenland 47 3 6.4
...located in Upper Austria 496 48 9.7
...located in Salzburg 216 12 5.6
...located in Carinthia 168 11 6.5
...located in Styria 863 61 7.1
...located in Tyrol 365 26 7.1
...located in Vorarlberg 88 3 3.4
...mentioned as partner in FP6 proposals **) 324 3,479 9.3
...mentioned as partner in successful FP 6 proposals **)
90 894 10.1
...mentioned as coordinator in FP6 proposals **) 81 603 13.4
...mentioned as coordinator in successful FP6 proposals **)
36 209 17.2
...mentioned as partner in FP7 proposals **) 2,570 257 10.0
...mentioned as partner in successful FP7 proposals **)
582 67 11.5
...mentioned as coordinator in FP7 proposals **) 696 105 15.1
...mentioned as coordinator in successful FP7 proposals **)
166 31 18.7
...mentioned as partner in EUREKA proposals **) 330 36 10.9
...mentioned as partner in successful EUREKA proposals **)
82 10 12.2
...mentioned as coordinator in EUREKA proposals **)
66 12 18.2
...mentioned as coordinator in successful EUREKA projects **)
25 7 28.0
...obtained „detailed advice‟ for FP6 1,441 248 17.2
...obtained detailed advice for FP7 2,266 248 10.9
...obtained detailed advice for EUREKA 323 44 13.6
...obtained „detailed advice‟ for other reasons/topics
868 75 8.6
*) Note: INNOMAN declares firms with up to 250 employees as SMEs, whereas the official European Commission definition set the limit at a maximum of 249 employees. We consider this error negligible and use henceforth the official definition of the Commission in the study. **) Note: Each FFG-EIP client can be mentioned 0 to n times as participant in the respective programmes. The figure presented here is the sum of all such „n‟ for the respective break-down. Overall note: Related break-down variables might not always add up to the given total, due to missing values/records. Source: INNOMan and main online survey

Final Report 267
A.3 Response rates for the control group survey
Figure 108 Response rate for the control group
Contacted [n]
Answered [n]
Response rate [%]
TOTAL 4,762 644 13.5
Source: Online survey control group, based on data supplied via FFF-2004 database and FWF data
As we have no information on structural attributes of the people contacted (e.g. the type of organisation they belong to), we cannot calculate response rates for specific groups of respondents. However, we asked respondents what type of organisation they belonged to. As can be seen in Figure 109, there is a particularly high number of SMEs in the sample.
Figure 109 Composition of sample by organisational type
n %
University 60 13.2
Non-university research institution 18 3.9
SME (up to 249 employees) 299 65.6
Large firms 79 17.3
Source: Online survey control group

Final Report 268
Appendix B - Austrian participation data for FP6 and FP7
B.1 Full analysis of Austrian participation in FP6
Overall participation in FP6 by Austrian organisations
The overall statistics on Austrian participation in FP6 provided by PROVISO198 are as follows:
Projects: Austrian organisations were involved in 1,324 projects, out of a total of 9,802. Austrian organisations were therefore involved in 13.51% of all FP6 projects
Participations: The total number of Austrian participations was 1,972, out of a total of 75,951 for the whole of FP6. Austria‟s participations therefore constituted 2.60% of the total
Organisations199: A total of 955 discrete organisations from Austria participated in FP6, out of 32,445 participants (all countries). Austrian organisations therefore constituted 2.9% of all those involved in FP6
Funding: Austrian organisations were allocated a total of €425,351,920 in funding from FP6, out of a total allocation of €16,604,230,373. Austrian organisations therefore received 2.56% of all FP6 funding
FP6 funding received by Austrian organisations
Overall funding
As indicated above, Austrian organisations were allocated a total of €425.35 million in funding from FP6, out of a total allocation of €16.6 billion. Austrian organisations therefore received 2.56% of all FP6 funding.
The average volume of FP6 funding allocated to Austrian organisations per participation was €215.7k. This is 1.3% lower than the average for FP6 as a whole (€218.6k), which explains why Austrian share of FP6 funding (2.56%) was lower than its share of participations (2.60%).
Below we look at FP6 funding allocated to Austrian organisations in more detail in order to assess its performance relative to other EU member states.
Funding received from FP6 in context
Austria‟s „return‟ from FP6 was €425.35 million, or 2.56% of the total EC funding allocations for FP6 as a whole. In 2004 (i.e. at the mid-point of FP6), Austria‟s share of EU GDP (out of the 25 Member States at that time) was 2.2%, so on this basis Austria‟s level of return was slightly above what we might have expected.
Austria‟s share of funding allocations to the EU-25 alone was 2.9%, so on this basis its level of return was even higher (+29%) than we might have expected based solely on its share of EU GDP (2.2%).
Figure 110 lists the EU-25 Member States and shows, for each, total FP6 EC funding allocations200, share of EU-25 FP6 funding, share of EU-25 GDP, and the ratio of share of EU-25 FP6 funding to share of EU-25 GDP. The table is sorted by the final column, so the countries listed towards the top of the table are those where their share of EU-25 FP6 funding allocations were greater proportionately than their share of EU-25 GDP.
Austria‟s position in the table indicates that it was 11th out of the EU-25 in terms of the amount of FP6 funding realised in comparison with its GDP share. Based on this indicator it has performed well, compared to the Czech Republic and Hungary, its neighbouring countries. On the other hand
198 PROVISO data includes the calls ACC/SSA and HYDROGEN and the project contemplated in article 169 but excludes Euratom.
199 Calculated using „uncleaned‟ e-CORDA database 200 FP6 Funding data used in this section was provided by PROVISO.

Final Report 269
Denmark, which is the country of a similar size of GDP to Austria has a higher FP6 income to GDP ratio. Austria‟s „target figure‟ for FP6 income if it were to have been in direct proportion to its GDP contribution to the EU25 total would have been €330 million, so there is a surplus of ~€96 million in FP6 funding to Austria.
Figure 110 FP6 funding allocations to the EU-25 in comparison with GDP
Member State FP6 funding (€ million)
Share of EU-25 FP6 funding
Share of EU-25 GDP (2004)
Ratio FP6 income to GDP
Estonia 33 0.2% 0.1% 241%
Slovenia 76 0.5% 0.3% 198%
Belgium 681 4.6% 2.8% 165%
Sweden 671 4.5% 2.7% 165%
Greece 420 2.8% 1.8% 160%
Malta 10 0.1% 0.0% 158%
Netherlands 1,096 7.4% 4.7% 158%
Finland 336 2.3% 1.4% 156%
Cyprus 28 0.2% 0.1% 153%
Denmark 396 2.7% 1.9% 142%
Austria 425 2.9% 2.2% 129%
Hungary 149 1.0% 0.8% 127%
Latvia 19 0.1% 0.1% 119%
Lithuania 27 0.2% 0.2% 105%
Czech Republic 127 0.9% 0.8% 102%
Germany 2,988 20.0% 21.0% 95%
Ireland 199 1.3% 1.4% 94%
United Kingdom 2,358 15.8% 16.8% 94%
France 2,034 13.6% 15.8% 87%
Portugal 170 1.1% 1.4% 84%
Spain 936 6.3% 8.0% 79%
Poland 215 1.4% 1.9% 74%
Italy 1,454 9.8% 13.2% 74%
Slovakia 35 0.2% 0.3% 73%
Luxembourg 21 0.1% 0.3% 55%
EU25 14,905 100.0% 100.0% 100%
Source: FP6 participation data processed and revised by PROVISO (PROVISO, June 2010) and Eurostat (GDP data)
Below, we provide similar data comparing the share of EU25 FP6 funding to the share of: (i) population, (ii) gross expenditure on research and development (GERD), and (iii) total researchers
(FTE)201.
Figure 111 shows the comparison between FP6 funding and population in 2004 for each of the EU-25 Member States. Austria‟s share of the total EU-25 population was 1.8%, while its share of FP6 funding amongst the EU-25 was 2.9%. So on this basis Austria‟s level of return was considerably higher than (more than 60% above) what might have been expected, given its population size.
201 Comparative data for po.pulation, GERD and total researchers for the EU-25 Member States used in this section are Eurostat figures.

Final Report 270
The ratio of Austria‟s share of FP6 funding to its share of population amongst the EU-25 was 161%, placing it 6th out of the EU-25. Sweden, which has the highest ratio of FP6 income to population, is also the most similar EU-25 country to Austria in terms of population. Regardless of this, Austria‟s performance in acquiring FP6 funding factored by its level of population was better than all neighbouring countries such as Hungary and the Czech Republic, which both have roughly the same population.
Austria‟s „target figure‟ for FP6 income if it were to have been in direct proportion to its share of EU25 population would have been €264 million, so there is a surplus of ~€161 million in FP6 funding to Austria.
Figure 111 FP6 funding allocations to the EU-25 in comparison with population
Member State Share of EU-25 FP6
funding Share of EU-25 Population
(2004) Ratio FP6 income to
Population
Sweden 4.5% 2.0% 230%
Denmark 2.7% 1.2% 226%
Netherlands 7.4% 3.5% 208%
Belgium 4.6% 2.3% 202%
Finland 2.3% 1.1% 198%
Austria 2.9% 1.8% 161%
Ireland 1.3% 0.9% 152%
Luxembourg 0.1% 0.1% 144%
United Kingdom 15.8% 13.0% 122%
Slovenia 0.5% 0.4% 117%
Greece 2.8% 2.4% 117%
Cyprus 0.2% 0.2% 116%
Germany 20.0% 18.0% 112%
France 13.6% 13.6% 101%
Malta 0.1% 0.1% 77%
Italy 9.8% 12.6% 77%
Estonia 0.2% 0.3% 75%
Spain 6.3% 9.2% 68%
Portugal 1.1% 2.3% 50%
Hungary 1.0% 2.2% 45%
Czech Republic 0.9% 2.2% 38%
Latvia 0.1% 0.5% 25%
Lithuania 0.2% 0.8% 24%
Slovakia 0.2% 1.2% 20%
Poland 1.4% 8.3% 17%
EU25 (millions) €14,905 459
Source: FP6 participation data processed and revised by PROVISO (PROVISO, June 2010) and Eurostat (GDP data)
Figure 112 shows the comparison between FP6 funding and intramural research & development expenditure (GERD) in 2004 for each of the EU-25 Member States. Austria‟s contribution towards total EU-25 GERD was 2.7%, while its share of FP6 funding amongst the EU-25 was 2.9%. On this basis Austria‟s level of return was therefore slightly higher than what might have been expected, given its level of R&D expenditure.
The ratio of Austria‟s share of FP6 funding to its share of GERD amongst the EU-25 was 105%, placing it 19th out of the EU-25. Based on GERD, countries of similar level of R&D expenditure to

Final Report 271
Austria are Finland and Belgium. While Austria performed relatively better than Finland, Belgium‟s ratio of FP6 income to GERD is over 50% higher.
Austria‟s „target figure‟ for FP6 income if it were to have been in direct proportion to its GERD contribution to the EU25 total would have been €406 million, so there is a surplus of ~€20 million in FP6 funding to Austria.
Figure 112 FP6 funding allocations to the EU-25 in comparison with GERD
Member State Share of EU-25 FP6
funding Share of EU-25 GERD
(2004) Ratio FP6 income to GERD
Cyprus 0.2% 0.02% 764%
Malta 0.1% 0.01% 541%
Greece 2.8% 0.53% 532%
Estonia 0.2% 0.04% 516%
Latvia 0.1% 0.02% 521%
Slovakia 0.2% 0.09% 263%
Hungary 1.0% 0.37% 267%
Slovenia 0.5% 0.20% 259%
Lithuania 0.2% 0.07% 254%
Poland 1.4% 0.59% 245%
Portugal 1.1% 0.58% 199%
Belgium 4.6% 2.80% 163%
Netherlands 7.4% 4.54% 162%
Czech Republic 0.9% 0.57% 150%
Ireland 1.3% 0.95% 140%
Spain 6.3% 4.64% 135%
Italy 9.8% 7.91% 123%
Denmark 2.7% 2.54% 105%
Austria 2.9% 2.72% 105%
United Kingdom 15.8% 15.46% 102%
Finland 2.3% 2.72% 83%
Sweden 4.5% 5.40% 83%
France 13.6% 18.50% 74%
Germany 20.0% 28.49% 70%
Luxembourg 0.1% 0.23% 62%
EU25 (millions) €14,905 €192,946
Source: FP6 participation data processed and revised by PROVISO (PROVISO, June 2010) and Eurostat (GDP data)
Finally, Figure 113 shows the comparison between FP6 funding and the number of FTE researchers in 2004 for each of the EU-25 Member States. Austria‟s contribution towards the total number of researchers in the EU-25 was 2.14%, while its share of FP6 funding amongst the EU-25 was 2.85%. Austria‟s level of return was therefore higher than what might have been expected, given its share of the total number of researchers in the EU-25.
The ratio of Austria‟s share of FP6 funding to its share of EU-25 researchers was 133%, placing it 9th out of the EU-25, just ahead of Denmark, which is the European country with a similar level of FTE researchers.

Final Report 272
Austria‟s „target figure‟ for FP6 income if it were to have been in direct proportion to its share of EU25 FTE Researchers total would have been €320 million, so there is a surplus of ~€106 million in FP6 funding to Austria.
Figure 113 FP6 funding allocations to the EU-25 in comparison with total (FTE) researchers
Member State Share of EU-25 FP6
funding Share of EU-25 FTE researchers (2004)
Ratio FP6 income to FTE researchers
Cyprus 0.19% 0.05% 385%
Netherlands 7.35% 3.43% 214%
Greece 2.82% 1.45% 194%
Malta 0.07% 0.04% 187%
Belgium 4.57% 2.68% 171%
Italy 9.75% 5.95% 164%
Slovenia 0.51% 0.33% 153%
Ireland 1.33% 0.91% 147%
Austria 2.85% 2.14% 133%
Denmark 2.66% 2.16% 123%
Sweden 4.50% 4.03% 112%
United Kingdom 15.82% 14.54% 109%
Germany 20.05% 22.32% 90%
Luxembourg 0.14% 0.17% 85%
France 13.65% 16.71% 82%
Hungary 1.00% 1.23% 81%
Estonia 0.22% 0.28% 80%
Spain 6.28% 8.34% 75%
Portugal 1.14% 1.71% 67%
Finland 2.25% 3.39% 66%
Czech Republic 0.85% 1.35% 63%
Latvia 0.13% 0.27% 46%
Lithuania 0.18% 0.61% 30%
Poland 1.44% 5.03% 29%
Slovakia 0.24% 0.89% 27%
EU25 (millions) €14,905 1.2%
Source: FP6 participation data processed and revised by PROVISO (PROVISO, June 2010) and Eurostat (GDP data)
*A figure for the number of FTE researchers in Greece is unavailable for 2004. An average of 2003 and 2005 figures has been used instead

Final Report 273
FP6 participation by type of organisation
FP6 participations by organisation type
The standard e-CORDA classification of participants in FP6 by organisation (or „activity‟) type contains four main categories. Figure 114 compares the breakdown of Austrian participations by activity type with the breakdown for all FP6 participations. It should be noted that the figures are known not to be 100% accurate due to variability in the categorisation of organisations by activity type, wherein the same organisation is often allocated to several different activity types across their various participations.
These limitations notwithstanding, the data indicate that Austrian participation profile differs to a limited extent from that of FP6 as whole. HEIs from Austria account for slightly more of the Austrian total (37%) than the FP6 average (36%), while Austrian research institutes account for less than the FP6 average (25% versus 28%). These minor deviations indicate that Austrian participations are roughly in line with the overall FP6 profile, however the Higher education system has stronger participation in FP than the research institutes.
Austrian industry‟s share of participations was also in line with the average for FP6. Participations by „other‟ organisations (mainly public sector bodies) from Austria were at a level above the FP6 average (20% for Austria as compared to 17% for FP6 overall).
Figure 114 Breakdown of Austrian FP6 participations and all FP6 participations, by Activity Type
Activity Type Number of participations - Austria Number of participations – FP6 overall
Higher Education 702 (37%) 26,490 (36%)
Industry 343 (18%) 13,908 (19%)
Research Institutes 479 (25%) 20,621 (28%)
Other 386 (20%) 12,371 (17%)
Total 1,945 (100%) 74,400 (100%)
Source: FP6 participation data (E-CORDA, September 2009)
In addition to the above comparison, Figure 115 presents a more realistic distribution of Austrian participations, based on „cleaned‟ data provided by PROVISO. Despite the fact that this data offers a more specific distribution and does not contain any unidentified cases, the equivalent data for FP6 overall is not available and therefore we rely on e-CORDA for Austria-Overall FP6 comparison. On the top of „Higher Education Institutions‟ (HEIs) and „Research Centres‟ PROVISO identifies two types of industrial organisations, „Large Enterprises‟ and „Small and Medium Enterprises‟ (SMEs), and „Non-research public bodies‟.
This breakdown shows a much stronger industrial participation than the official e-CORDA table and identifies SMEs as the main driver of this trend.
Figure 115 Breakdown of „cleaned‟ Austrian FP6 participations
Activity Type Number of participations - Austria Share of Austrian all participations - Austria
Higher Education 712 36%
Research Centres 389 20%
Large Enterprises 164 8%
SMEs 309 16%
Non-research public sector 68 3%
Other 330 17%
Total 1,972 100%
Source: FP6 participation data processed and revised by PROVISO (PROVISO, June 2010)
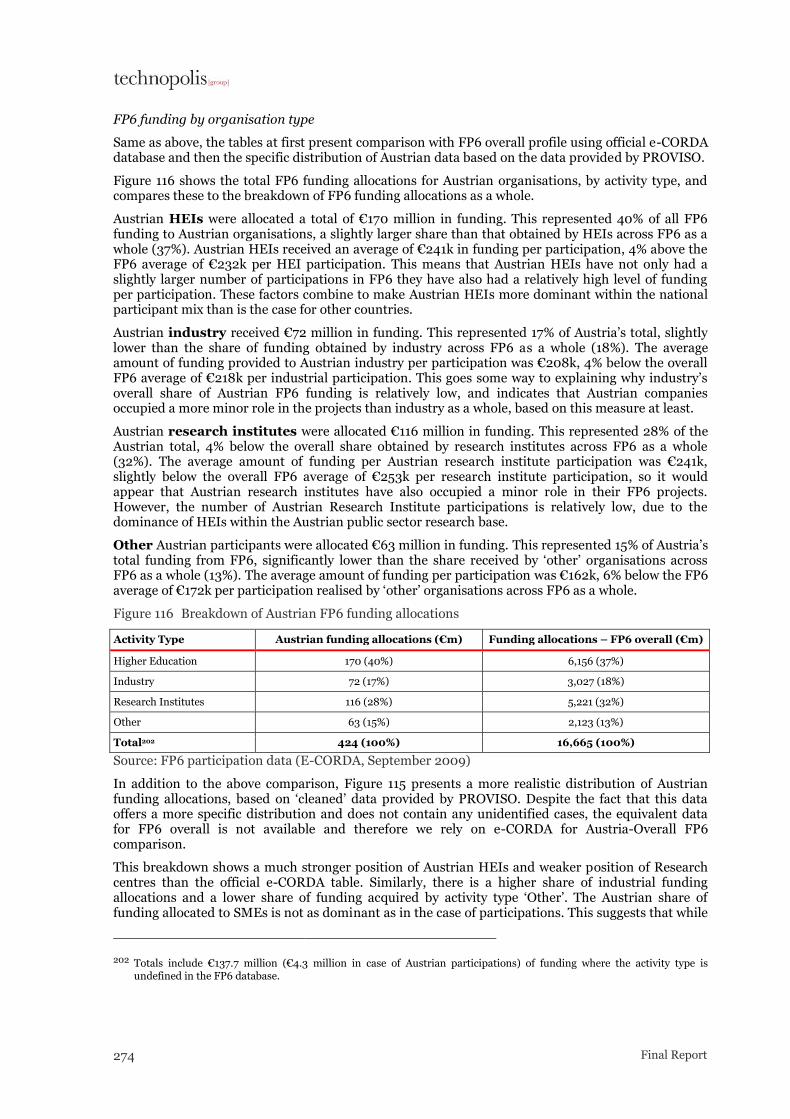
Final Report 274
FP6 funding by organisation type
Same as above, the tables at first present comparison with FP6 overall profile using official e-CORDA database and then the specific distribution of Austrian data based on the data provided by PROVISO.
Figure 116 shows the total FP6 funding allocations for Austrian organisations, by activity type, and compares these to the breakdown of FP6 funding allocations as a whole.
Austrian HEIs were allocated a total of €170 million in funding. This represented 40% of all FP6 funding to Austrian organisations, a slightly larger share than that obtained by HEIs across FP6 as a whole (37%). Austrian HEIs received an average of €241k in funding per participation, 4% above the FP6 average of €232k per HEI participation. This means that Austrian HEIs have not only had a slightly larger number of participations in FP6 they have also had a relatively high level of funding per participation. These factors combine to make Austrian HEIs more dominant within the national participant mix than is the case for other countries.
Austrian industry received €72 million in funding. This represented 17% of Austria‟s total, slightly lower than the share of funding obtained by industry across FP6 as a whole (18%). The average amount of funding provided to Austrian industry per participation was €208k, 4% below the overall FP6 average of €218k per industrial participation. This goes some way to explaining why industry‟s overall share of Austrian FP6 funding is relatively low, and indicates that Austrian companies occupied a more minor role in the projects than industry as a whole, based on this measure at least.
Austrian research institutes were allocated €116 million in funding. This represented 28% of the Austrian total, 4% below the overall share obtained by research institutes across FP6 as a whole (32%). The average amount of funding per Austrian research institute participation was €241k, slightly below the overall FP6 average of €253k per research institute participation, so it would appear that Austrian research institutes have also occupied a minor role in their FP6 projects. However, the number of Austrian Research Institute participations is relatively low, due to the dominance of HEIs within the Austrian public sector research base.
Other Austrian participants were allocated €63 million in funding. This represented 15% of Austria‟s total funding from FP6, significantly lower than the share received by „other‟ organisations across FP6 as a whole (13%). The average amount of funding per participation was €162k, 6% below the FP6 average of €172k per participation realised by „other‟ organisations across FP6 as a whole.
Figure 116 Breakdown of Austrian FP6 funding allocations
Activity Type Austrian funding allocations (€m) Funding allocations – FP6 overall (€m)
Higher Education 170 (40%) 6,156 (37%)
Industry 72 (17%) 3,027 (18%)
Research Institutes 116 (28%) 5,221 (32%)
Other 63 (15%) 2,123 (13%)
Total202 424 (100%) 16,665 (100%)
Source: FP6 participation data (E-CORDA, September 2009)
In addition to the above comparison, Figure 115 presents a more realistic distribution of Austrian funding allocations, based on „cleaned‟ data provided by PROVISO. Despite the fact that this data offers a more specific distribution and does not contain any unidentified cases, the equivalent data for FP6 overall is not available and therefore we rely on e-CORDA for Austria-Overall FP6 comparison.
This breakdown shows a much stronger position of Austrian HEIs and weaker position of Research centres than the official e-CORDA table. Similarly, there is a higher share of industrial funding allocations and a lower share of funding acquired by activity type „Other‟. The Austrian share of funding allocated to SMEs is not as dominant as in the case of participations. This suggests that while
202 Totals include €137.7 million (€4.3 million in case of Austrian participations) of funding where the activity type is undefined in the FP6 database.

Final Report 275
SMEs participate substantially more than their large counterparts, the amount of funding they obtain per participation is much lower (263k per participation for large enterprises and 169k per participation in case of SMEs).
Figure 117 Breakdown of „cleaned‟ Austrian FP6 funding allocations
Activity Type Austrian funding allocations – Austria (€m)
Share of all Austrian funding allocations - Austria
Higher Education 175 41%
Research Centres 102 24%
Large Enterprises 43 10%
SMEs 52 12%
Non-research public sector 9 2%
Other 44 10%
Total 425 100%
Source: FP6 participation data processed and revised by PROVISO (PROVISO, June 2010)
Numbers of Austrian organisations participating in FP6
Figure 118 shows a breakdown of the number of Austrian organisations of each type participating in FP6 and compares this to the overall numbers for FP6 as a whole (i.e. all countries), using e-CORDA data. It should be noted that this analysis is based on FP6 participation data that has not been „cleaned‟. As we have indicated above, it is not possible to provide completely accurate figures for the numbers of organisations participating in FP6 because in many cases the same organisation appears under slightly different names within the participation database. The distribution shows a lower share of industrial organisations and research institutes, and a higher share of discrete HEIs and organisations with activity type „Other‟, The higher relative number of HEIs might be caused by specificities within Austrian education system which recognises universities and „Fachhochschulen‟.
Figure 118 Austrian FP6 participants, by Activity Type
Activity Type AT organisations All FP6 organisations
Higher Education 211 (22%) 6,287 (20%)
Industry 250 (26%) 9,389 (30%)
Research Institutes 202 (21%) 7,479 (24%)
Other 267 (28%) 8,265 (26%)
Total203 965 (100%) 31,420 (100%)
Source: FP6 participation data (E-CORDA, December 2009)
FP6 top 10 participating organisations
In order to find the most frequently participating organisations from Austria within each of the six extended activity types, we used the data processed and revised by PROVISO. This database provides a better source of information as it has been „cleaned‟ from names of organisations with different spelling.
Figure 119 and
Figure 120 list the top 10 performing organisations in each activity type based on their number of participations in FP6.
203 These figures do not include participants whose activity type was unidentified and include the respondents who had assigned themselves to multiple activity types.

Final Report 276
Figure 119 Top 10 AT Participating organisations in FP6 based on number of participations (1-3)
Higher Education Research Institutes Large enterprises
TU Wien ARCS (now AIT) AVL List Gesellschaft für Verbrennungskraftmaschinen und Meßtechnik
Universität Wien ÖAW Siemens Österreich
TU Graz Joanneum Research Telekom Austria
Medizinische Universität Wien Profactor Produktionsforschungs GmbH ÖBB
Universität Innsbruck ARC – Arsenal (now part of AIT) EV Group, E. Thallner GmbH
Universität für Bodenkultur Forschungsinstitut für Molekulare Pathologie - Research Institute of Molecular Pathology GmbH
Frequentis Nachrichtentechnik
Universität Linz AMOR Forschungsgesellschaft Mobilität VCE Fritsch-Chiari Bauträger / VCE Holding
Universität Graz Dr. Friedrich Hinterberger; Verein zur Förderung eines Sustainable Europe Research Institute; SERI
Österreichische Autobahnen- und Schnellstraßen-Akt
Universität für Bodenkultur - ZSI
IFS - Interdisziplinäres Forschungszentrum Sozialwissenschaften (ICCR - Interdisciplinary Centre for Comparative Research in the Social Sciences)
MAGNA STEYR Fahrzeugtechnik AG & Co KG
Medizinische Universität Innsbruck
Techno-Z Forschungsgesellschaft (now Salzburg Research Forschungsgesellschaft)
Infineon
Source: FP6 participation data processed and revised by PROVISO (PROVISO, June 2010)
Figure 120 Top 10 AT Participating organisations in FP6 based on number of participations (4-6)
SMEs Non-research public sector Other
BOC Information Technologies Consulting AG
Bundesministerium für Verkehr, Innovation und Technologie
FFG
EUTEMA Dr. Prem KEG Bundesministerium für Bildung, Wissenschaft und Kultur (vorher: Unterricht und kulturelle Angelegenheiten)
IIASA - Internationales Institut für angewandte Systemanalyse - International Institute for Applied Systems Analysis
Konarka Austria Forschungs- u. Entwicklungsges.m.b.H.
Bundesministerium für Land- und Forstwirtschaft, Umwelt und Wasserwirtschaft
Umweltbundesamt GmbH (Federal Environmental Agency)
Polymun Scientific Immunbiologische Forschungs
Bundesamt und Forschungszentrum für Wald - Federal Office and Research Centre for Forests
FWF Der Wissenschaftsfonds
BIOMASSE-KRAFTWERK GÜSSING GMBH & CO. KG
Amt der Niederösterreichischen Landesregierung
HiTec Marketing; Vereinigung High Tech Marketing
RTD Services - DI Andreas Moser Amt der Steiermärkischen Landesregierung
AGES Österreichische Agentur für Gesundheit und Ernährungssicherheit (alt: BFL Bundesamt und Forschungszentrum für Landwirtschaft)
Amynon BioTech GmbH Bundeskanzleramt
Kuratorium für Verkehrssicherheit / Kuratorium für Schutz und Sicherheit (BOARD FOR SAFETY AND PREVENTION)
EFKON AG Österreichische Nationalbibliothek CATT-Central Austrian Training in Technologies
GEOVILLE Informationssysteme und Datenverarbeitung
Stadt Graz dialog<>gentechnik
Hanival Internet Services GmbH Bundesministerium für (wirtschaftliche Angelegenheiten) Wirtschaft und Arbeit
Oberösterreichische Technologie- und Marketinggesellschaft
Source: FP6 participation data processed and revised by PROVISO (PROVISO, June 2010)
Final Report 277
FP6 participation by Thematic Priority Area
The FP6 database does not categorise participating organisations by sector. However, analysis of FP6 participation by Thematic Priority provides an indication of the main research fields in which Austrian organisations were active.
FP6 was made up of three specific programmes, as follows
1. Integrating and Strengthening the European Research Area
2. Structuring the European Research Area
3. Nuclear Research (Euratom)
The first specific programme was split into two main blocks of activities204, as follows:
Block 1 - Focusing and Integrating European research, which included seven Thematic Priorities and three specific activities covering a wider field of research
Life sciences, genomics and biotechnology for health
Information society technologies
Nanotechnologies and nanosciences, knowledge-based multifunctional materials and new production processes and devices
Aeronautics and space
Food quality and safety
Sustainable development, global change and ecosystems
Citizens and governance in a knowledge-based society
Policy support and anticipating scientific and technological needs
Horizontal research activities involving SMEs
Specific measures in support of international cooperation
Block 3 – Strengthening the foundations of the European Research Area (ERA), which included two priority areas as follows:
Support for the coordination of activities
Support for the coherent development of research & innovation policies
The second specific programme was formed into one main block of activities, covering four priority areas, as follows:
Block 2 – Structuring the European Research Area (ERA)
Research and innovation
Human resources and mobility
Research infrastructures
Science and society
The third specific programme was organised into a single area, as follows
Euratom
This gives a total of 17 „priority areas‟ under which FP6 has been organised, and against which the participation data is reported.
Projects, participations and EC funding, by Priority Area
Figure 121 shows the number of Austrian projects and participations, and the volume of EC funding allocated, in each of the 17 FP6 Priority Areas.
204 These were known as Blocks 1 and Blocks 3 – Block 2 formed the second specific programme.

Final Report 278
Due to the differing scales of the different priority areas within FP6 it is not possible to draw conclusions on the performance of Austria from this table, but in terms of numbers alone the Information society technologies, Human Resources and mobility and Sustainable development priority areas were the most significant, with over 180 projects, over 210 participations and in excess of €37 million in funding achieved by Austria in each. The Information society technologies priority dominated in terms of the number of projects participations and by funding allocated to Austrian participants, followed by the Sustainable development area.
In addition to the 17 priority areas recognised by e-CORDA, PROVISO provided the corresponding data for ACC/SSA and Hydrogen calls.
Figure 121 Austrian projects, participations and EC funding, by Priority Area
Priority Projects Participations EC funding
1. Life sciences, genomics and biotechnology 117 182 €52,598,999
2. Information society technologies 266 418 €117,233,069
3. Nanotechnologies and nanosciences 92 153 €46,696,322
4. Aeronautics and space 41 61 €13,751,675
5. Food quality and safety 40 60 €10,597,984
6. Sustainable development 191 308 €70,184,541
7. Citizens and governance 54 68 €9,323,180
Policy support / S&T needs 82 110 €13,665,790
Horizontal research activities – SMEs 78 151 €16,206,600
Support for international cooperation 35 45 €5,379,768
Research and innovation 36 51 €8,184,674
Human resources and mobility 180 210 €37,977,498
Research infrastructures 23 29 €5,862,280
Science and society 31 44 €3,905,518
Support for the coordination of activities 45 63 €11,659,956
Development of R & I policies 6 10 €870,074
Euratom 9 10 €483,653
Total 1,326 1,973 €424,581,581
Source: FP6 participation data processed and revised by PROVISO (PROVISO, June 2010)
Priority Projects Participations EC funding
ACC/SSA* 4 4 €83,313
HYDROGEN** 3 5 €1,170,679
Total, including calls ACC/SSA and Hudrogen 1,333 1,982 €425,351,920
Source: FP6 participation data processed and revised by PROVISO (PROVISO, June 2010)
In order to place the raw numbers shown in Figure 121 in context, Austrian projects, participations and EC funding have been expressed as a share of the FP6 totals for each Priority Area. The results are shown in Figure 122, and arrows () have been used to symbolise whether Austria has performed comparatively strongly or less well in each area, as compared to Austrian overall performance in FP6. For example, across FP6 as a whole Austria accounted for 2.6% of the participations, so we can say that a participation rate of 1.8% in the Aeronautics area is „below average‟ () while involvement in 2.7% of Life sciences participations is „close to average‟ ().
The results indicate that Austria has performed above average in terms of its project share in most areas, taking part in over half of the projects in 14 of the 17 priority areas. Austrian project involvement rates were highest in the Support for the coordination of activities (46%) and Citizens and governance (37%), Sustainable development (29%) priorities.

Final Report 279
The share of participations and funding tend to be a better indicator for actual levels of performance. On these two measures Austrian performance has been strongest in the Support for the coordination of activities, Development of R & I policies, Science and society and Citizens and governance.
PROVISO also provided the corresponding data for ACC/SSA and Hydrogen calls, which were originally not part of e-CORDA database.
Figure 122 Austrian projects, participations and EC funding, expressed as a share of FP6 totals, by Priority Area
Priority Project share Participation share EC funding
Share
1. Life sciences, genomics and biotechnology 20% 2.7% 2.0%
2. Information society technologies 25% 3.0% 3.1%
3. Nanotechnologies and nanosciences 21% 2.6% 3.0%
4. Aeronautics and space 17% 1.8% 1.3%
5. Food quality and safety 22% 1.9% 1.4%
6. Sustainable development 29% 3.0% 3.1%
7. Citizens and governance 37% 3.4% 3.8%
Policy support / S&T needs 16% 2.4% 2.3%
Horizontal research activities - SMEs 16% 2.8% 3.4%
Support for international cooperation 10% 1.8% 1.9%
Research and innovation 15% 2.8% 3.7%
Human resources and mobility 4% 1.8% 2.2%
Research infrastructures 16% 1.7% 0.8%
Science and society 21% 4.3% 5.2%
Support for the coordination of activities 46% 5.4% 6.1%
Development of R & I policies 21% 4.2% 5.0%
Euratom205 n/a n/a n/a
Total 13.5% 2.60% 2.56%
Source: FP6 participation data processed and revised by PROVISO (PROVISO, June 2010)
Priority Project share Participation share EC funding
Share
ACC/SSA* 7% 1.7% 0.3%
HYDROGEN** 43% 4.5% 3.4%
Source: FP6 participation data processed and revised by PROVISO (PROVISO, June 2010)
Figure 123 provides a comparison of average funding per AT participation in AT projects, all participations in AT projects and average participation in all projects, by Priority Area (including ratios of AT funding per participation to others in same/all projects)
Austrian participants in the Policy support /S&T needs, Support for international cooperation, Research and innovation, Development of R & I policies and Science and Society areas received relatively high funding per participation compared to others in the same projects. In the Research and innovation area the volume of funding per Austrian participation is also very high compared to others in all projects. This area is therefore the one where the level of
205 PROVISO data does not include overall FP6 figures in priority area Euratom.

Final Report 280
Austrian involvement and / or the scale of the projects in which Austria is involved is much higher than average for those areas, suggesting that Austrian partners are taking a major role and / or are participating in the more major projects. Horizontal research activities – SMEs is also an area with a high Austrian funding per participation compared to others in all projects however Austrian participants do not seem to receive such high rates compared to others in the Austrian projects. .
PROVISO also provided the corresponding data for ACC/SSA and Hydrogen calls, which were originally not part of e-CORDA database.

Final Report 281
Figure 123 Comparison of average funding per participation in AT projects and in all projects, by Priority Area (including ratios of AT funding per participation to others in same/all projects)
Priority
Average funding amount per AT participation
(AT projects) €
Average funding amount per
participation
(AT projects) €
Average funding amount per
participation
(all projects) €
AT funding per participation compared
to others in the same projects
AT funding per participation
compared to others in all projects
1. Life sciences, genomics and biotechnology 289,005 411,377 375,861 70% 77%
2. Information society technologies 280,462 244,702 270,484 115% 104%
3. Nanotechnologies and nanosciences 305,205 293,628 264,097 104% 116%
4. Aeronautics and space 225,437 381,070 306,681 59% 74%
5. Food quality and safety 176,633 201,820 235,358 88% 75%
6. Sustainable development 227,872 223,461 219,478 102% 104%
7. Citizens and governance 137,106 127,703 124,585 107% 110%
Policy support / S&T needs 124,234 94,570 130,123 131% (H) 95%
Horizontal research activities – SMEs 107,328 95,611 86,811 112% 124% (H)
Support for international cooperation 119,550 78,135 113,102 153% (H) 106%
Research and innovation 160,484 92,505 123,238 173% (H) 130% (H)
Human resources and mobility 180,845 204,081 150,164 89% 120%
Research infrastructures 202,148 467,322 425,685 43% 47%
Science and society 88,762 62,967 73,435 141% (H) 121%
Support for the coordination of activities 185,079 165,447 163,829 112% 113%
Development of R & I policies 87,007 69,097 72,516 126%(H) 120%
Total 216,046 236,452 218,808 91% 99%
Source: FP6 participation data processed and revised by PROVISO (PROVISO, June 2010)
Priority
Average funding amount per AT participation
(AT projects) €
Average funding amount per
participation
(AT projects) €
Average funding amount per
participation
(all projects) €
AT funding per participation compared
to others in the same projects
AT funding per participation
compared to others in all projects
ACC/SSA 20,828 21,945 115,047 95% 18%
HYDROGEN 234,136 270,077 315,856 87% 74%
Source: FP6 participation data processed and revised by PROVISO (PROVISO, June 2010)

Final Report 282
FP6 participation by Type of Instrument
FP6 employed a range of different types of instruments (projects and actions) to implement its priorities, with a different profile of instruments being used within each Priority Area. The eleven instruments employed by FP6 were as follows:
Networks of Excellence (NoEs) – Multipartner projects aimed at strengthening excellence on a research topic by networking the critical mass of resources and expertise around a joint programme of activities. They are aimed primarily at creating a progressive and lasting integration of the research activities of the network partners, while at the same time advancing knowledge on the topic
Integrated Projects (IPs) – Multipartner projects to support objective-driven research, where the primary deliverable is knowledge for new products, processes, services, etc. They should bring together a critical mass of resources to reach ambitious goals aimed either at increasing Europe‟s competitiveness or at addressing major societal needs
Specific Targeted Research Projects (STREPs) – Multipartner research, demonstration or innovation projects to support research, technological development and demonstration or innovation activities of a more limited scope and ambition, particularly for smaller research actors and participants from candidate countries
Coordination Actions (CAs) – Actions to promote and support the networking and coordination of research and innovation activities. They cover the definition, organisation and management of joint or common initiatives as well as organisation of conferences, meetings, the performance of studies, exchanges of personnel, the exchange and dissemination of good practices, setting up of common information systems and expert groups.
Specific Support Actions (SSAs) – Single or multipartner activities intended to complement the implementation of FP6 and may be used to help in preparations for future Community research policy activities. The actions support conferences, seminars, studies and analyses, working groups and expert groups, operational support and dissemination, information and communication activities, or a combination of these.
Co-operative Research Projects (CRAFT) – Undertaken for the benefit of a number of SMEs from different countries on common specific problems
Collective Research Projects (CLR) – Carried out on behalf of industrial associations or industry groupings in sectors where SMEs are prominent, in order to expand the knowledge base of large communities of SMEs
Integrated Infrastructure Initiatives (I3) – Combine, within a single contract, several activities essential to reinforce research infrastructures and to provide an integrated service at the European level. Covers networking activities, provision of access to transnational users, and joint research activities
Specific Actions to Promote Research Infrastructures (II) – To support the integrated provision of infrastructure related services to the research community at European level, inducing a long-term integrating effect on the way research infrastructures operate, evolve and interact with each other and with their users, thus contributing to the development of the European Research Area
Marie Curie Actions (MCAs) – These actions provide a variety of possibilities for individual researchers in different stages of their career as well as for institutions acting as a host for fellows
Article 169 of the Treaty – A financial contribution from the Community to the joint implementation of well identified national research programmes, on the basis of Article 169 of the Treaty. Such a joint implementation requires the establishment or existence of a dedicated implementation structure. Community financial support will be provided subject to the definition of a financing plan based on formal commitments of the competent national authorities.
PROVISO data by type of instrument was organised under 9 headings, combining Collective research projects with Co-operative research projects and Specific Actions to Promote Research

Final Report 283
Infrastructures with Integrated Infrastructure Initiatives. This categorisation has therefore adopted throughout the following sections.
Projects, participations and EC funding, by Type of Instrument
Figure 124 shows the numbers of projects and participations, and the volume of EC funding, achieved by Austrian participants for each of the 10 main types of instrument covered by the FP6 database. As with the Priority Areas, the various instruments were used to a greater or lesser degree across FP6 and so it is not possible to draw firm conclusions on the performance of Austrian participants from this table. However, in terms of numbers alone, Austrian participation was highest for Specific Targeted Research Projects (STREPs), Integrated Projects and Marie Curie Actions, with over 175 projects, over 200 participations and in excess of €37.5 million in funding achieved by Austria for each type of instrument.
Figure 124 Austrian projects, participations and EC funding, by Type of Instrument
Instrument Projects Participations EC funding
Networks of Excellence 76 126 €22,810,466
Integrated Projects 244 437 €162,073,741
Specific Targeted Research Projects 411 588 €133,814,853
Coordination Actions 155 216 €26,022,307
Specific Support Actions 176 243 €23,132,543
Cooperative Research Projects + Collective Research Projects 70 137 €14,846,531
Integrated Infrastructure Initiatives + Specific Actions to Promote Research Infrastructures 14 19 €4,205,107
Marie Curie Actions 177 205 €37,746,372
Art.§ 169 1 1 €700,000
Total 1,324 1,972 €425,351,920
Source: FP6 participation data processed and revised by PROVISO (PROVISO, June 2010)
In order to place the raw numbers shown in Figure 124 in context, Austrian projects, participations and EC funding have been expressed as a share of the FP6 totals for each Type of Instrument. The
results are shown in Figure 125, and arrows () have been used to symbolise whether Austria has performed comparatively strongly or less well for each Type of Instrument, as compared to the Autrian overall performance in FP6. For example, across FP6 as a whole Austria participated in 13.5% of the projects, so we can say that a project participation rate of 18% within STREPs is „above‟
average () while involvement in 4% of the Marie Curie Actions is „below‟ average ().
The results suggest that Austria has performed comparatively strongly in terms of its share of projects for most types of instruments, being involved in almost a half of the Networks of Excellence and more than a third of Integrated Projects which were typically very large actions involving partners from many countries. For most of the remaining instruments Austria was involved in less than a third of all the funded projects and for such a small country this means good exposure to a variety of instruments. Marie Curie Actions and Specific Support Actions both typically involve relatively few countries in each project. The ability of any one country to have a high project involvement rate in these instruments is rather low.
Austria‟s share of the participations and funding associated with each type of instrument is a better indicator of performance, and here we see more variability in the results. In terms of participation, Austrian profile is very much in line with or slightly above its FP6 average in all instruments apart from Marie Curie Actions and Infrastructure projects where Austria underperformed in terms of share of participations and funding.
The main areas of strong performance in terms of funding received by Austrian participants were in Coordination Actions and Cooperative Research Projects combined with Collective Research Projects.

Final Report 284
Figure 125 Austrian projects, participations and EC funding, expressed as a share of FP6 totals, by Type of Instrument
Instrument Project share
Participation share
EC funding share
Networks of Excellence (NoEs) 45% 2.5% 1.8%
Integrated Projects 36% 2.6% 2.5%
Specific Targeted Research Projects 18% 2.7% 3.0%
Coordination Actions 33% 3.1% 4.3%
Specific Support Actions 13% 3.0% 2.8%
Cooperative Research Projects + Collective Research Projects 16% 2.9% 3.7%
Integrated Infrastructure Initiatives + Specific Actions to Promote Research Infrastructures 33% 2.1% 0.8%
Marie Curie Actions 4% 1.8% 2.2%
Art.§ 169206 - - -
Total 13.5% 2.60% 2.56%
Source: FP6 participation data processed and revised by PROVISO (PROVISO, June 2010)
There has been a high degree of interest in the new FP6 instruments – NoEs and IPs, and in particular the suitability of these instruments for different groups of actors. Figure 126 shows the profile of involvement of each of the four main groups of participants in each of these two instruments, overall for FP6 and then for the Austrian only.
The data reveal that overall the participants in NoEs are mainly HEIs and research institutes (56% and 29% of the participations respectively). The profile of Austrian involvement in NoEs shows that most of its involvement has been through the HEI (59%) sector whereas the research institutes were involved only in 7%. This is mostly due to high participation by activity type „Other‟ (31%). Austrian industry had an involvement in only in 3% of NoEs. The Austrian pattern compared to the overall FP6 is in line in HEIs, significantly above in activity type „Other‟ and well below in terms of industry and research institute involvement.
The Figure also shows Austrian and overall FP6 involvement in IPs. Overall, there is high involvement from HEIs, industry and research institutes with much lower participation share by activity type „Other. The Austrian profile is in line with the overall FP6 in HEIs and industry involvement, however there is lower involvement of research institutes and higher involvement of „Other‟ organisations.
Figure 126 Profile of involvement in NoEs and IPs, split by organisation type for all FP6 participants and AT only
Instrument HES IND REC OTH Total
NoEs – all FP6 participations 56% 8% 29% 7% 100%
NoEs – AT only 59% 3% 7% 31% 100%
IPs – all FP6 participations 31% 27% 26% 15% 100%
IPs – AT only 30% 27% 17% 27% 100%
Source: FP6 participation data (E-CORDA, December 2009)
Because of a certain level of inaccuracy in assigning the organisation type in the e-CORDA database we also show the „cleaned‟ profile of involvement based on data, which was processed and revised by PROVISO. This table shows in terms of NoEs, even higher share of participation of HEIs and higher involvement of research institutes than the previous table. This could suggest that the inaccuracies in type selection caused resulted in higher share of activity type other and lower share of research
206 PROVISO data does not include overall FP6 figures in instrument type Article §169.

Final Report 285
institutes in the previous table. Similarly, a more accurate profile of involvement for in integrated projects is shown, however the inexistence of respective overall FP6 data prevents a comparison on this greater detail.
Figure 127 Profile of Austrian involvement in NoEs and IPs, split by „cleaned‟ organisation type
Instrument HES REC Large SME Public OTH Total
NoEs – AT only 61% 25% 1% 6% 1% 6% 100%
IPs – AT only 31% 21% 16% 20% 2% 10% 100%
Source: FP6 participation data processed and revised by PROVISO (PROVISO, June 2010)
Nature of FP6 participation
Participants in the Framework Programmes can occupy the role of project coordinator or are otherwise listed simply as one of the participants. Analysis of Austria‟s FP6 participations reveals that the Austrian partner occupied the role of project coordinator in 213 cases. This means that the Austrian participants were in a coordinating role for 10.8% of all Austrian FP6 participations, slightly above the FP6 average of 8.4%.
Patterns of Austrian coordination by FP6 Priority Area have been analysed, and are shown in Figure 128. It reveals higher than average coordination rates for Austria in 8 of 16 the Priority Areas, particularly in the Support for international cooperation, Science and society, Citizens and governance and Policy support / S&T needs. There were no Austrian coordinators in the area of Research infrastructures, one coordinator in Development of R&I policies and the rates for the rest of the priority areas were roughly in line with the FP6 profile.
Figure 128 Austrian coordination levels by FP6 Priority Area
Priority AT coordinators Coordinator to participant ratio (AT)
Coordinator to participant ratio
(FP6 overall)
1. Life sciences, genomics and biotechnology 23 13% 9%
2. Information society technologies 40 10% 8%
3. Nanotechnologies and nanosciences 11 7% 7%
4. Aeronautics and space 5 8% 7%
5. Food quality and safety 5 8% 6%
6. Sustainable development 18 6% 6%
7. Citizens and governance 10 15% 7%
Policy support / S&T needs 20 18% 11%
Horizontal research activities - SMEs 20 13% 9%
Support for international cooperation 16 36% 13%
Research and innovation 6 12% 13%
Human resources and mobility 21 10% 9%
Research infrastructures 0 0% 8%
Science and society 12 27% 15%
Support for the coordination of activities 5 8% 8%
Development of R & I policies 1 10% 12%
Euratom n/a n/a n/a
Total207 213 11% 8%
Source: FP6 participation data processed and revised by PROVISO (PROVISO, June 2010)
207 Participant‟s role was not specified in 4 cases.

Final Report 286
The likelihood of being a project coordinator varies significantly depending on the type of instrument in which organisations are involved. For example, the NoEs have an average of 30 partners and it is therefore relatively difficult to occupy a high share of coordinator roles within this type of instrument. However, Marie Curie actions have an average of only two partners, so we would expect
to identify a high share of coordinator roles for this instrument.208
Figure 129 presents the number of Austrian coordinators for each type of instrument and the ratio of Austrian coordinators to participants. The average FP6 coordinator to participant ratio for each type
of instrument is also shown for comparison. Arrows () have again been used to symbolise whether Austrian coordination levels for each type of instrument are above, below, or in line with the overall picture. The data indicate that Austrian partners have occupied the role of coordinator to a higher degree than the overall FP6 average for STREPs, Coordination Actions, and Specific Support Actions. The coordination ratio was relatively low in Networks or Excellence. There were no Austrian coordinators in Integrated Infrastructure Initiatives + Specific Actions to Promote Research Infrastructures and the coordination levels of Austrian partners were in line with the FP6 profile in the remaining 3 instrument types. The overall participation data on Article 169 is not available however there was only one such FP6 project.
Figure 129 Austrian coordination levels by type of Instrument
Instrument AT coordinators Coordinator to
participant ratio (AT)
Coordinator to participant ratio
(FP6 overall)
Networks of Excellence (NoEs) 4 3% 7%
Integrated Projects 20 5% 5%
Specific Targeted Research Projects 81 14% 4%
Coordination Actions 20 9% 3%
Specific Support Actions 49 20% 9%
Cooperative Research Projects + Collective Research Projects 20
15% 16%
Integrated Infrastructure Initiatives + Specific Actions to Promote Research Infrastructures 0
0% 10%
Marie Curie Actions 19 9% 8%
Article 169209 0 0% N/A
Total 213 11% 8%
Source: FP6 participation data processed and revised by PROVISO (PROVISO, June 2010)
Figure 130 presents analysis of the activity (organisation) type of the Austrian coordinators. Analysis of the activity (organisation) type of the Austrian coordinators revealed that HEIs and research institutes were most likely to fulfil the role of coordinator, occupying the position of coordinator in 17% and 20% of participations respectively. Industry participants were coordinators in 7% of their participations, while for „other‟ organisations the figure was 10%. This profile is roughly in line with FP6 coordination profile with a minor deviation in higher relative number of research institutes taking on the role of coordinators in Austrian case.
208 PROVISO data includes a large number of participants in the Marie Curie Actions (e.g. individual fellowship holders) that are not included in E-CORDA. This significantly reduces the calculated overall ratio of coordinators to participants for Marie Curie actions – from around 39% (as shown in E-CORDA data) to 8% (as given by PROVISO).
209 PROVISO data does not include overall FP6 figures in instrument type Article §169.

Final Report 287
Figure 130 Austrian coordination levels by type of organisation
Instrument AT coordinators Coordinator to
participant ratio (AT)
Coordinator to participant ratio
(FP6 overall)
Higher Education 121 17% 17%
Industry 25 7% 6%
Research (i.e. organisations only or mainly established for research purposes) 96 20% 17%
Others 38 10% 9%
Total 280 15% 14%
Source: FP6 participation data (E-CORDA, December 2009)
Figure 131 shows the Austrian coordination levels by „cleaned‟ type of organisation provided by PROVISO. Similarly to the table above, research centres have the highest Coordination ratio. Austrian large enterprises had a role of coordinator in 11% of participations, followed by HEIs and activity type „Other‟. SMEs and non-research public organisations found themselves coordinating only in 5% and 3% of participations respectively.
Figure 131 Austrian coordination levels by „cleaned‟ type of organisation
Instrument AT coordinators Coordinator to participant ratio
(AT)
Higher Education 75 10.5%
Research Centres 71 18.3%
Large Enterprises 18 11.0%
SMEs 16 5.2%
Non-research public sector 2 2.9%
Other 31 9.4%
Total 213 10.8%
Source: FP6 participation data processed and revised by PROVISO (PROVISO, June 2010)
Collaboration within FP6 projects
Overall extent of collaboration
One of the main objectives of the Framework Programmes is to promote and support collaboration between European and International actors in the research and technological development sphere.
Through their 1,972 participations in 1,324 FP6 projects the Austrian actors have collaborated with a very large number of other organisations from a very broad range of countries. Overall statistics on the extent of this collaboration are set out below.
Collaboration between Austrian organisations within FP6 projects
With 1,972 participations across 1,324 projects it is clear that in some cases more than one Austrian partner was involved in the same FP6 project. In fact, there were 421 FP6 projects with more than one AT partner involved. The profile of intra-AT collaboration within the 1,324 projects is shown in Figure 132 below and reveals that in the majority of projects involving Austrian partners there was no intra-Austrian collaboration (69%). This means that there was some level of intra-Austrian collaboration in 31% of the projects, and the highest number of Austrian organisations involved in the same project was nine. These data indicate a good level of intra-Austrian collaboration within FP6 projects, suggesting that the projects in many cases provide the potential for knowledge transfer between Austrian organisations as well as between Austria and other countries.

Final Report 288
Figure 132 Number and share of AT FP6 projects with >1 AT partners
AT partners Number of FP6 projects Share of FP6 projects
1 (no intra-AT collaboration) 896 69%
2 271 21%
3 85 7%
4 26 2%
5 14 1%
6 7 1%
7 0 0%
8 0 0%
9 4 0%
Total 1,303 100%
Source: FP6 participation data processed and revised by PROVISO (PROVISO, June 2010)
Collaboration with actors from different countries
The number of participations in FP6 projects with Austrian involvement, excluding the Austrian participations, was 18,865.
Figure 133 presents data on the number and share of participations by actors from other countries within Austrian projects, listing first the 24 (other) EU Member States and then the candidate countries. In volume terms the greatest number and a share of collaborations took place with partners in Germany (17%), followed by the United Kingdom (11%), France (10%), Italy (9%), Spain and the Netherlands (~6% each). The dominant position of Germany as a partner for participation was expected based on the same language and common research priorities as well as strong engineering focus. However, the absolute numbers of participation reflect mainly the high levels of participation in FP6 by these countries as a whole.
A better indicator of the strength of collaboration between Austria and other countries is shown in the final column of Figure 133, which expresses the ratio of each country‟s share of all participations in Austrian projects to their overall share of FP6 participations. Using this indicator, the most active „Member State‟ collaboration partners were Slovenia, Slovakia, Luxembourg, Hungary and Czech Republic and the least active were Spain, France and United Kingdom. Interestingly, four out of top five collaboration partners Austria‟s are neighbouring countries. Despite Germany having a high number of participations in the FP6 overall, it placed 9th based on the formerly-described ratio. This points at a very strong link between these two countries when size of participation is factored out.
Figure 133 Austrian collaboration with actors from different countries: EU Member States and Candidate countries
Country Participations in Austrian projects
Share of all other participations in Austrian projects
Ratio of participation in Austrian projects to overall level of FP6
participation210
EU
Mem
ber
Sta
tes
Austria - - -
Belgium 831 4.4% 107%
Cyprus 68 0.4% 107%
Czech Republic 330 1.7% 123%
Denmark 429 2.3% 102%
Estonia 105 0.6% 108%
Finland 426 2.3% 118%
France 1,798 9.5% 88%
210 Ratios of overall level of participation FP6 by candidate countries has not yet been provided by PROVISO.

Final Report 289
Country Participations in Austrian projects
Share of all other participations in Austrian projects
Ratio of participation in Austrian projects to overall level of FP6
participation210
Germany 3,180 16.9% 117%
Greece 597 3.2% 98%
Hungary 413 2.2% 128%
Ireland 224 1.2% 94%
Italy 1,638 8.7% 94%
Latvia 66 0.3% 120%
Lithuania 85 0.5% 95%
Luxembourg 35 0.2% 133%
Malta 39 0.2% 119%
Netherlands 1,086 5.8% 103%
Poland 533 2.8% 103%
Portugal 275 1.5% 90%
Slovakia 156 0.8% 138%
Slovenia 222 1.2% 141%
Spain 1,155 6.1% 85%
Sweden 711 3.8% 106%
United Kingdom 2,010 10.7% 90%
Ca
nd
ida
te
cou
ntr
ies Croatia 54 0.3% n/a
FYR of Macedonia 17 0.1% n/a
Turkey 125 0.7% n/a
Source: FP6 participation data processed and revised by PROVISO (PROVISO, June 2010)
Figure 134 shows the numbers and share of collaborations with all other (non-member/candidate) countries where the number of participations within Austrian projects was 20 or more. Switzerland and Norway lead in terms of number of participations in Austrian projects with 613 and 296 participations respectively.
Figure 134 Austrian collaboration with actors from different countries: Other countries with >20 participations in Austrian projects
Country Participations in Austrian projects
Share of all other participations in Austrian projects
Ratio of participation in Austrian projects to overall level of FP6
participation211
Co
un
trie
s w
ith
20
+ p
art
icip
ati
on
s in
Au
stri
an
p
roje
cts
Bosnia and Herzegovina 24 0.13% n/a
Brazil 22 0.12% n/a
Canada 32 0.17% n/a
China (People's Republic of) 87 0.46% n/a
Iceland 26 0.14% n/a
India 35 0.19% n/a
Israel 197 1.04% n/a
Norway 296 1.57% n/a
Russian Federation 119 0.63% n/a
Serbia and Montenegro 45 0.24% n/a
South Africa 29 0.15% n/a
Switzerland 613 3.25% n/a
Ukraine 30 0.16% n/a
United States 46 0.24% n/a
Source: FP6 participation data processed and revised by PROVISO (PROVISO, June 2010)
211 Ratios of overall level of participation FP6 by other countries has not been provided by PROVISO.

Final Report 290
Collaboration between different types of organisation
The partners in the Austrian FP6 projects breakdown by activity type as shown in the penultimate column of Figure 135. For comparison, the figure also shows the breakdown of all FP6 participations and all Austrian participations by activity type. The spread of Austrian partners by activity type is broadly in line with the overall participation rates for FP6 overall as well as the Austrian participation profile of HEIs and industry. Austrian partners with activity type „research institute‟ represent only 19%, well under 28% in FP6 overall, despite the Austrian participation for this activity type being 25%. This means that there is a very low share of research institutes that partner with Austrian organisations. As these shares are relative, the higher participation share of Austrian partners is evident in activity type, other which is well above the FP6 overall and Austrian participation profiles.
Figure 135 Partners in Austrian FP6 projects, by Activity Types
Activity Type Participations – AT Participations in AT projects
Participations – FP6 overall
Higher Education 702 (36%) 7,598 (36%) 26,490 (36%)
Industry 343 (18%) 3,678 (17%) 13,908 (19%)
Research Institutes 479 (25%) 5,561 (19%) 20,621 (28%)
Other 386 (20%) 3,990 (26%) 12, 371 (17%)
Total212 1,945 (100%) 21,047 (100%) 74,400 (100%)
Source: FP6 participation data (E-CORDA, December 2009)
AT demand for participation in FP6
This section looks at Austrian participation in proposals submitted to FP6, using the available data to gauge levels of demand and success rates within the competition.
Proposals submitted to FP6 with AT participation
The European commission provided a database containing information on Austrian participation in proposals submitted to FP6. There were 10,333 records in the database. In order to clean the database and make it compatible with overall FP6 proposal dataset stage 1 of 2-stage proposal process and ineligible proposals were both excluded, resulting in 8,302 Austrian participations in proposals. The number of discrete proposals in which Austrian applicants were named was calculated at 5,724. Data published by the Commission indicates that the total number of proposals submitted to FP6 was 47,749, so we can calculate that Austrian participation rate within the proposals was 12.1%. This is an indicator of the level of „demand‟ for participation in FP6 by Austrian organisations.
Figure 136 shows the breakdown of eligible FP6 proposals with Austrian involvement, by priority area. The Figure also shows the breakdown of all eligible FP6 proposals by Priority Area. By comparing all proposals with those with Austrian participation, the final column gives an indication of the relative level of demand for involvement in each area. In terms of numbers alone, proposals with Austrian participation were highest in the Information society technologies, Human resources and mobility and Sustainable development, each with more than 660 participations in proposals.
The Figure 136 also shows the breakdown of all FP6 proposals by Priority Area. By comparing all proposals with those with Austrian participation, the penultimate column gives an indication of the relative level of demand for involvement in each area with the last column showing the rank of relative level of demand. The figure shows that Austrian proposal participation rate was highest in proposals submitted to the IST, Support for the coordination activities, Citizens and governance, Sustainable development priority areas. Austrian participation rates were lowest in Human resources and mobility, Support for international cooperation.
212 The activity type of 35 AT participations, 220 participations in AT projects and 1,010 participations overall in FP6 are unknown.

Final Report 291
Figure 136 Austrian participation in FP6 proposals, by Priority Area
Priority All Eligible proposals
AT Eligible proposals
Demand - share of bids with AT involvement
Rank
1. Life sciences, genomics & biotechnology 2,384 427 17.9% 6
2. Information society technologies 6,445 1,285 19.9% 4
3. Nanotechnologies and nanosciences 1,692 306 18.1% 5
4. Aeronautics and space 786 118 15.0% 11
5. Food quality and safety 1,044 174 16.7% 10
6. Sustainable development 2,860 662 23.1% 3
7. Citizens and governance 797 277 34.8% 2
Policy support / S&T needs 1,627 272 16.7% 9
Horizontal research activities - SMEs 3,560 615 17.3% 7
Support for international cooperation 2,613 220 8.4% 16
Research and innovation 746 126 16.9% 8
Human resources and mobility 20,677 879 4.3% 17
Research infrastructures 503 73 14.5% 12
Science and society 1,363 164 12.0% 13
Support for the coordination of activities 210 79 37.6% 1
Development of R & I policies 141 16 11.3% 14
Euratom 301 31 10.3% 15
Total 47,749213 5,724 12.0%
Source: FP6 proposal data (EC, June, 2010)
Austrian success rates in applying to FP6
As indicated above, Austrian organisations participated in 5,724 proposals and in 1,303214 projects; so Austrian overall success rate was 22.8%, substantially above the overall FP6 success rate of 21.1%. This indicates strong performance of Austrian organisations in application process in the FP6 overall.
On participation level, however, the picture is different. Austria with 8,302 participations in proposals and 1,945 participations achieved a success rate of 23.4%, which is slightly below the FP6 average (23.5%)
Austrian success rates by FP6 Priority Area
Figure 137 shows the success rates of proposals with Austrian participation and compares these to the overall success rates for all proposals submitted to FP6, by FP6 Priority Area. It shows that Austrian success rates were above average in 13 out of 17 priority areas with Austria performing particularly well in Development of R & I policies, Science and society, Food quality and safety, Sustainable development and Support for international cooperation where Austrian success rates were more than 25% higher than the FP6 averages.
Figure 138 shows the same analysis but for Austrian participations in proposals. It reveals just over a half of priority areas where Austria outperformed the FP6 average. Similarly to the previous figure, Austrian organisations had higher success rate in Development of R & I policies and Science and society. Some of the priority areas with lowest success rates were Euratom and Human resources and mobility.
213 Includes eight proposals where the priority area was unassigned. 214 For the following analysis of success rates and participation rates we use official e-CORDA data due to incompatibility of
the PROVISO database to make comprehensive comparisons across all priority areas. We have produced the tables using PROVISO data as well and the differences were negligible, however missing Euratom data and inclusion of MCA participations not recognised by the EC information system provides a strong reasoning for use of the official database.

Final Report 292
Figure 137 Austrian and all FP6 proposal success rates by Priority Area
Priority AT proposals AT projects Proposal success
rate - AT Proposal success
rate – all FP6 Ratio of AT success rates to
FP6 success rates
1. Life sciences, genomics & biotechnology 427 116 27.2% 25.1% 108%
2. Information society technologies 1,285 268 20.9% 16.9% 123%
3. Nanotechnologies and nanosciences 306 93 30.4% 26.3% 116%
4. Aeronautics and space 118 40 33.9% 30.7% 111%
5. Food quality and safety 174 39 22.4% 17.7% 126% (H)
6. Sustainable development 662 192 29.0% 23.2% 125% (H)
7. Citizens and governance 277 54 19.5% 18.3% 106%
Policy support / S&T needs 272 82 30.1% 32.1% 94%
Horizontal research activities – SMEs 615 79 12.8% 13.8% 93%
Support for international cooperation 220 36 16.4% 13.1% 125% (H)
Research and innovation 126 34 27.0% 31.8% 85%
Human resources and mobility 879 152 17.3% 22.2% 78%
Research infrastructures 73 26 35.6% 30.6% 116%
Science and society 164 32 19.5% 11.8% 165% (H)
Support for the coordination of activities 79 45 57.0% 48.6% 117%
Development of R & I policies 16 6 37.5% 13.5% 278% (H)
Euratom 31 9 29.0% 25.9% 112%
Total 5,724 1,303 22.8% 21.1% 108%
Source: FP6 proposal data (EC, June 2010) and FP6 participation data (E-CORDA, December 2009)

Final Report 293
Figure 138 AT and all FP6 participation-level success rates by Priority Area
Priority AT
participations in proposals
AT participations in
projects
Participation success rate - AT
Participation success rate – all
FP6
Ratio of AT success rates to FP6 success rates
1. Life sciences, genomics & biotechnology 676 181 26.8% 25.7% 104%
2. Information society technologies 1,898 429 22.6% 20.6% 110%
3. Nanotechnologies and nanosciences 469 154 32.8% 30.5% 108%
4. Aeronautics and space 158 60 38.0% 36.6% 104%
5. Food quality and safety 259 61 23.6% 23.3% 101%
6. Sustainable development 1,151 308 26.8% 28.8% 93%
7. Citizens and governance 372 68 18.3% 18.8% 97%
Policy support / S&T needs 337 110 32.6% 35.7% 92%
Horizontal research activities – SMEs 1,102 153 13.9% 15.0% 93%
Support for international cooperation 276 46 16.7% 15.2% 110%
Research and innovation 164 48 29.3% 28.9% 101%
Human resources and mobility 972 165 17.0% 20.3% 84%
Research infrastructures 96 32 33.3% 38.6% 86%
Science and society 202 45 22.3% 14.1% 158% (H)
Support for the coordination of activities 108 63 58.3% 59.6% 98%
Development of R & I policies 26 12 46.2% 15.7% 294% (H)
Euratom 36 10 27.8% 53.3% 52%
Total 8,302 1,945 23.4% 23.5% 100%
Source: FP6 proposal data (EC, June 2010) and FP6 participation data (E-CORDA, December 2009)

Final Report 294
Austrian Participation rates, explained by levels of demand and success rate
Figure 139 presents the data on Austrian demand, success and participation rates by priority area in FP6, relative to FP6 rates overall.
The percentages shown in column 2 are calculated by dividing Austria‟s share of its participations in each area by the overall share of FP6 participations in each area. So, if 20% of Austria‟s participations fall in the IST area but only 10% of all FP6 participations are in IST, then we can say that Austria has double the „normal‟ participation rate in IST. This gives a relative participation rate in that area of 200%.
The percentages shown in column 3 are calculated by dividing Austria‟s demand in each area by the overall FP6 demand in each area. So, if 20% of Austria‟s participations in proposals fall in the IST area but only 10% of all FP6 participations in proposals are in IST, then we can say that Austria has double the „normal‟ demand rate in IST. This gives a relative rate of demand in that area of 200%.
The percentages shown in column 4 are calculated by dividing Austria‟s success rate in each area by the overall FP6 success rate in that area. So if Austria‟s success rate in IST is 20% and the average FP6 success rate in that area is only 10%, then we can say that Austria has double the „normal‟ success rate in IST. This gives a relative success rate of success rate in that area of 200%.
These relative shares allow identification of the factor (success rate or demand) behind the Austrian level of participation in each priority area. The final column of Figure 139 contains a note on how the two factors combine to explain the relative participation rate in each priority area.
Following categorisation is adopted for a better illustration: Each cell is marked as „low‟, „medium‟ or „high‟ depending on the rank within the ratios, with the top 6 priorities in „high‟, 7th-11th in „medium‟ and remaining 6 priorities in the „low‟ category. For example, the share of Austrian participation accounted for by the Research Infrastructures priority area ranked 15th and therefore is in the „low‟ category.
Figure 139 shows priority areas with the highest relative Austrian participation rates are the Development of R & I policies driven by high success rate, Support for the coordination of activities driven by high demand, Science and Society driven by high demand and high success rate, Citizens and governance driven by high demand, Information society technologies driven by high demand and high success rate, and Sustainable development driven by high demand.

Final Report 295
Figure 139 Austrian participation: a comparison between Austrian relative success and demand in FP6 by priority area
Priority Participation rate Normalised Demand Normalised SR Note
1. Life sciences, genomics & biotechnology Medium (101%) Medium (97%) High (104%) Medium participation resulting from medium
demand
2. Information society technologies High (115%) High (104%) High (110%) High participation due to high SR and high demand
3. Nanotechnologies and nanosciences Medium (100%) Medium (93%) High (108%) Medium participation resulting from medium
demand
4. Aeronautics and space Low (66%) Low (63%) Medium (104%) Low participation resulting from low demand
5. Food quality and safety Low (73%) Low (72%) Medium (102%) Low participation resulting from low demand
6. Sustainable development High (113%) High (120%) Low (96%) High participation due to high demand
7. Citizens and governance High (133%) High (137%) Medium (97%) High participation due to high demand
Policy support / S&T needs Medium (91%) Medium (99%) Low (92%) Medium participation resulting from medium
demand and low SR
Horizontal research activities – SMEs Medium (108%) High (116%) Low (93%) Medium participation resulting from low SR and
high demand
Support for international cooperation Low (70%) Low (64%) High (110%) Low participation resulting from low demand
Research and innovation Medium (100%) Medium (98%) Medium (101%) Medium participation resulting from medium
demand and medium SR
Human resources and mobility Low (75%) Low (89%) Low (84%) Low participation resulting from low demand and
low SR
Research infrastructures Low (66%) Low (77%) Low (87%) Low participation resulting from low demand and
low SR
Science and society High (168%) High (106%) High (158%) High participation due to high SR and high demand
Support for the coordination of activities High (200%) High (204%) Medium (98%) Very high participation due to very high demand
Development of R & I policies High (272%) Medium (92%) High (295%) Very high participation due to very high SR
Euratom Low (32%) Low (62%) Low (52%) Low participation resulting from low demand and
low SR
Total 100% 100% 100%
Source: FP6 proposal data (EC, June 2010) and FP6 participation data (E-CORDA, December

Final Report 296
B.2 Full set of data for Austrian participation in FP7
Overall participation in FP7 by Austrian organisations
The overall statistics on Austrian participation in FP7 provided by PROVISO215 are as follows:
Projects: Austrian organisations have been involved in 813 FP7 projects, out of a total of 6,806. Austrian organisations have therefore been involved in 11.9% of all FP7 projects
Participations: The total number of Austrian participations in FP7 to date is 1,137, out of a total of 45,392 for FP7 as a whole. Austria‟s participations therefore constitute 2.56% of the total
Organisations216: A total of 290 discrete organisations from Austria have participated in FP7 to date, out of a total number of 10,277 organisations in FP7. Austrian organisations therefore form 2.8% of all participants in FP7 so far
Funding217: Austrian organisations have been allocated a total of €227.9 million in funding from FP7, out of a total allocation of €8.3 billion to date. Austrian organisations have therefore received 2.75% of all FP7 funding
FP7 funding received by Austrian organisations
Overall funding
As indicated above, Austrian organisations were allocated a total of €227.9 million in funding from FP7, out of a total allocation of €8.3 billion. Austrian organisations therefore received 2.75% of all FP7 funding.
The average volume of FP7 funding218 allocated to Austrian organisations per participation was €302.3k. This is 7.3% higher than the average for FP7 as a whole (€281.7k), which explains why the Austrian share of FP7 funding (2.75%) is higher than its share of participations (2.56%).
Below we look at FP7 funding allocated to Austrian organisations in more detail in order to assess its performance relative to other EU member states.
Funding received from FP7 in context
Austria‟s „return‟ from FP7 was €227.9 million, or 2.75%% of the total EC funding allocations for FP7 as a whole. In 2007, Austria‟s share of EU GDP (out of the 27 Member States) was 2.2%, so on this basis Austria‟s level of return was slightly above what we might have expected.
Austria‟s share of funding allocations to the EU-27 alone was 3.1%, so on this basis its level of return was even higher (+40%) than we might have expected based solely on its share of EU GDP (2.2%).
Figure 140 lists the EU-27 Member States and shows, for each, total FP7 EC funding allocations219, share of EU-27 FP7 funding, share of EU-27 GDP, and the ratio of share of EU-27 FP7 funding to share of EU-27 GDP. The table is sorted by the final column, so the countries listed towards the top of the table are those where their share of EU-27 FP7 funding allocations were greater proportionately than their share of EU-27 GDP.
215 PROVISO data includes the participation of individuals (fellows) in Marie Curie Actions but excludes participation in General Activities (Annex IV), Fusion Energy, and Nuclear Fission and Radiation Protection. Most of the data regarding number of participations and projects refers to information based on all successful proposals, rather than those that have passed through the contract stage. A footnote clearly states where the data is limited to contracted projects only.
216 The number of organisations in FP7 is based on „uncleaned‟ E-CORDA database of already contracted projects and the data is provided but not approved by PROVISO. Information on the number of Austrian participants in FP7, based on cleaned organisation name, suggests that reality 275 discrete Austrian organisations have participated in FP7 to date. For a breakdown by organisation type see Figure 148.
217 The figures refer to contracted projects only. All Austrian participations in approved projects were allocated €342.7 million out of a total of €13.1 billion, which represents 2.6%. Distributions of the funding associated with approved (but not contracted) projects within the FP7 priority areas, by instrument type and by organisation type have not been provided by PROVISO.
218 Figures used for calculation of averages were based on contracted projects only. 219 FP7 Funding data used in this section was provided by PROVISO, based on contracted projects.

Final Report 297
Austria‟s position in the table indicates that it was 11th out of the EU-27 in terms of the amount of FP7 funding realised in comparison with its GDP share. Austria‟s „target figure‟ for FP7 income if it were to have been in direct proportion to its GDP contribution to the EU27 total would have been €162.3 million, so there is a notional „surplus‟ of ~€65 million in FP7 funding to Austria.
Based on results so far, Austria‟s FP income to GDP ratio has increased from 129% in FP6 (with 25 Member States) to 140% in FP7 (with 27 Member States). It has also retained its 11th place.
Figure 140 FP7 funding allocations to the EU-25 in comparison with GDP
Member State FP7 funding
(€million) Share of EU-27 FP7
funding Share of EU-27 GDP
(2007) Ratio FP7 income to
GDP
Estonia 24.6 0.3% 0.1% 262%
Finland 207.4 2.8% 1.5% 193%
Sweden 351.9 4.7% 2.7% 177%
Slovenia 35.0 0.5% 0.3% 169%
Greece 228.6 3.1% 1.8% 168%
Netherlands 549.1 7.4% 4.6% 161%
Belgium 320.6 4.3% 2.7% 160%
Malta 5.1 0.1% 0.0% 155%
Bulgaria 26.6 0.4% 0.2% 154%
Cyprus 14.3 0.2% 0.1% 152%
Austria 227.9 3.1% 2.2% 140%
Denmark 188.5 2.5% 1.8% 139%
Hungary 61.2 0.8% 0.8% 101%
United Kingdom 1234.8 16.7% 16.5% 101%
Germany 1375.0 18.6% 19.6% 94%
Czech Republic 67.0 0.9% 1.0% 88%
Portugal 85.1 1.1% 1.3% 87%
France 944.7 12.7% 15.3% 83%
Italy 726.9 9.8% 12.5% 78%
Spain 485.3 6.5% 8.5% 77%
Latvia 9.1 0.1% 0.2% 72%
Ireland 81.1 1.1% 1.5% 71%
Lithuania 9.9 0.1% 0.2% 58%
Slovakia 17.5 0.2% 0.4% 53%
Poland 92.5 1.2% 2.5% 50%
Romania 34.3 0.5% 1.0% 46%
Luxembourg 6.7 0.1% 0.3% 30%
EU-27 7410.7 100.0% 100.00% 100%
Source: EC/E-CORDA, processed by PROVISO (11/2009) and Eurostat (GDP data)
Below, we provide similar data comparing the share of EU27 FP7 funding to the share of: (i) population, (ii) gross expenditure on research and development (GERD), and (iii) total researchers (FTE).
Figure 141 shows the comparison between FP7 funding and population in 2007 for each of the EU-27 Member States. Austria‟s share of the total EU-27 population was 1.67%, while its share of FP7 funding amongst the EU-27 was 3.08%. So on this basis Austria‟s level of return was almost twice as high as what might have been expected, given its population size.
The ratio of Austria‟s share of FP7 funding to its share of population amongst the EU-27 was 184%, placing it 6th out of the EU-27. Austria‟s „target figure‟ for FP7 income if it were to have been in direct proportion to its share of EU27 population would have been €123.9 million, so there is a notional „surplus‟ of ~€104 million in FP7 funding to Austria based on this measure.
Based on results so far, Austria‟s FP income to population ratio has risen from 161% in FP6 to 184% in FP7 and it retained 6th place (within EU25 in FP6 and EU27 in FP7).

Final Report 298
Figure 141 FP7 funding allocations to the EU-27 in comparison with population
Member State FP7 funding (€
million) Share of EU-27 FP7
funding Share of EU-27
Population (2007) Ratio FP7 Income to
Pop
Finland 207.4 2.80% 1.07% 263%
Sweden 351.9 4.75% 1.84% 258%
Denmark 188.5 2.54% 1.10% 231%
Netherlands 549.1 7.41% 3.30% 224%
Belgium 320.6 4.33% 2.14% 202%
Austria 227.9 3.08% 1.67% 184%
Greece 228.6 3.08% 2.26% 137%
United Kingdom 1234.8 16.66% 12.28% 136%
Ireland 81.1 1.09% 0.87% 126%
Cyprus 14.3 0.19% 0.16% 123%
Estonia 24.6 0.33% 0.27% 122%
Slovenia 35.0 0.47% 0.41% 116%
Germany 1375.0 18.55% 16.62% 112%
France 944.7 12.75% 12.85% 99%
Luxembourg 6.7 0.09% 0.10% 94%
Malta 5.1 0.07% 0.08% 83%
Italy 726.9 9.81% 11.94% 82%
Spain 485.3 6.55% 8.98% 73%
Portugal 85.1 1.15% 2.14% 54%
Czech Republic 67.0 0.90% 2.08% 44%
Hungary 61.2 0.83% 2.03% 41%
Latvia 9.1 0.12% 0.46% 27%
Bulgaria 26.6 0.36% 1.55% 23%
Slovakia 17.5 0.24% 1.09% 22%
Lithuania 9.9 0.13% 0.68% 20%
Poland 92.5 1.25% 7.70% 16%
Romania 34.3 0.46% 4.35% 11%
EU-27 7410.7 100.00% 100.00% 100%
Source: EC/E-CORDA, processed by PROVISO (11/2009) and Eurostat (Population data)
Figure 142 shows the comparison between FP7 funding and intramural research & development expenditure (GERD) in 2007 for each of the EU-27 Member States. Austria‟s contribution towards total EU-27 GERD was 3.05%, while its share of FP7 funding amongst the EU-27 was 3.08%. On this basis Austria‟s level of return was therefore slightly higher than what might have been expected, given its level of R&D expenditure.
Based on results so far, Austria‟s FP income to GERD ratio has therefore slightly decreased from 105% in FP6 to 101% in FP7, meaning that it is achieving a rate of return that is just higher than we might have expected based on this measure. Despite this fact, its rank has dropped from 19th place to the 21st (out of 25 in FP6 and out of 27 in FP7).
Figure 142 FP7 funding allocations to the EU-27 in comparison with GERD
Member State FP7 funding (€
million) Share of EU-27 FP7
funding Share of EU-27 GERD
(2007) Ratio FP7
Income to GERD
Cyprus 14.3 0.19% 0.03% 630%
Bulgaria 26.6 0.36% 0.06% 586%
Greece 228.6 3.08% 0.58% 536%
Malta 5.1 0.07% 0.01% 480%
Estonia 24.6 0.33% 0.08% 435%
Latvia 9.1 0.12% 0.06% 222%
Slovenia 35.0 0.47% 0.22% 215%
Slovakia 17.5 0.24% 0.11% 213%

Final Report 299
Member State FP7 funding (€
million) Share of EU-27 FP7
funding Share of EU-27 GERD
(2007) Ratio FP7
Income to GERD
Hungary 61.2 0.83% 0.43% 193%
Netherlands 549.1 7.41% 4.24% 175%
Poland 92.5 1.25% 0.77% 161%
Romania 34.3 0.46% 0.29% 161%
Belgium 320.6 4.33% 2.75% 157%
Portugal 85.1 1.15% 0.84% 136%
Italy 726.9 9.81% 7.39% 133%
Lithuania 9.9 0.13% 0.10% 131%
Spain 485.3 6.55% 5.86% 112%
Czech Republic 67.0 0.90% 0.86% 105%
United Kingdom 1234.8 16.66% 16.12% 103%
Finland 207.4 2.80% 2.74% 102%
Austria 227.9 3.08% 3.05% 101%
Denmark 188.5 2.54% 2.54% 100%
Ireland 81.1 1.09% 1.10% 100%
Sweden 351.9 4.75% 5.24% 91%
France 944.7 12.75% 17.28% 74%
Germany 1375.0 18.55% 27.01% 69%
Luxembourg 6.7 0.09% 0.26% 35%
EU-27 7410.7 100.00% 100.00% 100%
Source: EC/E-CORDA, processed by PROVISO (11/2009) and Eurostat (GERD data)
Finally, Figure 143 shows the comparison between FP7 funding and the number of FTE researchers in 2007 for each of the EU-27 Member States. Austria‟s contribution towards the total number of researchers in the EU-27 was 2.33%, while its share of FP7 funding amongst the EU-25 was 3.08%. Austria‟s level of return was therefore substantially higher than might have been expected, given its share of the total number of researchers in the EU-27.
Based on results so far, Austria‟s FP income to researcher ratio has increased from 129% in FP6 to 132% in FP7. It has also gained two places from 10th (out of 25 in FP6) to 8th (out of 27 in FP7).
Figure 143 FP7 funding allocations to the EU-27 in comparison with total (FTE) researchers
Member State FP7 funding (€
million) Share of EU-27 FP7
funding Share of EU-27 FTE
(2007) Ratio FP7 income to
FTE
Cyprus 14.3 0.19% 0.06% 327%
Netherlands 549.1 7.41% 3.28% 226%
Greece 228.6 3.08% 1.55% 199%
Malta 5.1 0.07% 0.04% 179%
Belgium 320.6 4.33% 2.67% 162%
Italy 726.9 9.81% 6.57% 149%
Sweden 351.9 4.75% 3.55% 134%
Austria 227.9 3.08% 2.33% 132%
United Kingdom 1234.8 16.66% 13.04% 128%
Ireland 81.1 1.09% 0.90% 121%
Estonia 24.6 0.33% 0.27% 121%
Denmark 188.5 2.54% 2.20% 116%
Slovenia 35.0 0.47% 0.46% 102%
Finland 207.4 2.80% 2.90% 97%
Germany 1375.0 18.55% 21.12% 88%
France 944.7 12.75% 15.69% 81%
Spain 485.3 6.55% 9.11% 72%
Hungary 61.2 0.83% 1.29% 64%

Final Report 300
Member State FP7 funding (€
million) Share of EU-27 FP7
funding Share of EU-27 FTE
(2007) Ratio FP7 income to
FTE
Luxembourg 6.7 0.09% 0.16% 56%
Portugal 85.1 1.15% 2.08% 55%
Czech Republic 67.0 0.90% 2.07% 44%
Bulgaria 26.6 0.36% 0.83% 43%
Latvia 9.1 0.12% 0.31% 39%
Romania 34.3 0.46% 1.40% 33%
Poland 92.5 1.25% 4.56% 27%
Slovakia 17.5 0.24% 0.92% 26%
Lithuania 9.9 0.13% 0.63% 21%
EU-27 7410.7 100.00% 100.00% 100%
Source: EC/E-CORDA, processed by PROVISO (11/2009) and Eurostat (GDP data)
FP7 participation by type of organisation
FP7 participations by organisation type
The standard classification of participants in FP7 by organisation (or „activity‟) type contains five main categories: Higher or secondary education est. (HEIs), Private Commercial, Public body, Research organisations and Others. Figure 144 compares the breakdown of Austrian participations by activity type with the breakdown for all FP7 participations. Unlike in FP6, each participation has an identified activity type.
The data220 indicate that Austrian participation profile differs to a small extent from that of FP7 as whole. HEIs from Austria account for slightly more of the Austrian total (38%) than the FP7 average (36%), as do private commercial organisations (28% versus 25%) and public bodies (6% compared to 5%). On the other hand, Austrian research organisations account for a lower share of the participations than the FP7 average (20% versus 24%), as do „others (7% versus 9%). These minor deviations indicate that Austrian participations are broadly in line with the overall FP7 profile, and that there is no reason to suspect that any particular group is significantly under- or over-represented as regards FP participation.
Figure 144 Austrian FP7 participations and all FP7 participations, by Activity Type
Activity Type Number of participations - Austria Number of participations – FP7 overall
Higher or secondary education est.
288 (38%) 10,525 (36%)
Private commercial 213 (28%) 7,359 (25%)
Research organisations 154 (20%) 7,182 (24%)
Public body (excl. res. and educat.)
47 (6%) 1,602 (5%)
Other 52 (7%) 2,791 (9%)
Total 754 (100%) 29,459 (100%)
Source: EC/E-CORDA, processed by PROVISO (11/2009), data not validated by PROVISO
Figure 145 presents a more accurate distribution of Austrian participations, based on „cleaned‟ data provided by PROVISO. Despite the fact that this data offers a more specific distribution the equivalent data for FP7 as a whole is not available and therefore we have to rely on the E-CORDA data shown above for Austria-Overall FP7 comparisons. PROVISO identifies two types of industrial (or private commercial) organisations, „Large Enterprises‟ and „Small and Medium Enterprises‟ (SMEs).
220 Numbers of participations in Figure 144 refer to participations in contracted projects. The equivalent data for successful (approved but not contracted) projects have not been provided by PROVISO.

Final Report 301
This breakdown shows a similar profile for Austrian participations by HEIs, Research organisations and the Private commercial organisations, which are according to the data predominantly SMEs (there are twice as many participations by SMEs than Large enterprises). Levels of participation by the Public bodies and those organisations with activity type Other are substantially different from the official E-CORDA data. Whereas Public bodies represented 7% in E-CORDA, cleaned data by PROVISO shows only 2%. The opposite situation occurs for participations by organisations with activity type Other, where the official data shows 7% but the cleaned PROVISO data shows 13%. One possible explanation is that the Commission and PROVISO employ different procedures for deciding which of these two categories certain organisations should be assigned to, with PROVISO much more likely to select „other‟.
Figure 145 Breakdown of „cleaned‟ Austrian FP7 participations
Activity Type Number of participations - Austria
Higher Education 409 (37%)
Research Centres 237 (21%)
Large Enterprises 94 (9%)
SMEs 191 (18%)
Non-research public sector 22 (2%)
Other 137 (13%)
Total221 1,090 (100%)
Source: EC, processed and revised by PROVISO (09/2010),
FP7 funding by organisation type
Figure 146 shows the total FP7 funding allocations for Austrian organisations, by activity type, and compares these to the breakdown of FP7 funding allocations as a whole. These data are taken from E-CORDA and have not been cleaned or approved by PROVISO.
Austrian HEIs have been allocated a total of €102 million in funding. This represents 45% of all FP7 funding to Austrian organisations, a slightly larger share than that obtained by HEIs across FP7 as a whole (43%). Austrian HEIs received an average of €355k in funding per participation, 5% above the FP7 average of €355k per HEI participation. This means that Austrian HEIs have not only had a slightly larger number of participations in FP7 they have also had a higher level of funding per participation. These factors combine to make Austrian HEIs more dominant within the national participant mix than is the case for FP7 as a whole.
Austrian industry has received €71 million in funding. This represented 31% of Austria‟s total, well above the share of funding obtained by industry across FP7 as a whole (24%). The average amount of funding provided to Austrian industry per participation was €333k, 23% above the overall FP7 average of €271k per industrial participation. This goes some way to explaining why industry‟s overall share of Austrian FP7 funding is relatively high, and indicates that Austrian companies occupied a more significant role in the projects than industry as a whole, based on this measure at least.
Austrian research organisations have been allocated €48 million in funding. This represents 21% of the Austrian total, 8% below the overall share obtained by research organisations across FP7 as a whole (29%). The average amount of funding per Austrian research organisation participation was €309k, slightly below the overall FP7 average of €336k per research institute participation, so it would appear that Austrian research organisations have occupied a more minor role in their FP7 projects. The relatively low number of Austrian Research organisation participations coupled to the strong showing of Austrian HEIs suggests that these differences may be structural rather than performance based.
221 The total does not include 47 participations by individuals (fellows) which are included elsewhere in the FP7 participation analysis.

Final Report 302
Public bodies and Other Austrian participants have been allocated €4 and €3 million in funding respectively, or 2% and 1% of Austria‟s total funding from FP7, respectively. The Austrian profile for these two organisation types is roughly in line with FP7 overall. The average amount of funding per Austrian public body participation was 40% higher than its FP7 equivalent while in org type other were the averages almost the same.
Figure 146 Austrian FP7 and all FP7 funding allocations, by Activity Type of Austrian FP7
Activity Type Funding allocations (€) – Austria (share)
Funding allocations (€) – FP7 overall (share)
Higher or secondary education est. 102,249,893 (45%) 3,545,117,583 (43%)
Private commercial 70,983,802 (31%) 1,996,558,005 (24%)
Research organisations 47,629,959 (21%) 2,412,097,552 (29%)
Public body (excl. res. and educat.) 4,016,853 (2%) 232,796,800 (3%)
Other 3,048,383 (1%) 111,384,903 (1%)
Total 227,928,890 (100%) 8,297,255,925 (100%)
Source: EC/E-CORDA, processed by PROVISO (11/2009), data not approved by PROVISO
In addition to the above comparison, Figure 147 presents a more accurate distribution of Austrian
funding allocations222, based on „cleaned‟ data provided by PROVISO. Despite the fact that this data offers a more specific distribution and does not contain any unidentified cases, the equivalent data for FP7 overall is not available and therefore we rely on E-CORDA for Austria-Overall FP7 comparison.
This breakdown shows a slightly stronger position of Research centres and a slightly weaker position for Austrian HEIs than the official E-CORDA data. Similarly, there is a lower share of industrial funding allocations, when the SME and large enterprises are combined. There is also a significantly higher share of funding allocations for activity type „Other‟. The Austrian share of funding allocated to SMEs is not as dominant as in the case of participations. This suggests that while SMEs participate substantially more than their large counterparts, the amount of funding they obtain per participation is much lower (334k per participation for the large enterprises and 276k per participation in case of the SMEs).
Figure 147 Breakdown of „cleaned‟ Austrian FP7 funding allocations
Activity Type Funding allocations (€) – Austria
Higher Education 134,523,008 (39%)
Research Centres 88,425,574 (26%)
Large Enterprises 31,422,390 (9%)
SMEs 53,182,299 (16%)
Other 35,134,562 (10%)
Total 342,687,833 (100%)
Source: EC/E-CORDA, processed by PROVISO (11/2009), data not approved by PROVISO
Numbers of Austrian organisations participating in FP7
Figure 148 shows a breakdown of the number of Austrian organisations of each type participating in FP7 and compares this to the overall numbers for FP7 as a whole (i.e. all countries), using E-CORDA data. It should be noted that this analysis is based on FP7 participation data that has not been „cleaned‟ or approved by PROVISO. As we have indicated above, it is not possible to provide completely accurate information on the numbers of organisations participating in FP7 because in some cases the same organisation appears under slightly different names within the participation
222 Unlike elsewhere in the document where contracted projects form the basis of the financial data, Figure 147 refers to funding allocated to participants in all successful (i.e. approved) projects.

Final Report 303
database. The distribution of Austrian organisations shows, on the contrary to the FP6, a dominant position of private commercial organisations with over half of the organisations participating in FP7 belonging to this Activity type. Austrian research organisations and higher or secondary education establishments represent much smaller groups of participants with 18% and 12% respectively. The breakdown of Austrian participants in FP7 is roughly in line with the overall FP7 profile. The minor deviations from the FP7 profile include a lower share of HEIs and a slightly higher share of Private commercial and research organisations.
Figure 148 Austrian FP7 participants, by Activity Type
Activity Type AT organisations All FP7 organisations
Higher or secondary education est. 34 (12%) 1,509 (15%)
Private commercial 172 (59%) 5,457 (53%)
Research organisations 52 (18%) 1,708 (17%)
Public body (excl. res. and educat.) 23 (8%) 1,022 (10%)
Other 9 (3%) 581 (6%)
Total 290 (100%) 10,277 (100%)
Source: EC/E-CORDA, processed by PROVISO (11/2009), data not validated by PROVISO
Figure 149 presents the more accurate breakdown of Austrian organisations participating in FP7, based on data cleaned by PROVISO. Relatively low share of HEIs participating in FP7 is expected due to their lower relative number compared to private for profit enterprises involved in R&D in Austria overall. In Figure 144 HEIs represented a high share of Austrian participations (38%). This is because Austrian HEIs have on average over 14 participations each whereas the second most frequently participating organisations are Research centres with only just over five participations each. Austrian large enterprises tend to have, on average, more than two participations each. Even though SMEs form a substantial share (38%) of Austrian organisations participating in FP7, their average number of participations shows that they are the participants that are least likely to have multiple participations (averaging just one per organisation).
Figure 149 Breakdown of „cleaned‟ Austrian FP7 participants, by Activity Type
Activity Type AT organisations
Higher Education 29 (11%)
Research Centres 42 (15%)
Large Enterprises 43 (16%)
SMEs 104 (38%)
Non-research public sector 9 (3%)
Other 48 (17%)
Total223 275 (100%)
Source: EC, processed and revised by PROVISO (09/2010),
FP7 Austrian top-participating organisations
Figure 150 lists the top performing organisations in each activity type based on their number of participations in FP7. The top three organisations, based on the number of participations, have more than 40 participations each in FP7 to date. The next 17 organisations in the table have between 40 and 11 participations each, of which the only representation by industry is AVL List GmbH. The final five organisations in the list, two of which are SMEs) have so far managed to participate in 5 to 10 projects.
223 These figures do not include participants whose activity type was unidentified and include the respondents who had assigned themselves to multiple activity types.

Final Report 304
Figure 150 List of top 25 Austrian organisations based on number of participations in FP7
Organisation name Activity type
Technische Universität Wien Higher Education
Universität Wien Higher Education
Technische Universität Graz Higher Education
Universität Innsbruck Higher Education
Austrian Research Centers GmbH Research Centre
Medizinische Universität Wien Higher Education
Österreichische Akademie der Wissenschaften Research Centre
Universität für Bodenkultur Wien Higher Education
Universität Linz Higher Education
Joanneum Research Research Centre
ZSI – Zentrum Für Soziale Innovation Research Centre
Universität Graz Higher Education
FFG - Österreichische Forschungsförderungsgesellschaft Other
IIASA – Internationales Institut für angewandte Systemanalyse INO
Medizinische Universität Innsbruck Higher Education
Universität Salzburg Higher Education
Medizinische Universität Graz Higher Education
Wirtschaftsuniversität Wien Higher Education
AVL List GmbH Large Enterprises
Bundesforschungs- und Prüfzentrum Arsenal GesmbH Research Centre
Forschungsinstitut für Molekurale Pathologie Research Centre
Bundesministerium für Wissenschaft und Forschung Non-research public sector
Universität Klagenfurt Higher Education
Technikon Forschungs- und Planungsgesellschaft mbH SME
TeleConsult Austria GmbH SME
Source: EC, processed and revised by PROVISO (11/2009),
FP7 participation by Thematic Priority Area
The FP7 database does not categorise participating organisations by sector. However, analysis of FP7 participation by Thematic Priority provides an indication of the main research fields in which Austrian organisations were active.
FP7 is made up of five specific programmes, as follows
Cooperation
Ideas
People
Capacities
Nuclear Research
The first specific programme focuses on fostering collaborative research and represents the core of FP7. It is split into 10 key thematic research areas plus General activities – Annex IV
Health
Food, agriculture and fisheries, and biotechnology

Final Report 305
Information and communication technologies
Nanosciences, nanotechnologies, materials and new production technologies
Energy
Environment (including climate change)
Transport (including aeronautics)
Socio-economic sciences and the humanities
Space
Security
The second specific programme supports “frontier research” and is implemented by the new European Research Council.
The third specific programme provides support for researcher mobility and career development. It is implemented via a set of Marie Curie actions.
The fourth specific programme strengthens research capacities in Europe and covers seven activities:
Research infrastructures
Research for the benefit of SMEs
Regions of knowledge
Research potential of convergence regions
Science in society
Coherent development of research policies
Activities of international cooperation
The fifth specific programme is for nuclear research and training activities and is split into two specific programmes:
Fusion energy research
Nuclear fission and radiation protection
This gives a total of 22 Priority Areas under which FP7 has been organised and against which the participation data is reported.
Projects, participations and EC funding, by Priority Area
Figure 151 shows the number of Austrian projects and participations, and the volume of EC funding allocated, in each of the 22 FP7 Priority Areas. It should be noted that data on General Activities (Annex IV), Fusion Energy, and Nuclear Fission and Radiation Protection was not available from PROVISO.
Due to the differing scales of the different priority areas within FP7 it is not possible to draw conclusions on the performance of Austria from this table, but in terms of numbers alone the Information society technologies, and Marie Curie priority areas were the most significant, with over 120 projects and over 173 Austrian participations each. Information society technologies is also the largest priority area in terms of funding, with more than double the funding allocated to the second most successful area, Health. On the other side of the distribution, Austrian participants had lowest involvement in Research Potential and Coherent development of research policies where Austria had only one and four participations respectively.

Final Report 306
Figure 151 Austrian projects, participations and EC funding in FP7, by Priority Area
Priority Projects Participations EC funding (€)
Energy 24 36 4,180,129
Environment (including Climate Change) 57 81 10,164,615
Food, Agriculture, and Biotechnology 29 42 5,819,665
General Activities (Annex IV) No data available No data available No data available
Health 76 107 35,257,377
Information & Communication Technologies 192 268 76,390,984
Nanosciences, Nanotechnologies, Materials and new Production Technologies 36 56 12,171,639
Security 21 28 4,060,600
Socio-economic sciences and Humanities 35 40 5,807,803
Space 14 20 4,780,317
Transport (including Aeronautics) 72 105 21,599,873
Activities of International Cooperation 18 25 2,854,771
Coherent development of research policies 3 4 193,438
Regions of Knowledge 6 13 843,420
Research for the benefit of SMEs 28 35 3,021,403
Research Infrastructures 33 43 6,930,748
Research Potential 1 1 45,903
Science in Society 20 23 2,587,478
Marie-Curie Actions 121 173 5,244,439
European Research Council 27 37 25,974,250
Fusion Energy No data available No data available No data available
Nuclear Fission and Radiation Protection No data available No data available No data available
Total 813 1,137 227,928,852
Source: EC, processed and revised by PROVISO (11/2009),
In order to place the raw numbers shown in Figure 151 in context, Austrian projects, participations and EC funding have been expressed as a share of the FP7 totals for each Priority Area. The results are shown in Figure 152, and arrows () have been used to symbolise whether Austria has performed comparatively strongly or less well in each area, as compared to Austrian overall performance in FP7. For example, across FP7 as a whole Austria accounted for 2.5% of the participations, so we can say that a participation share of 0.5% in the Research Potential is „below average‟ () while a participation share of 2.6% in Transport is „close to average‟ ().
The results indicate that Austria has performed above average in terms of its project share in most areas, taking part in over a fifth of the projects in 10 of the 19 priority areas. Austrian project involvement rates were highest in the Coherent development of research policies (43%) and Activities of International Cooperation (38%) priorities.
The share of participations and funding tend to be a better indicator for actual levels of performance. On these two measures Austrian performance has been strongest in the Activities of International Cooperation, Coherent development of research policies, Socio-economic sciences and Humanities and Information & Communication Technologies areas.

Final Report 307
Figure 152 Austrian projects, participations and EC funding, expressed as a share of FP7 totals, by Priority Area
Priority Project share Participation
share EC funding
Share
Energy 16% 2.1% 1.6%
Environment (including Climate Change) 29% 2.9% 2.7%
Food, Agriculture, and Biotechnology 15% 1.7% 1.5%
General Activities (Annex IV) No data available No data available No data available
Health 18% 2.4% 2.9%
Information & Communication Technologies 23% 3.5% 3.9%
Nanosciences, Nanotechnologies, Materials and new Production Technologies 15% 1.8% 1.7%
Security 27% 2.9% 2.6%
Socio-economic sciences and Humanities 27% 3.5% 4.4%
Space 31% 2.9% 3.4%
Transport (including Aeronautics) 23% 2.6% 3.3%
Activities of International Cooperation 38% 5.0% 7.5%
Coherent development of research policies 43% 5.6% 3.7%
Regions of Knowledge 14% 2.9% 4.0%
Research for the benefit of SMEs 10% 1.3% 1.5%
Research Infrastructures 24% 2.0% 1.0%
Research Potential 1% 0.5% 0.1%
Science in Society 22% 2.9% 5.1%
Marie-Curie Actions 5% 2.2% 2.1%
European Research Council 3% 2.1% 2.7%
Fusion Energy No data available No data available No data available
Nuclear Fission and Radiation Protection No data available No data available No data available
Total 11.9% 2.5% 2.7%
Source: EC, processed and revised by PROVISO (11/2009)
Figure 153 provides a comparison of average funding224 per AT participation in AT projects, all participations in AT projects and average participation in all projects, by Priority Area (including ratios of AT funding per participation to others in same/all projects). Overall, Austrian participants received 0.4% more funding on average than their partners in the same projects, and 4.3% more than the average for all participants in all projects.
Austrian participants in the Marie-Curie Actions, Research Potential, Regions of Knowledge, Science and Society, Food, Agriculture and Biotechnology, Socio-economic sciences and humanities and Energy areas received relatively high funding per participation compared to others in the same projects. In the Regions of Knowledge, Science and Society, and Socio-economic sciences and humanities areas the volume of funding per Austrian participation is also very high compared to others in all projects. These areas are therefore the ones where the level of Austrian involvement and / or the scale of the projects in which Austria is involved is much higher than average for those areas, suggesting that Austrian partners are taking a major role and/or are participating in the more major projects.
224 Funding data in this paragraph and in Figure 123 is based on requested funding of successful projects.

Final Report 308
Figure 153 Comparison of average funding per participation in AT projects and in all projects, by Priority Area (including ratios of AT funding per participation to others in same/all projects)
Priority
Avg funding (€) per AT participation
(AT projects)
Avg funding (€) per participation
(AT projects)
Avg funding (€) per participation
(all projects)
AT funding per participation compared to others in the same
projects
AT funding per participation compared to others in all
projects
Energy 360,489 252,207 381,272 140% (H) 95%
Environment 240,775 210,334 228,340 114% 105%
Food, Agr., and Biotech. 298,390 198,015 251,153 151% (H) 119%
General Activities Annex IV No data available No data available No data available No data available No data available
Health 477,624 420,932 418,546 113% 114%
ICT 410,977 405,993 388,313 101% 106%
Nanotech. 378,506 369,903 355,550 102% 106%
Security 209,187 273,657 320,763 76% 65%
Soc-economic, Humanities 223,457 159,090 179,559 140% (H) 124%(H)
Space 283,975 326,673 322,873 87% 88%
Transport 311,019 335,803 300,701 93% 103%
Activities of Int. Coop 134,247 103,855 110,904 129% 121%
Development of res. Pol. 83,774 79,947 86,234 105% 97%
Regions of Knowledge 125,080 74,398 84,265 168% (H) 148% (H)
Research for SMEs 150,407 125,998 139,507 119% 108%
Research Infrastructures 232,943 423,020 411,522 55% 57%
Research Potential 45,903 23,574 552,954 195% (H) 8%
Science in Society 178,563 112,270 111,312 159% (H) 160% (H)
Marie-Curie Actions 36,187 13,981 43,553 259% (H) 83%
ERC 840,214 664,200 796,311 116% 106%
Total 301,397 300,265 289,071 100% 104%
Source: EC, processed by PROVISO (11/2009)

Final Report 309
FP7 participation by Type of Instrument
FP7 employed a range of different types of instruments (projects and actions) to implement its priorities, with a different profile of instruments being used within each Priority Area. The
instruments employed by FP7 were as follows:225
Research for the benefit of specific groups (in particular SMEs) – Support for research projects where the bulk of the research and technological development is carried out by universities, research centres or other legal entities, for the benefit of specific groups, in particular SMEs or associations of SMEs. Efforts will be made to mobilise additional financing from the European Investment Bank (EIB) and other financial organisations
Collaborative projects – Support for research projects carried out by consortia with participants from different countries, aiming at developing new knowledge, new technology, products, demonstration activities or common resources for research. The size, scope and internal organisation of projects can vary from field to field and from topic to topic. Projects can range from small or medium-scale focused research actions to large scale integrating projects for achieving a defined objective. Projects should also target special groups such as SMEs and other smaller actors.
Coordination and support actions – Support for activities aimed at coordinating or supporting research activities and policies (networking, exchanges, trans-national access to research infrastructures, studies, conferences, etc.). These actions may also be implemented by means other than calls for proposals.
Combination of CP & CSA – Support for the preparatory phase leading to the construction of new research infrastructures or major upgrades of existing ones. This activity should help the majority of projects for new research infrastructures to reach the level of technical, legal and financial maturity required to enable the construction work to start.
Support for “frontier” research – Support for projects carried out by individual national or transnational research teams. This scheme will be used to support investigator-driven "frontier" research projects funded in the framework of the European Research Council. This instrument includes ERC Starting Grant and Call Advanced Grant.
Support for training and career development of researchers – Support for training and career development of researchers, mainly to be used for the implementation of Marie Curie actions. This includes Initial training networks, Industry-academia partnerships and pathways, Life-long training, International dimension, and Specific actions.
Networks of Excellence – Support for a Joint Programme of Activities implemented by a number of research organisations integrating their activities in a given field, carried out by research teams in the framework of longer term cooperation. The implementation of this Joint Programme of Activities will require a formal commitment of the organisations integrating part of their resources and their activities.
Article 169 of the Treaty – A financial contribution from the Community to the joint implementation of well identified national research programmes, on the basis of Article 169 of the Treaty. Such a joint implementation requires the establishment or existence of a dedicated implementation structure. Community financial support will be provided subject to the definition of a financing plan based on formal commitments of the competent national authorities.
Article 171 of the Treaty – A financial contribution from the Community to the implementation of Joint Technology Initiatives to realise objectives that cannot be achieved through the funding schemes identified above. Joint Technology Initiatives will mobilise a combination of funding of different kinds and from different sources: private and public, European and national. This funding may take different forms and may be allocated or mobilised though a range of mechanisms: support from the Framework Programme, loans from the European Investment Bank (EIB), or risk capital support. Joint Technology Initiatives may be decided and implemented on the basis of Article 171 of the Treaty (this may include the creation of joint undertakings) or by the Decisions establishing the specific programmes. Community
225 Source: Cordis (2010) GUIDE FOR APPLICANTS: Capacities – Research Infrastructures, [online] available at http://rp7.ffg.at/Kontext/WebService/SecureFileAccess.aspx?fileguid=%7B3d5aa05a-59d2-4560-ab1c-e258a66e4ca9%7D.

Final Report 310
support will be provided subject to the definition of an overall blueprint of financial engineering, based on formal commitments of all parties concerned.
Projects, participations and EC funding, by Type of Instrument
Figure 154 shows the numbers of projects and participations, and the volume of EC funding, achieved by Austrian participants for each of the 9 main types of instrument covered by the FP7 database. As with the Priority Areas, the various instruments were used to a greater or lesser degree across FP7 and so it is not possible to draw firm conclusions on the performance of Austrian participants from this table. However, in terms of numbers alone, Austrian participation was highest for Collaborative projects, Coordination and support actions and Support for training and career development of researchers, with over 116 projects and over 139 participations achieved by Austria for each type of instrument. In terms of absolute funding achieved by Austrian participants, the largest area by far was Collaborative projects.
Figure 154 Austrian projects, participations and EC funding, by Type of Instrument
Instrument Projects Participations EC funding (€)
226
Article 169 of the treaty 0 0 -
Research for the benefit of specific groups 28 35 5,268,681
Collaborative project 449 653 261,495,253
Combination of CP & CSA 24 34 8,477,353
Coordination and support action 162 230 28,241,730
Support for frontier research (ERC) 25 35 30,847,139
Article 171 of the treaty 0 0 -
Support for training and career development of res 116 139 5,805,753
Network of excellence 9 11 2,551,924
Total 813 1,137 342,687,833
Source: EC/E-CORDA, processed by PROVISO (11/2009), data not validated by PROVISO
In order to place the raw numbers shown in Figure 154 in context, Austrian projects, participations and EC funding have been expressed as a share of the FP7 totals for each Type of Instrument. The
results are shown in Figure 155, and arrows () have been used to symbolise whether Austria has performed comparatively strongly or less well for each Type of Instrument, as compared to the Austrian overall performance in FP7. For example, across FP7 as a whole Austria participated in 13.5% of the projects, so we can say that a project participation rate of 18% within STREPs is „above‟
average () while involvement in 4% of the Marie Curie Actions is „below‟ average ().
The results suggest that Austria has performed comparatively strongly in terms of its share of projects for 4 out of 7 types of instruments, being involved in over a third of the Networks of Excellence and almost a quarter of Combination of CP & CSA. For most of the remaining instruments Austria was involved in less than a quarter of all the funded projects and for such a small country this means relatively good exposure to a variety of instruments. Support for training and career development of research typically involve relatively few countries in each project. The ability of any one country to have a high project involvement rate in this instrument is rather low. Similarly Austria has been only involved in 3% of the ERC projects.
Austria‟s share of the participations and funding associated with each type of instrument is a better indicator of performance, and here we see more variability in the results. In terms of participation, the Austrian profile is very much in line with or slightly above the FP7 average in all instruments apart from Research for the benefit of specific groups and Support for training and career development of researchers, where Austria underperformed in terms of its share of
226 Funding data provided by PROVISO refers to successful projects.

Final Report 311
participations. The main area of strong performance in terms of participations and funding received by Austrian participants was Coordination and support action.
Figure 155 Austrian projects, participations and EC funding, expressed as a share of FP7 totals, by Type of Instrument
Instrument Project share Participations
share EC funding
share
Article 169 of the treaty - - -
Research for the benefit of specific groups 10% 1.3% 1.4%
Collaborative project 21% 2.7% 2.8%
Combination of CP & CSA 24% 2.0% 1.0%
Coordination and support action 18% 3.2% 3.5%
Support for frontier research (ERC) 3% 2.0% 2.2%
Article 171 of the treaty - - -
Support for training and career development of res 5% 1.9% 1.8%
Network of excellence 35% 2.4% 1.8%
Total 11.9% 2.5% 2.6%
Source: EC/E-CORDA, processed by PROVISO (11/2009), data not validated by PROVISO
Nature of FP7 participation
Participants in the Framework Programmes can occupy the role of project coordinator or are otherwise listed simply as one of the participants. Analysis of Austria‟s FP7 participations reveals that the Austrian partner occupied the role of project coordinator in 137 cases. This means that the Austrian participants were in a coordinating role for 12.0% of all Austrian FP7 participations, well above the FP7 average of 8.6%.
Patterns of Austrian coordination by FP7 Priority Area have been analysed, and are shown in Figure 156. It reveals higher than average coordination rates for Austria in 12 out of 18 the Priority Areas (for which PROVISO data is available), particularly in the Coherent development of research policies, Regions of Knowledge and Socio-economic sciences and Humanities. It should be noted that the numbers here are rather low and so we would expect the profile may change significantly by the end of FP7.

Final Report 312
Figure 156 Austrian coordination levels by FP7 Priority Area
Priority AT coordinators Coordinator to
participant ratio (AT)
Coordinator to participant ratio
(FP7 overall)
Energy 1 3% 9%
Environment (including Climate Change) 7 9% 7%
Food, Agriculture, and Biotechnology 3 7% 8%
General Activities (Annex IV) No data available No data available No data available
Health 16 15% 10%
Information & Communication Technologies 40 15% 11%
Nanosciences, Nanotechnologies, Materials and new Production Technologies 6 11% 8%
Security 2 7% 8%
Socio-economic sciences and Humanities 9 23% 11%
Space 3 15% 7%
Transport (including Aeronautics) 14 13% 8%
Activities of International Cooperation 3 12% 10%
Coherent development of research policies 1 25% 10%
Regions of Knowledge 3 23% 9%
Research for the benefit of SMEs 3 9% 10%
Research Infrastructures 3 7% 6%
Research Potential 0 0% 52%
Science in Society 5 22% 11%
Marie-Curie Actions 18 10% 8%
European Research Council Not applicable Not applicable Not applicable
Fusion Energy No data available No data available No data available
Nuclear Fission and Radiation Protection No data available No data available No data available
Total 137 12% 9%
Source: EC, processed and revised by PROVISO (11/2009)
The likelihood of being a project coordinator varies significantly depending on the type of instrument in which organisations are involved. For example, the NoEs have an average of 30 partners and it is therefore relatively difficult to occupy a high share of coordinator roles within this type of instrument. However, Marie Curie actions have an average of only two partners, so we would expect
to identify a high share of coordinator roles for this instrument.227
Figure 157 presents the number of Austrian coordinators for each type of instrument and the ratio of Austrian coordinators to participants. The average FP7 coordinator to participant ratio for each type
of instrument is also shown for comparison. Arrows () have again been used to symbolise whether Austrian coordination levels for each type of instrument are above, below, or in line with the overall picture. The data indicate that Austrian partners have occupied the role of coordinator to a higher degree than the overall FP7 average for Collaborative projects, Coordination and support actions, and Support for training and career development of researchers. There
227 PROVISO data includes a large number of participants in the Marie Curie Actions (e.g. individual fellowship holders) that are not included in E-CORDA. This significantly reduces the calculated overall ratio of coordinators to participants for Marie Curie actions – from around 58% (as shown in E-CORDA data) to 10% (as given by PROVISO).

Final Report 313
were no Austrian coordinators in Networks of Excellence. The coordination levels of Austrian partners were in line with the FP7 profile on Research for the benefit of specific groups and below average in Combination of CP & CSA. The overall participation data on Article 169 and Article 171 actions was not available from PROVISO. In addition, Support for frontier research actions are awards to individuals and therefore do not have project „coordinators‟ in the traditional sense.
Figure 157 Austrian coordination levels by type of Instrument
Instrument AT coordinators Coordinator to
participant ratio (AT)
Coordinator to participant ratio
(FP7 overall)
Article 169 of the treaty 0 Not available Not available
Research for the benefit of specific groups 3 9% 10%
Collaborative project 74 11% 9%
Combination of CP & CSA 1 3% 6%
Coordination and support action 45 20% 12%
Support for frontier research (ERC) Not applicable Not applicable Not applicable
Article 171 of the treaty 0 Not available Not available
Support for training and career development of res 14 10% 7%
Network of excellence 0 0% 6%
Total 137 12% 9%
Source: EC, processed and revised by PROVISO (11/2009)
Figure 158228 presents an analysis of the activity (organisation) type of the Austrian coordinators. The analysis reveals that Austrian Private commercial organisations, Research Centres and organisations with activity type „Other‟ have occupied the role of coordinator to a higher degree than the overall FP7 average. Austrian HEIs on average coordinate 11% of the projects in which they participate, which is roughly in line with the FP7 profile. Public bodies from Austria have occupied the role of coordinator only in 3 out of 47 participations and therefore their coordinator to participant ratio is 6%, slightly below the FP7 average.
Figure 158 Austrian coordination levels by type of organisation
Instrument AT coordinators Coordinator to
participant ratio (AT)
Coordinator to participant ratio
(FP7 overall)
Higher or secondary education establishments 33 11% 10%
Private commercial 24 21% 12%
Research organisations 32 11% 7%
Public body (excluding research and education) 3 6% 8%
Other 4 29% 3%
Total 96 13% 9%
Source: EC/E-CORDA, processed by PROVISO (11/2009), data not validated by PROVISO
Figure 159 shows the Austrian coordination levels by „cleaned‟ type of organisation provided by PROVISO. It shows a somewhat different picture to Figure 158, especially the coordinator to participant ratio of Austrian research centres, which according to the cleaned data set are much higher than indicated by the E-CORDA data. Almost one fifth of all participations by Austrian research centres are in the role of coordinator. If we combine the large enterprise and SME categories, the resulting ratio is 11%, almost half the rate given in the official data set. Interestingly,
228 Data presented in this table is based on contracted projects.

Final Report 314
Figure 159 also indicates that Austrian SMEs tend to coordinate projects more frequently than their large counterparts.
Figure 159 Austrian coordination levels by „cleaned‟ type of organisation
Instrument AT coordinators Coordinator to participant ratio
(AT)
Higher Education 43 11%
Research Centres 42 18%
Large Enterprises 5 5%
SMEs 25 13%
Non-research public sector 1 5%
Other 21 15%
Total 137 12%
Source: EC, processed and revised by PROVISO (11/2009)
Collaboration within FP7 projects
Overall extent of collaboration
One of the main objectives of the Framework Programmes is to promote and support collaboration between European and International actors in the research and technological development sphere.
Through their 1,137 participations in 813 FP7 projects the Austrian actors have collaborated with a large number of other organisations from a broad range of countries. Overall statistics on the extent of this collaboration are set out below.
Collaboration between Austrian organisations within FP7 projects
With 1,137 participations across 813 projects it is clear that in some cases more than one Austrian partner was involved in the same FP7 project. In fact, there were 218 FP7 projects with more than one AT partner involved. The profile of intra-AT collaboration within the 813 projects is shown in Figure 160 below and reveals that in the majority of projects involving Austrian partners there was no intra-Austrian collaboration (73%). This means that there was some level of intra-Austrian collaboration in 27% of the projects. The highest number of Austrian organisations involved in the same project was fourteen. These data indicate a good level of intra-Austrian collaboration within FP7 projects, suggesting that the projects in many cases provide the potential for knowledge transfer between Austrian organisations as well as between Austria and other countries.
Figure 160 Number and share of AT FP7 projects with >1 AT partners
AT partners Number of FP7 projects Share of FP7 projects
1 (no intra-AT collaboration) 595 73%
2 157 19%
3 43 5%
4 10 1%
5 2 0.2%
6 2 0.2%
7 2 0.2%
8 0 0.0%
9 1 0.1%
14 1 0.1%
Total 813 100%
Source: EC, processed and revised by PROVISO (11/2009)

Final Report 315
Collaboration with actors from different countries
The number of participations in FP7 projects with Austrian involvement, excluding the Austrian participations, was 44,255. Figure 161 presents data on the number and share of participations by actors from other countries within Austrian projects, listing first the 26 (other) EU Member States and then the candidate countries. In volume terms the greatest number and a share of collaborations took place with partners in Germany (17%), followed by the United Kingdom (10%), France (10%), Italy (9%), Spain and the Netherlands (~6% each). However, the absolute numbers of participation reflect mainly the high levels of participation in FP7 by these countries.
A better indicator of the strength of collaboration between Austria and other countries is shown in the final column of Figure 161, which expresses the ratio of each country‟s share of all participations in Austrian projects to their overall share of FP7 participations. Using this indicator, the most active „Member State‟ collaboration partners were Luxembourg, Croatia, Malta, Slovenia, Slovakia, Estonia and Germany and the least active were Cyprus, Spain, France, United Kingdom and Latvia. So far in FP7, the links with some neighbouring countries such as the Czech Republic and Hungary appear to be weaker than was the case in FP6.
Figure 161 Austrian collaboration with actors from different countries – EU Member States and Candidate countries
Country Participations in Austrian projects
Share of all other participations in Austrian projects
Ratio of participation in Austrian projects to overall level of FP7
participation
EU
Mem
ber
Sta
tes
Austria - - -
Belgium 418 4.6% 107%
Cyprus 72 0.8% 112%
Bulgaria 25 0.3% 73%
Czech Republic 132 1.5% 122%
Denmark 179 2.0% 98%
Estonia 55 0.6% 127%
Finland 233 2.6% 121%
France 856 9.5% 95%
Germany 1,509 16.7% 127%
Greece 275 3.0% 94%
Hungary 151 1.7% 119%
Ireland 103 1.1% 92%
Italy 806 8.9% 96%
Latvia 21 0.2% 86%
Lithuania 30 0.3% 98%
Luxembourg 25 0.3% 204%
Malta 25 0.3% 157%
Netherlands 519 5.7% 101%
Poland 207 2.3% 115%
Portugal 140 1.5% 93%
Romania 111 1.2% 123%
Slovakia 62 0.7% 143%
Slovenia 96 1.1% 145%
Spain 513 5.7% 76%
Sweden 345 3.8% 108%
United Kingdom 914 10.1% 84%
Ca
nd
ida
te
cou
ntr
ies Croatia 45 0.5% 175%
FYR of Macedonia 8 0.1% 98%
Turkey 71 0.8% 95%
Source: EC, processed and revised by PROVISO (11/2009)

Final Report 316
Figure 162 shows the numbers and share of collaborations with all other (non-member/candidate) countries where the number of participations within Austrian projects was 20 or more. Switzerland and Norway lead in terms of number of participations in Austrian projects with 341 and 126 participations respectively. In respect to the ratio of each country‟s share of all participations in Austrian projects to their overall share of FP7 participations, there is a strong link with Serbia and Ukraine, while the link with the United States and Israel is relatively weak.
Figure 162 Austrian collaboration with actors from different countries – Other countries with >20 participations in Austrian projects
Country Participations in Austrian projects
Share of all other participations in Austrian projects
Ratio of participation in Austrian projects to overall level of FP7
participation
Co
un
trie
s w
ith
20
+
pa
rtic
ipa
tio
ns
in A
ust
ria
n
pro
ject
s
Australia 26 0.3% 87%
China (People's Republic of) 40 0.4% 76%
Israel 97 1.1% 65%
Norway 126 1.4% 91%
Russian Federation 67 0.7% 105%
Serbia 32 0.4% 156%
Switzerland 341 3.8% 119%
Ukraine 30 0.3% 125%
United States 47 0.5% 63%
Source: EC, processed and revised by PROVISO (11/2009)
Collaboration between different types of organisation
The breakdown of partners in the Austrian FP7 projects by activity type is shown in the penultimate column of Figure 163. For comparison, the figure also shows the breakdown of all FP7 participations and all Austrian participations by activity type. The spread of Austrian partners by activity type is broadly in line with the overall FP7 overall profile for HEIs and industry, with a slightly higher share for research organisations and public bodies.
Austrian partners with activity type „research organisation‟ represent 27%, slightly higher than 24% in FP7 overall, despite the Austrian participation for this activity type being 20%. This means that there is a very high share of research institutes that partner with Austrian organisations. Similarly, there is a higher relative share of public bodies, as partners in Austrian projects, compared to both, the Austrian and overall FP7 profiles.
Figure 163 Partners in Austrian FP7 projects, by Activity Types
Activity Type Participations – AT Participations in AT projects
Participations – FP7 overall
Higher or secondary education est.
288 (38%) 2,274 (35%) 10,525 (36%)
Private commercial 213 (28%) 1,701 (26%) 7,359 (25%)
Research organisations 154 (20%) 1,786 (27%) 7,182 (24%)
Public body (excl. res. and educat.)
47 (6%) 557 (8%) 1,602 (5%)
Other 52 (7%) 244 (4%) 2,791 (9%)
Total 754 (100%) 6,562 (100%) 29,459 (100%)
Source: EC/E-CORDA, processed by PROVISO (11/2009), data not validated by PROVISO
AT demand for participation in FP7
This section looks at Austrian participation in proposals submitted to FP7, using the available data to gauge levels of demand and success rates within the competition.

Final Report 317
Proposals submitted to FP7 with AT participation
Data used for this section was provided by PROVISO based on the E-CORDA database. Data includes all eligible proposals submitted by applicants as a response to single stage calls for proposals and all eligible proposals submitted to second stage of FP7 calls for proposals involving a two-stage proposal submission and evaluation procedures. Proposals submitted to the first stage of two-stage calls are not included in the figures supplied by the Commission. Due to reliability problems with proposal-level data, this section limits the analysis to participations in proposals.
There were 5,801 Austrian participations in proposals within the overall set of 231,482 FP7 participations in proposals received to date, so Austrian participations in proposals formed 2.5% of the total. This is one indicator of the level of „demand‟ for participation in FP7 by Austrian organisations.
Figure 164 shows the breakdown of eligible FP7 Austrian participations in proposals, by priority area. The Figure also shows the breakdown of all eligible FP7 participations in proposals by Priority Area. By comparing all proposals with Austrian participation in proposals, the final column gives an indication of the relative level of demand for involvement in each area. In terms of numbers alone, Austrian participations in proposals were highest in the Information & Communication Technologies, Marie-Curie Actions and Health, each with more than 550 participations in submitted proposals.
By comparing all participations in proposals with Austrian participation, the penultimate column gives an indication of the relative level of demand for involvement in each area with the last column showing the rank of relative level of demand. The figure shows that Austrian participation-level proposal participation rate was highest in proposals submitted to the Coherent development of research policies, Science in Society, Energy, Socio-economic sciences and humanities, and Activities of International Cooperation priority areas. Austrian participation rates were lowest in Research Potential and European Research Council.
Figure 164 Austrian participation in FP7 proposals, by Priority Area
Priority All Eligible proposals
AT Eligible proposals
Demand - share of bids with AT involvement
Rank
Energy 8,032 282 3.5% 3
Environment (including Climate Change) 14,816 417 2.8% 7
Food, Agriculture, and Biotechnology 11,065 240 2.2% 16
General Activities (Annex IV) Not
available Not
available Not available Not available
Health 21,746 550 2.5% 11
Information & Communication Technologies 45,284 1,381 3.0% 6
Nanosciences, Nanotechnologies, Materials and new Production Technologies 5,142 95 1.8% 17
Security 5,306 137 2.6% 8
Socio-economic sciences and Humanities 11,110 354 3.2% 4
Space 1,963 50 2.5% 9
Transport (including Aeronautics) 14,653 351 2.4% 12
Activities of International Cooperation 1,362 42 3.1% 5
Coherent development of research policies 165 7 4.2% 1
Regions of Knowledge 1,984 44 2.2% 13
Research for the benefit of SMEs 17,034 432 2.5% 10
Research Infrastructures 4,974 108 2.2% 15
Research Potential 2,087 24 1.1% 19
Science in Society 3,617 127 3.5% 2
Marie-Curie Actions 31,177 684 2.2% 14
European Research Council 29,965 476 1.6% 18

Final Report 318
Priority All Eligible proposals
AT Eligible proposals
Demand - share of bids with AT involvement
Rank
Fusion Energy Not
available Not
available Not available Not available
Nuclear Fission and Radiation Protection Not
available Not
available Not available Not available
Total 231,482 5,801 2.5%
Source: EC/processed by PROVISO (11/2009)
Austrian success rates in applying to FP7
Austrian organisations had 5,801 participations in proposals which resulted in 1,137 participations in projects; so Austria‟s overall participation-level success rate was 19.6%, which is nearly identical to the FP7 average.
Austrian success rates by FP7 Priority Area
Figure 165 shows the participation level success rate profiles of Austrian and all FP7 participants. The analysis reveals that in just over half of the priority areas Austria outperformed the average FP7 success rate. Austrian organisations had the highest relative success rate in Activities of International Cooperation, and also performed very strongly in the Coherent development of research policies and European Research Council areas , where Austrian success rates were more than 30% higher than the FP7 averages.

Final Report 319
Figure 165 AT and all FP7 participation-level success rates by Priority Area
Priority AT
participations in proposals
AT participations in
projects
Participation success rate - AT
Participation success rate – all
FP7
Ratio of AT success rates to FP7 success rates
Energy 282 36 13% 22% 59%
Environment (including Climate Change) 417 81 19% 19% 102%
Food, Agriculture, and Biotechnology 240 42 18% 22% 81%
General Activities (Annex IV) Not available Not available Not available Not available Not available
Health 550 107 19% 21% 94%
Information & Communication Technologies 1,381 268 19% 17% 114%
Nanosciences, Nanotechnologies, Materials and new Production Technologies
95 56 59% 60% 98%
Security 137 28 20% 18% 115%
Socio-economic sciences and Humanities 354 40 11% 10% 109%
Space 50 20 40% 35% 115%
Transport (including Aeronautics) 351 105 30% 27% 110%
Activities of International Cooperation 42 25 60% 37% 162%
Coherent development of research policies 7 4 57% 43% 133%
Regions of Knowledge 44 13 30% 23% 130%
Research for the benefit of SMEs 432 35 8% 16% 52%
Research Infrastructures 108 43 40% 44% 92%
Research Potential 24 1 4% 10% 43%
Science in Society 127 23 18% 22% 84%
Marie-Curie Actions 684 173 25% 25% 102%
European Research Council 476 37 8% 6% 132%
Fusion Energy Not available Not available Not available Not available Not available
Nuclear Fission and Radiation Protection Not available Not available Not available Not available Not available
Total 5,801 1,137 20% 20% 100%
Source: EC/processed by PROVISO (11/2009)

Final Report 320
Austrian participation rates, explained by levels of demand and success rate
Figure 166 presents the data on Austrian demand, success and participation rates by priority area in FP7, relative to FP7 rates overall. These relative shares allow identification of the factor (success rate or demand) behind the Austrian level of participation in each priority area. The final column of Figure 166 contains a note on how the two factors combine to explain the relative participation rate in each priority area.
Figure 166 shows that the priority areas with the highest relative Austrian participation rates are the Coherent development of research policies driven by a combination of very high demand and high success rate, Activities of International Cooperation driven by high demand and a very high success rate, Science in Society driven by high demand and high success rate, Citizens and governance driven by high demand, Information society technologies driven by high demand and high success rate, and Socio-economic sciences and Humanities driven by high demand.

Final Report 321
Figure 166 Austrian participation: a comparison between Austrian relative success and demand in FP7 by priority area
Priority Participation rate Normalised Demand Normalised SR Note
Coherent development of research policies High (225%) High (169%) High (133%) Very high participation resulting from very high
demand and high SR
Activities of International Cooperation High (200%) High (123%) High (162%) Very high participation resulting from high demand
and very high SR
Information & Communication Technologies High (139%) High (122%) High (114%) High participation due to high demand and high SR
Socio-economic sciences and Humanities High (139%) High (127%) Medium (109)% High participation resulting from high demand
Science in Society High (118%) High (140%) Low (84%) High participation resulting from high demand
Security High (118%) Medium (103%) High (115%) High participation resulting from high SR
Space High (117%) Medium (102%) High (115%) High participation resulting from high SR
Environment (including Climate Change) Medium (115%) High (112%) Medium (102%) Medium participation due to medium SR
Regions of Knowledge Medium (115%) Low (88%) High (130%) Medium participation due to high SR and low demand
Transport (including Aeronautics) Medium (106%) Medium (96%) Medium (110%) Medium participation resulting from medium demand
and medium SR
Health Medium (94)% Medium (101%) Low (94%) Medium participation resulting from medium demand
Marie-Curie Actions Medium (89%) Low (88%) Medium (102%) Medium participation due to medium SR
European Research Council Low (83%) Low (63%) High (132%) Low participation resulting from low demand
Energy Low (83%) High (140%) Low (59%) Low participation resulting from low SR
Research Infrastructures Low (79%) Low (87%) Low (92%) Low participation due to low demand and low SR
Nanosciences, Nanotechnologies, Materials and new Production Technologies
Low (72%) Low (74%) Medium (98%) Low participation due to low demand
Food, Agriculture, and Biotechnology Low (70%) Low (87%) Low (81%) Low participation resulting from low demand and low
SR
Research for the benefit of SMEs Low (52%) Medium (101)% Low (52%) Low participation due to low SR
Research Potential Low (20%) Low (46%) Low (43%) Very low participation resulting from very low
demand and very low SR
General Activities (Annex IV) Not available Not available Not available Not available
Fusion Energy Not available Not available Not available Not available
Nuclear Fission and Radiation Protection Not available Not available Not available Not available
Total 100% 100% 100%
Source: EC/processed by PROVISO (11/2009)


Final Report 323

Technopolis Forschungs- und Beratungsgesellschaft m.b.H. Rudolfsplatz 12/11 A-1010 Wien Austria T +43 1 503 9592 12 F +43 1 503 9592 11 E [email protected] www.technopolis-group.com