The impact on satisfaction of managing attribute expectations: should performance claims be...
14
* Corresponding author. Tel.: #1-517-353-6381; fax: #1-517- 432-1112. E-mail address: spreng@pilot.msu.edu (R.A. Spreng). Journal of Retailing and Consumer Services 8 (2001) 261}274 The impact on satisfaction of managing attribute expectations: should performance claims be understated or overstated? Richard A. Spreng*, Cornelia Dro K ge Department of Marketing and Supply Chain Management, College of Business, Eli Broad Graduate School of Management, Michigan State University, N370 North Business Complex, East Lansing, MI 48824, USA Abstract Some marketers are suggesting that one way to increase consumer satisfaction is to lower expectations or `promise less than you can delivera, while others have suggested raising expectations, since expectations often have a positive impact on perceptions of performance. This study examines the impact of managing attribute expectations downward (when attribute performance is actually high) versus upward (when attribute performance is actually low) through marketer supplied information. The results show that providing inaccurate information to customers, by either understating or overstating attribute performance, results in lower satisfaction with marketer supplied information. Increasing attribute expectations did increase perceptions of attribute performance, however. Implications for managers are discussed. 2001 Elsevier Science Ltd. All rights reserved. Keywords: Satisfaction; Managing expectations 1. Introduction Customer satisfaction is crucial in retailing due to its impact on future customer intentions, loyalty, and word- of-mouth communications, and strategies have been sug- gested to `manage customer expectations.a In general, this seems to mean to deliberately reduce customer ex- pectations of performance so that it is easier to meet or exceed these expectations. For example, Peters (1987) urges "rms to `promise less and deliver more.a An alternative strategy, however, is to increase prepurchase expectations, as this may have the e!ect of increasing perceptions of performance, which in turn may increase satisfaction. In fact, Boulding et al. (1993, p. 24, emphasis in original) recommended this when they stated ` 2 "rms should manage customers' predictive expectations up rather than down.a Thus, managers are faced with con- #icting prescriptions regarding the communication of information about the product. The purpose of this paper is to examine the impact on customer satisfaction of managing attribute expectations through the information provided by the "rm. First, the strategy of intentionally reducing attribute expectations through marketer supplied information will be tested: will intentionally understating attribute performance produce positive discon"rmation, and actually result in higher attribute satisfaction? In this "rst case, we focus on the realistic scenario where actual attribute perfor- mance is relatively high but a retail salesperson provides modest claims on that attribute. Second, the impact of raising attribute expectations higher than actual at- tribute performance will be examined: will the positive e!ect of expectations on perceived performance produce higher satisfaction (even if it also produces negative discon"rmation)? In this second case, we assume that performance on an attribute is relatively low but the salesperson claims a higher level than actually exists. In both cases, we compare the impact on attribute satisfac- tion of telling the truth with the impact of either under- stating or overstating performance in the creation of attribute expectations. Finally, we incorporate the rami- "cation of truthfulness per se by examining consumer satisfaction related to the information provided by the salesperson. The paper is organized as follows. First, the competing strategies of managing attribute expectations up or down are reviewed, and hypotheses are developed. Depending on whether a discon"rmation of expectations model or 0969-6989/01/$ - see front matter 2001 Elsevier Science Ltd. All rights reserved. PII: S 0 9 6 9 - 6 9 8 9 ( 0 0 ) 0 0 0 3 2 - 1
Transcript of The impact on satisfaction of managing attribute expectations: should performance claims be...

*Corresponding author. Tel.: #1-517-353-6381; fax: #1-517-432-1112.
E-mail address: [email protected] (R.A. Spreng).
Journal of Retailing and Consumer Services 8 (2001) 261}274
The impact on satisfaction of managing attribute expectations: shouldperformance claims be understated or overstated?
Richard A. Spreng*, Cornelia DroK geDepartment of Marketing and Supply Chain Management, College of Business, Eli Broad Graduate School of Management, Michigan State University,
N370 North Business Complex, East Lansing, MI 48824, USA
Abstract
Some marketers are suggesting that one way to increase consumer satisfaction is to lower expectations or `promise less than youcan delivera, while others have suggested raising expectations, since expectations often have a positive impact on perceptions ofperformance. This study examines the impact of managing attribute expectations downward (when attribute performance is actuallyhigh) versus upward (when attribute performance is actually low) through marketer supplied information. The results show thatproviding inaccurate information to customers, by either understating or overstating attribute performance, results in lowersatisfaction with marketer supplied information. Increasing attribute expectations did increase perceptions of attribute performance,however. Implications for managers are discussed. ! 2001 Elsevier Science Ltd. All rights reserved.
Keywords: Satisfaction; Managing expectations
1. Introduction
Customer satisfaction is crucial in retailing due to itsimpact on future customer intentions, loyalty, and word-of-mouth communications, and strategies have been sug-gested to `manage customer expectations.a In general,this seems to mean to deliberately reduce customer ex-pectations of performance so that it is easier to meet orexceed these expectations. For example, Peters (1987)urges "rms to `promise less and deliver more.a Analternative strategy, however, is to increase prepurchaseexpectations, as this may have the e!ect of increasingperceptions of performance, which in turn may increasesatisfaction. In fact, Boulding et al. (1993, p. 24, emphasisin original) recommended this when they stated `2"rmsshould manage customers' predictive expectations uprather than down.a Thus, managers are faced with con-#icting prescriptions regarding the communication ofinformation about the product.
The purpose of this paper is to examine the impact oncustomer satisfaction of managing attribute expectationsthrough the information provided by the "rm. First, the
strategy of intentionally reducing attribute expectationsthrough marketer supplied information will be tested:will intentionally understating attribute performanceproduce positive discon"rmation, and actually result inhigher attribute satisfaction? In this "rst case, we focuson the realistic scenario where actual attribute perfor-mance is relatively high but a retail salesperson providesmodest claims on that attribute. Second, the impact ofraising attribute expectations higher than actual at-tribute performance will be examined: will the positivee!ect of expectations on perceived performance producehigher satisfaction (even if it also produces negativediscon"rmation)? In this second case, we assume thatperformance on an attribute is relatively low but thesalesperson claims a higher level than actually exists. Inboth cases, we compare the impact on attribute satisfac-tion of telling the truth with the impact of either under-stating or overstating performance in the creation ofattribute expectations. Finally, we incorporate the rami-"cation of truthfulness per se by examining consumersatisfaction related to the information provided by thesalesperson.
The paper is organized as follows. First, the competingstrategies of managing attribute expectations up or downare reviewed, and hypotheses are developed. Dependingon whether a discon"rmation of expectations model or
0969-6989/01/$ - see front matter ! 2001 Elsevier Science Ltd. All rights reserved.PII: S 0 9 6 9 - 6 9 8 9 ( 0 0 ) 0 0 0 3 2 - 1

a perceived performance model is accepted, rationales forthe manipulation of expectations become clear. Then anexperiment is described that allows testing of these com-peting strategies. Finally, the results and implications arepresented and discussed.
2. The e4ects of managing expectations
2.1. Predictive expectations
While predictive expectations have a number of sour-ces, an important source is communication from the "rm.Expectations created from "rm communications havebeen described as `promisesa (Woodru! et al., 1991),`persuasion-based expectationsa (Spreng and Dixon,1992), `explicit services promisesa (Zeithaml et al., 1993),and `marketer supplied informationa (Gardial et al.,1994). For example, Zeithaml et al. (1993, p. 9) de"nedexplicit service promises as `personal and nonpersonalstatements about the service made to customers by theorganization. These promises take di!erent forms,among them advertising, personal selling, contracts, andcommunications from service or repair departmentsa.Similarly, Gardial et al. (1994, p. 559) de"ned mar-keter}supplied information as `standards that are sug-gested by corporate/marketing communications (e.g.,promotions, salespeople, or manufacturer)a, and Sprengand Dixon (1992) found evidence that persuasion-basedexpectations were used by consumers in determiningsatisfaction. In addition, the `gapa model proposed byZeithaml et al. (1988) posits that `external communica-tion to consumersa is one of the sources of the consumer'sexpectations of service. Our focus in this paper will be onattribute expectations that are formed from marketersupplied information (a retail salesperson), since theseexpectations are largely controllable by the "rm.
2.2. The disconxrmation of expectations model:expectations and satisfaction
The dominant model of satisfaction/dissatisfaction isthe discon"rmation of expectations model (Oliver, 1980).A great deal of research has shown support for this model(for reviews see Oliver, 1997; Yi, 1990). This model pro-poses that a consumer's level of satisfaction with at-tributes, products or services is primarily determined bydiscon"rmation, i.e., the extent to which performancemeets, exceeds, or falls short of predictive expectations.When predictive expectations and performance match,con"rmation results; but this could be the result of lowexpectations matched with low performance, or of highexpectations matched with high performance. Converse-ly, when expectations and performance do not match,discon"rmation results; this could be due to low expecta-tions and high performance (positive discon"rmation,
leading to satisfaction) or high expectations andlow performance (negative discon"rmation, leading todissatisfaction).
While most "rms are tempted to create high expecta-tions in order to attract customers, an implication of thediscon"rmation of expectations model is that if attributeexpectations can be lowered, then positive discon"rma-tion (leading to attribute satisfaction) is more likely tooccur. Thus, a common prescription is to manage expec-tations downward (e.g., Davidow and Uttal, 1989; Peters,1987). The "rst question to be addressed with this studyis: given high attribute performance, does managing at-tribute expectations downward work? The `managingexpectations downwarda hypothesis is that when expec-tations are low and actual performance is high (Fig. 1,Panel 1A), satisfaction will be higher than when the samelevel of high performance is matched with high expecta-tions (point * in Panel 1A, con"rmation of high expecta-tions). This leads to the "rst hypothesis:
H1A Given that attribute performance is high and lowattribute expectations are created, attribute satis-faction will be higher than when attribute expecta-tions are created that match attribute performance.
The discon"rmation of expectations model also pre-dicts that when actual performance is low, satisfactionshould be lower when high expectations are created (Fig.1, Panel 2A), than when low expectations are created(point * in Panel 2A, con"rmation of low performance).For managers, the prescription is not to manage expecta-tions up (given low performance); i.e., managers shouldavoid pu!ery and exaggerations about attribute perfor-mance when actual performance is low. Thus, the secondhypothesis is
H2A: Given that attribute performance is low and highattribute expectations are created, attribute satis-faction will be lower than when attribute expecta-tions are created that match attribute performance.
It is important to note that according to the discon"r-mation of expectations model, it never makes sense toraise expectations above actual performance because thiswould always lead to lower satisfaction than if expecta-tions are created that match actual performance. Onlythe formulae expectations"performance (when actualperformance is low) or expectations(performance (whenactual performance is high; see Fig. 1) make managerialsense. In order to provide a rationale for raising expecta-tions above actual performance, we turn to the perceivedperformance model next.
2.3. The perceived performance model: expectations andperceived performance
The perceived performance model has prescriptions inour two scenarios that are quite di!erent from the
262 R.A. Spreng, C. Dro( ge / Journal of Retailing and Consumer Services 8 (2001) 261}274
Noonamsom
Noonamsom
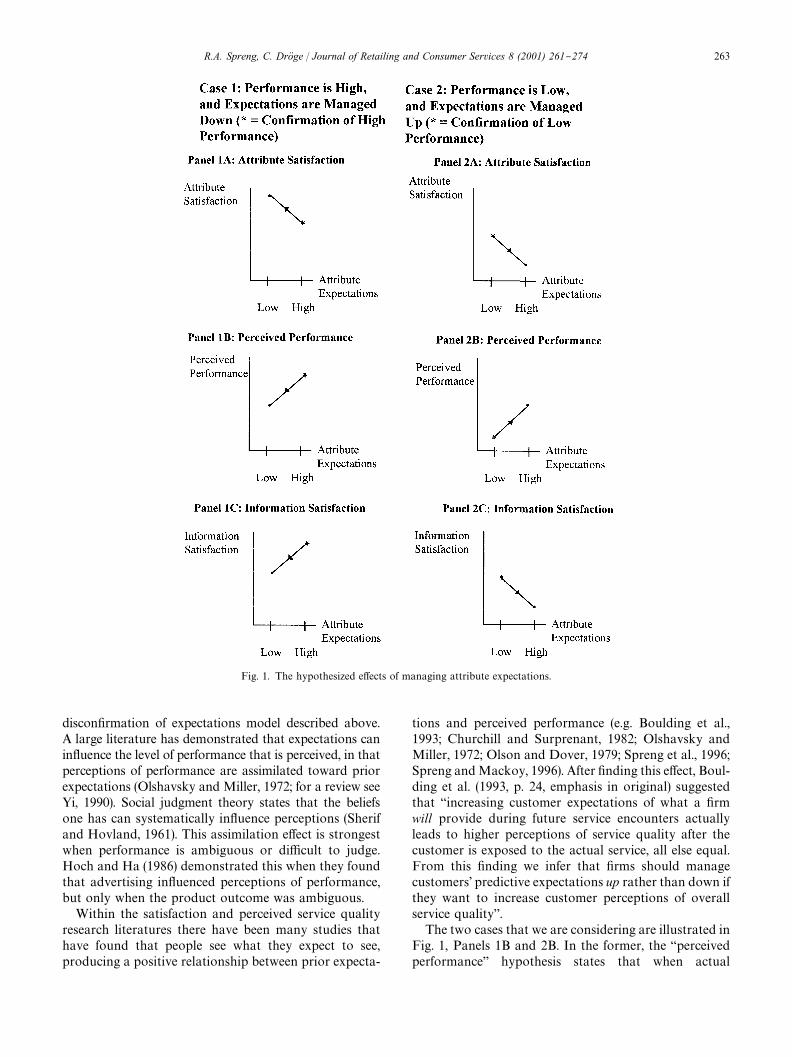
Fig. 1. The hypothesized e!ects of managing attribute expectations.
discon"rmation of expectations model described above.A large literature has demonstrated that expectations canin#uence the level of performance that is perceived, in thatperceptions of performance are assimilated toward priorexpectations (Olshavsky and Miller, 1972; for a review seeYi, 1990). Social judgment theory states that the beliefsone has can systematically in#uence perceptions (Sherifand Hovland, 1961). This assimilation e!ect is strongestwhen performance is ambiguous or di$cult to judge.Hoch and Ha (1986) demonstrated this when they foundthat advertising in#uenced perceptions of performance,but only when the product outcome was ambiguous.
Within the satisfaction and perceived service qualityresearch literatures there have been many studies thathave found that people see what they expect to see,producing a positive relationship between prior expecta-
tions and perceived performance (e.g. Boulding et al.,1993; Churchill and Surprenant, 1982; Olshavsky andMiller, 1972; Olson and Dover, 1979; Spreng et al., 1996;Spreng and Mackoy, 1996). After "nding this e!ect, Boul-ding et al. (1993, p. 24, emphasis in original) suggestedthat `increasing customer expectations of what a "rmwill provide during future service encounters actuallyleads to higher perceptions of service quality after thecustomer is exposed to the actual service, all else equal.From this "nding we infer that "rms should managecustomers' predictive expectations up rather than down ifthey want to increase customer perceptions of overallservice qualitya.
The two cases that we are considering are illustrated inFig. 1, Panels 1B and 2B. In the former, the `perceivedperformancea hypothesis states that when actual
R.A. Spreng, C. Dro( ge / Journal of Retailing and Consumer Services 8 (2001) 261}274 263

attribute performance is high and attribute expectationsare managed down, perceived attribute performance willbe lower than when accurate attribute expectations arecreated (point*, con"rmation of high expectations). Forexample, a "rm could promise four day delivery, know-ing that the product will be there in three days, in anattempt to produce performance that is better than ex-pected. But the customer may rely on these expectationsin determining his/her perception of performance, andperceive delivery as being in four days, when it wasactually three days. If true, managers would want toavoid such expectations manipulations. We test this asfollows:
H1B: Given that attribute performance is high and thenlow attribute expectations are created, perceivedattribute performance will be lower than whenattribute expectations are created that match at-tribute performance.
It is when attribute performance is low (Panel 2B), thatthe value of managing attribute expectations is revealed:here, when expectations are managed up, the `perceivedperformancea hypothesis says that perceptions of at-tribute performance will be enhanced when compared tocreating accurate attribute expectations (point *, con-"rmation of low expectations). Thus, if hypothesis 2Bbelow is con"rmed, managers could fruitfully manageattribute expectations up when actual attribute perfor-mance is low:
H2B: Given that attribute performance is low and thenhigh attribute expectations are created, perceivedattribute performance will be higher than whenattribute expectations are created that match at-tribute performance.
Note that hypotheses H1A and H1B are in con#ict.H1A suggests that lowering expectations (given high per-formance) will result in higher satisfaction by increasingpositive discon"rmation, while H1B suggests that lower-ing expectations (given high performance) will result inlower perceived performance and, in turn, lower satisfac-tion. Similarly, Hypothesis H2A and H2B are in con#ict.H2A suggests that raising expectations (given low perfor-mance) will result in lower satisfaction, while H2B sug-gests that raising expectations (given low performance)will result in higher perceived performance and, in turn,higher satisfaction. Yi (1990, pp. 78}79) discussed thiscon#ict when he observed:
It has been found that raising expectations may en-hance consumer ratings of product performance (An-derson 1973; Olshavsky and Miller, 1972). However,the e!ects of expectations on CS [consumer satisfac-tion] seem to be more complicated than for productperformance. While raising expectations about a prod-uct may enhance perceived product performance, it
may also increase the magnitude of discon"rmation.Thus, raising consumer expectations may yield bothan increase (due to the increase in perceived productperformance) and a decrease in CS (due to the increasein discon"rmation).a
2.4. The impact of managing expectations on satisfactionwith information
While not well researched, the idea that consumers'total satisfaction with a product or service is related atleast in part to their satisfaction with aspects of theprepurchase decision process is not new. For example,Jacoby et al. (1974) found that as the quantity of prepur-chase information increased, the level of product satisfac-tion also increased. Westbrook and Newman (1978)examined shopper dissatisfaction, which they de"ned as`the extent to which consumers encounter favorable ver-sus unfavorable experiences during the process of shop-ping for, deliberating about, and choosing a producta.Finally, Bettman (1979) suggested that before use, theconsumer gathers and processes information, and afteruse, the outcome serves as an additional source of in-formation. If the product performs poorly, the consumeris likely to attempt to identify the cause of the pooroutcome: `inferences about outcomes might be classi"edas directly related to the alternative (i.e., the cause issomething about the product itself ) or as related to thesituation or other factors (i.e., the cause is some factor notinherent to the product alone, such as the consumer's notfollowing directions or using the product in an inappro-priate situation)a (p. 272).
Particularly relevant to the topic of managing expecta-tions is research by Spreng et al. (1996), who proposedthe construct `satisfaction with the informationa. Theyargued that when expectations are created by commun-ications from the "rm (e.g., advertising and personalselling) and these expectations are discon"rmed, one canbe satis"ed or dissatis"ed with the information as well aswith the product itself. This dissatisfaction response tothe experience of using information can then in#uenceproduct satisfaction.
The distinction between satisfaction with product at-tributes and satisfaction with information about productattributes is relevant for two reasons. First, for the "rm,attribute versus information satisfaction generally #owfrom di!erent elements of the marketing mix (productdevelopment and promotion, respectively) and thus maybe managed separately. The tasks involved in ultimatelycreating satisfaction with attributes versus informationcan be quite di!erent, as R&D/Engineering versus copywriting illustrate. Second, from a theoretical perspective,one might question whether the formation of satisfactionwith information follows the same patterns with regards tomanaging expectations up or down as does satisfactionwith attributes. For example, if a consumer is told by
264 R.A. Spreng, C. Dro( ge / Journal of Retailing and Consumer Services 8 (2001) 261}274

a salesperson that a product will perform in a certain way(e.g., a product is easy to use) and this attribute is nega-tively discon"rmed (e.g., it is not easy to use), then theconsumer is likely to be dissatis"ed with the informationthat was given, as well as with the product. But would thereverse be true as well? If a salesperson undersells a prod-uct (e.g., by telling the customer it is not that easy to use)and this attribute is positively discon"rmed (e.g., it is easyto use), will the consumer also be dissatis"ed with theinformation?
We propose that when the information provided doesnot match the performance received, then satisfactionwith the information will be lower than when the in-formation matches performance. This is because truthful-ness and accuracy are key attributes of information, andboth overstating and understating attribute performancemeans that the consumer is receiving less valuable in-formation than if the truth is told. When a consumer ispromised high performance but receives low perfor-mance (Panel 2C in Fig. 1), the consumer may interpretthis as the marketer lying to make the sale, and henceinformation satisfaction will be low. On the other hand,when the consumer is told that attribute performancewill be average or poor but it is actually good (Panel 1Cof Fig. 1), the consumer may be suspicious (`what's thecatch?a) or think the marketer unnecessarily held backinformation, and this may result in low information satis-faction too. Thus:
H1C: Given that attribute performance is high and thenlow attribute expectations are created, informa-tion satisfaction will be lower than when attributeexpectations are created that match attribute per-formance.
H2C: Given that attribute performance is low and thenhigh attribute expectations are created, informa-tion satisfaction will be lower than when attributeexpectations are created that match attribute per-formance.
2.5. The determinants of satisfaction
Finally, we test the impact of perceived performance,discon"rmation, and information satisfaction on at-tribute satisfaction, controlling for any expectations ef-fect not accounted for by these three predictors. Asdiscussed previously, the performance e!ect should bepositive and the e!ect of discon"rmation on satisfactionshould be positive as well. Furthermore, attribute satis-faction should increase with information satisfaction ifconsumers are evaluating their entire consumption ex-perience. Thus, H3 below veri"es that the argumentsmade to support the previous hypotheses are indeedvalid.
H3A: Discon"rmation has a positive e!ect on attributesatisfaction.
H3B: Perceived performance has a positive e!ect onattribute satisfaction.
H3C: Information satisfaction has a positive e!ect onattribute satisfaction.
3. Research methods
3.1. Subjects and procedure
A 2!2 laboratory experiment was used so that expec-tations (high versus low) and performance (high versuslow) could be manipulated. Adult subjects were recruitedfrom a local church and signed up for individual, hour-long appointments. Subjects were recruited by tellingthem that the church would receive cash and a valuableproduct in exchange for their time. Subjects thereforemade a sacri"ce of their time, and anticipated the receiptof actual bene"ts from the product (through theirchurch). Because they made sacri"ces and knew theywould receive bene"ts, we believe they had the potentialto experience feelings of satisfaction/dissatisfaction. A to-tal of 214 usable responses were obtained. The medianage group was 31}35 years, 56% were female, 1% hadless than a high school education, 22% had high schoolor technical education, 27% had some college, and 49percent had at least a bachelor's degree.
A camcorder was selected as the product for tworeasons: (1) Both expectations and performance could berealistically manipulated at the attribute level of analysis;and (2) subjects in a lab could use the product for su$-cient time to form satisfaction/dissatisfaction.
Subjects were processed one at a time. Subjects read oneof two descriptions of the camcorder, purportedly froma sales person in a camera store. This was the expectationsmanipulation (content is described below), and the subjectwas then asked about predictive expectations. Perfor-mance was manipulated by taking subjects to one of tworooms, each containing a television set and a camcorder.Subjects used the camcorder and were also shown a shortdemonstration videotape. Subjects then returned to the"rst room and completed measures for perceivedattribute performance and all satisfaction evaluations.
3.2. Manipulations
Expectations and performance were manipulated forthree attributes: (1) ease of use; (2) versatility, or theability of the camcorder to handle special situations suchas a backlighted or high speed subject; and (3) picturequality. We attempted to create realistic scenarios involv-ing trade-o!s between the three attributes, becausetrade-o!s are characteristic of this product in the market-place. For example, easy to use cameras tend to be lessversatile. The per attribute, 2 (expectations) X 2 (perfor-mance) design is shown in Table 1.
R.A. Spreng, C. Dro( ge / Journal of Retailing and Consumer Services 8 (2001) 261}274 265

Table 1Manipulations of expectations and performance and their intended e!ects regarding discon"rmation for each of three attributes
Manipulated expectations condition Manipulated performance condition
Received an easy to use camcorder Received a di$cult to use camcorder
Create expectations of easy to use Con"rmation of high performance Negative discon"rmationCreate expectations of di$cult to use Positive discon"rmation Con"rmation of low performance
Received high versatility camcorder Received low versatility camcorderCreate expectations of high versatility Con"rmation of high performance Negative discon"rmationCreate expectations of low versatility Positive discon"rmation Con"rmation of low performance
Received high picture quality camcorder Received low picture quality camcorderCreate expectations of high picture quality Con"rmation of high performance Negative discon"rmationCreate expectations of low picture quality Positive discon"rmation Con"rmation of low performance
Subjects were randomly assigned to one of two expec-tations conditions, in which subjects read a product de-scription that was from a sales person in a retail camerastore. Subjects were told that the camcorder: (1) is `easyto use but, like most automatic cameras, is not able toprovide great pictures in all situationsa; or (2) is `moredi$cult to use but, unlike easy to use cameras, willprovide great pictures in all situationsa. Then subjectswere randomly assigned to one of two performance con-ditions. In the "rst, the automatic features were turned onand the manual override controls were covered. Thiscamcorder was easy to use, but the demonstration tapeshowed that it was not very versatile and the televisionwas manipulated so that the picture quality was not verygood. In the second, the controls had to be set manually,and subjects had to follow instructions for setting eachone. Thus, the camera was harder to use. However, thetelevision was manipulated to provide an excellent pic-ture, and the demonstration tape showed very goodperformance in di$cult photographic situations. Notethat each attribute was manipulated, but not everycombination of high/low on every attribute wasexperimentally created, since this would have createdunrealistic combinations of attributes (e.g., easy to useand versatile).
3.3. Measures
Manipulation checks. Immediately after reading the ex-pectations manipulation, subjects "lled out the expecta-tions measures in order to provide a manipulation check.It was important to capture the expectations manipula-tion checks at this point, rather than later in the experi-ment, since perceptions of performance might havein#uenced recalled expectations. Research has shownthat recalled expectations are di!erent than pre-purchaseexpectations (Halstead and Page, 1992). For each of thethree attributes (ease-of-use, versatility, and picture qual-ity) they were asked: `What performance do you anticip-ate or expect from this product?a The anchors for the
11-point scales were: (1) for ease-of-use, `Not very easy tousea and `Very easy to usea; (2) for versatility, `moder-ately versatile, able to take video in typical situationsaand `extremely versatile, able to take video in all situ-ationsa; and (3) for picture quality, `average qualitya and`extremely high quality.a In addition, the performancemeasures (see question wording below) were used asmanipulation checks for the performance manipulation.Finally, we veri"ed that the appropriate attribute discon-"rmations were created (see Table 1). These were mea-sured by asking, for each attribute, for the subject toassess the `di!erence between what you expected andhow well the camcorder meets your expectationsa, onseven-point scales, anchored `Exactly as I expecteda"1to `extremely di!erent than I expecteda"7.
Perceived attribute performance measures: Immediatelyafter the product experience, subjects responded to per-formance questions on the same three attributes. Thesequestions asked `How did you think the camera actuallyperformed?a on each attribute, and used 11-point scalesanchored the same as the expectations questions.
Attribute satisfaction measures: Subjects were asked:`Thinking just about the product itself, how satis"ed areyou with this product?a A seven-point scale was used foreach attribute, anchored by `very dissatis"eda and `verysatis"eda.
Information satisfaction. These measures asked subjects`thinking just about the information from the salesper-son, how satis"ed are you with this information?aA seven-point scale anchored by `very dissatis"eda and`very satis"eda was used for each attribute.
4. Results
4.1. Manipulation checks
Since the three attributes were manipulated in setscorresponding to realistic scenarios, it is particularlyimportant to verify that the manipulations were successful
266 R.A. Spreng, C. Dro( ge / Journal of Retailing and Consumer Services 8 (2001) 261}274

Table 2Results of the manipulation tests
Dependent variable Means
Intended manipulation of `lowa on the attribute Intended manipulation of `higha on the attributeExpectations for2
Ease of use 5.28! 9.32Versatility 4.51! 8.79Picture quality 3.88! 8.78
Perceived performance for2Ease of use 6.97! 9.42Versatility 4.48! 8.48Picture quality 3.75! 7.83
Con"rming low or high expectations Discon"rming low or high expectationsDiscon"rmation for2
Ease of use 2.93" 3.28Versatility 2.92! 3.59Picture quality 3.20# 3.78
!Means are signi"cantly di!erent at p(0.001."Means are signi"cantly di!erent at p"0.13.#Means are signi"cantly di!erent at p(0.01.
Table 3E!ects of manipulated expectations and performance on attribute satisfaction
Source of variation Multivariate F ratio Univariate F ratio Degrees of freedom P value
Expectations 2.48 3 0.039Ease of use 4.12 1 0.044Versatility 5.87 1 0.016Picture quality 4.38 1 0.038
Performance 53.24 3 (0.001Ease of use 15.98 1 (0.001Versatility 67.22 1 (0.001Picture quality 115.82 1 (0.001
Interaction 0.62 3 0.605Ease of use 1.65 1 0.200Versatility 0.43 1 0.511Picture quality 0.45 1 0.506
for each attribute. First, an ANOVA was conducted witheach expectation measure as the dependent variable, andthe expectations manipulation as the independent vari-able. For each attribute, there was a signi"cant di!erencein the means for measured expectations (each atp(0.001; see the "rst part of Table 2). Second, for theperformance manipulation the appropriate perceivedperformance di!erences were also found (p(0.001 foreach attribute; see second part of Table 2). Finally, theappropriate discon"rmation di!erences as speci"ed inTable 1 (where 1"exactly as I expected and 7"ex-tremely di!erent than I expected) were found for two ofthe attributes (versatility and picture quality, p(0.01,see last part of Table 2) and directional support wasfound for the ease of use attribute (p"0.13).
4.2. Hypotheses tests: manipulated expectations andperformance as independent variables
Ewects on attribute satisfaction: the hypotheses were"rst tested using MANOVA with the three attributesatisfaction measures as dependent variables. The resultsindicated that there were signi"cant main e!ects for bothmanipulations (expectations and performance), but theinteraction was not signi"cant. Table 3 and Fig. 2 showthe univariate attribute satisfaction results for each at-tribute. The pairwise planned comparisons reported be-low used the Bonferroni pairwise procedure with twoa priori comparisons.
Fig. 2 shows the actual results for the three attributeswhile the hypotheses are illustrated in Fig. 1, Panel A
R.A. Spreng, C. Dro( ge / Journal of Retailing and Consumer Services 8 (2001) 261}274 267

Fig. 2. The e!ects of managing expectations on attribute satisfaction.
(1A and 2A). In Case 1, downward manipulation ofexpectations from high actual performance was hy-pothesized to lead to higher attribute satisfaction (H1A).However, a glance at the results for the three attributes inCase 1 in Fig. 2 shows that H1A is not supported. For`ease of use,a the di!erence is not signi"cant (Bonferronipairwise p"1.00); for the versatility attribute, the pair-wise comparison indicated marginal signi"cance, but inthe opposite direction (p"0.06); and for the picture qual-ity attribute, the di!erence is marginally signi"cant(p"0.10) but again in the opposite direction.
In Case 2, upward manipulation of expectations washypothesized to lead to lower satisfaction (H2A). Fig. 2illustrates that this is supported for `ease of usea
(p"0.04), but not for versatility (p"0.43) or for picturequality (p"0.63).
Ewects on perceived performance. Table 4 shows theMANOVA results for perceived performance and indi-cates that there were signi"cant main e!ects for bothexpectations and performance, but that the interactionwas not signi"cant. Fig. 3 illustrates the univariateresults. In Case 1, downward expectation manipulationof high actual performance was hypothesized to lead tolower perceived performance (H1B). The results are notsupportive in the case of `ease of usea (Bonferroni pair-wise is n.s.), but are supportive for versatility (p"0.06)and picture quality (p(0.001). In Case 2, upwardexpectation manipulation of low actual performance was
268 R.A. Spreng, C. Dro( ge / Journal of Retailing and Consumer Services 8 (2001) 261}274

Table 4E!ects of manipulated expectations and performance on perceived performance
Source of variation Multivariate F ratio Univariate F ratio Degrees of freedom P value
Expectations 6.29 3 (0.001Ease of use 0.41 1 0.525Versatility 11.58 1 0.001Picture quality 19.92 1 (0.001
Performance 79.50 3 (0.001Ease of use 68.60 1 (0.001Versatility 169.75 1 (0.001Picture quality 171.31 1 (0.001
Interaction 0.87 3 0.458Ease of use 1.16 1 0.283Versatility 0.08 1 0.782Picture quality 0.28 1 0.598
Fig. 3. The e!ects of managing expectations on perceived performance.
R.A. Spreng, C. Dro( ge / Journal of Retailing and Consumer Services 8 (2001) 261}274 269

Table 5E!ects of manipulated expectations and performance on information satisfaction
Source of variation Multivariate F ratio Univariate F ratio Degrees of freedom P value
Expectations 0.90 3 0.442Ease of use 0.15 1 0.696Versatility 0.82 1 0.368Picture quality 0.50 1 0.480
Performance 9.77 3 (0.001Ease of use 0.02 1 0.903Versatility 13.00 1 (0.001Picture quality 19.69 1 (0.001
Interaction 7.11 3 (0.001Ease of use 17.35 1 (0.001Versatility 11.32 1 (0.001Picture quality 9.38 1 0.002
Fig. 4. The e!ects of managing expectations on information satisfaction.
270 R.A. Spreng, C. Dro( ge / Journal of Retailing and Consumer Services 8 (2001) 261}274

Table 6Pairwise correlations of attribute satisfaction with key model variables
Correlations (p-values)Case 1: Performance is high Case 2: Performance is low
Attribute satisfaction:(1) Ease of use with2
Perceived performance 0.514 ((0.001) 0.546 ((0.001)Discon"rmation 0.426 ((0.001) 0.610 ((0.001)Information satisfaction 0.250 (0.01) 0.384 ((0.001)Expectations (measured) 0.115 (0.241) !0.130 (0.185)
(2) Versatility with2Perceived performance 0.358 ((0.001) 0.685 ((0.001)Discon"rmation 0.535 ((0.001) 0.750 ((0.001)Information satisfaction 0.23 (0.02) 0.423 ((0.001)Expectations (measured) 0.247 (0.01) 0.275 (0.004)
(3) Picture quality with2Perceived performance 0.554 ((0.001) 0.616 ((0.001)Discon"rmation 0.674 ((0.001) 0.784 ((0.001)Information satisfaction 0.367 ((0.001) 0.509 ((0.001)Expectations (measured) 0.311 (0.001) 0.259 (0.007)
hypothesized to lead to higher perceived performance(H2B). Again, this is not supported for `ease of usea(Bonferroni pairwise is n.s.), but is supported for versatil-ity (p"0.02) and picture quality (p"0.02).
Ewects on information satisfaction. Hypotheses H1Cand 2C together stated that when performance divergesfrom expectations created by marketer supplied informa-tion, then satisfaction with that information will be lowerthan when the truth is told (these hypotheses are illus-trated in Panels 1C and 2C of Fig. 1). Table 5 shows theMANOVA results and indicates that there is a maine!ect for performance but not expectations. There is alsoa signi"cant interaction e!ect. Fig. 4 illustrates theunivariate results for each attribute.
In Case 1, downward expectation manipulation ofhigh actual performance was hypothesized to lead tolower information satisfaction (H1C). The results aresupportive in the case of `ease of usea (Bonferroni pair-wise is p"0.004) and for versatility (p"0.005) but notfor picture quality (p"0.19). In Case 2, upward expecta-tion manipulation of low actual performance was alsohypothesized to lead to lower information satisfaction(H2C). This is supported for `ease of usea (p"0.02) andpicture quality (p"0.02), but not for versatility(p"0.17). The pattern of results (four out of six plannedcomparisons) indicates that when subjects received per-formance that did not match their attribute expectations,their satisfaction with the marketer supplied informationwas lower than when performance matched expectations.
Determinants of satisfaction: The simple pairwise cor-relations of attribute satisfaction with each of perceivedperformance, discon"rmation, information satisfactionand measured expectations are shown in Table 6 (whichis divided into the high versus low performance condi-tions). These simple pairwise correlations show that at-
tribute satisfaction is positively related to each of theindependent variables, with the exception of the `ease ofusea correlations with measured expectations (r"0.115,n.s. in the high-performance case and !0.130, n.s. forlow-performance case).
H3A}H3C were then tested per attribute with separateregression models for the high-versus low-performanceconditions (i.e., a total of six models, each of which wassigni"cant at p(0.001). Measured expectations wereincluded in these models so that any expectations e!ectnot accounted for by perceived performance, discon"r-mation and information satisfaction would be estimatedand controlled. The results are shown in Table 7, whichlists the standardized betas and p-values. Standardizedbetas are partial correlation coe$cients controlling for allother model variables (unlike Table 6, which lists simplecorrelations). Model R-squares, which range from 0.367to 0.714, are listed in the table's footnotes.
The results show that for each attribute, whether ma-nipulated performance is high or low, both perceivedperformance and discon"rmation are positively related toattribute satisfaction (p-values range from (0.001 to0.015), supporting H3A and H3B. For information satis-faction in the case of high manipulated performance, theresults are nonsigni"cant for two of three attributes; how-ever, when manipulated performance is low, informationsatisfaction is a signi"cant positive predictor of attributesatisfaction, providing mixed support for H3C. Finally,measured expectations is a signi"cant predictor of two ofthree attribute satisfaction variables when manipulatedperformance is low. This means that the e!ects ofmeasured expectations are not necessarily completelymediated by perceived performance and discon"rmationwhen manipulated performance is low, but rather con-tinue to have a direct e!ect on attribute satisfaction.
R.A. Spreng, C. Dro( ge / Journal of Retailing and Consumer Services 8 (2001) 261}274 271

Table 7The determinants of attribute satisfaction: regression model results
Standardized betas (p-values)$Case 1: Performance is high Case 2: Performance is low
Independent variables!(1) For ease of use
Perceived performance 0.390 ((0.001) 0.352 ((0.001)Discon"rmation 0.295 (0.001) 0.417 ((0.001)Information satisfaction 0.169 (0.049) 0.151 (0.054)Expectations (measured) 0.033 (0.707) !0.015 (0.840)
(2) For versatility"
Perceived performance 0.213 ((0.015) 0.314 ((0.001)Discon"rmation 0.445 ((0.001) 0.490 ((0.001)Information satisfaction 0.078 (0.371) 0.210 ((0.001)Expectations (measured) 0.141 (0.112) 0.130 (0.035)
(3) For picture quality#
Perceived performance 0.309 ((0.001) 0.214 ((0.004)Discon"rmation 0.518 ((0.001) 0.544 ((0.001)Information satisfaction 0.050 ((0.493) 0.230 ((0.001)Expectations (measured) 0.109 (0.143) 0.126 (0.052)
!The dependent variable was `ease of usea attribute satisfaction. Model R! was 0.367 for Case 1 and 0.499 for Case 2."The dependent variable was `versatilitya attribute satisfaction. Model R! was 0.714 for Case 1 and 0.367 for Case 2.#The dependent variable was `picture qualitya attribute satisfaction. Model R! was 0.576 for Case 1 and 0.709 for Case 2.
5. Discussion
5.1. Summary of the results
5.1.1. Should expectations be lowered ?The results provide little support for the recommenda-
tion to intentionally `managea expectations downward(given high performance), with the goal of creating satis-faction through positive discon"rmation. In three tests ofthis hypothesis, one attribute showed no e!ect on at-tribute satisfaction, while two attributes showed a de-crease in satisfaction when expectations were manageddownward. Thus, these results do not support a basictenet of the discon"rmation model, which predicts thatmanaging expectations down (i.e., creating positive dis-con"rmation) should produce higher satisfaction thanmanaging expectations to match performance (i.e., cre-ating con"rmation by telling the truth). In addition, thediscon"rmation model suggests that raising expectationsgiven low performance (i.e., creating negative discon"r-mation) should produce lower satisfaction than con-"rmation and thus should be avoided. This held for onlyone out the three attributes.
Overall, there was little support for the discon"rma-tion model hypotheses negatively relating expectationsand satisfaction, and hence no con"rmation of the valid-ity of managerial advice about lowering expectations butnever raising them. It should be noted that (1) discon"r-mation did positively predict satisfaction for each of theattributes, as the standardized betas con"rming H3Ashow; and (2) the appropriate discon"rmation measures
resulting from the experimental manipulations werefound. Thus the individual theoretical links from ma-nipulated expectations to discon"rmation and from dis-con"rmation to satisfaction were generally supported inways consistent with the literature. It is clear howeverthat these links are not the only ones formed from themanipulation of expectations, nor are they necessarilythe dominant ones.
5.1.2. Should expectations be raised ?The second suggestion in the literature is to raise
expectations, based on the positive e!ect that expecta-tions have on perceptions of performance (Boulding etal., 1993). Results for two of three attributes suggest thatraising expectations when actual performance is low doeshave the e!ect of increasing perceptions of performanceas compared to telling the truth. Furthermore, managingexpectations down from high actual performance result-ed in lower perceptions of performance for two of threeattributes as compared to telling the truth. In each ofthese cases, the perceived performance hypotheses weresupported for the versatility and the picture quality at-tributes, but not for the `ease of usea attribute.
Thus, overall there was some support for managerialadvice about raising expectations and never loweringthem below actual performance. In addition, perceivedperformance positively predicted satisfaction for each ofthe attributes, as the standardized betas con"rming H3Bshow. Thus in the chain of theoretical links from manipu-lated expectations to perceived performance to satisfac-tion, the results supported both links.
272 R.A. Spreng, C. Dro( ge / Journal of Retailing and Consumer Services 8 (2001) 261}274

5.1.3. Should expectations be manipulated at all ?The next set of hypotheses provides some evidence
against prescriptions of managing expectations, either upor down. When attribute expectations were intentionallylowered below actual high performance, satisfaction withthis marketer supplied information was generally lowerthan in the case of accuracy; and, when expectations wereintentionally raised above low performance, satisfactionwith this information was again generally lower. Theseresults held for two of three attributes.
Overall, in most cases managing expectations (eitherup or down) resulted in lower satisfaction with the infor-mation than when the prepurchase information given bythe salesperson accurately re#ects future performance.However, satisfaction with the information positivelypredicted attribute satisfaction when actual performancewas low, while this held for only one of three attributeswhen actual performance was high (as the standardizedbetas for H3C show). Thus in the chain of proposed linksfrom manipulated expectations to information satisfac-tion to attribute satisfaction, the results supported bothlinks when actual performance was low (and expectationswere manipulated up) but only the former link whenactual performance was high (and expectations weremanipulated down). This suggests that pu!ery whenperformance is low actually creates a less satisfying totalconsumption experience than if the prepurchase informa-tion were accurate (all else assumed equal).
5.2. Future research
There are a number of directions for further researchon the e!ects of marketer supplied information. Researchhas shown that there are di!erences between services andproducts and Zeithaml et al. (1985) discuss the specialproblems associated with services such as customer par-ticipation in the service production process and intangi-bility. For example, it may be that due to the intangibilityof services that performance is even more di$cult tojudge, increasing the positive e!ect of expectations onsatisfaction (through perceived performance).
In addition, there are probably variations in the rela-tionships reported here depending upon the product orservices category. For example, a hotel that says thata meal will be delivered in 45min, knowing that they willactually be able to deliver it in 30, may "nd that; (1) theydo not lose many customers since there are few substi-tutes for room service; and (2) given that customers lookat a clock when ordering and receiving their meal, thecustomer will have a very objective way of determiningperformance, and therefore would not be in#uenced bythe expectationsPperceived performance e!ect. In thiscase, intentionally lowering expectations and then per-forming above this might produce pleasant surprise,leading to higher satisfaction (Oliver, 1997). The samestrategy might prove to be disastrous at a restaurant in
which prospective customers go to another restaur-ant rather than waiting for a table. Hence, the compet-itive environment may in#uence which strategy isappropriate.
Our results provided some evidence that the e!ectsvary by attribute. Thus, the type of attribute, such assearch, experience, credence (Darby and Karni, 1973;Nelson, 1970) or vector versus ideal point (Teas, 1993)could be important in specifying the e!ects of managingexpectations. For example, goods dominated by credenceattributes may be particularly susceptible to an expecta-tionsPperceived performance e!ect since it is di$cult toassess the performance even after use.
Finally, the impact of "rm communication on stan-dards other than expectations should be investigated.For example Zeithaml et al. (1993) suggested that higherlevels of explicit service promises can increase the level ofdesired service (rather than expected service). While pastresearch in satisfaction has argued, from a means-endtheory perspective, that desires come from higher levelvalues (e.g., Spreng and Olshavsky, 1993), little researchhas examined the antecedents of desires. An importantissue is whether marketing communications can in#u-ence the consumer's desires.
5.3. Conclusion
The overall results may seem to lead to a rather obvi-ous conclusion: marketing communication, such as froma retail sales person, should provide accurate informationto customers. Yet, due to an over reliance on the discon-"rmation of expectations paradigm, managers have beenrepeatedly told that they can increase satisfaction by`managing expectations down.a Our researchsuggests that managers should convey accurate informa-tion to customers, rather than trying to produce satisfac-tion through the manipulation, either up or down, ofexpectations.
References
Bettman, J.R., 1979. An Information Processing Theory of ConsumerChoice. Addison-Wesley, Reading, MA.
Boulding, W., Kalra, A., Staelin, R., Zeithaml, V.A., 1993. A dynamicprocess model of service quality: from expectations to behavioralintentions. Journal of Marketing Research 30, 7}27.
Churchill, G.A., Surprenant, C., 1982. An investigation into the deter-minants of consumer satisfaction. Journal of Marketing Research 19,491}504.
Darby, M.R., Karni, E., 1973. Free competition and the optimalamount of fraud. Journal of Law and Economics 16, 67}86.
Davidow, W.H., Uttal, B., 1989. Total Customer Service: The UltimateWeapon. Harper and Row, New York.
Gardial, S.F., Clemons, D.S., Woodru!, R.B., Schumann, D.W., Burns,M.J., 1994. Comparing consumers' recall of prepurchase and post-purchase product evaluation experiences. Journal of Consumer Re-search 20, 548}560.
R.A. Spreng, C. Dro( ge / Journal of Retailing and Consumer Services 8 (2001) 261}274 273

Halstead, D., Page Jr., T.J., 1992. The e!ects of satisfaction and com-plaining behavior on consumer repurchase intentions. Journal ofConsumer Satisfaction, Dissatisfaction, and Complaining Behavior5, 1}11.
Hoch, S.J., Ha, Y.W., 1986. Consumer learning: advertising and theambiguity of product experience. Journal of Consumer Research 13,221}233.
Jacoby, J., Speller, D.E., Kohn, C., 1974. Brand choice behavior as a func-tion of information load. Journal of Marketing Research 11, 63}69.
Nelson, P., 1970. Information and consumer behavior. Journal ofPolitical Economy 78, 311}329.
Oliver, R.L., 1980. A cognitive model of the antecedents and conse-quences of satisfaction decisions. Journal of Marketing Research 17,460}469.
Oliver, R.L., 1997. Satisfaction: A Behavioral Perspective on the Con-sumer. McGraw-Hill, Inc., New York.
Olshavsky, R.W., Miller, J.A., 1972. Consumer expectations, productperformance, and perceived product quality. Journal of MarketingResearch 9, 19}21.
Olson, J.C., Dover, P.A., 1979. Discon"rmation of consumer expectationsthrough product trial. Journal of Applied Psychology 64 (2), 179}189.
Peters, T., 1987. Thriving on Chaos. Harper and Row, New York.Sherif, M., Hovland, C.I., 1961. Social Judgment: Assimilation and
Contrast E!ects in Communication and Attitude Change. Yale Uni-versity Press, New Haven, CN.
Spreng, R.A., Dixon, A.L., 1992. Alternative comparison standards inthe formation of consumer satisfaction/dissatisfaction. In: Leone, R.P.,Kumar, V. (Eds.), Enhancing Knowledge Development in Marketing,1992 Educators' Proceedings. AMA, Chicago, IL, pp. 85}91.
Spreng, R.A., MacKenzie, S.B., Olshavsky, R.W., 1996. A reexamina-tion of the determinants of consumer satisfaction. Journal of Market-ing 60, 15}32.
Spreng, R.A., Mackoy, R.D., 1996. An empirical examination ofa model of perceived service quality and satisfaction. Journalof Retailing 72, 201}214.
Spreng, R.A., Olshavsky, R.W., 1993. A desires congruency model ofconsumer satisfaction. Journal of the Academy of Marketing Science21, 169}177.
Teas, R.K., 1993. Expectations, performance evaluation, and con-sumers' perceptions of quality. Journal of Marketing 57, 18}34.
Westbrook, R.A., Newman, J.W., 1978. An analysis of shopper dissatis-faction for major household appliances. Journal of Marketing Re-search 15, 456}466.
Woodru!, R.B., Clemons, D.S., Schumann, D.W., Gardial, S.F., Burns,M.J., 1991. The standards issue in CS/D research: a historical per-spective. Journal of Consumer Satisfaction/Dissatisfaction and Com-plaining Behavior 4, 103}109.
Yi, Y., 1990. A critical review of consumer satisfaction. In: Zeithaml,V.A. (Ed.), Review of Marketing 1990. American Marketing Associ-ation, Chicago, pp. 68}123.
Zeithaml, V.A., Berry, L.L., Parasuraman, A., 1985. Problems andstrategies in services marketing. Journal of Marketing 49, 33}46.
Zeithaml, V.A., Berry, L.L., Parasuraman, A., 1988. Communicationand control processes in the delivery of service quality. Journal ofMarketing 52, 35}48.
Zeithaml, V.A., Berry, L.L., Parasuraman, A., 1993. The nature anddeterminants of customer expectations of service. Journal of theAcademy of Marketing Science 21, 1}12.
274 R.A. Spreng, C. Dro( ge / Journal of Retailing and Consumer Services 8 (2001) 261}274