The Impact of the FAO-EU IPM Programme for Cotton in Asia
139
The Impact of the FAO-EU IPM Programme for Cotton in Asia Edited by: Peter A. C. Ooi, Suwanna Praneetvatakul, Hermann Waibel, Gerd Walter-Echols PUBLICATION SERIES SPECIAL ISSUE NO. 9
-
Upload
independent -
Category
Documents
-
view
0 -
download
0
Transcript of The Impact of the FAO-EU IPM Programme for Cotton in Asia

The Impact of theFAO-EU IPM Programme
for Cotton in Asia
Edited by:Peter A. C. Ooi, Suwanna Praneetvatakul,
Hermann Waibel, Gerd Walter-Echols
PUBLICATION SERIESSPECIAL ISSUE NO. 9
Com
para
tive
Anal
ysis
of th
e Ec
onom
ics
of B
t and
Non
-Bt C
otto
n Pr
oduc
tion
9
ISBN 3-934373-09-7
Verwendete Mac Distiller 5.0.x Joboptions
Dieser Report wurde automatisch mit Hilfe der Adobe Acrobat Distiller Erweiterung "Distiller Secrets v1.0.7" der IMPRESSED GmbH erstellt. Sie koennen diese Startup-Datei für die Distiller Versionen 4.0.5 und 5.0.x kostenlos unter http://www.impressed.de herunterladen. ALLGEMEIN ---------------------------------------- Dateioptionen: Kompatibilität: PDF 1.3 Für schnelle Web-Anzeige optimieren: Nein Piktogramme einbetten: Nein Seiten automatisch drehen: Nein Seiten von: 1 Seiten bis: Alle Seiten Bund: Links Auflösung: [ 1500 1500 ] dpi Papierformat: [ 842 1191 ] Punkt KOMPRIMIERUNG ---------------------------------------- Farbbilder: Downsampling: Nein Komprimieren: Ja Komprimierungsart: ZIP Bitanzahl pro Pixel: Wie Original Bit Graustufenbilder: Downsampling: Nein Komprimieren: Ja Komprimierungsart: ZIP Bitanzahl pro Pixel: Wie Original Bit Schwarzweiß-Bilder: Downsampling: Nein Komprimieren: Nein Graustufen glätten: Nein Text und Vektorgrafiken komprimieren: Nein SCHRIFTEN ---------------------------------------- Alle Schriften einbetten: Ja Untergruppen aller eingebetteten Schriften: Nein Wenn Einbetten fehlschlägt: Ignorieren Einbetten: Immer einbetten: [ /Courier-Bold /Helvetica /Times-Roman ] Nie einbetten: [ ] FARBE(N) ---------------------------------------- Farbmanagement: Farbumrechnungsmethode: Farbe nicht ändern Methode: Standard Geräteabhängige Daten: Einstellungen für Überdrucken beibehalten: Ja Unterfarbreduktion und Schwarzaufbau beibehalten: Ja Transferfunktionen: Anwenden Rastereinstellungen beibehalten: Nein ERWEITERT ---------------------------------------- Optionen: Prolog/Epilog verwenden: Nein PostScript-Datei darf Einstellungen überschreiben: Nein Level 2 copypage-Semantik beibehalten: Ja Portable Job Ticket in PDF-Datei speichern: Nein Illustrator-Überdruckmodus: Ja Farbverläufe zu weichen Nuancen konvertieren: Ja ASCII-Format: Nein Document Structuring Conventions (DSC): DSC-Kommentare verarbeiten: Ja DSC-Warnungen protokollieren: Nein Für EPS-Dateien Seitengröße ändern und Grafiken zentrieren: Ja EPS-Info von DSC beibehalten: Nein OPI-Kommentare beibehalten: Nein Dokumentinfo von DSC beibehalten: Nein ANDERE ---------------------------------------- Distiller-Kern Version: 5000 ZIP-Komprimierung verwenden: Ja Optimierungen deaktivieren: 3 Bildspeicher: 67108864 Byte Farbbilder glätten: Nein Graustufenbilder glätten: Nein Bilder (< 257 Farben) in indizierten Farbraum konvertieren: Ja sRGB ICC-Profil: sRGB IEC61966-2.1 ENDE DES REPORTS ---------------------------------------- IMPRESSED GmbH Bahrenfelder Chaussee 49 22761 Hamburg, Germany Tel. +49 40 897189-0 Fax +49 40 897189-71 Email: [email protected] Web: www.impressed.de
Adobe Acrobat Distiller 5.0.x Joboption Datei
<< /ColorSettingsFile () /LockDistillerParams true /DetectBlends true /DoThumbnails false /AntiAliasMonoImages false /MonoImageDownsampleType /Bicubic /GrayImageDownsampleType /Bicubic /MaxSubsetPct 100 /MonoImageFilter /CCITTFaxEncode /ColorImageDownsampleThreshold 1.1 /GrayImageFilter /FlateEncode /ColorConversionStrategy /LeaveColorUnchanged /CalGrayProfile (Gray Gamma 2.2) /ColorImageResolution 300 /UsePrologue false /MonoImageResolution 1200 /ColorImageDepth -1 /sRGBProfile (sRGB IEC61966-2.1) /PreserveOverprintSettings true /CompatibilityLevel 1.3 /UCRandBGInfo /Preserve /EmitDSCWarnings false /CreateJobTicket false /DownsampleMonoImages false /DownsampleColorImages false /MonoImageDict << /K -1 >> /ColorImageDownsampleType /Bicubic /GrayImageDict << /HSamples [ 2 1 1 2 ] /VSamples [ 2 1 1 2 ] /Blend 1 /QFactor 0.9 >> /CalCMYKProfile (U.S. Web Coated (SWOP) v2) /ParseDSCComments true /PreserveEPSInfo false /MonoImageDepth -1 /AutoFilterGrayImages false /SubsetFonts false /GrayACSImageDict << /HSamples [ 2 1 1 2 ] /VSamples [ 2 1 1 2 ] /Blend 1 /QFactor 0.9 >> /ColorImageFilter /FlateEncode /AutoRotatePages /None /PreserveCopyPage true /EncodeMonoImages false /ASCII85EncodePages false /PreserveOPIComments false /NeverEmbed [ ] /ColorImageDict << /HSamples [ 2 1 1 2 ] /VSamples [ 2 1 1 2 ] /Blend 1 /QFactor 0.9 >> /AntiAliasGrayImages false /GrayImageDepth -1 /CannotEmbedFontPolicy /OK /EndPage -1 /TransferFunctionInfo /Apply /CalRGBProfile (sRGB IEC61966-2.1) /EncodeColorImages true /EncodeGrayImages true /ColorACSImageDict << /HSamples [ 2 1 1 2 ] /VSamples [ 2 1 1 2 ] /Blend 1 /QFactor 0.9 >> /Optimize false /ParseDSCCommentsForDocInfo false /GrayImageDownsampleThreshold 1.1 /MonoImageDownsampleThreshold 1.5 /AutoPositionEPSFiles true /GrayImageResolution 300 /AutoFilterColorImages false /AlwaysEmbed [ /Courier-Bold /Helvetica /Times-Roman ] /ImageMemory 524288 /OPM 1 /DefaultRenderingIntent /Default /EmbedAllFonts true /StartPage 1 /DownsampleGrayImages false /AntiAliasColorImages false /ConvertImagesToIndexed true /PreserveHalftoneInfo false /CompressPages false /Binding /Left >> setdistillerparams << /PageSize [ 595.276 841.890 ] /HWResolution [ 1500 1500 ] >> setpagedevice

The Impact of the FAO-EU IPM Programme
for Cotton in Asia
Edited by:
Peter A. C. Ooi, Suwanna Praneetvatakul,
Hermann Waibel, Gerd Walter-Echols
A Publication of the Pesticide Policy Project
Hannover, July 2005
Special Issue Publication Series, No. 9

Pesticide Policy Project Publication Series
Special Issue No. 9, July 2005
Development and Agricultural Economics
School of Economics and Management
University of Hannover, Germany In cooperation with
Food and Agricultural Organization of the United Nations (FAO), Rome, Italy
The Impact of the FAO-EU IPM Programme for Cotton in Asia
Editor of the Pesticide Policy Project Publication Series:
Prof. Dr. H. Waibel Development and Agricultural Economics School of Economics and Management University of Hannover Königsworther Platz 1 30167 Hannover Germany
Tel.: +49 - (0)511 - 762 - 2666 Fax: +49 - (0)511 - 762 - 2667 E-Mail: [email protected]
All rights reserved by the authors.
Publication of the Chair of Development and Agricultural Economics, Königsworther Platz 1, 30167 Hannover, Germany
Printing: Uni Druck Hannover, 30419 Hannover, Germany
ISBN: 3-934373-09-7

Acknowledgements
This book would not have been possible without the generous support of a number of people and organisations. First of all, we would like to thank the European Commission for generously funding this regional development programme, and the National Programmes in the six member countries for complementing this assistance with their own support and commitments. We also wish to thank the Programme Management Unit in Bangkok for their assistance in organizing a technical workshop shortly before the closure of the Programme. This workshop helped to bring together the study material generated by the impact assessment teams in the different countries. With the supplementary financial assistance of the FAO Regional Office for Asia and the Pacific, a Regional Policy Seminar on IPM-FFS Impact was organised following the workshop where some of the Programme results were presented to high-level country policy makers. Furthermore, we would like to thank the impact assessment teams in the member countries who have accepted the challenge of conducting impact studies as an integral part of Programme implementation and therefore contributed much towards the development of an impact assessment culture among the National Programmes. We are also grateful to Dr. Peter Kenmore, Head of the Global IPM Facility, for his continuous support and encouragement throughout the Programme.
The final editorial team at the University of Hannover deserves praise for a careful job, which included some last-minute changes. Thanks go particularly to Dr. Diemuth Pemsl, Rudi Witt and Florian Heinrichs.
Last, but not least, we thank the farmers in the Programme countries who willingly participated in the surveys and shared their views, ideas and results with the enumerators, thereby contributing to good impact assessment results.
Peter A. C. Ooi Suwanna Praneetvatakul Hermann Waibel Gerd Walter-Echols


Table of Contents
List of Tables ...................................................................................................viii List of Figures ................................................................................................... ix List of Abbreviations...........................................................................................x Preface ............................................................................................................. xi
1 Concept of Impact Assessment in the FAO-EU IPM Programme for Cotton in Asia (G. Walter-Echols, P.A.C. Ooi) ............................... 1 1.1 Introduction ............................................................................................. 1 1.2 Methodology ........................................................................................... 4 1.3 Results.................................................................................................. 10 1.4 Conclusions and Recommendations..................................................... 15
2 The Costs and Benefits of the FAO-EU IPM Programme for Cotton in Asia (S. Praneetvatakul, G. Walter-Echols, H. Waibel) 19 2.1 Introduction ........................................................................................... 19 2.2 Methodology ......................................................................................... 20 2.3 Results.................................................................................................. 21
2.3.1 Program Costs ........................................................................... 22 2.3.2 Program Benefits ....................................................................... 23 2.3.3 Net Present Value, Benefit Cost Ratio and Financial Rate of
Return of the Programme........................................................... 28 2.3.4 Sensitivity Analysis..................................................................... 29
2.4 Summary and Discussion ..................................................................... 30
3 The Impact of FFS on Yield, Pesticide Cost and Gross Margin in Shandong Province, P.R. China: an Econometric Approach (L. Wu, S. Praneetvatakul, H. Waibel, L. Wang).................................. 33 3.1 Background........................................................................................... 33 3.2 Objective............................................................................................... 35 3.3 Theoretical Framework ......................................................................... 35 3.4 Data Collection...................................................................................... 37 3.5 Results.................................................................................................. 39 3.6 Conclusion and Recommendations ...................................................... 43

vi
4 Impact of an FFS-based IPM Approach on Farmer Capacity, Production Practices and Income: Evidence from Pakistan (M.A. Khan, I. Ahmad, G. Walter-Echols) ............................................ 45 4.1 Background........................................................................................... 45 4.2 Methodology ......................................................................................... 47 4.3 Results.................................................................................................. 50 4.4 Conclusions and Recommendations..................................................... 58
5 Impact of Farmer Field School Approach on Acquisition of Knowledge and Skills by Farmers about Cotton Pests and Other Crop Management Practices – Evidence from India (S.V. Reddy, M. Suryamani) ................................................................ 61 5.1 Introduction ........................................................................................... 61 5.2 Methodology ......................................................................................... 62 5.3 Results and Discussion......................................................................... 64
5.3.1 Changes in Knowledge .............................................................. 64 5.3.2 Changes in Skills........................................................................ 69 5.3.3 Content Analysis ........................................................................ 70
5.4 Conclusion ............................................................................................ 72
6 Incidence of Acute Pesticide Poisoning Among Women and Men Cotton Growers in India (F. Mancini, A.H.C. van Bruggen, J.L.S Jiggins, A.C. Ambatipudi, H. Murphy)....... 74 6.1 Introduction ........................................................................................... 74 6.2 Methodology ......................................................................................... 76 6.3 Results.................................................................................................. 80
6.3.1 Respondents’ Profile .................................................................. 80 6.3.2 Spraying Operations .................................................................. 80 6.3.3 Reported Symptoms and Signs.................................................. 82 6.3.4 Severity Score Versus Exposure Variables (Exposure Time,
Pesticide Toxicity, Spray Volume, Operation) ............................ 83 6.3.5 Medical Assistance .................................................................... 84
6.4 Discussion ............................................................................................ 85
7 Impact of FFS Training of the FAO-EU IPM Programme for Cotton in Asia on the Environment (G. Walter-Echols, M.H. Soomro) ........................................................ 89 7.1 Introduction ........................................................................................... 89 7.2 Methodology ......................................................................................... 90 7.3 Results.................................................................................................. 92 7.4 Conclusions and Recommendations..................................................... 98

vii
8 IPM-FFS Training Is Crucial for Sustaining Bt Cotton – A Case Study from Hubei Province, P.R. China (P. Yang, L. Wu, L. Wang, J. Xia, X. Li)............................................. 103 8.1 Methodology ....................................................................................... 103 8.2 Results................................................................................................ 105 8.3 Conclusions ........................................................................................ 108
9 Impact of FFS-based IPM Knowledge and Practices on Rural Poverty Reduction: Evidence from Pakistan (M.A. Khan, I. Ahmad) ....................................................................... 110 9.1 Background......................................................................................... 110 9.2 Methodology ....................................................................................... 111 9.3 Results................................................................................................ 118 9.4 Conclusions and Recommendations................................................... 121

viii
List of Tables Table 1-1: Pre- and Post-FFS Sample Sizes.........................................................................8 Table 1-2: FFS Graduate Characteristics in Comparison to NFFS and Control Farmers.....9 Table 1-3: Common Impact Targets ....................................................................................10 Table 2-1: Project Costs of the FAO-EU IPM Programme for Cotton in Asia ......................22 Table 2-2: Opportunity Costs for Farmers Participating in the
FAO-EU IPM Programme for Cotton in Asia ......................................................23 Table 2-3: Average Increase in Gross Margin of Farmers Participating in the
FAO- EU IPM Programme for Cotton in Asia .....................................................25 Table 2-4: Average Reduction in Pesticide Costs of Farmers Participating in the
FAO-EU IPM Programme for Cotton in Asia ......................................................26 Table 2-5: Total Annual Benefits and Composition of Benefits............................................27 Table 2-6: Benefits of the FAO-EU IPM Programme for Cotton in Asia (in US $) ...............27 Table 2-7: Benefits and Costs of the FAO-EU IPM Programme for Cotton in Asia .............29 Table 2-8: Scenario Analysis of the Rates of Return for the FAO-EU IPM Programme
for Cotton in Asia ................................................................................................30 Table 3-1: Descriptive Statistics by Farmer Category in 2000 (before training) ..................40 Table 3-2: Impact of FFS on Cotton Yield, Pesticide Cost and Gross Margin .....................41 Table 3-3: Results from Re-estimation ................................................................................42 Table 4-1: Change in the Human Capacities for Practice Changes ....................................51 Table 4-2: Difference of Difference Estimates of the Qualitative Attribute of Farmers’
Education that Contributes towards Changes in Production .............................51 Table 4-3: Input Use and Field Management Practices Before and After FFS training .......53 Table 4-4: Paired Difference in Production Practices by Farmer Group..............................53 Table 4-5: Pesticide Use at Different Crop Growth Stages..................................................55 Table 4-6: Paired Difference Comparisons for Pesticide Usage..........................................55 Table 4-7: Cotton Yields, Revenue, Gross Margin and Cost Comparisons.........................57 Table 4-8: Differences of Difference Estimates for Crop Production and Income ...............57 Table 5-1: Change in Knowledge of Respondents Towards Different Aspects of
Cotton IPM and Production Practices Through FFS..........................................66 Table 5-2: Changes in Overall Knowledge of Respondents About Cotton Pests and
other Crop Management Practices .....................................................................67 Table 5-3: Distribution of Respondents According to their Confidence Levels on Pests
and Other Crop Management Skills....................................................................69 Table 5-4: Extent of Confidence Expressed by the Respondents in Performing,
Selected Skills on Pests and Other Crop Management Practices – Content Analysis..............................................................................................71
Table 6-1: Distribution of Respondents among the Villages ................................................80 Table 6-2: List of Pesticides Used by the Reporting Farmers..............................................81 Table 6-3: Correlation Between Severity Score and ExposureVariables.............................83 Table 6-4: Distribution of the Severity Score among Operations in Percentage and
Total Number of Working Sessions ....................................................................84 Table 7-1: Estimated Total Pesticide Reduction as a Result of
Cotton IPM-FFS Education (without Philippines)................................................94 Table 7-2: Comparison of EI Values and Field EIQ from Pakistan and India……………….96

ix
Table 7-3: EI and Field EIQ Values with and without Soap Treatments. .............................96 Table 7-4: Species Diversity in IPM and Conventional Cotton Fields..................................98 Table 8-1: Adoption of Bt Cotton in the Sample by Category ............................................106 Table 8-2: Impacts of IPM-FFS and Bt Cotton on Gross Margins by Farmer Category ...107 Table 9-1: Poverty Line for Different Years........................................................................115 Table 9-2: Cotton Share in Total Household Income.........................................................118 Table 9-3: Change in the Household Gross and Net Incomes ..........................................119 Table 9-4: Operational Land Holdings, Area Allocation to Cotton and
Cropping Intensities.........................................................................................119 Table 9-5: Change in Land Holdings, Cotton Area and Cropping Intensity .......................120 Table 9-6: Poverty during Pre- and Post FFS Scenario.....................................................121
List of Figures Figure 1-1: Learning/Management Cycles ..........................................................................2 Figure 1-2: Cotton IPM Strategy .........................................................................................4 Figure 1-3: Time Allocation in Cotton IPM Farmer Field Schools .....................................13 Figure 1-4: Impact of IPM-FFS on Farmer Income ...........................................................14 Figure 5-1: Graphic Representation of Changes (Gain) in Overall Knowledge.................65 Figure 6-1 Reporting Format in Telegu Local Language .................................................78 Figure 6-2: Distribution of Severity Score by Landholding Size .......................................82 Figure 7-1: Impact of IPM-FFS on Pesticide Reduction....................................................93 Figure 7-2: Impact of Cotton IPM-FFS on Beneficial Populations.....................................97 Figure 7-3: FFS Impact on Predator-Pest Ratio................................................................98

x
List of Abbreviations AESA Agro-Ecosystem Analysis
DD Double Delta
EIQ Environmental Impact Quotient
EU European Union
FAO Food and Agricultural Organization
FFS Farmer Field School
GM Gross Margin
ha Hectar
hrs Hours
IPM Integrated Pest Management
IRR Internal Rate of Return
kg Kilogramme
ml Milliliter
NATESC National Agro-Technical Extension and Service Center
NFFS Non-FFS farmer
NGO Non-Governmental Organization
No. Number
NPV Net Present Value
OECD Organization for Economic Cooperation and Development
RMB Renminbi Yuan, Chinese Currency, 1US$ = 8.26 RMB
SPI Sensitive Price Index
ToF Training of Facilitators
USDA United States Department of Agriculture

Preface The FAO-EU Integrated Pest Management Programme for Cotton in Asia
has addressed the challenges of sustainable agricultural development of
cotton farmers in Asia. Through education, following the Farmer Field
School (FFS) concept, the Programme sought to empower poor farmers to
make better production management decisions and thus take greater
control of their lives. An integral part of the Programme design was to foster
a culture of impact assessment from the very beginning. Impact
assessment was not only used as an instrument to measure the
Programme’s benefit, but also as a tool for strategic planning and
organisational development.
In preparation for the seven impact assessment studies conducted by
independent investigators, each country’s project stakeholders engaged in
an intensive dialogue to define the impact targets and to formulate
objectively verifiable indicators for successful implementation. This process
was extended to FFS implementation by engaging farmers in monitoring
and evaluation of changes in the fields and their communities. Thus,
systematic progress and quality monitoring supplemented formal impact
studies in assessing the direction and success of the Programme. Through
this, impact assessment created a culture of accountability and learning that
penetrated all levels of Programme implementation.
It is acknowledged that the true impact of a development programme
cannot always be expressed in quantitative terms. Some effects such as
changes in yield increase, pesticide use and profits are measurable while
changes in attitudes, farmer critical thinking and confidence are more
difficult to capture especially on the short run.
The papers in this book represent some key impacts that have been
observed during programme implementation. They deal with a wide range
of impacts on income, poverty, human capacity, health and environment.

xii
The results show that well-targeted investment in Farmer Field Schools can
be effective in changing farmer behaviour and can result in a high rate of
return.
It is hoped that the results and the lessons learned from these studies
contribute appreciably to the ongoing discussion about the impact of public
investment in IPM in developing countries. It is also hoped that this book
may lead to further improvements in programme effectiveness and
refinements of the Farmer Field School concept in IPM and beyond. Finally,
we hope that this collection of case studies will contribute to the discussion
on conducting practical impact assessment of rural development
programmes.
Peter A. C. Ooi
Suwanna Praneetvatakul
Hermann Waibel
Gerd Walter-Echols

1 Concept of Impact Assessment in the FAO-EU IPM Programme for Cotton in Asia
Gerd Walter-Echols1 and Peter A.C. Ooi2
1.1 Introduction From 2000 to 2004, the FAO-EU Integrated Pest Management (IPM)
Programme for Cotton in Asia and associated country institutions qualified
1,540 extension workers and 945 farmers as farmer field school (FFS)
facilitators, who in turn conducted a total of 3,660 FFS for 93,700 farmers in
Bangladesh, China, India, Pakistan, Philippines and Vietnam. To determine
the impact of these farmer education activities, the project conducted seven
impact assessment studies in five countries, i.e. Bangladesh, China (three
studies), India, Pakistan and Vietnam. The objective of these studies was to
collect scientific evidence on IPM-FFS impacts. A recent review of 25 IPM
farmer field schools impact evaluations concluded that these studies varied
greatly in focus, approach, methodology and robustness and did not always
include proper control samples or baseline data as a reference (van den
Berg, 2004). While many studies reported significant impacts on farmer
income, pesticide reduction, human and social gains (Pincus, 2000; Pontius
et al., 2002; van de Fliert, 1993), an analysis by Feder et al. (2003)
concluded that the IPM-FFS programme on rice in Indonesia showed no
long-term evidence of yield increases or pesticide reduction; however, the
control villages in that study were not rigorously separated from the FFS
treatment areas and this could have affected the results. Therefore, more
studies and improvements in methodology are needed to determine the
impact of IPM-FFS activities that are founded in farmer education rather
than technology transfer.
1 formerly Environmental Impact Expert, FAO-EU IPM Programme for Cotton in Asia,
FAO Regional Office for Asia and the Pacific, Bangkok, Thailand 2 formerly Chief Technical Advisor, FAO-EU IPM Programme for Cotton in Asia,
FAO Regional Office for Asia and the Pacific, Bangkok, Thailand

2 Chapter 1: Concept of Impact Assessment
In its broadest sense, impact assessment measures the economic, social
and environmental effects of a project. Instead of conducting impact studies
as a requirement sometimes demanded by donors, the Cotton IPM
Programme aimed to use impact assessment as a tool for organizational
development and strengthening management skills and critical thinking in
all aspects of project implementation, thus creating a “culture of impact
assessment”. This required that the same management principles which
were taught to farmers in farmer field schools also needed to be practiced
by project staff, i.e. regular observations and measurement of key
performance factors, their analysis in a systematic manner and the
subsequent use of the results for decision making and planning
(Figure 1-1). In this way, IPM-FFS would not only improve the management
skills of farmers, but also those of extension agents, researchers and
project administrators.
Observation
Analysis
Action
Farmers
Institutions
Policy
Farmer’s Field Studies
Planning
Farmer Group Reflections:Gross Margins
Field Study Results AESA
FFS ExercisesField Observations
Field Studies
Pre/PostSurvey;Training
Quality Monitoring;
Special Studies
Changes inEconomy
EnvironmentHealthSocial
Project Advisory CommitteePolicy Assessment
Workshops
ProjectPlanning
Workshop
Joint Reflection WorkshopsStaff and Client
Satisfaction
Laws &Regulations
Funding
Project Strategy
Work PlansCurriculum
FFSReportsProgress
Reports
Figure 1-1: Learning/Management Cycles

Chapter 1: Concept of Impact Assessment 3
During FFS, farmers learn to make exact field observations, discover the
biology of pests and natural enemies in insect-zoo exercises and verify new
technologies and crop management practices in field experiments. With the
help of cotton ecosystem analyses, field observations are systematically
analysed and results are discussed with fellow farmers. Finally, farmers
arrive collectively at decisions regarding crop management practices or
needs for further field studies. By following this basic learning cycle farmers
succeed to improve their production and pest management skills.
The same learning/management cycle can also be applied at the
institutional level. Exact observation data would come from farm-household
surveys, monitoring of training quality and learning achievements, and
special studies, e.g. on health or biodiversity. The findings from these
studies are then analysed and jointly assessed by project staff and farmer
clients. As a result, training curricula and work plans would be improved
depending on the progress made toward specific impact targets.
On the level of national IPM policy, the observed economic, environmental,
health and social changes need to be summarized and reviewed at project
advisory committee meetings and forwarded as policy briefs to the attention
of political decision makers. Based on the analysis and assessment of
results, particularly whether and how much the project contributes to the
national development objectives, the project strategy may be revised, the
national IPM policy amended or new rules and regulations proposed.
This paper describes how this holistic impact assessment concept was
developed and implemented in the Cotton IPM Programme. The project
implementation agreement and other project documents provided only a
rough framework for impact assessment since the formulated goals and
objectives were quite general and mostly referred to outputs rather than
outcomes. In addition, the narrow focus of the project design on a single
commodity and in several countries having cotton production companies as
implementing institutions posed obstacles to a more holistic farmer

4 Chapter 1: Concept of Impact Assessment
education approach. Therefore impact assessment provided a means to
make the project design more development focused and responsive to
farmer needs.
1.2 Methodology Impact assessment activities started in 2001 with a regional workshop that
involved the country project teams and independent study investigators. At
this meeting, the design of the proposed impact studies was discussed and
it was decided to collect pre- and post-FFS data from FFS graduates,
exposed farmers in the same village and a separate control group. This
design allows assessing both the differences between before and after
training and with and without FFS (double difference or double delta model,
Feder et al., 2003).
IncreasedAdvocacy
Member-ships
OrganisationalTraining
Trust & Cooperation
Goals
Effects
Results
Outputs
Activities
Inputs
Economic Growth
Environmental Conservation
Improved Health
Social Capital
Human Capital
SocialParticipation
Quality Farmer Education
Gross Margin Increase
Increased Knowledge
Technical Training
Change in Practices
HumanPotential
Gender Sensitivity
Gender Training
Gender Equality
TechnologyAdaptation
Management Skills
SkillsTraining
Increased Efficiency
FewerSick-Days
SafetyConcern
HealthTraining
PesticideReduction
BiodiversityIncrease
ConservationAttitude
Environmental Training
PesticideReduction
Cotton IPM Strategy
Figure 1-2: Cotton IPM Strategy
For a follow-up workshop, each country programme was asked to present
its long-term implementation strategy. The meeting showed that member

Chapter 1: Concept of Impact Assessment 5
countries had clear ideas on how to schedule Training of Facilitators (ToF)
and farmer field school activities; however, the project’s role in relation to
the country’s long-term development goals or cotton sector targets
appeared to be less clearly understood. Therefore a planning matrix of
impact chains was developed to link FFS curriculum components with
specific livelihood results, effects and goals (Figure 1-2). Each country team
then listed their ultimate goals and impact targets, and the activities
specifying the paths toward each goal achievement. The workshop
concluded that there was a need to further develop each country’s longer-
term cotton IPM strategy by clearly defining impact targets, expansion plans
and timeframe for the national IPM programmes. It was also realized, that
minimum quality standards for both ToF and FFS needed to be established
and incorporated in the project activities as routine self-assessment
measures.
In preparation for the baseline farm-household surveys, each country team
conducted a series of meetings and workshops with the impact study
investigators to define the desired impact targets and to formulate
objectively verifiable indicators for their successful achievement. At a
regional meeting, these individual country targets were compared and a
consensus was reached toward a list of common targets that should be
included in all country studies. This process narrowed down the scope of
information to be collected to the specific areas where project activities
were most likely to produce changes. It was realized, that not every impact
area could be covered by farm-household surveys and that additional
methods needed to be employed, particularly for environmental and health
effects. General socio-economic data was limited to key parameters that
showed whether samples were representative of the targeted small-scale
cotton producer population. The clearly defined goals and corresponding
indicators for goal achievement helped in streamlining the impact
assessment surveys by focusing on the changes that were directly targeted
by project activities, rather than looking for unintended or accidental results.

6 Chapter 1: Concept of Impact Assessment
To further harmonize the different country studies, additional regional
workshops were conducted. One workshop focused on the analysis of
baseline data and established the criteria for the final impact assessment
reporting. During a final workshop, the different country results were
compared and summarized, and presented to the management of the
implementing country institutions and political decision makers.
All impact studies followed the same basic design that was decided during
the first regional workshop. It compared farmer practices in the year before
farmer field school training with those in the year after. As soon as FFS
groups were formed in the selected study sites, a sample of participating
farmers was interviewed about their previous season’s cotton cultivation
practices and other related background information. The survey was
repeated in the year after the FFS when the participants were by
themselves again and were no longer guided by an FFS facilitator. The
post-training data collection was conducted in intervals over the entire crop
cultivation season in order to minimize errors from recalling information. In
China and India the studies covered the years 2000 and 2002, while in
other countries the years 2001 and 2003.
The studies were conducted by local investigators from universities
(Bangladesh, Vietnam), an NGO (India) or the Social Sciences Institute of
the National Agricultural Research Centre (Pakistan); only in China did the
implementing institution also conduct the impact assessment (National
Agro-technical Extension and Service Center, NATESC).
The FFS baseline farmer sample comprised of 60-120 farmers from mostly
3-4 randomly selected FFS out of a total of 27-85 FFS that were conducted
in the countries during the respective years (overall total of 340 FFS). All
FFS were "normal" FFS conducted by previously graduated facilitators and
not associated with any ToF course. The sampling areas were those
locations where most of the FFS were implemented. From the same
communities as the FFS farmers, a sample of a minimum of 60 farmers was
Chapter 1: Concept of Impact Assessment 7
interviewed in an identical manner to assess the degree of diffusion of
knowledge and practices to neighbours of the FFS graduates. This sample
was labelled "non-FFS" (NFFS) or "exposed" farmers. In addition, another
60 farmers were selected from 3-4 communities in a cotton growing area
where no FFS were held nor were scheduled for the coming years. The
control area was generally at a distance of 30-60 km from the nearest FFS
and care was taken that the two sets of communities did not share a
common market place where information could be exchanged.
For the post-FFS impact sample, only those farmers that grew cotton in
both the pre- and post-FFS year were included. Otherwise, all FFS
participants, regardless whether they fully graduated or only partially
attended, were included. Because not all farmers grew cotton in both years
or were available for a second interview, the post FFS sample size shrank
from 1,511 to 1,060 (Table 1). For impact analysis, differences between the
years were determined for each farmer individually. To account for changes
in environmental conditions between the study sites and years, the results
for FFS and NFFS farmers were adjusted by the changes observed in the
control group over the same period of time. This difference in difference
procedure eliminated the influence of other confounding factors that could
have biased the observed differences. Results were summarised as overall
means and standard deviations for the three sample groups and the
differences between the FFS and NFFS farmers to the respective control
sample. The statistical significance of differences was determined through
analysis of variance, Chi-square and Student t tests.
Table 1-1 reveals great variation in the differences between the pre- and
post-FFS sample sizes. While a loss up to 15% of the respondents can be
explained in terms of normal sampling variation due to inability to find the
same farmer again or other difficulties, bigger reductions need explanations
and analysis. In Vietnam, Bangladesh and India only 61%, 45% and 33% of
the baseline farmers made up the post-FFS sample. In India, this was due

8 Chapter 1: Concept of Impact Assessment
to the late onset of monsoon rains in 2002, which prompted many baseline
respondents not to grow cotton that year. In Vietnam, farmers chose not to
grow cotton because of lower than world market prices for their harvest. In
Bangladesh, the reduction was due to sampling problems.
Table 1-1: Pre- and Post-FFS Sample Sizes
Pre-FFS Post-FFS % Study Sites FFS NFFS Control Total FFS NFFS Control Total remainingBangladesh 100 60 60 220 52 31 15 98 45% China-Anhui 60 60 60 180 60 60 60 180 100% China-Hubei 60 60 60 180 60 60 60 180 100% China-Shandong 60 60 60 180 56 52 60 168 93% India-Karnataka 97 97 97 291 37 30 30 97 33% Pakistan-Sindh 90 70 60 220 78 59 53 190 86% Vietnam 120 60 60 240 63 42 42 147 61% Total 587 467 617 1,511 406 334 320 1,060 70%
The increased awareness about impact targets also encouraged a
continuous review of ToF and FFS curricula with respect to their suitability
to achieve the desired outcomes. Two regional curriculum review
workshops and regular annual curriculum planning meetings aimed to align
the training activities more and more with the project’s impact targets.
Country programmes quickly realized a need for more information about the
type of farmers attending FFS, the process of group formation, the quality of
FFS facilitation, achievement of learning objectives and proficiency of
acquired skills. Consequently, impact assessment lead to an improved
monitoring and reporting of FFS activities and encouraged FFS facilitators
to experiment with ways to improve project performance and to feel
responsible for the quality of farmer education activities. Profile of FFS Participants and Beneficiaries The question has been posed whether FFS participants are better educated
and have more resources than their fellow farmers and therefore achieve
better results which cannot be extrapolated to the farming population in
general. Most country studies did not compare the sample socio-economic

Chapter 1: Concept of Impact Assessment 9
characteristics with those of the general cotton farmer population because
specific profiles of cotton farmers were not available. However, the survey
sample allows for a comparison between FFS and non-FFS farmers from
the same village, and a comparison between FFS and control villages. In
addition, profiles of regular FFS participants were available and could be
compared with the impact study sample.
Except for gender, the FFS sample matched the profile of 2003 FFS
graduates in terms of age, education and farm size (Table 1-2). A
comparison of the FFS and NFFS sample from the same villages showed
that FFS farmers were an average of 3 years younger than their
neighbours, were slightly more educated, had 0.4 ha larger farms and 13%
more household income; due to the great variability between farmers these
differences were noticeable but not statistically significant. A comparison of
the FFS and control villages showed that control villages had slightly lower
cotton yields and used less pesticide than FFS villages, but were
comparable in terms of age, education, farm size and household income.
These comparisons show that trained and untrained farmers were similar in
their socio-economic characteristics and production parameters. Hence the
possibility of a selection bias is small.
Table 1-2: FFS Graduate Characteristics in Comparison to NFFS and Control Farmers3
Category 2003 Averagea FFS NFFS FFS
Villageb Control Village
Age [years] 35.8 36.3 39.3 37.8 38.3 Gender [% female] 22.7 8.9 5.4 7.2 1.7 Education [years] 6.5 6.8 5.6 6.2 5.6 Farm Size [hectare] 2.1 2.0 1.6 1.8 2.0 Household Income [US$] 1,613 1,431 1,522 1,532 Cotton Yield [kg/ha] 2,580 2,531 2,555 2,467 Insecticide Use [kg/ha] 14.7 14.3 14.5 11.2 a Bangladesh, China and India (average of 12,000 FFS participants) b Average of FFS and NFFS values
3 Bangladesh, China (Anhui, Hubei, Shandong), India and Pakistan

10 Chapter 1: Concept of Impact Assessment
1.3 Results Impact Targets
The common impact targets that were agreed-upon after the lengthy
process of country and regional harmonisation meetings are listed in
Table 1-3. Together with additional country-specific targets they formed the
basis for designing the farm-household survey questionnaires. Quantifiable
indicators for each target achievement provided further information on the
dimensions and level of accuracy required from the studies.
This list revealed that not all targeted impacts could be or needed to be
assessed through a farm-household questionnaire survey. For example, to
determine the impact on environmental conservation required special
studies in post-FFS farmer fields or an analysis of FFS records. On the
other hand, impacts on farmer's social capacities or policy impacts could be
determined by routine monitoring and reporting. Consequently, further
studies and a monitoring and reporting system were designed to
supplement the impact assessment studies.
Table 1-1: Common Impact Targets
Area Common Impact Targets Poverty Alleviation and/or Economic Well-Being
Increase in cotton gross margins Reduction in expenditures for agricultural inputs Increase in expenditures for productive assets, such as children’s education, etc. Profile of FFS beneficiaries matches the normal socio-economic distribution among cotton farmers
Pesticide Reduction Reduction in amount of formulated product and number of applications Reduction in the use of certain toxic pesticides, OP and pyrethroids (IPPM 2015 list)
Environmental Conservation
Increase in number of species and population levels of natural enemies Increase in number of species and population levels collected in soil samples
Improved Health Reduction in number of pesticide-related lost work-days (hours) of the farmer the farmer family Reduction in pesticide-related health expenditures, treatment, etc.
Chapter 1: Concept of Impact Assessment 11
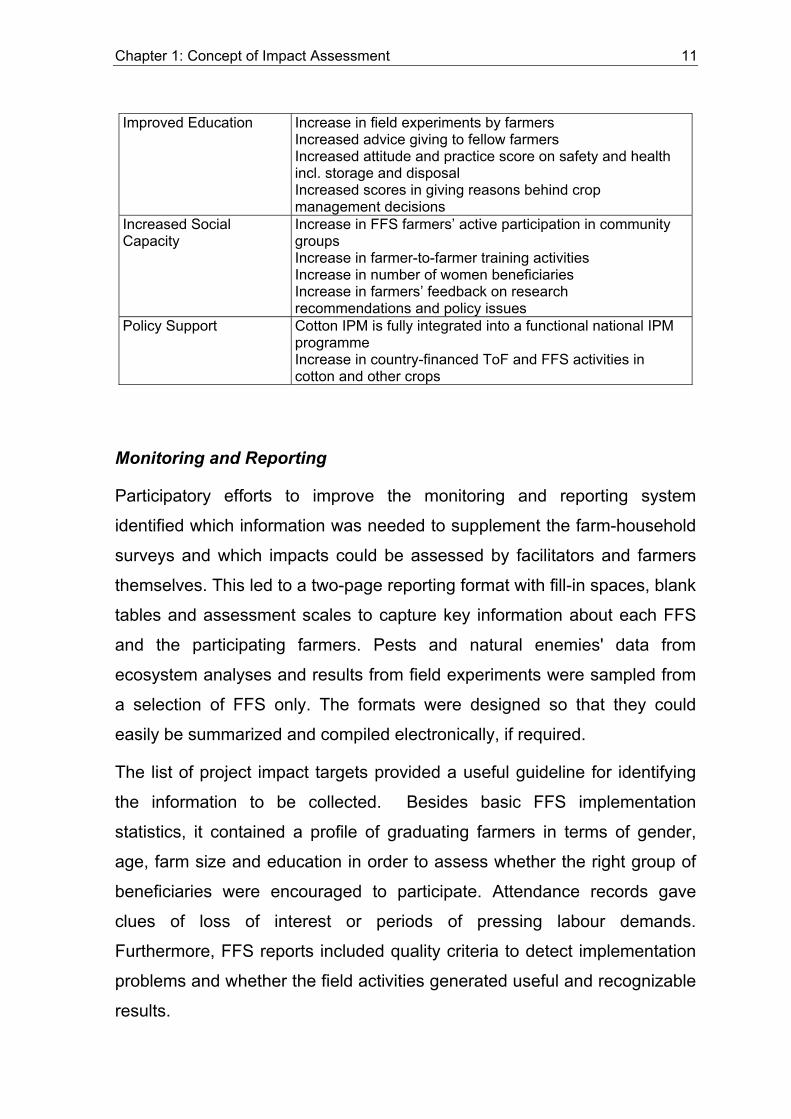
Improved Education Increase in field experiments by farmers
Increased advice giving to fellow farmers Increased attitude and practice score on safety and health incl. storage and disposal Increased scores in giving reasons behind crop management decisions
Increased Social Capacity
Increase in FFS farmers’ active participation in community groups Increase in farmer-to-farmer training activities Increase in number of women beneficiaries Increase in farmers’ feedback on research recommendations and policy issues
Policy Support Cotton IPM is fully integrated into a functional national IPM programme Increase in country-financed ToF and FFS activities in cotton and other crops
Monitoring and Reporting
Participatory efforts to improve the monitoring and reporting system
identified which information was needed to supplement the farm-household
surveys and which impacts could be assessed by facilitators and farmers
themselves. This led to a two-page reporting format with fill-in spaces, blank
tables and assessment scales to capture key information about each FFS
and the participating farmers. Pests and natural enemies' data from
ecosystem analyses and results from field experiments were sampled from
a selection of FFS only. The formats were designed so that they could
easily be summarized and compiled electronically, if required.
The list of project impact targets provided a useful guideline for identifying
the information to be collected. Besides basic FFS implementation
statistics, it contained a profile of graduating farmers in terms of gender,
age, farm size and education in order to assess whether the right group of
beneficiaries were encouraged to participate. Attendance records gave
clues of loss of interest or periods of pressing labour demands.
Furthermore, FFS reports included quality criteria to detect implementation
problems and whether the field activities generated useful and recognizable
results.

12 Chapter 1: Concept of Impact Assessment
Thus the monitoring and reporting system provided FFS facilitators and
coaches with a format to self-reflect whether the programme was reaching
the right farmers in terms of poverty orientation and disadvantaged groups,
whether the self-declared FFS objectives have been achieved, and whether
implementation was cost-effective and efficient. Field staff was encouraged
to organize themselves in district-level 'quality circles' that became
collectively responsible for the quality of farmer education, FFS
implementation and follow-up in their area.
Curriculum Review
The impact targets also provided guidelines for evaluating the curricula by
directly linking FFS activates with specific impact targets. An analysis of
cotton FFS in seven project regions showed that the average length of a
season-long FFS was 75 hours (range: 51-91; Figure 1-3). About half the
time was devoted to enhance farmers' ecological understanding through
cotton ecosystem analysis (CESA), field trials and insect zoos. Special
topics made up 14% of the time, while about 25% went into the end-of-
session reviews, FFS organizational matters, ballet-box tests and the final
field day and graduation ceremony.
A comparison of impact targets with the FFS curriculum revealed that a
number of subjects may not have been given enough emphasis to achieve
the desired effects. For example, little time was spent to organise farmers
into sustainable alumni groups that would conduct field experiments for a
deeper understanding of ecological relationships, to optimise management
practices or to evaluate new technologies such as improved seeds.

Chapter 1: Concept of Impact Assessment 13
CESA, 22.9
Field Trials/ Cultivation, 8.7
Insect Zoo, 6.1
Special Topics, 10.8 Group Dynamics, 6.2
Review, 5.6
Other, 8.1
FFS Organisation, 5.2
Time Allocation in Cotton IPM Farmer Field Schools(Overall average in hours per season)
Figure 1-3: Time Allocation in Cotton IPM Farmer Field Schools
Policy Support
The Cotton IPM Programme planned to use the impact assessment results
for entering into a dialogue with political decision makers about government
support to IPM-FFS activities. Unfortunately, the project ended just as the
impact assessment results became available. However, preliminary findings
from the studies were presented to a panel of decision makers from
member countries on 4 June 2004 to demonstrate the potential of the IPM-
FFS approach for contributing to several of the internationally recognized
Millennium Development Goals (UN, 2000), international treaties and
conventions. The average combined results from the seven impact
assessment studies showed:
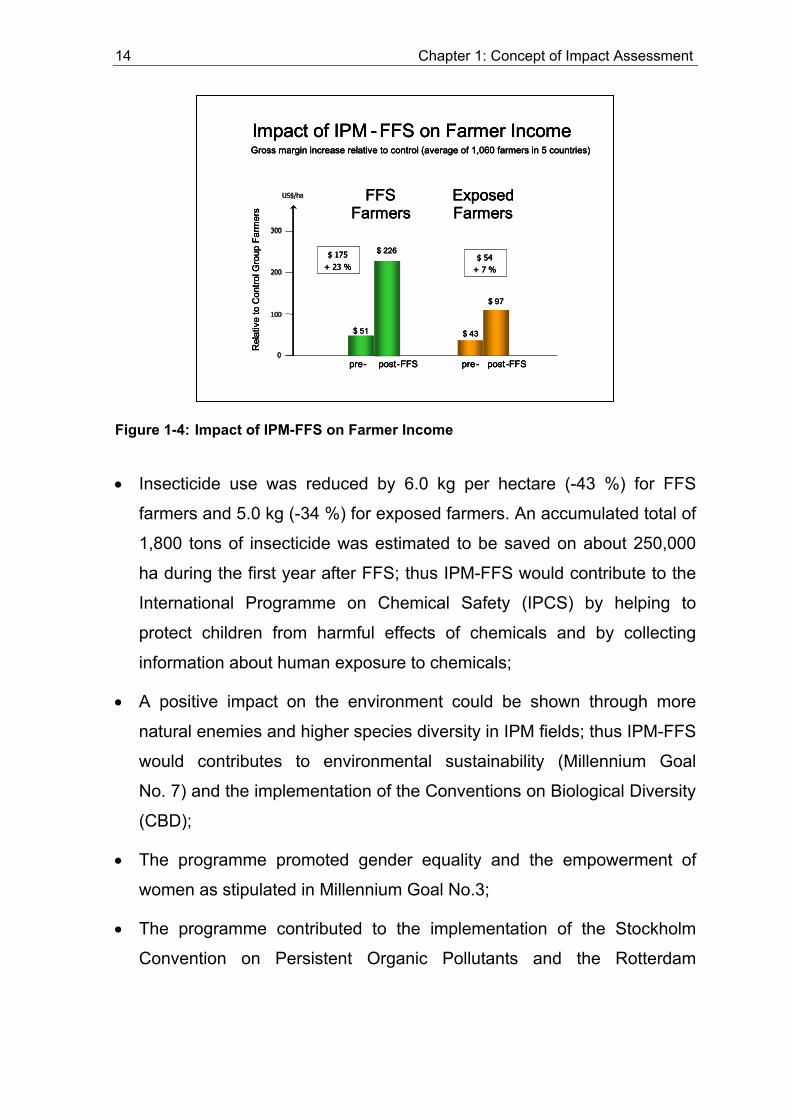
• Average gross margins increased by US$ 175 per hectare (+23%
relative to control) for FFS farmers and $54 (+7%) for exposed farmers
(Figure 1-4); this demonstrates the potential of IPM-FFS for reducing
rural poverty (Millennium Goal No.1);
14 Chapter 1: Concept of Impact Assessment
Impact of IPM -FFS on Farmer Income Gross margin increase relative to control (average of 1,060 farmers in 5 countries)
US$/haUS$/ha
200200
300300
100100
00
$ 175+ 23 %
$ 226
$ 51 $ 43
$ 97
FFS Farmers
Exposed Farmers
$ 54+ 7 %
pre- post-FFS pre- post -FFS
Rel
ativ
e to
Con
trol G
roup
Far
mer
s
Impact of IPM -FFS on Farmer Income Gross margin increase relative to control (average of 1,060 farmers in 5 countries)
US$/haUS$/ha
200200
300300
100100
00
$ 175+ 23 %
$ 226
$ 51 $ 43
$ 97
FFS Farmers
Exposed Farmers
$ 54+ 7 %
pre- post-FFS pre- post -FFS
Rel
ativ
e to
Con
trol G
roup
Far
mer
s
Impact of IPM -FFS on Farmer Income Gross margin increase relative to control (average of 1,060 farmers in 5 countries)
US$/haUS$/ha
200200
300300
100100
00
$ 175+ 23 %
$ 226
$ 51 $ 43
$ 97
FFS Farmers
Exposed Farmers
$ 54+ 7 %
pre- post-FFS pre- post -FFS
Rel
ativ
e to
Con
trol G
roup
Far
mer
s
Figure 1-4: Impact of IPM-FFS on Farmer Income
• Insecticide use was reduced by 6.0 kg per hectare (-43 %) for FFS
farmers and 5.0 kg (-34 %) for exposed farmers. An accumulated total of
1,800 tons of insecticide was estimated to be saved on about 250,000
ha during the first year after FFS; thus IPM-FFS would contribute to the
International Programme on Chemical Safety (IPCS) by helping to
protect children from harmful effects of chemicals and by collecting
information about human exposure to chemicals;
• A positive impact on the environment could be shown through more
natural enemies and higher species diversity in IPM fields; thus IPM-FFS
would contributes to environmental sustainability (Millennium Goal
No. 7) and the implementation of the Conventions on Biological Diversity
(CBD);
• The programme promoted gender equality and the empowerment of
women as stipulated in Millennium Goal No.3;
• The programme contributed to the implementation of the Stockholm
Convention on Persistent Organic Pollutants and the Rotterdam

Chapter 1: Concept of Impact Assessment 15
Convention for Prior-Informed Consent which were ratified to eliminate
or restrict certain severely hazardous chemicals.
Furthermore, the Programme successfully encouraged farmers and
facilitators to set-up local organisations and to play an active role in a
country’s development efforts (Ahmad et al., 2004) which positively
contributes to a strengthening of civil society functions.
1.4 Conclusions and Recommendations Experience of the Cotton IPM Programme has shown that a holistic
approach to impact assessment can bring benefits to a development project
beyond mere data collection and study reports. By practicing a “culture of
impact assessment” on all levels of project implementation, the Programme
not only improved the management skills of farmers, but also those of
extension agents, researchers and project administrators. This is
particularly important as IPM-FFS projects move out of a pilot phase mode
into systematic scaling-up when hundreds of facilitators would organize
thousands of FFS. At this stage, organisational matters become more
important than technical ones, and a clear understanding of the impact
targets can help in setting-up an efficient monitoring and reporting system.
Furthermore, impact assessments help focussing the farmer education
curriculum on the intended outcomes and maintain its quality standards.
Following the participatory nature of FFS it is better to place the
responsibility for quality in the hands of facilitators by grouping them into
'quality circles' than to establish a controlling system. This, however,
requires facilitators that are not only trained in adult education methods but
know how to coach farmer groups to form self-reliant organisations for
change.
The regional set-up of the Cotton IPM Programme created an inductive
environment for exchange between the countries and to learn from each
other. Finding consensus on a common set of impact targets created both a

16 Chapter 1: Concept of Impact Assessment
feeling of common goals as well as competition between different countries.
This would be particularly important as development projects focus more
and more on policy issues, international harmonisation and trade.
The experience of the Cotton IPM Programme has also shown that the
capacity to conduct impact assessment studies needs to be strengthened in
many countries. Investigators may have experience in collecting socio-
economic baseline data for feasibility studies, but impact studies require a
much more focussed approach and in-depth data analysis beyond mere
descriptive statistics. Building such capacities is vital as countries move to
more efficient agricultural systems and governmental organisations.
Through the process of impact assessment, the country programmes
became more focused and task-oriented, which in turn made project
implementation more efficient, transparent and accountable. Thus, the
impact assessment activities of the Cotton IPM Programme contributed to
building learning organisations in the member countries which will be able
to meet the challenges of the future.
References
Ahmad I., M. H. Soomro and M. A. Khan (2004): IPM Programme impacts on policy reforms and institutional capacity building: evidence from Pakistan. paper presented in Regional Workshop on IPM-FFS Impacts Analysis, organized by FAO-EU IPM Programme for Cotton in Asia, FAO Regional Office for Asia & Pacific, 39 Phra Atit Road, Bangkok, Thailand, 11pp.
CBD (1992): International Convention on Biological Diversity. See: http://www.biodiv.org
Feder, G., R. Murgai & J.B. Quizon (2003): Sending farmers back to school: The impact of farmer field schools in Indonesia. Review of Agricultural Economics.
Fleischer, G., H. Waibel, and G. Walter-Echols (2002): “The Costs of Transforming Public Extension Services Towards Participatory Approaches.” Paper presented at the CIMMYT Impact Assessment Conference, Costa Rica.
Hamid, A., S.M.F. Islam, M.M. Haque and Md. N.Bari (2003): Report on the Baseline Survey for Impact Evaluation of Cotton IPM in Bangladesh. Dept. of Agronomy and

Chapter 1: Concept of Impact Assessment 17
Dept. of Agricultural Economics, Bangabandhu Sheikh Mujibur Rahman Agricultural University, Gazipur, Bangladesh, 57 pp.
IPCS – International Programme on Chemical Safety by UNDP, ILO and WHO, established in 1980; see: http://who.int/ipcs/
Khan M. A., I. Ahmad and M. H. Soomro (2004): Impact of FFS-based IPM knowledge and practices on rural poverty reduction: evidence from Pakistan. paper presented in Regional Workshop on IPM-FFS Impacts Analysis, organized by FAO-EU IPM Programme for Cotton in Asia, FAO Regional Office for Asia & Pacific, 39 Phra Atit Road, Bangkok, Thailand, 15pp.
Khan M. A., I. Ahmad and M. H. Soomro (2004): Impact of IPM based plant protection practices on Biodiversity and Biosafety: evidence from Pakistan. paper presented in Regional Workshop on IPM-FFS Impacts Analysis, organized by FAO-EU IPM Programme for Cotton in Asia, FAO Regional Office for Asia & Pacific, 39 Phra Atit Road, Bangkok, Thailand, 18pp.
Khan M. A., M. H. Soomro and I. Ahmad (2004): Impacts of FFS group activities on organizational capacities of the farmers: evidence from Pakistan. paper presented in Regional Workshop on IPM-FFS Impacts Analysis, organized by FAO-EU IPM Programme for Cotton in Asia, FAO Regional Office for Asia & Pacific, 39 Phra Atit Road, Bangkok, Thailand, 14pp.
Khan M. A., I. Ahmad and M. H. Soomro (2004): Impact of FFS approach on skills enhancement and decision making capacity of farmers: evidence from Pakistan. Paper presented in Regional Workshop on IPM-FFS Impacts Analysis, organized by FAO-EU IPM Programme for Cotton in Asia, FAO Regional Office for Asia & Pacific, 39 Phra Atit Road, Bangkok, Thailand, 10pp.
Khan, M.A. (2004): Impact of FFS based IPM approach on cotton growing farms of Pakistan. Paper presented at “Workshop on Methodological aspects of Impact Assessment of Farmer Field Schools”, 21-23 July 2004, University of Hannover, Germany.
Pachagounder, P. (2004): “Farmer Field School helps small and marginal cotton growers in India to increase their net profit” presented at Regional Workshop on IPM-FFS Impacts Analysis, organized by FAO-EU IPM Programme for Cotton in Asia, FAO Regional Office for Asia & Pacific, 39 Phra Atit Road, Bangkok, Thailand
Pachagounder, P. (2004): “Institutionalization of farmer education in project states in India” presented at Regional Workshop on IPM-FFS Impacts Analysis, organized by FAO-EU IPM Programme for Cotton in Asia, FAO Regional Office for Asia & Pacific, 39 Phra Atit Road, Bangkok, Thailand
Pincus, J. (2000): “The Impact of Farmer Field Schools on Farmers’ Cultivation Practices in their own Fields,” Report submitted to the FAO Inter-country Programme for Community IPM in Asia, 2000.
Pontius, J., R. Dilts, A. Bartlett (ed.) (2002): From farmer field school to community IPM – Ten years of IPM training in Asia, RAP/2002/15, FAORAP, Bangkok, July 2002
PRDIS (2003): Impact Assessment of Cotton Integrated Pest Management (IPM) through Farmer Field School Approach. A Study in Karnataka State, India (2003). Participatory Rural Development Initiatives Society, 3-6-65/1/7, Basheerbagh, Hyderabad – 500 029, July 2003, 219 pp.
Quizon, J., G. Feder, and R. Murgai (2001): “Fiscal Sustainability of Agricultural Extension: The Case of the Farmer Field School Approach.” Journal on International Agricultural and Extension Education 8 (Spring 2001); 13-24.

18 Chapter 1: Concept of Impact Assessment
Thong, Le Quang and Nguyen Anh Ngoc (2004): The impact of Cotton Integrated Pest Management Training in Dak Lak Province, Vietnam. Draft Final Report. University of Agriculture and Forestry, Ho Chi Minh City, July 2004.
van den Berg, H. (2004): IPM Farmer Field Schools: A synthesis of 25 impact evaluations (2004). Wageningen University, Prepared for Global IPM Facility
van de Fliert, E. (1993): “Integrated Pest Management: Farmer Field Schools Generate Sustainable Practices. A Case Study in Central Java Evaluating IPM Training “Wageningen Agricultural University, Netherlands, Papers No. 93-3, 1993.
UN (2000): United Nations Millennium Declaration, Official records of the General Assembly, Fifty-fifths session, A/RES/55/2, 8 September 2000; see: http://www.un.org/millenniumgoals
Yang, Puyun, Lifeng Wu (2003): Report of Impact Assessment of Cotton IPM-FFS in Shandong Province, China. Draft report, December 2003. NATESC, MoA, Beijing 100026, P.R. China
Yang, Puyun, Lifeng Wu and Libing Wang (2003): Report of Impact Assessment of Cotton IPM-FFS in Yincheng City, Hubei Province, China. Draft report, December 2003. NATESC, MoA, Beijing 100026, P.R. China
Yang, Puyun, Lifeng Wu, Yinglai Tang, Wenxin Bao (2003): Report of Impact Assessment of Cotton IPM-FFS in Dongzhi County, Anhui Province, China. Draft report, December 2003. NATESC, MoA, Beijing 100026, P.R. China

2 The Costs and Benefits of the FAO-EU IPM Programme for Cotton in Asia
Suwanna Praneetvatakul1, Gerd Walter-Echols2 and Hermann Waibel3
2.1 Introduction Investment in rural education and farmer training has become an important
component of development assistance. During the past, these activities
were considered as public goods whose benefits were often just taken for
granted. Sometimes, cost-effectiveness analysis has been applied with the
aim to maximize the effectiveness of limited public funds through targeted
placement of education programs. Most studies on rural education used the
criterion of cost per trainee (farmer) to assess the relative advantage of the
project. More recently, however, the question of investment efficiency has
also been raised with farmer training activities (Quizon et al., 2001). Hence,
training is considered an investment with an identifiable stream of benefits
that occur over time. Especially, a publicly funded training program that
follows the Farmer Field School (FFS) approach should be subjected to
rigorous analysis and scrutiny because of the widespread perception that
this concept is too expensive. Thus, treating an FFS program in the context
of cost-benefit analysis can help to answer the question of whether FFS is a
justifiable investment from the point of view of the donor and implementing
countries.
The objective of this paper is to investigate the economic efficiency of
investment in training farmers under the FFS approach as undertaken by
the FAO-EU IPM Programme for Cotton in Asia.
1 Assistant Professor, Department of Agricultural and Resource Economics, Faculty of Economics,
Kasetsart University, Bangkok, Thailand. 2 formerly Environmental Impact Expert, FAO-EU IPM Programme for Cotton in Asia, FAO
Regional Office for Asia and the Pacific, Bangkok, Thailand 3 Professor, Chair of Development and Agricultural Economics, School of Economics and
Management, University of Hannover, Germany

20 Chapter 2: Costs and Benefits of the Programme
2.2 Methodology The results of a cost benefit analysis for a development programme such as
the FAO-EU IPM Programme for Cotton in Asia depend on the quality of the
data available and the analytical method used. First, in the case of the
FAO-EU IPM Programme data collection is not necessarily representative
for the entire project area of the five participating countries because data
are derived from the impact assessment studies mentioned in Chapter 1 of
this volume. Second, the analytical method was kept simple and only a
financial analysis was conducted. Due to limitations in time and resources it
was not possible to derive shadow prices for all the different country
situations. Thus, in the financial analysis actual prices converted at the
official exchange rates were used and the benefits at country level were
aggregated.
Analytical Method Benefit-cost analysis is a method to assess the economic desirability of
competing alternatives, where desirability is measured as the economic
worth to society as a whole (Sinden and Thampapillai, 1995). Because
resources are scarce, not all desired projects can be undertaken. Ex-ante
and ex-post evaluation of development projects are useful tools for
accountability purposes and for decision-making of resource allocation. By
calculating the net present value (NPV) and the internal rate of return (IRR),
a measure of the efficiency of the investment is obtained. The general
procedure starts with the identification of the benefits and costs of the
project. The second step is to quantify and value costs and benefits using
market prices for the financial analysis and shadow prices for the economic
analysis (Gittinger, 1982). Costs and benefits are tabulated on an annual
basis over the defined project period. The annual costs and benefits are
then discounted and a cumulative cash flow, which is the difference
between benefits and costs, is calculated resulting in the NPV of the project
investment. The net present value (NPV) is the present value of the total

Chapter 2: Costs and Benefits of the Programme 21
net gain of the project, calculated by the present value of benefits (B) minus
the present value of costs (C) using a discount rate that normally reflects
the opportunity costs of capital. The internal rate of return (IRR) is the
discount rate at which the present value of benefits equals the present
value of costs, i.e. the rate at which net present value is zero (Sinden and
Thampapillai, 1995). When applying the IRR criterion all benefits and costs
are discounted at the internal rate of return as shown by the following
equation:
0IRR)(1
)C(B...IRR)(1
)C(B)C(B ttt
111
00 =+
−++
+−
+−
Data
Both primary and secondary data sources were used for the analysis.
Primary data came from the seven impact assessment field surveys that
were conducted in Bangladesh, China (3 studies in three different
provinces), India, Pakistan and Vietnam. The individual datasets were
combined into a regional database. For each of the participating countries,
the average benefit in terms of increase in farmer’s income has been
applied to the respective total area covered. In addition, health benefits
were calculated based on the amount of pesticide reduction. The data on
project costs are based on project planning documents and country reports.
Price data for cotton output and wages were taken from national agricultural
statistics.
2.3 Results In this section the results of the financial benefit-cost analysis for the FAO-
EU IPM Programme for Cotton in Asia are presented. An outline is provided
of how program costs and benefits are calculated.

22 Chapter 2: Costs and Benefits of the Programme
2.3.1 Program Costs The program costs consist of the project’s operational costs which include
the costs of carrying out farmer training, the overall technical assistance by
the project management unit, the planning and evaluation workshops,
travel, equipment such as vehicles, the costs for management and
administration in the six countries and the program management unit at the
regional FAO office in Bangkok. Table 2-1: Project Costs of the FAO-EU IPM Programme for Cotton in Asia
Year Total actual project costs [US$]
2000 937,844
2001 2,332,468
2002 3,216,086
2003 4,012,160
2004 1,790,390
Total 12,288,948
Source: FAO-EU IPM Programme for Cotton in Asia, 2004
Project costs are listed in detail in Table 2-1 over the project period
resulting in a total budget of about US$ 12.3 million for 5 years. These cost
do not yet include the opportunity costs of farmers’ time. Adding these
costs, which were estimated at US$ 1,119,360 for the 55,968 farmers
trained by the programme until 2004 (see Table 2-2), brings the total
program costs to over US$ 13 million or about US$ 2.68 million per year.
Costs of farmer participation in the training were assessed by calculating
the opportunity cost of farmer’s time of participating in FFS. Considering
that participants attend a season-long training equivalent to 14 - 20 weekly
sessions depending on the country an average of US$ 20 per participant
was added.

Chapter 2: Costs and Benefits of the Programme 23
Table 2-2: Opportunity Costs for Farmers Participating in the FAO-EU IPM Programme for Cotton in Asia
Year Total FFS farmersa Total opportunity costs of FFS farmersb [US$] 2000 2,027 40,540.00 2001 7,727 154,540.00 2002 17,661 353,220.00 2003 23,039 460,780.00 2004 5,514 110,280.00 Total 55,968 1,119,360.00
Remarks: a based on October 2004 estimates; b is FFS farmers multiplied by US$ 20
2.3.2 Program Benefits In general, the expected benefits from the FAO-EU IPM Programme for
Cotton in Asia were as follows:
Enhanced farmer knowledge, skills and practices
Increased farmer income
Reduced use of pesticides
Improved farmer health
Enhanced agro-biodiversity
Reduced rural poverty
Not all of the listed benefits, however, can be quantified. Therefore, this
analysis is only based on the benefits from the two main impacts: (1)
income increase and (2) improved health resulting from pesticide use
reduction. Two sources of information were used for benefit assessment:
a) Data measured based on impact study results
b) Assumption based on literature for health cost reduction and diffusion
effects.

24 Chapter 2: Costs and Benefits of the Programme
Productivity Benefits The impact of the programme on farmer income was evaluated by
calculating the difference of post- and pre-training gross margins (GM) of
FFS graduates minus that of control farmers. The calculation of benefits
starts from calculating the change in gross margin per hectare (GM/ha).
The change in GM/ha is the difference of GM of post- and pre-training
between FFS and control farmers. Then, the change in gross margin per
household (HH) was estimated using GM/ha multiplied by farm size. Finally,
total gross margin increase was calculated from GM/HH multiplied by the
number of trained farmers per country.
The average increase in GM for farmers participating in FFS across all
countries was calculated at US$ 170.58 per HH (Table 2-3). Depending on
the country this is between a 2.5% – 425% increase in the pre-training
gross margin. Of course, benefits varied from country to country depending
on farm size, number of farmers practicing IPM and GM increase as derived
from the impact studies. For example, the increase in GM was highest in
Hubei province in China with close to US$ 500 per ha. This increase in
farmer income from FFS training compares well with those levels reported
from the introduction of transgenic cotton varieties in China (Huang et al.,
2002). In all but one country the change was positive. Bangladesh was the
only exception. Here the GM of the trained farmers declined relative to
those in the control villages, but not relative to the untrained farmers in the
same village. The main reasons for this unexpected outcome were 16%
higher yields in the control villages. This can be attributed to the highly
diverse cropping system where cotton is often not the main crop and some
administrative problems in programme implementation.

Chapter 2: Costs and Benefits of the Programme 25
Table 2-3: Average Increase in Gross Margin of Farmers Participating in the FAO- EU IPM Programme for Cotton in Asia
Countries Sample size
Total No. of Farmers trained a
GM change [US$/hab]
Farm size [ha/HH]a
GM [US$/HH]c
Total GM increased
Bangladesh 91 3,700 -37.81 0.35 -13.23 -48,951.00China-Anhui 180 3,772 27.28 0.28 7.63 28,780.36China-Hubei 180 3,983 489.30 0.22 107.64 428,730.12China-Shandong 175 7,411 329.03 0.15 49.35 365,732.85India 97 12,043 77.18 1.78 137.38 1,654,467.34Pakistan 190 10,471 214.28 2.68 574.27 6,013,181.17Vietnam 147 10,615 51.6 0.78 40.25 427,253.75Total 1,060 51,995 8,869,194.59Average per HHe 170.58a Source: FAO-EU IPM Programme for Cotton in Asia, 2004. The number of farmers is lower
than in table 2-2 by the number of FFS conducted in the Philippines and in some other provinces in China where no impact studies were conducted.
b calculated from the regional database. GM/ha is the difference of GM of post- and pre-training between FFS and control farmers.
c calculated from GM/ha multiplied by farm size in ha per household (HH). d calculated from GM/HH multiplied by no. of farmers. e calculated from total GM divided by total number of farmers.
Health Benefits The benefits resulting from an improvement of farmer health were
estimated through the reduction in pesticide costs. The study by Pingali et
al. (1994) showed that health costs resulting from chemical pesticide use
ranged from 0.5 to 1 times the pesticide costs. In this study, the lower value
of this ratio was used as a proxy to value health benefits. Thus, the average
benefit from improving farmers’ health equalled US$ 21.20 per FFS
graduate (Table 2-4).

26 Chapter 2: Costs and Benefits of the Programme
Table 2-4: Average Reduction in Pesticide Costs of Farmers Participating in the FAO-EU IPM Programme for Cotton in Asia
Countries Sample No. of farmersa
Pesticide Cost
[US$ /ha]b
Farm size [ha/HH]a
Pesticide Cost
[US$ /HH]c
Health Benefits [$/HH/year] d
Bangladesh 91 3,700 25.29 0.35 8.85 16,375.28 China-Anhui 180 3,772 57.63 0.28 16.14 30,433.25 China-Hubei 180 3,983 54.89 0.22 12.08 24,048.96 China-Shandong 175 7,411 14.30 0.15 2.15 7,948.30 India 97 12,043 88.57 1.78 157.65 949,317.17 Pakistan 190 10,471 5.20 2.68 13.94 73,102.24 Vietnam 147 10,615 0.22 0.78 0.17 827.97 Total 1,060 51,995 1,102,053.16 Average Health benefit ($/HH) 21.20
a Source: FAO-EU IPM Programme for Cotton in Asia, 2004 b calculated from the regional database. Pesticide cost/ha is the difference of total pesticide
costs of post- and pre-training between FFS and control farmers. c calculated from pesticide cost/ha multiplied by farm size (ha/HH). d calculated from total pesticide costs/HH multiplied by no. of farmers, divided by two.
Total Programme Benefits Total programme benefits consist of the benefits from income increase and
improved health as discussed above. In most countries, the benefits from
productivity increase exceed those from reduced health costs (Table 2-5).
Nevertheless, health benefits on average account for almost 20% of total
benefits. In India, where the programme focused on pesticide health effects
(see Chapter 6, this volume) health benefits account for over one third of
total benefits. In Bangladesh, the programme has probably produced a net
loss of almost US$ 9 per farm household in spite of positive health effects
from pesticide reduction, which compensated for some of the productivity
losses.

Chapter 2: Costs and Benefits of the Programme 27
Table 2-5: Total Annual Benefits and Composition of Benefits by Crop Income and Health
Composition of Benefits (%) Countries Gross Margin Health Cost
Reduction
Annual Total Net Benefits at Farm Level [US$]
Annual Total Benefit per Farmer [US$/HH/year]
Bangladesh 0 100 -32,575.72 -8.804249China-Anhui 48.6 51.4 59,213.61 15.6982China-Hubei 94.7 2.3 452,779.08 113.6779China-Shandong 97.8 2.2 373,681.15 50.4225India 63.5 37.5 2,603,784.51 216.2073Pakistan 98.8 1.2 6,086,283.41 581.2514Vietnam 99.8 0.2 428,081.72 40.328Total 9,971,247.75 191.7732
In the calculation of the IRR the benefit stream was assumed to start in the
year after farmers participated in an IPM-FFS. Then, the assumption was
made that farmers would continue their new practices for just one more
year. This very conservative assumption is based on the observation that
unless follow-up activities take place, farmers may dis-adopt the
technology, which they have acquired in the farmer field school training.
Since the project was terminated after its initial phase, follow-up activities
by the national programes are uncertain. The unitary benefits of some US$
190 per household and year were multiplied by the number of IPM
practitioners as shown in Table 2-1. A further deduction was made in
assuming that 20% of the FFS participants did actually not change their
practices after training, i.e. they did not adopt IPM. Thus the total benefits of
the project are calculated on a yearly basis as presented in Table 2-6. Table 2-6: Benefits of the FAO-EU IPM Programme for Cotton in Asia [in US $]
Year IPM 1 year benefits 2 year benefits Total Benefits Practitioners Income Health Income Health
2000 1,621.60 0 0 0 0 0 2001 6,181.60 275,672.00 34,053.60 0 0 309,725.60 2002 14,128.80 1,050,872.00 129,813.60 275,672.00 34,053.60 1,490,411.20 2003 18,431.20 2,401,896.00 296,704.80 1,050,872.00 129,813.60 3,879,286.40 2004 4,411.20 3,133,304.00 387,055.20 2,401,896.00 296,704.80 6,218,960.00 2005 749,904.00 92,635.20 3,133,304.00 387,055.20 4,362,898.40 2006 749,904.00 92,635.20 842,539.20

28 Chapter 2: Costs and Benefits of the Programme
2.3.3 Net Present Value, Benefit Cost Ratio and Financial Rate of Return of the Programme
In the base case scenario which used the assumptions described above
and presented in Table 2-7, results show a positive net present value of
US$ 575,548 and a benefit cost ratio of over 1 using a discount rate of 12%.
The Financial Internal Rate of Return was 16%. As shown by the positive
cash flow in Table 2-2, the pay-off period is reached in 2005, the very year
that the project was closed.
Results of this analysis indicate that the public investment of the EU to
implement the IPM Programme for Cotton in Asia was economically
justified. This judgment can be made with some confidence since the
analysis uses rather conservative assumptions. In reality, the viability of the
investment may be stronger. If the national programs continue to support
IPM under their regular extension activities, farmers are likely to continue to
practice IPM beyond the two years assumed in this analysis. Also, national
governments may undertake additional investments in IPM-FFS resulting in
further scaling-up of the program. For example, the Government of Pakistan
has committed significantly more of its budget for IPM expressing its’
willingness to diffuse the program further. In order to account for the
consequences of other possible scenarios, sensitivity analysis was
performed.

Chapter 2: Costs and Benefits of the Programme 29
Table 2-7: Benefits and Costs of the FAO-EU IPM Programme for Cotton in Asia
Year Benefits Costs Net Benefits Discounted cumulative cash flow
2000 978,384.00 -978,384.00 -873,557.142001 309,725.60 2,487,008.00 -2,177,282.40 -2,609,273.342002 1,490,411.20 3,569,306.00 -2,078,894.80 -4,088,989.602003 3,879,286.40 4,472,940.00 -593,653.60 -4,466,267.192004 6,218,960.00 1,900,670.00 4,318,290.00 -2,015,953.482005 4,362,898.40 4,362,898.40 194,426.63 2006 842,539.20 842,539.20 575,548.58
NPV (r=12%) 575,548.58
BCR 1.06 FIRR 16%
Note: NPV: Net Present Value, BCR: Benefit-Cost Ratio, FIRR: Financial Internal Rate of Return, r is the discount rate.
2.3.4 Sensitivity Analysis In order to determine whether the project was still worth the investment
under different assumptions, three additional scenarios were tested as
follows:
Scenario B4: farmers practice IPM for 3 years
Scenario C: diffusion effect to neighboring farmers at a rate of 1
exposed farmer to 1 FFS farmer; it is assumed that benefits to
exposed farmers are only 1/3 that of FFS graduates and they only
last for 1 year
Scenario D: same as Scenario B but without health benefits
Results of these scenarios are shown in Table 2-8. The first observation is
that if farmers continue to practice IPM for just one year longer than in the
base scenario the FIRR rises to 36%. Furthermore , taking the same
retention period of the base scenario but assuming diffusion effects to the
non-trained farmers living in the same village (exposed farmers, scenario
C), the FIRR also goes up to 27%. Finally, even when ignoring health
4 The base scenario (scenario A) was kept in the table for easier comparison.

30 Chapter 2: Costs and Benefits of the Programme
benefits but assuming a 3-year retention of IPM practices (scenario D), the
FIRR becomes 28%. Overall, the analysis shows that the critical factor for
project success is that farmers retain the IPM practices. This seems
possible, provided the national programs show the necessary commitment
and reform their extension system in order to accommodate participatory
approaches such as FFS on a large scale (Fleischer et al., 2002).
It should be mentioned that the results for the FAO-EU IPM Programme are
comparable to those calculated for an ADB-funded IPM project in Pakistan
despite the more optimistic assumptions made in the ADB analysis
(Erickson, 2004). In this analysis, the rate of return was in the order of 26%.
Hence, in conclusion, there is little doubt that the FAO-EU IPM Programme
for Cotton in Asia was an economically viable investment. The rate of return
of the project investment and the sustainability of the benefits would have
been considerably higher had the programme been continued for another
phase, as originally planned. Table 2-8: Scenario Analysis of the Rates of Return for the FAO-EU IPM
Programme for Cotton in Asia
Scenario Number of
IPM practitioners
Diffusion number of
farmers
Retention of IPM practice
years
Income benefit
[US$/farm]
Health Benefit
[US$/farm]
FIRR [%]
A 44,774 0 2 170 21 16 B 44,774 0 3 170 21 36
C 44,774 44,774
2 1
170 56.67
21 7 27
D 44,774 0 3 170 0 28 Note: FIRR: Financial Internal Rate of Return
2.4 Summary and Discussion This brief analysis of the benefits and costs of the FAO-EU IPM Programme
for Cotton in Asia has shown that even under conservative assumptions,
the investments made by the project did pay off. Also, as shown in a study
by Yang et al. (2005) investment in farmer training may effectively augment
the introduction of new pest control technologies such as transgenic cotton

Chapter 2: Costs and Benefits of the Programme 31
varieties. There is now an increasing amount of evidence indicating that
farmer education through FFS is effective in changing farmer behavior (van
den Berg, 2004). Furthermore, the findings of this analysis confirm the
results of an economic analysis of a similar IPM program in Pakistan
(Erickson, 2004).
Overall, this study has shown that in order to conduct meaningful benefit-
cost analysis, a well-designed impact assessment scheme is a necessary
pre-condition to obtain the basic data required for such analysis. To sustain
the benefits from FFS programs, it is crucial that enabling policy conditions
are in place in order to create incentives for farmers to continue IPM
practices. Moreover, institutional models for up-scaling IPM and the role of
FFS thereof need to be developed. Furthermore, a long-term ex post impact
analysis is needed to verify the critical assumptions of the analysis
presented here.

32 Chapter 2: Costs and Benefits of the Programme
References Erickson, R. (2004): Review and Evaluation Technical Assistance No. 3383-PAK:
Integrated Pest Management. Asian Development Bank. Philippines.
Fleischer, G., H. Waibel, and G. Walter-Echols (2002): “The Costs of Transforming Public Extension Services Towards Participatory Approaches.” Paper presented at the CIMMYT Impact Assessment Conference, Costa Rica, February 2002.
Gittinger, J.P. (1982): Economic Analysis of Agricultural projects. John Hopkins University Press.
Huang, J., R. Hu, S. Rozelle, F. Qiao and C. E. Pray (2002): Transgenic varieties and productivity of smallholder cotton farmers in China. The Australian Journal of Agricultural and Resource Economics 46 (3), 367-387.
Pingali, P.L., C.B. Marquez, and F.G. Palis (1994): Pesticides and Philippine Rice Farmer Health: A Medical and Economic Analysis. American Journal of Agricultural Economics. August 1994, P. 587-592.
Sinden, J.A. and D.J. Thampapillai (1995): Introduction to Benefit-Cost Analysis. Longman.
FAO (2004): Cotton IPM Newsletter. FAO-EU IPM Programme for Cotton in Asia. Issue no. 5. FAO Regional Office for Asia and the Pacific, Bangkok, Thailand.
Van den Berg, H. (2004): IPM Farmer Field Schools: A synthesis of 25 impact evaluations, Wageningen University, Report prepared for the FAO Global IPM Facility, Rome.
Quizon, J., G. Feder, and R. Murgai (2001): “Fiscal Sustainability of Agricultural Extension: The Case of the Farmer Field School Approach.” Journal on International Agricultural and Extension Education 8 (Spring 2001); 13-24.
Yang, P., M. Iles, S. Yan and F. Jollifee (2005): Farmers' knowledge, perceptions and practices in transgenic Bt cotton in small producer systems in Northern China. Crop Protection 24 (3), 229-239.

3 The Impact of FFS on Yield, Pesticide Cost and Gross Margin in Shandong Province, P. R. China: an Econometric Approach1
Lifeng Wu2, Suwanna Praneetvatakul3, Hermann Waibel4 and Lanying Wang5
Abstract
This paper uses a “difference in difference” model to evaluate the impact of
FFS on important farm-level socio-economic performance indicators of
cotton production such as yield, pesticide cost and gross margin. Analysis
results of panel data collected before and after the introduction of FFS
indicate that there is a significant effect of FFS on its graduates’
performance as compared to the control group. The FFS graduates had
higher growth rates for gross margin and yield while cost of pesticides
decreased significantly. For the exposed farmers, no significant difference
was found with respect to the growth rates of gross margin and yield as
compared to the control farmers, but pesticide costs were significantly
reduced.
3.1 Background Substantial investments in FFS training call for a comprehensive
assessment of its impact. Several recent studies reported encouraging
impacts of FFS training such as reduction in pesticide use (or cost) and
increase in yield (van den Berg, 2004). Praneetvatakul and Waibel (2002)
1 The authors thank the FAO-EU Cotton IPM Program in Asia for the financial support of the study.
Special thanks are extended to Dr. Peter Ooi, Dr. Gerd Walter-Echols and Dr. Puyun Yang for their constructive comments on the paper, and also to Mr. Zuowen Sun for data support.
2 Research Associate, National Agro-technical Extension and Service Center, Ministry of Agriculture, China
3 Assistant Professor, Department of Agricultural and Resource Economics, Faculty of Economics, Kasetsart University, Bangkok, Thailand
4 Professor, Chair of Development and Agricultual Economics, School of Economics and Management, University of Hannover, Germany
5 Researcher, Plant Protection Station of Lingxian County, Shandong province, China

34 Chapter 3: FFS Impact in Shandong Province, China
showed that rice farmers in Thailand who participated in FFS training
reduced their insecticide costs by 58% and costs of molluscicides by 59%,
while costs among farmers who were not trained remained unchanged
during the same period. Jiang and Liang (1997) reported farmers’ profit
from rice cultivation in China increased by 23.2% after participation in FFS,
while pesticide use was reduced by 38.5%. Godtland et al. (2003) showed
that for the case of Peru that participation in FFS on potatoes significantly
enhanced farmers’ knowledge of pests, fungicides and resistant varieties.
However, controversy exists about the reported impacts. Owing to the
complexity of impact evaluation, there is no agreed conceptual framework
for measuring FFS impact (van den Berg, 2004). Since FFS usually follows
certain criteria for project placement and participant selection, it is
contended that most previous studies have not accounted for econometric
problems that arise in estimating program impact when the placement of
the program across villages and selection of farmers for participation in the
program are not done at random. These and other econometric issues are
likely to bias estimates of program impact and the significance of the impact
may result from the existing difference (Feder et al., 2004).
Regarding the bias problem, meaningful work has been done by Feder et
al. (2004) through adopting the DD model for FFS impact assessment. In
their study this model was applied to panel data collected in Indonesia and
no significant improvement in economic performance was identified.
However, sample design and data collection methods are still being
questioned. Since the authors pointed out that FFS program design and
rapid scaling-up might have affected the impact, caution should be
exercised when citing the result of that study. More cases should be studied
before the outcomes can be applied. The DD model is an appropriate tool
to solve the problems rising from non-random selection of FFS participants
and non-random placement of project; it is worthwhile to utilise this
approach to evaluate the impact of FFS conducted elsewhere.

Chapter 3: FFS Impact in Shandong Province, China 35
3.2 Objective The overall objective is to investigate whether there is significant impact of
FFS on graduates and exposed farmers. The specific objectives of this
paper are to:
1. describe important socio-economic parameters of graduates, exposed
farmers and control farmers;
2. analyse the impact of FFS on cotton yield, gross margin and pesticide
cost using the “difference in difference” (DD) model.
3.3 Theoretical Framework A commonly used approach for FFS impact assessment is to regress farm
level outcomes on variables indicating a farmer’s participation in or
exposure to the FFS training and other relevant variables. For farmer i in
village j and time period t, the model can be constructed as follows:
ln(Yijt )=α+βDNijt+µDGijt+γXijt+δZjt+λi+ηj+εijt (1)
where Y stands for a farmer level outcome such as gross margin or
pesticide costs, DG and DN are dummy variables for graduates and exposed
farmers (with control farmers implicit). Variables X and Z denote vectors of
household and village characteristics respectively that may change over
time, λi and ηj are unobserved determinants of Y that are fixed over time
within a household and village, respectively.
Since non-random participant selection leads to correlation between DN, DG
and λi, while non-random program placement leads to correlation between
DN, DG and ηj, the orthogonality between graduate and exposed dummies
and the residual is likely to be violated. As a result, there is no guarantee for
unbiased estimates of µOLS and βOLS and hence no strong conclusion can
be drawn about the causal effect of FFS on graduate or exposed farmers
(Feder et al., 2004).
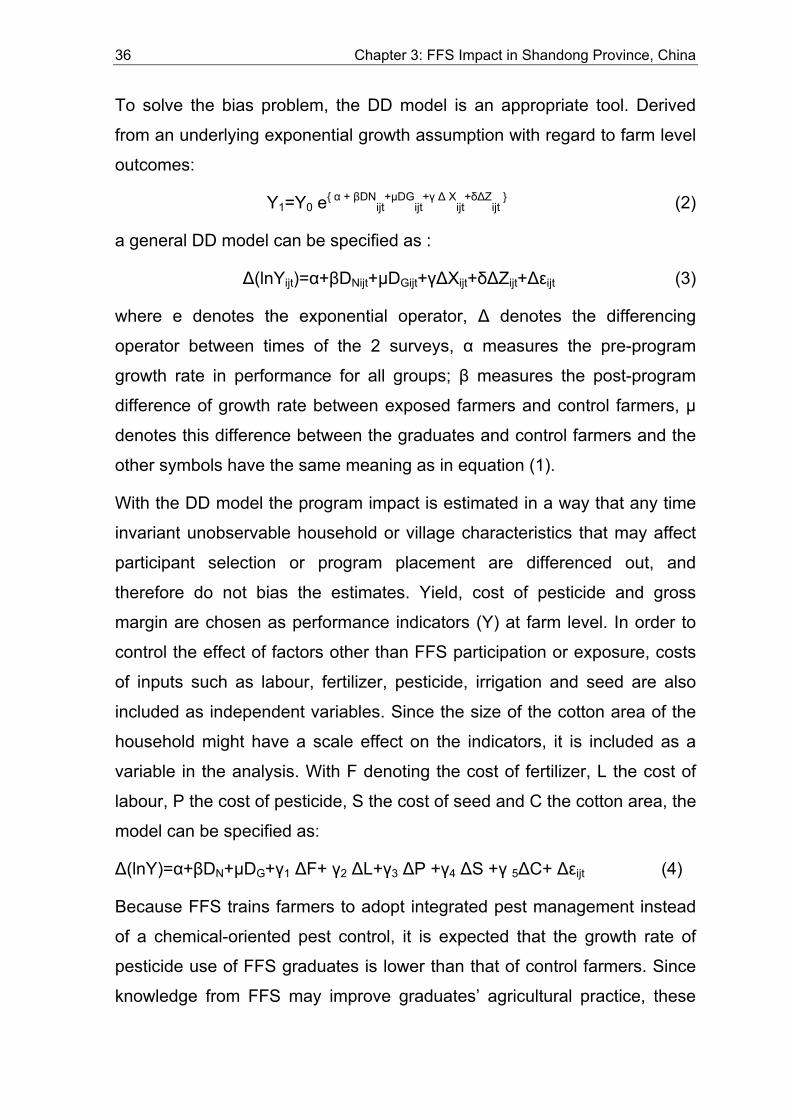
36 Chapter 3: FFS Impact in Shandong Province, China
To solve the bias problem, the DD model is an appropriate tool. Derived
from an underlying exponential growth assumption with regard to farm level
outcomes:
Y1=Y0 e{ α + βDNijt
+µDGijt
+γ ∆ Xijt
+δ∆Zijt
} (2)
a general DD model can be specified as :
∆(lnYijt)=α+βDNijt+µDGijt+γ∆Xijt+δ∆Zijt+∆εijt (3)
where e denotes the exponential operator, ∆ denotes the differencing
operator between times of the 2 surveys, α measures the pre-program
growth rate in performance for all groups; β measures the post-program
difference of growth rate between exposed farmers and control farmers, µ
denotes this difference between the graduates and control farmers and the
other symbols have the same meaning as in equation (1).
With the DD model the program impact is estimated in a way that any time
invariant unobservable household or village characteristics that may affect
participant selection or program placement are differenced out, and
therefore do not bias the estimates. Yield, cost of pesticide and gross
margin are chosen as performance indicators (Y) at farm level. In order to
control the effect of factors other than FFS participation or exposure, costs
of inputs such as labour, fertilizer, pesticide, irrigation and seed are also
included as independent variables. Since the size of the cotton area of the
household might have a scale effect on the indicators, it is included as a
variable in the analysis. With F denoting the cost of fertilizer, L the cost of
labour, P the cost of pesticide, S the cost of seed and C the cotton area, the
model can be specified as:
∆(lnY)=α+βDN+µDG+γ1 ∆F+ γ2 ∆L+γ3 ∆P +γ4 ∆S +γ 5∆C+ ∆εijt (4)
Because FFS trains farmers to adopt integrated pest management instead
of a chemical-oriented pest control, it is expected that the growth rate of
pesticide use of FFS graduates is lower than that of control farmers. Since
knowledge from FFS may improve graduates’ agricultural practice, these

Chapter 3: FFS Impact in Shandong Province, China 37
farmers are supposed to have higher growth rates in gross margin and yield
as compared to control farmers. Since exposed farmers may have access
to FFS knowledge indirectly from their FFS graduate neighbours, it is
expected that their performance will be improved to some extent. In all
cases, a significant β exhibits a significant difference between exposed
farmers and control farmers, while a significant µ shows a significant
difference between graduates and control farmers. In order to test whether
there is any difference of the growth rates between graduate and exposed
farmers, the regressions are re-estimated with exposed farmers implicit,
and the test of the coefficient for graduate dummy will give the answer.
Since the re-estimation is in essence the same as the original one, only
statistics relative to the constant term (exposed farmers), control farmers
and graduates are reported.
3.4 Data Collection The data were collected in Lingxian, a big agricultural county located in the
northwestern part of Shandong Province, China. Cotton is the most
important cash crop in this county. In the early 1990s, Lingxian ranked
among the 10 biggest cotton producing counties in China, while from 1992
onward the cotton area declined until Bt cotton was introduced in 1999.
With a 100% adoption of Bt cotton in 2001, the cotton area had expanded
to 30,800 hectares. As a traditional cotton growing area, Lingxian County
was included into the FAO-EU IPM Program for Cotton in Asia at its
inception and since 2001, 170 FFSs have been conducted and 4,700
farmers trained.
At the beginning of the 2001 cotton season, a baseline survey was carried
out during which retrospective data for the 2000 season (before the training
activities) were collected. Most farmers keep records of their agricultural
activities, and those records helped to ensure the precision of the
information. The survey covered economic, environmental, health,

38 Chapter 3: FFS Impact in Shandong Province, China
education and social information, but only economic data will be reported-
on in this paper.
The surveys were organized by the National Agro-technical Extension and
Service Center and the Shandong Provincial Plant Protection Station.
Enumerators were local agricultural technicians, consultants from
universities and research institutes and some FFS graduates. In order to
follow a standard surveying procedure, workshops were held to train these
investigators. Questionnaires for the survey were collectively designed and
pre-tested in a pilot survey.
Six villages within the two townships of Mi and Dingzhuang were included in
the survey. FFSs were only conducted in Mi Township while Dingzhuang
served as the control area. The two townships are 50 kilometers apart and
no FFSs were conducted in-between; this distance was assumed sufficient
to prevent possible diffusion of FFS knowledge or practices to the farmers
in Dingzhuan. Three villages in each township were sampled as replicates.
The selection of the sample villages was based on the analysis of
secondary data and considered factors such as cotton production, distance
from the city, infrastructure, etc. In each sample village in Mi Township, 20
FFS and 20 exposed farmer households were randomly selected for the
survey, while in each of the 3 villages in Dingzhuang, 20 farmer households
were taken as the control. Thus, 60 households were investigated for each
group (FFS graduates, exposed farmers and control farmers). Due to some
missing data, only 51 graduates, 59 exposed and 58 control farmer
households were included in this analysis.
The second survey was conducted by the same enumerators season-long
in 2002 and the same set of data was collected using a double-checking
system, i.e. monthly visits by the enumerators in combination with farmers’
book keeping.
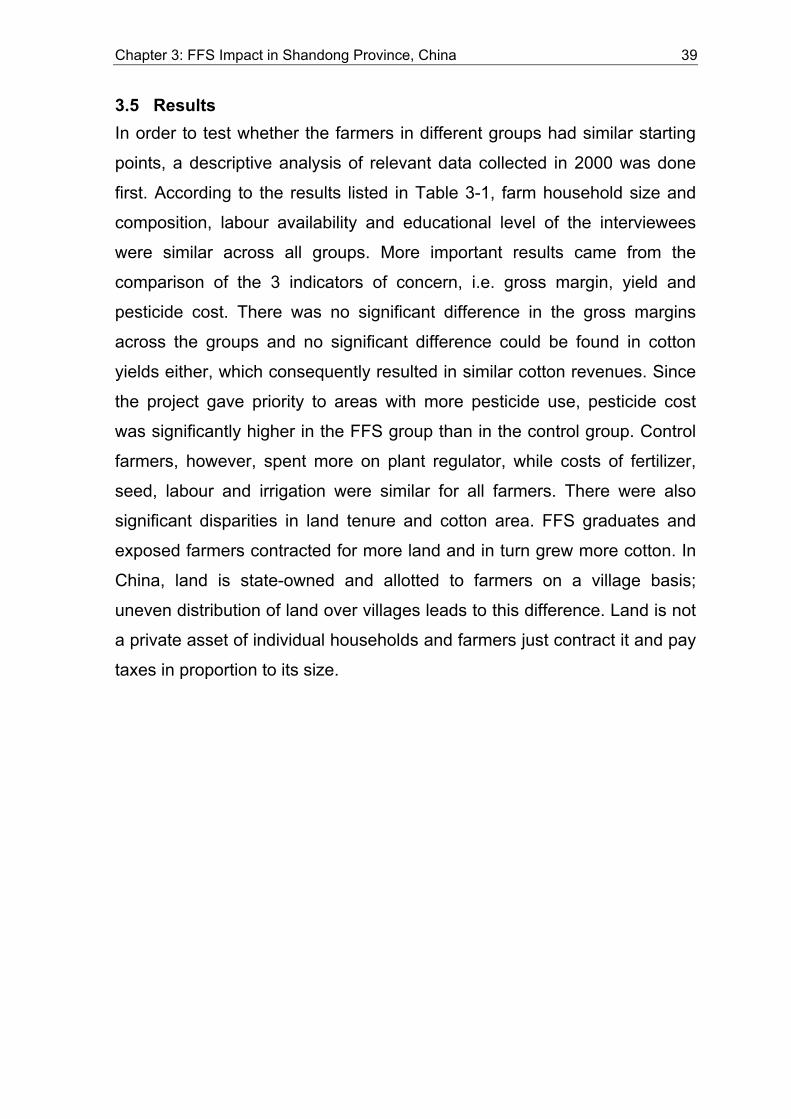
Chapter 3: FFS Impact in Shandong Province, China 39
3.5 Results In order to test whether the farmers in different groups had similar starting
points, a descriptive analysis of relevant data collected in 2000 was done
first. According to the results listed in Table 3-1, farm household size and
composition, labour availability and educational level of the interviewees
were similar across all groups. More important results came from the
comparison of the 3 indicators of concern, i.e. gross margin, yield and
pesticide cost. There was no significant difference in the gross margins
across the groups and no significant difference could be found in cotton
yields either, which consequently resulted in similar cotton revenues. Since
the project gave priority to areas with more pesticide use, pesticide cost
was significantly higher in the FFS group than in the control group. Control
farmers, however, spent more on plant regulator, while costs of fertilizer,
seed, labour and irrigation were similar for all farmers. There were also
significant disparities in land tenure and cotton area. FFS graduates and
exposed farmers contracted for more land and in turn grew more cotton. In
China, land is state-owned and allotted to farmers on a village basis;
uneven distribution of land over villages leads to this difference. Land is not
a private asset of individual households and farmers just contract it and pay
taxes in proportion to its size.

40 Chapter 3: FFS Impact in Shandong Province, China
Table 3-1: Descriptive Statistics by Farmer Category in 2000 (before training)
Farmer Category Controls Exposed Graduates
Household size 4.12 (0.98)
4.19 (0.99)
4.39 (1.18)
Male [%] 49.88 (13.50)
53.50 (15.86)
51.00 (18.01)
Female [%] 50.12 (13.50)
46.50 (15.86)
49.00 (18.01)
Labour [%]6 67.98 (21.93)
62.88 (20.27)
60.99 (19.83)
Educational level [years] 6.95 (1.92)
6.49 (2.51)
7.20 (2.26)
Cotton yield [kg/ha] 3498.22 (546.43)
3588.71 (514.66)
3627.32 (597.64)
Cotton gross margin [US$/ha]7 790.63 (373.57)
806.19 (370.03)
886.54 (405.99)
Cotton revenue [US$/ha] 1676.97 (257.99)
1674.25 (275.22)
1723.56 (295.90)
Pesticide cost [US$/ha] 13.77A (10.30)
17.51AB (15.57)
20.04B (14.98)
Plant regulator cost [US$/ha] 1.59B (0.87)
0.93A (0.91)
0.98A (1.27)
Fertilizer cost [US$/ha] 115.08 (45.22)
120.32 (56.77)
133.43 (92.93)
Seed cost [US$/ha] 47.16 (21.42)
48.26 (34.04)
54.32 (35.29)
Labour cost [US$/ha] 683.53 (237.85)
655.74 (235.46)
601.35 (323.74)
Irrigation cost [US$/ha] 25.22 (9.61)
25.30 (9.46)
26.90 (10.74)
Land tenure [ha] 0.46A
(0.14) 0.58B
(0.15) 0.53B
(0.18)
Cotton area [ha] 0.13A
(0.06) 0.19B
(0.08) 0.18B
(0.10) Notes: Standard deviation reported in parentheses.
Superscript capital letters denote results of Duncan’s test (0.05), no superscript no significant difference.
6 Labour refers to the number of family members who belonged in the age group between 16 and
60, but students in school and those adults who were not involved in farm work were excluded. 7 Gross margin is the difference between cotton revenue and the sum of all variable costs,
including costs of pesticide, plant regulator, fertilizer, seed, labor and irrigation. Opportunity cost of labor was 9 Yuan RMB per manday and the exchange rate between US$ and RMB used in this paper was 1:8.26. Price indices are used to inflate 2000 prices of cotton and inputs to 2002

Chapter 3: FFS Impact in Shandong Province, China 41
Table 3-2: Impact of FFS on Cotton Yield, Pesticide Cost and Gross Margin
Dependent variable Variable Coefficient Std Error Prob.
(Constant) -0.0447 0.036 0.215
EXPOSED 0.0178 0.031 0.569
Yield
R2=0.14, F=8.79 GRADUATE 0.142 0.032 0.000
(Constant) 0.627 0.140 0.000
EXPOSED -0.680 0.169 0.000
Pesticide cost
R2=0.26, F=14.23 GRADUATE -0.921 0.174 0.000
(Constant) 0.103 0.090 0.253
EXPOSED 0.0973 0.108 0.367
Gross margin
R2=0.43, F=30.69 GRADUATE 0.210 0.111 0.060
Note: Sample size in all regressions is 167
For the regression, the dummies of participation in and exposure to FFS
and those independent variables which have significant effect on the
dependent variables (using a stepwise selection procedure) were finally
included. The estimates of the growth rates of the control farmers
(coefficient of constant), the differences of the growth rates between the
graduates and control farmers (coefficient of graduate) and the differences
of the growth rates between the exposed and control farmers (coefficient of
exposed) are reported in Table 3-2.
According to the results of the yield analysis, graduates had a significantly
higher growth rate as compared to the control farmers, while no significant
difference existed between the exposed and control farmers. The non-
significant constant bears a negative sign, which ambiguously indicates that
yields may decrease over time without FFS. The results of the pesticide
cost analysis give evidence to both direct and diffusion effects of FFS. The
change rates of graduates and exposed farmers were significantly different
from control farmers. The coefficient of constant (denoting the growth rate
of control farmers) was positive, indicating that pesticide use in this group
increased during the period under study. Contrarily, the coefficients showed
negative signs for exposed farmers and graduates, indicating that pesticide
cost decreased over time in those two farmer groups. As for the gross
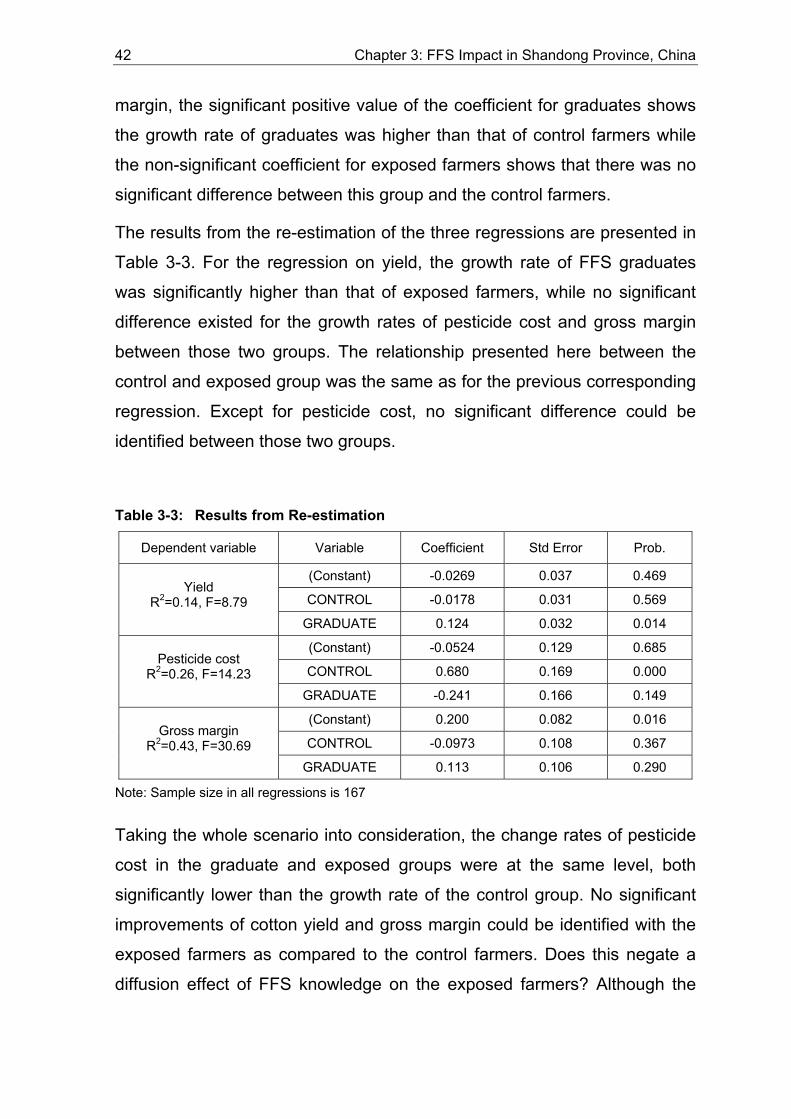
42 Chapter 3: FFS Impact in Shandong Province, China
margin, the significant positive value of the coefficient for graduates shows
the growth rate of graduates was higher than that of control farmers while
the non-significant coefficient for exposed farmers shows that there was no
significant difference between this group and the control farmers.
The results from the re-estimation of the three regressions are presented in
Table 3-3. For the regression on yield, the growth rate of FFS graduates
was significantly higher than that of exposed farmers, while no significant
difference existed for the growth rates of pesticide cost and gross margin
between those two groups. The relationship presented here between the
control and exposed group was the same as for the previous corresponding
regression. Except for pesticide cost, no significant difference could be
identified between those two groups.
Table 3-3: Results from Re-estimation
Dependent variable Variable Coefficient Std Error Prob.
(Constant) -0.0269 0.037 0.469
CONTROL -0.0178 0.031 0.569
Yield
R2=0.14, F=8.79 GRADUATE 0.124 0.032 0.014
(Constant) -0.0524 0.129 0.685
CONTROL 0.680 0.169 0.000
Pesticide cost
R2=0.26, F=14.23 GRADUATE -0.241 0.166 0.149
(Constant) 0.200 0.082 0.016
CONTROL -0.0973 0.108 0.367
Gross margin
R2=0.43, F=30.69 GRADUATE 0.113 0.106 0.290
Note: Sample size in all regressions is 167
Taking the whole scenario into consideration, the change rates of pesticide
cost in the graduate and exposed groups were at the same level, both
significantly lower than the growth rate of the control group. No significant
improvements of cotton yield and gross margin could be identified with the
exposed farmers as compared to the control farmers. Does this negate a
diffusion effect of FFS knowledge on the exposed farmers? Although the

Chapter 3: FFS Impact in Shandong Province, China 43
curriculum was designed as straightforward as possible, it was obviously
easier for neighbours of graduates to reduce pesticides than to acquire the
capability of ecosystem analysis and better decision-making and thus
achieve higher growth rates of yield and gross margin. It might just take
more time for exposed farmers to observe, practice and then master such
skills. Thus, despite the non-significant coefficients, the positive sign of the
coefficients for the exposed farmers in Table 3-3 is meaningful since it
shows the correct “direction” and permits prospects for future improvement.
3.6 Conclusion and Recommendations The empirical results from the analyses above provide evidence of
significant impacts of FFS on graduates’ performance. For exposed
farmers, diffusion effect on pesticide use was apparent and desirable
tendencies were also noticeable with regard to yield and gross margin.
Based on these findings, it is reasonable to conclude that in the Lingxian
case, IPM-FFS presents an effective approach for technical extension and
can contribute to the objective of achieving sustainable, profitable and
environmentally sound crop production.
Even though encouraging results for FFS were reported in this study, it is
risky to extrapolate the findings. Being of case study character, this study
has of course limitations that could be overcome by following the
recommendations listed below:
1. A much larger sample of FFS is needed. This paper is based on only 3
FFS villages, which is obviously insufficient for strong conclusions. To
get more general results, a much larger sample (include more villages)
of different FFS is crucial.
2. Additional village and township level information is needed. Although it
might have little influence on the results in this specific case, for a
rigorous analysis, it is indispensable to account for village or township
44 Chapter 3: FFS Impact in Shandong Province, China
characteristics. Information like wells for irrigation, access to schools and
road quality should be supplemented.
3. Long-term impact assessment is needed. This paper presents results of
a “short run” analysis that does not yield information on what the impact
will be in the long run. To capture the long-term impact of FFS training,
data from an additional sampling (several years after the training
intervention) is required.
References
Feder G., R. Murgai & J. Quizon (2004): “Sending Farmers Back to School: The Impact of Farmer Field School in Indonesia”. Review of Agricultural Economics 1:45-62.
Godtland E., E. Sadoulet, A. de Janvry, R. Murgai & O. Ortiz (2004): “The Impact of Farmer Field School on Knowledge and Productivity: A Study of Potato Farmers in the Peruvian Andes”. Economic Development and Cultural Change 53(1): 63-92.
Praneetvatakul S. & H. Waibel (2002): “A Socio-economic Analysis of Farmer Field Schools (FFS) implemented by the National Program on Integrated Pest Management of Thailand. Paper Presented at the CYMMIT Impact Assessment Conference. San Jose, Costa Rica.
Jiang R. & Liang D. (1997): “Companion on Rice IPM-FFS in China”. Beijing: China Scientific Publishers.
van den Berg H (2004): “IPM Farmer Field Schools: A Synthesis of 25 Impact Evaluations”. Global IPM Facility, Rome.

4 Impact of an FFS-based IPM Approach on Farmer Capacity, Production Practices and Income: Evidence from Pakistan
Muhammad Azeem Khan1, Iftikhar Ahmad2 and Gerd Walter-Echols3
4.1 Background Pakistan is the world’s fourth largest producer of cotton and a major
exporter. Cotton is grown largely in Punjab and Sindh Provinces. The
majority of cotton farmers are smallholders and there are many tenant
cotton-growing households meeting only bare minimum household
sustenance needs. Pest outbreaks during the early 1990’s have enhanced
pesticide-based farming. Also, the liberalization of generic pesticide import
has resulted in a many-fold increase of pesticide use. However, this has
neither increased cotton productivity nor the prosperity of the poor cotton
growers (Poswal and Williamson, 1998; and Ahmad and Poswal, 2000).
In Pakistan, research and development in IPM was initiated in the 1970’s.
However, efforts to implement IPM at the farm level were not very
successful. Pesticides became a major instrument of production leading to
a ‘pesticide treadmill’ situation (Irshad, 2000). An analysis of pesticide
policies through the UNDP-FAO Policy Reform Project paved the way for
the establishment of a National IPM Programme and provided instruments
to scale up farmer-led IPM through joint international and national efforts on
various fronts. A pesticide policy study estimated environmental and social
cost of pesticides in Pakistan at US$ 206 million per year (UNDP, 2001).
About 49% of these external costs were attributed to pest resistance
problems, while 29% to loss in bio-diversity, and nearly 20% occurred to
human and animal health. On the other hand, damage prevention
1 Principal Scientific Officer, National IPM Programme, National Agricultural Research Center,
Park Road, Islamabad, Pakistan 2 Deputy Director General/National IPM Coordinator, Institute of Plant and Environmental
Protection, National Agricultural Research Center, Park Road, Islamabad, Pakistan 3 formerly Environmental Impact Expert, FAO-EU IPM Programme for Cotton in Asia, FAO
Regional Office for Asia and the Pacific, Bangkok, Thailand

46 Chapter 4: FFS Impact in Pakistan
expenditures for residue monitoring and raising public awareness on the
dangers of pesticides is less than 2% of the total social costs of pesticides.
The study indicated that over- and misuse of pesticides has led to
tremendous economic losses and hazards to human health (Azeem, 2000;
Feenstra et al., 2000; Orphal, 2001; and Ahmad et al., 2001). The results of
the pesticide policy analysis and the onset of the FAO-EU IPM Programme
for Cotton in Asia led to the establishment of a National IPM Programme of
Pakistan in December 2000. During 2001, Training of Facilitators (ToF) and
Farmers Field School (FFS) activities were implemented in the cotton
growing areas of Sakrand and Khairpur Districts of Sindh Province, which
was expanded to other areas and provinces, i.e. Punjab and Balochistan.
The FFS approach aims at generating a deeper understanding of the
important interactions of agro-ecosystems as well as on a sustainable
farming, with particular emphasis on the reduction of chemical pesticide use
(Berg et al., 2004). A change in crop management practices of FFS farmers
is expected as a result from this training process. Discovery based learning
methodologies used for the training are expected to foster experimental and
analytical capacities of FFS farmers for making rational decisions under
complex and changing circumstances. Each FFS participant learns
improved crop management skills through group activities by attending
around 22 FFS sessions. The ultimate purpose of this rigorous training is to
achieve a significant improvement in the crop and pest management
knowledge and practices of the FFS farmers. The community neighbours of
the FFS participants are expected to benefit indirectly through knowledge
spill-over. The purpose of this study was fourfold:
i. To measure changes in farmers beliefs, attitude and decision making capacities for a sustainable use of IPM practices
ii. To determine to what extent farmers retained the FFS training knowledge
iii. To assess farmers ability to practice skills they learned in the FFS
iv. To quantify the income effects from FFS training

Chapter 4: FFS Impact in Pakistan 47
4.2 Methodology Sample Area and Size
IPM impact assessment was conducted in the cotton growing areas of
Sindh Province. Khairpur District in northern Sindh was purposively
selected over Nawabshah District because of the presence of a large
number of small and tenant farming communities and increasing pesticide
use scenarios. The low income and high poverty profile was another factor
behind this selection.
At a second stage, 4 FFS villages were selected from four different clusters
of FFS situated in 4 adjacent Tehsils. Finally, 4 control villages within a 20
km radius were selected in the adjoining Sukkur District, which were nearly
60 kilometer away from the nearest FFS project areas of Khairpur District.
The list frame on structural and operational variables including farmers’
age, education, farm size, cotton area and irrigation sources was developed
to determine similarities in the overall profile of project and control area
farms as cautioned by Casely and Kumar (1987).
About 100 FFS-participating farmers (all 25 farmers per FFS), 60 non-FFS
(15 from each FFS village) from 4 IPM villages and 60 control farmers from
4 non-IPM villages (15 farmers per village) were interviewed.
Data Collection and Transformations
The baseline survey was conducted during July 2002 immediately after the
formation of the FFS training groups and information was collected about
the 2001 cotton crop. The post FFS-impact survey was conducted during
the 2003 cotton season through multiple visits in three rounds. A set of both
qualitative and quantitative impact assessment indicators was determined
for data collection (Guijt, 1998; Abbot and Guijat, 1998).
A biodiversity score was derived from responses to questions on crop
losses estimated by the farmers. Scoring of the attitude towards the

48 Chapter 4: FFS Impact in Pakistan
environment was done based on six statements, which indicated the extent
of agreement of respondents. These statements, which were weighted
included belief in cultural and biological methods of crop protection,
consideration of pesticide use as sole crop protection solution, perceptions
on biodiversity losses, understanding on pesticide threat to natural
environment, know-how on pesticide hazards to all living organisms, and
beliefs on health risks of spraying.
Scoring on field experimentation skills was assessed through giving weights
(see number in parentheses) to experimentation initiatives undertaken by
farmers including early planting (10), late planting (10), trap crops (20),
change in variety (20), physically controlling pests (10) and experimentation
on pesticide chemical alternatives such as water spray, plant extracts
sprays, detergent spray etc (30). The decision-making empowerment
scoring was performed on using different decision aids like self-conducted
ecosystem analysis including pest scouting (40), consulting fellow farmers
(20), relying on own knowledge (10), reading labels (20) and
watching/listening agriculture programme on TV and radio (10), and
understanding the relationship between health problems and pesticide use
(10).
Social recognition of the farmers was assessed through assigning different
scores for contacting farmers for discussion on social and technical matters,
which was categorized as contacted by less than 5 farmers (10), contacted
by 5 to 10 farmers (20) and contacted by more than 10 farmers (40), office
bearer (20) and just member (10) of a farmer group.
Analytical Methods
Beside single difference comparisons of change in production practices
between trained and non-trained farmers, the difference in difference (DD)
method (Feder et al., 2003) was used for comparisons among FFS farmers,
exposed farmers and un-exposed farmers from control villages. As a first

Chapter 4: FFS Impact in Pakistan 49
explorative step, group means of relevant economic parameters were
compared by using T-test for the before-after comparison and using F-test
for the between-group comparison (Praneetvatakul and Waibel, 2001). The
DD method was used to compare mean, standard deviation and paired
T-test statistics to test for differences in gross margin, production practices
and input use level among IPM, non-IPM and control farms. Variable inputs
were valued based on market prices. Opportunity costs were estimated for
the operations performed by own farm machines, family labour and farm
inputs (farm yard manure and seed). Monetary costs arise for inputs such
as fertiliser, herbicide, insecticide, fuel, improved seed, casual hired labour,
picking and transplanting. The cotton activity’s gross margin is estimated as
the difference between per-unit revenue and total variable input costs.

50 Chapter 4: FFS Impact in Pakistan
4.3 Results Differences in Capacity Building
Table 4-1 shows performance parameters in terms of human capacity
aspects of farmer training. The separate before-after comparison among
the three farmer groups indicates that in general FFS training has enhanced
the human capacity of the participants. The F-values showed significant
differences in all variables after the training. While for three out of five
variables such differences existed already before the training the level of
significance was higher after the training. Also, the mean scores of FFS
farmers increased for all variables, in some cases it doubled. This was
different for control farmers where the change was small and in some cases
even negative. The same pattern of before-after difference observed for the
control group could be observed for the exposed farmers (Non-FFS)
indicating that enhancement of human capacity is depended on training
participation and is not likely to spread by other communication channels.
To better illustrate the differences in the human capacity performance
parameters as indicated in Table 4-1 paired comparisons were undertaken
for the three groups of farmers before and after the training. Results are
shown in Table 4-2. Furthermore, the respective before and after
differences were compared between FFS and control as well as Non-FFS
and control. These comparisons demonstrate the positive change for FFS
farmers while the differences were comparatively small and highly variable
between the two other groups.

Table 4-1: Change in the Human Capacities for Practice Changes
Decision making skill
score [%]
Field experiments
Score [%]
Observed biodiversity score [%]
Attitude towards
environment score [%]
Social Recognition Year Types N
Mean SD Mean SD Mean SD Mean SD Mean SD FFS 78 16.0 11.1 11.03 14.6 52.44 16.69 37.95 21.82 14 13.9 Non-FFS 59 10.3 8.3 7.80 12.7 51.19 19.48 36.10 22.82 9 10.5 Control 53 14.9 10.3 5.28 11.7 45.66 12.25 33.77 18.83 7 8.1 Overall 190 13.9 10.3 8.42 13.4 50.16 16.71 36.21 21.32 10 11.8
2001
Sig. 0.004 0.050 0.063 0.548 0.002 FFS 78 34.5 25.4 15.26 15.5 72.05 14.80 75.90 32.85 27 27.9 Non-FFS 59 9.5 12.7 11.19 14.9 54.75 17.87 39.15 33.44 8 15.8 Control 53 9.4 10.8 6.79 12.7 46.32 18.06 29.81 19.46 8 19.2 Overall 190 19.7 22.3 11.63 14.9 59.50 19.94 51.63 36.22 16 24.3
2003
Sig. 0.000 0.006 0.000 0.000 0.000
Table 4-2: Difference of Difference Estimates of the Qualitative Attribute of Farmers’ Education that Contributes Towards Changes in Production
Pre/post FFS Diff. FFS vs Control Non-FFS vs Control FFS Non-FFS Control Pre Post Diff. Pre Post Diff.
Decision making score 18 (27) -1 (13) -5 (13) 1 25 24 -5 0 5 Experimentation score 4 (18) 3 (20) 2 (18) 6 8 2 3 4 1 Biodiversity score 20 (20) 4 (26) 1 (21) 6 26 20 5 9 4 Attitude score 38 (34) 3 (32) -4 (23) 4 46 42 2 9 7 Social recognition score 14 (26) -1 (17) 2 (22) 7 19 12 2 0 -2 Note: Figures in parenthesis are Standard Deviations

52 Chapter 4: FFS Impact in Pakistan
Practice Differences
Following the concept of human capacity variables the same comparisons
were undertaken for input use and production practices. Table 4-3 shows
that before FFS training no significant difference among the three groups of
farmers existed in seed management and in the time spend on field
observations. This had changed after training. Control farmers tended to
overuse seeds while both FFS and Non-FFS farmers remained at
reasonable levels. Excessive use of seeds is often a response of farmers to
control weeds although the effect of this practice is questionable. Most
importantly, FFS farmers significantly increased the time spend on field
observation as compared to the other two groups. This illustrates that one
of the main messages of the training, i.e. to regularly observe the cotton
field was taken up by the participants.
No practice change however was observed in fertilizer management. The
significant difference that had existed before the training had disappeared in
2003. In irrigation management results also reversed, i.e. there was a
significant difference before the training but there was none in 2003. This
could be attributed to change in microclimatic factors and is not necessarily
associated with the training.
Application of irrigation was almost identical in absolute terms, but varied in
relation to timing and volume of application.
The paired comparisons make the changes after the training more
transparent (Table 4-4). For example, also Non-FFS farmers have
increased the time spend on field observations suggesting some diffusion
effect. Comparing these differences for FFS and Control shows that
material inputs among FFS farmers declined relative to the control farmers.
Also, the differences were generally larger as those between Non-FFS and
Control. The most pronounced change as indicated above was in the time
spent on field observations.

Table 4-3: Input Use and Field Management Practices Before and After FFS Training Seed
[kg/ha] N fertilizer
[kg/ha] P fertilizer
[kg/ha] No. of
Irrigations Field Observation
[hrs/season] Year Types N Mean SD Mean SD Mean SD Mean SD Mean SD
FFS 78 21 6 181 51 52 19 9 4 36 66 Non-FFS 59 21 6 171 47 54 24 9 5 32 53 Control 53 23 3 228 65 67 24 6 2 17 18 All Farmers 190 22 5 191 59 57 23 8 4 29 53
2001
Sig. 0.108 0.000 0.000 0.006 0.117 FFS 78 23 8 197 66 45 30 8 3 66 60 Non-FFS 59 23 8 184 57 49 35 8 3 44 50 Control 53 31 9 279 86 89 52 8 2 16 14 All Farmers 190 25 9 216 80 59 43 8 3 45 52
2003
Sig. 0.000 0.000 0.000 0.928 0.000 2003 FFS plot 26 18 10 85 47 13 10 6 4 145 49
Table 4-4: Paired Difference in Production Practices by Farmer Group Pre/post FFS Diff. FFS vs Control Non-FFS vs Control FFS Non-FFS Control Pre Post Diff. Pre Post Diff. Seed Rate [kg/ha] 1.4 (6.5) 1.8 (7.9) 7.8 (9.1) -1.53 -7.97 -6.44 -1.82 -7.82 -6 N [kg/ha)] 16.3 (81) 13.3 (65) 51.5 (91) -46.96 -82.2 -35.24 -57.28 -95.48 -38.2 P [kg/ha] -7.5 (31) -4.3 (37) 22.4 (54) -14.97 -44.8 -29.8 -13.2 -39.9 -26.7 Field Observations [hrs/ha] 29.7 (85) 12.4 (65) -0.8 (21) 19 49 30 15 28 13
Note: Figures in parenthesis are Standard Deviations

54 Chapter 4: FFS Impact in Pakistan
Difference in Pesticide Use
Pesticide use is a major variable in the assessment of FFS training.
Therefore, detailed account of pesticide use practices was taken before and
after the training. As shown in Table 4-5 there was a significant difference in
the total number of pesticide applications before the training. Control
farmers were those with the highest application frequency. In terms of
pesticide quantity used, FFS farmers had the highest input among the three
groups of farmers. However, looking at the distribution during the season no
clear pattern of differences can be observed.
As the year 2003 was wet and had pest outbreaks at the boll formation
stages, pesticide use had increased on all types of sample farms during this
crop stage. While FFS farmers also sprayed more during this period the
increase was smaller than for the two other groups of farmers. This
indicates that FFS farmers have gained confidence from conducting their
field observations.
As shown in Table 4-6, pesticide use of FFS farmers declined for both
frequency and dosage while this was only the case for pesticide dosage for
Non-FFS farmers. Again, the differences were more pronounced when
comparing FFS and Control versus Non-FFS and control farmers. These
differences in the number and dosage of pesticide application can be
explained with a better understanding of the pest situation in the field by the
trained farmers.

Table 4-5: Pesticide Use in Terms of Number per Season and Doses at Different Crop Growth Stages
Pesticide applications
Total Pesticide
Doses [ml/ha]
Vegetative stage
applications
Flowering stage
applications
Boll stage
applications Year Types N
Mean SD Mean SD Mean SD Mean SD Mean SD FFS 78 4.33 1.34 8371 2944 1.17 0.61 1.08 0.58 1.88 1.13 Non-FFS 59 3.85 1.68 7482 2768 1.10 0.64 0.97 0.56 1.58 1.16 Control 53 5.15 1.26 6986 1877 1.89 0.85 1.13 0.59 2.08 1.27 Overall 190 4.41 1.51 7709 2683 1.35 0.77 1.06 0.57 1.84 1.19
2001
Sig. 0.000 0.010 0.000 0.291 0.078 FFS 78 3.76 1.93 4927 3095 0.17 0.44 0.73 0.75 2.62 1.68 Non-FFS 59 4.22 2.07 6122 4557 0.25 0.60 0.69 0.79 3.05 1.63 Control 53 6.21 1.78 9299 3658 0.64 0.76 1.26 0.68 4.30 1.61 Overall 190 4.58 2.18 6518 4150 0.33 0.62 0.87 0.78 3.22 1.78
2003
Sig. 0.000 0.000 0.000 0.000 0.000
Table 4-6: Paired Difference Comparisons for Pesticide Usage Pre/post FFS Diff. FFS vs Control Non-FFS vs Control FFS Non-FFS Control Pre Post Diff. Pre Post Diff. Insecticide [No/season] -0.6 (1.9) 0.3 (1.7) 1.1 (2.0) -1.02 -2.68 -1.66 -1.44 -2.21 -0.77
Insecticide dose [kg/ha] -3495 (3642) -1524 (4300) 2312 (3633) 1 -4.8 -5.8 0.2 -3.6 -3.8
Note: Figures in parenthesis are Standard Deviations

56 Chapter 4: FFS Impact in Pakistan
Gross Margin Differences
The comparison of the economic performance of the three groups of
farmers before and after the training is depicted in Table 4-7. No significant
difference in yield and gross margin existed before the training, i.e. during
crop year 2001. However, for pesticide and fertilizer costs such differences
existed. Performing the same tests after the training showed that for all
parameters group differences were significant. The data show that 2003
was a year with low yields. This was mainly related to high pest infestation
and excessive vegetative growth.
Table 4-8 portrays the differences for yields and gross margins more
clearly. Even though yields declined for all three groups the gross margin of
FFS farmers increased. FFS farmers experienced relatively lower reduction
in cotton yield, while at the same time reducing pesticides and fertilizer
inputs. Table 4-8 further shows that for FFS farmers the positive gross
margin difference was more pronounced among smaller farmers. Similar to
the previous performance parameters the difference between FFS farmers
and control farmers was higher and more uniform than those between Non-
FFS and Control. While yield difference was negative for the second
comparisons the difference in gross margin was less than one fifth of the
difference between FFS and Control (see Table 4-8).

Table 4-7: Cotton Yields, Revenue, Gross Margin and Cost Comparisons
Yield (kg/ha) Revenue (US$/ha) Gross Margin (US$/ha)
Pesticide cost (US$/ha)
Fertilizer cost (US$/ha) Year Types N
Mean SD Mean SD Mean SD Mean SD Mean SD FFS 78 2137 697 708 237 140 218 74 31 94 38 Non-FFS 59 1985 754 671 260 125 244 72 37 95 34 Control 53 2111 687 694 240 50 286 144 207 121 39 Overall 190 2083 712 693 245 111 248 93 117 102 39
2001
Sig. 0.444 0.686 0.107 0.000 0.000 FFS 78 1487 393 925 248 391 267 48 37 105 38 Non-FFS 59 1079 373 660 223 151 250 61 48 100 46 Control 53 1242 552 688 335 25 320 123 66 160 59 Overall 190 1292 469 777 294 215 317 73 59 119 54
2003
Sig. 0.000 0.000 0.000 0.000 0.000 2003 FFS plot 26 1482 563 941 369 513 322 000 000 38 28
Table 4-8: Differences of Difference Estimates for Crop Production and Income Pre/post FFS Diff. FFS vs Control Non-FFS vs Control FFS Non-FFS Control Pre Post Diff. Pre Post Diff. GM [US$/ha] 251 (338) 26 (337) -25 (380) 90.09 366.26 276.17 75.08 126.24 51.16 Yield [kg/ha] -650 (771) -906 (837) -869 (735) 25.73 245.27 219.54 -125.47 -162.52 -37.05 GM [<2 ha farmer] 322.0 (355) 0.1 (339) 62.0 (344) 0 414 414 66 158 92 GM [>4 ha farmers] 211 (418) 133 (209) -6 (441) 158 376 218 -55 85 140
Note: Figures in parenthesis are Standard Deviations

58 Chapter 4: FFS Impact in Pakistan
4.4 Conclusions and Recommendations FFS-type farmer education implemented in Pakistan has provided farming
communities with opportunities to learn in a participatory way. As a result of
the season-long training, farmers’ skills for making rational and informed
decisions were significantly enhanced. Field observation, analysis and
decision making capacities have improved to a greater extent among FFS
farmers. This may have contributed to more cost effective and
environmentally friendly crop management decisions. As shown by the high
input costs, the management of major inputs like seeds, fertilizer and
irrigation scheduling were noticeably neglected at control farms. These
issues have received more attention by the FFS farmers. It is thus plausible
that the difference in gross margins has increased in FFS farms relative to
the non-FFS and especially control farms.
These first results indicate that farmers’ dependence on the use of highly
toxic chemicals can be reduced through training and the adoption of various
cultural and biological methods. However, further analysis and data
collection is warranted to confirm these indicative results. Planning, record
keeping, analysis and interpretation aspects of these experiments by
farmers needs further backup support to strengthen this crucial component
of sustaining IPM practices.
In order to enable farming communities to draw valid conclusions from their
own experimentation as initiated by FFS, a well-planned technical backup
support mechanism should be established. In this context, the integration of
the research system and farming communities in Pakistan is the pre-
requisite to establish a sound foundation for such collaborative
experimentation. At the outset, the researchable issues should be well
conceived during FFS training sessions through asking critical questions on
major differentials in the data generated during agro-ecosystem analyses
(AESA) by the farmers.

Chapter 4: Impact on Farmer Capacity, Production Practices and Income - Pakistan 59
In order to assure that the farmers will sustain FFS activities, farming
communities should be given the right kind of incentives to continue
working as a group. Institutionalised collective action is vital if cotton pest
management in Pakistan is to become safer, more efficient and more
environmentally friendly. Finally, a strategy for transforming the extension
service in Pakistan towards a more participatory and self-reliant system
should be developed.
References
Abbot, J., I. Guijt (1998): Changing Views on Change: Participatory Approaches to Monitoring the Environment. SARL Discussion paper No. 2. International Institute for Environment and Development London.
Ahad, K., Hayat, Y., and Ahmad, I. (2001): Capillary Chromatographic Determination of Pesticide Residues in Multan Division. The Nucleus 38(2): 145-149.
Ahmad, I. and Poswal, A. (2000): Cotton integrated pest management in Pakistan: Current status. Country Report presented in Cotton IPM Planning and Curriculum Workshop organized by FAO, Bangkok, Thailand. February 28-March 2, 2000.
Azeem, M. (2000): Economics Evaluation of Pesticide Externalities in Cotton Zones of Punjab Pakistan, Report for the UNDP study, FAO, Rome, Italy
Berg H.v d., Oooi P.A.C., Hakim A.L., Ariawan H. and Cahyana W. (2004): Farmer Field Research: An Analysis of Experices in Indonesia, FAO-EU Programme for Cotton in Asia, Regional Office of Asia and the Pacific Bangkok.
Casley, D.J., K. Kumar (1987): Project Monitoring and Evaluation in Agriculture. The John Hopkins University Press, Baltimore, London.
Emerson, R. W. (1990): Essays: First and Second Series. New York, Vintage Books.
FAO, (2002): From Farmer Field School to Community IPM: Ten Years of IPM in Asia (Editors: Pontius J., Dilts R. and Barlett A..) FAO regional office for Asia and Pacific, Bangkok.
FAO (2004): Environmental Education for Poor Farmers (Eds: Ooi P. A. A., Walter-Echols, G., Weidong, D., Abubakar, A. L. M., Soon, L. G. Pachagounder, P., Soomro, M. H., Galvan, C., Mancini, F., Peterson, R. and Kamp, K.). FAO regional office for Asia and Pacific, Bangkok.
Feder G., Murgai R. and Quizon J. B. (2003): Sending Farmers Back to School: The Impact of Farmer Field Schools in Indonesia, Review of Agricultural Economics-Volume 26, Number 1-Pages 1-18.

60 Chapter 4: FFS Impact in Pakistan
Feenstra S., Jabbar A., Masih R. and Jehangir W. A. (2000): Health Hazards of Pesticides in Pakistan, IWMI and PARC, Islamabad
Guijt, I.(1998): Participatory Monitoring and Impact Assessment of Sustainable Agriculture Initiatives--An introduction to the Key Elements. SARL Discussion Paper No. 1. International Institute for Environment and Development, London
Irshad, M. (2000). Status of pesticide resistance in Pakistan. Consultancy Report submitted to FAO under Project No. PAK/99/002, FAO Pakistan, Islamabad.
Orphal, J. (2001): Economics of Pesticide Use in Cotton Production in Pakistan, Diploma Thesis, University of Hannover, Germany
Praneetvatakul, S. and H. Waibel (2001): A Socio-economic Analysis of Farmer’s Drop-out from Training Programs in Integrated Pest Management. Paper presented at the workshop on “Participatory Technology Development and Local Knowledge for Sustainable Land Use in Southeast Asia”, 6-7 June 2001, Chiang Mai, Thailand.
Poswal, M.A. and Williamson, S. (1998): Stepping off the cotton pesticide treadmill: Preliminary findings from a farmer’s participatory cotton IPM training project in Pakistan. CABI Bioscience Centre, Rawalpindi.
Ross, L. and M. R. Lepper (1980): The perseverance of beliefs: Empirical and normative Considerations. New directions for methodology of behavioral science: Fallible Judgment in behavioral research. R. A. Shweder. San Francisco, Jossey-Bass:17-26.
UNDP (2001): Policy and Strategy for the Rational use of Pesticides in Pakistan, Building Consensus for Action, UNDP/FAO Paper Rome, Italy
Wason, P. C. (1960): On the failure to eliminate hypotheses in a conceptual task. Quarterly Journal of Experimental Psychology 12: 129-140.

5 Impact of Farmer Field School Approach on Acquisition of Knowledge and Skills by Farmers about Cotton Pests and Other Crop Management Practices - Evidence from India
S. Venku Reddy1 and M. Suryamani2
5.1 Introduction Background
In India, cotton is one of the most important agricultural commodities in the
country, but the area has declined since the early to mid nineties. The main
reason for this reduction was an increased cost of cultivation, particularly
due to the heavy use of pesticides. Recognizing the drawbacks of over-
dependency on chemical pesticides, integrated pest management (IPM) is
considered as an alternative.
The Food and Agriculture Organization of the United Nations (FAO) has
supported IPM training through farmer field schools (FFS) under the FAO-
EU Cotton IPM Programme in Asia since June 2000. One of the objectives
of FFS training is to build human capacity especially in knowledge and skills
and bring about behavioural changes in the use of chemical pesticides
through discovery-based learning. The state governments of Karnataka and
other states in India are interested to replicate the FAO model if shown
successful. Hence, this study was conducted to investigate the extent of
knowledge gains and the acquisition of skills and improved performance of
crop management practices.
1 formerly Professor of Agricultural Extension, ANGR Agricultural University; Agricultural Extension
Services Advisor, Govt of Uganda and Consultant,, World Bank; presently Executive Director, Participatory Rural Development Initiatives Society (PRDIS), Basheerbagh, Hyderabad, India
2 Associate Professor, ANGR Agricultural University and Consultant, PRDIS, Hyderabad, India

62 Chapter 5: FFS Impact in India
Objectives of the Study
i) To measure changes in the knowledge of farmers about cotton pests
and other management practices as a result of IPM-FFS.
ii) To identify changes in the acquisition and performance of diagnostic and
other management skills of farmers through IPM-FFS
5.2 Methodology Study Design
A before and after, with and without i.e. double delta (DD) design was
followed for the present study. Five FFS villages from two districts i.e.
Raichur and Bellary of Karnataka State were selected for the investigation.
In addition, another five villages having at least a distance of 30 km from
the FFS village as well as a sufficient number of cotton growing farmers
were selected as control villages.
Selection of Respondents
For the baseline sample, 97 farmers who regularly attended FFS training in
2001 were selected and interviewed about their 2000 cotton cultivation
practices. In addition, 97 non-FFS (NFFS) farmers from the same villages,
and 97 farmers from control villages, all with matching characteristics such
as age, education and landholding as the FFS respondents, were sampled.
Because of a late onset of monsoon rains in 2002, not all baseline farmers
planted cotton in the year after attending a FFS. Therefore, only 97
(37 FFS, 30 NFFS and 30 control) farmers could be included in the impact
study.
Data Collection Methods
For measuring the respondents’ knowledge, a testing schedule was
developed which included knowledge items about pests, diseases, natural

Chapter 5: FFS Impact in India 63
enemies, pesticides, ecosystem information, pest management and other
crop management practices. The total scores on the knowledge items were
computed for each respondent and classified as high, medium or low
knowledge levels according to exclusive class intervals. In addition, a
differentiated content (item) analysis of the knowledge was conducted to
draw meaningful conclusions.
Skills are understood as practiced abilities or efficient ways of performing a
practice. The skills investigated in the study were both complex (difficult to
practice) and simple (easy to practice). Simple skills were measured by
identifying the degree of the farmer’s confidence. The extent of confidence
expressed by respondents in performing various management skills were
rated as ‘fully confident’, ‘partially confident’ or ‘not confident’. If
respondents were fully confident in performing a skill, a score of 2 was
given, ‘1’ if they were partially confident and ‘0’ if they were not confident.
Complex skills were assessed through participatory methods using
transacts, seasonal calendars, ranking methods and Venn diagrams.
Diagnostic skills were tested by showing pictures of particular damage
symptoms, pests or natural enemies, and by observing the diagnostic
capacity and confidence. This was revalidated by use of focused group
discussions and by observing field conditions and farmer’s performance.
Analytical Procedures
Frequency and percentages of the responses were calculated for each of
the three groups of farmers. Respondents were classified into various
categories i.e. low to high knowledge levels and performance of skills.
T-tests were used to determine the significance of differences among the
three categories (FFS, NFFS and control groups) before and after the FFS
training. The correlation coefficients (r values) were calculated to find out
the association between knowledge and skills with regard to the adoption of
practices.

64 Chapter 5: FFS Impact in India
5.3 Results and Discussion
5.3.1 Changes in Knowledge Knowledge of Cotton Pests, Diseases, Natural Enemies and Ecosystem
As shown in Table 5-1, the majority of the FFS and NFFS farmers were in
the category of medium knowledge before the training started, whereas the
control group had low knowledge about cotton pests & diseases. After the
training, 27 percent of the FFS farmers moved from low/medium knowledge
categories to the high knowledge category. There were no ‘high knowledge’
scores among NFFS and control farmers and only modest overall gains. A
graphic representation is given in Figure 5-1.
The content analysis indicated that before training, the majority of
respondents expressed that pesticides were always essential to get higher
yields (83%); that mixing chemicals would effectively control the pests; and
that pesticide applications always protects the crop from pest damage. After
the training, the percentage of respondents having such opinion was less.
Besides, FFS farmers’ understanding of the life cycle of pests and nature of
damage was better compared to other groups. While before the training, all
the respondents had no knowledge about the effect of pesticides on
livestock and birds nor about agro-ecosystem and its analysis, a large
majority of FFS farmers gained such knowledge during the FFS training.
Furthermore, it was also observed that there was a statistically significant
gain in knowledge about pests and diseases in the FFS group after training
as revealed by t-tests. There were also significant differences in the
knowledge among the three groups before and after training. Further
content analysis could help identify areas of more emphasis in the
curriculum.

Chapter 5: FFS Impact in India 65
CHANGES IN KNOWLEDGE OF COTTON PESTS AND OTHER MANAGEMENT PRACTICES
0,0020,0040,0060,0080,00
100,00
FFS NFFS CONTROLCATEGORY
SC
OR
ES
PREPOST
Figure 5-1: Graphic Representation of Changes (Gain) in Overall Knowledge
Knowledge of Cotton Pest Management Practices
As presented in Table 5-1, all baseline respondents were in the category of
low-level knowledge about pest management practices. After training, 41
percent of FFS and 3 percent of NFFS farmers moved from low to medium
level of knowledge, indicating that most of FFS and some of the NFFS
respondents had improved their knowledge about pheromone traps and
their use, yellow sticky traps, bird perches, Trichogramma, use of NPV and
neem products, roughing of affected plants, stage of detopping, crop
residue destruction, and collection and destruction of fallen and damaged
fruiting bodies. There was no change in the control group. However,
comparisons of mean scores indicate more knowledge gains among FFS
farmers than in NFFS and control groups after training. There was no
significant difference between FFS and NFFS groups regarding knowledge
on pest management before the training whereas there was a significant
difference between FFS and NFFS after training. A close examination of the
reasons why the majority of FFS farmers fell into the medium knowledge
category revealed that they did not have sufficient knowledge about the
rationale behind the use (why and how aspects) of the practices and
products.

Table 5-1: Change in Knowledge of Respondents towards different Aspects of Cotton IPM and Production Practices through FFS.
FFS (N=37) NFFS (N=30) CONTROL (N=30) Category Before After Before After Before After
Cotton pests & diseases, natural enemies and ecosystem Low knowledge (1-26) 8 2 30 16 60 53Medium Knowledge (27-52) 92 70 70 83 40 47High knowledge (53-78) 0 27 0 0 0 0Total score 1823 1765 936 977 790 835Mean 35.74 47.70 31 33 26 28SD 7.41 8.93 7.8 7 10 9 t`value 6.76** 0.76 NS 0.701 NS Pest management practices Low (1-13) 100 59 100 97 100 100Medium (14-26) 0 41 0 3 0 0High (27-39) 0 0 0 0 0 0Total scores 165 467 113 184 63 117Mean 5 13 4 6 2 4SD 2 3 2 3 3 2 t`value 13.20** 3.81** 2.59** Other crop management practices Low Knowledge (1-11) 63 0 40 0 73 20Medium (12-22) 37 38 60 47 27 60High (23-34) 0 62 0 53 0 20Total score 354 862 336 650 259 518Mean 9.57 23.30 11.20 21.67 8.63 17.27SD 4.17 5.27 4.32 1.69 4.44 5.82 t`value 15.49** 7.89** 10.01** Cotton pests & diseases, natural enemies and ecosystem: F` Value among FFS, NFFS and Control groups before training 10.4**, after training 59.1** Pest management practices: F ValueFFS, NFFS and Control groups before trainig 7.4**, after training 86.8** Other Management practices: F Value FFS, NFFS and Control groups before training 2.7*, after training 9.3** *Significant at 5% level ** Significant at 1% level.

Chapter 5: FFS Impact in India 67
Knowledge of Other Crop Management Practices
Regarding other crop management practices, 63 percent of FFS farmers,
40% of NFFS and 73% of control group fell into the low knowledge category
in the baseline. After FFS training, 62% of FFS and 53% of NFFS farmers
moved from the low to the high knowledge group. It must be noted that the
knowledge on other crop management practices of the control group also
increased significantly after the training. This might be due to external
interventions. However, the knowledge score as well as the increase in
knowledge of the FFS group was significantly higher than that of the control
farmers. The content analysis indicated that more FFS farmers became
knowledgeable about trap cropping, use of manures, nitrogen management,
summer deep ploughing, etc. which were directly related to IPM. A similar
trend was also observed among NFFS farmers indicating a diffusion effect.
Further analysis through F-tests indicates that there were significant
differences among FFS, NFFS and control groups with respect to changes
in knowledge on other crop management practices.
Changes in Overall Knowledge Level
Table 5-2 shows the changes in overall knowledge of respondents towards
cotton pests and other crop management practices.
Table 5-2: Changes in Overall Knowledge of Respondents About Cotton Pests and Other Crop Management Practices (all knowledge item scores in percentages)
Category FFS (N=37) NFFS (N=30) Control (N=30) Before After Before After Before After Low knowledge 8.10 0.00 16.66 0.00 56.66 13.34 Medium knowledge 91.90 13.51 83.34 83.34 43.34 83.33 High knowledge 0.00 86.49 0.00 16.66 0.00 3.33 Mean 49.77 83.62 46.15 60.38 37.05 48.98 SD 10.57 12.86 11.28 10.56 15.60 11.01 t-value 15.831** 5.397* 5.077*
** Significant at 1 percent level ; * Significant at 5 percent level

68 Chapter 5: Impact on Knowledge, Skills and Crop Management Practices - India
In Table 5-2, comparisons of mean scores of overall knowledge items
indicate higher knowledge gains among FFS farmers (33.9) than NFFS
(14.2) and control groups (11.9). The difference of differences between FFS
and control groups amounts to 21.92 whereas the difference between
NFFS and control was only 2.3. The difference of differences between
control adjusted FFS and control adjusted NFFS scores was 20. This trend
is attributed to limited diffusion of knowledge from farmer to farmer and the
influence of cotton technology mission demonstrations on IPM undertaken
in the study area. There was also a significant difference among the FFS,
NFFS and control groups regarding overall knowledge of cotton pests and
other crop management practices.
Knowledge vs. Adoption
In the sample there was a highly significant correlation between the
knowledge on pest management and the adoption of IPM practices (r value
of 0.76, significant at the 1% level). Also, there was a significant correlation
between the knowledge on other crop management and the adoption of
IPM practices (r value of 0.32, significant at the 1% level). Adoption scores
were quantified based on the number of practices adopted by the farmers.
The correlation between knowledge and adoption shows that knowledge of
pest management and other crop management practices was significantly
correlated with adoption across all groups. This shows that knowledge is a
prelude to the adoption of improved practices. On the other hand, the
correlation values between knowledge and other independent variables like
age, education, landholding, and net returns were not significant. Thus FFS
training was successful in imparting knowledge about cotton pests and
production aspects.

Chapter 5: FFS Impact in India 69
5.3.2 Changes in Skills The confidence of skills as expressed by respondents about diagnosing
cotton pests and performing other crop management skills shows
(Table 5-3) that before IPM-FFS training the majority of FFS farmers (70%)
had a low level and 30% a medium level of skills performance.. After FFS
training, 54 percent of the FFS farmers moved from the low to the medium
and high level category, whereas only 37 percent of the NFFS farmers and
7 percent of the control farmers moved to the medium confidence category.
The analysis of variance (F values) indicates that there were significant
differences among FFS, NFFS and Control groups with respect to
confidence levels on pests and other crop management skills. Furthermore,
the t-value indicates that there was no significant difference between NFFS
and Control groups before training whereas a significant difference was
observed after the training.
Table 5-3: Distribution of Respondents According to Their Confidence Levels on
Pests and Other Crop Management Skills (percentages) FFS (N=37) NFFS (N=30) CONTROL (N=30) Category
Before After Before After Before After Low Skills (1-8) 70 16 100 63 100 93 Medium (9-18) 30 60 0 37 0 7 Highly (19-26) 0 24 0 0 0 0 Total score 150 529 6 244 0 125 Mean 4.05 14.30 0.2 8.13 0 4.17 SD 5.18 5.04 0.8 3.35 0 2.119 t`value 9.03** 13.04** 1.57**
Note: F value among FFS, NFFS and Control groups before training 17.1**
F value among FFS, NFFS and Control groups after training 60.0**
* significant at 5% level ** Significant at 1% level
Skills vs. Adoption
Moreover, a correlation in the pests and other crop management skills and
theadoption of IPM practices exists among FFS farmers. The results of the
analysis show, that the pest management skills of FFS farmers are highly
correlated with the adoption of IPM practices (r value of 0.52, significant at

70 Chapter 5: Impact on Knowledge, Skills and Crop Management Practices - India
the 1% level). Also, there was a correlation between the crop management
skills and the adoption of other crop management practices (r value of 0.34,
significant at the 5% level).
The results show that among FFS farmers the levels of confidence about
pest management and other crop management skills were significantly
correlated with the adoption corresponding practices. Conversely, in the
NFFS and control groups the skills were not correlated with adoption.
5.3.3 Content Analysis Content analysis (Table 5-4) of the extent of confidence expressed by the
respondents revealed that NFFS and control group farmers acquired only
simple skills, whereas the majority of the FFS farmers were able to acquire
simple as well as complex skills.

Chapter 5: FFS Impact in India 71
Table 5-4: Extent of Confidence Expressed by the Respondents in Performing Selected Skills on Pests and Other Crop Management Practices (percentages) – Content Analysis
FFS NFFS Controls Skills FC PC NC FC PC NC FC PC NC Simple Skills Detopping Pre Post
30 95
0 5
70 0
7 90
0 10
93 0
0 70
0 20
100 10
Use of pheromone traps Pre Post
41 48
10 47
49 5
0 37
0 40
100 23
0 6
0 27
100 67
Seed treatment Pre Post
22 76
2 8
76 16
0 20
0 23
100 57
0 6
0 13
100 81
Roughing Pre Post
3 54
5 38
92 8
3 43
0 30
97 27
0 0
0 27
100 73
Release of Trichogramma Pre Post
30 54
8 24
62 22
0 10
0 13
100 77
0 0
0 0
100 100
Use of NPV Pre Post
38 43
0 30
62 27
0 10
0 23
100 67
0 0
0 0
100 100
Prep of Neem Products NSK Pre Post
24 38
8 32
68 30
0 3
0 17
100 80
0 0
0 17
100 83
Complex Skills AESA Pre Post
0 8
0 62
0 30
0 3
0 50
100 47
0 0
0 6
100 94
Experiments Pre Post
0 21
0 33
100 46
0 10
0 30
100 60
0 6
0 7
100 87
Communication skills Pre Post
0 11
0 57
100 32
0 0
0 13
100 87
0 0
0 20
100 80
Facilitation skills Pre Post
0 11
0 32
100 57
0 0
0 3
100 97
0 0
0 3
100 97
Diagnostic Skills Pre Post
0 27
8 54
92 19
0 20
0 67
100 13
0 3
0 63
100 34
FC: Fully Confident, PC : Partially Confident, NC: Not Confident
The findings of Table 5-4 were supported and validated by projected and
participatory techniques and observations conducted by the study team.
The findings also showed that the majority of FFS farmers could acquire
complex skills (agro-ecosystem analysis (AESA), diagnosis, experiments,
communication and facilitation skills, etc.) and more than 50 percent of FFS

72 Chapter 5: Impact on Knowledge, Skills and Crop Management Practices - India
farmers were able to make correct pest control decisions based on AESA,
correctly design and interpret simple experimental results, identify more
than 6 pests and an equal number of natural enemies, and had good
communication as well as facilitation skills. In contrast, only about 10 - 15
percent of NFFS farmers were able to perform these skills. However, NFFS
and control farmers learned simple skills such as detopping, rouging, seed
treatment, etc. This indicates that some NFFS and a few control farmers
acquired skills through farmer-to-farmer diffusion.
5.4 Conclusion The study findings revealed that there was significant gain in knowledge
about pests, natural enemies, ecosystem, and pest management and also
in some crop management practices among FFS farmers. However, based
on focused group discussions, there appears to be a need for more
emphasis on the `how` and `why` aspects of technologies in FFS
programmes.
Due to a systematic training approach, the FFS farmers were able to learn
simple as well as complex skills. In contrast, NFFS and control farmers only
learned simple skills through farmer-to-farmer diffusion. The improved skills
enabled the farmers to make cost-effective and environmentally friendly
decisions. This demonstrates the potential of FFS as an extension tool to
impart complex skills, thus contributing towards human capital
development.
Furthermore, the knowledge and skills on pests and crop management
practices were positively and significantly correlated with the adoption of
key practices such as use of botanical pesticides, biocontrol agents, cultural
practices, detopping, etc. This indicates that behavioural changes in terms
of knowledge and skills are preludes for adoption. FFS as an extension tool
has the promise and potential to bring about desirable changes in human
behaviour.

Chapter 5: FFS Impact in India 73
To conclude, farmers of Karnataka are poised to adopt IPM. This may be
an important contribution towards poverty alleviation and environmental
conservation. To achieve such impact, however, a need for rationalizing
and harmonizing resources and facilitating policy change is needed.
References
Ekneligoda, I.A. (1996): “Integrated Pest Management in Asia and the Pacific: Report of APO Study Meeting 17-22 July 1995.” Country Paper # 10: Sri Lanka, Asian Productivity Organization, Tokyo, 1996.
Fleischer, G., H. Waibel, and G. Walter-Echols (2002): “The Costs of Transforming Public Extension Services Towards Participatory Approaches.” Paper presented at the CIMMYT Impact Assessment Conference, Costa Rica, February 2002.
Kenmore, P.E. (1991): “Indonesia’s Integrated Pest Management: A model for Asia.” Manila, Philippines: FAO Intercountry IPC Rice Program, 1991.
Pincus, J. (2000): “The Impact of Farmer Field Schools on Farmers’ Cultivation Practices in their own Fields.” Report submitted to the FAO Inter-country Programme for Community IPM in Asia, 2000.
Quizon, J., G. Feder, and R. Murgai (2001): “Fiscal Sustainability of Agricultural Extension: The Case of the Farmer Field School Approach.” Journal on International Agricultural and Extension Education 8 (Spring 2001); 13-24.
Van de Fliert, E. (1993): “Integrated Pest Management: Farmer Field Schools Generate Sustainable Practices. A Case Study in Central Java Evaluating IPM Training.” Wageningen Agricultural University, Netherlands, Papers No. 93-3, 1993.

6 Incidence of Acute Pesticide Poisoning Among Women and Men Cotton Growers in India
Francesca Mancini1, Ariena H.C. van Bruggen2, Janice L.S. Jiggins3, Arun Chandra Ambatipudi4 and Helen Murphy5
6.1 Introduction Background
In India, pesticides are primarily used to protect specific commercial crops.
For example, cotton receives more than 60% of the total pesticides used,
but still the crop’s productivity is considerably lower than the world average
(Jayaraj, 1996). In cotton 20 pesticide applications per season are
sometimes reached. The negative consequences of such intensive
pesticide use have become a concern to the Indian public. Alarmingly high
levels of pesticide residues were found in drinking water and in soft drinks
(CSE, 2003). Evidence from the literature suggests that in addition to risks
to consumers, there are also the hazards to persons who are directly
exposed to pesticide applications (Kishi, 1995; Murphy, 1999; Wesseling,
2001; Kunstadter, 2001; Maumbe, 2003). Agricultural labourers and farmers
work in a highly unsafe environment since few protective measures are
used. They mostly work barefoot, barehanded and wear only short-sleeved
cotton tee shirts and traditional sarongs (lungi). During a normal spraying
session, farmers are directly exposed to pesticides for three to four hours
through leaking spray equipment, dripping plants and wind drift.
Concentrated chemicals are often mixed with water sometimes using bare
hands. Such risky behaviour of farmers cannot simply be explained by a
lack of awareness. On the contrary, even though farmers have only partial 1 formerly FAO-APO (Associate Professional Officer), now Ph.D. student at Wageningen
University, Netherlands, with Jiggins/Bruggen 2 Professor, Biological Farming Systems Group, Wageningen University, Netherlands 3 Professor, Communication and Innovation Studies, Wageningen University, Netherlands 4 Programme Manager, Solidaridad-ETC Organic Cotton Programme India, Hyderabad, India 5 Director of Outreach, Pacific Northwest Agricultural Safety and Health Center, Department of
Environmental and Occupational Health Sciences, University of Washington, USA

Chapter 6: Incidence of Acute Pesticide Poisoning in India 75
and often inexact knowledge - they are aware of pesticide hazards (Aragon,
2001; Clarke, 1997; Eisemon, 1990; Kishi, 2002a; McDougall, 1993).
Furthermore training seems to do little to change the practice of using
hazardous pesticides. For example, a programme conducted by Novartis to
train farmers in the safe use of pesticides in the Coimbatore District of Tamil
Nadu, India in 1992 failed to achieve substantial and sustainable changes
in farmers’ practices (Atkin, 2002). Since protective equipment is expensive,
unavailable and cumbersome, it is rarely used in the tropics (Kishi, 1995).
Therefore, farmer education on the safe use of pesticides alone is unlikely
to be a viable solution to eliminate occupational risks.
To date, studies on health risk from pesticides have mostly focused on the
adverse health effects on the people directly involved in the application of
pesticides. However, in addition, women and children often play supportive
roles in the spraying operations and are at risk to a similar extent. In India,
use of female labour is high in cotton production. Mixing of pesticides with
water and refilling the sprayer tanks are typical female tasks (Mancini,
unpublished). Other activities with a high probability of pesticide exposure
are time-consuming operations such as weeding, which are often
performed by women and children during the peak of the spraying season
when there are high levels of residues in the fields.
Pesticides are commonly applied by low-income marginal farmers and
landless workers. Malnutrition and infectious diseases associated with this
group makes them more vulnerable to poisoning (London, 2000; WHO,
1990).
Objectives
In 2003, the FAO-EU Integrated Pest Management Programme for Cotton
in Asia initiated a season-long study that aimed to assess the degree of
acute pesticide poisoning among cotton growers in the Indian State of
Andhra Pradesh. The assessment was planned as a season-long

76 Chapter 6: Incidence of Acute Pesticide Poisoning in India
monitoring activity to be undertaken in three villages that also had IPM6
farmer field schools (FFS)7.
The purpose of this is to document the human health consequences caused
by the currently applied pesticides use practices on cotton in India. The
intent was to include not only the farmers directly involved in spraying, but
also exposed women and marginal farmers. Women perform supportive
activities that have often been neglected in studies dealing with direct
exposure. Marginal farmers are often hired to do spraying and therefore
prone to more continuous exposure. Because previous studies focused on
male farmers who apply chemical products, this study concentrated on
women as the main respondents.
6.2 Methodology The study was conducted in three villages with cotton FFS in Andhra
Pradesh. Selection criteria for the FFS were: a high female participation
(over 50%) and a high share of marginal farmers (over 50%) and a
community interest in the self-monitoring activity. Two of the villages
(Sairedapalli and Srinagar) were located in Warangal District and one
(Darpalli) in Mahbubnagar District. Darpalli is a small village of marginal
native farmers with a low level of education, which is typical for the State
where in 1997 some 70% of the rural people were illiterate. In contrast,
Srinigar and Sairedapalli villages are inhabited by migrant communities who
moved from the State coastal area in search of fertile land. In these villages
farmers have more resources and better education as compared to Darpalli.
6 Integrated Pest Management (IPM) is based on preserving natural enemies and growing healthy
crops to control pests 7 Farmer Field School (FFS) is an adult educational approach to empower farmers developed in
Indonesia in the early Nineties

Chapter 6: Incidence of Acute Pesticide Poisoning in India 77
Data collection method
Self-monitoring started in August 2003, the second month of the cotton
season when pesticides are first applied, and lasted until December 2003.
Farmers were assisted in generating information on:
The degree of acute pesticide poisoning occurring among male and
female cotton farmers
The exposure of women performing supportive roles during spray
operations
The vulnerability of low-income groups involved in pesticide
application
All the fifty women farmers who attended the FFS in their respective
villages were trained in filling-in the health-monitoring forms after any
potential exposure to dangerous substances. In addition to reporting their
own poisoning signs and symptoms, the women interviewed one male
family member (total of 47) who had applied pesticides. Respondents were
asked to fill-in a form after every potential pesticide exposure regardless
whether they had experienced adverse effects or not. Forms were filled
after any of the following activities:
Spraying pesticides in the field
Mixing chemical solution and re-filling spray tanks
Working in a field that was sprayed earlier in the day
Only the signs and symptoms that occurred immediately or within 24 hours
after exposure were recorded. At each weekly FFS meeting the forms were
reviewed.
The reporting format was pictorial to facilitate participation of illiterate
respondents (Figure 6-1). Facilitators provided the necessary assistance to
review the forms throughout the monitoring.

78 Chapter 6: Incidence of Acute Pesticide Poisoning in India
Figure 6-1 Reporting Format in Telegu Local Language
The form allows for the reporting of the following:
A list of 18 signs and symptoms of acute pesticide poisoning8
Type of chemical products used
Quantity of chemical products used
(ml formulated product / litre of water)
Hours spent in performing the operation
8 Developed by Keifer (1996) and adopted by Murphy (2002)

Chapter 6: Incidence of Acute Pesticide Poisoning in India 79
Hours extra-rest taken due to illness
Number of sick days not worked as a consequence of the illness
Use of medical treatments and homemade remedies
Operation performed
The following socio-economic parameters were collected in separate
interviews from each respondent: age, gender, formal education,
landholding and income level.
Scoring System
Following Murphy’s methodology (2002), the forms were scored on a 0-3
scale according to the signs and symptoms reported. Localized effects were
considered consequences of mild poisoning and rated in category 1. In the
same category were also some systemic or neurotoxic effects that are ill
defined (headache, dizziness, difficulty breathing) or effects that could be
confused with environmental factors such as heat exposure (excessive
sweating, excessive salivation). The other neurotoxic effects such as
nausea and vomiting, which might reflect cholinesterase depression, were
classified as category 2 or moderate poisoning. Category 3 included loss of
consciousness and seizure as effects of severe poisoning. Each form was
given a final score (severity score) equivalent to the highest category
marked).
Data Analysis
Linear trend analysis (frequencies analysis and chi-square test) was
performed to describe pairs of variables (men versus women and small
landholdings versus large). Correlations between the severity score and the
social, economic and exposure variables were also analyzed.

80 Chapter 6: Incidence of Acute Pesticide Poisoning in India
6.3 Results
6.3.1 Respondents’ Profile Data was obtained from a total of 97 farmers, including the main 50 main
respondent women participating in the health self-monitoring (Table 6-1)
and 47 men who were interviewed by the women. . The average age of the
reporting farmers was 36.5 years for women and 37 years for men. As a
result of the purposive selection of the villages, the sample included 70%
small farmers (<2 ha). Almost half of the respondents fell under the class
“marginal” (<1ha). Forty-one percent of the farmers lived below the national
poverty line of 10 rupees a day.
Table 6-1: Distribution of Respondents Among the Villages
Village Women (respondents)
Men (indirect reporting) Total
Darpalli 25 23 48 Sairedapalli 14 14 28 Srinagar 11 10 21 Total 50 47 97
6.3.2 Spraying Operations The women reported on 165 self-exposure sessions as well as 158 similar
sessions by their male relatives. The women’s health form were filled-in
after the following agricultural activities: mixing concentrated chemicals with
water and filling spray tanks (47%), mixing and subsequently working in the
field (24%), working in a recently sprayed field (17%), applying pesticides
(9%) and other activities (3%)9. The application of pesticides referred to
spreading phorate granules (organophosphate, WHO 1B hazard class) on
maize and chilli plants.
Men’s forms were filled-in after spraying pesticides (75%), spraying and
subsequently working in the field (22%) as well as mixing concentrated
9 Other activities included supervising labour and harvesting intercrops.
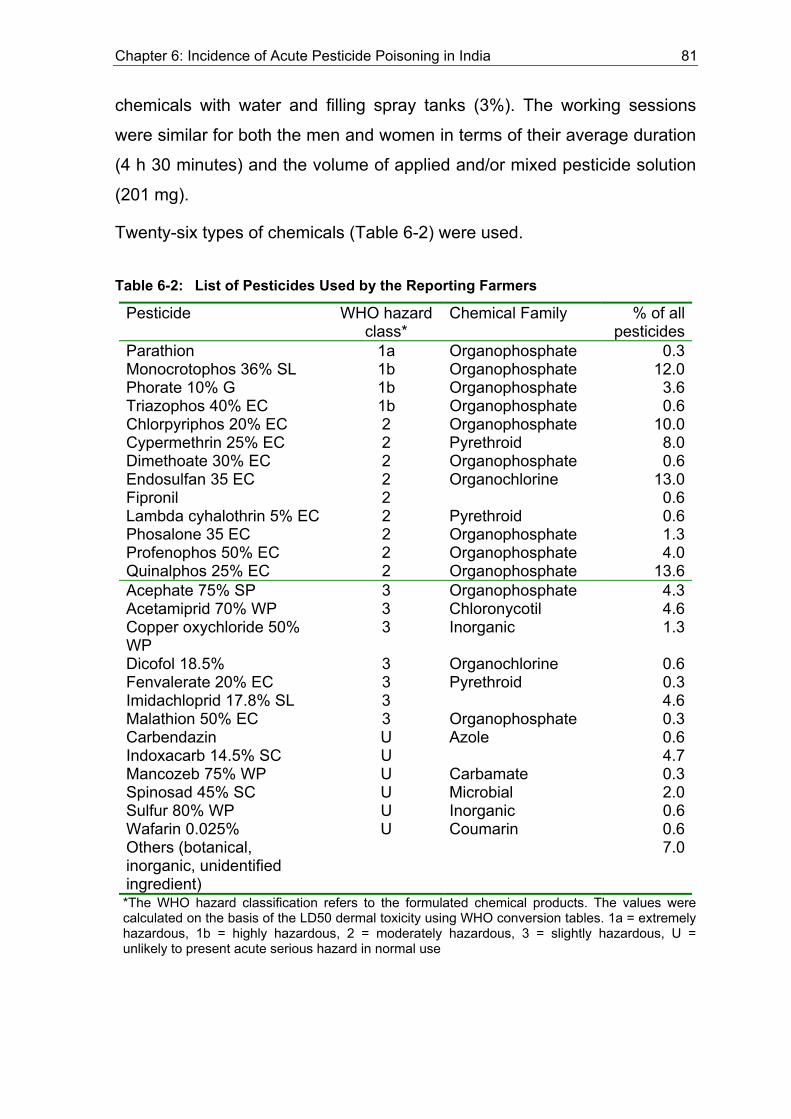
Chapter 6: Incidence of Acute Pesticide Poisoning in India 81
chemicals with water and filling spray tanks (3%). The working sessions
were similar for both the men and women in terms of their average duration
(4 h 30 minutes) and the volume of applied and/or mixed pesticide solution
(201 mg).
Twenty-six types of chemicals (Table 6-2) were used.
Table 6-2: List of Pesticides Used by the Reporting Farmers
Pesticide WHO hazard class*
Chemical Family % of all pesticides
Parathion 1a Organophosphate 0.3Monocrotophos 36% SL 1b Organophosphate 12.0Phorate 10% G 1b Organophosphate 3.6Triazophos 40% EC 1b Organophosphate 0.6Chlorpyriphos 20% EC 2 Organophosphate 10.0Cypermethrin 25% EC 2 Pyrethroid 8.0Dimethoate 30% EC 2 Organophosphate 0.6Endosulfan 35 EC 2 Organochlorine 13.0Fipronil 2 0.6Lambda cyhalothrin 5% EC 2 Pyrethroid 0.6Phosalone 35 EC 2 Organophosphate 1.3Profenophos 50% EC 2 Organophosphate 4.0Quinalphos 25% EC 2 Organophosphate 13.6Acephate 75% SP 3 Organophosphate 4.3Acetamiprid 70% WP 3 Chloronycotil 4.6Copper oxychloride 50% WP
3 Inorganic 1.3
Dicofol 18.5% 3 Organochlorine 0.6Fenvalerate 20% EC 3 Pyrethroid 0.3Imidachloprid 17.8% SL 3 4.6Malathion 50% EC 3 Organophosphate 0.3Carbendazin U Azole 0.6Indoxacarb 14.5% SC U 4.7Mancozeb 75% WP U Carbamate 0.3Spinosad 45% SC U Microbial 2.0Sulfur 80% WP U Inorganic 0.6Wafarin 0.025% U Coumarin 0.6Others (botanical, inorganic, unidentified ingredient)
7.0
*The WHO hazard classification refers to the formulated chemical products. The values were calculated on the basis of the LD50 dermal toxicity using WHO conversion tables. 1a = extremely hazardous, 1b = highly hazardous, 2 = moderately hazardous, 3 = slightly hazardous, U = unlikely to present acute serious hazard in normal use

82 Chapter 6: Incidence of Acute Pesticide Poisoning in India
6.3.3 Reported Symptoms and Signs Out of the 317 reported exposure events, 16% were asymptomatic, 39% led
to mild poisoning, 38% to moderate and 7% to severe poisoning. The
severity score (the value assigned to each form as a result of the scoring
procedure) was positively correlated with the total number of signs and
symptoms reported in each form (Pearson Correlation coefficient 0.779,
correlation significant at the 0.01 level). Mild attacks were associated with
an average signs and symptoms score of 1.9 moderate attacks with 4.0 and
severe attacks with 8.4.
The occurrence of pesticide poisoning events was found to be significantly
correlated with landholding status (chi square significant at P<0.0001). For
example, the incidence of severe poisoning was 10 times higher among
marginal and small farmers than larger landholders (Figure 6-2); precisely,
10.2% of the marginal and small farmers suffered from severe poisoning
effects.
0%
20%
40%
60%
80%
100%
Marginal/small Medium Large
SevereModerateMildNo S&S
Figure 6-2: Distribution of Severity Score by Landholding Size
The distribution of the signs and symptoms showed that marginal and small
landholding farmers experienced more effects than medium and large
landholders.
The gender segregated analysis showed no significant differences in the
distribution of signs and symptoms between men and women. Also, the
severity score was not significantly correlated with the gender of the

Chapter 6: Incidence of Acute Pesticide Poisoning in India 83
respondents. The health effects experienced by the women were
comparable to the ones experienced by men. These results confirm the
hypothesis that women are seriously exposed to pesticide contamination.
6.3.4 Severity Score Versus Exposure Variables (Exposure Time, Pesticide Toxicity, Spray Volume, Operation)
Exposure was described by four variables:
Pesticide toxicity: toxicity of the formulated chemical product classified
according to the WHO Hazard classes. Pesticides belonging to the WHO
class 1a (extremely hazardous) scored 1 point, class 1b (highly hazardous)
2 points, class II (moderately hazardous) 3 points and class III (slightly
hazardous) 4 points. Pesticides unlikely to present acute hazards under
normal use (class U) were assigned with a score of 5 points.
Exposure time: the duration in hours of the working session
Volume: the final volume of the spray solution expressed in litre
Operation: the type activity performed during the working session
The severity score was positively correlated with the toxicity and the
exposure time, but no significant correlation was found with the volume
(Table 6-3).
Table 6-3: Correlation Between Severity Score and ExposureVariables
Pesticide toxicity
Exposure Time
Severity score Pearson Correlation .420** .337** Sig. (2-tailed) .000 .000
* Correlation is significant at the 0.01 level (2-tailed).
The severity score distributed by the type of operation performed showed .
that “spraying” and “mixing” were key-exposure activities with a similar
incidence of severe poisoning (Table 6-4). During the operation “mixing”,
the respondents prepared chemical solutions in rapid succession. In

84 Chapter 6: Incidence of Acute Pesticide Poisoning in India
between, the respondents were present in the field. The same activities
(mixing), when associated with fieldwork afterwards, led to a slight shift of
the distribution towards higher degree of severity. “Mixing” and “spraying”
tasks had an average duration of 3.5 and 3.8 hours, respectively. The same
operations combined with fieldwork lasted 6.7 hours (mixing and field work)
and 7 hours (spraying and field work). This prolonged exposure more often
led to the development of severe illness. “Field work” alone did not cause
any severe or moderate poisoning. This may be explained by the absence
of direct contact with the concentrated chemical.
Table 6-4: Distribution of the Severity Score Among Operations in Percentage and Total Number of Working Sessions
% (No. of sessions) Mixing Mixing
+Field work Field work Spraying Spraying + field work Total
No S&S 10 (9) 0 (0) 57(16) 20 (27) 3 (1) 16 (53)Mild 52 (45) 10 (4) 43 (12) 44 (59) 19 (7) 39 (127)Moderate 33(28) 80 (31) 0 (0) 31 (42) 64 (23) 38 (124)Severe 5 (4) 10 (4) 0 (0) 5 (6) 14 (5) 6 (19)Total 100 (86) 100 (39) 100 (28) 100 (134) 100 (36) 100 (323)
6.3.5 Medical Assistance Regardless of the seriousness of the illness, farmers sought medical advice
only in 8% of the cases. Homemade treatments were taken in 70% of the
cases while no action was taken in the remaining cases. Occasionally, a
few hours of extra rest (1.41 for women and 1.38 for men) were taken
before resuming work. In 7% of the cases, a full day of rest was recorded -
a total of 23 sick days for the all participants during the 4-month reporting
period. This percentage is similar to the total number of severe cases
reported (5.9%). This suggests that using sick days as an indicator might
lead to an underestimation of the extent of pesticide poisoning.

Chapter 6: Incidence of Acute Pesticide Poisoning in India 85
6.4 Discussion The study documented the serious consequences from the indiscriminate
use of pesticides on the health of farmers and specifically women field
helpers in India. The health surveys reviewed by Kishi (2002b) pointed out
that the existing world data on poisoning refer mainly to male workers
directly involved in pesticide application applying pesticides. Only few
studies investigated the exposure of women carrying out pesticide
applications (Murphy, 1999; Kimani, 1995; Trivelato, 1992). However,
women in developing countries are often exposed in other ways performing
supportive tasks during the chemical application process (London, 2002).
Few studies have mentioned this aspect and none have estimated the
health effects of pesticides on women quantitatively (Rother, 2000; London
2002; Atkin, 2002). The current survey addressed this information gap by
focusing on the adverse effects observed among two target groups, women
and marginal farmers, after they performed operations with the risk of
pesticide exposure.
The presented study showed no differences between the degree of illness
related to pesticide experienced by women and men. Is not entirely clear
whether this is related to the fact that women reported both on themselves
and their husbands. Nevertheless, women reported significant health
effects. They performed typically female tasks, such as mixing concentrated
chemical products and refilling spraying tanks, which are key exposure
activities and potentially are as hazardous as pesticide applications itself.
Although 6% of the spray sessions were associated to serious neurotoxic
effects, none of the respondents sought medical care or were hospitalized.
On the contrary, farmers rarely stopped working for more than a day. This
finding confirms the serious underestimation of pesticide poidoning based
on official medical records (Keifer, 1996; Murray, 1994).
Low-income marginal farmers were more often subject to severe poisoning
than landlords. Small-holders and landless people often apply pesticides

86 Chapter 6: Incidence of Acute Pesticide Poisoning in India
throughout the season as hired labourers and therefore are exposed more
frequently and for longer time. Pesticide toxicity and exposure time were
positively correlated for the symptoms observed in this survey, while
education and land holding were negatively correlated to this measure of
illness. Factors that could re-enforce poisoning symptoms and thus leave
the more marginal farmers and workers more vulnerable to illness are
malnutrition and other diseases, (WHO, 1990; Repetto, 1997).
The methods applied in this study are a relatively inexpensive way to
achieve an overview about pesticide exposure and health risks for female
and male farmers in cotton production. However, there are some limitations
(Murphy, 2002). Since signs and symptoms of acute poisoning are non-
specific, the health data generated can be taken only as estimates.
Whether the women over- or underreported the true extent of the problem
cannot be determined without medical data. Self-reporting of symptoms
would need to be backed-up by clinical tests and blood sample analyses,
such as cholinesterase depressions. Another issue is that respondents
belonging to the same village had close interactions. This may have
introduced a systematic bias yielding homogeneity of reporting. Finally, the
methodology cannot assess the chronic consequences of prolonged
exposure to pesticides. A study conducted with female cotton workers in
India has shown long-term consequences of exposure to pesticides (Rupa,
1991) Relevant in the case of women are especially the long term effects
on the reproductive system that can lead to abortions, still births, neonatal
deaths and congenial defects (Restrepo, 1990; Taha, 1993; Zhang, 1992;
Rojas, 2002).
The extent of pesticide poisoning among farmers and workers in developing
countries is worrying (Kishi, 2002). In the extremely hot weather of the
tropics, protective gear does not seem to be a viable solution to eliminate
occupational risks. Farmer education on the pesticide hazards alone has
not achieved significant results (Atkin, 2000). The solution seems to be in

Chapter 6: Incidence of Acute Pesticide Poisoning in India 87
the replacement of toxic pesticides with non- or less toxic alternatives or
more ecological pest management strategies. One such alternative can be
found in the Integrated Pest Management approach.
References Aragon, A., C. Aragon and A. Thorn (2001): Pests, peasants, and pesticides on the
northern Nicaraguan Pacific Plain. Int J Occup Environ Health. 7 (4): 295-302
Atkin J. and K. M. Lesinger (eds) (2000): Safe and Effective Use of Crop Protection Products in Developing Countries
Clarke, E.E., L.S. Levy, A. Surgeon and I.A. Calvert (1997): The problems associated with the pesticide use by irrigation workers in Ghana. Occup Med (Lond) Jul; 47 (5): 301-8
CSE (Centre for Science and Environment), (2003): Pesticide residues in bottled water. CSE Report, New Delhi
Eisemon, T.O. and A. Nyamete (1990): School literacy and agricultural modernization in Kenya. Comparative Education Review. 34: 161-76
Jayaraj, S. (1996): Cotton in India Economy. Agricultural College & Research Institute. Tamil Nadu Agricultural University. Unpublished report
Keifer, M. (1996): Estimating underreported poisonings in Nicaragua. Ame J of Ind Med, 30: 195-201
Kimani, V.N. and M.A. Mwanthi (1995): Agrochemicals exposure and health implications in Githunguri location, Kenya. East African Medical Journal. 72 (8): 531-535
Kishi, M., N. Irschhorn, M. Djajadisastra, L.N. Satterlee, S. Strowman and R. Dilts (1995): Relationship of pesticide spraying to signs and symptoms in Indonesian farmers. Scandinavian Journal of Work, Environment, and Health, 21:124-33
Kishi, M. (2002a): Indonesian farmers’ perception of pesticides and resultants health problems from exposure. Int J Occup Environ Health. 8 (3): 175-81
Kishi, M. (2002b): The health impacts of pesticides: What Do We Know, What Can Be Done?
Kunstadter, P., T. Prapamontol, B.O. Siririjn, A Sontirat, A Tansuhaj and C Khamboonruang (2001): Pesticide exposure among Hmong farmers in Thailand. Int J Occup Environ Health 7: 313-25
London, L. and A. Rother (2000): People, pesticides and the environment: who bears the brunt of background policy in South Africa? New Solutions. 10 (4):339-50
London, L., S. de Grosbois, C. Wesseling, S. Kisting, H.A. Rother and D. Mergler (2002): Pesticide usage and health consequences for women in developing countries: Out of sight, out of mind? Int J Occup Environ Health 8: 46-59

88 Chapter 6: Incidence of Acute Pesticide Poisoning in India
Maumbe, B.M. and S.M. Swinton (2003): Hidden costs of pesticide use in Zimbabwe’s smallholders cotton growers. Social Science & Medicine. 57 (9): 1559-1571
McDougall, L. et al. (1993): Attitudes and practices of pesticide users in Saint Lucia, West Indies. Bull pan Am Health Organ 27 (1): 43-51
Murphy, H., A. Sanusi, R. Dilts, M. Djajadisastra, N. Hirchhorn and S. Yuliantiningsih (1999): Health effects of pesticide use among women Indonesian farmers: Part I: exposure and acute effects. J Agromedicine. 6 (3):61-85
Murphy, M., N.P. Hoan, P. Matteson and A.L. Morales Abubakar (2002): Farmers’ Self-surveillance of Pesticide Poisoning: a 12-month Pilot in Northern Vietnam. Int J Occup Environ Health 8:201-211
Murray, D.L. (1994): Cultivation crisis: the human cost of pesticides in Latin America. University of Texas Press. Austin
Repetto, R. and S. Baliga (1997): Pesticides and immuno suppression: the risks to public health. Health Policy Plan. 12 (2):97-106
Restrepo, M. et al. (1990): Prevalence of adverse reproductive outcomes in a population occupationally exposed to pesticides in Colombia. Scan J work Environ Health. 16:232-8
Rojas, A, M.E. Ojeda and X. Barrazza (2000): Congenital malformations and pesticide exposure. Rev Med Chil 128 (4): 399-404
Rother, H.A. (2000): Influences of pesticide risk perception on the health of rural South African women and children. African Newsletter on Occupational health and Safety. 10:42-6
Rupa, D.S., Reddy P.P. and O.S. Reddi (1991): Reproductive performance in population exposed to pesticides in cotton field in India. Environ. Res. 55 (2): 123-8
Taha, T.E. and R.H. Gray (1993): Agricultural pesticide exposure and prenatal mortality in central Sudan. Bull World Health Organ. 71 (3-4): 371-21
Trivelato, M.D. and C. Wesseling (1992): Use of pesticides in non-traditional crops in Costa Rica: environmental and labor health aspects. In: Kopke U., Schulz D.G. Proceedings 9th International Scientific conference IFOAM. November 16-21. Sao Paoò, Brazil
Wesseling, C., A. Aragon and Castillo Leta (2001): Hazardous pesticides in Central America. Int J Occup Environ Health. 7 (1):287-94
Zhang, J., W.W. Cai and D.J. Lee (1992): Occupational hazard and pregnancy outcomes. Am J Ind Med. 21:397-408
WHO (1990): The Public Health Impact of Pesticides Use in Agriculture. World Health Organization, Geneva.

7 Impact of the FAO-EU IPM Programme for Cotton in Asia on the Environment
G. Walter-Echols1 and Manzoor H. Soomro2
7.1 Introduction Agriculture intentionally disturbs natural ecosystems which leads to multiple
direct and indirect environmental consequences. To assess the impacts of
agricultural practices and pest management decisions on the environment,
many different approaches have been proposed. These range from
monitoring single indicator species to elaborate fate models or indexing the
impacts of pest control products and methods. Many challenges to
environmental impact assessment are still unresolved as to methodologies,
sampling and monitoring. (Levitan et al., 1995; Levitan, 1997 and 2000).
Over the past decade, many risk indicators have been developed and
OECD, EU and USDA are currently evaluating different models to find the
best suitable pesticide risk indicator to help governments assess the impact
of IPM and pesticide policies (AFT, 2003; CEC, 1994; OECD, 1997, 2001
and 2002; Reus et al., 1999; Vercruysse and Steurbaut, 2002). IPM
practitioners are being challenged to think more deeply about the potentials,
limitation and complexities of environmental impact assessment and to
integrate these aspects into IPM implementation.
Over many years, IPM has been assessed primarily in terms of cost and
efficiency of practices. To the extent that environmental impact was
considered, it was measured by the reduction of pesticide use or by
indicators relating to the impacts on beneficial arthropods. Pesticide
reduction was mostly measured in terms of cost, dose rate of formulated
products, active ingredient or number of applications. However, the number
1 formerly Environmental Impact Expert, FAO-EU IPM Programme for Cotton in Asia, FAO
Regional Office for Asia and the Pacific, Bangkok, Thailand 2 formerly FAO National Cotton IPM Expert, now Chief Scientific Officer, Pakistan Science
Foundation, Islamabad, Pakistan
90 Chapter 7: Impact of FFS on the Environment
of pesticide sprays contains little information about the hazards of the
application, particularly when different pesticides are used in a single spray
mixture. Measuring the amount of active ingredients is likely to
underestimate the effects of modern pesticides that are highly active in very
small quantities. This limitation is somewhat compensated by monitoring
the dose rate of formulated products which are sold at more or less similar
unit efficacies. Since there is no single ideal pesticide parameter with which
to assess pesticide usage, different measurements would have to be used.
Therefore, specific pesticide risk reduction indicators may be more suitable
to capture the environmental impact of IPM than pesticide reduction figures.
The FAO-EU IPM Programme for Cotton in Asia (Cotton IPM Programme)
monitored pesticide use and also decided to test the Environmental Impact
Quotient (EIQ; Kovach et al., 1992) as a means to assess the
environmental risk of different pest management strategies. This method
was already used by a Norwegian IPM project in Vietnam (Eklo, 2002) and
it was easy to apply with the help of a computer application developed by
the Cotton IPM Programme. The EIQ relies on a ranking methodology to
assess the environmental and health risks of particular pesticide application
schemes. The model uses toxicology data and chemical parameter
information to calculate the risk to farm workers, consumers and
environmental organisms.
This paper summarises the direct or indirect evidence obtained by the
Cotton IPM Programme for IPM-FFS impacts on the environment and
assesses the suitability of different evaluation parameters for IPM-FFS
impact evaluation.
7.2 Methodology Pesticide use data were collected as part of the Cotton IPM impact
assessment studies for both the year before FFS and the year after.
Parameters included the number of pesticide applications and the dose rate

Chapter 7: Impact of FFS on the Environment 91
of the formulated products in kilogram per hectare. Most studies recorded
segregated data for insecticides, fungicides and herbicides. The India and
Pakistan, studies also included information on the WHO hazard classes of
the chemicals used and on the timing of pesticide applications. The results
were generally expressed by means and standard deviation for the different
respondent groups, and the statistical significance of differences between
the groups was determined by paired t-tests of the mean differences
between the FFS or exposed farmers and the control village farmers.
Calculation of the EIQ followed the method described by Kovach et al.
(1992) and used the list of updated EIQ values posted in 2003 (Kovach et
al., 2003). Values for pesticides missing from this list were calculated using
pesticide datasheets available from EcoToxNet, USEPA, WHO/FAO or
PAN. The aggregated field EIQ for season-long pest control schemes as
well as separate impact (EI) values for farmers, consumers and the
environment were calculated using an Excel spreadsheet programme that
automatically looked up the list values and multiplied them with the percent
of active ingredient, dose rate and total number of sprays over the cotton
season. In Pakistan, the EIQ values were calculated for both the pre- and
post-FFS pest management practices by the different respondent groups. In
India, only post-FFS data were available for comparison. In all other
countries, EIQ values were only calculated for IPM and farmer-practice
plots managed during farmer field schools.
The effects of IPM management decisions on the population levels of pests
and natural enemies were mostly determined from weekly ecosystem
analyses conducted by farmers as part of the farmer field schools. The list
of natural enemies observed during FFS was often limited to ladybird
beetles, spiders and lacewings. In China, cotton fields of farmers who
graduated in the previous year were monitored season-long to assess the
post-FFS impact on insect population. Only one study determined the
overall species diversity in IPM and non-IPM farmer fields: the participants

92 Chapter 7: Impact of FFS on the Environment
of two special courses on insect identification in India and Bangladesh
reported the total number of plant feeder, predator species and parasites
species found in IPM, organic and farmer fields (Watson, 2003).
7.3 Results Impact on Pesticide Reduction
Overall results from the impact studies showed that after the attending FFS,
farmers reduced the number of pesticide applications from an average of
13.1 sprays per season before FFS to only 6.8 afterwards (p=0.064). Over
the same period, control village farmers reduced their applications by only
0.5 sprays. This amounted to a reduction of 55% relative to control values.
Most of these applications were for insecticides. In the baseline of both FFS
and control villages, only 1.4 applications were for fungicides and
herbicides. The average number of non-insecticide applications remained
unchanged in the FFS villages (increase of only 0.06 applications) and
increased slightly in control villages (by 0.5 applications) between the pre-
and post-FFS survey years. Thus insecticide sprays accounted for 11.7
applications before FFS and 5.5 applications afterwards (p=0.046), which
represent a 54% decline relative to the control (p=0.052).
In terms of formulated product, FFS farmers reduced their insecticide
consumption by 8.5 kg from an average of 13.9 kg per ha to only 5.4 kg
afterwards (p=0.053). Over the same period, control village farmers showed
a reduction of 2.5 kg (p=0.246). Thus, relative to control village farmers,
FFS farmers used 6.0 kg insecticide per hectare or 43% less (p=0.052) as
the result of FFS education (Figure 7-1).

Chapter 7: Impact of FFS on the Environment 93
Impact of IPM-FFS on Pesticide Reductionkg/ha decrease relative to control (average of 1,060 farmers in 5 countries)
kg/hakg/ha
2.52.5
5.05.0
00
--2.52.5
-- 5.0 kg5.0 kg
-- 34 %34 %
+ 3.8 kg
- 2.2 kg
+ 4.4 kg
- 0.6 kg
FFS Farmers
Exposed Farmers
-- 6.0 kg6.0 kg
--43 %43 %
pre- post-FFS pre- post-FFS
Rel
ativ
e to
Con
trol G
roup
Far
mer
s
Figure 7-1: Impact of IPM-FFS on Pesticide Reduction
In addition to the strong pesticide reduction effects on the FFS participants,
farmer field schools also had a considerable effect on the neighbouring
cotton farmers in the same villages. The sample of exposed farmers
reduced their insecticide usage by an average of 5.0 kg or 34% (p=0.028)
relative to the control. Thus diffusion to non-FFS farmers amounted to 83%
of the pesticide reduction achieved among FFS participants.
It must be noted that the FFS and control villages were not equal in terms of
pesticide usage and FFS villages had a distinct but statistically not
significant (p=0.232) higher pesticide consumption before FFS
implementation, as depicted in Fig. 8 in the pre-FFS columns. Baseline
values for the control villages were 10.8 pesticide applications or 10.1 kg of
insecticides while the correspondent values in the FFS villages (FFS and
non-FFS farmers combined) were 12.7 applications or 14.2 kg insecticide
per hectare. Since it is the goal of IPM to reduce the use of pesticides,
villages with higher pesticide consumption were selected for FFS training.
Due to fluctuating pest pressures and changing environmental conditions
between the pre- and post-FFS years, pesticide consumption in control

94 Chapter 7: Impact of FFS on the Environment
villages increased in two study sites while it remained constant or slightly
declined in four other sites.
Based on these pesticide reduction figures for FFS and exposed farmers, it
is estimated that almost 1,900 tons worth $ 17 million less pesticides were
used in the FFS villages during the first year after FFS alone (Table 7-1).
Thus about 250,000 ha of cotton were treated with substantially fewer toxic
chemicals as a result of IPM training. These figures do not include the
almost 40,000 farmers that attended FFS financed by governments in India,
Pakistan and China in 2003 and 2004. With these farmers included, the
total estimated annual pesticide reduction would double to about 4,700 tons
worth US$ 43 million.
Since these farmers are likely to continue their practices in the coming
years, the accumulated reduction of toxic chemicals over large areas of
cotton is expected to have noticeable positive impacts on the environment
and biodiversity.
Table 7-1: Estimated Total Pesticide Reduction as a Result of Cotton IPM-FFS Education (without Philippines)
FFS NFFS Country Cotton
[ha/HH]1
Farmers Reduction [kg/ha]
Subtotal tons Farmers2 Reduction
[kg/ha] Subtotal
tons
Total tons
Bangladesh 0.35 3,700 -0.90 -1.2 11,100 -0.70 -2.7 -3.9
China 0.22 18,336 -4.6 -18.6 55,008 -5.2 -62.9 -79.9
India 1.9 12,043 -20.0 -457.6 36,129 -14.0 -961.0 -1,338.8
Pakistan 2.7 10,471 -5.8 -164.0 31,413 -3.8 -322.3 -431.6
Vietnam 0.78 10,615 -0.86 -7.1 31,845 -0.68 -16.9 -24.0
Total 55,165 -648 165,495 -1,366 -1,878
1 average cotton plot size per household; 2 assuming 3 exposed farmers per 1 FFS participant or 100 households per FFS village.
Impact on Pesticide Risk
Figures on pesticide reduction do not indicate the degree of environmental
risk reduction because some products are more hazardous than others. A

Chapter 7: Impact of FFS on the Environment 95
more differentiated analysis that takes into account environmental toxicity
figures and exposure to ecosystems is needed to assess environmental
risks. Since there is not yet a widely adopted pesticide risk assessment
methodology, the Cotton IPM Programme chose the Environmental Impact
Quotient (EIQ) as an estimate of environmental risk, being aware of the
limitations of this approach (Dushoff et al., 1994). A comparison of the EIQ
values and pesticide reduction parameters in Pakistan showed an EIQ
reduction of 71% relative to control figures, while the number of sprays was
only reduced by 39% and the dose rate by 47%. Data from India showed
similar trends with reduction figures of 47% for EIQ, while only 14% for
sprays and 31% for dose rates. This indicates that FFS farmers selectively
reduced more hazardous products because they understood their effects on
natural enemies in the field. The EIQ values reflect this important change
better than the number of spray application or pesticide dose rates.
The overall field EIQ value can be segregated into sub-indices that
selectively estimate the pesticide risks to farm workers/farmers, consumers
and the environment. A comparison of these values from India and Pakistan
shows that each dataset displays different characteristics that cannot be
generalized (Table 7-2). While in Pakistan all three indices were within a
narrow range and showed similar reduction patterns, these were quite
different for the India data. There, the reduction of the EI Environment was
far greater than that for farmers and consumers. This was due to the
continued use of a highly toxic pesticide in the IPM treatment. A comparison
of the percent of total dose and percent of total EIQ values for individual
pesticides used in a pest management strategy can help identify those
products that contribute disproportional to their dose to the environmental
risk. Typical cotton pesticides like monocrotophos or methamidophos
clearly showed up as the biggest contributors to high EIQ values while
neem or other biopesticide products contribute proportionally less.

96 Chapter 7: Impact of FFS on the Environment
Table 7-2: Comparison of EI Values and Field EIQ from Pakistan and India EI
Farmer EI
Consumer EI
Environment Field EIQ
Pakistan (87 FFS participants) Pre-FFS 89 21 199 105 Post-FFS 30 7.1 72 36 Average % reduction -67% -66% -64% -66% India (post-FFS values for 37 FFS participants and 30 control farmers) Control Farmers 98 22 244 121 FFS graduates 71 21 102 65 Average % reduction -18% -5% -58% -46%
The term "pesticide" often only refers to synthetic chemical products and
excludes non-synthetic pest control measures such as bio-pesticides,
sulphur, soaps or oils. Even though these products may be relatively safe
for humans, their environmental impacts can be substantial, particularly
when used at very high dose rates as it is often the case for soaps and oils.
If these products can kill pests, they can also kill predators and parasites.
Therefore they must be included in an environmental risk evaluation of
different pest management schemes. Table 7-3 shows the EIQ values for
an IPM practices with and without soaps. The results show clearly the
potential negative environmental impact of pest management that rely too
heavily on pesticide substitution instead of ecological measures. This
aspect would be easily missed when looking only on chemical pesticide
reduction figures.
Table 7-3: EI and Field EIQ Values With and Without Soap Treatments. EI
Farmer EI
Consumer EI
Environment Field EIQ
Bangladesh (52 FFS and Farmer Practice Plots, 2003) Farmer Practice 149 49 229 143 IPM (chemicals only) 37 12 57 35 Average % reduction -75% -76% -75% -76% IPM (incl. soap) 122 49 371 181 Average % reduction -18% 0% +62% +27%
Impact on Species Diversity
While the EIQ may be an useful and easy-to-use indicator to assess
environmental risks of different pest management schemes, the ultimate
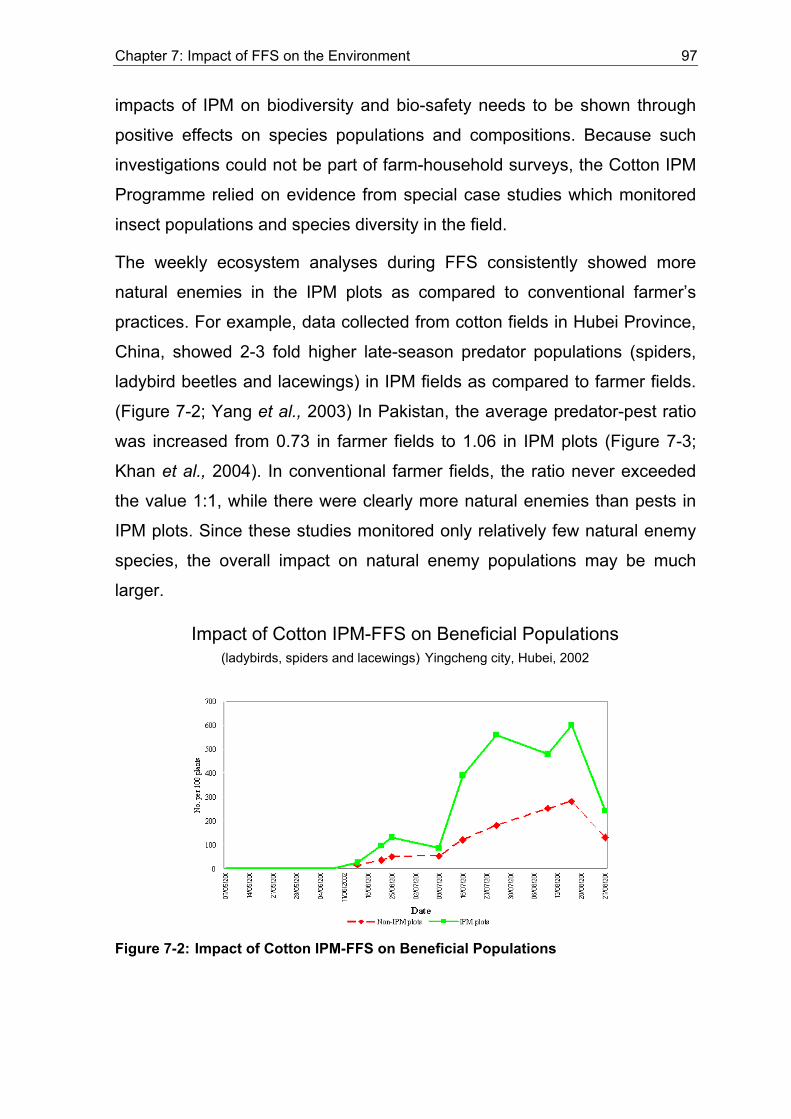
Chapter 7: Impact of FFS on the Environment 97
impacts of IPM on biodiversity and bio-safety needs to be shown through
positive effects on species populations and compositions. Because such
investigations could not be part of farm-household surveys, the Cotton IPM
Programme relied on evidence from special case studies which monitored
insect populations and species diversity in the field.
The weekly ecosystem analyses during FFS consistently showed more
natural enemies in the IPM plots as compared to conventional farmer’s
practices. For example, data collected from cotton fields in Hubei Province,
China, showed 2-3 fold higher late-season predator populations (spiders,
ladybird beetles and lacewings) in IPM fields as compared to farmer fields.
(Figure 7-2; Yang et al., 2003) In Pakistan, the average predator-pest ratio
was increased from 0.73 in farmer fields to 1.06 in IPM plots (Figure 7-3;
Khan et al., 2004). In conventional farmer fields, the ratio never exceeded
the value 1:1, while there were clearly more natural enemies than pests in
IPM plots. Since these studies monitored only relatively few natural enemy
species, the overall impact on natural enemy populations may be much
larger.
Impact of Cotton IPM-FFS on Beneficial Populations (ladybirds, spiders and lacewings) Yingcheng city, Hubei, 2002
Figure 7-2: Impact of Cotton IPM-FFS on Beneficial Populations

98 Chapter 7: Impact of FFS on the Environment
0
0.2
0.4
0.6
0.8
1
1.2
1.4
1.6
1.8
2
CESA1
CESA2
CESA3
CESA4
CESA5
CESA6
CESA7
CESA8
CESA9
CESA10
CESA11
CESA12
CESA13
CESA14
CESA15
CESA16
CESA17
CESA18
CESA19
Pred
ator
-Pes
t Rat
io
Predator-Pest Ratio at IPM Plots Predator-Pest Ratio at Farmers Plots
FFS Impact on Predator-Pest RatioPakistan, 92 IPM and Farmer Practice (FP) Plots
IPM Average
1.06
FP Average
0.73
Figure 7-3: FFS Impact on Predator-Pest Ratio
A study that measured the total number of arthropod species found in
cotton fields was conducted in Bangladesh and India (Watson, 2003).
Results showed that the total number of insect species found in cotton
fields was increased by 45% in IPM fields. This increase was mainly due to
natural enemies. A noticeable increase in parasitoids was observed in IPM
plots while this group of insects was largely absent from conventional
farmer fields (Table 7-4).
Table 7-4: Species Diversity in IPM and Conventional Cotton Fields
Trophism Level India (near Hyderabad) Bangladesh (near Jessore) IPM Plot Farmer Plot IPM Plot Farmer Plot Herbivores 21 16 13 14 Predators 19 15 31 19 Parasitoids 8 0 5 3 Total 48 31 49 36
7.4 Conclusions and Recommendations The FAO-EU IPM Programme for Cotton in Asia has shown that
environmental risks from agriculture can be substantially reduced through
an ecology-based crop production approach and that this in turn can lead to

Chapter 7: Impact of FFS on the Environment 99
an improved biodiversity in rural areas. The Programme was successful in
reducing pesticide consumption not only among FFS participants, but also
among exposed farmers in the same villages. After having heard about the
bad effects of pesticides, these farmers followed their FFS neighbours, but
without having gained their deeper understanding or improved decision-
making skills. The removal of substantial amounts of toxic chemicals from a
large area of cotton fields can be taken as an indirect indicator for positive
impacts on the environment. Since cotton receives the biggest share of
pesticides in Asia, a widespread implementation of IPM would greatly
reduce overall pesticide-related environmental risks and particularly in the
major cotton production areas.
Other positive environmental effects from IPM may come from a reduction
of nitrogen fertilizer. Even though this was not a major objective of FFS,
there appears to be a noticeable trend of reduced urea fertilizer and an
increase in potassium and phosphorus after FFS; however, more analyses
are needed to substantiate these preliminary observations. FFS data from
Pakistan also showed a reduction in use of irrigation water (a very precious
commodity in the country) in IPM plots as compared to FP plots (IPM 6.4
irrigations, FP 7.8 irrigations). Furthermore, a rational "intercropping" with
weeds as a source of fodder for the animals or as herbs for human
consumption could also have positive environmental effects. Though minor,
the increase in plant biomass in IPM fields positively contributes to the
absorption of carbon from the atmosphere.
The selected case studies showed that EIQ reduction figures exceeded
those of sprays, dose and cost, indicating that the EIQ may be able to
capture IPM benefits better than pesticide reduction indicators. However,
the dose at which products are applied is probably the single most
important factor that affects environmental risk. Since solvents are a major
component of pesticide formulations, their effect on the environment would
also need to be included. While considered less toxic to humans, the effect

100 Chapter 7: Impact of FFS on the Environment
of these "inert" ingredients on the environment may equal those of
alternative pest control measures such as oils or soaps.
The overall single field EIQ index number may not be the best indicator for
environmental impact since it also includes farm worker and consumer risk
estimates. Therefore, the separately calculated index for environmental
risks (EI Environment) may be a more useful indicator for assessing
potential environmental impacts from different pest management practices.
Field ecology study results showed considerable increases in natural
enemy populations and predator-pest ratios in IPM plots, as well as an
increase in the total number of species, substantiating the positive impacts
of IPM on the environments. However, showing the correlation between risk
reduction and increased populations and species diversity requires further
studies.

Chapter 7: Impact of FFS on the Environment 101
References AFT (2003): American Farmland Trust, Center for Agriculture and Environment, 4th IPM
Symposium: IPM Evaluation and Impact Session, 2003: http://www.aftresearch.org/ipm/symposium.htm
Dushoff, J., B. Caldwell, and C. L. Mohler (1994). Evaluating the environmental effect of pesticides: A critique of the Environmental Impact Quotient. American Entomologist, Fall 1994
CEC (1994). Council Directive 94/43/EC. Establishing Annex VI to Directive 91/414/EEC. Official Journal of the European Communities Number L227. Commission of the European Communities, Luxembourg, 1 September 1994, p31
Ecotoxnet - Extension Toxicology Network, Pesticide Information Profiles: http://ace.ace.orst.edu/info/exotoxnet.htm
Eklo, O. M. (2002). Risk reduction of pesticide management with use of risk indicator models as part on Integrated Pest Management in the Hanoi district of Vietnam. In: Biological Control of Crop Pests. Proceedings from a Vietnamese-Norwegian Workshop, 25-26 September 2001, Ås, Norway, Occasional Papers from The Norwegian Crop Research Institute, Grønn forskning 13/2002, pp. 111-114
Khan M. A., I. Ahmad and M. H. Soomro (2004). Impact of IPM based plant protection practices on Biodiversity and Biosafety: evidence from Pakistan. paper presented in Regional Workshop on IPM-FFS Impacts Analysis, organized by FAO-EU IPM Programme for Cotton in Asia, FAO Regional Office for Asia & Pacific, 39 Phra Atit Road, Bangkok, Thailand, 18pp.
Khan M. A., I. Ahmad and M. H. Soomro (2004). Impact of FFS-based IPM knowledge and practices on rural poverty reduction: evidence from Pakistan. paper presented in Regional Workshop on IPM-FFS Impacts Analysis, organized by FAO-EU IPM Programme for Cotton in Asia, FAO Regional Office for Asia & Pacific, 39 Phra Atit Road, Bangkok, Thailand, 15pp.
Kovach, J., C. Petzoldt, J. Degni, J. Tette (1992). A method to measure the environmental impact of pesticides. New York’s Food and Life Sciences Bulletin No. 139, Cornell University, Ithaca, NY, USA, 8pp
Kovach, J., C. Petzoldt, J. Degni, J. Tette (2003). A method to measure the environmental impact of pesticides. Table 2, List of Pesticides: http://nysipm.cornell.edu/publications/EIQ.html
Levitan, L., I. Merwin and J. Kovach (1995). Assessing the relative environmental impacts of agricultural pesticides: The quest for a holistic method. Agriculture, Ecosystems and Environment 55: 153-168
Levitan, L. (1997). An overview of pesticide impact and risl assessment systems. OECD Workshop on Pesticide Risk Indicators, Copenhagen, 21-23 April 1997.
Levitan, L. (2000). How to and “why”: assessing the enviro-social impacts of pesticides. Crop Prot. 19, 629-636; see: Pesticides, IPM, & Risk Indicators, Cornell University. http://environmentalrisk.cornell.edu/pri.htm
OECD (1997). Report of the OECD workshop on pesticide risl indicators. Copenhagen 21-23 April 1997, 31 pp.
OECD (2001). Report of the OECD Workshop on the Economics of Pesticide Risk Reduction in Agriculture, Copenhagen, 28-30 November 2001
102 Chapter 7: Impact of FFS on the Environment
OECD (2002). Evaluation Progress in Pesticide Risk Reduction: Summary Report of the OECD Project on Pesticide Aquatic Risk Indicators, Paris, 2002
PAN Pesticides Database http://www.pesticideinfo.org
PMEP, The Pesticide Management Education Program at Cornell University, Ithaca, NY, USA http://pmep.cce.cornell.edu/
PRDIS (2003). Impact Assessment of Cotton Integrated Pest Management (IPM) through Farmer Field School Approach. A Study in Karnataka State, India. July 2003. Participatory Rural Development Initiatives Society, 3-6-65/1/7, Basheerbagh, Hyderabad – 500 029, July 2003, 219 pp.
Reus, J., P. Leendertse, C. Bockstaller, I. Fomsgaard, V. Gutsche, K. Lewis, C. Nilsson, L. Pussemier, M. Trevisan, H. van der Werf, F Alfarroba, S. Blümel, J. Isart, D. McGrath, T. Seppälä (1999). Comparing environmental risk indicators for pesticides. Results of the European CAPER project. CLM, Utrecht, The Netherlands, 184 pp.
USEPA, Ecotox Database: http://www.epa.gov/ecotox/ecotox_home.htm
USEPA, Integrated Risk Information System (IRIS): http://www.epa.gov/iris.htm
Vercruysse, F., W. Steurbaut (2002). POCER, the pesticide occupational and environmental risk indicator. Crop Prot. 21: 307-315, 2002
Watson, G. W. (2003). Consultancy reports on duty travel to India, 15-19 August 2003 and Bangladesh 1-15 November 2003. FAO-EU IPM Programme for Cotton in Asia, FAORAP, Bangkok
WHO/FAO Data Sheets on Pesticides, IPCS, INCHEM http://www.inchem.org; www.fao.org/docrep
Yang, Puyun, Lifeng Wu and Libing Wang (2003). Draft Report of Impact Assessment of Cotton IPM-FFS in Yincheng City, Hubei Province, China. NATESC, MoA, Beijing 100026, P.R. China

8 IPM-FFS Training Is Crucial for Sustaining Bt Cotton – A Case Study from Hubei Province, P. R. China
Puyun Yang1, Lifeng Wu1, Libing Wang2, Jingyuan Xia1, Xianwei Li3
8.1 Methodology Sampling
Two townships, Huangtan and Nanyuan were selected in Yingcheng
County for conducting farmer household surveys. In Huangtan township
farmer field school (FFS) training for Integrated Pest Management (IPM) in
cotton was conducted in 2001, while Nanyuan township is the control
township where no cotton IPM-FFS activities were carried out. The distance
between these two townships is about 35 kilometers, Three villages,
namely Yujia, Longwan and Sanba in Huangtan township which held cotton
IPM-FFS in 2001 were selected as the IPM villages, three control villages,
namely Yifenchang, Erfenchang and Maihang village in Nanyuan township
were selected as the control villages.
Three treatments were established: (i) IPM farmers, who participated in
cotton IPM-FFS in 2001, (ii) exposed farmers (non-IPM farmers), who did
not participated in a cotton IPM-FFS but live in the same community
(village) with IPM farmers, and (iii) control farmers, who are sampled from
the three villages of the control townships, and are assumed to have no
exposure to cotton IPM-FFS.
Three groups of 20 IPM farmers each were randomly selected from 28
cotton IPM-FFS graduates in Sanba village, 27 graduates in Yujia village
and 28 graduates in Longwan village. Hence a total of 60 IPM farmers is
included in the study. Also, three groups of 20 exposed farmers (who did
not participate in the 2001 cotton IPM-FFS) were randomly selected from 1 National Agro-Technical Extension and Service Center, Ministry of Agriculture, Beijing, P. R.
China 2 General Station of Plant Protection of Hubei Province, Wuhan , P. R. China 3 Plant Protection Station of Yingchen County, Hubei, P. R. China

104 Chapter 8: IPM-FFS Training and Bt Cotton in Hubei Province, P. R. China
the three IPM villages selected in each IPM village, and three groups of 20
control farmers each who were not exposed to cotton IPM-FFS were
randomly selected from the three control villages of the non IPM townships.
The total sample for this study hence comprises 180 farmers, 60 IPM,
exposed and control farmers, respectively.
Pilot Test
The pilot test for the farmer household surveys was done in late April 2001
before the baseline survey was conducted. A sample of 6 randomly
selected farmers were surveyed to test the consistency and
comprehensibility of the questionnaires (both baseline and post-training
survey questionnaires). The questionnaires were revised and improved
based on the results of pilots test. Subsequently, the enumerators shared
their experiences gathered during the survey and were further trained to
ensure the quality of farmer household surveys.
Baseline Survey
The baseline survey was carried out in May 2001, the questionnaire was
used to collect recall information of farmers’ agricultural performance in the
2000 season. For the survey the enumerators were organized in groups of
2-3 persons to interview the sample farmers in one village. All the 60 FFS
participants and 60 sample exposed farmers from the three IPM villages,
and 60 control farmers from the non IPM villages were interviewed
individually using the same questionnaire.
Post-Training Surveys
Post training surveys were carried out monthly (8 times) throughout the
whole cotton season (May to December) in 2002 with all 180 sample
farmers (IPM farmers, exposed farmers and control farmers). Farmers were
asked to keep individual daily records (recording forms were distributed to

Chapter 8: IPM-FFS Training and Bt Cotton in Hubei Province, P. R. China 105
the sample farmers before the cotton season) of agronomic activities in
cotton plots. For example, the date of preparing fields, seed treatments, sowing, fertilizing, transplanting, irrigation, spraying, weeding and harvest,
the size of plots, amount of precipitation and the names of varieties etc.
Input costs, including pest control and labor inputs, were also recorded. The
use of pesticides was recorded in detail including the type, name and
amount of pesticide sprayed. The enumerators visited each of the 180 farm
households once a month to crosscheck the recorded information prior to
computer entry and analysis and assist the farmers if necessary.
Information on local market prices of agro-chemicals including pesticides,
fertilizers and plant growth regulators was collected regularly to determine
the costs of inputs. The actual amounts of cotton hand-picked by farmers
were recorded during the harvest season and used as the basis for
estimating total cotton production. Gross revenues for the plots were then
calculated using these estimates and the prevailing local prices for cotton
output. The costs of labor, pesticide, fertilizers and plant growth regulators
needed to compute the net revenue were also based on local market
prices.
Data Processing and Analysis
The survey data were encoded, entered into Excel sheets and verified prior
to analysis. Variation analysis was done by using Excel 2000, and SAS
(Version 8.0).
8.2 Results The Adoption Rates of Bt Cotton
Bt cotton was initially released into the fields for trials in very small scales in
Hubei province in 1999. The Bt cotton varieties were independently
developed by the cotton research institute, biotechnology research center of
Chinese Academy of Agricultural Sciences (CAAS) and the US based

106 Chapter 8: IPM-FFS Training and Bt Cotton in Hubei Province, P. R. China
company Monsanto. There were over 20 Bt cotton varieties available in the
market in 2001. The most varieties 33B and 32B (Monsanto) occupied the
biggest proportion. Other major varieties are Zhongmian-29, 38 and 39 from
cotton research institutes of CAAS, and SGK-321 from the biotechnology
research center of CAAS.
The adoption of Bt cotton has increased from 2000 to 2002. Results of the
farmer household survey showed that the Bt cotton adoption increased by
89%, 50% and 20% in the IPM, exposed and the control farmer group,
respectively (Table 8-1).
Table 8-1: Adoption of Bt Cotton in the Sample by Category
Numbers of farmer households adopted Bt cotton 2000 2002 Change between
2000 and 2002 Change
Control farmers (n=60) 20 24 4 20% IPM farmers (n=60) 19 36 17 89% Exposed farmers (n=60) 18 27 9 50%
Gross Margin Analysis of Cotton Productions by Farmer Categories
The results showed that the gross margins of cotton production for the
farmers in the control group who planted Bt cotton did not show a significant
change between 2000 and 2002. However their gross margins decreased
rather than increased (-6.7%) while cotton yields increased by 5.4% over
the three years. For those control farmers who planted conventional cotton,
gross margins decreased significantly (-21.6%). Over the same period, the
cotton gross margins of IPM farmers who planted Bt cotton increased
significantly (29.7%), and the IPM farmers who planted conventional cotton
also realized 27.1% higher gross margins. For the group of exposed
farmers, gross margins increased significantly by 16.8% and 17.6%, for
those planting Bt cotton and conventional cotton, respectively (Table 8-2).

Chapter 8: IPM-FFS Training and Bt Cotton in Hubei Province, P. R. China 107
Table 8-2: Impacts of IPM-FFS and Bt Cotton on Gross Margins by Farmer Category
Gross margins (US$/ha) Categories
2000 2002
Change between 2000
and 2002
Change [%]
SAS Anova (F=0.77, p=0.57)
Duncan’s test
SAS Anova (F=52.3,
p<0.0001) Duncan’s test
T test
Control farmers with Bt cotton (n=20 in 2000, 24 in 2002)
1174.0a 1095.1d -78.9 -6.7%
Control farmers with the conventional cotton (n=40 in 2000, 36 in 2002)
1138.4a 910.7c -228.4* -21.6%
IPM farmers with Bt cotton (n=19 in 2000, 36 in 2002)
1166.8a 1513.1a 346.3** 29.7%
IPM farmers with the conventional cotton (n=41 in 2000, 24 in 2002)
1201.9a 1551.6a 349,7** 29.1%
Exposed farmers with Bt cotton (n=18 in 2000, 27 in 2002)
1038.2a 1212.9b 174.7* 16.8%
Exposed farmers with the conventional cotton (n=42 in 2000, 33 in 2002)
1085.4a 1276.4b 191* 17.6%
Note: * Significant at 0.05, ** Significant at 0.001; Gross margin = yield x cotton price – total variable inputs (including seeds, pesticides, fertilizers etc.).
In the year 2000, there was no significant difference among the gross
margin for the three different goups (IPM, control and exposed farmers),
and there was also no significant difference between those farmers who
planted Bt cotton and those using conventional varieties (Table 8-2).
In the year 2002, the IPM farmers got the highest economic returns. This
holds true for all trained farmers, no matter whether they are adopters of Bt
cotton or not. The exposed farmers got significant higher economic returns
than the control farmers, though lower returns than the FFS participants.
The control farmers had significantly lower gross margins than IPM and
exposed farmers and those control farmers who planted conventional
cotton varieties performed worst (Table 8-2).
108 Chapter 8: IPM-FFS Training and Bt Cotton in Hubei Province, P. R. China
8.3 Conclusions
Based on the findings of this study, it can be concluded that farmers’
education in IPM is crucial not only for the cultivation of conventional cotton
varieties, but also for the production of Bt cotton. The results indicate that
IPM farmers obtained higher net incomes irrespective of the variety they
were using (both conventional and Bt cotton).
In most previous academic studies of Bt cotton impact on the field level,
economic analysis was based on a comparison between Bt and non-Bt
cotton production leading to a parochial and outdated top-down delivery
mechanism (Wugang et al., 1999, Jingyuan et al., 1999, Rong and Puyun,
2001). The issue on the sustainability of Bt cotton is raised as the number
of farmers who adopted Bt cotton increased dramatically without the
appropriate ecological knowledge. Many ecological repercussions were
experienced in the past in the applications of new technologies developed
during the “green revolution” when no efforts were taken to enhance
farmers’ knowledge (Qingnian et al., 2000, Yingqian, 1999).
The introduction of Bt cotton into the Chinese cotton ecosystem offers both
challenges and opportunities. The technology aims at a reduction of
pesticide applications without compromising economic and ecological
returns. In large scale farming systems, the so-called “high dose/refuge
strategy” is recommended as a countermeasures to overcome or slow-
down the development of pest resistance; but it is considered that the high
dose/refuge strategy is unsuitable for the diverse smallholder farming
systems prevalent in China (Jingyuan et al., 1999; Yingqian, 1999). The
study demonstrates that farmer training following the IPM-FFS approach is
crucial for the sustainability of Bt cotton. Enhanced knowledge of farmers is
required in order to better understand the ecological impacts of Bt cotton in
smallholder farming systems and develop an ecological approach to use Bt
cotton in an effective and sustainable way

Chapter 8: IPM-FFS Training and Bt Cotton in Hubei Province, P. R. China 109
The study shows that the economic returns of Bt cotton production depend
on various factors, such as the state of the agro-ecosystem, infestation
levels of the target pests, and location of the cotton region (Wugang et al.,
1999; Jingyuan et al., 1999; Qingnian et al., 2000). Based on our findings
and previous academic research in the Yangtze River valley zone, Bt cotton
does not have a significantly higher economic return as compared to the
local conventional cotton. As such, it is envisaged that the future adoption
of Bt cotton in this zone may not reach the high level that was originally
expected. Moreover, there are a number of uncertainties, such as the
severance of bollworm infestation, changes in the cropping systems,
uncertain weather conditions, and unpredictable strong fluctuations in
cotton prices.
References Wang Wugang, Wu Kongmin, Lian Gemei et al. (1999): Occurrence of cotton pests in the
Bt cotton fields and its control startegy. Plant protection (Chinese), 25(1):3-5.
Xia Jingyuan, Cui Jingjie, Ma Lihua et al. (1999): The role of Transgenic Bt cotton in Integrated Insect Pest Management. Acta Gossypii Sinica, 11(2):57-64
Guo Rong, Yang Puyun (2001): The progress of on-farm researches on the integrated pest management of Bt cotton. NATESC Newsletter (Chinese), 55:1-7.
Liu Qingnian, Li Jingwen, Wang Xufen et al. (2000): Preliminary studies on the population characteristics of key cotton pests and natural enemies of Bt cotton. Cotton Bulletin (Chinsese), 27(10):20-21.
Qian Yingqian (1999): Analysis of advantages and disadvantages on transgenic crops. Biotechnology information (Chinese), 15(5).

9 Impact of FFS-based IPM Knowledge and Practices on Rural Poverty Reduction: Evidence from Pakistan
Muhammad Azeem Khan1 and Iftikhar Ahmad2
9.1 Background In Pakistan, agriculture is the driving force of the national economy. Sixty-
seven percent of the total population lives in rural areas and is directly or
indirectly dependent on agriculture for sustenance. Agriculture contributes
26% to GDP, absorbs 47% of the labor force and meets food requirements
of the growing population. With virtually all available cultivable land and
water resources now being used, pressure on the country's natural
resources is growing and environmental problems have already reached
critical levels. The pressure to increase production is enormous on low
income and resource poor small farms.
Poverty in Pakistan has historically been higher in rural communities than in
cities. However, due to a fast agricultural growth in the 1970s and the first
half of 1980s, poverty had declined. A slow-down in agricultural growth in
the 1990s has had an adverse impact on poverty reduction (Pasha and
Palnivel, 2003). Poverty rose sharply in the rural areas in the 1990s, and by
1999 the incidence of rural poverty (36%) was significantly higher than
urban poverty (23%). Some rural areas are more affected by poverty than
others. Poverty is particularly manifested in many remote rural areas with
landless labor depending on agriculture. The poor are also characterized by
their vulnerability to environmental degradation and deterioration of the
natural resource base, given that they tend to be strongly dependent on the
exploitation of such resources.
1 Principal Scientific Officer, National IPM Programme, National Agricultural Research Center,
Park Road, Islamabad, Pakistan 2 Deputy Director General/ National IPM Coordinator, National Agricultural Research Center, Park
Road, Islamabad, Pakistan

Chapter 9: FFS Impact on Rural Poverty Reduction in Pakistan 111
Farmer Field School (FFS) based Integrated Pest Management (IPM) was
initiated in cotton growing areas of Pakistan to address the persistent rural
poverty among small-scale farmers characterized by inadequate incomes,
lack of food security and cumulative damage to the productive land. Among
the large numbers of resource-poor smallholders in the country, a
substantial proportion is trying to cope with unprofitable and ecologically
degraded land. The FFS approach has been designed not only to enhance
farmer skills and knowledge but also to create new institutions for farmers-
to-farmers knowledge transfer, to reform existing extension institutions for
participatory skills transfer and improve linkages among development
agencies, research institutions, extension departments and organised
farming communities. It is now well recognised that institutions matter in the
development process and can lead to higher investment levels, better
policies, increase in social capital stock of community, and better
management of ethnic diversity and conflicts (see for example North, 1990,
1994; Jutting, 2003; Rodrik, et al., 2002; Dollar and Kray, 2002; World
Bank, 2002; Aron, 2000; Chu, 2001; and Frischtak, 1995).
The overall objective of this study was to conduct a first assessment of the
poverty implications of FFS. The specific objectives of the study included: (i)
to assess the impact of FFS-based IPM approach on income derived from
cotton; (ii) to develop data bases to measure transition in poverty profiles
and (iii) to measure the programme impacts on changes in poverty.
9.2 Methodology Sample Area and Size
IPM impact assessment was conducted in the cotton growing areas of
Sindh province. Khairpur District in northern Sindh was purposively selected
because of the presence of a large number of small and tenant farming
communities and increasing pesticide use scenarios (Government of
Pakistan 2001 and 2003). The low income and high poverty profile was

112 Chapter 9: FFS Impact on Rural Poverty Reduction in Pakistan
another factor behind this selection (Development Statistics of Sindh,
1998).
At a second stage, 4 FFS villages were selected from four different clusters
of FFS situated in 4 adjoining Tehsils. Finally 4 control villages within a
20 km radius were selected in the adjoining Sukkur District, which were
nearly 60 kilometer away from the nearest FFS project areas of Khairpur
district. About 100 FFS-participating farmers (all 25 farmers per FFS), 60
non-FFS (15 from each FFS village) from 4 IPM villages and 60 control
farmers from 4 non-IPM villages (15 farmers per village) were interviewed.
Data Collection
The baseline survey was conducted during July 2002 immediately after the
formation of the FFS training groups, and information was collected about
the 2001 cotton crop. The post FFS-impact survey was conducted during
the 2003 cotton season through multiple visits in three rounds. Information
was collected through a formal survey on quantities and cost of traction
power, fertilizer, seed and irrigation inputs used. Family and hired labor use
with gender distribution was also gathered to compute opportunity and cash
costs paid for seed sowing, weeding, fertilizer and pesticide applications
and cotton picking. Information on area allocation to Rabi and Kharif crops
was collected along with total production and estimated values of total
outputs. Data on livestock and poultry enterprises numbers and outputs
was also collected in the sample survey. Off-farm employments and
sources of income were gathered from all sample households. Resource
persons were interviewed in all 8 villages to gather information on inputs
use and prices for all other crop and livestock enterprises for constructing
individual enterprise budgets.

Chapter 9: FFS Impact on Rural Poverty Reduction in Pakistan 113
Analytical Methods
Mean, standard deviation and paired T-test statistics was used to highlight
the differences in the household incomes, production costs and input and
structural variables at farms. The gross margin of cotton was estimated to
compare the differential among different sample categories with before and
after scenarios. Enterprise budgets were prepared and net incomes were
calculated for all crops and livestock enterprises for measuring net
household incomes.
Poverty lines were based on Ahmed (1993) who estimated these for rural
and urban areas based on an explicit listing of cost of meeting basic needs.
While it is recognized that there are other poverty dimensions (e.g. Havinga
et al., 1989; Anwar 1996; Bhatti et al., 1999) in this study we consider
income as a measure of poverty unlike studies by some other researchers
like Ali and Tahir (1999), Malik (1988) used income as a measure of living
standard. Malik (1988), Qureshi and Arif (2001) estimated the basic need
poverty line for Pakistan.
Hence, in this study, per capita income of the households was used as the
criterion to assess the poverty status of the households.
Estimation of Total Income, Total Cost and Net Income
To calculate the net income, as a first step, budgets were prepared for the
individual enterprises in different sample situations. The total income was
computed from the incomes received from the final sale of the products, i.e.
total value of the product or revenue from the main product as well as from
by-products. The revenue earned by production activities is the type and
quantity of outputs, and their market prices. The types of output per
production activity were categorized into main product and by-product.
Given the prices received for each output, the total revenue earned from
each activity xj was measured as:

114 Chapter 9: FFS Impact on Rural Poverty Reduction in Pakistan
r p yj n j tt
T
n
N
n j t===
∑∑11
Where pnjt is the unit price of the nth output of activity j in time period t; ynjt is
the yield of the nth output produced from one unit of activity j (ha) in time
period t; and n = 1,….,N denotes the outputs.
The total variable cost of the inputs used to produce one unit (ha) of each
enterprise consists of cash costs and in-kind costs which were normally
opportunity costs. The opportunity costs were estimated for the operations
performed by owned farm machines, family labour and farm inputs (farm
yard manure and seed). The cash costs were paid for inputs like fertilizer,
herbicide, insecticide, fuel, improved seed, casual hired labour, picking and
transportation. The total variable costs to produce an activity xj were
specified as:
c p aj ijt
t
T
i
k
ij t===
∑∑11
Where pijt is the unit price of the ith variable input applied to activity xj in time
period t; aijt is the amount of ith input used by activity xj in time period t; the
subscript t T=1,..., identifies the time intervals within the activity’s production
period. The land rent for each crop according to the duration of crop and
interest at 12 percent per annum was also calculated and included in the
cost. Total cost was calculated as the sum of variable and fixed cost.
The net income from each production activity, that is the difference between
an activity’s per unit revenue and total costs per unit, was computed as:
g r cj j j= −
Where r j is an activity’s per unit revenue and c j is an activity’s per unit total
cost.
As the farm size at the study sites was very small, only family labor was
found applied. Particularly in vegetable farming, all the practices from land

Chapter 9: FFS Impact on Rural Poverty Reduction in Pakistan 115
preparation to marketing was done by the farmers. Therefore total cost
(fixed + variable) and net income was calculated both with and with out
rental cost. The opportunity cost of family labor was calculated at market
price in the study area.
Net Household Income
Net income at average farm level was calculated multiplying the different
area allocations of the production activities with the net income per unit
area. The net income and the respective area allocations were estimated
for all food, cash, vegetable, orchard and livestock enterprises. Total net
household income was calculated by adding net farm and off-farm incomes.
The poverty indices were developed by finally estimating the per capita
income of the individual members of each household on a per month basis.
The poverty line per capita was US$ 12.79 for baseline year and US$ 13.26
for the impact survey year (Table 9-1). Table 9-1: Poverty Line for Different Years
Poverty Line [Rs & US$/ Capita/Month] Years Sensitive Price Index (SPI) Pak Rupees US $
1998-99 - 672.50 11.59 1999-00 1.8 684.61 11.80 2000-01 4.8 717.47 12.37 2001-02 3.4 741.86 12.79 2002-03 3.7 769.31 13.26
Source: Qureshi and Arif (2001) and Pakistan (2001-02)
Poverty Estimation Techniques
The following methods were used to determine poverty profile at sample
farms.

116 Chapter 9: FFS Impact on Rural Poverty Reduction in Pakistan
• Gini Coefficient
Gini (1912) devised the so-called Gini coefficient that can be used to
estimate income inequalities:
G = 1 – [Psi (CYSi + CYSi-1)]
Where,
G = Gini coefficient
Psi = Population share of ith household.
CYSi = Cumulative income share of ith household.
CYSi-1 = Cumulative income share of i-1th household.
• Redistribution Index
The redistribution index (R) indicates whether the poor part of the
population can be compensated through a shift in income from the rich part
of the population to the poor. With the index smaller than 1, the rich
population is able to provide the compensation:
q N-q
R = ∑ (Z-Yi) / ∑ (Yi-Z) i = 1 i = j
Where,
R = Redistribution index.
Z = Poverty line
Yi = Income of the ith household
N = Total number of households
q = Number of households below the poverty line (poor households).

Chapter 9: FFS Impact on Rural Poverty Reduction in Pakistan 117
• Foster Greer Thorbecke index
Foster et al. (1984) introduced a flexible poverty index known as FGT index.
FGT index has an advantage that it incorporates the factor of poverty
aversion. The measure in its general form is given below:
q
Pα = 1 /n ∑ {(Z – Yi) / Z}α i =1
Where,
Pα = FGT poverty measure, α is the measure of poverty aversion,
n = Total number of individuals
q = Number of individuals having monthly income below poverty line
Z = Poverty line (level of income at which poverty begins)
Yi = Income of ith individual
The salient feature of FGT index is the measure of poverty aversion “α”.
For α = 0, the FGT poverty measure becomes the head-count ratio, the
proportion of individuals below the poverty line.
For α = 1, the FGT poverty measure becomes poverty gap index. It takes
into account the income of the poor below the poverty line and its distance
from the poverty line. The index is sensitive to the number of poor and the
extent of poverty.
For α = 2, the FGT measure is sensitive to the distribution of income among
the poor, i.e. households with income far below the poverty line receive a
stronger weight.

118 Chapter 9: FFS Impact on Rural Poverty Reduction in Pakistan
9.3 Results Cotton Share in Household Income
Cotton was the central point of learning and practicing IPM-based
knowledge for farm level production activities hence cotton income changes
are crucial for changes in poverty. Table 9-2 shows that before training, the
share of cotton in gross household income was higher on control farms
whereas, net income share was higher by 8% on FFS farms. After training
in 2003 cotton gross income share was still higher on control farms (59%)
than FFS farms. However, share of net cotton income for FFS farms
increased to 46% which was much higher than the change in non-FFS and
control farms (12%). The results highlight that net income estimates truly
reflect the contribution of cotton as a cash crop towards total net gains of
the farming households.
Table 9-2: Cotton Share in Total Household Income
Gross Income [US$/year]
Net Income [US $/year]
Cotton Share in Gross Income
Cotton Share in Net Income Year Categories N
Mean SD Mean SD (%) (%) FFS 78 3617 3389 1463 1439 39 20 Non-FFS 59 3452 2986 1402 1742 39 12 Control 53 3257 2226 706 1067 60 12 Overall 190 3465 2967 1233 1482 45 16
2001
Sig. .794 .009 FFS 78 5170 6350 2548 3057 43 46 Non-FFS 59 3484 3121 1479 1830 36 18 Control 53 3616 3327 715 1425 59 12 Overall 190 4213 4807 1705 2445 45 34
2003
Sig. .071 .000
Table 9-3 shows the T-test significance and percentage change in the total
gross and net household income. Comparison between baseline and
impact years shows that both gross and net income were significantly
different at 1% levels on FFS farms but were not significant for the other
two categories.

Chapter 9: FFS Impact on Rural Poverty Reduction in Pakistan 119
Table 9-3: Change in the Household Gross and Net Incomes
Categories Gross Income (2001 vs. 2003)
Net Income (2001 vs. 2003)
T-Test Sig. Change (%) T-Test Sig. Change (%) FFS 0.006 (+) 43 0.000 (+) 74 Non-FFS 0.924 (+) 1 0.641 (+) 5 Control 0.367 (+) 11 0.952 (+) 1 Overall 0.007 (+) 22 0.001 (+) 38
Tables 9-4 and 9-5 show actual levels of land holding, cotton area and
cropping intensity. There was no significant difference in land holding
before the training among the three groups. This was opposite for the area
planted to cotton and the cropping intensity. The latter was highest for FFS
farmers and the former highest for control farmers. In 2003 the general
pattern largely remained the same but the significance levels were lower.
Hence testing for changes within the groups reveals that these were highest
for FFS farmers for all the three criteria. Furthermore the increase in cotton
area was clearly significant. This could be a result of higher cotton
productivity as experienced by trained farmers. The increase in land holding
is not necessarily attributakble to the training but may have been the result
of an increase in rent-in areas and the pooling land resources among
relatives. Further studies are needed to explore to what extent the collective
action which is promoted by the FFS can lead to other institutional changes
that may have positive income and poverty reduction effects.
Table 9-4: Operational Land holdings, Area Allocation to Cotton and Cropping Intensities
Operational holding [ha]
Cotton area [ha]
Cropping intensity [%] Year Categories N
Mean SD Mean SD Mean SD FFS 78 2.71 3.15 1.95 2.23 183 27 Non-FFS 59 2.77 2.25 1.91 1.72 182 29 Control 53 3.24 1.94 2.82 1.68 165 37 Overall 190 2.88 2.58 2.18 1.97 178 32
2001
Sig. 0.490 0.020 .002 FFS 78 3.37 4.15 2.80 3.55 204 107 Non-FFS 59 2.69 3.14 2.00 2.37 185 28 Control 53 3.50 2.70 3.25 2.57 164 37 Overall 190 3.19 3.49 2.68 2.99 187 74
2003
Sig. 0.390 0.079 .010

120 Chapter 9: FFS Impact on Rural Poverty Reduction in Pakistan
Table 9-5: Change in Land Holdings, Cotton Area and Cropping Intensity (2001 vs. 2003)
Categories Operational holding Cotton area Cropping intensity
T-Test Sig. Change
[%] T-Test Sig. Change
[%] T-Test Sig. Change
[%] FFS 0.052 (+) 24 0.007 43 0.085 (+) 21.28 Non-FFS 0.779 (-) 3 0.707 5 0.476 (+) 3.29 Control 0.502 (+) 8 0.237 15 0.936 (-) 0.63 Overall 0.118 (+) 11 0.006 23 0.092 (+) 9.58
Poverty Profile
Table 9-6 shows that during 2001, nearly 71% of the FFS farms were below
poverty line. This proportion decreased to 55% during 2003. Among non-
FFS and control farmers poverty headcounts were 75% and 89%
respectively during baseline period. Among these two groups poverty also
reduced slightly to 69% and 85% respectively. Among households of the
non-FFS and control farms, only 4-6% farmers could were able to get out of
poverty while FFS farmers these were 16%.
In addition to the headcount ratio poverty gap was also reduced for FFS
relative to non-FFS farmers. For control farmers the poverty gap even had
increased.. Overall the results show that if income from cotton can be
increased this can have positive implications for poverty reduction. The
Gini-income coefficients indicate that income inequalities had increased in
all three groups while the change was less pronounced in the FFS group.
Also the income redistribution index for FFS farmers declined from 1.03 (i.e.
full compensation not possible ) to 0.34, i.e. a level where the income of the
rich within the group would be theoretically sufficient to compensate the
poor.

Chapter 9: FFS Impact on Rural Poverty Reduction in Pakistan 121
Table 9-6: Poverty During Pre- and Post FFS Scenario FGT Index
Headcount Measure
Poverty Gap
Measure Foster-Greer-
Thorbecke
Gini Income
Redistribution Index Year Farm
Type
α = 0 α = 1 α = 2 FFS 0.71 0.38 0.24 0.43 1.03 Non-FFS 0.75 0.47 0.37 0.54 1.38 Control 0.89 0.47 0.60 0.80 7.90
Baseline 2001
Overall 0.77 0.48 0.38 0.55 1.72 FFS 0.55 0.25 0.15 0.47 0.34 Non-FFS 0.69 0.39 0.27 0.52 0.88 Control 0.85 0.70 0.80 0.95 7.49
Impact 2003
Overall 0.68 0.42 0.37 0.58 0.90
It could be concluded from these results that the FFS-participating farmers
augmented their income through increasing operational capacities,
increasing areas allocation to cotton (as a major cash crop) and through
adopting better crop management practices.
9.4 Conclusions and Recommendations The analysis on poverty and income distribution underlines the need to
further investigate the participation process of FFS farmers. While in order
to conduct a more comprehensive poverty analysis these data may give
some first indication a larger sample of FFS should be drawn among the
more than 10,000 farmers trained in FFS in Pakistan so far. Nevertheless
this first analysis using the three impact areas are believed to be a good
start to address this important question. It is also concluded that follow-ups
of the FFS activities will be necessary in order to better understand the
need for re-training on the one hand but also to better recognize the
potential for further institutional innovations that can increase the impact of
the FFS approach in terms of environmental improvement and pro-poor
growth in rural areas.

122 Chapter 9: FFS Impact on Rural Poverty Reduction in Pakistan
References
Ahmed, M. (1993): Choice of a Norm of Poverty Threshold and Extent of Poverty in Pakistan. The Journal of Development Studies. 12: 2.
Ali, S.S., and S.Tahir (1999): Dynamics of Growth, Poverty, and Inequality in Pakistan. The Pakistan Development Review. 38(4): 837-858.
Anwar, T. (1996): Structural Adjustment and Poverty: The Case of Pakistan. The Pakistan Development Review. 35(4): 911-926
Aron, J. (2000): Growth and Institutions: A Review of the Evidence. World Bank Research Observer 15:1, 99-135.
Bhatti, M.A., R.Haq and T. Javed (1999): A Sectoral Analysis of Poverty in Pakistan. The Pakistan Development Review. 38 (4): part II. p. 859-872.
Bureau of Statistics (1988): Development Statistics of Sindh, Planning and development Department, Government of Sindh, Karachi-6.
Chu, Ke-young (2001): Collective Values, Behavioural Norms, and Rules: Building Institutions for Economic Growth and Poverty Reduction. WINDER Discussion Paper (WDP 2001/98).
Dollar, D., and A.Kray (2002): Institutions, Trade and Growth. Paper prepared for the Carnegie-Rochester Conference Series on Public Policy.
Foster, J., J.Greer, and E.Thorbecke (1984): A Class of Decomposable Poverty Measures. Econometrica 52: 3.
Frischtak (1995): Overview: From Policy Reform to Institutions Change. In Governance, Leadership and Communication: Building Constituents for Economics Reform. World Bank, Washington, D.C.
Gazadar, H., S. Howes, and S. Zaidi (1994): Poverty in Pakistan: Measurements Trends and Patterns. STICERD, London School of Economics. Background Paper for the Pakistan Poverty Assessment. (Mimeographed).
Gini, C. (1912): Variabilita e Mutabilita. Bologna.
GOP (2000): “1998 District census report of Khairpur” Population census organization statistics Div. GOP, Islamabad.
Government of Pakistan (2003): Economic Survey of Pakistan 2002-2003. Economic Advisor’s Wing, Islamabad.
Havinga, I.C., F.W. Haanappel, A.S. Louter and W.A. van den Andel (1989): Poverty in Pakistan 1984-1985. The Pakistan Development Review. 28 (4): part II. p. 851-869.
Jutting, Johannes (2003): Institutions and Development: A Critical Review. OECD Development Centre. (Technical Papers No.210.)
Malik, M.H. (1988): Some New Evidence of Poverty in Pakistan. The Pakistan Development Review. 27 (4): 509-515.
North, D. (1990): Institutions, Institutional Change, and Economic Performance. Cambridge University Press.
North, D. (1994): Institutions, Institutional Change, and Economic Performance. Cambridge: Cambridge University Press.

Chapter 9: FFS Impact on Rural Poverty Reduction in Pakistan 123
Pasaha H. A. and Palanivel (2003): Pro-poor Growth and Policies: The Asian Experience, The Pakistan Development Review. 42(4): 331-348.
Qureshi, S.K., and G.M. Arif (2001): Profile of Poverty in Pakistan, 1998-99. Pakistan Institute of Development Economics. MIMAP Technical Paper Series No. 5.
Rodrik, D., A. Subramanian, and F. Trebbi (2002): Institutions Rule: The Primacy of Institutions over Integration and Geography in Economic Development. International Monetary Fund, Washington, D. C. (IMF working Paper, WP/02/189.)
World Bank (2002): World Development Report 2002: Building Institutions for Markets. Oxford: Oxford University Press.


University of Hannover PESTICIDE POLICY PUBLICATION SERIES:
AGNE, S., G. FLEISCHER, F. JUNGBLUTH and H. WAIBEL (1995): Guidelines for Pesticide Policy Studies - A Framework for Analyzing Economic and Political Factors of Pesticide Use in Developing Countries. PPP Publication Series No. 1, Hannover. (Also available in French and Arabic).
MUDIMU, G.D., S. CHIGUME and M. CHIKANDA (1995): Pesticide Use and Policies in Zimbabwe - Current Perspectives and Emerging Issues for Research. PPP Publication Series No. 2, Hannover.
WAIBEL, H. and J.C. ZADOKS (1995): Institutional Constraints to IPM. Papers presented at the XIIIth International Plant Protection Congress (IPPC), The Hague, July 2-7, 1995. PPP Publication Series No. 3, Hannover.
AGNE, S. (1996): Economic Analysis of Crop Protection Policy in Costa Rica. PPP Publication Series No. 4, Hannover.
JUNGBLUTH, F. (1996): Crop Protection Policy in Thailand - Economic and Political Factors Influencing Pesticide Use. PPP Publication Series No. 5, Hannover.
FLEISCHER, G., V. ANDOLI, M. COULIBALY and T. RANDOLPH (1998): Analyse socio-économique de la filière des pesticides en Côte d'Ivoire. PPP Publication Series No. 6/F, Hannover.
POAPONGSAKORN, N., L. MEENAKANIT, F. JUNGBLUTH and H. WAIBEL (eds., 1999): Approaches to Pesticide Policy Reform – Building Consensus for Future Action, A Policy Workshop in Hua Hin, Thailand, July 3 - 5, 1997. PPP Publication Series No. 7, Hannover.
WAIBEL, H., G. FLEISCHER, P.E. KENMORE and G. FEDER (eds., 1999): Evaluation of IPM Programs - Concepts and Methodologies. Papers presented at the First Workshop on Evaluation of IPM Programs, Hannover, March 16 - 18, 1998. PPP Publication Series No. 8, Hannover.
FLEISCHER, G., F. JUNGBLUTH, H. WAIBEL and J.C. ZADOKS (1999): A Field Practitioner’s Guide to Economic Evaluation of IPM. PPP Publication Series No. 9, Hannover.
GERKEN, A., J. SUGLO and M. BRAUN (2001): Pesticides Use and Policies in Ghana – An Economic and Institutional Analysis of Current Practice and Factors Influencing Pesticide Use. PPP Publications Series No. 10, Hannover.
AFFOGNON, H.D. (2002): Crop Protection Policy in Benin - Factors Influencing Pesticide Use. PPP Publications Series No. 11, Hannover.
All publications and other project related information are also available at: http://www.pesticide-policy-project.de

University of Hannover PESTICIDE POLICY PUBLICATION SERIES, Special Issues:
MUDIMU, G.D., H. WAIBEL and G. FLEISCHER (eds. 1999): Pesticide Policies in Zimbabwe – Status and Implications for Change. PPP Publication Series Special Issue No.1, Hannover.
AGNE, S. (2000): The Impact of Pesticide Taxation on Pesticide Use and Income in Costa Rica’s Coffee Production, Publication Series Special Issue No.2, Hannover.
AJAYI, O. (2000): Pesticide Use Practices, Productivity and Farmers’ Health: The Case of Cotton-Rice Systems in Côte d’Ivoire, West Africa; PPP Publication Series Special Issue No. 3, Hannover.
JUNGBLUTH, F. (2000): Economic Analysis of Crop Protection in Citrus Production in Central Thailand, PPP Publication Series Special Issue No. 4, Hannover.
HARDEWEG, B. (2001): A Conceptual Framework for Economic Evaluation of Desert Locust Management Interventions, PPP Publication Series Special Issue No. 5, Hannover.
AJAYI, M. CAMARA, G. FLEISCHER, F. HAÏDARAI, M. SOW, A. TRAORÉ and H. VAN DER VALK (2001): Socio-economic Assesment of Pesticide Use in Mali, PPP Publication Series Special Issue No. 6, Hannover.
ORPHAL, J (2005): Comparative Analysis of the Economics of Bt and Non-Bt Cotton Production, PPP Publication Series Special Issue No. 8, Hannover
All publications and other project related information are also available at: http://www.pesticide-policy-project.de