Industrial Audit of Chemical and Water Systems for Sustainability
Environmental Pollution 136 (2005) 331e340
www.elsevier.com/locate/envpol
The impact of the Almalyk Industrial Complexon soil chemical and biological properties
Nosir Shukurova,b, Stanislav Pen-Mouratova, Yosef Steinbergera,*
aFaculty of Life Sciences, Bar Ilan University, Ramat Gan, Israel 52900bInstitute of Geology and Geophysics, Academy of Sciences of Uzbekistan, 49, N. Khodjibaev Street, Tashkent 700041, Uzbekistan
Received 24 March 2004; accepted 13 December 2004
Soil nematodes and microbes are suitable biomonitors for metals in soils.
Abstract
The effect of heavy metals on soil free-living nematodes, microbial biomass (Cmic) and basal respiration (BR) was studied along
a 15 km downwind deposition gradient, originating at the Almalyk Industrial Complex. Soil samples from 0e10 and 10e20 cmlayers were collected at 5 km intervals. A significant decrease in heavy metal deposition was found going from the source in thedownwind direction and with depth. The soil microbial biomass, basal respiration and derived microbial indices for soil samples
from the Almalyk industrial area were analysed. The lowest soil microbial biomass and total number of free-living nematodes werefound in soil samples near the industrial complex, with a high heavy metal and weak total organic carbon (Corg) content. The highestCmic was found in the soil samples collected 15 km from the pollution source. BR displayed similar results. The derived indices,
metabolic quotient (qCO2) and microbial ratio (Cmic/Corg), revealed significant differences with distance, confirming environmentalstress in the first and second locations. The present study elucidates the importance of soil nematode and microbial populations assuitable tools for bio-monitoring the effect of heavy metals on soil systems.
� 2005 Elsevier Ltd. All rights reserved.
Keywords: Heavy metals; Soil; Contamination; Bioindicators
1. Introduction
Metal mining and smelting activities are importantsources of heavy metal air pollution, and result inconsiderable soil contamination (Davies, 1983; Alloway,1990). The main pollutants, including Pb, Zn, Cu, Cd,and As, are usually dispersed in relatively higherconcentrations in the vicinity of an industrial complex,with a gradual depletion as distance from the sourceincreases (Thornton et al., 1980; Kabata-Pendias andPendias, 1989; Verner et al., 1996; Wilcke et al., 1999).According to Steinnes et al. (1997); Loska et al. (2003),
* Corresponding author. Tel.: C972 3 5318571; fax: C972 3
5351824.
E-mail address: [email protected] (Y. Steinberger).
0269-7491/$ - see front matter � 2005 Elsevier Ltd. All rights reserved.
doi:10.1016/j.envpol.2004.12.007
long-range atmospheric transport is one of the mainfactors for dispersion and deposition of a wide range ofpollutants.
The long-standing Almalyk mining and smeltingindustrial facility in Uzbekistan is one of the heavymetal industrial complexes which was found to contam-inate the soil in the surrounding area with increasinglevels of Pb, Cu, and Zn (Talipov et al., 1997; NationalReport on State of the Environment and Use of NaturalResources, 1998; State Committee for Nature Protectionof the Republic of Uzbekistan, 2000). Shukurov (1999)studied heavy metal emission effect and reduction ofnegative impacts on a 20 km transect starting at theindustrial complex, and showed that the levels ofpollutants in the upper layer (0e20 cm) of soil decreasedgradually.
332 N. Shukurov et al. / Environmental Pollution 136 (2005) 331e340
Suter et al. (2000) emphasised the importance ofusing bioindicators in assessing ecological risks and notonly to relay additional information on the soil physical-chemical properties in soil surveys.
Properly chosen parameters allow both the identifi-cation of current changes in the soil and the predictionof future changes. For these purposes, the use ofmicrobial parameters seems to be very promising,because of their well-accepted importance as indicatorsof soil quality (Tate, 2000). Many studies have beenpublished in which changes in soil microbial parametersgave early warning of decreasing soil quality (e.g.,Powlson et al., 1987; Kandeler et al., 1999). Parametersdescribing the amount, activity, and diversity of soilmicroorganisms are also used as biological indicators ofsoil quality and health (Doran and Parkin, 1996;Sparling, 1997; Stenberg, 1999), integrating the chemicaland physical properties of the ecosystem (Oberholzeret al., 1999).
Soil microorganisms are usually studied and moni-tored at the process and biomass levels. The processlevel includes overall activities of the soil microorgan-isms, especially respiration (Sparling, 1997; Alon andSteinberger, 1999; Sarig et al., 1999). At the biomasslevel, the entire microbial community is evaluated asa single mass of microbial matter, without specificationof its structure. It is well known that heavy metalcontamination reduces soil respiration (Hattori, 1992),microbial biomass (Brookes et al., 1984; Brookes andMcGrath, 1984; Chander and Brookes, 1991; Klumppet al., 2003), nematode density and that it affects trophicinteractions (Vig et al., 2003; Caussy et al., 2003).
Baath (1989) studied the effect of heavy metals onmicrobial biomass and nematode density and showedthat Cd, Cu, Zn, Pb, and As significantly affect the sizeand dynamics of the above populations.
A number of soil microbiological parameters, notablymicrobial biomass carbon and basal respiration (Doranand Parkin, 1996; Sparling, 1997), have been suggestedas possible indicators of soil environmental quality, andare employed in national and international monitoringprograms. Soil microbial biomass, which plays animportant role in nutrient cycling and ecosystemsustainability, has been found to be sensitive to in-creased heavy metal concentrations in soils (Giller et al.,1998). Furthermore, the soil free-living nematodepopulation has been used as a bioindicator because ofits ubiquity, known response to chemical and physicalperturbations to soil and water, and current consider-ation in regional and national monitoring programs(Elliott, 1994; Gupta and Yeates, 1997; Neher, 2001;Heinz, 2002).
The aim of this study was to examine heavy metalimpact on the soil microbial and nematode populationalong the emission gradient of the Almalyk IndustrialComplex, Uzbekistan.
2. Materials and methods
2.1. Study site and locations
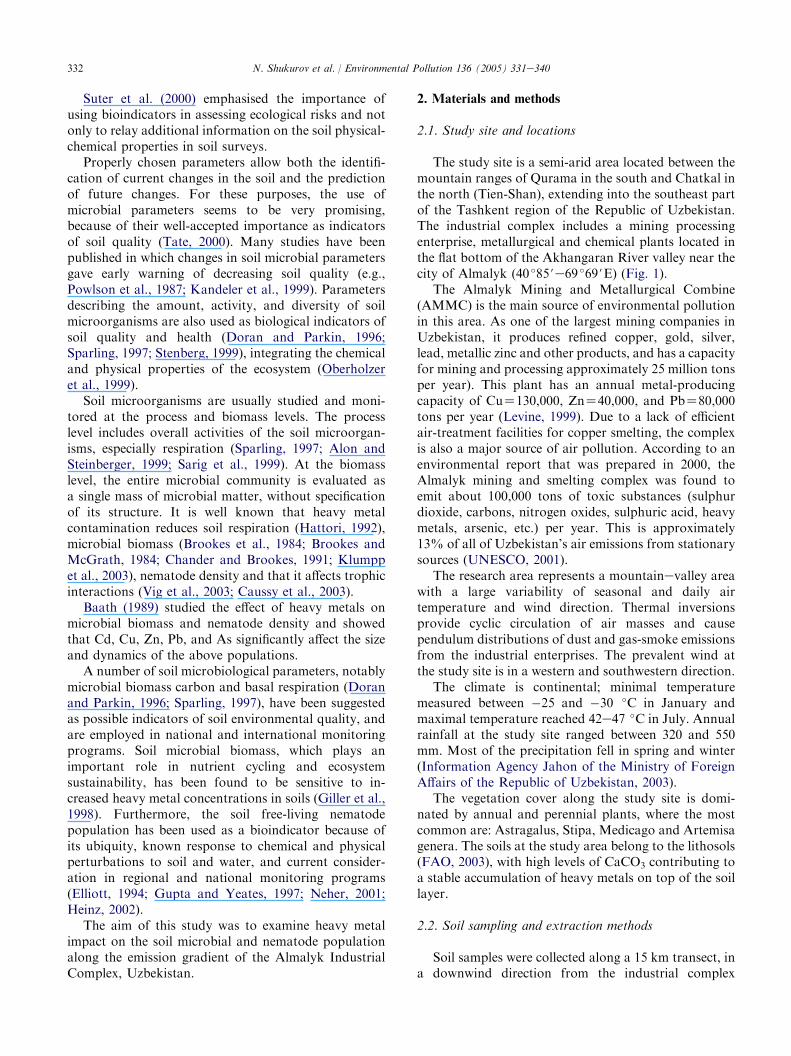
The study site is a semi-arid area located between themountain ranges of Qurama in the south and Chatkal inthe north (Tien-Shan), extending into the southeast partof the Tashkent region of the Republic of Uzbekistan.The industrial complex includes a mining processingenterprise, metallurgical and chemical plants located inthe flat bottom of the Akhangaran River valley near thecity of Almalyk (40 �85#e69 �69#E) (Fig. 1).
The Almalyk Mining and Metallurgical Combine(AMMC) is the main source of environmental pollutionin this area. As one of the largest mining companies inUzbekistan, it produces refined copper, gold, silver,lead, metallic zinc and other products, and has a capacityfor mining and processing approximately 25 million tonsper year). This plant has an annual metal-producingcapacity of CuZ130,000, ZnZ40,000, and PbZ80,000tons per year (Levine, 1999). Due to a lack of efficientair-treatment facilities for copper smelting, the complexis also a major source of air pollution. According to anenvironmental report that was prepared in 2000, theAlmalyk mining and smelting complex was found toemit about 100,000 tons of toxic substances (sulphurdioxide, carbons, nitrogen oxides, sulphuric acid, heavymetals, arsenic, etc.) per year. This is approximately13% of all of Uzbekistan’s air emissions from stationarysources (UNESCO, 2001).
The research area represents a mountainevalley areawith a large variability of seasonal and daily airtemperature and wind direction. Thermal inversionsprovide cyclic circulation of air masses and causependulum distributions of dust and gas-smoke emissionsfrom the industrial enterprises. The prevalent wind atthe study site is in a western and southwestern direction.
The climate is continental; minimal temperaturemeasured between �25 and �30 �C in January andmaximal temperature reached 42e47 �C in July. Annualrainfall at the study site ranged between 320 and 550mm. Most of the precipitation fell in spring and winter(Information Agency Jahon of the Ministry of ForeignAffairs of the Republic of Uzbekistan, 2003).
The vegetation cover along the study site is domi-nated by annual and perennial plants, where the mostcommon are: Astragalus, Stipa, Medicago and Artemisagenera. The soils at the study area belong to the lithosols(FAO, 2003), with high levels of CaCO3 contributing toa stable accumulation of heavy metals on top of the soillayer.
2.2. Soil sampling and extraction methods
Soil samples were collected along a 15 km transect, ina downwind direction from the industrial complex
333N. Shukurov et al. / Environmental Pollution 136 (2005) 331e340
Fig. 1. Location of the study sites along the transect from the Almalyk Industrial Complex (A, 0 km; B, 5 km; C, 10 km; D, 15 km from the complex).
emission sources. The soil samples were collected fromthe 0e10 and 10e20 cm layers at 0 (location A, at theindustrial complex), 5 (location B), 10 (location C) and15 (location D) km along the transect. Five random soilsamples were collected at each location, placed inindividual plastic bags and transported to the laboratoryfor chemical and biological component determination.The soils were kept in cold storage at 4 �C and weresieved though a 2-mm mesh sieve before biological andchemical analyses.
2.3. Laboratory analysis
1. Total concentration of heavy metals was determinedusing the atomic absorption spectrometry (AAS)method. Subsamples from each sample were air-dried and pounded into powder using an agate
mortar. Metals were extracted by digestion with 3parts concentrated HNO3 and 1 part concentratedHClO3 and the concentration was determined usingAAS.
2. Soil moisture (SM) of the subsamples was measuredgravimetrically as percentage of dry mass by dryingthe samples to a constant weight at 105 �C.
3. Total organic carbon (Corg) was determined usinga modified method of Rowell (1994). The method isbased on organic matter oxidation by K-dichromate.
4. Total soluble nitrogen (TSN) in soil was determinedby using the method of Houba et al. (1987). Theamounts of TSN in the soil extracts were determinedusing a Skalar Autoanalyzer unit (SFAS, 1995).
5. Soil pH was determined in H2O (soil solution ratio1:2.0) with a potentiometric glass electrode.
6. Soil salinity was determined in soil extracts andexpressed as electrical conductivity (EC). Soluble
334 N. Shukurov et al. / Environmental Pollution 136 (2005) 331e340
cations (Ca2C, KC, NaC) were determined bya flame photometer (Rhoades, 1982).
7. Nematode population was determined by extractionfrom 100 g soil samples using the Baermann funnelprocedure (Cairns, 1960). The recovered organismswere counted using a compound microscope andpreserved in formalin (Steinberger and Sarig, 1993).
8. Soil microbial biomass (Cmic) was determined usinga chloroform fumigation incubation (CFI) assay,according to Jenkinson and Powlson (1976). Five-gram soil samples were adjusted to 40%water-holdingcapacity and fumigated in a CHCl3-saturated atmo-sphere in a desiccator for 24 h. The fumigated andcorresponding non-fumigated (control) samples werethen transferred to 0.5-L glass jars and incubatedfor 10 days at 25 �C in the dark. CO2 concentrationwas measured in the head space of the glass jars usinga gas chromatograph (GC) and Cmic was calculatedas: CmicZ[(CO2�C from fumigated soil)�(CO2�Cfrom control sample)]/kc. A kc of 0.41 was used, asproposed by Anderson and Domsch (1990).
9. Soil basal respiration (BR) as CO2 evolution, wasdetermined by GC (Sparling and West, 1990).
10. Metabolic quotient (qCO2) was calculated as theratio between basal respiration (BR) and microbialbiomass (Cmic) (Anderson and Domsch, 1990). TheqCO2 is a specific parameter for evaluating theeffects of environmental conditions on the soilmicrobial biomass.
11. Microbial coefficient, known as substrate availabil-ity, was determined as the Cmic/Corg ratio.
The data presented in our study are reported as oven-dried weights. All data were subjected to statisticalanalysis of variance using the SAS model (ANOVA,Duncan’s multiple range tests and Pearson correlationcoefficient) and were used to evaluate differencesbetween separate means. Differences obtained at levelsof p!0.05 were considered statistically significant.
3. Results
3.1. Heavy metals
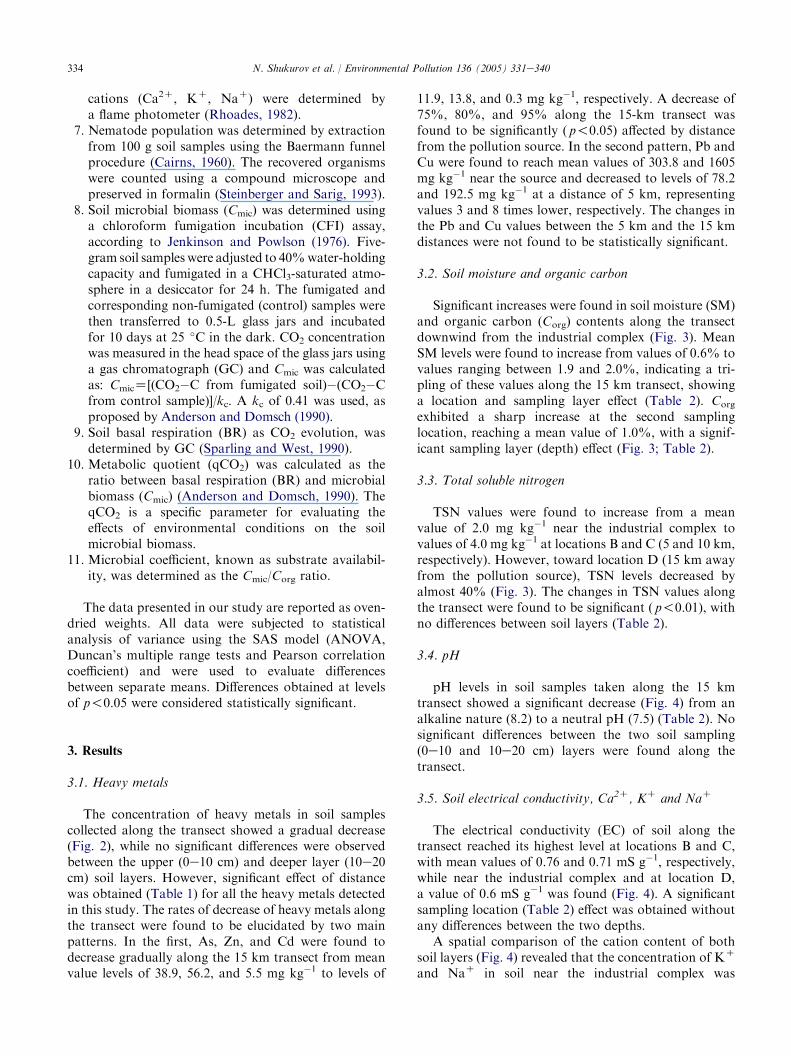
The concentration of heavy metals in soil samplescollected along the transect showed a gradual decrease(Fig. 2), while no significant differences were observedbetween the upper (0e10 cm) and deeper layer (10e20cm) soil layers. However, significant effect of distancewas obtained (Table 1) for all the heavy metals detectedin this study. The rates of decrease of heavy metals alongthe transect were found to be elucidated by two mainpatterns. In the first, As, Zn, and Cd were found todecrease gradually along the 15 km transect from meanvalue levels of 38.9, 56.2, and 5.5 mg kg�1 to levels of
11.9, 13.8, and 0.3 mg kg�1, respectively. A decrease of75%, 80%, and 95% along the 15-km transect wasfound to be significantly ( p!0.05) affected by distancefrom the pollution source. In the second pattern, Pb andCu were found to reach mean values of 303.8 and 1605mg kg�1 near the source and decreased to levels of 78.2and 192.5 mg kg�1 at a distance of 5 km, representingvalues 3 and 8 times lower, respectively. The changes inthe Pb and Cu values between the 5 km and the 15 kmdistances were not found to be statistically significant.
3.2. Soil moisture and organic carbon
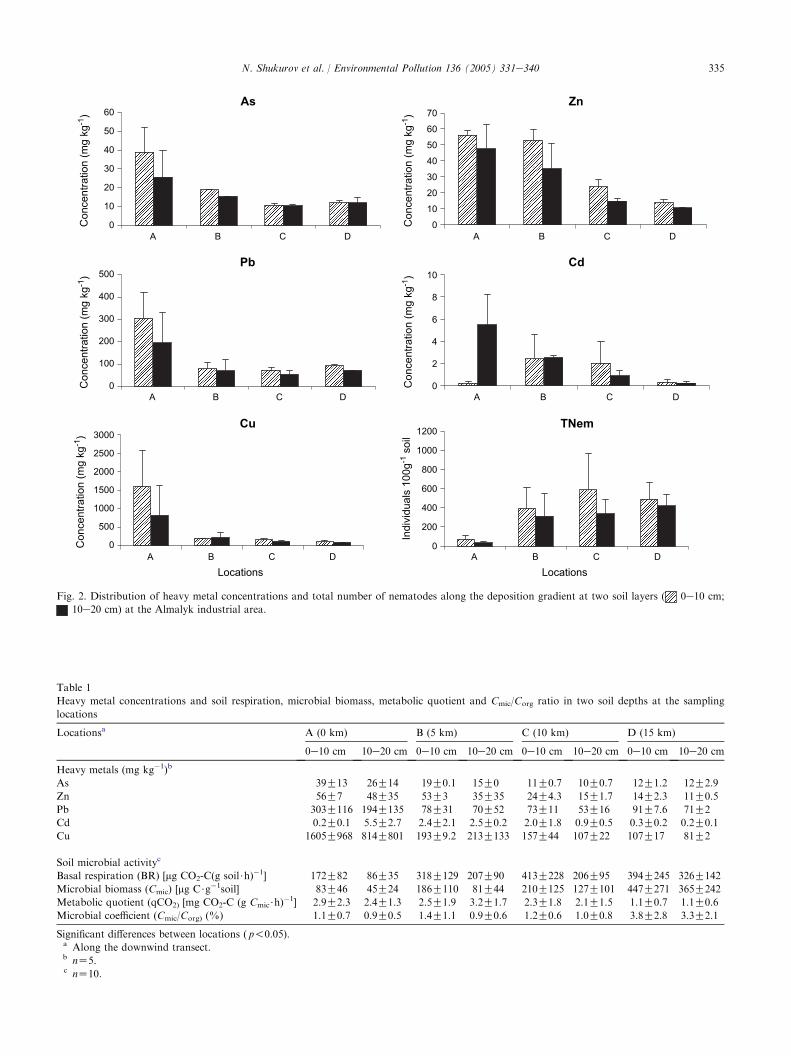
Significant increases were found in soil moisture (SM)and organic carbon (Corg) contents along the transectdownwind from the industrial complex (Fig. 3). MeanSM levels were found to increase from values of 0.6% tovalues ranging between 1.9 and 2.0%, indicating a tri-pling of these values along the 15 km transect, showinga location and sampling layer effect (Table 2). Corg
exhibited a sharp increase at the second samplinglocation, reaching a mean value of 1.0%, with a signif-icant sampling layer (depth) effect (Fig. 3; Table 2).
3.3. Total soluble nitrogen
TSN values were found to increase from a meanvalue of 2.0 mg kg�1 near the industrial complex tovalues of 4.0 mg kg�1 at locations B and C (5 and 10 km,respectively). However, toward location D (15 km awayfrom the pollution source), TSN levels decreased byalmost 40% (Fig. 3). The changes in TSN values alongthe transect were found to be significant ( p!0.01), withno differences between soil layers (Table 2).
3.4. pH
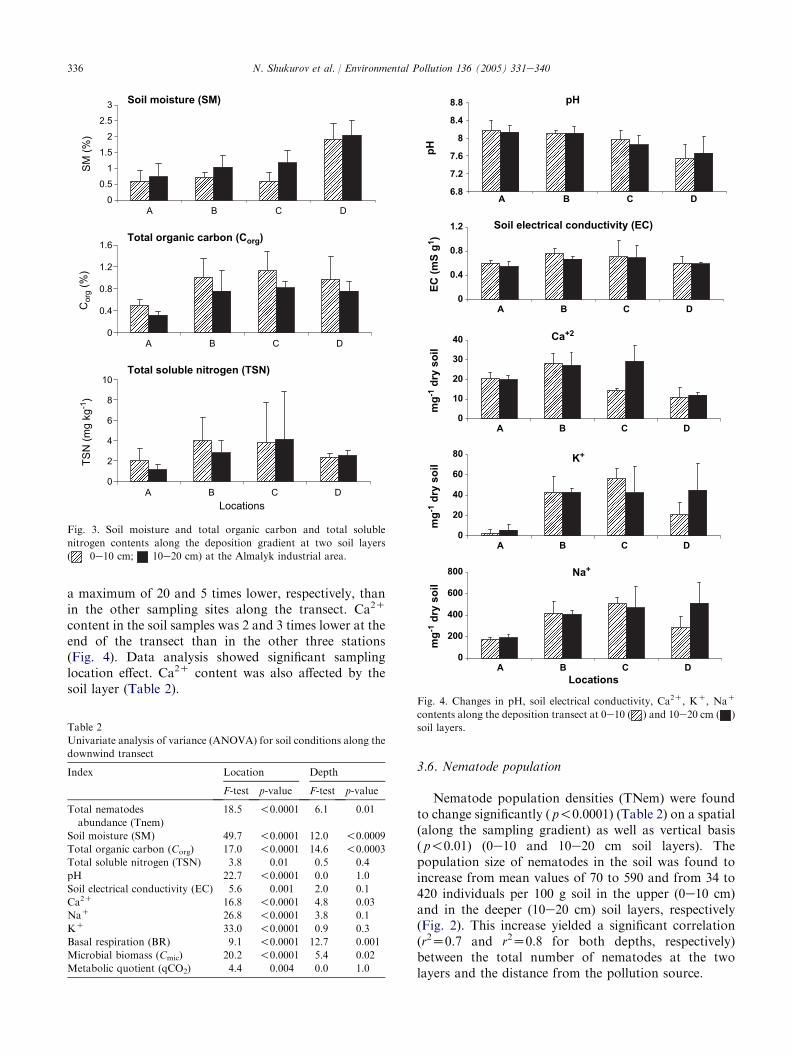
pH levels in soil samples taken along the 15 kmtransect showed a significant decrease (Fig. 4) from analkaline nature (8.2) to a neutral pH (7.5) (Table 2). Nosignificant differences between the two soil sampling(0e10 and 10e20 cm) layers were found along thetransect.
3.5. Soil electrical conductivity, Ca2C, KC and NaC
The electrical conductivity (EC) of soil along thetransect reached its highest level at locations B and C,with mean values of 0.76 and 0.71 mS g�1, respectively,while near the industrial complex and at location D,a value of 0.6 mS g�1 was found (Fig. 4). A significantsampling location (Table 2) effect was obtained withoutany differences between the two depths.
A spatial comparison of the cation content of bothsoil layers (Fig. 4) revealed that the concentration of KC
and NaC in soil near the industrial complex was
335N. Shukurov et al. / Environmental Pollution 136 (2005) 331e340
Table 1
Heavy metal concentrations and soil respiration, microbial biomass, metabolic quotient and Cmic/Corg ratio in two soil depths at the sampling
locations
Locationsa A (0 km) B (5 km) C (10 km) D (15 km)
0e10 cm 10e20 cm 0e10 cm 10e20 cm 0e10 cm 10e20 cm 0e10 cm 10e20 cm
Heavy metals (mg kg�1)b
As 39G13 26G14 19G0.1 15G0 11G0.7 10G0.7 12G1.2 12G2.9
Zn 56G7 48G35 53G3 35G35 24G4.3 15G1.7 14G2.3 11G0.5
Pb 303G116 194G135 78G31 70G52 73G11 53G16 91G7.6 71G2
Cd 0.2G0.1 5.5G2.7 2.4G2.1 2.5G0.2 2.0G1.8 0.9G0.5 0.3G0.2 0.2G0.1
Cu 1605G968 814G801 193G9.2 213G133 157G44 107G22 107G17 81G2
Soil microbial activityc
Basal respiration (BR) [mg CO2-C(g soil$h)�1] 172G82 86G35 318G129 207G90 413G228 206G95 394G245 326G142
Microbial biomass (Cmic) [mg C$g�1soil] 83G46 45G24 186G110 81G44 210G125 127G101 447G271 365G242
Metabolic quotient (qCO2) [mg CO2-C (g Cmic$h)�1] 2.9G2.3 2.4G1.3 2.5G1.9 3.2G1.7 2.3G1.8 2.1G1.5 1.1G0.7 1.1G0.6
Microbial coefficient (Cmic/Corg) (%) 1.1G0.7 0.9G0.5 1.4G1.1 0.9G0.6 1.2G0.6 1.0G0.8 3.8G2.8 3.3G2.1
Significant differences between locations ( p!0.05).a Along the downwind transect.b nZ5.c nZ10.
As
0
10
20
30
40
50
60
A B C D
Con
cent
ratio
n (m
g kg
-1)
Con
cent
ratio
n (m
g kg
-1)
Con
cent
ratio
n (m
g kg
-1)
Con
cent
ratio
n (m
g kg
-1)
Con
cent
ratio
n (m
g kg
-1)
Zn
0
10
20
30
40
50
60
70
A B C D
Pb
0
100
200
300
400
500
A B C D
Cd
0
2
4
6
8
10
A B C D
Cu
0
500
1000
1500
2000
2500
3000
A B C D
Locations
TNem
0
200
400
600
800
1000
1200
A B C D
Locations
Indi
vidu
als
100g
-1 s
oil
Fig. 2. Distribution of heavy metal concentrations and total number of nematodes along the deposition gradient at two soil layers ( 0e10 cm;
10e20 cm) at the Almalyk industrial area.
336 N. Shukurov et al. / Environmental Pollution 136 (2005) 331e340
a maximum of 20 and 5 times lower, respectively, thanin the other sampling sites along the transect. Ca2C
content in the soil samples was 2 and 3 times lower at theend of the transect than in the other three stations(Fig. 4). Data analysis showed significant samplinglocation effect. Ca2C content was also affected by thesoil layer (Table 2).
Soil moisture (SM)
0
0.5
1
1.5
2
2.5
3
A B C D
SM (%
)
Total organic carbon (Corg
)
0
0.4
0.8
1.2
1.6
A B C D
Cor
g (%
)
Total soluble nitrogen (TSN)
0
2
4
6
8
10
A B C DLocations
TSN
(mg
kg-1
)
Fig. 3. Soil moisture and total organic carbon and total soluble
nitrogen contents along the deposition gradient at two soil layers
( 0e10 cm; 10e20 cm) at the Almalyk industrial area.
Table 2
Univariate analysis of variance (ANOVA) for soil conditions along the
downwind transect
Index Location Depth
F-test p-value F-test p-value
Total nematodes
abundance (Tnem)
18.5 !0.0001 6.1 0.01
Soil moisture (SM) 49.7 !0.0001 12.0 !0.0009
Total organic carbon (Corg) 17.0 !0.0001 14.6 !0.0003
Total soluble nitrogen (TSN) 3.8 0.01 0.5 0.4
pH 22.7 !0.0001 0.0 1.0
Soil electrical conductivity (EC) 5.6 0.001 2.0 0.1
Ca2C 16.8 !0.0001 4.8 0.03
NaC 26.8 !0.0001 3.8 0.1
KC 33.0 !0.0001 0.9 0.3
Basal respiration (BR) 9.1 !0.0001 12.7 0.001
Microbial biomass (Cmic) 20.2 !0.0001 5.4 0.02
Metabolic quotient (qCO2) 4.4 0.004 0.0 1.0
3.6. Nematode population
Nematode population densities (TNem) were foundto change significantly ( p!0.0001) (Table 2) on a spatial(along the sampling gradient) as well as vertical basis( p!0.01) (0e10 and 10e20 cm soil layers). Thepopulation size of nematodes in the soil was found toincrease from mean values of 70 to 590 and from 34 to420 individuals per 100 g soil in the upper (0e10 cm)and in the deeper (10e20 cm) soil layers, respectively(Fig. 2). This increase yielded a significant correlation(r2Z0.7 and r2Z0.8 for both depths, respectively)between the total number of nematodes at the twolayers and the distance from the pollution source.
Soil electrical conductivity (EC)
0
0.4
0.8
1.2
A B C D
EC
(m
S g
1)
Ca+2
0
10
20
30
40
A B C D
K+
0
20
40
60
80
A B C D
Na+
0
200
400
600
800
A B C D
Locations
mg
-1 d
ry so
il
mg
-1 d
ry so
il
mg
-1 d
ry
so
il
pH
6.8
7.2
7.6
8
8.4
8.8
A B C D
pH
Fig. 4. Changes in pH, soil electrical conductivity, Ca2C, KC, NaC
contents along the deposition transect at 0e10 ( ) and 10e20 cm ( )
soil layers.
337N. Shukurov et al. / Environmental Pollution 136 (2005) 331e340
A similar trend was found between the totalnematode population and the heavy metal concentrationin the soil, reflecting its dispersion and yieldingsignificant correlations between the different pollutants(Cd, rZ�0.51, nZ16, p!0.04; Cu, rZ�0.60, nZ16,p!0.01; Pb, rZ�0.58, nZ16, p!0.01; Zn, rZ�0.52,nZ16, p!0.03; As, rZ�0.67, nZ16, p!0.004). Apositive significant correlation was also found betweenthe total number of nematodes and the total organiccarbon (Corg) (rZ0.46, nZ80, p!0.0001), and soilmoisture (SM) at the deeper layer (rZ0.47, nZ40,p!0.0001).
3.7. Microbial biomass (Cmic)
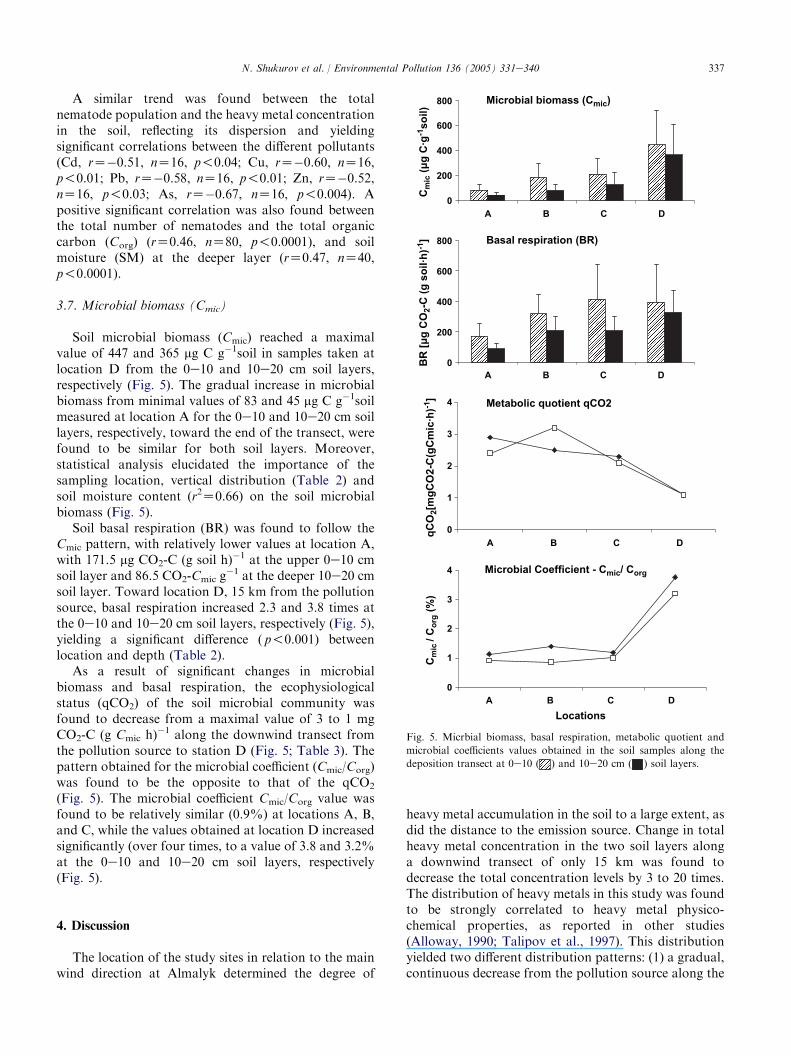
Soil microbial biomass (Cmic) reached a maximalvalue of 447 and 365 mg C g�1soil in samples taken atlocation D from the 0e10 and 10e20 cm soil layers,respectively (Fig. 5). The gradual increase in microbialbiomass from minimal values of 83 and 45 mg C g�1soilmeasured at location A for the 0e10 and 10e20 cm soillayers, respectively, toward the end of the transect, werefound to be similar for both soil layers. Moreover,statistical analysis elucidated the importance of thesampling location, vertical distribution (Table 2) andsoil moisture content (r2Z0.66) on the soil microbialbiomass (Fig. 5).
Soil basal respiration (BR) was found to follow theCmic pattern, with relatively lower values at location A,with 171.5 mg CO2-C (g soil h)�1 at the upper 0e10 cmsoil layer and 86.5 CO2-Cmic g
�1 at the deeper 10e20 cmsoil layer. Toward location D, 15 km from the pollutionsource, basal respiration increased 2.3 and 3.8 times atthe 0e10 and 10e20 cm soil layers, respectively (Fig. 5),yielding a significant difference ( p!0.001) betweenlocation and depth (Table 2).
As a result of significant changes in microbialbiomass and basal respiration, the ecophysiologicalstatus (qCO2) of the soil microbial community wasfound to decrease from a maximal value of 3 to 1 mgCO2-C (g Cmic h)
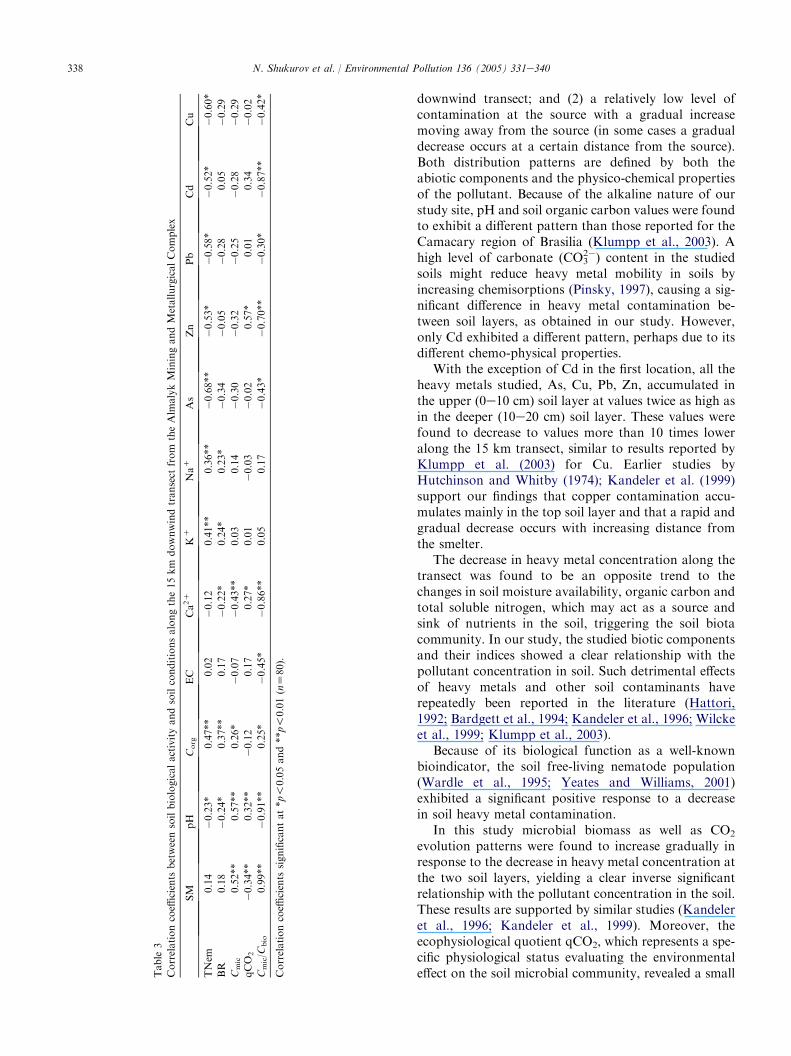
�1 along the downwind transect fromthe pollution source to station D (Fig. 5; Table 3). Thepattern obtained for the microbial coefficient (Cmic/Corg)was found to be the opposite to that of the qCO2
(Fig. 5). The microbial coefficient Cmic/Corg value wasfound to be relatively similar (0.9%) at locations A, B,and C, while the values obtained at location D increasedsignificantly (over four times, to a value of 3.8 and 3.2%at the 0e10 and 10e20 cm soil layers, respectively(Fig. 5).
4. Discussion
The location of the study sites in relation to the mainwind direction at Almalyk determined the degree of
heavy metal accumulation in the soil to a large extent, asdid the distance to the emission source. Change in totalheavy metal concentration in the two soil layers alonga downwind transect of only 15 km was found todecrease the total concentration levels by 3 to 20 times.The distribution of heavy metals in this study was foundto be strongly correlated to heavy metal physico-chemical properties, as reported in other studies(Alloway, 1990; Talipov et al., 1997). This distributionyielded two different distribution patterns: (1) a gradual,continuous decrease from the pollution source along the
Microbial Coefficient - Cmic
/ Corg
1
2
3
4
A B C D
Locations
Cm
ic / C
org (%
)
Metabolic quotient qCO2
0
0
1
2
3
4
A B C D
qC
O2[m
gC
O2-C
(g
Cm
ic·h
)-1]
Microbial biomass (Cmic
)
0
200
400
600
800
A B C D
Cm
ic (µ
g C
·g
-1so
il)
Basal respiration (BR)
0
200
400
600
800
A B C D
BR
[µ
g C
O2-C
(g
so
il·h
)-1]
Fig. 5. Micrbial biomass, basal respiration, metabolic quotient and
microbial coefficients values obtained in the soil samples along the
deposition transect at 0e10 ( ) and 10e20 cm ( ) soil layers.
338 N. Shukurov et al. / Environmental Pollution 136 (2005) 331e340
Table
3
Correlationcoeffi
cients
betweensoilbiologicalactivityandsoilconditionsalongthe15km
downwindtransect
from
theAlm
alykMiningandMetallurgicalComplex
SM
pH
Corg
EC
Ca2C
KC
NaC
As
Zn
Pb
Cd
Cu
TNem
0.14
�0.23*
0.47**
0.02
�0.12
0.41**
0.36**
�0.68**
�0.53*
�0.58*
�0.52*
�0.60*
BR
0.18
�0.24*
0.37**
0.17
�0.22*
0.24*
0.23*
�0.34
�0.05
�0.28
0.05
�0.29
Cmic
0.52**
0.57**
0.26*
�0.07
�0.43**
0.03
0.14
�0.30
�0.32
�0.25
�0.28
�0.29
qCO
2�0.34**
0.32**
�0.12
0.17
0.27*
0.01
�0.03
�0.02
0.57*
0.01
0.34
�0.02
Cmic/C
bio
0.99**
�0.91**
0.25*
�0.45*
�0.86**
0.05
0.17
�0.43*
�0.70**
�0.30*
�0.87**
�0.42*
Correlationcoeffi
cients
significantat*p!0.05and**p!0.01(nZ80).
downwind transect; and (2) a relatively low level ofcontamination at the source with a gradual increasemoving away from the source (in some cases a gradualdecrease occurs at a certain distance from the source).Both distribution patterns are defined by both theabiotic components and the physico-chemical propertiesof the pollutant. Because of the alkaline nature of ourstudy site, pH and soil organic carbon values were foundto exhibit a different pattern than those reported for theCamacary region of Brasilia (Klumpp et al., 2003). Ahigh level of carbonate (CO3
2�) content in the studiedsoils might reduce heavy metal mobility in soils byincreasing chemisorptions (Pinsky, 1997), causing a sig-nificant difference in heavy metal contamination be-tween soil layers, as obtained in our study. However,only Cd exhibited a different pattern, perhaps due to itsdifferent chemo-physical properties.
With the exception of Cd in the first location, all theheavy metals studied, As, Cu, Pb, Zn, accumulated inthe upper (0e10 cm) soil layer at values twice as high asin the deeper (10e20 cm) soil layer. These values werefound to decrease to values more than 10 times loweralong the 15 km transect, similar to results reported byKlumpp et al. (2003) for Cu. Earlier studies byHutchinson and Whitby (1974); Kandeler et al. (1999)support our findings that copper contamination accu-mulates mainly in the top soil layer and that a rapid andgradual decrease occurs with increasing distance fromthe smelter.
The decrease in heavy metal concentration along thetransect was found to be an opposite trend to thechanges in soil moisture availability, organic carbon andtotal soluble nitrogen, which may act as a source andsink of nutrients in the soil, triggering the soil biotacommunity. In our study, the studied biotic componentsand their indices showed a clear relationship with thepollutant concentration in soil. Such detrimental effectsof heavy metals and other soil contaminants haverepeatedly been reported in the literature (Hattori,1992; Bardgett et al., 1994; Kandeler et al., 1996; Wilckeet al., 1999; Klumpp et al., 2003).
Because of its biological function as a well-knownbioindicator, the soil free-living nematode population(Wardle et al., 1995; Yeates and Williams, 2001)exhibited a significant positive response to a decreasein soil heavy metal contamination.
In this study microbial biomass as well as CO2
evolution patterns were found to increase gradually inresponse to the decrease in heavy metal concentration atthe two soil layers, yielding a clear inverse significantrelationship with the pollutant concentration in the soil.These results are supported by similar studies (Kandeleret al., 1996; Kandeler et al., 1999). Moreover, theecophysiological quotient qCO2, which represents a spe-cific physiological status evaluating the environmentaleffect on the soil microbial community, revealed a small
339N. Shukurov et al. / Environmental Pollution 136 (2005) 331e340
difference between the two soil layers, with a significantchange toward the end of the transect. Such differenceswere mainly affected by heavy metal distribution.Results from our study on microbial coefficients werefound to be within the range of values reported byHofman et al. (2003), working on a monitoring micro-bial biomass and respiration program aimed to de-termine the relationship between soil properties andcontamination. The microbial coefficient was found tobe an important aid for gaining more complete un-derstanding of the heavy metal, abiotic, soil chemicalcomposition and soil microbial interaction. Since themicrobial coefficient interpreted as substrate availabilityexhibited a significant increase at station D, which iscomplementary to the significant decrease in ecophysi-ological status, it seems to elucidate the sensitivity of themicrobial community as one of the most sensitiveindicators of soil contamination.
Studies on the relationship between soil biota andpollution levels have raised the question regarding theimportance of natural soil abiotic properties, stressingthe importance of background data of environmentalconditions, and elucidating the importance of furtherstudies on this subject.
Acknowledgements
This project was supported by a UNESCO/ISRAELco-sponsored fellowship for post-doctoral studies inscience and technology to Nosir Shukurov. The authorswish to express their appreciation to Ms. GinettaBarness, Ms. Einav Mayzlish, and Mr. Evgeny Klima-nov, for useful comments during the study and fortechnical assistance. We also appreciate the helpfulcomments of an anonymous reviewer.
References
Alloway, B.J., 1990. Heavy metals in soils. Blackie, London.
Alon, A., Steinberger, Y., 1999. Response of the soil microbial biomass
and nematode population to a wetting event in nitrogen-amended
Negev desert plots. Biology and Fertility of Soils 30, 147e152.Anderson, T.H., Domsch, K.H., 1990. Application of eco-physiolog-
ical quotients (qCO2 and qD) on microbial biomass from soils of
different cropping histories. Soil Biology and Biochemistry 22,
251e255.Baath, E., 1989. Effects of heavy-metals in soil on microbial processes
and populations (a review). Water Air and Soil Pollution 47,
335e379.
Bardgett, R.D., Speir, T.W., Ross, D.J., Yeates, G.W., Kettles, H.A.,
1994. Impact of pasture contamination by copper, chromium, and
arsenic timber preservative on soil microbial properties and
nematodes. Biology and Fertility of Soils 18, 71e79.Brookes, P.C., McGrath, S.P., 1984. Effects of metal toxicity on
the size of the soil microbial biomass. Journal of Soil Science 35,
341e346.
Brookes, P.C., McGrath, S.P., Klein, D.A., Elliot, E.T., 1984. Effects
of heavy metals on microbial activity and biomass in field soils
treated with sewage sluge. Environ. Contamination International
Conference, London, pp. 574e583.
Cairns, E.J., 1960. Methods in nematology. In: Sasser, J.N.,
Jenkins, W.R. (Eds.), Nematology, Fundamentals and Recent
Advances with Emphasis on Plant Parasitic and Soil Forms.
University of North Carolina Press, Chapel Hill, NC, pp. 33e84.Caussy, D., Gochfeld, M., Gurzau, E., Neagu, C., Ruedel, H., 2003.
Lessons from case studies of metals: investigating exposure,
bioavailability, and risk. Ecotoxicology and Environmental Safety
56, 45e51.Chander, K., Brookes, P.C., 1991. Effects of heavy-metals from past
applications of sewage-sludge on microbial biomass and organic-
matter accumulation in a sandy loam and silty loam UK soil. Soil
Biology and Biochemistry 23, 927e932.Davies, B.E., 1983. Heavy metal contamination from base metal
mining and smelting: implications for man and his environment.
In: Thornton, I. (Ed.), Applied Environmental Geochemistry.
Academic Press, London, pp. 425e460.
Doran, J.W., Parkin, T.B., 1996. Quantitative indicators of soil
quality: a minimum data set. In: Doran, J.W., Jones, A.J. (Eds.),
Methods for Assessing Soil Quality. SSSA Special Publication
Number 49. Soil Science Society of America, Madison, pp. 25e38.
Elliott, E.T., 1994. The potential use of soil biotic activity as an
indicator of productivity, sustainability and pollution. In:
Pankhurst, C.E., Doube, B.M., Gupta, V.V.S.R., Grace, P.R.
(Eds.), Soil Biota Management in Sustainable Farming Systems.
CAB International, Oxon, UK, pp. 250e256.
UNESCO, 2001. Environmental Performance Reviews e Uzbekistan,
2001. Economic Commission for Europe.
FAO, 2003. Fertilizer use by crop in Uzbekistan first version. FAO,
Rome.
Giller, K.E., Witter, E., McGrath, S.P., 1998. Toxicity of heavy metals
to microorganisms and microbial processes in agricultural soils:
a review. Soil Biology and Biochemistry 30, 1389e1414.
Gupta, V.V.S.R., Yeates, G.W., 1997. Soil microfauna as bioindicators
of soil health. In: Pankhurst, C.E., Doube, B.M., Gupta, V.V.S.R.,
Grace, P.R. (Eds.), Soil Biota Management in Sustainable Farming
Systems. CAB International, Oxon, UK, pp. 201e233.
Hattori, H., 1992. Influence of heavy-metals on soil microbial
activities. Soil Science and Plant Nutrition 38, 93e100.Heinz, 2002. State of the nation’s ecosystems report. !http://
www.heinzctr.org/ecosystems/O.
Hofman, J., Bezchlebova, J., Dusek, L., Dolezal, L., Holoubek, I.,
Andel, P., Ansorgova, A., Maly, S., 2003. Novel approach to
monitoring of the soil biological quality. Environment Interna-
tional 28 (8), 771e778.
Houba, V.J.G., Novozamsky, I., Vittenbogaard, J., Van Der Lee, J.J.,
1987. Automatic determination of total soluble nitrogen in soil
extracts. Landwirtschaftliche Forschung 40, 295e302.
Hutchinson, T.C., Whitby, L.M., 1974. Heavy-metal pollution in the
Sudbury mining and smelting region of Canada. I. Soil and
vegetation contamination by nickel, copper and other metals.
Environmental Conservation 1, 123e132.
Information Agency Jahon of the Ministry of Foreign Affairs of the
Republic of Uzbekistan, 2003.
Jenkinson, D.S., Powlson, D.S., 1976. The effects of biocidal
treatments on metabolism in soil. V. A method for measuring soil
biomass. Soil Biology and Biochemistry 8, 209e213.Kabata-Pendias, A., Pendias, H., 1989. Trace elements in soils and
plants, second ed. CRC Press, Boca Raton.
Kandeler, E., Kampichler, C., Horak, O., 1996. Influence of heavy
metals on the functional diversity of soil microbial communities.
Biology and Fertility of Soils 23, 299e306.
Kandeler, E., Tscherko, D., Spiegel, H., 1999. Long-term monitoring
of microbial biomass, N mineralisation and enzyme activities of
340 N. Shukurov et al. / Environmental Pollution 136 (2005) 331e340
a Chernozem under different tillage management. Biology and
Fertility of Soils 28, 343e351.
Klumpp, A., Hintemann, T., Lima, J.S., Kandeler, E., 2003.
Bioindication of air pollution effects near a copper smelter in
Brazil using mango trees and soil microbiological properties.
Environmental Pollution 126, 313e321.
Levine, R.M., 1999. The mineral industry of Uzbekistan. US
Geological Survey Minerals Yearbook 1999.
Loska, C., Wiechulab, D., Korus, I., 2003, Metal contamination of
farming soils affected by industry. Environment International, in
press.
National Report on State of the Environment and Use of Natural
Resources, 1998. Tashkent, Republic of Uzbekistan.
Neher, D.A., 2001. Role of nematodes in soil health and their use as
indicators. Journal of Nematology 33, 161e168.Oberholzer, H.R., Rek, J., Weisskopf, P., Walther, U., 1999.
Evaluation of soil quality by means of microbiological parameters
related to the characteristics of individual arable sites. Agribiology
Research 52, 113e125.Pinsky, D.L., 1997. Ion exchangeable processes in soils. Academic
Press, Pushchino.
Powlson, D.S., Brookes, P.C., Christensen, B.T., 1987. Measurement
of soil microbial biomass provides an early indication of changes in
the total soil organic matter due to straw incorporation. Soil
Biology and Biochemistry 19, 159e164.
State Committee for Nature Protection of the Republic of Uzbekistan,
2001. Report on the Environmental Pollution in the Republic of
Uzbekistan in 2000.
Rhoades, J.D., 1982. Soluble salts. In: Page, A.L., Miller, R.H.,
Keeney, D.R. (Eds.), Methods of Soil Analysis. Part 2, Chemical
and Microbiological Properties. American Society of Agronomy,
Soil Science Society of America, Madison, Wisconsin, pp. 167e
179.
Rowell, D.L., 1994. Soil science: methods and applications. Longmans
Group UK Ltd., London.
SFAS, 1995. Manual-san plus analyzer. SKALAR Analytical, The
Netherlands.
Sarig, S., Fliessbach, A., Steinberger, Y., 1999. Soil microbial biomass
under the canopy of coastal sand dune shrubs. Arid Soil Research
and Rehabilitation 13, 75e80.
Shukurov, N.E., 1999. Occurrence forms of heavy metals-toxicants in
technogenic landscape soils within Almalyk mining industrial area.
Journal of Geology and Mineral Resources 5, 44e48 (in Russian).
Sparling, G.P., 1997. Soil microbial biomass, activity and nutrient
cycling as indicators of soil health. In: Pankhurst, C.E.,
Doube, B.M., Gupta, V.V.S.R. (Eds.), Biological Indicators of
Soil Health. CAB International, Wallingford, pp. 97e120.
Sparling, G.P., West, A.W., 1990. A comparison of gas chromatog-
raphy and differential respirometer methods to measure soil res-
piration and to estimate the soil microbial biomass. Pedobiologia
34, 103e112.
Steinberger, Y., Sarig, S., 1993. Responses by soil nematode
populations in the soil microbial biomass to a rain episode in the
hot, dry Negev Desert. Biology and Fertility of Soils 16, 188e192.
Steinnes, E., Allen, R.O., Petersen, H.M., Rambaek, J.P., Varskog, P.,
1997. Evidence of large scale heavy-metal contamination of natural
surface soils in Norway from long-range atmospheric transport.
The Science of the Total Environment 205, 255e266.
Stenberg, B., 1999. Monitoring soil quality of arable land: Microbi-
ological indicators. Acta Agriculturae Scandinavica B-S 49, 1e24.Suter, G.W., Efroymson, R.A., Sample, B.E., Jones, D.S., 2000.
Ecological risk assessment for contaminated sites. Lewis Publishers,
Boca Raton, FL.
Talipov, R.M., Shukurov, N.E., Artikov, A.A., 1997. Biogeochemical
anomalies of rare metals at places of tungsten ore mining and
dressing. Uzbeksitan Geological Journal 3, 40e46 (in Russian).
Tate, R.L., 2000. Soil microbiology, second ed. Wiley, New York.
Thornton, I., Jong, S., Moorcroft, S., Watt, J., Strehlow, C.D.,
Baltrop,D.,Wells, J., 1980.Cadmiumat Shiphame a unique example
of environmental geochemistry and health. In: Hemphill, D.D. (Ed.),
Trace Substances in Environmental Health e XIV. University of
Missouri, Columbia, pp. 27e37.Verner, J.F., Ramsey, M.H., Helios-Rybicka, E., Jedrzejczyk, B., 1996.
Heavy metal contamination of soils around a Pb-Zn smelter in
Bukowno, Poland. Applied Geochemistry 11, 11e16.Vig, K., Megharaj, M., Sethunathan, N., Naidu, R., 2003. Bio-
availability and toxicity of cadmium to microorganisms and their
activities in soil: a review. Advances in Environmental Research 8,
121e135.Wardle, D.D., Yeates, G.W., Watson, R.N., Nicholson, K.S., 1995.
The detritus food-web and the diversity of soil fauna as indicators
of disturbance regimes in agroecosystems. Plant and Soil 170,
35e43.Wilcke, W., Guscher, C., Kobza, J., Zech, W., 1999. Heavy metal
concentrations, partitioning, and storage in Slovak forest and
arable soils along a deposition gradient. Journal of Plant Nutrition
and Soil Science 162, 223e229.
Yeates, G.W., Williams, P.A., 2001. Influence of three invasive weeds
and site factors on soil microfauna in New Zealand. Pedobiologia
45, 367e383.
Copyright © 2022 FDOKUMEN