Breaks in the breaks: an analysis of divorce rates in Europe
Available online at www.sciencedirect.com
Mathematics and Computers in Simulation 79 (2009) 2654–2664
The impact of structural breaks on the integrationof the ASEAN-5 stock markets
Cathy W.S. Chen a,∗, Richard Gerlach b, Nick Y.P. Cheng c, Y.L. Yang c
a Graduate Institute of Statistics & Actuarial Science, Feng Chia University, Taiwanb Faculty of Economics and Business, University of Sydney, Australia
c Graduate Institute of Finance, Ling-Tung University, Taiwan
Available online 24 December 2008
Abstract
This paper examines the ASEAN-5 countries and explores the impact of structural breaks on the level of financial integrationin that region. An extended cointegration procedure allowing for three types of structural break, is employed and compared withthe standard Johansen procedure, for daily and weekly returns. The empirical results suggest a higher level of integration withinthe ASEAN-5 markets than previously found, suggesting that financial risk reduction benefits from diversifying investments acrossthe region are less than previously thought. Further, Singapore and Thailand are the main long-term drivers in the region; Malaysiaand Indonesia are more short-term drivers. Structural breaks are found to correspond with the Asian financial crisis in 1997/98 anda possible Y2K effect in late 1999. Results are verified using another structural break model and method, where break dates aretreated as known.© 2008 IMACS. Published by Elsevier B.V. All rights reserved.
JEL classification: C12; C22; C32; F36; G15
Keywords: Cointegration rank; Structural break; Asian financial crisis; Stock market
1. Introduction
This paper examines the level of integration, and thus the level of potential financial risk reduction via diversification,in the Malaysian, Singapore, Philippine, Thailand and Indonesian stock markets as a group. These are the originalmembers of the Association of Southeast Asian Nations (ASEAN-5).
The ASEAN member countries have deliberately integrated their investment zones in recent years. The ASEANFree Trade Area (AFTA) was designated in 1992; the ASEAN Investment Area (ATA) in 1997; and the Initiative forASEAN Integration (IAI) was published in 2000. If markets are highly integrated, then a country’s economy cannotbe insulated from foreign shocks and this reduces the risk benefits of diversifying investments across these markets.Thus, finding that the ASEAN markets are highly integrated will highlight the lack of risk reduction via diversificationfor investments across the region.
Standard cointegration techniques, as in Johansen [4,6], have been used extensively to study financial marketintegration. Systems (with k series) that are highly cointegrated display a smaller number (denoted p, where p < k) of
∗ Corresponding author. Tel.: +886 424517250x4412; fax: +886 424517092.E-mail address: [email protected] (C.W.S. Chen).
0378-4754/$36.00 © 2008 IMACS. Published by Elsevier B.V. All rights reserved.doi:10.1016/j.matcom.2008.12.012
C.W.S. Chen et al. / Mathematics and Computers in Simulation 79 (2009) 2654–2664 2655
long-term relationships or stochastic trends under this method. Stock and Watson [14] showed that a cointegration rankof k − p (denoted r) meant that there were p = k − r long-term stochastic trends driving the system. For example, Kasa[8] found evidence of a single cointegration relationship among stock markets in the five countries, hence the rank was1 and cointegration was present, but not very strong, in these markets, since there were four stochastic trends drivingthe system.
Many studies have already focused on integration in the ASEAN region: Palac-McMiken [9] examined the majorstock market indices in the ASEAN-5, from 1988 to 1995, and found a cointegration rank of 1, i.e. weak integration;Roca et al. [11] used weekly data over the same period and found no significant cointegration; Sharma and Wongbanpo[12] analyzed the period 1986–1996 and found a rank of 1: again weak integration; finally, Click and Plummer [1]used daily and weekly data from 1998 to 2002 (after the Asian crisis) and again found only weak integration (rank 1),after exchange rate adjusting into U.S. dollars (and Japanese yen).
These results, showing only weak integration and thus suggesting some level of risk reduction via diversificationacross the region, are mildly surprising in light of the extensive work the ASEAN-5 have done to integrate theireconomies and investment zones. However, Inoue [3] showed that the conventional Johansen cointegration rank testsused in these papers can be biased in the presence of structural breaks, and can incorrectly bias the rank downwards inthat case, which could potentially explain the low ranks obtained in the papers above.
Johansen, Mosconi and Neilsen [7] (JMN) proposed a trend-break model and extended the Johansen rank test inthat case. However, the timing of the breaks must be pre-judged by the user: it is well known this can lead to bias ifappropriate break times are not chosen. Inoue [3] also extended the standard cointegration rank estimation approachfor three structural break models, detailed in Section 2. However, this method simultaneously identified the most likelytiming of a single structural break. We henceforth refer to Inoue’s structural break method as ISB.
The aim of this paper is then to update the previous work on how strongly the ASEAN-5 stock markets are integrated,and better assess the implied level of risk reduction for investors via diversification, by accounting for the fact that themarkets may exhibit structural breaks during the chosen sample. We employ the ISB method to endogenously identifythe timing of breaks, while measuring the cointegration rank of these markets; we reinforce our result using the JMNmethod.
In related work, Gerlach et al. [2] examined real estate markets in Singapore, Malaysia, Hong Kong and Japan from1993 to 2001. The standard method found no long-term linkages in this system, i.e. a cointegration rank of 0. However,the ISB method found a rank of 2 and a structural break in mid-1997.
The paper is organized as follows: the ISB models are reviewed in Section 2. Section 3 describes the data sourcesand preliminary analysis. Section 4 provides the results from the cointegration tests, together with a discussion of therobustness of the model in each instance. Section 5 provides concluding comments.
2. Methods
When analyzing the stock markets in the ASEAN-5, we should not ignore a possible structural break occurringduring the Asian financial crisis in 1997, or at other times in our sample. Many articles have neglected the influence ofstructural breaks; or alternatively, simply divide the sample into two sub-samples, one on each side of a possible breakpoint, so as to avoid the problem. This approach was used by Sheng and Tu [13] for 12 Asia-Pacific stock markets.They found no long-term links before 1997 but significant integration during and after the crisis. Sheng and Tu [13]pointed out that the structural break may cause the differing results pre- and post-crisis.
Perron [10] initially showed that the usual unit root tests, e.g. the augmented Dickey–Fuller (ADF) test, have lowpower when a structural break occurs in the data. Zivot and Andrews [15] developed a test that accounts for breaks,called the ZA test hereafter. They suggested three univariate structural break models, endogenously picking the timingof the break and simultaneously testing for a unit root. We use this method to identify each series in our system as I(1)and to suggest possible breaks. Note that the ZA test is univariate, while the ISB procedure tests a multivariate system.
This paper uses the joint cointegration and break identification test of Inoue [3] which has the following advantages:(i) the possible structural break is determined endogenously and does not require pre-judgment from the user; (ii) threepossible break models are allowed; and (iii) the cointegrating rank is estimated in the presence of any possible break.Inoue’s method can be seen as a direct extension of the standard methods in Johansen [4,6]. Inoue suggested threedifferent models (denoted A, B and C), which can all be written as n-dimensional vector autoregressions (VAR). First
2656 C.W.S. Chen et al. / Mathematics and Computers in Simulation 79 (2009) 2654–2664
we define:
YAt (ξ) = Xt − μ − μ̃DUt(ξ), ; YB
t (ξ) = Xt − μ − μ̃DUt(ξ) − δt − δ̃DTt(ξ), ; YCt = Xt, (1)
where Xt is the original data series at time t; Xt, μ, μ̃, δ and δ̃ are n-dimensional vectors; the dummy variables DUt(ξ)and DTt(ξ) are defined as
DUt(ξ) ={
0, t < [Tξ]
1, t ≥ [Tξ]; DTt(ξ) =
{0, t < [Tξ]
(t − [Tξ] + 1), t ≥ [Tξ]
with [x] the integer component of x and T the total sample size. The term ξ is the break fraction, considered only overthe closed set [0.15, 0.85]. We give the error-corrected form of the models (i = A, B, C) as follows:
�Yit (ξ) = ΠYi
t−1(ξ) +p−1∑j=1
Γj �Yit−j(ξ) + ut, i = A, B, (2)
�Yct = c + μ̃DUt(ξ) + ΠYc
t−1 +p−1∑j=1
Γj �Yct−j + ut, (3)
where α and β are n × q matrices (q is an integer s.t. 1 ≤ q ≤ n) where αβ = Π; {Γj}p−1j=1 and Π are n × n matrices
representing the short and long run components, respectively, and ut ∼ N(0n×1, Ω), each independent over t. Thematrix Π represents the long-run components of the system and β contains the cointegration relations. Inoue tests thehypotheses:
H0 : rank(α) = rank(β) ≤ r, μ̃ = δ = 0n×1 vs H1 : rank(α) = rank(β) > r, (4)
where 0 ≤ r ≤ q and r < n, using the trace test statistic below; and also tests the null in (4) against the alternativehypothesis:
H2 : rank(α) = rank(β) > r + 1 (5)
using the maximum eigenvalue statistic below. To find the required eigenvalues, the following regressions need to berun: For model A, firstly regress �Xt on �DU(ξ)t and denote the residuals as Z1t. Next regress Xt on 1 and DU(ξ)t
denoting residuals Z0t. For model B, regress �Xt on �DU(ξ)t, DU(ξ)t and �DT(ξ)t; denote the residuals as Z1t. Thenregress Xt on 1 and DU(ξ)t, t and �DT(ξ)t and denote the residuals as Z0t. For model C, regress �Xt on 1 and DU(ξ)t
and denote the residuals as Z1t. Then denote Xt as Z0t. The procedure then regresses Z1t and Z0t−1 jointly on (Z1t−1,. . ., Z1t−q+1) generating η as the residuals. The required eigenvalues are the solutions to the generalized eigenvalue
problem:∣∣λS11 −S10 S−1
00 S01∣∣ , where S =
(S00 S10
S01 S11
)= 1
Tηη′.
The subscripts 0 and 1 above refer to the matrix components (of S) corresponding to Z1t and Z0t−1, respectively.The p eigenvalues, from the ith model, are placed in descending order and denoted λ̂i
j(ξ). The trace test statistic, forthe test in (4), and the corresponding maximum eigenvalue statistic for the test in (5), are respectively:
supξ ∈ Ξ
⎧⎨⎩−T
n∑j=r+1
ln(1 − λ̂ij(ξ))
⎫⎬⎭ and sup
ξ ∈ Ξ
{−T ln(1 − λ̂ir+1(ξ))}. (6)
The relevant asymptotic critical values were estimated by simulation and response surface analysis in Inoue [3].We also use the JMN method to re-enforce the results obtained by the ISB method. Their model allows the existence
of multiple trend-breaks within a multivariate system; see Johansen et al. [7] for details.We now examine the long-run relationships among the stock markets of the ASEAN-5 countries. This may allow
investors to review how a possible structural break affected their investment in this region and help to inform investorshow to redistribute the investments in an optimal manner, i.e. whether diversification should lead to reduced riskbenefits. The governments of the ASEAN-5 region may also better understand the long-term linkages pre, during andpost-Asian financial crisis in their region. This may provide direction to establish economic policy in the region.

C.W.S. Chen et al. / Mathematics and Computers in Simulation 79 (2009) 2654–2664 2657
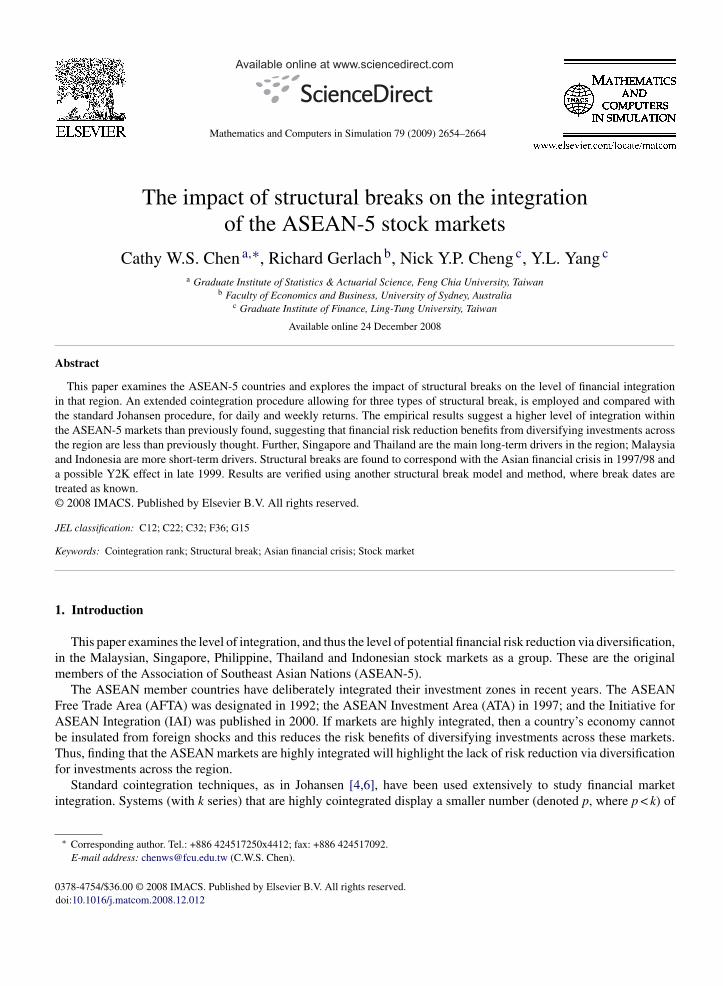
Fig. 1. Time plots of daily stock market indices for Indonesia, Malaysia, Philippine, Singapore and Thailand from 3 January 1994 to 12 August2005 (3030 observations). The reference date is 28 July 1997.
3. Data and preliminary results
The original ASEAN member countries are the most important markets in Southeast Asia; Singapore is the largestof these markets. The data consist of the daily and weekly stock indices over the period from 3 January 1994 to 12August 2005, giving a total of 3030 daily and 606 weekly observations. The data were collected from DatastreamInternational in each local currency, and were adjusted into U.S. dollars using the equivalent exchange rate data. Thefive stock market indices used were: Singapore straits times, Malaysia Kuala Lumpur composite, Philippines Manilacomposite, Thailand Bangkok SET and Indonesia JSX price index.
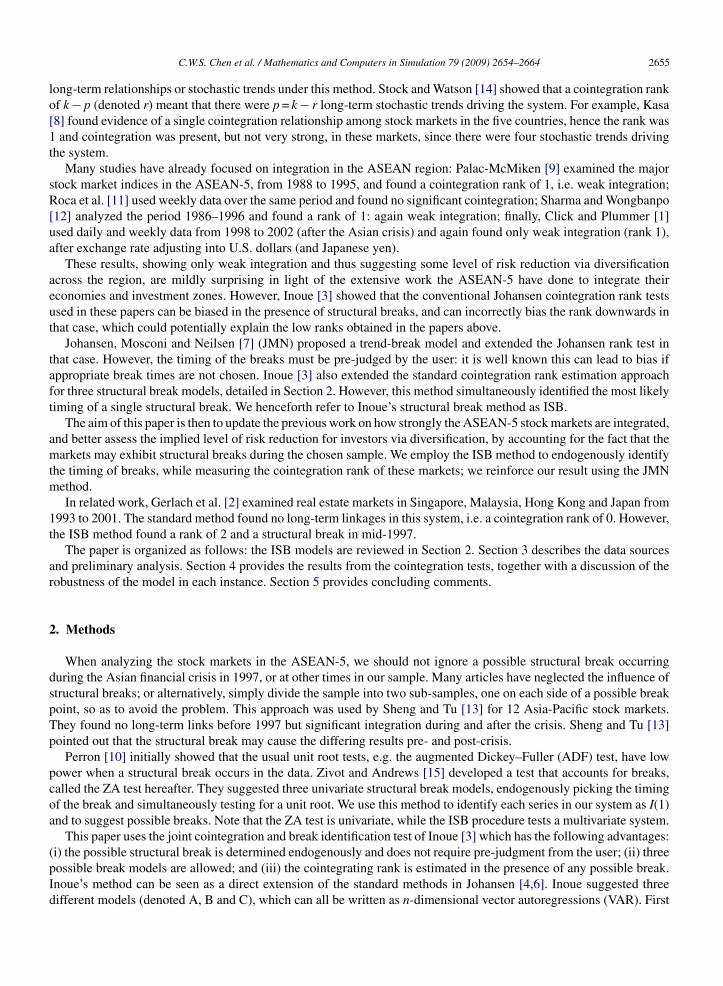
The data were transformed into natural logarithms. Figs. 1 and 2 show the (untransformed) market indices, illustratingthat all, except Thailand, had stable or positive drift until mid-1997. The five series then have significant and largedecreases from mid-1997 to the end of 1998, when they were possibly affected by the Asian crisis. The five marketindices clearly share some long-term relationships and the reference date for the crisis seems to be very close to mid-1997, for at least four of the five markets. Only Singapore seems to have regained its pre-crisis level of index valuespost-1997, illustrating the extent of the large negative effect of the crisis in the region.
Table 1 shows summary statistics of daily and weekly returns from the ASEAN-5 markets. The Jarque-Bera testssuggest these series are not normal, the results in the 7th column suggest excess kurtosis and fat tails. The Indonesianand Thailand markets display the two highest daily and weekly standard deviations among the ASEAN-5. From thisresult, in conjunction with Figs. 1 and 2, it may be surmised that the Asian financial crisis was ignited partially byThailand economic policy and that Indonesia was affected the most, both in terms of price and volatility, over a longperiod. We examine such hypotheses later in this work.
It is also necessary to check each index is a nonstationary I(1) process for cointegration analysis. The ADF tests inTable 2 illustrate that in each market index the hypothesis of a unit root cannot be rejected, but can be rejected in thereturns. Table 2 further shows the ZA test results, revealing likely univariate structural breaks either in the interceptterm (Model 1) or both the intercept and trend terms (Model 3) in each daily and weekly market close to mid-1997(as expected), excluding Singapore. The results suggest that the ASEAN-5 countries exhibit similarly timed structuralbreaks and non-stationary behaviour, and that we must consider the Asian financial crisis effect in our analysis. In

2658 C.W.S. Chen et al. / Mathematics and Computers in Simulation 79 (2009) 2654–2664
Fig. 2. Time plots of weekly stock market indices for Indonesia, Malaysia, Philippine, Singapore and Thailand from 3 January 1994 to 12 August2005 (606 observations). The reference date is 18 July 1997.
Table 1Summary statistics: daily and weekly stock market returns for the period 3 January 1994 to 12 August 2005 with 3030 and 606 observations,respectively.
Market U.S. dollar Mean S.D. Maximum Minimum Skewness Excess kurtosis Normality* test
DailySingapore 0.0020 1.4372 0.0664 −0.0507 0.2427 10.8806 14971.2750
(0.0000)Malaysia −0.0217 1.8864 0.1076 −0.1049 0.8658 34.6283 151717.7854
(0.0000)Philippine −0.0395 1.7192 0.0934 −0.0464 0.8829 15.9567 32528.3964
(0.0000)Thailand −0.0453 1.9789 0.0660 −0.0507 0.3648 5.3683 3704.4568
(0.0000)Indonesia −0.0284 2.7755 0.0973 −0.1728 −1.6413 35.8378 163455.7320
(0.0000)
WeeklySingapore 0.0145 3.5007 0.0839 −0.1261 −0.7095 10.6041 2885.4017
(0.0000)Malaysia −0.0990 4.3554 0.1480 −0.1319 0.2045 15.3092 5912.4087
(0.0000)Philippine −0.1920 4.2122 0.0787 −0.1282 −0.4849 6.4508 1072.7112
(0.0000)Thailand −0.2157 4.7632 0.0779 −0.0738 −0.0020 2.0444 105.3622
(0.0000)Indonesia −0.1476 6.6668 0.1867 −0.2134 −1.2128 16.1077 6688.9036
(0.0000)
Value inside the parenthesis is the p-value.* The Jarque-Bera normality test statistics are listed. Lower p-values indicate evidence against the null hypothesis of normality.

C.W.S. Chen et al. / Mathematics and Computers in Simulation 79 (2009) 2654–2664 2659
Table 2ADF and Zivot–Andrews unit root tests: daily and weekly data for the period 3 January 1994 to 12 August 2005.
Country ADF index ADF return ZA Model 1 ZA Model 2 ZA Model 3
Daily dataSingapore −1.5966 −48.5114 −2.9414 −2.6929 −2.8652
(0.7945) (0.0000)Malaysia −1.4950 −47.5223 −6.3239*** −2.5916 −6.2515***
(0.8315) (0.0000) (03/07/97) (03/07/97)Philippine −1.3939 −45.8602 −5.1383** −2.9164 −5.3693***
(0.8629) (0.0000) (19/06/97) (19/06/97)Thailand −1.4838 −50.4651 −4.4856 −3.4995 −4.6190
(0.8352) (0.0000)Indonesian −0.9492 −42.7945 −7.5474*** −2.1578 −8.0132***
(0.9488) (0.0000) (05/08/97) (05/08/97)
Weekly dataSingapore −1.3899 −24.2123 −2.9592 −2.7627 −2.8999
(0.8632) (0.0000)Malaysia −1.1082 −23.8413 −6.3574*** −3.0998 −6.3351***
(0.9256) (0.0000) (04/07/97) (20/06/97)Philippine −1.6499 −14.5207 −5.2478 −3.1501 −5.3083
(0.7720) (0.0000) (27/06/97) (27/06/97)Thailand −25.0462 −25.0462 −4.6524* −4.8855** −4.6852
(0.0000) (0.0000) (05/07/96) (03/10/97)Indonesian −10.5258 −10.5258 −7.1354*** −2.5345 −7.4728***
(0.0000) (0.0000) (01/08/97) (01/08/97)
The second and third columns are the ADF test results for stock market indices (converted to U.S. dollars) and returns.* Significant at the 10% level.
** Significant at the 5% level.*** Significant at the 1% level.
summary, the results in this section suggest that a multivariate cointegration model allowing for structural breaks is agood candidate for this data.
4. Cointegration and structural breaks
Table 3 shows the standard Johansen test results, for the daily and weekly market indices, in the first two columns.This test finds that the cointegration rank is 1 at both frequencies, agreeing with previous research, and suggests a weak
Table 3Johansen and Inoue rank tests: daily and weekly data for the period 3 January 1994 to 12 August 2005.
H0 Johansen Model A Model B Model C
λTrace λmax λTrace λmax λTrace λmax λTrace λmax
Daily datar = 0 93.224 51.288 139.786 89.217 173.330 105.402 139.776 89.565r ≤ 1 41.935 21.253 69.975** 50.429*** 93.187** 55.600*** 69.914** 50.761***
(28/06/96) (24/03/97) (23/09/99) (07/10/97) (02/07/96) (26/03/97)
Weekly datar = 0 81.815** 42.234*** 121.121*** 80.377*** 158.185*** 87.423*** 120.788*** 79.464***
(13/06/97) (11/07/97) (24/12/99) (18/07/97) (24/12/99) (27/06/97)r ≤ 1 39.581 21.680 58.980 40.423* 92.553** 58.771*** 60.143 40.514*
(16/05/97) (17/12/99) (17/12/99) (21/03/97)
* Significant at the 10%.** Significant at the 5% level.
*** Significant at the 1% level.

2660 C.W.S. Chen et al. / Mathematics and Computers in Simulation 79 (2009) 2654–2664
Table 4Johansen rank test for single and two break models: daily and weekly data for the period 3 January 1994 to 12 August 2005.
H0 Full daily samples
The break point is 28/07/97 The break point is 17/12/99
λTrace λmax λTrace λmax
r = 0 155.0538 90.616* 142.9318 69.2345)r ≤ 1 64.4374*** 36.0180** 73.6972*** 43.9379***
(0.0063) (0.0106) (0.0005) (0.0007)
H0 Full daily samples
The break point is 13/06/97 The break point is 17/12/99
λTrace λmax λTrace λmax
r = 0 123.2771 53.8419 131.7842 61.3700r ≤ 1 69.4351*** 41.5419*** 70.4141*** 46.4014***
(0.0017) (0.0017) (0.0013) (0.0003)
H0 Full daily samples
The break points are 28/07/97 and 17/12/99 The break points are 18/07/97 and 17/12/99
λTrace λmax λTrace λmax
r = 0 177.7628 77.4770 151.453 72.0453r ≤ 1 100.2857 60.5148 79.4079* 39.7446r ≤ 2 39.7708** 24.3466** 39.6633** 28.1304**
* Significant at the 10%.** Significant at the 5% level.
*** Significant at the 1% level.
integration link, i.e. the system of five markets is driven by four long-term stochastic trends. This suggests that themarkets are mostly segmented and not strongly related in the long-term, and that there do exist some diversificationbenefits for investors across the region. However the test has ignored any possible structural breaks. The ISB tests,shown in columns 3–8, estimate the rank of the system as 2 for daily and either 1 or 2 for weekly data. This suggests thefive markets are driven by only three long-term trends and points to a higher level of long-term linkage or integrationfor these markets, and thus a lower level of risk reduction via diversification, than found in previous studies. This resultalone may justify our updated, extended analysis of integration in the ASEAN-5 markets.
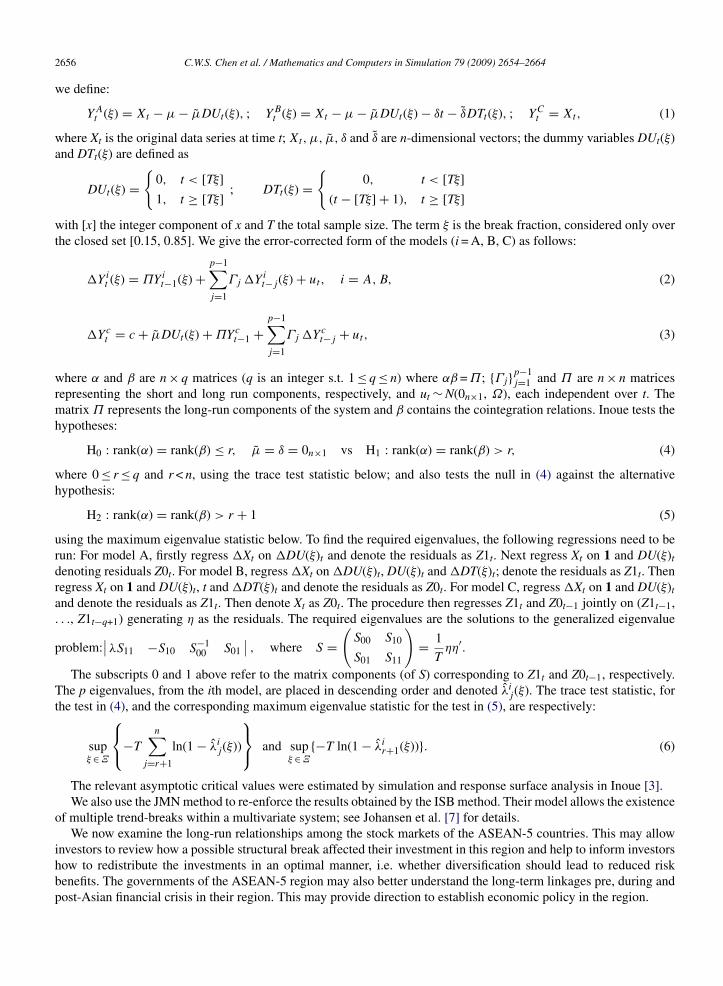
The ISB test finds significant structural breaks, mainly in mid-1997, but also possibly at the end of 1999 andmid-1996. All five markets move downwards at the end of 1999, led by a large drop in the Singapore index; seeFigs. 1 and 2. Only Thailand moves significantly down in mid-1996. Fig. 3 shows that both mid-1997 and the end of1999, but not mid-1996, rank highly for structural breaks under the ISB trace statistic for weekly data. Very similarresults were obtained for daily data and under the maximum eigenvalue statistic. Both mid-1997 and end of 1999 areoften significant under these tests. The most common break dates found were 28 July 1997 and 17 December 1999.
We next used the JMN model and tests to verify the ISB findings under one structural break, see Table 4. The criticalvalues for the rank test are in Johansen et al. [7]. The results clearly suggest a rank of 2 regardless of whether the breakis in mid-1997 or late 1999. The results strongly support those found by the ISB method above. It seems clear thatthe ASEAN-5 stock markets are more strongly cointegrated than previously thought, when a single structural break isaccounted for.
However, there is some empirical and visual evidence of more than one structural break occurring in both the dailyand weekly system from Figs. 1 and 3 and Tables 3 and 4. The estimated rank (of 2) may still be somewhat biasedunder the assumption only 1 structural break. Therefore, we employ a slightly ad hoc procedure to supplement theresults above. We apply the JMN method again, but this time including dummies for the two most likely break points:(i) 28 July 1997 and 17 December 1999 for daily data; and (ii) 13 June 1997 and 17 December 1999 for weeklydata. We note that methods to identify multiple break points are not apparent in the literature; as such this method of

C.W.S. Chen et al. / Mathematics and Computers in Simulation 79 (2009) 2654–2664 2661
Fig. 3. The trace statistics from Inoue’s rank test for weekly data from 8 September 1995 to 7 November 2003 (15–85% of sample, 425 observations).
2662 C.W.S. Chen et al. / Mathematics and Computers in Simulation 79 (2009) 2654–2664
multiple break identification relies on visual inspection and evidence from the ISB tests alone. Results are presented inTable 4. Here we see evidence that the cointegration rank may in fact be three (3) for both weekly and daily data. Thisfinding indicates a very strong long-term linkage between the ASEAN-5 and suggests that only two stochastic trendsare driving the system in the long run.
To summarise the results:
(i) The ZA univariate tests suggested a potential univariate break point in mid-1997 for most series for daily andweekly data.
(ii) The Johansen rank test suggests weak integration with a rank of 1, agreeing with the previous literature on ASEAN-5markets.
(iii) Two break dates in the system are suggested by the ISB tests. It seems that the five stock markets are impacted bythe Asian financial crisis (mid-1997) and possibly Year 2000 events (end of 1999, see below).
(iv) When allowing one structural break only, results suggest two cointegrating vectors among these five markets, i.e.there are only three long run stochastic trends driving the system of five markets. These results are consistentbetween the ISB and JMN tests and suggest a higher level of integration, and lower level of risk benefit fromdiversification, than previous work on the ASEAN-5.
(v) By allowing two break dates, we find three cointegrating vectors among the ASEAN-5 stock markets. This suggestsan even higher level of cointegration, and lower level of risk reduction by diversifying across markets, and thatonly two stochastic trends are driving the five markets in the long-term.
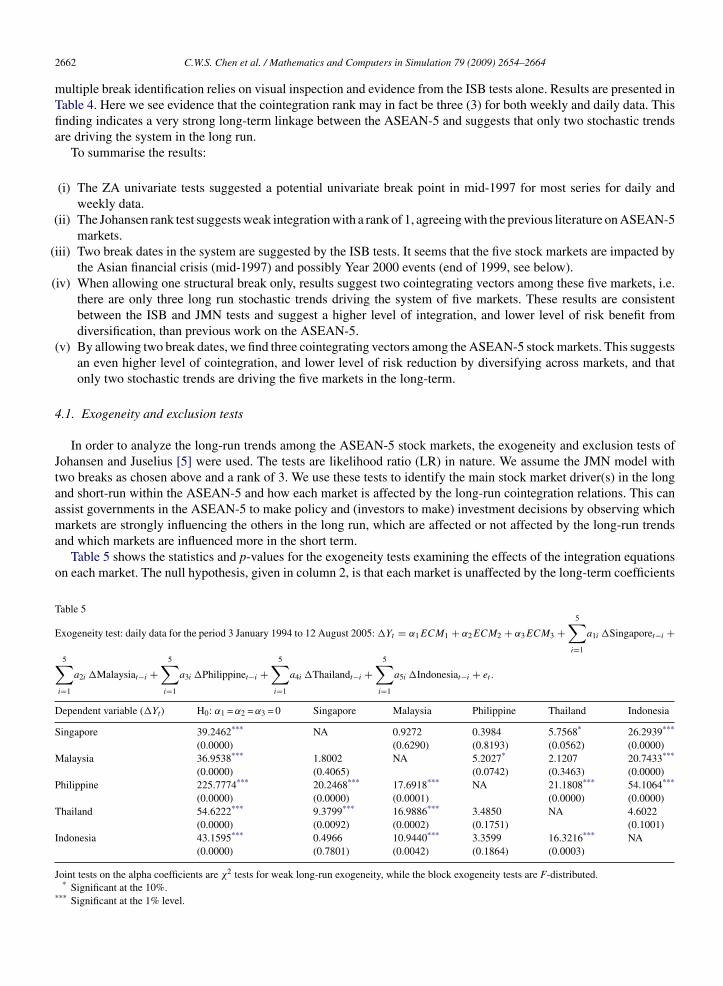
4.1. Exogeneity and exclusion tests
In order to analyze the long-run trends among the ASEAN-5 stock markets, the exogeneity and exclusion tests ofJohansen and Juselius [5] were used. The tests are likelihood ratio (LR) in nature. We assume the JMN model withtwo breaks as chosen above and a rank of 3. We use these tests to identify the main stock market driver(s) in the longand short-run within the ASEAN-5 and how each market is affected by the long-run cointegration relations. This canassist governments in the ASEAN-5 to make policy and (investors to make) investment decisions by observing whichmarkets are strongly influencing the others in the long run, which are affected or not affected by the long-run trendsand which markets are influenced more in the short term.
Table 5 shows the statistics and p-values for the exogeneity tests examining the effects of the integration equationson each market. The null hypothesis, given in column 2, is that each market is unaffected by the long-term coefficients
Table 5
Exogeneity test: daily data for the period 3 January 1994 to 12 August 2005: �Yt = α1ECM1 + α2ECM2 + α3ECM3 +5∑
i=1
a1i �Singaporet−i +
5∑i=1
a2i �Malaysiat−i +5∑
i=1
a3i �Philippinet−i +5∑
i=1
a4i �Thailandt−i +5∑
i=1
a5i �Indonesiat−i + et .
Dependent variable (�Yt) H0: α1 = α2 = α3 = 0 Singapore Malaysia Philippine Thailand Indonesia
Singapore 39.2462*** NA 0.9272 0.3984 5.7568* 26.2939***
(0.0000) (0.6290) (0.8193) (0.0562) (0.0000)Malaysia 36.9538*** 1.8002 NA 5.2027* 2.1207 20.7433***
(0.0000) (0.4065) (0.0742) (0.3463) (0.0000)Philippine 225.7774*** 20.2468*** 17.6918*** NA 21.1808*** 54.1064***
(0.0000) (0.0000) (0.0001) (0.0000) (0.0000)Thailand 54.6222*** 9.3799*** 16.9886*** 3.4850 NA 4.6022
(0.0000) (0.0092) (0.0002) (0.1751) (0.1001)Indonesia 43.1595*** 0.4966 10.9440*** 3.3599 16.3216*** NA
(0.0000) (0.7801) (0.0042) (0.1864) (0.0003)
Joint tests on the alpha coefficients are χ2 tests for weak long-run exogeneity, while the block exogeneity tests are F-distributed.* Significant at the 10%.
*** Significant at the 1% level.
C.W.S. Chen et al. / Mathematics and Computers in Simulation 79 (2009) 2654–2664 2663
Table 6Exclusion test: daily data for the period 3 January 1994 to 12 August 2005.
Country Exclusion form the cointegration space χ2(3) statistic p-Value
Singapore 22.4463 0.0004Malaysia 11.3005 0.0457Philippine 14.2612 0.0140Thailand 16.7883 0.0049Indonesia 5.2867 0.3818Joint 56.4779 0.0003
The exclusion tests were based on three cointegrating equations with two structural breaks and are χ2 distributed under the null.
in the VAR. Results from column 2 suggest that the affect on each market is significant at the 1% level. This indicatesthat all five stock markets are strongly impacted by the three estimated long-run equilibrium relationships.
We next used block exogeneity tests to examine the short run dynamics. These examine whether each market, inrow 1 of Table 5, affects the others in the short-run VAR terms. Table 5 shows that the Philippines market has almostno significant short-term effect in the other four markets, but is itself significantly influenced by price movementsin all other markets. In addition to each market affecting the Phillipines, the returns in Singapore significantly affectThailand in the short term; Malaysian returns have a significant effect on Thailand and Indonesia; Thailand returns affectSingapore and Indonesia; lastly, Indonesian returns affect Singapore and Malaysia. It seems that Thailand, Indonesiaand Malaysia are the main short-term drivers in the ASEAN-5 markets, with the Philippines being most influenced.
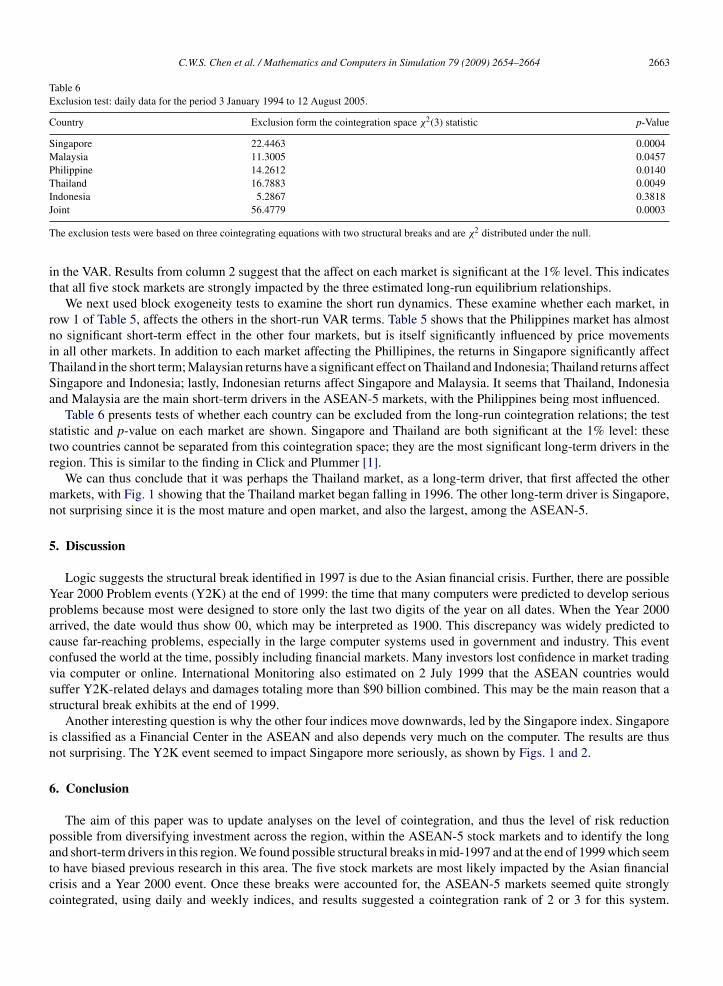
Table 6 presents tests of whether each country can be excluded from the long-run cointegration relations; the teststatistic and p-value on each market are shown. Singapore and Thailand are both significant at the 1% level: thesetwo countries cannot be separated from this cointegration space; they are the most significant long-term drivers in theregion. This is similar to the finding in Click and Plummer [1].
We can thus conclude that it was perhaps the Thailand market, as a long-term driver, that first affected the othermarkets, with Fig. 1 showing that the Thailand market began falling in 1996. The other long-term driver is Singapore,not surprising since it is the most mature and open market, and also the largest, among the ASEAN-5.
5. Discussion
Logic suggests the structural break identified in 1997 is due to the Asian financial crisis. Further, there are possibleYear 2000 Problem events (Y2K) at the end of 1999: the time that many computers were predicted to develop seriousproblems because most were designed to store only the last two digits of the year on all dates. When the Year 2000arrived, the date would thus show 00, which may be interpreted as 1900. This discrepancy was widely predicted tocause far-reaching problems, especially in the large computer systems used in government and industry. This eventconfused the world at the time, possibly including financial markets. Many investors lost confidence in market tradingvia computer or online. International Monitoring also estimated on 2 July 1999 that the ASEAN countries wouldsuffer Y2K-related delays and damages totaling more than $90 billion combined. This may be the main reason that astructural break exhibits at the end of 1999.
Another interesting question is why the other four indices move downwards, led by the Singapore index. Singaporeis classified as a Financial Center in the ASEAN and also depends very much on the computer. The results are thusnot surprising. The Y2K event seemed to impact Singapore more seriously, as shown by Figs. 1 and 2.
6. Conclusion
The aim of this paper was to update analyses on the level of cointegration, and thus the level of risk reductionpossible from diversifying investment across the region, within the ASEAN-5 stock markets and to identify the longand short-term drivers in this region. We found possible structural breaks in mid-1997 and at the end of 1999 which seemto have biased previous research in this area. The five stock markets are most likely impacted by the Asian financialcrisis and a Year 2000 event. Once these breaks were accounted for, the ASEAN-5 markets seemed quite stronglycointegrated, using daily and weekly indices, and results suggested a cointegration rank of 2 or 3 for this system.

2664 C.W.S. Chen et al. / Mathematics and Computers in Simulation 79 (2009) 2654–2664
This indicated only two or three long-term stochastic trends were driving the ASEAN-5 and that these markets aremore strongly cointegrated, thus displaying less diversification benefits, than found in previous studies of this region.Indonesia and Malaysia were found to be the main short-term drivers of the ASEAN-5 markets, with the Philippinesaffected by all other markets in the region. Singapore and Thailand were the main long-term drivers of the system, i.e.the main influence on price movements in the region over the long-term. Finally, we must take note of the differencesin economic policy among the ASEAN-5, e.g. the Malaysian government controls the exchange rate and the stockmarket strictly (e.g. see [1]). The different market sizes of the five markets may also play some part in our findings.These factors may have affected the results and conclusions of this paper.
Acknowledgements
We thank the special issue editors and a referee for comments that improved the paper. Cathy Chen is supported bygrant 95-2118-M-035-001 of National Science Council (NSC) of Taiwan and grant 94GB67 of Feng Chia University.Richard Gerlach, while on research visits to Feng Chia University, was supported by the grant 94GB67 of Feng ChiaUniversity and the University of Sydney via a new staff grant. Part of the work of Cathy Chen, was undertaken duringa research visit to the University of Sydney.
References
[1] R.W. Click, M.G. Plummer, Stock market integration in ASEAN after the Asian financial crisis, Journal of Asian Economics 16 (2005) 5–28.[2] R. Gerlach, P. Wilson, R. Zurbruegg, Structural breaks and diversification: the impact of the 1997 Asian financial crisis on the integration of
Asia-Pacific real estate markets, Journal of International Money and Finance 25 (2006) 974–991.[3] A. Inoue, Tests of co-integrating rank with a trend-break, Journal of Econometrics 90 (1999) 215–237.[4] S. Johansen, Statistical analysis of co-integration vectors, Journal of Economic Dynamics and Control 12 (1988) 231–254.[5] S. Johansen, K. Juselius, Maximum likelihood estimation and inference on cointegration with application to the demand for money, Oxford
Bulletin of Economics and Statistics 52 (1990) 169–210.[6] S. Johansen, Estimation and hypothesis testing of co-integration vectors in Gaussian vector autoregressive models, Econometrica 59 (1991)
1551–1580.[7] S. Johansen, R. Mosconi, B. Nielsen, Co-integration analysis in the presence of structural breaks in deterministic trends, Econometrics Journal
3 (2000) 216–249.[8] K. Kasa, Common stochastic trends in international stock markets, Journal of Monetary Economics 29 (1992) 95–124.[9] E.D. Palac-McMiken, An examination of ASEAN stock market: a cointegration approach, ASEAN Economic Bulletin 13 (1997) 299–311.
[10] P. Perron, The great crash the oil price shock and the unit root hypothesis, Econometrica 57 (1989) 1361–1401.[11] E.D. Roca, E.A. Selvanathan, W.F. Shepherd, Are the ASEAN equity market interdependent, ASEAN Economic Bulletin 15 (1998) 109–120.[12] S.C. Sharma, P. Wongbanpo, Long-term and cycles in ASEAN stock market, Review of Financial Economics 11 (2002) 299–315.[13] H.C. Sheng, A. Tu, A study of co-integration and variance decomposition among national equity indices before and during the period of the
Asian financial crisis, Journal of Multinational Financial Management 10 (2000) 345–365.[14] J.H. Stock, M.W. Watson, Testing for common trends, Journal of the American Statistical Association 83 (1988) 1097–1107.[15] E. Zivot, D. Andrews, Further evidence on the great crash the oil-price shock and the unit-root hypothesis, Journal of Business and Economic
Statistics 10 (1992) 251–270.
Copyright © 2022 FDOKUMEN