The Impact of Patient Self-Testing of Prothrombin Time for Managing Anticoagulation: Rationale and...
10
Journal of Thrombosis and Thrombolysis 19(3), 163–172, 2005. C 2005 Springer Science + Business Media, Inc. Manufactured in The Netherlands. The Impact of Patient Self-Testing of Prothrombin Time for Managing Anticoagulation: Rationale and Design of VA Cooperative Study #481—The Home INR Study (THINRS) David B. Matchar MD, 1,2 Alan K. Jacobson MD, 3,4 Robert G. Edson MA, 5 Philip W. Lavori PhD, 5,6 Jack E. Ansell MD, 7 Michael D. Ezekowitz MD, 8 Frederick Rickles MD, 9 Lou Fiore MD, 10 Kathy Boardman PharmD, 11 Ciaran Phibbs PhD, 5,12 Stephan D. Fihn MD, 13,14 Julia E. Vertrees PharmD, 11 Rowena Dolor MD 1,2 1 Health Services Research Field Program, VA Medical Center, Durham, NC; 2 Division of General Medicine, Dept. of Medicine, Duke University Medical Center, Durham, NC; 3 Jerry L. Pettis VA Medical Center, Research and Development Service (151), Loma Linda, CA; 4 Department of Internal Medicine, Loma Linda University, Loma Linda, CA; 5 VA Palo Alto Health Care System, Cooperative Studies Program Coordinating Center (151K), Palo Alto, CA; 6 Department of Health Research and Policy, Division of Biostatistics, Stanford University, Palo Alto, CA; 7 Department of Medicine, Boston University Medical Center, Boston, MA; 8 MCP/Hahnemann University, Philadelphia, PA; 9 The George Washington University Medical Center, Washington, DC; 10 Boston VA Medical Center, Boston, MA; 11 VA Cooperative Studies Program Clinical Research Pharmacy Coordinating Center, Albuquerque, NM; 12 VA Palo Alto Health Care System, Health Economics Resource Center (152), Palo Alto, CA; 13 VA Puget Sound Health Care System (152), Seattle, WA; 14 Division of General Internal Medicine, University of Washington School of Medicine, Seattle, WA Abstract. Background: Anticoagulation (AC) with war- farin reduces the risk of thromboembolism (TE) in a va- riety of applications, yet despite compelling evidence of the value and importance of high quality AC, warfarin remains underused, and dosing is often suboptimal. Ap- proaches to improve AC quality include (1) an AC ser- vice (ACS), which allows the physician to delegate day- to-day details of AC management to another provider dedicated to AC care, and (2) incorporating into the treatment plan patient self-testing (PST) under which, after completing a training program, patients perform their own blood testing (typically, using a finger-stick blood analyzer), have dosage adjustments guided by a standard protocol, and forward test results, dosing and other information to the provider. Studies have sug- gested that PST can improve the quality of AC and per- haps lower TE and bleed rates. The purpose of Department of Veterans Affairs (VA) Cooperative Studies Program (CSP) #481, “The Home INR Study” (THINRS) is to compare AC management with frequent PST using a home monitoring device to high quality AC management (HQACM) implemented by an ACS with conventional monitoring of prothrombin time by international normalized ratio (INR) on major health outcomes. PST in THINRS involves use of an INR monitoring device that is FDA approved for home use. Study design: Sites are VA Medical Centers where the ACS has an active roster of more than 400 patients. THINRS includes patients with atrial fibrillation (AF) and/or mechanical heart valve (MHV) expected to be an- ticoagulated indefinitely. THINRS has two parts. In Part 1, candidates for PST are evaluated for 2 to 4 weeks for their ability to use home monitoring devices. In Part 2, individuals capa- ble of performing PST are randomized to (1) HQACM with testing every 4 weeks and as indicated for out of range values, medication/clinical changes, or (2) PST with testing every week and as indicated for out of range values, medication/clinical changes. Address for correspondence: David B. Matchar, MD, Duke University Medical Center, Center for Clinical Health Policy Research, 2200 W Main St, Suite 220, Durham, NC 27705. Tel.: (919) 286-3399; Fax: (919) 286-5601; E-mail: [email protected] Support for this research was provided by: The Department of Veterans Affairs, Cooperative Studies Program (125), 810 Vermont Ave NW, Washington, DC 20420. 163
-
Upload
dukemedschool -
Category
Documents
-
view
0 -
download
0
Transcript of The Impact of Patient Self-Testing of Prothrombin Time for Managing Anticoagulation: Rationale and...
Journal of Thrombosis and Thrombolysis 19(3), 163–172, 2005.C© 2005 Springer Science + Business Media, Inc. Manufactured in The Netherlands.
The Impact of Patient Self-Testing of Prothrombin Time forManaging Anticoagulation: Rationale and Design of VACooperative Study #481—The Home INR Study (THINRS)
David B. Matchar MD,1,2 Alan K. Jacobson MD,3,4
Robert G. Edson MA,5 Philip W. Lavori PhD,5,6
Jack E. Ansell MD,7 Michael D. Ezekowitz MD,8
Frederick Rickles MD,9 Lou Fiore MD,10 KathyBoardman PharmD,11 Ciaran Phibbs PhD,5,12
Stephan D. Fihn MD,13,14 Julia E. VertreesPharmD,11 Rowena Dolor MD1,2
1Health Services Research Field Program, VA Medical Center,Durham, NC; 2Division of General Medicine, Dept. of Medicine,Duke University Medical Center, Durham, NC; 3Jerry L. PettisVA Medical Center, Research and Development Service (151),Loma Linda, CA; 4Department of Internal Medicine, LomaLinda University, Loma Linda, CA; 5VA Palo Alto Health CareSystem, Cooperative Studies Program Coordinating Center(151K), Palo Alto, CA; 6Department of Health Research andPolicy, Division of Biostatistics, Stanford University, Palo Alto,CA; 7Department of Medicine, Boston University Medical Center,Boston, MA; 8MCP/Hahnemann University, Philadelphia, PA;9The George Washington University Medical Center,Washington, DC; 10Boston VA Medical Center, Boston, MA; 11VACooperative Studies Program Clinical Research PharmacyCoordinating Center, Albuquerque, NM; 12VA Palo Alto HealthCare System, Health Economics Resource Center (152), PaloAlto, CA; 13VA Puget Sound Health Care System (152), Seattle,WA; 14Division of General Internal Medicine, University ofWashington School of Medicine, Seattle, WA
Abstract. Background: Anticoagulation (AC) with war-farin reduces the risk of thromboembolism (TE) in a va-riety of applications, yet despite compelling evidence ofthe value and importance of high quality AC, warfarinremains underused, and dosing is often suboptimal. Ap-proaches to improve AC quality include (1) an AC ser-vice (ACS), which allows the physician to delegate day-to-day details of AC management to another providerdedicated to AC care, and (2) incorporating into thetreatment plan patient self-testing (PST) under which,after completing a training program, patients performtheir own blood testing (typically, using a finger-stickblood analyzer), have dosage adjustments guided by astandard protocol, and forward test results, dosing andother information to the provider. Studies have sug-gested that PST can improve the quality of AC and per-haps lower TE and bleed rates.
The purpose of Department of Veterans Affairs (VA)Cooperative Studies Program (CSP) #481, “The HomeINR Study” (THINRS) is to compare AC managementwith frequent PST using a home monitoring device tohigh quality AC management (HQACM) implemented byan ACS with conventional monitoring of prothrombintime by international normalized ratio (INR) on majorhealth outcomes. PST in THINRS involves use of an INRmonitoring device that is FDA approved for home use.
Study design: Sites are VA Medical Centers where theACS has an active roster of more than 400 patients.THINRS includes patients with atrial fibrillation (AF)and/or mechanical heart valve (MHV) expected to be an-ticoagulated indefinitely.
THINRS has two parts. In Part 1, candidates for PSTare evaluated for 2 to 4 weeks for their ability to usehome monitoring devices. In Part 2, individuals capa-ble of performing PST are randomized to (1) HQACMwith testing every 4 weeks and as indicated for out ofrange values, medication/clinical changes, or (2) PSTwith testing every week and as indicated for out ofrange values, medication/clinical changes.
Address for correspondence: David B. Matchar, MD, DukeUniversity Medical Center, Center for Clinical HealthPolicy Research, 2200 W Main St, Suite 220, Durham,NC 27705. Tel.: (919) 286-3399; Fax: (919) 286-5601;E-mail: [email protected]
Support for this research was provided by: The Departmentof Veterans Affairs, Cooperative Studies Program (125), 810Vermont Ave NW, Washington, DC 20420.
163
164 Matchar et al.
The primary outcome measure is event rates, definedas the percent of patients who have a stroke, majorbleed, or die. Secondary outcomes include total time inrange (TTR), other events (myocardial infarction (MI),non-stroke TE, minor bleeds), competence and compli-ance with PST, satisfaction with AC, AC associated qual-ity of life (QOL), and cost-effectiveness.
To assess the effect of PST frequency on TTR andother outcomes, at selected sites patients randomizedto perform PST are assigned one of three test frequen-cies (weekly, twice weekly, or once every four weeks).
Key Words. anticoagulation, patient self-testing, atrialfibrillation, mechanical heart valve
Introduction
BackgroundAnticoagulation (AC) with warfarin (Coumadin©R)has been shown to reduce the risk of thromboem-bolism (TE) in a variety of applications [1]. Despitethe compelling evidence supporting the value of ACand the importance of high quality AC, warfarin re-mains underused and, for those receiving treatment,dosing is often suboptimal [2].
Several approaches have been recommended toimprove the quality of AC. One approach is an ACservice (ACS), which recognizes that the detail- andtime-intensive activity of AC management is diffi-cult in the hectic environment of the busy outpatientclinic. An ACS allows the busy physician to delegatethe day-to-day details of AC management to anotherprovider (e.g., a pharmacist or nurse) who can givehis or her complete attention to AC. Though an ACSprovides the infrastructure to monitor and maintainAC, it is not clear that this translates into substan-tially improved AC quality [2].
Another approach to improving the quality of ACis to engage the patient more directly in the pro-cess of care. One way to do this, illustrated by mod-ern strategies for diabetes care, is by incorporat-ing a home-monitoring system into a comprehensivetreatment plan. Patient self-testing (PST) involvespatients performing their own blood testing (typi-cally, using a finger-stick blood analyzer). In general,(a) patients are allowed to practice PST only aftercompleting a comprehensive training program; (b)dosage adjustments are guided by a standard pro-tocol; and (c) test results, dosing and other perti-nent information are forwarded (e.g., by telephoneor modem) to the provider on a regular basis. Sev-eral studies have suggested that PST with or with-out patient self-management of warfarin dosing canimprove the quality of AC and perhaps even TE andbleed rates [3–9]. (For a detailed review of these stud-ies [10]). Based on these studies, PST was consideredpromising, but, since most evidence was related topatients with MHV for whom AC was not optional,and there was limited information on health out-
comes, Medicare decided only to permit reimburse-ment of PST devices for patients with MHV [11].The Department of Veterans Affairs (VA) Coopera-tive Studies Program (CSP) #481, “The Home INRStudy” or THINRS, is designed to address both theclinical and clinical policy questions surrounding useof PST.
ObjectivesThe primary objective of THINRS is to compareAC management with frequent patient self-testing(PST) of prothrombin time standardized to the in-ternational normalized ratio (INR) using a homemonitoring device to high quality AC management(HQACM) implemented by an AC service (ACS) withconventional monitoring on major health outcomes(stroke, major bleed, and mortality; see Table 1).HQACM is AC care provided according to acceptedfunctional definitions established by the ManagingAnticoagulation Services Trial [2] (MAST), based onwork of the Anticoagulation Forum.
The secondary objectives of the study are to com-pare PST versus HQACM for the following outcomevariables:
• Time in target range (TTR), both with and withoutadjustment for event risk, based on INR;
• Loss function (i.e., derived from integrating the ob-served INR values over the distribution of projectedoutcome rate per INR value);
• Events other than those for the primary outcome(e.g., minor bleeds), as defined in Table 1;
• Competence and compliance with PST (for the PSTgroup only);
• Satisfaction with care (preferred managementstrategy);
• AC-related quality of life (QOL);• Health state utility;• Health services utilization and costs; and• Cost-effectiveness;• Other secondary objectives are to:• Identify patient characteristics that predict correct
use of INR self-monitoring devices for PST;• Identify categories of patients and indications for
which PST is most clinically effective and cost ef-fective; and
• In a substudy, determine the relationship betweenfrequency of testing and each of the primary andsecondary outcomes described above.
Methods
OverviewTHINRS is a trial of the clinical impact of PST withweekly testing compared to HQACM provided byan ACS with conventional testing every four weeks(Fig. 1). Sites are 28 VA Medical Centers with ACSswith active rosters of at least 400 patients. THINRSincludes patients with AF and/or MHV who are
Design of PT-INR Self-Testing Study CSP #481 165
expected to be anticoagulated indefinitely. The studyhas two parts.
Part 1 is a lead-in during which consenting pa-tients are evaluated over a 2- to 4-week period fortheir ability to properly use the home monitoring
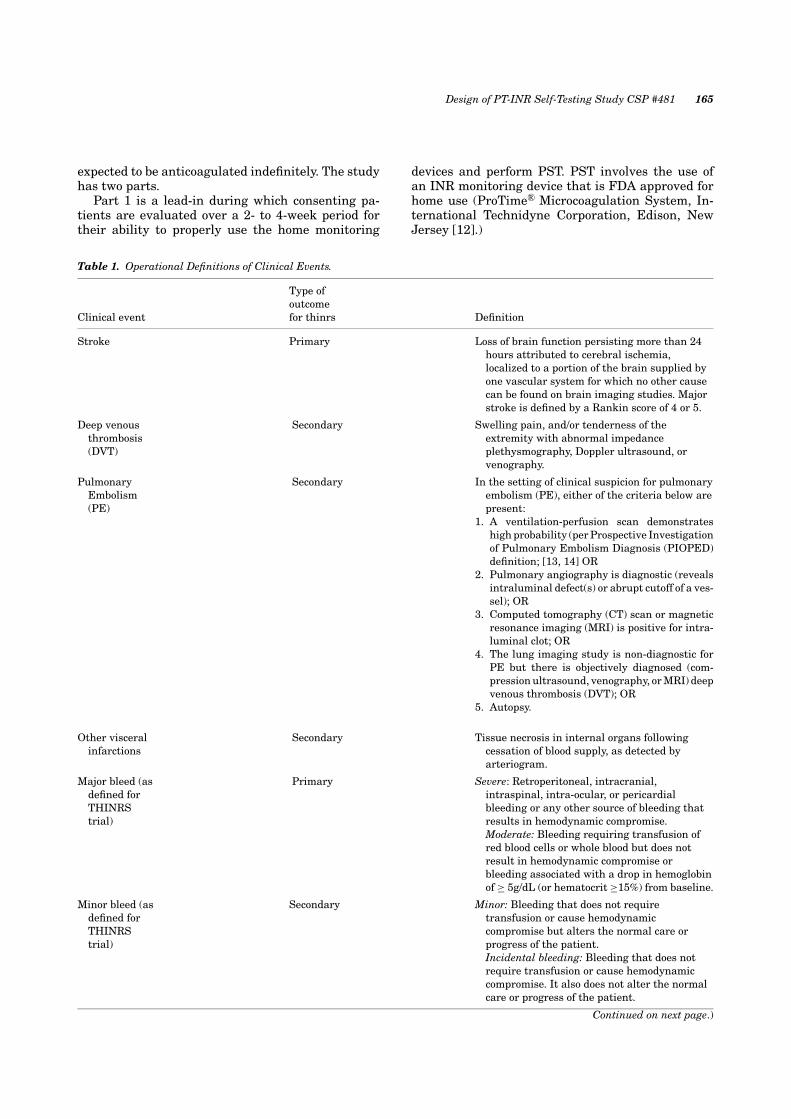
Table 1. Operational Definitions of Clinical Events.
Type ofoutcome
Clinical event for thinrs Definition
Stroke Primary Loss of brain function persisting more than 24hours attributed to cerebral ischemia,localized to a portion of the brain supplied byone vascular system for which no other causecan be found on brain imaging studies. Majorstroke is defined by a Rankin score of 4 or 5.
Deep venousthrombosis(DVT)
Secondary Swelling pain, and/or tenderness of theextremity with abnormal impedanceplethysmography, Doppler ultrasound, orvenography.
PulmonaryEmbolism(PE)
Secondary In the setting of clinical suspicion for pulmonaryembolism (PE), either of the criteria below arepresent:
1. A ventilation-perfusion scan demonstrateshigh probability (per Prospective Investigationof Pulmonary Embolism Diagnosis (PIOPED)definition; [13, 14] OR
2. Pulmonary angiography is diagnostic (revealsintraluminal defect(s) or abrupt cutoff of a ves-sel); OR
3. Computed tomography (CT) scan or magneticresonance imaging (MRI) is positive for intra-luminal clot; OR
4. The lung imaging study is non-diagnostic forPE but there is objectively diagnosed (com-pression ultrasound, venography, or MRI) deepvenous thrombosis (DVT); OR
5. Autopsy.
Other visceralinfarctions
Secondary Tissue necrosis in internal organs followingcessation of blood supply, as detected byarteriogram.
Major bleed (asdefined forTHINRStrial)
Primary Severe: Retroperitoneal, intracranial,intraspinal, intra-ocular, or pericardialbleeding or any other source of bleeding thatresults in hemodynamic compromise.Moderate: Bleeding requiring transfusion ofred blood cells or whole blood but does notresult in hemodynamic compromise orbleeding associated with a drop in hemoglobinof ≥ 5g/dL (or hematocrit ≥15%) from baseline.
Minor bleed (asdefined forTHINRStrial)
Secondary Minor: Bleeding that does not requiretransfusion or cause hemodynamiccompromise but alters the normal care orprogress of the patient.Incidental bleeding: Bleeding that does notrequire transfusion or cause hemodynamiccompromise. It also does not alter the normalcare or progress of the patient.
Continued on next page.)
devices and perform PST. PST involves the use ofan INR monitoring device that is FDA approved forhome use (ProTime©R Microcoagulation System, In-ternational Technidyne Corporation, Edison, NewJersey [12].)
166 Matchar et al.
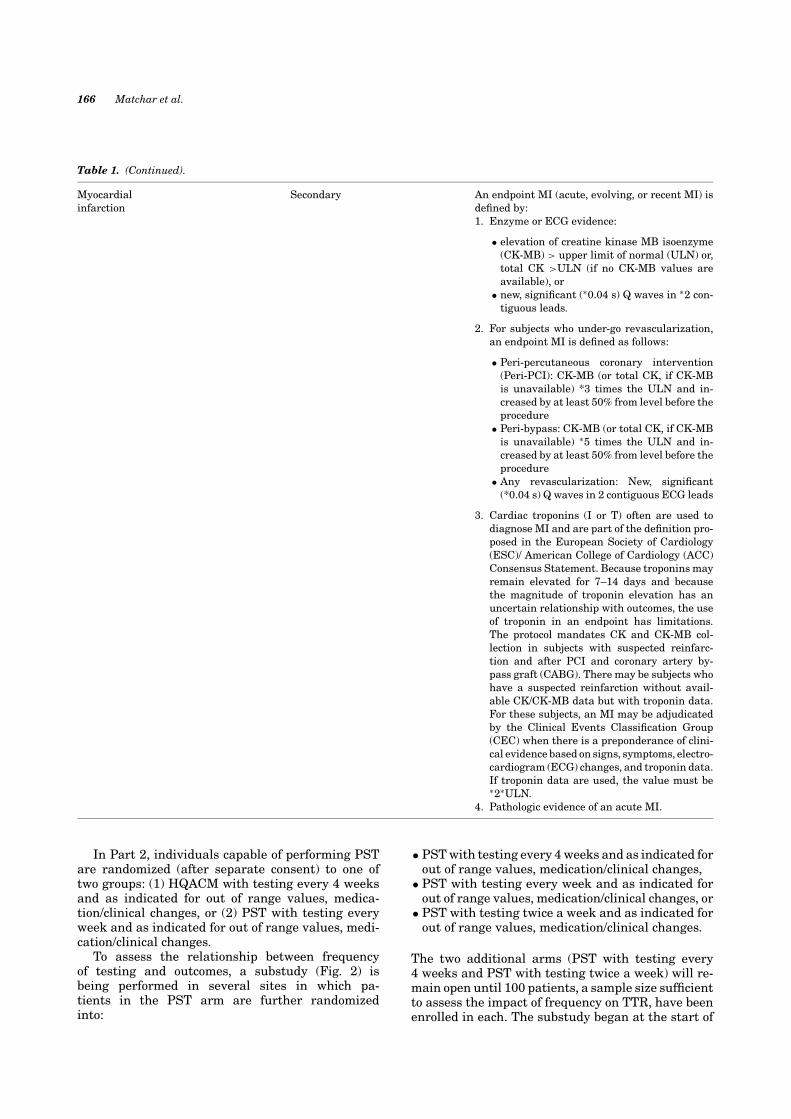
Table 1. (Continued).
Myocardialinfarction
Secondary An endpoint MI (acute, evolving, or recent MI) isdefined by:1. Enzyme or ECG evidence:
• elevation of creatine kinase MB isoenzyme(CK-MB) > upper limit of normal (ULN) or,total CK >ULN (if no CK-MB values areavailable), or
• new, significant (∗0.04 s) Q waves in ∗2 con-tiguous leads.
2. For subjects who under-go revascularization,an endpoint MI is defined as follows:
• Peri-percutaneous coronary intervention(Peri-PCI): CK-MB (or total CK, if CK-MBis unavailable) *3 times the ULN and in-creased by at least 50% from level before theprocedure
• Peri-bypass: CK-MB (or total CK, if CK-MBis unavailable) ∗5 times the ULN and in-creased by at least 50% from level before theprocedure
• Any revascularization: New, significant(*0.04 s) Q waves in 2 contiguous ECG leads
3. Cardiac troponins (I or T) often are used todiagnose MI and are part of the definition pro-posed in the European Society of Cardiology(ESC)/ American College of Cardiology (ACC)Consensus Statement. Because troponins mayremain elevated for 7–14 days and becausethe magnitude of troponin elevation has anuncertain relationship with outcomes, the useof troponin in an endpoint has limitations.The protocol mandates CK and CK-MB col-lection in subjects with suspected reinfarc-tion and after PCI and coronary artery by-pass graft (CABG). There may be subjects whohave a suspected reinfarction without avail-able CK/CK-MB data but with troponin data.For these subjects, an MI may be adjudicatedby the Clinical Events Classification Group(CEC) when there is a preponderance of clini-cal evidence based on signs, symptoms, electro-cardiogram (ECG) changes, and troponin data.If troponin data are used, the value must be∗2∗ULN.
4. Pathologic evidence of an acute MI.
In Part 2, individuals capable of performing PSTare randomized (after separate consent) to one oftwo groups: (1) HQACM with testing every 4 weeksand as indicated for out of range values, medica-tion/clinical changes, or (2) PST with testing everyweek and as indicated for out of range values, medi-cation/clinical changes.
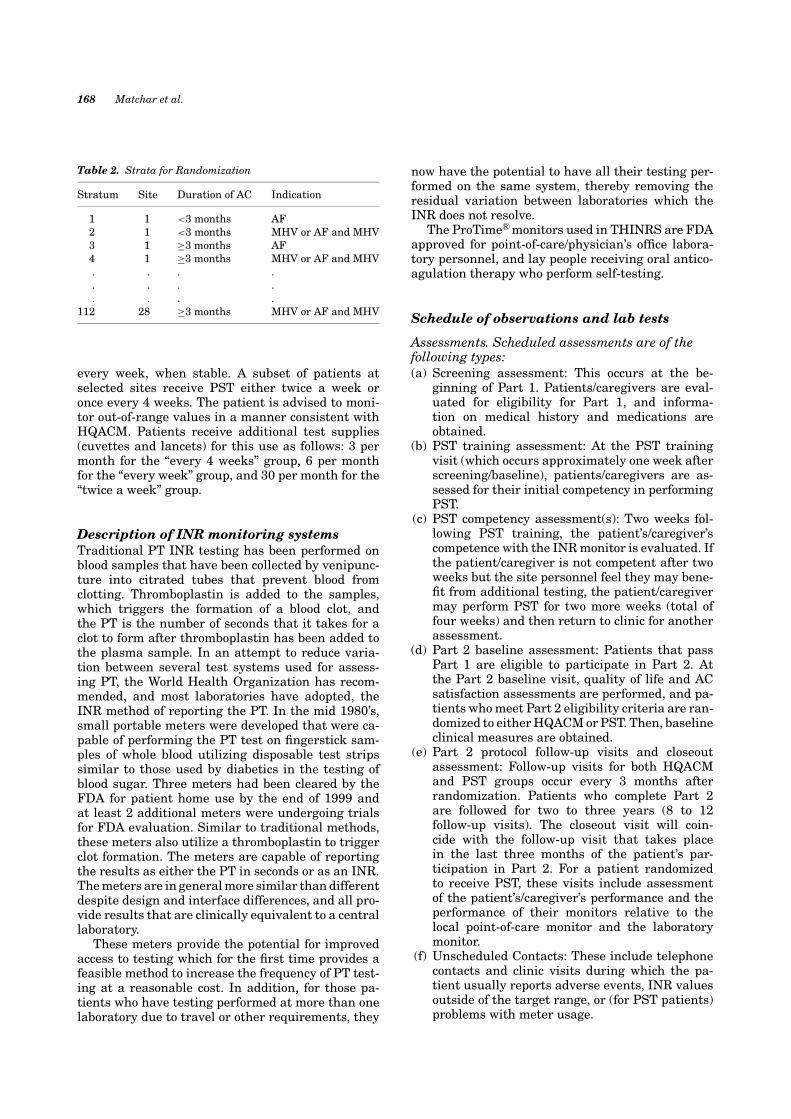
To assess the relationship between frequencyof testing and outcomes, a substudy (Fig. 2) isbeing performed in several sites in which pa-tients in the PST arm are further randomizedinto:
• PST with testing every 4 weeks and as indicated forout of range values, medication/clinical changes,
• PST with testing every week and as indicated forout of range values, medication/clinical changes, or
• PST with testing twice a week and as indicated forout of range values, medication/clinical changes.
The two additional arms (PST with testing every4 weeks and PST with testing twice a week) will re-main open until 100 patients, a sample size sufficientto assess the impact of frequency on TTR, have beenenrolled in each. The substudy began at the start of
Design of PT-INR Self-Testing Study CSP #481 167
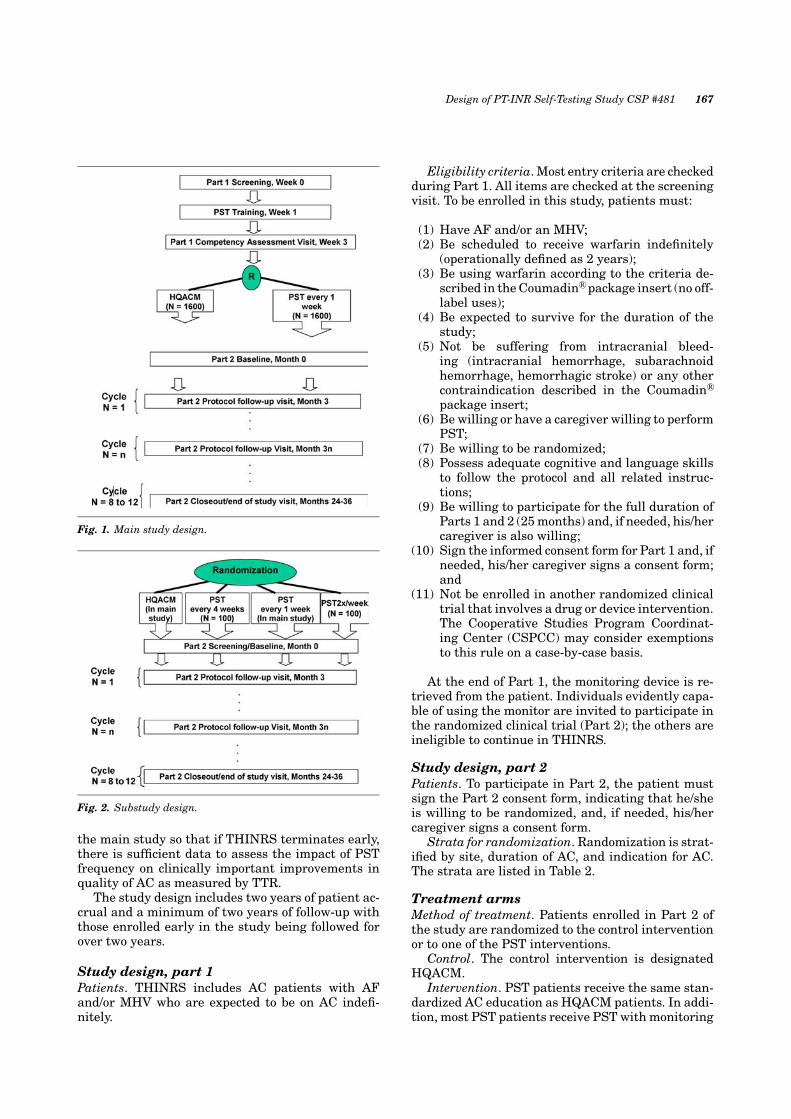
Fig. 1. Main study design.
Fig. 2. Substudy design.
the main study so that if THINRS terminates early,there is sufficient data to assess the impact of PSTfrequency on clinically important improvements inquality of AC as measured by TTR.
The study design includes two years of patient ac-crual and a minimum of two years of follow-up withthose enrolled early in the study being followed forover two years.
Study design, part 1Patients. THINRS includes AC patients with AFand/or MHV who are expected to be on AC indefi-nitely.
Eligibility criteria. Most entry criteria are checkedduring Part 1. All items are checked at the screeningvisit. To be enrolled in this study, patients must:
(1) Have AF and/or an MHV;(2) Be scheduled to receive warfarin indefinitely
(operationally defined as 2 years);(3) Be using warfarin according to the criteria de-
scribed in the Coumadin©R package insert (no off-label uses);
(4) Be expected to survive for the duration of thestudy;
(5) Not be suffering from intracranial bleed-ing (intracranial hemorrhage, subarachnoidhemorrhage, hemorrhagic stroke) or any othercontraindication described in the Coumadin©R
package insert;(6) Be willing or have a caregiver willing to perform
PST;(7) Be willing to be randomized;(8) Possess adequate cognitive and language skills
to follow the protocol and all related instruc-tions;
(9) Be willing to participate for the full duration ofParts 1 and 2 (25 months) and, if needed, his/hercaregiver is also willing;
(10) Sign the informed consent form for Part 1 and, ifneeded, his/her caregiver signs a consent form;and
(11) Not be enrolled in another randomized clinicaltrial that involves a drug or device intervention.The Cooperative Studies Program Coordinat-ing Center (CSPCC) may consider exemptionsto this rule on a case-by-case basis.
At the end of Part 1, the monitoring device is re-trieved from the patient. Individuals evidently capa-ble of using the monitor are invited to participate inthe randomized clinical trial (Part 2); the others areineligible to continue in THINRS.
Study design, part 2Patients. To participate in Part 2, the patient mustsign the Part 2 consent form, indicating that he/sheis willing to be randomized, and, if needed, his/hercaregiver signs a consent form.
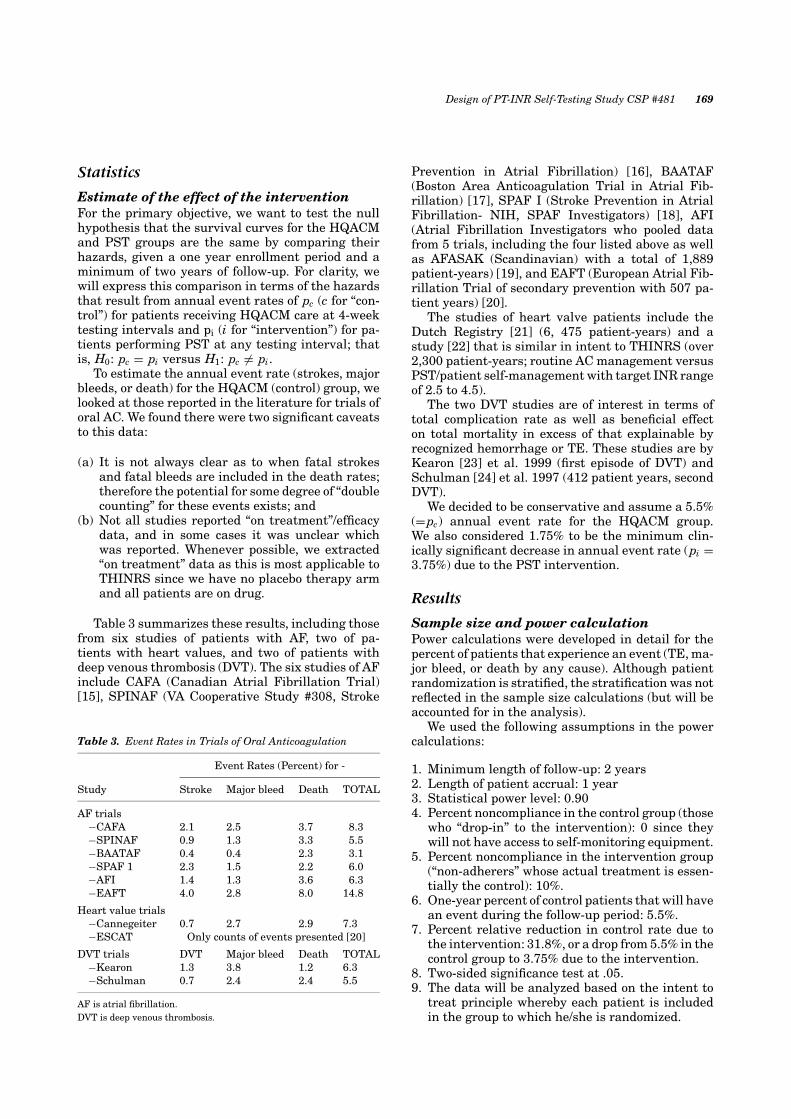
Strata for randomization. Randomization is strat-ified by site, duration of AC, and indication for AC.The strata are listed in Table 2.
Treatment armsMethod of treatment. Patients enrolled in Part 2 ofthe study are randomized to the control interventionor to one of the PST interventions.
Control. The control intervention is designatedHQACM.
Intervention. PST patients receive the same stan-dardized AC education as HQACM patients. In addi-tion, most PST patients receive PST with monitoring
168 Matchar et al.
Table 2. Strata for Randomization
Stratum Site Duration of AC Indication
1 1 <3 months AF2 1 <3 months MHV or AF and MHV3 1 ≥3 months AF4 1 ≥3 months MHV or AF and MHV. . . .. . . .. . . .
112 28 ≥3 months MHV or AF and MHV
every week, when stable. A subset of patients atselected sites receive PST either twice a week oronce every 4 weeks. The patient is advised to moni-tor out-of-range values in a manner consistent withHQACM. Patients receive additional test supplies(cuvettes and lancets) for this use as follows: 3 permonth for the “every 4 weeks” group, 6 per monthfor the “every week” group, and 30 per month for the“twice a week” group.
Description of INR monitoring systemsTraditional PT INR testing has been performed onblood samples that have been collected by venipunc-ture into citrated tubes that prevent blood fromclotting. Thromboplastin is added to the samples,which triggers the formation of a blood clot, andthe PT is the number of seconds that it takes for aclot to form after thromboplastin has been added tothe plasma sample. In an attempt to reduce varia-tion between several test systems used for assess-ing PT, the World Health Organization has recom-mended, and most laboratories have adopted, theINR method of reporting the PT. In the mid 1980’s,small portable meters were developed that were ca-pable of performing the PT test on fingerstick sam-ples of whole blood utilizing disposable test stripssimilar to those used by diabetics in the testing ofblood sugar. Three meters had been cleared by theFDA for patient home use by the end of 1999 andat least 2 additional meters were undergoing trialsfor FDA evaluation. Similar to traditional methods,these meters also utilize a thromboplastin to triggerclot formation. The meters are capable of reportingthe results as either the PT in seconds or as an INR.The meters are in general more similar than differentdespite design and interface differences, and all pro-vide results that are clinically equivalent to a centrallaboratory.
These meters provide the potential for improvedaccess to testing which for the first time provides afeasible method to increase the frequency of PT test-ing at a reasonable cost. In addition, for those pa-tients who have testing performed at more than onelaboratory due to travel or other requirements, they
now have the potential to have all their testing per-formed on the same system, thereby removing theresidual variation between laboratories which theINR does not resolve.
The ProTime©R monitors used in THINRS are FDAapproved for point-of-care/physician’s office labora-tory personnel, and lay people receiving oral antico-agulation therapy who perform self-testing.
Schedule of observations and lab tests
Assessments. Scheduled assessments are of thefollowing types:(a) Screening assessment: This occurs at the be-
ginning of Part 1. Patients/caregivers are eval-uated for eligibility for Part 1, and informa-tion on medical history and medications areobtained.
(b) PST training assessment: At the PST trainingvisit (which occurs approximately one week afterscreening/baseline), patients/caregivers are as-sessed for their initial competency in performingPST.
(c) PST competency assessment(s): Two weeks fol-lowing PST training, the patient’s/caregiver’scompetence with the INR monitor is evaluated. Ifthe patient/caregiver is not competent after twoweeks but the site personnel feel they may bene-fit from additional testing, the patient/caregivermay perform PST for two more weeks (total offour weeks) and then return to clinic for anotherassessment.
(d) Part 2 baseline assessment: Patients that passPart 1 are eligible to participate in Part 2. Atthe Part 2 baseline visit, quality of life and ACsatisfaction assessments are performed, and pa-tients who meet Part 2 eligibility criteria are ran-domized to either HQACM or PST. Then, baselineclinical measures are obtained.
(e) Part 2 protocol follow-up visits and closeoutassessment: Follow-up visits for both HQACMand PST groups occur every 3 months afterrandomization. Patients who complete Part 2are followed for two to three years (8 to 12follow-up visits). The closeout visit will coin-cide with the follow-up visit that takes placein the last three months of the patient’s par-ticipation in Part 2. For a patient randomizedto receive PST, these visits include assessmentof the patient’s/caregiver’s performance and theperformance of their monitors relative to thelocal point-of-care monitor and the laboratorymonitor.
(f) Unscheduled Contacts: These include telephonecontacts and clinic visits during which the pa-tient usually reports adverse events, INR valuesoutside of the target range, or (for PST patients)problems with meter usage.
Design of PT-INR Self-Testing Study CSP #481 169
Statistics
Estimate of the effect of the interventionFor the primary objective, we want to test the nullhypothesis that the survival curves for the HQACMand PST groups are the same by comparing theirhazards, given a one year enrollment period and aminimum of two years of follow-up. For clarity, wewill express this comparison in terms of the hazardsthat result from annual event rates of pc (c for “con-trol”) for patients receiving HQACM care at 4-weektesting intervals and pi (i for “intervention”) for pa-tients performing PST at any testing interval; thatis, H0: pc = pi versus H1: pc �= pi.
To estimate the annual event rate (strokes, majorbleeds, or death) for the HQACM (control) group, welooked at those reported in the literature for trials oforal AC. We found there were two significant caveatsto this data:
(a) It is not always clear as to when fatal strokesand fatal bleeds are included in the death rates;therefore the potential for some degree of “doublecounting” for these events exists; and
(b) Not all studies reported “on treatment”/efficacydata, and in some cases it was unclear whichwas reported. Whenever possible, we extracted“on treatment” data as this is most applicable toTHINRS since we have no placebo therapy armand all patients are on drug.
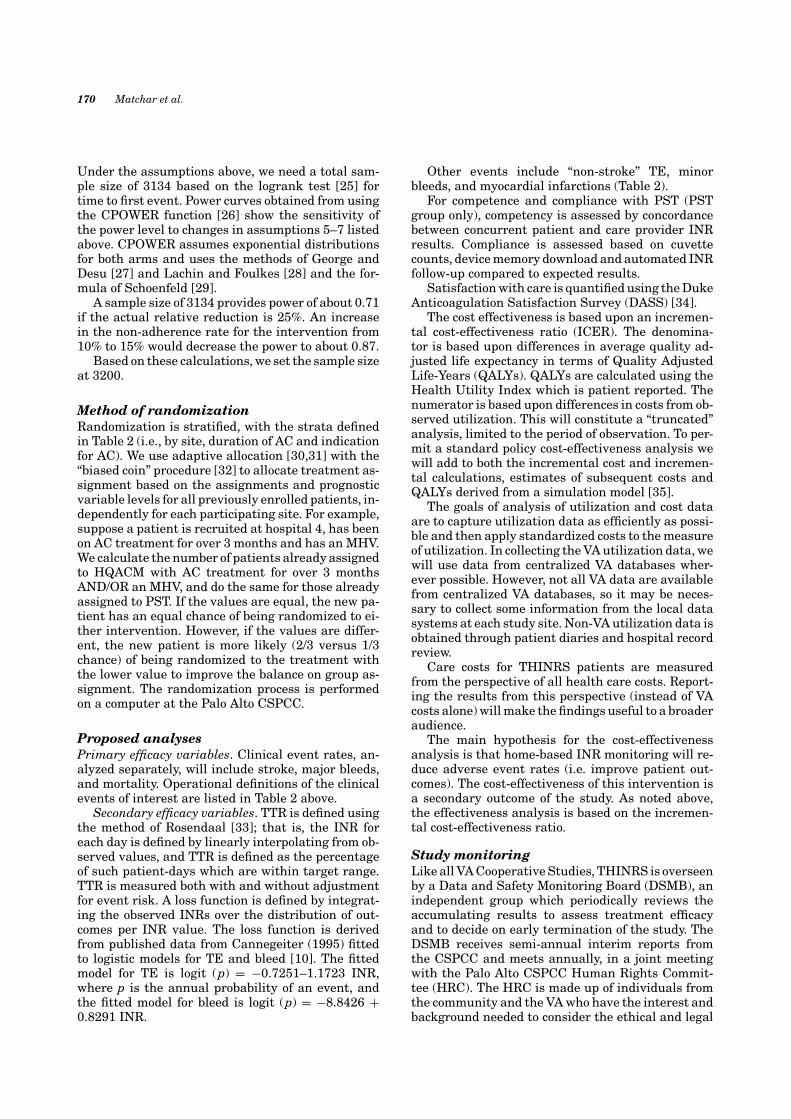
Table 3 summarizes these results, including thosefrom six studies of patients with AF, two of pa-tients with heart values, and two of patients withdeep venous thrombosis (DVT). The six studies of AFinclude CAFA (Canadian Atrial Fibrillation Trial)[15], SPINAF (VA Cooperative Study #308, Stroke
Table 3. Event Rates in Trials of Oral Anticoagulation
Event Rates (Percent) for -
Study Stroke Major bleed Death TOTAL
AF trials−CAFA 2.1 2.5 3.7 8.3−SPINAF 0.9 1.3 3.3 5.5−BAATAF 0.4 0.4 2.3 3.1−SPAF 1 2.3 1.5 2.2 6.0−AFI 1.4 1.3 3.6 6.3−EAFT 4.0 2.8 8.0 14.8
Heart value trials−Cannegeiter 0.7 2.7 2.9 7.3−ESCAT Only counts of events presented [20]
DVT trials DVT Major bleed Death TOTAL−Kearon 1.3 3.8 1.2 6.3−Schulman 0.7 2.4 2.4 5.5
AF is atrial fibrillation.DVT is deep venous thrombosis.
Prevention in Atrial Fibrillation) [16], BAATAF(Boston Area Anticoagulation Trial in Atrial Fib-rillation) [17], SPAF I (Stroke Prevention in AtrialFibrillation- NIH, SPAF Investigators) [18], AFI(Atrial Fibrillation Investigators who pooled datafrom 5 trials, including the four listed above as wellas AFASAK (Scandinavian) with a total of 1,889patient-years) [19], and EAFT (European Atrial Fib-rillation Trial of secondary prevention with 507 pa-tient years) [20].
The studies of heart valve patients include theDutch Registry [21] (6, 475 patient-years) and astudy [22] that is similar in intent to THINRS (over2,300 patient-years; routine AC management versusPST/patient self-management with target INR rangeof 2.5 to 4.5).
The two DVT studies are of interest in terms oftotal complication rate as well as beneficial effecton total mortality in excess of that explainable byrecognized hemorrhage or TE. These studies are byKearon [23] et al. 1999 (first episode of DVT) andSchulman [24] et al. 1997 (412 patient years, secondDVT).
We decided to be conservative and assume a 5.5%(=pc) annual event rate for the HQACM group.We also considered 1.75% to be the minimum clin-ically significant decrease in annual event rate (pi =3.75%) due to the PST intervention.
Results
Sample size and power calculationPower calculations were developed in detail for thepercent of patients that experience an event (TE, ma-jor bleed, or death by any cause). Although patientrandomization is stratified, the stratification was notreflected in the sample size calculations (but will beaccounted for in the analysis).
We used the following assumptions in the powercalculations:
1. Minimum length of follow-up: 2 years2. Length of patient accrual: 1 year3. Statistical power level: 0.904. Percent noncompliance in the control group (those
who “drop-in” to the intervention): 0 since theywill not have access to self-monitoring equipment.
5. Percent noncompliance in the intervention group(“non-adherers” whose actual treatment is essen-tially the control): 10%.
6. One-year percent of control patients that will havean event during the follow-up period: 5.5%.
7. Percent relative reduction in control rate due tothe intervention: 31.8%, or a drop from 5.5% in thecontrol group to 3.75% due to the intervention.
8. Two-sided significance test at .05.9. The data will be analyzed based on the intent to
treat principle whereby each patient is includedin the group to which he/she is randomized.
170 Matchar et al.
Under the assumptions above, we need a total sam-ple size of 3134 based on the logrank test [25] fortime to first event. Power curves obtained from usingthe CPOWER function [26] show the sensitivity ofthe power level to changes in assumptions 5–7 listedabove. CPOWER assumes exponential distributionsfor both arms and uses the methods of George andDesu [27] and Lachin and Foulkes [28] and the for-mula of Schoenfeld [29].
A sample size of 3134 provides power of about 0.71if the actual relative reduction is 25%. An increasein the non-adherence rate for the intervention from10% to 15% would decrease the power to about 0.87.
Based on these calculations, we set the sample sizeat 3200.
Method of randomizationRandomization is stratified, with the strata definedin Table 2 (i.e., by site, duration of AC and indicationfor AC). We use adaptive allocation [30,31] with the“biased coin” procedure [32] to allocate treatment as-signment based on the assignments and prognosticvariable levels for all previously enrolled patients, in-dependently for each participating site. For example,suppose a patient is recruited at hospital 4, has beenon AC treatment for over 3 months and has an MHV.We calculate the number of patients already assignedto HQACM with AC treatment for over 3 monthsAND/OR an MHV, and do the same for those alreadyassigned to PST. If the values are equal, the new pa-tient has an equal chance of being randomized to ei-ther intervention. However, if the values are differ-ent, the new patient is more likely (2/3 versus 1/3chance) of being randomized to the treatment withthe lower value to improve the balance on group as-signment. The randomization process is performedon a computer at the Palo Alto CSPCC.
Proposed analysesPrimary efficacy variables. Clinical event rates, an-alyzed separately, will include stroke, major bleeds,and mortality. Operational definitions of the clinicalevents of interest are listed in Table 2 above.
Secondary efficacy variables. TTR is defined usingthe method of Rosendaal [33]; that is, the INR foreach day is defined by linearly interpolating from ob-served values, and TTR is defined as the percentageof such patient-days which are within target range.TTR is measured both with and without adjustmentfor event risk. A loss function is defined by integrat-ing the observed INRs over the distribution of out-comes per INR value. The loss function is derivedfrom published data from Cannegeiter (1995) fittedto logistic models for TE and bleed [10]. The fittedmodel for TE is logit (p) = −0.7251–1.1723 INR,where p is the annual probability of an event, andthe fitted model for bleed is logit (p) = −8.8426 +0.8291 INR.
Other events include “non-stroke” TE, minorbleeds, and myocardial infarctions (Table 2).
For competence and compliance with PST (PSTgroup only), competency is assessed by concordancebetween concurrent patient and care provider INRresults. Compliance is assessed based on cuvettecounts, device memory download and automated INRfollow-up compared to expected results.
Satisfaction with care is quantified using the DukeAnticoagulation Satisfaction Survey (DASS) [34].
The cost effectiveness is based upon an incremen-tal cost-effectiveness ratio (ICER). The denomina-tor is based upon differences in average quality ad-justed life expectancy in terms of Quality AdjustedLife-Years (QALYs). QALYs are calculated using theHealth Utility Index which is patient reported. Thenumerator is based upon differences in costs from ob-served utilization. This will constitute a “truncated”analysis, limited to the period of observation. To per-mit a standard policy cost-effectiveness analysis wewill add to both the incremental cost and incremen-tal calculations, estimates of subsequent costs andQALYs derived from a simulation model [35].
The goals of analysis of utilization and cost dataare to capture utilization data as efficiently as possi-ble and then apply standardized costs to the measureof utilization. In collecting the VA utilization data, wewill use data from centralized VA databases wher-ever possible. However, not all VA data are availablefrom centralized VA databases, so it may be neces-sary to collect some information from the local datasystems at each study site. Non-VA utilization data isobtained through patient diaries and hospital recordreview.
Care costs for THINRS patients are measuredfrom the perspective of all health care costs. Report-ing the results from this perspective (instead of VAcosts alone) will make the findings useful to a broaderaudience.
The main hypothesis for the cost-effectivenessanalysis is that home-based INR monitoring will re-duce adverse event rates (i.e. improve patient out-comes). The cost-effectiveness of this intervention isa secondary outcome of the study. As noted above,the effectiveness analysis is based on the incremen-tal cost-effectiveness ratio.
Study monitoringLike all VA Cooperative Studies, THINRS is overseenby a Data and Safety Monitoring Board (DSMB), anindependent group which periodically reviews theaccumulating results to assess treatment efficacyand to decide on early termination of the study. TheDSMB receives semi-annual interim reports fromthe CSPCC and meets annually, in a joint meetingwith the Palo Alto CSPCC Human Rights Commit-tee (HRC). The HRC is made up of individuals fromthe community and the VA who have the interest andbackground needed to consider the ethical and legal
Design of PT-INR Self-Testing Study CSP #481 171
issues related to the participation of human patientsin research. The HRC is responsible for reviewing theprotocol for human rights issues and ensuring thatthe patients’ rights and welfare are protected duringthe study.
Discussion
AC is a highly effective therapy for TE prevention ifprovided appropriately and well. PST for INR repre-sents an expanding resource for engaging patientswith chronic disease in their own care. Availableevidence for home INR monitoring is promising; how-ever, because of relatively small samples, focus pri-marily on the intermediate outcome of time in tar-get range, and the highly selected nature of mostpatients studied, the likely value of PST is not en-tirely clear. Reimbursement by third parties is notconsistent; the most recent coverage decision by theCenters for Medicare and Medicaid Services (CMS)has limited reimbursement to individuals with me-chanical heart valves [11]. As a consequence, PST de-vices have not gained wide acceptance in the UnitedStates.
THINRS is designed to address the informationneeds of clinical and policy decision makers. It is ofsufficient size to examine the clinical outcomes of in-terest. Inclusion criteria are broad and thus the re-sults promise to be generalizable. Crucial practicalissues are incorporated into the study designed, in-cluding the impact of patient characteristics on abil-ity to effectively engage in PST (Phase 1), the effec-tiveness of various testing frequencies, and the costimplications. As indicated by the background CMSreport, studies such as THINRS will provide the dataessential to the development of an informed coveragedecision.
THINRS is developed in recognition of the factthat AC is an evolving story. PST is but one potentialinstrument in the toolbox for improving the appropri-ateness and quality of AC. Other approaches includepatient self-management, in which patients control(within limits) dose adjustments, and new oral an-ticoagulants, such as direct thrombin inhibitors. Asthis story unfolds, the distinct advantages and disad-vantages of each approach is clearer and it is possiblethat various ways of providing AC will serve as com-plements. THINRS will directly inform patients andclinicians as they chose among available options, andpolicy makers as they consider the optimal mix of ACstrategies.
Acknowledgment
The VA Cooperative Studies Program provided support for thisresearch.
References
1. Hirsh J, Dalen JE, Anderson D, et al. Oral antico-agulants: mechanism of action, clinical effectiveness,and optimal therapeutic range. Chest 1998;114:445S–469S.
2. Matchar DB, Samsa GP, Cohen SJ, Oddone EZ, JurgelskiAE. Improving the quality of anticoagulation of patientswith atrial fibrillation in managed care organizations: Re-sults of managing anticoagulation services trial. Am J Med2002;113:42–51.
3. White RH, MuCurdy SA, von Marensdorff H, Woodruff DE,Leftfoff L. Home prothrombin time monitoring after theinitiation of warfarin therapy: A randomized, prospectivestudy. Ann Intern Med 1989;111: 730–737.
4. Ansell JE, Patel N, Ostrovsky D, Nozzolillo E, Peterson M,Fish L. Long-term patient self-management of oral antico-agulation. Arch Intern Med 1995;155:2185–2189.
5. Koertke H, Minami K, Bairaktaris A, Wagner O, Koer-fer R. INR self-management following mechanical heartvalve replacement. J Throm THrombolysis 2000;9:S31–S45.
6. Beyth RJ, Landefeld CS. Prevention of major bleeding inolder patients treated with warfarin: results of a random-ized trial. (abstract) J Gen Intern Med 1997;12 (Suppl 1):66.
7. Hasenkam JM, Kimose HH, Knudsen L, et al. Selfmanagement of oral anticoagulant therapy after heartvalve replacement. Eur J Cardiothorac Surg 1997;11:935–942.
8. Horstkotte D, Piper C, Wiemer M. Optimal frequency ofpatient monitoring and intensity of oral anticoagulationtherapy in valvular heart disease. J Thromb Thrombolysis1998;5:S19–S24.
9. Sawicki PT. A structured teaching and self-managementprogram for patients receiving oral anticoagulation: A ran-domized controlled trial. JAMA 1999;281:145–150.
10. Samsa, GP, Matchar DB. Relationship between test fre-quency and outcomes of anticoagulation: A literature re-view and commentary with implications for the design ofrandomized trials of patient self-management. J ThrombThrombolysis 2000;9:283–292.
11. Centers for Medicare & Medicaid Services (CMS). Cover-age and Billing for Home Prothrombin Time InternationalNormalized Ratio (INR) Monitoring for AnticoagulationManagement. Program Memorandum: CMS-Pub. 60AB;Transmittal AB-03-089. June 20, 2003.
12. ITC. Available at: http://www.itcmed.com. (accessed De-cember 3, 2004).
13. Connolly SJ, Laupacis A, Gent M, et al. for the CAFA StudyCoinvestigators. Canadian Atrial Fibrillation Anticoagula-tion (CAFA) study. J Am Coll Cardiol 1991;18:349–355.
14. Ezekowitz MD, Bridgers SL, James KE, et al. for the Veter-ans affairs stroke prevention in nonrheumatic atrial fibril-lation investigators. Warfarin in the prevention of strokeassociated with nonrheumatic atrial fibrillation. N Engl JMed 1992;327:1406–1412. Erratum in: N Engl J Med 1993Jan 14;328:148.
15. Boston area anticoagulation trial for atrial fibrillation in-vestigators. The effect of low-dose warfarin on the risk ofstroke in patients with nonrheumatic atrial fibrillation. NEngl J Med 1990;323:1505–1511.
16. Stroke prevention in atrial fibrillation investigators.stroke prevention in atrial fibrillation study: Final results.Circulation 1991;84:527–539.
172 Matchar et al.
17. Atrial Fibrillation Investigators. Risk factors for strokeand efficacy of antithrombotic therapy in atrial fibrillation:Analysis of pooled data from five randomized controlledtrials. Arch Intern Med 1994;154:1449–1457. Erratum in:Arch Intern Med 1994 Oct 10;154(19):2254.
18. European Atrial Fibrillation Trial Study Group. Sec-ondary prevention in non-rheumatic atrial fibrillation af-ter transient ischemic attack or minor stroke. Lancet1993;342:1255–1262
19. Cannegieter SC, Rosendaal FR, Wintzen AR, van der MeerFJ, Vandenbroucke JP, Briet E. Optimal oral anticoagulanttherapy in patients with mechanical heart valves. N EnglJ Med 1995;333:11–17.
20. Kortke H, Korfer R. International normalized ratioself-management after mechanical heart valve replace-ment: Is an early start advantageous? Ann Thorac Surg2001;72:44–48.
21. Kearon C, Gent M, Hirsh J, et al. A comparison of threemonths of anticoagulation with extended anticoagulationfor a first episode of idiopathic venous thromboembolism.N Engl J Med 1999;340:901–907
22. Schulman S, Granqvist S, Holmstrom M, et al., and TheDuration of Anticoagulation Study Group. The Duration oforal anticoagulant therapy after a second episode of venousthromboembolism. N Engl J Med 1997;336:393–398.
23. Freedman LS. Tables of the number of patients re-quired in clinical trials using the logrank test. Stat Med1982;1:121–129. Erratum in Control Clin Trials 1994;15:326.
24. Harrell FE. Jr. CPOWER, Hmisc library, Splus 2000,Mathsoft, June, 1999.
25. Peterson B, George SL. Sample size requirements andlength of study for testing interaction in a 2 × k factorialdesign when time-to-failure is the outcome. Control ClinTrials 1993;14:511–522.
26. Lachin JM, Foulkes MA. Evaluation of sample size andpower for analyses of survival with allowance for nonuni-form patient entry, losses to follow-up, noncompliance, andstratification. Biometrics 1986;42:507–519.
27. Schoenfeld DA. Sample-size formula for the proportional-hazards regression model. Biometrics 1983;39:499–503.
28. Pocock SJ, Simon R. Sequential treatment assignmentwith balancing for prognostic factors in the controlled clin-ical trial. Biometrics 1975;31:103–115.
29. Birkett N. Adaptive allocation in randomized controlledtrials. Control Clin Trials 1985;6:146–155.
30. Efron B. Forcing a sequential experiment to be balanced.Biometrika 1971;58:403–417.
31. Rosendaal FR, Cannegieter SC, van der Meer FJM, BrietE. A method to determine the optimal intensity of oralanticoagulant therapy. Thromb Haemost 1993;69:236–239.
32. Samsa GP, Matchar DB, Dolor RJ, et al. A new instru-ment for measuring anticoagulation-related quality of life:Development and preliminary validation.Health Qual LifeOutcomes 2004;2:22.
33. Matchar DB, Samsa GP, Matthews JR, et al. The strokeprevention policy model (SPPM): Linking evidence andclinical decisions. Ann Intern Med 1997;127:704–711.
34. Stein PD, Hull RD, Pineo G. Strategy that includes se-rial noninvasive leg tests for diagnosis of thromboembolicdisease in patients with suspected acute pulmonary em-bolism based on data from PIOPED. Prospective investi-gation of pulmonary embolism diagnosis. Arch Intern Med1995;155(19):2101–2104.
35. Gray HW, Bessent RG. Pulmonary embolism exclusion: Apractical approach to low probability using the PIOPEDdata. Prospective investigation of pulmonary embolism di-agnosis. Eur J Nucl Med 1998;25(3):271–276.