The Impact of Dividend Policy on the Volatility of Share Price ...
13
International Journal of Recent Technology and Engineering (IJRTE) ISSN: 2277-3878, Volume-7 Issue-5S, January 2019 212 Published By: Blue Eyes Intelligence Engineering & Sciences Publication Retrieval Number: ES2148017519/19©BEIESP The Impact of Dividend Policy on the Volatility of Share Price of Manufacturing Companies in Malaysia Bhagmal Harsha Neelanjana, Hafinaz Hasniyanti Hassan Abstract: The objective of this research is to investigate the relationship between dividend policy and share price volatility of manufacturing companies in Malaysia. For this purpose, A sample of 35 dividend and non-dividend paying listed companies in the Malaysian Stock Exchange is taken from the food, beverages, chemical, home product and consumer product manufacturing sector for the time period starting 2008 to 2017. Dividend payout, dividend yield are the main independent variables while firm size and earnings volatility are the control variables that are tested against the volatility of share price in this study. The Pearson Correlation Analysis and Multiple Linear Regression are used for analysis to examine the relationship between the independent variables and share price volatility. Financial data was collected from annual reports of the companies listed in Bursa Malaysia. Results showed that dividend payout, firm size and earning volatility had a significant negative relationship with share price volatility while dividend was found to be insignificant to share price volatility. Keywords: Dividend policy, share price, volatility, manufacturing company I. INTRODUCTION Dividend policy is one among the major financing components to decide the return to shareholders for their investments in a company (Zakaria et al., 2012). Every company adheres to some sort of dividend pattern. Upon a company’s profitability, the management can either retain it for reinvestment purposes or distribute it in the form of cash dividends (Hashemijoo et al., 2012; Ullah et al., 2015). A permanent dividend policy should be established if a company decides to make dividend payment to its investors. The payment of dividends could indicate to investors that the company is conforming to good practices of corporate governance which are valued by a company since it implies that the business has the capacity to raise funds from the capital market on attractive base (Jo and Pan, 2009). It is believed that in the form of dividend distribution, the business can attract investors and further raise the share price of the company indirectly. This type of business may raise funds in an easy way through a new issue of shares for the expansion of the company, and this would further increase profits and the price of shares as well (Zakaria et al., 2012). Revised Manuscript Received on January 19, 2019. Bhagmal Harsha Neelanjana, Asia Pacific University of Technology and Innovation, School of Accounting, Finance and Quantitative Studies, Faculty of Business Management, Technology Park Malaysia, Bukit Jalil, 57000 Kuala Lumpur, Malaysia Hafinaz Hasniyanti Hassan, Asia Pacific University of Technology and Innovation, School of Accounting, Finance and Quantitative Studies, Faculty of Business Management, Technology Park Malaysia, Bukit Jalil, 57000 Kuala Lumpur, Malaysia. Many researchers have argued about the dividend policy relevance concerning the volatility of share prices. That argument has generated many controversies amongst financial theories from the studies of researchers such as Black, Scholes, Modigliani and Miller, Baskin, Gordon and others. This has led to two distinctive groups namely the relevance of dividend and irrelevance of dividend. This topic is still open for investigation since there are a lot of contradictions concerning the relationship between dividends and share price volatility. The discussion was firstly made by Modigliani and Miller (1961). As said in their previous research, the firm value is independent and not relevant to dividend policy. On the other hand, another school of thought states that a company which pays no dividend will be more attractive to investors that a company which gives dividend payment (Black, 1976). Share price volatility refers to the rate of change in the price of a share during a given time period. As a consequence, the higher the volatility, the higher will be the risk of substantial loss or gain. The volatility of stock is said to be a yardstick for risk to be determined (Ullah et al., 2015). When a stock is considered as volatile, the difficulty to predict what the future share price of the firm will be is higher. Similarly, a lot of investors prefer investing in stocks which sustain more predictable earnings (Profilet and Bacon, 2013). The stocks are likely carry less risk, which is a better option than an investment with a high risk. Since dividend yield and dividend payout ratio are the main factors that investors would look at before making an investment decision, close attention is paid to dividend policy due to the fact that the firm’s share evaluation may be affected by the riskiness of investments in the long run (Baskin, 1989; Hashemijoo et al., 2012; Zakaria et al., 2012; Hussainey, 2010; Allen and Rachim, 1996; Hussainey et al., 2011; Mgbame and Chijoke-Mgbame, 2011). Dividend policy still remains a basis of controversy in spite of many years of theoretical and empirical research. The stock market as well plays a vital role in the economy. Normally, the decision in regards dividend policy usually has a direct effect on the capital structure of a firm. This is so because dividend payment decreases the amount of funds that are available for new investments that are required for the growth of firms are likely to be reduced by dividend payment. The purpose of this study is to define and understand the relationship between dividend policy and share price volatility on manufacturing companies listed under Bursa Malaysia in Malaysia with the hope to help companies’ management and any interested user.
-
Upload
khangminh22 -
Category
Documents
-
view
1 -
download
0
Transcript of The Impact of Dividend Policy on the Volatility of Share Price ...
International Journal of Recent Technology and Engineering (IJRTE)
ISSN: 2277-3878, Volume-7 Issue-5S, January 2019
212 Published By:
Blue Eyes Intelligence Engineering
& Sciences Publication Retrieval Number: ES2148017519/19©BEIESP
The Impact of Dividend Policy on the Volatility of
Share Price of Manufacturing Companies in Malaysia
Bhagmal Harsha Neelanjana, Hafinaz Hasniyanti Hassan
Abstract: The objective of this research is to investigate the
relationship between dividend policy and share price volatility of
manufacturing companies in Malaysia. For this purpose, A
sample of 35 dividend and non-dividend paying listed companies
in the Malaysian Stock Exchange is taken from the food,
beverages, chemical, home product and consumer product
manufacturing sector for the time period starting 2008 to 2017.
Dividend payout, dividend yield are the main independent
variables while firm size and earnings volatility are the control
variables that are tested against the volatility of share price in
this study. The Pearson Correlation Analysis and Multiple
Linear Regression are used for analysis to examine the
relationship between the independent variables and share price
volatility. Financial data was collected from annual reports of the
companies listed in Bursa Malaysia. Results showed that
dividend payout, firm size and earning volatility had a significant
negative relationship with share price volatility while dividend
was found to be insignificant to share price volatility.
Keywords: Dividend policy, share price, volatility,
manufacturing company
I. INTRODUCTION
Dividend policy is one among the major financing
components to decide the return to shareholders for their
investments in a company (Zakaria et al., 2012). Every
company adheres to some sort of dividend pattern. Upon a
company’s profitability, the management can either retain it
for reinvestment purposes or distribute it in the form of cash
dividends (Hashemijoo et al., 2012; Ullah et al., 2015). A
permanent dividend policy should be established if a
company decides to make dividend payment to its investors.
The payment of dividends could indicate to investors that
the company is conforming to good practices of corporate
governance which are valued by a company since it implies
that the business has the capacity to raise funds from the
capital market on attractive base (Jo and Pan, 2009). It is
believed that in the form of dividend distribution, the
business can attract investors and further raise the share
price of the company indirectly. This type of business may
raise funds in an easy way through a new issue of shares for
the expansion of the company, and this would further
increase profits and the price of shares as well (Zakaria et
al., 2012).
Revised Manuscript Received on January 19, 2019.
Bhagmal Harsha Neelanjana, Asia Pacific University of Technology and Innovation, School of Accounting, Finance and
Quantitative Studies, Faculty of Business Management, Technology Park
Malaysia, Bukit Jalil, 57000 Kuala Lumpur, Malaysia Hafinaz Hasniyanti Hassan, Asia Pacific University of Technology
and Innovation, School of Accounting, Finance and Quantitative Studies,
Faculty of Business Management, Technology Park Malaysia, Bukit Jalil, 57000 Kuala Lumpur, Malaysia.
Many researchers have argued about the dividend policy
relevance concerning the volatility of share prices. That
argument has generated many controversies amongst
financial theories from the studies of researchers such as
Black, Scholes, Modigliani and Miller, Baskin, Gordon and
others. This has led to two distinctive groups namely the
relevance of dividend and irrelevance of dividend. This
topic is still open for investigation since there are a lot of
contradictions concerning the relationship between
dividends and share price volatility. The discussion was
firstly made by Modigliani and Miller (1961). As said in
their previous research, the firm value is independent and
not relevant to dividend policy. On the other hand, another
school of thought states that a company which pays no
dividend will be more attractive to investors that a company
which gives dividend payment (Black, 1976).
Share price volatility refers to the rate of change in the
price of a share during a given time period. As a
consequence, the higher the volatility, the higher will be the
risk of substantial loss or gain. The volatility of stock is said
to be a yardstick for risk to be determined (Ullah et al.,
2015). When a stock is considered as volatile, the difficulty
to predict what the future share price of the firm will be is
higher. Similarly, a lot of investors prefer investing in stocks
which sustain more predictable earnings (Profilet and
Bacon, 2013). The stocks are likely carry less risk, which is
a better option than an investment with a high risk. Since
dividend yield and dividend payout ratio are the main
factors that investors would look at before making an
investment decision, close attention is paid to dividend
policy due to the fact that the firm’s share evaluation may be
affected by the riskiness of investments in the long run
(Baskin, 1989; Hashemijoo et al., 2012; Zakaria et al., 2012;
Hussainey, 2010; Allen and Rachim, 1996; Hussainey et al.,
2011; Mgbame and Chijoke-Mgbame, 2011).
Dividend policy still remains a basis of controversy in
spite of many years of theoretical and empirical research.
The stock market as well plays a vital role in the economy.
Normally, the decision in regards dividend policy usually
has a direct effect on the capital structure of a firm. This is
so because dividend payment decreases the amount of funds
that are available for new investments that are required for
the growth of firms are likely to be reduced by dividend
payment.
The purpose of this study is to define and understand the
relationship between dividend policy and share price
volatility on manufacturing companies listed under Bursa
Malaysia in Malaysia with the hope to help companies’
management and any
interested user.

213
Published By:
Blue Eyes Intelligence Engineering & Sciences Publication Retrieval Number: ES2148017519/19©BEIESP
This research is going to put emphasis on manufacturing
firms, the reason being various types of industries are
included in the manufacturing sector, meaning that the
scope of the study is quite big. In addition to this, the
production sector is the highest sub-sector which contributes
a very considerable proportion to the GDP of Malaysia. As
well, financial data is easily available for listed companies
in Malaysia, which facilitates this study to be undertaken.
Since most previous studies on the impact of dividend
policy on share price volatility have been done in developed
stock markets, the Malaysia stock market is selected as an
emerging market.
There have been several researches conducted in order to
identify the impact of dividend policy on share price
volatility in Malaysia. Dividend policy’s effect on share
volatility has become so popular among academics. There
are many studies undertaken on this topic all around the
world. Different researchers use different approaches and
methods which lead to inconsistent results. Some studies
show that dividend policy and share price volatility have a
positive relationship, while other results show that they are
negatively correlated.
For instance, according to Mohammad Hashemijoo
(2012), it was found that the volatility of stock and dividend
yield is negatively correlated. This value of this correlation
coefficient between price volatility and dividend yield is in
line with Baskin (1989)’s results whereas it is opposing to
that Ullah et al. (2015) and Khan (2012) among other
researchers. Dividend payout and other control variables
have encountered the same problem.
Since there are so many inconsistent and opposite results
from the various sources, how dividend policy affects share
price volatility is difficult to obtain and this causes a lot of
biasness. Besides, the Malaysian stock market is indeed
volatile and share prices change frequently in the markets on
a daily basis. Concerning share prices, the movement of
share prices has no benchmark. Therefore, it is essential to
find as much information as possible about dividend and
share prices as these are one of the hottest topics in the
finance industry.
In addition, investors will be more likely to invest in
companies where they see the opportunity to reap the
maximum profit in terms of dividends. Investment increases
and stock prices have the tendency to go up. However, a
high dividend yield may also be the consequence of a weak
share price. Again, this generates an inconsistent result.
Besides, a falling share price has the tendency of leading to
corporate bankruptcy and this may have an adverse effect on
the manufacturing firms in Malaysia (Boyte-White, 2018).
Therefore, this study needs to be conducted in order to have
a broader and clearer insight on how dividend policy might
influence the movement of share prices.
It has however remained a puzzle whether a company’s
dividend policy really affect the firm’s share market prices.
Some scholars argue that dividend policy is irrelevant
(Miller and Modigliani, 1958) whereas others view it
otherwise. Hence the study was set to determine whether
there existed a causal relationship between dividend policy
and the share prices of a firm (Onchiri, 2013).
II. LITERATURE REVIEW
A. Share Price Volatility
The volatility of share price here is used as the dependent
variable. It refers to the systemic risk that investors who
own ordinary share investment face (Profilet and Bacon,
2013). When we say that the risk of common stock is
determined, it implies that the higher volatility of share
prices, the greater will be its risk. Volatility can also be
defined as the deviation or a variation in the returns of assets
from their mean. The understanding of fluctuations in share
prices are essential from the point of view of an investor. It
is believed that even though stock which fluctuate by higher
margins tend to have a higher profitability, the risk of loss is
greater as well.According to the modern portfolio theory
investors are likely to be risk- averse, which means that they
will prefer avoiding risk unless they receive a compensation
for such investment. They have the tendency to invest where
they are offered more certainty (Zainudin et al, 2016)
B. Dividend Yield
Dividend yield shows how much a company pays out in
dividend each year relative to its share price
(economictimes.indiatimes.com, 2017). It is usually
expected that when dividend yield is high, share price
volatility is lower (Profilet and Bacon, 2013).
The Relationship between Dividend Yield and Share
Price Volatility
A research conducted by Hussainey et al. (2010) in order
to identify the effect of dividend policy on share price
volatility, using a sample of companies listed in the UK
Stock Exchange, using multiple regression analysis
indicated that there is a positive significant relationship
between dividend yield and share prices. In this study,
dividend yield has been calculated based on current market
prices (Harshapriya, 2015). It is believed that a company
with a higher dividend yield or payout ratio has the
tendency to result in a low volatile share price. Rashid and
Rahman (2008) undertook a research using 104 non-
financial firms in the Dhaka Stock Exchange in Bangladesh
within the time frame of 1996 to 2006, using dividend yield,
payout ratio as independent variable and debt, growth and
size as control variables. Applying the cross-sectional
regression analysis, the results showed an insignificant
positive result between stock price volatility and dividend
yield, the reason being Bangladesh having inefficient capital
market, thus the influence of dividends over share prices are
still unclear (Zakaria et al., 2012). Khan (2012) analysed the
impact of dividend policy on share price using a sample of
55 firms which are listed in Karachi Stock Exchange (KSE),
using the random effect model and data for the period of
2001 to 2010, and found that there is positive relationship
between dividend yield and with the share price movements
(Ullah et al., 2015). Similarly, another study conducted by
Asghar et al. (2011) found in their study that there was
relationship to be positive and significant in KSE in
Pakistan. In addition to the above, a research conducted by
Nkobe et al. (2011)
International Journal of Recent Technology and Engineering (IJRTE)
ISSN: 2277-3878, Volume-7 Issue-5S, January 2019
214 Published By:
Blue Eyes Intelligence Engineering
& Sciences Publication Retrieval Number: ES2148017519/19©BEIESP
analysing dividend policy and volatility of stock in Kenya
using data from trading companies listed in the Nairobi
Stock Exchange within the time frame of 1999 and 2008
and using the multiple regression analysis showed results
that volatility of share prices are insignificantly and
positively affected by dividend yield.
However, in a study by Mohammad Hashemijoo (2012),
using a sample of 84 out of 142 product companies listed
under Bursa Malaysia, the relationship between dividend
policy and share price volatility was examined for a period
of six years from 2005 to 2010 using multiple regression.
Share price volatility being the dependent variable and two
main measurements namely dividend yield and dividend
payout ratio as being the independent variables. Other added
control variables such as size of firms, earning volatility,
leverage, debt and growth were used as independent
variables.
In the end results showed that dividend policy had a
negative relationship with share price volatility. Supporting
the above, a research conducted in China by Xu et al. (2016)
using a sample of 603 non- financial firms listed on the
China Stock Market for a time period from 16 years as from
2000 to 2015 and using the fixed effect model estimation
and the Breusch-Pagan test, the empirical findings showed
that dividend yield and stock prices were inversely related
but dividend yield was more correlated with share prices
than the payout ratio.
Last but not the least, a significant negative relationship
between dividend yield and volatility of share was found in
a research undertaken by Shah and Noreen (2016) which
consisted of the investigation of the role of dividend and
stock price volatility by utilising data from a sample of 50
companies in the non-financial sectors listed on the Karachi
Stock Exchange in Pakistan and using data for the period
2005 to 2012. The multi regression analysis was made by
adopting the random effect model on panel data.
These results give rise to the hypothesis that:
: There is no relationship between dividend yield and the
volatility of share price.
: There is a relationship between dividend yield and the
volatility of share price.
C. Dividend Payout
Dividend Payout refers to the proportion of earnings or
net income which is paid out as dividends to common
shareholders, typically expressed in the form of a
percentage. The payout ratio can be used to measure the
degree of sustainability of a firm's stream of dividend
payment. A low payout ratio shows that a firm is holding
more of its earnings to increase its company growth. On the
other hand, a greater payout ratio shows that a company is
distributing more of company earnings with its
shareholders.
Relationship between Dividend Payout Ratio and Share
Price Volatility
Ullah et al. (2015) investigated the impact of dividend
policy on share price in the Karachi Stock Exchange in
Pakistan. The latter took a sample of five firms from the
textile industry from 2003 to 2008 and the multi regression
model has been used to conduct the study. Using dividend
payout ratio as independent variable and earning volatility,
size of firms and growth as controlled variable, results
found stated that there was a positive relationship between
dividend payout and share price volatility.
Similarly, during a research conducted by Zakaria (2012)
on determining whether dividend policy affected share price
volatility of construction and material companies in
Malaysia from 2005 to 2010, using dividend payout as
independent variable and growth, size of firms and earnings
as control variables and using a least square regression
model, we could see that dividend payout significantly
influenced the changes in share price.The role of dividend
payout on share prices has been analysed by Huang et al.
(2009). Results showed that the relationship between both
was positive and significant, together with earnings growth.
The analysis made stated that in case dividend price ratio is
divided into the components of earning price ratio and
payout ratio, the ability for estimation of future returns is
higher, which defines the relationship between the
dependent and independent variable.
Another study supporting the significance of dividend
payout and fluctuation of stock price has been conducted by
Masum (2014). The latter analysed the effects of dividend
policy and how share prices are affected in Bangladesh by
estimating market returns of stock in excess out a sample to
30 banks listed on the Dhaka Stock Exchange for the time
frame of 5 years as from 2007 to 2011. Using a panel data
approach for the testing, it was revealed that stock prices
were significantly positively affected by dividend (Ullah et
al. 2015).
On the other hand, Lashgari and Ahmadi (2014) carried
out a study to examine the impact of dividend policy on
price volatility in the Tehran Stock Exchange. The sample
consisted of 51 companies chosen out of 470 listed
companies from 2007 to 2012. The Parskinson’s stock price
volatility was used to evaluate the changes in stock. A
multivariable regression model was used and for testing and
also compound data was used. Prior to data analysis, various
statistical such as Chaw test, Unit root test and Hausman test
were carried out, out of which pooled and fixed effect
models were chosen to do the research. Findings showed
that a negative relationship existed between dividend payout
ratio and price volatility.
In a research by Nazir et al. (2010) who used the financial
data of 73 non-financial companies in the capital market of
Pakistan for the time period of six years from 2003 to 2008
and using panel data together with doing a fixed effect
regression analysis, it was found that a negative relationship
exists between dividend payout and fluctuation in share
prices. Supporting the above findings, the research made by
Hussainey et al. (2011) which has already been discussed
above brought forward a negative relationship between
share price and dividend payout ratio. Baskin (1989), on the
contrary, found that payout has no relation with stock price
volatility.
These results give rise to the hypothesis that:
: There is no relationship between dividend payout and
the volatility of share.
: There is a relationship
between dividend payout and
the volatility of share.
215
Published By:
Blue Eyes Intelligence Engineering & Sciences Publication Retrieval Number: ES2148017519/19©BEIESP
Firm Size
Firm size is considered to be one of the most influential
factors when determining dividend policy. Size of the firms
can also be associated to price fluctuations because the
larger organizations are, they are considered to be
diversified in their risk while small ones are less known in
the market and their stocks are less liquid in nature and thus
more volatile.
Relationship between Firm Size and Share Price
Volatility
Sadiq et al. (2013) investigated the stock price volatility
in regards to Karachi Stock Market’s dividend policy. The
researcher used a sample of 35 firms which are listed on the
Karachi Stock Exchange in Pakistan and applied the panel
data approach and regression model. The regression model
results showed that there is a positive relationship between
firm size and stock price fluctuation. In addition, the
research made by Rashid and Rahman (2008), already
explained above supports the above finding.
The results of the research conducted by Naveed (2013)
who used a sample of 15 banks from the Karachi Stock
Exchange within the time frame of 2008 to 2011 in order to
identify the determinants of fluctuations in share prices
using the fixed effect regression model and using firm size
as control variable showed that there was a positive
significant between the mentioned variable and share price.
On the other hand, in the study of Hashemijoo et al.
(2012) discussed above, a significant negative relationship
was identified between firm size and share price volalitity
while applying the cross-sectional regression analysis. This
result is supported by that of Lashgari and Ahmadi (2014)
and Nazir et al. (2010).
Another research supporting the above result has been
conducted by Ramadan (2013) who tried to analyse how
dividend influence fluctuations in share prices. The latter
selected a sample of 77 industrial firms that are listed on the
Amman Stock Exchange in Jordan for a time period of
twelve years starting 2000 to 2011. The researcher made use
of the correlation analysis and multiple least square
regression. Size was used as a control variable and it was
found to have an insignificant relationship with share price
volatility.
These results give rise to the hypothesis that:
: There is no relationship between firm size and the
volatility of share.
: There is a relationship between firm size and the
volatility of share price.
Earning Volatility
Dividends paid by firms are generated from the firms’
profit and is one of the ways that firms distribute earnings
back to the shareholders. Therefore, earnings of firms are
expected to be one of the significant factors that will
influence dividend policy decisions.
Relationship between Earning Volatility and Share Price
Volatility
According to the research by Hooi et al. (2015) who used
a sample of 319 firms from Bursa Malaysia for the period
starting 2003 to 2013 identified a positive significant
association between earning volatility and price volatility.
This result is seconded by Hashemijoo et al. (2012), and
Rashid and Rahman (2008) who investigated the connection
between dividend policy and share price volatility with the
cross-sectional regression analysis being used and after
controlling for earning volatility, its relationship with share
price had an insignificant positive result.
Another research conducted by Zainudin et al. (2016)
investigating 166 industrial public listed firm in Malaysia
from 2003 to 2012 suggested that earning volatility
significantly explained SPV of industrial product firms
during the crisis period. This is seconded by Shah and
Noreen (2016).
Hussainey et al. (2011) explained above, it was found that
share price volatility is insignificant to earnings volatility
thereby having no relationship. Similarly, the same result
was found during the research conducted by Zakaria et al.
(2012) and Sadiq et al. (2013) as explained earlier.
This therefore leads to the hypothesis that:
: There is no relationship between earnings volatility and
the volatility of share price.
: There is a relationship between firm size and the
volatility of share price.
III. METHOD & MATERIALS
For this purpose, only secondary data will be used.
Secondary data refers to data which has already been
collected by other people and which is already published
and available. This will provide a basic understanding of the
issues discussed. Annual reports of a sample of 35
manufacturing companies out of 908 listed firms in Bursa
Malaysia from subsectors like food sector, beverages sector,
chemical sector, construction and material sector, consumer
product manufacturing sector, will be used for the analysis
of this research. In the annual reports, the researcher will be
extracting data from the financial statements such as the
Statement of Comprehensive income, Statement of
Financial Position, Statement of Changes in equity in
relation with dividend per share, earnings per share, total
assets, earnings before interest and taxes of respective
companies for the period of 2008 to 2017.
Other than information from the financial statements, the
director’s report from annual reports of the companies might
be taken into consideration for data collection, such as
dividend policy decisions. In addition, sources such as
books, articles and journals concerning the share prices and
dividend policies and other available resources relating to
the topic will also be used. In case, necessary information is
not available online, the researcher might visit Bank Negara
for further information and DataStream will also be used to
extract any additional information needed.
This study will be conducted on a sample of 35
manufacturing companies out of 908 total companies listed
under Bursa Malaysia. The analysis would be done based on
these companies only. The research timeline will be 10
years, from the period starting 2008 to 2017. As mentioned
earlier, the reason for choosing manufacturing companies is
because the scope of study is
large since the manufacturing
sector includes different types
of industries.

International Journal of Recent Technology and Engineering (IJRTE)
ISSN: 2277-3878, Volume-7 Issue-5S, January 2019
216 Published By:
Blue Eyes Intelligence Engineering
& Sciences Publication Retrieval Number: ES2148017519/19©BEIESP
In addition, the manufacturing companies will be selected
based on certain properties.The companies should be listed
in the Kuala Lumpur Stock Exchange since 2005.
Companies which do not pay dividend may also be
considered as long as they are listed in Bursa Malaysia.
1. BRITISH AMERICAN TOBACCO BERHAD
2. KAWAN FOOD BERHAD
3. NESTLE (MALAYSIA) BERHAD
4. DUTCH LADY MILK INDUSTRIES BERHAD
5. APOLLO FOOD HOLDINGS BERHAD
6. GENTING PLANTATIONS BERHAD
7. PPB GROUP BERHAD
8. MALAYAN FLOUR MILLS BERHAD
9. SPRITZER BERHAD
10. HEINEKEN MALAYSIA BERHAD
11. CARLSBERG BREWERY MALAYSIA BERHAD
12. MHC PLANTATIONS BERHAD
13. ORIENTAL FOOD INDUSTRIES HOLDINGS BERHAD
14. PANASONIC MANUFACTURING MALAYSIA BERHAD
15. HOMERITZ CORPORATION BERHAD
16. PENSONIC HOLDINGS BERHAD
17. MAGNI-TECH INDUSTRIES BERHAD
18. PADINI HOLDINGS BERHAD
19. ASIA BRANDS BERHAD
20. BONIA CORPORATION BERHAD
21. COCOALAND HOLDINGS BERHAD
22. PETRONAS CHEMICALS GROUP BERHAD
23. MERCURY INDUSTRIES BERHAD
24. SAPURA INDUSTRIAL BERHAD
25. HONG LEONG INDUSTRIES BERHAD
26. FEDERAL INTERNATIONAL HOLDINGS BERHAD
27. C.I. HOLDINGS BERHAD
28. POWER ROOT BERHAD
29. FRASER &NEAVE HOLDINGS BERHAD
30. ESTHETICS INTL.GROUP BERHAD
31. SARAWAK OIL PALMS BERHAD
32. NEGRI SEMBILAN OIL PALMS BERHAD
33. SARAWAK PLANTATION BERHAD
34. AJINOMOTO (MALAYSIA) BERHAD
35. LONDON BISCUITS BERHAD
Table 1: List of Companies
IV. RESULTS
A. Normality Test: Q-Q Plot
This test is conducted to show whether the data
distribution is following a normal distribution. There are
two categories on how to identify this namely graphical and
statistical. In order to identify the normality of the variables
for the periods of 2008 to 2017 in a graphical technique, a
Quantile-quantile plot (Q-Q plot) is as follows:

217
Published By:
Blue Eyes Intelligence Engineering & Sciences Publication Retrieval Number: ES2148017519/19©BEIESP
Based on respective chart above, it can be observed as
follows:
Share price volatility - most of the points that are plotted
for share price volatility lie on or next the diagonal line,
suggesting that the plot is linear. Therefore, it can be
concluded that the distribution for manufacturing firms for
2008 to 2017 is normal.
Dividend payout - most of the points that are plotted are
on the diagonal line or near the line, which appears to be
that the plot has a linear display, hence suggesting that the
distribution of data is normal for the period 2008 to 2017 for
the companies.
Dividend yield – the points on the Q-Q plot completely
deviating from the line. This indicates that dividend yield is
not linear. The pattern of the points is downward sloping
from the right to left along the line. The points that are
plotted on the line have a high slope. It therefore does not
follow a normal distribution, but the sample data is skewed.
A reason for this could probably be because many dividends
have done been declared during that period of time.
Size of firm - the points indicate that most points fall
along the line or are near the diagonal line and are not really
likely to deviate, which therefore shows that this plot and
the sample size are normally distributed.
Earning volatility –the points on the Q-Q plot completely
deviating from the line and it is not linear. There is a
deviation from the normality, the reason being that the
plotted point’s pattern forms a downward sloping curve
from right to left. This kind of plot will generally indicate
that the data has a lot of extreme values than would usually
be estimated in case they were normally distributed. It
therefore does not follow a normal distribution.
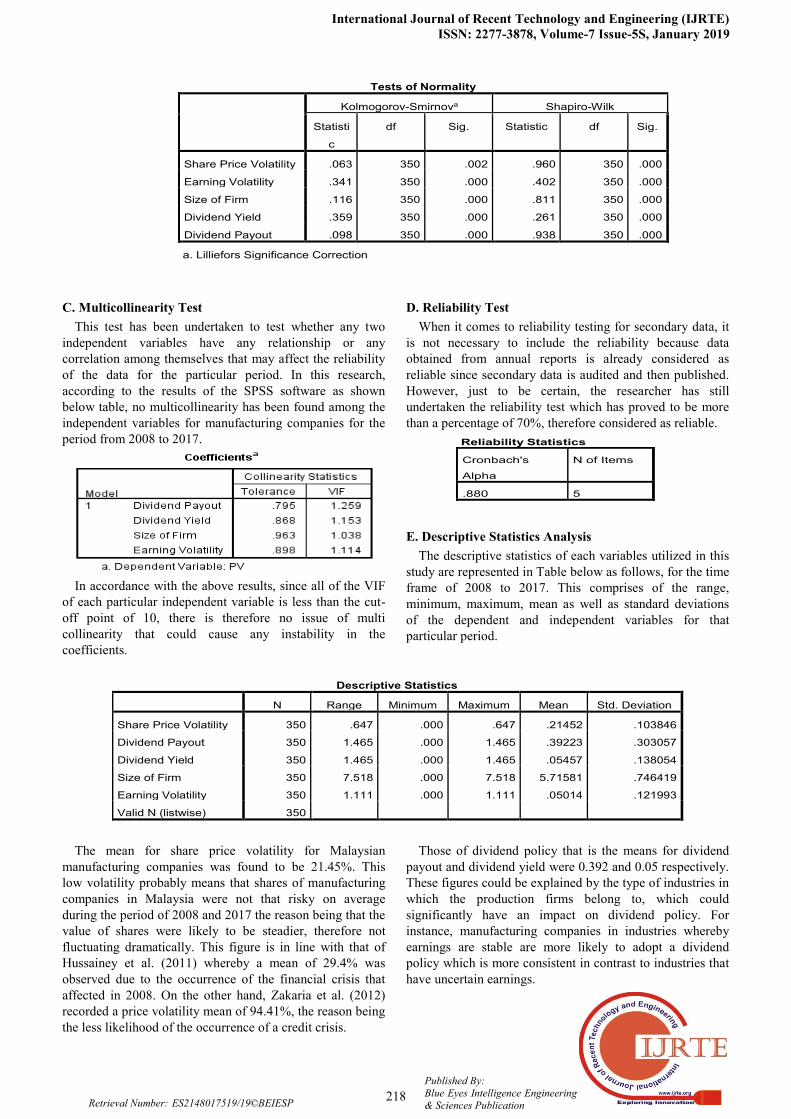
B. Shapiro-Wilk Test
To support the usage of the Q-Q plot test for normality, a
statistical technique named the Shapiro-Wilk test is usually
conducted. To test for the normality of the variables used in
the study to analyse the effect of dividend policy of
Malaysian manufacturing firms for the period 2008 to 2017,
the test has also been undertaken. As it can be observed in
the below table, since the p-value for each of the variables is
less than 0.05, it is assumed the null hypothesis that the
distribution is normal should be rejected due to its low
significance level. However, this is more applicable in the
cases of small sample sizes where the number is less than
30. In this situation, it is assumed that due to a large sample
size where (N=350), the significance value may have been
impacted resulting in a lower value, which is not reliable.
For a bigger sample size, a Q-Q plot is more appropriate.
We therefore assume that the data distribution is normal.
International Journal of Recent Technology and Engineering (IJRTE)
ISSN: 2277-3878, Volume-7 Issue-5S, January 2019
218 Published By:
Blue Eyes Intelligence Engineering
& Sciences Publication Retrieval Number: ES2148017519/19©BEIESP
C. Multicollinearity Test
This test has been undertaken to test whether any two
independent variables have any relationship or any
correlation among themselves that may affect the reliability
of the data for the particular period. In this research,
according to the results of the SPSS software as shown
below table, no multicollinearity has been found among the
independent variables for manufacturing companies for the
period from 2008 to 2017.
In accordance with the above results, since all of the VIF
of each particular independent variable is less than the cut-
off point of 10, there is therefore no issue of multi
collinearity that could cause any instability in the
coefficients.
D. Reliability Test
When it comes to reliability testing for secondary data, it
is not necessary to include the reliability because data
obtained from annual reports is already considered as
reliable since secondary data is audited and then published.
However, just to be certain, the researcher has still
undertaken the reliability test which has proved to be more
than a percentage of 70%, therefore considered as reliable.
E. Descriptive Statistics Analysis
The descriptive statistics of each variables utilized in this
study are represented in Table below as follows, for the time
frame of 2008 to 2017. This comprises of the range,
minimum, maximum, mean as well as standard deviations
of the dependent and independent variables for that
particular period.
The mean for share price volatility for Malaysian
manufacturing companies was found to be 21.45%. This
low volatility probably means that shares of manufacturing
companies in Malaysia were not that risky on average
during the period of 2008 and 2017 the reason being that the
value of shares were likely to be steadier, therefore not
fluctuating dramatically. This figure is in line with that of
Hussainey et al. (2011) whereby a mean of 29.4% was
observed due to the occurrence of the financial crisis that
affected in 2008. On the other hand, Zakaria et al. (2012)
recorded a price volatility mean of 94.41%, the reason being
the less likelihood of the occurrence of a credit crisis.
Those of dividend policy that is the means for dividend
payout and dividend yield were 0.392 and 0.05 respectively.
These figures could be explained by the type of industries in
which the production firms belong to, which could
significantly have an impact on dividend policy. For
instance, manufacturing companies in industries whereby
earnings are stable are more likely to adopt a dividend
policy which is more consistent in contrast to industries that
have uncertain earnings.
Tests of Normality
Kolmogorov-Smirnova Shapiro-Wilk
Statisti
c
df Sig. Statistic df Sig.
Share Price Volatility .063 350 .002 .960 350 .000
Earning Volatility .341 350 .000 .402 350 .000
Size of Firm .116 350 .000 .811 350 .000
Dividend Yield .359 350 .000 .261 350 .000
Dividend Payout .098 350 .000 .938 350 .000
a. Lilliefors Significance Correction
Reliability Statistics
Cronbach's
Alpha
N of Items
.880 5
Descriptive Statistics
N Range Minimum Maximum Mean Std. Deviation
Share Price Volatility 350 .647 .000 .647 .21452 .103846
Dividend Payout 350 1.465 .000 1.465 .39223 .303057
Dividend Yield 350 1.465 .000 1.465 .05457 .138054
Size of Firm 350 7.518 .000 7.518 5.71581 .746419
Earning Volatility 350 1.111 .000 1.111 .05014 .121993
Valid N (listwise) 350

219
Published By:
Blue Eyes Intelligence Engineering & Sciences Publication Retrieval Number: ES2148017519/19©BEIESP
A mean of 39.2% for dividend payout could be a result of
high profitability among Malaysian manufacturing firms on
average for the period starting 2008 to 2017. Besides, the
study also included both dividend and non-dividend paying
firms to analyse the impact on share price volatility, which
could further support a low dividend yield of 5.46% on
average. A low dividend yield on average could be
explained by the fact that probably many manufacturing
companies did not declare their dividends within the period
of 2008 to 2017.
Dividend yield result is in line with that of Shah and
Noreen with a DY mean of 6.9% and Zakaria et al. (2012),
who recorded a dividend yield of 2.2% only. Similarly, the
results of Hashemijoo et al. (2012) for dividend yield and
dividend payout are similar to this study with a mean value
of 0.04 and 0.37 respectively. Besides, this is also supported
by the findings of Allen and Rachim (1996) who stated a
result of 0.07 and 0.495 for dividend yield and dividend
payout while studying Australian firms.
On the other hand, the mean for size of firms for the
period 2008 to 2017 was 5.71, in line with the findings of
Zakaria et al. (2012) and Safian and Ali (2012) who
recorded firm size mean of 5.57 and 5.81 correspondingly.
Usually, large companies have the tendency to pay more
dividends to shareholders since they are more likely to have
more access to capital to be able to raise for funds
(Alzomania and Al-Khadhiri, 2013). Hooi et al. (2015)
conversely, recorded a firm size mean of 19.48 while Al-
Shawawreh (2014) noted a mean of 7.74.
A mean of 5.01% for earnings volatility has been
observed for manufacturing firms in Malaysia for 2008 to
2017. This could probably be a result of stable earnings for
the period of 2008 to 2017. This result is in line with that of
Zainudin et al. (2016) and Safian and Ali (2012) whose
results showed that earnings volatility had a mean of 6.86%
and 7.9% respectively. Misbah et al. (2013) alternatively
recorded a mean of 21.3% for earnings volatility, while
Nazir et al. (2012) got an extreme value of 560.86 for its
mean of this particular variable.
F. Pearson Correlation Analysis
The above table indicates the correlation matrix all for the
variables and the relationship between share price volatility
and dividend policy (dividend payout and dividend yield)
together with the other control variables (size of firm and
earning volatility) of Malaysian manufacturing companies
are analyzed for the period of 2008 to 2017. In accordance
to the table above, it can be observed that price volatility has
been found to be significantly negatively correlated to
dividend payout because it has a coefficient value of -0.296
at 1% significance level. On the other hand, in terms of the
relationship between dividend yield and volatility of share
price, a negative correlation can be observed between both
with a value of the -0.015 and both are insignificant with the
coefficient value close to zero, meaning that they are not
strongly correlated. Speaking further of the control variables
included such firm size, a significant negative linkage
between the mentioned variable and price volatility by a
value of -0.336 can be seen at 1% significance level. Last
but not the least, earning volatility has a significant negative
relationship with share price volatility by a value of -0.199.
On an overall basis, all of the independent variables have a
correlation with share price volatility with a coefficient
value ranging from -1 and 1.
G. Multiple Linear Regression Analysis
After having conducted a multiple regression analysis
from the SPSS software, the following results have been
obtained for the period of 2008 to 2017 and is presented
below.

International Journal of Recent Technology and Engineering (IJRTE)
ISSN: 2277-3878, Volume-7 Issue-5S, January 2019
220 Published By:
Blue Eyes Intelligence Engineering
& Sciences Publication Retrieval Number: ES2148017519/19©BEIESP
Step 1 – Multiple Regression Analysis and Equation 1
Regression with Dividend Policy
From the above table, the regression result for dividend
policy and volatility of share price for the manufacturing
firms can be determined for an overall 10-year period. The
value of r-square is 0.096, meaning that only 9.6% of
changes in share prices could be described by dividend
policy. The results show that there is a significant
relationship between dividend payout and share price
volatility since it has a p-value that is less than 0.05 based
on the table. On the other hand, dividend yield has been
observed to be insignificant to price volatility because its p-
value is 0.07, which is greater than 0.05.
Step 2- Multiple Regression Analysis and Equation 2
While adding the other control variables that could have
an additional influence on the volatility of share prices to
determine whether any changes in the dividend policy
coefficient would be observed, we come up with the results
as shown in the following table.
An r-square value of 18.9% has been obtained in this
study as it can be observed in the table above. As explained
earlier, this figure means that 18.9% of the changes in the
manufacturing firms for the period of 2008 and 2017 in
Malaysia could be explained by the independent variables
that have been tested namely dividend payout, dividend
yield, size of firm and volatility in earnings. This r-square
value of 0.189 may be seconded by that Profilet and Bacon
(2013) with a value of 21.72% and Onchiri (2013) with
20.8%. Harshapriya (2015) and Safian and Ali (2012) who
obtained a figure of 10.15% and 11.99% respectively. A low
r-square value could be explained by factors such as a
limited time frame since the research has been based on
only 10 years. In addition, only 35 companies have been
used to conduct this study. Perhaps if the research would
have been undertaken over a longer time period and a
greater number of companies would be used, the r-square
value would have been greater. Moreover, the fact that the
study results contained many outliers may have been a
reason attributed to a low r-square. Also, maybe if different
and additional control variables would be initiated or
different models would be employed, a stronger association
would have been obtained in this study.

221
Published By:
Blue Eyes Intelligence Engineering & Sciences Publication Retrieval Number: ES2148017519/19©BEIESP
In accordance to the above tables, the regression result for
the independent variables including dividend policy
(dividend payout and dividend yield) and control variables
(size and earning volatility) against the dependent variable
which is fluctuations of share price for the manufacturing
firms can be determined for the overall 10-year period
starting 2008 to 2017. According to table 4.9, 18.9% of the
changes in the manufacturing firms for the period of 2008
and 2017 in Malaysia could be explained by the independent
variables combined together which are dividend payout,
dividend yield, size of firm and volatility in earnings. The
table indicates that a significant relationship may still be
observed between dividend payout and share price volatility
with a p-value less than 0.05, while dividend yield and
volatility are still found to be insignificantly related with a
p-value of 0.181, compared to 0.07 in the previous analysis.
Firm size and earning volatility are seen to have a
significant connection with the volatility of share prices
with both a p-value of zero and 0.047 respectively, which
are less than 0.05.
Dividend Payout and Share Price Volatility
Dividend payout was found to have a negative correlation
with share price volatility by a coefficient of -0.296. In
addition, after having undertaken the different stages
multiple regression analysis, the finding showed that
dividend payout and price volatility have a significant
relationship. This means that the null hypothesis will be
rejected and the alternative hypothesis is accepted, therefore
suggesting that dividend payout relates negatively and
significantly to share price movements. This finding is line
with Zainudin et al. (2016) who suggested that dividend
payout continues to remain significant in forecasting price
volatility. The same result is also in accordance with that of
Shah and Noreen (2016), Hooi (2015), Lashgari and Ahmad
(2014), Al-Shawawreh (2014), Ramadan (2013), Nazir et al,
(2012), Hussainey (2011), among many other researchers.
The finding signifies that the higher the dividend payout,
lower will be the movement of share prices. Dividend
payout could be an indication to the market that is likely to
have an effect on fluctuations in stock prices, influencing
managers to be vigilant before changing corporate policies
concerning dividend payout.
Dividend Yield and Share Price Volatility
In terms of the relationship between dividend yield and
volatility of share price, a negative correlation can be
observed between price volatility and dividend yield with a
value of the -0.015. As well, the multiple regression result
discloses that both variables are insignificantly linked. The
researcher hence accepts the null hypothesis and rejects the
alternative hypothesis this indicates that share price
volatility and dividend yield are inversely insignificantly
related. This outcome is supported by that of Zuriawati et al.
(2012) whereby in the latter’s research, dividend yield did
not influence any change in share price movements. Rashid
and Rahman (2008) who also are in line with this finding,
suggest that an insignificant dividend yield might have been
caused because of a capital market which is inefficient or
probably due to a large proportion of stock being held by
leading shareholders having a large market share in the
board of the firm (Nazir et al., 2012). Conversely,
Gunarathne (2016) and Hashemijoo (2012) identified an
inverse but significant relationship between share prices and
dividend yield.
Size of Firm and Share Price Volatility
Speaking of firm size, an adverse linkage between the
mentioned variable and price volatility is observed by a
value of -0.336, based on the correlation analysis. After
analysing various stages of the multiple linear regression, it
is shown that firm size and price volatility have a significant
relationship, thereby influencing the researcher to reject the
null hypothesis and accepting the alternative hypothesis,
hence concluding that firm size and the dependent variable
have a negative significant relationship. These findings are
consistent with those of Zainudin et al. (2016), Hooi (2015),
Lashgari and Ahmad (2014), Profilet and Bacon (2013),
Naveed (2013) who also found an inverse linkage between
size and price volatility. This means that the larger the size
of a firm, the lesser the share price will be volatile
(Hussainey et al., 2011) while small firms are more likely to
be exposed to risk in relation to stock prices (Nazir et al,
2012). Shah and Noreen (2016) conversely found an
insignificant relationship between firm size and price
volatility. In general, bigger firms have the tendency to be
more financially sound and profitable, thereby more likely
to experience lower fluctuations in share prices (Zainudin et
al., 2016).
Earnings Volatility and Share Price Volatilty
Based on the correlation analysis, earning volatility is
found to have an inverse relationship with share price
volatility by a coefficient value of -0.199. The multiple
linear regression result states that earning volatility has a
significant relationship with the volatility of share prices.
This henceforth comes to the conclusion that the null
hypothesis is rejected and accepting the alternative
hypothesis, meaning that earning volatility and price
volatility have a significant negative association among each
other based on the multiple regression results. The findings
of this study are consistent only with that of Nishat and
Chaudhary (2006) and Allen and Rachim (1996). On the
other hand, Hussainey et al. (2011) and Zuriawati et al.
(2012) discovered an insignificant relationship between EV
and price volatility while Hooi (2015) and Shah and Noreen
(2016) display a significant relationship among the
mentioned variables in their respective studies. Sadiq at al.
(2013) seconded that there is no relationship between these
two mentioned variables. As of here, it is implied that as
earnings volatility increases, share price volatility decreases.
V. RECOMMENDATIONS AND CONCLUSION
Provided that the researcher analysed only 35
manufacturing firms over a limited time frame of 10 years
only, which the researcher believes is sufficient. But the use
of a longer time period and a greater sample size with the
inclusion of companies from different sectors and industries
other than the manufacturing sector, for instance the
services sector including the healthcare sector,

International Journal of Recent Technology and Engineering (IJRTE)
ISSN: 2277-3878, Volume-7 Issue-5S, January 2019
222 Published By:
Blue Eyes Intelligence Engineering
& Sciences Publication Retrieval Number: ES2148017519/19©BEIESP
Telecommunication sector, financial sector among others
and other capital markets or countries would probably
generate a better, accurate and more reliable result in
identifying the dividend policy effect on share price
volatility.
Another suggestion for further researches on the same topic
could be to adopt the use of other models other than the
multiple linear regression model and Pearson Correlation
Analysis in order to explain the various associations
between dependent and independent variables. For instance,
the time series analysis or polynomial models could be used
to consider the impact.
The research included only four independent variables have
been used, the results of which have mostly been negatively
related to share prices. Additional studies conducted on the
relationship between dividend policy and movements in
share prices could be undertaken using additional control
variables that could be likely to have an effect on volatility
of share prices and better results could be obtained. An
example would be the effect of macroeconomic variables
such as inflation and interest rates could be taken into
consideration.
The study encountered some difficulty in obtaining some
information for some few companies whose data was
missing in some years. Also, since most researchers in this
context have included the use of secondary data and
material that has already been published, it would not be a
bad idea to conduct a further study using primary data that
includes the use of questionnaires or interviews so as to
complement the study.
Last but not the least, this paper and previous studies have
been based mostly on listed companies in Bursa Malaysia
and other stock exchanges, henceforth excluding small and
medium firms and private companies. Supplementary
research could take into consideration non-public and small-
medium companies so as to get a broader perspective of
dividend policy on share prices.
In the light of the present discussion, this study has
investigated the relationship between dividend policy and
share price volatility with a concentration on 35
manufacturing firms from different sectors namely food,
beverages, chemical home and consumer product companies
listed in Bursa Malaysia from the years starting 2008 to
2017. Dividend payout and dividend yield have been used
as main independent variables while firm size and earnings
volatility have been used as control variables to further
determine the influence of dividends on share prices. Using
the Pearson Correlation analysis and the multiple linear
regression model, findings indicated that dividend payout,
size and earnings volatility are inversely related to share
price volatility while dividend yield has an adverse
insignificant association with the volatility of share prices.
The research thereby supports the dividend relevance theory
(Gordon, 1962). This study can now provide investors with
a clearer picture and a greater insight in terms of dividend
policy while for managers, this research may be an
influence for dividend policy decisions whenever there is
any investment opportunity. In short, it can be concluded
that an effective method to guide the market value of
manufacturing firms in Malaysia is through dividend policy.
REFERENCES
1. Al Abbadi, A.F.A., Al-Amarneh, A. & Abuorabi, M.M. (2016). The
Impact of Corporate Governance on the Quality of Marketing Audit
in Jordanian Industrial Public Shareholding Companies.
International Journal of Business Administration. [Online]. 7 (2). Available from:
http://www.sciedu.ca/journal/index.php/ijba/article/view/9162.
2. Adams, A., Armitage, S. & FitzGerald, A. (2012a). An analysis of stock market volatility. Annals of Actuarial Science. [Online]. 6
(01). p.pp. 153–170. Available from:
http://www.journals.cambridge.org/abstract_S1748499511000339. 3. Adams, A., Armitage, S. & FitzGerald, A. (2012b). An analysis of
stock market volatility. Annals of Actuarial Science. [Online]. 6
(01). p.pp. 153–170. Available from: http://www.journals.cambridge.org/abstract_S1748499511000339.
[Accessed: 28 February 2018].
4. Akram Ahmad, M. & Mohammad Salem Alrjoub, A. (2018). THE EFFECT OF DIVIDEND POLICY ON STOCK PRICE
VOLATILITY: EMPIRICAL EVIDENCE FROM AMMAN
STOCK EXCHANGE. Academy of Accounting and Financial
Studies Journal. [Online]. 22 (1). p.pp. 1528–2635. Available from:
https://www.abacademies.org/articles/The-Effect-of-Dividend-
Policy-on-Stock-Price-Volatility-1528-2635-22-2-161.pdf. [Accessed: 3 July 2018].
5. Al- Hasan, A. (2013). The Effect of Dividend Policy on Share Price:
An Evaluative Study. IOSR Journal of Economics and Finance. [Online]. 1 (4). p.pp. 06-11. Available from:
http://www.iosrjournals.org/iosr-jef/papers/vol1-
issue4/B0140611.pdf?id=6764. 6. Alayemi, S.A. (2013). Relationship between dividend payout and
market price of shares. Indican ournal of Commerce & Management
Studies. IV (1). p.pp. 116–122. 7. Allen, D.E. & Rachim, V.S. (1996). Dividend policy and stock price
volatility: Australian evidence. Applied Financial Economics.
[Online]. 6 (2). p.pp. 175–188. Available from: http://www.tandfonline.com/doi/abs/10.1080/096031096334402.
[Accessed: 3 July 2018].
8. Anis, S.N. (2012). Dividend Policy and Share Price Volatility:
Malaysia Evidence. [Online]. (January). Available from:
http://etd.uum.edu.my/3144/.
9. Anjom, W. & Karim, A.M. (2016). RELATIONSHIP BETWEEN NON-PERFORMING LOANS AND MACROECONOMIC
FACTORS WITH BANK SPECIFIC FACTORS : A CASE STUDY
ON LOAN PORTFOLIOS – SAARC COUNTRIES Non-performing loan can be defined as a form of financial assets from
which the banks is failed to receive i. Elk Asia Pacific Journal Of
Finance And Risk Management. 7 (2). p.pp. 1–29. 10. Anwar, S., Singh, S. & Jain, P.K. (2015). Cash Dividend
Announcements and Stock Return Volatility: Evidence from India.
Procedia Economics and Finance. [Online]. 30. p.pp. 38–49. Available from:
https://www.sciencedirect.com/science/article/pii/S2212567115012538. [Accessed: 30 June 2018].
11. Azzam, I. (2010). The Impact of Institutional Ownership and
Dividend Policy on Stock Returns and Volatility : Evidence from Egypt Islam Azzam. International Journal of Business. 15 (4). p.pp.
443–458.
12. Baskin, J. (1989). Dividend policy and the volatility of common stocks. The Journal of Portfolio Management. [Online]. 15 (3). p.pp.
19–25. Available from:
http://jpm.iijournals.com/lookup/doi/10.3905/jpm.1989.409203. [Accessed: 3 July 2018].
13. Black, F. (1976). The Dividend Puzzle. The Journal of Portfolio
Management. [Online]. 2 (2). p.pp. 5–8. Available from: http://jpm.iijournals.com/lookup/doi/10.3905/jpm.1976.408558.
[Accessed: 3 July 2018].
14. Borad Sanjay (2018). 17 Factors affecting Dividend Policy: Profitability, Industry, Ownership, etc. [Online]. 2018.
eFinanceManagement. Available from:
https://efinancemanagement.com/dividend-decisions/factors-affecting-dividend-policy. [Accessed: 3 July 2018].
15. Boyte-White, C. (2018). How Dividends Affect Stock Prices. 2018.
16. Bursamalaysia.com (2018). Market | Bursa Malaysia Market. [Online]. 2018. Bursa Malaysia Berhad. Available from:

223
Published By:
Blue Eyes Intelligence Engineering & Sciences Publication Retrieval Number: ES2148017519/19©BEIESP
http://www.bursamalaysia.com/market/. [Accessed: 1 July 2018].
17. Chandani, A. & Ahuja, A.K. (n.d.). Impact of Eps and Dps on Stock Price : a Study of Selected Public Sector Banks of India. p.pp. 111–
121.
18. Chughtai, A.R., Azeem, A., Amara & Shahid, A. (2014). Determining the Impact of Dividends, Earnings, Invested Capital
and Retained Earning on Stock Prices in Pakistan : An Empirical
Study. International Journal of Financial Management. 4 (1). 19. Corina, I., Mirela, N. & Mihaela, G. (2009). Factors that affect
dividend policies. Romanian Economic Business Review. [Online].
4 (2). p.pp. 83–89. Available from: ftp://ftp.repec.org/opt/ReDIF/RePEc/rau/journl/SU09/REBE-SU09-
A8.pdf.
20. Dasilas, A., Lyroudi, K. & Ginoglou, D. (2009). The impact of dividend initiations on Greek listed firms’ wealth and volatility
across information environments. Managerial Finance. [Online]. 35
(6). p.pp. 531–543. Available from: http://www.emeraldinsight.com/10.1108/03074350910956981.
21. DeFusco, R.A., McLeavey, D.W. & Pinto, J.E. (2015). Quantitative
Investment Analysis Workbook. [Online]. Wiley. Available from: https://www.wiley.com/en-
us/Quantitative+Investment+Analysis+Workbook%2C+3rd+Edition
-p-9781119104544. [Accessed: 3 July 2018]. 22. Desai, C.A. & Nguyen, K.H. (2015). What explains the change in a
firm’s idiosyncratic volatility after a dividend initiation? Managerial
Finance. [Online]. 41 (11). p.pp. 1138–1158. Available from: http://www.emeraldinsight.com/doi/10.1108/MF-03-2014-0066.
23. Dewasiri, N.J. & Banda, Y.K.W. (2015). Dividend Policy and Stock Price Volatility: An Error Corrected Approach. Asia-Pacific Journal
of Management Research and Innovation. [Online]. 11 (3). p.pp.
165–171. Available from: http://journals.sagepub.com/doi/10.1177/2319510X15588387.
[Accessed: 29 June 2018].
24. Elmirzaev, S. (2017). MARKET PERFORMANCE, DIVIDEND POLICY AND FINANCIAL STABILITY: EVIDENCE FROM
SELECTED TOP LISTED COMPANIES IN UZBEKISTAN.
International Journal of Economics, Commerce and Management. [Online]. V (6). Available from: http://ijecm.co.uk/wp-
content/uploads/2017/06/5613.pdf. [Accessed: 3 July 2018].
25. Ford, C. (2015). Understanding Q-Q Plots | University of Virginia Library Research Data Services + Sciences. [Online]. 2015.
University of Virginia Library. Available from:
https://data.library.virginia.edu/understanding-q-q-plots/. [Accessed: 2 July 2018].
26. Ghasemi, A. & Zahediasl, S. (2012). Normality tests for statistical
analysis: a guide for non-statisticians. International journal of endocrinology and metabolism. [Online]. 10 (2). p.pp. 486–9.
Available from: http://www.ncbi.nlm.nih.gov/pubmed/23843808.
[Accessed: 3 July 2018]. 27. Gordon, M.J. (1962). The Savings Investment and Valuation of a
Corporation. The Review of Economics and Statistics. [Online]. 44
(1). p.p. 37. Available from: https://www.jstor.org/stable/1926621?origin=crossref. [Accessed: 3
July 2018].
28. Gregoriou, G.N. (2009). Stock market volatility. CRC Press. 29. Gupta, S., Dogra, B., Vashisht, A.K. & Ghai, S. (2012). Stock Price
Reaction to Dividend Changes. International Journal of Financial
Management. 2 (2). p.p. 61. 30. Hamza, S.M. & Hassan, Z. (2017). Impact of Dividend Policy on
Shareholders Wealth: a Comparative Study Among Dividend Paying
and Non-Paying Technology Based Firm’S in Usa. International Journal of Information, Business and Management. 9 (3). p.pp. 1–
27.
31. Hashemijoo, M., Ardekani, A.M. & Younesi, N. (2012). The Impact of Divident Policy on Share Price Volatility in the Malaysia Stock
Market. Journal of Business Studies Quarterly. 4 (1). p.pp. 111–129.
32. Hussainey, K., Oscar Mgbame, C. & Chijoke‐Mgbame, A.M. (2010). Dividend policy and share price volatility: UK evidence. The Journal of Risk Finance. [Online]. 12 (1). p.pp. 57–68.
Available from:
http://www.emeraldinsight.com/doi/10.1108/15265941111100076.
33. Hussainey, K., Oscar Mgbame, C. & Chijoke‐Mgbame, A.M.
(2011). Dividend policy and share price volatility. Investment Management and Financial Innovations. [Online]. 12 (1). p.pp. 57–
68. Available from:
http://www.emeraldinsight.com/doi/10.1108/15265941111100076. 34. Ibrahim Eldomiaty, T., Atia, O., Badawy, A. & Hafez, H. (2014).
Mutual benefits of transferring stock risks to dividend policy. Journal of Economic and Administrative Sciences. [Online]. 30 (2).
p.pp. 131–158. Available from: http://dx.doi.org/10.1108/JEAS-05-
2013-0016. 35. Impact, T., Policy, D., Volatility, S.P., Stocks, B. & Exchange, C.S.
(n.d.). The Impact of Dividend Policy on Share Price Volatility : The
Impact of Dividend Policy on Share Price Volatility : Evidence from Banking Stocks in Colombo Stock Exchange Evidence from
Banking Stocks in Colombo Stock Exchange. p.pp. 27–67.
36. Jahfer, A., Mulafara, A.H., Jahfer, A. & Mulafara, A.H. (2016). International journal of managerial and financial accounting.
[Online]. Inderscience Enterprises. Available from:
https://econpapers.repec.org/article/idsinjmfa/v_3a8_3ay_3a2016_3ai_3a2_3ap_3a97-108.htm. [Accessed: 29 June 2018].
37. Lang, L.H.P. & Litzenberger, R.H. (1989). Dividend
announcements. Journal of Financial Economics. [Online]. 24 (1). p.pp. 181–191. Available from:
http://linkinghub.elsevier.com/retrieve/pii/0304405X89900779.
[Accessed: 28 February 2018]. 38. Lashgari, Z. & Ahmadi, M. (2014). The Impact of Dividend Policy
On Stock Price Volatility in the Tehran Stock Exchange. Journal of
Business Studies. [Online]. 3 (10). p.pp. 273–283. Available from: http://ezproxy.lib.monash.edu.au/login?url=http://search.ebscohost.c
om/login.aspx?direct=true&db=bth&AN=91711854&site=ehost-
live&scope=site. 39. Legenzova, R., Jurakovaitė, O. & Galinskaitė, A. (2017). The
Analysis of Dividend Announcement Impact on Stock Prices of
Baltic Companies. 6 (01). p.pp. 61–76. 40. Li, G. (2016). Growth options, dividend payout ratios and stock
returns. Studies in Economics and Finance. [Online]. 33 (4). p.pp. 638–659. Available from:
http://www.emeraldinsight.com/doi/10.1108/SEF-08-2015-0195.
41. Miller, M.H. & Modigliani, F. (1961). Dividend Policy, Growth, and the Valuation of Shares. The Journal of Business. [Online]. 34
(4). p.p. 411. Available from: http://www.jstor.org/stable/2351143.
[Accessed: 28 February 2018]. 42. Naveed, M.Y. & Ramzan, M. (2013). Interdisciplinary Journal Of
Contemporary Research In Business A View About The
Determinants Of Change In Share Prices: A Case From Karachi Stock Exchange (Banking Sector). [Online]. Available from:
http://journal-archieves31.webs.com/41-57.pdf. [Accessed: 30 June
2018]. 43. Nazir, M.S., Abdullah & Nawaz, M.M. (2012). How Dividend
Policy Affects Volatility of Stock Prices of Financial Sector Firms
of Pakistan. American Journal of Scientific Research. 61 (61). p.pp. 132–139.
44. Ndung’u, M.M. (2016). a Case Study of Companies Listed in the
Nairobi. p.p. 84. 45. Nishat, M. & Chaudhary, I.M. (2006). DIVIDNED POLICY AND
STOCK PRICE VOLATILITY IN PAKISTAN. ResearchGate.
46. Onchiri, M.O. (2013). The relationship between dividend policy and stock price volatility: a case of companies listed at Nairobi securities
exchange. [Online]. Available from:
http://erepository.uonbi.ac.ke/handle/11295/59274. [Accessed: 29 June 2018].
47. Ozuomba, C.N., Anichebe, A.S. & Okoye, P.V.C. (2016). The effect
of dividend policies on wealth maximization – a study of some selected plcs. Cogent Business & Management. [Online]. 3 (1). p.pp.
1–16. Available from:
https://www.cogentoa.com/article/10.1080/23311975.2016.1226457 48. Paper, C., Jayewaedenepura, S. & Jayewardenepura, S. (2015).
Impact of Dividend Policy on Stock Price Volatility : Evidence from
Sri Lanka ” Impact of Dividend Policy on Stock Price Volatility : 13 (January). p.pp. 219–225.
49. Patel, C.B. (2011). Volatile Earnings Growth, the Price of Earnings
and the Value Premium. CFA Digest. [Online]. 41 (4). p.pp. 56–57. Available from:
http://www.cfapubs.org/doi/full/10.2469/dig.v41.n4.23. [Accessed:
2 July 2018]. 50. Profilet, K.A. & Bacon, F.W. (2013). Dividend Policy and Stock
Price Volatility in the U . S . Equity Capital Market. American
Society of Business and Behavioral Sciences. 20 (1). p.pp. 219–231. 51. Rashid Afzalur & Rahman Anisur (2008). Dividend Policy and
Stock Price Volatility: Evidence from Bangladesh. [Online]. 2008.
ResearchGate. Available from: https://www.researchgate.net/publication/268397901_Dividend_Poli
cy_and_Stock_Price_Volatility_Evidence_from_Bangladesh.
[Accessed: 28 February 2018].

International Journal of Recent Technology and Engineering (IJRTE)
ISSN: 2277-3878, Volume-7 Issue-5S, January 2019
224 Published By:
Blue Eyes Intelligence Engineering
& Sciences Publication Retrieval Number: ES2148017519/19©BEIESP
52. Reilly, F. & Brown, K. (2009). Investment Analysis and Portfolio
Management. 9th Ed. Canada: South-Western Cengage Learning. 53. S.A.K, S., D, M. & S, S. (2016). Determinants of the Dividend
Policy of Companies Listed on the Stock Exchange of Mauritius.
Proceedings of the Fifth Asia-Pacific Conference on Global Business, Economics, Finance and Social Sciences. [Online]. p.pp.
1–18. Available from: www.globalbizresearch.org.
54. Safian, M.F.A. & Ali, N. (2012b). Dividend policy and share price volatility: Evidence from Malaysia. In: 2012 IEEE Colloquium on
Humanities, Science and Engineering (CHUSER). [Online].
December 2012, IEEE, pp. 221–226. Available from: http://ieeexplore.ieee.org/document/6504314/. [Accessed: 28
February 2018].
55. Seida, J.A. (1997). The Effect of Dividend Increases on Investor Behaviour: The Dividend Clientelle Hypothesis.
56. Shah, S.A. & Noreen, U. (2016a). International Journal of
Economics and Financial Issues Stock Price Volatility and Role of Dividend Policy: Empirical Evidence from Pakistan. International
Journal of Economics and Financial Issues. [Online]. 6 (2). p.pp.
461–472. Available from: http:%5Cnwww.econjournals.com. 57. Stacescu, B. (2006). Dividend Policy in Switzerland. Financial
Markets and Portfolio Management. [Online]. 20 (2). p.pp. 153–183.
Available from: http://link.springer.com/10.1007/s11408-006-0013-7. [Accessed: 28 February 2018].
58. statisticssolutions.com (2018). Multicollinearity. [Online]. 2018.
Statistics Solution. Available from: http://www.statisticssolutions.com/multicollinearity/. [Accessed: 2
July 2018]. 59. Toby Mordkoff, J. (2016). The Assumption(s) of Normality.
[Online]. Available from:
http://www2.psychology.uiowa.edu/faculty/mordkoff/GradStats/part 1/I.07 normal.pdf. [Accessed: 1 July 2018].
60. Trochim, W. (2006). Descriptive Statistics. [Online]. 2006.
Research Methods Knowledge Base. Available from: https://socialresearchmethods.net/kb/statdesc.php. [Accessed: 3 July
2018].
61. Ullah, H., Saqib, S. & Usman, H. (2015). The Impact of Dividend Policy on Stock Price Volatility : A Case Study of Selected Firms
from Textile Industry in. International Journal of Academic
Research in Economics and Management Sciences. 4 (3). p.pp. 40–51.
62. Wet, J. De & Mpinda, M. (2013). The Impact Of Dividend
Payments On Shareholders’ Wealth: Evidence From The Vector Error Correction Model. International Business & Economics
Research Journal. 12 (11). p.pp. 1451–1467.
63. Xu, M., Sun, W. & Xie, J. (2016). Empirical Analysis of Dividend Policy and Stock Volatility based on Fixed Effect Model. p.pp. 442–
453.
64. Yasir Habib, B., Irshad Kiani, Z. & Arif Khan, M. (2012). Dividend Policy and Share Price Volatility: Evidence from Pakistan. Global
Journal of Management and Business Research. [Online]. 12.
Available from: https://globaljournals.org/GJMBR_Volume12/9-Dividend-Policy-and-Share-Price-Volatility.pdf. [Accessed: 28
February 2018].
65. Zainudin, R., Shahnaz Mahdzan, N. & Hong Yet, C. (2018). International Journal of Emerging Markets Dividend policy and
stock price volatility of industrial products firms in Malaysia
Dividend policy and stock price volatility of industrial products firms in Malaysia. International Journal of Emerging Markets The
Journal of Risk Finance. [Online]. 13 (1). p.pp. 203–217. Available
from: https://doi.org/10.1108/IJoEM-09-2016-025068. [Accessed: 29 June 2018].
66. Zakaria, Z., Muhammad, J. & Zulkifli, A.H. (2012b). Dividend
policy and share price volatility: UK evidence. The Journal of Risk Finance. [Online]. 2 (5). p.pp. 1–8. Available from:
http://www.tandfonline.com/doi/abs/10.1080/096031096334402.
67. Zeyad RAMADAN, I. (2013). Dividend Policy and Price Volatility. Empirical Evidence from Jordan. International Journal of Academic
Research in Accounting Finance and Management Sciences.
[Online]. 3 (2). p.pp. 15–22. Available from: http://www.hrmars.com/admin/pics/1759.pdf. [Accessed: 28
February 2018].
AUTHORS PROFILE
Bhagmal Harsha Neelanjana is working in Asia Pacific University of Technology and Innovation, School of Accounting, Finance and
Quantitative Studies, Faculty of Business Management, Technology Park
Malaysia, Bukit Jalil, 57000 Kuala Lumpur, Malaysia.
Hafinaz Hasniyanti Hassan is working Asia Pacific University of
Technology and Innovation, School of Accounting, Finance and Quantitative Studies, Faculty of Business Management, Technology Park
Malaysia, Bukit Jalil, 57000 Kuala Lumpur, Malaysia.