The HUDSEN Atlas: a three-dimensional (3D) spatial framework for studying gene expression in the...
11
The HUDSEN Atlas: a three-dimensional (3D) spatial framework for studying gene expression in the developing human brain Janet Kerwin, 1 Yiya Yang, 2 Paloma Merchan, 3 Subrot Sarma, 1 Jessica Thompson, 1 Xunxian Wang, 1 Juan Sandoval, 3 Luis Puelles, 3 Richard Baldock 2 and Susan Lindsay 1 1 Institute of Human Genetics, Newcastle University, International Centre for Life, Newcastle upon Tyne, UK 2 MRC Human Genetics Unit, Institute of Genetics and Molecular Medicine, Edinburgh, UK 3 Department of Human Anatomy and Psychobiology, and CIBER en Enfermedades Raras U736, Faculty of Medicine, University of Murcia, Murcia, Spain Abstract We are developing a three-dimensional (3D) atlas of the human embryonic brain using anatomical landmarks and gene expression data to define major subdivisions through 12 stages of development [Carnegie Stages (CS) 12–23; approximately 26–56 days post conception (dpc)]. Virtual 3D anatomical models are generated from intact specimens using optical projection tomography (OPT). Using MAPAINT software, selected gene expression data, gathered using standard methods of in situ hybridization and immunohistochemistry, are mapped to a representative 3D model for each chosen Carnegie stage. In these models, anatomical domains, defined on the basis of morphological landmarks and comparative knowledge of expression patterns in vertebrates, are linked to a developmental neuroanatomic ontology. Human gene expression patterns for genes with charac- teristic expression in different vertebrates (e.g. PAX6, GAD65 and OLIG2) are being used to confirm and ⁄ or refine the human anatomical domain boundaries. We have also developed interpolation software that digi- tally generates a full domain from partial data. Currently, the 3D models and a preliminary set of anatomical domains and ontology are available on the atlas pages along with gene expression data from approximately 100 genes in the HUDSEN Human Spatial Gene Expression Database (http://www.hudsen.org). The aim is that full 3D data will be generated from expression data used to define a more detailed set of anatomical domains linked to a more advanced anatomy ontology and all of these will be available online, contributing to the long-term goal of the atlas, which is to help maximize the effective use and dissemination of data wherever it is generated. Key words 3D atlas; database; gene expression; human embryo; optical projection tomography. Introduction The human brain has a highly complex anatomical structure and achieving this through development requires the coor- dinated expression of sets of genes. These patterns are often directed by morphogen signals diffusing from orga- nizer regions, which specify and determine cell fate and location. A major focus of developmental neuroscience is to understand how this specificity is attained: the identifica- tion of genes which control the development of key brain regions and how the regions themselves develop spatially in 3D and temporally during gestation and postnatal devel- opment (morphogenesis and histogenesis). Gaining insight into the genetic programme that regulates normal brain development in human has further implications for the understanding of developmental disorders resulting in neu- rological impairment. Much of the work on determining patterns of gene expression in the developing brain has been carried out in the mouse and other organisms, but less so in human. In organisms such as mouse or zebrafish, visualization of gene expression patterns can be achieved relatively easily at early stages using wholemount staining techniques. Inevitably, wholemount experiments are rarely (if ever?) possible with material that has limited availability, such as human embryos. Instead, 2D spatial gene expression patterns are obtained from serially sectioned embryos using in situ hybridization or immunohistochemistry. Some of the big- gest challenges in the interpretation of these data in organs Correspondence Janet Kerwin, Institute of Human Genetics, Newcastle University, International Centre for Life, Central Parkway, Newcastle upon Tyne, NE1 3BZ, UK. E: [email protected] Accepted for publication 29 July 2010 ª 2010 The Authors Journal of Anatomy ª 2010 Anatomical Society of Great Britain and Ireland J. Anat. (2010) 217, pp289–299 doi: 10.1111/j.1469-7580.2010.01290.x Journal of Anatomy
Transcript of The HUDSEN Atlas: a three-dimensional (3D) spatial framework for studying gene expression in the...
The HUDSEN Atlas: a three-dimensional (3D) spatialframework for studying gene expression in thedeveloping human brainJanet Kerwin,1 Yiya Yang,2 Paloma Merchan,3 Subrot Sarma,1 Jessica Thompson,1 Xunxian Wang,1
Juan Sandoval,3 Luis Puelles,3 Richard Baldock2 and Susan Lindsay1
1Institute of Human Genetics, Newcastle University, International Centre for Life, Newcastle upon Tyne, UK2MRC Human Genetics Unit, Institute of Genetics and Molecular Medicine, Edinburgh, UK3Department of Human Anatomy and Psychobiology, and CIBER en Enfermedades Raras U736, Faculty of Medicine, University
of Murcia, Murcia, Spain
Abstract
We are developing a three-dimensional (3D) atlas of the human embryonic brain using anatomical landmarks
and gene expression data to define major subdivisions through 12 stages of development [Carnegie Stages
(CS) 12–23; approximately 26–56 days post conception (dpc)]. Virtual 3D anatomical models are generated from
intact specimens using optical projection tomography (OPT). Using MAPAINT software, selected gene expression
data, gathered using standard methods of in situ hybridization and immunohistochemistry, are mapped to a
representative 3D model for each chosen Carnegie stage. In these models, anatomical domains, defined on
the basis of morphological landmarks and comparative knowledge of expression patterns in vertebrates, are
linked to a developmental neuroanatomic ontology. Human gene expression patterns for genes with charac-
teristic expression in different vertebrates (e.g. PAX6, GAD65 and OLIG2) are being used to confirm and ⁄ or
refine the human anatomical domain boundaries. We have also developed interpolation software that digi-
tally generates a full domain from partial data. Currently, the 3D models and a preliminary set of anatomical
domains and ontology are available on the atlas pages along with gene expression data from approximately
100 genes in the HUDSEN Human Spatial Gene Expression Database (http://www.hudsen.org). The aim is that
full 3D data will be generated from expression data used to define a more detailed set of anatomical domains
linked to a more advanced anatomy ontology and all of these will be available online, contributing to the
long-term goal of the atlas, which is to help maximize the effective use and dissemination of data wherever it
is generated.
Key words 3D atlas; database; gene expression; human embryo; optical projection tomography.
Introduction
The human brain has a highly complex anatomical structure
and achieving this through development requires the coor-
dinated expression of sets of genes. These patterns are
often directed by morphogen signals diffusing from orga-
nizer regions, which specify and determine cell fate and
location. A major focus of developmental neuroscience is to
understand how this specificity is attained: the identifica-
tion of genes which control the development of key brain
regions and how the regions themselves develop spatially
in 3D and temporally during gestation and postnatal devel-
opment (morphogenesis and histogenesis). Gaining insight
into the genetic programme that regulates normal brain
development in human has further implications for the
understanding of developmental disorders resulting in neu-
rological impairment.
Much of the work on determining patterns of gene
expression in the developing brain has been carried out in
the mouse and other organisms, but less so in human. In
organisms such as mouse or zebrafish, visualization of gene
expression patterns can be achieved relatively easily at early
stages using wholemount staining techniques. Inevitably,
wholemount experiments are rarely (if ever?) possible with
material that has limited availability, such as human
embryos. Instead, 2D spatial gene expression patterns are
obtained from serially sectioned embryos using in situ
hybridization or immunohistochemistry. Some of the big-
gest challenges in the interpretation of these data in organs
Correspondence
Janet Kerwin, Institute of Human Genetics, Newcastle University,
International Centre for Life, Central Parkway, Newcastle upon Tyne,
NE1 3BZ, UK. E: [email protected]
Accepted for publication 29 July 2010
ªª 2010 The AuthorsJournal of Anatomy ªª 2010 Anatomical Society of Great Britain and Ireland
J. Anat. (2010) 217, pp289–299 doi: 10.1111/j.1469-7580.2010.01290.x
Journal of Anatomy
such as the developing human brain are how to relate the
2D section data to what is a complex and intricate 3D ana-
tomical structure and how to compare gene expression pat-
terns from one stage of development with another within
the same species or amongst different species.
Different projects have addressed these issues in various
ways: projects working on species such as Xenopus
(Bowes et al. 2010), Caenorhabditis elegans (Harris et al.
2010) and Drosophila (Lecuyer et al. 2007) have opted for
a system whereby wholemount images are displayed with
a text-based description of the sites of expression. In
more complex organisms such as the mouse, there are
atlases such as the Allen Brain Atlas (Lein et al. 2007) and
GENSAT (Heintz, 2004) which deliver gene expression pat-
terns from serially sectioned tissue, linked to a colour-
coded reference atlas of 2D annotated sections. Another
method, used by the Edinburgh Mouse Atlas of Gene
Expression (EMAGE; Baldock et al. 2003) and the Atlas of
Zebrafish Development (Verbeek et al. 1999), has been to
create a series of 3D reference models to provide a spatial
framework in which anatomical structures are defined,
and into which 2D experimental data can be mapped.
This is the approach we have taken for the HUDSEN atlas.
Our 3D reference models are generated from intact
human embryos using the rapid and non-invasive tech-
nique of optical projection tomography (OPT; Sharpe
et al. 2002). The HUDSEN atlas is based on 12 such OPT
models covering the range of Carnegie Stages CS12
(approximately 26 dpc; the closure of the caudal neuro-
pore) to CS23 (approximately 56 dpc; the end of the
embryonic period, when all the major organs have devel-
oped). The OPT models are visualized and manipulated
using custom-designed software, MAPAINT, developed as
part of the Edinburgh Mouse Atlas Project (http://www.
emouseatlas.org).
The HUDSEN atlas and human spatial gene expression
database are delivered via the project website (http://
www.hudsen.org). The project aims to define within the 3D
models a number of subdivisions of the CNS, linked to a cor-
responding ontology based on the prosomeric model of the
vertebrate forebrain (Puelles & Rubenstein, 2003), a model
of transversal and longitudinal brain subdivisions developed
by comparing a large number of gene expression patterns
and correlated homologous anatomical landmarks across
different vertebrate species (Puelles et al. 2004, 2007; Ferran
et al. 2009; Pombal et al. 2009; Puelles – reference atlases
for the Allen Brain Atlas: Developing Mouse Brain project,
http://developingmouse.brain-map.org/; released March
2010).
Conventional in situ hybridization or immunohistochem-
ical experiments in human embryos generate series of 2D
section data with intricate gene expression patterns,
which can be difficult to conceptualize without a 3D con-
text. Planes of section can vary widely among specimens,
making interpretation even more problematic. Our OPT
models act as a 3D anatomical framework whereby data
from different experiments can be mapped into the same
space and later visualized in any section plane, greatly
facilitating the interpretation of the results. As an ongo-
ing process, 2D section data from immunohistochemistry
or in situ hybridization experiments are also mapped into
the models to generate entries in the spatial gene expres-
sion database. Data entry from other groups is encour-
aged. We will map all data to the same 3D reference
models which will enable direct comparisons of data for
multiple genes as well as for data generated by different
groups.
Methods
Embryo collection
Human embryonic and fetal tissues were obtained from the
MRC-Wellcome Trust Human Developmental Biology Resource
(http://www.hdbr.org; Lindsay & Copp, 2005), Institute of
Human Genetics, Newcastle University. The samples were col-
lected with appropriate maternal consents and ethical approval
by the Newcastle and North Tyneside Research Ethics Commit-
tee. Embryos were staged and fixed overnight in 4% parafor-
maldehyde at 4 �C before being stored in 70% ethanol prior to
OPT imaging or wax embedding and sectioning at 8 lm. Placen-
tal tissue was sampled for karyotype analysis prior to fixation of
the embryo tissue.
OPT
The 3-dimensional models were generated from intact,
unstained human embryos, using optical projection tomography
(OPT). Fixed specimens were rehydrated through a graded series
of ethanol and embedded in a block of 1% low melting point
agarose. The blocks were dehydrated and cleared, and the spec-
imens were rotated through 360�, as 400 images were captured
at 0.9� intervals. The signal corresponded to the weak autofluo-
rescence originating from the paraformaldehyde-fixed tissue,
and was detected using a wideband FITC filter with excitation
at 465–500 nm and emission at 515–560 nm. The 400 captured
images were then assembled into a voxel-volume that recreates
the 3D shape of the embryo, using modified tomography algo-
rithms (Sharpe et al. 2002).
Anatomical domain painting
The OPT models are visualized and manipulated using the cus-
tom-designed software, MAPAINT, developed as part of the Edin-
burgh Mouse Atlas Project (http://genex.hgu.mrc.ac.uk). The
software enables the user to select a digital section at any arbi-
trary angle and position through a model, and compare a
number of different planes simultaneously or in sequence.
Neuroanatomical regions were manually ‘painted’ and corrected
for accuracy using MAPAINT. For each boundary traced, the opti-
mal section plane for visualizing it was selected (usually perpen-
dicular to the boundary), and the initial painted domain was
checked and refined using orthogonal views, thus correcting its
3D shape.
ªª 2010 The AuthorsJournal of Anatomy ªª 2010 Anatomical Society of Great Britain and Ireland
The HUDSEN electronic atlas of the developing human brain, J. Kerwin et al.290
Immunohistochemistry
Sections were mounted two to a slide, and alternate one-in-10
slide series were stained with antibodies against PAX6 (PRB-
278P, Covance), GAD65 (ab49830, Abcam) and OLIG2 (AB9610,
Millipore), using standard techniques. The reaction was visual-
ized with diamino benzidine and the sections lightly counter-
stained with toluidine blue.
Gene expression mapping
Images of the stained sections were captured through a ·1.25
objective (as viewed down the microscope at 12.5· magnifica-
tion) using the Zeiss Axiovision system. Each image was cap-
tured at 1300 · 1030 pixels, at a resolution of 8.2 lm per pixel.
After capturing high quality low-power images of the experi-
mental data, the corresponding section plane and respective
positions were identified in the OPT model by an experienced
user. Using a modified warping interface in MAPAINT, correspon-
dences between the experimental and digital images were then
identified and manually defined. The experimental image was
then transformed to the shape of the digital section, and the
image transformation saved. The interface uses interactive thres-
holding to extract the expression signal from the experimental
image, and then applies the image transformation to map this
signal into the space of the 3D OPT model. This was done for
each of the experimental images in turn, generating a gene
expression domain. We report here examples of such material.
For the CS19 OLIG2 domain, five sections were mapped through
the forebrain of the CS19 representative model, and for CS22,
PAX6, GAD65 and OLIG2 the domain consisted of approximately
20 sections for each gene through the forebrain of the CS22
representative model.
Results
In the Ongoing Work sections below we describe the pro-
gress made to date with generating the components of the
HUDSEN Atlas and Human Spatial Gene Expression Data-
base. This includes work that has been completed but is not
yet web-accessible. The Current Status sections summarize
what is already publicly available (http://www.hudsen.org).
HUDSEN atlas
Current status
There are individual pages for each stage from CS12 to
CS23 which include stage definitions and movies of a num-
ber of OPT models. Using the reference OPT model for each
stage, there is also a viewer with standard sections in the
three orthogonal planes linked to a basic ontology. The
CNS has been defined in all the 3D models. The Atlas home
page also includes links to a table giving the criteria we use
for staging human embryos and a table comparing human
and mouse developmental stages. At present the user can-
not interact fully with the 3D models over the web. How-
ever, we provide the 3D models on CD ⁄ DVD in the Java
Atlas Viewer (Feng et al. 2005), including the detailed ana-
tomical domains where these are available (currently CS17,
CS19 and CS22). A link to a request form is given on the
Atlas home page. The detailed anatomical domains are not
yet available online but will be once the WlzIIP viewer (Husz
et al. 2009 and see below) is brought into the site.
Ongoing work
Defining anatomical domains. The authors (L.P., P.M.
and J.S.) defined the boundaries and position of individual
domains in the human models on the basis of identifiable
morphological features (CS17, CS19 and CS22). Morphologi-
cal landmarks and features visible in the human models
were used to guide the painting of individual 2D digital sec-
tions. Features of the brain midline, surface and nerve roots
were particularly useful. These paintings were later incre-
mentally built up into a 3D domain whose 3D shape was
corrected by viewing all the component 2D sections in
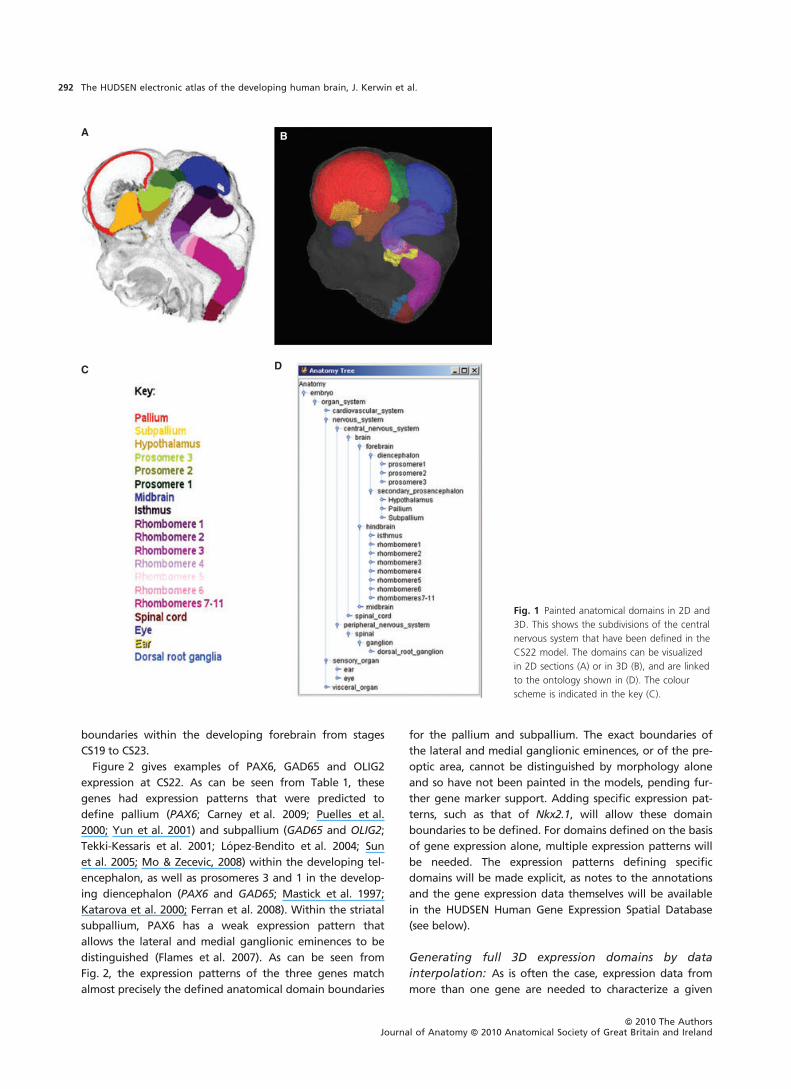
other, usually orthogonal, planes. Figure 1 shows the subdi-
visions of the central nervous system that have been
defined so far in the CS22 model. The domains can be visu-
alized in 2D sections (Fig. 1A) or in 3D (Fig. 1B), and are
linked to the ontology shown in Fig. 1D. A movie of the
painted CS22 model is available in the Supporting Informa-
tion Movie S1.
The neural-tube developmental ontology (Puelles –
ontology developed for the Allen Developmental Brain
Atlas, http://developingmouse.brain-map.org/; release
March 2010; see also Ng et al. 2009) is a single conceptual
framework applicable for all stages of development from
early neural plate stages (level 0) through to the adult
(levels 12 ⁄ 13). It proceeds by progressive subdivision of
early parts, first anteroposterior planar regions in the neu-
roepithelium (brain vesicles and segments – levels 1–3),
then dorsoventral planar regions (alar, basal, roof and
floor plates – levels 4, 5) and finer planar subdivisions
where required (levels 6–8), and, finally, primary radial
subdivisions (ventricular and mantle layers; immature man-
tle strata – levels 9, 10) and definitive nuclei, eventually
with internal subdivisions (levels 11–13). To date, the HUD-
SEN models of human development have been painted up
to level 3 of this ontology (segments; see Fig. 1). The neu-
ral-tube developmental ontology will be brought into the
atlas and delivered using the WlzIIP server technology
(Husz et al. 2009) which allows the user to view arbitrary
sections through the embryo models in conjunction with
selectable anatomical regions.
Generating gene expression data to refine and test
the anatomical domains. Usually, anatomical domains
can be defined to a much higher resolution if gene expres-
sion data are also available (as was the case for the Allen
Brain Atlas: Developing Mouse Brain project). Given the
more limited availability of human tissue, a restricted set of
genes (Table 1) was chosen to help define the major
ªª 2010 The AuthorsJournal of Anatomy ªª 2010 Anatomical Society of Great Britain and Ireland
The HUDSEN electronic atlas of the developing human brain, J. Kerwin et al. 291
boundaries within the developing forebrain from stages
CS19 to CS23.
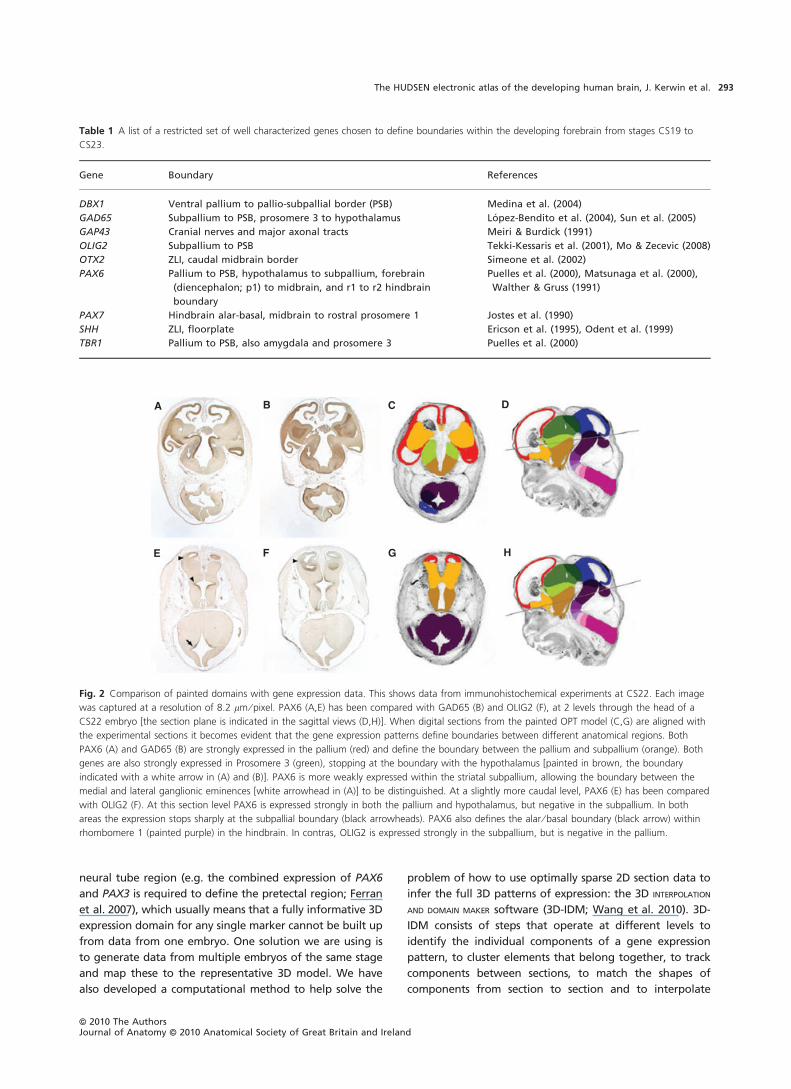
Figure 2 gives examples of PAX6, GAD65 and OLIG2
expression at CS22. As can be seen from Table 1, these
genes had expression patterns that were predicted to
define pallium (PAX6; Carney et al. 2009; Puelles et al.
2000; Yun et al. 2001) and subpallium (GAD65 and OLIG2;
Tekki-Kessaris et al. 2001; Lopez-Bendito et al. 2004; Sun
et al. 2005; Mo & Zecevic, 2008) within the developing tel-
encephalon, as well as prosomeres 3 and 1 in the develop-
ing diencephalon (PAX6 and GAD65; Mastick et al. 1997;
Katarova et al. 2000; Ferran et al. 2008). Within the striatal
subpallium, PAX6 has a weak expression pattern that
allows the lateral and medial ganglionic eminences to be
distinguished (Flames et al. 2007). As can be seen from
Fig. 2, the expression patterns of the three genes match
almost precisely the defined anatomical domain boundaries
for the pallium and subpallium. The exact boundaries of
the lateral and medial ganglionic eminences, or of the pre-
optic area, cannot be distinguished by morphology alone
and so have not been painted in the models, pending fur-
ther gene marker support. Adding specific expression pat-
terns, such as that of Nkx2.1, will allow these domain
boundaries to be defined. For domains defined on the basis
of gene expression alone, multiple expression patterns will
be needed. The expression patterns defining specific
domains will be made explicit, as notes to the annotations
and the gene expression data themselves will be available
in the HUDSEN Human Gene Expression Spatial Database
(see below).
Generating full 3D expression domains by data
interpolation: As is often the case, expression data from
more than one gene are needed to characterize a given
A
C D
B
Fig. 1 Painted anatomical domains in 2D and
3D. This shows the subdivisions of the central
nervous system that have been defined in the
CS22 model. The domains can be visualized
in 2D sections (A) or in 3D (B), and are linked
to the ontology shown in (D). The colour
scheme is indicated in the key (C).
ªª 2010 The AuthorsJournal of Anatomy ªª 2010 Anatomical Society of Great Britain and Ireland
The HUDSEN electronic atlas of the developing human brain, J. Kerwin et al.292
neural tube region (e.g. the combined expression of PAX6
and PAX3 is required to define the pretectal region; Ferran
et al. 2007), which usually means that a fully informative 3D
expression domain for any single marker cannot be built up
from data from one embryo. One solution we are using is
to generate data from multiple embryos of the same stage
and map these to the representative 3D model. We have
also developed a computational method to help solve the
problem of how to use optimally sparse 2D section data to
infer the full 3D patterns of expression: the 3D INTERPOLATION
AND DOMAIN MAKER software (3D-IDM; Wang et al. 2010). 3D-
IDM consists of steps that operate at different levels to
identify the individual components of a gene expression
pattern, to cluster elements that belong together, to track
components between sections, to match the shapes of
components from section to section and to interpolate
A B C
G H
D
FE
Fig. 2 Comparison of painted domains with gene expression data. This shows data from immunohistochemical experiments at CS22. Each image
was captured at a resolution of 8.2 lm ⁄ pixel. PAX6 (A,E) has been compared with GAD65 (B) and OLIG2 (F), at 2 levels through the head of a
CS22 embryo [the section plane is indicated in the sagittal views (D,H)]. When digital sections from the painted OPT model (C,G) are aligned with
the experimental sections it becomes evident that the gene expression patterns define boundaries between different anatomical regions. Both
PAX6 (A) and GAD65 (B) are strongly expressed in the pallium (red) and define the boundary between the pallium and subpallium (orange). Both
genes are also strongly expressed in Prosomere 3 (green), stopping at the boundary with the hypothalamus [painted in brown, the boundary
indicated with a white arrow in (A) and (B)]. PAX6 is more weakly expressed within the striatal subpallium, allowing the boundary between the
medial and lateral ganglionic eminences [white arrowhead in (A)] to be distinguished. At a slightly more caudal level, PAX6 (E) has been compared
with OLIG2 (F). At this section level PAX6 is expressed strongly in both the pallium and hypothalamus, but negative in the subpallium. In both
areas the expression stops sharply at the subpallial boundary (black arrowheads). PAX6 also defines the alar ⁄ basal boundary (black arrow) within
rhombomere 1 (painted purple) in the hindbrain. In contras, OLIG2 is expressed strongly in the subpallium, but is negative in the pallium.
Table 1 A list of a restricted set of well characterized genes chosen to define boundaries within the developing forebrain from stages CS19 to
CS23.
Gene Boundary References
DBX1 Ventral pallium to pallio-subpallial border (PSB) Medina et al. (2004)
GAD65 Subpallium to PSB, prosomere 3 to hypothalamus Lopez-Bendito et al. (2004), Sun et al. (2005)
GAP43 Cranial nerves and major axonal tracts Meiri & Burdick (1991)
OLIG2 Subpallium to PSB Tekki-Kessaris et al. (2001), Mo & Zecevic (2008)
OTX2 ZLI, caudal midbrain border Simeone et al. (2002)
PAX6 Pallium to PSB, hypothalamus to subpallium, forebrain
(diencephalon; p1) to midbrain, and r1 to r2 hindbrain
boundary
Puelles et al. (2000), Matsunaga et al. (2000),
Walther & Gruss (1991)
PAX7 Hindbrain alar-basal, midbrain to rostral prosomere 1 Jostes et al. (1990)
SHH ZLI, floorplate Ericson et al. (1995), Odent et al. (1999)
TBR1 Pallium to PSB, also amygdala and prosomere 3 Puelles et al. (2000)
ªª 2010 The AuthorsJournal of Anatomy ªª 2010 Anatomical Society of Great Britain and Ireland
The HUDSEN electronic atlas of the developing human brain, J. Kerwin et al. 293
expression patterns on ‘in between’ sections. A set of algo-
rithms carries out the clustering, tracking, shape matching
and interpolating automatically, and a graphical user inter-
face (GUI) is provided to guide and ⁄ or correct the results
generated by the automated algorithms in each step.
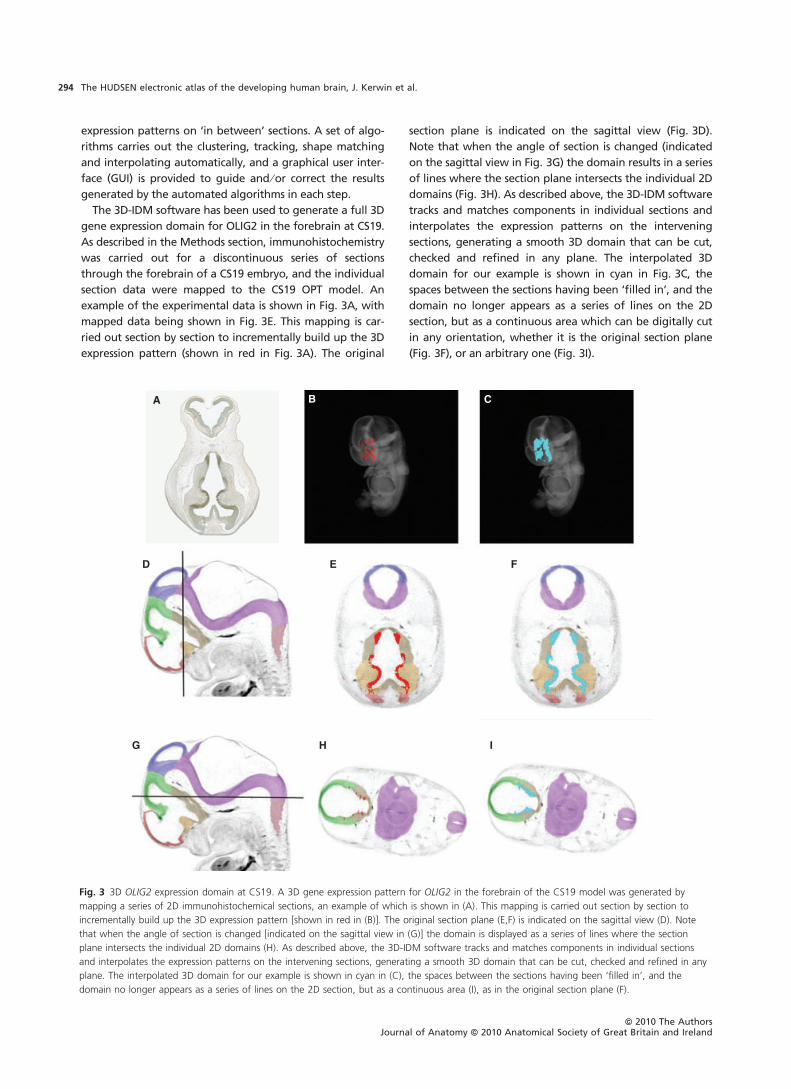
The 3D-IDM software has been used to generate a full 3D
gene expression domain for OLIG2 in the forebrain at CS19.
As described in the Methods section, immunohistochemistry
was carried out for a discontinuous series of sections
through the forebrain of a CS19 embryo, and the individual
section data were mapped to the CS19 OPT model. An
example of the experimental data is shown in Fig. 3A, with
mapped data being shown in Fig. 3E. This mapping is car-
ried out section by section to incrementally build up the 3D
expression pattern (shown in red in Fig. 3A). The original
section plane is indicated on the sagittal view (Fig. 3D).
Note that when the angle of section is changed (indicated
on the sagittal view in Fig. 3G) the domain results in a series
of lines where the section plane intersects the individual 2D
domains (Fig. 3H). As described above, the 3D-IDM software
tracks and matches components in individual sections and
interpolates the expression patterns on the intervening
sections, generating a smooth 3D domain that can be cut,
checked and refined in any plane. The interpolated 3D
domain for our example is shown in cyan in Fig. 3C, the
spaces between the sections having been ‘filled in’, and the
domain no longer appears as a series of lines on the 2D
section, but as a continuous area which can be digitally cut
in any orientation, whether it is the original section plane
(Fig. 3F), or an arbitrary one (Fig. 3I).
A
D E F
G H I
B C
Fig. 3 3D OLIG2 expression domain at CS19. A 3D gene expression pattern for OLIG2 in the forebrain of the CS19 model was generated by
mapping a series of 2D immunohistochemical sections, an example of which is shown in (A). This mapping is carried out section by section to
incrementally build up the 3D expression pattern [shown in red in (B)]. The original section plane (E,F) is indicated on the sagittal view (D). Note
that when the angle of section is changed [indicated on the sagittal view in (G)] the domain is displayed as a series of lines where the section
plane intersects the individual 2D domains (H). As described above, the 3D-IDM software tracks and matches components in individual sections
and interpolates the expression patterns on the intervening sections, generating a smooth 3D domain that can be cut, checked and refined in any
plane. The interpolated 3D domain for our example is shown in cyan in (C), the spaces between the sections having been ‘filled in’, and the
domain no longer appears as a series of lines on the 2D section, but as a continuous area (I), as in the original section plane (F).
ªª 2010 The AuthorsJournal of Anatomy ªª 2010 Anatomical Society of Great Britain and Ireland
The HUDSEN electronic atlas of the developing human brain, J. Kerwin et al.294
HUDSEN human gene expression spatial database
Current status
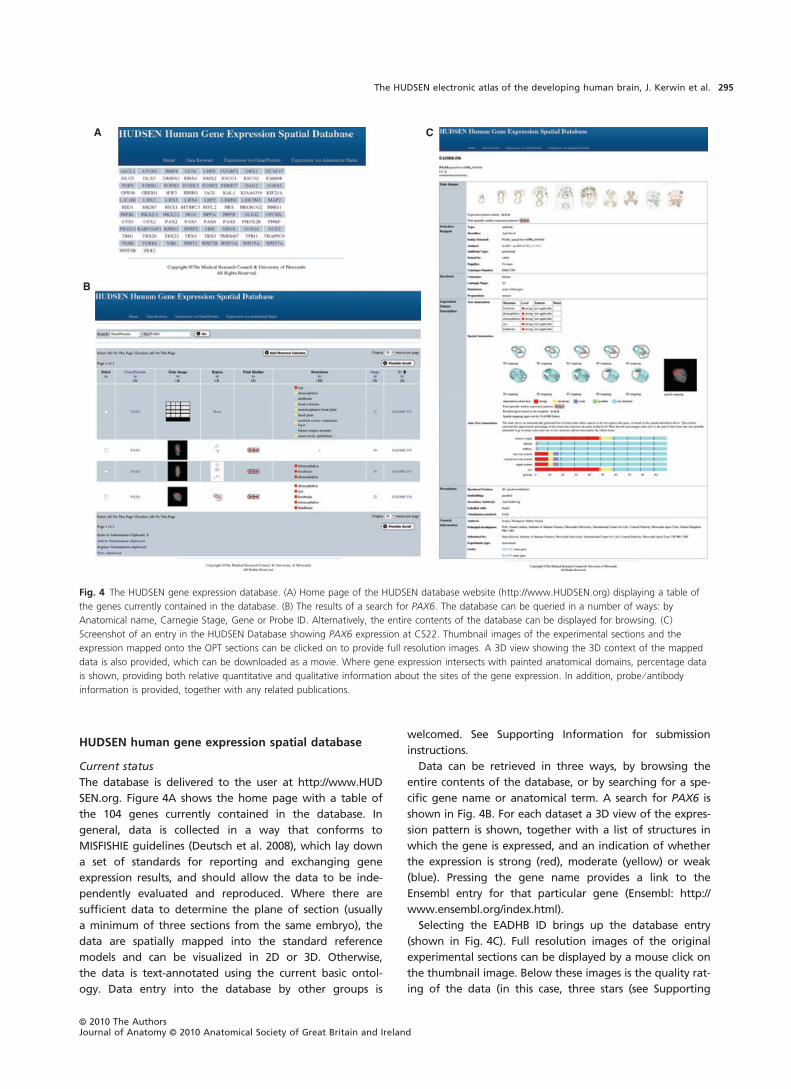
The database is delivered to the user at http://www.HUD
SEN.org. Figure 4A shows the home page with a table of
the 104 genes currently contained in the database. In
general, data is collected in a way that conforms to
MISFISHIE guidelines (Deutsch et al. 2008), which lay down
a set of standards for reporting and exchanging gene
expression results, and should allow the data to be inde-
pendently evaluated and reproduced. Where there are
sufficient data to determine the plane of section (usually
a minimum of three sections from the same embryo), the
data are spatially mapped into the standard reference
models and can be visualized in 2D or 3D. Otherwise,
the data is text-annotated using the current basic ontol-
ogy. Data entry into the database by other groups is
welcomed. See Supporting Information for submission
instructions.
Data can be retrieved in three ways, by browsing the
entire contents of the database, or by searching for a spe-
cific gene name or anatomical term. A search for PAX6 is
shown in Fig. 4B. For each dataset a 3D view of the expres-
sion pattern is shown, together with a list of structures in
which the gene is expressed, and an indication of whether
the expression is strong (red), moderate (yellow) or weak
(blue). Pressing the gene name provides a link to the
Ensembl entry for that particular gene (Ensembl: http://
www.ensembl.org/index.html).
Selecting the EADHB ID brings up the database entry
(shown in Fig. 4C). Full resolution images of the original
experimental sections can be displayed by a mouse click on
the thumbnail image. Below these images is the quality rat-
ing of the data (in this case, three stars (see Supporting
A
B
C
Fig. 4 The HUDSEN gene expression database. (A) Home page of the HUDSEN database website (http://www.HUDSEN.org) displaying a table of
the genes currently contained in the database. (B) The results of a search for PAX6. The database can be queried in a number of ways: by
Anatomical name, Carnegie Stage, Gene or Probe ID. Alternatively, the entire contents of the database can be displayed for browsing. (C)
Screenshot of an entry in the HUDSEN Database showing PAX6 expression at CS22. Thumbnail images of the experimental sections and the
expression mapped onto the OPT sections can be clicked on to provide full resolution images. A 3D view showing the 3D context of the mapped
data is also provided, which can be downloaded as a movie. Where gene expression intersects with painted anatomical domains, percentage data
is shown, providing both relative quantitative and qualitative information about the sites of the gene expression. In addition, probe ⁄ antibody
information is provided, together with any related publications.
ªª 2010 The AuthorsJournal of Anatomy ªª 2010 Anatomical Society of Great Britain and Ireland
The HUDSEN electronic atlas of the developing human brain, J. Kerwin et al. 295
Information Data S1 for Editorial Policy and guide to creat-
ing database entries). Details of the detection reagent (anti-
body supplier or accession number and nucleotide
sequence of probes) are given in the next panel. The gene
expression is described in a number of ways: where the sites
of expression have been manually annotated, a table of
structures is generated showing the level of intensity
(strong, moderate, weak, possible expression or not
detected). For patterns that have been spatially mapped,
images of the individual 2D OPT sections are displayed with
an image of the 3D context of the mapped data, which can
be downloaded as a movie. As each reference model is
linked to the ontology, where gene expression intersects
painted anatomical domains, percentage data are shown,
providing both relative quantitative and qualitative infor-
mation about the sites where gene signal is present. In
addition, any relevant publications are provided, together
with links to the same gene in other databases [The Edin-
burgh Mouse Atlas of Gene Expression (EMAGE) http://
www.emouseatlas.org/emage/, BioGPS; http://biogps.gnf.
org and Allen Brain Atlas; http://www.brain-map.org/].
Once a gene expression pattern has been chosen, it is
possible to search for gene expression patterns that are spa-
tially similar to that entry by pressing the ‘find similar’ icon.
This creates a list of entries showing the genes that have
been spatially mapped to the same structures in the same
representative model.
Ongoing work
There is an ongoing effort to add gene expression data,
generated both in-house and from other groups (either
submitted directly or via their publications). Data sets for
the genes in Table 1 are being generated for stages
CS19–CS23 with additional data for five of the nine genes
being generated for stages CS14–CS18. All these data sets
will be uploaded to the database along with notes indi-
cating the boundaries and ⁄ or regions that they have
been used to define. These notes will link to the same
domains in the corresponding reference model in the
Atlas. As is the case for all the entries, the original section
images as well as the thresholded and mapped data will
be present, so that database users will be able to judge
both the data and their interpretations for themselves.
The Puelles neural tube developmental ontology will also
be brought into the database and used for text-based
mapping of data. This will enable more detailed text-
based querying of the database. Similarly, as more
domains are defined and painted on the reference mod-
els they will be used for spatial mapping of the expres-
sion data. Again, this will mean more detailed spatial
queries are possible.
Relationships from one developmental stage to another
will also be made via the developmental ontology and
linked painted domains. Eventually, 4D analysis of gene
expression patterns will be possible, for example by identi-
fying data entries for the same ontology entity across all
stages included in HUDSEN.
Future plans
The main goal is to integrate the atlas and gene expression
database more closely and to enable the user to view and
manipulate data interactively in 3D. The user, for example,
would be able simultaneously to view one or more gene
expression patterns and all of the painted anatomical
domains within the same 3D OPT model. The Wlz IIP viewer
already allows the 3D models to be viewed and manipu-
lated interactively over the web and a prototype portal has
been designed that holds anatomical domains as well as
other types of educational material (for information see
The HUDSEN Electronic atlas of the developing human
brain and human spatial gene expression database http://
www.hudsen.org/next-generation-embryology/). There are
significant technical and conceptual challenges to deliver-
ing 3D gene expression data while preserving the structure
and metadata within the gene expression database. We will
start by generating and delivering 3D expression domains
for the marker genes in Table 1.
Discussion
In the HUDSEN Atlas, anatomical domains are structured
within the single conceptual framework of the neural-tube
developmental ontology, developed by one of the authors
(L.P.) for the Allen Developmental Brain Atlas. For a spatial
atlas, such as the HUDSEN atlas, the key mechanism for link-
ing spatial and anatomical information is to define the ana-
tomical domains (by ‘painting’ them) within the 3D
representative models.
The authors (L.P., P.M. and J.S.) defined the boundaries
and position of individual domains in the human models on
the basis of identifiable morphological features and land-
marks that were visible in the human models (e.g. anatomic
accidents of the midline of the brain; ventricular relief;
nerve roots; commissures and decussations; other character-
istic fibre tracts; choroidal or glandular specializations; char-
acteristic bulges and constrictions of the neural tube wall).
Useful images for comparison were found in classic human
neuroembryology atlases, e.g. Hochstetter (1919, 1923,
1929) and Lemire et al. (1975), plus the recent developmen-
tal human brain atlases of O’Rahilly & Muller (2005) and
Bayer & Altman (2005, 2006, 2008), even though different
interpretive models were used and discrepancies exist on
various specific points.
Gene expression data can be used to confirm and refine
the painted domains. However, we took the decision that
modifications to painted domains should be made on the
basis of reproducible discrepancies between the expression
patterns for at least two genes and the painted domain. To
date, we have only defined domains at the first anteropos-
terior planar regions in the neuroepithelium (brain vesicles
ªª 2010 The AuthorsJournal of Anatomy ªª 2010 Anatomical Society of Great Britain and Ireland
The HUDSEN electronic atlas of the developing human brain, J. Kerwin et al.296
and segments: levels 1–3; see http://developingmouse.brain-
map.org/; released March 2010 and Ng et al. 2009) at CS17,
CS19 and CS22. For each of these stages only those domains
for which there is sufficient morphological information
within the corresponding 3D OPT models have been
defined. For example, the extent of prosomere 1 in the alar
plate is given by the posterior commissure, while in the
basal plate it is approximated by the oculomotor nerve root
caudally and the fasciculus retroflexus (habenulo-interpe-
duncular tract) rostrally (Verney et al. 2001).
The genes chosen to confirm these domains (Table 1)
are well-characterized and show consistent expression pat-
terns across several vertebrate species so it is perhaps not
surprising that their expression patterns match closely the
relevant painted domains. Further subdivisions may have
to rely more heavily on gene expression data and for these
it will be important to define domains based on the
expression patterns of at least two, and ideally more,
genes. Also, genes are often expressed more widely ini-
tially and it is as their pattern becomes restricted after
closure of the neural tube that they progressively define
boundaries between anatomical regions. This will limit the
number of subdivisions that can be painted at earlier
developmental stages. It will also be important that all the
gene expression data are available for other researchers to
review independently.
Using the OPT models as a standard framework enables
gene expression patterns to be compared within the same
3D space for each developmental stage in the atlas and
database (CS12–CS23). This has the advantage that results
from different experiments or even different research
groups can be directly compared. Warping expression data
for the same gene from multiple samples into the same 3D
space will enable the consistent aspects of its expression pat-
tern to be reproducibly defined. Small differences between
experiments and ⁄ or samples are likely to be lost as data are
warped to a representative space, which will help to over-
come the problem of biological variation. Furthermore,
mapping the data to representative 3D models allows the
data to be processed by automatic methods, e.g. for pattern
recognition, or cluster analysis (Venkataraman et al. 2008).
The atlas and gene expression database are linked
through the anatomical ontology and defined painted
domains in the same set of reference models. Accurate
annotation and sufficient sampling of the gene expression
patterns is important both for the effective searching and
retrieval of information from the database, and for the ease
of interpretation of the results, particularly for non-expert
users. Anatomical annotation is done in two ways. First,
manual text annotation which allows the database to be
queried by text-based searches and is advantageous for
those structures which have not yet been painted, or to
describe gene expression in subdivisions of a structure that
are not morphologically visible in the OPT models. Sec-
ondly, where a gene expression pattern overlaps a painted
anatomical domain, the annotation is automatically gener-
ated according to the ontology. This automatic method of
generating annotation has the benefit that in future the
painted domains could be linked to one or more ontolo-
gies. This is an option which would be valuable for struc-
tures where the boundaries are poorly defined or disputed.
The user could check alternative morphologic interpreta-
tions, or simply visualize correspondences between variously
complex ontologies. The consistency of expression patterns
observed across many vertebrate species suggests that there
is a fundamental conservation of the genomic control of
early patterning and histogenetic brain development across
all vertebrates. As evidence accumulates, this may mean
that our developmental neuroanatomic ontology will not
only serve for comparing human and rodent brains
(HUDSEN and Allen Mouse Atlases), but actually represent a
conceptual framework able to inter-relate all sorts of com-
parative neuroanatomic data (other mammals, sauropsids,
amphibia, fishes).
A recent review of developmental gene expression atlases
(de Boer et al. 2009) concluded that an ‘ideal’ atlas should
be based on a series of 3D reference models, anatomically
annotated using a high resolution ontology. The HUDSEN
Atlas aims to attain this ideal: although not yet fully anno-
tated to a high resolution, it does provide a unique 3D spa-
tial anatomical framework associated to a flexible
developmental ontology for studying and understanding
gene expression in early human prenatal development.
Acknowledgements
The project is funded by the US National Institutes of Health
(grant: 5RO1MH070370), EU FP6 Research Infrastructure Action
‘Structuring the European Research Area’ Programme (Contract
number 011993), the Spanish Ministry of Science and Innovation
grant BFU2008-04156 and SENECA Foundation contract
04548 ⁄ GERM ⁄ 06-10891. The human tissue was provided by the
Joint MRC-Wellcome Human Developmental Biology Resource
(http://www.hdbr.org) IHG, Newcastle upon Tyne.
References
Baldock RA, Bard JB, Burger A, et al. (2003) EMAP and EMAGE:
a framework for understanding spatially organized data.
Neuroinformatics 1, 309–325.
Bayer S, Altman J (2005) Atlas of Human Central Nervous
System Development. Vol. 3. The Human Brain during the
Second Trimester. Boca Raton: CRC Press.
Bayer S, Altman J (2006) Atlas of Human Central Nervous
System Development. Vol.4. The Human Brain during the Late
First Trimester. Boca Raton: CRC Press.
Bayer S, Altman J (2008) Atlas of Human Central Nervous
System Development. Vol.5. The Human Brain during the
Early First Trimester. Boca Raton: CRC Press.
de Boer BA, Ruijter JM, Voorbraak FP, et al. (2009) More than a
decade of developmental gene expression atlases: where are
we now? Nucleic Acids Res 37, 7349–7359.
ªª 2010 The AuthorsJournal of Anatomy ªª 2010 Anatomical Society of Great Britain and Ireland
The HUDSEN electronic atlas of the developing human brain, J. Kerwin et al. 297
Bowes JB, Snyder KA, Segerdell E, et al. (2010) Xenbase: gene
expression and improved integration. Nucleic Acids Res.
38(Database issue):D607–D612.
Carney RS, Cocas LA, Hirata T, et al. (2009) Differential
regulation of telencephalic pallial-subpallial boundary
patterning by Pax6 and Gsh2. Cereb Cortex 19, 745–759.
Deutsch EW, Ball CA, Berman JJ, et al. (2008) Minimum
information specification for in situ hybridization and
immune-histochemistry experiments (MISFISHIE). Nat
Biotechnol, 26, 305–312.
Ericson J, Muhr J, Jessell TM, et al. (1995) Sonic hedgehog: a
common signal for ventral patterning along the rostrocaudal
axis of the neural tube. Int J Dev Neurosci 39, 809–816.
Feng G, Burton N, Hill B, et al. (2005) JAtlas view: a java atlas-
viewer for browsing biomedical 3D images and atlases. BMC
Bioinformatics 6, 47.
Ferran JL, Sanchez-Arrones L, Sandoval JE, et al. (2007) A model
of early molecular regionalization in the chicken pretectum.
J Comp Neurol 505, 379–403.
Ferran JL, Sanchez-Arrones L, Bardet SM, et al. (2008) Early
pretectal gene expression pattern shows a conserved
anteroposterior tripartition in mouse and chicken. Brain Res
Bull 75, 295–298.
Ferran JL, de Oliveira ED, Merchan P, et al. (2009)
Genoarchitectonic profile of developing nuclear groups in the
chicken pretectum.J Comp Neurol 517, 405–451.
Flames N, Pla R, Gelman DM, et al. (2007) Delineation of
multiple subpallial progenitor domains by the combinatorial
expression of transcriptional codes. J Neurosci 27, 9682–9695.
Harris TW, Antoshechkin I, Bieri T, et al. (2010) WormBase: a
comprehensive resource for nematode research. Nucleic Acids
Res 38 (Database issue):D463–D467.
Heintz N (2004) Gene expression nervous system atlas (GENSAT).
Nat Neurosci 7, 483.
Hochstetter F (1919) Beitrage zur Entwicklungsgeschichte des
menschlichen Gehirns. Teil I. Vienna: Deuticke.
Hochstetter F (1923) Beitrage zur Entwicklungsgeschichte des
menschlichen Gehirns. Teil II. 1. Lieferung. Die Entwicklung
der Zirbeldruse. Vienna: Deuticke.
Hochstetter F (1929) Beitrage zur Entwicklungsgeschichte des
menschlichen Gehirns. Teil II. 2. Lieferung. Die Entwicklung
des Mittel- und Rautenhirns. Vienna: Deuticke.
Husz ZL, Perry TP, Hill B, et al. (2009) Woolz IIP: a tiled on-the-
fly sectioning server for 3D volumetric atlases. 5th
International Symposium on Visual Computing, 2009. Lect
Notes Comput Sci 5875, 924–933.
Jostes B, Walther C, Gruss P (1990) The murine paired box gene,
Pax7, is expressed specifically during the development of the
nervous and muscular system. Mech Dev 33, 27–37.
Katarova Z, Sekerkova G, Prodan S, et al. (2000) Domain-
restricted expression of two glutamic acid decarboxylase genes
in midgestation mouse embryos. J Comp Neurol 424, 607–627.
Lecuyer E, Yoshida H, Parthasarathy N, et al. (2007) Global
analysis of mRNA localization reveals a prominent role in
organizing cellular architecture and function. Cell 131, 174–
187.
Lein ES, Hawrylycz MJ, Ao N, et al. (2007) Genome-wide atlas of
gene expression in the adult mouse brain. Nature 445, 168–
176.
Lemire RJ, Loeser JD, Leech RW, et al. (1975) Normal and
Abnormal Development of the Human Nervous System.
Hagerstown, MD: Harper&Row.
Lindsay S, Copp AJ (2005) MRC-Wellcome Trust Human
Developmental Biology Resource: enabling studies of human
developmental gene expression. Trends Genet 21, 586–590.
Lopez-Bendito G, Sturgess K, Erdelyi F, et al. (2004) Preferential
origin and layer destination of GAD65-GFP cortical
interneurons. Cereb Cortex 14, 1122–1133.
Mastick GS, Davis NM, Andrew GL, et al. (1997) Pax-6 functions
in boundary formation and axon guidance in the embryonic
mouse forebrain. Development 124, 1985–1997.
Matsunaga E, Araki I, Nakamura H (2000) Pax6 defines the
di-mesencephalic boundary by repressing En1 and Pax2.
Development 127, 2357–2365.
Medina L, Legaz I, Gonzalez G, et al. (2004) Expression of Dbx1,
Neurogenin 2, Semaphorin 5A, Cadherin 8, and Emx1
distinguish ventral and lateral pallial histogenetic divisions in
the developing mouse claustroamygdaloid complex. J Comp
Neurol 474, 504–523.
Meiri KF, Burdick D (1991) Nerve growth factor stimulation of
GAP-43 phosphorylation in intact isolated growth cones.
J Neurosci 11, 3156–3164.
Mo Z, Zecevic N (2008) Is Pax6 critical for neurogenesis in the
human fetal brain? Cereb Cortex 18, 1455–1465.
Ng L, Bernard A, Lau C, et al. (2009) An anatomic gene expression
atlas of the adult mouse brain. Nat Neurosci 12, 356–362.
Odent S, Atti-Bitach T, Blayau M, et al. (1999) Expression of the
Sonic hedgehog (SHH) gene during early human development
and phenotypic expression of new mutations causing
holoprosencephaly. Hum Mol Genet 8, 1683–1689.
O’Rahilly R, Muller F (2005) The Embryonic Human Brain, 3rd
edn. New York: Wiley.
Pombal MA, Megıas M, Bardet SM, et al. (2009) New and old
thoughts on the segmental organization of the forebrain in
lampreys. Brain Behav Evol 74, 7–19.
Puelles L, Rubenstein JL (2003) Forebrain gene expression domains
and the evolving prosomeric model. Trends Neurosci 26, 469–476.
Puelles L, Kuwana E, Puelles E, et al. (2000) Pallial and subpallial
derivatives in the embryonic chick and mouse telencephalon,
traced by the expression of the genes Dlx-2, Emx-1, Nkx-2.1,
Pax-6, and Tbr-1. J Comp Neurol 424, 409–438.
Puelles L, Martınez S, Martınez-de-la-Torre M, et al. (2004) Gene
maps and related histogenetic domains in the forebrain and
midbrain. In: The Rat Nervous System, 3rd edn (ed. Paxinos G),
pp. 3–25. San Diego: Academic Press.
Puelles L, Martınez-de-la-Torre M, Paxinos G, et al. (2007) The
Chick Brain in Stereotaxic Coordinates: an Atlas Featuring
Neuromeric Subdivisions and Mammalian Homologies. San
Diego: Elsevier ⁄ Academic Press.
Sharpe J, Ahlgren U, Perry P, et al. (2002) Optical projection
tomography as a tool for 3D microscopy and gene expression
studies. Science 296, 541–545.
Simeone A, Puelles E, Acampora D (2002) The Otx family. Curr
Opin Genet Dev 12, 409–415.
Sun Z, Wang HB, Laverghetta A, et al. (2005) The distribution
and cellular localization of glutamic acid decarboxylase-65
(GAD65) mRNA in the forebrain and midbrain of domestic
chick. J Chem Neuroanat 29, 265–281.
Tekki-Kessaris N, Woodruff R, Hall AC, et al. (2001) Hedgehog-
dependent oligodendrocyte lineage specification in the
telencephalon. Development 128, 2545–2554.
Venkataraman S, Stevenson P, Yang Y, et al. (2008) EMAGE –
Edinburgh Mouse Atlas of Gene Expression: 2008 update.
Nucleic Acids Res 36 (Database issue): D860–D865.
ªª 2010 The AuthorsJournal of Anatomy ªª 2010 Anatomical Society of Great Britain and Ireland
The HUDSEN electronic atlas of the developing human brain, J. Kerwin et al.298
Verbeek FJ, Lawson KA, Bard JBL (1999) Developmental
BioInformatics: linking genetic data to virtual embryos. Int J
Dev Biol 43, 761–771.
Verney C, Zecevic N, Puelles L (2001) Structure of longitudinal
brain zones that provide the origin for the substantia nigra
and ventral tegmental area in human embryos, as revealed by
cytoarchitecture and tyrosine hydroxylase, calretinin, calbindin,
and GABA immunoreactions. J Comp Neurol 429, 22–44.
Walther C, Gruss P (1991) Pax-6, a murine paired box gene, is
expressed in the developing CNS. Development 113, 1435–1449.
Wang X, Lindsay S, Baldock R (2010) From spatial-data to 3D
models of the developing human brain. Methods 50, 96–104.
Yun K, Potter S, Rubenstein JL (2001) Gsh2 and Pax6 play
complementary roles in dorsoventral patterning of the
mammalian telencephalon. Development 128, 193–205.
Supporting Information
Additional Supporting Information may be found in the online
version of this article:
Movie S1. A movie of the painted CS22 model. For the colour-
code, please refer to legend to Fig. 1C.
Data S1. Editorial policy and instructions for submitting data.
As a service to our authors and readers, this journal provides
supporting information supplied by the authors. Such materials
are peer-reviewed and may be re-organized for online delivery,
but are not copy-edited or typeset. Technical support issues aris-
ing from supporting information (other than missing files)
should be addressed to the authors.
ªª 2010 The AuthorsJournal of Anatomy ªª 2010 Anatomical Society of Great Britain and Ireland
The HUDSEN electronic atlas of the developing human brain, J. Kerwin et al. 299