The High Cost of Low Fertility in Europe
26
NBER WORKING PAPER SERIES THE COST OF LOW FERTILITY IN EUROPE David E. Bloom David Canning Günther Fink Jocelyn E. Finlay Working Paper 14820 http://www.nber.org/papers/w14820 NATIONAL BUREAU OF ECONOMIC RESEARCH 1050 Massachusetts Avenue Cambridge, MA 02138 March 2009 This paper was prepared for the International Conference on the Economic Consequences of Low Fertility, April 11 – 12 2008 at the University of St. Gallen Switzerland. We are grateful to three anonymous referees, and to Rainer Münz, and other participants in the Conference for their helpful comments. Support for this research was provided by grant number 5 P30 AG024409 from the National Institute on Aging, National Institutes of Health, and by a grant from the William and Flora Hewlett Foundation. The views expressed herein are those of the author(s) and do not necessarily reflect the views of the National Bureau of Economic Research. NBER working papers are circulated for discussion and comment purposes. They have not been peer- reviewed or been subject to the review by the NBER Board of Directors that accompanies official NBER publications. © 2009 by David E. Bloom, David Canning, Günther Fink, and Jocelyn E. Finlay. All rights reserved. Short sections of text, not to exceed two paragraphs, may be quoted without explicit permission provided that full credit, including © notice, is given to the source.
-
Upload
independent -
Category
Documents
-
view
1 -
download
0
Transcript of The High Cost of Low Fertility in Europe
NBER WORKING PAPER SERIES
THE COST OF LOW FERTILITY IN EUROPE
David E. BloomDavid CanningGünther Fink
Jocelyn E. Finlay
Working Paper 14820http://www.nber.org/papers/w14820
NATIONAL BUREAU OF ECONOMIC RESEARCH1050 Massachusetts Avenue
Cambridge, MA 02138March 2009
This paper was prepared for the International Conference on the Economic Consequences of LowFertility, April 11 – 12 2008 at the University of St. Gallen Switzerland. We are grateful to three anonymousreferees, and to Rainer Münz, and other participants in the Conference for their helpful comments.Support for this research was provided by grant number 5 P30 AG024409 from the National Instituteon Aging, National Institutes of Health, and by a grant from the William and Flora Hewlett Foundation.The views expressed herein are those of the author(s) and do not necessarily reflect the views of theNational Bureau of Economic Research.
NBER working papers are circulated for discussion and comment purposes. They have not been peer-reviewed or been subject to the review by the NBER Board of Directors that accompanies officialNBER publications.
© 2009 by David E. Bloom, David Canning, Günther Fink, and Jocelyn E. Finlay. All rights reserved.Short sections of text, not to exceed two paragraphs, may be quoted without explicit permission providedthat full credit, including © notice, is given to the source.

The Cost of Low Fertility in EuropeDavid E. Bloom, David Canning, Günther Fink, and Jocelyn E. FinlayNBER Working Paper No. 14820March 2009JEL No. J13,J21,O52
ABSTRACT
We analyze the effect of fertility on income per capita with a particular focus on the experience ofEurope. For European countries with below-replacement fertility, the cost of continued low fertilitywill only be observed in the long run. We show that in the short run, a fall in the fertility rate will lowerthe youth dependency ratio and increase the working-age share, thus raising income per capita. Inthe long run, however, the burden of old-age dependency dominates the youth dependency decline,and continued low fertility will lead to small working-age shares in the absence of large migrationinflows. We show that the currently very high working-age shares generated by the recent declinesin fertility and migration inflows are not sustainable, and that significant drops in the relative size ofthe working-age population should be expected. Without substantial adjustments in labor force participationor migration policies, the potential negative repercussions on the European economy are large.
David E. BloomHarvard School of Public HealthDepartment of Global Health and Population665 Huntington Ave.Boston, MA 02115and [email protected]
David CanningHarvard School of Public HealthDepartment of Global Health and Population665 Huntington Ave.Boston, MA [email protected]
Günther FinkHarvard School of Public HealthDepartment of Global Health and Population665 Huntington Ave.Boston, MA [email protected]
Jocelyn E. FinlayHarvard School of Public HealthDepartment of Global Health and Population22 Plympton StreetCambridge, MA [email protected]

1. Introduction
The impact of demographic change on economic development has long been debated.
Although the Malthusian hypothesis that population growth is constrained by available resources
held a central position for centuries, the simultaneous occurrence of economic growth and
population growth over long periods of time has demanded new models of the interplay between
these phenomena (Becker, Glaeser et al. 1999; Galor and Weil 1999; Galor and Weil 2000;
Galor 2005). Little consensus has been reached during the last 50 years on the effect of
population growth on economic growth. For example, Kelley and Schmidt (1995) find no
correlation between population growth and economic development in the 1960s and 1970s, yet
find evidence of a negative relationship emerging in the 1980s. This later relationship appears to
be even stronger when other demographic factors such as age structure are controlled for (Kelley
and Schmidt 2005).
The concept of “optimum population growth” is an old debate (Samuelson 1975;
Deardorff 1976; Samuelson 1976). Further debate over the effects of population pressure on
economic development remains fervent (Simon 1996; Ehrlich 2008). Ehrlich argues that
population pressure on natural resources and the environment is a contemporary issue that has
been ignored by policy makers. Simon takes an alternative view and stresses the benefits of the
technological progress that he argues is a natural concomitant of population growth. Larger
populations make innovation more likely, and moreover, increase the scope for technological
adoption. These assumptions are central in the more recent endogenous growth literature
focusing on research and development as main drivers of economic growth (Strulik 2005).
Early work by Bloom and Freeman and by others highlights the importance of analyzing
the effect on economic growth of the individual components of population growth: fertility and
mortality (Bloom and Freeman 1988; Kelley 1988; Brander and Dowrick 1994; Kelley and
Schmidt 1995; Kelley and Schmidt 2005). In this paper we highlight the fertility channel, and in
particular draw on the experience of European countries.

2
For many, but not all, countries in the world the decline in fertility in the last 45 years has
been rapid. The onset of a rapid fertility decline is a signal that a country is undergoing the
demographic transition from high fertility (and high mortality) to low fertility (and low
mortality). In Figure 1 we show the change in fertility that occurred between 1960 and 2000
relative to the initial fertility rate in 1960. Virtually all countries that had a fertility rate below 5.5
in 1960 experienced a decline in fertility2 – these countries are or have been undergoing the
demographic transition3. Countries that had a fertility rate above 5.5 in 1960 either experienced
rapid decline in fertility and thus are part of the demographic transition trajectory, or maintained
high fertility levels and remain today in a high-fertility and high-mortality state.
Figure 1: Change in total fertility rate 1960-2000
-6-4
-20
2C
hang
e in
tota
l fer
tility
rate
196
0-20
00
1 2 3 4 5 6 7 8 9Total fertility rate 1960
Source: World Bank (2007)
Source: World Bank (2007)
To highlight the change in fertility in Europe between 1960-2000 Figure 2 illustrates the
same relationship as in Figure 1 for the European countries.
2 Gabon is an exception to this pattern.
3 It should be noted that by 1960 most of the demographic transition had been completed in European countries.

3
Figure 2: Change in total fertility rate (TFR) 1960-2000 in Europe
-4-3
-2-1
0C
hang
e in
tota
l fer
tility
rate
196
0-20
00
1 2 3 4 5 6 7Total fertility rate 1960
Source: World Bank (2007)
In 1960, Estonia was the only European country to have a total fertility rate below two, at
1.96. Today all but two countries in Europe (Albania and Iceland) have a total fertility rate below
two. The reasons for the rapid decline in fertility in Europe, and its decline to “lowest of the low”
rates are varied (Lesthaeghe and Willems 1999; Kohler, Billari et al. 2002; Billari, Frejka et al.
2004; Billari and Kohler 2004; Aarssen 2005; Adsera 2006; Adsera 2006; Bjorklund 2006;
Coleman 2006; Kohler 2006; McDonald 2006; Feyrer 2007). Fertility decline in Europe is
thought to be due to socioeconomic incentives to delay childbearing, a decline in the desired
number of children, and institutional factors (labor market rigidities, lack of child care, changing
gender roles) (Bongaarts and Bulatao 1999; Kohler, Billari et al. 2002; Garrido and Malo 2005;
Kohler 2006). Eastern European societies have also undergone major economic, political and
social change.

4
Presently, Eastern and Western European countries share an important demographic
feature: below-replacement fertility. The economic consequences of below-replacement fertility
are not well understood. In this paper, we aim to analyze this relationship. We argue that while
declines in fertility generally induce positive economic outcomes in the short run, the same is not
necessarily true in the long run. In the long run, below-replacement fertility is likely to lead to
age structures that are sub-optimal with respect to their economic growth implications. The exact
magnitude of these effects depends on a host of demographic, social, and political factors. These
factors critically shape the long-term development of age structure as well as the interactions
between age structure and the economy.
The analysis in this paper naturally links to previous work on the “low fertility trap”
(Billari and Kohler 2004; Lutz and Skirbekk 2005; McDonald 2006). McDonald (2008) argues
that when fertility levels are below 1.5, it is difficult to raise fertility, due to changes in norms
(through socialization) and preferences regarding the number of children. Moreover, increased
opportunities for women in the workplace coupled with heightened consumerism, and the
demographic, mechanical effect of fewer women entering the childbearing age-group have
contributed to persistently low birth rates. Open for debate among these authors is the threshold
fertility rate at which countries enter the “trap” and how countries can escape the trap. Feyrer,
Sacerdote and Stern (2008) draw a more optimistic picture of general fertility trends, arguing that
fertility will go up again as countries adopt new social norms and facilitate the combination of
labor force participation and motherhood.
In this paper we do not model the dynamics of fertility directly, but rather explore the
long-term relationship between fertility levels and the relative size of the workforce. We thus
formalize and generalize the issues raised in the above literature, without making specific
assumptions regarding the long-term determinants of family size.
The rest of the paper is structured as follows: in section 2, we discuss the basic
mechanisms through which fertility affects economic growth and highlight the non-linear long-
run relationship between fertility and the working-age share. In section 3, we discuss recent
trends in fertility, migration and the working-age share in Western Europe and show that

5
working-age share has not fallen yet, despite fertility levels below replacement. We summarize
and discuss our results in section 4.
2. Theoretical Background
2.1 Overview
There are three theoretical channels through which fertility affects economic
development: population growth with fixed resources (the Malthusian theory), the Solow capital
stock effect, and the age structure effect. According to the Malthusian hypothesis, larger
populations imply lower resources per capita in the presence of a fixed factor (land is frequently
given as an example), and thus lower income per capita. A similar, yet slightly more subtle
mechanism is at play in the Solow growth model (Solow 1956) where capital stock is built up
through savings, and declines with depreciation. With constant returns to scale, population
growth works in the same way as capital depreciation and thus lowers steady-state income per
capita in the traditional Solow model.
The third link between fertility and economic growth, and the main focus of this paper, is
age structure. The age structure of a population follows from the historical sequence of fertility,
mortality, and net migration, and directly determines the relative size of the working-age
population. Since output is measured in per capita terms, the fact that labor force participation
rates vary by age means that the working-age share directly affects income per capita through the
number of workers per capita. A decline in fertility reduces the number of children, thus
unambiguously raising the working-age share and – as long as participation rates do not change –
increasing labor supply per capita in the short run (Bloom and Freeman 1986).
The same argument does not hold in the long run. As we show in further detail below,
persistently high fertility levels imply an age distribution strongly skewed towards the young
generations in steady-state. On the other hand, sustained low fertility levels like the ones
currently observed across Europe imply very large relative sizes for the old and economically
inactive cohorts in steady-state.

6
2.2 A Simple Model of Age Structure
The intuition for the basic mechanism linking fertility levels and age structure in the long run can
best be provided by a simple population model. Assume a stable population4 with three age
groups: the young, the middle age, and the old, where the size of the middle age group is
normalized to one. Assuming a male-female-ratio of one and a constant fertility rate f , we must
have 2f
people in the old age group,5 and 2f people in the young group as long as we also
assume that all individuals die at the end of the second period. In this setting, the age distribution
of the population in equilibrium is given by
2,1,2f
f⎫⎧
⎨ ⎬⎩ ⎭
. (1)
Assuming that only the middle age group works, the working-age share w of the population can
be defined as
2
1 22 2 41
2
fw f f ff
= =+ ++ +
(2)
This framework is similar to the models derived in Weil (1999) and Hock and Weil (2007), and
has intuitive properties. First, at replacement fertility,6 the working-age share is 1/3. Second,
deviations from replacement rate fertility unambiguously lead to a decline in the working-age
share. For high fertility levels, the first term in the denominator (2f ) becomes large; this is the
typical developing country scenario with high youth dependency and very low old-age
dependency ratios. With fertility levels below replacement, the last term in the denominator
2f
⎛ ⎞⎜ ⎟⎝ ⎠
becomes large, capturing the burden of very large old cohorts relative to the size of the
4 A stable population refers to a population that has constant age-specific fertility and mortality rates, which, in the absence of migration, implies a constant age structure and constant population growth. 5 The total number of births is the age-group-specific population times f/2. Thus, to get a birth cohort size of 1, we need a “parent cohort” population of 2/f. 6 In the case with zero mortality before old age, replacement fertility equals 2.

7
working-age cohorts. Figure 3 illustrates the theoretical relationship between stable population
fertility levels and working-age shares expressed in equation (2).
Figure 3: Theoretical long-run relationship between stable population working-age shares and fertility
0.15
0.20
0.25
0.30
0.35
0.5 1 1.5 2 2.5 3 3.5 4 4.5 5
Total fertility rate
Wor
king
age
shar
e
The basic mechanism outlined in our simple model has ignored two important influences on the
age structure: mortality and migration. Incorporating mortality in the basic framework is
relatively easy: high mortality rates have two principal effects: first, they lower the number of
females reaching age 45 and thus giving birth, as well as the number of children surviving early
childhood. As a result, the relative size of the young cohorts associated with a given total fertility
rate declines.

8
The second mortality effect comes through aging. Let us define σ as the fraction of
people that survives to old age, i.e. does not die at the end of period two7. Then one can rewrite
equation (2) as
2
1 22 2 41
2
fw f f ff
σσ= =
+ ++ + (3)
with 1σ ≤ . Lower old age survival implies a lower old-age dependency ratio and thus a higher
working-age share. Solving for the fertility rate that maximizes working-age share in steady-state,
we get the following first-order condition
( )
2
22
2 8 02 4
w ff f f
σ
σ
∂ − += =
∂ + +, (4)
The working-age share maximizing steady-state fertility rate f* is thus given by * 2f σ= (5) If 1σ = , a total fertility rate f=2 is the unique solution8. The lower the old-age survival, the
lower the working-age-share maximizing fertility rate.9 This result is intuitive. If 1σ < , the
relative weight of the old is strictly smaller than the relative weight generated by the young, so
that the working-age-share maximizing fertility rate is strictly below 2.
To further illustrate this point, we simulate stable population outcomes for representative
survival schedules for populations at different stages of development. Rather than assuming three
broad age groups, we calculate the stock of each age group based on a given fertility and
mortality schedule where the working age covers the ages 15-64. For each mortality/fertility
7 In this stylized framework, we assume for analytical simplicity that agents die either at the end of the second or the end of the third period. One can, however, interpret σ as the average fraction of people from the previous cohort still alive over the last period of life, in which case death could occur any time during the last period of life. 8 We restrict the domain of our analysis to the set of positive real numbers. 9 As this fertility rate can be above or below the replacement fertility rate, the working-age-share maximizing stable population fertility rate parameter will lead to positive, zero, or negative population growth. Thus we cannot assert that the fertility rate that maximizes the working-age share is the “optimal” fertility rate – the population growth consequences may impose a negative effect on economic growth.

9
schedule, we run the simulations until a stable population distribution is reached10. The resulting
working-age shares are summarized in Figure 4 below. The graph illustrates the relationship
between fertility and working-age share in the long run, i.e. in a stable population framework.
Figures 3 and 4 show that a decrease in fertility rate below the WAS-maximizing level
leads, in the long run, to a lower working-age share. The short-run transitional dynamics look
quite different, since any reduction in fertility will mechanically decrease the youth dependency
ratio in the near term as discussed in Weil (1999). The figures thus compare steady states, and do
not illustrate short-run dynamics.
Figure 4: Stable population distribution relationship between fertility and working-age share under different life expectancy scenarios
0%
10%
20%
30%
40%
50%
60%
70%
80%
0 1 2 3 4 5 6 7 8 9
Total fertility rate
Wor
king
age
shar
e
Life expectancy 40 years (Historical Life Tables)Life expectancy 40 years (Zambia 2005)Life expectancy 60 years (Yemen 2005)Life expectancy 80 years (France 2005)
Figure 4 shows the relationship between fertility and working-age shares for different life
tables (World Health Organization). The figure shows that the basic inverse U-shape relationship
10 We initiate the simulation with a flat age structure, and then impose constant age-specific fertility and mortality rates to impute the stock of each age group in each period. It takes up to 200 simulated periods for age structure to converge to a stable population distribution. In Figure 4 we show the resulting stable population working-age share for three examples of mortality schedules and fertility rates between zero and ten.

10
between fertility and working-age shares outlined in equations (2) and (3) persists, independent
of the mortality schedule applied.
Figure 4 also highlights the differential impact of life expectancies at different levels of
fertility. Although life expectancy has very limited effects at very high fertility levels, high levels
of old-age survival significantly lower the working-age share for low rates of fertility. As
revealed by equation (5), the fertility rate that maximizes the working-age share depends on the
relative size of the old cohorts. In France, with a life expectancy of 80 years, the burden from the
large old generations is greater than the burden from young generations, so that the working-age-
share-maximizing fertility rate in steady-state is 2.6, significantly above replacement. In Yemen,
with a life expectancy of 60 in 2005, the relative burden of the young and the old is similar in
magnitude, so that we get an optimal steady-state fertility rate of 1.9. In Zambia, with a life
expectancy of 40 years, youth dependency is more relevant than old-age dependency, so the
optimal steady-state total fertility rate is relatively low at 1.7.
The optimal fertility rate for Zambia is particularly low due to the rather peculiar
mortality profile generated by the HIV epidemic. In Figure 5 we compare today’s survival curves
in Zambia with a historical life table generating a Zambian life expectancy of 40 years.

11
Figure 5: Survival rates with 40 year of life expectancy: historical life tables versus
Zambia 2005
0%
10%
20%
30%
40%
50%
60%
70%
80%
90%
100%
0 1 5 10 15 20 25 30 35 40 45 50 55 60 65 70 75 80 85
Age
Surv
ival
Historical life table: life expectancy 40 years
Zambia life table 2005: life expectancy 40 years
Source: United Nations (1982), WHO (2008).
The historical survival curves associated with a life expectancy of 40 years imply
extremely high under-five mortality (close to 30%), and relatively low and constant mortality
afterwards. In comparison, infant and mortality rates are relatively low in Zambia today, while
adult mortality (mostly generated by HIV) is significantly higher. The shift in mortality from
childhood to adult life implies a very different stable population distribution. With the historical
tables, the burden of high fertility levels is lower than the respective burden with modern Zambia
survival rates; as a result, the working-age-share maximizing fertility rate is 2.1, significantly
above the optimal rate, 1.7, for present day Zambia.
It should be stressed at this point that our analysis completely abstracts from population
growth. The fertility levels maximizing the working-age shares under the different life
expectancy assumptions can be associated with very different growth rates. The working-age-
share maximizing rate for France (2.8) implies positive population growth of 0.8% per year; the
corresponding rates for Yemen and Zambia imply population growth rates of -2% and -0.7%. As

12
discussed in the introduction, the basic relation between population growth and income per
capita remains unclear, and will not be discussed further in this paper.
The focus of this paper instead lies in quantifying the magnitude of the effect of
demographic shifts on age structure. In the graphs and calculations made above, we have defined
working age as being the age range 15-64. In the European case, a majority of workers retire
around 60 (Gruber and Wise 1999; Gruber and Wise 2004), which means that the working-age
shares calculated before are likely to be overly optimistic. In Figure 6 we simulate stable
population working-age-shares for a range of retirement ages using the French survival schedule.
At retirement age 55, the burden of the old is particularly large, implying a working-age-share-
maximizing fertility rate of 3.1. If, on the other hand, the working age would go all the way up to
age 70, the WAS-maximizing fertility rate would fall to 2.0.
Figure 6: Stable population distribution relationship between fertility and working-
age share under different retirement age scenarios
0
0.1
0.2
0.3
0.4
0.5
0.6
0.7
- 0.5 1.0 1.5 2.0 2.5 3.0 3.5 4.0 4.5 5.0 5.5 6.0 6.5 7.0 7.5 8.0 8.5 9.0 9.5 10.0
Total fertility rate
Wor
king
-age
shar
e
Average retirement age: 55
Average retirement age: 70
Working-age maximizingfertility rate: 3.1
Working-age maximizingfertility rate: 2.0

13
An analogous picture emerges when we change the assumptions regarding the lower
bound of the working age to reflect differences in the years of schooling and the resulting
differences in the timing of labor force entry. As Figure 7 illustrates, later entry into the labor
force mechanically lowers the working-age share. Later entry into the labor force is associated
with a higher relative burden generated by the young cohorts, and thus lower working-age-share-
maximizing fertility levels.
Figure 7: Stable population distribution relationship between fertility and working-
age share under different labor force entry age scenarios
0
0.1
0.2
0.3
0.4
0.5
0.6
0.7
0 1 2 3 4 5 6 7 8 9 10
Total fertility rate
Wor
king
-age
shar
e
Start working at age 25
Start working at age 15
Working-age maximizingfertility rate: 1.8
Working-age maximizingfertility rate: 2.6
The second main channel omitted in the basic model outlined in this section is
immigration. Immigrants generally display reproductive behavior different from the population
in their host countries (Fernandez and Fogli 2006) and also directly affect the age distribution of
countries. The exact effect of migration on age structure depends on the average age of the
migrants, as well as on the duration of stay. Immigrants arriving during their working age and
14
leaving before retirement increase the relative size of the working-age population and labor force
of their host country, and lower the working-age share in their country of origin. We provide a
detailed discussion of this issue in the following section where we analyze the implications of
low fertility levels for Europe.
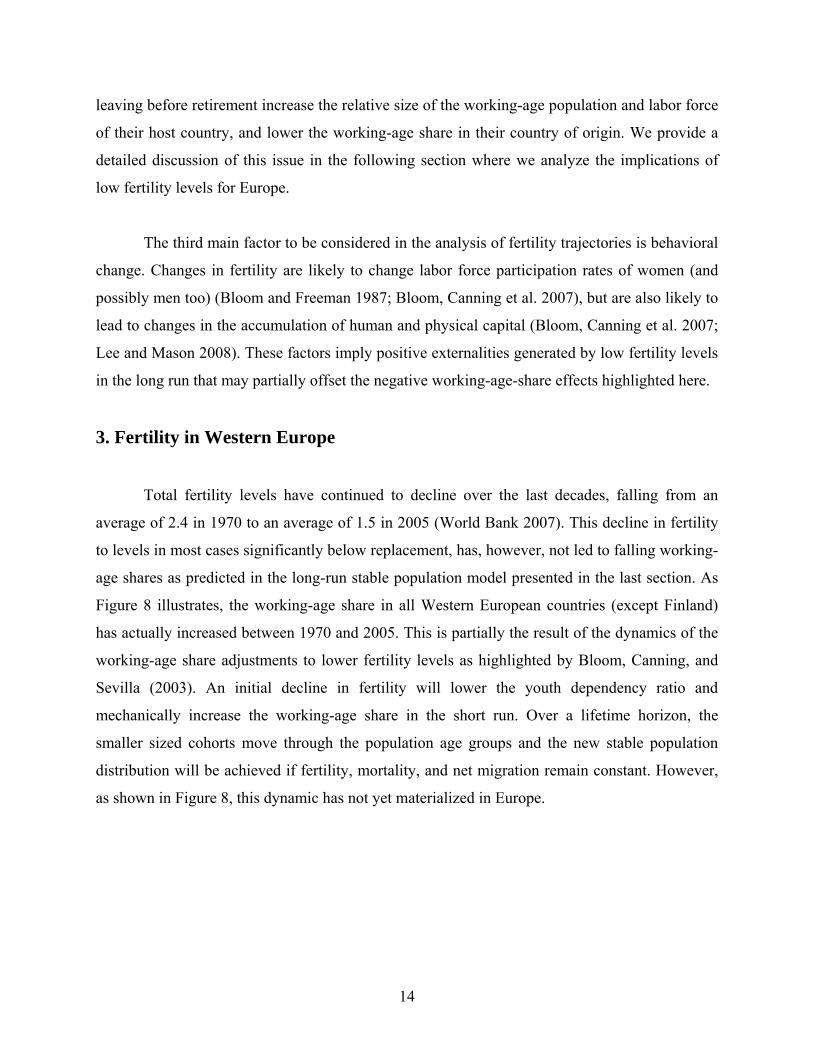
The third main factor to be considered in the analysis of fertility trajectories is behavioral
change. Changes in fertility are likely to change labor force participation rates of women (and
possibly men too) (Bloom and Freeman 1987; Bloom, Canning et al. 2007), but are also likely to
lead to changes in the accumulation of human and physical capital (Bloom, Canning et al. 2007;
Lee and Mason 2008). These factors imply positive externalities generated by low fertility levels
in the long run that may partially offset the negative working-age-share effects highlighted here.
3. Fertility in Western Europe
Total fertility levels have continued to decline over the last decades, falling from an
average of 2.4 in 1970 to an average of 1.5 in 2005 (World Bank 2007). This decline in fertility
to levels in most cases significantly below replacement, has, however, not led to falling working-
age shares as predicted in the long-run stable population model presented in the last section. As
Figure 8 illustrates, the working-age share in all Western European countries (except Finland)
has actually increased between 1970 and 2005. This is partially the result of the dynamics of the
working-age share adjustments to lower fertility levels as highlighted by Bloom, Canning, and
Sevilla (2003). An initial decline in fertility will lower the youth dependency ratio and
mechanically increase the working-age share in the short run. Over a lifetime horizon, the
smaller sized cohorts move through the population age groups and the new stable population
distribution will be achieved if fertility, mortality, and net migration remain constant. However,
as shown in Figure 8, this dynamic has not yet materialized in Europe.

15
Figure 8: Working-age shares in Western Europe: 1970 and 2005
50
55
60
65
70
75
Austria Belgium Denmark Finland France Germany Greece Ireland Italy Netherlands Norway Portugal Spain Sweden Switzerland UnitedKingdom
Shar
e of
pop
ulat
ion
ages
15-
64 (%
)
Working-age-share 1970 Working-age-share 2005
From a long-term (stable population) perspective, most of the declines in fertility are
recent. In 1960, all European countries had a total fertility rate above 2; in 1970 only a small
group of countries in Northern Europe had fallen below the threshold of 2 children per woman.
Consequently, the generations currently retiring in most countries with a low total fertility rate
still bore more than two children on average, which keeps old-age dependency rates moderate,
while youth dependency rates have fallen dramatically. Once the generations who have fewer
than two children on average begin to retire, working-age-shares will fall if fertility levels stay
below replacement and all other factors remain unchanged.
Positive short-term effects are, however, not the only reason why working-age shares
have remained high in Europe. The second main factor contributing to the currently high levels

16
of working-age-shares is migration. Since most immigrants are young (Malmberg 2008),
migration has a direct and positive effect on working-age-shares. Most Western European
countries have experienced significant migration inflows over the last decades. As summarized
in Table 1 below, immigrants (defined as current residents with foreign citizenships) constitute
between 2.1 (Finland) and 20% (Switzerland) of the current population. More importantly, net
migration remains positive for most countries. While an average current inflow of 4 immigrants
per 1000 population, the effect of migration on population levels and working-age shares can be
shown to be quite small.
Table 1: Immigrant stock in Western Europe
Total population 2005 ('000)
Foreign nationals 2005
('000)
Population share of foreign nationals (%)
Estimated annual net migration per 1000 population
Austria 8,230 789 9.58 4.39Belgium 10,500 871 8.29 3.50Denmark 5,420 268 4.94 1.70Finland 5,250 108 2.06 1.28France 60,900 3,623 5.95 2.40Germany 82,500 7,288 8.83 2.43Ireland 4,160 255 6.14 9.47Italy 58,600 2,402 4.10 3.87Netherlands 16,300 699 4.29 1.37Norway 4,620 213 4.62 3.70Spain 43,400 3,371 7.77 13.61Sweden 9,020 481 5.33 3.40Switzerland 7,440 1,525 20.49 2.72United Kingdom 60,200 3,066 5.09 3.20 Population-weighted average 6.63 4.18Source: Eurostat (2008), United Nations (2007)
One way to illustrate the mixed medium- to long-run effects of migration is to simulate
counterfactual historical population under the assumption that migration flows over the last
decades were zero. The thought experiment we conduct is the following: how different would
European working-age shares look today under the assumption that no migration had happened
in Europe over the last 45 years? Given that we know the historical age structure and subsequent
fertility and mortality rates, this simulation is relatively simple to implement under the

17
simplifying assumption that mortality and fertility levels would have been the same in the
absence of migration. i.e. that immigrants have the same fertility and mortality rates as the
domestic population.
Figure 9 compares the simulated to the actual age structure for Austria as a country with
relatively high immigration flows over the last 40 years. While the total population is by
construction lower in the simulated scenario (7.6 vs. 8.2 million in 2005), the graph highlights
the highly non-linear effect of migration on the age distribution. Immigration has led to slightly
larger population shares in the age groups 35-39 and 40-44; however, the opposite is true for
some of the old-age groups.
Figure 9: Actual age structure and simulated age structure in the absence of
migration: Austria 2005
0.0%
1.0%
2.0%
3.0%
4.0%
5.0%
6.0%
7.0%
8.0%
9.0%
10.0%
0-4 5-9 10-14 15-19 20-24 25-29 30-34 35-39 40-44 45-49 50-54 55-59 60-64 65-69 70-74 75-79 80-84
Age group
Perc
enta
ge o
f tot
al p
opul
atio
n
Actual age structure 2005Simulated age structure 2005

18
Overall, the effect of historical migration on the current size of the working-age share is
very small: while the actual working age share was 67.8% in 2005, our simulation results imply
that the share would have been 68.5% in the absence of migration. In short, migration over the
last 45 years has undoubtedly increased the total population in Austria, but has had very little
effect on the actual size of the working-age share.
The second, and much bigger, problem with the argument that migration can solve future
age structure problems, lies in the political feasibility of continued immigration inflows. With
increasing domestic resentment against immigration documents by the wide-spread popularity of
right-wing parties across European countries, immigration policies have been tightened
significantly and are likely to severely reduce migration inflows in the future.
In short, migration is highly unlikely to have a major effect on falling working-age shares
in Western European countries over the next decades. The size of the economic repercussions of
declining working-age shares on economic development, however, will critically depend on
individual behavior. With increasing life expectancies and smaller family sizes many aspects of
societies are bound to change.
In Bloom, Canning, Fink and Finlay (2007) we show that each extra child lowers a
female’s labor force participation by approximately 1.9 years over an average working life. With
lower fertility levels, female labor force participation increases and has important positive
second-order effects on income per capita. This relationship, however, appears different in
European countries, where fertility is clustered in a relatively small range as shown in Figure 7.
Engelhardt and Prskawetz (2004) argue that in fact the relationship between fertility and female
labor force participation in Europe is positive when looking at the changes within countries
across time. This finding, however, appears to be confounded by other country-specific trends
and is reversed once country-specific factors are fully accounted for (Brewster and Rindfuss
2000; Vlasblom and Schippers 2004).

19
Figure 10: Fertility and female labor force participation in Europe, 2005
Albania
Austria
BelgiumBulgaria
Croatia
Denmark
Finland
FranceGermany
Greece
Iceland
Italy
Lithuania
Macedonia, FYR
Malta
Moldova
Netherlands
Norway
Portugal
Serbia and Montenegro
Slovenia
Sweden
Ukraine
United Kingdom
3040
5060
70Fe
mal
e la
bor f
orce
par
ticip
atio
n ra
te, a
ge 1
5+
1 1.5 2 2.5Total fertility rate
Source: World Bank (2007), ILO (2007)
Source: ILO Bureau of Statistics (2007), World Bank (2007)
Changing fertility may also affect savings behavior. From a life-cycle perspective,
children and savings can be viewed as substitutes in terms of old-age security. In the absence of
formal capital markets, children may act as a more reliable form of savings for old-age support
than financial savings. As capital markets develop, parents can substitute towards savings and
lower the demand for children (Ehrlich and Kim 2007).
Lee and Mason (2008) argue that smaller family sizes do not necessarily lead to lower
aggregate human capital. According to the Lee-Mason model, households contribute a fixed
proportion of resources to fund the education of all the children. When the number of children
per household declines, investment in each child’s education increases proportionately.
Accordingly, as these children age and enter the workforce, the aggregate amount of human
capital is not compromised even though the number of people entering the workforce is now
lower.

20
5. Discussion
In this paper we have explored the effect of fertility on income per capita in the short and
long run. In the short run, a decline in the fertility rate unambiguously increases income per
capita as youth dependency falls and the working-age share increases. As we have shown in the
theoretical framework presented in section 2 of this paper, the relationship between fertility and
age structure in steady-state is more complex in the long run. Although it is true that very high
fertility levels have a negative effect on output per capita through low working-age shares, the
positive effects of lowering fertility only exist up to the rate at which working-age share is
maximized; any fertility decline below this maximizing rate lowers the working-age share in
equilibrium and may induce a reduction in output per capita. In high-fertility countries such as
Zambia, the message is clear: lower fertility will increase income per capita. For low-fertility
European countries, the implications of fertility decline are more complex: lower fertility will
increase income per capita in the short run, but decrease it in the long run. This poses a policy
conundrum for European policymakers.
In most Western European countries, continued net immigration and the relatively recent
decline in fertility have bolstered working-age shares to today’s levels. However, given the
growing aversion to further immigration exhibited in many European countries and the resulting
increase in migration restrictions, the scope for large future immigration inflows seems very
limited at the moment. If fertility levels stay at current levels, or fall further, declines in the
working-age share of the population will occur over the next decades and depress income per
capita gains. With a life expectancy of 80 years, our simulations imply that the long-run
working-age shares will drop to somewhere between 50% and 55% if fertility levels stay at
current levels. Comparing this with the current working-age shares close to 70% in most
European countries implies a reduction in the number of workers per capita of around 25% under
the assumption that average participation rates remain unchanged. Even though this adjustment
is likely to happen over several decades, the resulting negative growth effects will clearly be
noticed, especially by those economies with already modest economic growth.

21
The exact magnitude of these effects, however, critically depends on the many policies
affecting labor force participation, particularly social security regulations (Gruber and Wise
1998; Blondal and Scarpetta 1999; Gruber and Wise 1999; Gruber and Wise 2004). Adjusting
institutional settings such as social security, child care, and education will not only be important
to ensure long-term fiscal sustainability, but also to lessen and possibly avoid negative income
effects generated by demographic change.

22
6. References Aarssen, L. W. (2005). Why is fertility lower in wealthier countries? The role of relaxed fertility-
selection. Population and Development Review 31(1): 113-126. Adsera, A. (2006). An economic analysis of the gap between desired and actual fertility: The
case of Spain. Review of Economics of the Household 4: 75-95. Adsera, A. (2006). Marital fertility and religion in Spain, 1985-1999. Population Studies 60(2):
205-221. Becker, G. S., Glaeser, E. L. & Murphy, K. M. (1999). Population and economic growth.
American Economic Review 89(2): 145-49. Billari, F., Frejka, T., et al. (2004). Discussion of paper 'Explanations of the fertility crisis in
modern societies: A search for commonalities Population Studies 57(3): 241-263, by John Caldwell and Thomas Schindlmayr'. Population Studies 58(1): 77-92.
Billari, F. & Kohler, H.-P. (2004). Patterns of low and lowest-low fertility in Europe. Population Studies 58(2): 161-176.
Bjorklund, A. (2006). Does family policy affect fertility? Lessons from Sweden. Journal of Population Economics 19: 3-24.
Blondal, S. & Scarpetta, S. (1999). The Retirement Decision in OECD Countries. OECD Economics Department Working Paper 202.
Bloom, D. E., Canning, D., Fink, G. & Finlay, J. E. (2007). Fertility, Female Labor Force Participation, and the Demographic Dividend. NBER Working Paper 13583.
Bloom, D. E., Canning, D., Mansfield, R. K. & Moore, M. (2007). Demographic Change, Social Security Systems and Savings. Journal of Monetary Economics 54: 92-114.
Bloom, D. E., Canning, D. & Sevilla, J. (2003). The Demographic Dividend: A New Perspective on the Economic Consequences of Population Change. Population Matters Monograph MR-1274, RAND, Santa Monica.
Bloom, D. E. & Freeman, R. B. (1986). The Effects of Rapid Population Growth on Labor Supply and Employment in Developing Countries. Population and Development Review 12(3): 381-414.
Bloom, D. E. & Freeman, R. B. (1987). Population Growth, Labor Supply, and Employment in Developing Countries. Population growth and economic development: Issues and evidence.
Bloom, D. E. & Freeman, R. B. (1988). Economic Development and the Timing and Components of Population Growth. Journal of Policy Modeling 10.
Bongaarts, J. & Bulatao, R. A. (1999). Completing the Demographic Transition. Population and Development Review 25(3): 515--529.
Brander, J. A. & Dowrick, S. (1994). The Role of Fertility and Population in Economic Growth. Journal of Population Economics 7(1): 1-25.
Brewster, K. L. & Rindfuss, R. R. (2000). Fertility and Women’s Employment in Industrialized Nations. Annual
Review of Sociology 26(1): 271-296. Coleman, D. (2006). Immigration and ethnic change in low-fertility countries: A third
demographic transition. Population and Development Review 32(3): 401-446. Deardorff, A. V. (1976). The Opimum Growth Rate for Population: Comment. International
Economic Review 17(8): 510-515.
23
Ehrlich, I. & Kim, J. (2007). Has Social Security Influenced Family Formation and Fertility in OECD Countries? An Economic and Econometric Analysis. NBER Working Paper 12869.
Ehrlich, P. R. (2008). Demography and Policy: A View from Outside the Discipline. Population and Development Review 34(1): 103-113.
Engelhardt, H. & Prskawetz, A. (2004). On the changing correlation between fertility and female employment over space and time. European Journal of Population 20: 35-62.
Fernandez, R. & Fogli, A. (2006). Fertility: The Role of Culture and Family Experience. Journal of the European Economic Association 4(2): 552-561.
Feyrer, J. (2007). Demographics and Productivity. Review of Economics and Statistics 89: 100-109.
Feyrer, J., Sacerdote, B. & Stern, A. D. (2008). Will the Stork Return to Europe? Understanding fertility within developed nations. Journal of Economic Perspectives 22(3): 3-22.
Galor, O. (2005). The demographic transition and the emergence of sustained economic growth. Journal of European Economic Association 3(2-3): 494-504.
Galor, O. & Weil, D. N. (1999). From Malthusian stagnation to modern growth. American Economic Review 89(2): 150-154.
Galor, O. & Weil, D. N. (2000). Population, Technology, and Growth: From Malthusian Stagnation to the Demographic Transition and Beyond. American Economic Review 90(4): 806-28.
Garrido, L. J. & Malo, M. A. (2005). Postponement of family formation and public budget: Another approach to very low fertility in Spain. Public Finance and Management 5(1): 152-177.
Gruber, J. & Wise, D. (1998). Social Security and Retirement: An International Comparison. The American Economic Review 88(2): 158-163.
Gruber, J. & Wise, D. A. (1999). Social Security and Retirement around the World. Chicago, The University of Chicago Press.
Gruber, J. & Wise, D. A. (2004). Social Security Programs and Retirement around the World: Micro-Estimation. Chicago, The University of Chicago Press.
Hock, H. & Weil, D. N. (2007). Modeling the Effects of Population Aging on Consumption in the Presence of Intergenerational Transfers. Population Aging, Intergenerational Transfers and the Macroeconomy. R. Clark, N. Ogawa,A. Mason. Cheltenham, UK
Northampton, MA:, Edward Elgar. ILO Bureau of Statistics (2007). ILO Database on Labour Statistics, International Labour
Organization. Kelley, A. C. (1988). Economic consequences of population change in the third world. Journal
of Economic Literature 26: 1685-1728. Kelley, A. C. & Schmidt, R. M. (1995). Aggregate Population and Economic Growth
Correlations: The Role of the Components of Demographic Change. Demography 32(4): 543-555.
Kelley, A. C. & Schmidt, R. M. (2005). Evolution of Recent Economic-Demographic Modeling: A Synthesis. Journal of Population Economics 18(2): 275-300.
Kohler, H.-P. (2006). Determinants of Low Fertility in Europe. Entre Nous 63. Kohler, H.-P., Billari, F. C. & Ortega, J. A. (2002). The emergence of lowest-low feriltiy in
Europe during the 1990s. Population and Development Review 28(4): 641-680.

24
Lee, R. & Mason, A. (2008). Fertility, Human Capital, and Economic Growth over the Demographic Transition. Mimeo.
Lesthaeghe, R. & Willems, P. (1999). Is low fertility a temporary phenomenon in the European Union? Population and Development Review 25(2): 211-228.
Lutz, W. & Skirbekk, V. (2005). Policies addressing the tempo effect in low-fertiltiy countries. Population and Development Review 31(4): 699-720.
Malmberg, B. (2008). Global Population Ageing, Migration and European External Policies. Stockholm, Institute for Future Studies.
McDonald, P. (2006). Low Fertility and the State: The Efficacy of Policy. Population and Development Review 32(3): 485-510.
McDonald, P. (2008). Very Low Fertility: Consequences, Causes and Policy Approaches. The Japanese Journal of Population 6(1).
Samuelson, P. A. (1975). The Optimum Growth Rate for Population. International Economic Review 16(3): 531-538.
Samuelson, P. A. (1976). The Optimum Growth Rate for Population: Agreement and Evaluations. International Economic Review 17(2): 516-525.
Simon, J. L. (1996). The Ultimate Resource 2. Princeton, Princeton University Press. Solow, R. M. (1956). A Contribution to the Theory of Economic Growth. Quarterly Journal of
Economics 70: 65-94. Strulik, H. (2005). The Role of Human Capital and Population Growth in R&D-based Models of
Economic Growth. Review of International Economics 13(1): 129-145. Vlasblom, J. D. & Schippers, J. J. (2004). Increases in Female Labour Force Participation in
Europe: Similarities and Difference. Tjalling C. Koopmans Research Institute Working Paper Series. Utrecht, Tjalling C. Koopmans Research Institute.
Weil, D. N. (1999). Population Growth, Dependency, and Consumption. American Economic Review 89(2): 251--255.
World Bank (2007). World Bank Development Indicators CD-ROM. World Health Organization Life Tables for WHO Member States.