The Good Teacher Training Guide 2011 - University of ...
57
THE GOOD TEACHER TRAINING GUIDE 2011 Alan Smithers and Pamela Robinson Centre for Education and Employment Research University of Buckingham
-
Upload
khangminh22 -
Category
Documents
-
view
0 -
download
0
Transcript of The Good Teacher Training Guide 2011 - University of ...

THE GOODTEACHER TRAINING
GUIDE 2011
Alan Smithers and Pamela Robinson
Centre for Education and Employment ResearchUniversity of Buckingham

Contents
Executive Summary i
Introduction 1
2. The Providers 4
3. Training Routes Compared 13
4. The Trainees 16
5. Entry Qualifications 19
6. Subjects 22
7. QTS and Into Teaching 26
8. Policy Pointers 30
Appendix 35

i
Executive Summary
Providers Compared
All 227 university, school-centred (SCITT) and employment-based training (EBITT)
providers are compared on entry qualifications, Ofsted grades and take-up of teaching posts.
The Billericay Educational Consortium, one of the two pioneers of school-centred teacher training comes top, with Oxford University second, and Cambridge University third.
Four of the top ten are SCITTs, four are universities and two are EBITTs. The top EBITT is Southfields Community College (Wandsworth), one of the first Training Schools.
Routes Compared
This is the first year that the teaching take-up of employment-based trainees has been available making it possible for the first time to compare all three training routes. Trainees on SCITTs and EBITTS were much more likely to go into teaching than those from universities. Universities tended to have the higher entry qualifications and get the better Ofsted grades. But it is no good having excellent entrants and outstanding inspection grades if the trainees do not go into teaching.
Teaching Take-Up
The training system is currently very wasteful. Overall, even with the school-led schemes included, only 62% of the trainees were teaching in state schools in the January following.
Ofsted Grades
The new Ofsted inspection framework makes it more difficult to tell programmes apart. 33 universities were rated outstanding in the 2011 Profiles compared with only two in the 2000 Profiles. It seems unlikely that this explosion could all be due to real improvement.
Entry Qualifications
Over the fourteen years CEER has reviewed teacher training, there has been a twelve point increase in the percentage of trainees with firsts or upper-seconds (from 46% to 58%), but only at the rate that these degree classes have been awarded by the universities (50% to 61%). While teaching is holding its own against other graduate occupations, it is not increasing its share of the good graduates.
Subjects
Some subjects continue to struggle to find teacher trainees. Over a third of those in modern languages (37%), a quarter in maths (25%) and in physics (24%), and a fifth in chemistry (20%) and combined science (21%) lacked a 2.2 degree which the Government regards as the minimum for public funding. In these subjects also fewer of the trainees became teachers. Undergraduate courses do little to make up the shortfalls, with only two trainees in modern languages, one in physics and seven in chemistry among the secondary trainees, and only half of these make it to the classroom.

ii
Undergraduate Courses
In all, undergraduate ITT courses contribute 893 of the 19,876 secondary trainees (4.5%). Only half had entered with A-levels.
School Led
The Government has taken to linking the school-centred schemes (SCITT) and the Graduate Teacher Programme (GTP) as school-led schemes. They have a good record of trainees going into teaching and continuing in the profession. But after growing rapidly in the early part of the century they have stalled for the past six years. This appears to be due to a lack of funded places in the case of the GTP and high turnover among SCITTs.
Teaching take-up by those qualifying on the Overseas Trained Teacher Programme (OTTP) dropped from an initial 92% to 64% three years later, calling into question whether the scheme is worthwhile.
Teach First
The Government has been enthusiastic about Teach First and is expanding this scheme, but it should not be forgotten that it was devised as a two-year commitment on the part of good graduates planning careers in business and industry to give something back in challenging schools. Of the 149 on the scheme in 2005/6, 63 (42%) chose to remain in teaching (which is a plus), but within three years the other 86 had moved on. In 2009/10 the Teach First intake had been increased to 480, but still only 1.2% of the 38,429 teacher trainees, and only half are expected to stay in teaching.
Policy Pointers
The Graduate Teacher Programme is attractive to trainees since they receive salaries rather than having to pay tuition fees, as those on PGCE courses do. If the Government wishes to free it up for growth it will have to find the money. It would be a good investment since schools recruit to meet their needs and the trainees enter and continue in teaching.
The Government’s attempts to raise the bar for entry will have to reckon with the long-standing shortfalls in some subjects. It hopes to combat these with bursaries of up to £20,000. But it may be a matter more of personality than short-term financial incentives. Subjects like physics attract people who prefer abstract patterns to working with children day in and day out. It may be necessary to accept the shortfalls and find ways of getting the most able pupils together with the best teachers. Countries like the United State, Japan, Korea and Singapore, for example, have actual science schools (not like ours which are in name only).
The number and quality of the entrants and the take-up of teaching posts must put question marks against the Overseas Trained Teacher Programme, undergraduate ITT courses for the secondary age range, and key stage 2/3 courses.

1
1. Introduction
1.1 The Good Teacher Training Guide 2011 compares the teacher trainer providers, and analyses entries and outcomes. This is the first year that it has been possible to include the employment-based routes since their employment data is now publicly available. Each year since 1998 the Training and Development Agency for Schools, the body responsible for allocating teacher training places, has collected and made available an extensive dataset describing the training providers, and each year since 1998 the Centre for Education and Employment Research has analysed and summarized these data. In order to be able to compile statistics on the take-up of teaching posts the TDA Profiles refer to the preceding academic year, so the 2011 Profiles are based on the training year 2009-10.
1.2 The providers are ranked on a combination of entry qualifications, Ofsted inspections and the trainees’ take up of teaching posts. There are three main routes in teacher training: the universities and colleges (which we abbreviate to UNIs), the school-centred schemes (SCITTs), and the employment-based programmes (EBITTs). The UNIs and SCITTs offer training towards the Postgraduate Certification in Education (PGCE), and tuition fees are payable. These routes differ in that in university training, the trainees are found placements in schools by the universities as part of their courses and the funding is channelled via the universities. SCITTs are consortia of schools allocated training places and funding is channelled through them. Universities validate the PGCEs of SCITTs and may be hired by them to provide some of the teaching. There are also employment-based routes. There are three sorts of EBITT postgraduate programme (there is in addition the Registered Teachers Programme, RTP, for non-graduates): the Graduate Teacher Programme (GTP); the Overseas Trained Teacher Programme (OTTP); and Teach First. These differ markedly. The GTP and OTTP lead to qualified teacher status, but not a PGCE, and the trainees are paid a salary while training. Teach First is curiously classified as an EBITT since it is organised by a charity and the trainees do take a PGCE. It was designed as a scheme for graduates with good degrees who commit to work in challenging schools for two years, with the incentive that the enrichment programme they undertake is as much a basis for careers in business and industry (with the understanding that they will be looked upon favourably) as to remain in teaching.
1.3 In our comparisons, the scores for entry qualifications, Ofsted grades and employment in teaching are weighted equally. They have been standardised to a mean of 500 and a standard deviation of 100 across all provider types. The scores of the universities, SCITTs and EBITTs, and the primary and secondary phases, are thus directly comparable.
1.4 In the next chapter the initial teacher training providers are ranked. Universities currently train almost four-fifths of teachers. The top ten are identified (the full ranking is given in Appendix A1). The top ten for primary and secondary are also shown. The SCITTs and EBITTs are then added to the mix so we can see whether the best teacher training is provided in the Universities of Oxford or Cambridge, or Billericay SCITT, or Southfields (Wandsworth) EBITT. As well as the overall rankings, the top performers in each component - entry qualifications, Ofsted grades and take-up of teaching posts – are named.

2
1.5 In Chapter 3 the three training routes – UNIs, SCITTs and EBITTs - are compared. This is possible for the first time this year since the TDA has for the first time published the employment data for the EBITTs in its annual release of Teacher Training Profiles1. It is also important since it is a declared aim2 of the Government to rebalance teacher training provision in favour of school-led schemes (which it identifies as SCITT and GTP). Are, in fact, the school-led schemes doing better and, if so, in what ways?
1.6 Chapter 4 asks: how many trainees are there and who are they? The entrants to the different phases of teacher training - primary, key stage 2/3 and secondary - are characterised in terms of their gender, ethnicity, age, whether undergraduate or postgraduate, and whether entry is on the basis of a UK or overseas qualification. The trends over the 14 years the report has been compiled are traced.
1.7 In Chapter 5 the entry qualifications are looked at in more detail. The Government is putting great emphasis on the quality of new recruits. Are the entry qualifications of teacher trainees improving and, if so, does this mean that teaching is competing more successfully for graduates? The entry qualifications to undergraduate courses are analysed in terms of A-levels and to postgraduate courses in terms of good degrees. Are the better qualified more likely to train in universities, SCITTs or EBITTs. What are the entry levels to the different types of EBITT – the Graduate Teacher Programme, the Overseas Trained Teacher Programme and Teach First –and how do they differ?
1.8 Next, in Chapter 6, we turn to subjects and ask: how is recruitment faring? Again this is germane to Government policy since it has announced that, from 2012, the teacher training of only those with at least a lower-second will be publicly funded. We look in detail at how many trainees currently are recruited who fall short of this requirement. We also consider how many of the trainees are recruited on non-UK qualifications taking this as a further indication of whether training providers are struggling to fill places.
1.9 In Chapter 7 we turn our attention to outcomes, and consider how many of those recruited achieve Qualified Teacher Status and how many take up posts in teaching. This requires summarizing a different dataset. Most teacher training courses last one year, but not all do. Some trainees take less and others longer than a year to complete. Others have to repeat part of the training or retake tests. In this chapter we focus on the final-year trainees. These are mainly the same people as those of the earlier chapters, but for the reasons given are not exactly the same. We can compare how many of the final-year trainees achieve QTS and whether the different routes, phases, and subjects have different outcomes. The final-year trainees are followed up six months after completing so we can also see how many have taken teaching posts and in what sectors.
1 http://www.tda.gov.uk/training-provider/itt/data-surveys/performance-profiles.aspx 2 Training Our Next Generation of Outstanding Teachers. An Improvement Strategy for Discussion,
June 2011, paragraph 7, Page 15. DFE-00054-956-2011. ISBN: 978-1-84775-956-6.
www.education.gov.uk/publications

3
1.10 In the final chapter we consider Government proposals for teacher training in the light of the hard numbers with which they will have to contend.

4
2. The Providers
2.1 In all, in 2009-10, there were 234 teacher training providers offering a range of routes into teaching. Chart 1.1 shows that there were 75 higher education institutions mainly universities (UNIs) and 59 school-centred schemes (SCITTs) offering Qualified Teaching Status (QTS), either through first degrees or the Postgraduate Certificate of Education (PGCE). In addition, there were 100 employment-based providers offering training leading to QTS but not a PGCE.
2.2 The providers can also be grouped according to the phase of education for which training is provided - primary, key stage 2/3 or secondary. Although the programmes have different entrance requirements and focus on different levels and subjects, QTS is a general qualification and teachers are free to teach in any post they are offered.
Chart 2.1: ITT Providers 2009-2010
Phase/UG, PG UNI SCITT EBITT Total
Primary
Undergraduate 44 - 9 53
Postgraduate 59 30 73 162
Key Stage 2/3
Undergraduate 5 - - 5
Postgraduate 6 - 10 16
Secondary
Undergraduate 18 - 10 28
Postgraduate 73 30 89 192
2.3 Some of the providers have very few trainees, as low as just one in the case of some EBITTs. Only those with ten or more trainees have been included in our comparisons, resulting in one university course, two SCITTs and 19 EBITTs being omitted (see footnotes to Charts A1-A3 in appendix). Separate inspection grades are not published for key stage 2/3 training so it cannot be included in the rankings, and two university PGCEs, one SCITT and three EBITTs were left aside for the same reason (again see footnotes to charts in appendix for details). Chart 2.2 gives the numbers of providers included in the rankings.
Chart 2.2: ITT Providers Included in Comparisons1,2
Phase HEI SCITT EBITT Total
Primary 60 29 60 149
Secondary 71 28 79 178
Total2 75 57 95 227
1. Numbers differ from those in Chart 2.1 because: (a) programmes with fewer than ten trainees have been omitted leading to one fewer university course, two fewer SCITTs and 19 fewer EBITTs; (b) programmes with no published Ofsted ratings could not be included resulting in the exclusion of two university courses, one SCITT and 3 EBITTs; and (c) data for undergraduate and postgraduate programmes where a provider offers both have been combined.
2. Rankings of providers include both primary and secondary programmes. Just four universities have primary but no secondary courses. 35 EBITTS are primary only and 16 secondary only. The SCITTs included specialise in either primary or secondary.

5
2.4 Although some providers do not appear in the comparisons of Charts A1-A3 in the appendix, pages 36-49 (for the reasons given in the footnotes), all entrants and final-year year trainees do form part of the general analyses in Chapters 4 to 7. As Chart 4.1, page 16, shows nearly four-fifths of initial teacher training takes place in the universities and university colleges. We begin, therefore, by considering these institutions on their own, before going on to compare all providers.
Universities
2.5 Chart 2.3 shows the top ten university3 ITT providers overall. This is taken from the full table in Charts A1a and Alb, pages 36-39, listing 75 university ITT providers. The top position resembles the university boat race. Oxford and Cambridge have led the table almost every year since its inception in 19984. Oxford was on top for the first five years. Cambridge (with Homerton College now merged into it) led the way in 2004, Oxford regained the lead in 2005 and 2006, and then Cambridge led for four years. But this year Oxford takes over once more. It edges ahead because more of its trainees enter teaching and Cambridge is still carrying a dropped Ofsted grade for its primary provision.
Chart 2.3: Top Ten1 University ITT Providers
University Score Rank
2011 2010 2009
University of Oxford 643.8 1 2 2
University of Cambridge 636.9 2 1 1
University of Exeter 610.7 3 4 3
Loughborough University 598.2 4 6 4
University of Buckingham 594.6 5 5
University of East Anglia 587.5 6 7 11
King's College London 587.2 7 24 22
University of York 586.8 8 15 6
University of Birmingham 570.9 9 8 7
University of Bristol 570.3 10 9 5
1. Full listing in appendix in Charts A1 and A2.
2.6 The top ten university ITT providers are much the same as in 2009 and 2010. The University of Buckingham which burst on the scene last year holds its fifth place. King’s College, London has notably improved its position as a result of maximum grades in its Ofsted inspection, reaching seventh spot. The University of York which slipped in 2010 is back up in eighth position. None of the top ten places overall are held by the newer universities, which absorbed former teacher training colleges. The leading positions continue to go to the old established universities (except for Buckingham which is modelled on an Oxbridge college).
2.7 The newer universities do, however, make an appearance when the primary and secondary phases are considered separately as in Chart 2.4. Northumbria with just 18 secondary entrants comes second in that listing, but the lower score for the 227 primary trainees drops it to just outside the top ten overall. The University of
3 We have abbreviated higher education institutions to ‘universities’ (UNIs). 4 Apart from 2003 when the small specialised provision at Staffordshire University came out on top.

6
Chichester makes it to tenth spot in the secondary listing and the University of Derby to tenth spot in primary. In both cases it is their recent excellent Ofsted ratings. Nevertheless, the top positions are occupied by the old established universities. Exeter comes first for primary followed by Cambridge and Reading. Cambridge heads the secondary listing followed (if we leave aside the small number at Northumbria) by Oxford and Exeter.
Chart 2.4: Top Ten1 Universities for Primary and Secondary
Primary Secondary
University of Exeter 623.5 University of Cambridge 650.2
University of Cambridge 617.1 Northumbria University 648.9
University of Reading 616.6 University of Oxford 643.8
University of Chester 611.0 University of Exeter 604.9
University of Manchester 583.6 Loughborough University 598.2
University of East Anglia 581.9 University of Buckingham 594.6
University of Warwick 572.9 University of East Anglia 592.7
Northumbria University 565.0 King's College London 587.2
University of Birmingham 561.2 University of York 586.8
University of Derby 561.1 University of Chichester 586.6
1. Full listing in appendix in Charts A1 and A2.
Training Routes 2.8 If we look beyond the universities, the top ten providers overall come out as shown
in Chart 2.5. The ten comprise four SCITTs, four universities and two EBITTS.
Chart 2.5: Top Ten Teacher Training Providers
Provider Score Rank
Billericay Educational Consortium SCITT 646.3 1
University of Oxford 643.8 2
University of Cambridge 636.9 3
The North East Partnership SCITT 623.9 4
University of Exeter 610.7 5
Devon Primary SCITT Group 609.8 6
Southfields Community College EBITT 607.1 7
Canterbury Christ Church University EBITT 602.7 8
Suffolk and Norfolk Primary SCITT 601.0 9
Loughborough University 598.2 10
2.9 The highest scorer of all is a SCITT, the Billericay Educational Consortium, which comes ahead of both Oxford and Cambridge Universities. The Billericay Educational Consortium consists of a group of Essex primary schools which collaborate to offer a 42-week course for a maximum of 25 trainees a year leading to a PGCE validated by the Open University. It has consistently been the top performing primary SCITT in the country and in 2011 its highly qualified entrants and outstanding Ofsted grades have taken it to the very top of the 227 providers. Fittingly, in 1994, it was one of the two pioneers of the SCITT programme.

7
2.10 A SCITT for the secondary age range, the North East Partnership, is fourth, just behind Oxford and Cambridge. Two other primary SCITTs, the Devon Primary SCITT and Suffolk and Norfolk Primary SCITT, occupy sixth and ninth places respectively. Two EBITTs also appear in the top ten overall, Southfields Community College EBITT and Canterbury Christ Church EBITT, in seventh and eighth places respectively. Southfields is a school in Wandsworth and was one of the first Training Schools, established in 2001. It trains many of its 20-25 GTPs itself but there are also partner schools.
2.11 Canterbury Christ Church EBITT is interesting because it illustrates that the universities are also heavily involved in the employment-based routes. In 2009-2010 Canterbury had 620 EBITT trainees as well as the 1,094 on its PGCE courses. Canterbury’s EBITT programme scores much higher than its university courses. While both have maximum Ofsted ratings, the EBITT route had higher scores on entry qualifications and entry to teaching for both the primary and secondary phases. Canterbury Christ Church was the first to provide the university elements of the Teach First EBITT programme5. Of the four universities in the top ten overall, Oxford is second, Cambridge third, Exeter fifth and Loughborough tenth.
Chart 2.6: Top Ten1 Providers
2 by Route
UNI (N=75) SCITT (N=57) EBITT (N=95)
University of Oxford 643.8 Billericay Educational Consortium
646.3 Southfields Community College
607.1
University of Cambridge
636.9 The North East Partnership
623.9 Canterbury Christ Church University
602.7
University of Exeter 610.7 Devon Primary SCITT Group
609.8 Bourton Meadow ITT Centre
587.2
Loughborough University
598.2 Suffolk and Norfolk Primary
601.0 Forest Independent Primary Collegiate
581.1
University of Buckingham
594.6 Leicester and Leicestershire
600.9 University of Nottingham GTP
576.4
University of East Anglia
587.5 Royal Academy of Dance3
592.2 The Havering Teacher Training Partnership
571.5
King's College, London
587.2 Devon Secondary Teacher Training Group
586.5 East Lincolnshire GTP 570.4
University of York 586.8 South West Teacher Training
577.6 Alban Federation 569.8
University of Birmingham
570.9 Chiltern Training Group
575.9 Newman University College
563.6
University of Bristol 570.3 Thames Primary Consortium
569.5 King Edward's Consortium
562.8
1. Full listing in appendix in Charts A1 to A3.
2. Numbers are for overall rankings. Where a provider offers both primary and secondary these are combined to give one score.
3. Strictly speaking the Royal Academy of Dance is not a SCITT, but it not a UNI either, and since its funding model is aligned with SCITTs it is grouped with them.
2.12 Chart 2.6 shows the top ten providers for each route. The first column is taken from Chart 2.3 and we have already met the top ten overall in Chart 2.5. The scores in the
5 www.teachfirst.org.uk

8
UNI and SCITT columns are quite similar, but the EBITTs lag somewhat. Three of the top ten EBITTs are run by universities.
Entry Qualifications
2.13 The overall scores in the earlier part of this chapter derive from standardised scores for entry qualifications, Ofsted ratings and take-up of teacher posts. We now look in more detail at these components. Chart 2.7 shows the top ten across all providers for entry qualifications. Good is defined as the percentage of entrants on UK qualifications with a first or upper-second for postgraduate courses, or 300 UCAS points for undergraduate courses.
Chart 2.7: Top Ten1 for Entry Qualifications
Provider Phase %Good2
University of Cambridge Secondary 91.5
South West Teacher Training SCITT Secondary 90.7
University of Cambridge Primary 90.5
Billericay Educational Consortium (SCITT) Primary 90.5
Northumbria University Secondary 88.3
University of Leicester Primary 87.3
University of Birmingham Primary 86.8
University of Exeter Primary 86.5
University of Oxford Secondary 85.5
Royal Academy of Dance Secondary 85.0
1. Full listing in appendix in Charts A1-3.
2. Percentage ‘firsts’ or ‘upper-seconds’ for postgraduate courses or 300 UCAS points for undergraduate courses.
2.14 Entry qualifications reflect competition for places. Over 90 per cent of the entrants to both the primary and secondary courses at University of Cambridge and to two SCITTs, South West Teacher Training and the Billericay Educational Consortium, had a first or upper-second. Universities – Northumbria, Leicester, Birmingham, Exeter and Oxford – occupied positions five to nine. The Royal Academy of Dance6 was tenth.
Inspection Grades
2.15 The providers are regularly inspected by Ofsted, though not every year, and the inspection framework has changed over time. Charts 2.8a and b list alphabetically the providers in the three routes rated outstanding. The current inspection grades are a mix of two regimes. In the earlier regime teacher training providers were rated on the three dimensions of ‘training’; ‘standards’; and ‘management and quality’, but that has been revised to just two: ‘overall effectiveness’ and ‘capacity to improve’.
6 Grouped with the SCITTs since it is funded on the SCITT model.

9
Chart 2.8a: Primary Providers Rated by Ofsted as Outstanding in Latest Inspection1
PRIMARY
UNI(N=60) SCITT (N=29) EBITT (N=60)
Birmingham City Billericay Educational Consortium
Bourton Meadow ITT Centre
Bishop Grosseteste Cornwall Partnership (3-11) Canterbury Christ Church University
Canterbury Christ Church Devon Primary Group East Lincolnshire GTP
Northumbria Dorset Teacher Training Partnership
East Sussex Primary GTP
Oxford Brookes Gateshead 3-7 Essex Schools ITT Partnership
University College Birmingham Jewish Teacher Training Partnership
Hertfordshire Regional Partnership
Brighton Leicester and Leicestershire Institute of Education, London
Chester North Tyneside 3-7 Newman University College
Chichester Somerset Consortium Somerset SCITT Consortium
Derby Suffolk and Norfolk Primary University of Bedfordshire
East Anglia University of Worcester
Exeter
Gloucestershire
Reading
Warwick
Wolverhampton
Worcester
Chart 2.8b: Secondary Providers Rated by Ofsted as Outstanding in Latest Inspection1
SECONDARY
UNI (N=71) SCITT (N=28) EBITT (N=79)
Birmingham City Bromley Schools Collegiate Canterbury Christ Church University
Canterbury Christ Church Chiltern Training Group East Lincolnshire GTP
Institute of Education, London Devon Secondary Teacher Training Group
Essex Schools ITT Partnership
King's College London Northumbria DT Partnership Hertfordshire Regional Partnership
Loughborough The North East Partnership Institute of Education, London
Northumbria University Newman University College
Brighton, Southfields Community College
Cambridge The Havering Teacher Training Partnership
Chichester The Wakefield Partnership for Initial Teacher Training
East Anglia University of Nottingham GTP
Exeter University of Worcester
Nottingham
Oxford
Wolverhampton
Worcester
York
1. Full listing in appendix in Charts A1 to A3

10
2.16 Chart 2.9 shows the percentages of teacher training providers judged to be outstanding by Ofsted. Overall just over a fifth of the providers achieved top grades on either the three or two dimensions on which they were inspected. Similar proportions of universities and SCITTs achieved top grades, but somewhat fewer EBITTs. Primary providers in all three routes were more likely to be judged outstanding than the secondary providers.
Chart 2.9: Percentage of Providers Judged Outstanding
Phase UNI SCITT EBITT All
Primary 28.3 34.5 18.3 25.5
Secondary 22.5 17.9 13.9 18.0
Total 25.2 26.3 15.8 21.4
2.17 The percentages in Chart 2.9 stand in marked contrast to the early days of Ofsted’s teacher training inspections in the 1990s. Even in the year 2000 only two primary providers, Canterbury Christ Church and Homerton College (now merged into Cambridge University) achieved straight top grades and no secondary provider did, although Oxford was a near miss. The explosive growth in university providers judged outstanding from two in the year 2000 to 33 in 2011 reflects in part closer compliance with Ofsted’s standards and unsatisfactory providers being weeded out. But it also reflects changes to the inspection framework. In the first years of Ofsted inspections primary providers were rated on five dimensions7, and secondary providers in each subject on six dimensions. To achieve straight top grades primary providers would have to be ranked ‘1’ on five dimensions, but for secondary providers it would depend on how many subjects they covered and it could be 70 or more. Hence it is not surprising that only primary providers came out with completely clean sheets.
2.18 The first framework was replaced in 2004-05 by one which assessed three dimensions, and secondary providers received an overall rating rather than one for each subject. These inspections formed part of the 2006 Profiles. Even with this simplified approach only three universities – Cambridge (with Homerton now part of it), Oxford and Exeter - received straight top grades for their secondary provision. Only one primary provider achieved this level: Canterbury Christ Church retaining its perfect score. Within six years, and through another revision of the inspection framework, four had become 338.
Entry to Teaching
2.19 The picture for employment stands in contrast to that for Ofsted grades. Chart 2.10 lists those providers with 95 per cent or more of their final-year trainees in 2009-10 who were in teaching posts by the following January. Only one university had 95 per cent or more of the final-year trainees taking teaching posts compared with 10.5
7 ‘subject knowledge’, ‘teaching standards’, ‘ability to assess’, ‘course design and delivery’ ‘accuracy of assessing trainees’ (secondary providers were also judged on ‘admissions policy and selection’ but this was not included in our analysis). 8 A technical consequence is that instead of the relatively smooth curve generated by the first inspection framework, the present two dimensions give a seven point scale, of which the bottom two points (unsatisfactory) are hardly ever used. The quality scores, therefore, tend to be bunched.

11
per cent of the SCITTs and 12.2 per cent of the EBITTs. Although almost a quarter of the EBITTs (23 out of the 95) were organised by universities, only two of the 17 EBITTs with high take-up of teaching posts were run by them (Northumbria and UC Plymouth St Mark and St John).
Chart 2.10a: Primary Providers with 95 Per Cent or More Trainees inTeaching1
PRIMARY
UNI(N=60) SCITT (N=29) EBITT (N=60)
None Essex Primary Schools Training Group
Carmel Teacher Training
Forest Independent Primary Collegiate
Doncaster GTP Partnership
Suffolk and Norfolk Primary Forest Independent Primary Collegiate
Hull Citywide GTP Partnership
Isle of Wight Partnership
Merseyside and Cheshire GTP Partnership
North Lincolnshire ITT Partnership
The Kirklees Partnership
West Berkshire Training Partnership
Chart 2.10b: Secondary Providers with 95Per Cent or More Trainees in Teaching1
SECONDARY
UNI (N=71) SCITT (N=28) EBITT (N=79)
University of Buckingham Maryvale Institute Alban Federation
Royal Academy of Dance East Lincolnshire GTP
The North East Partnership George Spencer Training School
Merseyside and Cheshire GTP Partnership
Northumbria University
Stockton-on-Tees TTP
University College Plymouth St Mark & St John
West Berkshire Training Partnership
1. Full listing in appendix in Charts A1 to A3.
2.20 We have been criticised for including entry into teaching in our measure9, but it is now to be taken into account in allocating funded places10. It is no good having
9 Revell, P. (2006). ‘Bogus’ league tables. TES Magazine 13 January. 10 Training Our Next Generation of Outstanding Teachers. An Improvement Strategy for Discussion,
June 2011, paragraph 13, Page 10. DFE-00054-956-2011. ISBN: 978-1-84775-956-6.
www.education.gov.uk/publications

12
excellent entrants and outstanding Ofsted grades, if the trainees do not take up teaching posts.

13
3. Training Routes Compared
3.1. The TDA’s 2011 Performance Profiles are the first to include data on how many EBITT trainees go on to become teachers. It, therefore, becomes possible to compare the UNIs, SCITTs and EBITTs on all three dimensions. This is important because in its White Paper, The Importance of Teaching, the Government, envisages re-balancing the training routes in favour of school-led approaches11. The strategy is outlined in a discussion document12 published in June 2011. One of the reasons it gives for a shift to school-led training is that teachers trained on the job are more likely to enter and remain in the profession.
3.2. Chapter 2 contains intimations that this is indeed the case. Of the providers with more than 95 per cent of the trainees securing teaching posts, 17 were EBITTs, six were SCITTs, and only one a university (Buckingham). Chart 3.1 shows that the impression formed from the top performers is borne out by the means. The school-led schemes, SCITTs and EBITTs, do significantly better on teaching take-up than do the universities. But on overall scores the universities are ahead. This comes from the universities having higher entry qualifications and Ofsted grades. The differences from EBITTs, but not SCITTs, are statistically significant. But it has to be said again: what good is high quality training if the trainees do not go on to teach.
Chart 3.1: Training Routes Compared1
Route N Entry1 Quality
2 Teaching
3 Total
UNI2 75 522.4** 532.3** 482.3 512.3*
SCITT3 57 495.4 503.6 519.5* 506.2
EBITT4 95 484.8 477.8 520.8** 494.5
Total 227 499.9 502.3 507.8 503.3
1. Mean values for 227 providers listed in Charts A1-3, with primary and secondary combined.
2. Universities have higher entry qualifications than EBITTs at the 0.01 level. SCITTs not significantly different from other two.
3. Universities have higher Ofsted ratings than EBITTs at beyond the 0.01 level. SCITTs not significantly different from other two.
$. More EBITT trainees enter teaching than trainees from the universities, significance<0.01; more SCITT trainees than university trainees enter teaching, significance <0.05. SCITTs not significantly different from EBITTs.
3.3. The employment data, however, are only for entry into teaching in the year after completion and take no account of those who defer. Martin Furner, Head of ITT Data Collection and Analysis, at the TDA and his team have been able match those gaining QTS with the registration data of the General Teaching Council (England) to see what happens in the following years. They have kindly allowed us to graph the data they obtained for 2005/06 in Charts 3.2 and 3.3.
3.4. We have chosen 2005/06 as the year to concentrate on since it includes all routes and gives the longest run of follow-up years. From the GTC(E) register the TDA
11 The Importance of Teaching. The Schools White Paper 2010, paragraph 2.6, page 20, DFE, Cm 7980, London: The Stationery Office. 12 Training Our Next Generation of Outstanding Teachers. An Improvement Strategy for Discussion,
June 2011, paragraph 6, Page 14. DFE-00054-956-2011. ISBN: 978-1-84775-956-6.
www.education.gov.uk/publications

14
team classified those achieving QTS as ‘employed’, ‘not employed’ or ‘not matched’. There are very few non-matches – just 3.6 per cent for the 2005/06 cohort – so it is a very good dataset13. To simplify the presentation we have combined primary and secondary for individual providers since they had a similar pattern.
3.5. Chart 3.2 compares the three main routes. It confirms the big differences already reported for the first year, but in the following three years there is some degree of convergence. The percentage in teaching from the university courses actually rises in the second year and is sustained in the third before falling away somewhat in the fourth. But the percentage for EBITTs having started out at 16 points above that of the universities steadily drops till in the fourth year it is only 2.4 points to the good.
Chart 3.2: Per Cent in Teaching1 by Year After QTS2
50
60
70
80
90
100
1 2 3 4
Year
Per
Ce
nt
In T
ea
ch
ing
EBITT
SCITT
UNI
1. EBIIT is employment-based initial teacher training; UNI is universities and colleges, and SCITT is school-centred initial teacher training.
2. Data from GTC(E) compiled by Martin Furner, Head of ITT Data Collection and Analysis, at the TDA.
3.6. Surprisingly, in contrast, to the data of Chapter 2, SCITTs in these data run below the other two routes. But SCITT entry into teaching has improved since 2005/06 and in the latest figures - for 2008/09 – employment during the first year after completion was recorded as 88.2 per cent against the 72.3 per cent in 2005/06. This is in line with the results for the same year reported in the Good Teaching Guide 201014
13 There have to be some caveats, however. Not all employment settings in education required registration with the GTC(E), for example, in pupil referral units, in further or higher education, or in independent schools. It was the GTC for England so those going to teach in Wales would not be captured in this way. 14 Good Teaching Guide 2010, chart 4.2, page 19, Smithers, A and Robinson, P. (2010). Buckingham: Carmichael Press. The percentage shown is of final-year trainees. Of those awarded QTS, it is 85.7 per cent

15
3.7. The drop off among those achieving QTS through EBITT programmes is puzzling and in Chart 3.3 we investigate it further. The employment-based routes comprise the Graduate Teacher Programme (GTP), the Registered Teacher Programme (RTP), the Overseas Trained Teacher Programme (OTTP) and Teach First. Chart 3.3 shows that the percentage of those qualifying through the GTP and RTP in teaching holds up well, and after four years is seven percentage points above that of the university trained. The observed EBITT decline turns out to be mainly due to the OTTP route where the percentage in teaching falls from 92.3 per cent in Year 1 to 64.3 per cent in Year 4.
Chart 3.3: %EBITTs1 in Teaching by Year After QTS2
50
60
70
80
90
100
1 2 3 4
Year
Per
Ce
nt
In T
ea
ch
ing RTP
OTTP
GTP
1. RTP is Registered Teacher Programme; GTP is Graduate Teacher Programme and OTTP is Overseas Trained Teacher Programme
2. Data from GTC(E) compiled by Martin Furner, Head of ITT Data Collection and Analysis, at the TDA.
3.8. Teach First was very small in 2005/06 and it is not shown in the graph. By Year 4 only 63 of the 149 were still in teaching, with 58% having left. This is not unexpected since Teach First was designed as a dual preparation for teaching and careers in business and industry, and it represents a two-year commitment on the part of those who might otherwise have gone straight into the other careers. The pattern for Teach First is similar in the years 2006/7 and 2007/8.

16
4. Trainees
4.1 Altogether, as Chart 4.1 shows, there were 38,429 recruits to teacher training in 2009-10. This particular orange can be sliced in several ways. Of the main routes, 78.7 per cent went to university, 4.6 per cent joined a SCITT, and 16.7 per cent were employed in EBITTs. In terms of phases, 46.7 per cent were training to be primary teachers, 51.7 per cent secondary teachers, and 1.6 per cent key stage2/3 teachers. Separating the courses, 20.6 per cent were on undergraduate programmes (the vast majority in primary) and 79.4 per cent on postgraduate programmes.
Chart 4.1: ITT Entrants 2009-10
Phase/Course UNI SCITT EBITT Total
Primary
Undergraduate 6,646 - 78 6,724
Postgraduate 8,224 905 2,083 11,212
Key Stage 2/3
Undergraduate 310 - - 310
Postgraduate 252 - 55 307
Secondary
Undergraduate 853 - 40 893
Postgraduate 13,961 858 4,164 18,983
Total1 30,246 1,763 6,420 38,429
1. Includes assessment only provision at the University of Gloucester.
4.2 Chart 4.2 shows the trends in intakes including the first year the profiles were compiled.
Chart 4.2: Trends in ITT Intakes1
Phase/Route 1998 2006 2007 2008 2009 2010 2011
Primary
UNIs 12,352 15,023 15,254 14,468 14,172 14,264 14,870
SCITTs 171 871 819 817 761 803 905
EBITTs - 2,722 2,653 2,664 2,387 2,301 2,161
Total 12,523 18,616 18,726 17,949 17,320 17,368 17,936
Key Stage 2/3
UNIs 459 723 556 544 522 557 562
SCITTs - 54 41 0 0 0 0
EBITTs - 49 49 33 18 7 55
Total 459 826 646 577 540 564 617
Secondary
UNIs 15,438 15,299 15,263 15,036 14,293 13,924 14,814
SCITTs 317 786 838 848 779 782 858
EBITTs - 4,335 4,407 4,508 4,454 4,260 4,204
Total 15,755 20,420 20,508 20,392 19,526 18,966 19,876
Grand Total 28,737 39,862 39,880 38,918 37,386 36,898 38,429
1. Taken from Chart A4 in appendix; year is year of profile publication, the training year is the previous academic year, 2009-10 in the case of the 2011 profiles.

17
4.3 Chart 4.2 is an abbreviation (to fit on the page) of the full run shown in Chart A4 in the appendix, page 50. There has been considerable growth since 1998 with an overall increase of a third (33.7 per cent). Much of that growth has been outside the universities. In the secondary phase university ITT numbers have even fallen back somewhat, with the increase mainly contributed by EBITTs. Employment-based routes have been less prominent in the primary phase with some increase in universities, as well as the SCITTs and EBITTs coming on stream.
4.4 But that is to look across the span of fourteen years. What is striking about Chart 4.2 is that neither the SCITTs nor EBITTs have grown in the past six years. It is current government policy to expand school-led approaches, and to achieve this it will have to ask: why the stasis? The answer will be bound up with a number of factors: the demand for new teachers; the funding of places; the relative attractiveness of teaching among graduate occupations; and also the availability of provision.
4.5 Pupil numbers fell by about 4.0 per cent between the 2006-11TDA Profiles15, so the reduction of 3.6 per cent in trainees will have been a planned reduction. This mainly fell on the universities. Entries to EBITTs will have been limited by the cap on funded places, since the trainees draw a salary and are more expensive than PGCE trainees who pay fees. In the case of the SCITTs, although the totals hold up, there is considerable turnover in providers, suggesting that many schools are not ready to take on the training responsibilities. The willingness of trainees to come forward will have constrained provision, particularly in some subjects, and we will explore this further in Chapter 6.
Intake Characteristics
4.6 Who are the trainees? Chart 4.3 describes the characteristics of the 2009 intake as recorded in the 2011 Profiles. Recruits are predominantly female comprising just over four-fifths of the primary intake, and three-fifths of the secondary intake. The employment-based routes do attract more males to primary schools.
Chart 4.3: Intake Characteristics 2009-10
Characteristic Primary Secondary
All1
UNI SCITT EBITT UNI SCITT EBITT
%Male 15.2 20.2 19.6 38.0 42.0 37.6 27.6
%Ethnic Minority 9.0 8.3 9.6 14.1 10.3 12.1 11.4
%Age25+ 36.8 66.9 84.9 53.5 67.9 71.3 51.2
%Postgraduate 55.3 100.0 96.4 94.2 100.0 99.0 79.4
% Non UK Degree2 4.5 1.3 10.5 5.2 3.8 10.4 5.9
1. Includes KS2/3 intake.
2. Overseas entrants to EBITTs are high because the scheme includes the Overseas Trained Teachers Programme.
4.7 Overall one in nine of the recruits comes from an ethnic minority, with the proportion being higher for secondary than primary. University recruits, particularly the primary trainees, were younger than those on the SCITT and EBITT programmes, not unconnected with undergraduate provision. Approaching half (45
15 DFE (July 2011) National Pupil Projections; Future Trends in Pupil Numbers. Statistical Release. OSR 12/2011.

18
per cent) of the university trainees were following this route. Overall about six per cent entered on non-UK qualifications, particularly to EBITTs, which includes provision for those trained overseas.
4.8 Chart 4.4 traces the trends for the universities and SCITTs (EBITTs are omitted from this particular table because it was not an established route in the first profiles). It is an extract of Chart A5, page 51, in the appendix. It shows that in the past six years the characteristics of the trainees have remained much the same, though with some increase in recruits from ethnic minorities. The proportion is now almost double what it was in 1998.
Chart 4.4: Trends in ITT Intakes1,2
Characteristic 1998 2006 2007 2008 2009 2010 2011
Primary
%Male 14 13 13 13 14 14 15
%Ethnic Minority 5 8 8 8 8 9 9
%Age25+ n/a 43 40 39 38 36 39
%Postgraduate 41 58 57 56 57 57 58
%PG2.1+ degree 49 55 58 58 60 60 61
Primary Intake 12,523 15,894 16,073 15,285 14,933 15,067 15,775
Secondary
%Male 43 38 39 37 37 38 38
%Ethnic Minority 7 11 13 14 15 15 14
%Age25+ n/a 56 55 55 56 54 54
%Postgraduate 86 95 94 94 95 95 95
%PG2.1+ degree3 46 54 54 54 53 55 58
Secondary Intake 15,755 16,085 16,101 15,884 15,072 14,706 15,672
1. Extract from Chart A5 in appendix which gives trends profile by profile from 1998 to 2011.
2. Universities and SCITTs only since EBITT was not a category in the first profiles.
3. Percentage with good degrees is of total intake, not just those with UK degrees, since data on non-UK qualifications were not available for the first analyses. Chart 5.2 shows that the percentages were 63.8 per cent for primary and 61.5 per cent for secondary expressed as a percentage of UK qualifications only.
4.9 There has been a tendency in the recent past for teacher trainees to be, on average, older, but if anything in the past six years this has been reversing. More of the recruits are entering with a 2.1 or better, but we take up the question of entry qualifications in more detail in the next chapter.

19
5. Entry Qualifications
5.1 Are the entry qualifications of teacher trainees improving as has frequently been claimed? We saw in Chart 4.4 that the percentage with good degrees entering secondary ITT had gone up from 46 in 1998 to 58 in 2011, a rise of 26 per cent which seems conclusive enough. But it is the case that more first and upper-seconds are being awarded by universities. More of the more in the expanded higher education system are getting good degrees. In Chart 5.1 we put the two trends together. This strongly suggests that teaching is not increasing its relative share of good graduates, but is keeping pace with the expanding output.
Chart 5.1: Intake Qualifications1 and Degrees Awarded
2,3
0
10
20
30
40
50
60
70
1996 1997 1998 1999 2000 2001 2002 2003 2004 2005 2006 2007 2008 2009
Year
Per
Ce
nt
wit
h G
oo
d D
eg
ree
%2.1+ Secondary ITT
%2.1+ Awarded
1. Percentage taken from Chart 4.4 which does not include EBITTs and calculates the percentage with good degrees on the basis of all entrants not just those with UK degrees
2. Percentages are for: (i) the year of entry to teacher training; and (ii) degrees awarded in the year which would have fed into those teacher training admissions.
3. Full-time, home domiciled, UK graduates.
5.2 There have though to be some caveats. The calculation for ITT entrants does not include EBITTs, which as we shall be seeing would lower the percentage somewhat. But it is also based on the total number of entrants not just those with UK qualifications. If non-UK degrees are excluded (since they are not classified in the same way) we can see from Chart 5.2 that the percentage goes up by about 3 percentage points which is enough to close the gap with the degrees-awarded trend line. Nevertheless, the substantive point remains: teaching does not appear to be increasing its share of good graduates.
University ITT Entries
5.3 About four-fifths of the trainees entered universities to take either the PGCE or an undergraduate course leading to QTS. Chart 5.2 shows that with non-UK qualifications taken out of the calculation just over three-fifths of the trainees entered on good degrees. The percentage was slightly higher for primary courses,

20
perhaps reflecting the greater competition in this phase for places. The percentage was markedly lower for key stage 2/3 courses suggesting that these may have been offered as an alternative to those not getting their first choice.
Chart 5.2: University Postgraduate ITT Courses
Phase Providers Entrants UK
Qualifications Good Degree
% Good
Degree1
Primary 58 8,224 7,850 5,008 63.8
Key Stage 2/3 6 252 248 132 53.2
Secondary 72 13,961 13,229 8,134 61.5
Total 75 22,437 21,327 13,274 62.2
1. Percentage of entrants with first or upper-second expressed as percentage of trainees entering on UK qualifications.
5.4 Paradoxically, entrants to the small number of universities offering undergraduate KS2/3 were more likely to have entered with A-levels than entrants to the primary and secondary courses. But in none of the phases were the percentages those to be expected of degree courses. It will, of course, differ across the subjects and we look at the distribution across subjects in the next chapter (Chart 6.5, page 25).
Chart 5.3: University Undergraduate Courses
Phase Providers Entrants A-Levels % A-Levels
Primary 44 6,646 3,917 58.9
Key Stage 2/3 5 310 219 70.6
Secondary 18 8531 450 52.8
Total 46 7,809 4,586 58.7
1. Total differs from Chart 6.1 since this table does not contain EBITTS, whereas 6.1 does.
UNIs, SCITTs and EBITTs
5.5 Chart 5.2 shows postgraduate entrants to just the universities. In Chart 5.4 we compare them to all postgraduate providers. Entrants to university courses, on average, are better qualified than those training in SCITTs and EBITTs. The SCITT and EBITT entrants are older and so would have obtained their degrees when fewer firsts and upper-seconds were awarded, and the subject composition is different, but why the university ITT courses should attract the more highly qualified merits further investigation.
Chart 5.4: Good Degrees1 by Provider Type
Phase
Universities SCITT EBITT All
Entrants % Good
Degree Entrants
% Good
Degree Entrants
% Good
Degree Entrants
% Good
Degree
Primary 8,224 63.8 905 58.6 2,083 56.2 11,212 62.0
Key Stage 2/3 252 53.2 - - 55 38.0 307 50.7
Secondary 13,961 61.5 858 56.4 4,164 59.8 18,983 60.9
Total 22,437 62.2 1,763 57.5 6,302 58.4 30,502 61.2
1. First or 2i. as percentage of UK qualifications ie non- UK degrees not included.

21
5.6 Employment-based teacher training is an heterogeneous category. Separating it into its components reveals big differences in entry qualifications. In Chart 5.5 we can see how the 6,302 postgraduate EBITT trainees in the 2011 Profiles are shared between Teach First, the Graduate Teacher Programme and the Overseas Trained Teacher Programme. The major component is the GTP contributing four-fifths of the total, and the percentage with good degrees is thus close to the EBITT average. But the contrast between Teach First and the OTTP is striking. Of the TF entrants (7.6 per cent of the EBITTs, 1.2 per cent of the entrants overall), 94.1 per cent had good degrees, not surprising since it is a requirement.
Chart 5.5: Good Degrees1 by EBITT
EBITT
Primary KS2/3 Secondary All
Entrants % Good
Degree
Entrants % Good
Degree
Entrants % Good
Degree
Entrants % Good
Degree
Teach First 27 92.3 - - 453 94.2 480 94.1
GTP 1731 59.7 40 47.5 3303 57.0 5074 57.8
OTTP 325 4.5 15 0.0 408 5.6 748 4.9
Total 2083 56.2 55 38.0 4164 59.8 6302 58.4
1. First or 2i. as percentage of UK qualifications ie non- UK degrees not included.
5.7 At the other end of the scale, only one in 20 of the OTTP trainees had good UK degrees. One wonders if they had been recruited to the OTTP programme rather than the GTP programme because their UK qualifications were poor. It needs to be emphasized that the OTTP percentages of good degrees in Chart 5.5 are percentages of just those with UK qualifications.

22
6. Subjects
6.1. Recruitment to secondary teacher training is the sum of recruitment to the individual subjects. Some subjects find it easy to recruit and others struggle. This will be reflected in the entry qualifications since popular courses will have more choice over whom to accept.
Postgraduate Trainees
6.2. Chart 6.1 shows good degrees by subject as a histogram. It is based on the data of Chart A6, page 52, in the appendix. The percentages include all three training routes, but not non-UK qualifications. The trainees with the best degrees are in classics (92.1 per cent), history (79.2per cent), drama/dance (78.5 per cent), and English (76.2 per cent). The least well qualified are in ICT (49.8 per cent) mathematics (51.0 per cent), vocational subjects (48 per cent), and science (54.6 per cent). This pattern has persisted over a number of years and it is indicative of the competition for places. It means that children are more likely to find themselves with knowledgeable teachers in subjects like history and English than in maths, the physical sciences and ICT. Given the importance of high quality teachers this is likely to have a bearing on the subject choices of the pupils as they progress through school, and how well they do.
0
10
20
30
40
50
60
70
80
90
100
Per
Cen
t 2.1
+
Cla
ssics
His
tory
Dra
ma/Dan
ce
Engl
ish
Social
Sci
/Std
Citz
ensh
ip
Art&Des
ign
Music
RE
Citz
ensh
ip
Geo
grap
hy
Mod
Lang
Bus
ines
s Stu
dies
D&T
PE
Scien
ce
Voca
tiona
l Subj
ects
Mat
hs ICT
1. All entrants to universities, SCITTs and EBITTs on UK degrees or equivalent with an upper-second or above, but excluding non UK degrees. See Chart A6 in appendix. The following routes and subjects are not included here, but their details are given in Chart A6: University of Gloucester assessment only, diplomas, economics and other EBITTs.

23
6.3. The Government is anxious to tackle the issue of teacher quality head-on, and it is proposing to fund only trainees who hold at least a lower-second16. It becomes important, therefore, to attempt to gauge what the effects of this policy might be. Chart 6.2 shows the percentages of the entrants in the 2011 Profiles who did not have at least a lower-second. The final column includes those entering on poor UK degrees and non-UK degrees since both give an indication of how difficult it is to fill the places.
Chart 6.2: Degrees of Secondary Postgraduate Trainees by Subject
Subject Entrant Non UK
Degree
%Non-UK
Degree1
UK
Qualified
Below
Lower
Second
%Below
Lower
Second2
%Both
Non-UK &
Poor UK3
Modern Languages 1,607 401 25.0 1,206 188 15.6 36.7
Economics 11 2 18.2 9 2 22.2 36.4
Maths 2,551 201 7.9 2,350 437 18.6 25.0
Science 3,369 178 5.3 3,191 447 14.0 18.6
ICT 884 24 2.7 860 105 12.2 14.6
Design & Technology 1,211 29 2.4 1,182 141 11.9 14.0
Business Studies 593 47 7.9 546 31 5.7 13.2
Vocational Subjects 457 12 2.6 445 43 9.7 12.0
Music 751 33 4.4 718 54 7.5 11.6
Art and Design 654 16 2.4 638 57 8.9 11.2
Social Science/Studies 131 8 6.1 123 6 4.9 10.7
Geography 722 22 3.0 700 52 7.4 10.2
Physical Education 1,179 39 3.3 1,140 74 6.5 9.6
English 2,220 103 4.6 2,117 107 5.1 9.5
Citizenship 273 11 4.0 262 12 4.6 8.4
Religious Education 821 26 3.2 795 39 4.9 7.9
History 747 29 3.9 718 25 3.5 7.2
Drama/Dance 490 12 2.4 478 18 3.8 6.1
Classics 39 1 2.6 38 1 2.6 5.1
Other4 273 17 6.2 268 35 13.0 19.0
Total 18,983 1,199 6.3 17,784 1874 10.5 16.2
1. Per Cent of Entrants.
2. Per Cent of UK Qualified.
3. Per Cent of Entrants.
4. 116 assessment only trainees at University of Gloucester, 3 EBITT other trainees in other subjects and 154 Diploma trainees.
6.4. Taking both indicators together, modern languages, maths and science emerge as the subjects that struggle most. More than a third of the trainees in modern languages (36.7 per cent), a quarter in maths (25.0 per cent), and nearly a fifth in science (18.6 per cent) do not hold at least a 2.2. The handful of economics recruits are similarly poorly qualified, but this is something of a special case. The universities have stopped initial teacher training for the subject, subsuming it in business studies.
16 Training Our Next Generation of Outstanding Teachers. An Improvement Strategy for Discussion,
June 2011, paragraph 4, Page 3. DFE-00054-956-2011. ISBN: 978-1-84775-956-6.
www.education.gov.uk/publications

24
There is, however, some demand for economics teachers per se and this is being met by EBITTs, including OTTP trainees.
6.5. The situation in science is even more acute than shown in Chart 6.2 since the relatively strong recruitment to biology masks the shortfalls in physics and chemistry. Chart 6.3 shows that nearly a quarter of the physics trainees and over a fifth of the chemistry trainees lack at least a lower-second, and this is not compensated for by the combined/general category since over a fifth of the trainees here also are poorly qualified.
Chart 6.3: Degrees of Secondary Science Trainees
Science Entrant Non UK
Degree
%Non-UK
Degree1
UK
Qualified
Below
Lower
Second
%Below
Lower
Second2
%Both
Non-UK &
Poor UK3
Physics 491 24 4.9 467 92 19.7 23.6
Chemistry 789 33 4.2 756 126 16.7 20.2
Biology 1,114 48 4.3 1,066 97 9.1 13.0
Combined/General 975 73 7.5 902 132 14.6 21.0
Total 3,369 178 5.3 3,191 447 14.0 18.6
1. Per Cent of Entrants.
2. Per Cent of UK Qualified.
3. Per Cent of Entrants.
6.6. Chart 6.3 includes all the routes including the EBITTs, so lost within the combined/general science category are the extremely well qualified Teach First recruits. Chart 6.4 shows that all the Teach First science trainees are classified as ‘combined/general’ so we cannot tell what contribution this programme is making to the shortfalls in physics and chemistry. The Graduate Teacher Programme attracted 50 trainees to physics and 84 to chemistry, but OTTP added only 14 altogether.
Chart 6.4: EBITT Secondary Science Trainees
Phase Teach First GTP OTTP All
Physics - 50 4 54
Chemistry - 84 10 94
Biology - 90 16 106
Combined/General 98 181 51 330
Total 98 405 81 584
Undergraduate Secondary17
ITT Entry Qualifications by Subject
6.7. Undergraduate courses did little to make-up the shortfalls either. Chart 6.5 shows that in total they contributed only 893 out of the 19,876 the secondary teacher trainees (4.5 per cent). Nearly half (45.6 per cent) were in PE courses. Only two were in modern languages, one in physics, and seven in chemistry, although there were 129 in mathematics. The chart also raises questions about the entry qualifications. Only about half the undergraduate ITT entrants had two A-levels, although over four-fifths of those taking religious studies and geography did.
17 The small number of key stage 2/3 trainees are also classified by subject, but are left aside for consistency.

25
Chart 6.5: Undergraduate Secondary ITT Courses by Subject
Subject Entrants A-Levels %A-Levels
Religious Education 13 11 84.6
Geography 10 8 80.0
English 30 18 60.0
Physical Education 407 222 54.5
Maths 129 67 51.9
Science 75 38 50.7
Biology 3 1 33.3
Physics 1 0 0.0
Chemistry 7 3 42.9
General/Combined 64 34 53.1
ICT 63 29 46.0
Design & Technology 140 55 39.3
Music 16 2 12.5
Others1 10 0 0.0
Total 893 450 50.4
1. art and design,2; drama/dance, 2; citizenship, 2; history,1; modern languages,2; and vocational subjects, 1.
6.8. The low entry qualifications of some postgraduate and undergraduate trainees, as the Government recognises, has to be tackled. No one wants to see teachers attempting to teach subjects which they do not fully grasp themselves. But if not enough people with the necessary expertise put themselves forward, the difficult question that has to be faced in formulating policy is: is it better to have an able graduate who has not studied a subject at university or someone who has studied the subject at university but not done very well in it? Is it better, for example, to have a good biologist or a poor physicist teaching physics?

26
7. QTS and Into Teaching
7.1. In 2009-10 (2011 Profiles) there were 39,103 final-year trainees, 674 (1.8 per cent) more than the entrants. Although most teacher training courses last a year (only the final-year of undergraduate ITT degrees is taken into account in this chapter), some do not and not all trainees qualify at the first time of asking. The major contribution to the higher number of final-year trainees is an extra 391 EBITTs who will have taken less than a year to qualify. Nevertheless, the trainees in Chart 7.1 are substantially the same as the entrants in Chart 4.1.
Chart 7.1: Final Year Trainees
University UNI SCITT EBITT Total
Primary
Undergraduate 5,740 - 106 5,846
Postgraduate1 8,507 907 2,170 11,584
Key Stage 2/3
Undergraduate 189 - - 189
Postgraduate 312 - 51 363
Secondary
Undergraduate 818 - 53 871
Postgraduate1 14,974 845 4,431 20,250
Total 30,540 1,752 6,811 39,103
1. Includes assessment only University of Gloucester.
7.2. Chart 7.1 shows the distribution of those trainees across the various routes – 78.1 per cent in universities; 4.5 per cent in SCITTs and 17.4 per cent in EBITTs. Four-fifths (82.3 per cent) were on postgraduate programmes. In terms of phase, 54 per cent were secondary, 44.6 per cent primary, and only 1.4 per cent KS2/3.
Entry to Teaching
7.3. Chart 7.2 shows how many of the final-year trainees – university, SCITT and EBITT (for the first time this year) – achieved QTS and took teaching posts. Just over 70 per cent (71.5 per cent) of the final-year were recorded as being in teaching the following January, with higher percentages for SCITTs and EBITTs than universities. Postgraduate trainees were more likely to be in teaching than undergraduate trainees. The lowest conversion rate of training into teaching posts was for KS2/3 courses, which must put a question mark against these courses.
7.4. About 11 per cent overall failed to complete their courses on time and a further 17.4 per cent were not recorded as being in teaching. This does not mean that the trainees do not ever enter teaching (see trend lines in Chart 3.2, page 14). They may not have been able to get a job they wanted straightway, or taken a gap year, or looked for other experiences. But the process does seem wasteful especially bearing in mind that there are more teachers of working age not in schools than there are in teaching18.
18 According to Hansard Written Answers for 17 March 2010 there were, in March 2008, 483,760 teachers under age 60 who have never entered service in maintained schools (including city technology colleges and academies), have left service or who are in service in other sectors or outside England.

27
Chart 7.2: Final Year Trainees by QTS and Employment
Provider Final Year
Trainees
Awarded
QTS
% Awarded
QTS In Teaching
% In
Teaching1
Course
Undergraduate 6,906 6,145 89.0 4,637 67.1
Postgraduate 32,197 28,651 89.0 23,339 72.5
Provider Type
Universities 30,540 26,936 88.2 21,482 70.3
SCITTs 1,752 1,602 91.4 1,369 78.1
EBITTs 6,811 6,258 91.9 5,125 75.2
Phase
Primary 17,430 15,706 90.1 12,281 70.5
Key Stage 2/3 552 468 84.8 352 63.8
Secondary 21,121 18,622 88.2 15,343 72.6
Total 39,103 34,796 89.0 27,976 71.5
1. Percentage of final-year trainees. The TDA expresses employment as a percentage of only those achieving QTS so the figures are higher.
7.5. EBITT is a mixed bag, and in Chart 7.3 we separate out the four main strands. All three postgraduate strands achieved pass rates above those of university courses and comparable with that of the SCITTs. Teach First stood out in entry to teaching on completion. GTP trainees were also more likely to be in teaching. But those on the Overseas Trained Teachers Programme had already begun to fall away and, as we saw in Chart 3.319, Page 15) this continued in the first years of teaching. It is also true that, after four years, only about half the Teach First trainees remain in teaching, exercising the option designed into the programme to pursue careers in business, industry and elsewhere.
Chart 7.3: EBITT Trainees by QTS and Employment
EBITTs Final Year
Trainees
Awarded
QTS
% Awarded
QTS In teaching
% In
Teaching1
TFP 474 452 95.4 434 91.6
OTTP 800 737 92.1 530 66.3
RTP 159 130 81.8 95 59.7
GTP 5,378 4,939 91.8 4,066 75.6
Total 6,811 6,258 91.9 5,125 75.2
1. Percentage of final-year trainees. The TDA expresses employment as a percentage of only those achieving QTS so the figures are higher.
Teaching in Maintained or Independent Sectors
7.6. So far we have been treating ‘in teaching’ as a general category including all those known to be taking posts irrespective of sector. The publicly funded training system is intended mainly to train teachers for maintained schools so it is important to see how many make this their destination. Chart 7.4 shows that of the 70 per cent or so
Statistical First Release 26/2008 records that in January 2008 there were 441,200 full-time equivalent teachers in maintained schools (including city technology colleges and academies) in England. 19 In Chart 3.3 the percentages are of those who successfully completed. In Chart 7.3 the percentages are of final-year trainees, ie including in the calculation those who dropped out in the final year.

28
entering teaching of any kind, 62.2 percentage points are posts in maintained schools, 4.9 percentage points in independent schools, and a further 4.4 percentage points in ‘other’ education.
Chart 7.4: Types of Teaching Entered1
Phase and Course Maintained Non-Maintained Not Known Total
N %2 N %
2 N %
2 N %
2
Primary
Undergraduate 3,510 60.0 153 2.6 247 4.2 3,910 66.9
Postgraduate 7,492 64.7 415 3.6 464 4.0 8,371 72.3
Key Stage 2/3
Undergraduate 106 56.1 10 5.3 7 3.7 123 65.1
Postgraduate 159 43.8 26 7.2 44 12.1 229 63.1
Secondary
Undergraduate 505 58.0 37 4.2 62 7.1 604 69.3
Postgraduate 12,567 62.1 1,269 6.3 903 4.5 14,739 72.8
Total 24,339 62.2 1,910 4.9 1,727 4.4 27,976 71.5
1. Includes universities, SCITTs and EBITTs
2. Percentages of final-year trainees.
Chart 7.5: Postgraduate Secondary Trainee Outcomes by Subject
Subject1
Final Year
Trainees
Awarded
QTS
%Awarded
QTS In Teaching % In Teaching
Economics 11 11 100.0 10 90.9
Classics 44 43 97.7 38 86.4
Social Sci/Studies 132 122 92.4 114 86.4
Drama/Dance 521 488 93.7 437 83.9
PE 1,210 1,164 96.2 990 81.8
English 2,330 2,108 90.5 1,868 80.2
History 782 736 94.1 618 79.0
Geography 749 688 91.9 591 78.9
D & T 1,296 1,149 88.7 972 75.0
Art & Design 703 635 90.3 512 72.8
Vocational Studies 476 438 92.0 344 72.3
Business Studies 621 556 89.5 448 72.1
RE 848 753 88.8 608 71.7
Mathematics 2,843 2,390 84.1 1,991 70.0
Music 795 719 90.4 552 69.4
Science 3,688 3,115 84.5 2,542 68.9
Citizenship 281 235 83.6 187 66.5
Modern Languages 1691 1463 86.5 1,117 66.1
ICT 962 804 83.6 623 64.8
Total1 20,250 17,858 88.2 14,739 72.8
1. Does not include assessment only trainees at the University of Gloucester since they are not identified by subject: 125 were assessed and 117 achieved QTS of whom 114 (91.2%) were in teaching the following January.

29
Subjects
7.7. The percentage entering teaching varies considerably with subject. Chart 7.5 shows that in the main it correlates with entry qualifications and is the inverse of the difficulty of recruiting trainees. The top subjects for the award of QTS were generally those with the highest entry qualifications – classics, history, and drama/dance – and trailing were those with the poorest – ICT, modern languages and science. The correlation was close, but not perfect. PE and economics with modest entry qualifications had a high success rate for QTS. In citizenship had a low completion rate in spite of the good entry qualifications.
7.8. High QTS completions were generally associated with high rates of entry to teaching, with economics, classics and social studies, being at the top, and ICT, modern languages and citizenship trailing. But demand for the subject also comes into play. In history 94.1 per cent were awarded QTS, but only 70 per cent had obtained teaching posts by the following January.
Science
7.9. Science is down the list, with 84.5 per cent awarded QTS and 68.9 per cent entering teaching. But there are important differences between the sciences. Chart 7.6 shows that not only do the physical sciences find it hard to attract trainees, but fewer enter teaching. Of the recruits to postgraduate programmes in physics and chemistry, approaching a fifth did not complete successfully and a further third did not make it to the classroom.
Chart 7.6: Outcomes for Secondary Science Trainees1
Subject Final Year
Trainees
Awarded
QTS
%Awarded
QTS In Teaching % In Teaching
Undergraduate
Physics 4 3 75.0 2 50.0
Chemistry 8 5 62.5 5 62.5
Biology 2 2 100.0 2 100.0
Combined/General 39 32 82.1 21 53.8
Total 53 42 79.2 30 56.6
Postgraduate
Physics 577 470 81.5 382 66.2
Chemistry 914 731 80.0 594 65.0
Biology 1,188 1,028 86.5 853 71.8
Combined/General 1,009 886 87.8 713 70.7
Total 3,688 3,115 84.5 2,542 68.9
Grand Total 3,741 3,157 84.4 2,572 68.8
1. Includes universities, SCITTs and EBITTs – employment data for EBITTs makes this possible for the first time this year.
7.10. Chart 7.6 also shows that undergraduate courses make almost no contribution to the supply of science teachers. Of the 53 final-year trainees a fifth failed to complete and only 30 took teaching posts. Only two physics teachers and five chemistry teachers came via this route.

30
8. Policy Pointers
8.1. The Government attaches considerable importance to raising the quality of England’s teachers. In its Schools White Paper20, The Importance of Teaching, published in November 2010 it outlined (page 20) its intentions to:
raise the quality of new entrants to the profession by ceasing to fund initial teacher training for those who do not have at least a 2.2;
reform initial teaching training so that more training is on the job;
create a new national network of Teaching Schools, on the model of teaching hospitals.
8.2. These aspirations have been fleshed out in a discussion document21, Training Our Next Generation of Outstanding Teachers, issued in June 2011which proposes action in three main areas (page 3):
raising the bar for entry;
refocus government investment in teacher training so that it is effective in attracting and retaining in teaching more of the best graduates, especially in the shortage subjects;
improve the routes through teacher training, so it is easier to apply for teacher training and so that the nature and content of the training is more effective in preparing trainees to be successful in the classroom.
Its enthusiasm for on-the-job training seems much more muted in the discussion document than the White Paper.
8.3. In its reforms the Government has to start from where the system is now. In this chapter we focus on the numerical landscape with which it will have to contend as it seeks to implement its proposals. The Training and Development Agency for Schools, through its Data Collection and Analysis Section, holds an excellent evidence base. Each year since 1998 the TDA has published a performance profile for each teacher training provider. And each year since 1998 CEER has summarized these detailed data to enable broad comparisons to be made. For the first time this year, with the publication of teaching take-up figures for the employment-based routes, it has been possible to compare all the training routes. The data held by the TDA have been further strengthened by matching trainees achieving QTS with the register of the General Teaching Council for England so that it has been possible to look beyond the January after qualifying.
8.4. From our reading of the statistics we would suggest five policy pointers for the Government: re-balancing teacher training; raising the bar; value for money; Teach
20 The Importance of Teaching. The Schools White Paper 2010, DFE, Cm 7980, London: The Stationery Office. 21 Training Our Next Generation of Outstanding Teachers. An Improvement Strategy for Discussion,
June 2011, DFE-00054-956-2011. ISBN: 978-1-84775-956-6.
www.education.gov.uk/publications

31
First; and the need for a strong data collection and analysis section in the new Teaching Agency22.
Re-Balancing the System
8.5. Currently the universities recruit four-fifths of the nearly forty thousand trainees estimated to be required each year. In the 2011 Profiles 78.1 per cent of the final-year trainees were in universities and 18.2 per cent on school-led training23 in SCITTs and on the GTP. There is clearly scope for some re-balancing, and as we have seen (Charts 7.2 and 7.3, page 27), on school-led schemes more of the trainees become teachers. Recruitment also directly meets the needs of the schools. School-led recruitment and training is a one-stage process as used by most employers, whereas with training exported to the universities it is a two-stage process in which the education departments have to fill their places irrespective of how well they meet the needs of schools. No matter how good the entry qualifications or how pleased Ofsted is with the provision, teacher training fails if the trainees do not enter teaching. The present process is very wasteful, even with the school-led trainees included, since only about three out of five final-year trainees is to be found teaching in maintained schools in the January after qualifying. A more direct relationship between the training and the needs of the schools would seem to offer much better value for money.
8.6. But the Government has to reckon with the SCITT and EBITT routes not having grown in the past six years. The limitation on the GTP is that it is expensive. The trainees are paid a salary, met by the Government, and the trainee is additional to the school’s staff. In its discussion document, the Government is proposing that schools should find some of the salary themselves with the trainees no longer supernumerary. Whether the GTP will then continue to be attractive to schools remains to be seen, but freeing up the route would enable it to grow. Receiving a salary potentially has much more appeal than paying PGCE tuition fees. These are ameliorated to some extent by bursaries, but nevertheless there is considerable financial advantage to the GTP. Properly funded the GTP could be the engine of the change the Government says it wishes to make.
8.7. The school-centred schemes (SCITTs), too, have been flat-lining in recent years, and contribute only 4.5 per cent of final-year trainees. Although the total numbers remain about the same, there is considerable provider turnover. Why SCITTs come and go so frequently should be investigated, but there is the possibility that although schools may be attracted to the idea of running or playing a major part in teacher training, doing so may ask more of them than they can offer on top of their main task of teaching children. The Government is hoping to catalyse the process by accrediting Teaching Schools to form Teaching School Alliances (discussion document, para 8, page 14). This could work. One of the first old-style Training
22 The Training and Development Agency for Schools will from April 2012, subject to necessary approval, become the Teaching Agency, an executive agency responsible for the supply of, and regulating, teachers, incorporating key functions currently carried out by the TDA, the General Teaching Council for England, the Children’s Workforce Development Council and the Qualifications and Curriculum Development Agency. 23 The Government in its discussion document has taken to linking SCITTs and the GTP strand of EBITTs as school-led, distinguishing them from Teach First which is organised by a charity and OTTP which is a conversion scheme for teachers trained outside the European Economic Area.

32
Schools formed in 2001, Southfields Community College (Wandsworth) was the leading EBITT in our analysis, and the seventh most successful provider overall. The Government cites Teaching Hospitals as the model. But there is a practical difficulty. Hospitals are large and patient care is one-to-one, so many trainees can be absorbed in the one institution. In schools, however, children are taught in groups of twenty or more, and parents are liable to grow restive if their child’s education consists of wall-to-wall trainees.
Raising the Bar
8.8. It is self-evidently important that teachers should have expertise in the subjects they teach - and degree class is the best measure of that expertise we have. It is understandable why the Government should want to ensure that the people it funds to train as teachers have demonstrated a sufficient grasp of their subject. This it defines as having at least a lower-second (discussion document, para10, page 5). It could be that this will, as the Government hopes, raise the status of teaching among graduates, and also cut down on the wastefulness of the training process. Certainly something needs to be done. Teaching has not been increasing its share of good graduates in real terms. It is true the nominal percentage has gone up, but this has been in lock-step with more being awarded by the universities.
8.9. But the Government will have to take on board the attractiveness of teaching to graduates of different subjects. Over a third of the trainees in modern languages (36.7 per cent), a quarter in maths (25.0 per cent) and physics (23.6 per cent), and a fifth in chemistry (20.2 per cent) and combined science (21.0 per cent) lacked a 2.2 degree. To combat this, the Government has proposed (discussion document, para 7, page 9) a differential system of bursaries with perhaps £20,000 going to the best qualified in the high priority specialisms (mathematics, physics, chemistry, but curiously not modern languages given its role in the new English baccalaureate). This could work, but the shortfalls in these subjects may be rooted in the personalities of the people attracted to these subjects24. The satisfactions of teaching interacting with lively and energetic young people all day every day are different from the impersonal abstract patterns that are the stuff of mathematics and the physical sciences. The sort of person drawn to one may not be comfortable with the other. There is the risk that large incentives to train may boost intakes of cash-strapped graduates, but not add much to the supply of teachers once the minimum period of service had been completed. Even now fewer of the trainees in these subjects become and remain as teachers.
8.10. The Government may have to accept that the shortages will be a continuing feature of our education system, as they are for many other countries, and begin to work out ways of bringing the most able pupils in those subjects together with the best teachers. A number of countries, including the United States, Japan, Korea, and Singapore have, for example, science schools25. High schools in this country, with entry at age 13 or 14, are already among the best performing schools for physics26.
24 Smithers, A. and Hill, S. (1989). ‘Recruitment to physics and maths teaching: a personality problem?’ Research Papers in Education, 4, 3-21. 25 Smithers, A. and Robinson, P. (2009). Specialist Science Schools. Buckingham: Carmichael Press. 26 Smithers, A. and Robinson, P. (2007). Physics in Schools: Bucking the Trend. Buckingham: Carmichael Press.

33
Question Marks
8.11. Teacher training is very diverse. There are so many elements to it that the performance of particular types of provision may be overlooked. The data of the 2011 put question marks against three of the types of provision: the Overseas Trained Teacher Programme, undergraduate ITT degrees for the secondary phase, and key stage 2/3 courses.
Overseas Trained Teacher Programme
8.12. The OTTP is wrapped up with other EBITT programmes. The trainees have very poor UK qualifications, but it was assumed to be making a worthwhile contribution to the supply of teachers in some of the shortage subjects. In fact, in 2011, it contributed only four physics teachers and ten chemistry teachers. But what Martin Furner’s analysis at the TDA (illustrated in Chart 3.3, page 15) reveals is that the percentage of OTTP trainees remaining in teaching in schools in England after qualifying drops sharply from its initial level. This merits further investigation, since it may well show that the OTTP is not value for money.
Secondary Undergraduate ITT
8.13. Last year we suggested there was a case for phasing out secondary undergraduate ITT courses, except perhaps for physical education, and that continues to be our view. In the 2011 Profiles there were only 893 final-year students including 407 in PE. Only about half had entered with A-levels, and education has among the poorest entry qualifications of all degree fields. The courses make almost no contribution to the shortage subjects, with in the 2011 Profiles only two entering modern languages, one physics and seven chemistry. Less than half of even these paltry numbers are likely to make it to the classroom.
Key Stage 2/3 Courses
8.14. Concerns were also expressed about KS2/3 courses, and these remain. In the 2011 Profiles only 1.4 per cent of the final-year trainees (552 out of 39,103) were on these courses and less than two-thirds had obtained teaching posts by the January following completion. The postgraduate trainees were poorly qualified and may have been offered places as alternative to other courses which were full or for which they were not qualified.
Teach First
8.15. The Government is setting great store by Teach First (discussion document, paras 14-17, page 7). It believes that the scheme has brought into teaching a substantial number of graduates with good degrees from elite universities who would not otherwise have been attracted to the profession. It also claims that it is bringing the well-qualified in shortage subjects into challenging schools.
8.16. Teach First has undoubtedly generated considerable interest, but it has to be seen for what it is. It was originally devised as a two-year commitment on the part of highly able graduates intending a career in business and industry who wanted to give something back through teaching. After the two years it was expected that most would pursue their original career plans and that they would be given recognition by major employers for the service they had given. Numbers of Teach First trainees were very small. In 2005/6 there were 149 on the scheme of whom, after four years,

34
63 (42.3 per cent) had chosen to remain in teaching and 86 had moved on. It is not clear whether Teach First can be scaled up in its original form (where the number of interested major employers must be a limiting factor) or in its expansion it will morph into another teacher training route. In the 2011 Profiles it is still very small with only 480 trainees or 1.2 per cent of the total. If only half stay in teaching this will add just 240 to the supply - a welcome plus perhaps, but not substantial. We cannot tell how many will help make up the shortfalls in physics and chemistry since all the Teach First science trainees are classified together.
A Numerical Picture
8.17. Sound policy depends on knowing exactly where it is starting from. England currently has an excellent statistical base. At a European conference a little while ago we found the richness of teacher training data in England was greatly envied, and only the Netherlands, Sweden and Iceland came anywhere close in being as quantitatively aware of their teacher training systems.
8.18. This owes much to the Training and Development Agency’s Statistics and Analysis Division and it is important that this vital function is carried forward as the TDA becomes merged into the Teaching Agency. It is also extremely important to preserve the General Teaching Council’s register when it becomes part of the new Agency. It is not only intrinsically important but a very valuable source of data. As we saw in Chapter 3 when the TDA Profiles are matched to the GTC(E) register it is possible to track the trainees into teaching, and the picture that emerges four years on is rather different from that in the January after completion.
Conclusion
8.19. The Government is proposing to embark on major reforms of the teacher training system. This report sets out the numerical base from where it has to start.

35
Appendix
Methods
A.1 Rankings: CEER rankings are based on data compiled by the Training and Development Agency for Schools (TDA). The profiles run a year in arrears to allow for employment data to be collected. The 2010 Profiles relate to the training year 2008-09. The rankings are based on entry qualifications, Ofsted ratings, and the proportion of trainees known to be entering teaching (independent and other sectors, as well as maintained). The raw scores are standardised to a mean of 500 and a standard deviation of 100. For each provider the primary and secondary scores are averaged, weighted by the size of the intake. The university and SCITT providers are standardised together in the one pool so the scores are directly comparable.
A.2 Intake: The score for postgraduate courses is based on the proportion entering with a first or upper-second. For undergraduate courses the average UCAS tariff score is divided by 360. Where an institution offers both undergraduate and postgraduate courses, the contributions to the overall score are weighted by the size of the intakes.
A.3 Quality: The quality score is based on the latest available Ofsted inspections. There are two regimes currently in use. In the earlier one the score is based on the individual grades for ‘training’; ‘standards’; and ‘management and quality’. The grades for training and standards have been doubled to be consistent with a yet earlier inspection regime and the total score has been subtracted from 20 and multiplied by 200/15 to give a score out of 200, which is then standardised to a mean of 500 and a standard deviation of 100. An overall rating was obtained for secondary provision by combining the grades for each of the subjects in proportion to the number of trainees. The new inspection regime grades providers on just two dimensions ‘overall effectiveness’ and ‘capacity to improve’. We have combined those grades to create what is, in effect, a nine point scale arrived at from two ‘grade 1’, then ‘grade 1 plus grade 2 or vice versa’ through to ‘two grade 4’. This has been used in our analysis to locate the provider on a scale from 200 to 0 which has been standardised across the universities and SCITTs in the usual manner.
A.4 In Teaching: The percentage of the final-year students recorded as being in a teaching post six months after completing is summed across courses and multiplied by 2 to give a maximum score of 200. All final-year students are included whether they are undergraduate or postgraduate. As with the other dimensions it is standardised.
A.5 Coverage: The rankings include all providers in 2008-09 with a minimum of 10 entrants for whom full information was available on intake qualifications, inspection grades and entry into teaching. Key stage 2/3 courses are not included in the league tables because there is no separate inspection information for them, but they are included in the trend and other tabulations. No employment data is collected for employment-based routes so we are unable to include them in the league tables either
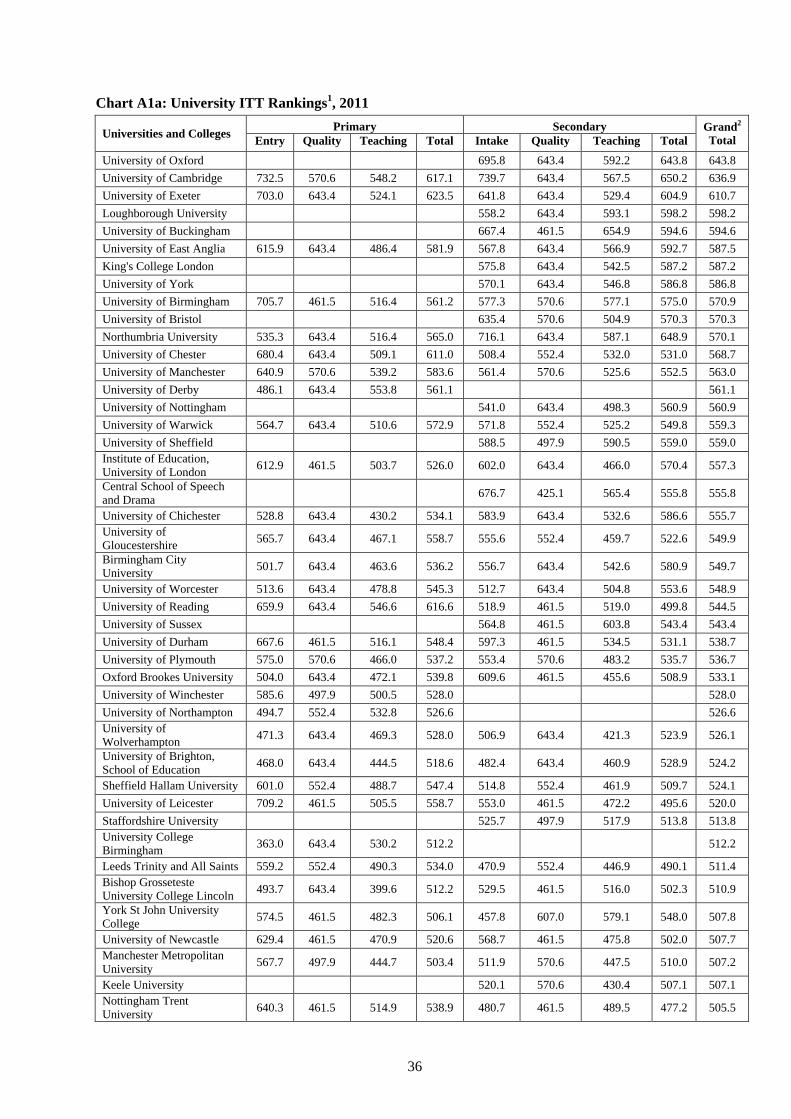
36
Chart A1a: University ITT Rankings1, 2011
Universities and Colleges Primary Secondary Grand
2
Total Entry Quality Teaching Total Intake Quality Teaching Total
University of Oxford 695.8 643.4 592.2 643.8 643.8
University of Cambridge 732.5 570.6 548.2 617.1 739.7 643.4 567.5 650.2 636.9
University of Exeter 703.0 643.4 524.1 623.5 641.8 643.4 529.4 604.9 610.7
Loughborough University 558.2 643.4 593.1 598.2 598.2
University of Buckingham 667.4 461.5 654.9 594.6 594.6
University of East Anglia 615.9 643.4 486.4 581.9 567.8 643.4 566.9 592.7 587.5
King's College London 575.8 643.4 542.5 587.2 587.2
University of York 570.1 643.4 546.8 586.8 586.8
University of Birmingham 705.7 461.5 516.4 561.2 577.3 570.6 577.1 575.0 570.9
University of Bristol 635.4 570.6 504.9 570.3 570.3
Northumbria University 535.3 643.4 516.4 565.0 716.1 643.4 587.1 648.9 570.1
University of Chester 680.4 643.4 509.1 611.0 508.4 552.4 532.0 531.0 568.7
University of Manchester 640.9 570.6 539.2 583.6 561.4 570.6 525.6 552.5 563.0
University of Derby 486.1 643.4 553.8 561.1 561.1
University of Nottingham 541.0 643.4 498.3 560.9 560.9
University of Warwick 564.7 643.4 510.6 572.9 571.8 552.4 525.2 549.8 559.3
University of Sheffield 588.5 497.9 590.5 559.0 559.0
Institute of Education, University of London
612.9 461.5 503.7 526.0 602.0 643.4 466.0 570.4 557.3
Central School of Speech and Drama
676.7 425.1 565.4 555.8 555.8
University of Chichester 528.8 643.4 430.2 534.1 583.9 643.4 532.6 586.6 555.7
University of Gloucestershire
565.7 643.4 467.1 558.7 555.6 552.4 459.7 522.6 549.9
Birmingham City University
501.7 643.4 463.6 536.2 556.7 643.4 542.6 580.9 549.7
University of Worcester 513.6 643.4 478.8 545.3 512.7 643.4 504.8 553.6 548.9
University of Reading 659.9 643.4 546.6 616.6 518.9 461.5 519.0 499.8 544.5
University of Sussex 564.8 461.5 603.8 543.4 543.4
University of Durham 667.6 461.5 516.1 548.4 597.3 461.5 534.5 531.1 538.7
University of Plymouth 575.0 570.6 466.0 537.2 553.4 570.6 483.2 535.7 536.7
Oxford Brookes University 504.0 643.4 472.1 539.8 609.6 461.5 455.6 508.9 533.1
University of Winchester 585.6 497.9 500.5 528.0 528.0
University of Northampton 494.7 552.4 532.8 526.6 526.6
University of Wolverhampton
471.3 643.4 469.3 528.0 506.9 643.4 421.3 523.9 526.1
University of Brighton, School of Education
468.0 643.4 444.5 518.6 482.4 643.4 460.9 528.9 524.2
Sheffield Hallam University 601.0 552.4 488.7 547.4 514.8 552.4 461.9 509.7 524.1
University of Leicester 709.2 461.5 505.5 558.7 553.0 461.5 472.2 495.6 520.0
Staffordshire University 525.7 497.9 517.9 513.8 513.8
University College Birmingham
363.0 643.4 530.2 512.2 512.2
Leeds Trinity and All Saints 559.2 552.4 490.3 534.0 470.9 552.4 446.9 490.1 511.4
Bishop Grosseteste University College Lincoln
493.7 643.4 399.6 512.2 529.5 461.5 516.0 502.3 510.9
York St John University College
574.5 461.5 482.3 506.1 457.8 607.0 579.1 548.0 507.8
University of Newcastle 629.4 461.5 470.9 520.6 568.7 461.5 475.8 502.0 507.7
Manchester Metropolitan University
567.7 497.9 444.7 503.4 511.9 570.6 447.5 510.0 507.2
Keele University 520.1 570.6 430.4 507.1 507.1
Nottingham Trent University
640.3 461.5 514.9 538.9 480.7 461.5 489.5 477.2 505.5

37
Canterbury Christ Church University
489.6 643.4 445.7 526.2 437.2 643.4 350.0 476.9 504.1
University of Southampton 553.5 461.5 448.5 487.8 556.8 461.5 526.6 515.0 502.4
Leeds Metropolitan University
566.3 461.5 486.8 504.9 455.2 461.5 537.3 484.7 501.4
Liverpool Hope University 586.6 461.5 417.4 488.5 530.8 570.6 445.3 515.6 499.4
University of Bath 484.2 552.4 455.6 497.4 497.4
Brunel University 464.9 570.6 552.0 529.2 483.3 461.5 449.1 464.6 493.5
University of Leeds 572.7 461.5 523.9 519.4 480.2 461.5 485.8 475.8 490.5
Liverpool John Moores University
671.5 461.5 465.9 533.0 495.6 461.5 467.3 474.8 488.0
St Mary's University College
492.5 461.5 513.1 489.0 467.6 461.5 508.4 479.2 485.8
Kingston University 502.3 461.5 459.5 474.4 548.1 461.5 482.7 497.4 480.8
University of The West of England
483.0 497.9 407.7 462.8 503.5 497.9 497.0 499.4 479.5
Bath Spa University 599.9 570.6 419.9 530.2 475.7 279.7 459.6 405.0 478.1
University of Sunderland 537.2 461.5 429.2 476.0 437.7 570.6 427.6 478.6 477.7
Roehampton University 418.2 497.9 442.8 453.0 601.2 461.5 514.8 525.8 473.6
University of Hertfordshire 427.3 461.5 499.0 462.6 540.2 461.5 510.2 503.9 471.7
University of Huddersfield 407.1 461.5 486.8 451.8 477.5 461.5 483.6 474.2 471.1
Newman University College
506.9 461.5 458.4 475.6 479.0 461.5 413.4 451.3 470.3
University of East London 440.5 461.5 508.3 470.1 425.5 461.5 470.4 452.5 461.9
University of Cumbria 453.4 570.6 355.5 459.8 501.7 497.9 364.3 454.6 458.3
Edge Hill University 476.0 570.6 401.4 482.7 416.6 461.5 427.0 435.0 454.1
University of Hull 486.8 497.9 435.2 473.3 339.6 461.5 430.2 410.5 452.5
London South Bank University
402.7 552.4 410.2 455.1 301.4 552.4 316.0 389.9 450.2
University of Portsmouth 419.1 461.5 455.7 445.4 445.4
University College Plymouth St Mark & St John
362.2 552.4 472.8 462.5 347.8 461.5 449.8 419.7 441.6
University of Greenwich 458.6 461.5 413.7 444.6 410.4 461.5 440.2 437.4 441.6
Middlesex University 371.8 461.5 380.8 404.7 514.6 461.5 396.1 457.4 437.3
The Open University 414.7 570.6 323.0 436.1 436.1
University of Bedfordshire 478.8 370.6 490.8 446.7 427.3 279.7 555.6 420.9 433.0
Goldsmiths University 356.9 461.5 441.4 419.9 404.9 461.5 414.8 427.1 424.6
Anglia Ruskin University 445.2 279.7 542.3 422.4 439.7 279.7 442.0 387.1 409.6
London Metropolitan University
366.3 461.5 308.6 378.8 386.3 461.5 272.2 373.3 375.9
Bradford College 261.1 461.5 308.8 343.8 441.6 461.5 260.2 387.8 363.4
1. The following provision has been omitted: University of Winchester fewer than 10 first-year secondary trainees; University of Gloucestershire assessment only primary and secondary provision which does not have Ofsted grades.
2. Combination of primary and secondary standard scores is weighted by the size of the intakes.

38
Chart A1b: University ITT Intakes and Rankings1 by Year
Universities and Colleges Primary Secondary Grand
2
Total
Rank
Intake Score Intake Score 2011 2010 2009
University of Oxford 180 643.8 643.8 1 2 2
University of Cambridge 169 617.1 252 650.2 636.9 2 1 1
University of Exeter 187 623.5 411 604.9 610.7 3 4 3
Loughborough University 123 598.2 598.2 4 6 4
University of Buckingham 41 594.6 594.6 5 5
University of East Anglia 165 581.9 178 592.7 587.5 6 7 11
King's College London 208 587.2 587.2 7 24 22
University of York 133 586.8 586.8 8 15 6
University of Birmingham 91 561.2 218 575.0 570.9 9 8 7
University of Bristol 242 570.3 570.3 10 9 5
Northumbria University 277 565.0 18 648.9 570.1 11 11 24
University of Chester 131 611.0 147 531.0 568.7 12 33 34
University of Manchester 123 583.6 241 552.5 563.0 13 10 8
University of Derby 187 561.1 561.1 14 36 48
University of Nottingham 255 560.9 560.9 15 14 14
University of Warwick 191 572.9 273 549.8 559.3 16 3 9
University of Sheffield 145 559.0 559.0 17 13 13
Institute of Education, University of London
306 526.0 730 570.4 557.3 18 16 12
Central School of Speech and Drama
35 555.8 555.8 19 17 21
University of Chichester 225 534.1 157 586.6 555.7 20 47 57
University of Gloucestershire
285 558.7 92 522.6 549.9 21 61 65
Birmingham City University 379 536.2 164 580.9 549.7 22 20 16
University of Worcester 262 545.3 197 553.6 548.9 23 27 42
University of Reading 119 616.6 192 499.8 544.5 24 19 10
University of Sussex 122 543.4 543.4 25 12 28
University of Durham 160 548.4 204 531.1 538.7 26 21 45
University of Plymouth 221 537.2 101 535.7 536.7 27 23 32
Oxford Brookes University 367 539.8 102 508.9 533.1 28 25 25
University of Winchester 303 528.0 528.0 29 22 19
University of Northampton 239 526.6 526.6 30 18 15
University of Wolverhampton
217 528.0 180 523.9 526.1 31 31 35
University of Brighton, School of Education
281 518.6 341 528.9 524.2 32 40 37
Sheffield Hallam University 300 547.4 487 509.7 524.1 33 50 53
University of Leicester 118 558.7 187 495.6 520.0 34 30 17
Staffordshire University 45 513.8 513.8 35 26 23
University College Birmingham
30 512.2 512.2 36 29 39
Leeds Trinity and All Saints 151 534.0 160 490.1 511.4 37 45 47
Bishop Grosseteste University College Lincoln
327 512.2 51 502.3 510.9 38 59 68
York St John University College
390 506.1 17 548.0 507.8 39 37 61
University of Newcastle 73 520.6 166 502.0 507.7 40 32 29
Manchester Metropolitan University
497 503.4 650 510.0 507.2 41 39 30
Keele University 210 507.1 507.1 42 38 54
Nottingham Trent University 171 538.9 202 477.2 505.5 43 51 41

39
Canterbury Christ Church University
605 526.2 489 476.9 504.1 44 34 44
University of Southampton 167 487.8 193 515.0 502.4 45 28 26
Leeds Metropolitan University
209 504.9 43 484.7 501.4 46 41 36
Liverpool Hope University 471 488.5 319 515.6 499.4 47 48 60
University of Bath 122 497.4 497.4 48 42 20
Brunel University 139 529.2 172 464.6 493.5 49 49 31
University of Leeds 118 519.4 232 475.8 490.5 50 43 38
Liverpool John Moores University
97 533.0 330 474.8 488.0 51 35 27
St Mary's University College 374 489.0 183 479.2 485.8 52 63 52
Kingston University 210 474.4 81 497.4 480.8 53 57 51
University of The West of England
248 462.8 206 499.4 479.5 54 60 55
Bath Spa University 275 530.2 196 405.0 478.1 55 54 58
University of Sunderland 143 476.0 259 478.6 477.7 56 65 70
Roehampton University 521 453.0 206 525.8 473.6 57 58 46
University of Hertfordshire 308 462.6 87 503.9 471.7 58 62 63
University of Huddersfield 23 451.8 144 474.2 471.1 59 68 43
Newman University College 278 475.6 77 451.3 470.3 60 46 50
University of East London 236 470.1 204 452.5 461.9 61 52 49
University of Cumbria 953 459.8 412 454.6 458.3 62 64 62
Edge Hill University 482 482.7 720 435.0 454.1 63 55 59
University of Hull 256 473.3 127 410.5 452.5 64 56 40
London South Bank University
231 455.1 19 389.9 450.2 65 74 73
University of Portsmouth 135 445.4 445.4 66 44 18
University College Plymouth St Mark & St John
204 462.5 194 419.7 441.6 67 72 71
University of Greenwich 274 444.6 199 437.4 441.6 68 69 69
Middlesex University 186 404.7 303 457.4 437.3 69 71 67
The Open University 197 436.1 436.1 70 66 64
University of Bedfordshire 213 446.7 241 420.9 433.0 71 70 33
Goldsmiths University 176 419.9 333 427.1 424.6 72 53 66
Anglia Ruskin University 203 422.4 115 387.1 409.6 73 67 56
London Metropolitan University
140 378.8 158 373.3 375.9 74 73 72
Bradford College 169 343.8 136 387.8 363.4 75 75 74
1. The following provision has been omitted: University of Winchester fewer than 10 first-year secondary trainees; University of Gloucestershire assessment only primary and secondary provision which does not have Ofsted grades.
2. Combination of primary and secondary standard scores is weighted by the size of the intakes.

40
Chart A2a: SCITT Rankings1,2
, 2011
SCITTs1
Primary Secondary Grand
Total Entry Quality Teaching Total Entry Quality Teaching Total
Billericay Educational Consortium (SCITT)
732.5 643.4 562.9 646.3 646.3
The North East Partnership SCITT
602.6 643.4 625.6 623.9 623.9
Devon Primary SCITT Group SCITT
643.1 643.4 542.9 609.8 609.8
Suffolk and Norfolk Primary SCITT
529.5 643.4 630.1 601.0 601.0
Leicester and Leicestershire SCITT
558.2 643.4 601.2 600.9 600.9
Royal Academy of Dance 692.4 461.5 622.7 592.2 592.2
Devon Secondary Teacher Training Group SCITT
686.6 643.4 429.5 586.5 586.5
South West Teacher Training SCITT
733.6 461.5 537.8 577.6 577.6
Chiltern Training Group SCITT
558.2 643.4 526.1 575.9 575.9
Thames Primary Consortium SCITT
600.3 497.9 610.5 569.5 569.5
Cornwall SCITT 596.4 570.6 537.8 568.3 568.3
Portsmouth Primary SCITT 582.6 570.6 547.5 566.9 566.9
Jewish Teacher Training Partnership SCITT
523.4 643.4 508.5 558.4 558.4
Forest Independent Primary Collegiate SCITT
579.4 461.5 628.0 556.3 556.3
The Bedfordshire Schools’ Training Partnership SCITT
611.3 461.5 574.4 549.1 549.1
Wandsworth Primary Schools Consortium SCITT
566.1 461.5 614.6 547.4 547.4
Durham Secondary Applied SCITT
488.5 552.4 599.7 546.9 546.9
Northumbria DT Partnership SCITT
408.1 643.4 580.6 544.0 544.0
Mid-Essex ITT Consortium (SCITT)
609.6 461.5 553.2 541.4 541.4
Somerset SCITT Consortium
419.6 643.4 526.1 529.7 529.7
South Coast SCITT 619.2 461.5 493.9 524.9 524.9
Kent and Medway Training SCITT
577.0 461.5 532.2 523.6 523.6
North Tyneside 3-7 SCITT 575.1 643.4 344.0 520.8 520.8
Bromley Schools Collegiate SCITT
322.7 643.4 590.5 518.8 518.8
Poole SCITT 549.8 461.5 521.6 511.0 511.0
High Force Education SCITT
549.8 570.6 410.6 510.4 510.4
The Pilgrim Partnership SCITT
488.5 461.5 578.2 509.4 509.4
Swindon SCITT 548.8 461.5 511.8 507.4 507.4
Suffolk and Norfolk Secondary SCITT
445.6 461.5 606.6 504.6 504.6
The Grand Union Training Partnership
582.6 352.4 567.1 500.7 500.7
Outstanding Primary Schools SCITT
515.8 497.9 483.6 499.1 499.1
Cornwall SCITT Partnership (3-11)
509.4 643.4 320.0 490.9 490.9
The Shire Foundation SCITT
558.2 461.5 448.8 489.5 489.5
Maryvale Institute SCITT 351.8 461.5 654.9 489.4 489.4

41
Birmingham Primary Training Partnership SCITT
450.9 461.5 551.8 488.1 488.1
Gateshead 3-7 SCITT 363.0 643.4 452.5 486.3 486.3
Gloucestershire SCITT Consortium SCITT
392.3 552.4 506.3 483.7 483.7
London Diocesan Board of Schools SCITT
408.1 461.5 580.6 483.4 483.4
Dorset Teacher Training Partnership SCITT
436.2 643.4 362.2 480.6 480.6
West Midlands Consortium SCITT
326.4 552.4 558.3 479.1 479.1
Northampton Teacher Training Partnership SCITT
500.8 352.4 579.1 477.4 477.4
Tendring Hundred Primary SCITT
436.2 461.5 526.1 474.6 474.6
Nottingham City Primary SCITT
388.5 461.5 570.9 473.6 473.6
North East Essex Coastal Confederation SCITT
414.7 461.5 541.2 472.5 472.5
Essex Primary Schools Training Group SCITT
323.6 461.5 631.9 472.3 472.3
Cumbria Primary Teacher Training Centre SCITT
480.2 461.5 474.6 472.1 472.1
Leeds SCITT 485.0 461.5 440.2 462.3 462.3
Colchester Teacher Training Consortium SCITT
367.6 461.5 537.8 455.6 455.6
Primary Catholic Partnership SCITT
351.8 497.9 455.0 434.9 434.9
SCITTELS 446.1 370.6 485.4 434.0 434.0
Bournemouth Poole and Dorset East Secondary SCITT
405.7 279.7 580.6 422.0 422.0
South Essex Southend and Thurrock SCITT
464.4 279.7 493.9 412.6 412.6
The Learning Institute South West SCITT
436.2 461.5 321.0 406.2 406.2
West Mercia Consortium [merged to The Robert Owen Foundation SCITT]
384.0 461.5 355.9 400.5 400.5
The Titan Partnership, Birmingham SCITT
349.1 461.5 348.2 386.3 386.3
The Robert Owen Foundation SCITT
378.5 279.7 395.6 351.2 351.2
Middlesborough SCITT 331.7 279.7 440.2 350.5 350.5
1. Strictly speaking the Royal Academy of Dance is not a SCITT, but it not a UNI either, and since its funding model is aligned with SCITTs it is grouped with them.
2. Hasting and Rother SCITT not included because no Ofsted rating (inspected 2011).

42
Chart A2b: SCITT Intakes and Ranking by Year1,2
SCITTs Primary Secondary Grand
Total
Rank
Intake Score Intake Score 2011 2010 2009
Billericay Educational Consortium (SCITT)
21 646.3 646.3 1 6 25
The North East Partnership SCITT 22 623.9 623.9 2 5 24
Devon Primary SCITT Group SCITT
23 609.8 609.8 3 18 23
Suffolk and Norfolk Primary SCITT
52 601.0 601.0 4 28 28
Leicester and Leicestershire SCITT 24 600.9 600.9 5 11 4
Royal Academy of Dance 20 592.2 592.2 6 3 21
Devon Secondary Teacher Training Group SCITT
20 586.5 586.5 7 4 17
South West Teacher Training SCITT
33 577.6 577.6 8 10 2
Chiltern Training Group SCITT 50 575.9 575.9 9 14 6
Thames Primary Consortium SCITT
29 569.5 569.5 10 15 10
Cornwall SCITT 66 568.3 568.3 11 17 44
Portsmouth Primary SCITT 30 566.9 566.9 12 1 1
Jewish Teacher Training Partnership SCITT
22 558.4 558.4 13 29
Forest Independent Primary Collegiate SCITT
24 556.3 556.3 14 22 15
The Bedfordshire Schools’ Training Partnership SCITT
24 549.1 549.1 15 12 32
Wandsworth Primary Schools Consortium SCITT
32 547.4 547.4 16 26 9
Durham Secondary Applied SCITT 35 546.9 546.9 17 36
Northumbria DT Partnership SCITT 26 544.0 544.0 18 7 11
Mid-Essex ITT Consortium (SCITT)
19 541.4 541.4 19 23 41
Somerset SCITT Consortium 45 529.7 529.7 20 43 19
South Coast SCITT 24 524.9 524.9 21 37
Kent and Medway Training SCITT 42 523.6 523.6 22 31 12
North Tyneside 3-7 SCITT 29 520.8 520.8 23 19
Bromley Schools Collegiate SCITT 30 518.8 518.8 24 2 22
Poole SCITT 29 511.0 511.0 25 13 42
High Force Education SCITT 29 510.4 510.4 26
The Pilgrim Partnership SCITT 42 509.4 509.4 27 16 39
Swindon SCITT 27 507.4 507.4 28 35 5
Suffolk and Norfolk Secondary SCITT
39 504.6 504.6 29 52 46
The Grand Union Training Partnership
22 500.7 500.7 30 33 34
Outstanding Primary Schools SCITT
93 499.1 499.1 31 44 33
Cornwall SCITT Partnership (3-11) 25 490.9 490.9 32 8 20
The Shire Foundation SCITT 24 489.5 489.5 33 42 8

43
Maryvale Institute SCITT 14 489.4 489.4 34 47 7
Birmingham Primary Training Partnership SCITT
25 488.1 488.1 35 40 27
Gateshead 3-7 SCITT 35 486.3 486.3 36 38 36
Gloucestershire SCITT Consortium SCITT
26 483.7 483.7 37 48 31
London Diocesan Board of Schools SCITT
26 483.4 483.4 38 46 37
Dorset Teacher Training Partnership SCITT
22 480.6 480.6 39 9 35
West Midlands Consortium SCITT 40 479.1 479.1 40 24
Northampton Teacher Training Partnership SCITT
17 477.4 477.4 41 45 18
Tendring Hundred Primary SCITT 20 474.6 474.6 42 39 47
Nottingham City Primary SCITT 23 473.6 473.6 43 50 13
North East Essex Coastal Confederation SCITT
17 472.5 472.5 44 25
Essex Primary Schools Training Group SCITT
28 472.3 472.3 45 27 16
Cumbria Primary Teacher Training Centre SCITT
25 472.1 472.1 46 41
Leeds SCITT 30 462.3 462.3 47 30 40
Colchester Teacher Training Consortium SCITT
33 455.6 455.6 48 21 38
Primary Catholic Partnership SCITT
29 434.9 434.9 49 32 43
SCITTELS 38 434.0 434.0 50 49 30
Bournemouth Poole and Dorset East Secondary SCITT
26 422.0 422.0 51 20 29
South Essex Southend and Thurrock SCITT
21 412.6 412.6 52
The Learning Institute South West SCITT
27 406.2 406.2 53 34 3
West Mercia Consortium [merged into The Robert Owen Foundation SCITT]
28 400.5 400.5 54
The Titan Partnership, Birmingham SCITT
21 386.3 386.3 55 54 45
The Robert Owen Foundation SCITT
77 351.2 351.2 56 53 26
Middlesborough SCITT 15 350.5 350.5 57 51 14
1. Strictly speaking the Royal Academy of Dance is not a SCITT, but it not a UNI either, and since its funding model is aligned with SCITTs it is grouped with them.
2. Hasting and Rother SCITT not included because no Ofsted rating (inspected 2011).

44
Chart A3a: EBITT Rankings1,2
, 2011
EBITTs1,2
Primary Secondary Grand
Total Entry Quality Teachingy Total Entry Quality Teachingy Total
Southfields Community College
607.0 643.4 570.9 607.1 607.1
Canterbury Christ Church University EBITT
584.0 643.4 572.9 600.1 613.4 643.4 552.9 603.2 602.7
Bourton Meadow ITT Centre
509.4 643.4 608.9 587.2 587.2
Forest Independent Primary Collegiate
536.1 552.4 654.9 581.1 581.1
University of Nottingham GTP
551.8 643.4 534.1 576.4 576.4
The Havering Teacher Training Partnership
513.9 643.4 557.3 571.5 571.5
East Lincolnshire GTP 558.2 643.4 608.9 603.5 339.9 643.4 654.9 546.1 570.4
Alban Federation 593.1 461.5 654.9 569.8 569.8
Newman University College EBITT
456.2 643.4 591.7 563.8 467.6 643.4 579.6 563.5 563.6
King Edward's Consortium 674.9 461.5 551.8 562.8 562.8
East Sussex Primary GTP 497.2 643.4 547.5 562.7 562.7
The Wakefield Partnership for ITT
509.4 643.4 532.2 561.7 561.7
University of Warwick EBITT
578.6 552.4 540.4 557.1 557.1
Nottingham Trent University EBITT
582.6 461.5 601.2 548.5 646.5 461.5 559.2 555.7 554.4
West Berkshire Training Partnership
536.1 461.5 654.9 550.8 582.6 461.5 622.7 555.6 554.1
George Abbot School 520.7 552.4 588.3 553.8 553.8
Stockton-on-Tees TTP 540.8 461.5 654.9 552.4 552.4
George Spencer Training School
536.1 461.5 654.9 550.8 550.8
E-Qualitas 469.5 552.4 607.2 543.0 513.7 552.4 572.8 546.3 545.6
The Shire Foundation 565.4 461.5 596.3 541.1 541.1
The Bedfordshire Schools' Training Partnership
602.6 461.5 555.8 540.0 540.0
Redcar & Cleveland Teacher Training Partnership
607.0 461.5 611.9 560.2 527.7 461.5 574.4 521.2 535.8
Colchester Teacher Training Consortium
558.2 461.5 583.3 534.4 534.4
Loughborough Encompass 645.4 370.6 585.9 533.9 533.9
University of Sussex EBITT
490.7 552.4 553.2 532.1 532.1
Hertfordshire Regional Partnership
515.2 643.4 523.7 560.7 514.1 643.4 389.2 515.6 530.4
West Midlands Consortium 566.9 461.5 559.5 529.3 529.3
The Pilgrim Partnership 540.8 461.5 574.4 525.6 525.6
University of Brighton, School of Education EBITT
627.9 552.4 562.9 581.1 295.5 552.4 456.7 434.9 525.2
Northumbria University EBITT
546.0 461.5 558.3 521.9 488.5 461.5 621.8 524.0 523.3
Bromley Schools Collegiate
495.8 552.4 520.1 522.8 522.8
Surrey LA 495.3 461.5 592.6 516.4 516.4
Matthew Moss ITT Partnership
520.7 461.5 562.9 515.0 515.0

45
University of Bedfordshire EBITT
299.0 643.4 601.2 514.5 514.5
Sheffield Hallam University EBITT
655.8 461.5 427.6 515.0 540.3 461.5 536.3 512.7 513.0
University of Southampton EBITT
469.5 461.5 601.2 510.7 510.7
Merseyside and Cheshire GTP Partnership
577.0 370.6 631.9 526.5 462.4 370.6 654.9 495.9 510.4
Kent County Council 520.7 461.5 555.8 512.7 498.7 461.5 569.0 509.7 510.4
University College Plymouth St Mark & St John EBITT
582.6 461.5 440.2 494.8 453.7 461.5 654.9 523.3 509.8
Bishop Grosseteste University College GTP EBITT
540.8 461.5 569.0 523.8 472.8 461.5 558.3 497.5 508.3
London East Consortium, University of Cumbria EBITT
450.9 461.5 607.2 506.5 506.5
Hull Citywide GTP Partnership
504.0 461.5 630.1 531.9 492.1 461.5 528.4 494.0 505.9
The Kirklees Partnership 476.9 461.5 654.9 531.1 395.6 461.5 579.1 478.7 504.9
Saffron Walden and Comberton Training School
497.2 461.5 555.8 504.9 504.9
Dorset Teacher Education Partnership
509.4 461.5 590.5 520.5 527.7 461.5 504.2 497.8 502.6
The East Northamptonshire College EBITT
466.7 461.5 574.4 500.9 500.9
University of Reading EBITT
466.7 461.5 545.9 491.4 532.5 461.5 540.5 511.5 500.8
Gloucester ITE Partnership 564.8 461.5 555.8 527.4 455.5 461.5 505.1 474.0 499.7
Northamptonshire, Leicester & Milton Keynes Consortium
515.8 461.5 567.1 514.8 523.4 461.5 450.0 478.3 497.4
Kent and Medway Training GTP
457.8 461.5 567.1 495.4 495.4
North East Essex Coastal Confederation
476.9 461.5 547.5 495.3 495.3
Mid-Essex ITT Consortium 452.2 461.5 570.9 494.8 494.8
Mid Somerset Consortium for TT
400.8 461.5 617.0 493.1 493.1
Suffolk and Norfolk GTP provider
393.2 552.4 518.3 488.0 501.4 552.4 424.3 492.7 491.3
CILT The National Centre for Languages
558.2 552.4 360.9 490.5 490.5
University of Chichester EBITT
457.8 552.4 579.1 529.8 474.8 552.4 390.7 472.6 490.3
University of East London EBITT
430.2 461.5 575.3 489.0 489.0
Two Mile Ash ITT Partnership
450.9 461.5 551.8 488.1 488.1
LearnED 354.9 552.4 553.2 486.9 486.9
The Beauchamp ITT Partnership
472.8 461.5 503.4 479.2 479.2
University of Sunderland 331.7 461.5 534.1 442.4 531.1 461.5 506.3 499.6 478.4
Royal Borough of Windsor & Maidenhead GTTP
497.2 461.5 470.9 476.5 476.5
London South Bank University (EBITT)
346.5 552.4 529.2 476.0 476.0
Doncaster GTP Partnership 469.5 461.5 654.9 528.6 304.5 461.5 583.3 449.8 473.9
Thamesmead School ITT Partnership
399.6 552.4 461.7 471.3 471.3

46
Essex Schools ITT Partnership
450.3 643.4 302.7 465.5 494.0 643.4 278.2 471.9 469.7
West London Partnership GTP/OTT
409.7 461.5 487.1 452.8 453.7 461.5 529.0 481.4 469.2
Birmingham Advisory Schools Service
476.9 370.6 453.6 433.7 593.1 370.6 574.4 512.7 468.8
London North Consortium 306.4 461.5 547.5 438.5 498.4 461.5 566.8 508.9 466.4
University of Derby GTP 531.1 461.5 465.5 486.0 367.0 461.5 523.5 450.7 465.9
Oxon-Bucks Partnership 579.4 370.6 477.2 475.8 513.3 370.6 493.9 459.3 465.3
Eastwood and Leigh GTP Partnership
455.5 370.6 567.1 464.4 464.4
North Lincolnshire ITT Partnership
375.2 461.5 654.9 497.2 216.7 461.5 590.5 422.9 463.4
2Schools Consortium 482.0 461.5 416.4 453.3 453.3
Stoke on Trent GTP 558.2 279.7 593.5 477.1 482.0 279.7 511.8 424.5 452.8
SCITTELS 392.3 370.6 592.6 451.8 451.8
Wessex Schools Training Partnership
558.2 461.5 332.9 450.9 450.9
University of Worcester EBITT
582.6 643.4 194.9 473.6 207.5 643.4 409.6 420.1 449.7
University of Wolverhampton EBITT
457.8 461.5 567.9 495.7 422.4 461.5 404.1 429.4 446.1
Ninestiles Graduate Teacher Consortium
314.2 461.5 553.2 443.0 443.0
Isle of Wight Partnership 203.3 461.5 654.9 439.9 314.2 461.5 534.1 436.6 438.0
The Cambridge Partnership 447.1 279.7 586.5 437.8 437.8
Somerset SCITT Consortium (EBITT)
655.8 643.4 11.0 436.7 436.7
Jewish Teacher Training Partnership
527.7 279.7 493.9 433.8 433.8
Institute of Education, University of London EBITT
351.8 643.4 139.7 378.3 485.7 643.4 250.1 459.7 431.2
Carmel Teacher Training 469.5 279.7 654.9 468.0 436.2 279.7 526.1 414.0 430.5
North West and Lancashire GTP Consortium
661.5 370.6 368.7 466.9 424.4 370.6 436.1 410.4 422.6
Southend Teacher Training Partnership
404.9 279.7 507.7 397.4 500.8 279.7 529.4 436.6 420.6
Kingsbridge Education Improvement Partnership GTP
436.2 279.7 526.1 414.0 414.0
Education Management Direct GTP Consortium
416.3 461.5 344.8 407.5 499.0 461.5 292.7 417.7 413.3
University of Bath EBITT 494.0 370.6 311.4 392.0 392.0
The Titan Partnership, Birmingham EBITT
314.2 461.5 332.9 369.6 369.6
The Robert EBITT 314.2 279.7 370.8 321.6 361.6 279.7 403.4 348.2 343.0
Bradford & Northern Employment Based Teacher Training
457.8 279.7 286.9 341.4 384.0 279.7 356.8 340.1 340.7
STORM 425.8 279.7 282.1 329.2 454.8 279.7 164.7 299.7 310.7
1. 19 EBITTs were omitted for having fewer than 10 trainees in 2009-10 (number in brackets). Primary Eastwood and Leigh GTP Partnership (8); George Spencer Training School (1); Royal Borough of Windsor & Maidenhead Graduate Teacher Training Partnership (8); Stockton-on-Tees TTP (8); The East Northamptonshire College (8); The Slough Partnership (9); The Titan Partnership, Birmingham (2); The Wakefield Partnership for Initial Teacher Training (7); University of Chester EBITT (5); University of East London EBITT (2); University of Southampton EBITT (9); University of Sussex EBITT (2). Secondary Jewish Teacher Training Partnership (8); Kingsbridge Education Improvement Partnership GTP (7); London South Bank University EBITT (8), SCITTELS (5); The Slough Partnership (8); University of Bedfordshire EBITT (4); University of Chester EBITT (9).
2. Three EBITTs omitted because there were no available Ofsted ratings: University of Gloucestershire ULF EBITT (primary); Liverpool John Moores University Teach First (secondary); University of Manchester EBITT (secondary).

47
Chart A3b: EBITT Intakes and Scores1,2
EBITTs1
Primary Secondary Grand
Total
Rank
2011 Intake Score Intake Score
Southfields Community College 21 607.1 607.1 1
Canterbury Christ Church University EBITT 105 600.1 515 603.2 602.7 2
Bourton Meadow ITT Centre 15 587.2 587.2 3
Forest Independent Primary Collegiate 11 581.1 581.1 4
University of Nottingham GTP 46 576.4 576.4 5
The Havering Teacher Training Partnership 35 571.5 571.5 6
East Lincolnshire GTP 14 603.5 19 546.1 570.4 7
Alban Federation 14 569.8 569.8 8
Newman University College EBITT 55 563.8 72 563.5 563.6 9
King Edward's Consortium 25 562.8 562.8 10
East Sussex Primary GTP 25 562.7 562.7 11
The Wakefield Partnership for ITT 21 561.7 561.7 12
University of Warwick EBITT 38 557.1 557.1 13
Nottingham Trent University EBITT 32 548.5 143 555.7 554.4 14
West Berkshire Training Partnership 11 550.8 23 555.6 554.1 15
George Abbot School 27 553.8 553.8 16
Stockton-on-Tees TTP 14 552.4 552.4 17
George Spencer Training School 11 550.8 550.8 18
E-Qualitas 74 543.0 261 546.3 545.6 19
The Shire Foundation 34 541.1 541.1 20
The Bedfordshire Schools' Training Partnership 26 540.0 540.0 21
Redcar & Cleveland Teacher Training Partnership 15 560.2 25 521.2 535.8 22
Colchester Teacher Training Consortium 10 534.4 534.4 23
Loughborough Encompass 28 533.9 533.9 24
University of Sussex EBITT 55 532.1 532.1 25
Hertfordshire Regional Partnership 53 560.7 108 515.6 530.4 26
West Midlands Consortium 28 529.3 529.3 27
The Pilgrim Partnership 14 525.6 525.6 28
University of Brighton, School of Education EBITT 21 581.1 13 434.9 525.2 29
Northumbria University EBITT 20 521.9 37 524.0 523.3 30
Bromley Schools Collegiate 44 522.8 522.8 31
Surrey LA 31 516.4 516.4 32
Matthew Moss ITT Partnership 14 515.0 515.0 33

48
University of Bedfordshire EBITT 21 514.5 514.5 34
Sheffield Hallam University EBITT 16 515.0 111 512.7 513.0 35
University of Southampton EBITT 46 510.7 510.7 36
Merseyside and Cheshire GTP Partnership 27 526.5 30 495.9 510.4 37
Kent County Council 13 512.7 45 509.7 510.4 38
University College Plymouth St Mark & St John EBITT
20 494.8 22 523.3 509.8 39
Bishop Grosseteste University College GTP EBITT 14 523.8 20 497.5 508.3 40
London East Consortium, University of Cumbria EBITT
26 506.5
506.5 41
Hull Citywide GTP Partnership 27 531.9 59 494.0 505.9 42
The Kirklees Partnership 18 531.1 18 478.7 504.9 43
Saffron Walden and Comberton Training School 12 504.9 504.9 44
Dorset Teacher Education Partnership 10 520.5 37 497.8 502.6 45
The East Northamptonshire College EBITT 25 500.9 500.9 46
University of Reading EBITT 113 491.4 99 511.5 500.8 47
Gloucester ITE Partnership 38 527.4 41 474.0 499.7 48
Northamptonshire, Leicester & Milton Keynes Consortium
23 514.8 21 478.3 497.4 49
Kent and Medway Training GTP 19 495.4 495.4 50
North East Essex Coastal Confederation 18 495.3 495.3 51
Mid-Essex ITT Consortium 23 494.8 494.8 52
Mid Somerset Consortium for TT 32 493.1 493.1 53
Suffolk and Norfolk GTP provider 34 488.0 79 492.7 491.3 54
CILT The National Centre for Languages 46 490.5 490.5 55
University of Chichester EBITT 17 529.8 38 472.6 490.3 56
University of East London EBITT 85 489.0 489.0 57
Two Mile Ash ITT Partnership 25 488.1 488.1 58
LearnED 19 486.9 486.9 59
The Beauchamp ITT Partnership 20 479.2 479.2 60
University of Sunderland 16 442.4 27 499.6 478.4 61
Royal Borough of Windsor & Maidenhead GTTP 13 476.5 476.5 62
London South Bank University EBITT 72 476.0 476.0 63
Doncaster GTP Partnership 11 528.6 25 449.8 473.9 64
Thamesmead School ITT Partnership 20 471.3 471.3 65

49
Essex Schools ITT Partnership 65 465.5 126 471.9 469.7 66
West London Partnership GTP/OTT 117 452.8 158 481.4 469.2 67
Birmingham Advisory Schools Service 30 433.7 24 512.7 468.8 68
London North Consortium 131 438.5 86 508.9 466.4 69
University of Derby GTP 31 486.0 41 450.7 465.9 70
Oxon-Bucks Partnership 28 475.8 48 459.3 465.3 71
Eastwood and Leigh GTP Partnership 19 464.4 464.4 72
North Lincolnshire ITT Partnership 12 497.2 10 422.9 463.4 73
2Schools Consortium 25 453.3 453.3 74
Stoke on Trent GTP 21 477.1 18 424.5 452.8 75
SCITTELS EBITT 30 451.8 451.8 76
Wessex Schools Training Partnership 15 450.9 450.9 77
University of Worcester EBITT 21 473.6 17 420.1 449.7 78
University of Wolverhampton EBITT 37 495.7 110 429.4 446.1 79
Ninestiles Graduate Teacher Consortium EBITT 18 443.0 443.0 80
Isle of Wight Partnership 11 439.9 15 436.6 438.0 81
The Cambridge Partnership 109 437.8 437.8 82
Somerset SCITT Consortium (EBITT) 10 436.7 436.7 83
Jewish Teacher Training Partnership 12 433.8 433.8 84
Institute of Education, University of London EBITT 40 378.3 74 459.7 431.2 85
Carmel Teacher Training 11 468.0 25 414.0 430.5 86
North West and Lancashire GTP Consortium 26 466.9 94 410.4 422.6 87
Southend Teacher Training Partnership 36 397.4 52 436.6 420.6 88
Kingsbridge Education Improvement Partnership GTP 10 414.0 414.0 89
Education Management Direct GTP Consortium 55 407.5 71 417.7 413.3 90
University of Bath EBITT 38 392.0 392.0 91
The Titan Partnership, Birmingham EBITT 16 369.6 369.6 92
The Robert EBITT 24 321.6 98 348.2 343.0 93
Bradford & Northern Employment Based Teacher Training
37 341.4 51 340.1 340.7 94
STORM 37 329.2 62 299.7 310.7 95
1. 19 EBITTs were omitted for having fewer than 10 trainees in 2009-10 (number in brackets). Primary Eastwood and Leigh GTP Partnership (8); George Spencer Training School (1); Royal Borough of Windsor & Maidenhead Graduate Teacher Training Partnership (8); Stockton-on-Tees TTP (8); The East Northamptonshire College (8); The Slough Partnership (9); The Titan Partnership, Birmingham (2); The Wakefield Partnership for Initial Teacher Training (7); University of Chester EBITT (5); University of East London EBITT (2); University of Southampton EBITT (9); University of Sussex EBITT (2). Secondary Jewish Teacher Training Partnership (8); Kingsbridge Education Improvement Partnership GTP (7); London South Bank University EBITT (8), SCITTELS (5); The Slough Partnership (8); University of Bedfordshire EBITT (4); University of Chester EBITT (9).
2. Three EBITTs omitted because there were no available Ofsted ratings: University of Gloucestershire ULF EBITT (primary); Liverpool John Moores University Teach First (secondary); University of Manchester EBITT (secondary).

50
Chart A4: Trends in ITT Intakes by the Different Routes
Phase and Route Year Profiles Published
1998 1999 2000 2001 2002 2003 2004 2005 2006 2007 2008 2009 2010 2011
Primary
Unis and Colleges 12,352 11,465 11,332 11,136 12,422 12,736 13,192 14,314 15,023 15,254 14,468 14,172 14,264 14,870
SCITTs 171 205 345 416 495 566 721 787 871 819 817 761 803 905
EBITTs - - - - - 1,169 1,363 2,010 2,722 2,653 2,664 2,387 2,301 2,161
Total 12,523 11,670 11,677 11,552 12,917 14,471 15,276 17,111 18,616 18,726 17,949 17,320 17,368 17,936
Secondary
Unis and Colleges 15,438 14,804 13,351 12,762 12,875 13,664 14,470 15,587 15,299 15,263 15,036 14,293 13,924 14,814
SCITTs 317 358 396 368 511 484 558 635 786 838 848 779 782 858
EBITTs - 5 23 35 222 1,964 2,540 3,321 4,335 4,407 4,508 4,454 4,260 4,204
Total 15,755 15,167 13,770 13,165 13,608 16,112 17,568 19,543 20,420 20,508 20,392 19,526 18,966 19,876
Key Stage 2/3
Unis and Colleges 459 705 750 737 640 750 672 786 723 556 544 522 557 562
SCITTs - - - 18 21 38 41 52 54 41 0 0 0 0
EBITTs - - - - - 10 51 86 49 49 33 18 7 55
Total 459 705 750 775 661 798 764 924 826 646 577 540 564 617
Grand Total 28,737 27,542 26,197 25,492 27,186 31,381 33,608 37,578 39,862 39,880 38,918 37,386 36,898 38,429

51
Chart A5: Trends in Teacher Trainee Characteristics
Characteristics Year Teacher Training Profile Published
1998 1999 2000 2001 2002 2003 2004 2005 2006 2007 2008 2009 2010 2011
Primary
%Male 14 13 13 13 13 13 12 13 13 13 13 14 14 15
%Ethnic Minority 5 5 5 6 6 6 6 7 8 8 8 8 9 9
%Age25+ n/a n/a 37 38 39 44 43 44 43 40 39 38 36 39
%Postgraduate 41 41 44 46 49 54 55 58 58 57 56 57 57 58
%PG2.1+ degree 49 53 52 51 52 54 55 54 55 58 58 60 60 61
Primary Intake 12,523 11,670 11,677 11,552 12,917 13,302 13,913 15,101 15,894 16,073 15,285 14,933 15,067 15,775
Secondary
%Male 43 40 38 38 36 37 37 40 38 39 37 37 38 38
%Ethnic Minority 7 7 7 8 8 8 9 10 11 13 14 15 15 14
%Age25+ n/a n/a 55 54 55 56 57 57 56 55 55 56 54 54
%Postgraduate 86 86 88 90 92 93 94 94 95 94 94 95 95 95
%PG2.1+ degree 46 47 48 48 49 49 52 53 54 54 54 53 55 58
Secondary Intake 15,755 15,161 13,747 13,130 13,386 14,148 15,028 16,222 16,085 16,101 15,884 15,072 14,706 15,672

52
Chart A6: Secondary Trainees with Good Degrees1 by Subject and Provider Type
Subject
Universities SCITT EBITT All
N % Good
Degree
N % Good
Degree
N % Good
Degree
N % Good
Degree
Art and design 522 66.1 7 71.4 125 62.8 654 65.5
Assessment based
116 50.0 - - - - 116 50.0
Business studies
484 59.9 15 57.1 94 62.8 593 60.3
Citizenship 209 63.2 9 33.3 55 75.0 273 64.5
Classics 31 90.3 - - 8 100.0 39 92.1
Design and technology
811 55.1 118 61.0 282 53.9 1,211 55.4
Diploma 143 54.9 9 88.9 2 100.0 154 57.5
Drama/dance 218 86.6 34 87.9 238 69.4 490 78.5
Economics - - - - 11 55.6 11 55.6
English 1,462 79.9 66 65.2 692 68.8 2,220 76.2
Geography 624 63.6 20 50.0 78 69.9 722 63.9
History 566 82.3 12 83.3 169 68.0 747 79.2
ICT 603 50.2 81 35.8 200 54.5 884 49.8
Mathematics 1,858 48.8 107 55.2 586 58.1 2,551 51.0
Modern languages
1,324 62.1 59 65.2 224 66.9 1,607 62.8
Music 579 65.6 29 72.4 143 62.4 751 65.3
Other (EBITT)
- - - - 3 33.3 3 33.3
Physical education
703 63.9 72 50.0 404 39.6 1,179 55.0
Religious education
666 66.5 29 39.3 126 63.2 821 65.0
Science 2,646 54.1 149 54.5 574 57.0 3,369 54.6
Social science/studies
110 79.0 - - 21 55.6 131 75.6
Vocational subjects
286 54.4 42 45.2 129 52.5 457 53.0
Totals 13,961 61.5 858 56.4 4,164 59.8 18,983 60.9
1. First or 2i. as percentage of those entering on UK qualifications ie non- UK degrees not included.

53
Chart A7: ITT Outcomes by Route
Provider1
Final Year
Trainees2
Awarded
QTS
% Awarded
QTS In Teaching
Per Cent
in Teaching3
Primary
Universities PG 8,507 7,642 89.8 6,071 71.4
Universities UG 5,740 5,118 89.2 3,843 67.0
SCITT 907 838 92.4 707 77.9
EBITT PG 2,170 2,014 92.8 1,593 73.4
EBITT UG 106 94 88.7 67 63.2
Key Stage 2/3
Universities PG 312 251 80.4 195 62.5
Universities UG 189 169 89.4 123 65.1
EBITT PG 51 48 94.1 34 66.7
Secondary
Universities PG 14,974 13,028 87.0 10,674 71.3
Universities UG 818 728 89.0 576 70.4
SCITT 845 764 90.4 662 78.3
EBITT PG 4,431 4,066 91.8 3,403 76.8
EBITT UG 53 36 67.9 28 52.8
Totals
Undergraduate 6,906 6,145 89.0 4,637 67.1
Postgraduate 32,197 28,651 89.0 23,339 72.5
Totals
Universities 30,540 26,936 88.2 21,482 70.3
SCITTs 1,752 1,602 91.4 1,369 78.1
EBITTs 6,811 6,258 91.9 5,125 75.2
Totals
Primary 17,430 15,706 90.1 12,281 70.5
Key Stage 2/3 552 468 84.8 352 63.8
Secondary 21,121 18,622 88.2 15,343 72.6
Grand Total 39,103 34,796 89.0 27,976 71.5
1. Final-year numbers differ from intakes since they includes repeaters from previous years and trainees taking longer than one year