the role of teacher training in beginning teachers' self-efficacy ...
139
THE ROLE OF TEACHER TRAINING IN BEGINNING TEACHERS’ SELF-EFFICACY, JOB SATISFACTION, AND TURNOVER MOTIVATION: FINDINGS FROM THE 2011- 2012 SCHOOLS AND STAFFING SURVEY A Dissertation by LUXI FENG Submitted to the Office of Graduate and Professional Studies of Texas A&M University in partial fulfillment of the requirements for the degree of DOCTOR OF PHILOSOPHY Chair of Committee, R. Malatesha Joshi Committee Members, Emily Cantrell Wen Luo Hersh C. Waxman Head of Department, Michael A. de Miranda August 2018 Major Subject: Curriculum and Instruction Copyright 2018 Luxi Feng brought to you by CORE View metadata, citation and similar papers at core.ac.uk provided by Texas A&M Repository
-
Upload
khangminh22 -
Category
Documents
-
view
3 -
download
0
Transcript of the role of teacher training in beginning teachers' self-efficacy ...

THE ROLE OF TEACHER TRAINING IN BEGINNING TEACHERS’ SELF-EFFICACY,
JOB SATISFACTION, AND TURNOVER MOTIVATION: FINDINGS FROM THE 2011-
2012 SCHOOLS AND STAFFING SURVEY
A Dissertation
by
LUXI FENG
Submitted to the Office of Graduate and Professional Studies of
Texas A&M University
in partial fulfillment of the requirements for the degree of
DOCTOR OF PHILOSOPHY
Chair of Committee, R. Malatesha Joshi
Committee Members, Emily Cantrell
Wen Luo
Hersh C. Waxman
Head of Department, Michael A. de Miranda
August 2018
Major Subject: Curriculum and Instruction
Copyright 2018 Luxi Feng
brought to you by COREView metadata, citation and similar papers at core.ac.uk
provided by Texas A&M Repository

ii
ABSTRACT
Providing high-quality education to students is always the ultimate goal of public schools
in the United States. However, the high ratio of teacher turnover has always been the barrier that
impedes the achievement of that goal. The turnover ratio is particularly high among beginning
teachers due to the unique characteristics of this population. For instance, beginning teachers’
self-efficacy usually sharply declines during the first year of teaching. Therefore, research on this
population could be critical, as the success of beginning teachers is important. Using the 2011-
2012 Schools and Staffing Survey, the dissertation included three studies to investigate
beginning teachers’ training profiles and the relationships among teacher training, self-efficacy,
job satisfaction, and turnover motivation. The three studies relied on latent mixture modeling,
which enabled the examination to be conducted at the individual levels. Results suggested that
beginning teachers’ preservice training profiles were differentiated by the undergraduate majors
and the completion of teacher education. Meanwhile, their in-service training profiles were
featured by several types of developmental activities, especially common planning time. The
association between preservice and in-service training was not statistically significant. Beginning
teachers’ training profiles predicted the classification of their teacher self-efficacy profiles,
which included three distinctive classes. In addition, teachers from urban schools were more
likely to have low-level self-efficacy. Finally, beginning teachers’ self-efficacy profiles were
significantly related to their job satisfaction and turnover motivation. At the individual level,
beginning teachers who were better supported by teacher training and worked in urban settings
were more likely to be associated with high-level self-efficacy, high-level job satisfaction, and
low-level turnover motivation.

iii
DEDICATION
To my mother, my husband, and my grandfather.

iv
ACKNOWLEDGEMENTS
I would like to thank my committee chair, Dr. Malatesha Joshi. Over the past seven
years, I have received so much help and guidance from him, which made this pursuit of learning
a rewarding and enjoyable journey. What I have learned from him is a great asset to my career. I
am also indebted to Dr. Hersh Waxman, who has been supportive of my research. His
encouragement has been a vital source to keep me stepping forward. In addition, I am thankful to
Dr. Emily Cantrell and Dr. Wen Luo, who provided valuable advice to this dissertation. Finally, I
am grateful to my families. Their love and support are always with me in whoever I am and
whatever I pursue.

v
CONTRIBUTORS AND FUNDING SOURCES
Contributors
This work was supported by a dissertation committee consisting of Dr. Malatesha Joshi,
Dr. Hersh Waxman, and Dr. Emily Cantrell of the Department of Teaching, Learning, and
Culture and Dr. Wen Luo of the Department of Educational Psychology.
The data analyzed for this dissertation was provided by Dr. Hersh Waxman.
All other work conducted for the dissertation was completed by the student
independently.
Funding Sources
Graduate study was supported by a dissertation fellowship from Texas A&M University.

vi
TABLE OF CONTENTS
Page
ABSTRACT ............................................................................................................ ii
DEDICATION ......................................................................................................... iii
ACKNOWLEDGEMENTS ..................................................................................... iv
CONTRIBUTORS AND FUNDING SOURCES ................................................... v
TABLE OF CONTENTS ........................................................................................ vi
LIST OF FIGURES ................................................................................................. viii
LIST OF TABLES ................................................................................................... ix
CHAPTER I INTRODUCTION AND LITERATURE REVIEW …...................... 1
Statement of the Problem ............................................................................. 3
CHAPTER II THEORETICAL FRAMEWORK .................................................... 6
Review of the Literature .............................................................................. 6
CHAPTER III METHODOLOGY .......................................................................... 30
Research Purposes ........................................................................................ 30
Data Description ........................................................................................... 35
Person-centered Analysis ............................................................................. 40
Analytic Plan ................................................................................................ 44
CHAPTER IV RESULTS ........................................................................................ 58
Study 1 ......................................................................................................... 58
Study 2 ......................................................................................................... 70
Study 3 ......................................................................................................... 87
CHAPTER V CONCLUSIONS .............................................................................. 96
Discussion .................................................................................................... 97
Limitations .................................................................................................... 101

vii
Conclusions .................................................................................................. 103
REFERENCES ......................................................................................................... 104

viii
LIST OF FIGURES
Page
Figure 1 The Analytic Model of Teacher Training ................................................... 33
Figure 2 The Analytic Model of Teacher Self-efficacy with Covariates .................. 34
Figure 3 The Analytic Model of Teacher Self-efficacy with Distal Outcomes ........ 34
Figure 4 Conditional Probability Plot of Preservice Training Profiles .................... 62
Figure 5 Conditional Probability Plot of In-service Training Profiles .................... 67
Figure 6 Conditional Probability Plots of Teacher Self-efficacy Profiles ............... 75

ix
LIST OF TABLES
Page
Table 1 Summary of Public School Characteristics ………….................................. 24
Table 2 Research Purpose, Analysis Methods, and Research Questions .................. 32
Table 3 Survey Items of Selection Criteria ……....................................................... 46
Table 4 Descriptive Information of the Sample ........................................................ 48
Table 5 Survey Items by Measures ……………………………………………....... 51
Table 6 Model Comparisons of Preservice Training ................................................ 60
Table 7 Model Classification of Preservice Training (Response=Yes) .................... 61
Table 8 Model Comparisons of In-service Training ................................................. 65
Table 9 Model Classification of In-service Training (Response=Yes) ..................... 66
Table 10 Cross Tabulation of Beginning Teachers’ Training Profiles …................. 69
Table 11 Model Comparisons of Teacher Self-efficacy ........................................... 71
Table 12 Model Classification of Teacher Self-efficacy .......................................... 73
Table 13 Parameter Estimates of Latent Class Regression Analyses on Teacher
Training ..................................................................................................... 78
Table 14 Estimated Probabilities by Classes on Teacher Training .......................... 84
Table 15 Parameter Estimates of Latent Class Regression Analyses on School
Location .................................................................................................... 86
Table 16 Estimated Probabilities by Classes on School Location ........................... 87
Table 17 Equality Tests of Probabilities across Classes on Job Satisfaction ........... 89
Table 18 Equality Tests of Probabilities across Classes on Moving Motivation ..... 91
Table 19 Equality Tests of Probabilities across Classes on Leaving Motivation .... 94

1
CHAPTER I
INTRODUCTION AND LITERATURE REVIEW
Public schools in the United States aim to provide high-quality education to all the
school-aged population. One critical means to achieve this goal is to maintain an adequate supply
of high-quality teachers, because teacher excellence is vital to improvement in student learning
(Nye, Konstantopoulos, & Hedges, 2004; Rowan, Correnti, & Miller, 2002). However, the
shortage of high-quality teachers has continuously been the major concern for schools and
districts (Ingersoll, 2001; Loeb, Darling-Hammond, & Luczak, 2005). To resolve this issue, there
are two general approaches: to prepare and recruit capable new teachers and to retain those who
are effective experienced ones. Recruitment of qualified teachers involves considering multiple
factors, such as teacher characteristics, subject matter knowledge, and pedagogical coursework,
while retention is related to additional factors, like job satisfaction, school climate, and student
behaviors. Considering both approaches leads to a concentration on beginning teachers, who are
at the entry level of career as well as at the transition stage growing from apprentices to veterans.
Beginning teachers are supposed to be equipped with adequate content and pedagogical
knowledge while receiving professional guidance from their experienced colleagues. After they
succeed through this initial stage, they will be expected to serve as mentors for the next
generation of teachers. Therefore, the success of beginning teachers is of great importance for
teacher retention as well as student success.
However, research has indicated that the majority of beginning teachers frequently
struggle with multiple challenges. They hesitate to ask for help (Fantilli & McDougall, 2009),
exhibit decreasing self-efficacy (Castro, Kelly, & Shih, 2010; Chester & Beaudin, 1996), and

2
have more concerns about class management, academic preparation (Meister, & Melnick, 2003)
and job security (Stallions, Murrill, & Earp, 2012). Meanwhile, they also face with immense
teaching assignments, insufficient administrative supports (Flores, 2006), limited resources
(Stallions et al., 2012), and inadequate communication skills (Meister, & Melnick, 2003).
Experiencing such challenges places beginning teachers at risk of burnout since their first year of
teaching (Gavish & Friedman, 2010). As a result, a U-shape curve is found when examining the
relationship between teaching years in the field and teacher turnover (Ingersoll, 2001). Many
teachers choose to leave or transfer within their first five years, and the estimated turnover-rate
ranges from one third to one half in the United States (Chang, 2009; Darling-Hammond, 2003;
Hargreaves & Fullan, 2012; Ingersoll, 2001; Konanc, 1996). This estimate among beginning
teachers is more alarming, ranging from one fifth to one fourth, which indicates they are the most
at-risk group to leave the profession (Gray & Taie, 2015; Kirby & Grissmer, 1993; Schlechty &
Vance, 1981).
Awareness of the critical role of beginning teachers along with their enduring struggles
reveals the significance of research on this particular group. During the past decades, a variety of
studies on beginning teachers concentrated on their perceptions of self-efficacy, demographics,
emotional status, teaching philosophy, job satisfaction, and turnover. Among these studies, the
important impact of teacher self-efficacy has been widely identified. With strong self-efficacy,
teachers showed high-level planning, organization, and enthusiasm (Allinder, 1994), and devoted
more time teaching subjects for which they felt prepared (Riggs & Enochs, 1990). As a result,
they were usually associated with high-level job engagement and satisfaction as well as low-
level emotional exhaustion and low-level motivation to leave the profession (Skaalvik &
Skaalvik, 2014). Therefore, research on how to promote beginning teachers’ self-efficacy and to

3
strengthen its long-lasting influences provides important insights to accommodate the challenges
of teacher shortage.
Statement of the Problem
Many research studies on the relationship between self-efficacy, job satisfaction, and
commitment have suggested that strong self-efficacy is an essential component among teachers
with high job satisfaction and retention willingness (e.g., Høigaard, Giske, & Sundsli, 2012;
Skaalvik & Skaalvik, 2014; Viel-Ruma, Houchins, Jolivette, & Benson, 2010). However, some
research gaps have to be acknowledged. First, teacher self-efficacy is often measured as a single
and composite construct in modeling. Bandura (1977, 1997) suggested four major sources of
efficacy expectations, including mastery experiences, vicarious experiences, verbal persuasion,
and physiological and emotional reactions. That is, the structure of the self-efficacy construct is
complex and multidimensional. Therefore, teachers with the same composite score in an
assessment (e.g., Likert scale questionnaire) could actually exhibit different patterns and manners
on teaching, class management, emotion, exhaustion, and so on. So far, limited efforts have been
devoted to research each specific dimension of this general construct.
Emphases on beginning teachers with strong self-efficacy should be traced back to the
examination on the factors that help them feel prepared. Research found that teacher education
and developmental activities serve as a solid foundation for the development of teacher self-
efficacy (e.g., Appleton, 1995; Mulholland & Wallace, 2001; Palmer, 2001; Robardey, Allard, &
Brown, 1994; Ross & Bruce, 2007). However, there is a lack of research concerning whether
teacher education and developmental activities further impact teacher retention. Moreover,
variation exists between teacher education and developmental activities. Teacher preparation
programs by colleges and universities are not the only means for entering the teaching

4
profession. Alternative certificate program offers another avenue to become a teacher.
Meanwhile, due to educational policies and financial budgets, the amount of developmental
activities offered by different states and districts varies. Therefore, it is worthwhile to examine
the training profiles of teacher education and developmental activities and how they are related
to teacher self-efficacy, job satisfaction, and turnover interactively.
Furthermore, research on beginning teachers often considers them as a large
homogeneous group. Few studies have been conducted regarding teachers who taught particular
subjects. Considering the structure of school education in the United States, teachers of early
elementary grades (e.g., Kindergarten, Grades 1, 2 and 3) are usually assigned to teach general
education as a generalist. However, teachers in higher grades are more likely to be assigned to
concentrate on particular subjects. Through reviewing several empirical studies, Guarino,
Santibanez, and Daley (2006) found the attrition rate of teaching profession was higher than
other occupations and varied across teachers specialized in different subjects. For example,
STEM fields struggled with teacher retention greatly (Borman & Dowling, 2017). Therefore,
combining teachers with distinctive characteristics like teaching assignments, working
conditions, and leaving risks as one group could be problematic.
Finally, the vast majority of research on teachers relies on a variable-centered approach
(e.g., regression models, hierarchical linear models), which focuses on the interrelations among
factors. However, conclusions drawn from variable-oriented studies are not always applicable to
the individual cases (von Eye & Wiedermann, 2015). Little has been researched on teachers
through a person-centered approach.
To address these issues, the purposes of the present dissertation on beginning teachers are
to explore their training profiles of teacher education and developmental activities and examine

5
how the training profiles impact their self-efficacy, job satisfaction, and motivation to leave the
profession. Teacher education refers to the training that teacher candidates receive before they
enter the field, such as content coursework and pedagogical coursework. Developmental
activities refer to the training that teachers participate in after they start to teach in classrooms,
such as professional development, induction, and mentorship. These two are both critical
components of teacher training, but they differ based on when teachers can have access to. This
dissertation project uses the 2011-2012 Schools and Staffing Survey along with a person-
centered analytic approach, and consists of three studies as follows:
Study 1: identifies the preservice and in-service training profiles of teacher education as
well as developmental activities among beginning teachers;
Study 2: identifies the profiles of beginning teachers’ self-efficacy and investigate the
relationship between teacher training profiles and self-efficacy profiles as well as between school
location and self-efficacy profiles;
And Study 3: examines the relationships between beginning teachers’ self-efficacy
profile and job satisfaction as well as turnover motivation, after controlling for their training
profiles and school location.

6
CHAPTER II
THEORETICAL FRAMEWORK
Using large-scale secondary data, this dissertation sought to understand beginning
teachers’ self-efficacy profiles through a person-centered analytic approach. The rationale came
from two sources: (a) the lack of literacy knowledge among preservice and in-service teachers
and (b) the interrelations between teacher training, self-efficacy, job satisfaction and turnover.
The purposes of this chapter include: (a) explaining the challenges faced by reading education
and teachers; (b) synthesizing relevant research; (c) demonstrating operational definitions of the
key constructs; and (d) reviewing related theoretical frameworks.
Review of the Literature
Reading Education and Student Reading Achievements
From No Child Left Behind Act (Bush, 2001) to Every Student Succeeds Act (Obama,
2015), literacy remains an essential and fundamental component of school education, especially
for students who are at the elementary grade levels as they transit from “learning to read” to
“reading to learn” (Chall, 1983; Chall & Jacob, 2003). The ability of proficient reading is
invaluable to students, because reading serves as the foundation of learning other content areas,
such as mathematics, social studies, and science (Gaddy, 2003). For instance, students who have
reading comprehension deficits would be less likely to achieve in a timed math assessment, since
they need additional time to comprehend the written questions. Integrating literacy into the
content areas effectively promotes content learning (Cantrell & Hughes, 2008). Therefore,
considerable efforts have been made to produce good readers through funded programs and
research, curriculum design, professional seminars, and standardized assessments.

7
However, the up-to-date results from the 2015 NAEP (i.e., Nation’s Report Card,
National Assessment of Educational Progress) showed that no statistically significant increase
has been found among the fourth, eighth, and twelfth graders’ average reading performance
across the nation for the past two decades. Only around one third of the school-aged population
could achieve the proficient level in reading. Similarly, results from the 2015 PISA (i.e., the
Organization for Economic Co-operation and Development, Program for International Student
Assessment), which internationally measures the academic performance of 15-year-old students,
indicated that almost one fifth of US students scored below the baseline of reading proficiency.
Thus, insufficient reading abilities remains a challenge for the majority of the school-aged
population and potentially impedes their academic achievements in other content areas.
To improve students’ reading performances, a variety of approaches could be made,
among which an adequate supply of teachers with abundant knowledge of literacy would be an
important contributor. The influential role of teachers is irreplaceable (Duffy-Hester, 1999).
Effective teachers could structure their instruction in an explicit and systematic manner to
scaffold students’ learning. Besides, students tend to increase behavioral and emotional
engagement in classrooms when they have a supportive relationship with teachers, thereby
gaining more in academic achievements (Hughes & Kwok, 2007; Skinner & Belmont, 1993).
Peter Effect and Teacher Knowledge of Literacy
The critical role of teachers deserves further examination. Measuring teacher quality
consists of multiple dimensions, including content and pedagogical knowledge. One of the
reasons that sufficient teacher knowledge is important may be due to the Peter Effect (Applegate
& Applegate, 2004), which suggests that one cannot give if one does not have the knowledge. In
the instructional context, this means that teachers can hardly help students develop either reading

8
proficiency or intrinsic motivation to read, if teachers do not have literacy knowledge. In
contrast, teachers with more literacy knowledge are more likely to include it in their instruction
and teach it to their students. Therefore, ineffective instruction, a leading contributor to academic
failure (Bos, Mather, Dickson, Podhajski, & Chard, 2011; Moats, 1994, 2000), was related to the
lack of teacher knowledge as well as poor teacher preparation (Brady & Moats, 1998).
In fact, the Peter Effect exists beyond the school classrooms. Binks-Cantrell, Washburn,
Joshi, and Hougen (2012) validated it within a teacher preparation program. They found that in
the knowledge assessments of basic language constructs, the teacher educators who participated
in development programs aiming on research-based and effective reading instruction performed
better than those who did not participate. Meanwhile, results of the same assessments among
their teacher candidates varied respectively. The teacher candidates who were taught by teacher
educators from the programs that emphasized evidence-based reading instruction had higher
scores on average than their peers who were taught by teacher educators who had not undergone
such professional development. Such findings highlighted the importance of sufficient training
and literacy knowledge on both teacher educators and preservice teachers, since they are the
source of future effective instruction, students’ reading success, and learning foundation.
Teachers who are academically prepared can better scaffold student learning (Darling-Hammond
& Richardson, 2009; Olson, 2000).
Recent studies provided evidence that teachers benefited from increasing literacy
knowledge. Appropriate usage of literacy strategies helps math and science teachers to achieve
their instructional goals through encouraging student thinking, reasoning, and inferencing
(Banilower, Cohen, Pasley, & Weiss, 2008). In a case study, Spitler (2011) tracked the changing
attitude of a first-year math teacher to content literacy. Although having rich knowledge of

9
mathematics, the participant reported a lack of strategies to transfer the knowledge to students at
first. Through completing undergraduate content literacy courses and preparing literacy
instruction for a math classroom, the participant gradually reflected upon the entire teaching
procedure, integrated strategies learned from literacy instruction into math content, and finally
developed a teacher literacy identity. As a result, a growing body of metacognitive practices was
identified in this classroom on both the teacher and his students.
Although research suggested the importance of teachers’ acquisition on literacy
knowledge, transferring this message to preservice and in-service teachers takes time. This
problem can be more serious among teachers whose major teaching assignments are not directly
related to reading, because they are very likely to assume that “literacy instruction was not their
responsibility” (Cantrell & Hughes, 2008, p.103). Moreau (2014) interviewed 35 in-service
generalist teachers about their perceptions and attitudes toward struggling readers. Although
teachers were aware of students’ reading difficulties, they did not attribute teaching specific
reading skills to their responsibilities when they were not assigned to teach literacy. They also
reported a lack of knowledge and instructional strategies to help struggling readers. Such
findings are consistent with previous research, which suggested that in many content areas,
teachers did not feel prepared to provide instruction based on students’ literacy needs (Bintz,
1997; Greenleaf et al., 2001; Mallette, Henk, Waggoner, & DeLaney, 2005). Therefore, literacy
strategies were rarely employed in content courses (Fisher & Ivey, 2005).
Unfortunately, even among reading teachers, accumulating research evidence has
revealed a widespread existence of lack of literacy knowledge. One of the first influential studies
was conducted by Moats (1994). She assessed preexisting literacy knowledge with a diverse
teaching group, which included a broad range from beginning teachers (i.e., in the first year of

10
teaching) to experienced teachers (i.e., in the 20th or later years of teaching) and found that they
had in common a limited understanding of spoken and written language structures, although
these skills were requested by direct and explicit instruction. In-service reading teachers
struggled with a variety of concepts, such as: (a) conceptual terminology in the reading field; (b)
phoneme manipulation; (c) recognition on letter-sound correspondences within specific spelling
patterns; (d) knowledge of functional letter clusters and syllable types; (e) word analyses at the
morpheme level; and (f) understanding of children’s reading difficulty and related interventions
(Bos et al., 2001; Carreker, Joshi, & Boulware-Gooden, 2010; Moats, 1994; Moats & Foorman,
2003). Similar findings were reported among preservice reading teachers as well (Binks, Joshi, &
Washburn, 2009; Cheesman, McGuire, Shankweler, & Coyne, 2009; Spear-Swerling & Brucker,
2003; Washburn, Joshi, & Binks-Cantrell, 2011).
This problem is not prevalent in the United States alone. Fielding-Barnsley and Purdie
(2005) demonstrated that in-service teachers in Australia were poor at recognizing the
contribution of metalinguistic awareness to reading development. The recent special issue by
Annals of Dyslexia, Teacher Knowledge from an International Perspective, reported several
studies relating to literacy knowledge among teachers from different countries and language
backgrounds. For instance, Aro and Björn (2016) reported the existence of limited knowledge of
basic phonological constructs and phonemic awareness skills among preservice and in-service
teachers in Finland. After examining the knowledge among teacher candidates in Canada,
England, New Zealand, and the United States, Washburn and colleagues (2016) found that these
preservice teachers did not have sufficient knowledge of certain literacy constructs that were
needed to instruct beginning readers. In addition, similar findings have been identified among
those EFL (English as a foreign language) teachers as well (Zhao, Joshi, Dixon, & Huang, 2016).

11
To sum up, not all teachers, including both preservice and in-service, are well prepared
with literacy knowledge. Many of them are constrained by limited professional training and have
limited literacy knowledge, although the Peter Effect demonstrates a necessity that teachers
should be knowledgeable. Things could get progressively worse among beginning teachers, since
they have to face challenges from multiple sources aside from content areas and have increasing
contacts with students.
Teacher Training and Continuous Development (Preservice and In-service Phases)
Teacher Education. The history of teacher education in the United States could be
traced back to the eighteenth century. Not until the 1950s did teacher colleges become the
leading force to prepare teacher candidates, and by the 1980s, many of these colleges emerged as
colleges of education in universities (Borman, Mueninghoff, Cotner, & Frederick, 2009).
Colleges of education serve as the main force of teacher preparation and provide traditional four-
or five-year certification programs (Steadman & Simmons, 2007).
Although different institutions do not set up the same executive plans for their teacher
education programs, there are three essential components shared among almost all these
programs. The first component is subject matter knowledge, which enable teachers to understand
and explain the professional content-based concepts thoroughly (Shulman, 1986). Subject matter
knowledge differs from research from academic fields and common knowledge grounded in
daily life (Krauss et al., 2008). Through receiving training on subject matter knowledge, teacher
candidates are supposed to understand that “school subjects consist of more than the facts and
rules they themselves learned as students” (Hattie, 2009, p. 110). The completion of content
coursework helps teachers build up subject matter knowledge. Schmidt et al. (2007) suggested
that in the United States, preservice teachers who registered in programs that included

12
demanding mathematics coursework obtained more math knowledge than peers from other
programs. Teachers’ gaining subject matter knowledge potentially influences teachers’ teaching
behaviors and thus promotes student achievement. For instance, in a meta-analysis on teacher
effectiveness of math teachers, Ahn and Choi (2004) identified a positive relationship between
students’ mathematics achievements and their teachers’ knowledge of mathematics. The effect
sizes were relatively small, but consistent and statistically significant at both elementary (d=0.11,
p<0.05) and secondary (d=0.10, p<0.05) grade levels. Even for in-service teachers, the
completion of the content coursework offered in the traditional programs makes a difference.
Swackhamer (2009) interviewed 88 experienced in-service middle-school teachers. Results
indicated an increase on self-efficacy if teachers recently completed four or more college-level
content courses.
The second component consists of pedagogical content knowledge, which helps teachers
make subject matter knowledge accessible to pass onto students (Shulman, 1986). Preservice
teachers acquire instructional theories and frameworks of teaching and learning through
accredited courses, professional workshops, and seminars. Shulman (1986) described
pedagogical content knowledge as “the ways of representing and formulating the subject that
makes it comprehensible for others” (p. 9). Through efforts to modify Shulman’s definition to
better identify pedagogical content knowledge, research suggested that the development of
pedagogical content knowledge relied on the transformation process of adapting the respective
subject matter knowledge to a great extent (Ball, Lubienski, & Mewborn, 2011; Baumert et al.,
2010; Friedriechsen et al., 2009). Through coursework on content and pedagogical knowledge,
the traditional programs are expected to help preservice teachers understand student thinking,
curriculum landscape, instructional strategies, and how to build on students’ existing knowledge

13
(Loucks-Horsley, Stiles, Mundry, & Hewson, 2009). Acquisition of pedagogical content
knowledge is associated with teacher self-efficacy, as pedagogical content knowledge facilitates
teaching, and successful teaching strengthens teacher self-efficacy through accumulating mastery
experiences (Park & Oliver, 2008).
The last component includes field experiences. Usually during the junior and senior
years, preservice teachers are under supervision by either a departmental supervisor or a mentor
teacher and begin class observation and student teaching practices. Anhorn (2008) recommended
this component as a critical part of teacher education programs, which should be provided earlier
and in a realistic manner. Through student teaching, preservice teachers get increasing exposure
to the schools, classrooms and students and obtain knowledge that can hardly be explicitly
delivered by college faculty in traditional education programs. For instance, Jones, Baek and
Wyant (2017) investigated preservice physical education teachers’ technology use during student
teaching and suggested the necessity of integrating field-based technology experience to develop
preservice teachers’ technological pedagogical content knowledge. Additionally, experience
from student teaching helps preservice teachers reflect on what they have learned on campus and
maintain high-level efficacy. Research by Flores (2015) followed a group of preservice teachers
who practiced student teaching after receiving ten-week training on content and pedagogical
knowledge. The finding of a significant self-efficacy increase was consistent with previous work
(e.g., Davis, Petish, & Smithy, 2006), which supported the positive relationship between
preservice teachers’ efficacy and field experiences. However, as the author suggested, other
factors embedded with student teaching impacted the change of teacher self-efficacy as well.
One example of such contributors was preservice teachers’ collaborative work in planning
discrepant events.

14
Little consensus has been achieved on how to strategically distribute these three
components within the teacher education programs, but the majority of traditional teacher
education programs focused on the latter two components (Darling-Hammond, 2010). Research
has suggested that exposure to all the three components showed their significant contributions to
the development of teachers (e.g., Abell, 2008; Loewenberg Ball, Thames, & Phelps, 2008).
Andrew (1990) compared graduates from four- and five-year programs and found that the latter
led to greater academic qualification and teaching commitment, due not only to higher entry
standards but also to additional student teaching practices and more interactions with peers and
supervisors. In addition, Jimenez-Silva, Olson, and Hernandez (2012) reported an increasing
efficacy about instructing English language learners among preservice teachers, after they
completed the endorsement courses that addressed the specific needs of English language
learners. Organized in a pedagogical framework, these courses provided the foundational
information that pertained to the specific student population. Preservice teaches exhibited a
growing level of confidence on multiple aspects, such as instructional strategies, professional
knowledge, and teaching methods.
However, due to the continuously growing teacher demand, formal teacher preparation
programs by universities are not the only means to enter this field. Alternative teacher
certification programs become another predominant approach to prepare qualified teacher
candidates over the past decades (Blake, 2008; Zeichner & Paige, 2007). These programs offer
teacher training to ensure candidates through this routine are similarly qualified as those through
a traditional routine (Darling-Hammond, Berry, & Thoreson, 2001). The organization of these
programs is not always consistent. Darling-Hammond, Chung, and Frelow (2002) pointed out
that the programs varied from short summer teaching practices to yearlong professional

15
trainings, which included coursework and mentoring as well. Qu and Becker (2003) provided
one example of the alternate programs in Mississippi, which instructed teacher candidate for
three weeks in summer. A later work by Walsh and Jacobs (2007) reported an increase in classes
and training time on educational coursework in alternate programs. To sum up, great variation
exists among teacher candidates from alternative teacher certification programs, even though
they go through all the requested components of teacher education.
Debate on which training routine could make teachers better prepared is ongoing, and the
findings are mixed. Evidence that little difference was found leads to some argument that
traditional teacher preparation programs were associated with little unique value (Gatlin, 2009;
Wilson, Floden, & Ferrini-Mundy, 2002). Teachers from alternate routines are quite effective
and have a high level of preservice preparation (Sass, 2008). Lowery, Roberts, and Roberts
(2012) interviewed several in-service teachers trained through different routines and suggested
that both routines were effective regarding teacher preparation. Even within the same training
routine, the structure of education programs varies. Barnes and Smagorinski (2016) compared
preservice teachers from three different programs. A comparison across the programs showed
that different teacher education programs had different focuses on their program designs (e.g.,
curriculum, student pathways), coursework (e.g., teaching principles), and field experiences
(e.g., setting, mentor teachers). Their results indicated that preservice teachers reported similar
learning outcomes regardless of the variation of program structures. Additionally, through
examining a group of first-year teachers, Fox and Peters (2013) found evidence that teachers
from different training routines failed to yield significantly different levels of self-efficacy,
which further indicated the effectiveness of both training routines.

16
In contrast, Darling-Hammond and colleagues (2002) suggested that beginning teachers
from distinctive preparation routines had different feelings of preparedness. Teachers from
traditional education programs showed stronger self-efficacy than those who selectively
completed some university courses, although the latter reported being better prepared than those
from alternative programs or even without prior education-related experience. Laczko-Kerr and
Berliner (2002) claimed similar findings as they noticed that students of certified teachers
achieved higher academic growth than peers of under-certified teachers from the alternative
program, Teaching for America. Maloch and colleagues (2003) found that high-quality teacher
preparation shaped beginning teachers’ perceptions and understandings of reading instruction.
Moffett and Davis (2014) reported that around one fourth of their sampled teachers were
certified through an alternate route. Their findings demonstrated that teachers certified through a
traditional route received statistically significant mentor support than peers certified through an
alternate route, which impacted their efficacy of teaching preparedness. However, teacher
preparation programs are also criticized for inadequate preparation and faculty commitment
(Borman et al., 2009; Shulman, 2005). In summary, strengths and shortcomings of both types of
teacher preparation programs and alternative teacher certification programs have to be
acknowledged, instead of one-size-fits-all evaluations on programs. The teacher preparation
program is not the only means of preservice training responsible for teacher education.
Professional Development. When teachers join the profession, they have access to
various in-service developmental activities, among which professional development plays an
important role. Professional development refers to in-service “teachers’ opportunities to learn”
(Cohen & Hill, 2000), which enables teachers to participate in a variety of developmental
activities. Different districts and schools offer different types of professional development

17
programs, such as observational visits, workshops, and seminars. Every school year, the
professional development activities by one district or school may also vary slightly. Besides,
federal and state grants and funding could be one additional constraint on the supply of
professional development. Although variations among professional development programs
widely exist, high-quality professional development is always required. Griffin (1983) suggested
that the goal of professional development was to “alter the professional practices, beliefs, and
understanding of school persons toward an articulated end” (p. 2). According to the model of
teacher change (Guskey, 1986, 2002), good professional development can help teachers gain
knowledge and skills and adjust their teaching, which coincides with increasing of student
achievement and strengthens teachers’ attitudes and self-efficacy in turn. In contrast, if teachers
receive poor support from professional development, their teaching behaviors are less likely to
be modified. Therefore, it is more difficult for students in these classrooms to advance their
learning. As a result, since student achievements also impact teacher efficacy, these teachers are
more likely to lose confidence in teaching and then leave the profession (Bruce, Esmonde, Ross,
Dookie, & Beatty, 2010).
Professional development benefits both teachers and students. Research has shown that
professional development could change teachers’ behaviors (Dennis & Horn, 2014), encourage
increasing implementation of strategies, and strengthen teachers’ self-efficacy for instruction
(Tschannen-Moran & McMaster, 2009). Meanwhile, students in classrooms with teachers who
receive professional development are more likely to have greater academic achievement than
their peers whose teachers did not receive the developmental training. The estimate of average
standardized mean difference, as the index of the expected change in percentile rank, was 0.53
(Yoon et al., 2007).

18
Rather than repetitively participating in professional development programs, the
effectiveness of the programs should be carefully considered to avoid wasting of time and
money. Research on professional development summarized some important features on
improving the effectiveness of training. For instance, Garet and colleagues (2001) compared the
effects of several features of professional development on mathematics and science teachers.
They found that to receive better outcomes on teachers’ acquisition on knowledge and skills and
change their in-class behaviors, professional development should concentrate on subject matter
knowledge, provide practices of hands-on work, and keep coherent with school life. In addition,
the form and duration mattered. Penuel, Fishman, Yamaguchi, and Gallagher (2007) reported
that professional development with relatively longer duration and collective participation could
be more helpful. In fact, such findings also address the common critiques of professional
development, such as short duration (e.g., single-shot one-day workshops, Yoon, Duncan, Lee,
Scarloss, & Shapley, 2007) and weak in-depth curriculum connections (Ball & Cohen, 1999),
and suggest adjustments should be considered when designing professional development
programs.
Additional Developmental Activities. In order to better support in-service teachers,
aside from professional development, there are additional types of developmental activities
provided to teachers. Ingersoll and Strong (2011) distinguished these developmental activities
from teacher education and professional development through a theoretical approach. They
suggested that teacher education consisted of “education and preparation candidates receive
before employment (including clinical training, such as student teaching)” and professional
development focused on “periodic upgrading and additional professional development received
on the job, during employment” (p. 203). Examples of these additional developmental activities

19
included individual and collaborative research, mentoring and peer observation, and informal
dialogue to improve teaching (Peña-López, 2009).
Research suggested a positive impact on teacher self-efficacy, job satisfaction, and
teacher retention, when teachers had increasing access to various developmental activities. A
selection of these developmental activities include induction programs (Ingersoll & Strong,
2011), mentorship from the same subject field (Smith & Ingersoll, 2004), beginning teacher
seminars (Kang & Berliner, 2012), extra classroom assistance (Kang & Berliner, 2012), common
planning time (Drolet, 2009; Kang & Berliner, 2012; Warren & Muth, 1995), and collaboration
(Ingersoll & Strong, 2011; Smith & Ingersoll, 2004). However, similar to professional
development, simply participating in these developmental activities is only halfway through the
journey. The quality of these activities should be considered seriously. Teachers who receive
high-quality developmental support are more likely to stay than those who receive weak or fair
support. Kapadia, Coca, and Easton (2007) found that the intensity and perceived helpfulness
yielded a significant difference in regards to teacher retention. Ingersoll (2012) reported an
association between teachers’ participation in induction programs and teacher retention.
However, he also pointed out that the strength of the link relied on the types and amount of
professional support. Convergent with previous research, DeAngelis, Wall, and Che (2013)
identified a relationship between the quality and comprehensiveness of induction and mentoring
and teachers’ willingness to leave. Considering the quality issue of developmental activities
helps to understand why some research did not find the effect of induction on teacher retention
and teaching performances (e.g., Glazerman et al., 2010). Smith and Ingersoll (2004) indicated
that teachers usually received multiple types of developmental support as “packages” or
“bundles”, which increased the likelihood of their retention (Ingersoll, 2012).

20
Teacher Self-efficacy
Self-efficacy is defined as “people’s judgments of their capabilities to organize and
execute courses of action required to attain designated types of performance” (Bandura, 1986, p.
391). More precisely, teacher self-efficacy refers to “individual beliefs in their capabilities to
perform specific teaching tasks at a specified level of quality in a specified situation” (Dellinger,
Bobbett, Olivier, & Ellett, 2008). The construct of self-efficacy originates from social cognitive
theory (Bandura, 1977, 1986). Based on the social cognitive theory, three modes of agency
within beliefs, including individual, proxy, and collective agencies, are in charge of individuals’
actions, and this brings about the belief that individuals can “influence the course of events by
their actions” (Bandura, 2006, p. 4),. Individual agency emphasizes the role of individuals, since
they are the major carrier of actions and then impact on others and outer environment. However,
individuals may lack direct control over social conditions and institutional practices of daily
lives. Therefore, they have to rely on other means of professionalism or expertise through proxy
agency, in search of personal well-being, security, and valued outcomes. Finally, individuals live
with relations and interactions. Therefore, individuals “pool their knowledge, skills, and
resources, provide mutual support, form alliances, and work together to secure what they cannot
accomplish on their own” (Bandura, 2006, p. 5). Collective agency is based on the shared beliefs
that cooperation can lead to desired changes in lives.
Bandura (1977, 1986, 1997) postulated four major sources of self-efficacy: mastery
experiences, vicarious experiences, physiological reactions, and verbal persuasion. Mastery
experiences are the dominant source of self-efficacy (Bong & Skaalvik, 2003; Pajares, 1997),
especially for beginning teachers (Mulholland & Wallace, 2001). That is to say, the increase of
teachers’ perception of self-efficacy is subject to their recognition of adequate preparation and
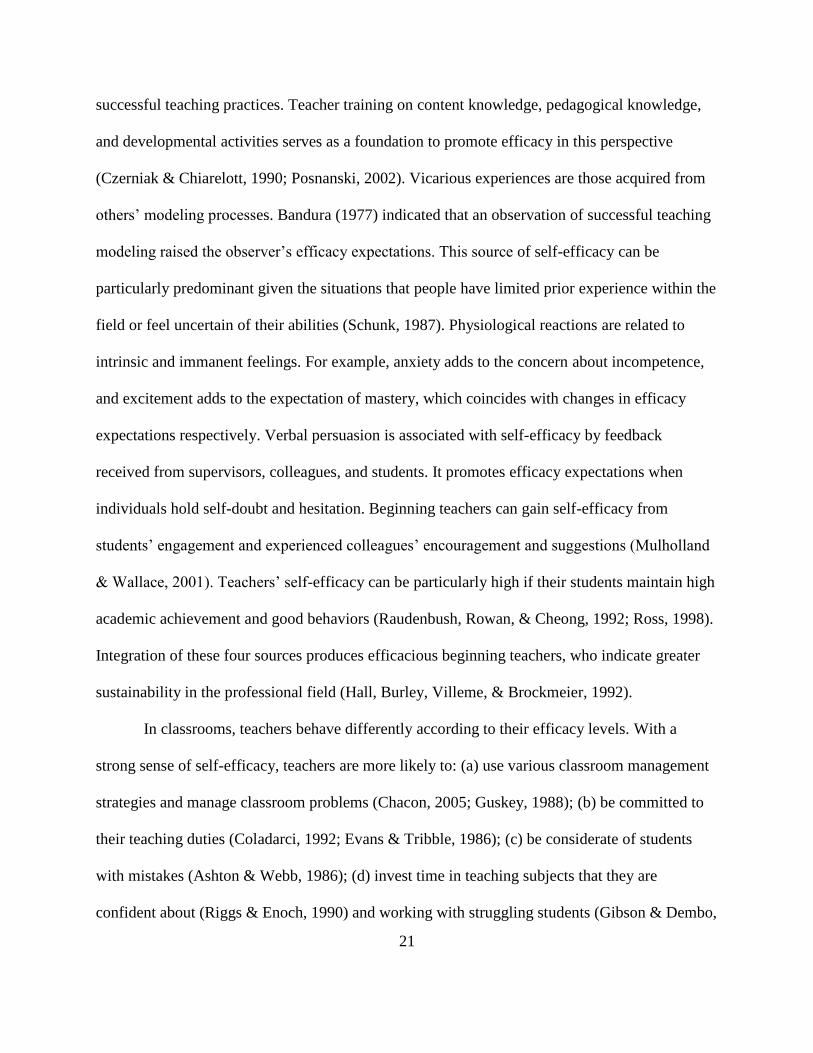
21
successful teaching practices. Teacher training on content knowledge, pedagogical knowledge,
and developmental activities serves as a foundation to promote efficacy in this perspective
(Czerniak & Chiarelott, 1990; Posnanski, 2002). Vicarious experiences are those acquired from
others’ modeling processes. Bandura (1977) indicated that an observation of successful teaching
modeling raised the observer’s efficacy expectations. This source of self-efficacy can be
particularly predominant given the situations that people have limited prior experience within the
field or feel uncertain of their abilities (Schunk, 1987). Physiological reactions are related to
intrinsic and immanent feelings. For example, anxiety adds to the concern about incompetence,
and excitement adds to the expectation of mastery, which coincides with changes in efficacy
expectations respectively. Verbal persuasion is associated with self-efficacy by feedback
received from supervisors, colleagues, and students. It promotes efficacy expectations when
individuals hold self-doubt and hesitation. Beginning teachers can gain self-efficacy from
students’ engagement and experienced colleagues’ encouragement and suggestions (Mulholland
& Wallace, 2001). Teachers’ self-efficacy can be particularly high if their students maintain high
academic achievement and good behaviors (Raudenbush, Rowan, & Cheong, 1992; Ross, 1998).
Integration of these four sources produces efficacious beginning teachers, who indicate greater
sustainability in the professional field (Hall, Burley, Villeme, & Brockmeier, 1992).
In classrooms, teachers behave differently according to their efficacy levels. With a
strong sense of self-efficacy, teachers are more likely to: (a) use various classroom management
strategies and manage classroom problems (Chacon, 2005; Guskey, 1988); (b) be committed to
their teaching duties (Coladarci, 1992; Evans & Tribble, 1986); (c) be considerate of students
with mistakes (Ashton & Webb, 1986); (d) invest time in teaching subjects that they are
confident about (Riggs & Enoch, 1990) and working with struggling students (Gibson & Dembo,

22
1984); (e) keep students engaged in tasks (Podell & Soodak, 1993); (f) learn and implement
innovative teaching strategies and methods (Allinder, 1994; Ross, 1994, 1998); and (g) take
responsibility to instruct struggling students instead of referring them to special education
(Allinder, 1994; Meijer & Foster, 1988; Soodak & Podell, 1993). In fact, teacher self-efficacy
has been found among the few teacher characteristics that are associated with student
achievement (Armor et al., 1976; Tschannen-Moran, Hoy, & Hoy, 1998; Tsouloupas et al.,
2010). Therefore, preparing efficacious teachers and teacher candidates is vital. Research has
shown that the first year of teaching is a critical determinant of the long-term development of
teacher self-efficacy. However, a significant decline has been found during the first year of
teaching (Hoy & Spero, 2013).
As previously discussed, one limitation of research on teacher self-efficacy is that this
construct is often measured as a one-dimensional construct (Schwarzer, Schmitz, & Daytner,
1999), regardless of its multiple dimensions (Ashton & Webb, 1982). Therefore, Skaalvik and
Skaalvik (2007) examined the structure of teacher self-efficacy and conceptualized six separate
but interrelated dimensions. The present dissertation is designed based on these findings and
focuses on beginning teachers.
School Context and Teacher Self-efficacy. Because of its importance for teachers,
teacher self-efficacy is associated with several internal and external factors, such as teacher
training, student behavior, collaborative relationships (Caprara, Barbaranelli, Steca, & Malone,
2006). Among these influential factors, many are classified as school context. Measurement of
school context includes multiple indicators. For instance, Hallinger, Bickman, and Davis (1996)
considered four factors (student socioeconomic status, parental involvement, principal gender,
and teaching experience). Research on school context by Klusmann and colleagues (2008)

23
concentrated on other six factors (principal support, teacher morale, cooperation with colleagues,
student discipline, students’ cognitive ability, and socioeconomic background). When examining
the impact of school context on teacher turnover and job satisfaction, Skaalvik and Skaalvik
measured four factors (supervisory support, time pressure, relationships with parents, and
autonomy) in their 2009 work, but six (supervisory support, time pressure, relations with parents,
relations with colleagues, value consonance, and discipline problems) in their 2011 study. Muller
(2016) reviewed the several National Center for Education Statistics programs and found that
when measuring school context, different programs and studies chose to employ different
indicators, such as school climate, curriculum, and so on.
In the network of all these significant indicators, a critical one, which is the primary
interest in this dissertation, is school location, whether the schools are located in an urban,
suburban or rural setting. Including this indicator is critical for teacher self-efficacy research
(Klassen, Tze, Betts, & Gordon, 2011; Pajares, 2007) because teachers who work in different
school settings may face different challenges. Review of recent national reports on public
schools (Goldring, Gray, Bitterman, & Broughman, 2013; Taie, Goldring, & Spiegelman, 2017,
see Table 1 for a summary) showed that the features of students and schools varied upon
locations and thus teachers working in different settings would face different challenges.
Teaching in urban schools is not an easy job (Groulx, 2001; Smith & Smith, 2006), and teachers
in urban schools exhibited a relatively higher attrition probability (Borman & Dowling, 2008).
The majority of students enrolled in urban schools were minority students (33.5% Hispanic and
23.4% African American students in Goldring et al., 2013) and participated in the free or
reduced-priced lunch program (60.6% in Goldring et al., 2013 and 58.8% in Taie et al., 2017).
Additionally, compared to students enrolled in other settings, a higher percentage of students in

24
urban schools were English language learners or struggled with limited English proficiency
(15.1% in Goldring et al., 2013). On the other side, urban schools were less likely to offer online
courses (16.8% in Taie et al., 2017), but more likely to provide individualized courses for
developing (67.8% in Taie et al., 2017) and advanced students (54.1% in Taie et al., 2017).
Therefore, compared to peers in other school settings, teachers in urban schools are probably in
need of different types of professional support (Gaikhorst, Beishuizen, Roosenboom, & Volman,
2017) and thus are associated with different levels of efficacy, job satisfaction and turnover
motivation in the same circumstance. For instance, Siwatu (2011) compared preservice teachers’
efficacy in urban and suburban settings and found preservice teachers were more prepared and
confident to teach in a suburban school rather than an urban school. Therefore, to extend the
findings from existing research, this dissertation includes school location and investigates its
impact on beginning teachers’ self-efficacy profiles.
Table 1
Summary of Public School Characteristics upon School Location from National Reports
Public School Characteristics Location
Urban Suburban Town Rural
2011-2012 Schools and Staffing Survey
Schools that participated the federal free or
reduced-price lunch program
96.7% 97.1% 96.4% 95.4%
Schools with at least one student on an IEP 98.9% 97.6% 98.3% 97.5%

25
Table 1 Continued
Public School Characteristics Location
Urban Suburban Town Rural
Schools with instruction specifically designed
for the needs of ELL or LEP
83.2% 84.1% 71.6% 59.2%
White, non-Hispanic students 32.6% 55.6% 66.3% 70.8%
Hispanic students 33.5% 21.3% 17.6% 13.5%
African American, non-Hispanic students 23.4% 13.4% 10.5% 9.5%
Students that received Type I service 49.5% 29.1% 41.5% 32.8%
Students who were approved for free or
reduced-price lunches
60.6% 37.5% 49.9% 44.6%
Students with an IEP 11.6% 11.6% 12.5% 11.5%
Students who were ELL or LEP 15.1% 8.6% 6.5% 4.8%
2015-2016 National Teacher and Principal Survey
Schools that participated the federal free or
reduced-price lunch program
95.0% 95.2% 93.7% 93.6%
Schools with at least one student on an IEP 98.7% 99.3% 98.4% 98.8%
Schools with instruction specifically designed
for the needs of ELL or LEP
80.3% 85.5% 73.4% 62.7%
Schools that offered courses entirely online 16.8% 16.4% 22.4% 30.2%
Schools where instruction beyond the normal
school day were provided for students who
need academic assistance
67.8% 55.2% 58.9% 55.0%

26
Table 1 Continued
Public School Characteristics Location
Urban Suburban Town Rural
Schools where instruction beyond the normal
school day were provided for students who
need academic advancement
54.1% 40.5% 39.9% 36.6%
Students that received Type I service 52.7% 32.8% 48.2% 42.7%
Students who were approved for free or
reduced-price lunches
58.8% 42.7% 54.9% 49.4%
Students with an IEP 11.8% 11.5% 12.4% 12.5%
Note. Descriptive sources are adapted from Goldring et al. (2013) and Taie et al. (2017). IEP,
Individual Education Plan; ELL, English language learners; LEP, limited-English proficient
students.
Job Satisfaction
Job satisfaction is an employee’s positive evaluative state from their job position (Locke,
1976). In the context of education, Skaalvik and Skaalvik (2011) specified teachers’ job
satisfaction as “teachers’ affective reactions to their work or to their teaching role” (p. 1030).
Dinham and Scott (1998, 2000) suggested that there are three domains of sources of teacher job
satisfaction. Satisfaction relates to intrinsic rewards of teaching (e.g., student achievement,
teacher advancement), which is the main source (Scott, Stone, & Dinham, 2001). Meanwhile,
dissatisfaction is associated with extrinsic challenges (e.g., working conditions, supervision,
compensation, policies). For instance, a decline in satisfaction is found when teachers experience
limited autonomy in classrooms (Crocco & Costigan, 2007; Hall, Pearson, & Carroll, 1992). In

27
addition, the third domain consists of school-based factors, such as teacher status and educational
change.
In general, research has consistently demonstrated a significantly positive relationship
between job satisfaction and job performance (Harrison, Newman & Roth, 2006; Judge, Bono,
Thoresen, & Patton, 2001). More specifically, teachers who tended to leave or transfer exhibited
less job satisfaction and more negative attitudes toward their teaching profession as well as the
school administration (Hall et al., 1992). Liu and Ramsey (2008) examined the 2000-2001
Schools and Staffing Survey and found that teachers’ dissatisfaction originated from limited time
for planning and preparation, overloaded teaching assignments, and low compensation. For
beginning teachers, they complained about lack of instructional support and then being left alone
to survive in the classroom. Although they observed that teachers’ job satisfaction increased
along with their years of teaching, a generalized relationship should be concluded with caution
because dissatisfied teachers could already leave during their early years.
One limitation of research on teacher job satisfaction, mentioned by Skaalvik and
Skaalvik (2009, 2010), is the inconsistent approach to measure this construct. Job satisfaction
could be considered either through the extent that teachers feel satisfied with some specific
aspects of their occupation or as a comprehensive index of the job. In the present dissertation,
teachers’ job satisfaction is recognized as an overall sense of teaching, which is consistent with
Skaalvik and Skaalvik (2011), because the former facet-specific approach underestimates the
variation of the importance of particular circumstances to certain individual teacher (Skaalvik &
Skaalvik, 2010).
Teacher Turnover
When teachers join the field, the probability of their turnover exists. Teacher turnover

28
refers to “the departure of teachers from their teaching jobs” (Ingersoll, 2001, p. 500). Teachers
may either transfer to another school (i.e., movers) or leave the profession to pursue other career
opportunities (i.e., leavers). According to the review by Skaalvik and Skaalvik (2009), teachers’
choice of turnover is attributed to “a syndrome of emotional exhaustion, depersonalization and
reduced personal accomplishment” (p. 518). Emotional exhaustion refers to the pressure teachers
undertake because of teaching. Depersonalization is about negative attitudes towards students,
colleagues, and administration. Reduced personal accomplishment relates to negative self-
evaluation and depressed motivation because of the occupation itself. These three factors cannot
be treated as one single measure (Bryne, 1994). On the other hand, teachers choose to enter and
continue their teaching due to the labor market theory of supply and demand (Ehrenberg &
Smith, 2011). Guarino, Santibañez, and Daley (2006) defined the demand and supply for
teachers with their pursuit of overall compensation, which includes not only monetary
compensation and benefit packages, but also specific rewards derived from teaching.
It is important to notice that multiple factors influence teachers’ choice of turnover. For
instance, research has achieved a consensus of the predictability of teacher self-efficacy and job
satisfaction on teacher turnover (Muhangi, 2017; Skaalvik & Skaalvik, 2007, 2010; Tiplic,
Brandmo, & Elstad, 2015). When teachers are associated with high self-efficacy and high job
satisfaction, their probability of turnover tends to decrease. However, some controversy should
also be highlighted. One example is related to school and teacher characteristics. Using the 1999-
2000 Schools and Staffing Survey (SASS), Hahs-Vaughn and Scherff (2008) suggested that
salary was a significant indicator of beginning reading teachers’ turnover, while school and
teacher characteristics were not. Using the same data but including all the beginning teachers,
Smith and Ingersoll (2004) suggested that the turnover rates varied upon school types (i.e.,

29
public, charter, and private schools), school size, poverty, and school characteristics (e.g.,
religious affiliation). Hancock and Scherff (2010) examined the 2003-2004 SASS and reported
that full-time secondary reading teachers were less likely to choose turnover if they were
minority, worked for five or more years, kept enthusiasm with their work, and received peer and
administrative support. In a meta-analysis, Borman and Dowling (2017) suggested that both
school and teacher characteristics were important moderators to teacher turnover. Teachers who
were (a) female, (b) white, (c) young, and (d) married with one child had a high probability of
turnover. Meanwhile, schools were more likely to lose their teachers, if they were (a) in urban
and suburban settings, (b) private, and (c) elementary level and lacked (a) collaboration, (b)
teacher networking and (c) administrative support. Therefore, depending on the teacher group of
interest and the analytic methods, findings of influential factors on teacher turnover are likely to
be changed slightly.
The trend of teacher turnover, including both movers and leavers, followed a U-shaped
plot (Guarino et al., 2006). It underscored the fact that the ratio of leaving among beginning
teachers is particularly high. It was estimated that about 14% of beginning teachers chose to
leave the field while 15% moved to other schools and districts (Smith & Ingersoll, 2004).
To sum up, reviewing the existing literature leads to the central interest of the present
dissertation, which examines the fragile group, beginning teachers, in the entire teacher
population. The interrelations among their acquired teacher training, self-efficacy, job
satisfaction, and turnover motivation are supposed to be explored from an individual-based (i.e.,
teachers) perspective.

30
CHAPTER III
METHODOLOGY
This chapter includes the methodological components used in the present dissertation.
First, the research purposes of the dissertation are clarified. The research questions as well as a
brief summary of analyses are provided. Second, the 2011-2012 SASS data is introduced and the
selection criteria to establish the sample for this dissertation were demonstrated. Third, the
measures and survey items included are listed in details and their descriptive information was
provided. Finally, the methods and the analytic plan are explained. The overall goal of this
chapter is to specify how the study results were generated.
Research Purposes
The present dissertation consisted of three related studies. The general goal was to
examine the hierarchical conceptualization at the individual level (i.e., a person-oriented
approach), regarding the relationships among beginning teachers’ training profiles, self-efficacy
profiles, and job satisfaction and turnover motivation. Overall, the hypothesis was that at the
individual level, beginning teachers, who acquired adequate teacher education experiences as
well as developmental activities and did not work in urban schools, would exhibit a high level of
self-efficacy along with a high level of job satisfaction and a low level of turnover motivation
than their peers.
The first study sought to identify beginning teachers’ training profiles. First, their profiles
of teacher education (i.e., during preservice phase) as well as developmental activities (i.e.,
during in-service phase) were established and examined separately. Additionally, the association
of their preservice and in-service training profiles was investigated. Because, hypothetically, it is

31
possible that beginning teachers with strong education background choose to leave due to
inadequate professional development and support. On the other hand, those who received strong
professional development as well as additional support might retain regardless of their preservice
education background. Through the first study, the characteristics of the training that beginning
teachers received were expected to be presented.
The second study concentrated on teacher self-efficacy and its relationship with
beginning teachers’ training profiles. Since self-efficacy is complex and multi-faceted, multiple
SASS questionnaire items in regards to teacher self-efficacy were included as indicators of the
latent construct. Then the profiles of teacher self-efficacy were examined and the interpretations
on the features of each latent class were provided through the comparisons with the distinctive
classes. Additionally, the classification of beginning teachers’ self-efficacy profiles was
examined after controlling for the variation of their training profiles. It is expected that beginning
teachers with strong training profiles had a higher probability to be grouped with high self-
efficacy profiles. Finally, the association between the self-efficacy profiles and school context
was investigated. According to previous research, it is anticipated that beginning teachers in
urban schools tended to exhibit low-level self-efficacy.
The third study examined the relationships of beginning teachers’ self-efficacy, job
satisfaction and turnover motivation. Using the information acquired from the previous studies,
job satisfaction and leaving motivation were included as independent distal outcomes during the
modeling stages, in order to examine the direct impacts of teacher training, school context and
self-efficacy status. The expectation was that beginning teachers who had high self-efficacy
profiles were associated with high-level job satisfaction and low-level turnover motivation, after
controlling for their training profiles and school context.

32
To sum up, the detailed research questions and their relevant analytic methods are
presented in Table 2. In addition, the visualized representations of the analytic models of the
three studies are provided in Figures 1, 2, and 3.
Table 2
Research Purpose, Analysis Methods, and Research Questions
Purpose of the Study Analysis Method Research Question
Study 1: to identify the
training profiles of teacher
education as well as
developmental activities
among beginning teachers
Latent Class Analysis;
Chi-square
Independence Test
1.1 What are the profiles of beginning
teachers’ preservice training (i.e.,
teacher education)?
1.2 What are the profiles of beginning
teachers’ in-service training (i.e.,
developmental activities)?
1.3 Are beginning teachers’ preservice
training profiles associated with their
in-service training profiles?
Study 2: to identify the
profiles of teacher self-
efficacy and to investigate
how training profiles and
school context are
associated with beginning
teachers’ self-efficacy
profiles
Latent Class Analysis;
Latent Class
Regression Analysis
2.1 What are the profiles of beginning
teachers’ self-efficacy?
2.2 Do their self-efficacy profiles vary
upon their training profiles?
2.3 Do their self-efficacy profiles vary
upon school locations?

33
Table 2 Continued
Purpose of the Study Analysis Method Research Question
Study 3: to examine the
relationship between self-
efficacy profiles and
beginning teachers’ job
satisfaction as well as
turnover motivation
Latent Class Analysis
with Distal Outcomes
3.1 Is beginning teachers’ job
satisfaction associated with their self-
efficacy profiles controlling for their
training profiles and school locations?
3.2 Is their moving motivation
associated with their self-efficacy
profiles controlling for their training
profiles and school locations?
3.3 Is their leaving motivation
associated with their self-efficacy
profiles controlling for their training
profiles and school locations?
Figure 1. The analytic model of teacher training.

34
Figure 2. The analytic model of teacher self-efficacy with covariates.
Figure 3. The analytic model of teacher self-efficacy with distal outcomes.

35
Data Description
Schools and Staffing Survey, sponsored by the National Center for Education Statistics
(NCES) of the Institute of Education Science (IES), has been conducted several times during the
last three decades. It is a nationally representative sample survey about public and private
schools, which carry grade levels from Kindergarten to Grade 12. For public schools, SASS
constructs its sample using a stratified, probability proportionate to size approach. That is to say,
schools were first sampled by school type (i.e., the first level of stratification including public
charter schools, traditional public schools, and some where counties are defined as school
districts), and then linked to their corresponding districts and states (i.e., the second level of
stratification). Finally, teachers were stratified based on their years of teaching and randomly
selected within each stratum from the school sampling. SASS selected no more than 20 teachers
per school in order to avoid schools being overburdened (see Appendix B in Goldring, Gray, &
Bitterman, 2013 for more information about SASS methodological notes). Similar sampling
process was applied within private schools, but stratums were quite different.
The dissertation used Teacher Questionnaire of the 2011-2012 SASS, which consisted of
comprehensive measures of public school teachers regarding their background information,
working conditions, school climate, and attitudes. A selection of survey items were employed in
order to address the research questions in this dissertation. Because the dissertation included the
information from the data, which is secondary and restricted-use based on NCES IES policies,
the relevant IRB application was submitted and approved (IRB2017-0154).
Sample Selection
The sample in this dissertation was pulled from the entire 2011-2012 SASS sampling

36
pool, which includes around 37,000 participants in total. The selection criteria on participants of
this sample were listed as following:
1. the participants were teachers who worked in public schools during the 2011-2012
school year (i.e., survey time) and first started teaching since the 2011-2012 school year (i.e.
T0040=201112);
2. their years of teaching (excluding time on leave and student teaching while including
the 2011-2012 school year) were no more than one school year (i.e., T0042≤1);
3. the participants were identified as regular full-time teachers (i.e., T0026=1) and the
participants who were identified as regular part-time/itinerant/long-term substitute teachers were
excluded;
4. they taught grade levels ranging from Kindergarten to Grade 12 during the 2011-2012
school year (i.e., responses from T0071 to T0083=1 while T0070 and T0084=2).
Detailed information of all survey items is given in Table 3. Based on criteria listed
above, the final sample size is 1,364. According to the selection criteria, the sample of this
dissertation includes all beginning teachers (i.e. first-year of teaching) who taught the grade
levels from Kindergarten to Grade 12 in the 2011-2012 SASS dataset. The rationale of this
research was related to the examination of teacher knowledge of literacy in general. Therefore,
the participants consisted of both beginning teachers who identified themselves as reading
teachers (i.e., T0090=101/102/151/152/153/154/155/158/159) and those whose main teaching
assignments were other than English and Language Arts (e.g., mathematics and computer
science, social sciences). The classification of reading teachers was based on the report by
National Center for Education Statistics (2004), which considered both general elementary

37
teachers and teachers assigned specifically to teach English and Language Arts as reading
teachers.
Descriptive information of the sample, including demographics, education background,
teaching assignments and additional assistance, is provided in Table 4. Results indicated the
characteristics of beginning teachers in United States that most of them were: 1) female, 2)
white, and 3) around 20 to 30 years old. The majority of the participants had Bachelor degrees
but only a few of them also hold Master degrees. They were assigned to teach a variety of
subject areas and at all the grade levels. In addition, although most of them had regular
supportive communication with the administrators, they lacked reduced teaching schedules and
extra classroom assistance.
Measures
Teacher Education (Preservice Training). To investigate the profiles of beginning
teachers’ preservice training, the selection of indicators of teacher education considered several
perspectives: degree status, undergraduate majors, coursework completion, and field
experiences. Each indicator was coded as binary (i.e., yes=1 and no=0). Some indicators were
recoded because of two reasons. First, a single indicator was expected to represent both degree
status and undergraduate majors. Results from screening the sample indicated that some
participants had two major fields in their undergraduate programs. Thus, the indicator
“undergraduate major” was created to identify whether the participants majored in general
education and/or English as Language Arts, considering the research interest in the completion of
reading coursework. There were 42.7% (n=582) of the participants coded as 1 (i.e., majoring in
general education and/or English as Language Arts in their first and/or second major fields) and
57.3% (n=782) coded as 0. Second, the responses to some survey items were greatly biased and

38
simply coding as “yes” and “no” could not provide a meaningful cutoff value. An example was
the indicator, “field experiences”. Only around 10% of the participants did not have any field
experience before they entered the field. The new coded cutoff was set as “12 weeks or more”
instead. Therefore, there were 70.3% (n=959) of the participants coded as 1 and 29.7% (n=405)
coded as 0. Overall, the four indicators of teacher education were modified to undergraduate
major, reading coursework, teaching method coursework, and field experiences. Detailed
information of the survey items on teacher education is given in Table 5.
Developmental Activities (In-service Training). To demonstrate the profiles of
beginning teachers’ in-service training, the measure of developmental activities consisted of five
indicators: induction program, common planning time, seminars for beginning teachers,
discipline-specific mentorship, and instructional collaboration. Each item was coded as binary
(i.e., yes=1 and no=0). The indicator “discipline-specific mentorship” was established through
two steps. First, whether the participants received mentorship and the frequencies of meetings
between mentors and mentees were considered. If the participants reported that they never met
their mentors during the first year of teaching, these cases were coded as the equivalent of those
who did not receive any mentorship. Second, among participants who did receive mentorship,
whether their mentors ever instructed the same subject area was coded. It is worthwhile to notice
that discipline-specific mentorship was examined rather than general mentorship. Research
suggested that beginning teachers tended to have low self-efficacy if they were assigned to teach
a subject area different from their certification area (Fox & Peters, 2013). Thus, the inclusion of
discipline-specific mentorship aimed on exploring the impacts of mentorship and teaching
assignment fields as an integration. There were 49.6% (n=677) of the participants receiving

39
mentorship in the same subject area and 50.4% (n=687) who did not. Detailed information of the
survey items on developmental activities is given in Table 5.
Teacher Self-efficacy. SASS evaluated teacher self-efficacy in teachers’ first year of
teaching. Therefore, for beginning teachers, the information was collected based on their
experience during the 2011-2012 school year. The indicators of teacher self-efficacy included
beginning teachers’ feelings of preparedness on eight aspects: classroom management,
instructional method usage, subject matter, computer usage, student assessment, differentiated
instruction, informed instruction, and state content standards. Each item was coded as categorical
(i.e., not at all prepared=1, somewhat prepared=2, well prepared=3, very well prepared=4).
Detailed information of the survey items on teacher self-efficacy is given in Table 5.
School Context. The teacher questionnaire did not have survey items directly related to
school context. Instead, teachers reported their employment information including the school
names, locations and zip codes. Therefore, school location was included as an alternative. The
entire SASS data reported the school location for each participant. Based on previous research,
the original coding of school location was transcribed as a binary observed variable (i.e., urban
school setting=1, non-urban school setting=0). The non-urban school settings included schools in
suburban, rural areas and towns. Detailed information of the survey item on school location is
given in Table 5.
Job Satisfaction. Measurement on teacher job satisfaction is under debate, since this
construct could be identified as facet-specific as well as comprehensive (Skaalvik & Skaalvik,
2009, 2010). In the present dissertation, job satisfaction has been considered as an overall
construct. There is one survey item in SASS directly measuring teachers’ overall job satisfaction
(i.e., T0451). Therefore, the variable was coded as categorical and valued in a reversed order

40
(i.e., strongly agree=4, somewhat agree=3, somewhat disagree=2, strongly disagree=1). A higher
value indicated an increasing level of job satisfaction for participants. Detailed information of the
survey item on job satisfaction is given in Table 5.
Turnover Motivation. There were two survey items measuring teachers’ turnover
motivation (i.e., T0468 and T0469). These items ask whether teachers would like to leave after
achieving certain conditions and whether they would like to transfer to another school. Since
teacher turnover considers both transferring and leaving, the two types of motivation were
examined separately. The two survey items were coded as categorical and valued in their original
order (i.e., strongly agree=1, somewhat agree=2, somewhat disagree=3, strongly disagree=4). A
higher value indicated a decreasing probability of participants’ turnover motivation. Detailed
information of the two survey items on turnover motivation was given in Table 5.
Person-centered Analysis
The majority of quantitative research on teachers employs variable-centered approaches.
Typical results are concerned with the interrelations among factors at the level of raw data and
draw the conclusions based on, for instance, correlation and regression analysis (von Eye &
Wiedermann, 2015). However, such variable-oriented statements can rarely validly describe
processes of changes and relationships among factors at the level of the individual (von Eye &
Bergman, 2003), since they simply assume the existence of a homogeneous sample and ignore
the fact that the average individual may never exist (Walls & Schafer, 2006). As a result,
descriptions of single cases are less likely to be validly presented. In contrast, person-oriented
research aims at identifying the underlying heterogeneity within a population and uncovering
subgroups that share similarities within responses (Muthén, 2004). The main purpose of person-
centered analyses is to classify the individuals and group those who share particular similar

41
attributes within a specific group. Overall, these two analytic methods are employed to address
different research purposes and thus answer different research questions.
The goals of the present dissertation included examining the profiles of teacher training
and self-efficacy for beginning teachers and investigating how the profiles are associated with
job satisfaction and turnover motivation. Therefore, it relied on the person-centered approach,
more specifically using one of mixture modeling techniques, latent class analysis (McCutcheon,
1987), in order to better understand beginning teachers and their challenges.
Latent Class Analysis
Latent class analysis (LCA) is one of the analytic methods of latent mixture modeling. In
LCA, a latent construct is identified through classifying one or more observed indicators rather
than being directly measured (Collins & Lanza, 2010). The entire population is partitioned by the
patterns of indicators and generates subgroups which share similarities within a particular group
and distinguish between groups. The indicators and latent constructs are all categorical variables.
To explain the results of LCA modeling, two types of parameters are used (Larose, Harel,
Kordas, & Dey, 2016), latent class probabilities (i.e., the prevalence of each participant of latent
classes) and conditional probabilities (i.e., the conditional response probabilities for each
combination of latent class, indicator and response level for the indicator). LCA captures the
uncertainty of measurement (Berlin, Williams, & Parra, 2014). Each latent class is mutually
exclusive and the sums of the probabilities that one participant belongs to a certain latent class
and that an indicator distributes to a specific latent class are both one (Collins & Lanza, 2010).
The model building procedure of LCA should be based on previous research and
theoretical frameworks. However, if such information is inadequate, the number of latent classes
can be freely estimated first as long as the models can be statistically identified and technically

42
interpreted (Berlin et al., 2014). The repetition of adding one additional latent class into a
specific LCA model stops until the posterior model cannot be converged and/or statistically
differ from the previous one. Then all the candidate models are compared and evaluated based on
model selection criteria. The estimated latent classes can be used as moderators and/or mediators
in the follow-up research (e.g., Asparouhov & Muthén, 2014).
To decide the selected number of classes in mixture modeling, a variety of criteria should
be considered in regard to both statistical and theoretical perspectives (Nylund, Asparouhov, &
Muthén, 2007). First, the absolute model fit is identified by the likelihood ratio model (LRT) chi-
square goodness-of-fit. The test of the absolute model fit focuses on the consistency between the
model and the real data. A statistically non-significant test result is expected, as the model is
anticipated to specify the data.
Second, indices of statistical information criteria (IC) are evaluated (e.g., AIC, Akaike’s
Information Criterion, Akaike, 1987; BIC, Bayesian Information Criterion, Schwartz, 1978).
Lower numerical values of IC indices are preferred because a smaller estimate indicates a better
relative model fit. The relative model fit demonstrates whether a specific model describes the
real data better than another model does. Among all the IC indices, BIC and adjusted BIC
(Sclove, 1987) have been suggested as good indicators for class enumeration over others,
because correct models could consistently be chosen (Collins, Fidler, Wugalter, & Long, 1993;
Hagenaars & McCutcheon, 2002; Jedidi, Jagpal, & DeSarbo, 1997; Magidson & Vermunt, 2004;
Yang, 2006).
Third, likelihood-based techniques are used to compare nested LCA models. The
commonly used log likelihood difference test is not applicable (Nylund et al., 2007) in LCA,
because the assumptions are not met. Instead, Lo-Mendell-Rubin likelihood ratio test (LMR, Lo,

43
Mendell, & Rubin, 2001) and parametric bootstrap likelihood ratio test (BLRT, McLachlan &
Peel, 2000) are applicable for LCA. Comparing to its neighbors, a model specification
significantly differs from others, if the test results are statistically significant at α=0.05 level
(Berlin et al., 2014).
Fourth, one important index to measure the classification quality is entropy, the value of
which ranges from zero to one. If the value of entropy approaches one, this indicates clear
delineation of latent classes (Celeux & Soromenho, 1996). A larger value of entropy is usually
recommended, but the interpretation of the classification quality can vary upon research settings.
With a poor entropy, the analysis results may still be able to distinguish latent classes clearly. In
this dissertation, a high entropy value was preferred, because the latent class memberships of
beginning teachers’ preservice and in-service training would be used for further analysis.
Finally, in this dissertation, the results of classification that are representative and
meaningful for further interpretations would be preferred. In other words, if adding one
additional class covers only a tiny proportion of a population, such nested model may not be the
first choice. Bauer and Curran (2003) suggested that researchers should consider the model fit
indices along with their research questions and accumulated research findings during the
procedure of selecting the optimal model.
Latent Class Analysis with Auxiliary Variables
Two types of LCA with auxiliary variables are employed in the dissertation. First,
covariates are included into LCA models to predict the specification of latent classes. Such
analyses are called latent class regression analysis (Asparouhov & Muthén, 2014). Traditionally,
the classical procedure of latent class regression analyses includes three steps: 1) establishing
multiple LCA candidate models; 2) comparing the model fit indices to select the optimal model,

44
recoding the conditional probabilities and assigning the class membership to each participant
based on the estimates of likelihood; 3) using the assigned classes as outcomes and conducting t-
tests. However, this approach often provides a downward-biased estimate of the relationship
between the latent classes and the covariates, as it ignores the classification errors (Bolck, Croon,
& Hagenaars, 2004; Vermunt, 2010). In addition, the classification results can be modified given
the inclusion of covariates during the model building. Therefore, the dissertation used the BCH
method as a correction (see Asparouhov & Muthén, 2015). The covariates are included in the
AUXILIARY option and followed by the R3STEP setting, which specifies the leading variables
as covariates. The covariates can be either continuous or binary. Categorical covariates are
required to be recoded following a binary manner.
Second, the identified latent construct can be used as a predictor of observed variables.
Asparouhov and Muthén (2014) named these observed variables as distal outcomes. The
properties of distal outcomes can be either continuous or categorical. In this dissertation, given
the BCH method, the distal outcomes are included in the AUXILIARY option and followed by
the DCAT setting, which is a preferred method for categorical distal outcomes (Asparouhov &
Muthén, 2015). All the analyses (i.e., LCA, latent class regression analyses, LCA with distal
outcomes) were run using Mplus 8 (Muthén & Muthén, 2017).
Analytic Plan
Study 1: Training Profiles
The first study included three research questions. For the first two research questions, two
sorts of nested LCA models were constructed in order to identify beginning teachers’ preservice
and in-service training profiles independently. Then the correlation between the two profiles was

45
examined to see whether one individual with strong teacher education background tends to have
sufficient professional development and supports as well.
Study 2: Self-efficacy Profiles
The second study focused on teacher self-efficacy. Since self-efficacy is a multi-facet
construct, LCA analysis would be more suitable to demonstrate various efficacy aspects that
beginning teachers may feel more or less competent. LCA models on teacher self-efficacy were
first constructed and compared. After that, information of training profiles obtained from the
previous study were included as covariates to see whether the classification of teacher self-
efficacy varies upon training and how they were associated with teacher self-efficacy profiles.
Finally, school location was included as another observed covariate into the selected model.
Similarly, the relationship between the self-efficacy profiles and school location was examined.
The two groups of covariates (i.e., teacher training and school context) were included in the
model hierarchically because they had different properties. The variables of teacher training were
generated based on previous study results and they were latent constructs in Study 1. School
location was directly reported in SASS data and identified as an observed variable.
Study 3: Job Satisfaction and Turnover Motivation
The third study focused on job satisfaction as well as turnover motivation. After
controlling for the training profiles and school location as covariates, the LCA model of teacher
self-efficacy included the three distal outcomes hierarchically. That is to say, job satisfaction was
examined first and then two types of turnover motivation were included separately. The overall
hypothesis was that beginning teachers with adequate preservice and in-service training would
exhibit higher self-efficacy along with higher job satisfaction and lower turnover motivation.

46
This hypothesis was expected to be supported at the individual level (i.e., the teacher level) at
last.
Table 3
Survey Items of Selection Criteria
ID Description Response
1 T0025 How do you classify your position
at THIS school, that is, the activity
at which you spend most of your
time during this school year?
1=Regular full-time teacher (in any of
grades Kindergarten-12 or comparable
ungraded levels)
2=Regular part-time teacher (in any of
grades Kindergarten-12 or comparable
ungraded levels)
3=Itinerant teacher (i.e., your assignment
requires you to provide instruction at
more than one school)
4=Long-term substitute (i.e., your
assignment requires that you fill the role
of a regular teacher on a long-term basis,
but you are still considered a substitute)
2 T0026 Which box did you mark in item 1
above?
1=Box 1
2=Box 2, 3, or 4
9 T0040 In what school year did you FIRST
begin teaching, either full-time or
part-time, at the elementary or
secondary level? (do not include
time spent as a student teacher)
11 T0042 Excluding time spent on
maternity/paternity leave or
sabbatical, how many school years

47
Table 3 Continued
ID Description Response
have you worked as an elementary- or
secondary-level teacher in public, public
charter or private schools?
11 T0042 (include the current school year; do not
include time spent as a student teacher;
record whole years, not fractions or
months)
13 Do you currently teach students in any of these
grades at THIS school?
T0070 Prekindergarten 1=Yes
2=No
T0071 Kindergarten
T0072 1st
T0073 2nd
T0074 3rd
T0075 4th
T0076 5th
T0077 6th
T0078 7th
T0079 8th
T0080 9th
T0081 10th
T0082 11th
T0083 12th
T0084 Ungraded

48
Table 4
Descriptive Information of the Sample
n Percent
Demographics Information
Gender Male 454 33.3%
Female 910 66.7%
Race White 1,252 91.8%
African American 86 6.3%
Asian 33 2.4%
Other 30 2.2%
Age (by 2011-2012) 20s 995 72.9%
30s 211 15.5%
40s 115 8.4%
50s and above 43 3.2%
Education Background
Bachelor Degree Yes 1295 94.9%
No 69 5.1%
Master Degree Yes 282 20.7%
No 1082 79.3%

49
Table 4 Continued
n Percent
Teaching Assignments
Grade Levels Kindergarten 76 5.6%
Grade 1 78 5.7%
Grade 2 85 6.2%
Grade 3 88 6.5%
Grade 4 80 5.9%
Grade 5 106 7.8%
Grade 6 283 20.8%
Grade 7 395 29.0%
Grade 8 398 29.2%
Grade 9 546 40.0%
Grade 10 578 42.4%
Grade 11 567 41.6%
Grade 12 534 39.2%
Main Teaching Assignment Fields Elementary Education 188 13.8%
Special Education 182 13.3%
Arts and Music 70 5.1%
ELA 203 14.9%
ESL 10 0.7%

50
Table 4 Continued
n Percent
Foreign Languages 65 4.8%
Health Education 57 4.2%
Mathematics and Computer Science 214 15.7%
Natural Sciences 141 10.3%
Social Sciences 119 8.7%
Career or Technical Education 98 7.2%
Other 17 1.2%
Additional Assistances
Reduced Teaching Schedules Yes 161 11.8%
No 1203 88.2%
Extra Classroom Assistance (e.g., teacher aides) Yes 413 30.3%
No 951 69.7%
Regular Supportive Communication (e.g., with principals,
administrators, or department chairs)
Yes 1103 80.9%
No 261 19.1%
Note. ELA: English and Language Arts. ESL: English as a Second Language.
The participants’ responses to race information are not mutually exclusive. One participant can mark two or more races as what they
considered themselves to be.
The participants’ responses to grade levels are also not mutually exclusive. One participant is likely to teach more than one grade
levels in their first year of teaching.

51
Table 5
Survey Items by Measures
ID Item Description Response n Percent
Teacher Education (Preservice Training)
25a T0160 Do you have a bachelor’s degree? 1=Yes 1295 94.9%
2=No 69 5.1%
25d T0163 What was your major field of study? General Education 386 28.3%
ELA 150 11.0%
Other 759 55.6%
25e T0164 Did you have a second major field of study? 1=Yes 268 19.6%
2=No 1027 75.3%
25f T0165 What was your second major field of study? (do NOT
report academic minors or concentrations)
General Education 89 6.5%
ELA 30 2.2%
Other 149 10.9%
29 T0205 Did any of your coursework result in a concentration or
specialization in READING?
1=Yes 211 15.5%
2=No 1153 94.5%
30 T0206 Have you ever taken any graduate or undergraduate
courses that focused solely on teaching methods or
teaching strategies?
1=Yes
2=No
1178
186
86.4%
13.6%

52
Table 5 Continued
ID Item Description Response n Percent
30 T0206 (include courses you have taken to earn a degree and
courses taken outside a degree program; do NOT include
practice or student teaching)
T0207 How many courses? 1=1 or 2 courses 245 18.0%
2=3 or 4 courses 409 30.0%
3=5 to 9 courses 352 25.8%
4=10 or more courses 172 12.6%
31a T0208 Did you have any practice or student teaching? 1=Yes 1220 89.4%
2=No 144 10.6%
T0209 How long did your practice or student teaching last? 1=4 weeks or less 40 2.9%
2=5-7 weeks 53 3.9%
3=8-11 weeks 168 12.3%
4=12 weeks or more 959 70.3%
Professional Development and Supports (In-service Training)
34 T0220 In your FIRST year of teaching, did you participate in a
teacher induction program? (If you are in your first year
of teaching, please answer for THIS school year)
1=Yes 1119 82.0%
2=No 245 18.0%

53
Table 5 Continued
ID Item Description Response n Percent
35b T0222 Did you have common planning time with teachers in
your subject during your first year of teaching?
1=Yes 161 11.8%
2=No 1203 88.2%
Did you participate in seminars or classes for beginning
teachers during your first year of teaching?
2=No 1203 88.2%
2=No 542 39.7%
36a T0230 In your FIRST year of teaching, did you work closely
with a master or mentor teacher who was assigned by
your school or district? (If you are in your first year of
teaching, please answer for THIS school year)
1=Yes 970 71.1%
2=No 394 28.9%
36b T0231 How frequently did you work with your master or mentor
teacher during your first year of teaching?
1=At least once a week 558 40.9%
2=Once or twice a month 306 22.4%
3=A few times a year 99 7.3%
4=Never 7 0.5%
36c T0232 Has your master or mentor teacher ever instructed
students in the same subject area(s) as yours?
1=Yes
2=No
53b T0365 In the past 12 months, did you participate in regularly
scheduled collaboration with other teachers on issues of
instruction? (Exclude administrative meetings)
1=Yes 1011 74.1%
2=No 353 25.9%

54
Table 5 Continued
ID Item Description Response n Percent
Teacher Self-efficacy
33 In your FIRST year of teaching, how well prepared were
you to
33a T0211 Handle a range of classroom management or discipline
situations?
1=Not at all prepared 56 4.1%
2=Somewhat prepared 500 36.7%
3=Well prepared 559 41.0%
4=Very well prepared 249 18.3%
33b T0212 Use a variety of instructional methods? 1=Not at all prepared 26 1.9%
2=Somewhat prepared 324 23.8%
3=Well prepared 689 50.5%
4=Very well prepared 325 23.8%
33c T0213 Teach your subject matter? 1=Not at all prepared 23 1.7%
2=Somewhat prepared 190 13.9%
3=Well prepared 570 41.8%
4=Very well prepared 581 42.6%
33d T0214 Use computers in classroom instruction? 1=Not at all prepared 48 3.5%
2=Somewhat prepared 328 24.1%
3=Well prepared 525 38.5%
4=Very well prepared 463 33.9%

55
Table 5 Continued
ID Item Description Response n Percent
33e T0215 Assess students? 1=Not at all prepared 33 2.4%
2=Somewhat prepared 316 23.2%
3=Well prepared 715 52.4%
4=Very well prepared 300 22.0%
33f T0216 Differentiate instruction in the classroom? 1=Not at all prepared 66 4.8%
2=Somewhat prepared 457 33.5%
3=Well prepared 578 42.4%
4=Very well prepared 263 19.3%
33g T0217 Use data from student assessments to inform instruction? 1=Not at all prepared 71 5.2%
2=Somewhat prepared 462 33.9%
3=Well prepared 576 42.2%
4=Very well prepared 255 18.7%
33h T0218 Meet state content standards? 1=Not at all prepared 39 2.9%
2=Somewhat prepared 269 19.7%
3=Well prepared 617 45.2%
4=Very well prepared 439 32.2%

56
Table 5 Continued
ID Item Description Response n Percent
School Context
URBA
NS12
Collapsed urban-centric school locale code 1=City 365 26.8%
2=Suburban 297 21.8%
3=Town 237 17.4%
4=Rural 465 34.1%
Job Satisfaction
63q T0451 I am generally satisfied with being a teacher at this school. 1=Strongly agree 773 56.7%
2=Somewhat agree 425 31.2%
3=Somewhat disagree 122 8.9%
4=Strongly disagree 44 3.2%
Turnover Motivation
65d T0468 If I could get a higher paying job I’d leave teaching as soon
as possible.
1=Strongly agree 89 6.5%
2=Somewhat agree 194 14.2%
3=Somewhat disagree 457 33.5%
4=Strongly disagree 624 45.8%

57
Table 5 Continued
ID Item Description Response n Percent
65e T0469 I think about transferring to another school. 1=Strongly agree 141 10.3%
2=Somewhat agree 346 25.4%
3=Somewhat disagree 301 22.1%
4=Strongly disagree 576 42.2%
Note. ELA: English and Language Arts.
General education includes majors in elementary education, secondary education, special education and other non-subject-matter-
specific education.

58
CHAPTER IV
RESULTS
The purpose of this chapter is to present and explain the study results. The chapter
includes three sections, one for each study. The first section reports beginning teachers’
preservice and in-service training profiles and then examines the association between the two
types of training profiles. The second section reports beginning teachers’ self-efficacy profiles
and results from latent class regression analyses. Training profiles from the first study are
retrieved to use as covariates in order to examine their association with efficacy profiles. School
context (i.e., school location) is also included as one covariate. The third section reports how
beginning teachers’ self-efficacy profiles predicted their job satisfaction and turnover motivation.
The results are generated based on the extracted sampling from the 2011-2012 SASS data.
Study 1
Descriptive information of all the indicators, including those for both preservice and in-
service training, is presented in Table 5. As for preservice training, results showed that: (a) less
than half of beginning teachers majored in general education and/or English and Language Arts;
(b) only a small percentage of beginning teachers had coursework in reading; (c) most beginning
teachers completed pedagogical courses, and around half of them took around three to nine
courses; and (d) the majority of them practiced student teaching and the practices in the field ran
over 12 weeks. As for in-service training, results suggested that: (a) most beginning teachers
participated in induction programs; (b) only a few of them had common planning time with
colleagues; (c) over 60% of them attended beginning teacher seminars; (d) around half of

59
beginning teachers received discipline-specific mentorship; and (e) only one fourth of them
lacked regularly scheduled collaborations on instructional issues.
Profiles of Preservice Training (Teacher Education)
To resolve the first research question, multiple LCA models with increasing numbers of
latent classes were constructed. The model building included four indicators: EDRT (whether
beginning teachers majored in general education and/or English and Language Arts), RDNG (the
completion of reading coursework), TMSC (teaching method or teaching strategy courses), and
STFE (student teaching or field experience for 12 weeks or more). Model fit information of all
the models is provided in Table 6. Since there were only four indicators, the 4-class model had a
negative degree freedom value for the Pearson Chi-square test. Therefore, the model building
procedure did not go beyond the 4-class model.
After conducting a series of model comparisons, the 3-class model and its results were
recorded for further analyses. This model was selected for several reasons. First, the model
difference between the 2-class and 3-class models was statistically significant, while the
difference between the 3-class and 4-class models was not. Second, despite of the BIC value, the
values of AIC and adjusted BIC in the 3-class model were smaller than those in the 2-class
model. In all four models, the 3-class model had the smallest AIC as well as adjusted BIC values.
Third, the 3-class model had adequate model fit based on the Pearson Chi-square test. Finally,
the 3-class model reported the largest entropy value, which indicated a high classification
quality.
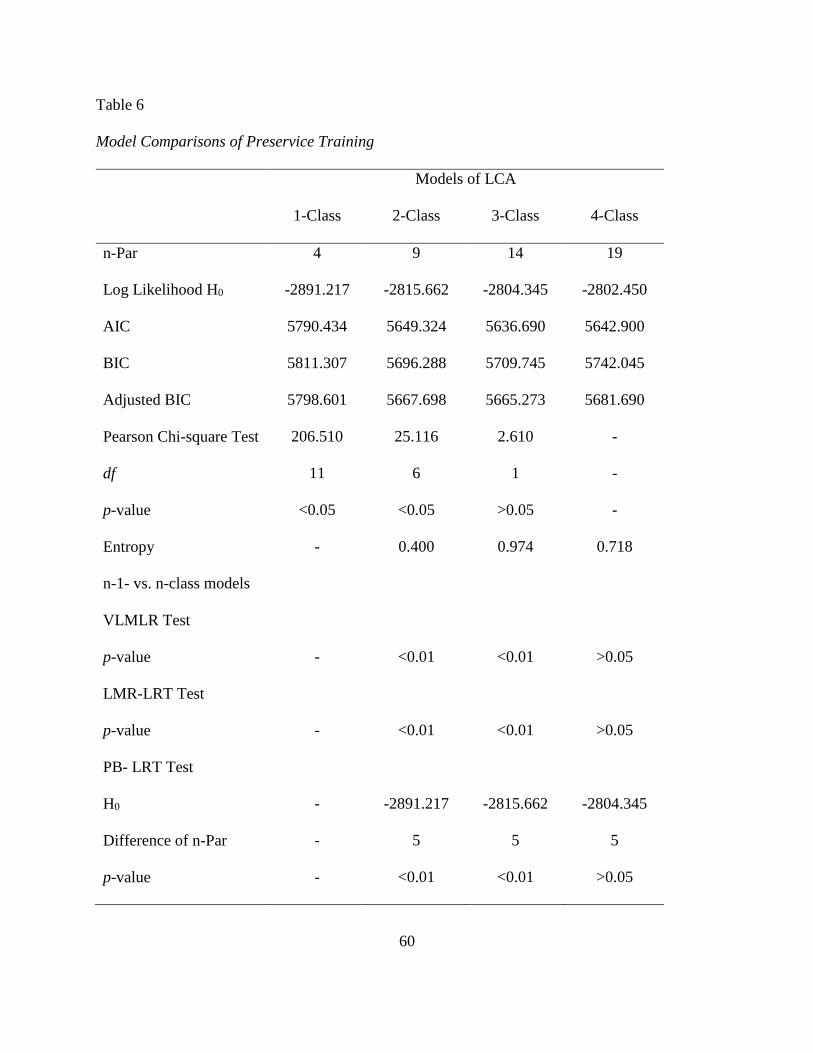
60
Table 6
Model Comparisons of Preservice Training
Models of LCA
1-Class 2-Class 3-Class 4-Class
n-Par 4 9 14 19
Log Likelihood H0 -2891.217 -2815.662 -2804.345 -2802.450
AIC 5790.434 5649.324 5636.690 5642.900
BIC 5811.307 5696.288 5709.745 5742.045
Adjusted BIC 5798.601 5667.698 5665.273 5681.690
Pearson Chi-square Test 206.510 25.116 2.610 -
df 11 6 1 -
p-value <0.05 <0.05 >0.05 -
Entropy - 0.400 0.974 0.718
n-1- vs. n-class models
VLMLR Test
p-value - <0.01 <0.01 >0.05
LMR-LRT Test
p-value - <0.01 <0.01 >0.05
PB- LRT Test
H0 - -2891.217 -2815.662 -2804.345
Difference of n-Par - 5 5 5
p-value - <0.01 <0.01 >0.05

61
Note. n-Par: number of free parameters; VLMLR: Vuong-Lo-Mendell-Rubin likelihood ratio
test; LMR-LRT: Lo-Mendell-Rubin Adjusted likelihood ratio test; PB-LRT: parametric
bootstrapped likelihood ratio test.
The model classification results, including the latent class prevalence and conditional
probabilities, are provided in Table 7. Additionally, Figure 4 provides a summary of the three
patterns of preservice training profiles. The three latent classes were named as “strong preservice
training” (SPT), “moderate preservice training” (MPT) and “weak preservice training” (WPT)
groups. There were 41.5% of the participants who were identified as SPT (n=566), 47.3%
identified as MPT (n=645), and 11.2% identified as WPT (n=153). The estimates of average
latent class probabilities and classification probabilities per class indicated that the model
classification was quite accurate for the majority of the participants.
Table 7
Model Classification of Preservice Training (Response=Yes)
Class 1
(SPT)
Class 2
(MPT)
Class 3
(WPT)
n 566 645 153
Percent 41.5% 47.3% 11.2%
Average Latent Class Probabilities 0.979 0.998 0.979
Classification Probabilities 0.992 1.000 0.927
Conditional Probability
EDRT 0.998 0.000 0.153
RDNG 0.238 0.113 0.032

62
Table 7 Continued
Class 1
(SPT)
Class 2
(MPT)
Class 3
(WPT)
TMSC 0.956 1.000 0.000
STFE 0.820 0.673 0.153
Note. SPT: strong preservice training; MPT: moderate preservice training WPT: weak preservice
training.
Figure 4. Conditional probability plot of preservice training profiles.
Several characteristics of beginning teachers who were classified as SPT could be
identified. First, all of SPT participants majored in general education and/or English and
Language Arts in their undergraduate programs. Second, almost all SPT participants took
courses on teaching methods or teaching strategies before. The estimated probability was 95.6%.
Third, although the estimated probability of SPT participants who practiced student teaching for
12 weeks or more was not very high, it was much higher than that of either MPT or WPT

63
participants. Finally, only around one fourth of SPT participants completed reading coursework.
Comparing to the probabilities of TMSC and STFE, the estimated RDNG probability was very
low. However, this class of beginning teachers still maintained the highest estimated probability
among all the three latent classes. In other words, if a participant was classified as MPT or WPT,
the probability of the completion of reading coursework would be extremely low.
The most obvious difference between SPT and MPT beginning teachers was that no MPT
participants graduated with general education and/or English and Language Arts as their major
areas. Instead, their education background was quite diverse. For instance, some participants did
not have undergraduate degrees. Some majored in programs such as arts, foreign languages,
mathematics, and social sciences. Additionally, some MPT participants majored in technical
content areas, such as business and mechanics. Although all of them reported that they had
student teaching for 12 weeks or more, only 67.3% of MPT participants completed pedagogical
coursework, while 11.3% completed reading coursework. Consequently, both estimated
probabilities were much lower than those for SPT participants.
The last class consisted of WPT participants who were most likely to be poorly prepared
for their teaching profession during their preservice phase. Although a small proportion of WPT
participants majored in general education and/or English and Language Arts, only 15.3% of them
had field experience for 12 weeks or more before they entered the field. No WPT participants
took any pedagogical courses, and only 3.2% of them had coursework in reading.
To sum up, the three types of profiles of beginning teachers’ preservice training were
different in regard to their majors, coursework completed, and the length of field experience.
Although the first and second classes exhibited different profiles of preservice training, the
words “strong” and “moderate” were used to differentiate the two classes by membership titles,

64
rather than by the quality of their preservice training profiles. It is possible that SPT and MPT
participants were similarly well prepared for instructing in classrooms due to their completion of
pedagogical courses and relatively long-term student teaching experiences.
Profiles of In-service Training (Developmental Activities)
To address the second research question, several LCA models with increasing numbers of
latent classes were established. The model building included five indicators: INDT (teacher
induction programs), COPT (common planning time with teachers in the same subject), BTSM
(seminars for beginning teachers), DSMT (discipline-specific mentorship) and SCII (regularly
scheduled collaboration on issues of instruction). Model fit information of all the models is
provided in Table 8. The model building procedure did not surpass the 4-class model for two
reasons. First, the result of the parametric bootstrapped likelihood ratio test suggested that the 3-
and 4-class models were not statistically significantly different. Second, although the results of
Vuong-Lo-Mendell-Rubin and Lo-Mendell-Rubin adjusted likelihood ratio tests were
statistically significant at α=0.05 level, there was one latent class that included less than 3% of
the participants in the 4-class model, which was not a preferred classification result.
According to the results from model comparisons, the 3-class model and its results were
recorded for further analyses. There were several reasons leading to the selection of this model.
First, compared to the adjacent LCA models, the 3-class model was statistically significantly
different from the 2-class model, but not from the 4-class model. Second, the 3-class model
provided the smallest values of AIC, BIC and adjusted BIC indices among all four models.
Third, the 3-class model had adequate model fit based on the Pearson Chi-square test. Finally,
the 3-class model reported the largest entropy value, which indicated a fairly high classification
quality.

65
Table 8
Model Comparisons of In-service Training
Models of LCA
1-Class 2-Class 3-Class 4-Class
n-Par 5 11 17 23
Log Likelihood H0 -4228.506 -4028.174 -3978.991 -3974.342
AIC 8467.013 8078.347 7991.983 7994.683
BIC 8493.104 8135.747 8080.692 8114.702
Adjusted BIC 8477.221 8100.805 8026.690 8041.640
Pearson Chi-square Test 720.705 115.676 19.125 12.086
df 26 20 14 8
p-value <0.05 <0.05 >0.05 >0.05
Entropy - 0.560 0.870 0.816
n-1- vs. n-class models
VLMLR Test
p-value - <0.01 <0.01 <0.05
LMR-LRT Test
p-value - <0.01 <0.01 <0.05
PB- LRT Test
H0 - -4228.506 -4028.174 -3978.991
Difference of n-Par - 6 6 6
p-value - <0.01 <0.01 >0.05

66
Note. n-Par: number of free parameters; VLMLR: Vuong-Lo-Mendell-Rubin likelihood ratio
test; LMR-LRT: Lo-Mendell-Rubin Adjusted likelihood ratio test; PB-LRT: parametric
bootstrapped likelihood ratio test.
The model classification results, including the latent class prevalence and conditional
probabilities, are provided in Table 9. Additionally, Figure 5 provides a summary of the three
patterns of in-service training profiles. The three latent classes were named as “strong in-service
training” (SIT), “moderate in-service training” (MIT) and “weak in-service training” (WIT)
groups. About 46.0% of the participants were grouped as SIT (n=627), 36.9% grouped as MIT
(n=503), and 17.2% grouped as WIT (n=234). The estimates of average latent class probabilities
and classification probabilities per class indicated that the model classification was quite accurate
for the majority of the participants.
Table 9
Model Classification of In-service Training (Response=Yes)
Class 1
(SIT)
Class 2
(MIT)
Class 3
(WIT)
n 627 503 234
Percent 46.0% 36.9% 17.2%
Average Latent Class Probabilities 0.981 0.936 0.944
Classification Probabilities 0.966 1.000 0.861
Conditional Probability
INDT 0.964 1.000 0.134
COPT 0.986 0.000 0.312

67
Table 9 Continued
Class 1
(SIT)
Class 2
(MIT)
Class 3
(WIT)
BTSM 0.762 0.607 0.199
DSMT 0.673 0.448 0.148
SCII 0.867 0.648 0.602
Note. SIT: strong in-service training; MIT: moderate in-service training WIT: weak in-service
training.
Figure 5. Conditional probability plot of in-service training profiles.
Beginning teachers who were classified into the SIT latent class were highly likely to
participate in a variety of developmental activities. For SIT participants, the estimated
probabilities of receiving induction programs, common planning time and collaboration on issues
of instruction were 96.4%, 98.6% and 86.7% respectively. On the other hand, the estimated
probabilities suggested that only 76.2% of SIT participants attended seminars for beginning

68
teachers and 67.3% of them received discipline-specific mentorship. Although the estimated
values of the probabilities of these two types of developmental activities were relatively low,
these values remained the highest among all three latent classes.
Compared to SIT participants, all MIT participants participated in induction programs,
but did not have any common planning time with colleagues. In addition, the estimated
probability of having collaboration on instructional issues was much lower for MIT participants
than for SIT peers. Along with the fact that less than half of MIT participants received discipline-
specific mentorship, these characteristics indicated that MIT participants lacked an effective
connection with their colleagues in regard to face and resolve the problems together and learn
from each other. In other words, MIT participants were more likely to work independently, when
they met challenges like instruction in content areas, classroom management, and
communication with students and parents.
WIT participants were poorly prepared through participating in developmental activities.
The estimated probabilities of joining induction programs, attending seminars for beginning
teachers and receiving discipline-specific mentorship were all below one fifth for WIT
participants. In addition, only 31.2% of WIT participants were likely to have common planning
time, and 60.2% of them had regularly scheduled collaboration on instructional issues. Overall,
except experiencing common planning, WIT participants were less likely to participate in any
one of the other four types of developmental activities than their SIT and MIT peers did.
To sum up, LCA results suggested three distinctive latent classes to differentiate
beginning teachers’ in-service training profiles. Comparing to SIT and even WIT participants, a
lack of common planning time was an important characteristic to identify MIT participants.

69
The Association between Preservice and In-service Training Profiles
As all the participants were assigned to latent classes of both preservice and in-service
training profiles, an examination of the association between the two types of training profiles
was conducted. Using Chi-square tests, no statistically significant association between preservice
and in-service training profiles was identified (χ2 (4)=6.40, p=0.17). In other words, the
participants with different preservice training profiles were equally likely to receive a similar
pattern of in-service training. In addition, Phi and Cramer’s V tests were conducted to examine
the strength of the association. Results indicated that the association between the two types of
training profiles was weak (Phi=0.07, Cramer’s V=0.05, p=0.17). Detailed information of the
cross tabulation of beginning teachers’ training profiles is provided in Table 10.
Table 10
Cross Tabulation of Beginning Teachers’ Training Profiles
Preservice Training
(Teacher Education) Row
Total SPT MPT WPT
In-service Training
(Developmental
Activities)
SIT 281 280 66 627
MIT 188 255 60 503
WIT 97 110 27 234
Column Total 566 645 153 1364

70
Study 2
Descriptive information of all the indicators of teacher self-efficacy was provided in
Table 5. There were four types of responses to the eight survey items on teacher self-efficacy.
The majority of beginning teachers felt well prepared on all the survey items, except the one in
regards to teaching subject matter. The count of beginning teachers who reported that they felt
very well prepared (n=581) on teaching subject matter was a little bit more than that of beginning
teachers who responded as well prepared (n=570). Additionally, results indicated that beginning
teachers felt less prepared on handling classroom management issues, assessing students, and
providing differentiated instruction.
Profiles of Teacher Self-efficacy
Based on the recent simulation study by Nylund-Gibson and Masyn (2016), class
enumeration was recommended to be conducted before including covariates, because an
unconditional latent class model could reliably determine the number of classes. Therefore,
beginning teachers’ efficacy profiles were examined using multiple LCA models at first. The
model building included eight indicators: CM (handling classroom management or discipline
situations), IM (using instructional methods), SM (teaching subject matter), CU (using
computers in classroom instruction), AM (assessing students), DI (differentiating instruction), IF
(using data from student assessments to inform instruction), and CS (meeting state content
standards). Model fit information of all the four models is given in Table 11. The model building
procedure paused at the 4-class model, because one latent class in this model contained only
around 5% of the participants, which did not meet the selection criteria.
To investigate teacher self-efficacy profiles, the 3-class model and its results were
recorded for further analyses. The model selection was decided based on several reasons. First,

71
the result of the model difference tests suggested that the 3-class model was significantly
different from the 2-class model. Although it also suggested that the difference between the 3-
and 4-class models was statistically significant, the 4-class model was excluded, because one of
its latent classes contained a small proportion of the sample. Second, compared to its neighbors,
the 3-class model provided the smallest IC indices, which indicated that it had better model fit.
Third, the 3-class model had good model fit based on the Pearson Chi-square test. Finally,
among all the LCA models, the selected one had the largest entropy value, which represented an
adequate classification quality.
Table 11
Model Comparisons of Teacher Self-efficacy
Models of LCA
1-Class 2-Class 3-Class 4-Class
n-Par 24 49 74 99
Log Likelihood H0 -12525.860 -11292.154 -10780.321 -10643.908
AIC 25099.720 22682.307 21708.642 21485.817
BIC 25224.957 22937.998 22094.787 22002.416
Adjusted BIC 25148.718 22782.345 21859.719 21687.934
Pearson Chi-square Test 143848.458 11412.898 9000.175 8399.112
df 65414 65396 65388 65372
p-value <0.05 >0.99 >0.99 >0.99
Entropy - 0.829 0.835 0.804

72
Table 11 Continued
1-Class 2-Class 3-Class 4-Class
n-1- vs. n-class models
VLMLR Test
p-value - <0.01 <0.01 <0.05
LMR-LRT Test
p-value - <0.01 <0.01 <0.05
PB- LRT Test
H0 - -12525.860 -11292.154 -10780.321
Difference of n-Par - 25 25 25
p-value - <0.01 <0.01 <0.01
Note. n-Par: number of free parameters; VLMLR: Vuong-Lo-Mendell-Rubin likelihood ratio
test; LMR-LRT: Lo-Mendell-Rubin Adjusted likelihood ratio test; PB-LRT: parametric
bootstrapped likelihood ratio test.
The model classification results, including the latent class prevalence and conditional
probabilities, are provided in Table 12. In addition, Figure 6 provides a visualized summary of
the three patterns of teacher self-efficacy profiles in regard to four responses. The three latent
classes were named as “high self-efficacy” (HSE), “moderately-high self-efficacy” (MSE), and
“low self-efficacy” (LSE) groups, respectively. There were 30.8% of the participants who were
labeled as HSE (n=420), 52.0% labeled as MSE (n=709), and 17.2% labeled as LSE (n=235).
The model classification was adequately accurate, based on the estimates of average latent class
probabilities and classification probabilities per class.

73
Table 12
Model Classification of Teacher Self-efficacy
Class 1
(HSE)
Class 2
(MSE)
Class 3
(LSE)
n 420 709 235
Percent 30.8% 52.0% 17.2%
Average Latent Class Probabilities 0.936 0.923 0.909
Classification Probabilities 0.932 0.933 0.891
Conditional Probability
Response=Very well prepared
CM 0.461 0.065 0.038
IM 0.639 0.079 0.000
SM 0.741 0.327 0.161
CU 0.606 0.249 0.135
AM 0.632 0.047 0.000
DI 0.541 0.048 0.005
IF 0.539 0.032 0.021
CS 0.758 0.153 0.050
Response=Well prepared
CM 0.351 0.546 0.117
IM 0.325 0.739 0.136
SM 0.222 0.549 0.380
CU 0.289 0.488 0.252

74
Table 12 Continued
Class 1
(HSE)
Class 2
(MSE)
Class 3
(LSE)
AM 0.352 0.742 0.192
DI 0.376 0.579 0.052
IF 0.384 0.571 0.054
CS 0.219 0.647 0.293
Response=Somewhat prepared
CM 0.176 0.374 0.681
IM 0.035 0.182 0.755
SM 0.037 0.116 0.386
CU 0.105 0.248 0.455
AM 0.013 0.209 0.681
DI 0.074 0.368 0.697
IF 0.077 0.377 0.687
CS 0.020 0.193 0.520
Response=Not at all prepared
CM 0.013 0.016 0.164
IM 0.000 0.000 0.108
SM 0.000 0.008 0.073
CU 0.000 0.014 0.158
AM 0.003 0.002 0.127
DI 0.009 0.004 0.246

75
Table 12 Continued
Class 1
(HSE)
Class 2
(MSE)
Class 3
(LSE)
IF 0.000 0.020 0.238
CS 0.003 0.007 0.137
Note. HSE: high self-efficacy; MSE: moderately-high self-efficacy; LSE: low self-efficacy.
Figure 6. Conditional probability plots of teacher self-efficacy profiles.

76
Comparisons across three latent classes indicated that HSE participants were most likely
to feel very well prepared on all the teacher self-efficacy perspectives measured in the 2011-2012
SASS. The estimated probabilities of feeling very well prepared for HSE participants were much
higher than those for either MSE or LSE participants regarding all the survey items. The only
survey item on which less than half of HSE participants felt very well prepared was CM.
Considering the fact that all three classes reported relatively low probabilities of feeling very
well or well prepared, this indicated that beginning teachers were commonly in need of more
support and guidance on classroom management to maintain high-level efficacy.
Compared to HSE peers, MSE participants were more likely to respond as well prepared
to all the survey items of teacher self-efficacy. They were confident with their teaching
performances and skills, but the confidence was not as high as that of HSE participants. Besides
CM, MSE participants were less likely to feel very well or well prepared on DI and IF as well.
The sums of the estimated probabilities of feeling very well or well prepared on the three survey
items were all around 60%.
Results indicated that LSE participants struggled and exhibited low-level self-efficacy on
almost all the self-efficacy perspectives. The only exception was their reported efficacy on SM.
Over half of LSE participants reported that they felt very well or well prepared in regards to
teach subject matter that they were assigned to. However, considering the relatively high
probabilities of HSE and MSE participants whose responses were “very well prepared” or “well
prepared”, this estimation was still quite low. The majority of LSE participants reported they
only felt somewhat prepared on all the survey items. Additionally, the estimated probabilities
that LSE participants did not feel prepared in regard to all eight survey items ranged from 10% to
25%, while these estimates of HSE and MSE participants were all below 2%.

77
To sum up, beginning teachers’ self-efficacy profiles were classified into three latent
classes. Although most of them reported relatively high-level self-efficacy on almost all the
survey items, it is critical to notice that around one fifth of the participants have already begun to
struggle to maintain high-level self-efficacy since their first year of teaching.
The Association between Training Profiles and Teacher Self-efficacy Profiles
The class memberships of teacher training profiles were recalled from the first study,
since the models achieved high entropy values. Although the entropy value of LCA on in-service
training profiles was a little lower than the expected value 0.9, the membership information was
still included based on the model’s high average latent class probabilities as well as classification
probabilities. Mplus requires that categorical covariates should be transformed to dummy
variables. Therefore, the class memberships were recoded as binary. For preservice training
profiles, the WPT class was selected as the reference group. If a participant’s responses to the
two binary covariates, the preservice training membership as SPT and the preservice training
membership as MPT, were both zero, this indicated that the participant’s membership of the
preservice training profiles was WPT. The same recoding procedure applied for the in-service
training profiles. Similarly, the WIT class was selected as the reference group.
Based on the results of the first research question in Study 2, the adjusted 3-step analyses
were conducted based on the 3-class LCA model. Three latent class regression analyses were
examined as the covariates were included in sequence. In all the three LCA regression models,
the classification of teacher self-efficacy profiles was consistent. Including covariates did not
change the specification of latent classes in regards to teacher self-efficacy. The parameter
estimates of all three models are presented in Table 13.

78
Table 13
Parameter Estimates of Latent Class Regression Analyses on Teacher Training
Estimate (log odds) SE LM UM p OR LMOR UMOR
Teacher Education
HSE/LSE
Intercept -0.787 0.238 -1.253 -0.321 <0.01
SPT 1.747 0.287 1.184 2.310 <0.01 5.737 3.269 10.070
MPT 1.487 0.271 0.956 2.018 <0.01 4.424 2.601 7.524
MSE/LSE
Intercept -0.123 0.215 -0.544 0.298 0.566
SPT 1.682 0.267 1.159 2.205 <0.01 5.376 3.186 9.073
MPT 1.228 0.251 0.736 1.720 <0.01 3.414 2.088 5.584
HSE/MSE
Intercept -0.664 0.261 -1.176 -0.152 <0.05
SPT 0.066 0.282 -0.487 0.619 0.815 1.068 0.615 1.857
MPT 0.259 0.279 -0.288 0.806 0.354 1.296 0.750 2.239
Developmental Activities
HSE/LSE
Intercept -0.064 0.202 -0.460 0.332 0.753
SIT 1.065 0.246 0.583 1.547 <0.01 2.901 1.791 4.698
MIT 0.411 0.250 -0.079 0.901 0.099 1.508 0.924 2.462

79
Table 13 Continued
Estimate (log odds) SE LM UM p OR LMOR UMOR
MSE/LSE
Intercept 0.673 0.185 0.310 1.036 <0.01
SIT 0.627 0.234 0.168 1.086 <0.01 1.872 1.183 2.961
MIT 0.381 0.231 -0.072 0.834 0.099 1.464 0.931 2.302
HSE/MSE
Intercept -0.737 0.185 -1.100 -0.374 <0.01
SIT 0.437 0.210 0.025 0.849 <0.05 1.548 1.026 2.336
MIT 0.030 0.220 -0.401 0.461 0.890 1.030 0.670 1.586
Teacher Training (including Teacher Education and Developmental Activities)
HSE/LSE
Intercept -1.460 0.320 -2.087 -0.833 <0.01
SPT 1.751 0.297 1.169 2.333 <0.01 5.760 3.218 10.310
MPT 1.519 0.278 0.974 2.064 <0.01 4.568 2.649 7.876
SIT 1.090 0.253 0.594 1.586 <0.01 2.974 1.811 4.884
MIT 0.460 0.260 -0.050 0.970 0.078 1.584 0.952 2.637
MSE/LSE
Intercept -0.557 0.278 -1.102 -0.012 <0.01
SPT 1.691 0.271 1.160 2.222 <0.01 5.425 3.189 9.227
MPT 1.236 0.252 0.742 1.730 <0.01 3.442 2.100 5.640
SIT 0.641 0.239 0.173 1.109 <0.01 1.898 1.188 3.033

80
Table 13 Continued
Estimate (log odds) SE LM UM p OR LMOR UMOR
MIT 0.436 0.242 -0.038 0.910 0.072 1.547 0.962 2.485
HSE/MSE
Intercept -0.904 0.321 -1.533 -0.275 <0.01
SPT 0.059 0.284 -0.498 0.616 0.834 1.061 0.608 1.851
MPT 0.283 0.282 -0.270 0.836 0.315 1.327 0.764 2.306
SIT 0.449 0.211 0.035 0.863 <0.05 1.567 1.036 2.369
MIT 0.023 0.221 -0.410 0.456 0.916 1.023 0.664 1.578
Note. SE: standard error; OR: odds ratio; LM: 95% confidence interval lower limit of log odds;
UM: 95% confidence interval upper limit of log odds; LMOR: 95% confidence interval lower
limit of odds ratio; UMOR: 95% confidence interval upper limit of odds ratio.
LCA Regression Model with Teacher Education. Beginning teachers’ preservice
training profiles were included in the LCA model of teacher self-efficacy first. Results of the
model estimates indicated the membership of preservice training profiles was a statistically
significant contributor to the differences between HSE and LSE participants as well as between
MSE and LSE participants (all p-values<0.01). However, the dummy covariates failed to
differentiate HSE from MSE participants (both p-values>0.05).
The information of odds ratio tests (see Table 13) suggested that: 1) the odds of SPT
participants with HSE rather than LSE was 5.737 times of the odds of WPT participants; 2) the
odds of MPT participants with HSE rather than LSE was 4.424 times of the odds of WPT
participants; 3) the odds of SPT participants with MSE rather than LSE was 5.376 times of the
odds of WPT participants; and 4) the odds of MPT participants with MSE rather than LSE was

81
3.414 times of the odds of WPT participants. In Table 14, the estimated probabilities of each
self-efficacy class showed that SPT participants had a probability of 31.2% of being in HSE,
56.8% of being in MSE, and 12.0% of being in LSE. Similarly, MPT participants were very
likely to be in HSE or MSE. Their estimated probabilities were 33.4% of being in HSE, 50.0% of
being in MSE, and only 16.6% of being in LSE. In contrast, the probabilities of WPT
participants to be in HSE and MSE were much smaller. For WPT participants, the estimated
probabilities were 19.5% of being in HSE, 37.8% of being in MSE, and 42.7% of being in LSE
respectively. These results suggested that they were likely to maintain high-level or moderately-
high-level self-efficacy, if their preservice training demonstrated a pattern which was similar to
either SPT or MPT. In contrast, almost one half of the participants whose preservice training
followed the WPT pattern were very likely to have low-level self-efficacy since their first year of
teaching.
LCA Regression Model with Developmental Activities. The second model included
beginning teachers’ in-service profiles instead of their preservice profiles. Results suggested that
only the SIT membership significantly differentiated beginning teachers’ self-efficacy profiles
(all p-values<0.05). In other words, compared to MIT and WIT peers, SIT participants were
more likely to report a higher level of self-efficacy. Neither the MIT nor WIT memberships
could yield significant differences across the three classes of self-efficacy profiles (all p-
values>0.05).
The information of odds ratio tests (see Table 13) suggested that: 1) the odds of SIT
participants with HSE rather than LSE was 1.548 times of the odds of WIT participants; 2) the
odds of SIT participants with HSE rather than MSE was 2.901 times of the odds of WIT
participants; and 3) the odds of SIT participants with MSE rather than LSE was 1.872 times of

82
the odds of WIT participants. Alternatively, SIT participants had a probability of 36.8% of being
in HSE, 49.7% of being in MSE, and 13.5% of being in LSE. On the other hand, MIT and WIT
participants shared a similar distribution of the estimated probabilities for each self-efficacy
class. The estimated probabilities were 26.8% of being in HSE, 54.3% of being in MSE, and
18.9% of being in LSE for MIT participants, while those were 24.1%, 50.3%, and 25.7% for
WIT participants respectively. Therefore, only SIT participants were likely to maintain a higher
level of self-efficacy. Insufficient in-service training like MIT and WIT would not help
beginning teachers being equipped with high-level self-efficacy. Considering the characteristics
of in-service training profiles, these results also indicated the potential necessity of common
planning time for beginning teachers, as MIT and WIT participants demonstrated a common lack
of COPT experiences.
LCA Regression Model with Teacher Training (Including Teacher Education and
Developmental Activities). The two covariates that explained beginning teachers’ training
profiles were included simultaneously in the last model. Results were similar to those of the
previous two models. The memberships of SPT, MPT, and SIT statistically significantly
contributed to the differences between HSE and LSE as well as between MSE and LSE (all p-
values <0.01). In addition, the membership of SIT was the only significant predictor to
differentiate participants with high-level self-efficacy from peers with moderately-high-level
self-efficacy (p-value<0.05).
According to Table 10, there were nine types of teacher training profiles that pertained to
beginning teachers, since their preservice and in-service profiles were exclusive to each other.
Therefore, the terms which combined both preservice and in-service training were used to refer
to the nine types of teacher training profiles. For instance, SPT×SIT participants received strong

83
preservice training like SPT as well as strong in-service training like SIT. The estimates of
conditional odds ratios were provided in Table 13. Controlling for the in-service training
profiles, SPT participants were 5.760 times as likely to be classified with HSE and 5.425 times
as much with MSE rather than LSE, compared to WPT peers. Similarly, MPT participants were
4.568 times as likely to be classified with HSE and 3.442 times as much with MSE compared to
WPT peers. On the other hand, controlling for the preservice training profiles, SIT participants
were 2.974 times as likely to be grouped as HSE and 1.898 times as much grouped as MSE
rather than LSE, compared to WPT participants. Additionally, SPT participants were 1.567 times
likely to be labeled as HSE instead of MSE when compared to WPT participants.
For each type of teacher training profiles, the estimated probabilities of being classified
into different self-efficacy profiles were given in Table 14. Results indicated that compared to
their peers, beginning teachers who received either SPT×SIT or MPT×SIT training were more
likely to be associated with HSE. Furthermore, regardless of the in-service training profiles,
WPT participants reported a high probability of experiencing LSE. If a participant received
WPT×WIT training, the estimated probability of the association with LSE was 55.4%.
Additionally, insufficient in-service training like WIT led to a relatively higher estimated
probability of being in LSE among SPT and MPT participants as well. It implied that WPT
participants were less likely to be classified in LSE, if they received MIT (22.6%) rather than
SIT (36.0%) training. However, considering the extremely low probability that WPT×MIT
participants were grouped as HSE (8.3%), the seemingly superior of MIT over SIT among WPT
participants should be reevaluated, as the ultimate goal was to help beginning teachers maintain
high-level self-efficacy.

84
Overall, results of LCA regression models suggested that given the association with a
specific class of in-service training profiles, regardless of undergraduate majors, beginning
teachers were likely to report a higher level of self-efficacy, as long as they received adequate
preservice training in regards to reading coursework, pedagogical courses, and field experience.
In addition, controlling for their preservice training profiles, beginning teachers were likely to
maintain high-level self-efficacy only when they actively participated in all of the selected
developmental activities. In the present sample, if the participants completely lacked common
planning time, they were likely to have the similar estimated probabilities of being classified into
a particular class of self-efficacy as their peers who did not actively join any types of
developmental activities.
Table 14
Estimated Probabilities by Classes on Teacher Training
HSE MSE LSE
Teacher Education
SPT 0.312 0.568 0.120
MPT 0.334 0.500 0.166
WPT 0.195 0.378 0.427
Developmental Activities
SIT 0.368 0.497 0.135
MIT 0.268 0.543 0.189
WIT 0.241 0.503 0.257

85
Table 14 Continued
HSE MSE LSE
Teacher Training (including Teacher Education and Developmental Activities)
SPT×SIT 0.366 0.542 0.092
SPT×MIT 0.267 0.606 0.126
SPT×WIT 0.246 0.571 0.184
MPT×SIT 0.399 0.474 0.127
MPT×MIT 0.293 0.532 0.175
MPT×WIT 0.263 0.489 0.248
WPT×SIT 0.249 0.391 0.360
WPT×MIT 0.083 0.690 0.226
WPT×WIT 0.129 0.317 0.554
The Association between School Location and Teacher Self-efficacy Profiles
School context information, school location, was included in the LCA regression model
related to self-efficacy. This covariate was examined aside from teacher training, because it was
directly reported in the 2011-2012 SASS data. Results suggested that including school location
as a covariate did not alter the specification of the LCA model on self-efficacy. School location
contributed to the differences between HSE and LSE as well as between MSE and LSE profiles
(both p-values<0.05). However, the association between school location and self-efficacy
profiles was not statistically significant in regards to the difference between HSE and MSE (p-
value>0.05).

86
The parameter estimates are provided in Table 15. The information of odds ratios
showed that: 1) the odds of participants from urban schools was 0.575 times of the odds of
participants from non-urban schools to be in HSE rather than LSE; and 2) the odds of
participants from urban schools was 0.684 times of the odds of participants from non-urban
schools to be in MSE rather than LSE. The estimated probabilities of participants from urban
schools were 26.7% of being in HSE, 50.7% of being in MSE, and 22.6% of being in LSE (see
Table 16). In contrast, these estimates of participants from non-urban schools were 32.5%,
51.8%, and 15.8% respectively. These results indicated that beginning teachers who worked in
non-urban schools were more likely to maintain high-level or moderately-high-level self-efficacy
during their first year of teaching.
Table 15
Parameter Estimates of Latent Class Regression Analyses on School Location
Estimate (log odds) SE LM UM p OR LMOR UMOR
HSE/LSE
Intercept 0.722 0.107 0.512 0.932 <0.01
Urban -0.553 0.195 -0.935 -0.171 <0.01 0.575 0.393 0.843
MSE/LSE
Intercept 1.188 0.107 0.978 1.398 <0.01
Urban -0.380 0.187 -0.747 -0.013 <0.05 0.684 0.474 0.987
HSE/MSE
Intercept -0.466 0.080 -0.623 -0.309 <0.05

87
Table 15 Continued
Estimate (log odds) SE LM UM p OR LMOR UMOR
Urban -0.174 0.164 -0.495 0.147 0.289 0.840 0.609 1.159
Note. SE: standard error; OR: odds ratio; LM: 95% confidence interval lower limit of log odds;
UM: 95% confidence interval upper limit of log odds; LMOR: 95% confidence interval lower
limit of odds ratio; UMOR: 95% confidence interval upper limit of odds ratio.
Table 16
Estimated Probabilities by Classes on School Location
HSE MSE LSE
Urban 0.267 0.507 0.226
Non-urban 0.325 0.518 0.158
Study 3
Descriptive information of beginning teachers’ job satisfaction and turnover motivation
was provided in Table 5. Almost 90% of participants reported that they were satisfied with being
a teacher based on their first-year-teaching experience. However, statistics in regards to their
turnover motivation also called attention to future teacher attrition. Over one third of participants
implied their potential moving to other schools. In addition, around one fifth of participants
indicated to leave teaching if they got higher payment by other positions. Although it should be
acknowledged that the factors resulting in teacher turnover were complicated, the third study
sought to explain why beginning teachers chose to leave by examining the relationships among
teacher turnover motivation, self-efficacy, and teacher training. Since including covariates like

88
teacher training and school location did not change the classification of teacher self-efficacy
profiles, the three models in this study were all established as LCA with distal outcomes.
LCA with Job Satisfaction
Results of LCA with job satisfaction as a distal outcome are provided in Table 17. Chi-
square test results suggested that teacher self-efficacy profiles statistically significantly
differentiated beginning teachers’ job satisfaction levels (p-value<0.01). More specifically, the
difference of job satisfaction was statistically significant between HSE and LSE participants.
Similar results were also reported between MSE and LSE participants as well as between HSE
and MSE participants (all p-values<0.05).
Tests of the odds ratios used Category=1 (beginning teachers strongly disagreed that they
were generally satisfied with being a teacher at this school) as the reference to generate the odds
and used the LSE class as the reference to calculate the odds ratios. Therefore, the odds ratios in
Table 17 were conditional to each comparison. For instance, the odds of HSE participants who
responded as strongly satisfied rather than as strongly dissatisfied with being a teacher at certain
schools was 9.636 times of the odds of LSE participants.
The estimated probabilities suggested that compared to MSE peers, HSE participants
were slightly more likely to be increasingly satisfied with being a teacher in general. Around
70% of HSE participants and 60% of MSE participants strongly agreed that they were satisfied
with their job. However, this estimate was only 26.5% for LSE participants. Additionally, while
the sum of the estimates of feeling somewhat and strongly dissatisfied with being a teacher were
below 10% for both HSE and MSE participants, this summed estimate was almost triple for LSE
participants. Overall, these results indicated that beginning teachers with a higher level of self-
efficacy were more likely to be associated with a high level of job satisfaction.

89
Table 17
Equality Tests of Probabilities across Classes on Job Satisfaction
Probability SE LM UM OR SEOR LMOR UMOR
HSE (reference=LSE)
Category=4 0.691 0.024 0.644 0.738 9.636 4.711 3.696 25.124
Category=3 0.225 0.022 0.182 0.268 1.829 0.891 0.704 4.753
Category=2 0.064 0.013 0.039 0.089 1.157 0.603 0.417 3.213
Category=1 0.019 0.007 0.005 0.033 1.000 0.000 1.000 1.000
MSE (reference=LSE)
Category=4 0.603 0.024 0.556 0.650 6.465 2.636 2.907 14.374
Category=3 0.311 0.021 0.270 0.352 1.938 0.803 0.860 4.367
Category=2 0.061 0.011 0.039 0.083 0.848 0.386 0.348 2.070
Category=1 0.025 0.007 0.011 0.039 1.000 0.000 1.000 1.000
LSE
Category=4 0.265 0.031 0.204 0.326 1.000 0.000 1.000 1.000
Category=3 0.456 0.035 0.387 0.525 1.000 0.000 1.000 1.000
Category=2 0.206 0.028 0.151 0.261 1.000 0.000 1.000 1.000
Category=1 0.072 0.018 0.037 0.107 1.000 0.000 1.000 1.000
HSE (reference=MSE)
Category=4 1.491 0.754 0.553 4.018
Category=3 0.944 0.487 0.343 2.593
Category=2 1.363 0.781 0.443 4.192

90
Table 17 Continued
Probability SE LM UM OR SEOR LMOR UMOR
Category=1 1.000 0.000 1.000 1.000
Chi-square p df
Overall Test 128.913 <0.01 6
HSE vs. LSE 117.592 <0.01 3
MSE vs. LSE 82.522 <0.01 3
HSE vs. MSE 7.881 <0.05 3
Note. Category=4 means beginning teachers strongly agreed that they were generally satisfied
with being a teacher at this school; Category=3 means beginning teachers agreed that they were
generally satisfied with being a teacher at this school; Category=2 means beginning teachers
somewhat agreed that they were generally satisfied with being a teacher at this school;
Category=1 means beginning teachers strongly disagreed that they were generally satisfied with
being a teacher at this school.
SE: standard error; OR: odds ratio; LM: 95% confidence interval lower limit of log odds; UM:
95% confidence interval upper limit of log odds; LMOR: 95% confidence interval lower limit of
odds ratio; UMOR: 95% confidence interval upper limit of odds ratio.
LCA with Moving Motivation
The second model included moving motivation as a distal outcome. In Table 18, Chi-
square test results suggested that teacher self-efficacy profiles statistically significantly
differentiated beginning teachers’ moving motivation levels (p-value<0.01), and the differences
across all classes of self-efficacy profiles were statistically significant (all p-values<0.01).
Results of the odds ratio tests are reported in Table 18. Category=4 (beginning teachers
strongly disagreed that they thought about transferring to another school) was used as the
reference to generate the odds and LSE class was employed to calculate the odds ratios. An
example of the interpretations of the odds ratios was that the odds of HSE participants who

91
responded as strongly agreeing rather than as strongly disagreeing the consideration of
transferring was 0.254 time of the odds of LSE participants. In other words, beginning teachers
with a lower level of self-efficacy were more likely to think about transferring during their first
year of teaching.
Table 18
Equality Tests of Probabilities across Classes on Moving Motivation
Probability SE LM UM OR SEOR LMOR UMOR
HSE (reference=LSE)
Category=4 0.527 0.027 0.474 0.580 1.000 0.000 1.000 1.000
Category=3 0.160 0.021 0.119 0.201 0.376 0.096 0.229 0.619
Category=2 0.222 0.022 0.179 0.265 0.382 0.086 0.245 0.596
Category=1 0.090 0.015 0.061 0.119 0.254 0.074 0.144 0.448
MSE (reference=LSE)
Category=4 0.410 0.021 0.369 0.451 1.000 0.000 1.000 1.000
Category=3 0.255 0.018 0.220 0.290 0.767 0.181 0.483 1.219
Category=2 0.253 0.019 0.216 0.290 0.560 0.126 0.360 0.872
Category=1 0.082 0.012 0.058 0.106 0.295 0.084 0.169 0.515
LSE
Category=4 0.279 0.032 0.216 0.342 1.000 0.000 1.000 1.000
Category=3 0.226 0.030 0.167 0.285 1.000 0.000 1.000 1.000
Category=2 0.307 0.033 0.242 0.372 1.000 0.000 1.000 1.000
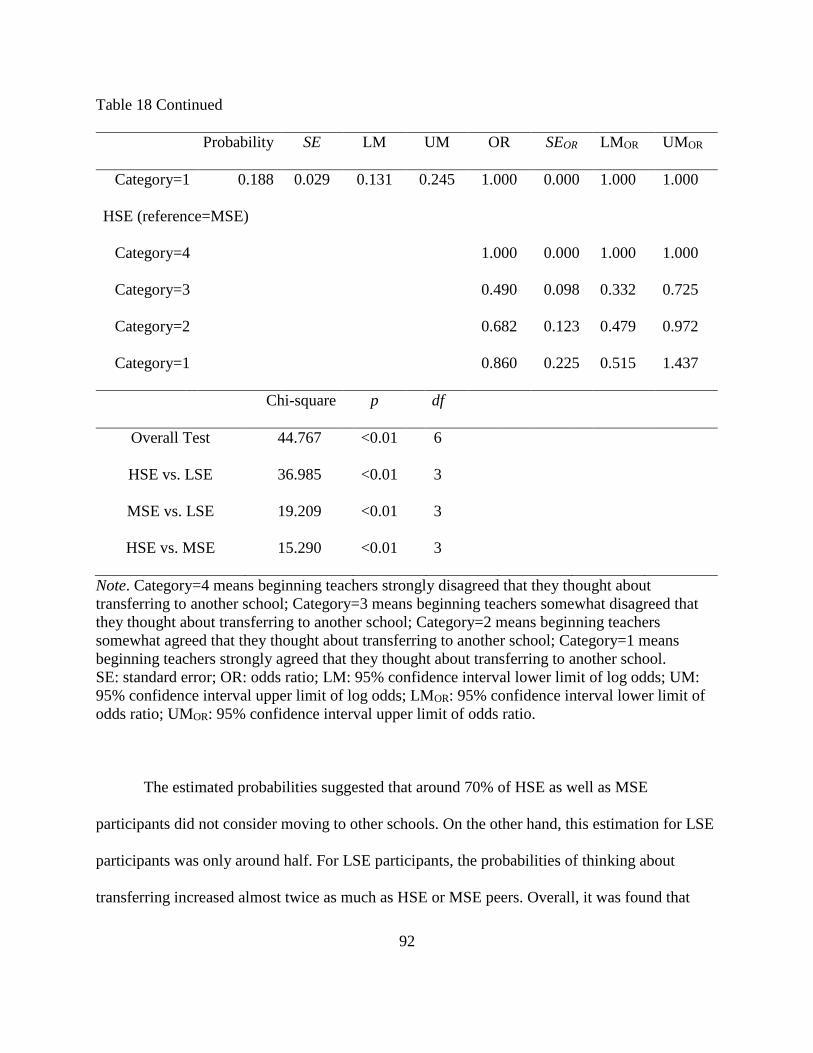
92
Table 18 Continued
Probability SE LM UM OR SEOR LMOR UMOR
Category=1 0.188 0.029 0.131 0.245 1.000 0.000 1.000 1.000
HSE (reference=MSE)
Category=4 1.000 0.000 1.000 1.000
Category=3 0.490 0.098 0.332 0.725
Category=2 0.682 0.123 0.479 0.972
Category=1 0.860 0.225 0.515 1.437
Chi-square p df
Overall Test 44.767 <0.01 6
HSE vs. LSE 36.985 <0.01 3
MSE vs. LSE 19.209 <0.01 3
HSE vs. MSE 15.290 <0.01 3
Note. Category=4 means beginning teachers strongly disagreed that they thought about
transferring to another school; Category=3 means beginning teachers somewhat disagreed that
they thought about transferring to another school; Category=2 means beginning teachers
somewhat agreed that they thought about transferring to another school; Category=1 means
beginning teachers strongly agreed that they thought about transferring to another school.
SE: standard error; OR: odds ratio; LM: 95% confidence interval lower limit of log odds; UM:
95% confidence interval upper limit of log odds; LMOR: 95% confidence interval lower limit of
odds ratio; UMOR: 95% confidence interval upper limit of odds ratio.
The estimated probabilities suggested that around 70% of HSE as well as MSE
participants did not consider moving to other schools. On the other hand, this estimation for LSE
participants was only around half. For LSE participants, the probabilities of thinking about
transferring increased almost twice as much as HSE or MSE peers. Overall, it was found that

93
beginning teachers with an increasing level of self-efficacy were less likely to consider moving
to another school.
LCA with Leaving Motivation
Leaving motivation was examined as a distal outcome in the last model. In Table 19, Chi-
square tests indicated that teacher self-efficacy profiles statistically significantly differentiated
beginning teachers’ leaving motivation levels (p-value<0.01), and the differences across all
classes of self-efficacy profiles were statistically significant (all p-values<0.05).
Results of the odds ratio tests are given in Table 19. Category=4 (beginning teachers
strongly disagreed that they would leave teaching as soon as possible if they could get a higher
paying job) was used as the reference to generate the odds and LSE class was employed to
calculate the odds ratios. An example of the interpretations of the odds ratios was that the odds of
HSE participants who responded as strongly agreeing rather than as strongly disagreeing the
consideration of leaving for higher payment was 0.104 time of the odds of LSE participants. In
other words, beginning teachers with a lower level of self-efficacy were more likely to think
about leaving to pursue a high paying position during their first year of teaching.
The estimated probabilities suggested that around 80% of HSE as well as MSE
participants did not consider leaving. In contrast, this estimation for LSE participants was lower
and less than 70%. For LSE participants, the sum of the probabilities of thinking about leaving to
different extents were over 30%, which was 1.5 times of that for either HSE or MSE participants.
Overall, beginning teachers with an increasing level of self-efficacy were less likely to consider
leaving for higher payment.

94
Table 19
Equality Tests of Probabilities across Classes on Leaving Motivation
Probability SE LM UP OR SEOR LMOR UMOR
HSE (reference=LSE)
Category=4 0.541 0.026 0.490 0.592 1.000 0.000 1.000 1.000
Category=3 0.264 0.023 0.219 0.309 0.319 0.069 0.208 0.489
Category=2 0.129 0.018 0.094 0.164 0.343 0.094 0.200 0.587
Category=1 0.066 0.013 0.041 0.091 0.291 0.104 0.145 0.587
MSE (reference=LSE)
Category=4 0.471 0.022 0.428 0.514 1.000 0.000 1.000 1.000
Category=3 0.348 0.021 0.307 0.389 0.483 0.103 0.318 0.734
Category=2 0.134 0.014 0.107 0.161 0.408 0.108 0.243 0.684
Category=1 0.048 0.009 0.030 0.066 0.240 0.082 0.123 0.469
LSE
Category=4 0.274 0.034 0.207 0.341 1.000 0.000 1.000 1.000
Category=3 0.420 0.036 0.349 0.491 1.000 0.000 1.000 1.000
Category=2 0.191 0.028 0.136 0.246 1.000 0.000 1.000 1.000
Category=1 0.115 0.025 0.066 0.164 1.000 0.000 1.000 1.000
HSE (reference=MSE)
Category=4 1.000 0.000 1.000 1.000
Category=3 0.660 0.110 0.476 0.915
Category=2 0.839 0.184 0.546 1.291

95
Table 19 Continued
Probability SE LM UP OR SEOR LMOR UMOR
Category=1 1.213 0.361 0.677 2.172
Chi-square p df
Overall Test 46.075 <0.01 6
HSE vs. LSE 39.357 <0.01 3
MSE vs. LSE 26.740 <0.01 3
HSE vs. MSE 8.038 <0.05 3
Note. Category=4 means beginning teachers strongly disagreed that they would leave teaching as
soon as possible if they could get a higher paying job; Category=3 means beginning teachers
somewhat disagreed that they would leave teaching as soon as possible if they could get a higher
paying job; Category=2 means beginning teachers somewhat agreed that they would leave
teaching as soon as possible if they could get a higher paying job; Category=1 means beginning
teachers strongly agreed that they would leave teaching as soon as possible if they could get a
higher paying job.
SE: standard error; OR: odds ratio; LM: 95% confidence interval lower limit of log odds; UM:
95% confidence interval upper limit of log odds; LMOR: 95% confidence interval lower limit of
odds ratio; UMOR: 95% confidence interval upper limit of odds ratio.

96
CHAPTER V
CONCLUSIONS
The purposes of this dissertation are: (a) to investigate beginning teachers’ preservice as
well as in-service training profiles; and (b) to examine the relationships among teacher training,
teacher self-efficacy, job satisfaction, and turnover motivation at the individual level. Many
research studies have explained how these factors were interrelated to each other using a
variable-centered approach to analyze data. Based on different research purposes, results from
these studies contribute to understanding the prediction of interested outcomes, such as self-
efficacy and job satisfaction, and develop the clarification of the associations between the factors
in structural equations. Recently, researchers have started to use a person-centered approach to
conduct studies on teachers (e.g., Drossel & Eickelmann, 2017; Eddy & Easton-Brooks, 2011).
Generating the homogeneous subgroups not only resolved the concern about violating analytic
assumptions faced by the classical variable-centered models, but also provided more insights to
better understand the population. Bámaca-Colbert and Gayles (2010) conducted their research
using both variable-centered and person-centered approaches. They found that although the
findings from different analytic models were similar, their latent mixture models given in the
person-centered approach were more informative. Therefore, this dissertation used the analytic
models within a person-centered approach to research beginning teachers in the 2011-2012
SASS data. Using these models, the classes of beginning teachers who shared a similar pattern of
attributes were classified, and the probabilities of particular class memberships were related to a
set of indicators. Overall, results of this dissertation suggested that beginning teachers had
different profiles of teacher training and self-efficacy. In addition, beginning teachers who were

97
better prepared by their preservice and in-service training were more likely to maintain high-
level self-efficacy, which further resulted in their high-level job satisfaction and low-level
turnover motivation during the first year of teaching.
Discussion
The first study examines beginning teachers’ training profiles. Few studies examined
educators’ profiles using latent class analyses. The most relevant example was the examination
of different types of principals by Urick and Bowers (2014) using the 1999-2000 SASS data.
Their study found that the profiles of principals were related to the degree of principal and
teacher leadership. The present study sought to provide additional contributions to this field by
examining beginning teachers’ training profiles. The results indicated that beginning teachers
received different patterns of preservice as well as in-service training, and their preservice
training was not significantly associated with the in-service training.
Beginning teachers’ preservice training was differentiated by two perspectives, the
completion of various teacher education components and the undergraduate majors. One
commonality shared in the three distinctive preservice training profiles was a lack of completing
reading coursework. Considering the Peter Effect, this finding helped to explain why teachers, no
matter which subject area they focused on, struggled with literacy instruction as well as why a
large proportion of students failed to read proficiently. Encouraging teacher candidates to
complete more reading coursework could be an important piece of the puzzle to resolve the
challenge of illiteracy faced by the entire education system.
Among a variety of developmental activities accessible to in-service teachers, the present
study examined a selection of them to establish beginning teachers’ in-service training profiles.
The results suggested that having common planning time was important for beginning teachers,

98
because it significantly contributed to the differences across the three profiles. Research
described common planning time as: (a) participants could be teachers from different subjects;
(b) these teachers either plan and work together or teach the same students; and (c) the meeting
was regularly scheduled (Flowers, Mertens, & Mulhall, 2003; Kellough & Kellough; 2008).
Considering the SASS survey item, more specifically, the result of the present study emphasized
the significance of common time with colleagues in the same subject area. Future studies could
research whether the experience of instructing the same subject would better meet beginning
teachers’ needs for further development than the instructional experience across disciplines
would.
The second study explores beginning teachers’ self-efficacy profiles. Using multiple
indicators constructed self-efficacy as a multifaceted factor and examined whether the reported
levels of preparedness varied upon different perspectives of self-efficacy. Results indicated that
there were three distinctive classes of beginning teachers’ self-efficacy profiles. Around one fifth
of the participants in this study struggled with maintaining high-level self-efficacy and reported
that they felt less prepared on all the efficacy perspectives measured by SASS.
The association between teacher training and self-efficacy profiles is examined. The
results showed that including teacher training did not change the classification of beginning
teachers’ self-efficacy profiles, and both preservice and in-service training significantly
contributed to differentiating beginning teachers’ self-efficacy. In general, the hypothesis was
supported that at the individual level, sufficient teacher training led to high-level teacher self-
efficacy during the first year of teaching. Furthermore, the results suggested that if beginning
teachers received adequate preservice training, they were likely to have high-level self-efficacy
regardless of their undergraduate majors. Meanwhile, beginning teachers who lacked common

99
planning time but had access to other types of developmental activities were likely to have a
similar classification of teacher self-efficacy profiles as their peers without adequate
participation in all developmental activities did.
In this study, the findings indicated that the completion of their coursework and field
experience, rather than undergraduate major, were more inferential to teacher preparation.
Therefore, school hiring committees may want to consider the quality of teacher preparation as
an important index to evaluate candidates’ readiness to instruct in classrooms. In addition, the
findings showed the unique contribution of common planning time with colleagues in the same
subject field to maintain high-level self-efficacy. Previous research suggested that common
planning time was implemented to support inclusive environments and thus make teachers keep
positive attitudes to their working environment (Hunter, Jasper, & Williamson, 2014; Warren &
Muth, 1995). Legters, Adams, and Williams (2010) suggested that common planning time helped
teachers center student needs and progress as their major responsibility, keep their instruction
consistent while adjusted to in-class diversity, and establish a community for peer leaning and
continuous progress. Common planning time contributed to reducing teacher turnover
probabilities (Ingersoll & Smith, 2004) as well as promoting students’ academic gains (Flowers,
Mertens, & Mulhall, 2000). Therefore, McEwin and Greene (2010) recommended that teachers
should be “provided at least one daily common planning period” (p. 52). Consistently, the
findings of the present dissertation emphasized the necessity of common planning time to
beginning teachers. Additionally, these findings extended previous research by indicating that
without common planning time, beginning teachers struggled with maintaining their self-efficacy
regardless of their participation in other types of developmental activities.

100
The association between school location and self-efficacy is also examined. According to
the results using the binary coding of school location, the hypothesis that beginning teachers
from urban schools struggled with high-level self-efficacy was supported. This finding was
consistent with that of Siwatu (2011). Using the Teachers’ Sense of Efficacy Scale data, Chang
and Engelhard Jr. (2016) reported that the measurement quality of self-efficacy survey items was
invariant in regards to school location. Therefore, the differences of reported teacher self-
efficacy across school locations were less likely to be due to how the survey items were
generated and selected, which further supported the relationship between school location and
teacher self-efficacy. Overall, the findings from this dissertation and previous research called for
attention to helping teachers maintain self-efficacy, especially for teachers in urban schools,
which could be significant to be considered and implemented by policy makers and stakeholders.
The third study investigates beginning teachers’ job satisfaction and turnover motivation.
As expected, the results suggested that beginning teachers with a higher level of self-efficacy
were more likely to have high-level job satisfaction and low-level turnover motivation. Many
research studies examined the relationships among teacher self-efficacy, job satisfaction, and
turnover (Caprara, Barbaranelli, Borgogni, Petitta, & Rubinacci, 2003; Caprara et al., 2006;
Klassen & Chiu, 2010; Skaalvik & Skaalvik, 2010; Viel-Ruma, Houchins, Jolivette, & Benson).
Using variable-centered methods like regression, factor analysis, and structural equation
modeling, their results have continuously reported a positive association between teacher self-
efficacy and job satisfaction as well as a negative association between teacher self-efficacy and
teacher turnover. The findings from the study in the present dissertation were consistent with
previous research but further explained the relationships among three factors, teacher self-
efficacy, job satisfaction, and turnover motivation, at the individual level. In other words, the

101
examination was conducted controlling for the homogeneity of teacher self-efficacy. In addition,
the distribution of the likelihood that beginning teachers with distinctive self-efficacy profiles
experienced a particular level of job satisfaction and turnover motivation was presented to better
understand the outcomes associated with poor teacher training and low self-efficacy. Future
research could examine the similar research questions using data that include teachers from
different contexts and compare whether a shift would exist if teachers had more diverse self-
efficacy profiles and if teachers transferred from one particular class of self-efficacy profiles to
another.
Overall, considering the results of three studies in this dissertation as an integrated piece,
support is provided to the overall hypothesis that beginning teachers who received better teacher
training and did not work in urban schools tended to exhibit a high level of self-efficacy and a
high level of job satisfaction as well as a low level of turnover motivation. All examinations are
conducted at the individual level, which enables this dissertation to extend previous research and
to contribute its unique significance.
Limitations
The three studies in the present dissertation relied on latent mixture modeling, which was
innovative in the field of teacher education research. Although the results were informative,
some limitations of the studies should be acknowledged. First, due to the features of the SASS
survey items, all indicators were manipulated as binary variables. As a result, for latent
constructs like profiles of teacher education and developmental activities, quantitative
information of their related indicators was not accessible. For instance, among teacher candidates
who completed some reading courses, it is impossible to know whether the distribution of the
number of completed courses could be skewed. That is, whether the majority of teacher

102
candidates completed one or more reading courses is unpredictable. Similarly, a concrete number
of how many teaching method courses should be completed as a baseline could not be generated
for future recommendations. In other words, results of this dissertation serve as a general
guideline and emphasize the necessity of a full coverage of teacher training.
Second, the categorical responses to the extents of feeling prepared, being satisfied, and
planning for turnover could be arbitrary. The specific distance and difference between two
adjacent categories could be subjective and variant. Meanwhile, response bias could be a
challenge that is inevitable when using self-reported data for research because “the respondent
wants to ‘look good’ in the survey, even if the survey is anonymous” (Rosenman, Tennekoon, &
Hill, 2011, p. 321). Therefore, it should be cautious when referring to the results of probabilities
as they were based on the specific sample in this dissertation.
Third, the study on self-efficacy included two types of covariates, teacher training and
school context. It is important to notice that there are many other internal and external factors,
which could be influential to the change of teacher self-efficacy. As reviewed before, a list of
examples of these factors includes student behaviors, student academic achievements, personal
issues, school climate, parental relationships, and so on. The substantial relationships between
these impactors and the covariates included in this dissertation deserve further research. For
instance, some additional factors may work as a mediator or a moderator on the relationships
among the included covariates and teacher self-efficacy profiles.
Finally, the index of turnover motivation was not equivalent to beginning teachers’
turnover ratio after their first year of teaching, which is beyond the research interest in the
present dissertation. Multiple reasons aside from poor preparation and decreasing confidence
could lead to teacher turnover. For example, teachers may have to transfer to another school or

103
permanently leave teaching because of family relocation or personal issues. The goal of this
dissertation is to help educators understand the significance of adequate teacher training, since
better-prepared teachers are likely to keep confident and satisfied with their jobs and stay in the
field.
Conclusions
Through examinations with person-centered models, the dissertation supported the
overall hypothesis that was proposed based on existing research using variable-centered models.
Beginning teachers with adequate teacher training are more likely to be associated with high-
level self-efficacy and thus have high job satisfaction and low turnover motivation. These
conclusions were achieved at the individual level, which enabled beginning teachers to be
classified into homogeneous subgroups sharing similar patterns of teacher training and self-
efficacy. Presenting these profiles and their relationships with job satisfaction and turnover
motivation indicates the important role of teacher training to prepare qualified teacher candidates
as well as to keep teachers staying in the profession with sufficient confidence and satisfaction.

104
REFERENCES
Abell, S. K. (2008). Twenty years later: Does pedagogical content knowledge remain a useful
idea? International Journal of Science Education, 30, 1405-1416.
doi:10.1080/09500690802187041
Ahn, S., & Choi, J. (2004). Teachers’ subject matter knowledge as a teacher qualification: A
synthesis of the quantitative literature on students’ mathematics achievement. Paper
presented at the annual meeting of the American Educational Research Association, San
Diego, CA.
Akaike, H. (1987). Factor analysis and AIC. Psychometrika, 52, 317–332.
doi:10.1007/BF02294359
Allinder, R. M. (1994). The relationship between efficacy and the instructional practices of
special education teachers and consultants. Teacher Education and Special Education,
17, 86–95. doi:10.1177/088840649401700203
Anhorn, R. (2008). The profession that eats its young. The Delta Kappa Gamma Bulletin, 74(3),
15-26.
Applegate, A. J., & Applegate, M. D. (2004). The Peter effect: Reading habits and attitudes of
preservice teachers. The Reading Teacher, 57, 554-563.
Appleton, K. (1995). Student teachers' confidence to teach science: Is more science knowledge
necessary to improve self-confidence? International Journal of Science Education, 17,
357-369. doi:10.1080/0950069950170307
Armor, D., Conroy-Oseguera, P., Cox, M., King, N., McDonnell, L., Pascal, A., … Zellman, G.
(1976). Analysis of the school preferred reading programs in selected Los Angeles

105
minority schools. (Report No. R-2007-LAUSD). Santa Monica, CA: Rand Corporation
(ERIC Document Reproduction Service No. 130 243).
Aro, M., & Björn, P. M. (2016). Preservice and inservice teachers’ knowledge of language
constructs in Finland. Annals of Dyslexia, 66, 111-126. doi:10.1007/s11881-015-0118-7
Ashton, P. T., & Webb, R. B. (1986). Making a difference: Teachers’ sense of efficacy and
student achievement. New York, NY: Longman.
Asparouhov, T., & Muthén, B. (2014). Auxiliary variables in mixture modeling: Three-step
approaches using M plus. Structural Equation Modeling: A Multidisciplinary
Journal, 21, 329-341. doi:10.1080/10705511.2014.915181
Asparouhov, T., & Muthén, B. (2015). Auxiliary variables in mixture modeling: Using the BCH
method in Mplus to estimate a distal outcome model and an arbitrary secondary
model. Mplus Web Notes. Retrieved from
https://www.statmodel.com/examples/webnotes/webnote21.pdf
Ball, D. L., & Cohen, D. K. (1999). Developing practices, developing practitioners: Toward a
practice-based theory of professional development. In G. Sykes & L. Darling-Hammonds
(Eds.), Teaching as the learning profession: Handbook of policy and practice (pp. 30–
32). San Francisco, CA: Jossey-Bass.
Ball, D. L., Lubienski, S. T., & Mewborn, D. S. (2001). Research on teaching mathematics: The
unsolved problem of teachers’ mathematical knowledge. In V. Richardson (Ed.),
Handbook of research on teaching (4th ed., pp. 433-456). New York, NY: Macmillan.
Bámaca-Colbert, M. Y., & Gayles, J. G. (2010). Variable-centered and person-centered
approaches to studying Mexican-origin mother–daughter cultural orientation dissonance.
Journal of Youth and Adolescence, 39, 1274-1292. doi:10.1007/s10964-009-9447-3

106
Bandura, A. (1977). Self-efficacy: Toward a unifying theory of behavioral change.
Psychological Review, 84, 191-215. doi:10.1177/002248718403500507
Bandura, A. (1986). Social foundations of thought and actions: A social cognitive theory.
Englewood Cliffs, NJ: Prentice-Hall.
Bandura, A. (1997). Self-efficacy: The exercise of control. New York, NY: Freeman.
Bandura, A. (2006). Adolescent development from an agentic perspective. In F. Pajares & T.
Urdan (Eds.), Self-efficacy beliefs of adolescents (pp. 1-43). Greenwich, CT: Information
Age.
Banilower, E., Cohen, K., Pasley, J., & Weiss, I. (2008). Effective science instruction: What does
research tell us? Portsmouth, NH: RMC Corporation, Center on Instruction.
Bauer, D. J., & Curran, P. J. (2003). Distributional assumptions of growth mixture models:
Implications for overextraction of latent trajectory classes. Psychological Methods, 8,
338–363. doi:10.1037/1082-989X.8.3.338
Baumert, J., Kunter, M., Blum, W., Brunner, M., Voss, T., Jordan, A., … Tsai, Y. -M. (2010).
Teachers’ mathematical knowledge, cognitive activation in the classroom, and student
progress. American Educational Research Journal, 47, 133-180.
doi:10.3102/0002831209345157
Berlin, K. S., Williams, N. A., & Parra, G. R. (2014). An introduction to latent variable mixture
modeling (part 1): Overview and cross-sectional latent class and latent profile
analyses. Journal of Pediatric Psychology, 39, 174-187. doi:10.1093/jpepsy/jst084
Binks, E., Joshi, R. M., & Washburn, E. K. (2009). Teacher knowledge and preparation in
scientifically-based reading research in the United Kingdom. Paper presented at the
annual meeting of the Society for the Scientific Study of Reading, Boston, MA.

107
Binks-Cantrell, E., Washburn, E. K., Joshi, R. M., & Hougen, M. (2012). Peter effect in the
preparation of reading teachers. Scientific Studies of Reading, 16, 526-536.
doi:10.1080/10888438.2011.601434
Blake, S. (2008). A nation at risk and the blind men. Phi Delta Kappan, 89, 601-602.
Bolck, A., Croon, M., & Hagenaars, J. (2004). Estimating latent structure models with
categorical variables: One-step versus three-step estimators. Political Analysis, 12, 3-27.
doi:10.1093/pan/mph001
Bong, M., & Skaalvik, E. M. (2003). Academic self-concept and self-efficacy: How different are
they really? Educational Psychology Review, 15, 1-40. doi:10.1023/A:1021302408382
Borman, G. D., & Dowling, N. M. (2008). Teacher attrition and retention: A meta-analytic and
narrative review of the research. Review of Educational Research, 78, 367-409.
doi:10.3102/0034654308321455
Borman, K. M., Mueninghoff, E., Cotner, B. A., & Frederick, P. B. (2009). Teacher preparation
programs. In L. J. Saha & A. G. Dworkin (Eds.), International handbook of research on
teachers and teaching (pp.123-140). New York, NY: Springer.
Bos, C., Mather, N., Dickson, S., Podhajski, B., & Chard, D. (2001). Perceptions and
knowledge of preservice and inservice educators about early reading instruction. Annals
of Dyslexia, 51, 97–120. doi:10.1007/s11881-001-0007-0
Brady, S., & Moats, L. C. (1998). Informed instruction for reading success: Foundations for
teacher preparation. English Teachers’ Journal, 52, 48-52.
Bruce, C. D., Esmonde, I., Ross, J., Dookie, L., & Beatty, R. (2010). The effects of sustained
classroom-embedded teacher professional learning on teacher efficacy and related student

108
achievement. Teaching and Teacher Education, 26, 1598-1608.
doi:10.1016/j.tate.2010.06.011
Byrne, B. M. (1994). Burnout: Testing for the validity, replication, and invariance of the causal
structure across elementary, intermediate, and secondary teachers. American Educational
Research Journal, 31, 645-673.
Cantrell, S. C., & Hughes, H. K. (2008). Teacher efficacy and content literacy implementation:
An exploration of the effects of extended professional development with coaching.
Journal of Literacy Research, 40, 95-127. doi:10.1080/10862960802070442
Caprara, G. V., Barbaranelli, C., Borgogni, L., Petitta, L., & Rubinacci, A. (2003). Teachers’,
school staff’s and parents’ efficacy beliefs as determinants of attitudes toward
school. European Journal of Psychology of Education, 18, 15-31.
Caprara, G. V., Barbaranelli, C., Steca, P., & Malone, P. S. (2006). Teachers’ self-efficacy
beliefs as determinants of job satisfaction and students’ academic achievement: A study
at the school level. Journal of School Psychology, 44, 473-490.
doi:10.1016/j.jsp.2006.09.001
Carreker, S., Joshi, R. M., & Boulware-Gooden, R. (2010). Spelling-related teacher knowledge:
The impact of professional development on identifying appropriate instructional
activities. Learning Disability Quarterly, 33, 148-158.
doi:10.1177/073194871003300304
Castro, A. J., Kelly, J., & Shih, M. (2010). Resilience strategies for new teachers in high-needs
areas. Teaching and Teacher Education, 26, 622–629. doi:10.1016/j.tate.2009.09.010
Celeux, G., & Soromenho, G. (1996). An entropy criterion for assessing the number of clusters
in a mixture model. Journal of Classification, 13, 195-212.

109
Chacon, C, T. (2005). Teachers’ perceived efficacy among English as a foreign language
teachers in middle schools in Venezuela. Teaching and Teacher Education, 21, 257-272.
doi:10.1016/j.tate.2005.01.001
Chall, J. S. (1983). Stages of reading development. New York, NY: McGraw-Hill.
Chall, J. S., & Jacobs, V. A. (2003). The classic study on poor children’s fourth-grade
slump. American Educator, 27, 14-15.
Chang, M. L. (2009). An appraisal perspective of teacher burnout: Examining the emotional
work of teachers. Educational Psychology Review, 21, 193-218. doi:10.1007/s10648-
009-9106-y
Chang, M. L., & Engelhard Jr., G. (2016). Examining the Teachers’ Sense of Efficacy Scale at
the item level with Rasch measurement model. Journal of Psychoeducational
Assessment, 34, 177-191. doi:10.1177/0734282915593835
Chester, M., & Beaudin, B. Q. (1996). Efficacy beliefs of newly hired teachers in urban schools.
American Educational Research Journal, 33, 233–257. doi:10.3102/00028312033001233
Cohen, D. K., & Hill, H. C. (1998). Instructional policy and classroom performance: The
mathematics reform in California. Teachers College Record, 102, 294-343.
Coladarci, T. (1992). Teachers’ sense of efficacy and commitment to teaching. Journal of
Experimental Education, 60, 323-337. doi:10.1016/j.jsp.2006.09.001
Collins, L. M., & Lanza, S. T. (2010). Latent class and latent transition analysis: With
applications in the social, behavioral, and health sciences. New York, NY: Wiley.
Collins, L. M., Fidler, P. L., Wugalter, S. E., & Long, J. D. (1993). Goodness-of-fit testing for
latent class models. Multivariate Behavioral Research, 28, 375–389.
doi:10.1207/s15327906mbr2803_4

110
Crocco, M. S., & Costigan, A. T. (2007). The narrowing of curriculum and pedagogy in the age
of accountability urban educators speak out. Urban Education, 42, 512-535.
doi:10.1177/0042085907304964
Czerniak, C., & Chiarelott, L. (1990). Teacher education for effective science instruction—A
social cognitive perspective. Journal of Teacher Education, 41, 49-58.
doi:10.1177/002248719004100107
Darling-Hammond, L. (2003). Keeping good teachers: Why it matters, what leaders can do.
Educational Leadership, 60(8), 6-13.
Darling-Hammond, L. (2010). Teacher education and the American future. Journal of Teacher
Education, 61, 35-47. doi:10.1177/0022487109348024
Darling-Hammond, L., Berry, B., & Thoreson, A. (2001). Does teacher certification matter?
Evaluating the evidence. Educational Evaluation and Policy Analysis, 23, 57-77.
doi:10.3102/01623737023001057
Darling-Hammond, L., Chung, R., & Frelow, F. (2002). Variation in teacher preparation: How
well do different pathways prepare teachers to teach? Journal of Teacher Education, 53,
286-302. doi:10.1177/0022487102053004002
Davis, E. A., Petish, D., & Smithy, J. (2006). Challenges new science teachers face. Review of
Educational Research, 76, 607-652. doi:10.3102/00346543076004607
DeAngelis, K. J., Wall, A. F., & Che, J. (2013). The impact of preservice preparation and early
career support on novice teachers’ career intentions and decisions. Journal of Teacher
Education, 64, 338-355. doi:10.1177/0022487113488945

111
Dellinger, A. B., Bobbett, J. J., Olivier, D. F., & Ellett, C. D. (2008). Measuring teachers’ self-
efficacy beliefs: Development and use of TEBS-Self. Teaching and Teacher Education,
24, 751-766. doi:10.1016/j.tate.2007.02.010
Dennis, L., & Horn, E. (2014). The effects of professional development on preschool teachers’
instructional behaviors during storybook reading. Early Child Development and
Care, 184, 1160-1177. doi:10.1080/03004430.2013.853055
Dinham, S., & Scott, C. (1998). A three domain model of teacher and school executive career
satisfaction. Journal of Educational Administration, 36, 362-378.
doi:10.1108/09578239810211545
Dinham, S., & Scott, C. (2000). Moving into the third, outer domain of teacher satisfaction.
Journal of Educational Administration, 38, 379-96. doi:10.1108/09578230010373633
Drolet, R. (2009). Meeting increased common planning time requirements: A case study of
middle schools in three Rhode Island districts (Doctoral dissertation). Dissertations &
Theses: Full Text. (Publication No. AAT 3350094).
Drossel, K., & Eickelmann, B. (2017). Teachers’ participation in professional development
concerning the implementation of new technologies in class: A latent class analysis of
teachers and the relationship with the use of computers, ICT self-efficacy and emphasis
on teaching ICT skills. Large-scale Assessments in Education, 5(19), 1-13.
doi:10.1186/s40536-017-0053-7
Duffy-Hester, A. M. (1999). Teaching struggling readers in elementary school classrooms: A
review of classroom reading programs and principles for instruction. The Reading
Teacher, 52, 480-495.

112
Eddy, C., & Easton-Brooks, D. (2011). Teacher efficacy as a multigroup model using latent class
analysis. Education Research International, 2011(Article ID 149530).
doi:10.1155/2011/149530
Ehrenberg, R., & Smith, R. (2011). Modern labor economics: Theory and public policy (11th
Ed.). Boston, MA: Pearson.
Evans, E. D., & Tribble, M. (1986). Perceived teaching problems, self-efficacy, and commitment
to teaching among preservice teachers. The Journal of Educational Research, 80, 81-85.
Fantilli, R. D., & McDougall, D. E. (2009). A study of novice teachers: Challenges and supports
in the first years. Teaching and Teacher Education, 25, 814–825.
doi:10.1016/j.tate.2009.02.021
Fielding-Barnsley, R., & Purdie, N. (2005). Teachers' attitude to and knowledge of
metalinguistics in the process of learning to read. Asia-Pacific Journal of Teacher
Education, 33, 65–75.
Fisher, D., & Ivey, G. (2005). Literacy and language as learning in content-area classes: A
departure from “Every Teacher a Teacher of Reading”. Action in Teacher Education,
27(2), 3-11. doi:10.1080/01626620.2005.10463378
Flores, I. M. (2015). Developing preservice teachers' self-efficacy through field-based science
teaching practice with elementary students. Research in Higher Education Journal, 27, 1-
19.
Flowers, N., Mertens, S. B., & Mulhall, P. (2000). What makes interdisciplinary teams effective?
Middle School Journal, 31 (4), 53-56. doi:10.1080/00940771.2000.11494640

113
Flowers, N., Mertens, S. B., & Mulhall, P. (2003). Lessons learned from more than a decade of
middle grades research. Middle School Journal, 35(2), 55–59.
doi:10.1080/00940771.2003.11494537
Fox, A. G., & Peters, M. L. (2013). First year teachers: Certification program and assigned
subject on their self-efficacy. Current Issues in Education, 16(1), 1-15.
Friedrichsen, P. J., Abell, S. K., Pareja, E. M., Brown, P. L., Lankford, D. M., & Volkmann, M.
J. (2009). Does teaching experience matter? Examining biology teachers’ prior
knowledge for teaching in an alternative certification program. Journal of Research in
Science Teaching, 46, 357-383. doi:10.1002/ tea.20283
Gaddy, B. (2003). Reading a central focus of No Child Left Behind Act. Aurora, CO: Mid-
Continent Research for Education and Learning.
Gaikhorst, L., Beishuizen, J., Roosenboom, B., & Volman, M. (2017). The challenges of
beginning teachers in urban primary schools. European Journal of Teacher
Education, 40(1), 46-61.
Garet, M. S., Porter, A. C., Desimone, L., Birman, B. F., & Yoon, K. S. (2001). What makes
professional development effective? Results from a national sample of teachers.
American Educational Research Journal, 38, 915-945. doi:10.3102/00028312038004915
Gatlin, D. (2009). A pluralistic approach to the revitalization of teacher education. Journal of
Teacher Education, 60, 469-477. doi:10.1177/0022487109348597
Gavish, B., & Friedman, I. A. (2010). Novice teachers’ experience of teaching: A dynamic
aspect of burnout. Social Psychology of Education, 13, 141–167. doi:10.1007/s11218-
009-9108-0

114
Gibson, S., & Dembo, M. (1984). Teacher efficacy: A construct validation. Journal of
Educational Psychology, 76, 569–582.
Glazerman, S., Isenberg, E., Dolfin, S., Bleeker, M., Johnson, A., Grider, M., & Jacobus, M.
(2010). Impacts of comprehensive teacher induction: Final results from a randomized
controlled study (NCEE 2010-4027). Washington, DC: US Department of Education.
Retrieved from https://files.eric.ed.gov/fulltext/ED565837.pdf
Goldring, R., Gray, L., & Bitterman, A. (2013). Characteristics of public and private elementary
and secondary school teachers in the United States: Results from the 2011–12 Schools
and Staffing Survey. Washington, DC: National Center for Education Statistics. Retrieved
from http://files.eric.ed.gov/fulltext/ED544178.pdf
Goldring, R., Gray, L., Bitterman, A., & Broughman, S. (2013). Characteristics of public and
private elementary and secondary school principals in the United States: Results from the
2011–12 Schools and Staffing Survey (NCES 2013-314). Washington, DC: National
Center for Education Statistics. Retrieved from
https://nces.ed.gov/pubs2013/2013314.pdf
Gray, L., & Taie, S. (2015). Public school teacher attrition and mobility in the first five years:
Results from the first through fifth waves of the 2007-08 beginning teacher longitudinal
study. First look. Washington, DC: National Center for Education Statistics. Retrieved
from https://files.eric.ed.gov/fulltext/ED556348.pdf
Greenleaf, C. L., & Schoenbach, R. (2004). Building capacity for the responsive teaching of
reading in the academic disciplines: Strategic inquiry designs for middle and high school
teachers’ professional development. In D. S. Strickland & M. L. Kamil (Eds.), Improving

115
reading achievement through professional development (pp. 97–127). Norwood, MA:
Christopher Gordon.
Griffin, G. A. (1983). Introduction: The work of staff development. In G. A. Grinffin (Ed.), Staff
development, eighty-second yearbook of the National Society for the Study of Education
(pp. 2). Chicago, IL: University of Chicago Press.
Guarino, C. M., Santibanez, L., & Daley, G. A. (2006). Teacher recruitment and retention: A
review of the recent empirical literature. Review of Educational Research, 76, 173-208.
doi:10.3102/00346543076002173
Guskey, T. (1986). Staff development and the process of teacher change. Educational
Researcher, 15, 5-12. doi:10.3102/0013189X015005005
Guskey, T. (1988). Teacher efficacy, self-concept, and attitudes toward the implementation of
instructional innovation. Teaching and Teacher Education, 4, 63-69. doi:10.1016/0742-
051X(88)90025-X
Guskey, T. (2002). Professional development and teacher change. Teachers and Teaching, 8,
381-391. doi:10.1080/135406002100000512
Hagenaars, J., & McCutcheon, A. (2002). Applied latent class analysis models. New York, NY:
Cambridge University Press.
Hahs-Vaughn, D. L., & Scherff, L. (2008). Beginning English teacher attrition, mobility, and
retention. The Journal of Experimental Education, 77, 21-54. doi:10.3200/JEXE.77.1.21-
54
Hall, B. W., Pearson L. C., & Carroll, D. (1992). Teachers’ long-range teaching plans: A
discriminant analysis. Journal of Educational Research, 85, 221-225.
doi:10.1080/00220671.1992.9941119

116
Hall, B., Burley, W., Villeme, M., & Brockmeier, L. (1992). An attempt to explicate teacher
efficacy beliefs among first year teachers. Paper presented at the Annual Meeting of the
American Educational Research Association, San Francisco, CA.
Hallinger, P., Bickman, L., & Davis, K. (1996). School context, principal leadership, and student
reading achievement. The Elementary School Journal, 96, 527-549.
Hancock, C. B., & Scherff, L. (2010). Who will stay and who will leave? Predicting secondary
English teacher attrition risk. Journal of Teacher Education, 61, 328-338.
doi:10.1177/0022487110372214
Hargreaves, A., & Fullan, M. (2012). Professional capital. Transforming teaching in every
school. New York, NY: Routledge.
Harrison, D. A., Newman, D. A., & Roth, P. L. (2006). How important are job attitudes? Meta-
analytic comparison of integrative behavioral outcomes and time sequences. Academy of
Management Journal, 49, 305-325. doi:10.5465/AMJ.2006.20786077
Hattie, J. A. C. (2009). Visible learning: A synthesis of over 800 meta-analyses relating to
achievement. New York, NY: Routledge.
Høigaard, R., Giske, R., & Sundsli, K. (2012). Newly qualified teachers’ work engagement and
teacher efficacy influences on job satisfaction, burnout, and the intention to quit.
European Journal of Teacher Education, 35, 347-357.
doi:10.1080/02619768.2011.633993
Hoy, A. W., & Spero, R. B. (2013). Changes in teacher efficacy during the early years of
teaching: A comparison of four measures. Teaching and Teacher Education, 21, 343-
356. doi:10.1016/j.tate.2005.01.007

117
Hughes, J. N., & Kwok, O. M. (2007). Influence of student-teacher and parent-teacher
relationships on lower achieving readers' engagement and achievement in the primary
grades. Journal of Educational Psychology, 99, 39-51. doi:10.1037/0022-0663.99.1.39
Hunter, W., Jasper, A. D., & Williamson, R. L. (2014). Utilizing middle school common
planning time to support inclusive environments. Intervention in School and Clinic, 50,
114-120. doi:10.1177/1053451214536045
Ingersoll, R. M. (2001). Teacher turnover and teacher shortages: An organizational analysis.
American Educational Research Journal, 38, 499–534. doi:10.3102/00028312038003499
Ingersoll, R. M. (2012). Beginning teacher induction: What the data tell us. Phi Delta
Kappan, 93(8), 47-51. doi:10.2307/23210373
Ingersoll, R. M., & Strong, M. (2011). The impact of induction and mentoring programs for
beginning teachers: A critical review of the research. Review of Educational
Research, 81, 201-233. doi:10.3102/0034654311403323
Jedidi, K., Jagpal, H., & DeSarbo W. S. (1997). Finite-mixture structural equation models for
response-based segmentation and unobserved heterogeneity. Marketing Science, 16, 39–
59.
Jimenez-Silva, M., Olson, K., & Hernandez, N. J. (2012). The confidence to teach English
language learners: Exploring coursework’s role in developing preservice teachers’
efficacy. The Teacher Educator, 47, 9-28. doi:10.1080/08878730.2011.632471
Jones, E. M., Baek, J. H., & Wyant, J. D. (2017). Exploring pre-service physical education
teacher technology use during student teaching. Journal of Teaching in Physical
Education, 36, 173-184. doi:10.1123/jtpe.2015-0176

118
Judge, T. A., Bono, J. E., Thoresen, C. J., & Patton, G. K. (2001). The job satisfaction-job
performance relationship: A qualitative and quantitative review. Psychological Bulletin,
127, 376-407. doi:10.1037/0033-2909.127.3.376
Kang, S., & Berliner, D. C. (2012). Characteristics of teacher induction programs and turnover
rates of beginning teachers. The Teacher Educator, 47, 268-282.
doi:10.1080/08878730.2012.707758
Kellough, R. D., & Kellough, N. G. (2008). Teaching young adolescents: Methods and resources
for middle grades teaching (5th ed.). Upper Saddle River, NJ: Pearson Merrill Prentice
Hall.
Kirby, S. N. & Grissmer, D. W. (1993). Teacher attrition: Theory, evidence, and suggested
policy options. Santa Monica, CA: Rand Corporation.
Klassen, R. M., & Chiu, M. M. (2010). Effects on teachers' self-efficacy and job satisfaction:
Teacher gender, years of experience, and job stress. Journal of Educational
Psychology, 102, 741-756. doi:10.1037/a0019237
Klassen, R. M., Tze, V. M., Betts, S. M., & Gordon, K. A. (2011). Teacher efficacy research
1998–2009: Signs of progress or unfulfilled promise? Educational Psychology Review,
23, 21-43. doi:10.1007/s10648-010-9141-8
Klusmann, U., Kunter, M., Trautwein, U., Lüdtke, O., & Baumert, J. (2008). Engagement and
emotional exhaustion in teachers: Does the school context make a difference? Applied
Psychology: An International Review, 57, 127-151. doi:10.1111/j.1464-
0597.2008.00358.x
Konanc, M. E. (1996). Teacher attrition 1980-1996. Raleigh, NC: North Carolina State
Department of Public Instruction.
119
Krauss, S., Brunner, M., Kunter, M., Baumert, J., Blum, W., Neubrand, J., & Jordan, A. (2008).
Pedagogical content knowledge and content knowledge of secondary mathematics
teachers. Journal of Educational Psychology, 100, 716-725. doi:10.1037/0022-
0663.100.3.716
Laczko-Kerr, I., & Berliner, D.C. (2002). The effectiveness of "Teach for America" and other
under-certified teachers on student academic achievement: A case of harmful public
policy. Education Policy Analysis Archives, 10(37). Retrieved from
http://epaa.asu.edu/epaa/v10n37
Larose, C., Harel, O., Kordas, K., & Dey, D. K. (2016). Latent class analysis of incomplete data
via an entropy-based criterion. Statistical Methodology, 32, 107-121.
doi:10.1016/j.stamet.2016.04.004
Legters, N., Adams, D. & Williams, P. (2010). Common planning: A linchpin practice in
transforming secondary schools. Herndon, VA: EDJ Associates, Inc. Retrieved from
https://www2.ed.gov/programs/slcp/finalcommon.pdf
Liu, X. S., & Ramsey, J. (2008). Teachers’ job satisfaction: Analyses of the teacher follow-up
survey in the United States for 2000–2001. Teaching and Teacher Education, 24, 1173-
1184. doi:10.1016/j.tate.2006.11.010
Lo, Y., Mendell, N., & Rubin, D. (2001). Testing the number of components in a normal
mixture. Biometrika, 88, 767–778. doi:10.1093/biomet/88.3.767
Locke, E. A. (1976). The nature and causes of job satisfaction. In M. D. Dunnette (Ed.),
Handbook of industrial and organizational psychology (pp. 1297-1349). Chicago, IL:
Rand McNally.

120
Loeb, S., Darling-Hammond, L., & Luczak, J. (2005). How teaching conditions predict teacher
turnover in California schools. Peabody Journal of Education, 80, 44-70.
doi:10.1207/s15327930pje8003_4
Loewenberg Ball, D., Thames, M. H., & Phelps, G. (2008). Content knowledge for teaching:
What makes it special? Journal of Teacher Education, 59, 389-407.
doi:10.1177/0022487108324554
Loucks-Horsley, S., Stiles, K. E., Mundry, S., & Hewson, P. W. (Eds.). (2009). Designing
professional development for teachers of science and mathematics. Thousand Oaks, CA:
Corwin Press.
Lowery, D. C., Roberts, J., & Roberts, J. (2012). Alternate route and traditionally-trained
teachers' perceptions of teaching preparation programs. Journal of Case Studies in
Education, 3, 1-11.
Magidson, J., & Vermunt, J. (2004). Latent class models. In D. Kaplan (Ed.), Handbook of
quantitative methodology for the social sciences (pp. 175–198). Newbury Park, CA:
Sage.
Maloch, B., Flint, A. S., Edridge, D., Harmon, J., Loven, R, Fine, J. C., … Martinez, M. (2003).
Understandings, beliefs, and reported decision making of first-year teachers from
different reading teacher preparation programs. The Elementary School Journal, 103,
431-457. doi:10.1086/499734
McCutcheon, A. C. (1987). Latent class analysis. Beverly Hills, CA: Sage.
McEwin, C. K., & Greene, M. W. (2010). Results and recommendations from the 2009 national
surveys of randomly selected and highly successful middle level schools. Middle School
Journal, 42(1), 49-63. doi:10.1080/00940771.2010.11461750

121
McLachlan, G., & Peel, D. (2000). Finite mixture models. New York, NY: Wiley.
Meijer, C., & Foster, S. (1988). The effect of teacher self-efficacy on referral chance. Journal of
Special Education, 22, 378–385. doi:10.1177/002246698802200309
Meister, D. G., & Melnick, S. A. (2003). National new teacher study: Beginning teachers'
concerns. Action in Teacher Education, 24, 87-94. doi:10.1080/01626620.2003.10463283
Moats, L. C. (1994). The missing foundation in teacher education: Knowledge of the structure
of spoken and written language. Annals of Dyslexia, 44, 81–102.
doi:10.1007/BF02648156
Moats, L. C. (2000). Whole language lives on: The illusion of "balanced' reading instruction .
New York, NY: Thomas B. Fordham Foundation.
Moats, L. C., & Foorman, B. R. (2003). Measuring teachers' content knowledge of language and
reading. Annals of Dyslexia, 53, 23–45. doi:10.1007/s11881-003-0003-7
Moffett, E. T., & Davis, B. L. (2014). The road to teacher certification: Does it matter how you
get there? National Teacher Education Journal, 7(4), 17-26.
Moreau, L. K. (2014). Who’s really struggling?: Middle school teachers’ perceptions of
struggling readers. RMLE Online, 37(10), 1-17.
Muhangi, G. T. (2017). Self-efficacy and job satisfaction as correlates to turnover intentions
among secondary school teachers in Mbarara district. American Scientific Research
Journal for Engineering, Technology, and Sciences (ASRJETS), 27(1), 256-275.
Mulholland, J., & Wallace, J. (2001). Teacher induction and elementary science teaching:
Enhancing self-efficacy. Teaching and Teacher Education, 17, 243-261.
doi:10.1016/S0742-051X(00)00054-8

122
Muthén, B. (2004). Latent variable analysis: Growth mixture modeling and related techniques
for longitudinal data. In D. Kaplan (Ed.), Handbook of quantitative methodology for the
social sciences (pp. 345–368). Newbury Park, CA: Sage.
Muthén, L. K., & Muthén, B. O. (2017). Mplus 8. Los Angeles, CA: Muthen and Muthen.
National Center for Education Statistics. (2004). Who teaches reading in public elementary
schools? The assignments and educational preparation of reading teachers (NCES 2004-
034). Washington, DC: U.S. Department of Education. Retrieved from
https://nces.ed.gov/pubsearch/pubsinfo.asp?pubid=2004034
Nye, B., Konstantopoulos, S., & Hedges, L. V. (2004). How large are teacher effects?
Educational Evaluation and Policy Analysis, 26, 237-257.
Nylund, K., Asparouhov, T., & Muthén, B. O. (2007). Deciding on the number of classes in
latent class analysis and growth mixture modeling: A Monte Carlo simulation study.
Structural Equation Modeling: A Multidisciplinary Journal, 14, 535-569.
doi:10.1080/10705510701575396
Nylund-Gibson, K., & Masyn, K. E. (2016). Covariates and mixture modeling: Results of a
simulation study exploring the impact of misspecified effects on class enumeration.
Structural Equation Modeling: A Multidisciplinary Journal, 23, 782-797.
doi:10.1080/10705511.2016.1221313
Olson, L. (2000). Finding and keeping competent teachers. Education Week, 19(18), 12–18.
Pajares, F. (1997). Current directions in self-efficacy research. In H. W. Marsh, R. G. Craven, &
D. M. McInerney (Eds.), International advances in self research (pp. 1-49). Greenwich,
CT: Information Age.

123
Pajares, F. (2007). Culturalizing educational psychology. In F. Salili & R. Hoosain (Eds.),
Culture, motivation, and learning (pp. 19-42). Charlotte, NC: Information Age.
Palmer, D. H. (2001). Factors contributing to attitude exchange amongst preservice elementary
teachers. Science Education, 86, 122-138. doi:10.1002/sce.10007
Park, S., & Oliver, S. (2008). Revisiting the conceptualization of pedagogical content knowledge
(PCK): PCK as a conceptual tool to understand teachers as professionals. Research
Science Education, 38, 261-284. doi:10.1007/s11165-007-9049-6
Peña-López, I. (2009). Creating effective teaching and learning environments: First results from
TALIS. Paris, France: Organization for Economic Cooperation and Development.
Retrieved from https://www.oecd.org/edu/school/43023606.pdf
Penuel, W. R., Fishman, B. J., Yamaguchi, R., & Gallagher, L. P. (2007). What makes
professional development effective? Strategies that foster curriculum implementation.
American educational research journal, 44, 921-958. doi:10.3102/0002831207308221
Podell, D., & Soodak, L. (1993). Teacher efficacy and bias in special education referrals. Journal
of Educational Research, 86, 247-253.
Posnanski, T. J. (2002). Professional development programs for elementary science teachers: An
analysis of teacher self-efficacy beliefs and a professional development model. Journal of
Science Teacher Education, 13, 189-220.
Qu, Y., & Becker, B. (2003). Does traditional teacher certification imply quality? A meta-
analysis. Paper presented at the annual meeting of the American Educational Research
Association, Chicago, IL.

124
Raudenbush, S., Rowan, B., & Cheong, Y. (1992). Contextual effects on the self-perceived
efficacy of high school teachers. Sociology of Education, 65, 150-167.
doi:10.2307/2112680
Riggs, I., & Enochs, L. (1990). Toward the development of an elementary teacher’s science
teaching efficacy belief instrument. Science Education, 74, 625-638.
doi:10.1002/sce.3730740605
Robardey, C., Allard, D., & Brown, D. (1994). An assessment of the effectiveness of full option
science system training for third- through sixth-grade teachers. Journal of Elementary
Science Education, 6, 17–29. doi:10.1007/BF03170647
Rosenman, R., Tennekoon, V., & Hill, L. G. (2011). Measuring bias in self-reported
data. International Journal of Behavioural and Healthcare Research, 2, 320-332.
doi:10.1504/IJBHR.2011.043414
Ross, J. A. (1994). Beliefs that make a difference: The origins and impacts of teacher efficacy.
Paper presented at the Annual Meeting of the Canadian Association for Curriculum
Studies.
Ross, J. A. (1998). The antecedents and consequences of teach efficacy. In J. Brophy (Ed.),
Advances in research on teaching (vol. 7, pp. 49-74). Greenwich, CT: JAI Press.
Ross, J., & Bruce, C. (2007). Professional development effects on teacher efficacy: Results of
randomized field trial. The Journal of Educational Research, 101, 50-60.
doi:10.3200/JOER.101.1.50-60
Rowan, B., Correnti, R., & Miller, R. J. (2002). What large-scale, survey research tells us about
teacher effects on student achievement: Insights from the prospects study of elementary
schools. Teachers College Record, 104, 1525-1567.

125
Sass, T. R. (2008). Alternative certification and teacher quality. Unpublished manuscript.
Tallahassee, FL: Florida State University. Retrieved from
http://myweb.fsu.edu/tsass/Papers/Alternative Certification and Teacher Quality 04.pdf
Schlechty, P. C., & Vance, V. S. (1981). Do academically able teachers leave education? The
North Carolina case. The Phi Delta Kappan, 63(2), 106-112.
Schmidt, W. H., Tatto, M. T., Bankov, K., Blömeke, S., Cedillo, T., Cogan, L., & Schwille, J.
(2007). The preparation gap: Teacher education for middle school mathematics in six
countries. East Lansing, MI: MSU Center for Research in Mathematics and Science
Education.
Schunk, D. H. (1987). Peer models and children’s behavioral change. Review of Educational
Research, 57, 149-174. doi:10.3102/00346543057002149
Schwartz, G. (1978). Estimating the dimension of a model. The Annals of Statistics, 6, 461–464.
Sclove, L. (1987). Application of model-selection criteria to some problems in multivariate
analysis. Psychometrika, 52, 333–343. doi:10.1007/BF02294360
Scott, C., Stone, B., & Dinham, S. (2001). I love teaching but.... international patterns of teacher
discontent. Education Policy Analysis Archives. Retrieved from: http://epaa.asu.
edu/epaa/v9n28.html
Shulman, L. S. (1986). Those who understand: Knowledge growth in teaching. Educational
Researcher, 15(2), 4-14. doi:10.3102/0013189X015002004
Shulman, L. S. (2005). Teacher education does not exist. Stanford Educator. Retrieved from
http://ed.stanford.edu/suse/ news-bureau/educator/fall2005/EducatorFall05.pdf

126
Siwatu, K. O. (2011). Preservice teachers’ sense of preparedness and self-efficacy to teach in
America’s urban and suburban schools: Does context matter? Teaching and Teacher
Education, 27, 357-365. doi:10.1016/j.tate.2010.09.004
Skaalvik, E. M., & Skaalvik, S. (2009). Does school context matter? Relations with teacher
burnout and job satisfaction. Teaching and Teacher Education, 25, 518-524.
doi:/10.1016/j.tate.2008.12.006
Skaalvik, E. M., & Skaalvik, S. (2010). Teacher self-efficacy and teacher burnout: A study of
relations. Teaching and Teacher Education, 26, 1059-1069.
doi:10.1016/j.tate.2009.11.001
Skaalvik, E. M., & Skaalvik, S. (2011). Teacher job satisfaction and motivation to leave the
teaching profession: Relations with school context, feeling of belonging, and emotional
exhaustion. Teaching and Teacher Education, 27, 1029-1038.
doi:10.1080/10615806.2010.544300
Skaalvik, E. M., & Skaalvik, S. (2014). Teacher self-efficacy and perceived autonomy: Relations
with teacher engagement, job satisfaction, and emotional exhaustion. Psychological
Reports: Employment Psychology & Marketing, 144, 68-77.
doi:10:2466/14.20.PRO.144k14w0
Skinner, E., & Belmont, M. (1993). Motivation in the classroom: Reciprocal effects of teacher
behavior and student engagement across the school year. Journal of Educational
Psychology, 85, 571–581. doi:10.1037/0022-0663.85.4.571
Smith, T. M., & Ingersoll, R. M. (2004). What are the effects of induction and mentoring on
beginning teacher turnover? American Educational Research Journal, 41, 681-714.
doi:10.3102/00028312041003681

127
Soodak, L., & Podell, D. (1993). Teacher efficacy and student problem as factors in special
education referral. Journal of Special Education, 27, 66–81.
doi:10.1177/002246699302700105
Spear-Swerling, L., & Brucker, P. O. (2003). Teachers' acquisition of knowledge about English
word structure. Annals of Dyslexia, 53, 72–103. doi:10.1007/s11881-003-0005-5
Spitler, E. (2011). From resistance to advocacy for math literacy: One teacher's literacy identity
transformation. Journal of Adolescent & Adult Literacy, 55, 306-315.
doi:10.1002/JAAL.00037
Stallions, M., Murrill, L., & Earp, L. (2012). Don’t quit now!: Crisis, reflection, growth, and
renewal for early career teachers. Kappa Delta Pi Record, 48, 123–128.
doi:10.1080/00228958.2012.707504
Steadman, S., & Simmons, J. (2007). The cost of mentoring non-university certified teachers:
Who pays the price? Phi Delta Kappan, 88, 364-367.doi:10.1177/003172170708800507
Taie, S., & Goldring, R. (2017). Characteristics of public elementary and secondary schools in
the United States: Results from the 2015-16 National Teacher and Principal Survey. First
look (NCES 2017-071). Washington, DC: National Center for Education Statistics.
Retrieved from https://nces.ed.gov/pubs2017/2017072.pdf
Tiplic, D., Brandmo, C., & Elstad, E. (2015). Antecedents of Norwegian beginning teachers’
turnover intentions. Cambridge Journal of Education, 45, 451-474.
doi:10.1080/0305764X.2014.987642
Tschannen-Moran, M., & McMaster, P. (2009). Sources of self-efficacy: Four professional
development formats and their relationship to self-efficacy and implementation of a new
teaching strategy. The Elementary School Journal, 110, 228-245. doi:10.1086/605771

128
Tschannen-Moran, M., Hoy, A. W., & Hoy, W. K. (1998). Teacher efficacy: Its meaning and
measure. Review of Educational Research, 68, 202-248.
Tsouloupas, C. N., Carson, R. L., Matthews, R., Grawitch, M. J., & Barber, L. K. (2010).
Exploring the association between teachers’ perceived student misbehaviour and
emotional exhaustion: The importance of teacher efficacy beliefs and emotion
regulation. Educational Psychology, 30, 173-189. doi:10.1080/01443410903494460
Urick, A., & Bowers, A. J. (2014). What are the different types of principals across the United
States? A latent class analysis of principal perception of leadership. Educational
Administration Quarterly, 50, 96-134. doi:10.1177/0013161X13489019
Vermunt, J. K. (2010). Latent class modeling with covariates: Two improved three-step
approaches. Political Analysis, 18, 450-469. doi:10.2307/25792024
Viel-Ruma, K., Houchins, D., Jolivette, K., & Benson, G. (2010). Efficacy beliefs of special
educators: The relationships among collective efficacy, teacher self-efficacy, and job
satisfaction. Teacher Education and Special Education, 33, 225-233.
doi:10.1177/0888406409360129
Viel-Ruma, K., Houchins, D., Jolivette, K., & Benson, G. (2010). The relationships among
collective efficacy, teacher self-efficacy, and job satisfaction. Teacher Education and
Special Education: The Journal of the Teacher Education Division of the Council for
Exceptional Children, 33, 225-233. doi:10.1177/0888406409360129
von Eye, A., & Bogat, G. A. (2006). Methods of data analysis in person-oriented research. The
sample case of ANOVA. In A. Ittel, L. Stecher, H. Merkens, & J. Zinnecker (Eds.),
Jahrbuch Jugendforschung (pp. 161-182). Wiesbaden, Germany: Verlag Für
Sozialwissenschaften.

129
von Eye, A., & Wiedermann, W. (2015). Person-centered analysis. In R. A. Scott and S. M.
Kosslyn (Eds.), Emerging trends in the social and behavioral sciences: An
interdisciplinary, searchable, and linkable resource (pp. 1–18). Hoboken, NJ: John
Wiley & Sons.
Walls, T. A., & Schafer, J. L. (2006). Models for intensive longitudinal data. Oxford, England:
Oxford University Press.
Walsh, K., & Jacobs, S. (2007). Alternative certification isn’t alternative. Washington, DC:
National Center for Teacher Quality.
Warren, L. L., & Muth, K. D. (1995). The impact of common planning time on middle grades
students and teachers. Research in Middle Level Education, 18(3), 41-58.
doi:10.1080/10825541.1995.11670053
Washburn, E. K., Binks-Cantrell, E. S., Joshi, R. M., Martin-Chang, S., & Arrow, A. (2016).
Preservice teacher knowledge of basic language constructs in Canada, England, New
Zealand, and the USA. Annals of Dyslexia, 66, 7-26. doi:10.1007/s11881-015-0115-x
Washburn, E. K., Joshi, R. M., & Binks-Cantrell, E. S. (2011). Are preservice teachers prepared
to teach struggling readers? Annals of Dyslexia, 61, 21–43. doi:10.1007/s11881-010-
0040-y
Wilson, S. M., Floden, R. E., & Ferrini-Mundy, J. (2002). Teacher preparation research: An
insider’s view from the outside. Journal of Teacher Education, 53, 190-204.
doi:10.1177/0022487102053003002
Yang, C. (2006). Evaluating latent class analyses in qualitative phenotype identification.
Computational Statistics & Data Analysis, 50, 1090–1104.
doi:10.1016/j.csda.2004.11.004

130
Yoon, K. S., Duncan, T., Lee, S. W.-Y., Scarloss, B., & Shapley, K. (2007). Reviewing the
evidence on how teacher professional development affects student achievement (Issues &
Answers Report, REL 2007-No. 033). Washington, DC: U.S. Department of Education,
Institute of Education Sciences, National Center for Education Evaluation and Regional
Assistance, Regional Educational Laboratory Southwest. Retrieved from
http://ies.ed.gov/ncee/edlabs/regions/southwest/pdf/REL_2007033.pdf
Zeichner, K. M., & Paige, L. (2007). The current status and possible future for ‘traditional’
college and university-based teacher education programs in the US. In T. L. Good (Ed.),
21st Century Education: A Reference Handbook (pp. 33-42). Thousand Oaks, CA: Sage.
Zhao, J., Joshi, R. M., Dixon, L. Q., & Huang, L. (2016). Chinese EFL teachers’ knowledge of
basic language constructs and their self-perceived teaching abilities. Annals of Dyslexia,
66, 127-146. doi:10.1007/s11881-015-0110-2