
New Institutional Linkages Between Dual Vocational Training ...
Upload
independentCategory
view
0download
0
The geography of transaction linkagesin twelve European case study regions.
Andrew Copus1, Dimitri Skuras2, Marsaili Macleod1, and Morag Mitchell1
Paper to be presented at:The 2003 Congress of the European Regional Science Association,
Jyväskylä, Finland, 27th-30th August 2003
1. Rural Policy Group, Scottish Agricultural College, Craibstone Estate, Bucksburn,Aberdeen, AB21 9YATel +44 1224 711246 Fax +44 1224 711270 email [email protected]
2. Department of Economics, University of Patras,University Campus – Rio 26500, PO Box 1391 Patras Greece
Abstract
The paper begins with a discussion of the role of business linkages in regional economic performance.Business linkages are the “nervous system” of the local economy, and provide an important means forlocal businesses to access knowledge and information of various kinds, and hence the innovation whichlargely determines economic performance.
The second section presents some results of survey work, carried out in twelve regions across the EU,which focuses upon the geography of transaction linkages. Perhaps not surprisingly, the scale of bothupstream and downstream linkages is very much determined by the sectoral characteristics of thebusiness. More interestingly, they are also affected by to some extent by the characteristics of theregion (in core-periphery terms), the size of the firm, its locational “history”, and the level of humanand social capital associated with the entrepreneur.
The paper concludes with a summary of the findings and some observations about policy implicationsand potential future work.
The research on which this paper is based forms part of the AsPIRE (AspatialPeripherality Innovation and the Rural Economy) project, which is funded by the EUFifth Framework (LIFE) Programme (Contract No QLK5-2000-00783). The researchpartnership comprises the Scottish Agricultural College, TEAGASC (Dublin), NationalUniversity of Ireland, Galway, University of Valencia, University of Patras, University ofDortmund, and the University of Helsinki.

2
I N T R O D U C T I O N
It has long been recognised that regional economic performance is closely related tolevels of innovation among the business population Both Marshall (1930) andSchumpeter (1934) have been credited as early proponents of this view. More recentlyinnovation has been reinterpreted as an incremental, endogenous, group activity(North and Smallbone 2000, Asheim 1999). Its success depends not solely ontechnology transfer arrangements, or the presence of “innovators”, but upon thecharacteristics of the entire local economy; the various actors, the relationshipsbetween them, and the environment within which they operate. Business networksthus form a major source of the information upon which innovation depends. Theimportance of linkages and networks is implicit in the literature on clusters, industrialdistricts, and innovation systems (Piore and Sable 1984, EU Commission 1995,Belussi 1996, Maillat 1998), and more recently they have become a specific focus forresearch in their own right (Perry 1999, Huggins 2000, Lechner and Dowling 2002).
One aspect of business linkages which is probably very important, but about whichwe at present know very little is their geography. A better understanding of the spatialmanifestations of business networks, and how they vary in different environments,across the spectrum of industrial activity, and according to the characteristics of firmsand entrepreneurs may be one of the keys to understanding processes ofdifferentiation between regions in terms of economic performance.
This paper presents findings, relating to the geography of business networks, of partof an EU Fifth Framework project entitled Aspatial Peripherality, Innovation and theRural Economy, (AsPIRE). In terms of data collection methodology the authorsacknowledge their debt to Paul Courtney and Andrew Errington (Errington andCourtney 2000).
T H E A S P I R E P R O J E C T
(i) The basic hypothesis
The AsPIRE project involves researchers in Scotland, Greece, Germany, Spain,Ireland and Finland. Its main focus is upon the way in which soft factors, such asbusiness network characteristics, social capital, human capital (especially in relationto the exploitation of information technology), and institutional thickness canameliorate the disadvantages of peripheral location. These issues are increasinglypertinent in a world where regional policies seem to have yielded infrastructuralimprovements (particularly transport and communications) contributing to thereduction of absolute time/cost disadvantages of peripheral regions, withoutnecessarily bringing equivalent benefits in relative competitiveness. The wellestablished academic emphasis on endogenous development processes and the contentof recent economic development strategies in peripheral regions is evidence that theneed to address local “soft” factors is already widely recognised as a response todifferential performance in the periphery. AsPIRE is exploring these issues through aset of comparative regional case studies, and in terms of four themes: businessnetworks and innovation, social capital, governance, and the role of InformationSociety Technology (IST). Each of the regions is benchmarked against an indicator of

3
“conventional” (spatial) peripherality. Amongst the final outputs of the project will bea better and more systematic understanding of the way in which soft factors interactwith conventional locational disadvantage. This should enable the project team todevise more appropriate indicators whereby “softer” aspects of a regional economicenvironment may be assessed, and appropriate policy responses devised.
This paper is based upon analysis of data collected for the Business Networks themeof AsPIRE.
(ii) Case Study Areas
Each AsPIRE project partner selected two case study regions, one of which wasperceived to be relatively peripheral, yet presenting a relatively dynamic andprosperous economy, the other more accessible but with a lagging economy. Theseregions are shown in Figure 1.
Mid West
SE
E Ayrshire
Shetland
Bitburg-Prumm
Rottal-Inn
Satakunta
Evrytania
Achaia
L'Alcoia
Camp de Morvedre
Keski-Suomi
Figure 1: AsPIRE Case Study Areas
4
(iii) The Business linkages Dataset
As part of the Business Networks theme the AsPIRE team carried out a survey of 600businesses, (50 in each case study region). Within each study area the sampling targetwas 25 manufacturing firms, and 25 service firms, with a distribution of firm sizesbroadly reflecting the size distribution of the region. A sub-sample of 120 firms wereasked further specific questions relating to the location of their ten most importantsuppliers and customers. This supplementary database has been linked to the mainbusiness survey database, allowing analysis according to various firm characteristics,such as business sector, age, size, the human capital of the entrepreneur and so on.
In the main business survey two questions formed the basis of the following analysis.These simply asked about the percentage of material inputs and sales which derivedfrom or went to: (a) the same (NUTS 3) region, (b) the same member state, (c) otherEU member states, and (d) outside the EU. The supplementary questionnaire askedfor information about up to ten of the firm’s suppliers and up to ten of its customers.For each of these a precise location (in terms of post code or settlement name) and thepercentage of total inputs or sales value, were requested.
R E S U L T S
(i) Comparison of Member States
(a) Sources of Material Inputs
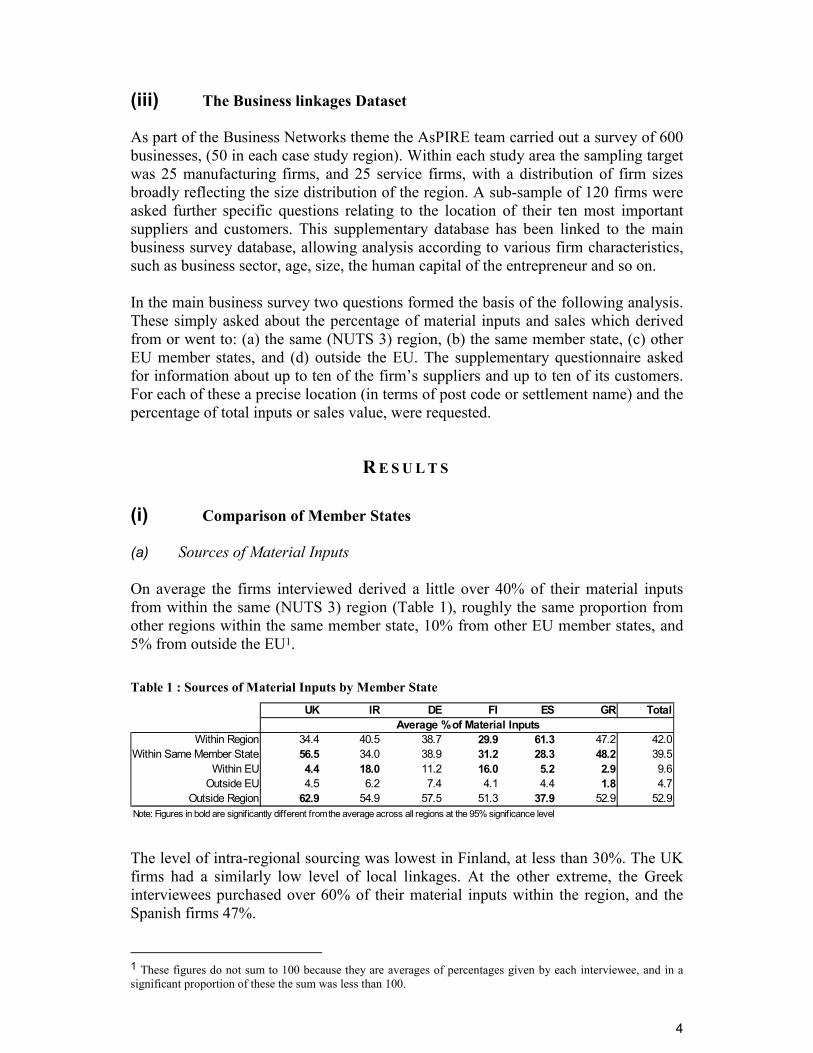
On average the firms interviewed derived a little over 40% of their material inputsfrom within the same (NUTS 3) region (Table 1), roughly the same proportion fromother regions within the same member state, 10% from other EU member states, and5% from outside the EU1.
Table 1 : Sources of Material Inputs by Member State
UK IR DE FI ES GR Total
Within Region 34.4 40.5 38.7 29.9 61.3 47.2 42.0Within Same Member State 56.5 34.0 38.9 31.2 28.3 48.2 39.5
Within EU 4.4 18.0 11.2 16.0 5.2 2.9 9.6Outside EU 4.5 6.2 7.4 4.1 4.4 1.8 4.7
Outside Region 62.9 54.9 57.5 51.3 37.9 52.9 52.9Note: Figures in bold are significantly different from the average across all regions at the 95% significance level
Average % of Material Inputs
The level of intra-regional sourcing was lowest in Finland, at less than 30%. The UKfirms had a similarly low level of local linkages. At the other extreme, the Greekinterviewees purchased over 60% of their material inputs within the region, and theSpanish firms 47%.
1 These figures do not sum to 100 because they are averages of percentages given by each interviewee, and in asignificant proportion of these the sum was less than 100.

5
The pattern of extra-regional purchasing is not easy to interpret. The Greek and UKfirms bought roughly half their inputs from other regions within the same memberstate, whilst in Ireland and Finland trade within the EU was relatively important. ExtraEU sources were relatively important in the Irish and German samples.
Overall, there seem to be two subgroups within the six countries involved in thesurvey (Table 2). Within the Northern group (UK, IE, DE and FI) sourcing within themember state dominated the pattern, with intra-regional sourcing apparently lessimportant. In the Southern group (ES GR) this pattern was reversed. The Northerngroup also seem to bring in more inputs from other member states, and from outsidethe EU, than the Southern group.
Table 2: Sources of Material Inputs, Northern and Southern Member StatesTotal
Within Region 35.8 54.1 42.0Within Same Member State 40.1 38.3 39.5
Within EU 12.4 4.0 9.6Outside EU 5.5 3.1 4.7
Outside Region 56.6 45.4 52.9Note: Figures in bold are significantly different from the average across all regions at the 95% signif icance level
Average % of Material Inputs
Northern Member States
Southern Member States
From the smaller (sub-sample) survey results (Table 3) it can be seen that the averagedistance to suppliers was about 640 kilometres, and the average distance to the mostimportant supplier was a little greater at about 740 km. The greatest mean distance(over 1,200km) was found in the Irish sample, and reflects the strong transatlanticlinks of the case study areas there. Longer linkages are also characteristic of the othercase study areas within the “Northern Periphery”, (UK and FI). The Spanish andGreek samples are by way of contrast characterised by relatively short supplierlinkages. The German study areas, being relatively close to major industrial areas,also displayed short input linkages.
Table 3: Supply Linkage Lengths by Member State
Mean Distance to
Supplier (Km)
Mean Distance to Most Important
Supplier (Km)UK 633 803IE 1,228 1,662DE 527 744FI 822 712ES 520 602GR 316 38All 637 740
(b) Destination of Sales
The overall average percentage of sales within the case study regions was found to be44%, whilst 39% went to other regions within the same member state (Table 4). Othermember states and countries outside the EU received 10% and 5% of sales

6
respectively. Thus the overall pattern of sales linkages is quite similar to that forinputs.Table 4: Sales destinations, by member state
UK IR DE FI ES GR Total
Within Region 38.8 25.5 35.4 36.9 52.2 73.7 43.8Within Same Member State 43.2 42.3 46.2 48.5 32.4 24.0 39.4
Within EU 7.7 23.9 13.8 4.4 12.9 1.3 10.6Outside EU 10.4 9.7 3.6 2.2 1.6 0.4 4.6
Outside Region 60.7 75.9 63.5 55.0 46.6 25.7 54.5Note: Figures in bold are significantly different from the average across all regions at the 95% significance level
Average % of Sales
Again the Southern member state study regions seem to be more “self contained” thanthose in the North. The firms interviewed in Greece and Spain sold over 60% of theirproducts within the same region, and only 36% outside the region (Table 5). In theNorthern study areas roughly one-third of sales went to the local region, whilst, 45%went to other regions within the same member state, and about 20% to othercountries. The Irish firms were notable for their low level of intra-regional sales, andtheir high level of exporting (Table 4).
Table 5: Destinations of sales, Northern and Southern member states
Total
Within Region 34.1 63.1 43.8Within Same Member State 45.1 28.2 39.4
Within EU 12.4 7.1 10.6Outside EU 6.4 1.0 4.6
Outside Region 63.8 36.1 54.5Note: Figures in bold are significantly different from the average across all regions at the 95% significance level
Average % of Sales
Northern Member States Southern Member States
The pattern of sales linkage length was similar to that of input linkages, although thedistances were relatively longer. The mean distance to all customers was 700km. Thatto the most important customer was shorter, at about 470km. The Greek firms seemespecially localised in their reach, whilst the Spanish average occupies anintermediate position. By contrast the Northern Periphery countries displayed thelongest linkages (the averages for the UK and Ireland being boosted by a few firmswith global interests).
Table 6: Sales linkage length by Member State
Mean Distance to Customer
(Km)
Mean Distance to Most Important Customer (Km)
UK 1,655 874IE 1,246 1,000DE 750 220FI 301 174ES 522 524GR 67 5All 700 468
7
(ii) The geography of Linkages and Innovation
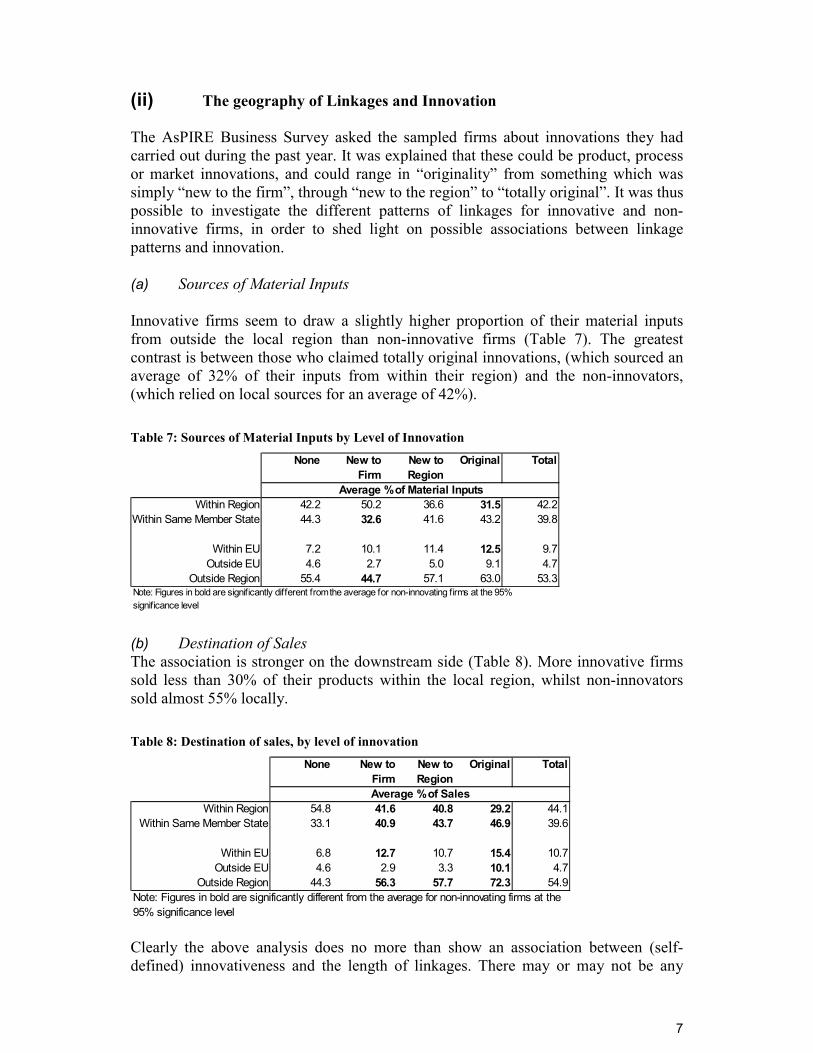
The AsPIRE Business Survey asked the sampled firms about innovations they hadcarried out during the past year. It was explained that these could be product, processor market innovations, and could range in “originality” from something which wassimply “new to the firm”, through “new to the region” to “totally original”. It was thuspossible to investigate the different patterns of linkages for innovative and non-innovative firms, in order to shed light on possible associations between linkagepatterns and innovation.
(a) Sources of Material Inputs
Innovative firms seem to draw a slightly higher proportion of their material inputsfrom outside the local region than non-innovative firms (Table 7). The greatestcontrast is between those who claimed totally original innovations, (which sourced anaverage of 32% of their inputs from within their region) and the non-innovators,(which relied on local sources for an average of 42%).
Table 7: Sources of Material Inputs by Level of Innovation
None New to Firm
New to Region
Original Total
Within Region 42.2 50.2 36.6 31.5 42.2Within Same Member State 44.3 32.6 41.6 43.2 39.8
Within EU 7.2 10.1 11.4 12.5 9.7Outside EU 4.6 2.7 5.0 9.1 4.7
Outside Region 55.4 44.7 57.1 63.0 53.3Note: Figures in bold are significantly different from the average for non-innovating firms at the 95% significance level
Average % of Material Inputs
(b) Destination of SalesThe association is stronger on the downstream side (Table 8). More innovative firmssold less than 30% of their products within the local region, whilst non-innovatorssold almost 55% locally.
Table 8: Destination of sales, by level of innovation
None New to Firm
New to Region
Original Total
Within Region 54.8 41.6 40.8 29.2 44.1Within Same Member State 33.1 40.9 43.7 46.9 39.6
Within EU 6.8 12.7 10.7 15.4 10.7Outside EU 4.6 2.9 3.3 10.1 4.7
Outside Region 44.3 56.3 57.7 72.3 54.9
Average % of Sales
Note: Figures in bold are significantly different from the average for non-innovating firms at the 95% significance level
Clearly the above analysis does no more than show an association between (self-defined) innovativeness and the length of linkages. There may or may not be any

8
causal relationship. Two possibilities suggest themselves: (a) It is possible that longerlinkages provide contacts which act as channels for “exotic” market or technicalinformation which stimulates local innovation. (b) Alternatively the causalrelationship could be the other way around, innovation being associated withspecialised products for which the local demand is limited.
(iii) Comparison of Peripheral and Accessible Regions
The AsPIRE study regions were selected by each research partner on the basis of twocriteria; peripherality and economic performance. The intention was to drawcomparisons (within each member state) between a region which was relativelyperipheral, but which had a dynamic economy (Type A), and a region which althoughrelatively accessible, had a lagging economy (Type B). The selection of the regionswas carried out by the research partner on the basis of a review of statistical andanecdotal evidence.
(a) Sources of Material Inputs
In the northern member state case study areas the dynamic peripheral case study areasseem to have been more “regionally sufficient” in terms of material inputs, whereasthe lagging accessible regions derived slightly higher proportion of inputs fromoutside their borders (Table 9). However the difference is not statistically significantat 95%. In the two southern member states the lagging accessible regions are moredependant on local material inputs, but again the difference is not statisticallysignificant.
Table 9: Sources of material inputs by case study area type
Dynamic Peripheral
Lagging Accessible
Total Dynamic Peripheral
Lagging Accessible
Total
Within Region 38.1 33.4 35.8 48.4 59.8 54.1Within Same Member State 39.5 40.7 40.1 41.5 35.0 38.3
Within EU 11.8 13.1 12.4 5.4 2.7 4.0Outside EU 4.5 6.6 5.5 3.4 2.7 3.1
Outside Region 55.1 58.2 56.6 50.4 40.4 45.4
Northern Member States Southern Member States
Average % of Material Inputs
Note: Figures in bold are significantly different from the average for the N or S groups at the 95% significance level
Average % of Material Inputs
The supplementary (sub-sample) survey of firms allows us to create a “profile” ofmaterial input supply for each type of study region (Figure 2). The curve representingthe average for all firms (in both types of study area) owes its concave shape to theincreasing radius of the zones with increasing distance from the firm’s location (equalradius zones would show a classic distance decay gradient with increasing distance).The graph still clearly illustrates the differences in the profile for each type of casestudy area. Thus firms in both types of study area derived approximately 22% of theirmaterial inputs from within a 50km radius of their location. In the 50-100km zonefirms in the lagging accessible case study areas acquire about 18% of their inputs,whilst those in the dynamic peripheral case study areas derive only about 8%. Firmsin the peripheral study areas tended to derive a higher proportion of their inputs from

9
more than 100 kilometres away. This is a reasonable finding, given the relativesparsity of economic activity further way from the main centres of population.
0
5
10
15
20
25
30
<50 50-100 100-200 200-500 >500
Distance to Supplier (Km)
Per C
ent o
f Sal
esRegion ARegion BTotal
Figure 2: Profile of material input supply, by type of study region
(b) Destination of Sales
On the downstream side the business survey results (Table 10) indicate no significantdifference between the peripheral dynamic and accessible lagging areas in terms ofthe regional pattern of sales.
Table 10: Destination of sales by study area type
Dynamic Peripheral
Lagging Accessible
Total Dynamic Peripheral
Lagging Accessible
Total
Within Region 33.9 34.3 34.1 60.0 66.1 63.1Within Same Member State 43.2 46.9 45.1 30.7 25.6 28.2
Within EU 12.4 12.5 12.4 6.7 7.5 7.1Outside EU 8.7 4.2 6.4 1.7 0.3 1.0
Outside Region 64.0 63.6 63.8 39.1 33.1 36.1
Northern Member States
Average % of Sales
Southern Member States
Note: Figures in bold are significantly different from the average for the N or S groups at the 95% significance level
Average % of Sales
However the profile based upon the supplementary survey suggests that a higherproportion of sales from firms in the dynamic peripheral regions are to customerswithin 50 kilometres of the business location and a lower proportion are in the 50-100and over 200 kilometre zones.
Thus by combining the information on material input and sales linkages a (tentative)picture emerges of peripheral regions which are dependent upon both local and distantinputs, but which serve predominantly regional markets. Firms in the more accessibleareas are more likely to have shorter upstream linkages and longer downstreamlinkages.

10
0
5
10
15
20
25
30
35
<50 50-100 100-200 200-500 >500
Distance to Customer (Km)
Per C
ent o
f Sal
es
Region ARegion BTotal
Figure 3: Sales linkage profile by type of case study region
(iv) Sectoral Effects
Previous work (MLURI et al 2002, Copus 2001) has suggested that the geography ofbusiness linkages is very much affected by the sectoral specialisation of firms. It istherefore important to explore the AsPIRE business survey data in terms of broadcategories of economic activity. The sampling frame excluded primary industries, butensured that manufacturing (including food processing) and services were representedwithin each study area. A preliminary analysis suggested that a tripartition of the data,into food processing, other manufacturing, and services, was appropriate.
(a) Sources of Material Inputs
For fairly obvious reasons, food manufacturing companies are significantly moredependent upon supplies of material inputs from within the same region than the restof manufacturing industry (Table 11). Perhaps less obvious is the explanation of theservice sector’s localised pattern of input linkages. However it should be kept in mindthat the service sector, by definition uses relatively few material inputs.
Table 11: Sources of material inputs, by broad sector
Food Man. Other Man. Services Total
Within Region 48.0 27.6 49.5 41.9Within Same Member State 43.4 45.5 36.5 40.1
Within EU 5.6 18.1 5.5 9.7Outside EU 1.8 7.2 3.6 4.7
Outside Region 50.8 70.6 44.3 53.6
Average % of Material Inputs
Note: Figures in bold are significantly different from the average for "other manufacturing" at the 95% significance level
The same patterns are clearly revealed by the supplementary survey data (Figure 4),which shows that food manufacturing firms obtained, on average, 70% of inputs fromthe zones within 100 kilometres, whilst other manufacturing obtained a average of alittle over 20%, and services a little under 40% from the same area. At the otherextreme, other manufacturing acquired an average of more than 30% from over 500

11
kilometres, whilst both food manufacturing and services received only about 20%from this distance.
05
1015202530354045
<50 50-100 100-200 200-500 >500
Distance to Supplier (Km)
Per C
ent o
f Sal
esFood Manuf.Other Manuf.Services
Figure 4: Material input profile, by broad sector
(b) Destination of Sales
The main feature of the regional pattern of sales is the relatively localised marketingof services, which is not surprising given the ubiquitous, market orientated nature ofthe sector.
Table 12: Destination of sales by broad sector
Food Man. Other Man. Services Total
Within Region 44.3 32.0 50.7 43.9Within Same Member State 43.0 49.0 34.4 39.9
Within EU 10.5 11.4 10.1 10.5Outside EU 2.5 7.0 3.3 4.5
Outside Region 55.9 67.1 47.7 54.8
Average % of Sales
Note: Figures in bold are significantly different from the average for "other manufacturing" at the 95% significance level
The profile of sales linkages revealed by the supplementary survey reveals a localfocus for the food processing sector, over 55% of sales being from within 50kilometres. Other manufacturing firms had much broader horizons, sending over 20%of sales to customers over 500 kilometres away.

12
0
10
20
30
40
50
60
<50 50-100 100-200 200-500 >500
Distance to Customer (Km)
Per C
ent o
f Sal
es
Food Manuf.Other Manuf.Services
Figure 5: Sales linkage profile, by broad sector
(v) The Role of Business Size
(a) Sources of Material Inputs
Larger firms (those which employed more than 50 people), tended to derive a smallerproportion of their inputs from within the same region (under 29% compared with44% for the smallest firms). They also purchased over 17% of their inputs fromoutside their own member state (Table 13).
Table 13: Sources of material inputs by firm size
<20 20-49 50+ Total
Within Region 44.6 38.6 28.7 41.9Within Same Member State 38.6 42.4 43.4 39.6
Within EU 7.9 13.2 17.5 9.6Outside EU 4.5 4.5 6.0 4.7
Outside Region 50.0 59.4 66.3 53.1Note: Figures in bold are significantly different from the average for the <20 size group at the 95% significance level
Employees
Average % of Material Inputs
The other side of the coin; the relative importance of local sources of inputs is clearlyshown by Figure 6. On average over 25% of small firm’s inputs were purchased fromsuppliers within 50 kilometres of the firm’s location.

13
0
5
10
15
20
25
30
<50 50-100 100-200 200-500 >500
Distance to Supplier (Km)
Per C
ent o
f Sal
es
<1010-19.9>20
Figure 6: Profile of input linkages, by firm size
(b) Destination of Sales
The pattern of sales linkages by firm size (Table 14, Figure 7) closely resembles thatfor material inputs, with smaller firms selling a higher proportion of their productslocally, and very little outside their member state or over distances of more than 500kilometres.Table 14: Destinations of sales by size of firm
<20 20-49 50+ Total
Within Region 48.7 35.0 20.9 43.7Within Same Member State 36.8 48.1 48.4 39.5
Within EU 8.8 10.2 22.0 10.7Outside EU 3.8 5.6 9.0 4.6
Outside Region 49.3 63.9 79.4 54.6Note: Figures in bold are significantly different from the average for the <20 size group at the 95% significance level
Employees
Average % of Sales
05
1015202530354045
<50 50-100 100-200 200-500 >500
Distance to Customer (Km)
Per C
ent o
f Sal
es
<1010-19.9>20
Figure 7: Sales linkage profile by size of firm

14
(vi) The Effect of Re-Location
(a) Sources of Material Inputs
Firms which had moved location tended to derive a slightly lower proportion of theirinputs from local sources and a higher proportion from other member states, or fromoutside the EU (although most of these differences were not significant at the 95%level - Table 15). The survey results also suggested that this was most likely amongfirms which re-located between member states, although the numbers involved wererelatively small.
Table 15: Sources of material input by migration statusNon-
migrantMigrant Total
Within Region 43.4 37.1 42.3Within Same Member State 39.8 39.4 39.8
Within EU 8.2 16.4 9.7Outside EU 4.5 5.6 4.7
Outside Region 51.7 60.1 53.3
Average % of Material Inputs
Note: Figures in bold are signif icantly dif ferent from the average for non-migrant f irms at the 95% significance level
(b) Destination of Sales Migration seems to have less impact on the geography of sales linkages, the regionaldistribution of sales being very similar in both migrant and non-migrant groups (Table16).
Table 16: Destinations of sales by migration statusNon-
migrantMigrant Total
Within Region 44.1 43.5 44.0Within Same Member State 39.5 41.0 39.8
Within EU 11.2 8.8 10.7Outside EU 4.8 3.8 4.6
Outside Region 55.3 53.5 55.0
Average % of Sales
Note: Figures in bold are signif icantly dif ferent from the average for non-migrant f irms at the 95% significance level
(vii) The Role of Human Capital
(a) Sources of Material Inputs
One of the most important elements of human capital in relation to the performance ofSMEs is the level of education of the entrepreneur. The results of the AsPIREbusiness survey suggest that the level it also has an impact upon the geography ofmaterial input linkages (Table 17). Firms whose entrepreneurs had secondary or post-secondary education were much more likely to draw on inputs from outside theirregion.

15
Table 17: Material inputs by education level of the entrepreneur
Primary Secondary Post-Secondary
Total
Within Region 55.6 43.3 38.6 41.9
Within Same Member State 27.8 43.1 41.9 40.6Within EU 6.5 8.0 11.1 9.7
Outside EU 2.6 3.5 5.1 4.3Outside Region 36.8 53.4 57.0 53.7
Average % of Material Inputs
Note: Figures in bold are significantly different from the average for firms whose manager had no post-primary education at the 95% significance level
Data from the supplementary survey shows that firms whose entrepreneurs had highercumulative scores on a number of human capital attributes (previous entrepreneurialexperience, involvement in representative bodies or local politics and so on), were onaverage much less reliant upon local sources of inputs.
0
5
10
15
20
25
30
35
<50 50-100 100-200 200-500 >500
Distance to Supplier (Km)
Per C
ent o
f Sal
es
LowMediumHigh
Figure 8: Profile of material input linkages by cumulative human capital score
(b) Destination of Sales
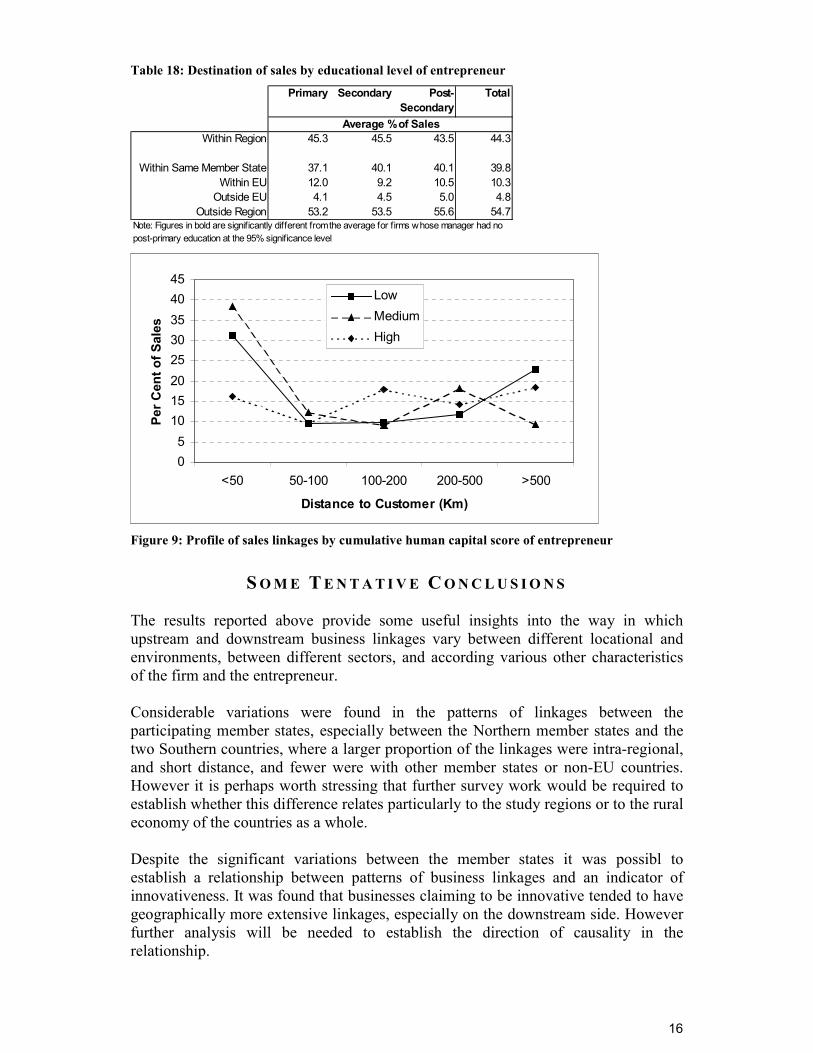
Strangely the relationship between education level and the geography of linkages doesnot seem to hold good with regard to sales (Table 18), and the relationship withcumulative human capital score is not as clear-cut (Figure 9).
16
Table 18: Destination of sales by educational level of entrepreneur
Primary Secondary Post-Secondary
Total
Within Region 45.3 45.5 43.5 44.3
Within Same Member State 37.1 40.1 40.1 39.8Within EU 12.0 9.2 10.5 10.3
Outside EU 4.1 4.5 5.0 4.8Outside Region 53.2 53.5 55.6 54.7
Average % of Sales
Note: Figures in bold are significantly different from the average for firms whose manager had no post-primary education at the 95% significance level
05
1015202530354045
<50 50-100 100-200 200-500 >500
Distance to Customer (Km)
Per C
ent o
f Sal
es
LowMediumHigh
Figure 9: Profile of sales linkages by cumulative human capital score of entrepreneur
S O M E T E N T A T I V E C O N C L U S I O N S
The results reported above provide some useful insights into the way in whichupstream and downstream business linkages vary between different locational andenvironments, between different sectors, and according various other characteristicsof the firm and the entrepreneur.
Considerable variations were found in the patterns of linkages between theparticipating member states, especially between the Northern member states and thetwo Southern countries, where a larger proportion of the linkages were intra-regional,and short distance, and fewer were with other member states or non-EU countries.However it is perhaps worth stressing that further survey work would be required toestablish whether this difference relates particularly to the study regions or to the ruraleconomy of the countries as a whole.
Despite the significant variations between the member states it was possibl toestablish a relationship between patterns of business linkages and an indicator ofinnovativeness. It was found that businesses claiming to be innovative tended to havegeographically more extensive linkages, especially on the downstream side. Howeverfurther analysis will be needed to establish the direction of causality in therelationship.

17
An indication of a relationship between the type of study area and the length oflinkages was suggested by the supplementary survey results. These suggested that thedynamic peripheral areas (Type A) derived more inputs from longer distances than thelagging accessible ones (Type B). On the downstream side the data suggests that theType A areas tend to serve more local markets than Type B regions.
Other characteristics which the data suggests are influential over patterns of materialinput and sales linkages include business sector, business size, locational history, andthe human capital of the entrepreneur. Thus service sector and manufacturingindustries dependent upon perishable or bulky materials and producing perishableproducts (such as food processing) tend to have a smaller “footprint” than othermanufacturing industries. Larger firms (in terms of employment) tend to have moreextensive networks than smaller ones. Firms which have migrated are more likely tohave linkages over longer distances than those which have not. Firms run byentrepreneurs with higher educational attainment and with greater levels of “humancapital” tend to have wider profiles of linkages.
The surveys reported in this paper have collected information on physical, transactionlinkages only. It is accepted that there are many indications in the literature that non-market or “soft” linkages are equally, if not more important, in terms of providingaccess to the information which fuels innovation and hence economic growth.However such soft linkages are very difficult to observe and quantify directly, andthis study has followed the precedent of other research in assuming that physicallinkages are a good proxy. The practical procedures for assessing the geography ofphysical linkages used within the AsPIRE project can therefore contribute to anexplanation of differential regional economic performance. However the limitationsof the sampling carried out, and the need for a larger survey, with more carefullycontrolled sampling before the conclusions drawn above can be anything more thantentative, is recognised.
In terms of policy implications the findings tend to confirm the validity of a shiftaway from investment in physical infrastructure towards policies which provideinvestment in human and social capital, and which nurture the development ofstronger business networks (both non-market and transactional). More specificallythis would imply provision of training and measures to raise “network awareness”among entrepreneurs. A greater understanding of the constraints relating to thecharacteristics of regions, firms and entrepreneurs will assist in the tailoring of localmeasures and their targeting.

18
References:
Asheim B (1999) Innovation, Social Capital and Regional Clusters: On theImportance of Co-operation, Interactive Learning and Localised Knowledge inLearning Economies, Paper presented at the Regional Studies AssociationInternational Conference Bilbao Sept 18-21
Belussi F (1996) Local Systems, Industrial Districts and Institutional Networks:Towards a New Evolutionary Paradigm of Industrial Economics? European PlanningStudies, Vol 4 No 1 pp 5-22
Copus A K (2001) Comparative Summary of Entrepreneur Survey Results, MILEUX,Northern Periphery Project 3107982/15:
http://www.sac.ac.uk/management/External/projects/Milieux/MILIEUX%20Comparative%20Report%20_entr%20Survey_%20Final%20Version.pdf
Errington, A. and Courtney, P. 2000. Tracing the "economic footprint" of markettowns. A methodological contribution to rural policy analysis. Contributed paperprepared for the Agricultural Economics Society Conference, Manchester 14 - 17,April 2000
EU Commission (1995) Cohesion and the Development Challenge Facing theLagging Regions, Luxembourg
Huggins R (2000) The Business of Networks, Ashgate, Aldershot
Lechner C and Dowling M (2002) Firm networks, external relationships as sources forthe growth and competitiveness of entrepreneurial firms, Entrepreneurship andRegional Development
Macaulay Land Use Research Institute (MLURI), Arkleton Centre for RuralDevelopment Research, and Scottish Agricultural College, (2002) Local EconomicLinkages and the Natural Heritage, a report for Scottish National Heritage andHighlands and Islands Enterprise
Maillat D (1998) Interactions between Urban Systems and Localised ProductiveSystems: An Approach to Endogenous Regional Development in Terms of InnovativeMilieu, European Planning Studies, Vol6 No 2 pp112-131
North D and Smallbone D (2000) Innovative Activity in SMEs and Rural EconomicDevelopment: Some Evidence from England, European Planning Studies, Vol 8 No 1pp87-105
Perry M (1999) Small Firms and Network Economics, Routledge, London
Piore, M. & C. Sabel (1984): The second industrial divide: Possibilities forprosperity. Basic Books, New York.
Copyright © 2022 FDOKUMEN