
The geography of giving: The effect of corporate headquarters on local charities
40
Cornell University ILR School DigitalCommons@ILR CAHRS Working Paper Series Center for Advanced Human Resource Studies (CAHRS) 3-27-2008 The Geography of Giving: The Effect of Corporate Headquarters on Local Charities David Card University of California at Berkeley, [email protected] Kevin F. Hallock Cornell University, [email protected] Enrico Moretti University of California at Berkeley, [email protected] This Article is brought to you for free and open access by the Center for Advanced Human Resource Studies (CAHRS) at DigitalCommons@ILR. It has been accepted for inclusion in CAHRS Working Paper Series by an authorized administrator of DigitalCommons@ILR. For more information, please contact [email protected]. Card, David; Hallock, Kevin F.; and Moretti, Enrico, "The Geography of Giving: The Effect of Corporate Headquarters on Local Charities" (2008). CAHRS Working Paper Series. Paper 488. http://digitalcommons.ilr.cornell.edu/cahrswp/488
-
Upload
independent -
Category
Documents
-
view
1 -
download
0
Transcript of The geography of giving: The effect of corporate headquarters on local charities
Cornell University ILR SchoolDigitalCommons@ILR
CAHRS Working Paper Series Center for Advanced Human Resource Studies(CAHRS)
3-27-2008
The Geography of Giving: The Effect of CorporateHeadquarters on Local CharitiesDavid CardUniversity of California at Berkeley, [email protected]
Kevin F. HallockCornell University, [email protected]
Enrico MorettiUniversity of California at Berkeley, [email protected]
This Article is brought to you for free and open access by the Center for Advanced Human Resource Studies (CAHRS) at DigitalCommons@ILR. Ithas been accepted for inclusion in CAHRS Working Paper Series by an authorized administrator of DigitalCommons@ILR. For more information,please contact [email protected].
Card, David; Hallock, Kevin F.; and Moretti, Enrico, "The Geography of Giving: The Effect of Corporate Headquarters on LocalCharities" (2008). CAHRS Working Paper Series. Paper 488.http://digitalcommons.ilr.cornell.edu/cahrswp/488
W O R K I N G P A P E R S E R I E S
Working Paper 08 – 08
The Geography of Giving: The Effect of Corporate Headquarters on Local Charities
CAHRS at Cornell University 615B Ives Hall Ithaca, NY 14853-3901 USA Tel. 607 255-9358 www.ilr.cornell.edu/CAHRS
David Card Kevin F. Hallock Enrico Moretti
The Geography of Giving CAHRS WP08-08
Cornell University Center for Advanced Human Resource Studies Page 2 of 39
The Geography of Giving: The Effect of Corporate Headquarters
on Local Charities
David Card Department of Economics
University of California at Berkeley 549 Evans Hall, #3880
Berkeley, CA 94720 [email protected]
Kevin F. Hallock
Departments of Labor Economics and HR Studies Cornell University
391 Ives Hall (East) Ithaca, NY 14853 [email protected]
Enrico Moretti
Department of Economics University of California at Berkeley
549 Evans Hall, #3880 Berkeley, CA 94720
March 27, 2008
http://www.ilr.cornell.edu/cahrs
This paper has not undergone formal review or approval of the faculty of the ILR School. It is intended to make results of Center research available to others interested in preliminary form to
encourage discussion and suggestions.
Most (if not all) of the CAHRS Working Papers are available for reading at the Catherwood Library. For information on what’s available link to the Cornell Library Catalog:
http://catalog.library.cornell.edu if you wish.
The Geography of Giving CAHRS WP08-08
Cornell University Center for Advanced Human Resource Studies Page 3 of 39
Abstract
We use data on the locations of the head offices of publicly traded U.S. firms to study
the impact of corporate headquarters on the receipts of local charitable organizations. Cities
like Houston, San Jose, and San Francisco gained significant numbers of corporate
headquarters over the past two decades, while cities like Chicago and Los Angeles lost. Our
analysis suggests that attracting or retaining the headquarters of an average firm yields
approximately $10 million per year in contributions to local non-profits, while the headquarters of
a larger firm (one ranked among the top 1000 in total market value) yields about $25 million per
year. Likewise, we find that each $1000 increase in the market value of the firms
headquartered in a city yields 70 cents or more to local non-profits. Most of the increase in
charitable contributions arises from an effect on the number of highly-compensated individuals
in a city, rather than through direct donations by the corporations themselves.
* We thank John Straub and Abigail Payne for comments on a preliminary draft, and Kevin Stange, Richard Crump, David Walton, and Daniel Hartley for outstanding research assistance. We also thank seminar participants at Cornell, Illinois and Princeton for helpful suggestions. This research was funded in part by a grant from the National Bureau of Economic Research.

The Geography of Giving CAHRS WP08-08
Cornell University Center for Advanced Human Resource Studies Page 4 of 39
The Geography of Giving: The Effect of Corporate Headquarters on Local Charities
Introduction
Much of the vital infrastructure in American cities is provided by charities.1 Colleges and
universities, cultural institutions, and hospitals all rely on charitable donations as a major source
of income. These organizations in turn contribute to the “social capital” of a city, helping to
attract new residents and in many cases defining the package of amenities that people
associate with a city.
In this paper we explore the effects of corporate headquarters on the level of charitable
giving in a city. Corporate executives are often seen as a key resource for local charities,
serving as benefactors and fundraisers and also channeling their companies’ donations to local
causes (Werbel and Carter, 2002). Beginning in the 1980s, however, analysts noted a shift
toward so-called “strategic philanthropy,” in which corporate charity is closely aligned with
overall business objectives (see e.g., Zetlin, 1990, Saiia, Carroll and Buchholz, 2003). In
addition, as more U.S. companies focus internationally, ties to any one “headquarters city” may
have weakened. Whether these trends have lessened the impact of corporate headquarters on
the incomes of local charities is unclear. Indeed, despite the routine attention of the popular
press, there is surprisingly little systematic evidence on how corporate headquarters affect local
non-profit organizations.2
The question of whether corporate headquarters matter to local charities has great
practical significance. Over the past 30 years, state and local governments have assumed
greater responsibility for economic development. They frequently offer substantial subsidies to
1 There is now a vast literature on the economics of charitable giving. See Bremer (1988) and Friedman and McGarvie (2002) for historical overviews of American philanthropy, Himmelstein (1997) for a broad discussion of corporate giving, Andreoni (1990, 1998), Bergstrom, Blume, and Varian (1986), Roberts (1984) and Rose-Ackerman (1996) for theoretical analyses of individual incentives to give and the economic role of non-profits, and Andreoni and Payne (2003) for a recent analysis of the problem of “crowding out” by government funding of charitable organizations. 2There are quite a bit of popular press on charities and corporate giving including some that focus on heaquarters moves. A recent example about Baltimore claims that the loss of corporate headquarters has resulted in lower donations to charities in the city (Smith Hopkins, 2004).

The Geography of Giving CAHRS WP08-08
Cornell University Center for Advanced Human Resource Studies Page 5 of 39
attract corporate headquarters to their jurisdictions (Greenstone and Moretti, 2005). In one well-
publicized recent case, Boeing was granted $50 million (about $100,000 per job) in tax
abatements to move its corporate headquarters to Chicago.3 Subsidies to attract headquarters
are difficult to rationalize based solely on the jobs created.4 Supporters often point to the impact
on local non-profits as a key justification for such packages.
We evaluate these spillover effects using information on the locations of publicly traded
corporations in the US from 1989 to 2002, combined with data on the contributions received by
public charities in 147 larger cities. During this period there was substantial turnover in
headquarters locations, driven by the growth of new firms, mergers and acquisitions, and the
decisions by some companies to relocate (Klier and Testa, 2002). A newly assembled data
base with the exact location of corporate headquarters allows us to measure the impact of
corporate headquarters on charitable contribution flows, while controlling for observable time-
varying factors like population growth and permanent unobserved city factors.
Our empirical analysis uses variation in both the number of headquarters in a city and
the market capitalization of the firms headquartered there. We find that the presence of a
corporate headquarters has a significant effect on local charities. Our estimates suggest that an
additional corporate headquarters is associated with about $10 million per year in additional
public contributions to local non-profits, while the headquarters of top firms – those that are
ranked in the top 1000 in market value at least once in the sample window – yield about $25
million per year. Likewise, each $1000 in combined market value for the firms headquartered in
a city yields 70 cents or more to local non-profits. Comparing different types of charitable
organizations, we find that increases in the market value of locally-based firms lead to higher
contributions for both nationally-oriented charities (such as education and research institutions)
and those with a more local orientation (such as health care and human service providers).
3 The move involved around 500 top level managers but no major production facilities. See McGuire and Garcia-Mila (2002). 4 From a pure efficiency point of view, there are only two possible justifications for these subsidies: (1) agglomeration externalities of some form; and (2) donations to private charities. Hornbeck, Greenstone and Moretti (2007), Greenstone and Moretti (2005), and
The Geography of Giving CAHRS WP08-08
Cornell University Center for Advanced Human Resource Studies Page 6 of 39
When we investigate the dynamics of charitable giving, we find that the effects of lagged
headquarters are larger than the effects of current counts. This is consistent with a lag between
the flow of charitable donations and the establishment of new headquarters (or the closing of
old ones). However, the same pattern does not emerge when corporate presence is measured
by market value of the headquartered firms. Much of the year-to-year variation in this measure
is driven by stock market fluctuations for firms that remain headquartered in a city, rather than
by changes in the numbers of headquarters in a city. Thus, the data suggest a relatively direct
connection between changes in company wealth and charitable contributions.
The main econometric issue confronting the estimation of our models is the possibility of
spurious correlation driven by unobserved time-varying, city-specific factors that affect
charitable contribution rates and are correlated with headquarters or firms’ market value. We
suspect that these biases are more likely to affect the estimation of models based on market
value than models based on the simple headquarters count. But even for the headquarters
count, it is possible that shocks to geographically concentrated industries can lead to a rise or
fall in the number of headquarters in a particular city, and also to changes in the incomes and
charitable contributions of workers who are affiliated with the industry but are not directly
connected to the corporate headquarters. To at least partially address these concerns, we
estimate models that include both current and future counts of headquarters as determinants of
current giving and find only small and statistically insignificant effects of the future variables.
We also present estimates of simple dynamic models that allow us to test for the endogeneity of
corporate location choices. While far from definitive tests, these results lend some support to a
causal interpretation of the correlation between the presence of headquarters and charitable
donations.
Davis and Henderson (2004) discuss the possibility of agglomeration externalities for manufacturing plants. Dye, Garcia-Mila and McGuire (2007) discuss the potential productivity spillovers from headquarters.

The Geography of Giving CAHRS WP08-08
Cornell University Center for Advanced Human Resource Studies Page 7 of 39
We go on to investigate the channels through which corporate headquarters might affect
local charities. The presence of headquarters can raise local contributions because the
companies themselves make donations, or because headquarters employ relatively high-
income people who make personal contributions and enhance local fundraising capacity. We
find that most of the increase in charitable contributions arises from an effect on the number of
highly-compensated individuals in a city, rather than through direct donations by the
corporations.
We conclude our empirical analysis by testing whether the gains to local charities
associated with the presence of corporate headquarters lead to offsetting changes in local
public expenditures.5 In particular, we focus on the impacts of additional headquarters, or
increased market capitalization of headquartered firms, on local government spending on social
services, schools, and hospitals. We find imprecise negative impacts of a rise in the numbers of
headquarters on spending on these three categories of spending. In contrast, increases in the
market capitalization of companies headquartered in a metropolitan area are associated with
significant increases in local government revenues and in most categories of spending. We
suspect that changes in market capitalization of local firms are correlated with the strength of
the local economy, making it difficult to disentangle a reverse crowd-out effect from the direct
revenue effects of local demand shocks.
The paper is organized as follows. Section I reviews the existing literature. Section II
describes our econometric specifications. Section III describes the data, and some preliminary
evidence. The main empirical results are in Section IV. Section V concludes.
5 Most existing studies of the interaction between non-profits and the government (e.g., Roberts, 1984; Bergstrom, Blume, and Varian, 1986) focus on the crowding out of non-profit activity by an exogenous increase in the government supply of services. Becker and Lindsay (1994) present an interesting analysis of “reverse crowd-out”: the impact of private donations on government spending.

The Geography of Giving CAHRS WP08-08
Cornell University Center for Advanced Human Resource Studies Page 8 of 39
I. Background on Corporate Giving and Local Charities
The existing literature on corporate giving has largely focused on the question of why
corporations donate to charity.6 The leading hypothesis is that corporate charity is an activity
pursued by utility-maximizing managers acting as imperfect agents for shareholders (Boatsman
and Gupta, 1996; Helland and Smith, 2006; Bartkus, Morris and Seifert, 2002; Webel and
Carter, 2002; Trost, 2004). The main alternative is that corporate giving is driven by profit-
maximizing concerns (Navarro, 1988; Fry, Keim, and Meiners, 1982). Both views suggest that
corporations will tend to focus much of their overall giving on local charities. Under the agency
hypothesis, CEO’s (and other top managers) presumably receive personal benefits from locally-
directed contributions, including community recognition and perquisites like access to cultural
events.7 Under the profit maximizing hypothesis, local contributions can lead to improved
community relations (e.g. better treatment by local regulatory agencies), and can also directly
affect the corporation’s workforce (e.g., through improved local education or health care
services). For firms that sell a sizeable fraction of their production locally, contributions to local
charities can also work as a form of advertising (as is the case with contributions to public
television and radio, for example).8 It is estimated that there is nearly $14 billion in corporate
charitable giving in the United States each year (Muirhead, 2006).
There are relatively few direct studies of how firms allocate their charitable contributions.
Using interview data for a sample of 229 large companies in 14 cities, McElroy and Siegfried
(1986) estimate that about 70% of corporate donations are targeted to headquarters cities.
Since most companies have a significant share of their overall workforce in the same city as
their headquarters, and firms also tend to contribute to charities in cities where they have plant
6A 1936 IRS ruling allowed corporations to receive a tax deduction for charitable donations of up to 5% of pre-tax earnings. Until a 1953 court ruling in New Jersey, however, the legality of corporate charity was still in dispute, with some states outlawing donations that did not directly benefit the company. See Himmelstein (1997) for more detailed discussion. 7Galaskiewicz (1997) studies donation patterns in Minneapolis-St. Paul, using data from the late 1970s and late 1980s. He focuses on the membership of the CEO and board members of a company in social networks as predictors of the generosity of corporate giving. 8Recent commentators have identified “strategic philanthropy” as an emerging trend in corporate giving (see e.g. Zetlin, 1990; Muirhead, 1999; Porter and Kramer, 2002; Saiia, Carroll and Buchholtz, 2003). This can be interpreted as charitable giving that contributes to profitability.

The Geography of Giving CAHRS WP08-08
Cornell University Center for Advanced Human Resource Studies Page 9 of 39
facilities, this 70% estimate presumably overstates the pure headquarters share.9
Nevertheless, a plausible range of estimates from McElroy and Siegfried (1986)’s study is that
corporations allocate about 50-65% of their charitable contributions to headquarters cities.10
This is similar to the 63% headquarters share estimated by Galaskiewicz (1997) for
corporations located in Minneapolis-St. Paul. In our analysis, due to the constraints of the data,
we focus on coporate headquarters only.
How big are the expected local impacts of a corporate headquarters? Annual
tabulations by the Conference Board for larger companies show average total charitable
contributions on the order of $20 million dollars per year, with about one-third given as direct
cash, and the remainder given as non-cash transfers or donations to corporate foundations.11
Taking only the corporate direct cash donations, and assuming a 60% local share, these
numbers suggest that a headquarters of a larger corporation could be expected to contribute
about $4 million in cash to local charities.12 For smaller firms the averages are presumably
smaller, though the headquarters’ share may be larger.
In addition to the direct contributions made by the corporation, charities in a
headquarters city may benefit from the presence of highly-compensated managers. These
people contribute directly to local charities, and also lend their support and expertise to local
fund-raising efforts. Assuming for example that the top managers in a large corporation have a
combined income (including salary, bonuses, and incentives) of around $250 million and that
their marginal contribution rate to non-religious charities is around 3 percent, the contributions of
top managers would add an additional $7.5 million to the local impact of a large corporate
headquarters. Again, the impact of a headquarters for a smaller company is presumably
9Suppose that a firm allocates a fraction αH of contributions to the headquarters city, and a fraction αP to cities with plant facilities, and that fH of all plant facilities are in the headquarters city. Then the overall share of contributions targeted to headquarters cities is αH + fH αp. 10McElroy and Siegfried (1986) estimate that 90% of all contributions are allocated to headquarters cities or cities where the firm has production facilities. Following the notation of the previous note, this implies that αH + αp = 0.9. Assuming that fH is between 0.2 and 0.5, the pure headquarters share (αH) is between 0.5 and 0.65. 11See Muirhead (2002). 12According to the Conference Board, non-cash contributions are particularly important for pharmaceutical, chemical, and computer and technology firms (Muirhead, 2002, page 10). It is unclear whether non-cash contributions are allocated in the same general way

The Geography of Giving CAHRS WP08-08
Cornell University Center for Advanced Human Resource Studies Page 10 of 39
smaller. This sum will be augmented by any impact of the top managers on the efficacy of fund
raising by local charities, or by positive “spillover” effects on other residents (or out-of-town
contributors). Overall, these calculations suggest that the attraction or retention of corporate
headquarters may have a significant effect on local charities.
II. Methods
To empirically evaluate the effects of corporate headquarters on local charities, we adopt
a simple reduced form approach. Let yct represent the public contributions received by
charitable organizations in city c in year t. We assume that
(1) yct = αc + δt + Xctβ + Hctγ + εct ,
where αc is a city-specific fixed effect, δt is a time effect, Xct is a set of control variables that
reflect changes in the underlying characteristics of the city, and Hct is a measure of the
presence of corporate headquarters in the city in year t. We consider two types of measures of
H. The first is a simple count of the number of corporate headquarters, or the number of
headquarters of large corporations. The second is the market value of the corporations with
headquarters in city c in year t. These alternatives capture somewhat different dimensions of
the “corporate presence” in a city13. The market value measure “weighs” the headquarters of
different firms in proportion to their relative market value. It can also change over time even in
the absence of any entry or exit, depending on the fortunes of local firms. To the extent that
corporate contributions are proportional to firm size, and larger corporations employ
proportionally more highly paid managers at their headquarters, the market value measure may
a relatively good indicator of the corporate presence.14
The main econometric issue confronting the estimation of equation (1) is the possibility
that Hct is correlated with unobserved city-specific factors that affect charitable contribution
as other contributions. It is also unclear how these are recorded by the receiving charities. 13 There are other potential measures of H. The number of employees in the firm is one possibility. This is available, for example, in CompuStat but the variable is not audited and is known to be measured with error. 14Note that other measures of the firm size may be preferable to market value, such as total net revenues or total number of employees. This may be a particular issue during our sample period because some firms with very small net revenues (or even negative revenues) had very high market values at the end of the 1990s.
The Geography of Giving CAHRS WP08-08
Cornell University Center for Advanced Human Resource Studies Page 11 of 39
rates. For example, trends in the health of the domestic automobile industry will affect
charitable donations in the Detroit metropolitan area not only through the direct charitable
contributions of General Motors and Ford, and their headquarters employees, but also through
the contributions of the many production workers who also live in the area. We suspect that
these biases are more likely to affect the estimation of the market value measure of H than the
simple headquarters count. Even in the latter case, however, shocks to geographically
concentrated industries can lead to a rise or fall in the number of headquarters in a particular
city, and also to changes in the incomes and charitable contributions of workers who are
affiliated with the industry but are not directly connected to the corporate headquarters.
It is also possible that corporations are attracted to (or emerge from) certain cities with
particularly successful local charities. For example, over the past decades a number of high-
tech businesses have grown up around major research universities.15 These institutions are
also major recipients of corporate and non-corporate donations. This “reverse causality” may
lead to an upward bias in OLS estimates of the parameter γ in equation (1).
To partially address these concerns, we present estimates of a simple dynamic version
of equation (1):
(2) yct = αc + δt + θc × t + Xctβ + Hctγ + Hct-1γLag + Hct+1γLead + εct .
This specification adds city-specific linear trends to the basic model, as well as leads and lags
of the headquarters measure. The city-specific trends θc will absorb any unobserved, smoothly
trending factors that affect charitable donations in a city and may also be correlated with H. The
lag term in H is included to reflect the possibility of a time lag between the arrival of new
headquarters in a city (or the growth in the market value of firms headquartered there) and the
flow of contributions to local charities. Finally, the lead term in H is included to test for
endogenous shifts in the corporate presence in a given city. A significantly positive estimate of
the lead coefficient (γLead), for example, can be interpreted as evidence of a “reverse causality”
The Geography of Giving CAHRS WP08-08
Cornell University Center for Advanced Human Resource Studies Page 12 of 39
effect from charities to headquarters, whereas an estimate close to zero is consistent with no
such effect.
III. Data Description
Our empirical analysis combines two different types of data. The first is information on
the locations of corporate headquarters by year. We limit our attention to publicly traded firms,
making it easy to develop estimates of the market value of the firms headquartered in a city.
The second type of data is information on the contributions received by local charitable
organizations.
a. Corporate Locations and Stock Market Valuation
We used the CompactDisclosure data base to retrieve the corporate addresses from the
10-K and 10-Q filings for all active U.S. firms listed on the New York, American, and NASDAQ
exchanges between 1989 and 2002.16 Where possible, we used the May versions of the data
base, which typically record the 4th quarter SEC filings. Thus, our address information generally
pertains to the end of the calendar year. We used a commercial zip code conversion program
(available from zipinfo.com) supplemented with additional hand-coding to successfully map the
5 digit zip codes for each corporate address into a Metropolitan Statistical Area (MSA) or
Primary Metropolitan Statistical Area (PMSA).17 For convenience, in the remainder of this paper
we refer to these as MSA’s or simply as “cities”.
We also retrieved for each corporation listed in the CompactDisclosure data base the
market value of the firm (i.e. the value of all outstanding shares) as of year end, and a CUSIP
identifier which we use to uniquely identify firms. For each year, we ranked all active firms by
their market value and identified the top 1000 firms in the year. We then identified “top firms” as
the set of 2,805 firms that were ever in the top 1000 list in any year between 1989 and 2002. Of
15The computer-related businesses in Silicon Valley are said to have started there because of the presence of Stanford University. 16We include firms listed on the NASDAQ over-the-counter system (the “National Market System”). The 1989 data base includes 5642 firms (657 on the AMS, 1371 on NDQ, 2288 on NMS, and 1326 on NYS). The 2000 data base includes 6506 firms (551 on AMS, 897 on NDQ, 3390 on NMS, and 1668 on NYS). 17Note that large metro areas (like New York) may consist of many PMSAs, whereas smaller areas are assigned to a single MSA. We adopt the convention that PMSAs in the same large area are different “cities”: thus, a corporation that moves its headquarters
The Geography of Giving CAHRS WP08-08
Cornell University Center for Advanced Human Resource Studies Page 13 of 39
these relatively large firms, 524 were continuously active over the entire period.18
Table 1 presents some simple descriptive information on number, market value, and
headquarters locations of the firms in our sample. The first 3 columns pertain to the sample of
“top firms” while the last 3 pertain to all firms listed on the three exchanges. As expected, mean
market values of the top firms are substantially larger than the corresponding values for all
firms. In fact, the top firms account for 85-90% of the total market value of all firms in our
sample. The mean and median market values of the firms in the sample rise substantially over
time, reflecting the run-up in U.S. stock market prices in the 1990s.
The bottom rows of Table 1 show the numbers of headquarters in selected cities in
1989, 1995, and 2002. These cities represent the 15 most important headquarters locations for
the top firms in our sample as of 1989, and accounted for a steady 46% of all top firm
headquarters over the sample period. Their share of all headquarters was smaller (40%) but
also quite stable. Despite the overall stability of the group there is substantial variation between
cities. Los Angeles, for example, experienced a relatively large decline in the number of
headquarters, while San Jose and San Francisco experienced relatively large gains. Dallas and
Houston also experienced a relatively large gain in the number of top headquarters, while New
York and Chicago experienced relatively large losses. Most of the other cities saw a net gain or
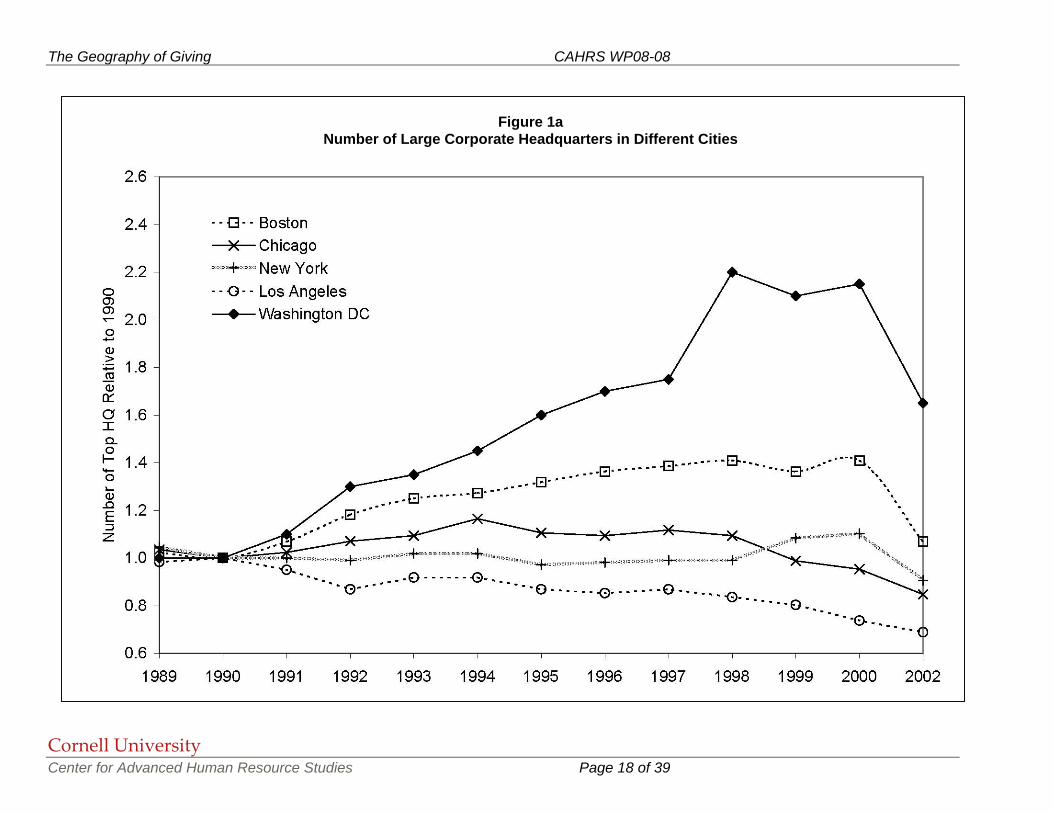
loss of only 1-3 headquarters. Some of these trends are illustrated in Figures 1a and 1b, which
show the relative numbers of large companies headquartered in 10 cities, including two that
were not in the top 15 in 1989 but experienced rapid growth in headquarters over the 1990s:
Washington DC and Seattle.
from Manhattan to Newark NJ would be considered to have moved. 18The vast majority of the remaining firms fall into three classes: those that were active in 1989 and remained continuously active until a “death” sometime before 2002; those that were “born” sometime after 1989 and remained continuously active until 2002; and those that were “born” sometime after 1989 and were continuously active until a death prior to 2002.

The Geography of Giving CAHRS WP08-08
Cornell University Center for Advanced Human Resource Studies Page 14 of 39
b. Charitable Contributions
Our data on charitable contributions are taken from information on 501(c)3 charities
included in the annual samples of charitable organizations compiled by the Internal Revenue
Service and released by the National Center for Charitable Statistics. Contributions to 501(c)3
organizations are tax deductible to the contributor. The samples, known as the “Statistics of
Table 1 Number, Market Value, and Headquarters Locations of Publicly Traded Firms
Top Firms (Ever in Top 1000) All Publicly Traded Firms
1989 1995 2002 1989 1995 2002
Number of Active Firms 1,328 1,595 1,413 5,642 6,353 5,418
Market Value of Firms: (millions, year end)
Mean Value 1,805 2,906 8,257 491 864 2,419
Median Value 624 1,011 2,109 39 96 192
Location of Headquarters: New York 112 104 97 404 364 291Chicago 88 94 72 210 241 187Los Angeles 60 53 42 284 258 180Boston 45 58 47 206 251 225Philadelphia 44 46 43 180 170 158Houston 35 57 48 126 197 157Minneapolis 34 38 35 158 201 145San Jose 34 68 89 128 194 260Atlanta 29 30 30 97 121 125Dallas 28 39 38 148 181 145Stamford 25 33 17 75 71 52Cleveland 22 28 21 70 70 53St. Louis 22 26 19 50 67 56San Francisco 22 34 37 71 106 125Pittsburgh 20 23 16 49 58 51Share of Firms in 15 Cities (%) 47 46 46 40 40 41
Note: list of firms drawn from CompactDisclosure. Headquarters assigned to MSA based on zip code for corporate headquarters. Market value is in current dollars. Market values for 10% of all firms and 1% of top firms are missing. Top firms is list of 2805 firms that were ever ranked in the top 1000 of all firms in a calendar year based on market capitalization in any year from 1989-2002. See text.
The Geography of Giving CAHRS WP08-08
Cornell University Center for Advanced Human Resource Studies Page 15 of 39
Income” sample files, include information for 11,000 to 16,000 organizations per year that filed a
Form-990 tax return.19 Non-profit organizations classified as 501(c)3 by the IRS include most
non-profits in education, health and human services, and the arts, as well as private grant
making organizations, but exclude trade unions, business organizations, social and recreational
clubs, and beneficiary societies.
Each organization included in the sample file reports a variety of income information,
including contributions received from the public, government grants, and other sources of
revenue. Organizations also report a zip code, which we convert to an MSA using the same
procedures we followed for identifying firm headquarters. Samples from 1990 and later include
a sample weight variable which is meant to reflect the sampling probability for the observation.20
Some basic information on the number of charities in the sample and their public
contributions is provided in Table 2. We present the actual (i.e., unweighted) numbers of
charities and their reported public contributions in the 4 left hand columns, and the weighted
analogues in the 4 right hand columns. (All dollar amounts are in constant 2002 $). Note that
the weighted number of organizations is about 10-11 times larger than the unweighted number,
while the weighted sum of all public contributions is only about 1.5 times larger than the
unweighted sum. The difference reflects the fact that small charities are sampled less
frequently.
The entries in the top line of the Table 2 show that the number of 501(c)3 non-profit
organizations in U.S. metropolitan areas grew rapidly over the 1990s, as did public contributions
to these organizations. The next line presents similar data for a subset of 147 larger cities that
we use in our statistical analysis. Cities were included in this sample if they had a minimum of 9
charities reporting from that city in each year between 1990 and 2002, and if the coefficient of
variation of (unweighted) total annual public contributions for organizations in the city over the
19Sample files are also available for 501(c)3 organizations that file a short version of Form 990 (known as Form 990-EZ). We only use the full Form 990 in our analyses. 20The data contain the population of the largest nonprofits and a sample of smaller organizations that have associated sample
The Geography of Giving CAHRS WP08-08
Cornell University Center for Advanced Human Resource Studies Page 16 of 39
same period was less than 0.62. Note that charities in these cities account for 85-90 percent of
charitable organizations in all 335 MSAs, and over 90 percent of public contributions to these
organizations.
The lower rows of Table 2 present comparable data for the 20 cities with the highest
levels of (unweighted) total public contributions in 1990. Most of these cities are among the top
15 headquarters cities shown in Table 1, although Washington DC is an interesting exception.
Washington was not a major headquarters city in 1989 (though it gained a number of
headquarters over the 1990s) but was the number 2 city in terms of public contributions in 1990
and also in 2002. Presumably this reflects the fact that many large national organizations (such
as the Red Cross) are based in Washington.
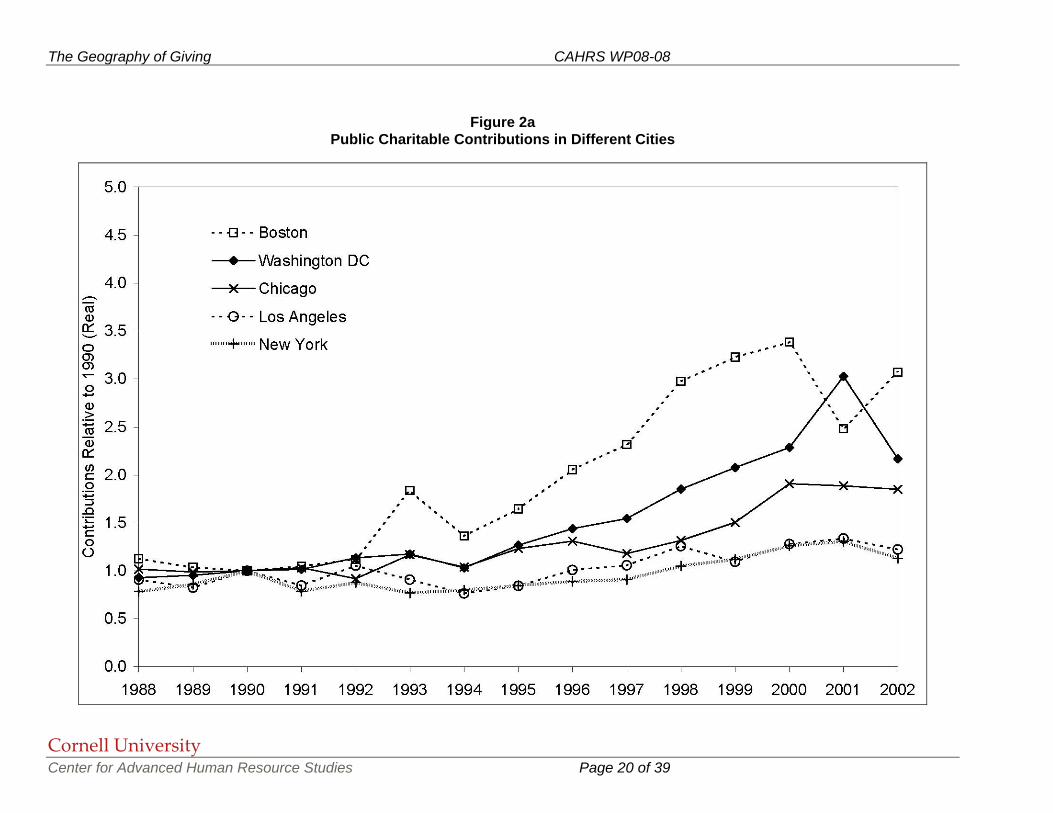
There is considerable variation in the city-specific trends in charitable contributions over
our sample period. Some of these differences are illustrated in Figures 2a and 2b, which show
the trends in (unweighted) contributions received in 10 major cities relative to 1990. Looking at
Figure 2a, for example, it appears that there was much more rapid growth in contributions in
Boston and Washington than in New York or Los Angeles. Interestingly, the same is also true
for the trends in the number of large companies headquartered in these towns (Figure 1a).
We also constructed graphs similar to Figures 2a and 2b using the sample weights to
estimate total contributions in each city. Inspection of these graphs suggested that the
weighted estimates are relatively noisy, reflecting the variation from year to year in the inclusion
of mid-sized charities with relatively large sampling weights.
weights. More details on the sampling scheme can be found at the National Center for Charitable Statistics web-site.

The Geography of Giving CAHRS WP08-08
Cornell University Center for Advanced Human Resource Studies Page 17 of 39
Table 2 Numbers of Charitable Organizations and Public Contributions
Unweighted Weighted Number
Charities Public
Contributions Number Charities
Public Contributions
1990 2002 1990 2002 1990 2002 1990 2002 All Cities 9,582 14,355 36,512 64,902 94,036 163,883 59,587 102,968
147 Sample Cities 8,285 12,339 34,255 59,057 79,113 136,958 54,312 91,756New York 680 932 7,265 8,218 5,239 8,586 10,467 11,415Washington DC 342 640 2,520 5,464 3,237 6,600 3,654 7,898Los Angeles 362 497 2,500 3,056 4,270 5,697 3,388 4,388Chicago 386 533 1,629 3,012 2,827 5,288 2,440 4,555Boston 326 453 1,686 5,175 2,796 4,989 2,222 6,036Atlanta 131 245 1,186 2,090 1,293 2,912 1,534 2,872Seattle 97 155 258 1,212 1,376 1,564 1,445 1,850Philadelphia 329 465 924 1,617 2,428 3,928 1,419 2,480Dallas 110 149 802 986 1,058 1,389 1,250 1,617San Francisco 140 247 597 1,443 1,544 3,352 919 2,169Minneapolis 154 258 558 882 1,657 3,274 918 1,511Providence 67 111 460 606 517 1,196 799 835Baltimore 148 235 551 854 1,146 2,167 798 1,255Cleveland 157 205 539 809 1,635 1,711 788 1,190Pittsburgh 152 232 483 859 1,081 1,778 731 1,816San Jose 55 94 442 925 604 1,234 616 1,306Houston 98 171 439 780 1,098 2,245 588 1,313St Louis 128 163 371 420 996 2,037 522 685Detroit 137 178 329 577 1,206 2,326 511 1,068Raleigh-Durham 63 105 342 1,569 526 1,031 454 1,924Percent of All Cities Totals in: 147 City Sample 86 86 94 91 84 84 91 8920 Main Cities 42 42 65 62 39 39 60 57Note: Based on 501c(3) organizations filing long forms in the IRS Statistics of Income data files. Contributions are in real (2002) millions of dollars. Organizations are assigned to MSA based on zip code for tax filing. See text.
The Geography of Giving CAHRS WP08-08
Cornell University Center for Advanced Human Resource Studies Page 18 of 39
Figure 1a Number of Large Corporate Headquarters in Different Cities

The Geography of Giving CAHRS WP08-08
Cornell University Center for Advanced Human Resource Studies Page 19 of 39
Figure 1b Number of Large Corporate Headquarters in Different Cities
The Geography of Giving CAHRS WP08-08
Cornell University Center for Advanced Human Resource Studies Page 20 of 39
Figure 2a
Public Charitable Contributions in Different Cities

The Geography of Giving CAHRS WP08-08
Cornell University Center for Advanced Human Resource Studies Page 21 of 39
Figure 2b Public Charitable Contributions in Different Cities
The Geography of Giving CAHRS WP08-08
Cornell University Center for Advanced Human Resource Studies Page 22 of 39
IV. Estimation Results
In this section we present the main empirical results of the paper. We begin in the first
subsection presenting models that relate long-run changes in charitable giving to long run
changes in the presence of headquarters in an area. In the second subsection, we focus on
year-to-year variation in charitable giving and in headquarter presence. In the third subsection,
we seek to distinguish between two possible mechanisms that may generate a link between
charitable giving and headquarter presence in a city. Finally, in the last subsection, we ask
whether charitable giving related to headquarters displaces public expenditures.
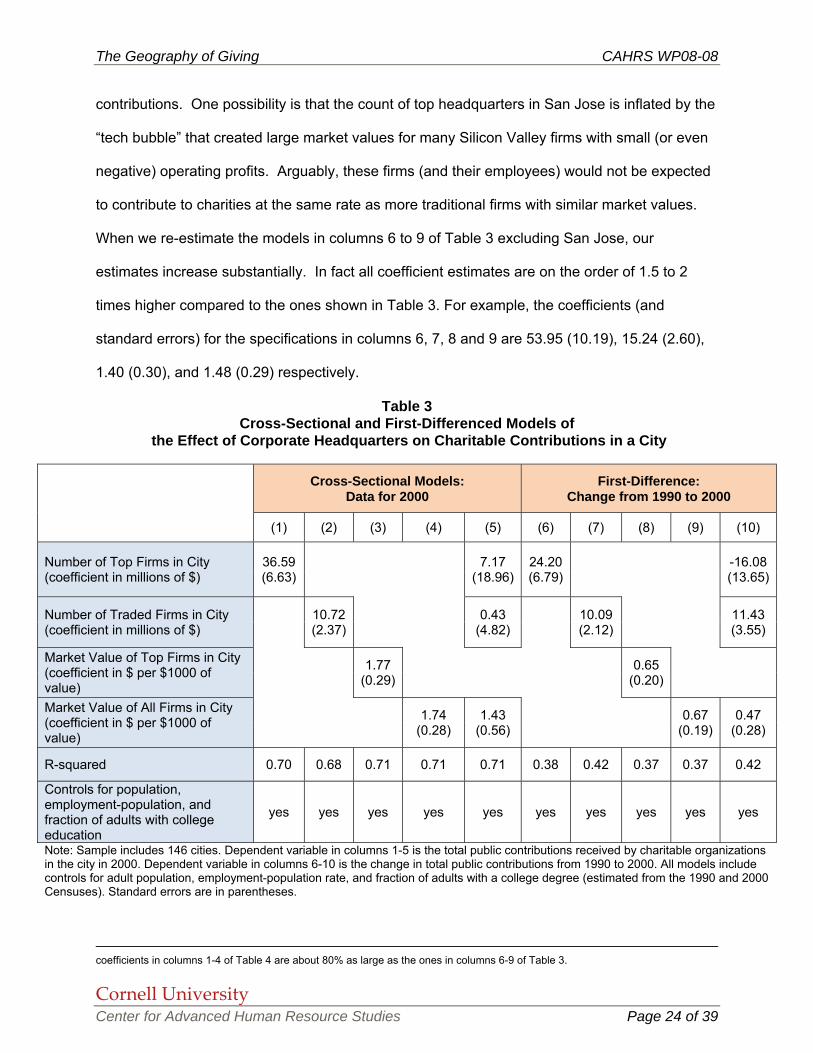
a. Models for 1990 and 2000
Table 3 presents a series of regression models based on equation (1) in which the
dependent variable is the weighted sum of charitable contributions to 501(c)3 organizations in
the year 2000 for each of the 147 cities included in our estimation sample, or the change in
contributions between 1990 and 2000. Use of data for these two years has the advantage that
information on the characteristics of each city can be obtained from the Decennial Censuses.
The different models use different measures of corporate headquarters: the number of top firms
headquartered in the city (columns 1 and 6); the number of all firms headquartered in the city
(columns 2 and 7); the market value of top firms in the city (columns 3 and 8); and the market
value of all firms headquartered in the city (columns 4 and 9). We also present one
specification with three of these four measures (columns 5 and 10). All the models include 3
key control variables: the adult population of the city; the employment-population rate (for 16-59
year olds) in the city; and the fraction of adults with a college degree or higher.
The estimates point to a number of interesting conclusions. First, the estimated
headquarters effects are positive and highly statistically significant in all of the models that
include only a single headquarters measure. Second, as might be expected if there are
unobserved differences that affect both charitable contributions and the probability of being a
headquarters city, the estimated headquarters effects tend to be larger in the cross-sectional
The Geography of Giving CAHRS WP08-08
Cornell University Center for Advanced Human Resource Studies Page 23 of 39
models than in the first-differenced models. Third, the impact of an additional headquarters for
a top firm – $25 million in the first-differenced model in column 6 -- is about 2.5 times larger than
the impact of an additional headquarters for any firm– $10 million in the first-differenced model
in column 7. Interestingly, the $25 million impact is much larger than our rough calculation of
the likely size of direct corporate donations by a large firm headquartered in a city ($4 million),
and suggests an important effect from the employees of the company. Fourth, the impacts of
the market value of top firms and all firms headquartered in a city are very similar. This
comparison suggests that the local contributions arising from the presence of a corporate
headquarters are roughly proportional to the market value of the company.21 Finally, the
specification in column 10 suggests that our sample lacks the power to separately identify the
effects of the number of headquarters and the market value of firms headquartered in a city.
Given the apparent noisiness of the weighted contribution totals for different cities, we
re-estimated the first differenced models using unweighted contribution totals. The results are
reported in the first four columns of Table 4. As would be expected, the coefficient estimates
obtained using the unweighted contributions are smaller, but their general patterns are very
similar to those obtained from the weighted data.22
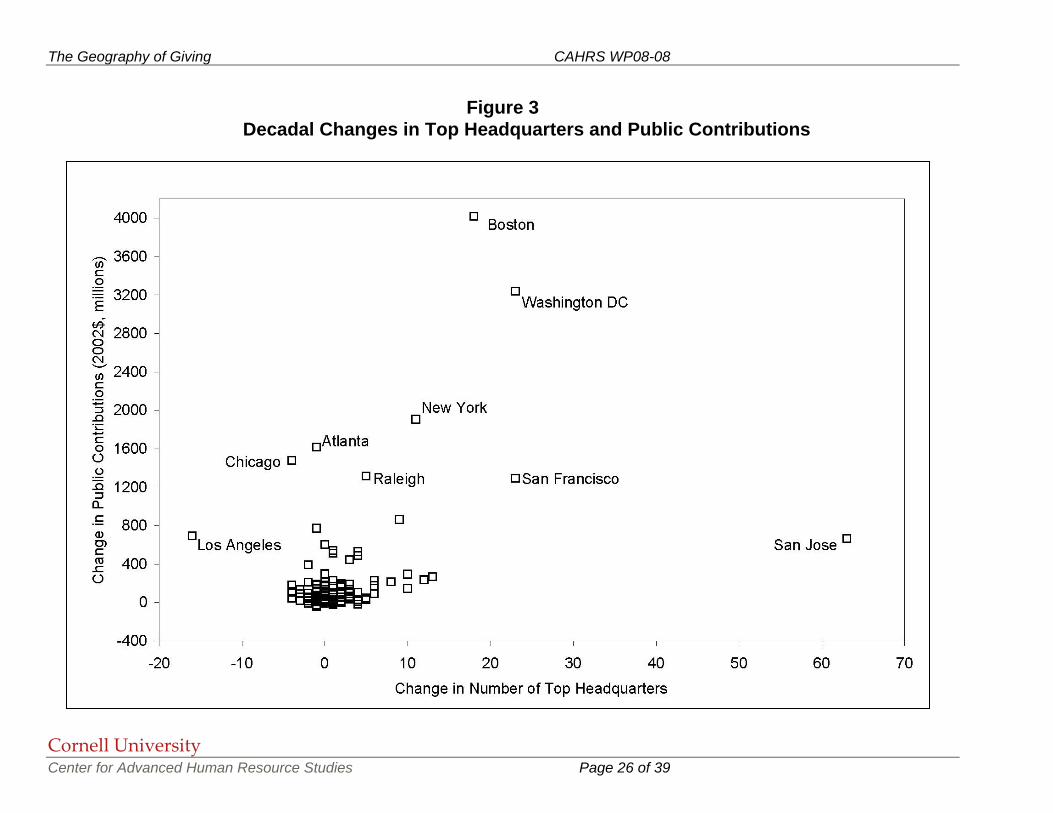
The relationship between the change in the number of large corporations headquartered
in a city and the change in public contributions received by the charities in those cities is
illustrated in Figure 3. Each of the 147 cities in our estimation sample is shown by an open
square. For reference, we have labeled some of the most interesting cities. Consistent with the
regression results in Tables 3 and 4, the graph suggests a relatively strong positive relationship
between changes in the number of headquarters and growth in charitable contributions. The
city of San Jose is an interesting “outlier”. This city experienced a very rapid growth in the
concentration of large headquarters, but not particularly strong growth in charitable
21 This finding also reflects the fact that top firms account for 85-90% of the value of all firms. 22 If the unweighted contributions represent about 65 percent of the total contributions, then one would expect the coefficients from the models fit to the unweighted data to be about 65 percent as large as the coefficients for the models fit to the weighted data. The
The Geography of Giving CAHRS WP08-08
Cornell University Center for Advanced Human Resource Studies Page 24 of 39
contributions. One possibility is that the count of top headquarters in San Jose is inflated by the
“tech bubble” that created large market values for many Silicon Valley firms with small (or even
negative) operating profits. Arguably, these firms (and their employees) would not be expected
to contribute to charities at the same rate as more traditional firms with similar market values.
When we re-estimate the models in columns 6 to 9 of Table 3 excluding San Jose, our
estimates increase substantially. In fact all coefficient estimates are on the order of 1.5 to 2
times higher compared to the ones shown in Table 3. For example, the coefficients (and
standard errors) for the specifications in columns 6, 7, 8 and 9 are 53.95 (10.19), 15.24 (2.60),
1.40 (0.30), and 1.48 (0.29) respectively.
Table 3 Cross-Sectional and First-Differenced Models of
the Effect of Corporate Headquarters on Charitable Contributions in a City
Cross-Sectional Models: Data for 2000
First-Difference: Change from 1990 to 2000
(1) (2) (3) (4) (5) (6) (7) (8) (9) (10)
Number of Top Firms in City (coefficient in millions of $)
36.59 (6.63)
7.17 (18.96)
24.20 (6.79)
-16.08 (13.65)
Number of Traded Firms in City (coefficient in millions of $)
10.72 (2.37)
0.43 (4.82)
10.09 (2.12)
11.43 (3.55)
Market Value of Top Firms in City (coefficient in $ per $1000 of value)
1.77 (0.29)
0.65 (0.20)
Market Value of All Firms in City (coefficient in $ per $1000 of value)
1.74 (0.28)
1.43 (0.56)
0.67 (0.19)
0.47 (0.28)
R-squared 0.70 0.68 0.71 0.71 0.71 0.38 0.42 0.37 0.37 0.42
Controls for population, employment-population, and fraction of adults with college education
yes yes yes yes yes yes yes yes yes yes
Note: Sample includes 146 cities. Dependent variable in columns 1-5 is the total public contributions received by charitable organizations in the city in 2000. Dependent variable in columns 6-10 is the change in total public contributions from 1990 to 2000. All models include controls for adult population, employment-population rate, and fraction of adults with a college degree (estimated from the 1990 and 2000 Censuses). Standard errors are in parentheses.
coefficients in columns 1-4 of Table 4 are about 80% as large as the ones in columns 6-9 of Table 3.

The Geography of Giving CAHRS WP08-08
Cornell University Center for Advanced Human Resource Studies Page 25 of 39
Table 4 Effect of Corporate Headquarters on Contributions to
Two Classes of Charitable Organizations (Unweighted Estimates of Contributions)
Contributions to All Charitable Organizations
Contributions to Nationally- Oriented Organizations
Contributions to Locally- Oriented Organizations
(1) (2) (3) (4) (5) (6) (7) (8) (9) (10) (11) (12)
Number of Top Firms in City (coefficient in millions of $) 20.30
(5.37) 14.82
(3.88) 5.48
(2.48)
Number of Traded Firms in City (coefficient in millions of $) 8.13
(1.69) 7.31 (1.17)
0.82 (0.81)
Market Value of Top Firms in City (coefficient in $ per $1000 of value) 0.61
(0.16) 0.25
(0.12) 0.35
(0.07)
Market Value of All Firms in City (coefficient in $ per $1000 of value) 0.61
(0.16) 0.27
(0.11) 0.35
(0.07)
R-squared 0.36 0.40 0.37 0.37 0.25 0.35 0.20 0.20 0.37 0.35 0.46 0.46
Controls for population, employment-population, and fraction of adults with college education
yes yes yes yes yes yes yes yes yes yes yes yes
Note: Sample includes 146 cities. All models are in first differences, using data for 1990 and 2000. Dependent variable in columns 1-4 is change in total contributions for all organizations. Dependent variable in columns 5-8 is change in contributions for 'nationally oriented' organizations. Dependent variable in columns 9-12 is change in contributions for 'locally oriented' organizations. See text for classification. See notes to Table 3. In this table, contributions of sampled charities are not inflated by sampling weights. Standard errors are in parentheses.
The Geography of Giving CAHRS WP08-08
Cornell University Center for Advanced Human Resource Studies Page 26 of 39
Figure 3 Decadal Changes in Top Headquarters and Public Contributions

The Geography of Giving CAHRS WP08-08
Cornell University Center for Advanced Human Resource Studies Page 27 of 39
An interesting question is whether all types of charities benefit equally from the presence
of corporate headquarters in a city. To provide some initial indication, we divided charities into
two groups, based on an rough distinction between organizations with a national orientation
(including education, medical and science research, and grant making organizations) and those
with a local orientation (including health and human service providers, and cultural
organizations). We then re-estimated the first differenced models using as alternative
dependent variables total contributions to each of these two types of charities. The results,
shown in columns 5-12 of Table 4, suggest that when corporate presence is measured by the
market value measures, the two types of charities both benefit. On the other hand, when
corporate presence is measured by the number of headquarters in a city, more of the benefit
seems to flow to nationally oriented organizations.
b. Dynamic Models Using Annual Data
Following the discussion in section III, we now present estimates of the simple dynamic
model outlined in equation (2). To do so, we fit a series of models using annual (as opposed to
decennial) data on charitable contributions and headquarters in each city. The results are
presented in Table 5. For simplicity, we only show results for two measures of corporate
presence: the number of firms headquartered in a city (columns 1-3); and the market value of all
firms headquartered in a city (columns 4-6). The models in the upper panel of the table exclude
city-specific trends, while these are included in the models in bottom panel. The dependent
variable for all models is the unweighted sum of public contributions to all charities in a city and
given year.23
Consider first the models in the upper panel of Table 5 that include only the current
value of the headquarters measure. The specification in column 1 yields a coefficient of 9.51,
which should be compared to the estimate of 8.13 in column 2 of Table 4. When we use the
23 Because the dynamic models include city-specific trends, here we do not control for population, employment-population and fraction of college graduates as we did in the previous Tables. Adding these additional controls has no impact on the estimates reported in Table 5.
The Geography of Giving CAHRS WP08-08
Cornell University Center for Advanced Human Resource Studies Page 28 of 39
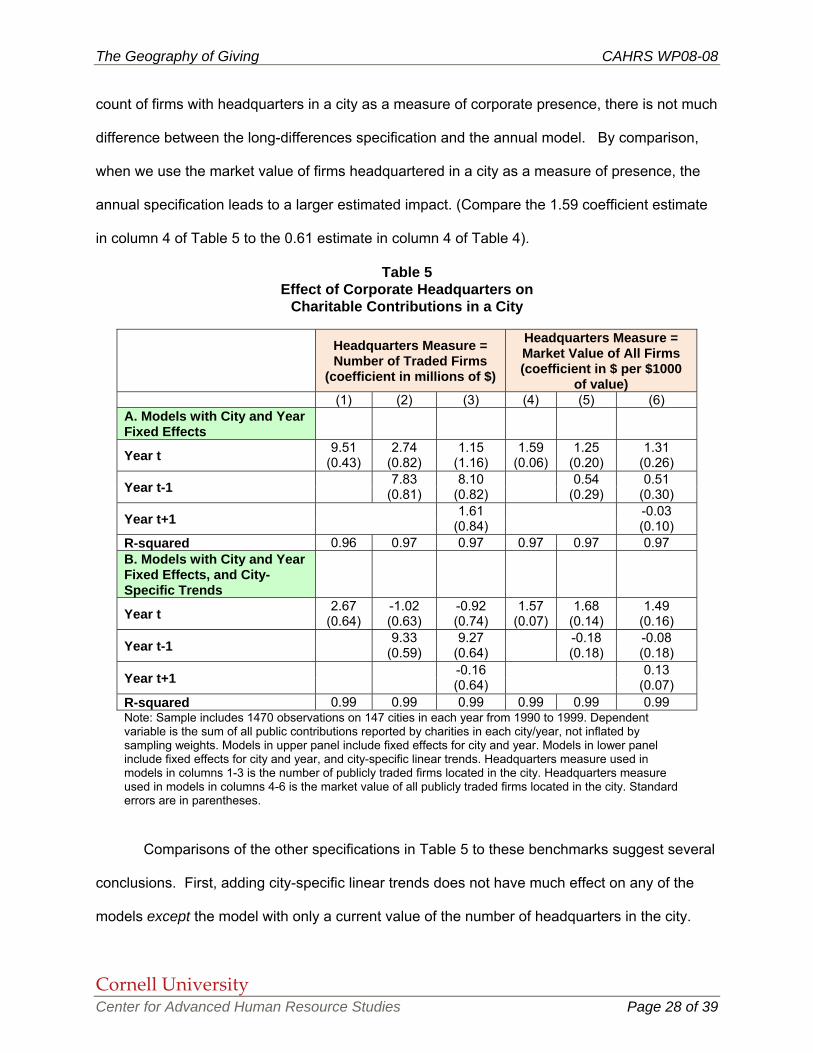
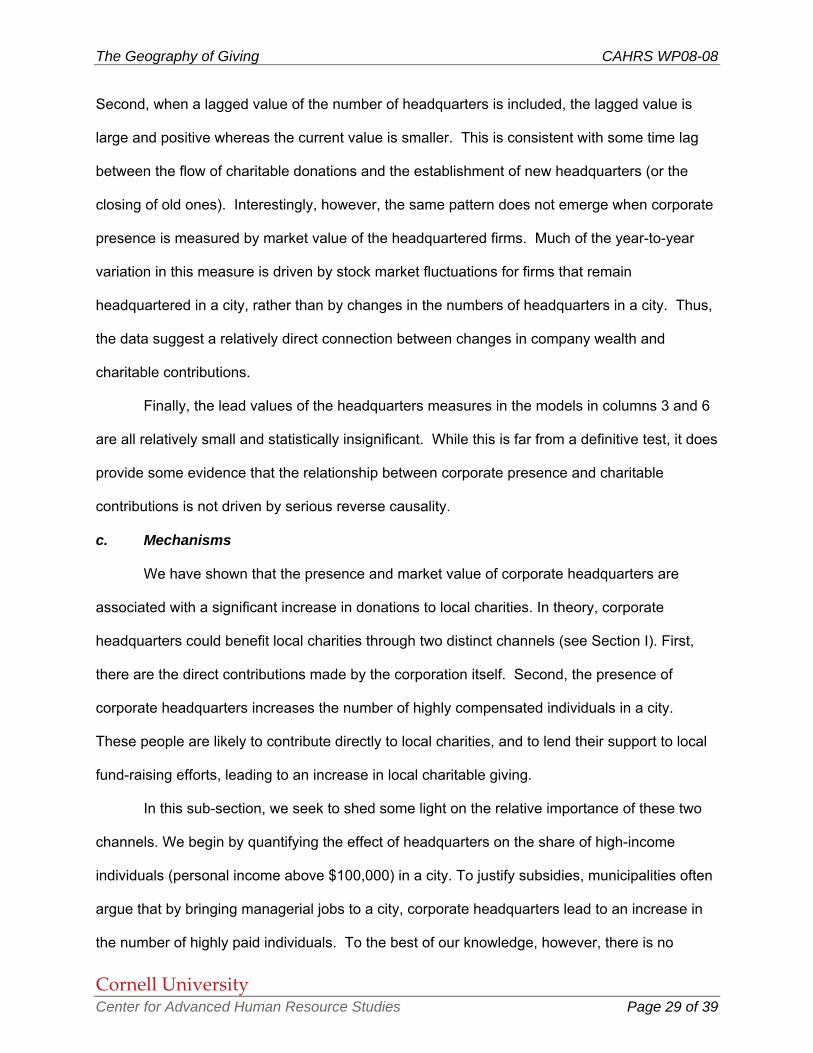
count of firms with headquarters in a city as a measure of corporate presence, there is not much
difference between the long-differences specification and the annual model. By comparison,
when we use the market value of firms headquartered in a city as a measure of presence, the
annual specification leads to a larger estimated impact. (Compare the 1.59 coefficient estimate
in column 4 of Table 5 to the 0.61 estimate in column 4 of Table 4).
Table 5 Effect of Corporate Headquarters on
Charitable Contributions in a City Headquarters Measure =
Number of Traded Firms (coefficient in millions of $)
Headquarters Measure = Market Value of All Firms (coefficient in $ per $1000
of value) (1) (2) (3) (4) (5) (6) A. Models with City and Year Fixed Effects
Year t 9.51 (0.43)
2.74 (0.82)
1.15 (1.16)
1.59 (0.06)
1.25 (0.20)
1.31 (0.26)
Year t-1 7.83 (0.81)
8.10 (0.82)
0.54 (0.29)
0.51 (0.30)
Year t+1 1.61 (0.84)
-0.03 (0.10)
R-squared 0.96 0.97 0.97 0.97 0.97 0.97 B. Models with City and Year Fixed Effects, and City-Specific Trends
Year t 2.67 (0.64)
-1.02 (0.63)
-0.92 (0.74)
1.57 (0.07)
1.68 (0.14)
1.49 (0.16)
Year t-1 9.33 (0.59)
9.27 (0.64)
-0.18 (0.18)
-0.08 (0.18)
Year t+1 -0.16 (0.64)
0.13 (0.07)
R-squared 0.99 0.99 0.99 0.99 0.99 0.99 Note: Sample includes 1470 observations on 147 cities in each year from 1990 to 1999. Dependent variable is the sum of all public contributions reported by charities in each city/year, not inflated by sampling weights. Models in upper panel include fixed effects for city and year. Models in lower panel include fixed effects for city and year, and city-specific linear trends. Headquarters measure used in models in columns 1-3 is the number of publicly traded firms located in the city. Headquarters measure used in models in columns 4-6 is the market value of all publicly traded firms located in the city. Standard errors are in parentheses.
Comparisons of the other specifications in Table 5 to these benchmarks suggest several
conclusions. First, adding city-specific linear trends does not have much effect on any of the
models except the model with only a current value of the number of headquarters in the city.
The Geography of Giving CAHRS WP08-08
Cornell University Center for Advanced Human Resource Studies Page 29 of 39
Second, when a lagged value of the number of headquarters is included, the lagged value is
large and positive whereas the current value is smaller. This is consistent with some time lag
between the flow of charitable donations and the establishment of new headquarters (or the
closing of old ones). Interestingly, however, the same pattern does not emerge when corporate
presence is measured by market value of the headquartered firms. Much of the year-to-year
variation in this measure is driven by stock market fluctuations for firms that remain
headquartered in a city, rather than by changes in the numbers of headquarters in a city. Thus,
the data suggest a relatively direct connection between changes in company wealth and
charitable contributions.
Finally, the lead values of the headquarters measures in the models in columns 3 and 6
are all relatively small and statistically insignificant. While this is far from a definitive test, it does
provide some evidence that the relationship between corporate presence and charitable
contributions is not driven by serious reverse causality.
c. Mechanisms
We have shown that the presence and market value of corporate headquarters are
associated with a significant increase in donations to local charities. In theory, corporate
headquarters could benefit local charities through two distinct channels (see Section I). First,
there are the direct contributions made by the corporation itself. Second, the presence of
corporate headquarters increases the number of highly compensated individuals in a city.
These people are likely to contribute directly to local charities, and to lend their support to local
fund-raising efforts, leading to an increase in local charitable giving.
In this sub-section, we seek to shed some light on the relative importance of these two
channels. We begin by quantifying the effect of headquarters on the share of high-income
individuals (personal income above $100,000) in a city. To justify subsidies, municipalities often
argue that by bringing managerial jobs to a city, corporate headquarters lead to an increase in
the number of highly paid individuals. To the best of our knowledge, however, there is no
The Geography of Giving CAHRS WP08-08
Cornell University Center for Advanced Human Resource Studies Page 30 of 39
systematic evidence on the importance of this effect. We then re-estimate the relationship
between headquarters and charitable contributions controlling for the number of high-income
individuals. To the extent that this addition leads to a reduction in the coefficient on the
corporate presence variable, we infer that a fraction of the measured presence effect in Tables
3-5 works through an effect on the number of high-income people in the city.
Table 6 presents models similar to the specifications in Table 3 but taking as the
dependent variable the number of people in the city with income larger than $100,000 per
year.24 The entry for the first-differenced model in column 6 suggests that the addition of a new
top headquarters in a city is associated with a roughly 800 person increase in the number of
individuals with income over $100,000 per year. The corresponding figure for the average
publicly traded firm in column 7 is 275. Both coefficients are precisely estimated.
The other specifications in Table 6 show that the number of high-income people in a city
is also related to the total market capitalization of firms headquartered in the city. The models in
columns 8 and 9 suggest that this effect is economically large and statistically significant.
Moreover, the comparison of columns 8 and 9 indicates that a one dollar increase in market
capitalization has roughly the same effect on the number of rich individuals, irrespective of the
size of the firm.
Having found that the presence of a corporate headquarters significantly affects the
number of high-income people in a city, we now turn to the question of how much of the impact
of corporate headquarters on charitable giving can be attributed to this channel, versus a
“direct” effect of corporate presence holding constant the number of high income people in the
city. The models in Table 7 expand on the specifications in Table 3 by including the number of
people earning more than $100,000 per year as an added control. The contrast between the
first differenced models in Table 3 and Table 7 is striking. The addition of just one variable
24 This variable was calculated from the 1990 and 2000 Census of Population. It refers to individuals 16 or older. The metropolitan areas with the largest number of individuals with personal income over $100,000 are Los Angeles and New York (about 280,000 in 2000, and 230,000 in 1990), followed by Chicago (260,000 in 2000 and 170,000 in 1990).

The Geography of Giving CAHRS WP08-08
Cornell University Center for Advanced Human Resource Studies Page 31 of 39
results in a marked increase in the R-squared of the first differenced models, and a dramatic fall
in the estimated effect of corporate presence. In particular, the models in columns 6 to 9 in
Table 7 indicate that after controlling for the share of workers who earn more than $100,000,
increases in the number of headquarters or increases in their market value have virtually no
effect on charitable contributions in a city. For example, the coefficient on the number of top
headquarters drops from 24.20 in Table 3 to 0.48 in Table 7. Similarly, the coefficient on the
market value of top firms drops from a statistically significant 0.65 to a statistically insignificant -
0.21.
By contrast, the coefficient on the number of individuals with income larger than
$100,000 is sizable and statistically significant. In the first differenced models, it is around 30,
indicating that the presence of one additional person who earns over $100,000 per year is
associated with a extra $30,000 in charitable contributions. According to IRS reports, in year
2000 the average charitable contribution for individuals with income above $100,000 was
$8700, or about 30% of the estimated impact of the presence of an additional person earning
$100,000 or more on local giving.25 It is important to realize, however, that our estimates are
not directly comparable with the IRS statistics. On one hand, the IRS figure includes deductions
for both local and national charities, while our estimates only reflect contributions to local
charities. On the other hand, the IRS figure only includes personal contributions, while our
estimates will incorporate the donations from other people in the city or from outside the city
attributable to the fund-raising efforts of high-income people.
In sum, the comparison of Table 3 and Table 7 suggests that the main channel through
which corporate headquarters benefit local charities is by raising the number of high-income
people in a city, rather than by increasing the amount of direct corporate contributions that are
channeled to local charities
25 This number was obtained by summing entries for incomes above $100,000 in column 79 and dividing the sum by the sum of entries in column 78 in Table 2.1 of IRS Publication 1304.

The Geography of Giving CAHRS WP08-08
Cornell University Center for Advanced Human Resource Studies Page 32 of 39
Table 6 Cross-Sectional and First-Differenced Models of
the Effect of Headquarters on the Number of High-Income People in a City Dependent Variable = number of people earning > $100,000 per year Cross-Sectional Models: Data for 2000 First-Difference: Change from 1990 to 2000 (1) (2) (3) (4) (5) (6) (7) (8) (9) (10)
Number of Top Firms in City 501.11(96.92) -316.98
(268.12) 800.50
(141.31) -426.71 (269.24)
Number of Traded Firms in City 214.47(31.92 0.28
(0.07) 275.15(44.89) 231.88
(70.03) Market Value of Top Firms in City 18.50
(4.41) 27.20 (3.94)
Market Value of All Firms in City 18.50 (4.31)
5.57 (7.85) 27.50
(3.82)25.50 (5.45)
R-squared 0.95 0.95 0.95 0.95 0.95 0.69 0.70 0.72 0.72 0.74 Controls for population, employment-population, and fraction of adults with college education
yes yes yes yes yes yes yes yes yes yes
Note: Sample includes 146 cities. All models include controls for adult population, employment-population rate, and fraction of adults with a college degree (estimated from the 1990 and 2000 Censuses). Standard errors are in parentheses.

The Geography of Giving CAHRS WP08-08
Cornell University Center for Advanced Human Resource Studies Page 33 of 39
Table 7
Cross-Sectional and First-Differenced Models of the Effect of Corporate Headquarters on Charitable Contributions in a City
(controlling for income)
Cross-Sectional Models: Data for 2000 First-Difference: Change from 1990 to 2000
(1) (2) (3) (4) (5) (6) (7) (8) (9) (10)
Number of Top Firms in City (coefficient in millions of $)
30.15 (7.13)
11.62 (18.74)
0.48 (5.94)
-3.28 (11.15)
Number of Traded Firms in City (coefficient in millions of $)
7.85 (2.69)
-3.50 (5.02)
2.42 (1.94)
4.48 (2.98)
Market Value of Top Firms in City (coefficient in $ per $1000 of value)
1.53 (0.30)
-0.21 (0.18)
Market Value of All Firms in City (coefficient in $ per $1000 of value)
1.50 (0.29)
1.35 (0.55)
-0.20 (0.18)
-0.30 (0.24)
Population with > 100k in income 12.67 (5.68)
13.39 (6.17)
13.08 (5.39)
12.90 (5.40)
14.06 (5.90)
29.64 (3.19)
27.9 # (3.23)
31.68 (3.32)
31.73 (3.35)
29.99 (3.48)
R-squared 0.71 0.69 0.72 0.72 0.72 0.61 0.62 0.62 0.62 0.62
Controls for population, employment-population, and fraction of adults with college education
yes yes yes yes yes yes yes yes yes yes
Note: Sample includes 146 cities. Models and sample are similar to the one in Table 3, but we now control for the fraction of the population with income above $100,000. Dependent variable in columns 1-5 is the total public contributions received by charitable organizations in the city in 2000. Dependent variable in columns 6-10 is the change in total public contributions from 1990 to 2000. All models include controls for adult population, employment-population rate, and fraction of adults with a college degree (estimated from the 1990 and 2000 Censuses). Standard errors are in parentheses.

The Geography of Giving CAHRS WP08-08
Cornell University Center for Advanced Human Resource Studies Page 34 of 39
d. Public Expenditures
In light of the impact of corporate headquarters on local charities, an interesting question
is what happens to local public spending on social services, schools, and hospitals. As noted in
Becker and Lindsay (1994), it is possible that an increase in local charitable contributions leads
to “reverse crowd out” – a reduction in local government spending. The magnitude of this effect
has important theoretical and policy implications for the overall impact of charitable
organizations.
Consider the following simplified model of local government spending (G) on a particular
public service (e.g., welfare):
(2) G = F( Y, X) − λ P ,
where Y is total community income, X is a set of preference shifters, P is the dollar value of the
service supplied by local non-profits, and λ is a “reverse crowd-out” parameter (with 0≤ λ≤1).
The income of local non-profits is increased by the presence of corporate headquarters in a
metropolitan area, suggesting that P will increase when there are more corporations (or
corporations with larger market capitalization) in the area. If this was the only effect, it would be
possible to estimate λ by instrumental variables, using local corporate headquarters as
instruments for P. Changes in the number or market value of corporations in an area may also
affect community income, however, invalidating the IV procedure. In light of this, we follow a
simple reduced form approach and relate changes in the number or market value of local
corporations to changes in local government spending, focusing in particular on education,
health, and welfare – three areas where there is substantial overlap between the public and
non-profit sectors. A reduced form analysis yields estimates of the combined derivative
(3) ∂F/∂Y × ∂Y/∂Corp − λ ∂P/∂Corp
where ∂Y/∂Corp represents the effect of the measure of corporate presence on local income,
and ∂P/∂Corp represents the effect of corporate presence on service provision by local
nonprofits.

The Geography of Giving CAHRS WP08-08
Cornell University Center for Advanced Human Resource Studies Page 35 of 39
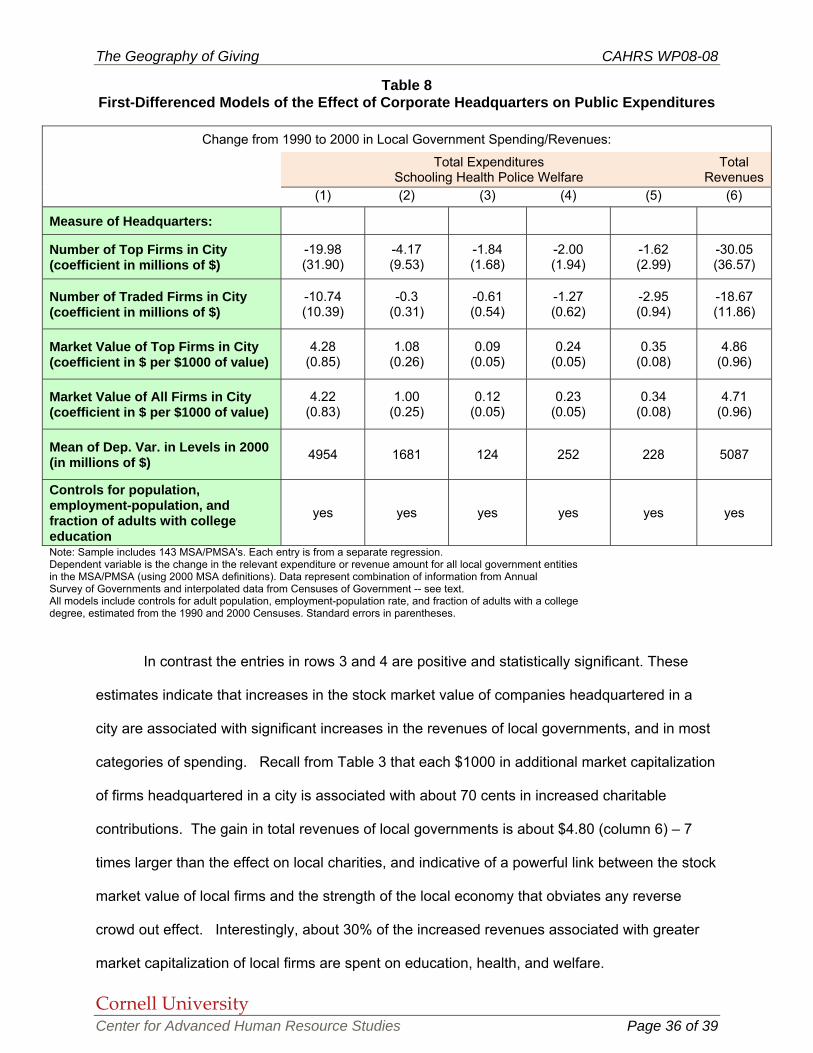
Table 8 present first-differenced models similar to those in Table 3, where the dependent
variable is total public spending, or spending on a specific category of services, and the key
independent variable is a measure of local corporate presence. Data on public expenditures
are from the Annual Survey of Governments and the Censuses of Governments, aggregated
across all local government entities to the level of the metropolitan area. For example, the
dependent variable in column 1 is the 1990-2000 change in total expenditures of all local
governments that belong to the relevant metropolitan area.26 The dependent variables in
columns 2 are the changes in public expenditures for elementary and secondary schooling,
health, police, and welfare, respectively. Column 6 shows estimates for total public revenues. In
the bottom row, we report the 2000 level of the relevant dependent variable. Each entry in the
Table is from a separate regression.
The estimates in Table 8 point to different conclusions about the effects of the number of
headquarters in a metropolitan area and the market value of the firms headquartered there. The
coefficients in rows 1 and 2, associated with the numbers of headquarters in an area, are all
negative but relatively imprecisely estimated. As a point of comparison, note that our estimates
in Table 3 suggest that the headquarters of a top firm leads to an increase in charitable
donations of about 25 million, while the headquarters of any firm leads to an increase about
one-half as large. The estimated impact of an additional top headquarters on combined local
government spending on schooling, health, and welfare is -7.6 million, while the impact of
additional headquarters for any firm is -4.5 million. Thus, the estimated effects of the number of
headquarters are consistent with a value of λ = −⅓, assuming that changes in the numbers of
headquarters have no effect on local income. However, the estimates are imprecise, and we
cannot rule out a net effect of zero (or even of a modest positive value) from an increase in the
number of corporations headquartered in a city.
26 We combine data from the Annual Surveys of Government (ASG, available for the larger government entities in most larger cities) with data from the Censuses of Government (available every 5 years for all government entities). In cases where a certain entity only reports in the Census, we use linear interpolation to infer values for the inter-censal years. We then aggregate the interpolated Census data and the ASG data across all entities in each MSA/PMSA, using 2000 MSA definitions.
The Geography of Giving CAHRS WP08-08
Cornell University Center for Advanced Human Resource Studies Page 36 of 39
In contrast the entries in rows 3 and 4 are positive and statistically significant. These
estimates indicate that increases in the stock market value of companies headquartered in a
city are associated with significant increases in the revenues of local governments, and in most
categories of spending. Recall from Table 3 that each $1000 in additional market capitalization
of firms headquartered in a city is associated with about 70 cents in increased charitable
contributions. The gain in total revenues of local governments is about $4.80 (column 6) – 7
times larger than the effect on local charities, and indicative of a powerful link between the stock
market value of local firms and the strength of the local economy that obviates any reverse
crowd out effect. Interestingly, about 30% of the increased revenues associated with greater
market capitalization of local firms are spent on education, health, and welfare.
Table 8 First-Differenced Models of the Effect of Corporate Headquarters on Public Expenditures
Change from 1990 to 2000 in Local Government Spending/Revenues:
Total Expenditures Schooling Health Police Welfare
Total Revenues
(1) (2) (3) (4) (5) (6)
Measure of Headquarters:
Number of Top Firms in City (coefficient in millions of $)
-19.98 (31.90)
-4.17 (9.53)
-1.84 (1.68)
-2.00 (1.94)
-1.62 (2.99)
-30.05 (36.57)
Number of Traded Firms in City (coefficient in millions of $)
-10.74 (10.39)
-0.3 (0.31)
-0.61 (0.54)
-1.27 (0.62)
-2.95 (0.94)
-18.67 (11.86)
Market Value of Top Firms in City (coefficient in $ per $1000 of value)
4.28 (0.85)
1.08 (0.26)
0.09 (0.05)
0.24 (0.05)
0.35 (0.08)
4.86 (0.96)
Market Value of All Firms in City (coefficient in $ per $1000 of value)
4.22 (0.83)
1.00 (0.25)
0.12 (0.05)
0.23 (0.05)
0.34 (0.08)
4.71 (0.96)
Mean of Dep. Var. in Levels in 2000 (in millions of $) 4954 1681 124 252 228 5087
Controls for population, employment-population, and fraction of adults with college education
yes yes yes yes yes yes
Note: Sample includes 143 MSA/PMSA's. Each entry is from a separate regression. Dependent variable is the change in the relevant expenditure or revenue amount for all local government entities in the MSA/PMSA (using 2000 MSA definitions). Data represent combination of information from Annual Survey of Governments and interpolated data from Censuses of Government -- see text. All models include controls for adult population, employment-population rate, and fraction of adults with a college degree, estimated from the 1990 and 2000 Censuses. Standard errors in parentheses.

The Geography of Giving CAHRS WP08-08
Cornell University Center for Advanced Human Resource Studies Page 37 of 39
V. Conclusions
The past twenty years have been characterized by marked differences in the ability of
different cities to attract and retain corporate headquarters. Cities like Houston, San Jose, and
San Francisco have gained a significant numbers of corporate headquarters, while cities like
New York, Chicago and Los Angeles have lost. Local leaders and politicians work hard to
attract and retain corporate headquarters in their communities, often providing tax incentives to
sweeten the deal. These incentives are sometimes justified by the claim that locally-headed
corporations are a significant source of money and fund-raising talent for local non-profits.
These claims are difficult to verify, since the existing empirical evidence is limited.
In this paper we seek to empirically assess the influence of corporate headquarters in a
city on non-profit organizations there. Our analysis suggests that attracting or retaining the
headquarters of an average firm yields approximately $10 million per year in public contributions
to local non-profits, while the headquarters of a larger firm yields about $25 million per year.
Changes in the market capitalization of firms headquartered in a city are also important
determinants of charitable donations. We find that each 1000 dollar increase in the market value
of the firms headquartered in a city yields 70 cents or more to local non-profits.
Most of these increases in charitable contributions seem to be due to the fact that the
presence of corporate headquarters raises the number of rich individuals in an area. The
addition of a new headquarters in a city is associated with an increase in the number of
individuals with income larger than $100,000 equal to 275. By contrast, we find limited support
for the notion that the presence of corporate headquarters benefits charities directly, through
corporate donations. Given that the vast majority of firms in our sample produce nationally
traded goods, this finding may be not too surprising. Profit maximizing firms with customers all
over the country should have limited incentives to contribute only to local charities.
The Geography of Giving CAHRS WP08-08
Cornell University Center for Advanced Human Resource Studies Page 38 of 39
References
Andreoni, James, 1990. “Impure Altruism and Donations to Public Goods: A Theory of Warm- Glow Giving,” Economic Journal, 100 (401), pp. 464-477. Andreoni, James, 1998. “Toward a Theory of Charitable Fund-Raising,”Journal of Political
Economy, 106 (6), pp. 1186-1213. Andreoni; James and Abigail Payne, 2003. “Do Government Grants to Private Charities Crowd
out Giving or Fund-Raising?” American Economic Review, 93 (3), pp. 792-812. Bartkus, B., S. Morris, and B. Siefert, 2002. “Governance and Corporate Philanthropy:
Restraining Robin Hood?” Business and Society, 41(3), pp. 319-44. Becker, Elizabeth and Cotton M. Lindsay, 1994. “Does the Government Free Ride?” Journal of
Law and Economics 37 (1), pp. 277-296. Bergstrom, Theodore, Lawrence Bloom and Hal Varian, 1986. “On the Private Provision of
Public Goods,” Journal of Public Economics 29 (1), pp. 25-50. Boatsman, J.R. and S. Gupta, 1996. “Taxes and Corporate Charity: Empirical Evidence from
Micro-Level Panel Data,” National Tax Journal, 49, pp. 193–213 Bremmer, Robert, 1988. American Philanthropy, (Revised Second Edition), Chicago: University of Chicago Press. Davis, James, and Vernon Henderson, 2004. “The Agglomeration of Headquarters," Unpublished working paper, Brown University Department of Economics. Dye Richard, Teresa Garcia-Mila and Therese McGuire, 2007. “Productivity Spillovers of Headquarters,” Unpublished working paper, Northwestern University Kellogg School of Management. Friedman, L. J. and M.D. McGarvie, 2002. Charity, Philanthropy, and Civility in American History, Cambridge and New York: Cambridge University Press. Fry, Louis W, Gerald Keim, and Roger E. Meiners, 1982. “Corporate Contributions: Altruistic or
For Profit,” Academy of Management Journal, 25, pp. 94-106. Galaskiewicz, Joseph, 1997. “An Urban Grants Economy Revisited: Corporate Charitable
Contributions in the Twin Cities, 1979-81, 1987-89,” Administrative Science Quarterly, 42(3), pp. 445-71.
Greenstone, Michael, and Enrico Moretti, 2005. “"Bidding for Industrial Plants: Does Winning a
'Million Dollar Plant' Increase Welfare?” NBER Working Paper 9844 (revised). Helland, Eric, Janet Smith, and William Brown, 2006. “Corporate Philanthropic Practices,”
Journal of Corporate Finance, 12, pp. 855-77. Himmelstein, Jerome L., 1997. Looking Good and Doing Good: Corporate Philanthropy and
Corporate Power, Bloomington Indiana: Indiana University Press.

The Geography of Giving CAHRS WP08-08
Cornell University Center for Advanced Human Resource Studies Page 39 of 39
Hornbeck, Richard., Michael Greenstone and Enrico Moretti 2007. “Identifying Agglomeration Spillovers: Evidence from Million Dollar Plants”, Unpublished Working paper, MIT Department of Economics. Klier, Thomas., and William Testa, 2002. “Location Trends of Large Company Headquarters
During the 1990s,” Federal Reserve Bank of Chicago Economic Perspectives, 26(2), pp. 12-26. McClimon, Timothy J., 2004. “The Shape of Corporate Philanthropy Yesterday and Today," Grantmakers in the Arts Reader, 15 (3), pp. 1-7. McElroy, Katherine M. and John J. Siegfried, 1986. “The Community Influence on Corporate
Contributions,” Public Finance Quarterly, 14, pp. 394-414. McGuire, Therese and Teresa Garcia-Mila, 2002. “Tax Incentives and the City,” Brookings- Wharton Papers on Urban Affairs 2002, pp 95-114. Muirhead, Sophia A., 2002. Corporate Contributions in 2002, New York: The Conference
Board. Muirhead, Sophia A., 2006. The 2006 Corporate Contributions Report, The Conference Board. Navarro, Peter, 1988. “Why Do Corporations Give to Charity?” Journal of Business, 61 (1), pp.
65–93. Roberts, Russell, 1984. “A Positive Theory of Private Charity and Public Transfers,” Journal of
Political Economy 92 (1), pp. 136-148.
Rose-Ackerman, Susan, 1996. “Altruism, Nonprofits, and Economic Theory,” Journal of Economic Literature, 34 (2), pp. 701-728.
Saiia, David H., Archie B. Carroll and Ann K. Buchholtz, 2003. “Philanthropy as Strategy: When
Corporate Charity ‘Begins at Home’,” Business and Society 42 (2), pp. 169-201. Smith Hopkins, Jamie, 2004. “Baltimore Loss: HQs Go Elsewhere”, Baltimore Sun, August 29. Trost, Steven, 2006. “Crowding Out in Corporate Charitable Giving,” Unpublished Working
Paper, United States International Trade Commission. Werbel, James D. and Suzanne M. Carter, 2002. “The CEO’s Influence on Corporate
Foundation Giving,” Journal of Business Ethics 40, pp. 46-60. Zeltin, Minda, 1990. “Companies Find Profit in Corporate Giving,” Management Review 79, 10-
15.