
The geography of advance transit-oriented development in metropolitan Phoenix, Arizona, 2000–2007
11
The geography of advance transit-oriented development in metropolitan Phoenix, Arizona, 2000–2007 Carol Atkinson-Palombo a, * , Michael J. Kuby b,1 a University of Connecticut, Department of Geography, 215 Glenbrook Road, Storrs, CT 06269-4148, United States b Arizona State University, School of Geographical Sciences and Urban Planning, Arizona, AZ 85287-5302 United States article info Keywords: Transit-oriented development Overlay zoning patterns Light-rail transit Urban investment patterns Uneven development abstract Phoenix adopted overlay zoning (an additional, targeted layer of regulations) in some light-rail transit (LRT) station areas at the site-selection stage to reduce planning-related uncertainty. This prompts con- sideration of advance transit-oriented development (TOD)—development that takes place before LRT sys- tem operation. In this paper we break down almost $1 billion worth of advance TOD in the Phoenix area by type of TOD, type of station area, and use of overlay zoning. Factor analysis and cluster analysis are applied to GIS-based parcel-level data to identify five distinct station-area types. We then use ANOVA to verify statistically significant relationships between station-area type and: the value of advance TOD, the percentage of parcels with overlay zoning, and the percentage of advance TOD with overlay zon- ing. The five station-area types, ordered from highest to lowest advance TOD per station, are employment centers; Middle-Income Mixed-Use areas; transportation (park-and-ride) nodes; high population/rental areas; and urban poverty areas. Overlay zoning was used most in areas of urban poverty and least in sta- tion-area types with the most single-family housing. Advance TOD coincided strongly with overlay zon- ing in areas of urban poverty and least in employment and amenity centers. Ó 2010 Elsevier Ltd. All rights reserved. 1. Introduction Growing concern about the viability of traditional automobile- dependent suburbs containing single-family houses on their individual lots has sparked considerable debate about alternative potentially ‘‘more sustainable” built environments (Ewing et al., 2008; Squires, 2002). Light-rail transit (LRT) has been offered as one such option, with supporters claiming that it can help to reshape the quality and form of urban growth by simultaneously providing an antidote to urban sprawl and a fulcrum for urban revitalization (Babalik-Sutcliffe, 2002; Bernick and Cervero, 1997; Calthorpe, 1993; Cervero and Duncan, 2002; Salvensen, 1996). Extensive debates over the past twenty years have established that LRT needs to be implemented alongside a raft of supportive poli- cies to encourage transit-oriented development (TOD), which is most broadly conceptualized as high density, pedestrian-friendly, mixed-use neighborhoods (TCRP, 1997, 2002, 2004). Policies to encourage TOD include—but are not limited to—overlay zoning, a regulatory tool that creates a special zoning district placed over an existing base zone(s). Overlay zoning identifies special provi- sions in addition to those in the underlying base zone to guide development within a special area (City of Portland, 2008). With respect to LRT, overlay zoning is used to create the development of higher density, mixed-use environments that have pedestrian- friendly streetscapes designed at the human-scale (Cervero and Kockelman, 1997). In this paper we study the LRT system in metropolitan Phoenix, which is unique because the city of Phoenix strategically adopted overlay zoning to encourage TOD in 2000—eight years ahead of system opening—specifically to accelerate land-use change (City of Phoenix, 2002, 2004). This unprecedented policy sequencing has motivated us to evaluate advance TOD, defined as new construction that takes place in station areas after an LRT system is approved but before it starts operating. We use a variety of quantitative methods such as cluster analysis, factor analysis, and ANOVA tests to create a typology of LRT station areas based on geographic characteristics, and use this typology to investigate the relationships among station-area type, overlay zoning, and the value and kind of advance TOD. Our objective is to evaluate the relationship between geography and the amount and type of advance TOD that takes place across an LRT system, and to provide a baseline for future studies that will investigate how TOD unfolds over time. 0966-6923/$ - see front matter Ó 2010 Elsevier Ltd. All rights reserved. doi:10.1016/j.jtrangeo.2010.03.014 * Corresponding author. Tel.: +1 860 486 8805; fax: +1 860 486 1348. E-mail addresses: [email protected] (C. Atkinson-Palombo), [email protected] (M.J. Kuby). 1 Tel.: +1 480 965 6850; fax: +1 480 965 8313. Journal of Transport Geography 19 (2011) 189–199 Contents lists available at ScienceDirect Journal of Transport Geography journal homepage: www.elsevier.com/locate/jtrangeo
Transcript of The geography of advance transit-oriented development in metropolitan Phoenix, Arizona, 2000–2007
Journal of Transport Geography 19 (2011) 189–199
Contents lists available at ScienceDirect
Journal of Transport Geography
journal homepage: www.elsevier .com/ locate / j t rangeo
The geography of advance transit-oriented development in metropolitanPhoenix, Arizona, 2000–2007
Carol Atkinson-Palombo a,*, Michael J. Kuby b,1
a University of Connecticut, Department of Geography, 215 Glenbrook Road, Storrs, CT 06269-4148, United Statesb Arizona State University, School of Geographical Sciences and Urban Planning, Arizona, AZ 85287-5302 United States
a r t i c l e i n f o
Keywords:Transit-oriented developmentOverlay zoning patternsLight-rail transitUrban investment patternsUneven development
0966-6923/$ - see front matter � 2010 Elsevier Ltd. Adoi:10.1016/j.jtrangeo.2010.03.014
* Corresponding author. Tel.: +1 860 486 8805; faxE-mail addresses: carol.atkinson-palombo@uconn
[email protected] (M.J. Kuby).1 Tel.: +1 480 965 6850; fax: +1 480 965 8313.
a b s t r a c t
Phoenix adopted overlay zoning (an additional, targeted layer of regulations) in some light-rail transit(LRT) station areas at the site-selection stage to reduce planning-related uncertainty. This prompts con-sideration of advance transit-oriented development (TOD)—development that takes place before LRT sys-tem operation. In this paper we break down almost $1 billion worth of advance TOD in the Phoenix areaby type of TOD, type of station area, and use of overlay zoning. Factor analysis and cluster analysis areapplied to GIS-based parcel-level data to identify five distinct station-area types. We then use ANOVAto verify statistically significant relationships between station-area type and: the value of advanceTOD, the percentage of parcels with overlay zoning, and the percentage of advance TOD with overlay zon-ing. The five station-area types, ordered from highest to lowest advance TOD per station, are employmentcenters; Middle-Income Mixed-Use areas; transportation (park-and-ride) nodes; high population/rentalareas; and urban poverty areas. Overlay zoning was used most in areas of urban poverty and least in sta-tion-area types with the most single-family housing. Advance TOD coincided strongly with overlay zon-ing in areas of urban poverty and least in employment and amenity centers.
� 2010 Elsevier Ltd. All rights reserved.
1. Introduction
Growing concern about the viability of traditional automobile-dependent suburbs containing single-family houses on theirindividual lots has sparked considerable debate about alternativepotentially ‘‘more sustainable” built environments (Ewing et al.,2008; Squires, 2002). Light-rail transit (LRT) has been offered asone such option, with supporters claiming that it can help toreshape the quality and form of urban growth by simultaneouslyproviding an antidote to urban sprawl and a fulcrum for urbanrevitalization (Babalik-Sutcliffe, 2002; Bernick and Cervero, 1997;Calthorpe, 1993; Cervero and Duncan, 2002; Salvensen, 1996).Extensive debates over the past twenty years have established thatLRT needs to be implemented alongside a raft of supportive poli-cies to encourage transit-oriented development (TOD), which ismost broadly conceptualized as high density, pedestrian-friendly,mixed-use neighborhoods (TCRP, 1997, 2002, 2004). Policies toencourage TOD include—but are not limited to—overlay zoning, aregulatory tool that creates a special zoning district placed over
ll rights reserved.
: +1 860 486 1348..edu (C. Atkinson-Palombo),
an existing base zone(s). Overlay zoning identifies special provi-sions in addition to those in the underlying base zone to guidedevelopment within a special area (City of Portland, 2008). Withrespect to LRT, overlay zoning is used to create the developmentof higher density, mixed-use environments that have pedestrian-friendly streetscapes designed at the human-scale (Cervero andKockelman, 1997).
In this paper we study the LRT system in metropolitan Phoenix,which is unique because the city of Phoenix strategically adoptedoverlay zoning to encourage TOD in 2000—eight years ahead ofsystem opening—specifically to accelerate land-use change (Cityof Phoenix, 2002, 2004). This unprecedented policy sequencinghas motivated us to evaluate advance TOD, defined as newconstruction that takes place in station areas after an LRT systemis approved but before it starts operating. We use a variety ofquantitative methods such as cluster analysis, factor analysis,and ANOVA tests to create a typology of LRT station areas basedon geographic characteristics, and use this typology to investigatethe relationships among station-area type, overlay zoning, and thevalue and kind of advance TOD. Our objective is to evaluate therelationship between geography and the amount and type ofadvance TOD that takes place across an LRT system, and to providea baseline for future studies that will investigate how TOD unfoldsover time.

190 C. Atkinson-Palombo, M.J. Kuby / Journal of Transport Geography 19 (2011) 189–199
The paper is laid out as follows. Section 2 contains a review ofliterature that relates to the geography of TOD and an explanationof how this paper builds upon existing research. Sections 3–5contain background information on the study area, details aboutthe data and methods, and the results respectively. The paperconcludes with a discussion of the study’s major findings and po-tential implications for policy.
2 Important because most systems are designed to pass through CBDs (Kahn, 2007;Kuby et al., 2004).
2. Literature review
2.1. Evolution of the TOD concept
The concepts behind TOD are predicated upon creating builtenvironments that service non-motorized and/or public transpor-tation rather than the private automobile. Mixed land uses builtat high density at the human-scale produce places that are condu-cive to walking, biking, bus and rail (Cervero and Kockelman, 1997;Khasnabis, 1998; Konheim and Ketcham, 2000; Schlossberg andBrown, 2004; TCRP, 1996). Bertolini and Split (1998) argued that‘‘the unique challenge of the development of node-places is the needto deal, at the same time, with both transport and urban developmentissues” (cited in Dittmar and Poticha, 2004, p. 32). Case studies ofindividual station areas or projects have shown wide variationsin the form of development at station areas (Breznau, 2004; Feigonet al., 2004; Leach, 2004; Ohland, 2004a,b).
TOD may have multiple objectives (see Renne and Wells (2005)for a comprehensive evaluation of the benefits of TOD). Some ofthose objectives, such as maximizing revenue for the transit agencythrough lucrative ground leases, maximizing ridership, or revitaliz-ing station areas, potentially conflict with each other (Babalik-Sutcliffe, 2002; Belzer et al., 2004; Willson and Menotti, 2007).Realizing TOD benefits therefore requires determining land-useobjectives at particular locations and coordinating objectives sothat stations fulfill complementary functions within a system.
2.2. Geographical variations in TOD
Researchers are increasingly recognizing that TOD can take avariety of forms and individual station areas can serve differentbut complementary functions within a system. Calthorpe (1993)differentiated between neighborhood TODs that are primarily resi-dential and urban TODs that emphasize job-generating uses. Ditt-mar and Poticha (2004) refined this distinction by offering atypology of TOD that included urban downtown, urban neighbor-hood, suburban town center, suburban neighborhood, neighbor-hood transit zone, and commuter town. The City of Denver (2006)identified seven different types of TOD for strategic planning:downtown, major urban center, urban center, urban neighborhood,commuter town center, main street, and campus/special events sta-tion. Each of the types has a desired land-use mix, desired housingtypes, commercial/employment types, proposed scale, and transitsystem function. Greater understanding of how geographic charac-teristics and station-area function interrelate will help to explainwhy TOD unfolds differently across a given system and what publicpolicies encourage development and revitalization in various set-tings (Hess and Lombardi, 2004; Sawicki and Flynn, 1996; Squiresand Kubrin, 2005).
2.3. Relationship between LRT and TOD
Studies of transit systems constructed in the 1980s and early1990s revealed that LRT had little effect on land-use patterns in sta-tion areas (Cervero and Landis, 1997; Landis et al., 1995; Landis andZhang, 1995). This prompted two extensive research studies by theNational Research Council’s Transit Cooperative Research Program,
which offered two explanations for the lack of development in sta-tion areas (TCRP, 1996, 1997). First was the existence of economicbarriers to development that include the comparatively high costof land in the urban core,2 the availability of large tracts of develop-able land on the fringe, the high costs of assembling land parcels forinfill TOD, and the risk of encountering neighborhood opposition toprojects (see also Farris, 2001; Larsen, 2005; Suchman and Sowell,1997). A second explanation was that overlaying transit onto theexisting urban landscape was ineffective because environmentsconfigured for automobiles are not conducive to the pedestrian-scale activity associated with transit use (Cervero and Kockelman,1997; TCRP, 1997). These basic findings for systems in the UnitedStates are echoed in a study that compared system performancein the US, UK, and Canada (Babalik-Sutcliffe, 2002).
LRT is therefore implemented in conjunction with a raft of sup-portive policies designed to encourage TOD (TCRP, 2002, 2004).While we focus in this study on overlay zoning, other public poli-cies, such as financial incentives to encourage public–private part-nerships and station-area master plans, can also impact TOD (Belzeret al., 2004; Boarnet and Crane, 1998; Hess and Lombardi, 2004;Parzen and Sigal, 2004). An important consideration in determiningfuture land use is compatibility with existing land use and theneeds of existing residents (Kahn, 2007; Larsen, 2005), especiallyas neighborhood opposition to development is a frequently citedprominent barrier to TOD (Farris, 2001; Hess and Lombardi, 2004).
2.4. Temporal variations in TOD
TOD is generally accepted to take years—perhaps even decades—to unfold (Boarnet and Compin, 1999; Cervero and Landis, 1997;Hass-Klau et al., 2004), with supportive policies acting as a catalystfor that development (TCRP, 2004). Cervero and Landis (1997) men-tioned that one of the main criticisms of the original BART impactstudies published in 1979 was that they were premature, conductedonly 3–5 years after BART opened. A subsequent study was con-ducted to investigate impacts on land use and development after20 years had elapsed (Cervero, 1995). In their analysis of land-usechange for 25 of the 34 stations in the BART system, Cervero andLandis (1997) found that office development was concentrated inthe downtowns of Oakland and San Francisco, multi-family housingwas built near suburban stations, and some station areas experi-enced little land-use change because of neighborhood oppositionor a lackluster local real-estate market. BART in and of itself hadbeen unable to induce large-scale land-use changes, but under theright circumstances, it appears to have been an important contribu-tor. The main recommendation was that stronger public policy ini-tiatives would be needed to channel future regional growth to BARTcorridors. The resultant broad recommendations provide the foun-dation for current policies relating to LRT and TOD (TCRP, 2004).
Those working on subsequent systems have the benefit oflearning from earlier experiences with LRT and TOD and the exten-sive research undertaken to provide policy suggestions to improvethe chances of achieving policy goals. One idea that was adoptedby the City of Phoenix was to strategically implement overlay zon-ing ahead of LRT construction in an attempt to accelerate land-usechange (City of Phoenix, 2002). This allows for a study of advanceTOD, the first of its kind to be documented in the literature.
3. Study area
Metropolitan Phoenix comprises over 20 separately governedmunicipalities that have merged into the 12th largest metropolitan

Activity centersCity boundaries
USAir Arena
DowntownTempe
Chase Ballpark
Burton Barr Library
Central High School
Heard Museum
ArizonaState
University
Gateway Community College Phoenix Zoo
Salt River
Sky HarborAirport
DowntownPhoenix
PHO
ENIX
TEM
PE
TEMPE
MESA
PHO
ENIX
SCO
TTSD
ALE
PARADISEVALLEY
Rail routeStations with Park & RideOther stations
Station area (1/2 mile walking distance)
One mile buffer
Median household income, 2000 (dollars)
020,00030,00045,00070,000
$ 174,840
Light rail
Urban features
0 1 2 3 mi
0 1 2 3 km
Phoenix
ARIZONA
Fig. 1. The Phoenix metropolitan light-rail system.
1 - PS M
all-PR
2 - 19
th Av-C
amel-
PR
3 - 7t
h Av-C
amel
4 - Cen
tl-Cam
el-PR
5 - Cen
tral H
S
6 - Park 7 -
PC Mall
8 - SJ M
ed 9 - Hea
rd Mus
10 - A
rt/Lib
11 - R
oosv
12 - C
ent S
ta
14 - S
tadium
s
15 - 1
2th
16 - 2
4th
17 - I
nd
18 - A
ir-Ofc
19 - A
ir-Ofc
20 - T
empe
-CBD
21 - A
SU1
22 - A
SU2
23 - A
p1
24 - A
p2-PR
25 - A
p3-PR
26 - 1
01-PR
27 - M
esa-P
R13
- PHX-C
BD
2 -19
th Av-C
amel
7 - PC M
all
8 - SJ M
ed
13 - P
HX-CBD
21 - A
SU1
23 - A
p1
18 - A
irport
Employment and Population Counts Near Stations
0
5.000
10.000
15.000
20.000
25.000
1 3 4 5 6 9 10 11 12 14 15 16 17 20 22 24 25 26 27
EmploymentPopulation
18
Fig. 2. Light-rail transit system, metropolitan Phoenix, Arizona: transit-related overlay zoning, and employment and population counts.
C. Atkinson-Palombo, M.J. Kuby / Journal of Transport Geography 19 (2011) 189–199 191
statistical area in the United States, with an estimated 4.3 millionpeople (US Bureau of the Census, 2008). Housing consists mainlyof subdivisions of single-family houses, with the majority of newdevelopment located at an outwardly expanding urban fringe(Gober and Burns, 2002). Expansion of this nature has been enabledby half a century of transportation policies focused almost exclu-sively on the automobile (Abbitt, 1990; ARPA, 2006; Gober, 2005).Concern about the sustainability of ongoing outward-orientedgrowth prompted a shift in land-use and transportation policies.
LRT is one of a series of initiatives at the local, regional, and state lev-els to promote urban infill and revitalize downtowns (MAG, 2003).
City of Phoenix voters approved funding for an LRT starter sys-tem in 2000, construction began in 2005, and operations began inDecember 2008 (ARPA, 2006; City of Phoenix, 2002, 2004). The sys-tem comprises 20.3 miles of at-grade track that passes through thedowntowns of Phoenix and Tempe to the western edge of Mesa;and 27 stations located in residential neighborhoods, commercialdistricts, and an industrial zone. As one component of an
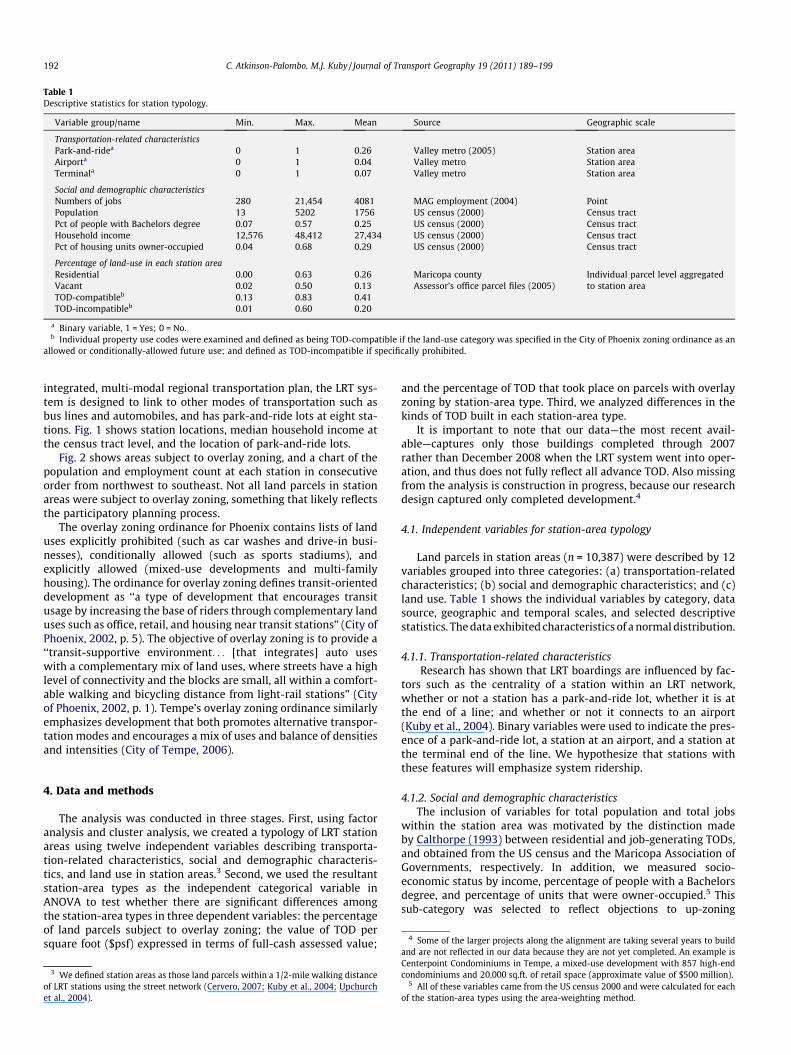
Table 1Descriptive statistics for station typology.
Variable group/name Min. Max. Mean Source Geographic scale
Transportation-related characteristicsPark-and-ridea 0 1 0.26 Valley metro (2005) Station areaAirporta 0 1 0.04 Valley metro Station areaTerminala 0 1 0.07 Valley metro Station area
Social and demographic characteristicsNumbers of jobs 280 21,454 4081 MAG employment (2004) PointPopulation 13 5202 1756 US census (2000) Census tractPct of people with Bachelors degree 0.07 0.57 0.25 US census (2000) Census tractHousehold income 12,576 48,412 27,434 US census (2000) Census tractPct of housing units owner-occupied 0.04 0.68 0.29 US census (2000) Census tract
Percentage of land-use in each station areaResidential 0.00 0.63 0.26 Maricopa county Individual parcel level aggregated
to station areaVacant 0.02 0.50 0.13 Assessor’s office parcel files (2005)TOD-compatibleb 0.13 0.83 0.41TOD-incompatibleb 0.01 0.60 0.20
a Binary variable, 1 = Yes; 0 = No.b Individual property use codes were examined and defined as being TOD-compatible if the land-use category was specified in the City of Phoenix zoning ordinance as an
allowed or conditionally-allowed future use; and defined as TOD-incompatible if specifically prohibited.
192 C. Atkinson-Palombo, M.J. Kuby / Journal of Transport Geography 19 (2011) 189–199
integrated, multi-modal regional transportation plan, the LRT sys-tem is designed to link to other modes of transportation such asbus lines and automobiles, and has park-and-ride lots at eight sta-tions. Fig. 1 shows station locations, median household income atthe census tract level, and the location of park-and-ride lots.
Fig. 2 shows areas subject to overlay zoning, and a chart of thepopulation and employment count at each station in consecutiveorder from northwest to southeast. Not all land parcels in stationareas were subject to overlay zoning, something that likely reflectsthe participatory planning process.
The overlay zoning ordinance for Phoenix contains lists of landuses explicitly prohibited (such as car washes and drive-in busi-nesses), conditionally allowed (such as sports stadiums), andexplicitly allowed (mixed-use developments and multi-familyhousing). The ordinance for overlay zoning defines transit-orienteddevelopment as ‘‘a type of development that encourages transitusage by increasing the base of riders through complementary landuses such as office, retail, and housing near transit stations” (City ofPhoenix, 2002, p. 5). The objective of overlay zoning is to provide a‘‘transit-supportive environment. . . [that integrates] auto useswith a complementary mix of land uses, where streets have a highlevel of connectivity and the blocks are small, all within a comfort-able walking and bicycling distance from light-rail stations” (Cityof Phoenix, 2002, p. 1). Tempe’s overlay zoning ordinance similarlyemphasizes development that both promotes alternative transpor-tation modes and encourages a mix of uses and balance of densitiesand intensities (City of Tempe, 2006).
4 Some of the larger projects along the alignment are taking several years to build
4. Data and methods
The analysis was conducted in three stages. First, using factoranalysis and cluster analysis, we created a typology of LRT stationareas using twelve independent variables describing transporta-tion-related characteristics, social and demographic characteris-tics, and land use in station areas.3 Second, we used the resultantstation-area types as the independent categorical variable inANOVA to test whether there are significant differences amongthe station-area types in three dependent variables: the percentageof land parcels subject to overlay zoning; the value of TOD persquare foot ($psf) expressed in terms of full-cash assessed value;
3 We defined station areas as those land parcels within a 1/2-mile walking distanceof LRT stations using the street network (Cervero, 2007; Kuby et al., 2004; Upchurchet al., 2004).
and the percentage of TOD that took place on parcels with overlayzoning by station-area type. Third, we analyzed differences in thekinds of TOD built in each station-area type.
It is important to note that our data—the most recent avail-able—captures only those buildings completed through 2007rather than December 2008 when the LRT system went into oper-ation, and thus does not fully reflect all advance TOD. Also missingfrom the analysis is construction in progress, because our researchdesign captured only completed development.4
4.1. Independent variables for station-area typology
Land parcels in station areas (n = 10,387) were described by 12variables grouped into three categories: (a) transportation-relatedcharacteristics; (b) social and demographic characteristics; and (c)land use. Table 1 shows the individual variables by category, datasource, geographic and temporal scales, and selected descriptivestatistics. The data exhibited characteristics of a normal distribution.
4.1.1. Transportation-related characteristicsResearch has shown that LRT boardings are influenced by fac-
tors such as the centrality of a station within an LRT network,whether or not a station has a park-and-ride lot, whether it is atthe end of a line; and whether or not it connects to an airport(Kuby et al., 2004). Binary variables were used to indicate the pres-ence of a park-and-ride lot, a station at an airport, and a station atthe terminal end of the line. We hypothesize that stations withthese features will emphasize system ridership.
4.1.2. Social and demographic characteristicsThe inclusion of variables for total population and total jobs
within the station area was motivated by the distinction madeby Calthorpe (1993) between residential and job-generating TODs,and obtained from the US census and the Maricopa Association ofGovernments, respectively. In addition, we measured socio-economic status by income, percentage of people with a Bachelorsdegree, and percentage of units that were owner-occupied.5 Thissub-category was selected to reflect objections to up-zoning
and are not reflected in our data because they are not yet completed. An example isCenterpoint Condominiums in Tempe, a mixed-use development with 857 high-endcondominiums and 20,000 sq.ft. of retail space (approximate value of $500 million).
5 All of these variables came from the US census 2000 and were calculated for eachof the station-area types using the area-weighting method.

Fig. 3. Land use in LRT station-area types, metropolitan Phoenix, Arizona.
C. Atkinson-Palombo, M.J. Kuby / Journal of Transport Geography 19 (2011) 189–199 193
contained in new urbanist projects (e.g. Farris, 2001) and the exis-tence of NIMBY-ism that has been documented in more general lit-erature (Dear, 1992; Deng, 2003; Ellis, 2004; Lake, 1993; Pendall,1999), both of which have shown that existing residents can influ-ence future development.
The chart inset in Fig. 2 shows population and employmentcounts for each station area. Two station areas stand out as prom-inent centers of employment—St. Joseph’s Medical Center (SJ Med)located on Central Avenue, a main commercial thoroughfare linedwith cultural facilities and public landmarks such as the Heard Mu-seum and the Burton Barr Central Library—and the downtownPhoenix CBD. Two sub-centers of employment with 5000–10,000employees are PC Mall, also on Central Avenue, and ASU1, the sta-tion serving both Arizona State University and downtown Tempe.
4.1.3. Land useExisting land use is an important determinant of future devel-
opment (Cervero, 1995; Cervero and Landis, 1997; Knight andTrygg, 1977). We hypothesize that the amount of land in residen-tial use, the amount of vacant land, and the extent to which exist-ing non-residential uses are compatible or not with TOD willinfluence the amount and form of TOD. We therefore created fourmutually exclusive categories of land-use: residential, vacant,TOD-compatible, and TOD-incompatible.6 A parcel was defined asbeing TOD-compatible if it is neither residential nor vacant and itsproperty use code (obtained from the Maricopa County Assessor Of-fice dataset) would be allowed for future development in the overlayzoning ordinances for the cities of Phoenix and Tempe. Those land-use categories expressly stipulated as being prohibited for futuredevelopment were designated as TOD-incompatible. The reason that
6 Aggregation was carried out to reduce over 2000 land uses to a more manageablenumber of categories. Theoretically, TOD will contain a mix of uses that includesresidential units.
vacant land was assigned its own category is that while some parcelscould potentially become TOD in the future, other parcels are formerindustrial brownfields and superfund sites, and in flood zones. Be-cause of the difficulties associated with creating a scale of developa-bility for vacant land, we decided to treat it as a separate category.
Fig. 3 shows the percentage of land use at each station, goingfrom northwest to southeast along the LRT alignment. Table 2shows the station names along with a brief description of the sta-tion area. Two clusters of primarily residential station areas—where residential land use averages 54% of the station area—arepresent at the terminals (see Fig. 3). The figure also shows a clusterof station areas with a high percentage of vacant land in the indus-trial corridor near the airport.
4.2. Station-area typology
The resultant data matrix consisted of 27 rows, one for each sta-tion, and 12 columns, one for each variable. The variables were fac-tor analyzed to identify relationships among the variables, and theemergent factors were used to group stations using cluster analy-sis. Factor analysis was performed prior to the cluster analysis toreduce multicollinearity in the variables (Lawley, 1971). Then,using the resultant matrix of stations in rows and factors in col-umns, stations were grouped using cluster analysis. Cluster analy-sis is an unsupervised method for creating taxonomies when thenumber of clusters is not known in advance. In cluster analysis, aseries of partitions takes place, running from a single cluster con-taining all observations to clusters that each contains a singleobservation. At any stage of the clustering process, those observa-tions within each cluster are more closely related to one anotherthan objects assigned to different clusters. Clustering was per-formed using Ward’s method, which uses a sum of squares criteriato maximize between group differences and minimize within-group differences (Mikelbank, 2004).

Table 2Station names.
# Abbreviations Descriptions (official station name is in bold)
1 PS Mall-PR Phoenix Spectrum Mall and park-and-ride atMontebello/19th Ave.
2 19Av-Camel-PR
Residential and park-and-ride at 19th Ave. /CamelbackRd.
3 7 Av-Camel 7th Ave./Camelback Rd.4 Cent-Camel-
PRPark-and-ride at Central Ave./Camelback Rd.
5 Cent HS Central, Brophy, and Xavier High Schools at CampbellAve./Central Ave.
6 Park Indian School Park at Indian School/Central Ave.7 PC Mall Park Central Mall at Osborn/Central Ave.8 SJMed St. Joseph’s Medical Center at Thomas/Central Ave.9 Heard Mus Heard Museum at Encanto/Central Ave.10 Art/Lib Phoenix Art Museum and Phoenix Central Library at
McDowell/Central Ave.11 Roosv Roosevelt/Central Ave. gentrifying neighborhood12 Cent Sta Van Buren/Central Ave./1st Ave. transfer station. Also
near Arizona Center downtown mall/offices.13 CBD Washington/Central Ave./1st Ave. at the heart of the
CBD.14 Stadiums 3rd St./Washington/Jefferson at the pro basketball and
baseball stadiums.15 12th 12th St./Washington/Jefferson16 24th West end of the airport (no connection) at 24th St./
Washington/Jefferson17 Ind Industrial facilities at 38th St./Washington18 Airport Sky Harbor Airport access and Gateway Community
College at 44th St./Washington19 Air1 ‘‘Edge City” office and industrial area near Sky Harbor
Airport at Priest Dr./Washington20 TempeCBD Downtown Tempe shopping and offices at Mill Ave./
Third21 ASU1 Arizona State University football stadium at Veterans
Way/College Ave.22 ASU2 East side of Arizona State University at University Dr./
Rural23 Ap1 Low-income housing and student apartments at
McClintock/Apache Blvd.24 Ap2-PR Low-income housing, student apartments, and park-
and-ride at McClintock/Apache Blvd.25 Ap3-PR Low-income housing, industry and park-and-ride at
Smith-Martin/Apache Blvd.26 101-PR Park-and-ride at Price-101 Freeway/Apache Blvd.27 Mesa-PR Park-and-ride near Motorola plant at Sycamore/Main
St. in Mesa, AZ
Table 3Factor loadings for individual variables.
Extraction method: principal component analysis.a Binary variables.
194 C. Atkinson-Palombo, M.J. Kuby / Journal of Transport Geography 19 (2011) 189–199
4.3. Advance TOD
Land parcels that experienced construction from 2000 through2007 and were located either in station areas or on parcels subjectto overlay zoning (n = 748) were identified, along with fields iden-tified whether or not parcels were subject to overlay zoning, thetype of land use, the area, and the full-cash value (FCV) of land plusimprovements. We used this dataset to quantify the FCV (in dol-lars) by station area in total and by $psf of TOD that took placein between 2000, when overlay zoning was adopted and LRT sta-tions were announced, and 2007, a year before the LRT system be-gan operating.
4.4. ANOVA tests
Three sets of ANOVAs tested whether there are statistically sig-nificant differences in mean values of a dependent variable amonggroups of station areas defined by a categorical independent vari-able (Devore and Peck, 2001). The dependent variables testedwere: the percentage of land parcels that were subject to overlayzoning; the mean values of advance TOD ($psf); and the proportionof advance TOD that took place on parcels with overlay zoning. Theindependent variable is station-area type, as defined by the clusteranalysis.
5. Results
5.1. Station typology
Factor analysis produced five vectors that explained 80% of var-iation in the variables. Several rotations were explored, and themost interpretable set of factor loadings (Lawley, 1971) are pre-sented in Table 3. Vector A had high loadings for income and thepercentage of houses that are owner-occupied at 97% and 94%,respectively, suggesting a socio-economic measure. Vector Bshowed a high degree of correlation between the number of jobsand the percentage of land that is TOD-compatible (81% and95%), suggesting a measure of employment and amenity. VectorC, with a high negative loading of �83% on the percentage of peo-ple with a Bachelors degree and a high positive loading of 80% onland use that is TOD-incompatible, reflects areas of urban poverty.Vector D is most notable for an 84% loading on the percentage ofland in residential use, 70% on the population count, and �75%on vacant land, suggesting a vector that is highly populated resi-dential with little vacant land. Finally, vector E reflects transporta-tion nodes, loading 90% on the binary variable terminal and 78% onthe binary variable park-and-ride.
The hierarchical cluster analysis produced five natural groups(Everitt, 1993) whose descriptive statistics are shown in Table 4.Fig. 4 shows how types are distributed across the system.
Group 1 consists of eight stations with high mean values for thepercentages of people with a Bachelors degree (39%) and owner-occupied housing (31%), and median household income of$30,302, approximately 62% of the median household income forthe Greater Phoenix Area (GPEC, 2006). These characteristics, alongwith an average employment count of 3799 and population countof 1465, suggest a classification of ‘‘Middle-Income Mixed-Use.”Station 6, located at Indian School Road and Central Avenue is rep-resentative of this group. Central Avenue, one of the main thor-oughfares into downtown Phoenix, is an important commercialarea, lined with private-sector office towers interspersed with ser-vices and landmarks such as the Heard Museum and the BurtonBarr Public Library. Densely populated residential neighborhoodslie behind the main commercial strip.
Group 2 consists of two stations set apart by a very highemployment count (21,146), and a high percentage of land useclassified as TOD-compatible (71%), suggesting these stations are‘‘Employment and Amenity Centers.” A representative station ofthis category is close to the peak-value intersection of the PhoenixCBD, located at Washington/Jefferson Streets and Central Avenue.

Table 4Descriptive statistics of five station-area types.
Middle-incomemixed-use
Employment &amenity centers
Urbanpoverty
High populationresidential
Transportationnodes
N 8 2 7 5 5
Transportation-related characteristicsPark-and-Ridea 0 0 0 0.40 1.00Airporta 0 0 0.14 0 0Terminala 0 0 0 0 0.40
Social and demographic characteristicsNumbers of jobs 3799 21,146 3521 932 1638Population 1465 1236 870 3772 1656Pet of people with Bachelors degree 39% 25% 12% 28% 20%Household Income $30,302 $28,232 $19,202 $26,959 $34,526Pet of housing units owner-occupied 31% 29% 19% 24% 43%
Percentage of land-use in each station area (%)Residential 23 10 9 56 31Vacant 21 2 13 6 12TOD-compatible 46 71 44 24 35TOD-incompatible 9 17 34 14 22
a Binary variables.
0 1 2 3 mi
0 1 2 3 km PHO
ENIX
TEM
PE
One mile buffer
Rail route
1 - PS M
all-PR
2 - 19
th Av-C
amel-
PR
3 - 7t
h Av-C
amel
4 - Cen
tl-Cam
el-PR
5 - Cen
tral H
S
6 - Park 7 -
PC Mall
8 - SJ M
ed 9 - Hea
rd Mus
10 - A
rt/Lib
11 - R
oosv
12 - C
ent S
ta
14 - S
tadium
s
15 - 1
2th
16 - 2
4th
17 - I
nd
19 - A
ir-Ofc
20 - T
empe
-CBD
22 - A
SU2
21 - A
SU1
23 - A
p1
24 - A
p2-PR
25 - A
p3-PR
26 - 1
01-PR
27 - M
esa-P
R
13 - P
HX-CBD
18 - A
irport
Percentage of land parcels with overlay zoning
Station-areatypes
0 10 20 30 40 50 60 %
Middle-Income Mixed Use
Employment and Amenity Centers
Areas of Urban Poverty
High Population RentalNeighborhoods
Transportation Nodes
Percentage of single-family houses with overlay zoning
0 5 10 15 20 25 30 35 %
Fig. 4. Station-area types.
C. Atkinson-Palombo, M.J. Kuby / Journal of Transport Geography 19 (2011) 189–199 195
Much of the station area comprises government offices and ser-vices, with only 10% of land by area devoted to residential use.The other station-area in this category is St. Joseph’s Medical Cen-ter located at Osborn and Central Avenue, which contains densehigh-rise commercial buildings.
Group 3 comprises seven stations characterized by the lowestvalues of all five groups for median household income ($19,202),percentages of people with a Bachelors degree (12%), and owner-occupancy (19%); and the highest of land use that is TOD-incom-patible (34%). These characteristics suggest areas of ‘‘UrbanPoverty” located in disamenity areas. Representative of this groupis the station located at Washington Street and 12th Street, be-tween the Phoenix CBD and Sky Harbor Airport. This station areacontains low-income residential neighborhoods interspersed withwarehouses and light industry associated with the nearby airport.
Station-area type 4 contains five stations, characterized by ahigh percentage of land in residential use (56%), low owner-occu-pancy rates (24%), and a high population count (3772), suggestinga classification of ‘‘High Population Rental” neighborhoods. A rep-resentative station, located at McClintock Road and Apache Boule-vard, features trailer parks and motels built in the 1950s and 1960sthat serve as low-income rental housing and large concentrationsof college students in apartments and shared houses. Factors dif-ferentiating these areas from those classified as Urban Povertyare average median income ($26,959 versus $19,202) and percent-age of people with a Bachelors degree (28% versus 12%).
Group 5 comprises stations with park-and-ride lots, and highrates of owner-occupied housing (43%), suggesting a classificationof ‘‘Transportation Node.” The terminal station in the northwesternend of the system (PS Mall-PR) is typical of this group. It comprises
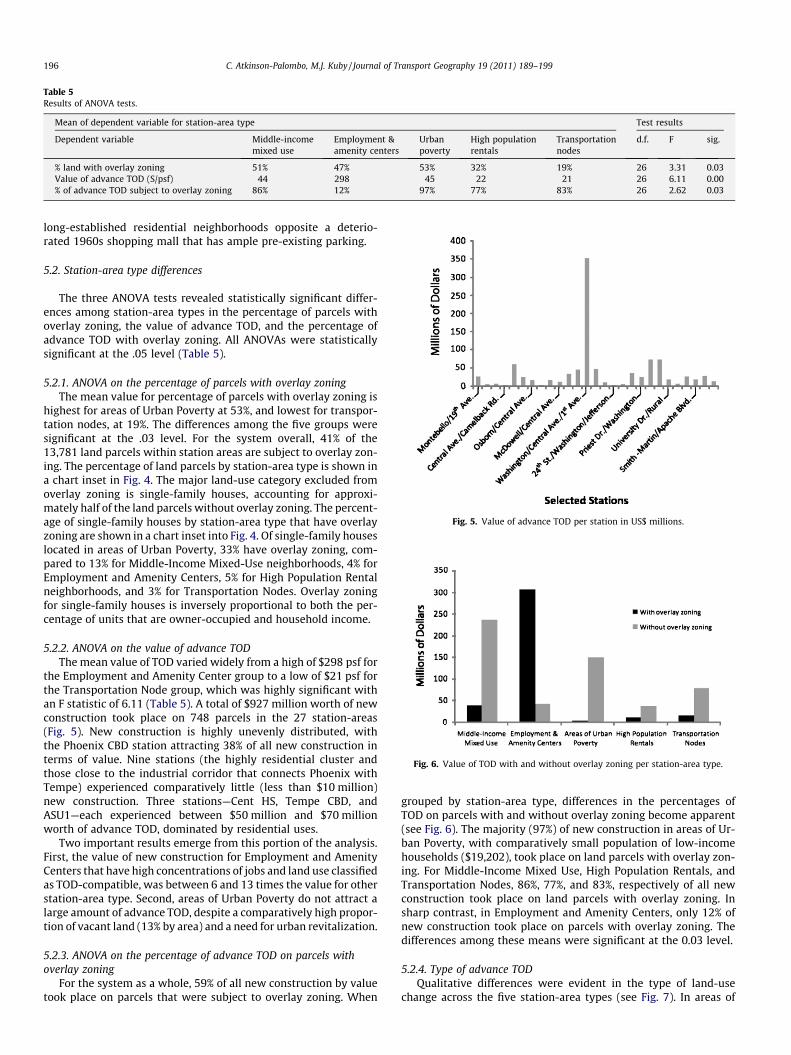
Fig. 5. Value of advance TOD per station in US$ millions.
Fig. 6. Value of TOD with and without overlay zoning per station-area type.
Table 5Results of ANOVA tests.
Mean of dependent variable for station-area type Test results
Dependent variable Middle-incomemixed use
Employment &amenity centers
Urbanpoverty
High populationrentals
Transportationnodes
d.f. F sig.
% land with overlay zoning 51% 47% 53% 32% 19% 26 3.31 0.03Value of advance TOD (S/psf) 44 298 45 22 21 26 6.11 0.00% of advance TOD subject to overlay zoning 86% 12% 97% 77% 83% 26 2.62 0.03
196 C. Atkinson-Palombo, M.J. Kuby / Journal of Transport Geography 19 (2011) 189–199
long-established residential neighborhoods opposite a deterio-rated 1960s shopping mall that has ample pre-existing parking.
5.2. Station-area type differences
The three ANOVA tests revealed statistically significant differ-ences among station-area types in the percentage of parcels withoverlay zoning, the value of advance TOD, and the percentage ofadvance TOD with overlay zoning. All ANOVAs were statisticallysignificant at the .05 level (Table 5).
5.2.1. ANOVA on the percentage of parcels with overlay zoningThe mean value for percentage of parcels with overlay zoning is
highest for areas of Urban Poverty at 53%, and lowest for transpor-tation nodes, at 19%. The differences among the five groups weresignificant at the .03 level. For the system overall, 41% of the13,781 land parcels within station areas are subject to overlay zon-ing. The percentage of land parcels by station-area type is shown ina chart inset in Fig. 4. The major land-use category excluded fromoverlay zoning is single-family houses, accounting for approxi-mately half of the land parcels without overlay zoning. The percent-age of single-family houses by station-area type that have overlayzoning are shown in a chart inset into Fig. 4. Of single-family houseslocated in areas of Urban Poverty, 33% have overlay zoning, com-pared to 13% for Middle-Income Mixed-Use neighborhoods, 4% forEmployment and Amenity Centers, 5% for High Population Rentalneighborhoods, and 3% for Transportation Nodes. Overlay zoningfor single-family houses is inversely proportional to both the per-centage of units that are owner-occupied and household income.
5.2.2. ANOVA on the value of advance TODThe mean value of TOD varied widely from a high of $298 psf for
the Employment and Amenity Center group to a low of $21 psf forthe Transportation Node group, which was highly significant withan F statistic of 6.11 (Table 5). A total of $927 million worth of newconstruction took place on 748 parcels in the 27 station-areas(Fig. 5). New construction is highly unevenly distributed, withthe Phoenix CBD station attracting 38% of all new construction interms of value. Nine stations (the highly residential cluster andthose close to the industrial corridor that connects Phoenix withTempe) experienced comparatively little (less than $10 million)new construction. Three stations—Cent HS, Tempe CBD, andASU1—each experienced between $50 million and $70 millionworth of advance TOD, dominated by residential uses.
Two important results emerge from this portion of the analysis.First, the value of new construction for Employment and AmenityCenters that have high concentrations of jobs and land use classifiedas TOD-compatible, was between 6 and 13 times the value for otherstation-area type. Second, areas of Urban Poverty do not attract alarge amount of advance TOD, despite a comparatively high propor-tion of vacant land (13% by area) and a need for urban revitalization.
5.2.3. ANOVA on the percentage of advance TOD on parcels withoverlay zoning
For the system as a whole, 59% of all new construction by valuetook place on parcels that were subject to overlay zoning. When
grouped by station-area type, differences in the percentages ofTOD on parcels with and without overlay zoning become apparent(see Fig. 6). The majority (97%) of new construction in areas of Ur-ban Poverty, with comparatively small population of low-incomehouseholds ($19,202), took place on land parcels with overlay zon-ing. For Middle-Income Mixed Use, High Population Rentals, andTransportation Nodes, 86%, 77%, and 83%, respectively of all newconstruction took place on land parcels with overlay zoning. Insharp contrast, in Employment and Amenity Centers, only 12% ofnew construction took place on parcels with overlay zoning. Thedifferences among these means were significant at the 0.03 level.
5.2.4. Type of advance TODQualitative differences were evident in the type of land-use
change across the five station-area types (see Fig. 7). In areas of

Fig. 7. Type of TOD per station-area type.
C. Atkinson-Palombo, M.J. Kuby / Journal of Transport Geography 19 (2011) 189–199 197
High Population Rentals and Transportation Nodes, which have thehighest percentages of land devoted to residential uses (56% and31%, respectively), advance TOD housing is multi-family ratherthan condos, and other types of land use have been built includingoffices and shopping. Middle-Income Mixed-Use areas that have
large amounts of jobs as well as population (means of 3799 and1465, respectively) attract a variety of kinds of advance TOD thatincludes condos, multi-family housing, and offices. Station-areatypes are emerging as nodes to feed passengers onto the transpor-tation system, akin to the residential TODs identified by Calthorpe

198 C. Atkinson-Palombo, M.J. Kuby / Journal of Transport Geography 19 (2011) 189–199
(1993). Amenities are being added to these station areas to rein-force the mix of uses.
Substantial differences in the absolute amount of TOD suggestthat locations that already have a high percentage of land inTOD-permitted uses reinforce their role as centers of employmentand amenity. Of note is that while areas of Urban Poverty are expe-riencing similar kinds of new construction to Employment andAmenity Centers, the absolute amount is much smaller.
6. Discussion and conclusions
The research produced three significant findings, detailed belowin order of significance, followed by a discussion of their potentialto inform public policy. First is that overlay zoning was strategic interms of location as well as timing. Phoenix-area planners enactedoverlay zoning in areas of Urban Poverty (affecting 53% of all landparcels by area), and tended to avoid single-family houses in long-standing neighborhoods such as those in our transportation nodesgroup. The ordering is consistent with existing research on NIMBY-ism that suggests that the percentage of land in residential use andrates of owner-occupancy influence overlay zoning and the place-ment of parking lots associated with LRT7 (Dear, 1992; Pendall,1999), and the research conducted by Kahn (2007) on which neigh-borhoods get treated with park-and-ride versus walk-and-ride.
Second, the value of advance TOD is highly variable by stationand station-area type and strongly influenced by existing landuse. Station areas with a critical mass of land use that is compatiblewith TOD, such as Employment and Amenity Centers, attract ad-vance TOD, although much of this is public rather than privatedevelopment8. Locations such as areas in Urban Poverty with a highpercentage of land uses that are not conducive to TOD have a dispro-portionately low share of TOD in terms of value. While barriers toTOD exist, as suggested by TCRP (1997, 2004), they have a geo-graphic dimension and are higher in some locations than in others.More aggressive public policies may be needed to redress some ofthe imbalances between locations to redirect development to areasin need of urban revitalization.
Third is that differences exist in the type of advance TOD thattakes place in different station-area types. Employment and Ame-nity Centers attract the development of public amenities that fur-ther reinforce their central role. Areas of urban poverty attractcondo development, along with publicly funded developmentsaimed at urban revitalization. In Middle-Income Mixed-Use neigh-borhoods and High Population Rental neighborhoods, a large pro-portion of advance TOD is residential. These areas—which areakin to the neighborhood TODs described by Calthorpe (1993)—are developing in ways that will enhance the ridership base andprovide amenities at station areas for transit riders. For example,in the Transportation Nodes station areas, a high percentage of ad-vance TOD is shopping. While the latter two findings are not unex-pected, they had not been studied before with respect to TOD inadvance of system operation.
The methodology for basing a station typology on quantitativegeographic variables may be useful to policy-makers because thecategories provide insight into income, housing tenure, andwhether or not existing land uses are compatible with TOD. Forexample, areas of Urban Poverty are substantively different from
7 In his extensive investigation into whether TOD produces gentrification, Kahn(2007) emphasizes the importance of controlling for pre-existing geographic char-acteristics in determining the effects of TOD on walk-and-ride versus park-and-ridestations. The typology presented here suggests that there are material differences instation areas that host parking lots and those that do not, confirming the presence ofendogeneity.
8 This differentiation is determined by the Property-Use Codes—land and buildingsowned by municipal, county, and federal government entities have separate codes.
High Population Rental neighborhoods in terms of demographics,with comparatively lower income and percentage of people witha Bachelor’s degree, and land use (with more land that is TOD-incompatible than residential), and in the extent and form ofTOD that they attract (condos and government uses versus mul-ti-family housing). This delineation may offer more insight thanthe categories suggested by Dittmar and Poticha (2004) such as ur-ban neighborhood and suburban neighborhood that may be sub-ject to interpretation. In a similar vein, highlighting the existenceof Employment and Amenity centers rather than urban downtownor suburban town center, may provide a more objective way toportray locations in contemporary polycentric metropolitan areaswhere jobs tend to be more highly dispersed.
One issue that warrants mention is that of project sequencing.Farris (2001) described how development generally takes placein the most desirable locations first, and once they become builtout, developers rotate to neighborhoods that were initially less-desirable. This suggests that as the process of land-use change un-folds, the proportion of TOD for each station-area type will changeover time, with more development taking place in areas that wereinitially considered ‘‘less developable.” Farris (2001) cautioned thatthe spatial spillovers are often interrupted by business cycles anddownturns in the real-estate market. With specific regard tolight-rail, an additional factor that may interrupt the spatial spill-over process is system expansion. Once new stations are addedto the system, these new locations will compete for resources.Some locations may not be developed if opportunities for greaterprofit open up elsewhere along the LRT system.
Finally, the analysis presented in this study may serve as a use-ful baseline from which to measure how TOD unfolds over time toprovide an empirical test of the extent to which advance TODshapes the long-term evolution of station areas (Cervero, 1995;Cervero and Landis, 1997; Farris, 2001; Hess and Lombardi, 2004).
References
Abbitt, J.W., 1990. History of Transit in the Valley of the Sun: a History of PublicTransportation in Phoenix, Arizona, 1887–1989. Public Transit Department,Phoenix, Arizona.
AG, M., 2003. Growing Smarter Implementation Project Best Practices: Transit-oriented Development. Maricopa Association of Governments, Phoenix,Arizona.
ARPA, 2006. History of Transportation Elections in the Valley of the Sun, 1960–2000. Arizona Rail Passenger’s Information 2006. (accessed 15.11.2006).
Babalik-Sutcliffe, E., 2002. Urban rail systems: analysis of the factors behindsuccess. Transport Reviews 22 (4), 415–447.
Belzer, Dena, Autler, Gerald, Espinosa, Judith, Feigon, Sharon, Ohland, Gloria, 2004.The transit-oriented development drama and its actors. In: Dittmar, H., Ohland,G. (Eds.), The New Transit Town: Best Practices in Transit-orientedDevelopment. Island Press, Washington, Covelo and London.
Bernick, M., Cervero, R., 1997. Transit Villages for the 21st Century. McGraw Hill,New York.
Bertolini, L., Split, T., 1998. City on Rails: the Redevelopment of Railway StationAreas. Routledge, New York and London.
Boarnet, M.G., Compin, N.S., 1999. Transit-oriented development in San Diegocounty – the incremental implementation of a planning idea. Journal of theAmerican Planning Association 65 (1), 80–95.
Boarnet, M.G., Crane, R., 1998. Public finance and transit-oriented planning: newevidence from southern California. Journal of Planning Education and Research17 (3), 206–219.
Breznau, Shanti., 2004. The San Jose case study: Ohlone-Chynoweth station. In:Dittmar, H., Ohland, G. (Eds.), The New Transit Town: Best Practices in Transit-oriented Development. Island Press, Washington, Covelo and London.
Calthorpe, Peter, 1993. The Next American Metropolis: Ecology, Community and theAmerican Dream. Princeton Architectural Press, New York.
Cervero, R., 1995. Bart @ 20: Land Use and Development Impacts. Institute of Urbanand Regional Development, Berkeley.
Cervero, R., Duncan M., 2002. Transit’s Value-added Effects – Light and CommuterRail Services and Commercial Land Values. In: Travel Demand And Land Use2002.
Cervero, R, 2007. Transit-oriented development’s ridership bonus: a product of self-selection and public policies. Environment and Planning A 39 (9), 2068–2085.
Cervero, R., Kockelman, K.M., 1997. Travel demand and the 3Ds: density, diversity,and design. Transportation Research Part D-Transport and Environment 3, 199–219.

C. Atkinson-Palombo, M.J. Kuby / Journal of Transport Geography 19 (2011) 189–199 199
Cervero, R., Landis, J., 1997. Twenty years of the Bay Area Rapid Transit System: landuse and development impacts. Transportation Research Part A-Policy andPractice 31 (4), 309–333.
City and County of Denver, 2006. Transit-oriented Development Strategic Plan.Community Planning and Development, Denver, Colorado.
City of Phoenix, Arizona, 2002. Interim Transit-oriented District Overlay ZoningOrdinance, edited by C. o. P. P. Department: City of Phoenix PlanningDepartment.
City of Phoenix, Arizona. 2004. Downtown Phoenix: A Strategic Vision and Blueprintfor the Future.
City of Portland, Oregon, 2008. Portland Online, edited by B. o. D. S. (BDS). Portland,Oregon, City of Portland.
City of Tempe, Arizona. 2006. City of Tempe, Arizona, Zoning and DevelopmentCode (Amended), edited by P. Department.
Dear, M., 1992. Understanding and overcoming the nimby syndrome. Journal of theAmerican Planning Association 58 (3), 288–300.
Deng, F.F., 2003. The rebound of private zoning: property rights and localgovernance in urban land use. Environment and Planning A 35 (1), 133–149.
Devore, J., Peck, R., 2001. The Exploration and Analysis of Data, 4th ed. Duxbury,Pacific Grove, CA.
Dittmar, Hank, Poticha, Shelley, 2004. Defining transit-oriented development: thenew regional building block. In: Dittmar, H., Ohland, G. (Eds.), The New TransitTown: Best Practices in Transit-oriented Development. Island Press,Washington, Covelo and London.
Ellis, G., 2004. Discourses of objection: towards an understanding of third-partyrights in planning. Environment and Planning A 36 (9), 1549–1570.
Everitt, B., 1993. Cluster Analysis. Halstead Press, London, New York.Ewing, R., Bartholemew, K., Winkelman, S., Walters, J., Chen, D., 2008. Growing
Cooler: the Evidence on Urban Development and Climate Change. Urban LandInstitute, Washington, DC.
Farris, J.T., 2001. The barriers to using urban infill development to achieve smartgrowth. Housing Policy Debate 12 (1), 1–30.
Feigon, Sharon, Hoyt, David, Ohland, Gloria, 2004. The Atlanta Case Study:Lindbergh City Center. In: Dittmar, H., Ohland, G. (Eds.), The New TransitTown: Best Practices in Transit-oriented Development. Island Press,Washington, Covelo and London.
Gober, P., 2005. Metropolitan Phoenix: Place-making and Community-Building inthe Desert. University of Pennsylvania Press, Philadelphia, PA.
Gober, P., Burns, E.K., 2002. The size and shape of Phoenix’s urban fringe. Journal ofPlanning Education and Research 21 (4), 379–390.
GPEC, 2006. Growth in Metropolitan Phoenix Municipalities. (accessed 01.09.2006).Hass-Klau, C., Crampton, G., Benjari, R., 2004. Economic Impact of Light Rail: the
Results of Fifteen Urban Areas in France, Germany, UK and North America.Environmental and Transportation Planning, Brighton, UK.
Hess, D.B., Lombardi, P.A., 2004. Policy support for and barriers to transit-orienteddevelopment in the inner city – literature review. In: Transit Planning AndDevelopment, Management And Performance, Marketing And Fare Policy, AndCapacity And Quality Of Service.
Kahn, M.E., 2007. Gentrification trends in new transit-oriented communities:evidence from 14 cities that expanded and built rail transit systems. Real EstateEconomics 35 (2), 155–182.
Khasnabis, S., 1998. Land use and transit integration and transit use incentives. In:Transit Planning, Management, Marketing, New Technology, Capacity, And QualityOf Service.
Knight, R.L., Trygg, L.L., 1977. Evidence of land-use impacts of rapid transit systems.Transportation 6 (3), 231–247.
Konheim, C.S., Ketcham, B., 2000. Effective transit requires walkable communities –land use lessons of transport patterns in four world cities. In: TransportationLand Use and Smart Growth – Planning and Administration.
Kuby, M., Barranda, A., Upchurch, C., 2004. Factors influencing light-rail stationboardings in the United States. Transportation Research Part A-Policy andPractice 38 (3), 223–247.
Lake, R.W., 1993. Planners Alchemy transforming nimby to yimby. Journal of theAmerican Planning Association 59 (1), 87–93.
Landis, J., Zhang, M., 1995. BART and metropolitan land-use change: 1985–1990. In:Landis, J., Guhathakurta, S., Huang, W., Zhang, M., Fukuji, B., Sen, S. (Eds.), RailTransit Investments, Real Estate Values, and Land Use Change: a ComparativeAnalysis of Five California Rail Transit Systems. Institute of Urban and RegionalDevelopment, Berkeley, California.
Landis, J., Zhang, M., Fukuji, B., Sen, S., 1995. Rail transit investments and stationareas land-use changes: 1965–1990. In: Landis, J., Guhathakurta, S., Huang, W.,Zhang, M., Fukuji, B., Sen, S. (Eds.), Rail Transit Investments, Real Estate Values,and Land Use Change: a Comparative Analysis of Five California Rail TransitSystems. Institute of Urban and Regional Development, Berkeley, California.
Larsen, K., 2005. New urbanism’s role in inner-city neighborhood revitalization.Housing Studies 20 (5), 795–813.
Lawley, D.N., 1971. Factor Analysis as a Statistical Method. Butterworths, London.Leach, D., 2004. The Arlington County case study, Rosslyn–Ballston corridor. In:
Dittmar, H., Ohland, G. (Eds.), The New Transit Town: Best Practices in Transit-oriented Development. Island Press, Washington, Covelo and London.
Mikelbank, B.A., 2004. A typology of US suburban places. Housing Policy Debate 15(4), 935–963.
Ohland, Gloria., 2004a. The Dallas case study: Mockingbird Station and AddisonCircle. In: Dittmar, H., Ohland, G. (Eds.), The New Transit Town: Best Practices inTransit-oriented Development. Island Press, Washington, Covelo, London.
Ohland, Gloria., 2004b. The San Diego case study: Barrio Logan’s Mercado project.In: Dittmar, H., Ohland, G. (Eds.), The New Transit Town: Best Practices inTransit-oriented Development. Island Press, Washington, Covelo, London.
Parzen, Julia, Sigal, Abby Jo, 2004. Financing Transit-oriented Development. In:Dittmar, H., Ohland, G. (Eds.), The New Transit Town: Best Practices in Transit-oriented Development. Island Press, Washington, Covelo and London.
Pendall, R., 1999. Opposition to housing – NIMBY and beyond. Urban Affairs Review35 (1), 112–136.
Renne, John L., and Wells, Jan S., 2005. Transit-oriented Development: Developing aStrategy to Measure Success. In: Jenks, C.W. (Ed.), Transportation ResearchBoard of the National Academies, Washington, DC.
Salvensen, D., 1996. Promoting transit-oriented development. Urban Land 37, 31–35.
Sawicki, D.S., Flynn, P., 1996. Neighborhood indicators: a review of the literatureand an assessment of conceptual and methodological issues. Journal of theAmerican Planning Association 62 (2), 165–183.
Schlossberg, M., Brown, N., 2004. Comparing transit-oriented development sites bywalkability indicators. In: Transit Planning and Development, Management andPerformance, Marketing and Fare Policy, and Capacity and Quality of Service.
Squires, G. (Ed.), 2002. Urban Sprawl: Causes, Consequences, and Policy Responses.The Urban Institute Press, Washington, DC.
Squires, G., Kubrin, C.E., 2005. Privileged places: race, uneven development and thegeography of opportunity in urban America. Urban Studies 42 (1), 47–68.
Suchman, Diane R., Sowell, Margaret B., 1997. Developing Infill Housing in Inner-City Neighborhoods. Urban Land Institute, Washington, DC.
TCRP, 1996. Commuter and Light Rail Transit Corridors: The Land Use Connection.Transit Cooperative Research Program, Washington, DC.
TCRP, 1997. The role of transit in creating livable metropolitan communities. In:Project for Public Spaces, Transportation Research Board, National ResearchCouncil, Washington, DC.
TCRP, 2002. Transit-oriented development and joint development in the UnitedStates: a literature review. In: Research Results Digest. Transit-CooperativeResearch Program, Washington, DC.
TCRP, 2004. Transit-oriented development in the United States: experiences,challenges, and prospects. In: Research Results Digest, Transit-CooperativeResearch Program, Washington, DC.
Upchurch, C., Kuby, M., Zoldack, M., Barranda, A., 2004. Using GIS to generatemutually exclusive service areas linking travel on and off a network. Journal ofTransport Geography 12, 23–33.
US Bureau of the Census, 2008. State and County QuickFacts.Willson, R., Menotti, V., 2007. Commuter parking versus transit-oriented
development – evaluation methodology. Transportation Research Record2021, 118–125.