Structural analysis of FAD synthetase from Corynebacterium ammoniagenes
Upload
khangminh22Category
view
0download
0
THE GENETICS OF MYCOLIC ACIDS BIOSYNTHESIS IN
CORYNEBACTERIUM GLUTAMICUM
By
SAYYADA AIVIATUL HAFEEZ
A thesis submitted for the degree of
Doctor o£_EIlilosophy
I* LIBRARY • !
Victoria University
Food Safety Authenticity and Quality unit
Australia

WER THESIS 572.829373 HAF 30001008803837 Hafeez, Sayyada Amatul The genetics of mycolic acids biosynthesis in Corynebacteriurn glutamicum

DECLARATION
I, Sayyada Amatul Hafeez, declare that the PhD thesis enthled The genetics of
mycolic acid biosynthesis in Corynebacterium glutamicum is no more than 100,000
words in length, exclusive of tables, figures, appendices, references and footnotes.
This thesis contains no material that has been submitted previously, in whole or in
part, for the award of any other academic degree or diploma. Except where otherwise
indicated, this thesis is my own work.
Signature Date
11

ACKNOWLEDGEMENT
Many people contributed towards the completion of this study. First of all I would hke to
thank AusAlD, Centre for Bioprocess and Food Technology for providing financial
support.
My greatest acknowledgement is to my supervisor. Prof Margaret Britz who encouraged
me to undertake this study. I am thankful to her for the faith that she placed in me as a
researcher, her timely advices clear guidance and encouragement throughout the course of
this work.
I would like to recognise the assistance and concern of Dr. Maria Serificia for her role as
co-supervisor.
Sincere and appreciative acknowledgment is made to everyone who contributed to the
thesis and this includes: Prof Akhter Kalam Deputy Dean; former staff, Nikola Popovic
for his technical assistance, Mr Vilnis Ezemiks for assistance in GC work, Ivana
Radojevic, Shin-Jae Change, Dr. Ki-Hyo Jang and other friends n the laboratory.
Special thanks must go to the technical and professional staff of the Centre for Bioprocess
and Food Technology, Dale Tomilson for his technical assistance.
My special thanks are extended to Dr. Sara Eraser for her warm friendship, encouragement
valuable assistance and advice through out my stay at VUT. 1 must express my
appreciation for the friendly guidance and support of my Lab friends Jang, Aslam Khan,
and Mathiew Knight.
This acknowledgement would be incomplete if I do not mention two silent supporters - my
parents - whose prayers are source of my strength. I wish my father to be there he had
great love for knowledge.
m

At the end I would like to dedicate this humble effort, the fmit of my thoughts and studies
to my fanuly, my husband and my littie daughter Zuhaa for their love and support.
IV

SUMMARY
Because of the great importance of C. glutamicum, and Brevibacterium in fermentation
Industry and its potential for application in foreign protein expression, research has been
focused mainly on strain improvement and development of technique to overcome the
barriers that effect successful introduction of foreign DNA into these corynebacteria.
Corynebacterial cell wall stmctures, which include corynemycolic acids, act as a physical
barrier for DNA transformation into the cell. While investigating the physical and
biochemical barrier for gene manipulation to these organism Britz and colleague isolated
a series of auxotrophic mutants of C. glutamicum strain 13059, which were later found to
be cell surface stmcture mutants.
The research reported in this thesis focuses mainly on understanding the nature of
physical barrier including: (i) determining the effect of growth medium containing glycine
and INH on the mycolic acids and fatty acids composition of cell wall and compare this
with the whole ceU mycolates of wild-type and mutants of C. glutamicum. (ii)
investigating the genetics of mycolic acids biosynthesis this involve identification of
presumptive inhA gene involve in mycotic acid synthesis using various molecular biology
approaches in C. glutamicum and Brevibacterium species, sequencing the inhA gene in
several corynebacteria strains and to define any genetic changes, which may have
occurred in INH-hypersensitive mutants through sequence analysis of the InhA protein in
mutants in comparison the sequence, determined for the wild type C. glutamicum. (iii)
determining the function of presumptive inhA gene in corynebacteria by inactivation
using homologous recombination and analysis of the resulting mutants to deduce
correlation between genetic and physiological changes.
Corynebacterial strains used in this study included C. glutamicum AS019 (rif mutant
ATCC 13059) and auxotrophic mutants MLB 133 and MLB 194, csp\ inactivated {csp\
gene responsible for S-layer formation) mutant strain of C. glutamicum, restriction

deficient mutant RM4 of ATCC 13032. Two Breibacterium species B. lactofermentum
and B. flavum were also included in this study.
To study the effect of some of the potential growth modifier like glycine, INH on lipids
profile of cell wall, MICs of INH and ETH its stractural analog were determined. The
present work showed that corynebactereia is less sensitive to INH than Mycobacterium
However, distinct differences in INH MICs between the corynebacterial species used
were observed. AS019 and BF4 were more resistant whereas BLl and RM4 were more
sensitive to INH. Similarly, cspl dismpted mutant of C. glutamicum behaved similar to
AS019. The two mutants MLB 133 and MLB 194 exhibited greater sensitivity towards
INH relative to the parent type strain AS019. MICs of ETH showed that C. glutamicum
was more susceptible to ETH thus confirming that ETH was more effective than INH in
corynebacteria.
Cell waU of aU strains of corynebacteria tested contained five major types of mycotic
acids (C32:o, C34:o, C34;i, C36:2, C36:i). hi the Cell wall fraction the relative proportions of
unsaturated mycolic acid (C34:i and C36:2 was higher and C32:o was lower). In the AS019
family, the proportion of C32:o was in decreasing order of AS019, MLB 194 and MLB 133.
After the addition of 2% glycine in growth media the proportion of unsaturated MAMEs
in the ceU waU fractions (C34:i, C36:2, C36:i) decreased significantly (from 60.0% in LBG
to 30.3% in LBG-G for AS019 and 63.3% to 30.5% for MLB133) compared to growth in
LBG whereas C32:o was proportionately increased. The mycotic acids profile of the
strains tested showed littie quantitative variation in the mycolic acids for both cells and
cell wall fractions. For ah strains tested palmitic acid (Ci6:o) and oleic acid (Ci8:i) were
the major fatty acids in both cells and cell walls. There was a trend towards shght
decreases in FAMEs after growth in LBG-G and LBG-I suggesting that these chemicals
inhibited fatty acids synthesis.
Results described in this thesis further report the identification, cloning and sequencing of
the inhA gene homologue in several corynebacterial strains. This gene was first reported
VI

in mycobacterial species where it was believed to be involved in mycolic acids
biosynthesis and also one of the targets for INH. This data is the first documentary report
on the genetics of mycolic acids biosynthesis in corynebacteria. Southern hybridisation
profiles of AS019, MLB133, MLB194 indicates the presence of multiple copies of the
inhA gene on the chromosome compared with M. smegmatis. The translation product of
the inhA gene was found to 2-enoyl-acyl-carrier protein reductase, which showed
significant homology with enzyme involved in bacterial and plant fatty acids biosynthesis.
The highest identity score was 98% with M. smegmatis strongly suggesting its
involvement in lipid biosynthesis. Sequence comparison of AS019 and two mutants with
M. smegmatis indicates that two mutants were similar to M. smegmatis compared with
their parent strain AS019. The inhA gene was successfully cloned and sequenced in two
Brevibacterium strains BLl and BF4 using PCR approaches. The InhA proteins of two
Brevibacterium species showed amino acids variations at several points. Amino acid
comparison of InhA proteins of C. glutamicum strain AS019 with two Brevibacterium
species showed that B. flavum is similar to AS019.
Finally, the inhA gene was inactivated in B. lactofermentum using homologous
recombination. Results showed that the emerging mutants failed to grow ordinary rich
media implying they have altered cell wall. The mutant had similar MICs values as seen
for the parents indicating that the inhA inactivation had no effect on INH resistance and
hence InhA protein is not the target for INH in corynebacteria. Lipids profile analysis
showed the absence of mycolic acids in transconjugants, fatty acids however, were
detected in lower proportion as compare to parents.
VU

ABBREVIATIONS USED IN THIS THESIS
Aeoo ANGIS Amp ATCC bp BAP BSA "C Cl4:0
Cl5:0
Cl6:0
Ci7:0
Ci8:0
Ci8:l
C25
C32:0
C34:l
C34:0
C36:2
C36:l FSAQ c.f.u Cm CsCl EtBr Cyd CTAB D dNTPs DIG DNA DNase DSM
DTT EMS EtOH FAMES FID G+ GC
Absorbance at 600 nm Australian National Genomic Information Service Ampicillin American Type Culture Collection, Rockville, U.S.A. Base pair Bacterial alkaline phosphatase Bovine semm albumin Degree Celsius Myristic acid Pentadecanoic acid Palmitic acid Hepatadecanoic acid Stearic acid Oleic acid Lignoceric acid methyl ester Corynemycolic acid Corynemycolic acid Corynemycolic acid Corynemycolic acid Corynemycolic acid Food Safety Authenticity and Quality Unit Colony forming unit Chlorampheni col Caesium chloride Ethidium bromide Cytidine Hexadecyltrimethylammonium bromide Dalton Dinucleotide triphosphate Digoxigenin Deoxyribonucleic acid Deoxyribonuclease Deutsche Sammlung von Microorganism, Gottingen, Germany
Dithiothreitol Ethyl methanesulphonate Ethanol Fatty acid methyl esters Flame ionisation detector Gram Gas chromatography
Vll l

HPLC High Performance Liquid Chromatography INH Isonicotinic acid hydrazide IPTG Isoproylthio-P-D-galactoside ileu Isoleucine K Kilo Km Kanamycin LA Luria agar LAG Luria agar with glucose LB Luria broth LBG Luria broth with glucose LBG-G LBG supplemented with glycine LBG-1 LBG supplemented with INH LBG-G LBG supplemented with glycine and INH Leu Leucine 1 Litre MAMEs Mycolic acid methyl esters MIC Minimal inhibitory concentration min Minute mM Millimolar MS Mass spectormetry pg microgram pj microhtre |j. Cell specific growth rate M.W Molecular weight NA Nutrient agar NAG Nutrient agar with glucose Nx Nahdixic acid NCIB National Collection of Industrial Bacteria, Aberden, Scotland. NADH P-nicotinamide adenine dinucleotide Neo Neomycin NTG N-methyl-N-nitro-N-nitrosoguanidine OC DNA Open circular deoxyribonucleic acid o.p.m. Orbits per minute ORFs Open reading frames PEG Polyethylene glycol Rf migration distance relative to front Rif Rifampicin RM system Restriction and modification system RNase Ribonuclease Sec Second SDS Sodium dodecyl sulphate SSC 0.15 M Nad, 0.15 M sodium cifrate
IX

Sir Streptomycin SD Standard deviation Tc Tetracychne TE Transformation efficiency TF Transformation frequency TLC Thin layer chromatography TMS Trimethylsilyl Tris Tris (hydroxymethyl) aminomethane Tween 80 Polyoxyethlene sorbitan monooleate U Unit V Voh V Volume v/v Volume per volume w/v Weight per volume wt Weight X-gal 5-Bromo-4-chloro-3-indolyl-P-D-galactoside VUT Victoria University of Technology

Table of contents Page
DECLARATION
ACKNOWLEDGEMENTS
SUMMARY
ABREVIATION
11
iii
V
vii
Chapter 1
1.1
1.2
1.3
1.4
1.5
1.6
1.5.1
1.5.2
1.6.1
1.6.2
1.6.3
Introduction 1-77
GENERAL INTRODUCTION 1
CELL SURFACE MUTANTS OF
CORYNEBACTERIA 7
INDUSTRIAL IMPORTANCE OF
CORYNEBACTERIA 11
TAXONOMY OF CORYNEFORM BACTERIA 14
OVERVIEW OF THE LIPIDS FOUND IN
CORYNEBACTERIA AND RELATED
SPECIES 23
The nature of the lipids found in mycolic acid
containing bacteria 23
Physical organization of cell wall lipids 27
MYCOLIC ACID: OCCURRENCE,
BIOSYNTHESIS AND GENETICS 33
Analytical methods 33
Types of mycolic acids found in corynebacteria
34
Role of mycolic acids as a permeability barrier 35
XI

1.6.4
1.6.5
1.7
1.7.1
1.7.2
1.7.3
1.8
1.8.1
1.8.2
1.8.3
1.8.4
1.8.5
1.9
Chapter 2
2.1
2.1.1
2.1.2
2.1.3
2.1.4
2.2
2.2.1
Biosynthesis of mycolic acids
Genetics of mycolic acids biosynthesis
MODULATORS OF CELL SURFACE
STRUCTURES
Glycine
Isoniazid
Ethionamide
MOLECULAR GENETICS METHODS IN
C. GLUTAMICUM AND RELATED SPECIES
Protoplast transformation
Transduction
Electroporation
Conjugation
Mobilizable vector: gene disruption
and replacement
AIMS AND OBJECTIVES OF THE THESIS
Materials and methods
MATERIALS
Bacterial strains and plasmids
Chemicals
Buffers
Instrumentation
MICROBIOLOGICAL METHODS
Media
39
47
54
54
56
58
59
60
63
64
67
69
76
78-121
78
78
78
78
82
83
83
Xll
2.2.2 Growth of bacteria 86
2.2.21 Growth of corynebacteria on plates 86
2.2.2.2 Growth of mycobacteria 86
2.2.2.3 Growth off;, coli 87
2.2.2 4 Growth curves, viable counts and drug sensitivity test 82
2.2.3 Storage of strains 87
2.3 MOLECULAR BIOLOGY METHODS 88
2.3.1 Preparation and analysis of DNA 88
2.3.1.1 Small-scale plasmid DNA isolation 88
2.3.1.2 Large-scale plasmid DNA isolation 90
2.3.1.3 Preparation of caesium chloride-ethidium
bromide gradients 90
2.3.1.4 Isolation of chromosomal DNA 91
2.3.1.5 Isolation of high molecular weight mycobacterial chromosomal
DNA 93
2.3.1.6 Estimation of DNA concentration 93
2.3.1.7 Agarose gel electrophoresis 94
2.3.1.8 Photography 95
2.3.1.9 Restriction enzyme digestion of chromosomal DNA 95
2.3.1.10. Recovery of DNA fragments from agarose gels 95
2.3.1.11. Synthesis and preparation of the oligonucleotides
95
2.3.1.12 Polymerase Chain Reaction (PCR) amplification conditions 97
2.3.1.13 Purification of PCR products 98
2.3.1.14 16S ribosomal RNA (rRNA) gene analysis 99
2.3.2 Southern hybridisation 100
2.3.2.1 Use of DIG-Iabelled probe 100
2.3.2.2 Detection of hybridisation signals 101
xm

2.3.2.3 Radioiabelling of DNA probes 102
2.3.2.4 Development of X-ray films 103
2.3.3 Construction of sub-genomic libraries 103
2.3.3.1 Preparation of the insert 103
2.3.3.2 Preparation of the vector 104
2.3.3.3 Ligation of vector and insert DNA 104
2.3 3.4 Preparation of competent cells ofE. coli 104
2.3.3.5 Transformation of competent £•. cofo'cells 105
2.3.3.6 Identification of positive clones 105
2 3.3.7 Screening of the sub-genomic library for the inhA 106
2.3.4 Determination of DNA sequences 107
2.3.4.1 Primers for sequencing reactions 107
2.3.4.2 Ligation and transformation of the PCR products
for sequencing 107
2.3.4.3 Sequencing reactions 108
2.3.4.2 Analysis of the inhA gene sequences and deduced proteins 109
2.3.5 Introduction of plasmid DNA into corynebacteria
strains 111
2.3.5.1 Electroporation 111
2.3.5.2 Conjugational transfer into C. ^/Mtomicwm. 112
2.4 BIOCHEMICAL METHODS 115
2.4.1 Analysis of proteins and enzymes 115
2.4.1.1 Assay of NADH oxidase activity 115
2.4.1.2 Protein concentration assays 115
2.4.1.3 Polyacrylamide gel electrophoresis" 116
2.4.2 Isolation and analysis of fatty acids and mycolic
acids from cell walls and whole cells 117
2.4.2.1 Preparation of cell walls 117
2.4.2.2 Use of internal standard 119
XIV

2.4.2.3 Extraction of long-chained lipid components from whole
cells and cell walls preparation 119
2.4.2.4 Derivatising and analysis of trimethylsilyl (TMS) derivatives
of MAMEs and FAMEs 121
2.4.2.5 Gas chromatography (GC)-flame ionization detection (FED)
of TMS ethers of MAMEs and FAMEs. 121
Chapte r 3 Analysis of the mycolic acid and fatty acid 121 -166
composition of the cell wall of C glutamicum and
comparison between parents and mutant strains
3.1 INTRODUCTION 122
3.2 DETERMINATION OF MICS FOR INH AND
ETH FOR C. GLUTAMICUM AND RELATED
SPECIES 124
3.3 EVALUATION OF THE METHODS TO PREPARE
CELL WALL FRACTIONS OF
C. GLUTAMICUM 131
3.3.1 Preparation of the cell wall 132
3.3.2 Standardisation of quantitative methods 138
3.3.2.1 Quantification of mycolic acids by gas
chromatography (GC) 138
3.3.2.2 Reproducibility of the analysis between experiments 138
3.3.3 Preparation of mycolic acids using
Fujiokaera/. (1986) 141
3.3.4 Preparation of mycolic acids by the method
of Jang (1997) 141
XV

3.4 MYCOLIC ACID COMPOSITION IN WHOLE
CELLS AND CELL WALL FRACTIONS 142
FOLLOWING GROWTH IN DIFFERENT MEDIA
3.4.1 LBG 142
3.4.2 LBG-glycine 143
3.4.3 LBG-INH (4 mg/ml 146
3.4.4 LBG containing 2% glycine and 4 mg/ml INH 147
3.5 FATTY ACID COMPOSITION OF
C.GLUTAMICUM STRAINS FOLLOWING
GROWTH IN DIFFERENT MEDIA 150
3.6 MYCOLIC ACID COMPOSITION OF
CSPl DISRUPTED MUTANTS OF C.
GLUTAMICUM 160
37 DISCUSSION 162
3.7.1 Drug sensitivity analysis 162
3.7.2 Lipid composition of cell walls of C g/Mto/w/cM/w 164
3.7.3 Models for the cell wall structure of C. glutamicum 169
Chapter 4 Cloning, sequencing and sequence analysis
of an inhA gene homologue in C. glutamicum
wild-type strain AS019 174-228
4.1 INTRODUCTION 174
4.2 CLONING OF THE inhA GENE IN
C. GLt/TAM/Cf/M STRAIN AS019 175
XVI

4.2.1 Verification of the strams 175
4.2.1.1 Construction of primers to ampHfy the inhA
gene from C glutamicum strain AS019 176
4.2.2 Optimisation of PCR conditions and
useofSolnQ 178
4.2.3 Sequencing of PCR fragments of the inhA gene of
strain AS019 and M smegmatis. lis
4.2.4 Sequence analysis of the PCR products 182
4.2.5 Southern hybridisation and identification of
the inhA gene in C glutamicum strain AS019 182
4.2.6 Cloning of the entire inhA gene in C glutamicum
AS019 and verifying that clones contain the
Pstl fragment 192
4.2.7 Sequencing of the inhA gene from clones 193
4.3 SEQUENCE ANALYSIS OF THE inhA GENE OF
AS019 212
4.3.1 Sequence assembly of the inhA gene in AS019
using fragments generated by PCR.
212
4.3.2 Homology search results of assembled sequence 222
4.4 DISCUSSION 228
Chapter 5 Comparison of inhA gene of parent strain AS019
with two mutants MLB194 and MLB133 236 294
5.1 INTRODUCTION 236
XVll

5.2 CLONING OF THE inhA GENE FROM MLB194 237
5.2.1 PCR amplification of the inhA gene from MLB194 237
5.2.2 Sequence analysis of the amplified products 237
5.2.3 Southern hybridisation and identification of the inhA
gene in C glutamicum strain MLB194 242
5.3 CLONING AND ANALYSIS OF THE inhA GENE
OF MLB194 245
5.3.1 Screening by restriction digestion 247
5.3.2 Southern hybridisation and PCR screening of the
recombinant clones 247
5.3.3 Sequencing of the inhA gene from clones 251
5.4 SEQUENCE ANALYSIS OF THE inhA GENE
OF STRAIN MLB194 259
5.4.1 Sequence assembly of the inhA gene in MLB194 using
fragments generated by PCR 259
5.4.2 Homology search results of the assembled
sequence (FASTA, BLASTN, BLASTX) 266
5.5 CLONING SEQUENCING AND SEQUENCE
ANALYSIS OF THE inhA GENE IN MLB133 270
5.5.1 Sequencing of the inhA from cloned MLB133 270
5.5.2 Sequence assembly for MLB133 271
5.5.3 Sequence analysis of the assembled inhA
gene for MLB133 271
5.6 COMPARISON OF THE inhA GENE AND
GENE PRODUCT IN C. GLUTAMICUM
STRAINS AS019, MLB194, MLB133. 282
XVIU

5.6.1 Southern hybridisation patterns 282
5.6.2 Sequence alignment of inhA genes of
AS019, MLB133 and MLB194 287
5.6.3 Sequence comparison of InhA protein of
AS019 with the two mutants of MLB194
and MLB133 290
5.7 GENERAL DISCUSSION 294
Chapter 6 Sequencing and sequence analysis of the inhA
gene in Brevibacterium species and comparison
with C. glutamicum 303-357
6.1 INTRODUCTION 303
6.2 CLONING AND SEQUENCING OF
THE inhA GENE IN B. LACTOFERMENTUM
STRAIN BLl BY PCR 304
6.2.1 PCR amplification of inhA gene in
B. lactofermentum 304
6.2.2 Southern hybridisation using the B. lactofermentum
genomic DNA probed with PCR fragments 305
6.2.3 Sequencing and cloning of the PCR 305
amplified inhA gene fragments from BLl
6.2.4 Sequence assembly for BLl 306
6.2.5 Sequence analysis of assembled inhA
gene for BLl 306
XIX

6.3 CLONING AND SEQUENCING OF inhA
GENE IN 5 . FLA y t /M STRAIN BF4 BY PCR 320
6.3.1.1 PCR amplification of the inhA gene in B. flavum 320
6.3.1.2 Southern hybridisation using the B. flavum
genomic DNA probed with PCR fragments 320
6.3.1.3 Sequencing of the inhA gene from BF4 320
6.3.1.4 Sequence assembly for BF4 321
6.4 SEQUENCES OF THE inhA GENE OF
BREVIBACTERIUM SPECIES 331
6.4.1 Submission of the inhA gene sequences
to theGenBank 331
6.4.2 Comparison of the inhA gene of C. glutamicum
and Brevibacterium species 335
6.4.2.1 Southern hybridisation analysis 335
6.4.2.2 Base composition of the inhA genes in C. glutamicum
and Brevibacterium 342
6.4.2.3 Sequence comparison of the inhA genes of C. glutamicum
and Brevibacterium 342
6.4.3 Analysis of deduced amino acids sequence
of the InhA proteins 344
6.4.3.1 Sizes of the InhA proteins 344
6.4.3.2 Biochemical properties of the InhA proteins 344
6.4.3.3 Differences in the amino acids sequences of InhA proteins of
corynebacterial and mycobacterial species. 346
XX

6.4.3.4 Composition of amino acids of the InhA
proteins of Corynebacterium 346
6.4.3.5 Comparison of the InhA proteins of different Corynebacterial
species with other bacterial and plant proteins
catalysing similar function 350
6.5 DISCUSSION 354
6.5.1 Differences in the Southern hybridisation pattern
of C glutamicum and Brevibacterium 354
6.5.2 The comparison of deduced InhA proteins
of different corynebacterial species 356
6.5.3 Properties of amino acid sequences of InhA
Proteins 357
Chapter 7 Disruption of the inhA gene by mean of 359-393
homologous recombination and
characterization of mutants
7.1 INTRODUCTION 359
7.2 ESTABLISHING A METHOD FOR DISRUPTION
OF m M GENE INC. GLUTAMICUM
360
7.2.1 MICs 360
7.2.2 Failed attempts and strategies for inhA gene
disruption 363
7.2.2.1 Construction of mobilizing pK18mob-mM 363
7.2.2.2 Transconjugation 365
7.2.2.3 Results of the transconjugation 366
7.2.2.4 Southern hybridisation to confirm integration of lysA 366
XXI

7.2.3 Gene disruption using electroporation 369
7.2.3.1 Electroporation and selection of mutants 369
7.2.3.2 Proof of integration 370
7.3. PRELIMINARY CHARACTERISTICS OF THE
TRANSFORMANTS 378
7.3.1 Gram staining 378
7.3.2 Inability of the mutants to grow on non-osmotically
protective media 378
7.3.3 MICs of mutants for INH and ETH 381
7.3.4 Analysis of Lipids 3 8 6
7.4
7.3.5 16S ribosomal RNA (rRNA) gene analysis of the
mutants 388
7.3.5.1 16S rRNA gene amplification 388
7.3.5.2 16S rDNA sequence 388
7.3.5.3 16S rRNA operon copy number 389
DISCUSSION 393
APPENDIX 1
APPENDIX 2
APPENDIX 3
APPENDIX 4
MEDIA, REAGENTS AND SUPPLIERS OF
CHEMICALS, MEDIUM CONSTITUENTS
AND ACCESSORIES 397
BUFFERS AND REAGENTS FOR 400
MEMBRANE PREPARATION AND
FOR PROTEIN ASSAY
BUFFERS, REAGENTS AND ENZYMES FOR
MOLECULAR WORK 403
MAJOR FINDING OF THE THESIS 405
xxu

APPENDIX5 SOUTHERN HYBRIDIZATION ANALYSIS OF
THE GENOMIC DNA WITH 16S RNA PROBE 414
APPENDIX 6 Conclusion and further recommendations 417
REFERENCES 424
448
XXlll

Chapter 1
Introduction
1.1 GENERAL INTRODUCTION
Coryneform bacteria are a taxonomically ill-define group of Gram-positive bacteria with
a rod or club shape. The term coryneform, originally used to describe the club or wedge-
shape of Corynebacterium diphtheriae and related animal pathogens, is now widely used
to describe Gram-positive, non-mycelial, non-sporing bacteria. The group includes many
animal pathogens (Barksdale, 1981), plant pathogens (Carlson and Vidauer, 1982), and
saprophytic (non-pathogenic) soil organisms used for the industrial production of amino
acids such as arginine, glutamic acid, isoleucine, leucine, lysine, ornithine, prohne,
threonine, tryptophane and vahne (Hirose et al, 1985; Kinoshita, 1985). Other strains
synthesise emulsifying agents (Duvnjak and Kosarie, 1981; Zajic et al., 1977), degrade
hydrocarbons (Cardini and Justshuk, 1970; Cooper et al., 1979), produce anti-tumour
activity (Milas and Scott, 1978) or carry out steroid conversion (Constantinides, 1980;
Yamada et al., 1985). Among the explanations advanced for the numerical predominance
of some of these bacteria in soil are their extreme resistance to drying and to starvation
and the nutritional versatility of the commonly occurring species (Jones and Keddie,
1981). The group also contains various degraders of chlorophenol (McAUister and
Trevors, 1996), cyanide (Dubey and Holmes, 1995), or diphenyls (Higson, 1992) and is
therefore of envhonmental and biotechnological interest. The group comprising plant
pathogenic corynebacteria were renamed Clavibacteria (Davis et al, 1984).
Saprophytic species of corynebacteria used for the indusfrial production of amino acids
include Corynebacterium glutamicum, Brevibacterium and related genera Arthrobacter
and Microbacterium (Archer et al., 1989; Batt et al; 1985a, Eikmanns et al, 1993;
Kinoshita, 1985; Liebl 1991; Wohlleben et al, 1993). In the early 1990s, studies
including DNA-DNA hybridisation, chemotaxonomy and biochemical studies revealed
only minor differences between the Brevibacterium flavum, Brevibacterium
lactofermentum and C. glutamicum species (Eikmanns et al., 1991; Liebl et al, 1991),

and therefore Liebl et al. (1991) proposed that these species be considered as C.
glutamicum species. However, the controversy about the relationship between these two
corynebacteria groups used routinely as amino acid producing strains, B. lactofermentum
and C. glutamicum, remained unresolved (Liebl et al, 1991; Correia et al, 1994).
Although there was a relatively high degree of similarity (RFLP sttidies), there were
enough clear differences to allow separation of B. lactofermentum from C. glutamicum
(Correia et al, 1994). The cloning of the rRNA operons (rrn) provided a very useful
instmment to settie the polemic about the taxonomic relatedness of these two glutamic
acid producing corynebacteria. Characterisation of an operon from B. lactofermentum,
including the complete sequence of the 16S rRNA gene and upstream regulatory region
and transcriptional analysis, has been recentiy reported by Amador et al. (1999).
Phylogenetic studies using complete 16S rRNA sequence analysis showed that '5.
lactofermentum' is closely related to several species of the genus Corynebacterium but
only distantiy related to the type species Brevibacterium linens and therefore the authors
suggested that it should be reclassified as Corynebacterium lactofermentum. Analysis of
the rmD sequence has provided information not only on the phylogeny of '5.
lactofermentum' but also on the molecular control of macromolecule gene expression.
The largest market for amino acids is in food ingredients and nutritional supplements for
human and animal use. The world-wide production in 1992 of the flavour enhancer
mono-sodium glutamate (MSG) and the food supplement lysine by C. glutamicum was
estimated at approximately 800,000 and 400,000 metric tons respectively (Jetten and
Sinskey, 1995; RandeU and Andreas, 1992). Austraha imports over $40 miUion worth of
lysine, an essential amino acid, per annum for incorporation into products made from
grains (particularly bread) and into pig feed (growth stimulant, improves fertiUty). Strain
improvement for amino acid production has been based traditionally on mutation and
selection, which was particularly effective in this group of bacteria because of then
inherent ability to overproduce glutamate and the relatively simple metabolic regulatory
mechanisms present. Furthermore their physical traits made C. glutamicum and related
species particularly suitable for large-scale industrial fermentations: strains grow well on
simple defined media; secretion of amino acids is achieved by manipulating the cell

surface structures by growth in biotin-hmited media and exposure to ethanol or peniciUin
G, so that high intracellular concenfrations of metabohc intermediates, which may
otherwise limit production, does not occur; and corynephages are relatively rare so that
fermentation failure due to bacteriophage infection is minimal (Britz and Demain, 1985).
Because of their industrial importance, the genetics and enzymology of amino acid
synthesis by C. glutamicum has been studied extensively (Abe and Takayama, 1972;
Fazal et al, 1980; Hagino et al, 1975). Extensive "classical" mutagenesis of some
coryneform bacteria (C. glutamicum, B. lactofermentum and B. flavum) was used to
obtain improved strains for the production of lysine, glutamic acid, threonine,
tryptophane and a variety of other amino acids (Shiio, 1983), and the flavour enhancing
nucleotides. A successful approach to obtaining high yielding mutants has been selection
of variants resistant to amino acid analogs such as 5-fluorotryptophane, S-
aminoethylcysteine, and a-amino-P-hydroxyvaleric acid. Resistance to amino acid
analogs frequentiy results in deregulation of the corresponding amino acid biosynthetic
pathway due to a change in the stmctural gene of an enzyme(s) that is the target of
inhibition, or mutation in regulatory sequences so that transcription and/or translation is
increased. Another successful strategy to increase amino acid production was to raise the
metabolic flow through a pathway by blocking branch pathways through auxotrophic or
regulatory mutagenesis (Martin et al, 1987). A further increase in production by such
traditional techniques is rather limited because the cumulative effect of the mutations
previously introduced can result in almost complete physiological deregulation.
However, further increase in yields were often necessary to make the fermentation route
to production of particular amino acids commercially feasible.
A new strategy to strain improvement was initiated in the early 1980s by developing
cloning systems, so that techniques such as the construction of high expression and
promoter-probe vectors and site-directed mutagenesis could be applied to corynebacteria.
The first reports on the metabohc engineering of C. glutamicum appeared in 1984 (Miwa
et al, 1984; Santamaria et al, 1985). Since that time, several research groups have
independently initiated research programs focusing on the development of metabohc
engineering tools for Corynebacterium species (for example see Jetten et al, 1993;

Martin et al, 1987; Yoshihama et al, 1985; Wohlleben et al, 1992). The approach
normally taken has involved using natural plasmids (Davis et al, 1987; Katsumata et al,
1984) or constracting shuttle vectors which function in E. coli and the corynebacterial
host and which can be transferred using protoplast transformation (Katsumata et al,
1984; Ozaki et al, 1984; Thierbach et al, 1988; Yoshihama et al, 1985), electroporation
(Haynes and Britz, 1990; Liebl et al, 1989; Vertes et al; 1994b., Wolf, 1989) or
conjugation (Schafer et al, 1990). The application of recombinant DNA techniques has
allowed expression of foreign genes and production of recombinant proteins. Foreign
genes successfully expressed by C. glutamicum include a-amylase of Bacillus
amyloliquifaciens (Smith et al, 1986), Cellulomonas fimi nuclease (Paradis et al, 1987),
bacterial genes involved in amino-acid biosynthesis (Patek et al, 1989), Staphylococcus
aureus nuclease (Liebl et al, 1992) and ovine gamma interferon (Billman-Jacobe, 1994).
It has been reported that C. glutamicum grown in rich medium secretes two main
proteins, PSl and PS2 (Johff er al, 1992). However, a large fraction of PS2 remains
associated with the cell wall. The existence of two distinct major proteins which are
abundantly secreted into the C. glutamicum culture supernatant shows that C.
glutamicum, well known for metabolite excretion, is also able to secrete significant
amounts of proteins. The deduced N-terminal region of PSl of C. glutamicum encoded
by cspl gene is similar to the antigens 85 complex of Mycobacterium tuberculosis, act as
a mycoloyl tranferase catalysing the transfer of mycolic acids not only to arabinogalactan,
but also to trehalose monomycolate (Puech et al, 2000). In addition to cspl (renamed
cmytA), five new cmyt genes {cmytB-F) were identified in the two strains of C.
glutamicum and three cmyt genes in C. diphtheriae (De Sousa et al, 2003, Kacem et al,
2004). In silico analysis showed that each of the putative cMyts contains the esterase
domain, including the three key amino acids necessary for the catalysis.
Most recently Portevin et al. (2004) have identified a new protein pksl3, an enzyme
which catalyses the condensation of two fatty acids to form mycolic acids both in
Corynebacteria and Mycobacteria. They showed that a C. glutamicum strain with a
deletion in pks 13 gene was deficient in mycolic acid production but was able to produce

fatty acids precursors. This mutant strain had an altered cell envelope stmcture. In 1995,
Billman-Jacobe et al. reported that C. glutamicum can express and secrete foreign
exoproteins originating from Gram-positive and Gram-negative bacteria and that this
species has the potential to be developed as a host for foreign gene expression and
secretion. This conclusion was based on their study of cloning and expression of genes
encoding the basic protease of Dichelobacter nodosus {bprV) and the Bacillus suhtilis
(aprE) in C. glutamicum. In each case, enzymatically active protein was detected in the
supematants of liquid cultures. More recently Salim et al. (1998) have reported the use
of C. glutamicum as an alternative host for the functional heterologous expression of the
Mycobacterium smegmatis 85A gene.
Barriers to successful introduction of foreign genes into corynebacteria include the
presence of restriction-modification systems (Jang et al, 1996; Katsumata et al 1984;
Schafer et al 1994b; Tauch et al 1994), which preclude survival of heterologously
derived plasmid DNA and cause low transformation efficiency (Haynes and Britz, 1990;
Serwold-Davis et al, 1987;), and the physical barrier of a complex cell wall stmcture
(Haynes and Britz, 1990).
The cell wall of Gram-positive bacteria of the genera Corynebacterium, Brevibacterium,
Rhodococcus and Nocardia have similar overall architecture, which includes a thick
peptidoglycan layer covalently bound to arabinogalactan, and they possess mycolic acids
linked to the polysaccharides (Barksdale and Kim, 1977; Collins et al, 1982a; Chevalier
et al, 1988; Tomiyasu, 1982). Indeed, mycolic acids are a major component of the cell
wall stmcture of this group of bacteria and mycobacteria where, for instance, up to 60%
by weight of the mycobacterial cell is composed of mycolic acids (Jarlier and Nikaido,
1994). Mycolic acids are a-alkyl, P-hydroxy fatty acids with up to 90 carbons in
mycobacterial species and 28-50 carbons in corynebacteria. It is believed that mycolic
acids have a stmctural role which gives rise to the resistance of the cell to harsh
environments and causes the acid fastness of mycobacteria; they probably play an
important role in the restricted permeability of these microbes to water-soluble molecules
(Jarlier and Nikaido, 1990). Little is known about the assembly of the cell wall of C.

glutamicum, thus it is not clear whether it acts in the same way as the permeability barrier
in mycobacteria. Methods to improve the excretion of particular amino acids have
developed which may influence the integrity of the cell wall and/or membranes, such as
treatment with penicillin G or amide surfactants. Several workers have reported that
mycotic acid composition of corynebacteria was modified by changes in environmental
conditions such as growth temperature (Suzuki et al, 1969, Tomiyama et al, 1980,
Tomiyasu et al, 1980) and additives such as Tween 80, (Chevaher, 1988), glycine, or
isonicotinic acid hydrazide (INH) (Best and Britz, 1986; Jang et al, 1997; Tomiyasu et
al, 1984). These changes in the mycolic acid composition reduce the physical barrier to
DNA transformation. Best and Britz (1986) also observed mutants of C. glutamicum,
which were auxotrophic for various branched-chain amino acids, protoplasted more
readily than then parent (Best and Britz, 1986), noting that these strains showed higher
sensitivity to growth inhibition by glycine. Furthermore preliminary studies also showed
that C. glutamicum is relatively insensitive to INH when compared to Mycobacterium
species but the mutants were more sensitive to INH than then parent, suggesting that
these mutants had altered cell-surface properties. To understand the nature of these
mutations and the mechanism of action of glycine and INH, Pierotti (1987) and Jang et
al. (1997) analysed the fatty acid and mycolic acid composition of strain ATCC 13059
and selected mutants which had been shown previously to protoplast more readily, with
specific reference to the lipid composition following growth in glycine and INH. Then
findings showed that glycine and INH enormously affected cell growth, cell wall
morphology and the mycolic acid composition of C. glutamicum. In addition to the
previously reported targeting of the peptidoglycan cross-linking, these results showed that
glycine affects mycolic acid attachment to the cell surface of C. glutamicum.
Biochemical evidence has suggested that both INH and ethionamide (ETH, a-
ethylthioisonicotinamide a structural analog of INH and a second line anti-tuberculosis
drug) block mycolic acid biosynthesis in M. tuberculosis and other mycobacteria
(Winder, 1982 and Winder et al, 1982) at a concentration of the dmg which produces
>99% reduction of bacterial counts. Banerjee et al. (1994) used a genetic approach to
identify the gene encoding at least one of the targets of INH and ETH and characterised

the mutation within the gene. The target site of INH in M. tuberculosis and several other
mycobacterial species was identified as the InhA protein, which is a 2-fran5-enoyl-acyl
carrier protein (ACP) involved in fatty acid synthesis (Dessen et al, 1995).
The present study focused on investigating the genetics of mycolic acid synthesis in C.
glutamicum by analysing the genetic changes which had occurred in INH hyper-sensitive
mutants, specifically through characterisation and sequence analysis of the inhA gene
homolog. Insertional inactivation approaches were used to determine the role of a
presumptive inhA gene in mycolic acid biosynthesis. Further analysis on the changes in
the cell surface structures of the mutants was also performed. The remainder of the
Introduction section provides a literature review on various aspects of the above and
defines the subject of this thesis.
1.2 CELL SURFACE MUTANTS OF CORYNEBACTERIA
Attempts have been made to improve various strains of Corynebacterium for specific
applications. The approach taken has largely been along traditional tines of mutagenesis
and screening for mutants which overproduce particular metabohtes (Tosaka et at.,
1983). As a result of mutation, some mutants gave higher transformation efficiencies
than seen for the parent strains. Some of these mutants are presumptive cell surface
mutants (Best and Britz, 1986) and others seem to be restriction-deficient strains (Liebl et
al, 1989; Ozaki et al, 1984; Schafer et al, 1990, 1994a). Although many mutant strains
of corynebacteria have been reported, only specific examples which are relevant to this
thesis will described here.
Best and Britz (1986) isolated several auxotrophic mutants of C. glutamicum ATCC
13059 by long-term exposure to ethylmethanesulphonate (EMS) (Fig 1). Many of these
protoplasted more easily than the parent type strain. Some mutants, including strains
MLB 131-135 and MLB 194, produced larger ceUs than other auxotrophs or the parent
strain when grown in Luria Broth (LB) and always displayed notably apparent
morphological changes during growth in LB-glycine. Using scanning electron

microscopic observation, Britz (1986) found that C. glutamicum sttain ATCC 13059
grown in LB produced irregular rods, with coccobacilh 1-2 pm in length.
Characteristically, this strain forms parallel ridges around its circumference. However,
growth in LB containing 2% (w/v) glycine caused cell elongation and the rare appearance
of X- and Y- shaped cells. Auxotrophic mutants derived from this strain produced
elongated ceUs with buds in LB. When grown in LB-glycine, X-and Y-shaped cells were
seen more frequentiy, as were branched rods, suggesting that cell division was occurring
through budding, branch formation, then septation (Jang et al, 1997). In addition, Britz
(1989) examined the effect of glycine and INH on cell growth of a number of
corynebacteria, including C. glutamicum strains AS019, MLB 133 and MLB 194, B.
lactofermentum BLl, B. flavum BF4 and C. ulcerans (wild type), by measuring the final
optical density as 600 nm after 16 h cell growth. The author found that mutant strain
MLB 133 and MLB 194 were more sensitive to inhibition by the presence of INH and
glycine during growth relative to the parent strain. In the case of B. lactofermentum,
which gave higher transformation efficiency than C. glutamicum AS019 (Haynes and
Britz, 1989), sensitivity to INH was higher than AS019.
In Pierott's work (1987) on strain ATCC 13059, AS019, and mutants MLB133 and
MLB 194, fatty acid and mycolic acid profiles were quantitatively determined by gas
chromatography (GC) analysis following growth under different conditions. An alteration
in the cell surface structures of two mutant (MLB 133 and MLB 194) strains was further
supported by the observation that the quantitative fatty acid and mycolic acid
compositions were different from the parent-type strain AS019 (Pierotti, 1987). For these
experiments, Pierotti (1987) used two different media: LB supplemented with 0.5% (w/v)
glucose (LBG) and LBG containing 2% (w/v) glycine, where samples were prepared
from several cell growth phases. Pierotti (1987) observed two major spots following
TLC, corresponding to mycolic acid methyl esters (MAMEs) and fatty acid methyl esters
(FAMEs), and characterised these using GC and this combined with mas spectrometry
(GC-MS).

ATCC 13059 12%
MLB50 7 1% i l e u "
MLB112 84%
i leu" h is"
I * MLB176
ileu" h is" SFu
I * MLB194 99%
i ieu" his" SFu'^Rit'^
MLB111
i leu" leu"
MLB51 94%
met"
MLB78
met" his" WLB91 67%
met" i leu"
ML8131 96% MLB126 35% MLB160
i leu" leu" Rif met" his" Strep met " i l eu " a rg"
1* MLB161 77%
met" i leu" a rg " Rif r
MLB53 met" leu"
f^LBSI 40%
met" leu" Strep*^
I
MLB86 83%
Figure 1 Geneology of mutants derived from C. glutamicum strain ATCC 13059 by
EMS mutagensis or through selections of strains spontaneously resistant to
antimetabolites on selection media (from Best and Britz, 1986). Abbreviations: Rif,
rifampicin resistant; Sfrep*", sfreptomycin resistant; S-Fu"", 5-florouracil resistant; arg',
auxotrophic for arginine; his", histidine; ileu", isoleucine; leu', leucine; mef, methionine.
Percentages represent protoplasting efficiency.

Analysis of FAMEs showed that, with increasing cultivation time from exponential phase
to late stationary phase, the percentage of Ci8:i in strain MLB 133 increased from 1.5% to
6% while the percentage of Ci8:i in AS019 was not changed. Analysis of MAMEs
showed five types of peaks (C32:o, C34:i, C34:o, C36:2, C36:i) in all of the strains of C.
glutamicum used, confirming the observation that these strains and the mutants had a
mycohc acid composition similar to those seen for C. glutamicum NCIB 10025 (CoUins
et al, 1982a). No significant differences in the quantitative composition of mycolic acids
were detected at different cell growth phases for the parent strain of C. glutamicum.
Jang (1997) determined the effect of glycine and INH on mycohc acid profiles of whole
cells and in spent culture medium. The most important observations regarding his studies
were as follows: the mycolic acid profiles in terms of relative proportions of each type in
the cells and the culture fluid were quite similar for each sample tested; both mutant
strains MLB 133 and MLB 194 always contained a higher proportion of unsaturated
mycohc acids (C32:o lower than the parent, C34:i and C36:2 higher); the main effect of
glycine (2% w/v) was to increase the proportion of mycolic acids found in extracellular
fluids (15.9% for AS019 and 19.3% in MLB133); growth in LBG with INH also
increased the proportion of extracellular mycolic acids and changed the proportion of
unsaturated mycolic acids; increased proportions of unsaturated mycolic acids
corresponded to decreases in C32:o and increases in the proportion of C34:i and C^e-.i,
similarly, in the presence of glycine or INH the relative percentage of fatty acids to the
total lipids (fatty acids plus mycolic acids) of AS019 decreased from 76.9% (in LBG) to
72.9% (in LBG 2% glycine), and 66.4% in (LBG-8mg/ml INH), implying that glycine
and INH in the medium inhibited not only mycolic acid synthesis but also fatty acid
synthesis. However, Jang did not investigated the impact of glycine and INH addition in
the growth medium on the mycolic acid profiles of cell wall components, as he examined
only whole cellular lipids. The present work aimed to determine the profile of hpids
bound to the ceU wall (both quantitative and qualitative analysis) after growth in the
presence of glycine and INH in comparison with the mycohc acid profile of whole cells,
to determine whether the observed changes were at the level of the cell surface lipid
composition or cellular lipid synthesis.
10

1.3 INDUSTRIAL IMPORTANCE OF CORYNEFORM
Amino acids are produced via chemical synthesis, hydrolysis of natural proteins, and
bacterial fermentation (Kinoshita, 1985). Only a hmited number of bacterial species are
used to obtain production strains for the industrial manufacture of amino acids (Aida et
al, 1986) and corynebacteria are the micro-organisms that have been traditionally used
for amino acid production. The main use of amino acids is in animal feed
supplementation to increase the efficiency of plant proteins that are usually deficient in
certain essential amino acids (e.g. lysine, threonine, tryptophane, and methionine)
(Flodin, 1993; Howe et al, 1965). In the food industry, amino acids are used as flavour
enhancing agents (e.g. glutamate and glycine) (Jetten and Sinskey, 1992). Amino acids
are used in the pharmaceutical industry as therapeutic agents in nutritional and metabolic
disorders, and in the chemical indusfries they find use in the manufacture of cosmetics,
toothpaste, shampoos and detergents. Amino acid derivatives are also increasingly used
in agriculture as plaguicides and plant growth regulators. Another important, although
less significant, use of amino acids is in the preparation of intravenous infusions (Yamada
etal, 1972).
Lysine, used mainly as a forage additive, is one of the economically most important
amino acids produced by C. glutamicum (Tosaka and Hirose, 1983). Isoleucine is of
commercial interest as a food and feed additive, since mammahan cells are not able to
synthesise it. This branched-chain amino acid has been produced on a large scale of
about 400 tons per year by extraction of protein hydrolysates (Kleemann et al, 1985) or
by fermentation with classically-derived mutants of Serratia marcescens (Ikeda and
Yoshinaga, 1976; Kisumi and Chibata, 1977) or mutants of C. glutamicum (Eggehng et
al, 1987; Morbach et al, 1995; Patek et al, 1994). Many natural isolates of glutamic
acid producing corynebacteria have been mutated to further increase amino acid
production, including Corynebacterium species C. callunae, C. glutamicum, C.
herculis and C. lilium; Brevibacterium species B. flavum, B. lactofermentum, B.
diverticum and Mycobacterium species M. ammoniaphilum (Kinoshta, 1987).
11

Some corynebacteria have relevance in the cheese production industry while several
others are used in bioconversions. For example it is well known that "orange cheese"
coryneform bacteria play an important role in the ripening of red smear cheeses, in
particular by producing methanethiol (Greez and Hedrick, 1962; Lewis, 1982), a sulfur
compound which imparts a typical flavour to this kind of cheese (Law and Sharpe, 1978).
Some orange cheese corynebacteria produce antibacterial substances such as bacteriocin,
including linencin A and linocin Ml8, which have been purified and characterised (Kato
et al, 1984 and 1991; Valdes and Scherer, 1994). An orange cheese coryneform bacteria
isolated from the surface of Gruyere of Comte was identified as B. linens and this
produces an antimicrobial substance designated Unenscin OC2. This compound inhibits
Gram-positive food-borne pathogens including S. aureus and Listeria monocytogens but
is not active against Gram-negative bacteria. Linenscin OC2 caused viabihty loss and
lysis of the test organism, L. innocua (Sophie et al, 1995). The spectrum of activity of
hnenscin 0C2 is interesting, if not used in food, another apphcation of Unenscin 0C2
could be as an antibiotic in human therapy, if activity is retained in vivo. Other industrial
appUcations of corynebacteria include the conversion of 2,5-diketo-D-gluconic acid into
2-keto-L-gulonate (an intermediate in L-ascorbate synthesis), steroid conversion
(hydrocortisone to L-ascorbate) and other oxidations (Anderson et al, 1985; Martin et
al, 1987; Yamada ef a/., 1985).
C. glutamicum is used widely for its abUity to produce large amounts of glutamate under
particular growth conditions, e.g., biotin timitation. Different research groups have
studied glutamate excretion (Bunch et al, 1986; Clement et al, 1986; Gutmann et al,
1992; Hoischen and Kramer, 1989 and 1990), and different hypotheses have been put
forward to explain this capacity (Clement et al, 1984). In 1995, Lambert et al. attributed
glutamate efflux under biotin limitation to the activity of a specific excretion carrier
system. Their study showed that C. glutamicum can be triggered to excrete glutamate by
the addition of local anaesthetics, particularly tetracaine. Glutamate efflux is a carrier-
mediated process and not due to unspecific membrane permeabiUzation. The
concenttation of local anaesthetic triggering optimal excretion depended on the type and
concentration of anaesthetic, ranging from 0.1 mM for chlorpromazine, 1.3mM for
12

tetracaine and 2.6 mM for butacaine to 15 mM for benzocaine, which closely followed
the order of anaesthetic efficiencies. The onset of glutamate excretion was not correlated
to changes in the viscosity or fiuidity of the membrane, nor was it related to an action of
the anaesthetic as an uncoupler. Tetracaine-triggered glutamate excretion was not
correlated to changes in the transmembrane osmotic gradient. These authors reported that
the most possible explanation for the triggering effect is that the action of local
anesthetics is not a direct interaction with certain proteins but a general action on the
membrane, which triggers the carrier activity. C. glutamicum cells, which excrete
glutamate without manipulation of the membrane, e.g., biotin-limited cells or glutamate
production mutants, were not stimulated by the addition of tetracaine.
Biosynthesis of the aromatic amino acids in micro-organisms proceeds via a common
pathway to chorismate, from which the pathways to phenylalanine, tyrosine, and
tryptophane branch (Umbarger, 1978). Some attempts to genetically engineer existing
mutants of C. glutamicum which produce the aromatic amino acid resulted in significant
improvement in yields. In such studies, the strategy used aimed at amplifying the gene
coding for the rate-controlling enzyme, thereby eliminating the bottleneck in the
biosynthetic pathway (Ito et al, 1990; Ozaki et al, 1985). Katsumata and Ikeda (1992)
reported a tryptophane-producing mutant of C. glutamicum which was genetically
engineered to produce tyrosine or phenylalanine in abundance. To achieve this, three
genes encoding the first enzyme in the common pathway, 3-deoxy-D-arabino-
heptulosonate 7-phosphate synthase (DS), and the branch-point enzymes chorismate
mutase and prephenate dehydratase, were individually cloned from regulatory mutants of
C glutamicum, which had either of the corresponding enzymes desensitised to end-
product inhibition. These cloned genes were assembled one after another onto a
multicopy vector of C. glutamicum to yield two recombinant plasmids. One plasmid,
designated pKYl, contained the DS and chorismate mutase genes, and the other,
designated pKFl, contained all three biosynthetic genes. The enzymes specified by both
plasmids were simultaneously over expressed approximately seven-fold relative to the
chromosomally encoded enzymes in the parent C. glutamicum strain. When transformed
with pKYl or pKFl, tryptophane-producing C. glutamicum KYI0865, with the ability to
13

produce 18 g of tryptophane per litre, was altered to produce a large amount of tyrosine
(26 g/liter) or phenylalanine (28 g/liter), respectively, because the accelerated carbon
flow through the common pathways was redhected to tyrosine or phenylalanine.
1.4 TAXONOMY OF CORYNEFORM BACTERIA
Lehman and Newman (1907) were the first to create the genus Corynebacterium to
accommodate the diptheria bacillus and a few similar animal parasitic species. The genus
was defined mainly on the basis of morphological characteristics (wedge or club shape of
the organism) and staining reaction (Gram positive with irregular bar or band formation).
Morphological similarity was then generally beUeved to indicate relatedness and thus
organisms from habitats other than human or animal sources were included in this genus.
Coryneform bacteria were subsequentiy recognised as saprophytes in soil, water, milk,
dairy products and fish, and as plant pathogens (Keddie, 1978), Keddie concluded that it
is convenient to use the term corynebacteria to define "a broad morphological group,
sometimes imperfectly, but it does not imply relatedness within it".
The definition of the genera commonly referred to as coryneform (Corynebacterium,
Microbacterium, Cellulomonas and Arthrobacter [Jensen, 1952]) are equivocal because
they are based almost entirely on microscopic appearance and staining characteristics and
these are affected by morphological changes during the growth cycle and also by culture
conditions (Cure & Keddie, 1972; Jensen, 1993). Furthermore, some Corynebacterium
species are morphologically similar to Propionibacterium and Brevibacterium while
others in the genus, together with the genera Arthrobacter and Cellumonas, show a close
morphological resemblance to representative of the genera Mycobacterium and Nocardia
(Bowie etal, 1972; Jensen, 1952; Skerman, 1967).
Keddie and Cure (1977) defined legitimate members of Corynebacterium sensu stricto as
those facultative anaerobes which contain mejo-diaminopimelic acid {meso-DAP),
arabinose, galactose and corynemycolic acids in their cell waU. This definition covered
organisms with a fairly narrow range of DNA base ratios and included C. diphtheriae,
most animal pathogens and parasitic species, some saprophytes and Microbacterium
14

flavum, but excluded most saprophytes and all species pathogenic to plants. Saprophytic
species included in this group were C. glutamicum and several other glutamic acid
producing species: B. divarticum, B. lilium, C. callunae and C. herculis. Abe et al.
(1967), however, considered that these should be reduced from species level to synonomy
with C. glutamicum.
In addition to using traditional, taxonomic morphological characteristics to classify
coryneform, numerical taxonomy and chemotaxonomic classification have played
important roles in determining taxonomic relationships. Chemotaxonomy is defined as
the application of chemical techniques which gives information on the presence or
absence of specific compounds, such as lipids, amino acids and sugars in the cell surface
(Barreau et al, 1993; Cummins, 1962) and is a useful tool for the classification and
differentiation of Gram-positive bacteria. In Gram-positive bacteria, since the cell wall
structure constitutes up to 40% of the dry cell weight of these bacteria (Dolye, 1992)
therefore it is considered as an important indicator in classification of these bacteria.
Peptidoglycan is the characteristic cell wall polymer in bacteria. The chemical
composition of the cell walls of human and animal pathogenic Corynebacterium species
was found to be similar to that of Mycobacterium and Nocardia species (Cumins and
Harris, 1956; Cummins 1962). These genera contain meso-DAP, arabinose and galactose
in the cell wall and could be distinguished from Streptomyces species which contain
glycine and meso-DAP, and Actinomyces species, which contain lysine and galactose
(Cummins, 1962; Lechevalier, 1970; Mordarska et al, 1972). The peptidoglycan of
corynebacteria is composed of 1,4-linked glucosamine and muramic acid units. Chemical
and immunological studies suggested that arabinogalactan is a seriological antigen
common to mycobacteria, nocardia and corynebacteria (Azuma et al, 1973; Misaki, Seto
and Azuma, 1974). The enzymatic degradation of mucopeptides and chemical analysis
of their subunits indicated that the tetrapeptide, Ala-Gln-Dpm-Ala, is the principal
subunit of the peptide moiety of the mucopeptide portion of cell wall of mycobacteria,
nocardia and corynebacteria (Azuma et al, 1973). It was concluded that corynebacteria,
mycobacteria, and nocardia were closely related and that strains of these three groups
should therefore be taxonomically grouped together. This was supported by Harringston
15

(1966) and GoodfeUow (1967), who made a numerical taxonomic study of coryneform
and members of the genera Mycobacterium and Nocardia and who, as a result of
available evidence, proposed that the genera Corynebacterium, Mycobacterium, and
Nocordia be merged to form one genus.
In the last 20 years the taxonomy of this important group of bacteria has much improved.
In particular, the careful application of phenotyping methods, used in conjunction with
molecular genetic methods (e.g. DNA-DNA hybridisation [Carlotti et al, 1993; Liebel et
al, 1991] and 16S rRNA gene sequencing [Pascual et al, 1995; Stackebrandt and
Schleifer, 1984]) have resulted in more robust and reUable species identification. In
1989, Ochi and coworkers developed a method for identifying and classifying
actinomycetes. This approach is based on the analysis of ribosomal AT-L30 proteins
(homologous to E. coli L30 protein) which involves determining the electrophoretic
mobihties of the AT-L30 proteins and then N-terminal amino acid sequences. In 1995
these authors further extended this study with the objectives (i) to clarify the phylogenetic
relationships among the genera Rhodococcus, Nocardia, Mycobacterium,
Corynebacterium and Tsukamurella and (ii) to clarify the taxonomic status of the
members of the family Actinomplanaceae and actinobacteria as represented by the genera
Actinomyces and Micrococcus within the Gram-positive bacteria. The phylogenetic
relationships among 30 mycolic acid-containing, wall chemotype IV, actinomycetes and
12 strains belonging to alUed taxa were examined by determining the amino acid
sequences of the ribosomal AT-L30 proteins of those organisms. Sequencing 20 N-
terminal amino acids of AT-L30 preparations revealed that the members of the mycolic
acid-containing actinomycetes formed two clusters: the first cluster contained the genera
Nocardia, Rhodococcus, Gordona, and Tsukamurella, and second cluster contained the
genera Corynebacterium and Mycobacterium. The phylogenetic clusters identified were
entirely consistent with the proposal of GoodfeUow that the family Nocardiaceae should
encompass the mycolate-containing, cell wall type IV actinomycete genera Nocardia,
Rhodococcus, Gordona, and Tsukamurella. The genera Actinomycetes and Micrococcus
exhibited AT-L30 amino acids sequence characteristics intermediate between those of
actinomycetes and those of typical eubacteria. The genera Rhodococcus and
16

Corynebacterium were considered to be taxa that consist of phylogenetically distantiy
related species. Ochi's results agreed with this classification (Fig 1.1). However, less
significant difference between 16S rRNA analysis and Ochi's AT-L30 is that in the 16S
rRNA the genera Nocardia and Rhodococcus occupied separate phylogenetic positions
(Klatte et al, 1994; Stackebrandt et al, 1980) whereas Ochi's results imply that among
mycolic acids-containing taxa, the genera Nocardia and Rhodococcus are very closely
related.
The taxonomy of mycolate-containing, wall chemotype IV actinomycetes has undergone
extensive revision. Ochi's results also agree with this classification as well. Rhodococcus
equi is an important eqine pathogen and was previously classified in the genus
Corynebacterium. Although the members of the genus Rhodococcus generally contain
longer mycolic acids than the members of the genus Corynebacterium, several
rhodococci, including R. equi, have mycolic acids whose lengths overlap the lengths of
mycolic acids of corynebacteria. The AT-L30 data support the current taxonomic status
of R. equi (Fig 1.1). Actinomyces pyogens, which was previously classified in the genus
Corynebacterium (Reddy et al, 1982), is also an important veterinary pathogen. C.
glutamicum, which was previously classified in the genus Micrococcus, is an important
organism in the glutamic acid fermentation industry. According to these authors, AT-
L30 data provides strong support for the current taxonomic status of Actinomyces
pyogens and C. glutamicum (Fig 1.2). It is especially interesting that C. amycolatum, a
relatively new species proposed by Colhns et al, (1988), differs from other
corynebacteria by lacking mycotic acids. Despite such a significant difference, inclusion
of this organism in the genus Corynebacterium is strongly supported not only by the high
level of amino acid sequence similarity to other Corynebacterium species, but also by a
distinctive characteristic of this genus, a deletion of the amino acid at position two in the
AT-L30 protein (Fig 1.1). Finally these authors suggested that the AT-L30 sequence
method appears to be useful for bacterial taxonomy not only at the generic level but also
at species level.
17

1
N. asteroides
N. otitidiscaviarum
N. nova
N, brasiliensis
N. farcinica
R. rhodochrous
R. rhodnii
R. ruber
R. erythropolis
R. coprophilus
R, luteus
R. equi
M. diernhoferi
M. fortuitum
M. chelonae
M. moriokaense
M. austroafricanum
C. diphtheriae
C. flavescens
C. cystitidis
C. vitarumen
C. glutamicum
C, xerosis
C. amycolatum
G. bronch i a 1i s
G. rubropertinctus
G. terrae
G. amarae
G. sputi
Ala-Asp"Leu-Lys Val
Ala-<;iu-Leu-Lys Val
Ala-Gln-Leu-Lys
Ala-Asp-Leu-Lys
Ala-Asp-Leu-Lys
5 10
~Thr-Gln-l le-Lys-Ser-Thr-I le-Cly
Thr-€ln-Ile-Lys-Ser- ? -Ile-Gly
Va
Val
Thr-{Iln-I le-Lys-Ser-Thr-I le-Gly|Ala
ValfThr-Gln-lle-Lys-Ser-Thr-Ile-GlyJAlalLys-Gln-Asn-Gln- ? -Asp
? -Asn-Gln- ? -Asp •Thr-Gln-1 le-Lys-Ser-Thr-Ile-Gly Ala
15 20
Ala|Lys-Ala-Asn-Gln-Lys-Asp
AlafLys-Ala-Asn-<;in- ? -Glu
Lys-Lys-Asn-GIn- ? -Glu
25
Lys-
Ala-Glu-Leu-Lys-1le-Thr-Gln-Ile-Lys-Ser-Thr-1le-Gly-Ala-Lys-Ser-Asn-Gln-
Ala-Asn-Ile-Lys-Ile-Thr-Gln-lle-Lys-Ser-Thr-lle-Gly-Thr-Lys-Gln-Asn-Gln-
A1a-G1u-Leu-Lys-11e-Thr-G1n-Va1-Lys-Ser-Thr-11e-G1y-A1a-Lys-Ser-Asn-C1n-
Ala-Asp-Leu-Lys-Val-Thr-Gln-Ile-Lys-Ser-l!e-Ue-Gly-Thr-Lys-Gln-Asn- ? -
Ala-Glu-Leu-Lys-Ile-Thr-Gln-Ile-Lys- ? -Thr-1le-Gly- ? -Lys- ? -Asn-Gln-
Ala-Gln-Leu-Lys-Val-Thr-Gln-lle-Lys-Ser-Thr-lle-Gly-Gln-Lys-Ala-Asn-Gln-
Ala-Gln-Leu-Lys-Val-Thr-Gln-Val-Lys-Ser-Thr-1le-Gly-Thr-Lys-Gln-Asn- ? -
Asp
•Asp Ser-Leu- ? -Thr-Leu
Asp
•Asp
Asp
Asp Ser-Leu- ? -Thr-Leu
Asp Ser- ? - ? -Thr-Leu
Ala-Glu-Leu-Lys-Ile-Thr-Gln Val -Arg-Gly-Thr-I le-Gly-
Ala-Glu-Leu-Lys-lle-Thr-<]ln Val-Arg-Gly-Thr-I le-Gly
Ala-Asp-Val-Lys-I le-Thr-Gln Val-Arg-Ser-Thr-1 le-<}ly
Ala-Glu-Leu-Lys-Ile-Thr-Gln Val -ArgjSer-Thr-1le-Gly
Ala-Glu-Leu-Lys-Ile-Thr-Gln Val Arg Ser-Thr-Ile-Gly
Ala Arg:
Ala
Ala
Ala
Ala
Arg
Arg
•Arg
-Arg
? 1
9
7
• ;
7
7
Lysf ? - ?
LysfGln- ?
Lys Gln-
LysjGln-
Lys
Glu
Klu
Glu
Glu
Glu
Ala Leu-Lys-Ile-Thr-Gln-His-Lys- Gly
Ala Leu-Lys-1 le-Thr-Gln-Val-Lys- Gly-
Ala Leu-Lys-Ile-Thr-Leu-Lys-Arg Gly-
Ala Leu-Lys-Ile-Thr-Gln-Thr-Lys- Gly
Ala Leu-Lys-Ile-Thr-Gln-Ile-Lys- Gly-
Ala Leu-Lys-Ile-Thr-Gln-Leu-Arg Gly
Ala Leu-Lys-I le-Thr-Gln-Val-Arg -Gly
Leu-Val-Gly-Ala-Asn
Leu-Val-Gly-Thr-Lys
Lys-lle-Gly-Thr-Lys Pro
Leu-Val-Gly-Ala-Asn|Pro
Thr-Val-Gly-Thr-Lys
Pro-
Pro-
Lys-Gln- ? - ?
? - V - •> -Ala
7 . 7 _ 7 - 7
Lys-Gin- ? -Lys
Pro ? 7
Asn
Asn
Asn
Asn
Asn
Asn I Thr-A1a-G1y-Thr-Lys-GIn-Asn-G1n-Lys-Asp
Thr-Ala-Gly-Thr-Glu-Gln-Lys- ? -Lys-Asp-Ser-Leu- ? -Thr-Leu
Ala-Glu-Leu-Lys-Ile-Thr-Gln-Val
Ala-Glu-Leu-Lys-Ile-Thr-Gln- Val
Ala-Glu-Leu-Lys-I le-Thr-Gln- Val
Ala-Glu-Leu-Lys-Ile-Thr-Gln- Val
Ala-Gln-Leu-Lys-Ile-Thr-Gln Val
Lys Gly
Lys Gly
-Lys Gly
Thr-Ile-Gly-Thr-Lys
Thr-Ile-Gly-Thr-Lys Lys
Thr-Ile-Gly-Thr-Lys
Lys Gly- Thr-1 le-Gly-Thr-Lys Lys
Lys Asn-Gln- ? -Asp-Ser-Leu- ? -Thr-Leu
Lys
Asn-Gln- ? -Asp-Ser-Leu- ? -Thr-Leu
Asn-Gln- ? -Asp-Ser-Leu- ? -Thr-Leu
-Asn-Gln- ? -Asp-Ser-Leu- ? -Thr-Leu
Lys<]ly Thr-Ile-Gly-Ala-Lys-Ser-Asn-Gln- ? -Asp-Ser-Leu- ? -Thr-Leu
T. paurometabolum Ala-Glu-Leu-Lys-Ile-Thr-Gln-Val-Arg-Gly-Thr-Ile-Gly-Thr-Lys-Lys-Asn-Gln- ? -Asp-Ser-Leu- ? -Thr-Leu
Figure 1.1 Primary structure of the N-terminal of AT-L30 proteins from various species of the
genera belonging to mycolic acid-containing, cell wall type IV actinomycetes. The question mark
indicates amino acids that were not determined. The dotted lines indicate deletions The amino
acids which characterise each genus are enclosed in boxes. Abbreviations: N, Nocardia; R;
Rhodococcus; M, Mycobacterium; C, Corynebacterium; G, Gordona; T, Tsukamurella . (Ochi,
1995).

However, identification at the species level has to be confirmed by testing more species
and more than one strain per species. Also, this technique is limited for species
identification, as Gordona species could not be differentiated (Fig 1.1 and 1.2).
Studies of glutamic acid producing bacteria, including C. glutamicum, B.
lactofermentum and B. flavum, indicated that these species share many common
characteristics, such as cellular fatty acids composition, the presence of mycohc acids and
peptidoglycans containing me 'o-DAP in the ceU wall (Suzuki & Komagata, 1983),
similar nucleotide sequence of genes encoding the same enzymes in both species, G+C
content in the range 54-56% (typical of true members of the genus Corynebacterium) and
high degree of similarity in DNA-DNA hybridisation studies (Liebel et al, 1991). Based
on these data, the transfer of B. lactofermentum to the genus Corynebacterium has been
proposed (Liebl et al, 1991). Differentiation of strains classified as C. glutamicum and
B. lactofermentum has been made by analysis of rDNA restriction patterns (Liebl et al,
1991) and by restriction fragment polymorphisms around hom genes (Eikmanns et al,
1991). B. linens, the type species of genus Brevibacterium (usually isolated from cheese
sources), has a higher G+C content than B. lactofermentum and C. glutamicum. One
strain, B. linens ATCC 19391, is a patented L-lysine producer. This strain belongs to
the DNA homology groups of the type species, B. linens ATCC 9172 (Fiedler et al,
1981).
Similarly, studies on the genome of these two corynebacteria groups using pulsed-field
gel electrophoresis (PFGE) revealed difference in patterns of chromosomal DNA
(Correia et al, 1994). Using Pad and Swal endonucleases, the genome of B.
lactofermentum ATCC 13869 (genome size 3,052kb) was consistentiy cut into 26 and 20
bands, respectively, and the genome of C. glutamicum ATCC 13032 (2,987kb) yielded
27 and 26 fragments respectively (Correia et al, 1994). Bathe et al. (1996) consUucted a
physical and genetic map of the C. glutamicum ATCC13032 chromosome using PFGE
and hybridisation with cloned genes.
19

8dci I lus subti1 IS
— Actinomyces viscosus
•" Actinomyces naeslundi
-c
4
_L 30 40 50 60 70 80 90
Sequence Relatedness (Z)
£^
d
rd
Micrococcus agilis
Mycobacterium chelonae
Mycobacteriuoi diernhoferi Mycobacterium fortuitum
Mycobacterium austroafricanum Mycobacterium inoriokaense
Corynebacterium diphtheriae
Corynebacteriufli vitaruntcn
Corynebacteriu« f1avescens
Corynebacterium glutamicum
Corynebacterium amycolatum
Corynebacterium xerosis
Corynebacterium cystitidis
Tsukamurella paurometabolum
Gordona bronchial is Gordona rubropertinctus Gordona terrae Gordona amarae
Gordona sputi
Rhodococcus rhodochrous Rhodococcus coprophilus
Rhodococcus ruber
Rhodococcus 1uteus
Nocardia asteroides
Nocardia farcinica
Nocardia bras11iens is
Nocardia otitidiscavi arum
Nocardia nova
Rhodococcus rhodnii
Rhodococcus equi
Rhodococcus erythropolis
Pseudonocardia saturnea
Pseudonocardia thermophila
Saccharomonospora vi ndis
Acti nop lanes philippi nensis Actinop lanes utahensis
Act 1 nop lanes regulari s
Actinopianes digitatis
Micromonospora purpurea
Microcnonospora echinospora
Micromonospora chalcea
Micro<nor>ospora carbonacea
100
-2 "o
* U
Figure 1.2 Clustering based on AT-L30 protein SAS values (quantitative expression of
the levels of similarity of the amino acids sequences, Ochi, 1995).
20

Furthermore, the pattern of PCR (polymerase chain reaction) amplification of
chromosomal DNA using random primers showed that PCR patterns of two strains of C.
glutamicum, ATCC13032 and AS019, were almost identical but that these were clearly
different from that of 5. flavum BF4 (Webster, 1995).
More recently, rm operons of amino acid producing corynebacteria were studied as a
way to understand growth regulation and the mechanism that triggers amino acid
accumulation under nutritional starvation (Amador et al, 1999). These authors by
hybridisation studies found five rRNA operons (rm) in the genome of B. lactofermentum
ATCC 13869 and C. glutamicum ATCC 13032. 'B. lactofermentum' DMS 20412
differed from the other corynebacteria tested showing six hybridisation bands. Two of
the rm operons {rrnD and rrnE) were located in a single cosmid. Sequencing of the rmD
operon showed that it contains a complete 16S rRNA-23S RNA-5S rRNA gene cluster.
Analysis of rmD sequence has provided information on the phylogeny of 'B.
lactofermentum' and on the molecular control of macromolecule gene expression. Based
on their 16S RNA analysis, these authors proposed that B. lactofermentum ATCC 13869
should no longer be considered as a member of the genus Brevibacterium and that it
should be transferred to the genus Corynebacterium in agreement with the proposal of
Liebl et al. (1991). However, their studies showed that the divergence between B.
lactofermentum and C. glutamicum was higher than that between different species of
Corynebacterium, e.g., C. fastidiosum, C. segmentosum, C. accolens and C.
pseudotuberculosis, which indicated that '5. lactofermentum' was a different species of
the genus Corynebacterium. These researchers therefore suggested that 'B.
lactofermentum' should be changed to C. lactofermentum, thus maintaining the name of
the species. '5. lactofermentum' was clearly different from the glutamic acid producer
C. ammoniagenes (previously B. ammoniagenes). It would be interesting to speculate
whether if similar conclusions apply to otiier glutamic acid producing corynebacteria
such as B. flavum, but no data are available on their rrn genes.
The genome mass of C. glutamicum is approximately 1.7 XI0^. Similar values have
been established in B. ammoniagenes (1.9 X 10 ) and other corynebacteria (Bak et al.
21

1970; Crombach, 1978). This size is smaller than the genome size of E. coli (4,000 kb)
and of streptomyces (10, 000 kb) as estimated by Benigni et al {1975).
The genus Corynebacterium contains many species of chnical importance (Colhns &
Cummins, 1986). According to previous studies, mycolic acids are of particular
importance in the definition of authentic members of the genus Corynebacterium
(Athalye et al, 1984; Corina and Sesardic, 1980; Carlotti et al, 1993; Keddie and Cure,
1977). Therefore it can be argued that any bacterium devoid of mycohc acids cannot be
classified in this genus. However, Barreau et al, (1993) collected clinical isolates that
possess all of the phenotypic characteristics of coryneform bacteria but did not contain
mycolic acids. All of these strains were identified as Corynebacterium spp. by standard
culture and biochemical tests. Many of these strains were then identified by a new
commercial kit (Frenny et al, 1991; Gavin et al, 1992) as C. minutissimum, C.
striatum, or related organisms of CDC group 1.
As a result of polyphasic approaches, and growing awareness of corynebacteria as
opportunistic pathogens, a plethora of new species from humans have been described in
the past few years (Funke et al, 1977, 1995, 1997; Reigel et al, 1993, 1995). In contrast,
the potentially pathogenic corynebacteria in veterenary clinical microbiology have
received much less attention, although these organism are the probable cause of, or are
associated with, diseases in animals. This situation is evident in the case of subchnical
mastitis. Staphylococci are traditionally identified to be the most important aetiological
agents of sub-clinical mastitis (Honkanen-Buzalski et al, 1996; Marco, 1994; Serrano et
al, 1994), altiiough corynebacteria are emerging as pathogens of clinical significance in
this patiiology (Fernandez et al, 1997; Honkanen et al, 1996). Recently Fernandez et al.
(1998) reported the isolation of a non-lipophilic coryneform bacterium biochemically
similar to C. jeikeium and C. coyleae from sheep suffering from sub-chnical mastitis.
Based on polyphasic taxonomic analysis, the authors proposed a new Corynebacterium
species, C. camporealensis, for this coryneform from sheep.
22

1.5 OVERVIEW OF THE LIPIDS FOUND IN CORYNEBACTERTIA AND RELATED SPECIES
1.5.1 The nature of the lipids found in mycolic acid containing bacteria
Lipids are natural products which can be isolated from biological materials by extraction
with organic solvents and which are usually poorly soluble in water. Lipids are divided
into two subgroups: polar and non-polar, the most common type of polar hpids found in
corynebacteria are phospholipids, glycolipids and ornithine or lysine-amides,
Amphipathic polar lipids consist of hydrophihc head groups usually linked to two
hydrophobic aliphatic chains. Non-polar lipids are fatty acids, mycolic acids, isoprenoid
quinones and carotenoid pigments. Long-chain fatty acids are released when bound
lipids are subjected to chemical degradation. Lipid markers have been traditionally used
in the classification and identification of coryneform and related taxa (Minnikin et al,
1978).
Isoprenoid quinone analysis has also been proposed as a means of classification of
coryneform and related taxa (Collins et al, 1979; Yamada et al, 1976). Isoprenoid
quinones are a class of terpenoid lipids widely distributed in bacteria and two structural
groups can be recognised, menaquinones (vitamin K) and ubiquinones (coenzyme Q).
They are located in the plasma membranes and are principally involved in electron
transport and respiration (Redfearn, 1966). Menaquinones and 2-methyl-3-polyprenyl-l-
4-napthoquinones display structural variations which include the length and degree of
hydrogenation of the polyprenyl side-chain, hydroxylation (Allen et al, 1967) and
possibly epoxidation (Friis et al, 1967). Coryneform and related bacteria can be divided
into several groups on the basis of menaquinone composition (Collins et al, 1977;
Yamada et al, 1976). Thus human and animal parasitic corynebacteria contain
predominantiy dihydromenaquinone with eight isoprene units, MK-8(H2), whereas C.
23

bovis, C. glutamicum and Mycobacterium strains have dihydromenaquinones with nine-
isoprene units MK-9(H2) as major components.
Fatty acids commonly occur as the hydrophobic chains of the membrane phospholipids
although they can also be present as free fatty acids. They may be straight chain,
unsaturated, branched chain or contain cyclopropane. The fatty acids from
corynebacteria have been extensively studied (Collins et al, 1982b; Minnikin et al,
1978) they have chain lengths between ten and twenty carbon atoms and include mainly
saturated and unsaturated forms (Colhns et al, 1982b; Pierotti, 1987). The cellular fatty
acid composition made up from the four types of fatty acids appear to be distinct and do
not overlap for distinct groups of corynebacteria, even when the culture conditions are
changed. Type I (normal unsaturated) fatty acid composition is found in all coryneform
bacteria that have meso-DAP and arabinoglactan in then cell wall. Collins et al. (1982b)
showed that C. glutamicum and related saprophytic strains, such as B. lactofermentum,
and B. flavum, and animal-associated strains predominantiy contain palmitic acid (Ci6:o)
and oleic acid (Ci8:i). In C. glutamicum, myristic acid (Ci4:o) petadecanoic acid (Ci5:o),
palmitoleic acid (Ci6:i), heptadecanoic acid (Ci7:o) and stearic acid (C]8:o) were also
detected as minor components. According to Pierotti (1987), about 50% of the fatty acids
in the cells are unsaturated and that with increasing cultivation time, from exponential
phase to late stationary phase, the percentage of Ci8:i in AS019 was less than seen for
cell-surface mutant strains of C. glutamicum. Duferene et al. (1997) reported that the
surface of corynebacteria (Corynebacterium strains DMS 44016 and DMS 6688) was rich
in hydrocarbon-like compounds including mycolic acids. Jang (1997) showed that C.
glutamicum also contains a Ci8:3 fatty acid which was particularly noticeable in
extracellular culture fluids.
The name mycotic acid was given to a high molecular weight hydroxy, methoxy fatty
acid from M. tuberculosis which released hexacosanoic acid on pyrolysis (Anderson,
1941; Stodola et al, 1938). The pyrolytic cleavage of mycotic acids was shown to be due
to the characteristic 3-hydroxy-2-branched structure (Assehneau, 1950; Asselineau and
Lederer, 1950). The pyrolysis of mycolic acid was as follows:
24

OH OH I I
R—CH—CH—COOH-^R—CHO + HCH—COOH
(CH 2 ) 2 ^ CH3 (CH 2 ) 2 3 - < : H 3
Assehneau and Lederer (1950) were thus able to define mycotic acids as "high molecular
weight P-hydroxy fatty acids with a long a-side chain". The chain from die |3-carbon can
be up 60 carbons long in mycobacteria and may consist of a wide variety of chemical
structures, such as cyclopropane rings, methyl branches, combinations of cis and trans
double bonds (unsaturated chains) and hydroxyl, methoxy and other functional groups
(Brennan and Nikaido, 1995; Minnikin et al, 1982). Mycohc acids vary considerably in
structure, ranging from the relatively simple mixture of saturated and unsaturated acids in
corynebacteria to the very complicated mixtures characteristic of mycobacteria (Figure
1.3) (Minnikin et al, 1975, 1984a, b, 1985). Mycolic acids of Corynebacterium and
Nocardia contain up to about 40 and 60 carbon atoms, respectively, but those from
Mycobacterium usually contain 70-90 carbon atoms (ChevaUer et al, 1988; Collin et al,
1982a; Jarher and Nikaido, 1994; Stodola et al, 1938; Stakebrandt, 1988). The
corynemycolic acids are attached by an ester linkage to the 5-hydroxy group of the D-
arabinofuranoside residue of arabinogalactan (AG) (Azuma, Yamamura and Fukushi,
1968). In addition, several others lipid species, many of them with unusual structures, are
known to exist in the mycobacterial cell wall as "free" lipids, which are solvent-
extractable lipids that are not covalentiy linked to the AG-peptidoglycan complex
(Brennan, 1988,1989; Minnikin and GoodfeUow, 1980; Minnikin, 1982). The hst of such
extractable lipids is becoming longer with the addition of trehalose-based
hpopolysaccharides (LOSs) (Hunter et al, 1985).
Walker et al. (1973) reported that in C. diphtheriae the mycotic acids were present in the
form of 6% acid-extractable lipids. The bound lipid fraction includes corynemycohc
acids in salt form, trehalose esters (trehalose-6, 6'-dimycolate: cord factor) and glucose
esters when these bacteria are grown on a glucose-containing medium.
25

OH
CH3(CH2 )i7 ^ ' ' ^ ^ ( C H 2 ) i o ^ ^ ^ ^ (CH2)i7 - - - ^ ^ ^ ° ^
(CH2)23 I
CH. '3
a-Mycolic acid (Mycobacterium)
OH
R/ COOH CH3(CH2)i4^fl
(CH2)i3 I
. CH3
Corynoniycoiic acid (Corynebacterium)
Figure 1.3 Structure of a representative a-mycolic acid from M tuberculosis and
corynemycolic acid from C. matruchotti (Minnikin, 1982).
26

The cell walls of both pathogenic and non-pathogenic strains is coated with salts of
corynemycolic acid and "cord factor" which are extractable from cells by treatment with
light petroleum (Walker et al, 1973). In 1987 Pierotti studied covalently bound mycohc
acids of C. glutamicum and showed that approximately 50% of the mycohc acids existed
as the bound form and there was little difference in the relative proportion of mycolic
acids found in the covalently bound or the extractable lipids. Mycohc acids are a major
component of the cell walls of these organisms and the synthesis of these is the subject of
this thesis and the biochemistry and genetics of mycolic acid synthesis is described in
more detail in section 1.6.
1.5.2 Physical organisation of cell wall hpids
Minnikin (1982) proposed a chemical model for the arrangement of the mycobacterial
cell wall and some of the wall-associated lipids, in which the mycolic acids formed a
monolayer near the outer surface of the wall, with fatty acyl chains of various wall-
associated lipids intercalated with the mycolate chains. It was also proposed that this
mycolic acid inner leaflet was composed of extractable lipids, the whole structure thus
producing an asymmetric lipid bilayer. There is some experimental evidence to support
this model. Nikaido et al. (1993) calculated that the amount of mycohc acid in the cell
wall of the M. bovis BCG was sufficient to form a monolayer with an area similar to that
of a mycobacterial cell. In the same paper these authors produced the X-ray diffraction
pattern of an aqueous suspension of purified walls of M. chelonae. The X-ray diffraction
studies showed very clearly that much of the hydrocarbon chains in the cell wall exist in a
tightiy packed, parallel, quasi-crystalline array, and that they occur directed mainly in a
direction perpendicular to the plane of the cell waU.
Based on these results, Nikaido proposed a tentative model similar to that described by
Minnikin (1982). Since a monolayer arrangement of mycolic acid molecules will
produce a large hydrophobic surface, the model assumes the presence of an outer leaflet,
composed of other lipids. However, with the bilayer arrangement proposed, presumably
the unusual structure of the mycotic acids can produce a barrier of extraordinarily low
fluidity and very high stabihty. In the apparent variations in the ratio of mycolate to AG
27

in various mycobacterial species there seems a need for further quantitative investigation
of mycolates in the walls of actively growing mycobacteria. To indicate the proposed
arrangement of lipids in the mycobacterial model, a recent variant of these models by Liu
et al. (1995) is shown in Fig 1.4. These authors pointed out that a dominant waU-
associated hpid in mycobacteria is triglyceride with C14-C18 fatty acids. They suggested
that there is more than enough of this to intercalate with the mycolic acids in the cell
wall. This explains their findings about the fluidity of the lipids in the wall of M.
chelonae, which is low in general but higher in outer parts which are accessible to spin-
labelled probes. Their proposed model consists of a layer of close-packed mycohc acids
with a thermal transition temperature to fluidity well above the growth temperature of the
organisms, intercalated with triglyceride. It follows that the distribution of lipids such as
phenolic glycolipids (PGL) and a, a- trehalose dimycolate (TDM) is not crucial to prove
the Minnikin model: if these lipids are part of the wall, then they could be accommodated
in the bilayer, but if they are mainly the capsular components, then their low
concentration in the wall compartment does not negate the Minnikin model. The model
of Liu et al. (1995) includes an outer membrane leaflet composed of wall-associated
glycolipids, similar to that proposed by Rastogi (1991), and they point out that there is
sufficient glycopeptidolipids (GPL) in the wall of M. chelonae to form such a membrane
leaflet, and that the presence of a leaflet explains the measured high mobihty of the lipids
in the outermost part of the wall. However, this still leaves unexplained the nature of the
outer leaflet in mycobacterial species that do not produce GPL, and this model is open to
the same criticism as the Rostogi model that there is no clear sign of a lipid bilayer in
electron microscope sections. Barry and Mdluh (1996) also favour a bilayer model, but
locate the region of relative disorder in the outer part of the mycolate model. Although
great progress has been made in understanding the arrangement of the lipids of the cell
wall and the wall-associated lipids, there are still some important unsettled issues
regarding the physical arrangement of this structure.
28

GPL PL- --' UL
1,1, 7, 7, .V, , \ ,y,)f, ,'i,y // Arabinogalactan-PG Complex
Figure 1. 4 Model of the ceU waU of M chelonae (Liu et al, 1995). The proposed
arrangement of mycolic acids and associated lipids forming the outer permeability barrier
of the mycobacterial envelope is shovm, indicating the assumed position of the
mycobacterial porin-like protein. A similar arrangement presumably occurs in all
mycobacterial walls, though the mycobacterial acid types and the range of other lipids
involved would differ. GPL, glycopeptidolipid; PL, glycophospholipid; UL, lipids of
unknown structure; TG, friglyceride; PG, peptidoglycan. The solid triangles and squares
indicate double bonds in the mycolic acids.
29

Mycobacterium tuberculosis secreted a series of major exported proteins and protective
antigens which are a triad of related gene products called antigen 85 (Ag85) complex.
These proteins have been implicated in disease pathogenesis through its fibronectin-
binding properties. Belisle et al. (1997) discovered a carboxylesterase domain within the
amino acid sequences of Ag85A, B, and C, by direct enzyme assay and site-directed
mutagenesis he further shown that each protein acted as a mycolyltranferase involved in
the final stages of mycobacterial cell wall assembly. It has been demonstrated by Puech
et al, 2000 that PSl which is homologous to mycobacterial antigen 85 act as
mycoloyltrasferase. Over expression of PSl in the wild type strain of C glutamicum
suggested the involvement of this protein in the transfer of corynomycolates, evidenced
by an increase esterification of the cell wall arabinogalactan with corynomycolic acid
residues and an accumulation of trehalose dicorynomycolates. PSl was present in most
strains tested (Puech et al, 2001) and its deletion leads to a considerable decrease in the
amount of covalently linked mycolic acids in the cell wall (Puech et al, 2000).
Corynebacterium has a cell wall structure similar to that of Mycobacterium, which
consists of mycolic acids arabinoglactan, and peptidoglycan (Barksdale and Kim, 1977;
Lederer, 1971; Bordet, 1976). X-ray photoelectron spectroscopy studies of Duferene et
al. (1997) have indicated that for coryneform bacteria peptidoglycan is an important cell
wall component and contributes about 23 to 31% to the cell dry weight: the protein
content is in the range of 7 to 14%. It was further reported that the surface of
corynebacteria (Corynebacterium species strain 44016 and DMS 6688) contain about
40% hydrocarbon (Dufrene etal, 1997).
Chami et al. (1995) indicated that the surface of C. glutamicum grown on solid medium
was totally covered with highly ordered (hexagonal) surface layer and reported that C.
glutamicum is one of the few known examples (Adachi et al, 1991) where the S-layer
protein is continuously released from the cell wall, implying a continuous synthesis of the
protein. Like mycobacteria, the presence of ion permeable channels has also been
reported by Niederweis et al. (1995) in the cell wall of C. glutamicum. Furthermore h
was found that C. glutamicum has aqueous channels with littie or no interaction between
the channel wall and ions. C. glutamicum has also been shown to contain both free
30

mycolic acids (GoodfeUow et al, 1976; Keddie and Cure, 1977) and "Cord factor" type
lipids (Pierotti, 1987). However, the physical organisation of these lipids in the cell wall
has yet to be elucidated.
A unique model has been proposed by Puech et al. (2001) for corynebacteria using a
combination of molecular compositional analysis, ultrastructural appearance and freeze-
etch electron microscopy studies. This study showed that the ultrastructural appearance
of the cell walls of both corynebacteria and mycobacteria are similar. The similar
features included the plasma membrane bilayer, a thick electron dense layer (EDL), an
electron-transparent layer (ETL) and an outer layer (OL). The EDL contains cell wall
peptidoglycan which bound to the metallic stains during electron microscopy. The EDL is
surrounded by a thin ETL which is traditionally considered to consist of mycolic acids
residues because of their transparent structure under electron microscopy. However, this
layer was also seen in C. amycolatum, which is devoid of corynomycolates (Fig 1.5).
Furthermore the analysis of the purified cell wall also revealed the absence of fatty acyl
substituents indicating that ETL was not synonymous with the lipid layer. The OL
stained heavily with ruthenium red like mycobacteria (Rastogi et al, 1986). This layer
consists primarily of polysaccharides and contains protein. It is evident from this study
that outermost carbohydrates of corynebacteria like mycobacteria (Ortalo-Magne et al,
1995; Lemassu et al, 1996) were found to be exclusively neutral substances.
In corynebacteria the cell-wall-linked mycolates and corynomycolates certainly
contribute to this barrier, since the disruption of genes that code for mycoloyl-transferases
causes a decrease in the amount of the cell wall-bound mycolates and corynomycolates,
and affects the permeability of the envelope of the mutants (Puech et al., 2000). This
outer penneability barrier also includes non-covalently linked lipids which are probably
arranged to form a bilayer with the corynomycolol residues as proposed for mycobacteria
(Rastogi, 1991; Liu et al., 1995). Freeze-etch electron microscopy showed that
corynomycolate-containing strains exhibited a main fracture plane in their cell wall and
contained low-molecular-mass porins, while the fracture occurred within the plasma
membrane of strains devoid of both corynomycoate and pore-forming proteins.
31

TMCM TDCM
Figure 1.5 A tentative model for the cell envelope of corynomycolate-containing corynebacteria, e.g. C.
glutamicum. From the cytoplasmic to the external side of the bacteria the cell envelope is composed of
plasma membrane (PM), a complex wall that is composed of a plasma membrane (PM), a complex wall
that is seen in thin section as an electron-dense layer (EDL) and an electron-transparent layer (ETL), and an
outer layer (OL). The plasma membrane is typical bilayer of proteins (dark rectangles and oval spots) and
phospholipids (PL, empty oval symbols). The EDL consists of thick peptidoglycan (PG) covalently linked
to the heteropolysaccharide arabinogalactan (AG); some of the arabinosyl termini of this polysaccharide are
esterified by C32.36 corynomycolic acids (thin parallel bars). Because the amount of these fatty acids in
most corynebacteria is not sufficient to cover the bacterial surface (see text) covalently bound
corynomycoloyl residues are probably arranged to form with other non-covalently linked lipids, e.g.
trehalose dicorynomycolate (TDCM, a pair of empty squares with two pairs of thin parallel bars), and
trehalose monocorynomycolates (TMCM, a pair of empty square with one pair of thin parallel bar), the
inner leaflet of symmetric bilayer that represents a virtually outer barrier obstructing ace of hydrophilic
substance; the outer leaflet I composed of non-covalently linked lipid which assemble themselves into a
monolayer. In addition, like that of Gram-negative bacteria, the cell envelope of corynebacteria contains
proteins, including one with pore forming ability (P, grey squares) which are present in all the cell envelope
compartment, except the PM. In fi-eeze-fractured and deep-etched preparations of most corynomycolate-
containing strain the major fracture plane (FP) is seen within the cell wall, presumably located between the
two leaflet of the outer membrane (arrow); in strains devoid of corynomycolates and porins, e.g. C
amycolatum, the FP occurs within the PM (arrow). The different non-covalently linked lipid is also present
in OL, which consists primarily of polysaccharides and contains proteins.
32

1.6 MYCOLIC ACIDS: OCCURRENCE, BIOSYNTHESIS AND GENETICS
1.6.1 Analytical methods
Physiochemical analysis of mycohc acid composition and molecular weight distributions
have been used extensively in taxonomic studies of bacteria that contain tiiese acids.
Structural studies indicate that mycohc acids of mycobacteria are a complex mixture of
high molecular weight (Ceo to C90), whereas those from nocardiae and rhodococci are
smaller (C^e-Cee) (Alshamony et al, 1976 a, b; Minnikin and GoodfeUow, 1980). The
mycolic acids from corynebacteria contain homologous mixtures of saturated and
unsaturated components containing between 20 to 36 carbon atoms (Collin et al, 1982a;
Herrera-Alcaraz etal, 1993; Pierotti, 1987).
A number of methods have also been used in studying mycolic acids including the
production of multispot mycolic acid patterns by two-dimensional thin layer
chromatography (TLC) (Barreau et al, 1993; GoodfeUow et al, 1976; Hamid et al,
1993; Minnikin et al, 1975). Cleavage products of mycohc acids detected by gas
chromatography (GC) and GC combined with mass spectrometry (GC-MS) provide
characteristic profiles of mycolic acid composition useful in chemotaxonomic
identification schemes (CoUins et al, 1982a; Chevaher et al, 1988; Pierotti, 1987). High
performance liquid chromatography (HPLC) has also been used to fractionate mycolic
acids (Butler et al, 1991; Thibert et al, 1993).
Mycolic acids have been studied using many extraction and derivatisation methods. In
these methods alkahne hydrolysis is followed by conversion to methyl esters with
diazomethane (Asselineau, 1966; Etemadi, 1967). Apart from the toxicity and explosive
nature of diazomethane this method has a number of disadvantages. A more convenient
method involves acid methanolysis, which directiy produces methyl esters (MAMEs)
(Jang et al, 1997; Minnikin et al, 1975; Minnikin et al, 1980; Pierotti et al, 1987). In
this method, covalentiy bound mycolic acids and fatty acids are extracted from the cell
wall by treating the cells with a mixture of toluene, methanol and sulphuric acid (30:15:1)
followed by incubation at 80°C overnight. The released MAMEs and fatty acid methyl
33

esters (FAMEs) are separated from other cellular components using petroleum extraction,
MAMEs and FAMEs move into the petroleum layer leaving other components in the
aqueous layer. The presence or absence of MAMEs can be demonstrated by TLC of
methanolysates, in which MAMEs are separated from FAMEs due to their slower
chromatographic mobility, using petroleum ether and acetone (95:5, v/v) as solvent. R/
values <0.5 correspond to MAMEs where as R/ values of >0.7 correspond to FAMEs
(Jang, 1997; Pierotti, 1987). Resulting MAMEs can be analysed by GC (Asselineau,
1966). Since mycotic acids are high molecular weight compounds therefore GC analysis
is performed at very high temperatures which causes thermal cleavage to yield FAMEs
and aldehydes (Asselineau, 1966). To avoid this problem pyrolysis GC has been used to
study mycolic acids from various bacteria. Mycobacterial mycohc acids release C22 to
C26 FAMEs, whereas Nocardia yield C12 to C18 FAMEs (CoUins et al, 1982a;
Lechevalier, 1976; Minnikin et al, 1978). Alternatively, hydroxyl group of mycohc
acids can be derivatized to trimethylsilyl (TMS) ethers and these can be analysed as intact
molecules by GC, this can avoid pyrolytic cleavage. GC followed by mass spectrometry
(MS) have been used to fractionate intact molecules of silylated mycohc acids from
corynebacteria (Corina and Sesardic, 1980; Gaily et al, 1982; Pierotti, 1987; Welby-
Giesse et al, 1970), and other mycolic acid containing bacteria (Yano et al, 1972).
Mycolic acids have also been studied using reversed-phase HPLC (Buttier et al, 1991;
Thiebert and Lapierre, 1993). Experimentally, mycohc acids were modified using
saponification techniques and derivatising acids to their p-bromophenylacyl esters. The
resulting products formed distinct pattern types depending on the species examined and
these patterns were also used as a means of species differentiation (Butier et al, 1991).
1.6.2 Types of mycolic acids found in corynebacteria.
The mycolic acid composition of the glutamic acid producing coryneform bacteria has
been studied previously (Bousfield & GoodfeUow, 1976; Collin et al, 1979a; Pierotti,
1987), and they were found to contain mycotic acids with carbon chain length of C28 to
C36 with saturated mono- and di-unsaturated components. Differences in mycolic acid
34

composition for three corynebacteria have been reported, where the three species
contained: C. glutamicum NCIB 10025, C30-C36, B. flavum NCIB 9565, C28-C36 and B.
lactofermentum NCIB 9567, C32-C36. The main mycohc acid lipids were C32:o and C34:i
in all the three species tested. Furthermore, in our laboratories (Jang et al, 1997), studies
were performed on the quantitative determination of mycolic acid profiles of C.
glutamicum strain ATCC 13059, AS019 and mutants MLB 133 and MLB 194 under
different growth conditions. Results showed that all strains had five major types of
mycohc acid (C32;o, C34:o, C34:i, C36:i, C36:2) with C32:0 and C34:i the dominant types
present.
It was observed that pathogenic corynebacteria such as C. diphtheriae, C. ulcerans and
C. urealyticum have different mycolic acid composition (Corina and Sesardic, 1980;
Herrera-Alcarzar et al, 1993; Yano and Saito, 1972). C. ulcerans (Yano & Saito, 1972)
possesses shorter chain length mycolic acids, C20 to C32, while C. diphtheriae possess
mycohc acids ranging from C20 to C35. C. urealyticum exhibited mycolic acids with
lipids ranging from C26 to C30. A summary of mycolic acids found in different
corynebacterial species is shown in Table 1.1.
1.6.3 Role of mycolic acids as a permeability barrier
Cell wall-containing eubacteria have traditionally been divided into two main groups.
Gram-negative and Gram-positive bacteria on the basis of the structure of their cell walls.
The Gram-negative group has a cell wall with a thin peptidoglycan layer and an
asymmetric outer membrane. Small hydrophihc compounds can diffuse through the
outer membrane by the porin pathway (Benz, 1988; Nikaido et al, 1985). Gram-positive
bacteria like mycobacteria and corynebacteria are unique because they contain, in
addition to the thick peptidoglycan layer, a large amount of lipid in the form of mycolic
acids in the cell wall. Mycolic acids have structural roles which give rise to the resistance
of cells to harsh environments and cause the acid fastness of mycobacteria, they probably
play an important role in the restricted permeability of these microbes to the water
35

Table 1.1 Examples of the disfribution of mycohc acids in corynebacteria (Jang
, 1997).
Organism Mycotic acids Reference
Pathogenic corynebacteria
C. diphtheria
C. ulcerans
C. urealyticum
Non-pathogenic bacteria
B. lactofermentum
B. flavum
C. glutamicum
C. lilium
C20 to C25
C 20 to C32
C26 to C30
C32 to C36
C28 to C36
C30 to C36
C32 to C36
Corina and Sesadic, 1980
Yano and Saito, 1972
Herrera-Alcaraz et al, 1993
CoUins ef a/., 1982a
Collins er a/., 1982a
Collins er fl/., 1982a
Collins era/., 1982a
36

soluble molecules (Jarher and Nikaido, 1990). The strong permeabihty barrier of
mycobacterial cell wall due to the presence of lipid layer is one of the major factor
governing the resistance of pathogenic mycobacteria to otherwise potent antibiotics
(Jarher and Nikaido, 1991).
The mycobacterial ceU wall shows an unusually low degree of permeability to
hydrophobic solutes. Jarher and Nikaido (1990) experimentally determined the
permeability of M. chelonae cell wall to hydrophihc solutes using cephalosporins. The
rate of hydrolysis of cephalosporin by intact mycobacterial cells was measured, and the
cell wall permeability was calculated by assuming that drug molecules first diffuse
through the cell waU (following Pick's first law of diffusion) and then are hydrolysed by
periplasmic ^-lactamase (following Michaetis-Menten kinetics). The wall permeability
measured was indeed low: about three orders of magnitude lower than seen for the E.
coli outer membrane and 10 times lower than the permeability of the notoriously
impermeable Pseudomonas aeruginosa outer membrane. Permeation rates had low
temperature coefficients and did not increase when more lipophihc cephalosporins were
used, indicating that the permeation occurred mainly through aqueous channels (Jarlier
and Nikaido, 1990). Recentiy, channels have been identified in the cell walls of M.
chelonae and M. smegmatis and it became clear that the low permeability of
mycobacteria is because of two factors. Firstly, M. chelonae porin is a minor protein of
the cell wall and, secondly, it produces a permeability far lower than that produced by an
equal weight of E. coli porin (Trias and Jarher, 1992). Likewise, Niederweis et al
(1995) identified the hydrophilic pathway through the mycohc acid layer of C.
glutamicum. Their results are in agreement with the assumption that the channel from the
cell wall of C. glutamicum is an aqueous channel with littie or no interaction between the
channel wall and ions. Furthermore, it is clear that these channels can be present only in
the cell wall and not in cytoplasmic membranes. Otherwise, the presence of these high
conducting channels would result in cell death. Several procedures widely used in
biotechnology to improve amino acid secretion by C. glutamicum are hkely to affect the
state of corynebacterial cell wall (Kramer, 1994). However, it remains to be elucidated
37

whether the abihty of corynebacteria to excrete amino acids effectively under certain
conditions is related to the channel forming activity identified or to other properties of
cell wall or a secretary mechanism (Lambert et al, 1995).
Haynes and Britz (1990) speculated that the cell surface of C. glutamicum precluded
efficient uptake of DNA. The unusual structure of the cell wall makes the corynebacteria
resistant to lysozyme unless they have been grown in the presence of cell wall inhibitors,
such as penicillin G, glycine or INH, which modify these structures (Best and Britz,
1986; Jang et al, 1997; Katsumata et al, 1984; Santamaria et al, 1984; Thiebach et al,
1988). It has therefore been suggested that cell wall permeabihty of corynebacteria can
be increased by using ceU wall inhibitors (Best and Britz 1986; Haynes and Britz 1989;
Yoshihama et al, 1985). The action of some of these cell wall acting agents is described
in detail in section 1.7.
Several workers have reported quantitative changes in the mycolic acid composition of
corynebacteria, nocardia and mycobacteria by varying the environmental conditions such
as growth temperature (Toriyama et al, 1980; Tomiyasu et al, 1981) and substrates
(Cooper et al, 1979). Tween 80 is often added to enhance the growth rate of some
cutaneous corynebacteria in commonly used media (McGinley et al, 1985a, b; RUey et
al, 1979). Chevaher et al. (1988) observed that the presence of Tween 80 in the growth
medium of cutaneous corynebacteria induced variations in double bonds of
corynemycolic acids. Tomiyasu (1982) found that mycotic acid composition of Nocardia
species could be changed by shifting the cultivation temperature at mid-exponential
growth phase from 15°C to 50°C, which increased the relative amount of saturated
mycolic acids. These results indicate that environmental changes and specific chemicals
can alter the mycolic acids compositions of some mycolic acid containing bacteria.
38

1.6.4 Biosynthesis of mycolic acids
In contrast to the extensive hterature on the biochemistry of mycohc acid synthesis in
Mycobacterium species and the emerging hterature on the genetics of this, the models for
synthesis of corynemycohc acids are based on relatively few pubhcations and
information comes from a diverse range of species (described in the following), reflecting
the relatively greater importance of pathogenic mycobacteria in human health. Mycohc
acids are thought to result from a unique Claisen-type condensation of two fatty acids
moieties; however littie is known about this essential step within the mycolic acid
biosynthetic pathways. Gastambide-Odier and Lederer (1959) observed that C.
diphtheriae condensed [l- ' C] palmitate when this was supphed in the culture medium to
form the corynemycolic acids C32H64O3 which was labelled essentially at C-1 and C-3.
Therefore it was postulated that two molecules of palmitic acid condense in a Claisen-
type reaction to form the 3-keto derivative, followed by further reaction to yield the
corynemycolic acids. It was also proposed that this conversion apparently involved a
biotin-dependent carboxylation step (Fig 1.6). However, the formation of the putative
tetradecylmalony-CoA, one of the substrates for the subsequent Claisen condensation
reaction, proved difficult to demonsfrate.
Walker et al (1973) confirmed this reaction in a cell-free system of C. diphtheriae and
similar condensations were estabhshed for the corynemycolic acids of sizes between C34
to C36 by Shimakata et al. (1984). Shimakata et al. (1984) demonstrated a complete in
vitro synthesis of corynemycolic acids (C34:o, C34:i, C36:o and C36:i) from [1- C] fatty
acids by the "fluffy layer" (upper fraction of pellet in homogenised-disrupted cells)
fractions prepared from Bacterionema (later renamed Corynebacterium) matruchotii and
some characterization of this synthesis. They found that when ceUs were grown in [1-
C]-stearic acid, the label was incorporated into two major radioactive peaks which were
separated by gas chromatography (GC): one corresponding to the peak of (C34;o + C34.1)
mycolic acids and the other to (C36:o + C36;i) mycolic acid. The reaction was dependant
39

on the pH (optimum at pH 6.4) and required a divalent cation (Mg"^, Zn"^, Ca^ and
Mn^). The in vitro system utilised myristic, palmitic, stearic and oleic acids (probably
via their activated forms) as precursors, among which myristic and palmitic acids were
more effective than the rest. Cerulenin, a specific inhibitor of P-ketoacyl synthetase in de
novo fatty acid synthesis, inhibited the reaction at a relatively high concentration. Thin-
layer chromatographic analysis of lipids extracted from the reacting mixture without
alkaline hydrolysis showed that both exogenous [l-'^'C] fatty acid and synthesised
mycolic acids were bound to an unknown compound by an alkali-labile linkage and this
association seemed to occur prior to the condensation of two molecules of fatty acids.
Recentiy Lee et al (1997) re-investigated the question of a biotin-dependent
carboxylation step through the use of 2, 2-[ HJpalmitic acid in pulse labelling of whole
cells, in the belief that the results would provide clues to the mechanism of the
condensation reaction as well as allowing the design of inhibitors targeted against the
Claisen condensation reaction, at least in corynebacteria. The model strain chosen for
this study was C. matruchotti, since the in vitro synthesis of corynomycolates from 1,2-
["'C] acetate leads to mature corynomycolates and not the intermediate C32 f3-keto esters,
as in the case of C. diphtheriae. The presence of a (3-keto ester would require additional
precautions during chemical analysis, since alkaline hydrolysis results in the liberation of
palmitone (Walker et al, 1973). They also reasoned that the Claisen condensation step
would be conserved between C. matruchotti, C. diphtheriae and Mycobacterium genus.
The results of their studies supported the earlier conclusions of Gastambide-Odier and
Lederer (1960), that two molecules of palmitic acid condense together to form the C32
corynemycolate. Their results showed that corynomycolate retains two deuterium atoms
within the P-chain, at positions C-2 and at C-4. The retention of the deuterium atom at
position C-2 clearly supported a pathway whereby two palmitic acids condense without
an intermediate carboxylation step in the course of synthesis of the mature mycolic acid.
This proposed pathway is demonstrated in Fig 1.7.
40

The absence of a carboxylation step allows one to propose a mechanism for the
condensation reaction involving a highly activated enolate intermediate (Fig 1.8). This
evidence allowed the design and synthesis of several structurally related antagonists
against the condensation reaction, which were shown to posses potent in vivo activity
against C. matruchotti with complete inhibition of growth on solid medium at
concentrations between 1-10 pg/ml (Richard et al, 1997).
Corynebacteria also possess a closely related multifunctional fatty acid synthase complex
(FAS-I) similar to mycobacteria which is responsible for the synthesis of medium chain
C16-C18 acyl-CoA derivatives (Knoche et al, 1991). ExperimentaUy this soluble synthase
was found to be insensitive to the fatty acid analogs suspended at 200 pg/ml, suggesting a
separate and distinct synthase, that is particulate in nature (EP60), responsible for
corynomycolate synthesis, and presumably involving a membrane-bound ACP.
A different model was proposed for mycobacterial mycolic acid biosynthesis. It is
postulated that the Claisen condensation reaction of M. tuberculosis (Fig 1.9) involves
the interaction of an activated C56 fatty acid (meromycolate) (I) with an activated C26
fatty acid (II) to yield a 3-oxo intermediate of an acyl carrier group (III) which is then
reduced to form the mature mycolic acid prior to its transfer to the various cell wall
components (IV) (Lee et al, 1997). Lee et al. (1997) showed that X was H rather than
CO2. Accordingly, the transition state intermediate of the resulting Claisen condensation
reaction could provide a crucial target for antagonists and thus potentially new drugs for
application in mycobacterial diseases. Also the inhibition of this step should facilitate
41

1-[^^C]palmitate
\
H
CH3(CH2)i3-C-*CO-CoA
H
CH3(CH2)i4 - *C0 - Carrier (CoA/ACP)
O H
CH3(CH2)i4 - *C - C - *C0 - Carrier -*-I
(CH2)l3
CH3
\ OHH
CH3(CH2)i4 - *C - C - *C0 - Carrier
H (CH2)i3
CH3
CO2H
CH3(CH2)i3-C - * C O - C o A I
H Tetradecylmalonyl - CoA
O CO2H
CH3(CH2)i4 - *C - C - *C0 - CoA I
(CH2)i3
CH3
Figure 1.6 Earlier postulated pathway for the synthesis of corynemycolic acids of C.
matruchotti, involving a carboxylation step (Shimakata et al, 1984; Gastambide-Odier et
al, 1960).
42

H
DENOVO SYNTHESIS/ELONGATION (FAS-I/FAS-II)
CH3(CH2)i3 - C - CO - Carrier (CoA/ACP)
I CH3(CH2)i4 - CO - Carrier (CoA/ACP)
H
O H
CH3(CH2)i4 - C - C - CO - Carrier I
(CH2)i3
CH.',
\
OHH
CH3(CH2)i4 - C - C - CO - Carrier I I
H (CH2)i3
CH3
Figure 1. 7 The proposed pathway for corynomycolate synthesis in C. matruchotti
involving a non-carboxylation dependent step. The nature of the acyl carrier groups is
not known but are presumably ACPs (acyl carrier proteins) (Lee et al, 1997).
43

o -LJp.^K Carrier-H
OH
O
^H^ [ C '"'"' '' + Carrier -^-H S ^ O
'n
Enz^
Carrier
H-
Enz"
b
v / „ Carrier
Figure 1.8 The proposed mechanism of Claisen condensation reaction in corynebacteria
(Richard e/a/., 1997).
40

O
CH3(CH2)i7^ ^ (CH2) io ' ^ " - ( C H s l i r - ^ Carrier,
(I)
Carrier,
CH3(CH2 )23
(II)
CH3(CH2)17 (CH2)io
(III)
O O
(CH2) 17 Carrier,
Carrier,
(CH2)23
CH3
R (cell wall; trehalose)
OH O
^ ^ ( C H 2 ) i o / ^ (CH2)i7 - ' ^ ^ R CH3(CH2)l7^ ^(CH2)10
(IV) (CH2)23
CH.,
o Carrier,
X
Figure 1. .9,Condensation step in the biosynthesis of the a-mycolates of M. tuberculosis.
Two fatty acids moieties, a C56 meromycolate (I) and a C26 saturated fatty acid (11)
condense to yeild a 3-oxo ester (III) which is then reduced to the hydroxy form (IV). The
nature of the acyl carrier groups are not known but are presumably ACPs (Lee et al,
1997).
41

identification of the acyl carrier groups involved in the final stages of de novo synthesis
of mycolic acids. Clearly, these processes are particularly complex in mycobacteria
because of the requirement of a C56 meromycolate containing within it a variety of
functional groups (Minnikin et al, 1982). Information on the synthesis of the
meromycolic chain is limited (Daffe et al, 1998; Laneelle, 1989). Previous studies,
however, suggest that it would be formed by elongation of a 16- to 24-C precursor by
successive additions of 2-C units (Lacave et al, 1990; Lopez et al, 1991).
Based on the results of corynemycolic acids synthesis (Shimakata et al, 1984; Walker et
al, 1973), Brennan and Nikaido (1995) speculated that the resulting products are in the
form of trehalose mono-mycolates and these esters are thought to be the carriers of the
mycolic acid to the mycobacterial cell wall, where it is transferred to the non-reducing
terminal D-arabinose residue of arabinoglactan via an unknown transacylation reaction in
mycobacteria (Brennan and Nikaido, 1995). Early studies on the biosynthesis of mycolic
acids have been reviewed by Besra and Chitterjee, 1994. More recently mycolyl-
marmosylphosphopolyprenol was identified and it was suggested that mature mycolic
acids are formed from p-oxo precursors while attached to a mannosylphosphopolyprenol
and are then transported through the membrane for esterification to the arabinan in the
wall (Besra et al, 1994; Kolattukudy et al, 1997).
The condensase, the enzyme responsible for the final condensation step in mycolic acid
biosynthesis remained an enigma for decades. By in silico analysis of various
mycobacterial genomes Portevin et al. (2004) has identified an enzyme, pksl3, which
contain the four catalytic domains required for the condensation reaction. Homologs of
this enzyme were found in other Corynebacterineae species. They proposed that the
substrate of the pks 13 condensase are activated by the acyl-CoA synthase, FadD32, and
an acyl-CoA corboxylase containing the accD4 protein. These experiments showed that
pks 13 gene was essential for the survival of M smegmatis.
46

1.6.5 Genetics of mycolic acids biosynthesis
Knowledge about enzymes that catalyse individual steps that are postulated to be
involved in mycolic acid synthesis is hmited. Fatty acid elongation and cyclopropanation
have been examined. Of the four resolved component enzymes of this very long-chain
fatty acid elongation system, only two, the 3-oxo-acyl-CoA reductase, and enoyl-CoA
reductase were inhibited by INH, a commonly used antimicrobial drug that is known to
inhibit mycohc acid synthesis (Kikuchi et al, 1989). Molecular evidences further
suggested that enoyl reductase (InhA, the product of the inhA gene) is the target for INH
(Dessen et al, 1995). Since the molecular genetics of mycohc acids biosynthesis is the
subject of this thesis, InhA and its genetics is the subject of this section.
The major mycolic acid produced by M. tuberculosis contains two ci^-cyclopropanes in
the meromycolate chain. The genes involved in the cyclopropanation were found using
cosmid cloning of M. tuberculosis DNA which, when introduced into M. smegmatis,
caused cyclopropanation of the double bond in the mycolic acid. A gene, cmal, encoding
a protein that has 34% identity with the cyclopropanating enzyme of E. coli, was found
to be responsible for this cyclopropanation (Yuan et al, 1995). Another gene, cma2, with
73% identity to cmal, was cloned from M. tuberculosis by homology to a putative
cyclopropane synthase identified from the M. leprae sequencing project. This gene
cyclopropanated the proximal olefin in the mycolic acids of M smegmatis (George et al,
1995). The methoxymycolate series found in M. fuZjercw/o 'w contains a methoxy group
adjacent to the methyl branch, in addition to the cyclopropane in the proximal position.
The molecular genetics of this olefin modification were elucidated (Yuan and Barry,
1996). Since cyclopropanation of mycotic acids has not been reported in corynebacteria,
this topic is not further reviewed here.
INH was first reported to be an effective antituberculosis drug in 1952, displaying
particular potency against M. tuberculosis and M. bovis. Isoniazid resistant strains were
isolated immediately after this antibiotic began to be used therapeuticaUy (Middlebrook,
1952), and about 20% of the M. tuberculosis strains in New York City were later
47

reported as resistant to isoniazid (Frieden et al, 1993). Determining the molecular
mechanisms of action of isoniazid, and its cellular targets, is thus crucial botii for
understanding resistance mechanisms in mycobacteria and for designing more potent
anti-mycobacterial agents for controUing tuberculosis and other diseases caused by
mycobacteria.
Drug resistance can be caused by many mechanisms, including mutation in the drug
target that reduces the binding of the drug or mutations that lead to increased production
of the target (Rabussay et al, 1969). The mechanism by which INH inhibits M.
tuberculosis and its precise target of action are unknown. However, compelling
biochemical evidence has suggested that both INH and ethionamide (ETH) block mycolic
acid biosynthesis. Previous studies have also shown that in certain cases low-level INH
resistance correlated not with the loss of catalase activity but with the coaquisition of
ETH resistance (Canetti, 1965), indicating that the mechanism of action of the two drugs
may share a common target.
The recent development of molecular genetic techniques for mycobacteria (Jacob et al,
1991) and availabiUty of a cell-free assay system for mycohc acid biosynthesis (Quemard
et al, 1991) have allowed advances in the understanding the mechanism of INH action.
A novel gene, inhA, was identified from M. tuberculosis, M. avium, M. smegmatis and
M. bovis by characterisation of genetic variants that conferred resistance to both INH and
ETH (Banerjee et al, 1994). Resistance to these two anti-tubercular drugs was shown to
be mediated by either mutations in the structural gene or the presence of the wild-type
gene on a multi-copy plasmid. Sequence analysis revealed that the inhA locus consists of
two open reading frames (ORFs), designated orfl and inhA, encoding 25.7-kd and 28.5-
kd proteins respectively, which may participate in fatty acid biosynthesis (Dessen et al,
1995). Sub-cloning studies demonsfrated that the second orf from. M. smegmatis DNA
was sufficient to confer the INH resistance phenotype and was thus named the inhA gene.
The preferred designation for orfl is now mabA [mycolic acid biosynthesis] [Musser et
al, 1996]). In M. tuberculosis and M. bovis, the two genes are separated by a short (21
bp) non-coding region that lacks a readily identifiable promoter (Banerjee et al, 1994). It
48

is thought that mabA and inhA together constitute a two-gene operon that is Uanscribed
from a promoter located upstream of mabA.
Quemard et al. (1995) in their steady state kinetic experiments have shown that isoniazid
is a poor inhibitor of enzymatic activity (Kjs ca. 40 mM against 2-rran5-octenoyl-CoA)
suggesting that isoniazid is not the active form of the drug but rather a pro-drug which
must be converted to an active form. Earlier observation suggested a hnk between INH
resistance and the loss of mycobacterial catalase-peroxidase activity (Cohn et al, 1954;
Middlebrook, 1954). Recent reports have demonstrated that deletion of, or point
mutations in, the M. tuberculosis katG gene, which encodes a unique
catalase-peroxidase, results in the aquisition of INH resistance and that transformation of
INH-resistant sfrains of M. tuberculosis with a functional katG gene restores sensitivity
to the drug (Zhang et al, 1992, 1993). A more recent report has shown that the catalase-
peroxidase oxidizes isoniazid to form reactive intermediates, which can be quenched with
added nucleophiles (Johnsson and Schultz, 1994).
The suggested targets for the activated drug in mycobacteria have included InhA, an
enoyl acyl carrier protein reductase (Banerjee et al, 1994), as well as two components of
a type II fatty acid synthase system, AcpM and KasA (Mdluli et al, 1996a, b). This is
consistent with the observation that mycolic acid biosynthesis is inhibited by isoniazid
and that fatty acids up to 24-26 carbons accumulate in its presence (Quemard et al,
1991). Alternative mechanisms for the in vivo activation of isoniazid, which are
independent of KatG-dependant oxidation, may additionally generate enoyl-ACP
reductase inhibitors, since isoniazid-sensitive strains of M. tuberculosis with no
catalase-peroxidase activity have been isolated (Heym et al, 1994; Kapur et al, 1995;
Stoeckleera/.,1993).
The predicted InhA proteins of M. tuberculosis, M. bovis, and M. smegmatis show
some sequence similarity to the EnvM proteins of Salmonella typhimurium and E. coli.
The protein EnvM is thought to be involved in fatty acid biosynthesis (Bergler et al,
1992; Turnowsky et al, 1989) and has been shown to catalyse the reduction of a
crotonyl-acyl carrier protein (Bergler et al, 1994), an essential part of fatty acid
49

elongation. The first open reading frame (orfl) also exhibits sequence similarity to
several other proteins involved in fatty acid biosynthesis; the highest identity score was
46.5% over 241 amino acids of the 3-keto-acyl carrier protein reductase (fabG gene
product) from E. coli. The InhA protein uses flavin nucleotides as substrates or
cofactors, as it has a putative binding site for these molecules (Banerjee et al, 1994).
Kinetic analysis suggested that isoniazid resistance is due to a decreased affinity of the
mutant protein for NADH. Moreover, examination of the crystalline structure of the
target protein (2-rran5-enoyl-acyl carrier protein) revealed that drug resistance was
directly related to perturbation in the hydrogen-bonding network that stabilises P-
nicotinamide adenine dinucleotide (NADH) binding.
In two different studies, 25% of the clinical isolates contained mutations within the inhA
locus, and substitutions within the inhA open reading frame have been shown to express
the Ser ' - Ala^^ (S94A) and Ile^^-> Thr ^ (116T) InhA enzymes (Heym et al, 1994;
Banerjee et al, 1994; Kapur et al, 1995), suggesting that these changes are important for
continued activity by the InhA protein.
The identification of an inhA gene missense mutation (Ser ' -Ala ' ) that conferred
isoniazid and ethionamide resistance in the laboratory, together with the observation that
most rifampicin resistant strains had missense mutation in a defined region of rpoB
(Musser et al, 1995), led to the plausible hypothesis that missense mutations in the inhA
gene would constitute a major cause of resistance among M. tuberculosis strains
recovered from patients. However, sequencing of the entire inhA gene, including the
upstream presumed regulatory region, in 37 isoniazid-resistant organisms revealed that
only with one exception, all strains had the identical wild-type inhA aUele, and none
contained the Ser " -Ala " substitution conferring resistance in the laboratory (Kapur et
al, 1995). Variation was also examined in the 744-bp mabA gene in 24 resistant chnical
isolates, and substitutions were identified at two nucleotides flanking a presumed
ribosomal binding site in four isolates (Kapur et al, 1995). On the basis of these studies,
50

it was suggested that the base-pair substitution flanking the presumed mabA ribosomal
binding site resulted in altered regulation of MabA or InhA (or both) in some M.
tuberculosis-resistant strains. In another study by Musser et al. (1996 ) it has been shown
that katG missense mutation virtually never occur in association with a mutation in the
putative regulatory region of the inhA locus. The most probable explanation proposed by
these authors for the failure of these changes occurring together was that either mutation
alone is sufficient to confer the resistance phenotype.
The product of the inhA gene is characterised as being part of an elongase as it does not
reduce the initial trans-2-enoyl product, crotoyl-CoA, of fatty acid biosynthesis de novo.
Its preferred substrates are Ci6 to C24 enoyl-ACP. Wheeler et al. (1996) did further
investigations to find out whether an elongase step in mycolic acid biosynthesis is the
primary target of isoniazid. According to them, three tines of evidence identified 24:1
cw-5-elongase as the primary isoniazid target. Firstly, 24:1 cis-5 fatty acid did not restore
isoniazid-inhibited mycotic acid biosynthetic activity in a crude cell-wall preparation,
suggesting that the drug acts after the formation of the A-5 double bond. Secondly, 24:1
cis-5 elongase assay, in which the product is mycolic acid, is completely inhibited by
isoniazid. FinaUy, the only intermediates that accumulate as a result of the addition of
isoniazid are fatty acids of 24 carbons. Both 24:0 and 24:1 are observed in a similar ratio
whether or not isoniazid is present, even though concomitant mycolic acid biosynthesis is
inhibited by isoniazid. The proposed scheme (Wheeler et al, 1996) to demonstrate
isoniazid-sensitive reduction of fran5-2-ci5'-5-tetracosdienoyl-ACP is shown in Fig 1.10.
These results are consistent with studies of M. tuberculosis InhA by Dessen et al. (1995).
Although the work of these people adds to the evidence that the target of isoniazid in
Mycobacterium is a highly susceptible fatty acyl elongase involved in mycolic acid
biosynthesis, much work remains to be done in this area. Ultimately the isolation of
individual enzymes should allow the correct pathway to be estabhshed and the binding of
isoniazid or its activated form to its target demonstrated directly.
51

More recentiy, the studies of Mdluh et al. (1996) on hpid biosynthetic responses to
isoniazid treatment of M. tuberculosis and M. smegmatis suggested that the mode of
action of activated INH differs between these two organisms. Transformation of M.
smegmatis with inhA cloned into a plasmid conferred a high level of resistance to INH,
while the same construct failed to confer resistance in M. tuberculosis. The inhA region
from two clinical isolates whose resistance had been attributed to changes in the upstream
promoter region has been cloned and was not sufficient to impart INH resistance to the
level of the parent strain on sensitive M. tuberculosis. These putative mutant promoter
elements appear to elevate expression levels of gene fusion reporter constructs,
suggesting some non-causal connection between observed mutations and the lipid
metabohsm of the drug-resistant organism.
It remains unclear as to what extent inhA mutations co-occur with katG mutations in
some reports, it is clear that many of the observed mutations occur in strains with very
high MICs, consistent with the absence of katG (Heym et al, 1995). In other reports,
inhA promoter mutations occur in the context of multi-drug resistant strains with
unspecified levels of INH resistance (Rislow et al, 1995). In such complex backgrounds,
it is clearly necessary to establish the function of each mutation individually and in
relation to the metabolism of the drug-resistant organism. Perhaps the observed changes
in the inhA loci may be related to compensatory mutations in lipid metabolism in a katG
background, similar to the compensatory changes in enzymes of the oxidative stress
regulon recentiy reported (Sherman et al, 1996). Such mutations may even confer
enhanced resistance to INH in a fozrG-impaired background, which might not be obvious
when tested in wild-type M. tuberculosis but which may have clinical significance.
Finally, the combination of previously reported genetic (Banerjee et al, 1994), structural
(Dessen et al, 1995), enzymological (Quemard et al, 1995) data and recent studies of
Mdluli et al (1996) indicate that InhA is not the major target for isoniazid in M.
tuberculosis. The most consistent interpretation of the data is that a currently
unidentified protein involved in the production of unsaturated 24-carbon fatty acids is
direcUy or indirectly inhibited by torG-activated INH in the uniquely INH-sensitive M.
tuberculosis.
52

16;0-ACP
2 ^ C.
20:0-ACP
22:0-ACP
Anaerobic desaturation of 20:0 to 22:1
22:1frans-3-ACP
Aerobic: A-5 desaturase
22:1 c/s-3-ACP
24:0-ACP 24:1 cis-5-ACP
^2- 24:1 cis-5 elongase
26.0-ACP
a-Mycolate
:o-Carboxy mycolates Keto mycolate
Elongation Methylation Oxygenation
Figure 1.10: Possible pathways for mycolic acids biosynthesis. M. aurum and M.
tuberculosis converts double bonds to cyclopropane rings (Yuan et al, 1995) and
elaborates the mycolate class methoxymycolates. InhA is involved in elongation of acyl-
ACP, but has low affinity for acyl-CoA. The carrier involved in mycolic acid
biosynthesis remains to be identified directly. The target of isoniazid was identified as
elongation of the 24:1 ClS-5 moiety. Note that frans-2-enoyl-carrier reductases are
involved in all C2 elongation steps, but their reaction is shown here only for the
elongation of 20:0-ACP to 22:0-ACP (Wheeler and Anderson, 1996).
53

1.7 MODULATORS OF CELL SURFACE STRUCTURES
The impact of agents like glycine, INH and ETH, which disrupt the physical integrity of
the bacterial cell wall, are described in the following sections.
1.7.1 Glycine
It has been known for many years that increasing concentrations of glycine have some
inhibitory effect on bacterial growth (Dienes et al, 1950; Gorden and Gorden., 1943).
Studies have shown that the morphological effects of glycine are similar to those of
peniciUin G, i.e., cell elongation and spheroplast formation, therefore it has been assumed
that the cell wall is the main site of glycine action. In 1965 Strominger and Birge studied
the effect of glycine on S. aureus and observed the accumulation of uridine diphosphate-
N-acetyl muramic acid (UDP-MurNAc) and other cell wall precursors in which L-alanine
was replaced by glycine. The mechanism of action of glycine was studied in detail by
Hishinuma et al. (1971). These authors proposed that growth inhibition is partly due to
the inhibition of the "L-Ala-adding-enzyme".
Studies of Hammes et al. (1973) had shown that the structure of peptidoglycan in the
Gram-positive cell wall was altered following growth in medium containing glycine,
where these authors proposed that glycine substituted for alanine in the peptidoglycan,
impairing the cross-hnking and weakening the peptidoglycan structure.
Previously, Hopwood et al.(l911) used glycine in the growth medium as a preliminary
step to protoplasting Streptomyces species and later on this approach was apphed
successfully in C. glutamicum species. Yoshihama et al. (1985) reported that when C.
glutamicum cells were grown in medium containing 2% (w/v) glycine before lysozyme
treatment, there is 99% increase in the proportion of osmotically sensitive cells (mixture
of spheroplast and protoplasts). Best and Britz (1986) also reported that more
osmotically sensitive cells are obtained following growth in glycine and lysozyme
treatment. Streptomyces mycelium subcultured into a medium containing glycine showed
some growth retardation and cells became much more sensitive to lysozyme than those
grown without glycine (see reviews by Okanishi et al, 1974 and Hopwood, 1981).
54

Zuneda et al. (1984) reported that increasing glycine concentrations from 1% to 2%
increased the lag time, slowed down the growth rate and decreased the biomass yield of
5. antibioticus.
In 1986 Best and Britz studied the effect of presence of glycine in growth medium on cell
morphology of C. glutamicum. CeUs were harvested at mid-exponential phase after
growth in medium containing 2% (w/v) glycine, incubated with 2.5 mg/ml lysozyme for
2 h and then with 0.1 M EDTA for 30 min. These researchers observed that after growth
in glycine cells became larger, more irregularly shaped when compared to those grown in
unsupplemented media. They also found that these effects were less marked in stationary
phase cultures. These observations suggested sfrongly that alterations in cell morphology
in C. glutamicum were related to the presence of glycine in the growth medium.
Jang et al. (1997) also studied the effect of glycine on the cell growth and cell
morphology of C. glutamicum AS019 and the readUy-protoplasting mutants MLB 133
and MLB 194. They noticed that the specific growth rates of aU strains tested decreased
as the concentration of glycine in the growth medium increased. Furthermore, growth in
glycine caused some cell elongation and the rare appearance of X-and Y-shaped ceUs.
The presence of X-and Y-type cells was more frequent in the cell surface mutants
(MLB 133), as were branched rods, relative to the parent strain grown under the same
conditions, suggesting that cell division here occurs through budding, branch formation,
then septation.
A similar observation was also reported in other corynebacteria. When C. diphtheriae
were grown in the presence of 2% (w/v) glycine, the cells elongated and bulged at the
side where the cell wall had apparently been damaged. When cells were treated with
lysozyme (2 mg/ml) and washed in hypertonic buffer, the misshapen rods were replaced
by spherical forms (Serwold-Davis et al, 1987). The effective concentration of glycine
also varied with each strain for the formation of osmotically sensitive cells, C. ulcerans
required much less glycine than did C. diphtheriae (Serwold-Davis et al, 1987).
55

1.7.2 Isoniazid
For several decades, isoniazid (INH) has been a key component in the treatment of
tuberculosis. The INH minimal inhibitory concentration (MIC) for susceptible M.
tuberculosis strains is usually less than 0.02 to 0.05 pg/ml (reviewed by Musser, 1995).
Although neither the precise target of the drug nor its mode of action are known, INH
treatment is bactericidal for mycobacteria. Among the many metabohc perturbations
which have been observed are altered pigment formation (Youatt, 1961), reduced nucleic
acid synthesis (Gangadharam et al, 1963), decreased protein synthesis (Tsukamura and
Tsukamura, 1963), reduced lipid content and altered cell wall permeability (Winder and
Brennan, 1965; Winder, 1964). It was thougt that many of these effects may be indirect
and may simply reflect growth inhibition (Youatt, 1969).
Key informations about the into the mechanism of INH resistance were obtained in 1954
when Middlebrook and colleagues discovered that INH-resistant organisms had
decreased catalase activity (Cohn et al, 1954; Middlebrook, 1954). Hedgecock and
Faucher (1957) further extended this observation, these authors studied INH-resistant
organisms and found an inverse correlation between INH MIC and catalase-peroxidase
activity.
In M. tuberculosis, resistance is typically associated with at least two independent
mechanisms: (1) loss of activation of the pro-drug through either deletion or mutation of
katG gene (Musser et al, 1996) and (2) mutation or inactivation of the inhA gene, which
putatively encodes a fatty acid synthetase associated with mycolic acid synthesis
(Banerjee et al, 1994). The katG gene encodes a catalase-peroxidase (Jackett et al,
1978). Peroxide, in the presence of catalase-peroxidase, converts isoniazid to a variety of
intermediates, ultimately leading to isonicotinic acid (Johnsson et al, 1994). It is thought
that one of these products binds to the target or complexes with NADH to bind to the
target, with isoniazid itself being a poor inhibitor of the inhA gene product (Quemard et
al, 1995).
56

In another study Stoeckle and colleagues (1993) found 31 (76%) of 41 isoniazid-resistant
strains isolated in New York City contained katG sequences. The observation that only a
relatively small percentage of INH-resistant M. tuberculosis strains are catalase negative,
with either gross alterations or missense mutations involving katG (Cockerill et al,
1995), led to the conclusion that mechanisms other than catalase activity play an
important role in isoniazid resistance among clinical isolates of M. tuberculosis.
Likewise some data are available to suggest that INH blocks the synthesis of long-chain-
branched, P-hydroxy fatty acids, or mycolic acids, characteristics of cell walls of mycolic
acid containing bacteria (Banerjee et al, 1994; Davidson and Quemard et al, 1991;
Quemard et al, 1995b; Takayama, 1979; Winder and Colhns, 1970), resulting in the loss
of acid fastness. This is inferred by the observation that INH decreases the amount of
mycolic acids and possible intermediates, very long chain fatty acids, in Nocardia species
(Tomiyasu and Yano, 1984), and INH inhibited the enzymatic biosynthesis of very long
chain fatty acids in M. tuberculosis H37Ra (Quemard et al, 1995b). Tomiyasu and Yano
(1984), working with Nocardia species, also found that INH markedly reduced the
synthesis of mycolic acids longer than C44 or C46, specifically by inhibiting chain
elongation or desaturation of the precursor fatty acids longer than C28 to C30. However,
the exact point of inhibitory action or lethal changes in mycolic acids has not been
demonstrated to date. According to the observations of Winder et al. (1964) and others
(Tomiyasu and Yano, 1984; winder and CoUins, 1970), INH treatment also induced
morphological changes, such as disappearance of acid-fastness or wrinkled surface
structures in Mycobacteria and Nocardia. The latter also implied that INH impacts on
surface structures.
Britz and colleagues (Britz, 1985; Haynes and Britz, 1989; Haynes and Britz, 1990)
added INH as a component of the growth medium of coryneform bacteria species in an
order to reduce cell surface barriers for DNA transformation, in respect to the known
effects of INH on mycohc acid synthesis in mycobacterial species. In their experiment
they grew two species of corynebacteria, C. glutamicum and B. lactofermentum, in LBG
containing different concentrations of INH (0-4 mg/ml), harvested at early-exponential
57

phase, then transformed with homologously isolated plasmid DNA (Haynes and Britz,
1989; 1990). An increase in transformation efficiency was observed with higher
concentration of INH in the growth medium, when compared to cells grown in the
absence of INH (Haynes and Britz, 1990). Based on this observation, these authors
suggested that mycolic acids were probably the principal physical barrier to DNA
entering cells. The effect of INH on mycohc acid composition of corynebacteria was
studied by Jang et al. (1997). These authors noticed that although C. glutamicum is
insensitive to INH, when this was included in the growth medium at high concentrations
(8 mg/ml), all of the sfrains tested had decreased relative proportions of C32:o with parallel
increased proportions of C34.1 and C36:2 and extraceUular mycolates increased to 18-20%
for cell-surface mutants (MLB 133 and MLB 194). These authors therefore suggested that
INH inhibited synthesis of shorter chained, saturated mycolic acids in all strains and also
further impaired covalent binding of mycolates to the cell surface in the mutants. It was
further proposed that unlike mycobacteria, where INH is thought to be converted in vivo
to an active metabohte by the action of T-catalase, such inactivation may not occur in C.
glutamicum but trace amount of an active form may be present in media containing INH
at the high concentrations used, which causes inhibition of mycolic acid synthesis (Britz
personal communication).
1.7.3 Ethionamide (ETH)
Isoniazid and ethionamide are specific tuberculosis drugs. The mode of action of the
former has been reviewed several times (Iwainsky, 1988; Krishna, 1975; Takayama etal,
1979; Winder, 1982), while there are only a speculative data for the latter (Winder,
1982).
ETH, presents strong bacteriostatic properties against some mycobacteria and is rather
more active against INH-resistant mutants (Rist, 1960). Structurally, it is strikingly
analogous to INH and a similar mode of action has been proposed for the two drugs
(Winder, 1982). Similar effects on acid fastness and resphation were also recorded
58

(Dunbar, 1957; Schaefer, 1960), and identical decreases in the "alkah-soluble
carbohydrates" of the cell envelope were noted (Winder and Rooney, 1970). In both
cases, the bacteria double in number before the growth stops (Rist, 1960). Moreover, as
observed after INH treatment (Winder et al, 1971), whole ETH-treated ceUs of M. bovis
(BCG strain) showed strong inhibition of mycohc acid synthesis
However, no cross-resistance between the two drugs could be established (Winder,
1982). Quemard et al. (1992) determined the MICs of ETH on mycotic acid synthesis in
whole cells and cell extracts of different mycobacterial species. Their studies showed
that there was not a direct relationship between ETH susceptibility and mycolic acid
inhibition. The presence of ETH disturbed mycolic acid synthesis in both resistant and
susceptible mycobacteria. The production of oxygenated species of mycolic acid was
inhibited, while that of di-unsaturated mycolic acids was either slightly altered or even
increased. Moreover they found that in the presence of ETH, the unsaturated mycolic
acid molecule presented a methyl end different from the usual one. Finally they
suggested that the normal unsaturated mycohc acid species are not the precursor of the
oxygenated mycolic acids. Moreover, they showed that ETH probably acts early in the
pathway leading to oxygenated mycohc acids (Quemard et al, 1991).
1.8 MOLECULAR GENETICS METHODS IN C. GLUTAMICUM AND
RELATED SPECIES
Currently several methods for the introduction of cloning vectors and exogenous DNA
into Corynebacterium species are available. These include protoplast transformation,
transduction, elecUoporation, and transconjugation (Jetten and Sinskey, 1995). Early
attempts to develop genetic exchange systems in corynebacteria were hampered by two
barriers: the unique cell surface structure and the presence of restriction-modification
systems. The latter caused low frequency of expression of exogenous DNA, particular if
this came from E. coli or B. subtilis and the restriction barriers between strains of
59

corynebacteria were also severe (Jang, 1997; Serwold-Davis et al, 1987). As this is not
the subject of this thesis, this will not be reviewed further here.
1.8.1 Protoplast transformation
Most pubhshed protoplast transformation protocols are based on methods developed for
B. subtilus and Streptomyces species and involve lysozyme treatment followed by PEG-
stimulated uptake of DNA. The methods used in these species involved harvesting the
culture at the appropriate growth stage (usually, during mid-exponential growth),
incubating cells with lysozyme in order to prepare protoplasts, transformation of
protoplasts with DNA and regeneration of the protoplasts (Tichy and Landman, 1969).
Later glycine was added in the growth medium to make cells more sensitive to lysozyme
action (Okanishi et al, 1974). According to a report published by Okanishi et al. in 1974
higher reversion of protoplasts to the normal state was observed by incubating the
protoplasts in hypertonic medium containing MgCl2 (20 or 50 mM), CaCh (50 or 20
mM), phosphate (0.22 or 0.44mM) and casamino acid (0.01%). Subsequentiy, the
polyethylene glycol 6000 (PEG 6000) method was developed for improving DNA uptake
based on its high ceU fusion-inducing abitity and broad applicabihty for various
organisms (Ahkong et al, 1975), including B. subtilus (Gabor and Hotchkiss, 1979;
Schaefferer^z/., 1976).
The reported transformation methods for the corynebacteria are based on the treatment of
protoplasts or spheroplasts with DNA and PEG. Protoplasts of Corynebacterium species
B. flavum was first obtained by Kaneko and Sakaguchi (see Komatsu, 1979). After
transformation, the protoplasts were regenerated in selective regeneration medium in the
presence of adequate concentrations of antibiotics to select clones carrying the antibiotic
resistance markers of the vector. A procedure for the production and regeneration of
protoplasts of B. flavum and the subsequent fusion of protoplasts accompanied by
60

genetic recombination was initially described by Kaneko and Sakaguchi (1979).
Exponentially growing cultures were grown in 0.3 units peniciUin G per ml followed by
lysozyme treatment in hypertonic medium, resulting in the generation of osmotically
sensitive protoplasts. A modification of this method was used by Katsumata et al (1984)
forC. g/Mtomtcwm and Santamaria ef a/. (1984) for fi. lactofermentum. Santamaria ef A/.
(1985) reported that the concentration of penicilhn G added during growth affected not
only the efficacy of protoplast formation and regeneration, but also the PEG induced
DNA uptake by protoplasts. They further reported that prolonged lysozyme treatment
(16 hours at 30°C) used to obtaining more protoplasts, decreased cell viability and
impaired regeneration, leading to low frequencies of transformation. These authors
suggested that a solution to the problem of long lysozyme treatment could be the use of
mutants that form protoplasts more easily and proposed that such mutants could be
isolated on the basis of their hypersensitivity to lysozyme. High frequency
transformation of lysozyme-sensitive variants of corynebacteria was reported by Ozaki et
al. (1984) and by Smith et al. (1986) but similar or higher frequencies have been obtained
using wild-type strains (Santamaria et al, 1985). Morphologically abnormal strains of C.
glutamicum which formed protoplasts more readily than the wild type strain (ATCC
13059) have been reported (Best and Britz, 1986) although their sensitivity to lysozyme
was not greatiy altered.
A variety of parameters affecting the efficiency of protoplast formation, regeneration and
uptake of DNA have been optimised. Santamaria et al. (1984, 1985) reported an efficient
PEG-assisted method for transformation of B. lactofermentum protoplasts that used
constructed shuttie vectors. Unlike C. glutamicum (Katsumata et al, 1984), B.
lactofermentum protoplasts were formed readily foUowing growth in the presence of
peniciUin G (0.3 units) and subsequent lysozyme treatment for four hours (Santamaria et
al, 1984). Santamaria et al. (1985) found that transformation efficiency in B.
lactofermentum depended on the concentration of DNA, the number of cells used for
transformation, and the concenfration and type of PEG. Under optimal conditions, 10
transformants were obtained per pg of DNA used per 10 ceUs treated.
61

A different sfrategy was used by Best and Britz (1984, 1986) and Yoshihama et al (1985)
to make C. glutamicum cells more sensitive to lysozyme treatment by prior growth in
media containing glycine. Yoshihama et al. (1985) obtained osmotically sensitive cells
of C. glutamicum after growth in the presence of 2% glycine, harvesting during
stationary growth phase and treating with lysozyme for 90 min. After protoplast
formation, cells were transformed in the presence of 50% PEG, regeneration medium was
added, and the mixture was incubated for 3 h. Glycine was added into the growth
medium and the cells were turned into osmotically sensitive cells by lysozyme treatment.
These authors reported that no alterations in cell morphology was seen using light
microscopy, suggesting that instead of true protoplasts cells formed spheroplasts, which
were expected to have appeared as rounded cells. To obtain real protoplasts by further
removal of cell wall structures, cells were further grown in the presence of cell wall
biosynthetic inhibitors (cerulenin and INH) at growth-inhibitory concentrations or
treating the cells with a lipase in conjunction with lysozyme treatment, but there was no
success in context with the increase in transformation efficiency. However, the
concentration of INH used were relatively low in comparision those used later to improve
protoplast transformation (Best and Britz, 1986).
Best and Britz (1986) used glycine plus INH to produce protoplasts foUowing lysozyme
treatment, INH concentrations (5 mg/ml) was relatively high which caused substantial
growth inhibition. True protoplasts and spheroplast were differentiated from each other
using differential counting, which were seen under phase contrast microscopy after
growth in glycine plus INH and prolonged lysozyme treatment (Britz, unpubhshed
observation). Cell were plated on regeneration media, ET, which contained sodium
succinate, gelatin, bovine serum albumin, CaCh, MgCh, sucrose and a low concenUation
of phosphate (Best and Britz, 1986). These researchers reported 50-70% increase in
recovery of cells using ET media compared to cells regenerated on normal media such as
LAG (LB [1% tryptone, 0.5% yeast exfract, 0.5% NaCl] supplemented with 1% glucose
and sohdified witii 1.2% agar, pH 7.2) or NAG (Nutrient Broth No. 2 supplemented with
1% glucose and sohdified witii 1.2% agar). To perform total cell counts protoplast
62

mixture was diluted in the osmotically protective medium then plated onto ET
(protoplast, spheroplasts, damaged cells and normal cells were enumerated) or LAG
(spheroplasts, damaged cells and normal cells were enumerated). In parallel,
osmotically-sensitive ceUs were detected by dilution in water, to lyse the spheroplasts,
protoplasts, and damaged cells, allowing enumeration of protoplasts from the differences
in counts seen between this and the above (Britz 1985, unpubhshed observation). It was
also noted that protoplasts of C. glutamicum AS019 prepared following growth in
glycine-INH were fransformed more readily if cells were harvested earlier in the growth
phase and the efficiency fell by 80% if cells came from stationary phase cultures.
Genetic exchange using protoplast fusion has been reported for corynebacteria where
PEG proved useful in the fusion of protoplasts. Karasawa et al. (1986) described PEG-
induced fusion of protoplasts to produce a lysine auxotroph strain of B. lactofermentum
which over-synthesised lysine and threonine.
Protoplast transformation developed for amino acid-producing Corynebacterium strains
was based on the PEG-mediated standard procedures used for other Gram-positive
bacteria (Katsumata et al, 1985; Santamaria et al, 1985; Yoshihama et al, 1985). Once
different parameters had been optimised, transformation efficiencies in the range of 10 to
10 transformants per microgram of DNA were routinely obtained. These transformation
efficiencies are high enough to allow direct cloning in corynebacteria even if a 10 to 100-
fold reduction in transformation occurs when using cloning vectors containing foreign
DNA fragments.
1.8.2 Transduction
Tranduction was first reported in S. typhimurium by Zinder and Lederberg in 1952,
since then tranduction has been observed for both Gram-positive and Gram-negative
bacteria and their phages. Several review papers (Low and Porter, 1978; Susskind and
Botstein, 1978) has been written on generalised transduction. Phage-based transduction
of corynebacteria have also been the subject of few reports (Momose et al, 1976; Ozaki
63

et al, 1984; Patek et al, 1988). Momose et al. (1976) isolated temperate phages from
coryneform bacteria. One of these phages named CP-123, transduced the trp marker at a
frequency of approximately 10' when 1.2 M MgCh was added to the reaction mixture.
One report appeared about the construction of a functional vector system based on phages
(Miwa et al, 1985). These researchers constructed a cosmid vector using a DNA
fragment containing the cohesive ends of a Brevibacterium phage. E. coli-
Corynebacterium shuttle vectors carrying the cos fragment were transduced into B.
lactofermentum and C. glutamicum using the intact phage. Although this system was
described as being suitable for cloning genes into C. glutamicum and B. lactofermentum,
but no further report about the use of this system for gene transfer has been reported.
Protoplasts were also used for transduction of Corynebacterium species (Ozaki et al,
1984; Smith et al, 1986) and B. lactofermentum (Karasawa et al, 1986; Smith et al,
1986) strains. It was reported by Ozaki et al. (1984) that protoplasts could be used for
gene transformation. They reported the successful introduction of an E. coli-C.
glutamicum shuttle vector into E. coli and protoplasts of C. glutamicum by transduction.
The shuttie vector contained ampicillin, kanamycin and tetracychne resistance genes.
The resistance phenotype, except for ampicillin, was expressed in C. glutamicum.
Similarly, Smith et al. (1986) reported that protoplasts of lysozyme-sensitive C. lilium
strains were efficiently transfected with lytic phage CSl DNA at a frequency between 10
and 10 transfected cells per pg of CSl DNA. However, tiiey could not obtain
transfectants when lysozme treatment was omitted.
Petek et al. (1988) used extended protoplast-based transfection for B. flavum. They
prepared osmotically sensitive cells when grown in medium containing penicilhn G (0.4
unit/ml), followed by lysozyme treatment (3 mg/ml). Under these conditions, they found
the efficiency of ti-ansfection varied with the period of lysozyme treatment, PEG
concentration and the number of competent cells used. Based on these observations, they
suggested that the most suitable recipient for the transfer of phage or plasmid DNA in
competent cultures of comybacteria are cells with a partially degraded cell waU.
64

1.8.3 Electroporation
Instead of protoplast transformation, electroporation and transconjugation are now used
as more convenient and much more efficient methods for transformation. Electroporation
involves the use of a high voltage and high current to cause reversible local
disorganisation and transient breakdown of the cell membrane, which allows DNA to
enter the bacterial ceU through the "pores" in the membrane and bring about
transformation (Chang, 1992).
Transformation using electroporation has now been reported for a wide range of Gram-
positive (Berthier et al, 1996; Chassy and Fhckinger, 1987; Foley-Thomas et al, 1995;
Powell et al, 1988) and Gram-negative bacteria (Dower et al, 1988). An early example
was the stimulation of trasformation of B. cereus protoplasts by electric field pulses
(Shivarova et al, 1983) since then the electroporation technique was successfully apphed
to transform Streptococcus thermophilus (Somkuti and Steinberg, 1987), 5. lividans
protoplasts (MacNeil, 1987), Lactobacillus casei (Chassy and Flicking, 1987),
Campylobacter jejuni (Miller et al, 1988), different strains of lactic streptococci (Powell
et al, 1988), Enterococcus faecalis protoplasts, Pseudomonas putida and E. coli (Fiedler
andWirth, 1988;Taketo, 1988).
Various groups have developed their own procedures for electroporation in C.
glutamicum (Bonamy et al, 1990; Bonnassie et al, 1990; Dunican and Shivnam, 1990;
Follettie et al, 1993; Haynes and Britz, 1989, 1990). NormaUy, ceUs used for
electroporation are grown in rich medium for 3 to 5h, harvested at early logarithmic
phase, washed extensively with low-salt buffers containing 5 to 20% glycerol, and
concentrated to approximately 10'° cells per miUititre before use. The physiological state
of the cells being pulsed appears to be important. In general, cells harvested during
exponential growth are electrotransformed more efficiently.
Several compounds (penicilhn G, ampicilhn, glycine, INH, or Tween 80) are reported to
increase the efficiency of electroporation, addition of these agents in the growth medium
can make the cells more permeable for exogenous DNA (Bonassie et al, 1990; Follettie
et al, 1993; Haynes and Britz, 1990; Wolf et al, 1990). A reasonably good
65

transformation efficiencies of 7 X 10 fransformants per pg of DNA with C. glutamicum
strain AS019 and plasnud pHY416 without using any cell wall-weakening agents has
been reported by Dunican and Shivnan (1989). In an experiment, they harvested cells at
an A600 of 0.6, washed with 10% glycerol twice, suspended in 10% glycerol before
storage at -70°C. Subsequentiy 40 pi ahquots of the cells were mixed with 0.1 to Ipg of
DNA and subjected to field strengths of 12.5 kV/cm for about 3 to 8 msec. Thereafter the
cells were immediately nuxed with 0.9 ml of an isotonic medium, incubated for 1 to 1.5 h
then plated onto appropriate media. Transformants generally appear within 48 h.
Freezing prior to electroporation may have altered cell surface integrity. However, many
other workers reported that such a high transformation efficiency is not normally
obtained when cells are grown without using cell wall-weakening agents, and addition of
glycine (2-2.5 %, w/v) to cultures improved the transformation efficiency about 10 to 100
times (Haynes and Britz, 1990; Nob et al, 1990).
Haynes and Britz (1989) electroporated C. glutamicum strain AS019 after growth in
LBG supplemented with 2.5%, w/v, glycine plus 4mg/ml INH plus 0.1% Tween 80 and
obtained 4 x 10 transformants per ug DNA (using small BioRad cuvettes) per 10 cells
electroporated, transformants were recovered on ET media. This was about four orders
of magnitude higher than efficiencies obtained for cells grown in LBG. In their attempts
of improving electrotransformation efficiencies, Haynes and Britz (1990) reported a
transformation frequency of 5 x 10 transformants per pg DNA with C. glutamicum
strain AS019 when grown in LBG supplemented with 2.5% (w/v) of glycine and 4 mg/ml
of INH (using large BioRad cuvettes). There was 10 to 100-fold improvements on using
the protoplast transformation of the same strain of C. glutamicum grown similarly. In
the presence of INH alone, considerable improvement in electrotransformation
efficiencies were noticed only when concentrations were very high (>5mg/ml). Haynes
and Britz (1990) further reported that the recovery medium on which the transformants
were isolated and the diluents used following elecfroporation had a significant effect on
the number of transformants obtained, as observed for protoplast transformation (Britz,
unpublished, 1985). The osmotically-protective medium (ET) gave at least 70% higher
numbers of transformants (in terms of transformation efficiency) than those found on
66

non-osmotically protective medium after using hypertonic diluents following
electroporation, suggesting that electroporation after growth in glycine/INH caused cell
damage and made them osmotically fragile.
Bonnassie et al. (1990) electroporated on B. lactofermentum after growing in LB,
incubating to early-exponential growth phase before adding ampicilhn (0.5 to 1.5 pg/ml)
then harvesting at A540 of 0.3 to 0.5. Subsequently, cells were electroporated with
homologously-isolated DNA at 6.25 kV/cm (25pF capacitor). Pre-treatment witii
ampicilhn allowed electrofransformation of the cell whereas no transformants were
obtained without pre-freatment. Haynes and Britz (1989) reported the improved
electrotransformation frequencies of B. lactofermentum after growth in Tween 80 alone
or in combination with glycine and INH.
Electroporation was used to transform (Noh et al. 1991) C. glutamicum JS231, a strain
derived from ATCC 13032, these workers grew the cells in LG medium (1% w/v,
tryptone, 0.5%, v/v, yeast extract, 0.5 w/v, glucose 1%, w/v, NaCl, pH 7.0) supplemented
with 0.3 U/mJ of penicilhn G and showed about 10 times higher transformation
efficiencies than those for cells grown in medium without penicillin G. This approach
paralleled the earlier work of Kaneko and Sakaguchi (1979) in B. lactofermentum.
1.8.4 Conjugation
Another very efficient means for the introduction of DNA into Corynebacterium is by
transconjugation. Conjugation is a mean of DNA transfer from donor to recipient
bacteria by a mechanism involving cell to cell contact. This process is usually mediated
by conjugative plasmids, which have been isolated from a diverse range of Gram-positive
and Gram-negative bacteria. Plasmids of some incompatibihty groups are capable of
conjugal transfer or immobilization and stable maintenance in almost all Gram-negative
and even Gram-positive bacteria. They are caUed broad host range plasmids and belong
mainly to the compatibility groups IncC, IncN, IncP, IncQ and IncW (Datta and Hedges,
1972; Olsen and Shipley, 1973; Wilkins, 1990).
67

Conjugal transfer of broad-host-range IncP-type resistance plasmids within the Gram-
negative bacterial species is well known (Beringer, 1974; Datta and Hedges, 1972; Olson
and Shipley, 1973). Non-self-transmissible plasmids carrying the appropriate origin of
transfer (oriT) can be mobihsed by IncP plasmids (Willetts and Crowther, 1981). Recent
studies have shown that conjugation is a non-specific process and accounts for most
horizontal gene transfer between even phylogenetically remote organisms (Buchanan et
al, 1987; Mazodier et al, 1989; Trieu-Cuot et al, 1987, 1988). Conjugation mediated
by the broad-host-range (bhr) plasmid RP4 (Datta and Hedges, 1971) is suitable for
transfer of plasmid DNA from E. coli to a wide range of Gram-negative bacteria and also
at high efficiency into several Gram-positive genera, like Streptococcus, Bacillus,
Staphylococcus, Mycobacterium, Streptomyces, Corynebacterium, Brevibacterium,
Arthrobacter or Rhodococcus.
Unlike transformation and electroporation, conjugation is a highly efficient way to
introduce foreign DNA into wild-type C. glutamicum strains, which seem to have a
rather strong restriction system (Martin et al, 1987; Schafer et al, 1990; Thierbach et al,
1988). Schafer et al (1990) reported the mobilization of shuttle plasmids from Gram-
negative E. coli to Gram-positive corynebacteria by P-type transfer functions. This
strategy is based on the oriT and plasmid transfer (Tra) function of IncP-type broad-host-
range plasmid RP4 (Datta et al, 1971) and consists of E. coli mobitising strains (E. coli
SI 7-1) and derivatives of conventional E. coli vectors (pSUP vectors [Simon and Piihler,
1983; Simon et al, 1986]). Conjugation between E. coli and corynebacteria is
performed using nitrocellulose filters to concentrate cells. This system was applicable to
a wide range of different C. glutamicum strains (Schafer et al, 1990). Transfer
frequencies up to 10" per final donor colony, with 10 to 10 transconjugants per mating
assay, were obtained. Restriction systems in coryneform bacteria impairing intergeneric
conjugation have been shown to be stress sensitive and can be inactivated by short stress
treatments (Schafer et al, 1990 and 1994). The recipient cells can be rendered more
fertile by applying heat treatment, which consisted of incubating C. glutamicum ATCC
13032 at 49°C for approximately 9 min (Schafer et al, 1994a). Thereafter, non-growing
cultures remained in a "competent state" for several days. When transferred to fresh
68

medium and incubated at optimal growth temperature and aeration, the ceUs lost their
high fertihty within a few hours. Conjugation frequency was increased by lO' -fold after
heat treatment of host ceUs. Schafer et al (1996) observed high frequency plasmid
transfer when the restriction system of the recipient was mutated. This problem can also
be overcome by the use of restriction-deficient host sttains, or exposing the cells to
environmental stress such as pH, ethanol or SDS (Bonassie et al, 1990; Follettie et al,
1991; Liebel, 1991; Schafer etal, 1990, 1994).
Vertes et al. (1994a) described the presence in C. glutamicum of the element 1S31831
from ATCC 31831 and later used it to construct two artificial transposons (Yn31831 and
mini-Tn3/S5i) for mutagenesis of corynebacteria by conjugation. Resulting mutagenesis
produced a variety of mutant sfrains of B. flavum at an efficiency of 4.3 X 10"* mutants
per pg DNA. A new IS element (IS 7 206) from C. glutamicum was described by
Bonamy et al. (1994), and a different one (1S13869) has been isolated from B.
lactofermentum (Correia and Martin, 1996). In addition, an extensive survey on the
occurrence of IS elements in coryneform bacteria, conducted with an IS entrapment
vector based on the B. subtilis sacB gene, indicated that at least three different classes of
IS elements are present in coryneform bacteria (Jager and Piihler, 1995). A transposable
element from C. xerosis was also shown to be active in C. glutamicum after introduction
of the deUvery vector by intergeneric conjugation (Tauch and Piihler, 1995).
Numerous observations made during transformation and transconjugation experiments
indicate the presence of restriction or modification system in Corynebacterium strains
(Follettie et al, 1991; Liebl, 1991; Wohlleben et al, 1992). The problems caused by
these systems for cloning experiments can be overcome to some extent by the use of
restriction-deficient host strains, or by stress (Bonassie et al, 1990; Follettie et al, 1991;
Liebl, 1991; Schafer ef a/., 1990, 1994)
1.8.5 Mobilisable vectors: gene disruption and replacement
A special class of integration vectors has been developed and is now very frequently used
for gene disruption and gene replacement experiments in Corynebacterium (Schafer et
al, 1990; Schwarzer and Piihler, 1991). These so-called suicide vectors lack a functional
69

replicon, and can therefore only be maintained when integration occurs via homologous
recombination into the chromosome. To employ these vectors, very efficient DNA
transfer via transconjugation or electroporation is requfred.
Disruption of a chromosomal gene by integration of a vector plasmid with an internal
fragment of a well characterised or sequenced gene is a rapid way to analyse its function.
Three methods provide a means of constructing a mutation in vitro in a cloned gene and
reintroducing this mutation at the correct chromosomal site. These techniques are:
integrative disruption, one-step gene disruption and transplacement.
Integrative disruption (Shortle et al, 1982) generates a deletion in the chromosomal copy
of a cloned gene. In this method, an internal fragment of the target gene is used.
Disruption of a cloned gene is infroduced into the chromosome on an integrating plasmid.
This generates a gene duplication, but neither copy of the gene is intact copy: one copy is
missing the 3' end of the gene and one copy is missing the 5' end.
Like integrative disruption one-step gene disruption (Rothstein, 1983) generates a gene
disruption in one step via transformation, using a fragment of DNA containing a cloned
gene that is disrupted by a selectable genetic marker. Homologous recombination
between free DNA ends, which are highly recombinogenic, and homologous sequences in
the genome result in replacement of the wild-type gene by the disrupted copy. The
disrupted gene can contain either a simple insertion (of the selectable marker) or a
deletion/insertion mutation. Introduction of this disruption into the genome can be
achieved in a single step, resulting in stable, non-reverting mutations.
The third technique, transplacement is more generally applicable: it can be used to
introduce insertion or deletion mutations containing a selectable marker, but it can also be
used to introduce non-selectable mutations, such as conditional lethal mutations in an
essential gene.
Gene disruption and replacement have been described for a wide range of prokaryotes
such as Gram-negative Rhizobia (Simon et al, 1983), Gram-positive B. subtilis (Ferrari
et al, 1983) and Streptomycetes species (Charter and Bruton, 1983). Several systems
70

were developed to force homologous recombination between vector-bom and
chromosomally located gene copies using non-replicative plasmids (Simon et al, 1986),
unstable rephcating vectors (Weber and Losick et al, 1988), plasmids with temperature-
sensitive replicons (Muth et al, 1989), an attachment site deleted phage or plasmid
curing by protoplast formation (Anzai et al, 1988). Insertional mutagenesis by
illegitimate recombination was observed in R. fascians (Desomer and Montagu, 1991)
and in mycobacteria (Kalpana et al, 1991). However, in both cases, the plasmids used
contained host DNA fragments. Marklund et al. (1995) described the experimental
system used to study DNA recombination events in the M. intracellulare. First, an
integrative plasmid was introduced into M. intracellulare 1403. A non-rephcative, non-
integrative plasmid having homology with the integrated plasmid was then introduced
and the resultant recombinants were analysed to distinguish between the events of
homologous and illegitimate recombination. No illegitimate recombination occurred; in
all recombinants, a single crossover between homologous regions of the two plasmids
was noted. During subsequent growth of a recombinant clone, a spontaneous deletion
occurred that resulted in a gene replacement on the chromosome of M. intracellulare
1403. This gene-exchange protocol can be used for knockout mutagenesis, site-specific
gene manipulation, or targeted introduction of a reporter gene such as lux (e.g. see
Barletta et al, 1992, and Boyer et al, 1969).
Recently a special class of integration vectors has been developed for corynebacteria,
where these are called suicide vectors as they lack a functional corynebacterial replicon,
and can therefore only be maintained when integration occurs through homologous
recombination into the chromosome.
During plasmid transfer experiments carried out to evaluate the apphcability of known
transposons in coryneform strains, it was discovered that the E. coli mobilizable
plasmids pSUP 1021, pSUP2021 (Simon et al, 1986), pSUP301 (Simon et al, 1983) and
pKlSmob (Schafer et al, 1994), all of which are based on classical narrow-host range
plasmids and carry the oriT of plasmid RP4, become integrated into the genomes of
different corynebacteria. These plasmids are mobihsed by E. coliSll-l (Fig 1.11),
71

Figure 1.11 Construction of mobilizable sfrains of E. coli S17-1 (a) RP4-2-Tc::Mu is
kanamycin resistant (Km" ) and self-fransmissible (Tra" ) (Simon and Piihler et al, 1983).
h carries the insertion element ISRl within the transposon Tnl^^ deletion resulting in the
ampicillin sensitive (Ap ) phenotype. The Tc resistance is inactivated by insertion of the
bacteriophage Mu genome. The plasmid pS120 is a fusion product between two
functional replicons, ColEl (thick line) and a mini-RP4 (thin line). The mini-RP4 is
devoid of the Km resistance and most of the Tra genes, but it still confer resistance to Ap
and Tc. (b) The two incompatible RP4 derivatives were introduced into a recA cell of E.
coU by fransduction. (c) Co-selection for Km and Tc resistance led to spontaneous
integration of the RP4-2-Tc::Mu into the chromosomes, (d) The plasmid-free mobilizing
strain was isolated in curing experiments.
72

which harbours a derivative of the self-transmissible plasmid RP4 integrated into the
chromosome. The natural resistance of C glutamicum to nalidixic acid and the rehable
loss of the vector, which is unable to rephcate in the new host, facihtates the
identification of the new host, with the foreign DNA integrated into their genome
vwhomologous recombination (Schafer et al, 1994). Special strains with defined
deletion mutations, which lack all vector and antibiotic resistance marker sequences can
be constructed by combining the techniques of gene disruption and replacement. Strains
constructed in this manner are very likely to be considered safe with respect to
envhonmental release or industrial use. Several examples of the application of these
techniques are summarised in Table 1.2 (Jetten and Sinskey, 1995).
Mateos et al. (1996) reported the conjugative transfer of mobilizable derivatives of the E.
coU narrow-host-range plasmids pBR322, pBR325, pACYC177, and pACYC184 from E.
coli to species of Gram-positive genera Corynebacterium and Brevibacterium, resulted in
the integration of the plasmids into the genomes of the recipient bacteria.
Transconjugants appeared at low frequencies and reproducibly, with a delay of two to
three days in recovering transconjugants compared with matings using replicative
vectors. Southern analysis of corynebacterial transconjugants and nucleotide sequences
from insertion sites revealed that integration occurred at different locations and different
parts of the vector were involved in the process. Integration was not dependent on an
indigenous insertion sequence element but resulted from recombination between very
short homologous DNA segments (8 to 12 bp) present in the vector and host DNA.
Classical recA~ mediated recombination and site-specific integration were not possible
because integration had occurred at different sites. Therefore these authors postulated
that integration was mediated by an enzyme that recognises very short homologous
sequences.
Schwarzer and Piihler (1991), developed a system for the genetic manipulation of the
amino acid-producing C. glutamicum. Gene disruption and replacement was achieved
by introducing, via conjugation, E. coli vector plasmids carrying the manipulated C.
glutamicum DNA fragments. Using this system, stable mutants were obtained in which
the chromosomal lysA gene, encoding mew-diaminopimelate decarboxylase, was
73

interrupted by a chloroamphenicol resistance cartridge, or one in which an essential
internal part of the lysA gene was deleted. The deletion mutants retained neither
antibiotic resistance marker nor vector sequences. This sfrategy is generally apphcable to
the consfruction of industrial strains to be used in the fermentation industry.
By using the plasmid pKl?,mobsacB, Schafer et al. (1994) created deletions of the hom-
thrB genes in the chromosome of C. glutamicum. The genes encoding enzymes
homoserine dehydrogenase (hom) and homoserine kinase (thrB) involved in the
biosynthesis of threonine and methionine constitute an operon. A 3-kb fragment
containing the hom-thrB operon was cloned into pKlSmobsacB. A central one Kb Pstl
fragment comprising the C-terminal 236 amino acid of hom and the 113 N-terminal
amino acids of thrB was deleted and the resulting plasmid pAT20 was transferred by
intergeneric conjugation from E. coli S17-1 to C. glutamicum. Since pAT20 is unable to
rephcate in C. glutamicum, transconjugant could only arise after integration of pAT20
into the chromosome by homologous recombination.
Moreover, studies of Schafer et al. (1990) on the transfer of shuttie vectors to various
strains of coryneform bacteria revealed efficient plasmid transfer into several related
species of C. glutamicum. Prehminary experiments showed that gene disruption
experiments with p301 lys-int led to lysine defective mutants in the closely related strains
B flavum DSM 20411 and A. albidus DSM 20128 (Schwarzer and Puhler, 1991).
74

Table: 1.2 Genes disrupted or integrated via transconjugation in C. glutamicum (Jetten
and Sinskey, 1995).
Target gene Disrupted Phenotype or
Integrated
Ref
ask Integrated Increased internal lysine Broer and Kramer, 1983
Disrupted No lysine production Schrumpf ef a/., 1992
Integrated Increased lysine production Jetten et al, 1994a
cspA Disrupted No S-layer formation Payertefa/., 1993
dapE Disrupted Decreased lysine production Wehrman etal, 1983
ddh
dgh
Disrupted Decreased lysine production Schrumpf et al, 1991
Disrupted No apparent effect Labarre er a/., 1993
gltA Disrupted No apparent effect
hom ^-thrC Integrated Increased threonine
production
Reyes era/., 1991
Reinscheid etal, 1994
ilvA Disrupted Isoleucine auxotrophy Boles etal, 1993
lysA
Disrupted No threonine degradation Jetten, Unpublished
Disrupted Lysine auxotrphy Schwarzer and Phueler,
1991
ppc
pyK
Disrupted No apparent effect Gublerera/., 1994a
Disrupted Decreased lysine production Gubler, 1994
75

1.9 AIMS AND OBJECTIVES OF THE THESIS
Because of the great importance of C. glutamicum in fermentation industry and its
potential for apphcation in foreign protein expression, research has been focussed mainly
on strain improvement and development of techniques to overcome the barriers which
affect successful introduction of foreign DNA into these corynebacteria. While
investigating the physical and biochemical barriers to efficient gene transfer in these
organisms, a series of auxofrophic mutants of C. glutamicum strain ATCC 13059 were
isolated which protoplasted more readily than their parent strain and which showed
morphological changes (Best and Britz, 1986) and hypersensitivity to both glycine and
INH. Previously in our laboratory, studies were focussed on the analysis of lipids under
standard growth conditions by these mutants (Jang et al, 1997). A key finding of these
studies was that the proportion of extracellular mycolic acids, and solvent-extractable
mycolates, was higher for the mutants and growth in glycine and INH greatiy increased
the proportion of extracellular mycolates for the mutants and the parent. These results
suggested that these agents exert effects in addition to those previously reported, where
these may be related to the attachment of the mycolates to the ceU surface. This project is
concerned with defining the nature of the mutations which give rise to hypersensitivity to
INH and glycine by studying cell wall composition, and gaining insight into the genetic
and biochemical mechanisms of mycohc acid synthesis in C. glutamicum, noting that
this pathway has not been characterised for this species previously and similar pathways
in other genera are still largely described only in models.
The specific aims of the projects were
1- To determine whether an inhA gene equivalent occurs in C. glutamicum, and
characterise this gene through sequence analysis.
2- To define any genetic changes which may have occurred in INH-hypersensitive
mutants through sequence analysis of the inhA gene in these mutants in comparison with
the sequence determined for the wild-type C. glutamicum.
76

3- To characterise and analyse the sequence of the inhA gene in closely related species of
C. glutamicum such as B. lactofermentum and B. flavum, and to compare of the
sequence with the C. glutamicum gene.
4- To compare the inhA gene sequence of C. glutamicum and related species with those
of Mycobacterium species.
5- To determine the role of the presumptive inhA gene in mycolic acid biosynthesis in C.
glutamicum using insertional inactivation approaches and evaluating the impact on fatty
acid and mycohc acid production, for both ceU-associated and extracellular mycohc
acids.
6- To examine the effect of growth medium containing glycine, INH or glycine plus INH
on the mycolic acid and fatty acid composition of the cell wall and compare this with the
whole cell mycolates of wild-type and mutants of C. glutamicum.
11

Chapter 2
Materials and methods
2.1 IMATERL^LS
2.1.1 Bacterial strains and plasmids
The corynebacteria, mycobacteria and E. coli strains and plasmids used in this study are
shown in Tables 2.1 and 2.2.
2.1.2 Chemicals
The sources of all chemicals and media are listed in Appendix 1 and abbreviations used
for these are listed on page. All reagents, where not specified, were analytical grade and
supphed by BDH (UK) or Sigma (USA). Distilled water was prepared using the Milli-
RO Water Purification System or deionised water using a Milli-Q Ultrapure Water
System. Amino acids and vitamin stock solutions were prepared at 50 mM in sterile
distilled water and sterilised by filtration (0.45 pm, Millipore). Sources of otiier materials
and media are otherwise given in the text describing their use or preparation or in
appendices.
2.1.3 Buffers
All buffers were made up as previously described by Dawson et al. (1986), unless
otherwise stated. The pH of each buffer was checked on an Orion model 410A pH meter
and adjusted with appropriate solutions of salts, acid (10 M HCl) or base (10 M NaOH)
as needed before use. All buffers were prepared in glass with Milh-Q (Millipore) water
and sterilised by autoclaving at 12rC for 20 min unless otherwise stated. Sugar
components in buffers were added from stock solutions of 50% (w/v) sucrose and 20%
(w/v) glucose sterilized by autoclaving at 109°C for 25 min.
78

Table 2.1 Bacterial strains used in this work
Sti-ains
C. glutamicum
AS019 MLB 133 MLB 194 RES467 B. lactofermentum'^
BLl
B. flavum BF4
M. smegmatis mc l55
E. coli sfrains
JM109
DH5a
S17-1
ToplOF
Relevant characteristics^
Spontaneous Rif mutant of ATCC 13059 Mutants of ATCC 13059, ilu", leu", Rif Mutants of ATCC 13059, ileu, leu", Rif cspl gene knock out ser'
met", thr"
recAl supE44 endAl hsdR17 gyrA96 relAl thi A(lac-proAB)r(traD36 proAB^ lacf AMIS)
F endAl hsdR17(r^m^'') supE44 thi-lrecAl gyrAl relAl 80d/acZAM15 A(lacZYAargF)U169 [rec, m" ] [mobilizing donor strain MM2947-ecA with an RP4 derivative integrated into the chromosome] F (kef TnlO (Tet* )) mac A A (mrr-hsdRMS-mcrRC) 4)80/acZAM15 AlacX14 rec Al araD139 A(ara-leu)1691 galU galK rspL (Str* ) endA 1 nupG
Source or Reference
Yoshihama et al, 1985 Best and Britz, 1986 Best and Britz, 1986 Dr. Kahnowski ATCC 21789'
Rogers, University of New South Wales, Australia
Ucohetal, 199 A
Promega, Yanisc-Perron et al, 1985
Bethesda Research Laboratories, Gaithersburg, Md, USA Simons? a/., 1991
Invitrogen
leu" (leucine), ileu' (isoleucine), mef (methionine), ser" (serine), thr" (threonine)
auxotrophy;
Km (Kanamycin), Rif (rifampicin) resistance.
ATCC = American Type Culture CoUection, RockviUe, U. S. A.
B. lactofermentum was renamed as C. lactofermentum by Amador et al, (1999)
based on then 16S rRNA studies but in this thesis the name B. lactofermentum
will continue to be used as originaUy obtained by ATCC culture collection.
79

Table 2.2 List of plasmids used in this study
Plasmid
pBluesCTiptllSK-F/-
PCR®2.1
PECMA
pSUP301
p30HysA-int
pKlSmob
Characteristics^
3.9 kb Amp' cloning vector
3.9 kb TA Km' cloning vector
B. ammoniagenes suicide vector
derived from pECMl by elimination of
a 2.4 kb Sphl fragment. Km', Cm'
Source or Refrence
pACYC177-mob, Km^, Amp^
pSUP301 plasmid containing a 990 bp
Hincll-EcoRV fragment of pTG1225
carrying an internal part of C.
glutamicum lysA gene into Seal site.
3.8 kb E. coli mobilizable vector (mob
of plasmid RP4); pBR325 rephcon; Km'
lacZ
Stratagen
Invitrogen
Shin-Jae Ph.D
student in the
University,of
Melbourne,
Australia
Simon era/., 1994
Schwarzer et al,
1991
Schafer et al, 1994
Resistance to particular antibiotics: Amp' (ampicilhn). Km' (Kanamycin), Cm
(chloroamphenicol)
80

Lysis buffer (Best and Britz, 1986), pH 8.0, was used for plasmid and chromosomal DNA
extractions in corynebacteria and contained 10 mg lysozyme/ml, 10 mM Tris pH 8.0,0.7
M sucrose, 10 mM MgCl2. 6H2O, 10 mM CaCl2, 0.05% KH2PO4, 0.01% bovine serum
albumin (BSA). BSA and lysozyme solutions were prepared freshly before use and
filtered steriUzed (0.25 pm, MiUipore filters).
SMMC buffer (Yoshihama et al, 1985), pH 6.5, was used as diluent for viable cell
counts before and after electroporation and contained 0.7 M sucrose, 50 mM maleic acid,
10 mM MgCl2.6H20 and 10 mM CaCl2.
Veronal buffer was prepared by dissolving 572 mg veronal, 375 mg sodium veronal, 27
mg CaCl2 2H2O and 109 mg MgS04 7H20, in IL distiUed water and pH adjusted to 7.5.
Maleic acid buffer contained 0.1 M maleic acid, 0.15 M NaCl and the pH adjust with
NaOH (solid or 10 M stock solution) to pH 7.5 (20°C) and stored at room temperature.
The following buffers were prepared as described by Sambrook et al. (1989).
Denatured salmon sperm DNA was prepared in sterile H2O at a concentration of 1 mg/ml
denatured at 95°C for 10 nun and chilled on ice prior to use.
20X SSC solution was made by dissolving 175.3 g of sodium chloride and 88.2 g of
sodium citi-ate in one hti-e of H2O. The pH was adjusted to 7.0 with the addition of
NaOH. The stock solution was stored at room temperature.

TAE buffer (50X), pH 7.8, contained 200 mM Tris, 100 mM sodium acetate (NaOAc)
and 10 mM ethylenediamine tetraacetic acid (EDTA). A 50X concentrated stock was
diluted in distiUed water to IX TAE prior to use in agarose gel electrophoresis.
TE buffer, pH 8.0, contained 10 mM Tris and 1 mM EDTA. This was used for dissolving, diluting and storing DNA, particularly for E. coli DNA.
Two types of restriction enzyme buffers were used from lOX stock solutions as follows:
One-Phor-All buffer (Pharmacia) and specific commercial buffers from suppliers of
restriction enzymes. lOX One-Phor-All buffer, pH 7.5, contained 100 mM Tris-acetate,
100 mM magnesium acetate and 100 mM potassium acetate.
Protein gel loading buffer (2X) contained 0.3 g of dithiothreitol (DTT, Sigma), 4.0 ml of
10% sodium dodecyl sulphate (SDS), 1.6 ml of 1.25 M Tris-HCl (pH 6.8), 2.5 ml of 87%
glycerol, 0.5 mg of bromophenol blue and was made up to 20 ml with Milli-Q water.
This was stored at -20°C in 1ml ahquots.
Electrode buffer (lOX) for SDS-polyacryamide gel electrophoresis (SDS-PAGE)
contained 30.3 g of Tris base, 144.2 g of glycine and 10.0 g of SDS and was made up to 1
litre with Milli-Q water. The pH was not adjusted and the solution was stored at room
temperature. The lOX concentrated stock solution was diluted in Milli-Q water to IX
electrode buffer before use in SDS-PAGE.
2.1.4 Instrumentation
An Eppendorf centrifuge was used for samples of volume less than 1.5 ml. For samples
greater than 1.5 ml, a Beckman model J2-HS refrigerated centrifuge was used. For
higher speeds, a Beckman model L-70 ulti-acentrifuge with 70.1 Ti rotor was used. An
Ultraspec model spectrophotometer (LKB) was use to measure absorbance in the range
between 260 and 680 nm. Liquid cultures were grown in orbital shaker incubators
(model 013422, Panton Scientific Pty, Ltd). A Dynavac mini-freeze dryer was used for
lyophilising samples. Other general analytical instrumentation is described in the specific
methods sections.
82

2.2 MICROBIOLOGICAL IMETHODS
2.2.1 Media
Unless specified, all media were sterilised by autoclaving for 15 min at 121°C. Media
additives were stored in brown-coloured bottles at room temperature. Supplements, such
as antibiotics and amino acids, were added asepticaUy from stock solutions to the
medium at 50°C, immediately prior to dispensing the medium.
Luria Broth (LB) (Miller, 1972), pH 7.2, was used for growth of E. coli strains and
contained 10 g of tryptone, 5 g of yeast extract and 5 g of sodium chloride per hire. For
plates, LB was solidified with 15 g/l of agar (LA).
Luria broth with glucose (LBG) was routinely used for corynebacterial growth (Best
and Britz, 1986). LB was supplemented with 0.5% (w/v) glucose from a 20% (w/v) stock
solution. For plates, LBG was solidified with 15 g/l of agar (LAG).
LBG supplemented with glycine (LBG-G) was used for DNA isolation,
electrotransformation, and qualitative analysis of mycohc acid composition from
corynebacteria (Haynes and Britz, 1989). Due to differential sensitivities of strains to
glycine, the final concentrations of glycine in LBG-G varied from experiment to
experiment depending on the strain used but usually the concentration was 2% (w/v). For
the LBG-G (2% glycine), 2X LB was supplemented with 0.5% glucose and glycine from
a sterile stock solution (20% w/v glucose and 20% w/v glycine) and the volume was
adjusted with sterile water to produce IX LB. Glycine stock solution often precipitated
during storage and therefore crystals were redissolved by warming at 65°C prior to use.
LBG supplemented with INH (LBG-I) was used for quahtative analysis of mycolic
acid composition of corynebacteria (Haynes and Britz, 1989). Final concenttations of
INH in the LBG-I varied from experiment to experiment but usually the concentration
was 4% (w/v). For LBG-I (4 mg/ml INH), 2X LB was supplemented with 0.5% glucose
and INH from sterile stock solutions (20% [w/v] glucose and 100 mg/ml INH) and the
volume was adjusted with sterile water to produce IX LB.
83

LBG supplemented with glycine plus INH (LBG-GI) was used for quantitative
analysis of mycolic acid composition of corynebacteria. Corynebacteria were grown in
this medium before electtoporation, conjugation and for DNA isolation. Final
concentrations of glycine and INH in LBG-GI varied from experiment to experiment but
usually the concentration was 2% (w/v) glycine and 4 mg/ml INH and this was prepared
as described above for LBG-G and LBG-I.
M-ADC-TW broth was used routinely for the growth of mycobacteria and contained 4.7
g of Middlebrook 7H9 broth (Difco) base and 2 ml of glycerol dissolved in 900 ml of
deionised water and autoclaved for 20 min. After cooling, 100 ml of albumin-dextrose
complex (ADC) enrichment and 2.5 ml of 20% Tween 80 solution were added. ADC
enrichment was made by dissolving 2 g glucose, 5 g BSA (Sigma), and 0.8 g of NaCl in
100 ml deionised water. This solution was filtered sterilised and stored at 4°C. Tween 80
solution was made by dissolving 20 ml of polyoxyethylene sorbitan monooleate to 80 ml
deionised water, heating at 55°C for 30 min to dissolve completely, sterilising by
Alteration (0.45 pim, MiUipore).
Middlebrook 7H10 agar was used for growth of mycobacteria on plates. This was made
by dissolving 19 g Middlebrook 7Hr0 agar in 900 ml deionised water, autoclaving for 20
min and allowing to cool to 55°C. ADC enrichment (100 ml) was added then
cycloheximide was added to give a concentration of 50 pg/ml (to inhibit mold
contamination) before the media was poured as plates. Plates contained 25-30 ml of
medium.
Nutrient agar (NA) with glucose (NAG) was prepared by supplementing sterile NA
(25g Oxoid Nutiient Broth no. 2 and 15 g agar per titre) with 0.5% (w/v) glucose.
ET medium (Best and Britz, 1986) was used for viable counts of corynebacteria and this
had the following composition (per hire): mixture A in 590 ml solution (yeast exfract, 5g;
tryptone, 5g; K2SO4, 0.25g; gelatin, 5g; agar, 12g); mixture B in 300 ml solution
(succinic acid, 35.7 g, pH adjusted to 7.2 with 5N NaOH before sterihsing); Tris base,
3.94 g (pH adjusted to pH 7.2 witii HCl); glucose 10 g; CaCl2, 1.47 g; MgCl2.6H20, 2.03
84

g; KH2PO4, 50 mg; BSA, 0.1 g (prepared as a 2% solution, filter sterilised); trace
elements solution (which contained per litre: ZnS04.7H20, 8.8 g; FeCl3.6H20, 0.97g;
CUSO4.5H2O, 0.27g; Na2B4O7.10H2O, 88 mg; (NH4)6Mo702. H2O, 37 mg; MnCl2.4H20,
72 mg). To prepare ET medium, sterile mixture A and B were combined with gentie
mixing and supplemented with the following sterile stock solutions in the following
order: 25 ml of Tris (IM); 50 ml of 20% (w/v) glucose; 5 ml of 2% (w/v) BSA; 2.5 ml of
2% (w/v) KH2PO4; 10 ml of IM MgCl2.6H20; 10 ml of IM of CaCl2.2H20; 1 ml of trace
elements.
Minimal medium for corynebacteria (Britz, personal communication) contained the
foUowing composition (per liti-e): (NH4)2S04, 1.5 g; urea, 1.5; KH2PO4, 1.0 g; K2HPO4,
3.0 g; MgS04.7H20, 0.1 g; CaCl2.2H20, 1.0 mg; biotin, 100 pg; thiamine hydrochloride,
100 pg; trace elements solution (as for ET), 1.0 ml, agar 15 g. After sterilisation at 121°C
for 15 min, the basal medium was supplemented with appropriate amino acids (100 mg/1)
before dispensing as plates.
X-Gal medium was prepared in LA containing ampiciUin/lPTG/X-Gal. One hundred pi
of lOOmM IPTG (isopropyl-p-D-thiogalactoside) and 20 pi of 50 mg/ml X-Gal (5-
bromo-4-chloro-3-indolyl-P-galactoside, dissolved in 1 ml of N, N'-dimethyl formamide)
was spread over the surface of LA containing 100 pg/ml ampicillin and allowed to absorb
for 30 min prior to use.
SOB (Sambrook et al, 1989) was used for DNA transformation into E. coli and one titre
of SOB contained 20 g of ti-yptone, 5 g of yeast extract, 0.5 g NaCl, 0.186 g KCl. After
autoclaving, 1 g of MgCb were added from stock solutions.
SOC consisted of SOB supplemented with 20 mM glucose (Sambrook et al, 1989) and
was used as the recovery medium for E. coli cells after transformation.
Recovery medium (Britz, personal communication) was used to recover ttansformants of
C. glutamicum after electroporation and contained LBG supplemented with 10 mM
CaClzand 10 mM MgCl2.6H20.
85

2.2.2 Growth of bacteria
2.2.2.1 Growth of corynebacteria on plates
LAG inocula were prepared on LAG plates, where corynebacteria glycerol stocks stored
at -20°C were transferred onto LAG plates with a sterile loop and then aUowed to grow at
30°C for about 16 h before being used as inocula. NAG was often used for sub-culturing
of corynebacteria instead of LAG. MacCartney botties (25 ml capacity) containing 10 ml
of sterile LBG were inoculated with single colonies from LAG plates. The cultures were
incubated overnight at 200 oscillations per min (o.p.m.) and 30°C and cultures used as
inocula for large-scale cultures, including determination of growth rates by measuring
absorbance at 600 nm.
Larger volume cultures were performed to compare mycolic acid composition in cell wall
fractions for cells grown in Erlenmeyer flasks of two litre capacity containing one litre of
the following media: LBG, LBG containing 2% (w/v) glycine, LBG containing 4 mg/ml
or 8 mg/ml of INH (AS019, MLB 194, MLB 133), or LBG containing 2% glycine plus 0.4
mg/ml or 4 mg/ml (BLl, BF4, RM3, RM4) INH, harvesting cells at early stationary
phase.
2.2.2.2 Growth of mycobacteria
Mycobacteria stored at -80°C in glycerol were transferred onto a thick poured
Middlebrook 7H10 agar plate and wrapped with parafilm both to prevent desiccation of
the media and to reduce possible risks of mold contamination. The plates were then
allowed to grow at 37°C for three to four days before being used. SmaU flasks (250 ml)
containing 25 ml of sterile M-ADC-TW broth were inoculated with single colonies from
Middlebrook 7H9 plates. The cultures were maintained at 37°C at 100 o.p.m for four
days, and 0.1 ml of these cultures were used subsequentiy as inoculum into 100 ml of M-
ADC-TW brotii.
86

2.2.2.3 Growth of K coli
MacCartney bottles containing 10 ml of sterile LB media supplemented when requfred
with appropriate antibiotics (50 pg/ml kanamycin or 100 pg/ml of ampicilhn) were
inoculated with single colonies from LA plates of E. coli. The cultures were maintained
at 37°C overnight and 200 o.p.m. and subsequent cultures were used as inoculum for
larger volume cultures.
2.2.2.4 Growth curves, viable counts and drug sensitivity tests
Growth was monitored by measuring absorbance at 600 nm using an LKB Ultraspec
spectrophotometer; when Aeoo exceeded 0.8, cultures were diluted in the medium used
for growth and Aeoo recorded against medium blanks. Viable counts were performed
using 10-fold dilutions of cultures in SMMC buffer. Dilutions were made using 0.9 ml
volumes of diluent in 1.5 ml capacity capped tubes with 0.1 ml samples transferred using
a 200pl Gilson pipette and sterile tips. After vortexing tubes, samples of 0.1 ml were
taken from tubes and spread onto appropriate plates (usuaUy ET and LAG) using a sterile
glass spreader. Samples were allowed to dry then plates were incubated at appropriate
temperatures for up to seven days. All counts were performed in ttiplicate.
Drug sensitivity tests were performed by incorporating antimicrobial agents into the
plates. The method for corynebacteria involved preparing various concentrations of the
drugs, ranging between 0.1 to 20 mg/ml. Plates were prepared on the day of use and
dried at 37°C. Overnight cultures of coryebacteria were diluted in SMMC buffer or
peptone water. Different dilutions of each sttain were plated onto agar plates containing
drugs with a multiprong replicator. The spots were allowed to dry and plates incubated at
30°C for 24 h. Plates without drugs were inoculated to ensure that viable organisms were
present throughout the experiment. The minimal inhibitory concentration (MIC) was
defined as the lowest concentration of the drug that completely inhibited growth, after 48
h incubation at 30°C.
87

2.2.3 Storage of strains
Freeze-dried sti-ains of corynebacteria and E. coli were obtained from frozen ampoules
and streaked out onto LA (for E. coli sti-ains) or LAG (for corynebacteria). The working
stock cultures were prepared by streaking single colonies of cells onto tiie entire surface
of LA plates (for E. coli) or LAG plates (for corynebacteria). After 16 h incubation,
plates were taken into a lamina flow hood and growth harvested into glycerol storage
broth, using a sterile stainless-steel wire loop. Glycerol storage broths contained 50%
glycerol in LB (for E. coli) or LBG (for corynebacteria), supplemented with antibiotics
(50 pg/ml as final concentration) if sfrains contained plasmid DNA, and were dispensed
in 2-3 ml aliquots into 5ml capacity glass bottles. Sealed botties were stored at -20°C
(for working stocks) and -80°C (for long term storage stocks).
2.3 MOLECULAR BIOLOGY METHODS
2.3.1 Preparation and analysis of DNA
Standard recombinant DNA methods, including restriction digestion, agarose gel
electrophoresis and plasmid purification, were performed using standard apparatus and
methods (Sambrook et al, 1989; Ausubel et al, 1992), unless otherwise stated, and these
are briefly described in the following.
2.3.1.1 Small-scale plasmid DNA isolation
The following is the protocol for rapid isolation of plasmid DNA without colunm
purification for small-scale preparation or for large-scale preparation using CsCl
gradients (Sambrook et al, 1989). E. coli strains (for example, SI7-1 and DH5a
containing pKl%mob-inhA and p301/yM-int) were grown overnight in 250 ml of LB
containing suitable antibiotics (such as 50 pg/ml Km). The cells were harvested at 4,000
r.p.m., 4°C, 10 min, using a JH-2S refrigerated cenfrifuge (Beckman). The pellet was
resuspended in 6 ml of freshly prepared lysis solution (25 mM Tris-HCl, pH 7.5, 10 mM
EDTA, 15% sucrose, 2 mg/ml lysozyme) by pipetting cells up and down thoroughly

using a 10 ml pipette. The resuspended cells were incubated in ice water for 20 min then
12 ml of a solution containing 0.2 M NaOH and 1% SDS was added. After mixing by
inversion and incubating in an ice water bath for 10 min, 7.5 ml of 3 M sodium acetate,
pH 4.6, was added, mixed by inversion and incubated in an ice water for 20 min. The
sample was centi-ifuged at 15,000 r.p.m. for 25 min. The supernatant was collected and
treated with 60 pi of DNase-free RNase (1 mg/ml) for 30 min at 37°C. The samples were
extracted twice with phenohchloroform (1:1), then two volumes of ethanol added to
precipitate the DNA at -20°C overnight. The sample was centrifuged at 10,000 r.p.m. for
10 min at 4°C. The supernatant was removed and the peUet was washed with 70%
ethanol. The DNA was dissolved in sterile Milli-Q water or TE buffer (pH 7.5) and
stored at-20°C.
Alternatively, plasmid purification was achieved using a Plasmid Mini kit (QIAGEN)
according to the manufacturer's insfruction. Briefly, E. coli JM 109 and X-cell blue
transformants, containing inhA gene PCR products or Pstl digested genomic DNA
fragments from corynebacteria hgated in the PCR2.1® vector and pBlueScript II
(Inviti-ogen, Sfratagen), were grown overnight at 37°C in LB (10 ml) containing 100
pg/ml ampicillin. Cultures samples (2 ml) were centrifuged (Eppendorf) for 30 sec and
the ceUs resuspended in the supphed resuspension (200 pi) and lysis (250 pi) solutions,
mixing by gentie inversion and then adding the supphed neuttalisation solution (250 pi)
and mixing by gentie inversion. The white precipitate was collected by centrifugation
(8,000 r.p.m.) for 10 min and the collected supernatant transferred to the supphed Spin
filter then centrifuged for 30 sec. The column was then washed once with the supplied
washing solution and finally with the ethanol wash solution by centtifugation (30 sec and
Imin). Sterile MUh-Q water (100 pi) was added and the plasmid DNA was eluted by
centrifugation for 30 sec. The eluted plasmid DNA was analysed by gel electrophoresis
then aliquoted and stored at -20°C.
Plasmid DNA from corynebacteria was isolated using an alkahne lysis method (Best and
Britz, 1986). This procedure was used with minor modification as described in the next
section. To increase the efficiency of cell lysis, cells were tteated with 10 mg/ml
89

lysozyme in lysis buffer at 37°C for at least three hours. Plasmid DNA was also extracted
from larger volumes of cultures.
2.3.1.2 Large-scale plasmid DNA isolation
Plasmid DNA from corynebacteria was isolated after growth in 400 ml of LBG-G (2%
glycine) with Km (50 pg/ml). The procedure involved preparation of osmotically
sensitive ceUs by growing cells in the presence of glycine and followed by lysozyme
treatment, breaking the cell surface structure using SDS ti-eatment, removing
chromosomal DNA and proteins from plasmid DNA using ultracentrifugation through
CsCl-ethidium bromide gradients. When the Aeoo of cells reached greater than 1.0 (ie.
late exponential growth), ceUs were collected by centrifugation (5,000 X g, 10 min, 4°C)
then resuspended in 50 ml lysis buffer supplemented with lysozyme (10 mg/ml). Cells
were incubated at 37°C for three h before adding 12.5 ml of 0.5M EDTA (pH 8.0) and
incubating for one h. This was followed by the addition of 7 ml of freshly prepared lysis
solution (10% SDS, 1 M NaOH) pre-heated at 55°C. CeUs were heated at 55°C for 10
min in a water bath. If lysis did not occur, then another 7 ml of lysis solution was added
and heated at 55°C. Subsequently, 35 ml of ice-cold acetate solution (200 ml of this
contained 120 ml of 5 M potassium acetate; 23 ml of acetic acid; and 57 ml of dH20)
[Sambrook et al, 1989]) was added. The mixture was chilled at -20°C for 30 min and the
precipitate removed by centrifugation (3,000 X g, 15 min, 4°C). The supernatant fluid
were collected and filtered tiirough cheese clotii. Plasmid DNA was precipitated by
addition of 0.6 volumes of isopropanol and nucleic acids coUected by centrifugation
(14,000 X g, 30 min). The pellet was washed with 70% ethanol, collected by
centrifugation and dried. The DNA was resuspended in 9 ml of water and applied to
CsCl density gradient centtifugation.
2.3.1.3 Preparation of caesium chloride-ethidium bromide (CsCl-EtBr)
gradients
CsCl was finely powdered and nine grams amount added to 15 ml sterile, capped plastic
centrifijge tubes. DNA mixture in water (9 ml) was added with 0.92 ml of ethidium
90

bromide (10 mg/ml stock) and the CsCl dissolved by repeating gentle mversion. The
DNA-CsCl-EtBr mixture was centtifuged (2,000 X g, 15 min, 4°C) and the clear red fluid
decanted into a quick-seal ultracentirifuge tube (16 X 76 mm, Beckman), leaving behind a
buoyant red precipitate. Tubes were filled with hght mineral oil (Sigma), weighed for
balancing, and sealed with a Beckman tube topper. The tubes were centrifuged
(Beckman L-70 ulti-acenttifuge, with a Beckman 70 Ti/70.1 rotor) at 20°C and 60,000
r.p.m. (approximately 250,000 X g) for 16 h and the rotor allowed to stop without
braking. Usually, two bands (the top band corresponding to the chromosomal DNA)
were formed after centrifugation and the plasmid (lower band) was collected under long
wave ( ^ 302 nm) light (LKB 2011 Macrovue Transluminator). Depending on the
amount of residual chromosomal DNA, this was done either by piercing the side of the
tube with a syringe, removing fluorescent material in the plasmid band through a 21
gauge needle, or by gently removing liquid above this band using a Pasteur pipette after
opening the top of the tube using a sterilised blade, then collecting the plasmid band with
a fresh pipette. Ethidium bromide was removed from the DNA solution by several
extractions with equal volumes of isopropanol until the red coloured had disappeared
from the DNA solution. Two volumes of cold ethanol were added to the DNA solution,
mixed, then stored at -20°C for 30 min. The DNA was collected by centrifugation
(14,000 X g, 20 min, 4°C) and washed with 70% ethanol prior to centrifugation. After
removing the ethanol, DNA was resuspended in a minimum volume of distiUed water,
aliquoted, and then stored at -20°C.
2.3.1.4 Isolation of chromosomal DNA
The method used to exttact chromosomal DNA from E. coli was described by Ausubel et
al (1987) and used as follows. Broth cultures (100 ml) of E. coli strains were grown to
saturation at 37°C overnight and harvested by centrifugation (5,000 X g, 4°C, 10 min).
The pellet was resuspended in a mixture containing 9.5 ml of TE buffer, 0.5 ml of 10%
SDS and 50 pi of 20 mg/ml proteinase K and incubated at 37°C for one h. Sodium
chloride (5 M) was added to a final concenttation of 1 M and the mixture was shaken
thoroughly at room temperature before adding 1.5 ml of CTAB/sodium chloride solution
91

(10% ceyl-frimethylammonium bromide/0.7 M NaCl). The sample was incubated for 20
min at 65°C in a water bath. This was followed by a chloroform/isoamyl alcohol (24:1)
exti-action and the aqueous phase transferred to a new tube using a Pasteur pipette.
Isopropanol (0.6 volumes) was added and incubated for 10 min at room temperature. The
nucleic acids were collected by centrifugation (14,000 X g, 20 min, 20°C), resuspended in
9 ml of water and used to prepare CsCl gradients for further separation of chromosomal
DNA.
The method used to extract chromosomal DNA from coryneform bacteria was based on
one described by Britz and Best (1986) and which was based on the earlier method of
Marmur (1961). CeUs from 100 ml LBG-G broth cultures were pelleted (5,000 r.p.m., 10
min, 4°C) after 16 h growth and washed once with 100 ml of lysis buffer (without
lysozyme), then cells collected by centrifugation and resuspended in 5 ml of lysis buffer
containing lysozyme (final concenttation of 10 mg/ml) followed by incubating for 16 h at
37°C using a orbitary shaker incubator (200 o.p.m.). EDTA (10 mM in 10 mM Tris
buffer, pH 8.0) was added and the mixture incubated at 37°C and 200 r.p.m. for one h.
Osmotically sensitive ceUs were collected by centrifugation (1,200 X g, 10 min, 4°C) in a
JA-20 Beckman rotor. Cells were washed with buffer without lysozyme, resuspended in
20 ml of lysis buffer (containing 2 mg/ml of lysozyme in 10 mM-Tris pH 8.0, 0.7%
sucrose, 10 mM CaCh, 10 mM MgCb .6H2O, 0.05% KH2PO4, 0.01% BSA) and
incubated at 37°C for 2-3 h. Cells were lysed by the addition of 8 ml of SDS solution
(1% w/v, in water) followed by heating at 55°C for 10 min. Proteinase K (0.2 mg/ml)
was added and the tube was incubated at 37°C for one h. Sodium perchlorate was added
to a final concenttation of 1 M and the mixture shaken at room temperature in an equal
volume of phenol and exttaction was performed at 30°C with slow shaking (100 r.p.m.).
The emulsion was separated (5,000 X g, 10 min, 20°C) and the upper aqueous layer
transferred into a new tube using a Pasteur pipette. Isopropanol (0.6 volumes) was added
and the mixture was incubated for 10 min at room temperature. The nucleic acids were
collected by centtifugation (14,000 X g, 20 min, 20°C), resuspended in 9 ml of water and
used to prepare CsCl gradients for further separation of chromosomal DNA.
92

2.3.1.5 Isolation of high molecular weight mycobacterial chromosomal DNA
Chromosomal DNA from M. smegmatis mc^l55 was prepared according to the method
of Jacob et al. (1991). Cells were grown in 100 ml M-ADC-Tw broth and coUected after
overnight culttire by centrifugation (5,000 X g for 10 min at 4°C). The resulting pellet
was resuspended in 10 ml of homogenisation buffer (0.3 M Tris, pH 8, O.IM NaCl, 6niM
EDTA). The resuspended cells were transferred to a conical screw-cap vial which was
filled to one quarter to one half with 0.1-0.11mm, acid-wash sterile glass beads (B.
Braun, Germany). The vial was then placed in a MSK ceU homogeniser (B. Braun) and
homogenised for a total of 60 sec with the temperature of the homogenisation medium
maintained at 4°C by a flow of CO2. The homogenised suspension was exttacted twice
with an equal volume of phenol-chloroform (1:1) then once with chloroform-isoamyl
alcohol (24:1). The nucleic acids were precipitated with 1/10 volume of 3M sodium
acetate, pH 5.2, and two volumes of cold ethanol by incubating at -20°C overnight and
collecting DNA by centrifugation (14,000 X g, 20 min, 20°C). The peUet was washed
with 70% ethanol, dried and resuspended in 1 ml of TE (10 mm Tris-lmM ETA) buffer.
RNA was digested by adding RNase A (100 pg/ml from 10 mg/ml boiled stock) and
incubating at 37°C for 30 min. After RNA digestion, the suspension was exttacted twice
with an equal volume of phenol-chloroform then once with an equal volume of
chloroform-isoamyl alcohol as before. Finally, DNA was pelleted with two volumes of
cold ethanol and 1/10 volume of 3 M sodium acetate, dried and resuspended in 1 ml of
TE.
2.3.1.6 Estimation of DNA concentration
DNA concenttations were determined using the spectrophotometric and ethidium
bromide/agarose plate methods as described by Sambrook et al. (1989). Amounts of
synthesised ohgonucleotides were measured using specttophotomettic methods. Isolated
nucleic acid samples and synthesised ohgonucleotides were diluted 1:100 in distilled
water and absorbance readings were taken at wavelengths of 260 nm and 280 nm, and the
93

A260/A280 ratio provided an estimation of the purity of samples. Nucleic acid
concentrations were determined according to the equation: 1 A 260 unit (1cm light path) =
50 pg/ml double sttanded DNA and 33 pg/ml for single-sttanded ohgonucleotides
(Sambrook ef fl/., 1989).
2.3.1.7 Agarose gel electrophoresis
Electrophoresis of DNA was usually performed with horizontal 0.8% (w/w) agarose slab
gels measuring 10.5 X 8 cm (Gel Electtophoresis Apparatus GNA-100, Pharmacia,
Sweden). For good separation of small DNA fragments, different concenttations (1.0%,
1.5%, or 2%) of agarose slab gels were used. Large gels (20 X 20 cm, GNA-200,
Pharmacia, Sweden) were used for endonuclease digested genomic DNA.
Electrophoresis was carried out using IX TAE buffer running normally at 80 volts for 1-2
h or until the loading dye ran near the bottom of the gel, whilst 25 or 35 volts were used
for large gels in IX TAE buffer, running overnight. Ethidium bromide staining solution
was added to the agarose gel before electrophoresis and to the IX TAE tank buffer at a
final concenttation of 0.5 pg/ml. The DNA bands were visualised on transilluminator (X
= 302 nm) (LBK 2011 Macrovue transluminator). EcoRI and Hindlll digested lambda
DNA preparations (Progen) containing eleven fragments (21.1, 5.1, 4.3, 3.5, 2.0, 1.9, 1.6,
1.4, 0.9, 0.8, 0.6 and 0.1 kb) was used as molecular markers for the digested genomic
DNA. Alternatively SppllEcoRl markers (Promega) containing 15 fragments (8.5, 7.3,
6.1, 4.8, 3.5, 2.8, 1.9, 1.8, 1.5, 1.3, 1.1, 0.98, 0.72, 0.48, 0.36) were also used for size
determination. Standards used for PCR products or digested PCR products were a 100 bp
DNA ladder (Promega) containing 11 fragments (1,500, 1,000, 900, 800, 700, 600, 500,
400, 300, 200, and 100 bp) or Probase 50™ (Progen) containing 16 fragments (3,147,
2,647, 900, 800, 700, 600, 500, 450, 400, 350, 300, 250, 200, 150, 100, and 50 bp).
Approximately 0.5-1.0 pg of the size markers was used per gel weU.
The migration distances of hnear fragments of plasmid DNA on agarose gels were related
to their molecular weights from a plot of the logarithm of the relative migration distances
of standards against logarithm of molecular weights, which gave linear curves.
94

2.3.1.8 Photography
Gel photography was performed using a Polarid MP-4 Camera if requfred. Typically,
Type 667 black and white film was used for documentation at a shutter speed of 1/60 to
1/30 sec with an aperture of F16. Type 665 positive/negative film was used at a shutter
speed 1/4 to 1/12 sec and an aperture of F16. If the picture was too hght, the shutter
speed was increased or a higher F number was set or altered inversely when the picture
was too dark (Ausubel et al, 1992). The MICs plates were photographed with a top
lighting black paper on white light box with a shutter speed of 1/30 sec and an aperture of
F22..
2.3.1.9 Restriction enzyme digestion of chromosomal DNA
Chromosomal DNA from corynebacteria and mycobacteria strains was digested with
various resttiction endonucleases. Endonucleases (ENase) EcoPl, EcoRV, Kpnl, Pstl,
BamHl, Hindlll, and Sail were purchased from Promega. Incubation mixtures for
digestion (30 pi) contained 2pg of DNA, 3pi of the lOX buffer recommended by the
manufacturer and 5-15 units of ENase to cleave the DNA for one h at 37°C. For each gel
well, 15 pi (out of 36 pi) of mixture was loaded and the remainder stored at -20°C.
Phage lambda DNA (0.35pg/pl) and Sppl/EcoPJ (0.25pg/pl) (Promega) were used as the
molecular weight standard and 2pl was loaded on each gel.
2.3.1.10 Recovery of DNA fragments from agarose gels
DNA fragments were recovered from agarose gels (0.6%) and used for different
purposes, depending upon the need. After electtophoresis, gels were photographed and
DNA bands corresponding to the desired size was excised from the gel and isolated using
a Gene clean kit (Bio 101 Inc) as recommended by the manufacturer.
2.3.1.11 Synthesis and preparation of the oligonucleotides
In the beginning of tiiis research ohgonucleotides were synthesised by Ms. U.
Manueplillai (PhD student, CBFT, VUT) witii an Applied Biosystem Model 391 DNA
95

synthesiser (Perkin-Elmer) but later on purchased from Pacific Oligos Pty. Ltd. For the
synthesis of oligonucleotides chemicals and columns were obtained from Perkin-Elmer
and the primers were processed as recommended by the suppher. After synthesis,
cleavage from the column, deprotection, dehydration and precipitation of the
oligonucleotides were carried out as described in the instruction manual provided by the
supplier (Applied Biosystem).
For the cleavage of oligonucleotides from synthesis columns, 5-7 ml of concenttated
ammonia solution (30-35%) was dispensed into a clean glass bottle (MacCartney). The
tubes were capped tightly. The tip of a sterile 1ml syringe was inserted into one end of
the column. The syringe was fitted snugly with a plunger at the needle end and 0.75 ml
concenttated ammonia was drawn into another 1 ml syringe. Any air bubbles at the tip
were removed. The second syringe was inserted into the other end of the column. The
syringe-column-syringe unit was held horizontally. The plunger of the syringe
containing ammonia was pushed gently and the ammonia was allowed to pass thorough
the column into the opposite syringe. Pushing the ammonia back and forth between the
syringes was repeated 4-5 times. The syringe-column-syringe unit was laid down on a
flat surface and incubated for 15 min at room temperature, making sure that there was
ammonia solution inside the column. The ammonia solution was drawn into one of the
syringes, which was then removed from the column. The ammonia was expeUed into a
pre-cleaned 4 ml vial, and the vial was tapped tightiy with a teflon-lined screw cap.
These vials were then placed at 55°C overnight for deprotection of the oligonucleotides.
The deprotected oligonucleotide was incubated in a waterbath at 40°C for 16 h, with the
vial capped loosely so that tiie ammonia evaporated, then frozen at -70°C before
dehydration. The frozen oligonucleotides were dehydrated overnight under vacuum in a
freeze drier.
The freeze-dried oligonucleotides were dissolved in 600pl of water and 100 pi of 3M
sodium acetate (pH 5.2); these volumes were calculated on the basis tiiat expected optical
density of ohgonucleotides would be 20 and 30pl of water plus 5 pi of 3 M sodium
96

acetate were added per one unit of optical density according to the supplier's instructions.
Two ml of ethanol was added to the ohgonucleotide solutions then vortexed briefly. The
mixttire was stored at -20°C for 30 min, then centrifuged at 14,000 rpm in a
microcenttifuge for 5 min at 4°C. The supernatant was removed and the peUet was
washed using 70% ethanol. Finally, the oligonucleotide pellet was dried under vacuum
and dissolved in 300 pi of distilled water. The ohgonucleotide concenttation was
determined according to the formula: 1 A260 unit = 32 pg DNA/ml (Sambrook et al,
1989).
2.3.1.12 Polymerase Chain Reaction (PCR) amplification
The PCR amplification of the presumptive inhA genes were carried out using the
QIAGEN PCR kit and AmliTaq DNA polymerase (Perkin-Elmer) and used according the
supplier's instructions. A typical PCR mixture contained PCR buffer (IX), Soln Q,
deoxynucleoside ttiphophosphate (final concentration 200 pM of each dNTP), PCR
primers (final concenttation 0.5 pM of each), 2 mM MgCl2, 100 ng of DNA, 2.5 units of
enzyme, with water added to a final volume of 100 pi. All reactions included negative
(sterile distilled water) confrols. Amplification was performed on the DNA Thermal
Cycler-480 (Perkin-Elmer) or Peltcer Thermal Cycler (PTC-200) (Bresatec) using the
protocol described by the manufacturer. For genomic DNA and plasmid DNA, PCR
temperature profiles were varied and this is described in detail in Table 4.2.
The PCR amplification of the 16S rDNA was performed according to the Expand^^ Long
Template PCR system (Boehringer Mannheim) protocol. The PCR mixtures (50 pi)
contained 20 pmol of each appropriate primer, and approximately 500 ng of genomic
DNA. Briefly, two mixtures (25 pi of master mix I [1.75 pi each of 10 mM dNTP,
downstteam and upstteam primer and template DNA] and 25 pi of master mix II [5 pi of
10 times PCR buffer with system II and 0.75 pi of amphfy enzymes]) were prepared and
mix shortly before cycling. The cycle profile was as follows: after initial denaturation at
95 C for 2 min, samples were chilled on ice briefly and enzyme was added then cycling
97

were perfoprmed at 95°C 1 min; 54°C 1 min; 72°C 2 min for 35 rounds followed by a
extension at 72°C for 5 min. Following PCR, 5 pi of the amplified products was
electrophoresed in 1% agarose gels containing ethidium bromide (0.5 mg/ml) with IX
TAE buffer and viewed on a fransilluminator.
2.3.1.13 Purification of PCR Products
The PCR products of expected sizes were purified using two methods, depending on
wether the PCR products were in solution or prepared following separation on agarose
gels.
Wizard^^ Minicolumns (Promega)
PCR products were purified using the Wizard^'^ PCR Preps DNA Purification System
(Promega) following the manufacturer's insttuctions. For each complete PCR reaction,
the entire contents (approximately 95 pi) were added to a 1.5 ml microcenttifuge tube
containing 100 pi of Direct Purification buffer, and then vortexed briefly to mix.
Subsequently, 1 ml of PCR Preps DNA Purification Resin was added and the samples
were then vortexed briefly three times over a one minute period. One Wizard^^
Minicolumn was prepared for each PCR reaction. The 3-ml disposable syringe barrel
was attached to the Luer-Lock R extension of each minicolumn while the syringe plunger
was set aside. The DNA/resin mixtures were put into the syringe barrel and then the
syringe plunger was inserted slowly and gentiy to push the DNA slurry into the
minicolumn. Subsequentiy, the column was washed with 2 ml of 80% isopropanol. The
column was centtifuged for 20 sec at 12,000 X g to dry the resin. To remove DNA, 50 pi
of sterile distilled water was added to the column, which was left for two min. The
column was centtifuged for 20 sec at 12,000 X g to elute the bound DNA fragments, and
the purified DNA solution was stored at -20 °C.
BANDPURE ™ DNA Purification kit (Progen)
Alternatively, PCR products were firstly separated on agarose gels and the bands excised
under UV light. At least 2.5 volumes of the Nal binding buffer was added to the DNA
98

shce and melted at 55°C for 5 min. The BANDPURE sihca mattix suspension was
vortexed until it was resuspended thoroughly and then 5 pi of it was added to the DNA
solution. For amounts of DNA greater then 5 pg, an additional 1 pi of sihca mattix
suspension was added for each 1 pg of DNA. The melted gel-silica matrix suspension
was incubated at room temperature for 5 min with frequent gentle mixing, then
centrifuged for about 30 sec to pellet the sihca mattix with DNA bound to it. The
supernatant was discarded. The pellet was washed by adding 500 pi of ice-cold ethanol
wash solution to the pellet. The pellet was resuspended and centtifuged for about 30 sec
to pellet the matrix, and the ethanol wash solution was discarded. This step was repeated
three times, retaining the pellet each time. The DNA was eluted from the pellet by
adding 30-50 pi of water, incubating at 55°C for 5 min, then centtifuging for 30 sec to
collect the supernatant containing the DNA. The approximate DNA concenttation was
determined on agarose gels, using the intensity of one band of the 50 base or 100 base
PCR markers for comparison, according to instructions of the supplier (Promega). The
PCR products purified by either method were cloned into vectors, used dhectly for
sequencing or were used to prepare probes for Southern hybridisation.
2.3.1.14 16S ribosomal RNA (rRNA) gene analysis
In order to check the purity of DNA samples 16S rRNA sequence analysis was
performed. Approximately, 1300 bp of a consensus (16S RNA) sequence was amphfied
from DNA templates of six corynebacterial sttains using two primers 63f (5'CAG,
GCCTAA, CAC, ATG, CAA, GTC 3') (Marches! et al, 1998) forward primer, and
1387r reverse primer (5' GGG, CGG,TGT, GTA, CAA, GGC) (Pharmacia; Marchesi et
al, 1998). The primers were purchased from Pacific Ohgos.
Expand long template PCR system (Boehringer Mannheim) was used for PCR
amplification. In each reaction 500ng of genomic DNA was used as the template. The
PCR products were sequenced directly using the same PCR primers, 63f and 1387r.
99

2.3.2 Southern hybridisation
Genomic DNA was digested with restriction enzyme and run on an agarose gel in
preparation of Southern blotting. Gels were placed in denaturing solution for 45 min at
room temperature with gentie agitation. Gels were ttansferred to neuttalising solution
and agitated for 20 min. Excess solution was removed by blotting the gels on filter paper.
The gels were ttansferred to perspex boards (DNA side up) and precut nitrocellulose
membranes (Hybond, Amersham) were placed on top. Air bubbles were removed by
rolling the membrane with a 10 ml pipette. Three layers of filter paper (Whatman 3 mm
Chromatographic paper) were applied to the membranes plus approximately 4 cm
absorbent paper towelling. A second perspex board was apphed on top of the paper
towel and IKg weight placed on top. Gels were blotted overnight. After blotting the
membranes were washed in 2XSSC for 5 min, blotted on filter paper to remove excess
solution and wrapped in glad wrap. Membranes were exposed to UV hght (LKB 2011
Macrovue transUuminator, Bromma) for five min to fix the DNA to the membrane then
stored at room temperature.
2.3.2.1 Use of DIG-labelled probes
Prehybridisation and hybridisation of membrane-bound nucleic acid to DIG-labelled
^DNA was performed according to the manufacturer's insttuctions (Boehringer
Mannheim). Membranes were prehybridised in a sealed bag which contained 20 ml of
hybridisation buffer (5X SSC and blocking reagents; 0.01 % w/v, N-laurosarcosine;
0.02%, w/v, SDS) at 68°C for three h.
In order to prepare the probe, 190-210 ng of template DNA was added to sterile water
(Milli-Q) to a final volume of 40 pi in a 1.5 ml Eppendorf tube. The DNA was denatured
by heating in a boiling water bath for 10 min and chilled quickly on ice. DIG-High
Prime (4pl, Boehringer Mannheim) was added into aqueous DNA then mixed by
centtifuging (Eppendorf) briefly. The probe was incubated overnight at 37°C. The
reaction was stopped by adding 5 pi of 0.2 M EDTA (pH 8.0) and stored at -20°C until
used.
100

The membrane was then transferred to a fresh bag containing the same buffer plus 5 pi of
DIG-labelled X DNA or SPPllEcoRl DNA markers and 20 pi of specific probe in the
same buffer. The probes had been denatured in boihng water for 10 min, chilled on ice,
diluted in hybridisation solution and filtered through a 0.45 pm filter (Millipore, GS)
after pre-warming at 40°C before adding to the membrane. After hybridisation at 68°C
overnight, blots were washed at room temperature twice each for 15 min with 100 ml of
2X SSC plus 0.1% SDS, followed by one wash in O.IX SSC plus 0.1% SDS at 68°C.
2.3.2.2 Detection of hybridisation signal
Bound probes were detected by enzyme-linked immuno-assay using an antibody
conjugate (antidioxigenin-alkahne phosphatase conjugate) and visuahsed with the
chemiluminence substtate CSPD^'^ supphed by the kit manufacturer (Boehringer
Mannheim). Enzymatic dephosphorylation of CSPD^^ by alkaline phosphatase leads to
light emission at a maximum wavelength of 477 nm which is recorded on X-ray films.
This procedure was described by the manufacturer and used without modification.
Membranes were washed briefly (1 to 5 min) in washing buffer (maleic acid buffer plus
0.3% [v/v] Tween 20) and incubated for 30 min with 100 ml of blocking solution (lOx
supphed blocking solution diluted in maleic acid buffer 1:10). The membrane was then
incubated for 30 min with anti-DIG-AP conjugate (diluted to 75 mU/ml [1:10,000] in
blocking solution). The membrane was washed twice for 15 min each in 100 ml washing
buffer. The membrane was equihbrated for 2 min in 20 ml detection buffer (100 mM
Tris HCl, 100 mM NaCl, 50 mM MgCl2; pH 9.5). The membrane was placed into a
hybridisation bag and about 20 drops (1 ml) of the supphed CSPD™ was added.
Following this, membranes were placed on a development folder and incubated at 37°C
for 15 min. Finally membranes were exposed to X-ray films (Amersham, Hyerplus) for
15-25 min at room temperature.
101

2.3.2.3 Radioiabelling of the DNA probes
Hybridization buffer was prepared as follows: Denhardt's (5X) solution contained 2%
Ficoll (type 400, Pharmacia), 2% polyvinylpryrrohdone (PVP), 2% BSA (FractionV,
Sigma), and was sterilised by filtration (0.22 pm, Millipore, GS) then stored at -20°C.
Prehybridisation solution (9.0 ml) was prepared by mixing 4 ml of 6X SSC, 4 ml of 5X
Denhardt's solution, 0.5 ml of 10% SDS (mixed together and preheated at 55°C for 10
min before use), and 0.5 ml of denatured salmon sperm DNA (denatured at 95°C for 10
min using a water-bath, and placed on ice immediately). This solution (10-20 ml) was
placed into a scalable plastic blender bag containing the membrane. The hybridisation
bag was sealed and placed on a glass ttay or into a suitable container and prehybridised at
65°C for up to 8 h.
Probes were labelled randomly with a-P^^ dCTP (sp. act. > 3000 ci/nmole, Brestec) using
a High Prime Labelling Kit (Boehringer Mannheim). Reaction mixtures of 25 pi
contained 25 ng of denatured probe DNA mixed with 6 pi of high prime labelling mix, 2
pi of a-P^^ dCTP and 7 pi of sterile distilled water. The mixture was incubated at 37 °C
for 15 min. The reaction was terminated by the addition of 2 pi of 0.25 mM EDTA. A
G-50 Sephadex column was prepared to remove the unincorporated P ' nucleotide. The
column was washed with 100 pi of cold STE buffer and then 100 pi of TE. Prior to
passing the probe through the column, 50 pi of TE buffer and 2 pi of tRNA (Gibco, BRL)
(5 pg/ml) was added to the probe, then this loaded onto the column. The probe was
collected by centtifuging for 30 sec and 100 pi of TE buffer was added before it was
denatured at 95°C (10 min). After denaturation, tiie probe was mixed with 200 pi of TE
buffer and placed on ice immediately. The probe was then added to the membrane, then
this was allowed to hybridise for 24 h at 65°C. The membranes were washed twice in 2X
SSC plus 0.1% SDS at room temperattire for 10 nun and once in 0.2X SSC plus 0.1 SDS
at 65°C for 5 min with gentie agitation. The probe emitted radioactivity of 5-10 cps when
measured by a Geiger Muller radiation monitor. The membrane was exposed to X-ray
film (Kodak XAR-5) in a Kodak intensify cassette for 48 h at -80°C.
102

2.3.2.4 Development of the X-ray films
Films were developed manually as follows: 5 min in developer solution (phenol-X-ray
developer supplied), 1 min in the 3% acetic acid, 5 min in the fixer solution (Agfa,
Gevaert-X ray fixing bath). Finally, the films were washed in running tap water for 15
min and dried by hanging at room temperature. The probes were washed off from
membranes following the Amersham protocol for use with DNA blots only. Membranes
were incubated at 45°C in 0.4 M NaOH for 30 min and then transferred into O.IX SSC,
0.1% w/v SDS, 0.2 M Tris HCl pH 7.5 then incubated for another 15 min. The
membranes were ah dried on Whatman filter paper, sealed in a plastic bag and stored in a
cool, dry place at room temperature.
2.3.3 Construction of subgenomic libraries
2.3.3.1 Preparation of the insert
Chromosomal DNA from sttains of C. glutamicum and related species was subjected to
Pstl restriction digestion, where the 30 pi reaction mixture contained 2 pg of DNA, 3pl
of restriction buffer and 10 units of enzyme, with the reaction carried out at 37°C for 3 h.
After incubation, 4 pi of reaction mixture was loaded on the gel and run for 1 h to check
the extent of digestion and the reaction was then terminated by heating at 65°C for 10
min. The DNA was exttacted with an equal volume of phenol-chloroform (24:1),
precipitated with two volumes of cold ethanol and 1/10 volume of 3M sodium acetate,
Uien washed with 70% ethanol. The pellet was dissolved in 10 pi of sterile distilled
water, 1 pi of the sample was run on an agarose gel to determine the concentration. The
DNA was stored at -20°C until used.
103

2.3.3.2 Preparation of the vector
Plasmid pBluescript II SK-i-/- was completely digested with Pstl restriction endonuclease
at the multi-cloning site. The reaction mixture contained 5 pg of DNA, 5 pi of lOX
buffer, 25 units of enzyme and 40 pi of deionised water. The mixture was incubated at
37°C for 3 h. The digested DNA was treated with calf intestinal alkahne phosphatase
(ClAP) as described by the supplier (Promega) to remove 5' phosphate groups and thus
prevent rechcularization of the vector during ligation. After CIAP tteatment, the DNA
was purified with phenol-chloroform and precipitated by addition of 1/10 volume of 3M
sodium acetate and two volumes of ethanol as above. The pellet was washed with 70%
ethanol and resuspended in 10 pi of nuclease-free water.
2.3.3 3 Ligation of vector and insert DNA
To obtained the optimal ratio of the vector to insert DNA, molar ratios of 1:1 or 3:1 insert
to vector were ttied. Ligation mixtures contained 100 or 300 ng of insert DNA, 100 ng of
vector DNA, 1 pi of T4 DNA ligase (4 Weiss units), 1 pi of lOX hgase buffer and
deionised water to a total volume of 10 pi. The reaction was carried out at 15°C
overnight. At the completion of the reaction, tubes were kept at -20°C until used.
2.3.3.4 Preparation of E. coli cells for transformation
E. coli sttains XLl-blue and JM109 (Promega) were used for preparation of competent
cells by the CaCh treatment method, as described by Sambrook et al (1989). Bacterial
cells were stteaked on M-9 plates containing 5mg/ml of thiamine-HCl and incubated at
37°C overnight. A single colony was picked to inoculate 10 ml of SOB broth (starter
culture). SOB broth (100 ml) was inoculated with an overnight starter culttire to give a
starting Aeoo of 0.1 and incubated at 37°C, 200 o.p.m. for 2-3 h until growtii reached an
Aeoo of 0.4. Cells were tiien harvested by centtifugation (2, 000 x g, 4°C, 10 min) and
resuspended witii 10 ml of ice-cold 0.1 M CaCh; aU subsequent steps were performed
with sterile solutions held on ice and centtifugation were performed at 4°C. After 10 min
104

on ice, ceUs were pelleted and resuspended in 2 ml of ice-cold 0.1 M CaCb. Using a
chilled, sterile pipette tip, 200 pi of each suspension of competent ceUs were ttansferred
into Eppendorf tubes, frozen on dry ice and stored at -70°C.
Alternatively, for electroporation a single colony was used to inoculate 25 ml of LB
medium and the culture was incubated at 30°C overitight with vigorous shaking. Using a
2.8 htte flask, 500 ml of LB medium was inoculated with 5 ml of cells from the overnight
culttire and shaken at 150-200 o.p.m. at 30°C until the Aeoo reached 0.45-0.55. The ceUs
were chilled in ice water for 2 h and centtifuged at 2,500 X g for 15-20 min at 4°C. The
cells were washed twice with 15% glycerol (W/V) at 4°C. Finally, the cells were pooled
then 80% glycerol was added dropwise with gentle swirling to a final concenttation of
15% (v/v) and the suspension aliquoted in 0.2-1 ml quantities, frozen on dry ice and
stored at -70°C.
2.3.3.5 Transformation of competent E. coli cells
The ttansformation of competent cells of E. coli XLl-blue and JM109 were carried out
as per the protocols provided with their respective kits. The competent cells stored at -70
°C were thawed on ice and an appropriate volume of ligation mixture was added to the
tubes and these were left on ice for 30 min. The cells were then heat shocked for 90 sec
at 42°C, then allowed to recover for five min on ice before the addition of 800 pi SOC
medium. After incubating at 37°C for 45 min, 100 pi of the ttansformation mixture was
plated onto LBG X-gal plates containing 100 pg/ml of ampicillin and plates incubated at
37°C overnight. Alternatively, 2 pi of 0.5 M P-mercaptoethanol was also added to the
competent cells prior to mixing with cloned DNA to enhance the ttansformation
efficiency (Invittogen).
2.3.3.6 Identification of positive clones
Both pBluescript (pBSK+/-) and PCR 2.1 vectors contained the lacZ gene, which
provides a-complementation of the P-galactosidase subunit encoded by the plasmid, with
105

that encoded by the appropriate host cells. This allows colour selection of the
recombinant phagemids (colourless colonies) and non-recombinant phagemids (blue
colonies) on plates containing X-gal and IPTG. The white colonies were identified as
'positive' for the successful insertion of PCR products. The efficiency of transformation
was calculated as the number of white colonies per pg DNA used. A number of
independentiy transformed colonies were picked and grown in small-scale culture
containing 100 pg/ml ampicillin at 37°C overnight with vigorous shaking. Plasmids were
isolated from each one of them using the QUAGEN miniprep protocol according to the
manufacturer's instructions.
2.3.3.7 Screening of the Genomic library for the inhA gene
The positive clones were identified by three approaches.
Plasmids isolated from transformed colonies were analysed by digestion with restriction
enzymes with cutting sites on either side of the insert then the size was determined by gel
electtophoresis as described in section 2.3.1.7. The plasmids showing appropriate size
inserts were further analysed by Southern hybridisation and by PCR.
The selected plasmids were digested with appropriate enzymes, DNA was transferred to
the nylon membrane and hybridised with PCR-amplified inhA product from M.
smegmatis or C. glutamicum. The clones containing inserts that showed hybridisation
signal with inhA probe were further analysed by PCR.
Several sets of primers were designed based on the reported inhA gene sequence of M.
smegmatis (Banerjee et al, 1994) and the conditions used are described in Table 4.2.
Clones generating PCR products of the size expected were chosen for sequence analysis
as described in section 2.3.4.
106

2.3.4 Determination of DNA sequences
2.3.4.1 Primers for sequencing reaction
Both purified PCR products and plasmid DNA were used in sequencing reactions. In
addition to the primers used for amplification of the inhA gene, T7, T3 and Ml 3 universal
primers were also used in sequencing reactions. To sequence the whole clones
containing the Pstl fragments of genomic DNA from C. glutamicum strains, the
sequencing strategy started with T7 and T3 primers, then as the sequencing data
accumulated, additional internal primers were designed based on this data, to conffrm the
sequences and obtain overlaps, to allow the reconstruction of the contiguous sequences.
The primers used are described in the appropriate results sections.
2.3.4.2 Ligation and transformation of PCR products for sequencing
PCR products were cloned for sequencing purposes using the TA cloning kit from
Invittogen following the manufacturer's instructions. Fresh PCR products were
WIZARD purified and the amount of PCR product needed to ligate with 50 ng (20 f
moles) of PCR was calculated using the formula below
x ng of PCR product = (v bp PCR product)(50 ng PCR 2.1 vector)
(size in bp of the PCR 2.1 vector=3900)
Where x ng is the amount of PCR product of y base pairs to be ligated for a 1:1 (vector:
insert) molar ratio using the concenttation previously determined for the PCR products.
The hgation reaction was as follows: x pi of PCR product, 1 pi of lOX hgation buffer, 2
pi PCR 2.1 vector (25 ng/pl), 1 pi of T4 DNA hgase (4.0 Weiss units) and sterile water to
a total volume of 10 pi. Ligation was performed at 16°C overnight and, after completion,
the reaction mixture was stored at -20°C until used. Transformation was done using
ToplOF' competent cells according to the manufacturer's insttuction. Transformants
were selected as described previously, plasmid DNA isolated and inserts were sequenced
using T7 and T3 primers.
107

Table 2.3 Composition of sequencing reactions
Composition
DNA sample
Primer
Premixed reagents*
Total Volume
Standard FS Kit
30-90 ng PCR products
or
300-500 ng plasmid DNA
1 pi (3-5 pmol)
8 pi
20pl
BigDye Kit
30-90 ng PCR products
or
300-500 ng plasmid DNA
1 pi (3-5 pmol)
6 pi
16 pi
*Premixed reagents were provided by Perkin-Elmer
108

2.3.4.3 Sequencing reaction
Two kits (Perkin Elmer) were used to carry out DNA sequencing reactions: the ABI
PRISM ™ Dye Terminator Cycle Sequencing Ready Reaction Kit (Standard FS) and
ABI Prism BigDye Terminator Cycle Sequencing Ready Reaction Kit. The composition
of reaction mixes is given in Table 2.3. The cycle sequencing reaction was performed in
20 pi reaction volumes for 25 cycles, each cycle consisting of step 1 (96°C for 30 sec),
step 2 (50°C for 15 sec) and step 3 (60°C for 4 min), on the DNA Thermal cycler-480
(Perkin-Elmer) and Peltcer Thermal Cycler (PTC-200) (Bresatec). The extension
products were then purified using ethanol precipitation. A 1.5-ml microcenttifuge tube
containing 2.0 pi of 3 M sodium acetate, pH 4.6 and 50 pi of 95% ethanol, was prepared
for each reaction. The entire 20 pi contents of the reaction was transferred into a
microcenttifuge tube containing the ethanol solution. The tube was then vortexed and
placed on ice for 10 min before being centtifuged at maximum speed (14,000 X g) for 30
min. The ethanol solution was carefully aspirated using a micropipettor. The pellet was
rinsed by adding 250 pi of 70% ethanol and centrifuged at maximum speed for 10 min.
The ethanol solution was carefully removed and the pellet was dried in a vacuum
centtifuge. The DNA sequences were determined using an ABI 373-Automated DNA
sequencer (Perkin-Elmer) at the Department of Microbiology, Monash University,
Melbourne.
2.3.4.4 Analysis of InhA gene sequences and deduced proteins
Sequence editing, assembly, ttanslation and ahgnment were carried out using the
Austtalian National Genomic Information Service (ANGIS) on the WebANGIS interface
(Greta 1997), as described briefly below.
Editing and analysis of DNA sequences
The Ereverted programme was used to reverse the sequence data determined by the
reverse primers into the forward dhection for further analysis. The Ecomposition
109

program was used to analyse A, T, G, and C composition of the DNA sequnces. InhA
gene sequences were compared with all currently accessible nucleotide sequences from
the SWISS-PROT, PIR, and GenBank databases that are combined in the non-redundant
sequence database at the National Centte for Biotechnology (NCBI) using the program
BLASTN.
Comparison of two or more sequences
The Bestfit program was used to determine the extent of identity between two DNA
sequences and the extent of identity or similarity in amino acid sequences of any two
proteins. The conventional conditions set for this comparison were used for gap weight
5.00, length weight 0.30, average match 1.00 and mismatch -0.90. Any two sequences
were compared by the Prettybox program to exhibit the locations of the altered
nucleotides or amino acids.
Simultaneous ahgnment of DNA sequences of more than two genes or amino acid
sequences of more than two proteins were performed by the Pileup program of ANGIS.
The conventional conditions were gap weight 3.00 and length weight 0.10. The multiple
sequence ahgnments were also analysed further with the Readseq and Prettybox
programs to identify the location of variable sequences. DNA sequences of the inhA
genes from several C. glutamicum sttains and related species (M. smegmatis etc.) were
analysed by the Mapping program to search for the sites of 6-base cutter resttiction
enzymes within these genes. The maps for any unique restriction enzyme sites present in
these genes were also developed. The inhA genes were ttanslated into putative amino
acid sequences of then respective proteins using the Etranslation program. The BLASTP
program was used to screen the amino-acid sequence database, and the BLASTX
program was used to screen the conceptual ttanslation of the nucleotide sequence
database in six reading frames (Altschul et al, 1990, 1994).
The putative amino acid sequences of the InhA proteins were analysed by the Pepstats
program for the physical properties including molecular weight, isoelecfric point and
composition of amino acids.
110

2.3.5. Introduction of plasmid DNA into corynebacteria strains
2.3.5.1 Electroporation
Transformation by electroporation was based on the method developed by Haynes and
Britz (1990), and this was carried out using the Gene-Pulser system (Bio-Rad
Laboratories, Richmond, CA). The system was composed of the Gene Pulser apparatus,
pulse conttoUer unit and Gene-Pulser cuvettes of 0.2 cm electtode gap.
To prepare the ceUs, a single colony was cultured in 10 ml LBG. Next morning, 5 ml of
the culture was diluted into 100 ml of LBG-GI (2% glycine, plus 4 mg/ml INH for
AS019, MLB 133, MLB 194 and 2% glycine plus 0.4 mg/ml INH for BLl, RM3 and
RM4). Cells (100 ml) were harvested by centrifugation (2,000 X g, for 10 min, 4°C)
(Beckman J2-HS centrifuge with rotor JA-20) at Aeoo between 0.35 and 0.45, the pellet
was washed twice with 100 ml of 15% (w/v) of glycerol at 4°C, cells evenly dispensed
before use, and then finaUy resuspended in 2 ml of cold 15% (v/v) glycerol.
The following procedure was performed in a lamina flow to ensure aseptic conditions.
Forty pi samples of suspension (approximately 10 cells) were mixed with 2 to 5 pg of
plasmid DNA of pK18mob-m/zA, p301/yj'A-int and PCR2.l-cspI. The total volume was
adjusted to 72 pi with distiUed water and 100% v/v glycerol was added to a final
concenttation of 15% glycerol. Subsequentiy the contents of the tubes were mixed
thoroughly, stored on ice for 5 min and then ttansferred by pipetting into a pre-cooled 0.2
cm cuvette. The cuvette was then placed in a pre-cooled pulse chamber, and the cells
were exposed to a single pulse (2.5KV, 25pF). The output of the pulse generator was
directed through a Pulse ConttoUer unit containing two ohm resistors in series and two
100 ohm resistors in parallel circuit with the sample. Time constants were recorded for
each experiment and these were normally 4.0-4.9 msec. If arching occurred during the
pulse, tiie samples were discarded. Following the pulse, the cells were immediately
removed from the electtodes and stored on ice for 5 min. Subsequently, the cells were
HI

transferred by pipetting into an Eppendorf tube and mixed with 1 ml of recovery medium.
The cells were incubated, without shaking for one h at 30°C. At the end of this recovery
period, 10-fold serial dilutions were made in SMMC and appropriate dilutions spread
onto LAG, NAG or ET, (to determine the number of survivors), and onto ET plates
containing 50 pg/ml of kanamycin (ET-Km), NAG-Km or LAG-Km (to enumerate
transformants). For the selection of transformants, the recovery broth was not diluted.
To determine the number of cells used for electtoporation, the concentrated cell
suspensions stored in 15% (v/v) glycerol were diluted in SMMC and appropriate
dilutions spread onto LAG and ET media. Enumeration of transformants was done using
triplicate plates. Conttols included untreated cells plated onto ET-Km medium.
Transformants were scored initially after 2 to 3 days at 30°C, then after 4 days of growth,
triplicate samples were scored and means calculated.
2.3.5.2 Conjugational transfer into C. glutamicum.
Conjugational plasmid transfer from E. coli SI7-1 to C. glutamicum was performed
according to the method of Schafer et al. (1990). Two types of suicide vectors were
chosen for this purpose, PECMl and pK18mob. Suicide vector pK18mob carries unique
MCS sites and plasmids carrying insertions can be easily identified using the lac colour
reaction. A 700bp PCR amplified fragment of inhA gene obtained from C. glutamicum
sttains AS019 using a primer set CGPl and CGP4 was ligated into the Pstl digested
pK18mob and EcoRl digested PECMl suicide vectors. These primers are designed to
112

Table 2.4 Antibiotics stock solutions (Sambrook et al., 1989; Ausubel et a/.,1992)
Antibiotics
AmpiciUin
Carbeneicillin
Stock solution Mode of resistance
50 mg/ml in water
50 mg/ml in water
^-lactamase hydrolyzes ampicilhn before it
enters the cell
in place of ampiciUin
Chloramphenicol 10 mg/ml in
methanol
Chloramphenicol acetyltransferase inactivates
chloramphenicol
Kanamycin 50 mg/ml in water Aminoglycoside phosphottansferase
inactivates kanamycin
Nalidixic acid PH to 10 mg/ml in Mutation in the host DNA gyrase prevent
IN NaOH 11 with nalidixic acid from binding
NaOH
Rifampicin 34 mg/ml in
methanol
Mutation in the |3 subunit of the RNA
polymerase prevents rifampicin from
complexing
113

contain the EcoRl restriction site on one end. Finally, the suicide vector containing the
insert was transformed into SI7-1 E. coli strains using standard protocols (Sambrook et
al, 1989). The presence of insert in pKlSmob was confirmed using the standard M13
sequencing primer.
For mating experiments, plasmids (pECMlA-m/zA, pK18mob-m/iA, p3QllysA-int) were
introduced by transformation into mobitising sttain E. coli SI7-1. E. coli S17-1 carries
an RP4 derivative integrated into the chromosome which provides the ttansfer functions
necessary for mobilization. Preparation of the competent cells and ttansformation was
done as described by Sambrook et al. (1989). Transformants were selected on LB plates
containing Km (50 pg/ml). For conjugational transfer of plasmids (pECMA-inhA,
pK18mob-:mM, p301/y.yA-int) into C. glutamicum AS019, MLB133, BLl and RM3
recipient sttains, donor sttains SI7-1 from a single colony containing these plasmids were
grown overnight at 37°C in 5 ml of LB medium supplemented with appropriate
antibiotics. Next day the culture was diluted 1/5 in LB and grown up to an optical
density of 1 to 1.5 (580 nm) in a rotary shaker. Recipient sttains were grown in LBG
medium containing 0.4mg/ml INH and 2% glycine at 30°C in rotary shaker (120 r.p.m).
When OD580 reached 0.4 to 0.6, ten ml of culture was transferred to a test tube and placed
in a 49°C water bath for 9 min. The donor (E. coli) and recipient (C. glutamicum) cells
were mixed in a ratio of 1:1 (5 x 10^ ceUs), centrifuged (2,000 r.p.m for 2 min), the
supernatant discarded and ceUs resuspended in residual medium. The mating mixture
was then placed onto a nitroceUulose filter (2.5 cm diameter and 0.45-um-pore size)
(Millipore Corp., Bedford, MA.) and this placed on prewarmed LB plates, dried and
incubated for 20 h at 30°C, the cells were washed off from the filter with 0.9 ml of LB
medium. Transconjugants were plated both on LBG and ET plates containing 30 pg of
Km and 50 pg of nalidixic acid (Nx) per ml and plates were incubated at 30°C for two to
three days. Transconjugates were further subcultured onto ET plates containing higher
concenttations (80 and 100 pg/ml) of Km and Nx.
To confirm tiie integration of the mobilizable plasmids cartying the insert, total DNAs of
transconjugant clones were isolated and digested with selected restriction enzymes.
114

Resttiction fragments were separated by agarose gel electtophoresis and ttansferred to a
nylon membrane (Amersham) and probed with PCR amphfied inhA gene from C.
glutamicum. The plasmid insertion is expected to destroy the inhA gene by disrupting it
into two halves. The proximal ends of both halves contain a duphcate inhA sequence
from the recombinational event. Therefore in Southern hybridisation the inhA gene will
appear as two new bands or there will be a shift in the respective inhA restriction
fragment to the higher-molecular-mass position in the gel. Alternatively the suicide
vector was also used as a probe to confirm the integration of this into the genomic DNA
of the host. Southern hybridisation was performed with the ^ P see section (2.3.2.3).
2.4 BIOCHEMICALS METHODS
2.4.1. Analysis of the proteins and enzymes
2.4.1.1 Assay of NADH Oxidase activity
NADH Oxidase activity was calculated according to Osborn et al, 1972. Incubation
mixtures contained 50 mM Tris-HCl, pH 7.5, 0.12 mM NADH, 0.2niM ditiiiothreitol, and
3 to 100 pg of protein in a total volume of 1.0 ml. Cuvettes containing reaction mixtures
were placed in the specttophotometer and cell fractions added quickly to initiate
reactions. Conttol tubes contained Tris buffer, NADH and reaction mixture without
enzyme. The rate of decrease in absorbance at 340 nm was measured at 22°C in a Gilford
2400 recording spectrophotometer.
2.4.1.2 Protein concentration assays
Bacterial cells were harvested from cultures, disrupted mechanically by homogenisation
and protein concenttations were determined according to the method described by Lowry
and co-workers (1951). All buffers and reagents used for protein concentration assays
are described in Appendix 3. Bovine serum albumin BSA, was used as a protein
standard, (0-100 pg in the sample volume.) to quantify tests in all analyses. To 0.5 ml of
115

protein sample, 2.5 ml of the alkaline-copper reagent (Lowry C reagent) was added,
followed by vortexing and then standing at room temperature for 10 min. After adding
0.25 ml of dUuted Fohn-Ciocalteau reagent (BDH) (2:3 in deionised water), the contents
were mixed thoroughly and allowed to stand at room temperature for another 30 min.
The absorbance at wavelength of 750 nm was read for each sample. The amount of
protein was determined from a hnear standard curve (R^ > 0.99) for 0-100 pg of BSA.
2.4.1.3 Polyacyamide gel electrophoresis
Proteins were resolved by polyacrylamide gel electtophoresis (SDS-PAGE) (Laemmli,
1970). Samples were prepared for electtophoresis by mixing two parts of the sample to
one part of the sample buffer and boihng for five min, then immediately transferring onto
ice. The preparation was centtifuged for 10 sec to remove debris. About 20 pi of protein
sample were applied in each well in 4% stacking gel over a 12% separating gel.
Electrophoresis was performed with a discontinuous buffer system in a Mini-Protein-II
slab ceU (Bio-Rad). The gel was run at a current of 15-30 mM current until the
bromophenol blue marker had reached the bottom. Low-range prestained SDS-PAGE
standards (Bio-Rad) were used as markers. The polyacrylamide gel was visualised by
either Coomassie blue or silver staining and photographed.
A 0.5 mg/ml solution of Coomassie brilhant blue R-250 (Sigma) was prepared by
dissolving the dye in five parts methanol before addition of one part acetic acid and four
parts Milli-Q water. Gels were stained for 30 min at room temperature with gentie
shaking. The gels were rinsed in Milli-Q water and transferred to destaining solution
(one part acetic acid, four parts ethanol and five parts MiUi-Q water) then gently shaken
at room temperature until blue bands and a clear background were obtained. Fresh
destaining solution was added if requfred. The gels were kept in MiUi-Q water overnight
after destaining, then dried using a Gel Air dryer (Bio-Rad).
The silver staining protocol was followed according to the instruction manual
(Pharmacia) as follows. The gel was immersed in tiie fixing solution (one part acetic
116

acid, four parts ethanol, and five parts Milh-Q water) for at least 30 minutes. The gel was
placed in the incubation solution (60 ml of ethanol, 10.25 g of sodium acetate, anhydrous,
1.04 ml of glutaraldehyde, 0.4 g of sodiumthiosulfate and made up to 200 ml with Milli-
Q water) for at least 30 min. The gel was washed three times, each time for 15 min, in
Milh-Q water. The gel was then put into the silver solution (0.2 g of stiver nittate, 40 pi
of formaldehyde and made up to 200 ml with Milli-Q water) for 40 min. The gel was
placed into developing solution (5 g of sodium carbonate, 20 pi of formaldehyde and
made up to 200 ml with Milh-Q water) for 5-10 min. The gel was washed in Milli-Q
water with one change for 5-10 min then preserved in a GelBond film (Pharmacia) as
recommended by the manufacturer.
2.4.2. Isolation and analysis of fatty acids and mycolic acids from cell
wall and whole cells
2.4.2.1 Preparation of cell walls
Method 1
Cell walls were initially prepared from C. glutamicum strains using the method described
by Nikaido et al. (1993). The cells were cultured at 30°C overnight in a rotary shaker in
multiple one litte flasks. Cells (from 2L culture) were chilled to 5°C, harvested by
centtifugation at 2,000 X g for 10 min, and washed once with 60 mM sodium phosphate
buffer, pH 7.5, containing 0.1 M NaCl with ImM phenylmethylsulfonyl flouride, by
resuspension and centtifugation. The same buffer was added to the pellet (40 ml buffer
per 10 g wet weight), and the resuspended cells were broken by homogenisation for a
total of 60 sec using a MSK ceU homogeniser (B. Braun, Germany) and 0.1mm glass
beads. After the addition of pancreatic deoxyribonucleases and ribonuclease (Promega)
(10 pg/ml), the cellular fractions were left at 4°C overnight. The extract was centrifuged
at 1,000 X g for 10 min in a Sorvall GSA rotor, and the supernatant was centrifuged again
under the same conditions. The supernatant was diluted two-fold with the same
phosphate buffer, and centrifuged at 2,500 X g for 40 min. The supernatant thus obtained
117

was centtifuged at 5,000 X g for 40 min, in a Beckman centrifuge to sediment the cell
walls. The pellet was washed twice in IM NaCl, and once in water, by resuspension and
centrifugation. The pellet containing the cell envelops (cytoplasmic membranes and cell
wall) were resuspended in 2 ml of water, and was layered onto sucrose step gradient
consisting of 15 (1 ml), 30 (2 ml), 40 (4 ml) and 70 (3 ml). The gradient was centrifuged
in an SW28 rotor at 27,000 r.p.m for 2 h. The three fractions of the gradients were
collected, analysed for protein content by SDS-PAGE and for the presence of NADH-
oxidase activity by the method of Osborn et al. (1972). These fractions were kept as the
'purified ceU wall' fractions at -70°C, after recovery by centtifugation and washing in
water.
Method 2
Cell wall fractions of C. glutamicum were prepared according to the method of Fujika et
al. (1985) as follows. The cells were cultured at 30°C overnight in a rotary shaker in
multiple 500 ml flasks. After coohng to below 10°C, the cells (from 1 L of culture) were
harvested by centtifugation and washed with distilled water. The cells were suspended in
distilled water and disrupted mechanically by homogenisation for a total of 60 sec using a
MSK ceh homogeniser and 0.1mm glass beads. The disrupted cell fraction was mixed
with 400 ml veronal buffer pH 7.5, assayed for NADH-oxidase activity and then mixed
with 10 mg deoxyribonuclease and 15 mg ribonuclease and stirred at room temperature
for 30 min. The enzyme-treated cell suspension was centtifuged at 1,000 X g for 10 min
in a Sorvall GSA rotor (twice), and the supernatant thus obtained was diluted two-fold
with the same veronal buffer and was then centrifuged at 2,500 X g for 30 min. The
supernatant thus obtained was centtifuged at 5,000 X g for 40 min, to sediment the cell
wall. This fraction was further washed with acetone, 20% (v/v) Triton X-100 solution
and ethanol/distiUed water (2:3, v/v), successively. The residue was collected by
centtifugation at 16,950 X g, resuspended in distilled water, and the pH adjusted to 5.5
with 6 M HCl. After stirring for 60 min, the suspension was centrifuged at 16,950 X g to
obtained crude cell walls. The walls were then incubated witii 0.25 g protease (Sigma) at
room temperattire for 24 h in veronal/HCl buffer pH 9.5 (0.1 M veronal sodium solution
118

was adjusted to pH 9.5 with 1 M HCl). The waUs were sedimented at 16,950 X g,
washed with distilled water and 1,2-dichloroethane/ethanol (l:2,v/v), and finally freeze-
dried in a Dynavac freeze-dryer unit for 16 h. This material was disrupted using a sterile
pessel and mortal and designated as Coryne-CWS.
2.4.2.2 Use of internal standard
Lignoceric acid methyl ester (LAME) C25H50O2, was added at 2 mg/ml into each sample
before exttaction of mycolic acids. The peak corresponding to the internal standard in
gas chromatography (GC) chromatograms appeared between-the last peak of the fatty
acids and the earliest peak of the mycohc acids, and did not interfere with the
interpretation of data for both fatty and mycolic acid analyses. Three other chemicals
(nonacosanoic acid methyl ester, C30H60O2, tticontanoic acid methyl ester, C31 He2 O2,
henttiacontanoic acid methyl ester, C32) were also tested as internal standard. As reported
by Jang (1997), peaks of these compounds appeared between the peaks of either fatty
acids or peaks of mycolic acids in the GC chromatogram, but were closer to the peaks
corresponding to mycolic acids than seen for LAME (data not shown). For this reason
lignoceric acid methyl ester was normally added as internal standard to each sample prior
to extraction and all analysis standardised using the area obtained following extraction
and derivatisation of LAME.
2.4.2.3 Extraction of long-chained lipid components from whole cells and cell
wall preparations
Cells and Coryne-CWS were subjected to acid methanolysis as described by Jang (1997).
This procedure was described previously by Minnikin et al. (1980), modified by Pierotti
(1987) and finally modified by Jang (1997). Cells (100-250 mg, wet weight, depending
on the medium) were harvested at stationary phase by centtifugation (2,000 X g, 4°C, 10
min); the cells were stored at -20°C until analysis. Stored cells were lyophihsed using a
Dynavac freeze-dryer for 16 h. Dried samples of cells were weighed and about 50 mg of
whole cells and 200 mg of Coryne-CWS samples were transferred into 5 ml glass tubes
119

(Wheaton). Since results reported by Jang (1997) showed that both FAME and MAME
appeared in GC chromatograms and the internal standard (LAME) also appeared between
FAME and MAME peaks (which enable comparison between the amount of FAMEs and
MAMEs from the cells) 2 mg/ml of internal standard (LAME) was added into each
sample prior to exttaction.
Dried cells, cell walls and internal standard were subjected to acid methanolysis as
previously described by Minnikin et al. (1980). Samples were vortexed after the addition
of 3 ml of methanol:toluene:H2S04 (30:15:1, vol/vol/vol) then incubated at 80°C for 16 h
in sealed tubes to disrupt the cell wall structure for methanolysis. The reaction mixture
was cooled to room temperature and liberated mycolic acid methyl esters (MAMEs) and
fatty acid methyl esters (FAMEs) were exttacted using petroleum ether (b.p. 60-80°C, 2
ml). After vortexing for 30 sec, the emulsion was allowed to separate for 10 min, then
the top layer (petroleum ether) was collected with a Pasteur pipette and neutrahsed by
pipetting directly onto a 1 cm column of ammonium hydrogen carbonate (BDH)
(prepared dry in a Pasteur pipette with a cotton wool and pre-washed with diethyl ether
[BDH]). This procedure was repeated twice by adding two aliquots of 2 ml of petroleum
ether and proceeding as described above. The eluent were combined into 5 ml glass
tubes and concenttated under a stteam of nittogen and stored at -20 °C. In his PhD
thesis, Jang (1997) had shown that the inclusion of a TLC step to separate MAMES and
FAMES was not necessary when analysing TMS derivatives and this gave better
quantification of MAMES and FAMES, this step was also omitted here before GC
analysis. The conttol was 100 pi (2 mg/ml) of LAME, which was derivatised and
exttacted as above. The area of LAME in each sample was compared to that of the
conttol and exttaction yields of each sample obtained, peaks were identified by
comparison with the retention time and peak area of the internal standards (Sigma 189-6,
189-17) for FAMES.
120
2.4.2.4 Derivatising and analysis of trimethylsilyl (TMS) derivatives of
MAMEs and FAMEs
Purified MAMEs and FAMEs were derivatised to trimethylsilyl (TMS) ethers by
dissolving in 400 pi of trimethylsilylimidazole (Tri-sil Z, pierce) at 60°C for 20 min. The
TMS derivatives of MAMEs were analysed by GC using a flame ionisation detector
(FID) or by GC-MS. The conversion of the MAMEs to TMS ethers protects the
molecules from pyrolysis and makes them amenable to conventional GC at high
temperatures (Yano et al, 1972).
2.4.2.5 Gas chromatography (GC)-flame ionization detection of TMS ethers
of MAMEs and FAMEs
The TMS ethers of MAMEs and FAMEs were analysed by GC using a Varian Star 3400
CX gas chromatograph fitted with FID. One pi of the solution was injected onto a 25 m
non-polar BPX5 (0.22 nun i.d.; 0.33 mm o.d., fused silica, SGE, Scientific Pty, Ltd,
Austtalia) with spht ratio set at 85:1. The oven temperature program was set at 150°C
isothermally for one min, increased by 5°C/min to 165°C, then increased to 185°C at 0.3
°C/min. The colunm temperature was increased to 260°C by 6°C/min, increased by 2
°C/min to 320''C and held at 320°C for 6 min and 50 sec before analysis of the next
sample. The injection temperature and the detector temperature were 300°C. Nittogen
gas was used as carrier gas (0.9 ml/min). Injection of samples was carried out by an
autosampler (Varien 8200) (needle was washed by nittogen between injections). The
identity of individual TMS etiiers of FAMEs was estabhshed by comparison of the
retention time with those of standard TMS ethers of FAMEs (Sigma) containing known
amounts of saturated and unsaturated FAMEs (C12-C20, Sigma). The relative peak
proportions of TMS ethers of FAMEs were determined by comparing peak area. All
analyses were standardised using the area obtained for the C25 internal standards, which
was added prior to exttaction and derivatisation
121

Chapter 3
Analysis of the mycohc acid and fatty acid composition of the cell wall of
C. glutamicum and comparison between parents and mutant strains
3.1 INTRODUCTION
Previous studies have shown that transformation efficiency in corynebacteria remained
low even with homologously derived DNA, implying that the cell wall structure of this
species could be one of the key parameters in DNA transformation in addition to
restriction and modification barriers (Jang et al, 1997). Several workers had shown that
growth in the presence of agents which, presumably, modified cell surface structures of
coryneform bacteria (penicilhn G, glycine, INH, Tween 80) (Haynes and Britz, 1989,
1990; Katsumata et al, 1984; Noh et al; Yoshihama et al, 1985) improved
ttansformation of plasmid DNA into these bacterial species. Since INH and glycine are
known to alter the mycolic acid composition in mycobacteria and the peptidoglycan
structure of the Gram positive cell wall respectively, these chemicals were selected for
addition into the growth medium to study the impact of these chemicals on cellular
mycolic acid composition and growth rates (Jang et al, 1997).
Prior growth of strain AS019, a rifampicin-resistant derivative of C. glutamicum ATCC
13059, in either glycine or INH (at high concenttations) or combinations of these had
been shown to increase electtoporation frequencies significantiy (Haynes and Britz, 1989;
1990). Furthermore, a series of auxottophic mutants of sttain ATCC 13059 had been
isolated which protoplasted more readily: two of these mutants, sttains MLB 133 and
MLB 194, were sttidied in the present work. Because of the observed morphological
changes seen for MLB 133 and MLB 194, they were thought to be ceU-surface sttucture
mutants (Best and Britz, 1986; Pierotti, 1987). Two species of Brevibacterium, B.
lactofermentum sttain BLl and B. flavum BF4, were also included in the study to enable
comparisons between different sources of C. glutamicum, noting that it has been
proposed to consider them as one C. glutamicum species (Liebl et al, 1991).
122

As indicated above, when glycine and INH were added to LBG cultures of AS019,
MLB133 or MLB194, Jang et al. (1997) showed that several changes in hpid
composition occurred: both mutant strains MLB 133 and MLB 194 contained decreased
proportions of C32:o relative to their parent, there was an increase in the proportion of
exttacellular mycolic acids, the relative percentage of fatty acids to the total lipids also
decreased, and the cell waU became thinner (Jang, 1997; Jang and Britz, 2000).
The goal of the research described in this chapter was to obtain an understanding of how
growth in the presence of cell wall modifiers (glycine and INH) affected cell wall
composition of C. glutamicum. Previous studies had noted that the fatty acid
composition of C. glutamicum AS019 altered when grown in different media but this
was not studied in detail. Furthermore, these studies did not differentiate between cell
wall and total cellular lipids as analysis was performed on whole cells. So that it was not
clear whether fatty acid or mycolic acid synthesis had been altered by glycine and INH.
A method to prepare cell walls of mycobacteria had been described, where this involved
differential centrifugation to prepare cell wall fractions free of cell membranes.
Therefore a major aim of this chapter was to tty this method with C. glutamicum and
obtain some sttuctural analysis of fatty acid composition of the cell wall. An important
feature of this method when used with mycobacteria was tracking the protein profile of
both the cell wall and cell membrane. NADH oxidase is a cell membrane protein which
should be enriched in cell membrane or whole cell fractions but not in the cell wall
(Nikaido et al, 1994 ). This assay was therefore used to determine the success of the
fractionation procedure in C. glutamicum. Cell wall fractions were also washed with
several detergent solutions and finally digested with proteinase to solubilize the cell
membrane so tiiat only cell wall bound lipids would remain for analysis.
Knowing that the cell wall fatty acids had changed would have been useful in preparing
models of how the mutants have changed. Our preliminary experiments included
determining the minimal inhibitory concenttations of INH and ETH, a structural analogue
of INH, for C. glutamicum sttains and Brevibacterium species. This was undertaken to
123

validate the phenotypes of the strains under study using sohd media (noting that the
previous MICs were determined in LBG) and to test whether the previously observed
differences in INH sensitivity were also seen for ETH.
3.2 DETERMINATION OF MICs FOR INH AND ETH for C.
GLUTAMICUM AND RELATED SPECIES
MICs were determined by using a multi-prong repticator to ttansfer small drops of
overnight cultures of all isolates onto NA plates containing INH at concenttations of 0 to
18 mg/ml at increments of Img INH/ml. Cultures were used either undiluted ("heavy
inocula") or diluted up to 10' in 0.1% ttyptone water ("light inocula") to determine the
MICs for whole cultures and single cells. Tests were performed in duphcate. Examples
of the tests were photographed and these are shown in Figures 3.1 A and 3. IB.
Plates were observed after 24 to 48 h incubation at 30°C and growth was arbittarily
scored and recorded (Table 3.1): MICs were defined as the lowest concenttation of INH
which first significantiy decreased growth of single colonies (hght inocula). The
following observations were made:
• The parent sttain of C. glutamicum, AS019, had the highest MICs for INH among all
of the sttains tested;
• The two mutants sttains MLB 133 and MLB 194 both had lower INH MICs relative to
Uie AS019, confirming then known phenotype;
• cspl disrupted mutant of C. glutamicum (sttain RES467) also showed lower MIC,
and in this respect was more hke MLB 133 and MLB 194;
• The RM4 (restriction deficient mutant) showed more sensitivity to INH relative to
AS019;
• other C. glutamicum sttains, CG2 and ATCC 13032, were more like MLB 133 and
MLB 194, in tiiat they had lower MICs then AS019;
124

• BLl showed the highest sensitivity to INH, however, BF4 showed less sensitivity to
INH and the MICs determined were more similar to AS019;
t The above results were consistent both with previously recorded tests in liquid media
and with the observed ease of protoplasting and ttansformation seen for these sttains
(Jang and Britz 2001).
MICs for ETH were determined similarly using NA plates which contained ETH at
concentrations of 0.1 to 10 mg/ml. The amount of drug increased at a concenttation of
0.2 mg/ml up to 1 mg/ml and then at increments of 1 mg/ml to lOmg/ml. Examples of
some of the tests were photographed and these are shown in Figure 3.2. MICs were
defined as the lowest concenttation of the ETH that ffrst significantiy inhibited the
growth of light inocula of the C. glutamicum strains tested. MICs varied from sttain to
sttain and important observations are summarised below.
For aU of the sttains tested, growth in the presence of ETH was inhibited at lower
concentrations than seen for INH. MICs were therefore repeated using plates prepared
with concenttations at smaller increments and over a lower concenttation range: data for
several sttains is summarised in Table 3.2. In contrast to the data seen for INH, MICs for
all of the sttains were similar. This meant that the differential sensitivity seen when using
INH could not be detected when using ETH, which was reported as a more potent drug
when tested using mycobacteria.
• AS019 had the highest MICs for ETH of the sttains tested, followed by BF4;
• MLB194 and MLB133 both had shghtly lower ETH MICs relative to AS019;
125

10 11
12
15
13
16
14
17
Figure 3.1A Photograph of the MICs plates for AS019, MLB 194, MLB 133, where a
multi-prong replicator was used to ttansfer small drops of overnight culture and dilutions
onto INH-containing NA plates. These plates have increased INH concentration from 0
to 17 mg/ml and were photographed after 24 h at 30°C. Bacterial isolates were as foUows
(identical on each plate).
Row 1-2 Sttain AS019 undUuted tiien diluted 10" to 10"
Row 3 Sttain MLB 194 undiluted then diluted 10" to 10'
Row 4-5 Sttain MLB 133 undiluted then diluted 10" to 10"
Photograph 1, 2, 3, Top rows of plates contained 0, 1, 2; 6, 7,8; 12, 13, 14 mg/ml INH
Photograph 1, 2, 3, 2nd row of plates contained 3, 4, 5; 9, 10, 11; 15, 16, 17 mg/ml E^H
126

10 11
12
^ * -': ^
mm
13 14
15 16 17
Figure 3.1B Photograph of MICs plates for AS019, BLl and BF4, where a multiprong
replicator was used to transfer small drops of overnight culture onto INH containing NA
plates. The plates have increasing INH concenttations from 0 to 17 mg/ml. Bacterial
sttains used were as follows (identical on each plate). From left to right;
Row 1-2 Sttain AS019, undiluted, then diluted 10" to 10'
Row 3, Sttain BLl undiluted then dilution 10" to 10"
Row 4-5 Sttain BF4 undiluted then dilution 10" to 10" .
Photograph 1, 2, 3, Top rows of plates contained 0, 1, 2; 6, 7,8; 12, 13, 14 mg/ml INH
Photograph 1, 2, 3, 2nd row of plates contained 3, 4, 5; 9, 10, 11; 15, 16, 17 mg/ml INH
127

Figure 3.2 Photograph of ETH MICs plates for several C. glutamicum strains where a
multi-prong replicator was used to ttansfer small drops of overnight culture onto ETH-
containing plates. The plates have increasing ETH concenttations (from 0 to 4 mg/ml).
Bacterial sttains used were as follows (identical on each plate). From left to right:
Row 1,2
Row 3
Row4
Row 5
Row 6-7
Sttain AS019 undiluted then diluted 10" to 10"
Sttain MLB 194 undiluted then dtiuted to 10' to 10'
Sttain MLB133 undiluted then diluted 10" to 10"
Sttain BLl undiluted then diluted 10" to 10"
Sttain BF4 undiluted then diluted 10" to 10'
Photograph 1, Top rows of plates contained 0, 0.4, 0.8
Bottom rows of plates contained 1, 2, 3 mg/ml of ETH
Photograph 2 contained 4 and 5 mg/ml ETH respectively.
128

U3
c •a
s
s 00
u
g
H
14
15
16
17
18
19
20
INH
con
cent
ratio
n in
mg/
ml
8 9
10
11
12
13
in
Stra
in
-
1
1
+
+
+
+
+
+ +
+ +
+ +
+ +
+ +
+ +
+ +
+++
+++
+ + +
+ + +
AS0
19
VO
1
1
1
1
1
1
+
+
+
+
+
+
+
+ +
+ +
+ +
+ + +
+++
+++
ML
B 1
94
r-
+
+
+
+
+
+ +
+ + +
+ +
+ +
+++
+++
+++
ML
B 1
33
m
+
+
+
+
+
+
+
+ +
+ +
+ +
RM
4
o
+
+
+
+ +
+ +
+ +
+ +
+ +
+ +
+++
+++
+ + +
+ + +
Csp
l m
utan
t
OS
1
1
1
1
1
1
+
+
+
+
+
+ +
+ +
+ +
+ +
+ +
+ +
+++
+++
+++
CG
2
r-
1
1
1
+
+
+
+
+
+
+
+
+
+
+ +
+ +
+++
+++
+++
+++
AT
CC
130
32
^
+
+
+ +
+ +
+++
BL
l
o
1
1
1
+
+
+
+
+
+
+ +
+ +
+ +
+ +
+ + +
+ + +
+ + +
+ + +
+++
+++
BF4
1/1
03
D . <D
C3 O
;r3 a, V v> o
<+-1/2
bO
a > a r.
a 3 O o c
JS W)
s W)
c
usi
1/3 0> c " S
g 1)
* - > u •a
C/3
u 1 — 1
S u.
,<> <*-
a P
-c ^ — •
^ o k > W)
o c 1 o" X)
vis
-4—>
D
- C •4—>
^ O U l W)
II
s: ^ n U l
bU
en <U
II + + + J=
•i o u bO
1 3 O O W)
II + + +
T3 1) D oo
o X3
B >-.
0 0

(U T3
c3 C o
W
C c
•Ul c o o s 3
E c o
s
1/3
u
"Z R
H
C/3
r_) :s
s "bi s e c o
4..^
Ul .u> c (l> o n o
( )
ET
H
trai
ns
C/3
a .—^ B B
o
6 7
8 9
1
m
^
f o
CM
.
OS
o
00
o
o
o
• o
o
o
cs o
o
m
1
1
1
1
+
+
+
+ +
+ +
+ + +
+ + +
+ + +
+ + +
+ + +
+ + +
+ + +
+ + +
+ + +
+ +
S019
<
<N
1
1
1
1
1
1
1
+
+ +
+ + +
+ + +
+ + +
+ + +
+ + +
+ + +
+ + +
+ + +
+ + +
+ + +
- *
ML
B 1
9
cs
1
1
1
1
1
1
1
+
+ +
+ + +
+ + +
+ + +
+ + +
+ + +
+ + +
+ + +
+ + +
+ + +
+ + +
CO
ML
B 1
3
cs
1
1
1
1
1
1
1
+
+ +
+ + +
+ + +
+ + +
+ + +
+ + +
+ + +
+ + +
+ + +
+ + +
+ + +
CN
o u
cs
1
1
1
1
1
1
1
+
+ + +
+ + +
+ + +
+ + +
+ + +
+ + +
+ + +
+ + +
+ + +
+ + +
+ + +
cs m O
TC
Cl:
<
. — 1
1
1
1
1
1
1
1
+
+
+ + +
+ +
+ +
+ + +
+ + +
+ + +
+ + +
+ + +
+ + +
+ + +
J CQ
m
1
1
1
1
1
1
+
+ +
+ +
+ + +
+ + +
+ + +
+ + +
+ + +
+ + +
+ + +
+ + +
+ + +
+ + +
2 P3
o feb o c
3
p - 4 - ^
O u bO
bO

• BLl was the most sensitive sttain, which was consistent with its relative sensitivity to
INH.
3.3 EVALUATION OF THE METHODS TO PREPARE CELL
WALL FRACTIONS OF C GLUTAMICUM.
Results reported by Jang et al. (1997) had concenttated on the effects of INH and glycine
on the mycolic acid composition and location (cellular and extracellular) for two families
of C. glutamicum strain, ATCC 13059 and ATCC 13032, and then mutants. However,
these studies could not differentiate between changes in the lipids at the cell wall in
relationship to changes in whole cellular lipids as no sub-cellular fractionation was
attempted. Changes in the mutants obtained from ATCC 13059 could have occurred at
different parts of the mycolic acid biosynthesis pathways:
(a) Biosynthesis of the fatty acids, destined for incorporation into both mycolic acids and
membrane lipid structures;
(b) Assembly of the fatty acids into mycolic acids;
(c) Attachment of the mycolic acids to arabinogalactan at the cell surface, noting that
exttacellular mycolic acids increased for the mutants and after growth in glycine/INH;
(d) Cross-linking between mycolic acids;
(e) Other interactions between free and bound mycolic acids and free fatty acids at the
cell surface.
Consequentiy, obtaining further information on the composition of the cell wall, in
relation to analysis of whole cells, may have provided further insight into the nature of
the mutations in MLB 133 and MLB 194, and the site of action of glycine and INH in
altering cell wall composition.
Several metiiods for preparing cell walls had been described for mycobacteria, nocardia
and rhodococcus species (Fujioka et al, 1985; Shigetaka et al, 1986; Nikaido et al,
1991). These involved various fractionation procedures, often with differential
131

centtifugation, to obtained cell wall fractions free from cytoplasmic membrane. The
methods described by Nikaido et al. (1991) and Fujioka et al. (1985) were tested here
with C glutamicum.
3.3.1 Preparation of cell wall
Experiment 1: Preparation of cell waU using Nikaido et al. (1993) metiiod.
First a method described by Nikaido et al. (1993) was used without modification for the
preparation of cell waU fractions (see section 2.4.2.1 for detail). Crude cell walls were
obtained after three successive low-speed centtifugation steps were washed with distilled
water and layered onto a sucrose step gradient using 15, 30, 40, 70 % (w/v) steps. Instead
of two bands as anticipated in Nikaido's experiments with mycobacterial walls, four to
five bands were seen with corynebacterial walls. The top brown and two bottom light
brown fractions were collected for assay of NADH oxidase activity using the method of
Osborn et al. (1970) (data not shown) and protein content were analysed by SDS-PAGE.
The results of the experiment are briefly summarised in Fig 3.3 (A, B). The top fractions
showed maximum NADH oxidase activity and complex protein profiles (cytoplasmic
membranes) while the two bottom fractions showed almost negligible activity. However,
the yields of cell wall in these fractions were too low and did not meet my requirements
which involved analysing the mycolic acid and fatty acid composition of cell wall
fractions by GC. Therefore this method was not considered to be a good one for C.
glutamicum despite its use by many workers (Benz et al, 1993, 1994; Nikaido et al,
1994) for mycobacteria. This method was not further used and other methods which
involve the use of detergents were tested, as these were reported to give better yields
Fujioka era/. (1985)..
132

Sucrose % i
mo <
mo •<
70% •(
Fl maximum
F2
F3 minimum
F4 minimum
Figure 3.3 A Fractions formed in a sucrose-step gradient of the cell envelope from C.
glutamicum strain AS019. The sucrose concenttation before centtifugation is indicated to
the left of the tube. The different zones formed in the tube after centrifugation were
clearly distinguishable by their colours. Only three fractions were collected and NADH-
oxidase activity was measured. The Fl layer showed miximum NADH oxidase activity,
and F3 and the lower bottom layer showed minimum NADH oxidase activities.
133

1 2 3 4 5 6 7 8
4 5
Figure 3.3 (B) Protein composition of the fractions from the sucrose-step gradient
centtifugation.
Top gel: Lane 1 Broad-range SDS-PAGE standards (209, 124, 80, 49, 34.8, 28.9, 20.6,
7.1); lanes 2,3,4 contain fractions Fl, F3, F4 from AS019; Lanes 5,6,7 fractions Fl, F3,
F4 from MLB194; lane 8 fraction Fl from MLB133.
Bottom gel: Lane 1 Broad-range SDS-PAGE standards (209, 124, 80, 49, 34.8, 28.9,
20.6, 7.1); lanes 2,3,4 fractions Fl, F3, F4 from MLB133; lanes 5, 6 fractions Fl from
AS019andMLB194.
134

Experiment 2: Preparation of cell wall fractions using a method modified from Fujioka
etal(l9S5).
A method was developed (see section 2.4.2.1) which utihsed the same initial steps as in
Nikaido's method, until the preparation of crude cell waU. Briefly, AS019 cells were
chilled to 5°C, harvested and homogenised, then protein concenttations and NADH-
oxidase activities were determined. The fractions were then tteated with RNase and
DNase and subjected to three low-speed centrifugation steps and finally crude cell-wall
fractions were obtained by sedimentation. It has been found previously that low speed
centrifugation steps removed unbroken cells completely with minimal sedimentation of
the cell wall (Nikaido et al, 1993). The cell wall fractions is then obtained as a pellet
after centrifugation at 5,000 x g for 40 min, leaving behind most of the cytoplasmic
membrane in the supernatant. Despite the significant enrichment in cell walls, this
fraction is normally contaminated with cytoplasmic membrane, as shown by the level of
NADH oxidase activity, although the levels present were much less than found in the
supernatant fraction (Table 3.3 A, B. The results showed that after several low speed
centrifugations steps the crude cell wall fractions had reduced level of NADH oxidase
activity, indicating that a preparation of the cytoplasmic membrane have been removed
when compared with the crude cell lysate). These fractions were further purified as
described by Fujioka et al. (1985). The use of detergent in this method solubilised the
cytoplasmic membrane and SDS-PAGE was also performed to detect residual proteins
during the preparation of the cell wall fraction (Fig 3.4). The results are shown in Fig 3.4
but since no conttol has been run it is difficult to predict how much protein was removed
from the cell wall during subsequent washing in detergent. These fractions were further
subjected to protease tteatment which completely remove the protein component of the
cell wall, leaving behind hpids and other components. The walls were sedimented after a
high speed centtifugation step and washed with 1,2-dichloroethane/ethane and finaUy
freeze-dried. This material was disrupted using a mortar and pestle, and designated
Coryne-CWs (coryne-cell walls). Mycolic acid exttaction from the cell wall was done
initially using the exttaction procedure described by Fujioka et al, (1986) but later on the
135

Table 3.3 NADH-oxidase in cellular fractions of C. glutamicum strains.
a-NADH-Oxidase activity of supernatant obtained after centtifugation at 5,000 x g for 40
min.
Strain NADH-Oxidase activity pmol/min/mg of protein
AS019 40.92
MLB 194 25.31
MLB133 33.10
b NADH-oxidase activity of crude cell wall fractions (pellet obtained after centtifugation
at 5,000 X g for 40 min.)
Strain NADH-Oxidase activity pmol/min/mg of protein
AS019 9J3
MLB 194 4.08
MLB133 11.15
136

w
**' fe-"
Figure 3.4 SDS-PAGE analysis of crude CW proteins (after 3 low speed centtifugation steps).
A; Lane 1 Low-range prestained SDS-PAGE standards (103, 77, 50, 34.3, 28.8, 20.7); Lanes 2, 3, 4 AS019 (LBG-I, LBG-G, and LBG); Lanes 5, 6, 7 BLl (LBG-I, LBG-G, and LBG); Lanes 8, 9 BF4 (LBG-I, LBG-G).
B; Lane 1; Low-range prestained SDS-PAGE standards (103, 77, 50, 34.3, 28.8, 20.7); Lanes 2, 3, 4 AS019 (INH, glycine, LB); Lanes 5, 6, 7 MLB133 (LBG-I, LBG-G, and LBG); Lanes 8, 9, 10 MLB 194 (LBG-I, LBG-G, and LBG).
137

exttaction procedure developed by Jang (1997) was used as this gave better quantification
of mycohc acids and omitted purification of these by TLC, shortening the procedure.
3.3.2 Standardisation of quantitative methods
3.3.2.1 Quantification of mycolic acids by gas chromatography (GC)
In order to determine the relationship between the amount of mycohc acids injected and
peak areas detected, several injections were carried out using mycohc acids exttacted
from cells and samples of several dilutions injected (Fig 3.5). Samples were diluted with
pyridine because the derivatizing agent (Tri-Sil-Z) was solubilised in pyridine. As shown
in Fig. 3.5, the relationship between the peak area and amount of TMS ethers of MAMEs
apphed was hnear, with peak area ranging between <20,000 to 120, 000. In most cases,
samples described in the present study contained amounts of mycolic acids within this
range of peak area.
3.3.2.2 Reproducibility of the analysis between experiments
Analysis of the extracts prepared from the cells of strain AS019 (grown in LBG) was
performed twice to determine variations in quantification between samples. Three
separately grown cultures were harvested in early stationary phase and mycolic acids
were separately prepared from the cells using the procedure described in section 2.4.2.3.
The qualitative mycolic acid profile obtained in the two analyses were the same for the
five types of mycolic acid, but there were quantitative variations, related to the relative
proportion of each mycohc acid detected (Table 3.4). Variation was found for the
compound CBM (62.53 to 64.38), C34:i (18.45 to 19.79), C34:0 (8.35 to 10.90) C36:2 (3.08
to 3.60) and C36;i.(2.76 to 3.10). In the case of repeated injections (twice using the same
sample), tiie variation in peak area was less than ±2 % between injections.
138

120000
100000 -
80000 J (0 0)
^ 60000 -w
40000
0 20 40 60 80
Dilution factor
100 120
Figure 3.5 Relationship between the amount of mycolic acid from whole cells and peak
area detected using gas chromatography. Cells of C. glutamicum AS019 were grown in
LBG and whole cells extracted as described in section 2.4.2.3. The liberated mycolic
acids were converted to TMS ethers as described in section 2.4.2.4. The MAMEs were
diluted from samples with dilution factors of 5, 10, 50, 100 and 1,000 and analysed by
GC. The same amount of each sample from each dilution was injected onto the column.
139

Table 3.4 Evaluation of reproducibility of quantitative analysis of mycolic acids
composition between different experiments using C glutamicum AS019 grown in LBG.
CulUires containing 500 ml of media were grown in I litte flask at 30°C and harvested at
early stationary phase. Mycolic acids were exttacted from dried cells and from the cell
wall fractions prepared as described in section 2.4.2.1. After acid methanolysis of the
dried cells, samples were exttacted three times using petroleum ether, dried under N2 gas,
silylated to TMS ethers and then analysed by GC.
Mvcolic acids tvpe''
N'
Whole ceU
1
2
3
Average
Standard deviation
ccw 1
2
3
Average
Standard deviation
C32:0
62.53
63.77
64.38
63.56
0.43
30.16
31.16
30.58
31.73
0.50
C34:l
19.79
18.85
19.95
19.53
0.59
41.95
44.51
44.71
43.7
1.53
C34:0
10.9
9.30
8.35
9.51
1.31
7.41
5.95
5.95
6.43
0.84
C36:2
3.60
3.25
3.08
3.31
0.26
15.95
15.11
15.39
15.48
0.59
C36:l
3.10
2.76
3.10
2.99
1.96
4.1
3.25
3.34
3.56
0.60
N is experiment number. Data was from three separately grown cultures and
mycolic acids were separately prepared.
Proportion of each TMS derivatives of the MAMEs was calculated as a % of the
total in terms of peak area detected, correcting for variation in injection using the
internal standard and using three exttactions with petroleum ether.
140

3.3.3 Preparation of mycolic acids using Fujioka et ah, (1986)
Initially the method of Fujioka et al. (1986) with some modification was used to exttact
the mycolic acids from the cell wall fractions. About 200 mg of cell wall of C.
glutamicum sttain AS019, prepared after growth in LBG, was mixed with and hydrolysed
with 5 ml of KOH in methanol at 100 °C for 3 hrs in a sealed tube. After acidification
with 10 ml IM HCL, the sample was extracted three time with 25 ml diethyl ether. The
combined ethereal solution was rinsed twice with water and then evaporated to dryness.
The TLC step for the further purification was omitted and the dried exttact was silylated
as described by Jang (1997) and mycolates were analysed by GC. Using the GC
conditions described in section 2.4.2.5, FAMEs and MAMEs were identified by
comparison with the retention time and peak area of the external standards (Sigma 189-6,
189-17). Similar FAMEs and MAMEs patterns were observed both for cell wall and
cells, however, the yield was very low (data not shown). Among the five major mycohc
acids, two components of the mycohc acids fraction (C32:o and C34:i) made up to 72.01 to
76.91% of the total composition in the cell wall of AS019. This method was not very
convenient and losses may have occurred due to the many steps used. Therefore it was
decided to use the method described by Jang (1997) as it was simple, more accurate and
gave 95% recovery yield of MAMEs.
3.3.4 Preparation of mycolic acids by the method of Jang (1997)
After the crude cell wall was obtained from AS019 grown in LBG by the method of
Fujioka et al. (1985), the wall was incubated with protease at room temperature for 24 hrs
in veronal/HCl buffer pH 9.5 [0.1 M sodium solution was adjusted to pH 9.5 with IM-
HCl]. The wall was sedimented at 16,950 x g, washed with distilled water and 1,2-
dicholoroethane/etiianol (1:2, v/v), and finally freeze dried. Cell wall (Coryne-CWs)
fractions were disrupted mechanically using a mortar and pestie and were furtiier
processed for mycolic acids exttactions according to the method as described by Jang
(1997).
141

Due to the frequent use of the GC column by several people, the column had to be
completely cleaned before analysis to avoid any chances of contamination by the
presence of chemicals in the column from previous analysis by others. The temperature
gradient was adjusted (section 2.4.2.5) in such a way that both FAMEs and MAMEs
appeared in the same chromatogram. The first peak from TMS ethers of MAMEs was
eluted at above 280°C and all the peaks corresponding to FAMEs appear before
MAMES. In most cases, there were no or few background peaks detected above 280°C.
3.4 MYCOLIC ACID COMPOSITION IN WHOLE CELLS AND
CELL WALL FRACTIONS FOLLOWING GROWTH IN
DIFFERENT MEDIA
The procedure used for the extraction of mycohc acids and fatty acids from whole cells
and the cell wall fractions is described in detail in section 2.4 2.3. Although the nature of
the two samples were different, once the samples were freeze dried, the same procedure
was used for the exttaction of mycolic and fatty acids from both whole cells and cell
walls.
3.4.1 LBG
Mycotic acid profiles of whole cells and cell wall fractions from several corynebacterial
sttains after growth in LBG are shown in Table 3.5. Among the five major mycohc acids
seen in all of the strains, two components C32:o and C34:i made up to 73.1 to 86.4% of the
total composition in all sttains. Although the type of mycolic acids detected were the
same for all sttains, difference in the relative amounts of mycolic acids were seen: the
abundance of 032.0 was higher in sttain AS019 (63.5%) than in mutant sttains MLB133
and MLB 194, which agreed with data reported previously by Jang (1997) for whole ceUs.
In terms of relative proportions of unsaturated to saturated mycohc acids for AS019 and
its mutants, significant differences were observed: strain AS019 had relatively low
proportions of unsaturated mycolic acids (27.2 %), whereas the two mutants had higher
proportions of unsaturated mycolic acids, ranging from 40.6% in MLB 133 to 39.1% in
142

MLB 194 in whole ceUs. The two Brevibacterium strains showed mycohc acids profiles
similar to MLB 133.
The relative proportions of the different types of mycolic acids found in the cells and cell
walls were quite different for all the sttains tested: the proportion of unsaturated mycohc
acids found in the ceU waU fraction was 60.0% for AS019 and 63.3% for MLB 133. In
the cell wall fractions, the proportion of C32;o was relatively lower, which corresponded to
an increase in the relative proportion of unsaturated mycolic acids compared to whole
cells. The abundance of C32:o was higher in the ceU wall fractions of MLB 194 (39.6 %)
than seen for AS019 (31.7%) and MLB 133 (30.6%). The two Brevibacterium sttains
showed similar proportions of cell wall mycolic acids, where the level of unsaturated
mycohc acids ranged from 56.4% in BLl to 63.3% in BF4; the level of C32:o in BLl and
BF4 was 33.4% to 33.7% respectively. The differences in the relative proportion of
certain mycolic acids in whole cells compared with cell walls showed that tteatment with
solvents, detergent and enzymes removed the free extractable mycolic acids, leaving
behind mycohc acids in bound form. These results suggest that differences in MA
composition between strains arise largely due to differences in the non-bound MA.
3.4.2 LBG-glycine
In order to determine if growth in 2% glycine had any affect on the mycolic acid profiles
of the sttains, cells were grown in the presence of glycine and samples prepared as above.
The results of analysis of mycohc acids in whole cells and the ceU waU fractions are
shown in Table 3.6. The relative proportions of unsaturated mycohc acids in whole cells
ranged between 28.3% for AS019 to 38.3%) for MLB 133. The results showed that
growtii in LBG-glycine had httie impact although the mutant sttain on the relative
proportion of tiie mycolic acids detected in whole cells of AS019, MLB 133 exhibited a
small increase in the proportion of C32:o when compared to cells grown in LBG (Table
3.5). The data in agreement with results previously reported by Jang (1997), which show
that glycine mainly increased the proportion of exttacellular mycohc acids.
143

Table 3.5 Mycolic acid composition of whole cells and cells wall fractions following
growth in LBG.
Strains
Whole cells
AS019
MLB133
MLB 194
BLl
BF4
Cell Wall
AS019
MLB 133
MLB 194
BLl
BF4
C32:0
63.6
48.5
54.8
45.2
41.3
31.7
30.6
39.6
33.4
33.7
C 34:1
20.9
28.8
31.6
30.0
31.8
40.9
41.8
40.2
41.8
38.7
Mvcolic acids^
C 34.0
9.5
6.4
6.1
10.9
11.3
7.4
6.1
8.6
9.2
9.4
C 36:2
3.3
7.9
5.7
9.74
9.2
15.0
17.9
13.0
11.4
13.2
C 36:1
3.0
3.9
3.3
3.7
3.1
4.1
3.7
4.5
4.3
4.5
% of UM to TM''
27.2
40.6
39.2
43.5
44.11
60.0
63.3
57.5
56.4
63.3
Proportion % of each mycolic acids found in whole cells and the cell wall
fractions. The proportion of each mycolic acids was calculated as a % of the total
in terms of peak area detected.
The ratio of UM (unsaturated mycolic acids, C34:i, C36.2, C36:i) to TM (sum of
sattirated and unsaturated mycolic acids) was determined by dividing the sum of
the peak areas obtained for unsaturated mycolic acids by the sum of the total
mycolic acids.
144

Table 3.6 Mycolic acid composition of whole ceUs and cell wall fractions foUowing
growth in LBG-glycine (2%).
strain
Whole ceUs
AS019
MLB 133
MLB 194
Cell Wall
AS019
MLB 133
MLB 194
C32:0
58.4
54.6
51.0
55.7
55.9
47.9
C34:l
22.6
27.4
20.9
26.1
25.4
25.6
Mvcolic acids''
C34:0
13.2
8.7
16.3
13.8
13.7
11.0
C36:2
2.8
7.1
3.4
3.0
2.8
11.3
C36:l
2.9
3.7
3.4
3.3
2.5
4.2
% UM to TM"
28.3
38.3
27.8
30.3
30.5
42.7
Proportion (%) of mycolic acids found in whole cells or the cell wall fractions.
The proportion of each mycolic acid was calculated as a % of the total in terms of
peak area detected.
The ratio of unsaturated mycolic acid, (C34:i, C36:2, and C36:i) to TM (sum of
saturated and unsaturated mycolic acids) was determined by dividing the sum of
the unsaturated mycolic acids values by the sum of the total mycolic acids.
145

The relative proportions of five types of mycolic acids found in the cell wall fraction for
aU sttains tested were quite similar to those seen in whole cells, in conttast to seen for
cells grown in LBG. The proportion of unsaturated mycolic acids ranged between 30.3%)
in AS019 to 42.7% in MLB 194, and 30.5% in MLB 133 after growth in LBG-G. This
represented a significant decrease in the relative proportion of unsaturated mycohc acids
in the cell wall fractions of the cells grown in 2% glycine compared to ceUs were grown
in LBG. The proportions of unsaturated mycolic acids decreased from 60.0%? in LBG to
30.3% in LBG-G for AS019, 63.3% to 30.5%? for MLB 133 and 57.5 % to 42.1% for
MLB 194. For the three strains tested, the cell wall fractions contained proportionately
more C32:o after growth in glycine as compared with Coryne-CW from LBG-grown cells.
3.4.3 LBG-INH (4 mg/ml INH)
The C. glutamicum strains were cultured in LBG containing 4 mg/ml INH and cells
harvested in early stationary phase; the specific growth of the three sttains in the AS019
family were reduced by 40% as previously reported by Jang et al (1997). The analysis
of mycolic acids in whole cells and cell wall fractions is shown in Table 3.7. The relative
proportion of unsaturated mycohc acids was 36.8%> in AS019, 43.6%o in MLB 194 and
40.1% in MLB 133, and similar ttends were seen in both whole cells and cell wall
fractions. However, MLB 133 showed a small decrease in C32:o and increase in 034:1 and
C36:2 in the cell wall fraction compared to the whole cells. The relative proportions of
unsaturated to saturated mycolic acids ranged between 39.9% AS019 and 48.6%) in the
cell wall. Growth in the presence of 4 mg/ml INH had httie impact on whole cell
mycolic acids when compared to LBG. This is consistent with results reported by Jang et
al (1997), who showed tiiat INH at 4mg/ml had little impact on whole ceU mycohc acids
but at 8mg/ml the proportion of exttacellular mycolates increased. However, analysis of
the cell wall fractions showed a significant decrease in the proportion of unsaturated
mycolic acids relative to these in cells grown in LBG (Table 3.5), similar to the ttends
seen for cell wall fractions following growth in LBG-G.
146

3.4.4 LBG containing 2% glycine and 4 mg/ml INH.
The cumulative effects of glycine plus INH were also evaluated, where strains AS019
and the mutants (MLB 133 and MLB 194) were grown in LBG cotaining 2% glycine plus
4 mg/ml INH. The results for mycolic acid analysis of whole cells and cell wall fractions
are shown in Table 3.8 for cultures harvested at early stationary phase. In whole cells,
the relative proportions of unsaturated to saturated mycohc acids was 31.4 % in AS019
and 44.6 % in MLB 133 and for ceU fractions was 24.7 % in AS019, and 50%) in
MLB 133. Changes caused by the presence of this combination were similar to those seen
for LBG-G for whole cells and cell walls. The relative proportions of mycohc acids
found in the ceU walls and whole cells were similar for AS019 and MLB 194. However,
in the cell wall of MLB 133 the relative proportion of unsaturated to saturated mycolic
acids showed an increase after growth in LBG-INH-glycine compared to growth in LBG-
2% glycine: 49%) in LBG-INH-glycine and 30.5% after growth in LBG-2%) glycine.
Littie changes were observed for AS019, while MLB194 and MLB133 showed a small
decrease in the relative proportion of C32:o. The previously reported results by Jang
(1997) also showed that 4 mg/ml INH alone or in combination with glycine had little
further impact on the mycohc acids composition of the AS019 family of strains foe whole
cells. The most important impact was the increase in exttacellular mycolates.
147

Table 3.7 Mycolic acids composition of whole cell and cell walls fractions following
growth in LBG-INH (4 mg/ml).
strains
Whole cell
AS019
MLB 133
MLB 194
Cell Wall
AS019
MLB 133
MLB 194
032:0
52.8
46.3
48.5
50.1
40.1
47.1
C34:l
28.7
31.7
29.6
28.9
38.1
31.9
Mycolic acids^
0 34:0
10.6
10.1
11.1
11.8
8.8
9.8
C 36:2
4.8
8.1
6.7
5.6
9.6
7.2
0 36:1
2.3
3.6
3.8
3.5
3.4
3.8
yoofUMtoTM"
36.8
43.6
40.1
39.9
48.6
39.3
Proportion (%) of each mycolic acid found in whole cell or culture fluids. The
proportion of each mycolic acid was calculated as a % of the total in terms of
peak area detected.
The ratio of UM (unsattirated mycolic acids, C34:i, C36:2, C36:i) to TM (sum of
saturated and unsaturated mycolic acids) was determined by dividing the sum of
the unsaturated mycolic acids values by the sum of the total mycolic acids.
148

Table 3.8 Mycolic acids composition of whole ceU and cell waU of AS019 family of C.
glutamicum following growth in LBG containing 2% glycine and 4 mg/ml.
Strains
Whole cell
AS019
MLB 133
MLB 194
Cell wall
AS019
MLB 194
MLB 133
C32:0
57.6
44.3
43.4
60.0
38.9
40.3
C34:0
18.1
30.8
33.5
17.7
36.9
36.5
Mvcolic acids^
C34:l
11.6
11.0
6.4
15.3
9.6
8.8
C36:2
10.5
8.8
12.3
3.9
10.5
9.6
C36:l
2.8
5.1
3.6
2.1
4.4
3.4
% of UM to TM"
31.4
44.6
44.6
24.7
50.0
49.0
Proportion (%) of each mycolic acid found in whole cells and cell wall. The
proportion of each mycolic acid was calculated as a % of the total in terms of
peak area detected.
The ratio of UM (unsaturated mycolic acids, 034:1, 036:i and 036:2) to TM (sum of
saturated and unsaturated mycolic acids) was determined by dividing the sum of
the mycolic acids values by the sum of the total mycolic acids.
149

3.5 FATTY ACIDS COMPOSITION OF C. GLUTAMICUM
STRAINS FOLLOWING GROWTH IN DIFFERERENT MEDIA
The composition of fatty acids along with mycohc acids was analysed for whole cells and
cell wall fractions for different media (LBG, LBG containing 2% glycine, LBG
containing 4 mg/ml INH and LBG containing 2% glycine and 4 mg/ml of INH). The
procedure developed by Jang (1997) was used as described in section 2.4.2.3 and this
allowed comparison of the relative proportions of the fatty acids to mycolic acids from
the peak areas obtained in the same GC profile.
Fatty acids were fractionated using a 25m non-polar BPX5 column. Hexadecanoic acid
(Ci6:o) and octadecanoic acids (Oi8:i) were the major fatty acids found in all of the sttains
tested when the samples were obtained from whole cells. These results were in
agreement with data reported by Jang (1997). Myristeric acid (Oi4:o), steric acid (Ci8:o),
pentadecanoic acids, palmitoleic acids (Oi6:i) and some other fatty acids were also
detected in very small amounts, so that these fatty acids were not taken into consideration
when calculating relative proportions of lipids. The identity of the fatty acids were
confirmed by co-injecting purified FAMEs plus external standards (FAMEs, Sigma).
The GC profiles are shown in Fig 3.6.
Several repeat analysis were performed to check the reproducibility of the methods used
(Table 3.9). Cells of AS019 were cultivated in LBG and harvested in early stationary
phase. Dried samples of whole cells and cell wall fractions were prepared, then 2 mg/ml
of internal standard was added, and hpids exttacted as described in sections (2.4.2.3).
FAMEs and MAMEs were analysed by GC. The quantitative fatty acid profile obtained
from tiie cell walls of four samples were the same in terms of relative percentages of fatty
acids detected. However, there was a significant variation between experiments in terms
of the ratio between FAMEs to total lipids (FAMEs plus MAMEs) detected. All
experiments were performed at least in duplicate and the average % of FAMEs for
AS019 across several experiments was similar to that prepared in Table 3.9.
150

Ei I
I
O
Urttt Xf t
9
TrfY 1 (T
,s s
o
-n rr -irrimir
O
Ovc
o
irmh /flrnw i¥ I wr—irrfi
o
o
o
ifnV
Q
TTTl m TTT
TIME
B
151

5 1 =1?
o
0"
\0
Mlrtri-rll-
o IS
o 00
o
-fr
P
C
o
rmT TliviEOviTNT 'm 11 irnf
o
Figure 3.6 GO analysis of FAMEs on a 25-m non-polar BPX column. (A) Cellular
FAMEs and MAMEs from C. glutamicum AS019 after growth in LBG. (B) Standard
FAMEs mixture-Sigma 189-17. (0) 189-17 plus FAMEs and MAMEs from sttain
AS019
152
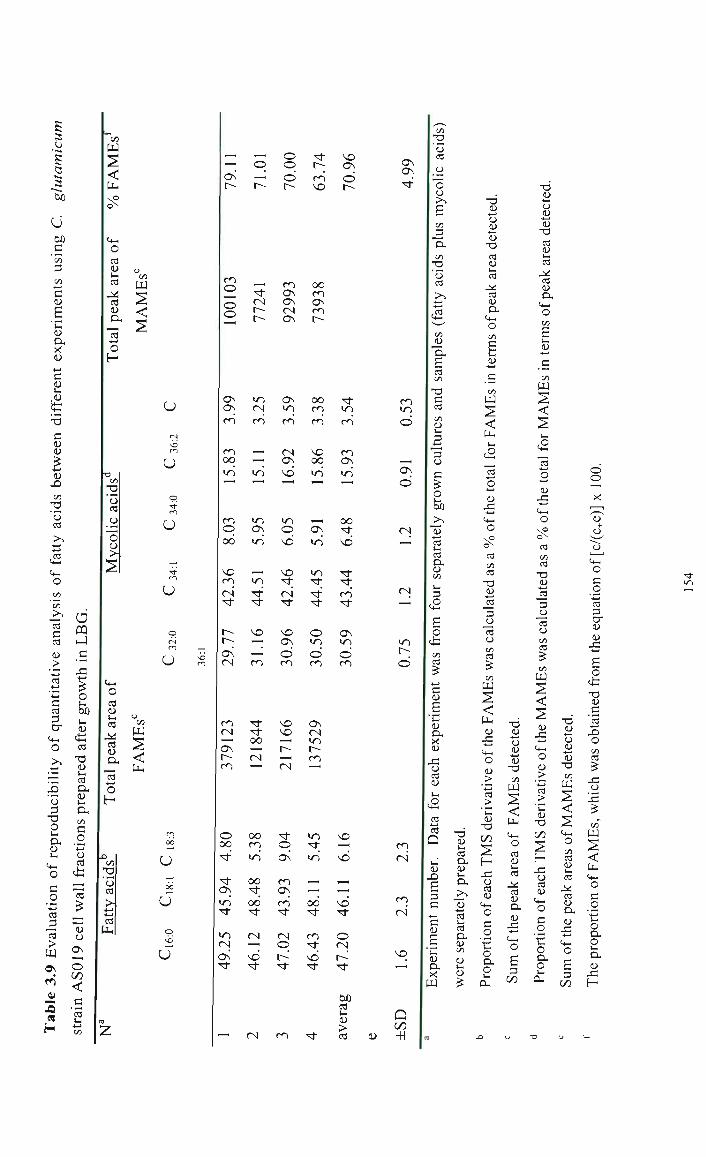
s
S 3
"So
U M
' i / )
3
c (U
a X 0)
•*.J
C
(U X) c/3
'o CO
>^
O
c«
CO
CO 3 cr
o
3 "O 2 a
o c o
'•C CO
_3
> w
j j Z h
O
o
CO
CO
a CO
G O
. ^H +.» o CO
cfc
<
o CO
<u ; - i CO
CO
"^ + j
O H
a> c/a
w :§ <
• o
"5 CO
o
o >\
o CO
CO
CO
"cO
o
CO
ON
O
<
"?3
'o CO
>1 ti CO
CO
w
u
u
o
u
u
r^ —
U
u 00
u
u
— .^ o —. q o ON ^ ' O r- r~- r-
ON
o
o o o
,— ^ ( N
r t^
m ON O N ( N O N
0 0 m O N r«-) r
O N ON
rn
oo i n
q od
r-r-ON ( N
rn
^
i n
m ON i n
i n
vo
r<
ON i n
rn
ON
vd
i n
o vd
O N
O
0 0
en
oo i n
O N
i n
i n
o i n
o
i n
rn
m ON i n
oo
^
O N i n
o
m ( N » — < ON
r-~ m
^ 's i -
oo . - H
( N
-^
^ vo ^ H
r ^^ CNI
ON ( N i n t^ m • - H
o oo T t
ON
i n
i n CN
ON
OO
i n
oo
od
( N
^ ^
r
q ON
m O N
rn
O
m
i n
i n
, od ' s ^
NO
^
^
NO
^ ^ ^
o
CO
> CO
ON ON
m in
(N
^
CO
O o
c« 3
t/3
CO
>-. .CO
CO en
c CO
(U
•a CO
a. Ul
CO
O H (U CO
U
(U
.C
w
<
"3 o
• . - »
o
CO
CO CO
-O 0)
3 _o lo o 1/3
CO
en
W <
o U
_> '.3
CO
_> 'H -O
o CO <U
O 3 O
••s
o O
W
cO
CO
a. (U
J 2 ^^ C4-I
O
s 3
CO
1 3
!> . ^ j
O
T3 CO ID Ul CO
.^ CO
C j - l
o
o <u >->
T3 CO
u CO
CO (U
a. o M
(U
oo
W
<
e. CO
. . .J
o (D
4 3 4-»
C4-I
o
CO
en CO
• 3 (U
_C0
3 u
cal
ME
s w
as
< 2 J 3
O u
vativ
'C
0 0
s H J 3 o CO
O
C o
••s o o. o u
P H
• 3 0 )
CJ 0 )
• 3
ME
s
< S <+H O W5 CO
U l CO
.i^ CO
(U 4= -4-»
<+-! O
E 3
0 0
o o X
',—.,' +
o ~o
o 3
_o "-4—»
CO 3 O "
d fr
om t
he
u c
'5 X5 O
CO
^
hich
>. izT
m S < [ i . C 4 - 1
0
c 0
'•£ 0
0 u CI. 1 )
- C
H

Table 3.10 and 3.11 showed the relative proportion of fatty acids of three sttains of C.
glutamicum (AS019, MLB 133, MLB 194) after growth in three different media. All three
sttains showed approximately the same proportions of Ci6:o and Ci8:i when cells were
grown in LBG. The relative percentage of total FAMEs to total esters (FAMEs plus
MAMEs) were 67.92 % for AS019, 69.78 % for MLB133 and 69.44%o for MLB194, for
cells grown in LBG.
In the presence of glycine or INH, the relative percentage of the fatty acids of AS019
declined very shghtly from 67.92 % in LBG to 66.83% in LBG-2% glycine and 61.37%
in LBG-4 mg/ml INH in whole cells. Similar decreases in the relative proportion of
cellular fatty acids were also observed in MLB 133 and MLB 194 (Table 3.9 and 3.10).
This data is in agreement with the results previously reported by Jang (1997). The major
cell wall fatty acids were Oi6:o and Oi8:i but the fatty acid Oi8;3 and some other fatty acids
were also detected in small amounts in the cell wall in addition to these two fatty acids.
The relative proportions of total fatty acids in the cell wall of the three sttains grown in
LBG were 71.29 % for AS019, 68.39 % for MLB 133 and 10.91% for MLB 194. In the
presence of 2% glycine or 4 mg/ml INH, the relative proportion of the fatty acids
decreased, as seen for whole cells. The fatty acid Ci8:3 was too low to detect in whole
cells, because in ceU wall the Ci8:3 is a minor fatty acid. This fatty acid had only been
seen previously in exttacellular fluids of C. glutamicum (Jang, 1997). These results
suggest that the total fatty acids in the cell wall fractions decline following growth in
LBG-G or LBG-I so that the Oi8;3 is detected as a relatively major component. This is
consistent with the increased release of all lipids into the culture fluids during growth in
glycine and INH (Jang, 1997).
156

CO
••3
B 3 (U Ul
•-3 3
s
u t^-l O en 3
'cO Ul +-» tn O
«4- l
O CO
T3
CO
C t - l
O
en
lo
_>
3 a o
9i
9
H
<
U
(N m r-~ oo n - NO ON oo en r~- r - - ^ I> NO — ON rn NO NO NO NO NO NO m
O N r - CN ON - ^ ON CN i n NO r n NO CN -^ -^ ON od od — r-^ NO i n NO NO NO
NO m m 00 —; ^ r- Tj; NO in ON od od NO
r - NO 0 0 ON
en
'o CO
> CO
o •
ON
rn i n
o CN i n
o i n rn i n
o
i n
i n
rn i n
CN
m
o CN
m NO
o o o i n
O N o
od i n
C?N
_3 '3 00
o i n
NO
CN OO
0 0
m NO
O N
i n
i n
NO
CN
NO
NO
NO
o
od
i n CN
O
en r— —' i n NO m rn CN rn -si- ^ r f
0 0 6 0 6 6 m D3 PQ CQ OQ m H J HJ uJ uJ uJ hJ
O HH O - -
0 6 6 0 6 6 03 PQ CQ CQ CQ OQ J J u-1 J HJ J
^ ON C3N ON
® o o o 00 on 00 <<<
JS
m m en m m m
hJ uJ H J
S3 m m m « _ m m m > ON ON ON .-^ - H ^ -' ir :r :r CQ CQ CQ S o o o n 1 LJ 13 oci 00 00 a d i U < < < S S S
en C 0
arat
i
a. U l
a. CO
3 0 CO
CJ
;^ 0 0
B TJ 3 CO
> ^—» .u»
" ' JJ
B CO eA3
TS 3 CO
en (U U l
B 3 0
3 ^ 0
feb
ely
arat
a. (U en 0
^
rom
CO CO
^
rim
ent
CI. X <L)
each
fo
r
CO +-» CO
Q
•d 0
CJ
4—> (U
TD
CO
U l CO
.^ CO
D, c ^ 0 CO
g 4-»
_s ~~ CO
•4—»
0
OJ 4 3
0
0 ^
CO en CO
-a <u 4-»
.2 3 CJ
"cO 0 cm CO
CO
2 < fe (L>
4 3
=4-1
0 OJ
'4-* CO >
. 1—1
Ul
<u TS
0 0
4= 0 CO (U
0 3 0
0 O H
0 P H
0 0
"" X
+ CJ
— ~CJ
C+H
0
C 0
4 - t
CO 3 CT (U
e 0
03
3 '3 4 - »
. 0 0 en CO
43 0 S ^ .> en
<
0 3 0
0
0 Ul
0-OJ 4 =
H
0 0 >n .^

U l
« CO
'^ ON va-M
m J S 3
• 1-^
CO
t tn
5 3 U
• " * » 5 •c s "Sb
u C4-4
0 1
CO
^ ^ (U 0
"O 3 CO
en
(U 0
u 0
43 ^
f + H
0
3 0
• .™ i •*->
. . . H CO
0 D.
B 0 CJ
tn 73 0 CO
>. tl CO « < 4 -
0 en
en >,
"cO 3 CO
u >
4 0 CO
^4-t 4 .^
CO 3
a F N
• r
ble
n H
CO
TJ (U
a 4.J
3 QJ U l
c2i ^ (U u
C • l - H
1 0
feb
. 0
t /3
w 2 < PtH
0 ^
e 3 • 1-^
TJ (U
2
3 CO U l
4—»
00
u
u
CO
73 CJ CO
>. CO
PtH
U
Tf ON Tf - -ON CN NO NO
O m o\ m
ON
o 00
rn m
i n ^ i n
CN
^ CN
m CN
Os 00 ON
rn in
rj- m rn (N r~ od m m
1 ^ NO 00 O —^ NO in
in NO i n
O CN CN NO r-^ ON m • ^
O HH
0 CQ hJ
0 CQ H J
0 CQ J
0 CQ hJ
0 CQ hJ
(U 0
^ • ^
ON ^ ON
• ^
ON
^ CO
^ ^ (U
^ ON
'^ ON
73 U
4™>
o 4->
(U 7 3
CO (U Ul CO
4>i CO (U a.
C 4 - 1 o CO
<u
CO 4 - >
0 4 - »
(U 43 4—»
( 4 - 1
0
0 ^
CO CO
CO
73 (U
4—> CO
3 0
3 CJ CO CO
CO
w 2 < P H
<u 43 4—»
^4-1
0
.> . ^ H
CO > 'C (U
7 3
I TM
S:
4=; 0 CO (U
^ 0
3 0
•-£ 0
rop
PH
0 0
'—' X
' ^ + 0
•^ ~CJ
C4-1
0 3 0
4—»
CO 3 cr 0)
S 0
. < H
cC 73 1) 3
'3 4—>
X ) 0 CO
CO
43 0
S ^ ^ C/3
FA
ME
<+H
0 3 0
t 0 O H 0 Ul C I .
4 3
H
ON in
3.6 MYCOLIC ACID COMPOSITION OF CSPl DISTRUPTED
MUTANTS OF C GLUTAMICUM
The results of mycohc acids profiles in whole ceUs for the cspl disrupted mutant strain of
C. glutamicum, which lacks the S-layer, after growth in four different media are
presented in Table 3.12. The mycohc acids composition was similar to the AS019 family
in terms of qualitative profiles; however, quantitative profiles differ significantly,
indicating a difference in the cell surface structure of this mutant relative to AS019.
Among the five major types of mycohc acids found in the whole cells of this mutant, the
mycohc acid C32:o and 034:1 made up to 75.11 to 85.11% of the total composition.
However, the relative proportion of 032:0 (35.20%) was lower than the AS019 family
while the proportion of 034:1 and 036:2 was shghtly higher (41.21% and 12.85%). Similar
mycotic acids profiles were observed by Jang (1997) for restriction deficient mutants of
C. glutamicum RM3 and RM4 after growth in LBG.
After growth in glycine there was an increase in the proportion of 032:0 with parallel
decreased in the relative proportion of 034:1 and 036:2 in the cspl mutants. These results
showed that the cspl disrupted mutant has a mycolic acid profile similar to those
previously reported for sttains RM3 and RM4 by Jang (1997), where he observed lower
proportions of 034:1 and 036:2 after growth in 2% glycine. Following growth in LBG plus
glycine, there was a relative increase in the percentage of 032:0 (from 35.20 to 44.56%)
with the parallel decrease in the relative proportion of unsaturated mycolic acids (34.99
and 9.15%). The addition of INH (3 mg/ml) had similar impacts on the relative
proportion of saturated and unsaturated mycolic acids: % of unsaturated mycolic acid
decreased in LBG-I and LBG-GI. The cumulative effect of 2% glycine and INH was also
studied. The results showed impacts on the relative proportions of mycohc acids when
compared with LBG and LBG plus 2% glycine. There was a further increase in the
relative proportion of 032:0 (47.17%), with decreases in the relative proportion of
unsaturated mycolic acids (35.64%) 034:1 and 5.8l%o 036:2)- The specific growth rate of
160

en W
< UH
w
P H
5
bo
u (4-1
o 3 CO
4->
3 S
7 3
en '-B ~- Cli
0) 4 3 4-»
<4-l
O
en
13 CJ
3 4 3
(4-1
o 3 O
en O Cli
B o o
o 3 o
7 3 3 CO
o CO
CO
«N 1 ^
0)
IQ
H
CO
CO P H
en
3 'o CO
o 3 o >
7 3 0)
u
u
U
U
o
u _ - u
u
u
ON r-; od NO
ON 0C3 NO r~-
m '^ CN
<N ^ d ^
m — C3N m
NO Tf CN
r-
m ON
od
NO CN
r- m
oo in in NO
(N ON
od r-
m oo NO
in <N
r- m
in — ON NO
r--- H
^ OO
Tl-'^ in
r-NO r ^
sa%
oft
he
CO 73
was
cal
cula
rs o
colic
a(
>. B
.—( i n
r-^ i n
m i n
m
NO
CN
CN
CN
o CN i n
m
o OQ
NO i n i n TT
m i n
m m
m 0 0
m
NO i n
O N
i n
NO
m O N
ON
rn
NO
m
CN NO
CN
o o PQ PQ
NO OO
NO
m
m
CN
'xl-
oo
CN
m ON
OO CN ON
ON ON
NO ON
od
m oo r-
m
oo in
ON in od
NO
«n m
O « O o CQ
3 o
••£ o o-o Ul Cl . (U
4 3
H
(U CJ
3 4 3
7 3 3 3
CJ CO
o 3 o
43 O CO <u
^^ O
3 O
t: O G H O Ul
04
73 (U
4.J CJ (U
4—» <D
73 CO <U Ul CO
CO (U d l
C4-I O
<u
CO
CO
3 CO
_o 3 o
73 <U
•t—t CO Ul
3 CO c« 3 3
73 3 CO
7 3 !U
4—» CO Ul
3 CO e/3
3 CO
H o
3 O CO CJ
u
U en~
3. 3 CO
O
•
3 o S
7 3
<u to Ul
a CO CO 3 3
t4 - l
o
CO Ul (U
43 B H
U U
•c U U
W PJ
.3 o

these mutants was significantiy affected by the combination of INH plus glycine at tiie
concenttations used (3mg/nil).
Table 3.12 also showed the fatty acid composition for cspl mutants along with mycotic
acids. The results showed that, like AS019 fanuly, significant changes were observed in
the relative percentage of fatty acids to total esters (fatty acids plus mycolic acids) when
growth was in the presence of glycine or glycine plus INH. In the presence of glycine or
INH, or the combination of the two, the relative percentage of fatty acids also changed.
3.7 DISCUSSION
3.7.1 Drug sensitivity analysis
It is difficult to find rehable data in the literature concerning MICs, because experimental
conditions are so different so that it may be erroneous to compare published values. INH
inhibits mycolic acid synthesis in mycobacteria and nocardia at concentrations of <50
pg/ml (Tomiyasu and Yano, 1984: Winder and Colhns 1970; Quemard et al, 1995b).
Tables 3.1 and 3.2 described the MICs in detail for different strains of C. glutamicum.
The presented work showed that corynebacteria is less sensitive to INH than
Mycobacterium and nocardia species. However, there are distinct differences in INH
MICs between the corynebacterial species used, where C. glutamicum sttains AS019, B.
flavum and B. lactofermentum exhibited different levels of MICs. MICs were defined as
lowest concenttation of drug required to produce 85% end point. AS019 and BF4 were
relatively more resistant to INH (MICs 11 and 10 mg/ml) and growth was completely
inhibited at tiie concenttations of 16 mg/ml and 17 mg/ml. In contrast, BLl was more
sensitive and complete inhibition of growth occurred at lower concentrations of INH
(MICs 5-6 mg/ml) indicating different levels of drug resistance in this important group of
corynebacteria. It has been argued that B. lactofermentum should be re-classified as C.
glutamicum (Abe et al, 1967; Liebel et al, 1991) but their different sensitivity to INH
indicates physiological differences which may argued against this. Similar results were
observed by Jang (1997) when he noted the effect of INH and glycine on specific growth
rates. For glycine medium, BF4 was less inhibited than AS019 and BLl and when
162

glycine was replaced by INH, AS019 was found to be the least sensitive of the sttains
tested. However, our method was different from that used by Jang (1997), who observed
the effect of INH added directiy into broth cultures at different stages of growth.
However, the ttends in results were quite similar.
The two mutants MLB 133 and MLB 194 exhibited greater sensitivity towards INH
relative to the parent type sttain AS019. MIC values for MLB 194 and MLB 133 were 6
and 8 mg/ml, where the dechne in growth started and 100% inhibition was observed at a
concentration of 14 and 13 mg/ml of INH. The present study also showed that at
concenttations of 6, and 8 mg/ml INH, the inocula prepared from dilutions of 10"\ 10" ,
10' (AS019), 10'\ 10' (MLB133 and MLB194) survived and as the concenttation of tiie
drug increased only "heavy" inocula survived, indicating the impact of inoculum size on
determining MICs of corynebacteria.
The sensitivity of a cspl mutant strain of C. glutamicum, in which the cspl gene
responsible for S-layer formation has been inactivated, and restriction deficient sttain
RM4, was also determined. The results showed that, hke BLl, RM4 was much more
sensitive to INH. Growth started declining at 3 mg/ml and was completely inhibited at
10 mg/ml of INH. Whereas cspl disrupted mutants behaved similar to AS019 (MICs 10
mg/ml). However, in the later experiment when INH was used at 4 mg/ml in
combination with glycine the growth was extremely slow so the concentration of INH
was reduced to 2 mg/ml. This suggests that this sttain is more sensitive to the combined
inhibitory effect of glycine and INH relative to AS019.
ETH, a-ethylthioisonicotinamide, exhibits sttong bacteriostatic properties against some
mycobacteria and is rather more active against INH-resistant sttains (Rist 1960).
Sttucturally it is sttikingly analogous to INH and a similar mode of action has been
proposed for the two drugs (Winder 1982). In this study, MICs of ETH were determined
for different corynebacterial species. C. glutamicum was more susceptible to ETH
compared to INH. In conttast to data for INH, the differential sensitivity between strains
seen when using INH could not be detected for ETH, with the exception that BLl was
most sensitive. No growth was seen beyond 6 mg/ml in almost all of the sttains tested,
163

confinning that ETH was more effective than INH in corynebacteria, which is similar to
the results reported for mycobacteria (Rist, 1960).
3.7.2 Lipids composition of the cell wall of C. glutamicum
The cell walls of Corynebacterium, Mycobacterium and Nocardia have a common
constiTiction consisting of mycolic acid, arabinoglactan and peptidoglycan (Lederer,
1971; Michel and Bordet, 1976; Barksdale and Kim 1977). Mycohc acid composition and
the effect of agents like glycine or INH on cellular mycolic acids have been studied in
detail (Colhns et al, 1982, Colhns et al, 1982b, Pierotti, 1987; Jang, 1997). In tius thesis
the comparative analysis of lipid composition (both mycohc acids and fatty acids) of cell
wall plus whole cells has been presented to provide a better understanding about the
anangement of lipids on the cell surface. The cellular mycolic acid profiles of the sttains
included in the present study are in full agreement with the previously reported results
(CoUins et al, 1982, Collins et al, 1982b, Pierotti, 1987; Jang, 1997). Table 3.18
summarises results for the AS019 series of sttains to allow comparison.
These results suggested that in LBG-grown cells, the cell wall was richer in unsaturated
mycolic acids compared with the whole cells, indicating the different nature of the
cellular fractions used for mycolic acid analysis. The method used for the preparation of
the cell wall fractions included several washing steps that solubilised the cytoplasmic
membrane and also washed off the free and loosely bound mycolic acids. The difference
in the mycolic acid proportions of the cell wall fraction and whole ceUs further support
the previously reported Pierotti (1987) observation that approximately 45 to 48 % of the
C. glutamicum mycolic acids were solvent-exttactable.
The mutants of C. glutamicum examined here, MLB 133 and MLB 194, had similar
qualitative profiles to the parent type strain AS019, but differed from this sttain in that
they had higher proportions of 034:1 and 036:2- Similarly, in the cell wall fraction tiie
relative proportions of O34:] and 036:2 was further increased and a decrease in the
164

7 3
CO
B
rent
£ C4-I
3
s <L>
3.
sup
O OQ J
3
a 3
O feb e/3
3 3 b en s a CJ
C4-1 o
0)
o <u
3 43 73 3 CO
CO
<4- l
O
3 O en
•c CO
o u
h
o m
b" 3 o
"ob
CN
7 3 U 4-» 3
bo u
o CO
o o
a O H 3 en
o OQ
O t a
OQ
en 3 O
> (U u
-O
<
3 m
C4H r -en
7 3 m
m
m
e -
.3
X) CO
S
7 3 u 3
X ) O
(U u U
CO 4-» CO
Q
S
e 7 3
3
CN
43
7 3
NO ..Si O H O H 3 en
o CQ
o 6 OQ
E
4 3 o o
o I
a
r t B
19
hJ
S
0 OQ
0 6 oa J
o CQ
O CQ
O I
O CQ
a CQ
o 43
-rf v) m r-r n r n "* . (N " ^ TT • ^ r n NO — m • ^
i n c» T f
NO ON <N
. — 1 . — 1
^ "^ °° CD — NO r n • *
O C3N m ex) _: d NO t ' t r^ i n CN —' m m CNI
00 NO CN ^ - ^ - . r~ r n c^ i n m NO i n m m
m 00 o O — m — 00 i n T t
m r^ — NO vo - ^ d - : " ^ r<^ • ^ m — 00 m - ^
NO • ^ m T f t - : "^^ —. ""^ od >n CN 00 r^ m m
vo — NO i n • * t-: od —I d °^ —! i n — —' — CN m
CN 00 o NO i n (N — •<a- (N m
• * NO CN r r i od rsi r n ° ° <= od i n (N —' CN <N CN
NO ON CN f ^ O >n r n q ^ NO CN ON m m (N
H O H
D (N — O (N — ^ (N TT TT NC NO O ro <^ m r*i f l - .
u u u u u ^
O; C3N vC O
od NO " ^ d " ^ d r<", m ON — • ^ <n
— ON m r-' _ • 00 (N 00 o< T f m ON t ^ m r n
ON NO q r n r--t--: in _; _: cs rsi T t <N — — - * - ^
NO CN ON r n
^ r-; - ^ t - : 0 0 .— 11^ > n
m m o d vo °° ' ^ ^ . o^ • ^ m 00 cjN m T t
— O NO d od °° "^ ' ^ od Tl" m 00 ON m - ^
ON -^ t ^ m m i n rr^ ° ° " ^ d m CN — CN (N m
od od ' ^ "^ ' d • * (N NO t ^ m Tj-
d —' " . r~ '~~: rri m • * NO — m NO
o r - r n d r- i n NO — — m CN CN
— ON 0 0 ON
d od - ; ^ -^ o; in (N — >n m m
m — 00 m i n NO r n "=! " ^ d i n (N —< m m m
( ^ ON
—! d •sf i n . — ^ o NO
o
C3
U U U U U U SN
p
o
c
o
73
D
OS CJ c/i
JO o
o o
6 CO
c o
3 o D. O u
n.
CO
(L> O
o
o
73 c
, 0
o to
o
4= O CO
u
c o
3 o a o
o CO
o o
to •t—'
o
3
. 0
to >
o
•T3
c
X3 73
c
o 73 c« CO
H o
o o
•a <a o u t 3 CO 7 3 >-
£! H to .: to <u
in NO

proportion of 032:0 was observed. In the AS019 family, the proportion of 032:0 was in
decreasing order of AS019, MLB 194, and MLB 133. Both Brevibacterium species BF4
and BLl showed similar patterns of mycolic acids both in quantitative and qualitative
compositions, in that these strains exhibited the presence of five mycolic acids in botii
whole cells and cell wall fractions.
After the addition of 2% glycine in growth media there was a small decline in the relative
proportion of cellular unsaturated mycohc acids for AS019, MLB 133, MLB 194.
However, in the cell wall fractions the proportion of unsaturated MAMEs (034:1, 036:2 and
C36:i) showed a significant decrease compared to growth in LBG, whereas 032:0 was
proportionately increased. This observation that the level of unsaturated mycolic acids
decUned dramatically in the presence of 2% glycine in the growth media further adds to
the observation that the cell wall becomes thinner after growth in 2% glycine (Jang,
1997).
Previous studies have shown that glycine interferes with several steps of peptidoglycan
synthesis (Hammes et al, 1973). The replacement of L-alanine residues (Strominger et
al, 1965) and the inhibition of L-alanine adding enzymes (Hishinuma et al, 1971) are
only two of several possible impacts and glycine may act as an analogue of either of L-
alanine or of D-alanine. Hammes et al. (1973) showed that in Corynebacterium sp., C.
callunae, L. pantarum and L. cellobiosus most of the D-alanine replaced by glycine
occurs in the 0-terminal position. Based on their studies, two mechanisms leading to a
more loosely cross-hnked peptidoglycan and morphological changes of the cells were
considered. Firstiy, the accumulation of glycine-containing precursors may lead to a
disruption of the normal balance between peptidoglycan synthesis and the conttol of
enzymatic hydrolysis during growth. Secondly, the modified glycine-containing
precursors may be incorporated. Since these are poor substtates in the ttanspeptidation
reaction, a high percentage of muropeptides remains uncross-linked.
166

The shidies of Jang (1997) also showed that exttacellular mycohc acid levels increased
following growth in glycine, suggesting that glycine exerted an effect in addition to those
previously reported, where this may be related to the attachment of mycolates to the cell
surface. Since the knowledge about the synthesis, assembly and transportation of
mycolic acids is limited in corynebacteria, the mechanism of how glycine promotes the
leakage of exttacellular mycolic acids cannot be explained with any certainty. It is
possible that glycine may interfere dfrectly with the ttanslocation of corynemycolic acids
from presumptive, yet unidentified carriers via ttansacylation to arabinose units in the
arabinogalactan. Alternatively, destabihsation of peptidoglycan cross-hnking by glycine
incorporation could impafr arabinogalactan linking to the altered backbone, leading to a
looser external structure which resulted in "leakage" of mycohc acids-arabinogalactan
structure into the culture fluids. Changes observed in the mycolic acid composition of
cell wall, however, suggest that glycine had impaired cross-linking and weakened the
peptidoglycan sttucture. Some of the mycolic acids in the cell wall are bound to the
arabinose residue of arabinogalactan by an ester hnkage in mycobacteria, while the nature
of linkage between arabinogalactan and peptidoglycan remains unknown in C.
glutamicum. A glycosidic hnkage between the arabinogalactan and peptidoglycan has
been demonsttated in the ceU wall of Mycobacterium (Kanetsuna and San Bias, 1970)
and also for the first time in the ceU waU of N. rubra AN-115 (Fujioka et al, 1985). The
nature of the linkage between peptidoglycan and arabinoglactan needs to be revealed to
allow a better understanding of the action of glycine in Corynebacterium, particularly in
relation to the attachment of mycolic acids.
The overall mycolic acid profile for the relative proportions of each mycolic acid in cells
and cell walls were quite similar for each sample tested indicating that a particular
mycolic acid is not being released into the culture fluid and hence affecting the ceUular
mycolic acids profile. Analysis of the whole cell MAMEs confnmed that sttains
MLB133 and MLB194 could be differentiated from AS019 foUowing growth in LBG-
glycine/INH, confirming their phenotype for later studies.
167

The mycohc acid profile of the strains tested showed httie change following growth in 4
mg/ml of INH, as there was little quantitative variation in the mycolic acids for both cells
and cell wall fractions. This is probably due to the relatively low concenttations of INH
in the growth medium, which was well below a lethal level. However, the two mutants
showed higher sensitivities towards the presence of INH into growth medium and there
was slight decrease in the proportion of saturated mycolic acids in whole cells and
unsaturated mycolic acids of cell wall as compare to growth in LBG. After growth in 4
mg/ml of INH there was decrease in the proportion of 034:1 and 036:2 in the cell wall of
mutants with paraUel increases in the proportion of 032:0 and 034:0. This study did not
include investigating the effect of increasing INH concenttation on the cell wall mycolic
acids, however, studies of Jang (1997) indicated that after the addition of 2% glycine or 8
mg/ml of INH, the level of exttacellular mycohc acids increased to 18-21% for the
mutants. He suggested that INH inhibited the synthesis of shorter chained mycolic acids
in all sttains and also further impaired covalent binding of mycolates to the cell surface in
the mutants.
The effect of different growth media on the mycolic acid compositions of the cspl
dismpted mutant of C. glutamicum which lacks tiie S-layer are shown in Table 3.12. The
results showed a decrease proportion of 032:0 and an increase proportion of 034:1 and 036:2
after growth in LBG. Results previously reported by Jang (1997) showed that a similar
profile was observed for two restriction-deficient mutants strains RM3 and RM4, where
C32:o was less than the unsaturated mycohc acids. His studies further showed that
following growth in LBG plus 2% glycine there was a decrease in the proportion of 034:1
and C36:2 with parallel increase in the proportion of 032:0- Similar results were also
observed for the cspl mutant after growth in LBG-G, where the relative proportion of
C32:o increased with a parallel decrease in the proportion of 034:1 and 036:2- Growth in the
combination of INH and glycine also had similar impacts on lipids. It has been reported
(Bardou et al, 1996) that the important decrease in cell wall mycolic acid content of
mycobacteria selectively induces an overproduction of secreted proteins about which
littie is known. Whetiier the action of INH also leads to the overproduction of
168

exttacellular proteins in corynebacteria needs to be investigated. These sttidies should
include the S-layer proteins and their fate foUowing growth in INH and glycine.
In the present study, the fatty acid composition of cells and cell walls was also studied.
For all sttains tested, palmitic acid (Oi6:o) and oleic acid (Oi8:i) were the major fatty acids
in both cells and cell walls. There was a trend towards shght decreases in FAMEs after
growth in LBG-G, LBG-I implying that including glycine and INH in the growth medium
not only affected mycolic acids but also impacted on the fatty acids composition. The
main effect of the addition of the cell wall modifiers was to decrease the level of FAMEs
as compared to MAMEs. Similar ttends were seen in cell wall fractions where the
proportion of FAMEs decreased after growth in glycine and INH medium, implying that
INH affects FAMEs of the cell wall. The previously reported results of Jang (1997)
showed the presence of extracellular fatty acids in culture fluids. He suggested that fatty
acids were probably located at the cell surface in unbound form and leaked out during
growth as the integrity of the cell wall structure was affected by glycine and INH. In the
present study, since the starting material was cell wall fractions it can said that INH
caused changes in the relative proportion of fatty acids at the cell surface or membrane
level. This study further shows that fatty acids are present in a bound form in the cell
wall fraction, as they were not extracted during the procedures used to prepare cell wall
fractions.
3.7.3 Models for the cell wall structure of C. glutamicum
In mycobacteria, it has been shown that some changes in the cell envelope occur before
the bacteriostatic effect of INH, which appears one generation after the addition of tiie
drug (Takayama et al, 1974). These changes include the increase in respiration
compatible with the increase in the permeability of the cell envelope (Schaefer et al,
I960), tiie fragihty of the cell wall and increased loss of the cellular material into the
medium. Similar studies in C. glutamicum revealed that addition of 2% glycine and INH
has an effect on tiie morphology of corynebacteria. These changes included reduction in
169

size of cell (after growth in INH) budding and branching following growth in LBG plus
2% glycine (Best and Britz, 1986; Jang, 1997) and increased loss of cellular hpids into
the medium. The present study further adds to the observation that INH and glycine
affect the cell wall by altering the lipid composition of the cell wall. In mycobacterial
cell walls, mycolic acids are quantitatively the major component (ca. 40%); inhibition of
their formation may explain, on one hand, the narrow specificity of INH for mycobacteria
and, on the other hand, death of the cells as a consequence of cell wall structure damage.
This sttidy and previously reported results of Jang (1997) support the idea that INH
inhibited production of the shorter chained lipids and, if fatty acids are used as a substrate
for mycolic acid synthesis, the presence of glycine or INH in the medium inhibit not only
MA synthesis but also fatty acid synthesis. Studies in mycobacteria also showed that the
target of INH is shorter chained length lipids (O16-O22 carbon containing molecules),
noting that mycobacteria utihze these to make complex mycohc acid (Banerjee et al,
1994).
Models for the ceU surface sttuctures of mycobacteria are described in detail in Chapter 1
(section 1.6.4) and these include the presence of bound plus free mycohc acids and fatty
acids. According to Pierotti's work (1987), there are at least two different mycolic acids:
exttactable (free mycolic acids, approximately 45-48%) of total mycohc acids) and
covalently bound mycohc acids.
If the physical organisation of tiie hpids in the cell wall of C. glutamicum is similar to
that of proposed model system in mycobacteria, then the cell wall structure of C.
glutamicum is basically a highly asymmetric lipid bilayer. In this bilayer model the
bound lipids must form the inner leaflet of cell wall as they are covalently bound mycohc
acid to the arabinoglactan which in turn are cross-linked (presumably by ester hnkage) to
die underlying peptidoglycan. The free and loosely bound lipids will serve as a good
candidate for tiie outer leaflet. This study showed the presence of fatty acids (Cu-Oig) in
bound form attach to the cell wall, whereas the O16 and Oi8:i were the dominant fatty
acids and the proportion of FAMEs (as calculated by the equation [(c/c+e) x 100]) were
more tiian the MAMEs. Therefore it can be assumed that there are more than enough of
170

these to intercalate with the mycolic acids in the cell wall. The cell wall presumably
contains proteins and peptides, and an ion channel (proposed model of cell wall structure
of C. glutamicum is presented in Fig 3.6).
Since the results showed that ceU wall was richer in unsaturated mycolic acids (034:i,
C36:2, C36:i) h appcars that these lipids are forming part of the inner leaflet and, if this
model is true, it can explain the low permeability of C. glutamicum. In the proposed
model, the inner leaflet consisted of unsaturated MAs they will form the effective
permeability barrier by producing lipid environments of exceptionally low fluidity as (i)
the arms of mycohc acid residues are quite long (18 carbons) and (ii) they contain few
double bonds (1 to 2). Nikaido et al. (1994) in the proposed model for the mycobacterial
cell wall explained that the inner leaflet containing mycolic acids was expected to
produce a very effective barrier for permeation.
Liu et al. (1995) also reported similar findings about the fluidity of lipids in the cell wall
of M chelonae, which was low in general but higher in the outer part, and was accessible
by spin-labelled probes. Their proposed model consisted of a layer of close-packed
mycolic acids with a thermal transition temperature to fluidity well above the growth
temperature of the organism, intercalated with triglycerides. However, experimental
support such as x-ray chrystallographic studies and spin-labelled probes analysis are
needed to prove the validity of this model.
Puech et al, 2001 analysed several corynebacterial species and compared their cell
envelope constituents before drawing a model, this model has been described in detail in
chapter 1 (section 1.5.2). According to their model the corynebacterial ceU envelopes
consist of (i) an outer layer composed of polysaccharides, proteins, which include the
mycoloyltranferase PS land lipids; (ii) a cell wall glycan core of peptidoglycan-
arabinogalactan which may contain other sugar residues and was usually esterified by
corynomycolic acids; and (iii) a typical plasma membrane bilayer. With freezed-etch
electton microscopy they showed that most corynomycolate-containing strains have a
main fracttire plane in their wall and contained low-molecular mass porins. The fracture
171

plane seen within the plasma membrane of those sttains was devoid of both
corynomycolate and pore-forming protein. They found that most strains the amount of
cell wall-linked corynomycolates was not sufficient to cover the bacterial surface; and
that the occurrence of a cell wall fracture plane correlated with the amount of non-
covalently bound lipids of the strains. They proposed that these lipids spontaneously
form liposomes, indicating their participation in bilayer structure. In conclusion, they
suggested that the cell wall permeability barrier in corynebacteria involved both
covalently linked corynomycolates and non-covalently bound lipids of their cell wall.
The model proposed in this study is based only on the mycolic acids composition of
whole cell, cell wall culture fluid extract (free mycolic acids) and involved few
corynebacterial species and cell surface mutants. Thus this model is similar to that
proposed by Puech et.al (2001). It involved a study of both covalently bound lipids and
unbound lipids. The bound lipids were proposed to be part of inner leaflet of bilayer cell
wall since the (i) permeability of envelope is low towards inner side of the membrane and
(ii) the proportion of MAMEs were less than FAMEs. The free and loosely bound lipids
will form the outer leaflet.
172

Model of C glutamicum cell M all
Proposed Model of CW of C. glutamicum
Figure 3.7 Proposed model of the structure of C. glutamicum cell wall, redrawn from
Jang. (1997) with permission, showing the proposed arrangement of mycohc acids and
associated lipids forming the outer permeability barrier of the mycobacterial envelope
and indicating the assumed position of the porins and S-layer-hke proteins. A similar
arrangement presumably occurs in all mycobacterial walls, though the mycohc acid types
and the range of other lipids involved would be different.
173

Chapter 4
Cloning, sequencing and sequence analysis of an inhA gene homologue
in C. glutamicum wild type strain AS019
4.1 INTRODUCTION
The results reported in the previous chapter showed that C. glutamicum is naturaUy more
resistant to INH and ETH (MICs of 12-16 mg mT and 4-8 mg ml"' respectively) on plates
relative to reported sensitivity of mycobacterial species. Previous studies have indicated
that growth of strain AS019, a rifampicin-resistant derivative of C. glutamicum ATCC
13059, in either glycine or INH (high concenttations) or combinations of these increased
electtoporation frequencies significantly (Haynes and Britz, 1989, 1990).
Previous results had further shown that significant differences in cell growth rate,
ttansformation efficiency and mycolic acid composition appeared when the concenttation
of INH was increased in the growth medium, particularly when this was in the presence
of glycine (Jang et al, 1997). At high concenttations of INH (8 mg ml''), all of the C.
glutamicum strains in the AS019 series tested had decreased relative proportions of 032:0
and C34:o with paralleled increased proportions of 034:1 and 036:2- This suggested that
INH inhibited synthesis of shorter chained saturated mycolic acids. The relative
proportion of total fatty acids to total lipids (fatty acids plus mycolic acids) following
growth in LBG was higher than following growth in LBG plus 8mg ml"' INH, as INH
decreased the ratio of fatty acids significantly. This indicated that INH might inhibit
some stage of fatty acid synthesis in addition to the mycolic acid synthesis.
The mechanism of INH resistance and genetics of mycohc acid biosynthesis is not known
in corynebacteria. However, substantial biochemical evidence has suggested that both
INH and ETH block mycohc acid biosyntiiesis in closely related mycobacterial species.
The emerging literature over the last few years showed that one target site of INH in M.
tuberculosis, and several other mycobacterial species, was identified as the InhA protein,
174

the product of the inhA gene, which is a 2-trans enoyl acyl carrier protein involved in
fatty acid synthesis (Dessen et al, 1995). This enzyme preferentially reduces Ci6
derivatives, consistent with its involvement in mycohc acid biosynthesis (Quemard et al,
1995b). Since mycohc acids are the unique characteristic of corynebacteria and
mycobacteria, it was reasoned that the drug might have similar impacts on mycohc acid
biosynthesis in corynebacteria as seen in mycobacteria.
The work reported in this chapter was carried out with the following objectives:
• To determine whether there is an inhA gene equivalent in C. glutamicum sttain
AS019;
• If a inhA gene was found the second aim was to sequencing the inhA gene in C.
glutamicum and comparie this with the reported inhA gene sequences in
mycobacterial species.
4.2 CLONING OF THE inhA GENE IN C GLUTAMICUM STRAIN
AS019
4.2.1 Verification of the strains
The corynebacterial strains used in this study were recovered from glycerol stock solution
as described in section 2.2.3. The identity of all corynebacterial sttains were checked by
16S rRNA partial sequencing. The target sequences were amplified using PCR in C.
glutamicum sttain AS019, two mutants MLB 194, MLB 133 and related species B.
lactofermentum (BLl). Approximately 1,300 bp of consensus 16S rRNA gene was
amplified using two primers 63f and 1387r (Pharmacia; Marchesi et al, 1998) as
described in section 2.3.1.14.
The PCR products were sequenced dfrectly using the same primers, used for
amplification (63f and 1387r). The sequence analysis was performed on DNA samples
for all coryne sttains using the BLASTN programme of the WebANGIS and showed 99-
100% similarity with known 16S rRNA gene of the C. glutamicum. The 16S rRNA
175

sequencing data for corynebacterial strains and their BLASTN similarity results are
shown in appendix 4.
Based on partial 16S rRNA sequence information Southern blot analysis of genomic
DNA digest was performed to provide some information on the number of copies of the
gene and to compare the "ribotype" of the mutants relative to the parent. Southern
hybridisation was performed using P-labelled PCR amplified 16S rRNA gene probe
from C. glutamicum sttain AS019 against the genomic DNA digest of corynebacterial
strains with various enzymes. The results of Southern hybridisation are shown in
appendix 5 (Fig 41, 411, 411). The results showed common resttiction pattern of 16S
rRNA gene between parents and mutants. The Southern results indicate several bands
depending on the resttiction enzyme used.
4.2.1.1 Construction of the primers to amplify the inhA gene from C.
glutamicum strain AS019
On the basis of the published inhA gene sequence of M smegmatis (Banerjee et al,
1994), several sets of degenerate primers were designed to amplify the inhA gene in
corynebacteria. The inhA gene from AS019 was amplified as five overlapping fragments
which together cover the area from upstteam of the start codon to the stop codon, as
deduced from the known sequence of the mycobacterial inhA gene. AU primers were at
least 22 bases long to allow specific binding to the templates, with no self-
complementary regions and they had similar annealing temperatures (58-65°0). Table
4.1 provides the list of all the primers used for amplification and sequencing of the inhA
gene. All primers were used for PCR and sequencing.
176

Table 4.1 List of the primers used in the amphfication and sequencing of the inhA gene
from C. glutamicum and related species (B. lactofermentum and B. flavum). All the
primers were derived from the reported inhA gene sequence of M. smegmatis
(MSU02530) (Banerjee et al, 1994).
CGPl
CGP2
CGP3
CGP4
CGP5
CGP6
CGP8
INHl
INH2
SEQUENCE (5' 3')
ATC ATO ACC GAT TOG TOG ATO GOG T
CT T GGC GAO GOT OAT OCA GTT GT
OTO GAA TOT OGT TOO GGC AGGA
ACA GOA GTG OGO ACA OGG TOTT
ATG ACA GGC OTA OTO GAA GGC A
ATC OGG TOG GOO AGA GTC GAO A
OAT OCA GTT GTA GGC OGG OAT 0
COG GAO ACA CAA GAT TTC TOG OTO
ATO ACA ACA GOT GOG TOO TGG OGO
SIZE'
25
24
22
22
22
22
22
24
24
TMCcf
76
72
70
70
68
72
70
11
78
' Size=number of bases
' TM=melting temperature
177

4.2.2 Optimisation of PCR conditions and use of Soln Q
DNA from the genus Corynebacterium has very high G+C content (54%) and therefore
was a difficult template for PCR amphfication. In attempts to optimise the conditions for
amplification of the inhA gene, several kits were ttied: PCR products of expected size
were obtained using the QIAGEN Kit and Soln Q and AmphTaq DNA polymerase.
According to the suppliers, Soln Q is designed to change the melting behaviour of the
template DNA and can be used for those PCR systems which do not work under standard
conditions. In this work it was found that Soln Q was one of the essential requirements
for successful PCR. For maximum specificity and yield, temperature and cychng times
were optimised for each new primer pair. Table 4.2 shows the respective PCR profile for
each pair of primers and their anticipated products. Amplification of the inhA gene from
M. smegmatis was simple and was done using the published PCR profile (stepl 94°0 3
min; step 2 94°C Imin; step 3 71°0 Imin; step 4 72°0 Imin; step 2-4 35 cycles; step 5
72°C 5min) as well as the conditions used to amplify inhA fragments from C
glutamicum.
4.2.3 Sequencing of PCR fragments of the inhA gene of strain AS019
andM. smegmatis.
Figure 4.1 shows the PCR amplification products obtained from genomic DNA of C.
glutamicum sttain AS019 using the selected primers hsted in Table 4.1 and conditions in
Table 4.2. Figure 4.2 shows the PCR amplification products of the inhA gene from M.
smegmatis using the same sets of primers but using the PCR protocols mentioned in
Table 4.2 without the SolnQ in the reaction nuxture. The figures show:
(a) using primer sets INH1-0GP4, OGP5-OGP2 and OGP3-INH2 the fragments obtained
from both M. smegmatis and C. glutamicum DNA were the same for both species and
approximately the size expected for the primers used, however, additional minor bands
were also seen for AS019 in some experiments.
(b) when using primer set OGP3-OGP4, M. smegmatis produced a fragment measuring
approximately 255 bp which was longer than the expected size of 184 bp. However,
sequence read out of this fragment and the OGP3-INH2 amplified fragment using 0GP3
178

Table 4.2 Primer pairs used for the amplification of the inhA gene from C. glutamicum,
its mutant strains and related species (B. lactofermentum and B. flavum), thefr respective
PCR profile and expected product size.
PRIMER PAIRS
INH1-CGP4
(1-778)
CGP5-OGP2
(511-535) CGP1-CGP2
(82-535)
CGP5-CGP6
(39-272)
CGP3-OGP4
(594-779)
CGP3-INH2
(594-850)
PCRPROHLEFOR
PLASMID DNA
1.95"C/2 min
2-94°C/l min
3-68"C/lmin
4-72"C/lmin
step 2-4 35 cycles
5-72"C/5min
As above
As above
As above
l-95"C/2 min
2-94" C/1 min
3-55"C/l min
4-72" C/1 min
step 2-4 35 cycles
5-72"C/5 min
l-95"C/2 min
2-94"C/l min
3-70"C/3 min
step 2-3 35 cycles
4-72"C/5 min
PCR PROFILE FOR
GENOMIC DNA
l-95"C/4 min
2-94"C/l min
3-69"C/3 min
step 2-3 35 cycles
4-72°a7 min
^ s above
As above
As above
As above
l-95"C/4 min
2-94"C/l min
3-70"C/3 min
step 2-3 35 cycles
4-72"C/5 min
PRODUCT
SIZE
778 bp
494 bp
443 bp
234 bp
184 bp
256 bp
179

1 2 3 4 5 6
l,500bn
snnhp
500bp 'k'%/€^M. 255bp
200bp
Figure 4.1 PCR amplification of inhA gene from genomic DNA of C. glutamicum.
Lane 1, 100 bp DNA ladder (1,500, 1,200, 1,000, 900, 800, 700, 600, 500, 400, 300, 200
and lOObp); 2, inhA gene fragment (800 bp of INH1-0GP4 primers); 3, inhA gene
fragment (496 bp 0GP5 -0GP2 primers); Lane 4, inhA fragment (255 bp of OGP3-INH2
primers); Lane 5, inhA fragment (200 bp of OGP3-OGP4 primer pahs); Lane 6, inhA
fragment (250 bp of OGP5-OGP6 primers).
180

ISOObp
800bp 500bp
200bp
Figure 4.2 PCR amplification of the inhA gene from genomic DNA of M. smegmatis
mc 155. Lane 1, 100 bp DNA ladder (1,500, 1,000, 900, 800, 700, 600, 500, 400, 300,
200 and lOObp); Lane 2, inhA gene fragment (800bp from INH1-0GP4 primers); Lane 3,
inhA fragment (496 bp product of OGP5-OGP2); Lane 4, inhA fragment (255 bp of
CGP3-INH2 primers); Lane5, inhA fragment (200bp of OGP3-CGP4 primers).
181

(forward) primer was exactiy the same as the sequence obtained for OGP3-OGP4
products, as expected.
In this experiment M. smegmatis was used as a control therefore only four primer sets
were used for amplification of the inhA gene. For C. glutamicum, extra primer pairs (e.g
CGP5-CGP6, 0GP1-0GP2, OGP5-OGP4) were also used to get more overlapping
fragments to improve the accuracy of sequencing the entire gene.
4.2.4 Sequence analysis of the amplified products
PCR amplified fragments of the inhA gene from M. smegmatis and C. glutamicum sttain
AS019 obtained using tiie 0GP1-0GP2 and OGP3-OGP4 primer sets were sequenced
using the same primers. A sequence sinularity search based on the NCBI was performed
using the National Genomic Information Service (ANGIS) and BLASTN (nucleotide
sequence against nucleotide sequence database similarity search) programs. The
polypeptides deduced for the fragments amplified from AS019 were compared to all
known proteins in the database using the BLASTX (Altschul et al, 1990) and FASTA
(Pearson and Lipman, 1988) programs. Tables 4.3, 4.4 and 4.5 show BLASTN,
BLASTX and FASTA homology searches for these products. These data showed that the
highest similarity was with mycobacterial proteins and confirmed the presence of an inhA
gene homologue in C. glutamicum. Sequence assembly of this is reported in section 4.3.
4.2.5 Southern hybridisation and identification of the inhA gene in C.
glutamicum strain AS019
The PCR amphfied products of the OGP3-INH2 primer set from C. glutamicum AS019
were labelled using two different labelling systems: DIG labelled, using the DIG High
Prime labelling kit and radiolabelled, using adOTP and the High Prime labeUing kit. The
two probes were then used to hybridise the blots containing the genomic DNA of C.
glutamicum and M. smegmatis digested with various enzymes. Figures 4.3 and 4.4 show
the results of Southern hybridisation with non-radioactive and radioactive labelling
systems.
182

Table 4.3 BLASTN sequence analysis of PCR amphfied products of M. smegmatis
mc l55 and C. glutamicum using CGP3-OGP4 and 0GP1-0GP2 primers sets.
Sequence
M3P3'
MlPl'
AS019P1''
AS019P2^
AS019P3'
AS019P4'
% homology
M. smegmatis
inhA gene
91
96
98
98
98
94
M. tuberculosis
M. bovis
inhA gene
79
82
83
82
84
82
M. tuberculosis
mutant NADH
dependant inhA
79
82
83
82
84
82
M. tuberculosii
H37RV
79
82
83
82
84
82
Sequence 3 from
patent US
5686590
91
90 d
-
98
94
'M3P3 and MlPl are PCR products of OGP3-OGP4 and 0GP1-0GP2 primer sets from
M. smegmatis genomic DNA and sequenced by 0GP3 and CGPl primers respectively.
''AS019 PI and AS019 P2 are PCR products of 0GP1-CGP2 primers sets sequenced by
the same respective primers.
'AS019 P3 and AS019 P4 are PCR products of OGP3-OGP4 primers sets sequenced by
the same primers.
- no data was obtained.
183

Table 4.4 BLASTX sequence analysis results of PCR amplified products from M.
smegmatis mc 155 and C. glutamicum genomic DNA using the OGP3-OGP4 and OGPl-
CGP2 primers sets.
Sequence
M3P3'
M2P1'
AS019P1''
AS019 P2''
AS 109 P3'
AS019 P4'
% homology
M. smegmatis
Enoyl-ACP
reductase
81.4
94
99
96
98
96
M. tuberculosis
Enoyl-ACP
reductase
69
78
83
79
84
81
M. avium
Enoyl-ACP
reductase
69
76
85
—
63
63
Enoy -ACP
(fragment)
76
94
85
-
84
81
Putative Enoyl-
ACP reductase
d
50
46
-
—
—
'M3P3 and M2P1 are PCR products of OGP3-OGP4 and 0GP1-0GP2 primer sets from
M. smegmatis and sequenced by 0GP3 and CGPl primers respectively.
''AS019 P3 and AS019 P4 are PCR products of OGP3-OGP4 primers sets from AS019
and sequenced by the same primers.
'AS019 PI and AS019 P2 are FOR products of 0GP1-0GP2 primers sets from AS019
and sequenced by the same respective primers.
- no data obtained
184

Table 4.5 FASTA sequence analysis results of PCR amphfied products of M. smegmatis
mc 155 and C. glutamicum using OGP3-OGP4 and 0GP1-0GP2.
Sequence
M3P3'
M2Pf
AS019P1''
AS019P3'
%homology
M. smegmatis
isoniazid
89.24
94.42
98.22
91.51
M. tuberculosis
H37RV inhA
77.21
79.94
83.33
79.59
M. fcovw putative
keto acyl-ACP
reductase
77.21
79.99
83.33
79.59
M. avium GIRIO
transcript
73.41
79.93
82.60
74.51
'M3P3 and MlPl are PCR products of OGP3-OGP4 and CGPl- 0GP2 primer sets from
M. smegmatis and sequenced by 0GP3 and CGPl primers respectively.
''AS019 PI is PCR products of OGP3-OGP4 primers sets sequenced by the same primers.
'AS019 P3 is PCR products of 0GP1-0GP2 primers sets sequenced by the same
respective primers.
185

The sizes of the different hybridisation signals obtained using both approaches were
determined and shown in Table 4.6. These results showed that the probe bound sttongly
to 3kb Pstl fragments of M. smegmatis genomic DNA, confirming the previously
reported observation of Banerjee et al. (1994). In conttast, a completely different and
unique hybridisation pattern appeared for strain AS019, where the probe bound to several
fragments of different sizes for all of the various enzymes used. The Southern
hybridisation pattern obtained using the two labelling systems were quite similar.
However, some additional minor bands were also observed using DIG labeUed probes
along with the major bands. For example, Pstl restriction digestion of C. glutamicum
DNA showed three major bands plus another very sttong signal which corresponded to
the probe binding to a very small molecular weight (0.25kb) fragment of genomic DNA.
h is interesting to note that the two gels for Figs. 4.3 and 4.4 were run simultaneously and
particular enzymatic digestion mixtures were loaded on each gels from one tube.
However, additional minor and major bands were seen in DIG system which did not
appear with ^ P probe, suggesting that DIG system was more sensitive than ^ P but may
also have shown less specificity.
The Southern blot analysis indicated the putative presence of an inhA gene homologue in
C. glutamicum. The multiple signals may have arisen due to the presence of several
gene copies, cutting sites for the enzymes used within the gene or to non-specific binding
of the probe to similar sequences. To confirm the identity of the inhA gene two
approaches were used subsequently: construction of a genomic library of AS019 (section
4.2.6) and sequencing the gene from the cloned DNA plus assembhng the sequence
directly from PCR products of genomic DNA (section 4.3).
186

12 kb
5kb 4kb
2.1 kb
1.6 kb
1 2 3
- • Ui^^
3kb
564bp ^M
Figure 4.3 Southern hybridisation of genomic DNA digest of C. glutamicum sttain
AS019 and M. smegmatis mc^l55 probed with the 256 bp PCR amplified fragment from
C. glutamicum using CGP3-INH2 primer pairs using the radioactive labelhng system.
Lanes 1, 2, 3, Bglll, Hindlll, Pstl digested genomic DNA of C glutamicum sttain
AS019. Lane 4, Pstl digested genomic DNA of M. smegmatis mc^ 155.
187

1 2 3 4 5
23.13kb 9.42kb 6.58kb
4.36kb
2.32kb 2.03kb
Figure 4.4 Southern blot hybridisation of genomic DNA digest of C. glutamicum strain
AS019 and M. smegmatis mc^ 155 probed with a 256bp PCR amplified inhA fragments
from C. glutamicum of OGP3-INH2 primers pairs, using the DIG labelling system. Lane
1, Lambda phage DNA Hindlll digests (size markers); Lanes 2, 3, 4 , Bglll, Hindlll, Pstl
digested genomic DNA of C. glutamicum sttain AS019. Lane 5, Pstl digested genomic
DNA of M smegmatis mc^ 155

Table 4.6 Molecular weights of the hybridisation fragments obtained when the 0GP3-
INH2 probe was used against genomic DNA from AS019 was digested with various
enzymes.
MW (kb) of the bands detected
Dig Labelling
IHindm
23,130
9,416
6,557
4,322
2,322
2,027
564
130
Bglll
8-9'*
6
5
4
3.5
2.1
Hindlll
12
10
2.2
1.6
^ P Labelling
Pstl
9.2
6.5
5.5
3.5
0.25
0.12
Bgm
9
5
-
4
2.1
Hindlll
12
10
1.6
Pstl
9.2
5.2
3.5
0.12
* Numbers in bold correspond to major bands seen. The band sizes not in bold type were
minor bands.
189

4.2.6 Cloning of the entire inhA gene in C. glutamicum AS019 and
verifying that clones contain the Pstl fragment.
Pstl digestion of M. smegmatis DNA contained the entire inhA gene (Banerjee et al,
1994). Although C. glutamicum DNA showed a different pattern, the three major bands
obtained were >3kb so it was likely that the fragments would contained the entire inhA
gene from C. glutamicum. Both DIG and P labelled probes, however, bound to a 3.5kb
fragment, which is slightiy bigger when compared to the 3kb Pstl fragment of M.
smegmatis and this appeared to be very feint compared to the other sttonger bands. Due
to the phylogenetic similarity of the two species, it was likely that 3.5kb fragment also
contained the gene. Moreover, the size of this fragment could easily be cloned into the
pBluescript SKII vector, therefore Pstl digested genomic DNA of AS0T9 was randomly
cloned into pBluescript SKII vector using Pstl digestion and a subgenomic library of
AS019 DNA was constructed in E.coli JM109 (as described in section 2.3.1.1). The
second largest fragment (5.2kb) was still small enough to be successfully cloned using
the pBluescript SKII vector (Sambrook et al, 1989).
Of the resulting ttansformants, approximately fifty white colonies were grown in LBG
with suitable antibiotic and plasmid DNA was isolated and run on agarose gels. About
30 putative clones were randomly chosen and, based on the relative mobility of the
plasmids, selected for screening. Figure 4.5a shows the relative mobility of plasmids
from various clones with respect to each other and pBluescript SKII vector. The circular
plasmid DNA from the putative clones which were larger than the pBluescript SKII
vector were digested with Pstl. Unfortunately, most of the clones generated more than
one Pstl fragment and therefore only a few clones which generated a single Pstl
fragment of sizes between 3kb to 3.5kb and above were chosen for further study. Figure
4.5b shows the Pstl resttiction digestion profiles of some of the selected clones. The
digest shown in lane 6 in Fig 4.5b contained a doublet, indicating that the vector (3.5kb)
and insert (2.99kb).are not well separated.
190

1 2 3 4 5 6 7 8 9
10,000kb
Linear DNA o r DNA
CCC DNA
Figure 4.5 Analysis of E. coli clones containing pBluescript SKII with inserts of C.
glutamicum AS019 genomic DNA.
a Lane 1, Ikb DNA ladder (10,000, 8,000, 6,000, 5,000,4,000,3,500, 3,000, 2,500, 2,000,
1,500, 1,000, 750, 500, 250bp respectively); Lane 2, pBluscript SKII; Lanes 3, 4, 5, 6 ,7,
8 and 9 are AS019 clones A29, A30, A36, A37, A38, A26, A27 respectively. The three
configurations of closed covalently circular (ccc), open cfrcular (oc) and hnear DNA are
shown for tiie pBluescript SKII vector only.
191

1 2 3 4 5 6 7 8
8,500bp
2,810bp pBluescript
b Pstl restriction digestion of some of the selected clones. Lane 1 SPPl/£coRl markers
(8,500, 7,350, 6,100, 4,840, 3,590, 2,810, 1,950, 1,860, 1,510, 1,390, 1,160, 980, 720,
480, 360bp); Lanes 2, 3, 4, 5, 6, 7, 8 are clones Al, A2, A29, A28, A30, A36, A37. Note
the two bands in lane 6 are not well separated.
192

4.2.7 Sequencing of the inhA gene from clones.
The fifteen clones containing inserts of suitable size were subjected to PCR amphfication
using inhA gene-specific primers. Finally two clones designated as AS29 and AS30 were
chosen for further studies. Figure 4.6 shows the PCR amplified inhA fragments from
some positive clones using primers sets INH1-0GP4 and OGP3-INH2. Clones AS29 and
AS30 were selected for sequencing because the amphfication products were the expected
size for each of the primer pairs used.
Initially, attempts were made to sequence the entire clone for characterisation in order to
identify sequences in the vicinity of the inhA gene as well as obtaining sequence data for
the cloned inhA gene. The M13 and T7 universal primers were used as pBluescript had
the sites for these sequencing primers in the poly-cloning region. As the sequencing data
accumulated (see below), further nested primers were made to "walk up and down" on
both sites of the insert. Unfortunately, C. glutamicum is a notoriously difficult template
for sequencing and the primer walking approach failed. Two new nested primers were
designed and sequencing reaction was undertaken with changed reaction conditions but
the reactions failed. This may have been due to high GC content, or because of
secondary loops inside tiie template so the primers failed to bind. It was then decided to
verify the inhA gene sequence by means of PCR amplification from the clones. For the
PCR amplified fragments from the clones (A29, A30) as shown in Fig 4.6a and b
respectively, each of the PCR products was used as a template for automated DNA
sequencing using the two primers (INH1-0GP4 and OGP3-INH2) as sequencing primers.
193

The identity of the sequences was determined by a BLASTN similarity search by
accessing ANGIS. Results of the identity search revealed tiiat the DNA sequences
obtained were 92-99% sinular to the M. smegmatis inhA gene confirming the presence of
this gene in these clones.
The nested primers used to sequence the clone A30 in the T7 dhection are shown in
Table 4.7. The sequencing data obtained from both ends of the insert in clone A30 with
M13 and T7 primers are shown in Figures 4.7a and b respectively. A hnear restriction
map of the generated sequence was obtained through the MAP program of the
WebANGIS and is shown in Figure 4.8. According to the map, restriction enzymes
EcoRY, Bglll, had single cutting sites and Hindlll had two (one in poly-cloning region
and at position 930 within the sequence). The clones were digested singly and doubly
with these enzymes to validate the sequence. Figure 4.9 shows the restriction digestion
of clone A30 using various resttiction enzymes. The restriction digestion with EcoRV
and Bglll generated single fragments of sizes between 6.5 and 7kb whereas with Hindlll
gave two fragments of sizes 5.5 and 0.93kb. Sinularly, double digestion of the clone with
HindllllBglll, HindlUlEcoRV, HindllllPstl generated two and three fragments of
expected sizes. The figures showed that restriction digestion profiles of the clone was in
accordance to the hnear resttiction map which was obtained accessing MAP programme
of the WebANGIS. This implies that although tiie exact position of the gene within the
clone was not mapped, the clone was sequenced in the right dhection. The sequence
readout witii M13 primer was hmited to only 450 bp. No further success in that dhection
was made because of the failure of reaction with the nested primers designed from this
sequence.
194

A sequence similarity search was performed using the BLASTN program of ANGIS.
More recentiy, the whole genome of C. glutamicum had been published The results of
the identity search showed that the DNA sequence obtained from clone A30 had
similarity with pubhshed C. glutamicum and mycobacterial genomes. The results
showed 99 to 85% similarity with C. glutamicum ATCC 13032 and C. effeciens YS-314
DNA, similarity scores with mycobacterial genomes were, M. tuberculosis 12%, M.
leprae cosmid M1496 69%, Streptomyces coelicolor cosmid 70% etc. The polypeptides
deduced from the sequences of these clones were also compared to that of all known
proteins in the database using the BLASTX and FASTA programs. The results showed
maximum homology 87% with 94.2 kDa protein RV146, hypothetical 95.7 kDa protein
B1496, M. leprae cosmid L536 87%, M. tuberculosis complete genome H37RV 81%,
Pyrococcus furiosus putative thianune biosynthesis protein gene 74%, Erwinia
chrysanthemi ATPase operon 66% and a lesser degree of similarity with Bacillus
halodrans genomic DNA 45%. Sequencing data for clone A29 was limited to only
500bp and the identity search results performed by accessing BLASTN showed 99%
similarity with C. glutamicum ATCC 13032 DNA, 65% similarity with M. tuberculosis
H37 RV and M. tuberculosis sequence V044. Figures 4.10 a, b and c showed the
nucleotide sequence, linear resttiction map and resttiction digestion profile of clone A29
respectively.
195

1 2 3
800bp
Primers dimer
Figure 4.6 PCR amphfied inhA fragments for selected clones using primer sets INHl-
CGP4 (a) and OGP3-INH2 (b).
a Lane 1 lOObp ladder (1,000, 900, 800, 700, 600, 500, 400, 300, 200, 100); Lanes,
2,3,5,6,7 contain A28, A29, A30, A37, respectively; Lane, 8 negative conttol.
196

l.OOObp
500bp 256bp
b PCR amphfied fragments for selected clones using primers sets OGP3-INH2. Lane 1
lOObp ladder (1,000, 900, 800, 700, 600, 500, 400, 300, 200, 100); Lanes, 2,3,5,6,7
contain DNA from clones A28, A29, A30, A37.
197

Table 4.7 List of nested primers designed to sequence clone A30.
PRIMERS
T7
AS30T7
AST7
AST2
AST3
M13
SEQUENCE (5' 3')
0 0 0 TAT AGT GAG TOG TAT TA
ATG OTO AGG GOO TTG AGG OGO T
GAA GOA TOO ATT OTG GOT OGO TOT
ATG OTG GOA GAG TTG CAA 0 0 0 GT
AGO AAG GGA ATO ATA TTC GTG G
OGT GAO TOG GAA AAC
SIZE'
20
24
24
23
22
15
TM ("O^
56
72
74
72
64
46
POSITION
473-494
498-522
870-792
1091-1111
^Size=number of bases 'TM=melting temperature
198

Figure 4.7a Sequence of the DNA insert in clone AS30 using primer walking from the
T7 promoter region, of the pBluescript vector. The first 40 bases (1-40) are part of the
vector and sequence in the insert start from 41.
1 CCCTCGAGGT CGACGGTATC GATAAGCTNG ATATCGAATT CCTGCAGAGG
51 AATGTCCACG TGGACACCCT TTGGCACGTA GATGAAAGAT CCACCGGACC
101 AGACAGNGGA GTTCAGTGCG GAGAACTTGT TGTCGCCTGC TGGAATGACG
151 GTGCCGAAGT ACTCCTGGAA GATCTCAGGG TGCTCTTTCA GTGCGGTATC
201 GGTGTCAAGG AAGATAACTC CCTTTTCCTC CAGGTCCTCG CGGATCTGGT
251 GGTAGACAAC CTCAGACTCG TACTGAGCTG CAACACCTGC AACGAGGCGC
301 TGCTTCTCGG CCTCAGGAAT ACCCAGCTTG TCGTAGGTAT TCTTGATGTC
351 TTCTGGGAGA TCCTCCCAGG ACTGTGCCTG CTTCTCAGTG GAGCGGACGA
4 01 AGTATTTAAT GTTGTCGAAG TCAATGCCTG AAAGGTCTGC ACCCCAGGTT
451 GGAACTGGCT TCTTATCAAA AATGCTCAGG GCCTTGAGGC GCTGCTGAAG
501 CATCCATTCT GGCTCGCTCT TCTTCGCAGA GATGTCGCGT ACGACATCCT
551 CGCTGAGACC ACGCTGTGCG GATGCACCAG CGTCGTCGGA GTCGTGCCAA
601 CCATAGTTGT ACGGACCGAT GGATTCAATG ATCTGGTCAT CGGTCAAGGG
651 CTCGTTAACC CCTGGGTTCG TCGTTGCCGA AGTCATGATC CGCTCCTTTC
701 ATCAGGAGTG TTTGATGGGT GTCAATGGAA TATTTGTTGT GCAGATGCCG
751 TGGCCGTCCG CGATTGTTGC CAATGGTTGC GTGTGCTGCC CCAAAAGTTC
801 TGAGACTGCT TGATGCTCTG CCTCACACAG TTCCGGAAAT TCCGTGGCGA
851 CTGTAGATAT TGGACAGTGA TGCTGGCAGA GTTGCAACCC GTTTCGAGTG
901 GCATCGACAG TTGCTGCATA ACCATGCCGA CTAAAAGCTT CAACTAAAGA
951 TTTGGCTGTA TCTTCGATTG ATTGATCTGT GACATCTGCT GGGGTAATAC
1001 CCTCAACAAT TGTTTCGATC CGCTTTCTAG CAAATTGCCT TACTGCATCA
1051 TCTCCGCCGA CCTCTCGAAG AGTGGCTAGA GCTGCCGCAG CAAGGGAATC
1101 ATATTCGTGG CCGAAGATTG AGCGACCTTT ATCAGTAAGC CGATAAGTTT
1151 TTGCTGGCCT ACCGCGCATT TTGGGCTCAT ATGGGTTCTG GCGCGGATTT
1201 GCCGCCTCCG CCAGATTTTC TTCAACCAAG TTGTCTAGGT GCCTGCGCAC
1251 TCCCACAGTT GAAAGCTGAA GCTGTTCAGC AATATCTGAA GCGATCACCG
199

Figure 4.7b Sequence of the DNA insert in clone AS30 from the Ml3 promoter site using
M13asa sequencing primer.
1 CCGGGCTGCA GCATTCGGCT CATGAAGTTT CCGCCAGGGA AATCCACATA
51 CGGATTATTC ACCACCGGAA GTGCACCCGC GCCCAGCGCA CCAAACGCGA
101 TCATTAACGC ACCCATGGTG CCGATCAGGC GCAGCCATGC AAATCGGCGA
151 ATCTTTTCAG GCTCAAGCCC TGAGGCGTCG GTATCGCGGT CGTTGATGGA
201 GCTCGCGCCG GTCGCGACGT CGAAAAGCGT TGCCCCTAAA GGGCTCTGCT
251 CGTCTTCCAC GTGGAGGGTC GCTGATCTGG AACCAGCGGT GCCGATGCGC
301 GGCAAAGTGT CGAGAAATTG GCGTAGGGGA CGAGGTGCCC GAGGAAACCA
351 TTTTCTGTTT TCAGGGGCGT TCGAATTGGG TTGAATCTGC TCGTCCTTCG
401 TCACTCGCAT CATTCTACGC AAGGGAGCGG AGAACATTTA CCTCGCATCA
451 GAGTCTGGTG GTGACCCGAA GGGGGATAGT GTGAGCTAAA TCTCAAATTA
501 TATTCATTTT CGG
200

Figure 4.8 Linear restriction map of clone A30 obtained by accessing the MAP program
of WEB ANGIS.
T H B S i s C E Ep C MB
ASTTX SAnMT t CT Av c T Ac5 M S v P asP vmalh accna 4 la Ii o a poO n f i s earn alqio Icllq C aq uJ R q oR9 1 c R t lAl m i l m i l I II II V I III I I I I III //// / / / // /
CCCTCGAGGTCGACGGTATCGATAAGCTNGATATCGAATTCCTGCAGAGGAATGTCCACG I + + + + + + 60 GGGAGCTCCAGCTGCCATAGCTATTCGANCTATAGCTTAAGGACGTCTCCTTACAGGTGC
S MB B BH Aa T
T as MT A sMD sp vu B A s a ea sa 1 tbp aa a9 s c p i lA Ii w Yon WI 16 1 i R I II II I III II II I I I
/ / / TGGACACCCTTTGGCACGTAGATGAAAGATCCACCGGACCAGACAGNGGAGTTCAGTGCG
61 + + + + + + 120 ACCTGTGGGAAACCGTGCATCTACTTTCTAGGTGGCCTGGTCTGTCNCCTCAAGTCACGC
B C SN C BPBS BB M a Btl TsRS sssc gsDMD b c a4a apse sptr Itpbd o 8 nCI t6aa KGNF lYnoe I
I iiv nil nil inn i / / / / / /
GAGAACTTGTTGTCGCCTGCTGGAATGACGGTGCCGAAGTACTCCTGGAAGATCTCAGGG 121 + + + + + + 18 0
CTCTTGAACAACAGCGGACGACCTTACTGCCACGGCTTCATGAGGACCTTCTAGAGTCCC
il s T M BPBSAOPa ^2 e A s B b ssscvlpuM A K 1 c p p o sptra0u9n c ^6 I i R m I KGNFI9M61 i ^I I I I I I IIIIIIIII I / / I I I I
TGCTCTTTCAGTGCGGTATCGGTGTCAAGGAAGATAACTCCCTTTTCCTCCAGGTCCTCG + + + + + +
ACGAGAAAGTCACGCCATAGCCACAGTTCCTTCTATTGAGGGAAAAGGAGGTCCAGGAGC
BB B B F B H F ssMD M a n sH C s CnC s C B i n ttbp n V ? ^f? l^^ ^^^° ^ ^^"^T BtMvM s n Hu UYon \ " P" ^ '^^^xs bAniw p P h4 ini T T ? ^^^ ^^^ ^^^^ I "J^Re vPlRo M 1 aH
1 1 ^ ^ ^Y "^ ^"^ ^ "11 II"! I I II 2^^ ^^^TCTGGTGGTAGACAACCTCAGACTCGTACTGAGCTGCAACACCTGCAACGAGGCGC
GCCTAGACCACCATCTGTTGGAGTCTGAGCATGACTCGACGTTGTGGACGTTGCTC^ ^^^
201
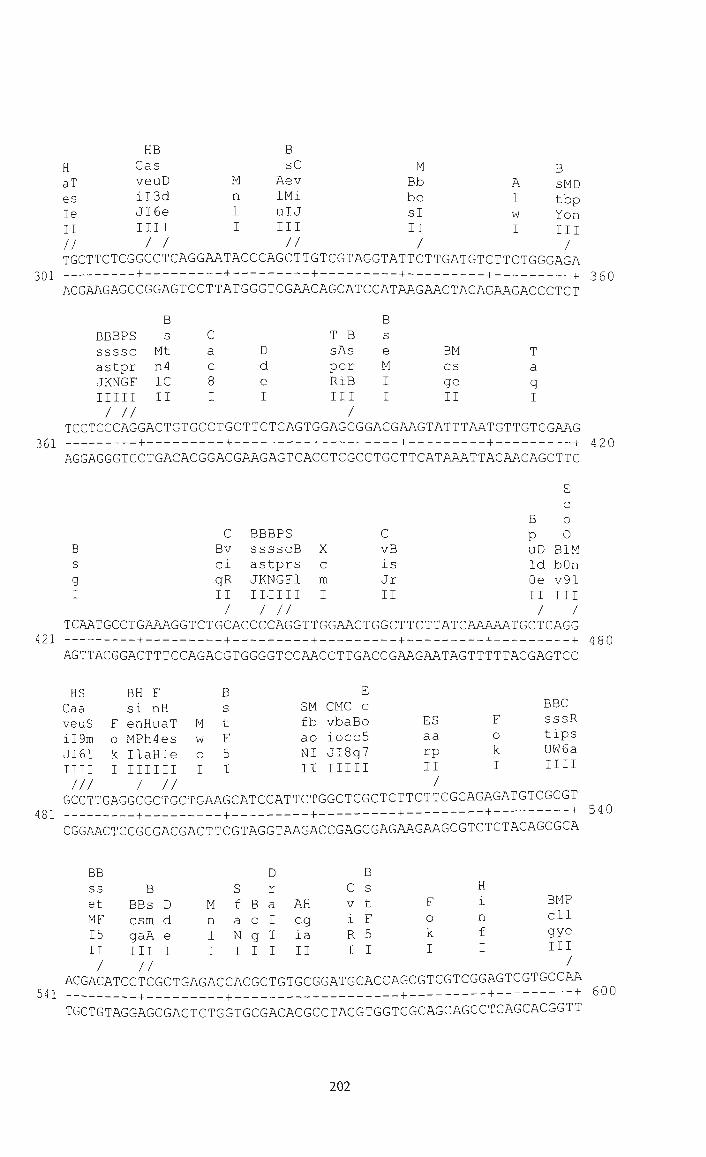
H aT es Ie II //
HB Gas veuD iI3d Jl6e n i l
/ /
M n 1 I
B sC
Aev IMi UlJ III //
M Bb b o s i I I
/
A 1 w I
sMD tbp Yon III /
TGCTTCTCGGCCTCAGGAATACCCAGCTTGTCGTAGGTATTCTTGATGTCTTCTGGGAGA 301 + + + + + + 360
ACGAAGAGCCGGAGTCCTTATGGGTCGAACAGCATCCATAAGAACTACAGAAGACCCTCT
BBBPS ssssc astpr JKNGF m i l / //
B s
Mt n4 10 II
C a c 8 I
D d e I
T B sAs per RiB III
/ TCCTCCCAGGACTGTGCCTGCTTCTCAGTGGAGCGGACGAAGTATTTAATGTTGTCGAAG
361 + + + + + + 4 20 AGGAGGGTCCTGACACGGACGAAGAGTCACCTCGCCTGCTTCATAAATTACAACAGCTTC
B s e M I I
BM cs ge II
T a q I
421
c Bv Cl
qR II /
BBBPS sssscB astprs JKNGFl IIIIII / //
X c m I
C vB is
Jr II
B s g
TCAATGCCTGAAAGGTCTGCACCCCAGGTTGGAACTGGCTTCTTATCAAAAATGCTCAGG + + + + + +
AGTTACGGACTTTCCAGACGTGGGGTCCAACCTTGACCGAAGAATAGTTTTTACGAGTCC
B P uD Id Oe II /
E c o 0
BIM bOn v91 III /
480
481
HS Caa veuS iI9m JI61 nil
F 0
k I
BH F si nH enHuaT MPh4es IlaHIe IIIIII
M w o I
B s t F 5 I
SM fb ao NI II
E CMC c vbaBo iocc5 JIBg7
nm
ES aa rp II
F o k I
BBC sssR tips UW6a nil
/ / / / / / / GCCTTGAGGCGCTGCTGAAGCATCCATTCTGGCTCGCTCTTCTTCGCAGAGATGTCGCGT
+ + + + + + 540 CGGAACTCCGCGACGACTTCGTAGGTAAGACCGAGCGAGAAGAAGCGTCTCTACAGCGCA
BB ss et MF 15 II /
B BBS D csm d gaA e III I //
M n 1 I
S f a N I
B c g I
D r a I I I
AH eg ia II
C V
i R I
B s t F 5 I
F o k I
1
n f I
BMP ell gye III
/ ACGACATCCTCGCTGAGACCACGCTGTGCGGATGCACCAGCGTCGTCGGAGTCGTGCCAA
541 + + + + + + 600 TGCTGTAGGAGCGACTCTGGTGCGACACGCCTACGTGGTCGCAGCAGCCTCAGCACGGTT
202

C sR ps 6a II
S ARa vsu ar9 116 III //
H iT nf fi II /
M D b p o n I I
B s p H
C Bl i B V a2 MnH s i n8 Sep a J 16 ela J I II III I
/ / CCATAGTTGTACGGACCGATGGATTCAATGATCTGGTCATCGGTCAAGGGCTCGTTAACC
601 + + + + + + 660 GGTATCAACATGCCTGGCTACCTAAGTTACTAGACCAGTAGCCAGTTCCCGAGCAATTGG
BBBPS ssssc astpr JKNGF m i l ////
CCTGGGTTCGTCGTTGCCGAAGTCATGATCCGCTCCTTTCATCAGGAGTGTTTGATGGGT 661 + + + + + + 72 0
GGACCCAAGCAGCAACGGCTTCAGTACTAGGCGAGGAAAGTAGTCCTCACAAACTACCCA
B H Bs Ca stBE ve aDta il JSge JI nil II / /
GTCAATGGAATATTTGTTGTGCAGATGCCGTGGCCGTCCGCGATTGTTGCCAATGGTTGC
CAGTTACCTTATAAACAACACGTCTACGGCACCGGCAGGCGCTAACAACGGTTACCAACG
A 1 w I
B s P H I
N 1
MaD bip oin III
A e 1
I
B s r B I
S s P I
S f a N I
C V
1
R I
B A Bs e St i gU I II
/
M w o I
B b V
I
F n MuT w4s oHe III /
B s e M I I
B s m A I
S D f d a e N I I
B s t 4 C I
BBH Mssp napa IWEI nil
//
T s P
A5 pO o9 II /
GTGTGCTGCCCCAAAAGTTCTGAGACTGCTTGATGCTCTGCCTCACACAGTTCCGGAAAT 781 + + + + + + g40
CACACGACGGGGTTTTCAAGACTCTGACGAACTACGAGACGGAGTGTGTCAAGGCCTTTA
Bs s S s T C C StB St f t ^ a V
B s
St f4 cC II
S f a N I
B s t 4 C I
T s P R I
C a c 8 I
T a q I
B b V
I
3Dt j.y a 41 p e 1
JSg cC N C R 8 R III II I I I I I /
TCCGTGGCGACTGTAGATATTGGACAGTGATGCTGGCAGAGTTGCAACCCGTTTCGAGTG 841 + + _ + + + 900
AGGCACCGCTGACATCTATAACCTGTCACTACGACCGTCTCAACGTTGGGCAAAGCTCAC
203

n i n C M C d Av b V I I i o i I u J I J
I I I I I I I I I I I I I I / /
GCATCGACAGTTGCTGCATAACCATGCCGACTAAAAGCTTCAACTAAAGATTTGGCTGTA 901 + + + + + + 960
CGTAGCTGTCAACGACGTATTGGTACGGCTGATTTTCGAAGTTGATTTCTAAACCGACAT
T a q
B sS tf 4a CN
F An C luTv w4si NHeR
M s 1
N 1 a I I
T a q I
M D b p o n I I
MT as ep 14 15 II /
T s P
M5 fO e9 II /
AM In wl II /
TM ab qo II
D P n I
A c i I
B f a I
P 5 0 9 I
E a r I
T a q I
B b V
I
M n 1 I
C vB if Ja II
M b o I I
TCTTCGATTGATTGATCTGTGACATCTGCTGGGGTAATACCCTCAACAATTGTTTCGATC 961 + + + + + + 1020
AGAAGCTAACTAACTAGACACTGTAGACGACCCCATTATGGGAGTTGTTAACAAAGCTAG
T s
C S E V Af e i c a i R iN I I I I
/ CGCTTTCTAGCAAATTGCCTTACTGCATCATCTCCGCCGACCTCTCGAAGAGTGGCTAGA
1021 + + + + + + 1 0 ^ ° GCGAAAGATCGTTTAACGGAATGACGTAGTAGAGGCGGCTGGAGAGCTTCTCACCGATCT
M C b V 0 i 1 J I I
GCTGCCGCAGCAAGGGAATCATATTCGTGGCCGAAGATTGAGCGACCTTTATCAGTAAGC
1081 + + + + + + 1140 CGACGGCGTCGTTCCCTTAGTATAAGCACCGGCTTCTAACTCGCTGGAAATAGTCATTCG
B s
H H p H C Ca Bi C Bl i B a ve AMsnH M v a2N n AsH E e il cwtPh w i n8d P cth c 8 JI ioUla . o J I6e 1 iUa i I II m i l I I III I III I
/ / / / / CGATAAGTTTTTGCTGGCCTACCGCGCATTTTGGGCTCATATGGGTTCTGGCGCGGATTT
1141 + + + + + + 1200 GCTATTCAAAAACGACCGGATGGCGCGTAAAACCCGAGTATACCCAAGACCGCGCCTAAA
F F F Cn n n AvuMAuMuTTB Ii4wc4w4sss uJHoiHoHeel IIIIIIIIIII
H iT nf fi II
B b V
I
M s 1 I
E a e I
H Ca ve il JI II
204

F n Au c4 iH II /
MA wc oi II
M b o I I
M n 1 I
B f a I
N B 1 a a n I I V
H C i a nFH c Psh 8 Ipa I III
B s t 4 C I
GCCGCCTCCGCCAGATTTTCTTCAACCAAGTTGTCTAGGTGCCTGCGCACTCCCACAGTT ^201 + + + + + + 12 60
CGGCGGAGGCGGTCTAAAAGAAGTTGGTTCAACAGATCCACGGACGCGTGAGGGTGTCAA
Enzymes that do cut:
AccI
BanI
BpulOI
BsiWI
BsrBI
BstYI
Ddel
EcoRI
Hhal
Mae 11
MslI
PspGI
ScrFI
Tfil
XmnI
Acil
Banll
Bsal
BslI
BssKI
Bsu36I
Dpnl
EcoRV
HinPlI
Maelll
Mwol
Pstl
SfaNI
Tlil
Alul
Bbsl
BsaAI
BsmAI E
BstAPI
Btgl
Drain
Fnu4HI
Hindi
Mbol
Ndel
Rsal
Sfcl
Tsel
.nzymes that do not cut:
Aatll
Apal
Bbel
BsaBI
BsrDI
BstZ17l
Faul
Narl
Nspl
PspOMI
Sfil
Srfl
Acc55I
ApaLI
BbvCI
BsaHI
BsrFI
Btrl
Fsel
Neil
Pad
Pvul
Sfol
StuI
Acll
Asd
BciVI
BseRI
BsrGI
BtsI
KasI
Ncol
Pcil
Pvul I
Sgfl
Alwl
Bbvl
BsaJI
spl286I
Bst4CI
CacSI
Eael
Fokl
Hindlll
MboII
Nlalll
RsrII
Smll
Tsp45I
Afel
Asel
Bell
BseSI
BssHII
Dral
Kpnl
NgoMIV
PflMI
Sad
SgrAI
AlwNI
Bcgl
BsaWI
BspEI
BstDSI
Clal
Earl
Fspl
Hinfl
Mfel
NlalV
Sail
Sspl
Tsp509I
Aflll
Avrll
Bgll
BsiEI
BssSI
DrdI
Mlul
Nhel
Prael
SacII
Smal
Apol
Bfal
BseMII
BspHI
BstFSI
Csp6I
Ecil
Haell
Hpal
Mlyl
Plel
Sapl
Tail
TspRI
Afini
Bael
BlpI
BsmI
BstBI
EagI
Msel
NotI
PpulOI
SanDI
SnaBI
Styl Swal Tthllll
Aval
Bglll
Bsgl
BspMI
BstNI
CviJI
Avail
Bpml
BsiHKAI
BsrI
BstUI
CviRI
Eco57I EcoO109l
Haelll
Hpall
Mnll
Pmll
Sau96I
TaqI
Xeml
Agel
Bael
Bmrl
BsmBI
BstEII
EC1136II
MspAlI
Nrul
PshAI
Sbfl
Spel
Xbal
Hgal
HphI
Msel
PpuMI
Seal
TatI
Xhol
Ahdl
BamHI
BplI
BsmFI
BstXI
EcoNI
Nael
Nsil
Psil
SexAI
Sphl
Xmal
205

1 2 3 4 5 6 7 8
lO.OOOkb
3,000kb
250 bp
Figure 4.9 Restriction pattern of plasmid DNA from clone A30 containing the inhA gene
from C. glutamicum sfrain AS019. Lanel, Ikb DNA ladder (10,000, 8,000, 6,000, 5000,
4,000, 3,500, 3000, 2,500, 2,000, 1,500 1,000, 750, 500, 250); Lanes 2,3,4, 5, contained
EcoRW, Bglll, Hindlll, EcoOl09l; Lanes 6, 7 and 8 contained double digestion of A30
with: Pstl/Hindlll; Hindm/BgRl, HindllU EcoRV.
206

Figure 4.10a Sequence of the DNA insert in clone A29 using the T7 primer.
1 TCTTGGTATC GATANGCTTG ATATCGAATT CCTGCAGGAG CAAAAGCGCC
51 TTCAGTAGTT AAAAGGCCCT AAAAGCACAA AGGTGCGTCT GAGTATTTCA
101 CTCAGACGCA CTTTTTGTTG CCTAAATTAT GCTGCTAACC ATGATGCGGT
151 GGTTGCTGTT CTTTCCAGAA TTCCTCACCT GTTGGTTGGT CATCTTGTTC
201 TGGATCTAAA GAAACTTCCC GGACATCATC GTTAGTTGTT GATTCCAGAG
251 GAGAATCTGC CGTGCGATCA TAGTCCTTTG CATCTGACGC ACGGAACGCT
301 CGTCTACGTT GTCTACTCAC ACCCGACCAA CTCAAACCAC GGAAGTGCGA
351 AGCTGATCTA CAACAAAATC AACCAACGGT GTCAGAGTTG CCATGCCATC
401 ACGAATTGCC GAACGAGACT CAGCCGAGGT TGACCACCAC GGTTGAGCCG
451 GATACGCCCG CTACGCCTCG GGAAACACTT GCATCCACCG CGCCACAGGC
501 CAAACCGGAG GAACGAAGCG CCTGCGCGAT TCTGGGGGAC GT
207

Figure 4.10b Linear restriction map of the DNA insert in clone A29 using MAP program
of WEB ANGIS.
B sCT ml a Faq III /
E e o R V
T a q I
T s
Ep Ac 5 poO oR9 III //
S f c I
E Cc voPS i5sb R7tf IIII
/
H i H n Ha P he 1 al I II
M s e I
TCTTGGTATCGATANGCTTGATATCGAATTCCTGCAGGAGCAAAAGCGCCTTCAGTAGTT + + + + + +
AGAACCATAGCTATNCGAACTATAGCTTAAGGACGTCCTCGTTTTCGCGGAAGTCATCAA 60
E c o HS OCaa Iveu 0iI9 9JI6 IIII //
M w o I
H g a I
B s eM Ms 11 II /
D d e I
D d e I
B s
He gM al II
B b v I
AAAAGGCCCTAAAAGCACAAAGGTGCGTCTGAGTATTTCACTCAGACGCACTTTTTGTTG
TTTTCCGGGATTTTCGTGTTTCCACGCAGACTCATAAAGTGAGTCTGCGTGAAAAACAAC 120
T N s 1 Ep a BA M HAe5 I SC w ppoO I Ii o hoR9 I II I IIII
// CCTAAATTATGCTGCTAACCATGATGCGGTGGTTGCTGTTCTTTCCAGAATTCCTCACCT
121 + + + + + + 180 GGATTTAATACGACGATTGGTACTACGCCACCAACGACAAGAAAGGTCTTAAGGAGTGGA
T s P 5 0 9 I
F nS Tuf s4a eHN III
B B H S M sMD A s pNc n tbp 1 s acr 1 Yon w K liF I III I I III
/ // GTTGGTTGGTCATCTTGTTCTGGATCTAAAGAAACTTCCCGGACATCATCGTTAGTTGTT
181 + + + + + + 24 0 CAACCAACCAGTAGAACAAGACCTAGATTTCTTTGAAGGGCCTGTAGTAGCAATCAACAA
H iMT nnf f l i
H i T n f f i
B s M D e b p R o n I I I
c V
i R
M w o
S f a N
HM gw ao
I I I I I I I I I I I I I / / / / GATTCCAGAGGAGAATCTGCCGTGCGATCATAGTCCTTTGCATCTGACGCACGGAACGCT
241 + + + + + + 300 CTAAGGTCTCCTCTTAGACGGCACGCTAGTATCAGGAAACGTAGACTGCGTGCCTTGCGA
208

A c c I
M a e I I
T a i I
A e c I
Bs StB M aDt s JSg 1 III I
C AvM D lib p uJo n III I
/ / CGTCTACGTTGTCTACTCACACCCGACCAACTCAAACCACGGAAGTGCGAAGCTGATCTA
301 + + + + + + 360 GCAGATGCAACAGATGAGTGTGGGCTGGTTGAGTTTGGTGCCTTCACGCTTCGACTAGAT
B s t 4 C I
N 1 a I I I
T s
P 5 0 9 I
B s MP m 11 A ye I II
/
H i DM n dn f el I II
/ CAACAAAATCAACCAACGGTGTCAGAGTTGCCATGCCATCACGAATTGCCGAACGAGACT
361 + + + + + + GTTGTTTTAGTTGGTTGCCACAGTCTCAACGGTACGGTAGTGCTTAACGGCTTGCTCTGA
420
121
CB vs la JJ II
H B i s n e c M I I I I
B Bs StB aDt JSg III /
B s t 4 C I
B e 1
V I
CH vp la JI II
M w o I
C Aa ce 18 II /
M w o I
B FsAF aavo uJak IIII
M n 1 I
CAGCCGAGGTTGACCACCACGGTTGAGCCGGATACGCCCGCTACGCCTCGGGAAACACTT
GTCGGCTCCAACTGGTGGTGCCAACTCGGCCTATGCGGGCGATGCGGAGCCCTTTGTGAA
481
H Ca BH veM Bsp iln caa JIl gWI III III /
GCATCCACCGCGCCACAGGCCAAACCGGAGGAACGAAGCGCCTGCGCGATTCTGGGGGAC + + + + + + 54 0
CGTAGGTGGCGCGGTGTCCGGTTTGGCCTCCTTGCTTCGCGGACGCGCTAAGACCCCCTG
B sC tv Fi 5R II /
MA we oi II
H Bi S snHf tPha UlaN IIII / /
M w o I
H i n P 1 I
HC Haa hee aI8 III
H i n P 1 I
B H sHiT thnf Uafi IIII
B c
g I
M a e I I
/ /
Enzyme that do cut:
"Acre I
BciVI
BssKI Clal
EcoRV HinPli
Mnll
Sau96l Tsel
Acil BsaJI Bst4CI CviJI Faul
Hindi Msel
Sbfl TsnRnQT
Alul BsaWI
BstDSI CviRI Fnu4HI Hinfl MslI
ScrFI
Alwl BseMII BstFSI
Ddel Fokl
Hpal I Mwol
SfaNI
Apol BseRI BstUI Dpnl
Haell HphI Neil
Sfcl
Aval BslI
BstYI Eco57I Haelll Maell
Nlalll
Tail
Bbvl BsmAI Btgl
Eeo0109I Hgal Mbol Plel
TaqI
Bcgl BsmFI Cac8I EcoRI Hhal Mlyl Pstl
Tfil
209

Enzyme that do not cut:
Aatll AiwNI Bael Bfal Bsal BsiWI BsrBI BstEII Dral EcoNI MboII Ndel Pad Psil SacII Sgfl Sspl
Tthllll
Aee65I Apal BamHI Bgll BsaAI BsmI BsrDI BstNI Drain Fsel Mfel
NgoMIV Peil PspGI Sail SgrAI StuI Xbal
Aell ApaLI BanI Bglll BsaBI BsmBI BsrFI BstXI DrdI Fspl Mlul Nhel PflMI
PspOMI SanDI Smal Styl Xeml
Afel AscI Banll BlpI BsaHI
Bspl286I BsrGI
BstZ17I Eael
Hindlll Msel NlalV Pmel Pvul Sapl Smll Swal Xhol
Aflll Asel Bbel Bmrl
BseSI BspEI
BssHII Bsu36I
EagI Hpal
MspAlI NotI Pmll
PvuII Seal
SnaBI TatI Xmal
Afllll Avail Bbsl BplI Bsgl
BspHI BssSI Btrl Earl KasI Nael Nrul
PpulOI Rsal SexAI Spel Tin XmnI
Agel Avrll BbvCI Bpml BsiEI BspMI BstAPI BtsI Eeil Kpnl Narl Nsil PpuMI RsrII Sfil Sphl
Tsp45I
Ahdl Bael Bell
BpulOI BsiHKAI
BsrI BstBI Csp6I
Ecll36II Maelll Ncol Nspl PshAI Sad Sfol Srfl TspRI
210

1 2 3 4 5 6 7 8
10,000kb
S.OOOkb
Figure 4.10c Restriction digestion pattern of plasmid DNA from clone A29 containing
the inhA gene from C. glutamicum strain AS019. Lanel, Ikb DNA ladder (10,000,
8,000, 6,000, 5000, 4,000, 3,500, 3000, 2,500, 2,000, 1,500 1,000, 750, 500, 250); Lanes
2,3,4, 5, contained Xhol. Bglll, EcoRV, EcoQl09l; Lanes 6, 7, 8 and 9 contained double
digestion of A29 with XhoVEcoRV, Pstl/Hindlll; Hindlll/Bglll, and Hindlll.
211

4.3 SEQUENCE ANALYSIS OF THE inhA GENE OF AS019
4.3.1 Sequence assembly of the inhA gene in AS019 using fragments generated by PCR
Putative inhA gene sequences were amplified from the genomic DNA of AS019 as well
as from clones (data in Appendix 4) using the inhA specific primers and conditions
described in detail in Table 4.1. Although primer sets INH1-CGP4 and CGP3-INK2
were able to amplify 100% of the inhA gene of C. glutamicum and M. smegmatis (total
gene length of approximately 850 bp for M. smegmatis), good sequencing data could
only be obtained for up to 300-400 bp due to instrumentation hmitations, quality of the
DNA templates, primers and reagents. Assembly of the DNA fragments obtained from
1NH1-CGP4 and CGP3-INH2 into one continous sequence was not achieved with these
two primers sets alone. In order to join these fragments and to unambiguously determine
the inhA gene sequence from C. glutamicum strains, several sets of degenerate primers
were used to amplify internal regions of the gene. Finally, five PCR products (Figure 4.1
[800bp using INHl and CGP4, 500 bp using CGP5 and CGP2, 256 bp using CGP3 and
INH2, 200 bp using CGP3 and CGP4, and 255-bp using CGP5 and CGP6]) were chosen
for sequencing. The longer PCR fragments were cloned into the PCR 2.1 vector using
the TA cloning kit and read using Ml3 and T7 primers. The smaller fragments were read
directly using the relevant PCR primers. All sequences were analysed for their overlap
portions and then assembled both manually and using the GCG program of ANGIS.
Sequences obtained for strain AS019 were from positions 1-495, 107-476, 286-773, 628-
850, 645-850 for primers Ml3, CGP5, CGP4, CGP3, etc. The assembled inhA gene
sequence of C. glutamicum sfrain AS019 was 100% complete from positions 1-850 bp.
The DNA sequence was deposited to GenBank under the accession number
(NCBI_REF566285). Figure 4.11 shows the nucleotide sequence of the inhA gene of
AS019 and the relationship between the PCR products used to obtained this sequence. A
linear restriction map of tiie inhA gene was also consfructed using the MAP program of
WEB ANGIS and this is shown in Figure 4.12. The similarity of the inhA gene sequence
was determined using BLASTN similarity search. Figure 4.13 shows the BESTFIT of
the inhA gene sequence of AS019 with that of M. smegmatis. The top four high scoring
pairs of mM sequences obtained
212

Figure 4.11a The nucleotide sequence of the inhA gene of C. glutamicum strain AS019
(position 1-850) [NCBI_REF 566285].
1 CCGGACACAC AAGATTTCTC GCTCACAAGG AGTCACCAAA TGACAGGCCT
51 ACTCGAGGGC AAGCGCATCC TCGTCACGGG GATCATCACC GATTCGTCGA
101 TCGCGTTCCA CATCGCCAAG GTCGCCCAGG AGGCCGGCGC CGAACTGGTG
151 CTGACCGGTT TCGACCGCCT GAAGTTGGTC AAGCGCATCG CCGACCGCCT
201 GCCCAAGCCG GCCCCGCTGC TGGAACTCGA CGTGCAGAAC GAGGAGCACC
251 TGTCGACTCT GGCCGACCGG ATCACCGCCG AGATCGGTGA GGGCAACAAG
301 ATCGACGGTG TGGTGCACTC GATCGGGTTC ATGCCGCAGA GCGGTATGGG
351 CATCGACCCG TTCTTCGACG CGCCGTACGA GGATGTGTCC AAGGGCATCC
4 01 ACATCCCGGC GTACTCGTAC GCCTCGCTCG CCAAAGCCGT TCTGCCGATC
451 ATGAATCCGG GCGGCGGCAT CGTCGGCATG GACTTCGACC CCACGCGCGC
501 GATGCCCGGC TACAACTGGA TGACCGTCGC CAAGAGCGCG CTCGAATCGG
551 TCAACCGGTT CGTCGCGCGT GAGGCGGGCA AGGTGGGCGT GCGCTCGAAT
601 CTCGTTGCGG CAGGACCGAT CCGCACGCTG GCGATGAGCG CAATCGTGGG
651 CGGTGCGCTG GGCGACGAGG CCGGCCAGCA GATGCAGCTG CTCGAAGAGG
701 GCTGGGATCA GCGCGCGCCG CTGGGCTGGA ACATGAAGGA CCCGACGCCC
751 GTCGCCAAGA CCGTGTGCGC ACTGCTGTCG GACTGGCTGC CGGCCACCAC
801 CGGCACCGTG ATCTACGCCG ACGGCGGCGC CAGCACGCAG CTGTTGTGAT
213

o 00
I
00 (N
O —'
U OH (N
m I
Cs|
m
o
•sO
r-I
o
O
C • I—I
vo
O lO 00 0 0 (N
o
rn
O cn <
ON
I
( N ON
c/5 O
r H U CIH (N
0 0 I
c« O
cn
o i n 00
I/:
cn
CSl
u CSl
r-cn IT)
I
O OH
c c ^
•« 9.
00 0 1/5 KS
( U • -
(U C C (D (U 3 W) CT
O O T i O C " o Id •s c S3 rt w 1-1 3 U
5 s
> .4—t o I)
OJ
rt <u Tf
00 t^ 00
S« .—I u
ta < H

Figure 4.12 A linear restriction map of the inhA gene of AS019 using MAP program of
WEB ANGIS
g Has MT as
H iep PM
1
3 p nI4 11 J h fI5 ey J I III II
/ CCGGACACACAAGATTTCTCGCTCACAAGGAGTCACCAAATGACAGGCCTACTCGAAGGC
+ + + + + + 60 GGCCTGTGTGTTCTAAAGAGCGAGTGTTCCTCAGTGGTTTACTGTCCGGATGAGCTTCCG
H Ca veS lit JIu in //
FT oa kq II
H B C i s a n tH c P Fh 8 1 5a I I II
/
MT asS epfB I4as I5N1 IIII /
HMM D pnb p hlo n III I
A 1 w I
BBH Assp gara eWFI IIII ///
T a q I
B As Cl
IE II /
B s 1 I
H B B B iT TM DsPs sS nf ab pivt at fi qo nEuU Jy II II IIII II / / /
MGCGCATCCTCGTCACGGGGATCATCACCGATTCGTCGATCGCGTTCCACATCGCCAAG gl + + + + + + 120
TTCGCGTAGGAGCAGTGCCCCTAGTAGTGGCTAAGCAGCTAGCGCAAGGTGTAGCGGTTC
H H N BBBPS BCC Ba HiH gN
M M sssscBM svaBseHBanpKNNolBS w n astprgw ricaalhbePaaaaMasf 0 1 JKNGFlo FJSnHIaelllserlIro 1 I IIIIIII IIIIIIIIIIIIIIVVII
I I I I / I III11111 I GTCGCCCAGGAGGCCGGCGCCGAACTGGTGCTGACCGGTTTCGACCGCCTGAAGTTGGTC
121 + + + + + + 180 CAGCGGGTCCTCCGGCCGCGGCTTGACCACGACTGGCCAAAGCTGGCGGACTTCAACCAG
H MFN S BCCHCa s n g N a svapveMANpuoBlFuT r i c a i I w c a A 4 M s a a 9 s F J 8 I J I o i e l H I l I u 6 e I I I I I I I I I I I V I V I I I
/ / / / / / / / MGCGCATCGCCGACCGCCTGCCCAAGCCGGCCCCGCTGCTGGAACTCGACGTGCAGAAC
181 + + + + + + 240 TTCGCGTAGCGGCTGGCGGACGGGTTCGGCCGGGGCGACGACCTTGAGCTGCACGTCTTG
B Bs sp H H il iBH Ca BBH H2MPSABnsiT E veH sspM D KBllacscena a ilp aiab p A6yelcgIRfq e JIh WEIo n IIIIIIIIIII I III IIII I /// // // / /
GAGGAGCACCTGTCGACTCTGGCCGACCGGATCACCGCCGAGATCGGTGAGGGCAACAAG 241 + + + + + + 300
CTCCTCGTGGACAGCTGAGACCGGCTGGCCTAGTGGCGGCTCTAGCCACTCCCGTTGTTC
215
H 1
n H P h 1 a I I
E c o 5 7 I
S B fAs aci NiE III
/
C a c 8 I
B b V
I
T a q I
M aB et Ir II
C TvM ain iRl III
/
A A c 1 i w I I
MBDM bcpn ognl IIII
/
HM pb ho II

DT pa nq II
B s t 4 C I
A P a L I
B Bs sp
C Bil B vBsH2MTDsP iceKBbapiv RgSA6oqnEu IIIIIIIIII
// / /
N F 1 n aAu Ic4 liH III
/
B BAs ser liB III
/
M w o I
M b o I I
S f a N T
T a q I
H Bi BC snHMssHR tPhnipgs UlalW6aa IIIIIIII / / /
F o k I
S fB as Nl II
C sR ps 6a II
BC ssR ips W6a III
C Ma wc o8 II
M n 1 I
C V
1
J I
M w o I
S f a N I
N 1 a I I I
ATCGACGGTGTGGTGCACTCGATCGGGTTCATGCCGCAGAGCGGTATGGGCATCAACCCG 301 + + + + + + 360
TAGCTGCCACACCACGTGAGCTAGCCCAAGTACGGCGTCTCGCCATACCCGTAGTTGGGC
B B s B s t sS Ft F at oF 5 Jy k5 I II II
/ TTCTTCGACGCGCCGTACGAGGATGTGTCCAAGGGCATCCACATCTCGGCGTACTCGTAC
AAGAAGCTGCGCGGCATGCTCCTACACAGGTTCCCGTAGGTGTAGAGCCGCATGAGCATG
N F F B HI BH S n n
M Ds iaTspNc AuBABu b pp nifsacr c4scc4 0 nH fliKIiF iHligH 1 II IIIIIII IIIIII
// / / GCCTCGCTCGCCAAAGCCGTTCTGCCGATCATGAATCCGGGCGGCGGCATCGTCGGCATG
421 + + + + + + 4 80 CGGAGCGAGCGGTTTCGGCAAGACGGCTAGTACTTAGGCCCGCCGCCGTAGCAGCCGTAC
B H H H N S sBBC B iBiCHCa g
T f sssaBsHHnsnapveMMNo a a HttccthhPrPcailwwaM q N lUUBgUaalFlBIJIooel I I IIIIIIIIIIIIIIIIIIV
/ / //// / / ///// GACTTCGACCCCACGCGCGCGATGCCGGCCTACAACTGGATGACCGTCGCCAAGAGCGCG
481 + + + + + + 54 0 CTGAAGCTGGGGTGCGCGCGCTACGGCCGGATGTTGACCTACTGGCAGCGGTTCTCGCGC
H H H i H i BBH BiB HnTiT n Assp MsnsFH M hPanf c gara ntPtah w alqfi I eWFI lUlUua o m i l I n i l I I I I I I I / / / / / / / / / / CTCGAATCGGTCAACCGGTTCGTCGCGCGTGAGGCGGGCAAGGTGGGCGTGCGCTCGAAT
541 + ^ + + + + 600 GAGCTTAGCCAGTTGGCCAAGCAGCGCGCACTCCGCCCGTTCCACCCGCACGCGAGCTTA
B s 1 I
B s r I
BB ss tt F4 5C II
F o k I
BH siBC
MsnsaH wHPtch oIlU8a IIIIII
/ //
C A a c c i 8 I I
M w o I
H C i a n H c P h 8 1 a I I I
H T iT a nf q fi I II
/

F n
Au c4 iH
S Aa
Avu l a 9 wI6
M D A b p c o n 1
C C a B a C S C
8 1 8
H i
Mn H wP h o l a
A c i
H i n H P h 1 a
M n 1
I I I I I I I I I I I I I I I I I I /
CTCGTTGCGGCAGGACCGATCCGCACGCTGGCGATGAGCGCAATCGTGGGCGGTGCGCTG 601 + + + + + + 660
GAGCAACGCCGTCCTGGCTAGGCGTGCGACCGCTACTCGCGTTAGCACCCGCCACGCGAC
HH N F F M BH B F BCC CC aaH gSCn C n sP C M si sBBC Cn svaEBvaFeepNofvuMAvEuMpvTTBT v MbD snAsssaAau ricabicsIIaaMai4wlia4nAuasbs i bop HPlHttccc4 FJBevJSelllelNRHouJrHllIqeve J oIn IlwIUU8i8H IIIIIIIIIIIIVIIIIIIIIIIIIIII I III IIIIIIIIII / / / IIIIIII I I IIIIII I / //// //
GGCGACGAGGCCGGCCAGCAGATGCAGCTGCTCGAAGAGGGCTGGGATCAGCGCGCGC-CG 661 + + + + + + 720
CCGCTGCTCCGGCCGGTCGTCTACGTCGACGAGCTTCTCCCGACCCTAGTCGCGCGCGGC
E c
HH N o S B H Cii 1 AONPa B P s i T
BHHHvnnM a vllpu s s H B t nFBH B s fhhhiPPw I a0au9 a h g c 4 Psth b p aaaaJllo I I9IM6 H A a g C Ipsa v R IIIIIIII I IIVII I I I I I IIII I I /// /// / // / CTAGGCTGGAACATGAAGGACCCGACGCCCGTCGCCAAGACCGTGTGCGCACTGCTGTCG
GATCCGACCTTGTACTTCCTGGGCTGCGGGCAGCGGTTCTGGCACACGCGTGACGACAGC
F H N B F H F C nBHC C a g BH N s n Bi CH C Nn vBuspaBvEeNoTsp B 1 t M D AuBsnHBaaKMaNluSA is4racciaIaMsra a a 4 b p c4aaPhbceawcaa4f1 JrHFIBgJeleleFI n I C o n iHnHlaeBIsoBrlHou i i i i i i i i i n v i i i I V I I I i i i i i i i i i i i i i v i i i
/ / / / / / / / / / / / / GACTGGCTGCCGGCCACCACCGGCACCGTGATCTACGCCGACGGCGGCGCCAGCACGCAG
+ + + + + + 3 40 CTGACCGACGGCCGGTGGTGGCCGTGGCACTAGATGCGGCTGCCGCCGCGGTCGTGCGTC
M C sP BB vApvT M BssD i l A u s b b a p p J w l l e o vWEn n i i i I n i l
I III II CTGTTGTGAT
781
841 + 850
GACAACACTA

Enzyme that do cut:
AccI Bbel BseRI BspEI BstFSI CviRI Fokl
Hindi MboII NgoMIV PvuII Styl
Acil Bbvl BseSI BspHI BstNI Dpnl Fsel Hinfl Mlyl
Nlalll Rsal Tail
Agel Bcgl Bsgl BsrI BstUI Eael Fspl
Hpall Mnll NlalV Sail TaqI
Alul Bfal
BsiEI BsrBI Btrl Earl
Haell HphI
MspAlI Plel
Sau96I Tfil
Alwl Bgll
BsiHKAI BsrFI BtsI
Eco57I Haelll KasI Mwol PpuMI ScrFI Tsel
ApaLI BsaHI BsiWI
BssHII Cac8I
EcoO109I Hgal
Maell Nael PshAI SfaNI
Tsp45I
Avail BsaJI BslI BssKI Csp6I Faul Hhal
Maelll Narl PspGI Sfol
TspRI
BanI BsaWI
Bspl286I Bst4CI CviJI Fnu4HI HinPlI Mbol Neil Pvul StuI
Enzyme that do not cut:
Aatll Apal BamHI Bmrl BsmI
BstAPI Btgl
Ecll36II Mlul Nrul
PpulOI Sapl Smal TatI XmnI
Acc65I Apol Banll BplI BsmAI BstBI Clal EcoNI MscI Nsil Psil Sbfl Smll Tlil
Acll AscI Bbsl Bpml
BsmBI BstDSI
Ddel EcoRI Msel Nspl
PspOMI Seal SnaBI
Tsp509I
Afel Asel BbvCI
BpulOI BsmFI BstEII
Dral EcoRV MslI Pad Pstl
SexAI Spel
Tthllll
Aflll Aval BciVI Bsal
BspMI BstXI Drain
Hindlll Ncol Pcil
RsrII Sfcl Sphl Xbal
Afllll Avrll Bell
BsaAI BsrDI BstYI DrdI Hpal Ndel PflMI Sad Sfil Srfl Xcml
Ahdl Bael Bglll BsaBI BsrGI
BstZ17I EagI Kpnl Nhel Pmel
SacII Sgfl Sspl Xhol
AlwNI Bael BlpI
BseMII BssSI Bsu36I Eeil Mfel NotI Pmll SanDI SgrAI Swal Xmal
218

Figure 4.13 Nucleotide sequence similarity ahgnment of the inhA genes of AS019 and
M. smegmatis using the GCG/BESTFIT program. Identical nucleotides are indicated by
vertical hnes. Gaps are introduced by the program to maximise similarity scores. The
inhA of AS019 is shown on top and of M. smegmatis is shown at the bottom.
1 CCGGACACACAAGATTTCTCGCTCACAAGGAGTCACCAAATGACAGGCCT 5 0
1 CCGGACACACAAGATTTCTCGCTCACAAGGAGTCACCAAATGACAGGCCT 5 0
51 ACTCGAGGGCAAGCGCATCCTCGTCACGGGGATCATCACCGATTCGTCGA 100
51 ACTCGAAGGCAAGCGCATCCTCGTCACGGGGATCATCACCGATTCGTCGA 100
101 TCGCGTTCCACATCGCCAAGGTCGCCCAGGAGGCCGGCGCCGAACTGGTG 15 0
101 TCGCGTTCCACATCGCCAAGGTCGCCCAGGAGGCCGGCGCCGAACTGGTG 150
151 CTGACCGGTTTCGACCGCCTGAAGTTGGTCAAGCGCATCGCCGACCGCCT 2 00
151 CTGACCGGTTTCGACCGCCTGAAGTTGGTCAAGCGCATCGCCGACCGCCT 2 00
201 GCCCAAGCCGGCCCCGCTGCTGGAACTCGACGTGCAGAACGAGGAGCACC 250
201 GCCCAAGCCGGCCCCGCTGCTGGAACTCGACGTGCAGAACGAGGAGCACC 2 50
251 TGTCGACTCTGGCCGACCGGATCACCGCCGAGATCGGTGAGGGCAACAAG 3 00
251 TGTCGACTCTGGCCGACCGGATCACCGCCGAGATCGGTGAGGGCAACAAG 3 00
301 ATCGACGGTGTGGTGCACTCGATCGGGTTCATGCCGCAGAGCGGTATGGG 350
I I I I I I I I I I I I I I I I M I I I I I I I I I I I I I I I I I I I I I I I I I I I I I I M
301 ATCGACGGTGTGGTGCACTCGATCGGGTTCATGCCGCAGAGCGGTATGGG 3 50
351 CATCGACCCGTTCTTCGACGCGCCGTACGAGGATGTGTCCAAGGGCATCC 4 00
I I I I I M I I I I I I M I I I I I I I I I I M M I I I I I I M I I I I I I I I I I I I
351 CATCAACCCGTTCTTCGACGCGCCGTACGAGGATGTGTCCAAGGGCATCC 4 00
219

401 ACATCCCGGCGTACTCGTACGCCTCGCTCGCCAAAGCCGTTCTGCCGATC 450
111II III11111111II111Ii 11111M IIIII1111Ii III111iI 401 ACATCTCGGCGTACTCGTACGCCTCGCTCGCCAAAGCCGTTCTGCCGATC 450
451 ATGAATCCGGGCGGCGGCATCGTCGGCATGGACTTCGACCCCACGCGCGC 500
451 ATGAATCCGGGCGGCGGCATCGTCGGCATGGACTTCGACCCCACGCGCGC 500
501 GATGCCCGGCTACAACTGGATGACCGTCGCCAAGAGCGCGCTCGAATCGG 550
501 GATGCCGGCCTACAACTGGATGACCGTCGCCAAGAGCGCGCTCGAATCGG 550
551 TCAACCGGTTCGTC6CGCGTGAGGCGGGCAAGGTGGGCGTGCGCTCGAAT 600
I II I I I I I I I I I I II I I II I I I I I I I I I i I I I I I I I I II I I I I I I II I I I 551 TCAACCGGTTCGTCGCGCGTGAGGCGGGCAAGGTGGGCGTGCGCTCGAAT 600
601 CTCGTTGCGGCAGGACCGATCCGCACGCTGGCGATGAGCGCAATCGTGGG 650
II I I I II I I I I I I I I I I I I I II I i I I II I I II I I I I I I I I I II I I I I I I I
601 CTCGTTGCGGCAGGACCGATCCGCACGCTGGCGATGAGCGCAATCGTGGG 650
651 CGGTGCGCTGGGCGACGAGGCCGGCCAGCAGATGCAGCTGCTCGAAGAGG 7 00
llllllllllllllllllllllllllllllllllllllllllllllllll 651 CGGTGCGCTGGGCGACGAGGCCGGCCAGCAGATGCAGCTGCTCGAAGAGG 7 00
7 01 GCTGGGATCAGCGCGCGCCGCTAGGCTGGAACATGAAGGACCCGACGCCC 750
701 GCTGGGATCAGCGCGCGCCGCTGGGCTGGAACATGAAGGACCCGACGCCC 750
751 GTCGCCAAGACCGTGTGCGCACTGCTGTCGGACTGGCTGCCGGCCACCAC 8 00
Ii111111111 i 111111111111111111111111111111II M I i! i
751 GTCGCCAAGACCGTGTGCGCACTGCTGTCGGACTGGCTGCCGGCCACCAC 800
801 CGGCACCGTGATCTACGCCGACGGCGGCGCCAGCACGCAGCTGTTGTGAT 850
llllllllllllllllllllllllllllllllllllllllllllllllll 801 CGGCACCGTGATCTACGCCGACGGCGGCGCCAGCACGCAGCTGTTGTGAT 850
220

PEETTiBOX o f ; / H o m c / ' ^ t i j f t 0C)/Aji iatuI /AHATUL2/f l = 0 1 3 .iii=£ H • } A p r i l 1 2 , 1 9 1 0 0 l f : l g : J S . 9 o
a ! 0 1 9 s C C G G A C A C A C
i n . b o v i » d n . s i m c i C C G G A C A C A C
jn. t u b e r
Con5«n5'ua _ _ _ - - - - - - -
A A G A I T T C T C
A A G A T T T C T C
G C T C A C A A G G
G C T C A C A A G G
A G T C A C C A A Q 40
A G T C A C C A
• 4
«:019: UlfJJll*»»Mcr^J
m - b o v L s d 311. sjnecl
jn . tuber
C o n s e n s u s h * « » J * « < » a - B B J
T G A C A G G T G A C A G G
Mnlc f tWG
. - . . G T M > 4 C M H A m j G l S d c
fiH - r«K1 -
^ ' & ' ^ S
T G C Q c A H C C
: G C A T c c C G r
05019=
jn .bov iad
m, BJTwg
jn. t u b e r A |
C o n s e n s u s TtW^m^mMW^m-wmM
G ^ ^ A Q C Q C C
G ^ A T C A T C A C C
ftTCATCACC
T T
SEESBSS^EE E^B- - ^ X S Q
a:019: A l m . b o v l s d G J
IT1. sjnea A I m. t u b e r G j
Consensus - r twi i i - rtwtwmtmH
az019s T j n . b o v i s d C
m.STnea T ^ iTi. t u b e r G
C o n s e n s u s - E X I ^ ^ ^ B ^
dISE fsrir
^ ^ ^ ^ G cK^^^Wi C A G R K H
- - ^ ^ S
eUG i W i « i « * A C aGCTJli
rcmm
B s O I 9 s C M l i g J i ^ M a A G m . b o v i s d T G G A T ^ H G G A
n.ZTnca C M * I ^ ^ ^ ^ ^ 3 A A G m . t u b e r G ^ B J C ^ ^ C T G g C A
C o n s e n s u s - I^mwwm^wt
a s O I 9 s a . b o v i s d T G T
in. smeo
C o n s e n s u s ^ E B O ^ E E B E E ^ E Q - B - B
G T G G T G
G T G Q T G
G T G G T G _
GTGGTGC
irmtmtmt* - R - H R g l so
C Q Q T C H C E Q Q T E J B C C
[«»^.»»ir»»y»M - 120
15?
102
158
119
BE^E-E^^aB ISO
197
140
19T
15
bj jUMtjrgia B»ami - cj^»aBgi 280
J I T G T 25T
JIT 2T8
C o n s e n s u s Q - Q - ^ Q J ^ ^ Q - | V » ; ^ ^ ^ J . » ; » J W K ^ » a - K * » J i g l P I - K g J g ^ l l l f t M ^ 3 2 0
o s 0 1 9 s C m . b o v i s d G
m.siTteai C
T C G A T C G G G ™ U _ X t ri l Hi c
T C Q A Q C GHB^fcgiciaT^ra T T C A T G I."
; A T G < i n . t u b e r T C ^ K K H
C o n s e n s u s - l l l g J c » J i i P . f c ^ i W L l l M A l ^ W J i K ^ I CTBKI - CTaKl - F g J r j r T ' c » J : a i l l ' J M H « l JGO
a s 0 1 9 s j n . b o v i s d
m, siTfeo m . t u b e r
X3^EiEa
Q G Q T ^ B C G H A Q G E ^ E B G T
«tiMa
: G A G G A T G T G
; G A G Q A Q G T Q
: G A G G A T G T G
G G A T G T G
c A A Q G B C A
T C C A A G G G C A
jgT J34. 39T 358
Consensus M j a . * l g * i f c i f . f c l t J i g J . ^ » . g . g t a i < J | r * » * g f » * * * i * t | U l g i g i » » ; : ^ g * » J ' * l 400
Figure 4.14 Alignment of the inhA sequence of AS019 with that of mycobacterial species
using the PRETTYBOX program. Identical bases are shown in black boxes and similar
bases in grey boxes (light or deep grey according to the similarity). Gaps are introduced
to maximise similarity scores. The inhA sequences shown are the following order: inhA
of C. glutamicum strain AS019, M. bovis, M. smegmatis, M. tuberculosis, tiien the
consensus sequence.
221

From tiie BLASTN search results were ahgned using the PRETTYBOX program.
The high degree of similarity is shown by the black highhghted sections (Figure
4.14).
4.3.2 Homology search results of assembled sequence
Sequence comparison with the GCG program demonstrated 98% similarity
between the inhA genes of C. glutamicum AS019 and M. smegmatis. A
sequence similarity search based on NCBI data was performed using ANGIS and
the BLASTN programs. The deduced protein from AS019 was compared to that
of all known proteins in databases using the FASTA programs (Pearson and
Lipman, 1988) and BLAST (Altschul et al, 1990) and similarity scores were
calculated using the GCG/BESTHT and GCG/GAP (Devereux et al, 1984)
programs. The most striking observation was the similarity range of 92-98% with
the inhA gene of mycobacterial species. Figure 4.15 shows the BESTFIT of the
amino acid sequence of the InhA protein of AS019 and M. smegmatis. Figure
4.16 shows the multiple sequence alignments of the deduced InhA protein of
AS019 with other mycobacterial species using PRETTYBOX program. Tables
4.8, 4.9 and 4.10 show BLASTN, BLASTX, FASTA results for strain AS019.
Low homology scores were seen for non-mycobacterial proteins of other species,
including the fabi gene of product of P. aeruginosa, the EnvM of E. coli and
short chain alcohol dehydrogenase of E. coli.
Ill

1 PDTQDFSLTRSHQMTGLLEGKRILVTGIITDSSIAFHIAKVAQEAGAELV 50
1 PDTQDFSLTRSHQMTGLLEGKRILVTGIITDSSIAFHIAKVAQEAGAELV 50
51 LTGFDRLKLVKRIADRLPKPAPLLELDVQNEEHLSTLADRITAEIGEGNK 100
51 LTGFDRLKLVKRIADRLPKPAPLLELDVQNEEHLSTLADRITAEIGEGNK 100
101 IDGWHSIGFMPQSGMGIDPFFDAPYEDVSKGIHIPAYSYASLAKAVLPI 150
101 IDGWHSIGFMPQSGMGINPFFDAPYEDVSKGIHISAYSYASLAKAVLPI 150
151 MNPGGGIVGMDFDPTRAMPGYNWMTVAKSALESVNRFVAREAGKVGVRSN 2 00
151 MNPGGGIVGMDFDPTRAMPAYNWMTVAKSALESVNRFVAREAGKVGVRSN 2 00
201 LVAAGPIRTLAMSAIVGGALGDEAGQQMQLLEEGWDQRAPLGWNMKDPTP 250
201 LVAAGPIRTLAMSAIVGGALGDEAGQQMQLLEEGWDQRAPLGWNMKDPTP 250
251 VAKTVCALLSDWLPATTGTVIYADGGASTQLL 2 82
251 VAKTVCALLSDWLPATTGTVIYADGGASTQLL 2 82
Figure 4.15 Amino acid sequence similarity ahgnment of the InhA protein of AS019 and
M. smegmatis using the GCG/BESTFTT program. Identical amino acids are indicated by
vertical hnes, and similar amino acids are indicated by two dots or a single dot. Gaps are
introduced by the program to maximise similarity scores. The InhA proteins of AS019 is
shown on the top and that of M. smegmatis is shown on the bottom.
223
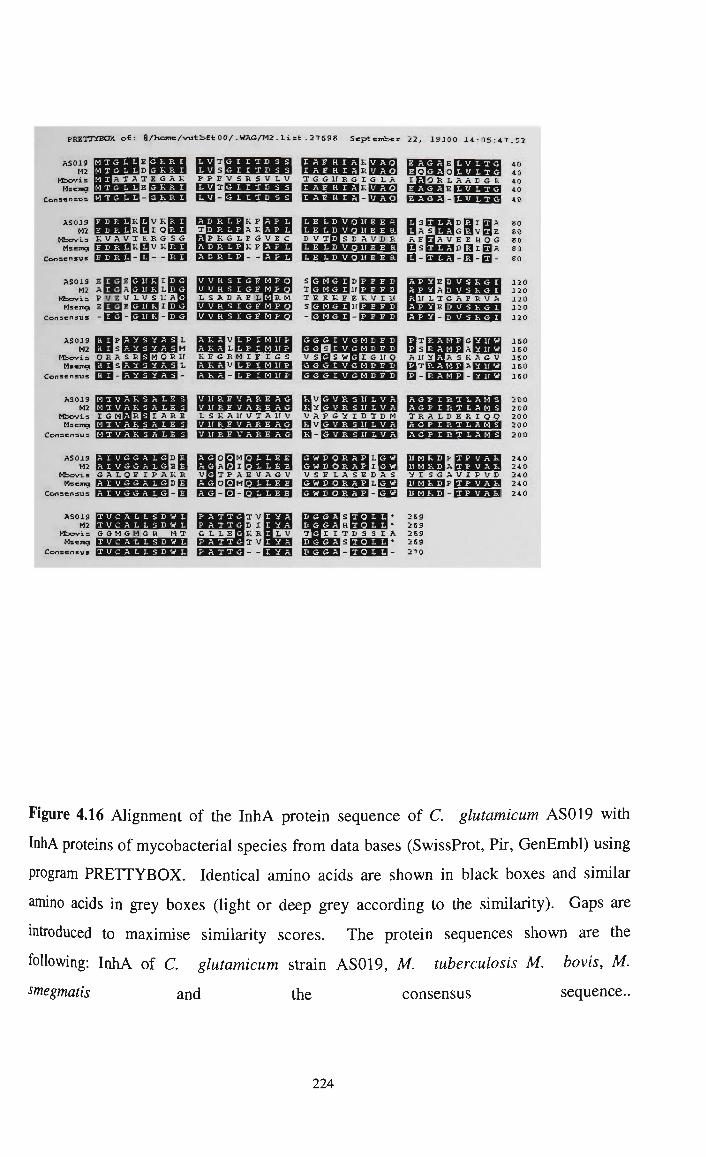
PKBXr^reaX o f : 8 / h ° m e / v u t b f t 0 0 / . W A G ^ 2 . 1 i = t . J T S S S Scjrfreiiiber 22^ 1 9 1 0 0 1 4 : 0 5 : 4 T . 5 2
C o n s e n s u s
^3331 m^GpUCi^S EEBaSKEjoQ E^^B^ISXSQ DSSSI ISS^BUEE^B t^OSEJKnSEi rTogWorWitfa
A T A T E G A i : P P E V S P. S V L V T G G i r E G I G L A - - - - -
[SE^aB-Qaai Esa-asEs^si lEiaiis-EEE]
40 40
O R L A A E G a 40 E W U r C ' i 40
E Z I S I R U I QE31 AS013
va H b o v i s K V A V T H P. G S G
Consensus IMMMS - B - - E 3 ]
AS019 E I Q E Q T Q I I Q M2 a I » J l A t « » l » i l L n M
Mbovis P V E V L V S It A H MseTKOI E I E ^ H I B J ^ E B
C o n s e n s u s - [ ^ - Q I O - E ^
A s o i g H2
Mbovis O E A S I t | Hsejnoi E H S | ~
Consensus F l - tMrMMlMMA -
L E L D V O H E E H L E L U V Q U E E a
i D g i E j A 80 S j ^ g S i a v H E 80
E B A V E E H O G SO I S ^ ^ H S Q I H A 80
[939SEEI3S3 B-QESEl-E]- so
D V T t a S D A V a R A
msEEnaasEB
1 2 0 1 2 0
I I L T G A E R V A 1 2 0
E t a c B i ^ n 120 O I B - Q D B l S a 120
K E G R H r E r G S
I V G H D E D I r V G H II E II
T
s r a s w r a i G i r o A ir y F « T i * ' « ^ ^ ' * * ^ ' EST |«VC3
1 6 0 1 6 0
A S R A G V 1 6 0 t ^ t m iGo QQEI 160
A S 0 1 3 H2
H T V A K 3 A L E 3 M T V A R S A I. E 3
I A Q S H T V A P I S A L E 3
Mbovis I G M H R H ^ A R E L S K A U V T A l f V M s e ^ I t f c a i J J f c i i i M a ^ VMlM»MfMMi^^B
Consensus Q E ^ Q i S B E S ^ H J I » J I A I * J i - J ^ T O
MiiiiJHi^ i ^^ i ra i aaiiiiMiti 2 0 0 2 0 0
V A P G Y I D T D H
EB-saEaaixsiEi T R A L D E Q Q 2 0 0
^aaoxsEEB 200
AS019 K2
Mbovis G A L O E I P A R R
Mse^ ^ m ^ ^ E Q s Q Consensus t * * < J J V » » » a - 13
I T P A E V A G V
a S H ^ ^ E B c Q ^ o Q M b S j M J J M * l . » . » J » J 3 L K g l t n T Q a p E S S ^ Q
Wt'H'WEBB ^ A Q I Q E B S S E B X B I ^ E!I!IS3AEIS!EI3 ' ' ' ' ^ ' " ' ' ' V S E L A S E D A S
M ' * . M . i J f c ^ 3 L E B
2 4 0 2 4 0
y i S G A V I P V E 2 4 0
t aggapEBEBEa 340 mEMSS-tSXEB 240
T V C A L L 3 D W L T V C A L L 3 D W L
ASOjg H2
Mbovis G G H G H G H M T
Consensus U * W * « » f c « . W » l l t » * i f c l M V i
2 6 9 2 6 9
I r T II S S I A 2 6 S S ^ ^ ^ O * 2 6 9
t < ^ » t » z l - l i i K » » » < - 2 T 0
Figure 4.16 Alignment of the InhA protein sequence of C. glutamicum AS019 with
InhA proteins of mycobacterial species from data bases (SwissProt, Ph, GenEmbl) using
program PRETTYBOX. Identical amino acids are shown in black boxes and similar
amino acids in grey boxes (light or deep grey according to the similarity). Gaps are
introduced to maximise similarity scores. The protein sequences shown are the
following: InhA of C. glutamicum strain AS019, M. tuberculosis M. bovis, M.
smegmatis and the consensus sequence..
224

<A X )
CS
CQ U
ao _c
OS
O
< <+-l o (U c 1)
^
3 CO 0) I-I
IS u 1/3
cU
-§
CQ U 2 c o CO
C u w ; H
CO
o in < o c 0)
o
o
V
Co
<3
o
o
s 5 s B a S
^ ^
00
o o
o o
oo i n >n
ON >n
O O
(N OO
CO
oo l O
oo o o
(N
(N OO
r<-) 00
O O — H
ON OS
O o
o S o
00 <
CQ 00
«
ON
o 00
o o
ON
o 00
Co
a
a • 5 S o
c3
c«
t^
C3 Co O
^ ' ^ a
.a a .1
Od

CO
X) es CS
T3
S U
u J3
O
0 \
o 00 < g c«
a
bo
u o
. c "53 • 4 ->
o a,
(U J3
^
c«
cs u CO
fe
X H 00 < HJ CQ O N
«
E
CO
(51
o CO
'53 • 4 — »
o
CO
• ^
O N F—H
O 00
^4H
o tu CO CS
> o c w c cs C u 57
-O I
Q <
O
•c cs
CO
C 5 ^
oq
a
od
>i o bo
54)
3 -o (U ; H
CL,
u <
Co
^ a Ss.
5
0 \ o 00 <
•^ m
O — O T t - H
>n i n o OS
o o
>n >n i n o o o
i n m i n o o NO
<N
00 oo o o
oo O N
O O
O O
OS
AS
Ol
•£2 -V.
a ^ S
Co O
•—. a
-O a
Q Co
1 s<
fc •2 a S •S
S. t
yp
so
a
OQ

Table 4.10 FASTA homology search resuhs for the inhA gene of C. glutamicum strain
ASOl9 from the NCBI database.
Organism Gene % Similarity
M smegmatis inhA 99.29
M. tuberculosis inhA 82.76
M. bovis inhA 82.76
M. avium inhA 83.73
Pseudomonas aeruginosa fabI 52.89
E. coli envM 52.71
H. influenza Short chain alcohol dehydrogenase 59.00
E.coli Short chain alcohol dehydrogenase 52.71
H. pylori Enoyl acyl carrier protein 38
227

4.4 DISCUSSION
The results presented in this chapter suggest that the inhA gene is present in C.
glutamicum strain AS019 and its two mutants. Morover, the results suggest that inhA
gene is also present in related species B. lactofermentum and B. flavum. At the time of
this study several hnes of evidence support the existence of the inhA gene in these strains.
1 InhA specific primers could be used to amplify the inhA gene specific fragments
directly from genomic DNA and also from individual clones on a genomic library of C.
glutamicum
2 An inhA specific probe which correctly identified the predicted Pstl derived fragment
on M. smegmatis genomic DNA identified more than one band in C. glutamicum species
under the same conditions.
At the time of this study there was no reason to doubt the validity of these findings and
problems in direct sequencing had been attributed to the high GC contents of this species.
Indeed this data was critically reviewed and sequences were submitted to the Gene Bank.
However, since this work was completed in 2002 there have been two published reports
which do not support the findings of this study on the discovery of a inhA gene in C.
glutamicum. The first report was pubhshed, on the genome of C. efficiens YS-314 by
Kawarabyasi et al (2002). C. efficiens is the closest relative of C. glutamicum but unhke
C. efficiens can grow above 40°C and it has a high GC content. The complete genome
sequence analysis was performed by Kawarabyasi et al (2002) to investigate the basis of
its thermostability by comparing its genome with that of C. glutamicum. Then
comparative genomic study showed tremendous bias in amino acids substitutions in ah
orthologous ORFs. The other report was about the complete genome sequence of C.
glutamicum strain ATCC 13032 by Nakagawa et al. (2002). It is important to mention
here that shotgun-cloning method (Fleischmann et al, 1995) was used to construct a
subgenomic library for ASOl9 and MLB 194 in pBluescript. Kawarabayasi et al, 2003
also used the shotgun method to construct genomic libraries of C. efficiens in JCM
228

44549 (strain YS-314) for sequencing purpose. Moreover, it has been also mentioned in
this paper that the genome sequence itself was used for training.
The following discussion is based on our findings although at the end of the chapter we
have addressed some of the reasons for the apparent conflicts between our results and
those of Kawarabyasi et al. (2002) and Nakagawa et al. (2002). This chapter describes
the identification, cloning and sequencing of the putative inhA gene homologue from C.
glutamicum strain ASOl9 and its comparison with the mycobacterial inhA gene.
The findings in this study of the presence of the inhA gene in C. glutamicum were based
on the assumption that the C. glutamicum strain ASOl9 was correctly verified. These
verification experiments included the sequencing of 16S rRNA from a stored strain of C.
glutamicum and Southern blotting of a ^ P labelled PCR amplified 16S rRNA to
determine the copy number and to compare the "ribotype" of the mutants compared with
the parent (AS019). The results from these verification experiments indicated that the
parents and mutants have same restriction pattern. The BLASTN sequence similarity
results indicated 99-100% homology with the pubhshed C. glutamicum 16S rRNA gene
(appendix 5).
This putative C. glutamicum strain ASOl9 was then used in a study to identify the inhA
gene using PCR and Southern blotting. Initial detection of the presence of an inhA gene
homology from the putative C. glutamicum was obtained through PCR amplification of
fragments using primers designed on the basis of mycobacterial sequences. C.
glutamicum DNA was found to be an extremely difficult template for PCR because of the
high (G+C) content in this organism. This problem was overcome by using the "Soln Q"
denaturing solution supplied with the QIAGEN kit. This PCR method should thus be
applicable to identification and amplification of different genes from corynebacterial
species, if they are significantiy similar to the known gene. SolnQ was found to be
highly usefiil in this regard.
229

To unambiguously determine the sequence of the inhA gene from the putative C.
glutamicum, several overlapping inhA gene fragments were amphfied from the genomic
DNA of ASOl9 using various primer combinations. Sequence data from tiiese confirmed
the presence of the inhA gene.
The identity of inhA gene was further confirmed by Southern hybridisation by using two
different labelhng systems. With the exception of a few extra minor bands seen when
using the DIG method, the Southern patterns obtained using the two approaches were
similar and mainly confirmatory. Another key finding of this study is that multiple
copies of the gene are present on the chromosome of the putative C. glutamicum, as
indicated initiatiy from DNA-DNA hybridisation profiles of strain ASOl9 when
compared with M. smegmatis. In M. smegmatis, the probes used always bound to a 3Kb
Pstl fragment, implying there is one copy of the 0.85 kb gene. The genomic DNA of the
putative C. glutamicum was digested with three restriction enzymes, Bglll, Hindlll, and
Pstl, with all of these three-restriction digestion producing two to three strong signals,
plus some minor bands were also seen. The high temperature (65°C to 68°C) used during
the incubation with probes plus high stringency washes of the blots, minimised non
specific binding.
The inhA gene sequence was assembled from different overlapping PCR fragments of the
putative sti-ain ASOl9 that covered the total length of 850bp, for the positive strand. A
linear restriction map analysis was performed on the inhA gene sequence via MAP
program of the WebANGIS in order to locate any internal cutting site for the above three
enzymes used for Southern analysis. This analysis showed there are no internal cutting
sites for Pstl, BgUl and Hindlll enzymes within the sequence. This observation indicated
that binding of probe to multiple fragments following enzymatic digestion of genomic
DNA must be due to the presence of multiple copies of the gene. However, Southern
results of Pstl restriction digestion were contradictory. Apart from three main signals,
two small (250 and 150 bp) bands were also seen, indicating a significantiy prominent
signal: the origin of these bands is unknown, and the restriction map does not show any
internal cutting sites witiun the inhA gene for Pstl. This could have arisen from non-
230
specific interactions between the probe used and either other DNA in the chromosome or
protein. In the restriction digestion of the genomic DNA with Pstl, BSA was used. The
signal seen at the bottom of the gel may be due to the non-specific binding of protein and
nucleic acids, which occurs quite often. This phenomenon was not further investigated.
The nucleotide sequence data obtained here revealed that variabihty in the coding region
was much smaller between corynebacteria and mycobacterial species than for other
species. Sequence similarity search based on the NCBI database revealed a 85-98%
nucleotide sequence similarity between the inhA gene of C. glutamicum ASOl9 and
mycobacterial species.
From the deduced amino acid sequence, it appears that the inhA gene of ASOl9 is a 2-
trans-enoyl acyl carrier protein, and when compared with sequences from the SWISS
PROT databases, significant homologies with enzymes involved in bacterial and plant
fatty acid biosynthesis were also seen. The highest identity score was 98% with the
Mycobactetrium family (98% with M. smegmatis, 85% with M. tuberculosis, 85% with
Af. bovis and 84% with M. avium). The InhA protein of C. glutamicum also showed
59% similarity with a short chain alcohol dehydrogenase of (EnvM) from Haemophilus
influenza), 54% with EnvM from S. typhimurium, 54% with EnvM of E. coli, 40% with
an enoyl acyl carrier protein of Helicobacter pylori and 38% identity with a Brassica
napus Enoyl-ACP reductase. The high degree of similarity of C. glutamicum InhA
protein with the mycobacterial InhA and other proteins involved in fatty acids
biosynthesis suggest that InhA might also be involved in lipid biosynthesis.
Initially the project aimed to get some sequencing information outside the coding regions
of inhA to indicate what other genes are located near the inhA gene. A subgenomic DNA
library of ASOl9 was constructed for this purpose using the Pstl site of pBluescript. Our
results showed that shotgun or random cloning approach was not a good method because
of self-hgation of Pstl fragments, as many inhA positive clones were rejected because
they generated multiple Pstl fragments following digestion with this enzyme. Only two
inhA positive clones were used for sequencing but a read-out of only 1200bp could be
231

obtained because of the reaction failure probably due to the high GC content. A hnear
restriction map of this sequence was created, accessing the MAP programme and
confirmation was made by restriction digestion of the clones with several enzymes. The
restriction digestion profiles were in accordance witii the created theoretical map thus
indicating that the clone was sequenced in the right dhections. Finally the sequence of
the inhA gene was validated by amplification and sequencing of the inhA fragments from
these clones. Although the inhA gene was amplified from these clones, the exact position
of the gene within the cloned DNA was not located. The minimum sequencing data from
two clones was compared with BESTFIT program and results showed no match between
the two. Although the sequencing information is not conclusive because of failure to
reach the far end of the inhA gene, it can be predicted that the two clones contain insert
from different parts of the genome. Moreover, the sequence similarity search performed
on the non-mM sequencing data obtained from both clones showed 72-87% homology
with various mycobacterial proteins whose functional properties are not known. The
location of the inhA gene and its function with possible operon needs furtiier
investigation.
The evidence that InhA is one target for activated INH in M. smegmatis is compelhng.
Both genetic selection (Banerjee et al, 1994) and in vitro assays (Johnsson et al, 1995,
Quemard et al, 1996) have established that InhA is inhibited by a metabolite derived
from activation of INH by KatG. No such studies have been documented in
corynebacteria therefore the mechanism of INH action is not understood. Studies
reported to date showed that C. glutamicum was relatively insensitive to the drug and
significant differences in cell grow1;h rate, ti-ansformation efficiency and mycohc acid
composition of C. glutamicum were only obvious at high concentrations of INH
(8mg/ml) (Jang et al, 1997). The present study indicates the presence of a putative target
gene for INH in corynebacteria. The observed INH resistance in C. glutamicum may
arise due to several possible mechanisms. For example, the conversion of INH into an
active metabolite might not occur in corynebacteria but frace amounts of an active form
may be present in the INH added to the media at tiie high concenti-ations used, which then
causes inhibition of mycolic acid synthesis. Alternatively, the presence of more than one
232

copy of the inhA gene in C. glutamicum may also explain the insensitivity of this species
to high concentrations of INH. This subject will be further discussed in later chapters.
The InhA protein, which is frans-2-enoylacyl carrier protein (ACP) reductase (Quemard
etal, 1995a), is one of the enzymes that constitutes fatty acids synthase or elongase-type
complexes. This finding is consistent with the observation that mycohc acid biosynthesis
is inhibited by INH with the subsequent accumulation of fatty acids of up to 24-26
carbons (Quemard et al, 1995b, Takayama et al, 1972). The presence of an inhA gene
in C. glutamicum and its considerably high similarity with the mycobacterial inhA gene
enables speculation that the InhA protein might catalyse similar functions to those seen in
mycobacteria. The existence of multiple copies of the gene in corynebacteria, however,
might suggest that the InhA protein plays a slightiy different role in C. glutamicum
despite its similarity to the mycobacterial gene. Studies of Jang et al. (1997) also showed
that INH disrupts the attachment of mycolic acids to the cell surface, an observation that
had not been reported previously in mycobacteria. The following chapters will explore
the functional properties of the inhA gene in C. glutamicum and provide further data on
sequence analysis in other related species.
The reason for this apparent discrepancy between our results and those of Kawarabyasi et
al. (2002) and Nakagawa et al. (2002) is not apparent. The Southern hybridisation
experiment in particular is difficult to rationalize. In these Southern hybridisation
experiments the PCR amplified inhA gene probe from M. smegmatis and C. glutamicum
was used against the genomic DNA digest of C. glutamicum. Hybridisation was carried
out at high temperature (68°C) to avoid any cross contamination, high stringency wash
conditions were used to clean the blots further minimising any unnecessary binding of the
probe. Two different hybridisation methods (radioactive-labelling and non radioactive-
labelling) were used which produced similar results. In this study a comparative DNA-
DNA hybridisation analysis of C. glutamicum and M. smegmatis revealed two different
Southern patterns. In our experiment involving M. smegmatis the probe bound singly to
3Kb Pstl fragment which appeared to verify the results of Banerjee et al, (1994). The C.
233

glutamicum results, however, behaved differentiy showing multiple banding patterns. In
addition to Pstl, two other enzymes BgUl and Hindlll used to digest the genomic DNA
of three corynebacterial sfrains (AS019, MLB 194, MLB 133), two Brevibacterium species
(B. lactofermentum, B. flavum) and M. smegmatis using Southern blotting analysis.
The results were again consistent showing different Southern pattern for
Corynebacterium and Mycobacterium species. In the case of M. smegmatis no signal
appeared with BgUl and Hindlll indicating the presence of inhA gene only on 3Kb Pstl
fragment whereas multiple bands were observed with C. glutamicum and Brevibacterium
restriction digests. The high degree of similarity of the sequencing data generated from
the clones with that of published Corynebacterium sequences reported to NCBI indicates
the presence of inhA gene in C. glutamicum.
However as a result of some preliminary experiments there now appears to be some
doubt regarding the authenticity of the C. glutamicum strain that was used for the study
although as indicated in the methods section of this chapter considerable effort was made
at the start of the project to verify the purity of the C. glutamicum DNA used for this
study. The verification of the purity involved the determination of the sequence analysis
of 16S rRNA, which showed 99-100% similarity with 16S rRNA gene of C. glutamicum
as expected. In addition a Southern blot analysis of different corynebacterial sfrains with 32
p labelled probe from parent sfrain AS019 was undertaken which again produce results
that were consistent with the PCR results.
A number of procedures were taken to avoid any possible contamination of the different
strains of bacteria. These included a storage procedure, which included holding tiie
strains of C. glutamicum with M. smegmatis in separate containers. All buffers for each
experiment were made up fresh before each experiment and sterile water was used as a
positive conti-ol, which did not show any amplification product. For the PCR reaction
hybridisation was undertaken at an elevated temperature to reduce the chances of cross
contamination. The isolation of genomic DNA from M. smegmatis and C. glutamicum
were carried out at different time periods. The DNA vials of M. smegmatis and
Corynebacterium were kept with two separate PCR reagents in two separate boxes. PCR
234

reactions with M. smegmatis DNA were carried out at different times. Moreover, the
sequencing data generated from the four clones two from C. glutamicum strain ASOl9
genomic hbrary and two (IC, IF) from MLB 194 library using T3 and T7 sequencing
primers was analysed using BLASTN search programme showed 96-99% homology with
the relevant parts of the published genomic DNA sequence of Corynebacterium species
proving the purity of genomic DNE in these clones. The sequencing data obtained from
clones IC and IF was not included in the thesis therefore it is attached as appendix 5.
However, despite these precautions mentioned above the possibility remains that there
was an accidental contamination of the C. glutamicum with M. smegmatis. This
contamination may have arisen from the iiutial allocation of the two different strains of
bacteria including C. glutamicum with M. smegmatis since a number of people were
involved in running the laboratory including a postdoctoral research assistant and a
number of other postgraduate students. Given the earlier verification experiments that
were undertaken at the commencement of the study no further verification was
undertaken once the project had commenced. It was only after receiving reports from
some overseas investigators that had that the possibihty of cross-contamination was
raised which occurred too late for the work to be repeated. The reasons for the
discrepancy between our results and those of Kawarabyasi et al (2002) and Nakagawa et
al. (2002) are still to be resolved but could not be attempted because the scholarship I was
on could not be extended.
235

Chapter 5
Comparison of inhA gene of parent strain AS019 with two mutants
MLB133 and MLB194.
5.1 INTRODUCTION
The results reported in Chapter 3 showed significant differences in the INH MICs for
strain AS019 and two auxofrophic mutants, MLB 133 and MLB 194. Previous studies
have shown that these mutants protoplasted more readily than the parent strain and this
plus the observed morphological changes seen for MLB 133 and MLB 194 suggested that
these strains were cell-surface sfructure mutants (Best and Britz, 1986: Jang et al, 1997:
Pierotti 1987). Mutants MLB 133 and MLB 194 were more sensitive to growth inhibition
by INH and glycine, which caused budding and branching (Jang et al, 1997).
Further studies on mycolic acid composition following growth in LBG and 8mg/ml of
INH showed increased proportions of extracellular mycolic acids for the mutants
(MLB133 and MLB194 had 18.8% and 21.2% whereas AS019 had 8.5%) and the
proportion of unsaturated mycolic acids increased. This corresponded to decreases in
C32:o relative to increases in the proportion of C34:i and Cse.i- These results suggested that
the mutations in strains MLB 133 and MLB 194 were associated with synthesis of specific
mycohc acids (e.g C32:o) and possibly attachment of mycohc acids to the cell surface,
both of which are likely target sites for glycine and INH action for cell surface
modifications.
InhA is the product of the inhA gene, which catalyses the NADH-specific reduction of the
ACP. It has been documented that single amino acid substitutions (Ser to Ala or He to
Thr) caused resistance to INH in mycobacteria in laboratory stirains (Dessen et al, 1995).
Moreover changes in the regulatory region upsti-eam of the inhA locus have also been
observed in resistant clinical isolates of mycobacteria.
236

After the discovery of an inhA gene in sfrain ASOl9, it was decided to extend this study
towards the comparative genetic analysis of the inhA gene in the parent represented by
AS019 and the above mutants. This may have provided a better understanding of the
mechanism of INH action and the observed biochemical changes in mycohc acid
composition. In this chapter, the inhA gene of these INH hypersensitive mutants
(MLB 133 and MLB 194) were cloned and sequenced, including regions upsti-eam from
the open reading frame. Computer analysis of the resulting nucleotide and amino acid
sequences were compared with known inhA gene sequences to identify sequence
differences in the stiiictural gene or in its regulatory region, which may correlated witii
the phenotypes.
5.2 CLONING OF THE inhA GENE FROM MLB194
5.2.1 PCR products of the inhA gene from MLB194
PCR amplification products of the inhA gene from strain MLB 194 genomic DNA are
shown in Figure 5.1. The same strategy was used to sequence the inhA gene from strain
MLB 194 as was used for AS019. The inhA gene from MLB 194 genomic DNA was
amplified as five overlapping fragments using the same sets of primers and same sets of
PCR conditions as mentioned in Tables 4.1 and Table 4.2 respectively. Using the primer
sets INH1-CGP4, CGP1-CGP2, CGP5-CGP2 and CGP3-INH2, the sizes of the bands
obtained were in accordance with the expected sizes for each respective primer set.
5.2.2 Sequence analysis of the amplified products
PCR amplified fragments of the inhA genes from M. smegmatis and C. glutamicum
strain MLB 194 obtained using the CGP1-CGP2 and CGP3-CGP4 primer sets were
sequenced using the inhA specific primers.
237

l,500bp
779bp 496bp
255bp
Figure 5.1 PCR amplification of the inhA gene from genomic DNA of MLB 194. Lane 1,
PCR markers (100 bp DNA ladder, 1,500, 1,200, 1,000, 900, 800, 700, 600, 500, 400, 300,
200, 100 bp); Lanes 2 to 5 show amplification products for primers INH1-CGP4; CGPl-
CGP2; CGP5-CGP2; and CGP3-INH2.
238

Table 5.1 BLASTN sequence analysis of PCR amplified products of M. smegmatis mc^ 155
and C. glutamicum strain MLB 194 using CGP3-CGP4 and CGP1-CGP2 primers sets.
Sequence
M3P3'
Mipr
194 CGPl"
194 CGP2"
194 CGP3'
194 CGP4=
M. smegmatis inhA gene
91
96
98
98
90
92
M. tuberculosis
M. bovis inhA gene
79
82
83
82
77
80
% Homology
M. tuberculosis mutant NADH dependant inhA
79
82
83
82
77
80
M.tuberculosis H37RV
79
82
83
82
77
80
Sequence 3 from patent US 5686590
91
90
-
90
90
M3P3 and MlPl are PCR products of CGP3-CGP4 and CGP1-CGP2 primer sets
from M. smegmatis mc^ 155 and sequenced by CGP3 and CGPl primers
respectively.
194 CGPl and 194 CGP2 are PCR products of CGP1-CGP2 primers sets sequenced
by the same respective primers.
194 CGP3 and 194 CGP4 are PCR products of CGP3-CGP4 primers sets sequenced
by the same primers.
239

Table 5.2 BLASTX sequence analysis results of PCR amplified products from M. smegmatis
mc 155and C. glutamicum strain MLB194 genomic DNA using the CGP3-CGP4 and CGPl-
CGP2 primers sets.
Sequence
M3P3'
M2Pr
194 CGPl"
194 CGP2"
194 CGP3'
194 CGP4'
% Homology
M. smegmatis
Enoyl-ACP
rreductase
81.4
94
99
96
81
81
M.
Enoyl
tuberculosis
-ACP
reductase
69
78
83
79
75
73
M. avium
Enoyl-ACP
reductase
69
76
85
63
63
Enoyl-ACP
(fragment)
76
94
85
81
81
Putative Enoyl-
ACP
reductase
50
46
M3P3 and MlPl are PCR products of CGP3-CGP4 and CGP1-CGP2 primer sets
from M. smegmatis and sequenced by CGP3 and CGPl primers respectively.
194 CGPl and 194 CGP2 are PCR products of CGP1-CGP2 primers sets sequenced
by the same respective primers.
194 CGP3 and 194 CGP4 are PCR products of CGP3-CGP4 primers sets sequenced
by the same primers.
240

Table 5.3 FASTA sequence analysis results of PCR amplified products of M. smegmatis mc
155 and C. glutamicum MLB 194 using CGP3-CGP4 and CGP1-CGP2.
Sequence
M3P3'
M2P1'
194 CGPl"
194 CGP3'
% Holmology
M.smegmatis
isoniazid
89.24
94.42
98.22
91.51
M.tuberculosis
H37RV inhA
77.21
79.94
83.33
79.59
M.bovis putative
keto acylACP
77.21
79.99
83.33
79.59
M. avium GIRIO
transcript
73.41
79.93
82.60
74.51
M3P3 and MlPl are PCR products of CGP3-CGP4 and CGP1-CGP2 primer sets
from M. smegmatis and sequenced by CGP3 and CGPl primers respectively.
194 CGPl is PCR products of CGP1-CGP2 primers sets sequenced by the same
respective primers.
194 CGP3 is PCR products of CGP3-CGP4 primers sets sequenced by the same
primers.
241

A sequence similarity search based on the NCBI was performed via the National
Genomic Information Service (ANGIS) using the BLASTN programs. InhA deduced
protein from MLB 194 was compared to that of aU known proteins in databases using the
FASTA (Pearson and Lipman, 1988) and BLAST (Altschul et al, 1990) programs.
Tables 5.1, 5.2, 5.3 show the results of BLASTN, BLASTX and FASTA homology
searches for these products. The data showed that the highest similarity was with the
mycobacterial inhA genes (82-97%). Sequence assembly of this is reported in section
5.4.1
5.2.3 Southern hybridisation and identification of the inhA gene in C
glutamicum strain MLB194.
The PCR amplified products of CGP3-CGP4 primer sets from C. glutamicum strain
MLB 194 were labetied using radioactive ^ P and non-radioactive (DIG) labelling
systems. The two probes were then used to hybridise the blots containing the genomic
DNA of C. glutamicum strain MLB 194 and M. smegmatis digested with various
enzymes.
Figure 5.2 a and 5.2 b showed the results of Southern hybridisation using ^ P and DIG
labelHng systems respectively. Similar to Southern hybridisation results for ASOl9
genomic DNA, binding of the probe with multiple fragments of strain MLB 194 genomic
DNA digest with various resfriction enzymes was observed. The Southern hybridisation
pattern obtained using the two systems were identical to those observed for ASOl9.
Similarly, some additional minor bands were obtained for DIG labelhng system, which
were not seen with the ' P labelled probes. The probe showed strong hybridisation
signals with a 3kb Pstl fragment of M. smegmatis DNA thus confirming the previously
reported results of Banerjee et al. (1994). In confrast to M. smegmatis, the phenomenon
of probe binding to multiple fragments of different molecular weights was common both
in MLB194 and AS019. For example, Pstl restriction digestion of MLB194 (Figure 5.2
a, lane 2) using ^ P labehed probe in addition to tiie two major bands, the probe sti"ongly
hybridise to two small molecular wteigh fragments (0.25 and O.lkb) at the bottom of the
gel.
242

23.13kb
9.41kb 6.58kb
4.36kb
2.32kb 2.02kb
0.25kb
O.lkb
Figure 5.2 Southem blot hybridisation analysis of genomic DNA from C. glutamicum strain
MLB 194 and M. smegmatis mc^ 155 following digestion with different restriction enzymes
and probed with the 256 bp PCR fragment obtained from C. glutamicum using CGP3-INH2
primers pairs
a Analysis using ^^P radioactive labelling system. Lane 1, Lambda phage DNA HindUl
digest (size markers); Lanes 2 to 5 contained Pstl, HindUl, EcoRl, Sail digested total
genomic DNA of strain MLB 194.
243

23.13 kb
9.41kb
6.58kb
4,36kb
3kb
b Analysis using DIG labeUing system. Lane 1, Lambda DNA HindRl digest (size markers);
Lane 2, Pstl digested genomic DNA of M. smegmatis; Lanes 3, 4, 5, HindRl, EcoRl, Sail,
digest of genomic DNA of C. glutamicum sti-ain MLB 194.
244

Similarly, lanes 3 in Figures 5.2 a and b contained Hindlll digest of MLB 194 and the
results were similar to ASOl9 when using the two types of labelled probes. Table 5.4
shows the calculated molecular weights of all the bands obtained in Southern
hybridisation using the two labelling systems.
To further confirm the identity of the inhA gene, two approaches were used subsequentiy:
constmction of a genomic library of MLB 194 and sequencing the gene from the cloned
DNA plus assembling the sequence directiy from PCR products amplified from genomic
DNA.
5.3 CLONING AND ANALYSIS OF THE inhA GENE OF MLB194.
Results of Southern hybridisation had shown one hybridisation fragment for M.
smegmatis and more than one hybridisation fragment for C. glutamicum strain MLB 194
when various resfriction enzymes were used. The Southern pattern obtained for MLB 194
was similar to that seen for AS019: when using Pstl, the two major signals seen in
MLB 194 Southern were greater than 3kb. Therefore, because ASOl9 and MLB 194 were
derived from the same parent strain and the two strains had similar genomes, it was
anticipated that these fragments might contain the enthe inhA gene.
Subsequentiy, genomic DNA from MLB 194 was digested with Pstl and randomly cloned
into the P^fl-digested pBluscript SK II vector and a subgenomic hbrary of MLB 194 was
constructed in E. coli XLl Blue (as described in section 2.3.1.1).
The hbrary was screened for the presence of the inhA gene by the following means:
1 Screening by resti-iction digestion and Southern hybridisation analysis of the Pstl
digested recombinant clones and
2 By PCR amplification using inhA gene specific primers.
245

Table 5.4 Molecular weights of hybridisation fragments obtained when the CGP3-INH2
probe was used against genomic DNA digests of strain MLB 194 using various enzymes.
MW of the bands detected
DIG labelhng
XDNA
23.123
941
6.58
4.36
2.32
2.02
HindlU
12.2"
10
2.2
1.6
EcoRl
8.8
6.8
4.1
3.6
Sail
8.8
6.7
4.4
^ P labeUing
Pstl
11
5.2
3.5
0.25
0.1
Hindm
12.2
10
2.2
1.6
EcoRl
8.8
6.8
4.1
3.6
Sail
8.8
6.8
4.4
^Numbers in bold correspond to the major bands seen. The band sizes not in bold type were
minor bands.
246
5.3.1 Screening by restriction digestion
Of the resulting transformants, one hundred white colonies were grown in LBG with
suitable antibiotics, then plasmid DNA was isolated from the recombinant clones and run
on an agarose gel. About fifty clones were randomly chosen based on the relative
mobihty of the plasmids, and selected for screening. The cfrcular plasmids of molecular
weight in the ranges between 3.5 to 4kb and above (judged relative to the mobihty of
pBluescript ccc DNA) were subjected to Pstl restiiction digestion. Figure 5.3 shows the
restiiction digestion patterns of some of the selected clones. Clones which generated
Pstl fragments of sizes between 3 to 4kb and greater were selected for further sequence
analysis.
Furthermore, the DNA from this gel which shows Pstl restriction digestion of clones was
transferred to the nylon membrane and subjected to Southern hybridisation. The probe
was the PCR amplified product of the CGP3-INH2 primer set and radiolabelled with ^ P
(Figure 5.4). Clone IC, IF, C22, Cl, C2 showed positive signals with the CGP3-INH2
probe. Three clones, IC, IF, C22 which contained inserts greater than 3kb, were chosen
for further analysis.
5.3.2 Southern hybridisation and PCR screening of the recombinant
clones
Recombinant clones, which contained inserts of sizes between 3.5 to 4.5kb and which also
showed positive signals with the inhA probe, were further screened by PCR amplification
using m/tA-specific primers. Ten clones generated positive signals, then clones IC, IF, C22
were chosen based on the sizes of their insert for sequencing purpose. Figure 5.5 a, b, c
shows the sizes of the PCR fragments obtained for clones IF and C22 using the ENH1-CGP4
and CGP3-INH2 primers. Although clones IC and IF generated successful PCR products
and also showed positive signals in Southem hybridisation analysis, they were not chosen for
further study because they generated more than one
247

1 2 3 4 56 78 9 1011 1213
21.2kb
PBluescript 3.5kb 2.02kb
Figure 5.3 Restriction digestion of some of the recombinant clones produced in pBluescript
following Pstl digestion of MLB 194 DNA. Lanes 1 and 13, lambda DNA digested with
//mdII/£'coRl(size markers); Lane 6, Hindm); Lanes 2, 3, 4, 5, 7, 8, 9, 10, 11, 12
pBluescriptSK DNA; cloneslC, IF, C22, C2, C3, C4, 2C, 2D, 2E digested with Pstl. DNA
from this gel was transferred to nylon membrane and subjected to Southem hybridisation.
248

1 2 3 4 5 6 7 8 9 10
21.22kb
3.5kb
Figure 5.4 Southem blot hybridisation of some Pstl digested clones containing MLB 194
DNA using the 255 bp PCR amplified inhA probe (CGP3-INH2) from C. glutamicum.
Lanes 1, and 6 represent //indlll/EcoRl, and Hindlll digested Lambda DNA size markers
respectively. Lane 2, Pstl digested pBluscript SKH; Lanes, 3, 4, 5, 7, 8, 9, 10 represent Pstl
digestion profiles of clones IC, IF, C22, C2, C3, C4, 2C, respectively.
249

1 2 3
2 3 4 5 2 3
780bD 500bp 300bp
Figure 5.5 PCR analysis of pBluscript clones containing DNA from MLB 194.
a Uncut recombinant clones of MLB 194. Lanes 1, and 2, clone IF; Lanes 3, and 4, clone
C22; Lane 5, PCR size markers.
b PCR amplification of the inhA gene from some of the Clones C22 and IF using INHl-
CGP4 primers sets. Lanel, PCR size markers; Lane 2, inhA gene fragment from C22; Lane
3, inhA fragment from IF.
c PCR amplification of inhA gene from Clones C22 and IF using CGP3-INH2 primers sets.
Lane 1, PCR size markers; Lane 2, inhA fragment from clone C22; Lane 3, inhA fragment
from clone IF.
250

Pstl fragment. Finally, the clone designated as C22, which contained a slightly bigger
fragment, was chosen for further sequencing and analysis.
5.3.3 Sequencing of the inhA gene from clones
In the beginning, the insert in the chosen clone was sequence in both directions using T3
and T7 universal primers. As the sequencing data accumulated, several internal primers
were designed to walk up the DNA. Table 5.5 shows the nested primers used to sequence
clone C22. Unfortunately, after 1,250 bp read out (Fig 5.6) further sequencing reactions
failed and no further data accumulated.
The sequencing data obtained for clone C22 is shown in Figure 5.6 where the first forty
bases correspond to the vector including the regenerative Pstl site used for cloning. A
linear restriction map of the generated sequence was obtained through the MAP program
of the WebANGIS. The linear resfriction map of clone C22 and restriction digestion
pattern is shown in Figures 5.7 a and b respectively. This showed that restriction
digestion of the clone matches with the linear resfriction map, as expected. A sequence
similarity search based on the BLASTN was performed on this generated sequence. The
results of identity search revealed 61% homology with Rhizobium meliloti C4-
dicarboxylate fransport protein (dcTA, dcTB, dcTD) genes, 61% with Ralstonia KNl
genes for regulator protein, phenol hydroxylase component, ferredoxin-like protein and
catechol 2,3-dioxygenase, partial and complete genome sequence. A lower degree of
similarity was observed for Trans-Acting Transcriptional protein ICPO (immediately
eariy protein) 53%, N-tabacum cysteine-rich extension-like protein-1 gene, complete cds
35%, Transcription initiation factor Tfiid l35kDa subunh (TAFII135) 31%. h was then
decided to verify the inhA sequence from the clones. PCR amplified fragment from clone
C22 are shown in Figure 5.8a. Each of the PCR products was used as a template for
automated DNA sequencing using the relevant primers. The identity of the sequence was
determined by a BLASTN similarity search, which was run by accessing ANGIS.
Results of the identity search revealed that DNA sequences obtained were 90-99%
similar to the mycobacterial inhA genes, confirming the presence of this gene in these
clones.
251

Table 5.5 List of the nested primers constructed to sequence clone C22.
Primer
T7
CT22F
CTA22C
cta22cfl
cta22cf2
Ct22t4
Sequence
CCC TAT AGT GAG TCG TAT TA
ACG CCG CCG AAC GCT TTG CCC T
ACG CTT TGC CCT CGG CCT GGA ACT
GTC CTT CAC CAT GAC ATC CCC C
ATTCAG GAA GGG CAG ATC AAG TTA
TTC ACC GGC CAA TAC GTC CT
Position
351-373
362-385
672-694
887-909
1167-1187
TM (°C)
56
74
78
70
68
62
252

Figure 5.6 Sequence of the clone C22 using primer walking from T7 region of the
pBluescript.
1 cgacggtatc gataagctng atatcgaatt cctgcaggag cgggtggtgg
51 agcgtttggg gggcaaccag ctgatcccgc tggatntccg ngtcattgcc
101 gccaccaagg aagacctgcg ccaatccgcc gaccagggcc gtttccgcgc
151 cgacttgtat taccggctca acgttgcgcc gctgcgtatt ccgccgctgc
201 gcgagcgtgg cgaagatgcg ttgatgctgt tccagcattt cgctgacgaa
251 gccagcagcc gccacggcct gccgctgcac gaactgcaac cgggccaacg
301 cgcgttgttg ctgcgtcata gctggcccgg caatgtacgg gaattgcaga
351 acgccgccga acgctttgcc ctcggcctgg aactggcgtt ggatgccacg
401 ccggacaacc cttccgccag cgtgctgacc tccactcccg gcggcctgag
451 cgagcaggtc gagcagttcg aaaaaagcct gatcgctgcc gaactgaccc
501 gcccccacgg ctcgcatgcg cagcctcgcc gaagccctcg gcgtaccgcg
551 caagaccctg cacgacaaat tgcgcaagca cggcctgaac tttgccaacc
601 aaagtgccga cgacgaatga gcccctctaa agagttcacc atgaaccgcg
651 acagccgtta cctcgaatcc gtccttcacc atgacatccc cctgacccgg
701 gaaatgggcc tcaaggtgcg tgactggcaa gatgcaaggc tggaactgca
751 tctacccttg caagccaata tcaatcacaa gagcaccatg tttggcggca
801 gtctctactg cggcgccgtg ctggcgggct ggggttggct gcatttgcag
851 ttgcgtgagg aagggattga agacgggcat atcgtgattc aggaagggca
901 gatcagttac ccgctgccgg tcacgcgcga tgcgaccgtt gtatgccaag
951 cgccggaaga taaggtgtgg aagcggtttg tggcgacgta caagcgttac
1001 ggccgagcac ggttggcgct ggagacgtgg attgtgaatg agggcagcga
1051 ggagcgggca gtagccttca ccggccaata cgtcctgcac cgctagaagc
1101 cttcacacaa aaccaaatgt gggagg
253

Figure 5.7 Analysis of clone C22 by restiiction digestion and sequence analysis of the
insert using T7 primers.
a A linear restriction map of clone C22 of MLB 194 obtained using the MAP program of
WEB ANGIS
61
121
181
241
B s t 4 C I
CT la aq II /
C Av Ii uJ II /
T s
E Ep c T Ac5 o a poO R q oR9 V I III
//
C SFv PS fai sb cuR tf III II
/
B As cr iB II /
c g a c g g t a t c g a t a a g c t n g a t a t c g a a t t c c t g c a g g a g c g g g t g g t g g a g c g t t t g g g -+ 60
g c t g c c a t a g c t a t t c g a n c t a t a g c t t a a g g a c g t c c t c g c c c a c c a c c t c g c a a a c c c
A 1 w I
M C s P
AvMpDvMA libApuwc uJolnloi IIIIIIII / / /
M s P A 1 I
F a u I
B s r D I
F n
Au c4 iH II /
B sS at Jy II /
H i
E Bn H c bP h i s i a I I I I
g g g c a a c c a g c t g a t c c c g c t g g a t n t c c g n g t c a t t g c c g c c a c c a a g g a a g a c c t g c g + + + + —+ +
c c c g t t g g t c g a c t a g g g c g a c c t a n a g g c n c a g t a a c g g c g g t g g t t c c t t c t g g a c g c 120
H H H MB bs op IM II
A c 1
I
BBB'PaSCa ssssucve satp9ril KJNG6FJI IIIIIIII
/ / /
MA wc oi II
Bi snH tPh Ula III /
BH C M sp ra FI II
V
i J I
B b V I
Aa ce 11 II /
T a i I
n P 1 I
HAE hcc aii III
c c a a t c c g c c g a c c a g g g c c g t t t c c g c g c c g a c t t g t a t t a c c g g c t c a a c g t t g c g c c -+ 180
g g t t a g g c g g c t g g t c c c g g c a a a g g c g c g g c t g a a c a t a a t g g c c g a g t t g c a a c g c g g FF M nn s uuBpT 4 4 DAS HHvle m i l / //
MA wc oi II
FMF H nsn i
AupuTn C4A4SP iHlHel IIIIII / /
B C S sHaMf rncwa UaSoN m i l / /
M w 0 I
s f a N I
M b o I I
M w o I
get gcgtattccgccgctgcgcgagcgtggcgaagatgcgttgatgetgttccagcattt + + + + + + 240
cgacgcataaggcggcgacgcgctcgcaccgcttctacgcaactacgacaaggtcgtaaa
F B F H FMF C n C Bs n CCa nsn C a Tu vABBstBBuBvaeMAupuTv c s4 icsbaDgt4bicIwc4A4si 8 eH JigvJSlgHvJ8IoiHlHeR I II IIIIIIIIIIIIIIIIIIII
IIIIIII I cgctgacgaagccagcagccgccacggcctgccgctgcacgaactgcaaccgggccaacg
+ + + + -+ + gcgactgcttcggtcgtcggcggtgccggacggcgacgtgcttgacgttggcccggttgc
M w o I
C V i J I
B s tM Aw Po II /
C V
i R I
S H BH aSCa spNucve sac9ril KIi6FJI IIIIIII
/ /
B b V
I
B s t U I
300
254

H iB nsHH Ptgh lUaa IIII / //
F n Tu s4 eH II
C B sRs psr 6aD III
T s P 5 0 9 I
C vB ic Rg II
F n
Au c4 iH II /
S H CCaBCaH S
AvausvepMNc lic9silawcr uJ8 6KJIIoiF IIIIIIIIIII / //////
cgcgttgttgctgcgtcatagctggcccggcaatgtacgggaattgcagaacqccqccaa 301 + + + + ^ -—-+ 360
gcgcaacaacgacgcagtatcgaccgggccgttacatgcccttaacgtcttgcggcgqct - — H "B -
B B BCa PSS s H C s sBsveMBBscf B M t p EF A a a sstilncspra s w F a co c c J KlNJIlglGFN r o 5 I ik i 8 I IIIIIIIIIII I I I I II I I
// /// acgctttgccctcggcctggaactggcgttggatgccacgccggacaacccttccgccag
+ + + + + + 420 tgcgaaacgggagccggaccttgaccgcaacctacggtgcggcctgttgggaaggcggtc
B F B H C BsH nSCBp a C a sepMNAucvsuDeM a TM c sMancc4ripldIw c aw 8 KIIliiHFJMOelo 8 qo I IIIIIIIIIIIIII I II
/ / /// cgtgctgacctccactcccggcggcctgagcgagcaggtcgagcagttcgaaaaaagcct
gcacgactggaggtgagggccgccggactcgctcgtccagctcgtcaagcttttttcgga
361
B sT ta Bq II /
B b V
I
C V
i J I
M b o I
D P n I
F n Tu s4 eH II
A c i I
B Bs C C stBBFvMa aDgtaiwc JSlguJo8 IIIIIIII / // /
C a c 8 I
H F N i n Cl nFHuMvaNST Psh4wilsps IpaHoJIphe IIIIIIIIII
/ ////
B b V
I
C B vMs m a JIJ III /
gatcgctgccgaactgacccgcccccacggctcgcatgcgcagcctcgccgaagccctcg 481 + + + + + + 54 0
ctagcgacggcttgactgggcgggggtgccgagcgtacgcgtcggagcggcttcgggagc
H C Bi BsRAMsnHM spscntPhw g6ailUlao IIIIIIIII II 1 1 1
C V
i R I
s P 5 0 9 I
H i C nFH a Psh c Ipa 8 III I
M w o I
H Ca ve il JI II /
gcgtaccgcgcaagaccctgcacgacaaattgcgcaagcacggcctgaactttgccaacc 541 + + + + + + 600
cgcatggcgcgttctgggacgtgctgtttaacgcgttcgtgccggacttgaaacggttgg
B s P
C Bl V a2 i n8 J 16 I II
/ aaagtgccgacgacgaatgagcccctctaaagagttcaccatgaaccgcgacagccgtta
601 + + + + + + 660 t t t c a c g g c t g e t g e t t a c t c g g g g a g a t t t c t c a a g t g g t a c t t g g c g c t g t c g g c a a t
255
H P h I
M n
1 I
N 1 a I
I I
B A s e t
i U I I
M C a V 6
i I
J I I I

H T iT H a nf p q fi h I II I
/
FM on kl II /
Is at IF 15 II
B s r I
C V
1
R I
C V
1
J I
M w o I
C V
1
R I
S f a N I
C C C V a V i c i R 8 J I I I
S H M B B BH SaSCa a sAsBBspNBNcueveSSX eM svasssacscr9riliiimra In KaJllKIiliF6FJIala II IIIIIIIIIIIIIIIIII II
////// // / //// / cctegaatccgtccttcaceatgacatcecectgacecgggaaatgggeetcaaggtgeg
661 + + + + + + 720 ggagcttaggcaggaagtggtactgtagggggaetgggccetttacccggagttccacgc
T Ss fp M a4 w N5 o II I / tgaetggeaagatgcaaggctggaactgcatctacecttgcaagccaatatcaatcacaa
721 + + + + + + 780 actgaccgttctacgttcegaccttgacgtagatgggaacgttcggttatagttagtgtt
F H F n Bi H C CNC Cn
AuBsnHBFaKNBaMABalvS vuT c4aaPhbaeaagcwcbcaif i4s iHnHlaeuIsrl8oiv8IJo JHe IIIIIIIIIIIIIIIIIVII III
/ / / / / / / / gagcaecatgtttggcggcagtctctactgcggcgccgtgetggcgggctggggttggct
ctcgtggtacaaacegccgteagagatgacgccgcggcaegaccgcccgaccccaaccga
M H B b iT B b o nf b s I fi V I I II I
/ gcatttgcagttgcgtgaggaagggattgaagacgggcatatcgtgattcaggaagggca
841 + + + + + + 900 cgtaaacgtcaaegcaetccttccctaacttetgccegtatagcactaagtccttcccgt
MF M T H B H sn B HaS s BiB Bs i H H
A puTBsFpefMp snsH st n BaHp e A4ssraalaw4 tPth i4 P seha i IHelFuIINoS UlUa EC 1 Hal I IIIIIIIIIII IIII II I i m
I I I I I I I I " gatcagttacccgctgccggteacgcgcgatgcgaccgttgtatgccaagcgceggaaga
901 + + + + + + 960 ctagtcaatgggcgacggccagtgcgcgctacgctggcaacatacggttegcggccttct
B
B Bs sp il H2 K8 A6 II /
N 1 a I I I
F n
Au c4 iH II
B s m A I
C V
1
R I
M w o I
C V
1
R I
M n 1 I
MD bp on II /
M a e I I I
H Bs
M H spB M C a CBa ils BB Hi a sRT e EEvse H2t M ssHan e psa I aaiil K84 w mheP I 6ai I egJEI A6C o ABall I III I m i l I " I " / "
/ I I I I ' taaggtgtggaagcggtttgtggcgacgtacaagcgttacggccgagcaeggttggcget ^^^^
^ ^ ittccacaecttcgccaiac^ccgctgeatgttcgcaatgecggctegtgccaaccgcga
256
M b o I I
A c 1
I

M aB et Ir II
T a i I
M n 1 I
B P m I
M n 1 I
F n Tu s4 eH II
F a u I
B C AsBa crbe iBv8 IIII / /
H P h I
BC sv ei RJ II /
H B HCa BsEpve sraail gFelJI IIIIII / / /
M a e I I
g g a g a c g t g g a t t g t g a a t g a g g g c a g c g a g g a g c g g g c a g t a g c c t t c a e c g g e e a a t a ]_Q2i + + + + + + 108 0
e c t e t g c a e c t a a c a c t t a e t c c c g t c g e t c c t c g c c c g t c a t c g g a a g t g g c c g g t t a t
1081
T a i I
C v i R I
A c 1
I
B f a I
C V
1
J I
M n 1 I
s 1 I
cg tcc tgcaecgc tagaagcc t tcacacaaaaccaaa tg tgggagg + + + + 11
g c a g g a c g t g g e g a t c t t c g g a a g t g t g t t t t g g t t t a e a c c c t c c
26
Enzymes that do cut
Acil
Bbel BsaHI BsmAI BssKI Btgl Dpnl Fokl Hpall MspAlI Pstl Sfol Tsel
Acll Bbsl BsaJI BsmBI
BstAPI Btrl Eael Fspl HphI Mwol PvuII Smal
Tsp45I
Alul Bbvl
BseMII Bspl286l
BstBI Cac8l EagI
Haell KasI Narl Rsal Smll
Tsp509I
Alwl Bcgl
BseRI BspMI
Bst4CI Clal Eeil
Haelll Maell Neil
Sau96I Sphl Xmal
Apol Bfal Bsgl BsrI
BstDSI Csp6I EcoRI Hgal
Maelll Nlalll
Sbfl Styl
Aval Bgll
BsiEI BsrBI
BstFSI CviJI EcoRV Hhal Mbol NlalV ScrFI Tail
BanI Bpml
BsiHKAI BsrDI BstNI CviRI Faul
HinPli MboII Nspl SfaNI TaqI
Banll BpulOI BslI
BsrFI BstUI Ddel
Fnu4HI Hinfl Mnll PspGI Sfcl Tfil
257

1 2 3 4 5 6 7 8 9 10 11 12 13
23.13kb
2.02kb
b Restriction digestion pattern of clone C22 containing the complete inhA gene on a 4.2 kb
Pstl insert from strain MLB 194 with various restriction enzymes. Lane 1, Lambda DNA
digested with Hindm (size markers); 2, SPPl/EcoRI markers; 3, Uncut C22; 4, Sad; 5, Sail;
6, EcoRV 1, SacII Kpnl doubly digested; 8, Lambda DNA digested with Hindm (Size
markers); 9, SPPl/£coRI size markers; 10, Sacl/Sall; 11, SacllDraH; 12, Sad and EcoRl
double digestion of clone C22; Lane 13, DraH single digestion of clone C22.
258

5.4 SEQUENCE ANALYSIS OF THE inhA GENE OF STRAIN
MLB194
5.4.1 Sequence assembly of the inhA gene in MLB194 using fragments
generated by PCR
Putative inhA sequences were amplified from the positive clone C22 and also from the
genomic DNA of MLB 194 as several overlapping PCR fragments using the same primer
sets and conditions as described previously in Chapter 4. Figure 5.8 a shows the PCR
amphfied fragments from clone C22.
All of the seven PCR fragments shown in Figure 5.8 a (778 bp using INH1-CGP4, 535 bp
1NH1-CGP2, 495 bp CGP5-CGP2, 443 bp of CGP1-CGP2, 184 bp of CGP3-CGP4, 255
bp CGP3-INH2 and 134 bP of CGP5-CGP6) were sequenced directiy using the relevant
primers. However, the longer PCR fragments were cloned into the PCR 2.1 vector using
the TA cloning kit and read using M13 and T7 primers. Restriction digestion of
recombinant (PCR2.1) clones containing EcoRl fragments of the inhA gene are shown
later in this chapter. The map of PCR 2.1 vector is shown in Appendix 4.
Figure 5.8 b summarises the entire sequence assembly obtained for strain MLB 194 from
genomic DNA and clone C22. Sequences obtained for strain MLB 194 were from
position 1-404, 422-778, 125-570, 144-525, 80-252, 618-774, 644-845 with Ml3, INHl,
CGPl, CGP5 and CGP3 primers, and from position 485-155, 282-90, 735-419, 755-595
with CGP2, CGP6, and CGP4 primers. After sequence assembly, the sequence of the
inhA gene from positions 1 to 845 bp was obtained from clone C22, which contained a
4.6kb single Pstl insert. This sequence was 99.4% complete and the strand that was
sequenced was the positive strand. Figure 5.9 shows the nucleotide sequence for strain
MLB 194. The DNA sequence was deposited to GeneBank under accession number
(AF050109). A linear restriction map of the inhA gene from strain MLB 194 was
constnicted using the MAP program of WEB ANGIS and is shown in Figure 5.10. The
nucleotide sequence of the inhA gene was translated using the Etranslate program of
WEB ANGIS.
259
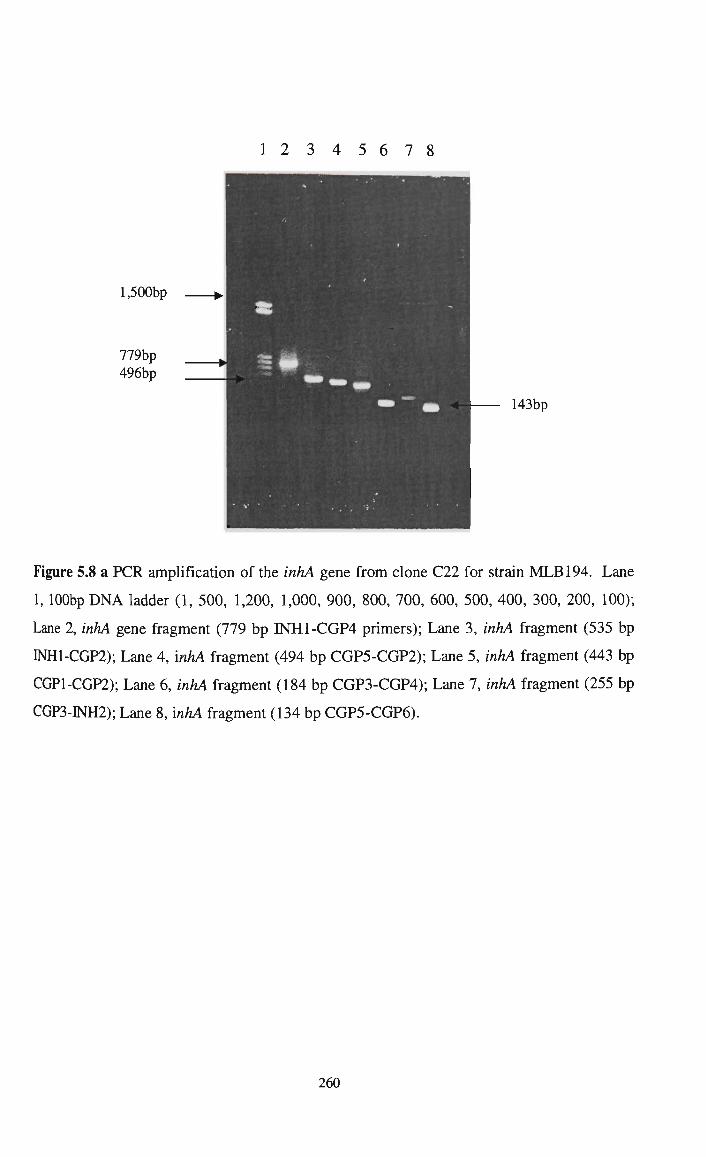
1 2 3 4 5 6 7 8
l,500bp
779bp 496bp
143bp
Figure 5.8 a PCR amplification of the inhA gene from clone C22 for strain MLB 194. Lane
1, lOObp DNA ladder (1, 500, 1,200, 1,000, 900, 800, 700, 600, 500, 400, 300, 200, 100);
Lane 2, inhA gene fragment (779 bp INH1-CGP4 primers); Lane 3, inhA fragment (535 bp
INH1-CGP2); Lane 4, inhA fragment (494 bp CGP5-CGP2); Lane 5, inhA fragment (443 bp
CGP1-CGP2); Lane 6, inhA fragment (184 bp CGP3-CGP4); Lane 7, inhA fragment (255 bp
CGP3-1NH2); Lane 8, inhA fragment (134 bp CGP5-CGP6).
260

00
I
N
M
U
in CO r-
I
ON
1-H
vn I m
ON in
g:
(N
r-I
CNl oo
cn
u
oo I
XT
cn
O
in I
in (N
a h—I
00
I
in in
CO
o u
in CN in
I
O oo T-H
C<l I
o
o
<N^ in (N
I o oo
PH in O U
o
m U PH 1-H
c X c i r oc
1
t+H
^ z C CO rt < fti J u m Cu tj-H
o • ^ ^S
^ ^ " ^ c3 OQ -D HJ sa s-s 1 2 is 0) 1/3 -C
. ^ S bO s o . o •«
Q -=; •s -^ •a e CkO (U
c/3 , • t/J
O <^ u, U
<o S >> ^
-2 £"
V5 C ) rt '^ 1 « U
f the
inh
A g
ene
sequ
enc
)m c
lone
s (d
esig
nate
d l<
ence
r.
o y 3
rt rt fl i3 <- rt D 2^ 00 a Q 2 O O Cl.
rt S ^
chem
ge
no
sing
t
C/D g fl ,£J O ' 2 «5 <i3 g • ^ i2 c/3 jw < '3; is ^ >> S 73 ^
r OJ) O 5 ;— t- C fe dl rt

1 ccggacacac aagatttctc gctcacaggg agtcaccaaa tgacaggcct
51 actcgaaggc aagcgcatcc tcgtcacggg gatcatcacc gattcgtcga
101 tcgcgttcca catcgccaag gtcgcccagg aggccggcgc cgaactggtg
151 ctgaccggtt tcgaccgcct gaagttggtc aagcgcatcg ccgaccgcct
201 gcccaagccg gccccgctgc tggaactcga cgtgcagaac gaggagcacc
251 tgtcgactct ggccgaccgg atcaccgccg agatcggtga gggcaacaag
301 atcgacggtg tggtgcactc gatcgggttc atgccgcaga gcggtatggg
351 catcaacccg ttcttcgacg cgccgtacga ggatgtgtcc aagggcatcc
401 acatctcggc gtactcgtac gcctcgctcg ccaaagccgt tctgccgatc
451 atgaatccgg gcggcggcat cgtcggcatg gacttcgacc ccacgccgcg
501 atgcccggcc tacaactgga tgaccgtcgc caagagcgcg ctcgaatcgg
551 tcaaccggtt cgtcgcgcgt gaggcgggca aggtgggcgt gcgctcgaat
601 ctcgttgcgg caggaccgaa tcgcacgctg gcgatgagcg caatcgtggg
651 cggtgcgctg ggcgacgagg ccggccagca gatgcagctg ctcgaagagg
701 gctgggatca gcgcgcgccg ctgggctgga acatgaagga cccgacgccc
751 gtcgccaaga ccgtgtgcgc actgctgtcg gactggctgc cggccaccac
801 cggcaccgtg atctacgccg acggcggcgc cagcacgcag ctgtt
Figure 5.9 Nucleotide sequence of the inhA gene for strain MLB 194 obtained from
positions 1 to 845. The sequence was submitted to GenBank (accession number
AF0501).
262

PM 11 ey II
H Ca veS ilt JIu III //
FT oa kq II
C a c 8 I
H i n P 1 I
B s tH Fh 5a II /
MT asS epfB I4as I5N1 IIII /
HMM pnb hlo III
D P n I
A 1 w I
H IT nf fi II /
TM ab qo II
B B DsPs pivt nEuU IIII
/
Figure 5.10 A Imear restriction map of the inhA gene of MLB194 obtained using the
MAP program of the WEB ANGIS.
MT j Has p H iep a P nI4 I h fI5 I I III
/ ccggacacacaagatttctcgctcacagggagtcaccaaatgacaggcctactcgaaggc
-|_ + + + + + + 60 ggcctgtgtgttctaaagagcgagtgtccctcagtggtttactgtccggatgagcttccg
B sS at Jy II /
aagcgcatcctcgtcacggggatcatcaccgattcgtcgatcgcgttccacatcgccaag
ttcgcgtaggagcagtgcccctagtagtggctaagcagctagcgcaaggtgtagcggttc H H N
BBBPS BCC Ba HiH gN BBH B M M sssscBM SvaBseHBanpKNNolBS Assp T As B w n astprgw ricaalhbePaaaaMasf gara a ci s 0 1 JKNGFlo FJSnHIaelllserlIro eWFI q iE 1 1 I IIIIIII IIIIIIIIIIIIIIVVII IIII I II I
I 11 I I I IIIIIIII I III I gtcgcccaggaggccggcgccgaactggtgetgaccggtttcgaccgcctgaagttggtc
121 + + + + + + 18 0 cagcgggtcctccggccgcggcttgaccacgactggccaaagctggcggacttcaaccag
H MFN S BCCHCa sng N a M C svapveMANpuoBlFuT T aB TvM ricaiIwcaA4Msaa9s a et ain
FJ8IJIoielHIlIu6e q Ir iRl IIIIIIIIIIIVIVIII I II III
I I I I I I I I I aagcgcatcgccgaccgcctgcccaagccggccccgctgctggaactcgacgtgcagaac
181 + + + + + + 24 0 ttcgcgtagcggctggcggacgggttcggccggggcgacgaccttgagctgcacgtcttg
B Bs sp H H il iBH Ca BBH H2MPSABnsiT E veH sspM D A A MBDM HM KBllacscena a ilp aiab p c 1 bcpn pb A6yelcgIRfq e JIh WEIo n i w ognl ho IIIIIIIIIII I III IIII I I I IIII II /// / / / / / / /
„ ^aggagcacctgtcgactctggccgaccggatcaccgccgagatcggtgagggcaacaag .41 + ^ ^ ^ ^ ^ 3QQ
ctcctcgtggacagctgagaccggctggcctagtggcggctctagccactcccgttgttc
263
H 1
n H P h
1 a I I
E c o 5
7 I
S B fAs aci
NiE III
/
C a c
8 I
B b
V
I

DT pa nq II
B s t 4 C I
A P a L I
B Bs sp
C Bil B vBsH2MTDsP iceKBbapiv RgSA6oqnEu IIIIIIIIII
// / /
N F 1 n aAu Ic4 liH III
/
B BAs ser liB III
/
M w o I
M b o I I
S f a N I
atcgacggtgtggtgcactcgatcgggttcatgccgcagagcggtatgggcatcaacccg 301 + + + + + + 360
tagctgccacaccacgtgagctagcccaagtacggcgtctcgccatacccgtagttgggc
T a q I
H Bi BC snHMssHR tPhnipgs UlalW6aa IIIIIIII / / /
F o k I
B s B t sS F at 5 Jy I II
/
B s Ft oF kb II
S fB as Nl II
C sR ps 6a II
BC ssR ips W6a III
C Ma wc o8 II
M n 1 I
C V
X
J I
B s r I
BB ss tt F4 5C II
F o k I
BH siBC
MsnsaH wHPtch oIlUBa IIIIII
/ //
ttcttcgacgcgccgtacgaggatgtgtccaagggcatccacatctcggcgtactcgtac 351 + + + + + + 42 0
aagaagctgcgcggcatgctcctacacaggttcccgtaggtgtagagccgcatgagcatg N F F N
B HI BH S n n S I M Ds iaTspNc AuBABu M f a b pp nifsacr c4scc4 w a I 0 nH fliKIiF iHligH o N I 1 II IIIIIII IIIIII I I I
// / / gcctcgctcgccaaagccgttctgccgatcatgaatccgggcggcggcatcgtcggcatg
cggagcgagcggtttcggcaagacggctagtacttaggcccgccgccgtagcagccgtac
B H H H N S sBBC B iBiCHCa g
T f SssaBsHHnsnapveMMNo B a a HttccthhPrPcailwwaM s q N lUUSgUaalFlBIJIooel 1 I I IIIIIIIIIIIIIIIIIIV I
/ / //// / / ///// gacttcgaccccacgcgcgcgatgccggcctacaactggatgaccgtcgccaagagcgcg
481 + + + + + + 54 0 ctgaagctggggtgcgcgcgctacggccggatgttgacctactggcagcggttctcgcgc
H H i H i BBH HnTiT n Assp hPanf c gara alqfi I eWFI m i l I IIII /// / /// ctcgaatcggtcaaccggttcgtcgcgcgtgaggcgggcaaggtgggcgtgcgctcgaat
541 + + + + + + 600 gagcttagccagttggccaagcagcgcgcactccgcccgttccacccgcacgcgagctta
H i
Mn H wP h ol a
II I
ctcgttgcggcaggaccgaatcgcacgctggcgatgagcgcaatcgtgggcggtgcgctg 601 + + + + + + 660
gagcaacgccgtcctggcttagcgtgcgaecgctactcgcgttagcacccgccacgcgac
264
H BiB
MsnsFH ntPtah lUlUua IIIIII
/ //
M w o I
A c i I
C a c 8 I
M w o I
C a c 8 I
H i n P 1 I
H h a I
T a q M
H iT nf fi II /
F n Au c4 iH •
II
S Aa vu a9 16
II /
H iT nf fi
II /
C a c 8
I
C a c 8
I
A c i
I
i n H P h 1 a
I I
M n 1 I

HH N F F M BCC CC aaH gSCn C n sP SvaEBvaFeepNofvuMAvEuMpvTTBT ricabicsIIaaMai4wlia4nAuasbs FJ8evJ8eIIIeINRHouJrHllIqeve IIIIIIIIIIIIVIIIIIIIIIIIIIII / / / /////// / / ////// /
ggcgacgaggccggccagcagatgcagctgctcgaagagggctgggatcagcgcgcgccg 661 + + + + + +
ccgctgctccggccggtcgtctacgtcgacgagcttctcccgaccctagtcgcgcgcggc
c V
i J I
M MbD bop oIn III
BH B F si sBBC Cn snAsssaAau HPlHttccc4 IlwIUUBiBH IIIIIIIIII / //// //
720
N 1 a I I I
c o S
AONPa vllpu a0au9 I9IM6 IIVII / //
B s a H I
P s h A I
H g a I
B c g I
B s t 4 C I
H i nFBH Psth Ipsa IIII
/
B b V I
T s P R I
H HM iCis
HHHnvnpM hhhPiPAw aaalJllo IIIIIIII //// /// ctgggctggaacatgaaggacccgacgcccgtcgccaagaccgtgtgcgcactgctgtcg
721 + + + •+ + + 780 gacccgaccttgtacttcctgggctgcgggcagcggttctggcacacgcgtgacgacagc
F H N C nBHC C a g BH vBuspaBvEeNoTsp B is4racciaIaMsra a JrHFIBgJeleleFI n IIIIIIIIIIIVIII I / /////
781 —
F H F n Bi CH C Nn
AuBsnHBaaKMaNluSA c4aaPhbceawcaa4fl iHnHlaeBIsoBrlHou IIIIIIIIIIIIIVIII
/ /// // / gactggctgccggccaccaccggcaccgtgatctacgccgacggcggcgccagcacgcag
ctgaccgacggccggtggtggccgtggcactagatgcggctgccgccgcggtcgtgcgtc M
N 1 a I V
B s t 4 C I
M b o
H
D P n I
840
CsP vpvT iAus Jlle IIII //// ctgtt
841 845 gacaa
.,
Enzymes that do not cut:
Aatll Acc65I Apal Apol BamHI Banll BlpI Bmrl
BseMII BsmI BsrGI BssSI
Bstzni Bsu36I EagI Ecil Kpnl Mfel Nhel NotI Pmel Pmll SacII SanDI Sgfl SgrAI Sspl Swal Xhol Xmal
Acll AscI Bbsl BplI BsmAI BstAPI Btgl
Ecll36II Mlul Nrul
PpulOI Sapl Smal TatI XmnI
Afel Asel BbvCI Bpml BsmBI BstBI Clal
EcoNI MscI Nsil Psil Sbfl Smll Tlil
Aflll Aval BciVI BpulOI BsmFI BstDSI
Ddel EcoRI Msel Nspl
PspOMI Seal SnaBI
Tsp509I
Afllll Avrll Bell Bsal
BspEI BstEII
Dral EcoRV MslI Pad Pstl SexAI Spel
Tthllll
Ahdl Bael Bfal BsaAI BspMI BstXI Drain Hindlll
Ncol Pcil
RsrII Sfcl Sphl Xbal
AlwNI Bael Bglll BsaBI BsrDI BstYI DrdI Hpal Ndel PflMI Sad Sfil Srfl Xcml
26(5

Figure 5.16 shows the comparison between the amino acid sequence of the InhA protein
for strain AS019 and MLB 194 using the program GCG/PRETTYBOX via the WEB
ANGIS).
5.4.2 Homology search results of the assembled sequence (FASTA,
BASTN, BLASTX)
The nucleotide similarity of the entire inhA gene sequence of MLB 194 was determined
using BLASTN sinularity search on the NCBI database. A high degree of similarity was
seen with the inhA gene of mycobacterial species. The results of the BLASTN search are
shown in Table 5.6.
The similarity scores between InhA deduced amino acid sequences of MLB 194 and
AS019 were calculated using GCG/BESTHT and GCG/GAP programs. The results
showed the two proteins were 98% identical and the similarity score between the InhA
protein of MLB 194 and M. smegmatis was 99.62%.
Tables 5.7 and 5.8 summarise the results of BLASTX and FASTA homology searches.
The highest similarity score was 83-99% with that of mycobacterial species. The
deduced protein from MLB 194 was compared to that of all known proteins in databases
using BLASTP program. As seen for ASOl9, the highest similarity was observed with
that of mycobacterial proteins and low homology scores were seen for non-mycobacterial
proteins of other species, including the fabI (P. aeruginosa), EnvM and short chain
alcohol dehydrogenase of E. coli, Enoyl-ACP reductase of (Brassica napus) etc.
266

5
c
3 1)
J3
3 IZl
o J3
"o
s o
00
CQ
H
^ > s: 5U
^ >
:5 ^
s •S 5 « ^ ^ -| 0 ^ -C •S
•S
bov
^ <+-! 0 ^ -a; •S
"t "S: .K '
3 •S
"0 0
•*j
s .s 'C a •1 -5 a. ^ oi
<3 Co 0 C tJC
g
o;
0
GIR
c •3
1 1
to
•S S5
^ S
li) -C)
s •» .«
^
•S -K^
Q
^ ^ 5 <<>
^
^ ON
5 KJ
s
OS
5
• *
^ 0 0 o o
o o
ON 1 0
o o
r<1 0 0 0 0
o o
1 ^
0 0
o o
o if.
1>3
s ^
0 2 a a « 0 ^ ^ -s i> -S S 6ci
^^ «5 « ^ ^ ^ a a:
um
• N - »
•§ .5
typ
^
o o

1/3
T3
5 u z u
s o
ON
5
c '3 11
1/3
s a
S <3
U o
, c ' S -» o
<a 3 U3 (U 11
O IH
C/3
CO
X
<
CQ
H
a
Co
O
to
s
a
I Co
5
00 r<-)
TT r^
ro ^
m ^
_ „
^ ^ • *
o o
i n Tl- o S 2
' I - Tf o o o
TT Tf in
o o
00 NO
0 0
o o
o o
TT ON
5 03
Co O
a
3
Co O K 3
Co Uj
10
OQ

Table 5.8 FASTA homology search results for the inhA gene of MLB 194.
Organism
M. smegmatis
M. tuberculosis
M bovis
M. avium
M. bovis
P. aeruginosa
Actinamadura hisca
E. coli
E. coli
Gene % homology
inhA 99.40
inhA 82.88
inhA 82.88
inhA 83.84
NADH dependent malat 53.56
fabI 52.80
polyketide synthase 53.87
envM 53.02
Short chain alcohol 53.02
Dehydrogenase
269
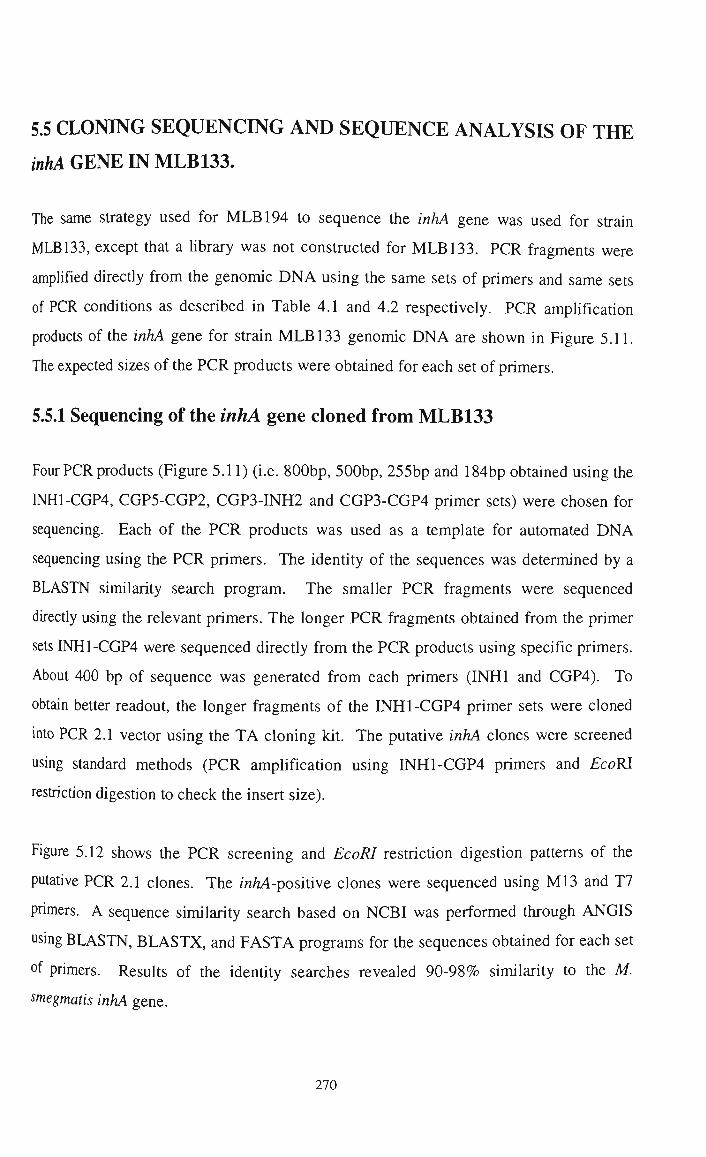
5.5 CLONING SEQUENCING AND SEQUENCE ANALYSIS OF THE
inhA GENE IN MLB133.
The same strategy used for MLB 194 to sequence the inhA gene was used for strain
MLB133, except that a hbrary was not constructed for MLB133. PCR fragments were
amplified directiy from the genomic DNA using the same sets of primers and same sets
of PCR conditions as described in Table 4.1 and 4.2 respectively. PCR amphfication
products of the inhA gene for strain MLB 133 genomic DNA are shown in Figure 5.11.
The expected sizes of the PCR products were obtained for each set of primers.
5.5.1 Sequencing of the inhA gene cloned from MLB133
Four PCR products (Figure 5.11) (i.e. 800bp, 500bp, 255bp and 184bp obtained using the
INH1-CGP4, CGP5-CGP2, CGP3-INH2 and CGP3-CGP4 primer sets) were chosen for
sequencing. Each of the PCR products was used as a template for automated DNA
sequencing using the PCR primers. The identity of the sequences was determined by a
BLASTN similarity search program. The smaller PCR fragments were sequenced
directly using the relevant primers. The longer PCR fragments obtained from the primer
sets INH1-CGP4 were sequenced directly from the PCR products using specific primers.
About 400 bp of sequence was generated from each primers (INHl and CGP4). To
obtain better readout, the longer fragments of the INH1-CGP4 primer sets were cloned
into PCR 2.1 vector using the TA cloning kit. The putative inhA clones were screened
using standard methods (PCR amplification using INH1-CGP4 primers and EcoRl
restriction digestion to check the insert size).
Figure 5.12 shows the PCR screening and EcoRI restriction digestion patterns of the
putative PCR 2.1 clones. The mM-positive clones were sequenced using M13 and T7
primers. A sequence similarity search based on NCBI was performed through ANGIS
using BLASTN, BLASTX, and FASTA programs for the sequences obtained for each set
of primers. Results of the identity searches revealed 90-98% similarity to the M.
smegmatis inhA gene.
270

5.5.2 Sequence assembly for MLB133
Sequences data of four overlapping fragments of the MLB 133 inhA gene were used to
assemble one continuos sequence for the inhA gene. The sequences were assembled both
manually and by using GCG program of ANGIS. Figure 5.13a summarises the
sequencing strategy. After sequence assembly the sequence of inhA gene obtained was
from position 1-810. The nucleotide sequence of the inhA gene of MLB 133 is shown in
Figure 5.13b. In both strains MLB194 and MLB133 the strand that was sequenced was
the positive strand. The assembled DNA sequence of MLB 133 was 95% complete and
only 40 bp need to be sequenced to obtained a full length inhA gene. The DNA
sequences were submitted to the GeneBank. A linear restriction map of the inhA gene for
MLB 133 was also created using the MAP program of the WEB ANGIS and this is shown
in Fig 5.13c.
5.5.3. Sequence analysis of the assembled inhA gene for MLB 133
The nucleotide sequence and deduced InhA protein from MLB 133 was analysed using
BLASTN, BLASTX, FASTA programs (Tables 5.9, 5.10, and 5.11). The inhA gene of
MLB 133 showed the highest similarity score of 81-96 % with that of mycobacterial
species. Lowest homology was observed with that of other proteins like EnvM, Short
chain alcohol dehydrogenase of (E. coli), ACP protein reductase of (Brassica napus),
and/aW of P. aeruginosa. Amino acids sequence comparison and calculated similarity
score of the deduced InhA protein for strain MLB 133 and M. smegmatis using
(GCG/BESTFIT and GCG/GAP) programs ranged between 94.32 to 97%.
271

1 2 3 4 5 6
l,200bp
779bp
500bp 256bp
Figure 5.11 PCR amphfication of the inhA gene from the genomic DNA of strains MLB 133.
Lane 1 100 bp DNA ladder; Lane 2 to 5 contained inhA gene fragment of INH1-CGP4,
CGP5-CGP2, CGP5-CGP6, and CGP3-INH2primers sets. Lane 6 contained probase PCR
markers.
272

1 2 3 4
l,500bp
l.OOObp
1 2 3 4
779bp
PCR2.1 vector
Figure 5.12 Analysis of plasmid DNA from clones generated in the PCR 2.1 vector by
insertion of PCR amplification products from genomic DNA of C. glutamicum strain
MLB 133.
a PCR products obtained using primers INH1-CGP4. Lane 1 PCR markers.(Probase,
1,500, 1,200, 1,000, 900, 800, 700, 600, 500, 400, 300, 200, 100), lanes 2 to 4 contained
inhA gene fi-om C. glutamicum strains AS019, MLB 194 and MLB 133.
b Restriction digestion of PCR2.1 clones containing a 779 bp PCR amphfied gene using
primers sets INHl and CGP4 ft-om C. glutamicum strains AS019, MLB194 and MLB133
with £coRl restriction enzyme. Lane 1 Hindlll digested Lambda DNA size markers;
Lanes 2,3,4 ASOl9, MLB 194, MLB
273

1
133 CG
(100-510) ^33 P2
(61 460)
T7(PCR hih.seq) >
1-543
(PCR 133 INH) 401
<-
-771
PCR 133
1
MLB 133P4
594 - 738
133 P3 (633-800) >
-\ 1-
(401-778)
PCR INH. Seq(320 - 778)
Figure 5.13a Schematic illustration of the inhA gene sequence assembly for C.
glutamicum strain MLB 133. Primers used and completed sequence of the inhA gene for
this strain are shown in Table 4.1 and Fig 5.13 b respectively.
274

1 CCGGACACAC AAGATTTCTC GCTCACAAGG AGTCACCAAA TGACAGGCCT
51 ACTCGAAGGC AAGCGCATCC TCGTCACGGG GATCATCACC GATTCGTCGA
101 TCGCGTTCCA CATCGCCAAG GTCGCCCAGG AGGCCGGCGC CGAACTGGTG
151 CTGACCGGTT TCGACCGCCT GAAGTTGGTC AAGCGCATCG CCGACCGCCT
201 GCCCAAGCCG GCCCCGCTGC TGGAACTCGA CGTGCAGAAC GAGGAGCACC
251 TGTCGACTCT GGCCGACCGG ATCACCGCCG AGATCGGTGA GGGCAACAAG
301 ATCGACGGTG TGGTGCACTC GATCGGGTTC ATGCCGCAGA GCGGTATGGG
351 CATCAACCCG TTCTTCGACG CGCCGTACGA GGATGTGTCC AAGGGCATCC
401 ACATCTCGGC GTACTCGTAC GCCTCGCTCG CCAAAGCCGT TCTGCCGATC
451 ATGAATCCGG GCGGCGGCAT CGTCGGCATG GACTTCGACC CCACGCGCGC
501 GATGCCGGCC TACAACTGGA TGACCGTCGC CAAGAGCGCG CTCGAATCGG
551 TCAACCGGTT CGTCGCGCGT GAGGCGGGCA AGGTGGGCGT GCGCTCGAAT
601 CTCGTTGCGG CAGGACCGAT CCGCACGCTG GCGATGAGCG CAATCGTGGG
651 CGGTGCGCTG GGCGACGAGG CCGGCCAGCA GATGCAGCTG CTCGAAGAGG
701 GCTGGGATCA GCGCGCGCCG CTGGGCTGGA ACATGAAGGA CCCGACGCCC
751 GTCGCCAAGA CCGTGTGCGC ACTGCTGTAA GACCGTGTGC GCACTGCTGT
801 AAGTAACCG ATCTACGACG GCTTCGGCGC CAGCACGCAG CTGTTGTGAT
Figure 5.13b Nucleotide sequence of the inhA gene for strain MLB 133, based on primers
derived from M. smegmatis inhA gene sequences (INHl, INH2, CGP2, CGP3, CGP4,
CGP5, CGP6).
275

H Ca veS ilt JIu III
FT oa kq II
H B C i s a n tH c P Fh 8 1 5a I I II
/
MT asS epfB I4as I5N1 IIII /
HMM D pnb p hlo n III I
A 1 w I
Figure 5.13c A linear restriction map of the inhA gene of M L B 133 created by accessing
MAP program of the W E B ANGIS.
MT H Has p H iep PM a p nI4 11 I h fl5 ey I I III II
/ // CCGGACACACAAGATTTCTCGCTCACAAGGAGTCACCAAATGACAGGCCTACTCGAAGGC
I + + + + + + 60 GGCCTGTGTGTTCTAAAGAGCGAGTGTTCCTCAGTGGTTTACTGTCCGGATGAGCTTCCG
H B B B iT TM DsPs sS nf ab pivt at fi qo nEuU Jy II II IIII II / / /
RRGCGCRTCCTCGTCACGGGGRTCATCRCCGATTCGTCGATCGCGTTCCACRTCGCCRRG 61 + + + + + + 120
TTCGCGTAGGAGCAGTGCCCCTAGTAGTGGCTAAGCAGCTAGCGCAAGGTGTAGCGGTTC
H H N ' BBBPS BCC Ba HiH gN BBH B
M M sssscBM SvaBseHBanpKNNolBS Assp T As B w n astprgw ricaalhbePaaaaMasf gara a ci s 0 1 JKNGFlo FJ8nHIaeIlIserIIro eWFI q iE 1 1 I IIIIIII IIIIIIIIIIIIIIVVII IIII I II I
I I I / / / //////// / /// / GTCGCCCAGGAGGCCGGCGCCGAACTGGTGCTGACCGGTTTCGACCGCCTGAAGTTGGTC
121 + + + + + + 180 CAGCGGGTCCTCCGGCCGCGGCTTGACCACGACTGGCCAAAGCTGGCGGACTTCAACCAG
H MFN S BCCHCa sng N a svapveMANpuoBlFuT
ricaiIwcaA4Msaa9s FJBIJIoielHIlIu6e IIIIIIIIIIIVTVIII / / / / / / //
AAGCGCATCGCCGACCGCCTGCCCAAGCCGGCCCCGCTGCTGGAACTCGACGTGCAGAAC 181 + + + + + + 240
TTCGCGTAGCGGCTGGCGGACGGGTTCGGCCGGGGCGACGACCTTGAGCTGCACGTCTTG
B Bs sp H H il iBH Ca BBH H2MPSABnsiT E veH sspM D A A MBDM HM KSllacscena a ilp aiab p c 1 bcpn pt> A6yelcgIRfq e JIh WEIo n i w ognl ho niiirriiii i iii nn i i i nn ii
/ / / / / / / / / / GAGGAGCACCTGTCGACTCTGGCCGACCGGATCACCGCCGAGATCGGTGAGGGCAACAAG
241 + + + + + + 300 CTCCTCGTGGACAGCTGAGACCGGCTGGCCTAGTGGCGGCTCTAGCCACTCCCGTTGTTC
276
H i n H P h 1 a I I
E c o 5 7 I
S B fAs
aci NiE III
/
C a
c 8 I
B
b v I
T
a q I
M aB
et Ir II
C TvM
ain iRl III
/

B Bs
B sp N F S A C Bil B 1 n B M S
DT t p vBsH2MTDsP aAu BAs M b f pa 4 a iceKBbapiv Ic4 ser w o a
N I
nq C L RgSA6oqnEu l i H l i B o I
II I I i i i innii in m i i / / / / / / ATCGACGGTGTGGTGCACTCGATCGGGTTCATGCCGCAGAGCGGTATGGGCATCAACCCG
301 + + + + — + + 360 TAGCTGCCACACCACGTGAGCTAGCCCAAGTACGGCGTCTCGCCATACCCGTAGTTGGGC
H B B Bi BC s B s S C BC snHMssHR F t sS Ft fB sR ssR
a tPhnipgs o F at oF as ps ips q UlalW6aa k 5 Jy k5 Nl 6a W6a I IIIIIIII I I II II II II III
/ / / / TTCTTCGACGCGCCGTACGAGGATGTGTCCAAGGGCATCCACATCTCGGCGTACTCGTAC
361 + + + -+- + + 420 AAGAAGCTGCGCGGCATGCTCCTACACAGGTTCCCGTAGGTGTAGAGCCGCATGAGCATG
N F F N C C B H l B H S n n 5 1
Ma M V M Ds iaTspNc AuBABu M f a wc n i b PP nifsacr c4scc4 w a I o8 1 J o nH fliKIiF iHligH o N I II I I I II IIIIIII IIIIII I I I
// / / GCCTCGCTCGCCAAAGCCGTTCTGCCGATCATGAATCCGGGCGGCGGCATCGTCGGCATG
421 + + + + + + 48 0 CGGAGCGAGCGGTTTCGGCAAGACGGCTAGTACTTAGGCCCGCCGCCGTAGCAGCCGTAC
B H H H N BB BH S sBBC B iBiCHCa g ss siBC
T f sssaBsHHnsnapveMMNo B B tt F MsnsaH a a HttccthhPrPcailwwaM s s F4 o wHPtch q N IUU8gUaalF18IJIooeI 1 r 5C k ollUSa I I IIIIIIIIIIIIIIIIIIV I I II I IIIIII
/ / //// / / ///// / // GACTTCGACCCCACGCGCGCGATGCCGGCCTACAACTGGATGACCGTCGCCAAGAGCGCG 481
^ I- + + + + 540 CTGAAGCTGGGGTGCGCGCGCTACGGCCGGATGTTGACCTACTGGCAGCGGTTCTCGCGC
" « H H 1 H i BBH BiB C C i H
h p l i f " ^ ^ ^ P MsnsFH M A a M a n H T i T npanf c g a r a n t P t a h w c c w c P h a n f a l q f i I eWFI l u i u u a o i 8 o 8 1 a q f i ]]y] I ^]]] m i l l I I I I I I I ? I I ' / / / / / / / / / CTCGAATCGGTCAACCGGTTCGTCGCGCGTGAGGCGGGCAAG
^ _ _ ^ ^ GAGCTTAGCCAGTTGGCCAAGCAGCGCGCACTCCGCCCGTTCCACCCGCACGC
/ 541 ___ZJ__ _^_ _^'^'^'- ^^^^'-^'-^'-'^^^J^GGCGGGCAAGGTGGGCGTGCGCTCGAAT
-+ + + + 600 5CGAGCTTA
^ S H H n Aa C C i i
A u A v u M D A a B a M n H A n H M c4 l a 9 b p c c s c w P h c P h n iH wI6 o n i e i e O l a i l a l ^ I I I I I I I I I I I I I I I I I
601 ^!^^!^^'^^^^-^^^^^^^TCCGCACGCTGGCGATGAGCGCAATCGTGGGCGGTGCGCTG
GAGCAACGCCGTCCTGGCTAGGCGTGCGACCGCTACTCGCGTTAGCACCCGCCACGCGAC
277:

• -— 'HH N F r M BCC CC aaH gSCn C n sP SvaEBvaFeepNofvuMAvEuMpvTTBT ricabicslIaaMai4wlia4nAuasbs FJSevJBelllelNRHouJrHllIqeve iiiriiiiiirivTiriiriiiiinn / / / /////// / / ////// /
GGCGACGAGGCCGGCCAGCAGATGCAGCTGCTCGAAGAGGGCTGGGATCAGCGCGCGCCG 661 + + + + + + 720
CCGCTGCTCCGGCCGGTCGTCTACGTCGACGAGCTTCTCCCGACCCTAGTCGCGCGCGGC
c V
1
J I
M MbD bop oIn in
BH B F si sBBC Cn snAsssaAau HPlHttccc4 IlwIUUBiSH IIIIIIIIII / //// //
H HM iCis
HHHnvnpM hhhPiPAw aaalJllo rriiiiii //// ///
N 1 a I I I
E c o S
AONPa vllpu a0au9 I9IM6 IIVII / //
B s a H I
P s h A I
H g a I
B s t 4 c I
H i nFBH Psth Ipsa IIII
/
T s P R I
B s t 4 c I
H i nFBH Psth Ipsa IIII
/
T s P R I
M a e I I I
M D b P o n I I
CTGGGCTGGAACATGAAGGACCCGACGCCCGTCGCCAAGACCGTGTGCGCACTGCTGTAA 721 + + + + + + 780
GACCCGACCTTGTACTTCCTGGGCTGCGGGCAGCGGTTCTGGCACACGCGTGACGACATT H F
C Bi CH CN n C V BsnHBaaKNalSuTAv i aaPhbceaacaf4sli J nHlaeSIsrBIoHeuJ I IIIIIIIIIIVIIIII
/ /// // / / GACCGTGTGCGCACTGCTGTAAGTAACCGATCTACGACGGCTTCGGCGCCAGCACGCAGC
781 + + + + + + 84 0 CTGGCACACGCGTGAC'GACATTCATTGGCTAGATGCTGCCGAAGCCGCGGTCGTGCGTCG
M sP pv B Au b II V II I // TGTTGTGAT
841 849 ACAACACTA
Enzymes that do not cut
Aatll Apal BamHI Blpl
BseMII BsrGI
Bstzni EagI Kpnl Nhel Pmel SacII Sgfl Sspl Xhol
Acc65I Apol Banll Bmrl BsmI BssSI Bsu36I Ecil Mfel NotI Pmll SanDI SgrAI Swal Xmal
Acll AscI Bbsl BplI BsmAI
BstAPI Btgl
EC1136I1 Mlul Nrul
PpulOI Sapl Smal TatI XmnI
Afel Asel BbvCI Bpml BsmBI BstBI Clal
EcoNI MscI Nsil Psil Sbfl Smll Tlil
Aflll Aval BciVI BpulOI BsmFI BstDSI
Ddel EcoRI Msel Nspl
PspOMI Seal SnaBI
Tsp509I
Afllll Avrll Bell Bsal BspEI BstEII
Dral EcoRV MslI Pael Pstl SexAI Spel
Tthllll
Ahdl
Bael Bfal BsaAI BspMI BstXI Drain Hindlll
Ncol Pcil RsrII Sfcl Sphl Xbal
AlwNI Bael Bglll BsaBI BsrDI BstYI DrdI Hpal Ndel PflMI Sad Sfil Srfl Xcml
278

m
ffl
is
a
3
U o <u G u ao
s <u
;3
U
o
o J 3
CQ
«r5
.fi
^ > c I i i
:§ >
:s ^
s a p a ^ ^ o ^ -5 .K ~
•5
bov
^ < * . -o ^ -s: •S
^ - .K ^
3 .g
o
^
S a ^ a •1 ^ Q. ^ Od
a ^ o s: Sj g
a
o
s o c '3 i3 t/3
.52 So
-2 a
^ -o a ^
Cn • I - * •»»«
Q
1 <y
s t o
'
ro m S J S
5 H-l
i n so 00 o O
o o
ON o o
oo o o
ON
r-)
ON ~
I S ^
a •« o ^ ^ -s sj -a s SP a o ~ o »-
^ ^ ^ o a:
•S a .§ •S
typ
Co Ci!

V M K!
X> CS
-•-<
CQ U
z J= 00
_d
r<1
s
e 1 01
O
CO
'5 o 1 1
o
ON
5
o
>3
a
ttj
•S a .1 -S
o a: 'I—»
5« w «
rn
i r i
o
ro O
m — '— o Tl- Tt Tt —
i n i n o
o t o ON —
Tt T t o
o o
T t o
Tt O o 00 (N
O
Cu U
> o a W
to
a
a 0 0
o r~- o 00 —'
c S3
C 1> D (U
•T3
§ I
ON
o o
o
•c
CO
5 o o
5 5U
~2 a
a
o K
S ^ ^ o;
_a a
3 a
Co tq oq

Table 5.11 FASTA homology search results for the inhA gene sequence of MLB133.
M. smegmatis
M. tuberculosis
M. bovis
M. avium
P. aeruginosa
E. coli
Gene
inhA
inhA
Putative Keto-acyl ACP
inhA
fabI
envM protein gene
E. coli
% homology
97.17
81.06
81.08
81.62
52.74
53.02
Short chain alcohol dehydrogenase 53.02

5.6 COMPARISON OF THE inhA GENE AND GENE PRODUCTS
IN a GLUTAMICUM STRAINS AS019, MLB133 AND MLB194
The inhA gene sequences of C. glutamicum strains AS019, MLB 133, and MLB 194
were deposited to the GenBank. Table 5.12 showed the asscession number for these
genes.
5.6.1 Southern hybridisation patterns
Genomic DNA of each strain was digested with restriction enonucleases, transferred
to the nylon membrane and probed with a 800 bp PCR amplification products from
the inhA of ASOl9 which was DIG labelled. Since the small part of the inhA gene
was used as a probe previously, the possibility that a particular sequence was repeated
in the genome could not be ruled out. Therefore the main purpose of this experiment
was to see how many copies of the gene were present in the genome and to validate if
there is any consistency in the results when small and large probes were used. Figure
5.14a and 5.14b show the results of Southern blot hybridisation of genomic DNA of
the four different strains of C. glutamicum (AS019, MLB 194, MLB 133, and ATCC
13032) digested with Pstl, and Kpnl/EcoRl. The results showed that the Southern
hybridisation pattern obtained with the larger probe was similar with the Southem
pattem obtained with the small probe, when ^ P labehed major bands of 9.2, 5.2, 3.5
kb were obtained whereas using the DIG system major bands of 6.5, 5.2, and 3.5 kb
were common with both probes (CGP3-INH2 and INH1-CGP4). The two small
bands seen previously in Pstl Southern hybridisation were not seen this time. One
possible explanation is that Pstl enzyme was from a different source and digestion
was accomplished with the addition of BSA each time. The variations in the results
with two approaches (DIG and ^¥) can be explained by the fact that the DIG system
uses 300-1,000 ng of probe DNA whereas the ^¥ system uses only 25 ng of DNA.
Therefore the DIG system is more sensitive than ^ P system. Table 5.13 shows the
molecular weights of the hybridisation signals. The three strains showed similar
patterns as evident from the hybridisation signals for each enzyme used,
demonstrating similarity between the strains. The Southem pattem obtained with
Kpnl/EcoRl double digested genomic DNA with large probe also showed multiple
signals thus confirming the previous observation with the smaller probe.

Table 5.12 Accession numbers for the inhA gene sequences of the three corynebacterial
strains were submitted to the Gene bank.
ORGANISM
Corynebacterium glutamicum ASOl9
Corynebacterium glutamicum
MLB 133
Corynebacterium glutamicum
MLB194
ACCESSION NUMBER
AF 139472
AF145898
AF050109

1 2 3 4 5
8.5kb 7.3kb
3.59kb
Figure 5.14 Southem hybridisation analysis of digested genomic DNA of C. glutamicum
strains ASOl9, MLB 194, MLB 133 probed with the DIG-labelled PCR amplification
products obtained from AS019 using the INH1-CGP4 primers sets.
a Pstl digested genomic DNA. Lane 1, SPPI/JECORI DNA size markers; Lanes, 2 to 5
contained C. glutamicum strains AS019, MLB 194, MLB 133, ATCC 13032 respectively.

8.5kb
4.8kb
1.9kb
b Kpnl/EcoRl double-digested genomic DNA. Lane 1 SPPl/EcoRl DNA size markers.
Lanes 2, 3, and 4, C. glutamicum, strains AS019, MLB 194, MLB 133.

Table 5.13 Molecular weights of the genomic DNA fragments obtained after
Southem hybridisation for AS019, MLB133, and MLB194 using a DIG-labehed
probe (800bp PCR product from ASOl9 DNA).
SPFVEcoRl Markers
8.5
7.35
6.10
4.84
3.59
2.81
1.95
1.86
1.51
1.39
1.16
0.98
0.72
0.48
0.36
KpnyEcoRY
8.5
6.1
1.95
Pstl
6.5
5.2
3.5
2.5

5.6.2 Sequence alignment of the inhA genes of AS019, MLB133, and
MLB194
Alignment of sequence data (Fig.5.15a) for the three inhA genes of C. glutamicum
strains AS019, MLB133 and MLB194 with M. smegmatis inhA gene (Banerjee et al,
1994) showed that the three genes aligned almost perfectly, as expected from the
similarity scores. The alignment indicated that the translation initiation codon (ATG)
and termination codon were highly conserved and present at the corresponding
positions in all three genes of corynebacteria and M. smegmatis.
However, nucleotide variations (single base changes) were observed at several points.
Nucleotide sequences were verified several times by PCR amplification dhectly from
the genomic DNA and also from the clones thus minimizing the risk of any
sequencing error that have occurred. The nucleotide variations at different points are
shown by red letters in Figure 5.15 b. The sequences of MLB 133 and MLB 194 were
more similar to M. smegmatis: the variations were observed mostly in AS019 and M.
smegmatis sequences. The common nucleotide substitutions were observed between
AS019 and M. smegmatis and AS019 and MLB 194 and MLB 133. For example, A
(adenine) at position 115 is replaced by G in ASOl9; similarly, at position 120, T is
replaced by C in AS019 whereas in MLB 133 and MLB 194 these two bases are (A, T),
similar to M. smegmatis.

Figure 5.15a Muhiple sequence ahgnment of the inhA genes of C. glutamicum
strains ASOl9, MLB 133 and MLB 194, with the inhA gene of M smegmatis using the
Eclustaw program of WEB ANGIG. Asterisk represents similar nucleotides and a gap
represents a difference in nucleotide at that position.
194d
AS019d
M. smegD
133.seq
194d
AS019d
M. smegD
133.seq
194d
AS019d
M.smegD
133.seq
10 20 30 40 50 60
CCGGACACACAAGATTTCTCGCTCACAGGGAGTCACCAAATGACAGGCCTACTCGAAGGC
CCGGACACACAAGATTTCTCGCTCACAAGGAGTCACCAAATGACAGGCCTACTCGAGGGC
CCGGACACACAAGATTTCTCGCTCACAAGGAGTCACCAAATGACAGGCCTACTCGAAGGC
CCGGACACACAAGATTTCTCGCTCACAAGGAGTCACCAAATGACAGGCCTACTCGAAGGC
*************************** **************************** ***
AAGCGCATCCTCGTCACGGGGATCATCACCGATTCGTCGATCGCGTTCCACATCGCCAAG
AAGCGCATCCTCGTCACGGGGATCATCACCGATTCGTCGATCGCGTTCCACATCGCCAAG
AAGCGCATCCTCGTCACGGGGATCATCACCGATTCGTCGATCGCGTTCCACATCGCCAAG
AAGCGCATCCTCGTCACGGGGATCATCACCGATTCGTCGATCGCGTTCCACATCGCCAAG
************************************************************
GTCGCCCAGGAGGCCGGCGCCGAACTGGTGCTGACCGGTTTCGACCGCCTGAAGTTGGTC
GTCGCCCAGGAGGCCGGCGCCGAACTGGTGCTGACCGGTTTCGACCGCCTGAAGTTGGTC
GTCGCCCAGGAGGCCGGCGCCGAACTGGTGCTGACCGGTTTCGACCGCCTGAAGTTGGTC
GTCGCCCAGGAGGCCGGCGCCGAACTGGTGCTGACCGGTTTCGACCGCCTGAAGTTGGTC
************************************************************
194d
AS019d
M.smegD
133.seq
AAGCGCATCGCCGACCGCCTGCCCAAGCCGGCCCCGCTGCTGGAACTCGACGTGCAGAAC
AAGCGCATCGCCGACCGCCTGCCCAAGCCGGCCCCGCTGCTGGAACTCGACGTGCAGAAC
AAGCGCATCGCCGACCGCCTGCCCAAGCCGGCCCCGCTGCTGGAACTCGACGTGCAGAAC
AAGCGCATCGCCGACCGCCTGCCCAAGCCGGCCCCGCTGCTGGAACTCGACGTGCAGAAC
********************* ***************************************
194d
AS019d
M.smegD
133.seq
GAGGAGCACCTGTCGACTCTGGCCGACCGGATCACCGCCGAGATCGGTGAGGGCAACAAG
GAGGAGCACCTGTCGACTCTGGCCGACCGGATCACCGCCGAGATCGGTGAGGGCAACAAG
GAGGAGCACCTGTCGACTCTGGCCGACCGGATCACCGCCGAGATCGGTGAGGGCAACAAG
GAGGAGCACCTGTCGACTCTGGCCGACCGGATCACCGCCGAGATCGGTGAGGGCAACAAG
************************************************************

194d ATCGACGGTGTGGTGCACTCGATCGGGTTCATGCCGCAGAGCGGTATGGGCATCAACCCG
AS019d ATCGACGGTGTGGTGCACTCGATCGGGTTCATGCCGCAGAGCGGTATGGGCATCGACCCG
M. smegD ATCGACGGTGTGGTGCACTCGATCGGGTTCATGCCGCAGAGCGGTATGGGCATCAACCCG
Pcrp4 . seq ATCGACGGTGTGGTGCACTCGATCGGGTTCATGCCGCAGAGCGGTATGGGCATCAACCCG * * * * * * * * * * * * * * * * * * * * * * * * * * * * * * * * * j t * ^ * j t * ^ j . ^ ^ j ^ ^ . ^ ^ ^ j ^ ^ j ^ ^ ^ ^ ^ * * * * *
194d TTCTTCGACGCGCCGTACGAGGATGTGTCCAAGGGCATCCACATCTCGGCGTACTCGTAC
AS019d TTCTTCGACGCGCCGTACGAGGATGTGTCCAAGGGCATCCACATCCCGGCGTACTCGTAC
M. smegD TTCTTCGACGCGCCGTACGAGGATGTGTCCAAGGGCATCCACATCTCGGCGTACTCGTAC
Pcrp4 . seq TTCTTCGACGCGCCGTACGAGGATGTGTCCAAGGGCATCCACATCTCGGCGTACTCGTAC
********************************************* ******** ******
194d
AS019d
M.smegD
133. seq
194d
AS019d
M. smegD
133.seq
GCCTCGCTCGCCAAAGCCGTTCTGCCGATCATGAATCCGGGCGGCGGCATCGTCGGCATG
GCCTCGCTCGCCAAAGCCGTTCTGCCGATCATGAATCCGGGCGGCGGCATCGTCGGCATG
GCCTCGCTCGCCAAAGCCGTTCTGCCGATCATGAATCCGGGCGGCGGCATCGTCGGCATG
GCCTCGCTCGCCAAAGCCGTTCTGCCGATCATGAATCCGGGCGGCGGCATCGTCGGCATG
************************************************************
GACTTCGACCCCACGCGCGCGATGCCGGCCTACAACTGGATGACCGTCGCCAAGAGCGCG
GACTTCGACCCCACGCGCGCGATGCCCGGCTACAACTGGATGACCGTCGCCAAGAGCGCG
GACTTCGACCCCACGCGCGCGATGCCGGCCTACAACTGGATGACCGTCGCCAAGAGCGCG
GACTTCGACCCCACGCGCGCGATGCCGGCCTACAACTGGATGACCGTCGCCAAGAGCGCG
************************** * *******************************
194d
AS019d
M. smegD
133.seq
194d
AS019d
M.smegD
133.seq
CTCGAATCGGTCAACCGGTTCGTCGCGCGTGAGGCGGGCAAGGTGGGCGTGCGCTCGAAT
CTCGAATCGGTCAACCGGTTCGTCGCGCGTGAGGCGGGCAAGGTGGGCGTGCGCTCGAAT
CTCGAATCGGTCAACCGGTTCGTCGCGCGTGAGGCGGGCAAGGTGGGCGTGCGCTCGAAT
CTCGAATCGGTCAACCGGTTCGTCGCGCGTGAGGCGGGCAAGGTGGGCGTGCGCTCGAAT
************************************************************
CTCGTTGCGGCAGGACCGAATCGCACGCTGGCGATGAGCGCAATCGTGGGCGGTGCGCTG
CTCGTTGCGGCAGGACCGATCCGCACGCTGGCGATGAGCGCAATCGTGGGCGGTGCGCTG
CTCGTTGCGGCAGGACCGATCCGCACGCTGGCGATGAGCGCAATCGTGGGCGGTGCGCTG
CTCGTTGCGGCAGGACCGATCCGCACGCTGGCGATGAGCGCAATCGTGGGCGGTGCGCTG
******************* ***************************************
194d
AS019d
M.smegD
133.seq
GGCGACGAGGCCGGCCAGCAGATGCAGCTGCTCGAAGAGGGCTGGGATCAGCGCGCGCCG
GGCGACGAGGCCGGCCAGCAGATGCAGCTGCTCGAAGAGGGCTGGGATCAGCGCGCGCCG
GGCGACGAGGCCGGCCAGCAGATGCAGCTGCTCGAAGAGGGCTGGGATCAGCGCGCGCCG
GGCGACGAGGCCGGCCAGCAGATGCAGCTGCTCGAAGAGGGCTGGGATCAGCGCGCGCCG
************************************* ***********************

194d
AS019d
M. smegD
133.seq
194d
AS019d
M. smegD
133seq
CTGGGCTGGAACATGAAGGACCCGACGCCCGTCGCCAAGACCGTGTGCGCACTGCTGTCG
CTAGGCTGGAACATGAAGGACCCGACGCCCGTCGCCAAGACCGTGTGCGCACTGCTGTCG
CTGGGCTGGAACATGAAGGACCCGACGCCCGTCGCCAAGACCGTGTGCGCACTGCTGTCG
CTGGGCTGGAACATGAAGGACCCGACGCCCGTCGCCAAGACCGTGTGCGCACTGCTGTAA
** *******************************************************
GACTGGCTGCCGGCCACCACCGGCACCGTGATCTACGCCGACGGCGGCGCCAGCACGCAG
GACTGGCTGCCGGCCACCACCGGCACCGTGATCTACGCCGACGGCGGCGCCAGCACGCAG
GACTGGCTGCCGGCCACCACCGGCACCGTGATCTACGCCGACGGCGGCGCCAGCACGCAG
GACCGTGTGCGCACTGCTGT
* * * * *** * *
194d
AS019d
M.smegD
133.seq
CTGTT
CTGTTGTGAT
CTGTTGTGAT

5.6.3 Sequence comparision of InhA proteins of AS019, MLB 133 and
MLB194
The DNA sequences of the three inhA genes from C. glutamicum wild type strain
ASOl9 and two mutants MLB 133 and MLB 194 were translated into putative
sequences of theh respective InhA proteins using the Etranslation program. InhA
proteins of these three strains were further aligned using the PRETTYBOX program.
Figure 5.17 shows the extent of identity of these InhA proteins from three strains of
corynebacteria with the same protein from M. smegmatis.
The results showed that the three proteins aligned almost perfectly as was obvious
from the sequencing data. The InhA protein is highly conserved among the different
C. glutamicum strains: AS019, MLB 133 and MLB 194, had >95% identhy with M.
smegmatis InhA. The position where the variation in the protein sequence occurred is
indicated in the white boxes (Fig. 5.16). The stmcture of the InhA protein had also
been determined in M. smegmatis using X- ray chrystallography. Based on the
similarity seen between this and corynebacterial proteins it is possible to predict that
the InhA protein of C. glutamicum might have a similar stmcture.
A putative binding site in InhA for nicotinamide or flavin nucleotide is shown in
Figure 5.17). The points of difference are indicated with red letters. Variations in the
amino acids sequence occurred at position 106, 123, 157 in AS019 relative to M.
smegmatis MLB 133 and MLB 194, whereas the two sequences MLB 194 and MLB 133
vary at position 194.

Figure 5.16 Alignment of the InhA protein sequence of C. glutamicum and M.
smegmatis using the PRETTYBOX program of ANGIS. Identical amino acids are
shown in black boxes and similar amino acids in grey boxes hght or deep grey
according to the similarity. Gaps are introduced to maximise similarity scores. The
protein sequences shown are the following: InhA of the C. glutamicum strain As019,
MLB 133, MLB 194 and M. smegmatis.
PEETlrfBOX o £ : S / h o m e / v i a t i f t 0 0 / . W A G / a 3 3 1 S l A = . l i s t . a"t40i Itsz^^mtxi 6 , 1 9 1 0 0 1 4 : 1 8 : 0 * . 2 6
113 194
AS019
H T G L L E G K E I H T G L L E G H I I r fji T /-_ 7 1 1? ;-, K P. I
; K II r MSCUKI i a » l M i » l » 5 W a
I A E a. Z 1
IL ri-B H I A K V A O l A F H I A K V A O l A E H I A K V A O
EPEEKIIiii 1 3 3 194
AS019
E D I: L IL L V K E. I E D I: L l ; L V K P. I E D R L i ; L V K R r E n P. L i : L V i ; IL r
A D R L P K P A P L A D PL L P K P A P L A D R L P K P A P L A D R L P K P A P L
L E L D V O i r E E H L E L D U O i r E E H
IMIMIM To T L A D p. r T , T L A D R r T .
60 80
Con»n!<u^ l » « » l » a » l « » i » « « r » M 5 » l » » i » » i » i » i l » l » « l » . M . » l » » « ! l l . » » . l » l » : » . » ! » 1 l » i l SO
133 194
AS019 Mscjnq
E I G E G l f K I D G E I G E G I F K I D G E I G E G i r K I D G E r c E G i r K I D G
Con^cnr^, > J J M J J i a W j a U A U i B . - » J t * J 3 I 3 g 1 M H i ^ » * l * J J 3 r a Q a a S X ^ I ^ S a 120
133 194
A S O l 9 Hacjnci
H r s A : f 3 y A S L H I Q A Y S Y A S r H I S A Y S Y A 3 L
A K A V L P r H ir P A K A V L p r H ir P A K A V L P I H i r P A K A V L p r H ir P
^ • H D E D G G G I V G H D E D
P T R A H P A Y i r W P T R A H P A Y i r W P T R A M P Q Y ir W P T R A H P A Y ir W
1 6 0 1 6 0 1 6 0 1 6 0
Conacnsi , timm:»im.M»»im^m nmt^imfmrn^mamma t'JTMim'M^tHa^H f i l f iy i l t tg iWIBTi leo
133 194
ASOIS Mscmci
H T V A l; S A L E S H T V A K 3 A L E S H T V A K 3 A L E S H T V A K 3 A L E 3
K V G V R 3 ir L V A H A G P I R A R E A G H K V G V R S ir L V A H A G P Q P -
' A R E A G H K V G V R 3 ir L V A H A G P t R ' A R E A G H K V G V R S i r L V A ™ » -- ' ^ ^ m m
200 200 200 200
con»n,..= liUMMMmmmm^ OESSSXMSBEE i«'Jv*'J«*i**'*:« EEIMSXM^EB 2°°
A r V G G A L G D E A I V G G A L G D E
133 194
ASOlg Marine. > » » « « > » » • » » « » • «
L G W G W D O R A P L G G W D O R A P L G
ir H K D P T P V A K If H K D P T P V A K i r H K D P T P V A K I f H K D P T P V A K
240 240 240 240
cona.nau, Bs^E^oaaa B^^aasssaa M**.«.»*^J»>»^J QEEaaxxx^o 240 133 194
ASOlg Haeinci
T V C A L L T V C A ' T T V C A T V C A L L 3 D W L
R^V E O^A M H G L L E G K R I L V T G I I 2 6 8 M 269 m G 1 V r Y A
G T V I Y A G T V I Y A ^m I L •" 2 6 9
1 L * 2 6 9
Consensus EE^OSlSsCEl ^ S S E E S i l S Z ] UMMh«*jaw - - 2-ro

100 150
SGMGINPFFD APYEDVSKGI HISAYSYASL AKAV-LPIMNP GGGIVGMDFD
SGMGINPFFD APYEDVSKGI HISAYSYASL AKAV-LPIMNP GGGIVGMDFD
SGMGIDPFFD APYEDVSKGI HIPAYSYASL AKAV-LPIMNP GGGIVGMDFD
SGMGINPFFD APYEDVSKGI HISAYSYASL AKAV-LPIMNP GGGIVGMDFD
151 200
'194 PTRAMPAYNW MTVAKSALES VNRFVAREAG KVGVRSNLVA AGPNRTLAMS
Msemg PTRAMPAYNW MTVAKSALES VNRFVAREAG KVGVRSNLVA AGP|RTLAMS
AS019 PTRAMPGYNW MTVAKSALES VNRFVAREAG KVGVRSNLVA AGPIRTLAMS
133 PTRAMPAYNW MTVAKSALES VNRFVAREAG KVGVRSNLVA AGPIRTLAMS
Figure 5.17 Alignment of amino acid sequences of InhA proteins of the three strains of
C glutamicum (AS019, MLB194, MLB133) and M. smegmatis showing a putative
binding site in InhA for nicotinamide or flavin nucleotide. Red letters indicates the points
of variations.

5.7 GENERAL DISCUSSION
In this chapter the sequence of the inhA gene from MLB 133 and MLB 194 was
determined. The inhA sequence of MLB 194 was determined foUowing the same
approach used for ASOl9. The inhA sequences were amplified from genomic DNA of
MLB 194 and a sub-genomic library was constmcted. The identity of the sequences
was further verified after being amplification and sequencing from clone C22. The
identity scores calculated using the BEST/FIT program revealed 98% identity
between inhA from ASOl9 and MLB 194 and 99% with M. smegmatis. The Southern
hybridisation results confirmed the presence of the inhA gene and the appearance of
more than one signal confirmed the existence of multiple copies of the gene in the
genome of MLB 194.
The approach used to analyse the inhA gene homologue in MLB 133 was limited to
only PCR amplification directly from the genomic DNA and sequencing of the
amplified fragments. Since the conditions were already optimised for ASOl9, PCR
fragments of expected sizes were obtained without any difficulty. The sequence of
the inhA gene for this strain was 96% complete and the last 40 bases need to be
sequenced to achieve the total length of 850 bases. The sequence data obtained
through the PCR fragment produced using the CGP3-INH2 primer set was not reliable
and therefore, to determine the sequence this PCR fragment unambiguously the
fragment was also cloned into the PCR2.1 vector. The readout obtained using T3 and
Ml3 primers was acceptable but the sequence of last 40 bases could not be achieved.
DNA-DNA hybridisation profiles strongly suggest that gene is highly conserved m
the parent type strains and mutants, and multiple copies of the gene are present in the
genome. The comparative analysis of AS019 and the two mutants showed 85-96%
homology among themselves and greater than 95% with M. smegmatis. However,
the sequence alignment showed some differences in the sequences for AS019,
MLB 133 and MLB 194 at various points.
The deduced InhA protein product of the inhA gene of AS019, MLB 133, MLB 194 is
an Enoyl-ACP, an enzyme essential for mycolic acid biosynthesis, which shows

significant homologies with other enzymes involved in bacterial (mycobacteria) and
plant fatty acid biosynthesis. Besides significant homologies with the Mycobacterium
family (84 to 98%) InhA protein, the protem in of C. glutamicum also show some
identity with EnvM from H. influenza, S. typhimurium and E. coli, and with Enoyl-
ACP of//, pylori and B. napus.
The alignment of the two proteins from C. glutamicum and M. smegmatis indicates
amino acid variations at four different positions: aspartic acid at position 106 in
ASOl9 is hydrophobic instead of asparagine, which is neutral; residue 123 is prohne
while in M. smegmatis this is serine. Proline is often used to produce a bend in the
protein chain. Residue 157 in the putative NADH binding site is glycine instead of
alanine. This suggests that the three dimensional structure of the two InhA proteins
(ASOl9 and M. smegmatis) might be different. Our results (see chapter 3 Table 3.1
& 3.2) showed the two mutants of C glutamicum MLB 194, and MLB 133 are more
sensitive to inhibition by INH and ETH than their parent strain ASOl9, suggesting
that stmctural changes in these mutants may be associated with the target of INH
activity. Subsequent studies on sequence analysis of the putative translation product
revealed that the amino acids substitution between ASOl9 and mutants have occurred
at the same points as in AS019 and M. smegmatis. Residues 106, 123, 157 are
replaced by asparagine, serine and alanine in two mutants. There is single amino acid
substitution between MLB 194 and M. smegmatis and also between MLB 194 and
MLB 133 isoleucine 194 is replaced by asparagine in MLB 194 which is a neutral
amino acid but because of its polarity it is often classified as extemal whereas
isoleucine is uncharged and therefore constitutes internal side chain. These amino
acids mutations lie in the putative NADH binding site. In other words MLB 194 and
MLB 133 are more similar to M. smegmatis than its parent ASOl9, the only difference
between MLB 194 and M. smegmatis is at position 194.
Several studies showed that about 25% of the clinical isolate of M. tuberculosis
contains mutations within the promoter or stinctural regions of the inhA gene, and no
inhA mutations have been identified in isoniazid sensitive isolates (Telenti et al,
1997; Musser et al, 1996; Rouse et al, 1995; Kapur et al, 1995). Four different
clinical isolates have been identified where mutation have occurred due to single
amino acid substitution within or near the NADH binding region of InhA. In
mycobacteria the location of S94A mutation is also within the NADH binding region.

Studies of Dessen et al (1995) showed that the S94A mutant of mycobacteria
displays reduced hydrogen bonding pattem between NADH and the enzyme.
Similarly, Quemard et al, 1996 have also shovm that isoniazid-dependent inhibition
of wild-type InhA requires the presence of NADH, and inhibition of the S94A mutant
occurs only when the concentration of NADH is increased. Furthermore, acyl-ACP
substrates can prevent isoniazid-dependent inhibhion of InhA, suggesting that
activated isoniazid interacts with the substrate-binding region of InhA.
Data from X-ray crystallography and mass spectrometry also reveal that mechanism
of isoniazid action against InhA is covalent attachment of the activated form of the
dmg to the nicotinamide ring of nicotinamide adenine dinucleotide bound within the
active site of InhA (Rozwarski et al, 1998). There are two possible scenarios for the
formation of isonicotinic acyl-NADH inhibitor of InhA as shovm in (Figure 5.18), in
which an activated form of isoniazid (isonicotinic acyl anion or radical) covalently
attaches to a form of NADH (NAD^ or NAD radical) within the active site of InhA,
while retaining a tetrahedral carbon at position four of the the nicotinamide ring. The
free radical pathway is more likely as isoniazid dependant inhibition of InhA occurs at
a faster rate with NADH than with NAD^ (Johnson et al, 1995; Basso et al, 1996).
As reported in Chapter 3, both glycine and INH inhibh not only mycolic acid
synthesis but also fatty acids biosynthesis. The presence of an inhA gene homology in
C. glutamicum and its analogy with the mycobacterial inhA gene strengthen the
hypothesis that InhA might be the target for INH in corynebacteria. Furthermore, the
fact that extracellular mycolic acid level increases following grov^h of C.
glutamicum in INH suggest that dmg might dismpt the attachment of mycolic acid
from cell surface. This also suggests that beside its involvement in mycolic acid
biosynthesis InhA is playing slightly different role in Corynebacterium. However,
this hypothesis is controversial, because of the observed insensitivity of
corynebacteria to INH as compare to mycobacteria (MIC 14-16 mg/ml).
It is likely that InhA protein of C. glutamicum may use nicotinamide or flavin
nucleotide as substi-ate, as it has a putative binding site for these molecules (Figure
5.17).

'-"igJIf^^gWP^ '•"./sf^wwii'gpr Jmmam
Isoniazid Isonicob'nic acyt {(sonicotJnic acid Isonicotinic acvl
anion hydrazide) radical
^ Mn^* / ^ c . Mn2* >< ^^ KatG (I ^ KatG
4AD . NH.
NAOracScal
2 H
\ - . # V - - - - . - l v ; ,
Q'-'.. ^"rjr-w^x--:.-::
Figure 5.18 Proposed pathway for the formation of isonicotinic acyl-NADH
inhibitor oflnhA.

Since the free radical pathway have been much favoured (Rozwarski et al, 1998)
because the isoniazid dependant inhibition of InhA occurs at faster rate with NADH
than with NAD^ (Figure 5.18), it is possible that stmcture of InhA in C. glutamicum
might be such to allow decrease in molecular contact between isonicotinic acyl-
NADH and the active site of InhA and therefore higher concentrations of INH are
required to produce a significant change in mycolic acid composition.
In corynebacteria multiple copies of the gene has been observed by Southem
hybridisation. Multiple copies of the gene may lead to the over expression of InhA
protein and therefore more substrate is required to inactivate or inhibit the InhA
protein. The existence of more than one copy of the gene might be an explanation of
a naturally high level of resistance of this organism against isoniazid, and this might
also explain why the significant changes in the mycolic acids composition,
transformation efficiency appear when higher concenfrations of the dmg are added
into the growth medium. In addition to the genetic data, the fact that extracellular
mycolic acid level increases following growth of C. glutamicum in INH suggest that
dmg might dismpt the attachment of mycolic acids from the cell surface. This also
suggests that besides its involvement in mycolic acids biosynthesis InhA is playing a
slightly different role in corynebacteria.
Molecular contacts between isonicotinic acyl-NADH and the active site of InhA has
also been studied in mycobacteria (Figure 5.19) h show very clearly that the nitrogen
atom of the isonicotinic acyl group is within hydrogen-bonding distance of a buried
water molecule held by the side chain of Metl55. The putative translation product of
the inhA gene of C. glutamicum strains MLB 133 and MLB 194 (Figure 5.16) are
much more similar to M. smegmatis as compared to ASOl9. There is a single amino
acid difference or substitution between M. smegmatis and MLB 194 as compared to
ASOl9. This is not surprising as our biochemical data shows that the two mutants
(particularly MLB 133) are more sensitive to INH inhibition while the parent strain
ASOl9 is more resistant to INH.
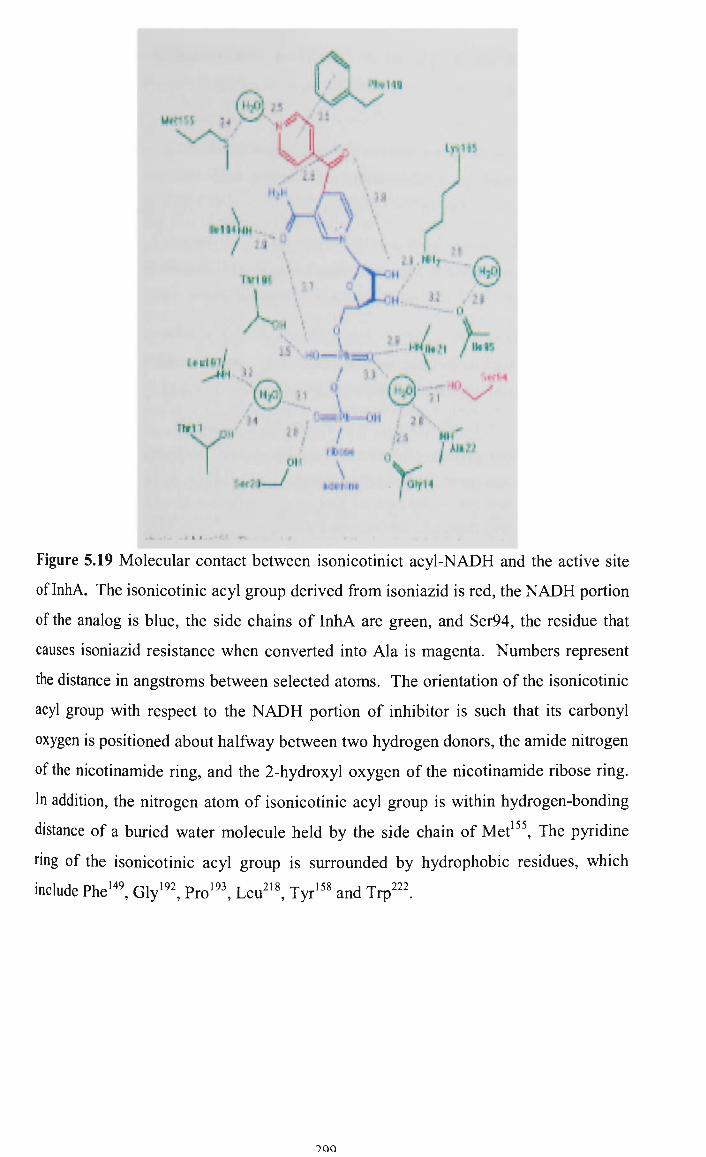
yttf- -I ; j
t f M
Figure 5.19 Molecular contact between isonicotinict acyl-NADH and the active site
of InhA. The isonicotinic acyl group derived from isoniazid is red, the NADH portion
of the analog is blue, the side chains of InhA are green, and Ser94, the residue that
causes isoniazid resistance when converted into Ala is magenta. Numbers represent
the distance in angsfroms between selected atoms. The orientation of the isonicotinic
acyl group with respect to the NADH portion of inhibitor is such that its carbonyl
oxygen is positioned about halfway between two hydrogen donors, the amide nitrogen
of the nicotinamide ring, and the 2-hydroxyl oxygen of the nicotinamide ribose ring.
In addition, the nitrogen atom of isonicotinic acyl group is within hydrogen-bonding
distance of a buried water molecule held by the side chain of Met'^^ The pyridine
ring of the isonicotinic acyl group is surrounded by hydrophobic residues, which
mclude Phe•^^ Gly'^^ Pro'^^ Leu^'^ Tyr'^^ and Trp^^l
9QQ

In Mycobacterium, studies were performed on the crystal stmcture of isoniazid-
inhibited InhA, these studies provide an explanation for the exquisite specificity of
activated isoniazid for InhA. Although KatG is not the activator of ethionamide
(Basso et al, 1996), ethionamide also requires activation and, by analogy to isoniazid
it is proposed that activated ethionamide inhibits InhA by becoming covalently
attached to poshion four of the nicotinamide ring of NADH by a 2-ethyl isonicotinic
thioacyl group. Comparison of the crystal stmctures of InhA with bound NADH
(Dessen et al, 1995) and with bound isonicotinic acyl-NADH reveals that the only
significant difference in the protein is location of the side chain of Phe''*^ . When
isonicotinic acyl-NADH is bound, the side chain of Phe '* has rotated -90° and forms
an aromatic ring-stacking interaction with pyridine ring of isonicotinic acyl group.
The authors proposed that such stmctural arrangement would increase the affinity
over NADH alone. Similarly, mutations with decreased affinity for NADH are likely
to decrease the affinity for isonicotinic acyl-NADH. By analogy with M smegmatis
it can be presumed that similar reaction takes place between isoniazid and active side
of InhA. Since counter studies related to the comparative crystal stmcture of InhA
with bound NADH and with bound isonicotinic acyl-NADH are lacking it is difficuh
to draw any conclusion at this stage. However, it is likely that although the coryne-
InhA protein show 98 % sequence homology with mycobacteria but the stmcture
InhA would be such to decrease the affinity for NADH.
Furthermore, kinetic isotope analysis of InhA has demonstrated that the binding
sequence of NADH and long-chain acyl-ACP subsfrates is not strictly ordered, but
there is a preference for the NADH binding first (Quemard et al, 1995). This
preference would leave most of the wild-type enzyme in the NADH-bound form,
available for attack by activated isoniazid. If the v^ld-type InhA cannot release
significant amount of isonicotinic acyl-NADH, this will effectively create a
permanent inhibition of the enzyme and prevent mycolic acid biosynthesis. In
contrast, the decreased affinity of the S94A mutant for NADH would promote acyl-
ACP subsfrates binding before NADH, thereby protecting most of the enzyme from
activated isoniazid. When the isonicotinic acyl-NADH is formed on the mutant
enzyme, the lowered affinity for NADH promotes release of isonicotinic acyl-NADH,

allowing normal substrate catalysis to proceed and resulting in isoniazid-resistant
tuberculosis.
InhA from C. glutamicum also displays 38% amino acid identity with enoyl-acyl
carrier protein (ACP) reductase of B. napus and 54% identity with enoyl-reductase
(ENR) of E. coli (NCBI data base similarity search). The stmcture of the E. coli
enzyme show resemblance to its mycobacterial counterpart (40% sequence identity),
particularly in the region of the active site, and also to that of B. napus ENR (33%
sequence identity). Examination of the stmctures of the E. coli and M. tuberculosis
ENRs showed that respective Gly ' —>Ser (G93S) and Ser^'^^Ala mutations, which
lead to diazaborine (Bergler et al, 1992) and isoniazid (Banerjee et al, 1994)
resistance, map to the region close to the nucleotide-binding site.
In addition to the difference in the InhA proteins and existence of multiple copies of
gene it is likely that in C. glutamicum resistance to INH may arise from other
sources. For example lack of a katG gene or inactivation of this resulting in no or low
activity may be an alternative explanation. The observed hypersensitivity of the two
mutants relative to their parent strain could be explained by the differences in the two
InhA proteins relative to ASOl9 making these more similar to the mycobacterial InhA
protein. If we assume that the mechanism of action of INH is similar to that proposed
for mycobacteria, it is possible that in the mutants InhA cannot release significant
amounts of isonicotinic acyl-NADH, which will create a permanent inhibition of the
enzyme and prevent mycolic acid biosynthesis, however, this hypothesis needs to be
explored further experimentally. Since other studies have shown that the target of the
InhA protein is short-chain Ci6 fatty acids it is also possible that elongation or
condensation of Cie and Cig fatty acids to theh counterpart corynemycolates is
impahed, giving rise to decreased synthesis of Cs^o and accumulation of these fatty
acids normally during growth in the presence of INH. Moreover due to difference in
the peptide sequences of InhA proteins in the two species the overall stmcture will be
different and mechanism of action is different from that proposed in the
Mycobacterium tuberculosis.

The mechanism of dmg resistance has been studied in detail m Mycobacterium where
it is assumed that resistance to INH is associated with a variety of mutations affecting
one or more genes such as those encoding catalase-peroxidase (katG) (Zhang et al,
1992), the enoyl-acyl carrier protein reductase involved in mycohc acid biosynthesis
(inhA) (Banerjee et al, 1994), and the recentiy described aUcyl-hydroperoxide
reductase (ahpQ, which is involved in the cellular response to oxidative stress
(Deretic et al., 1995; Wilson et al, 1996; Sherman et al, 1995). However, the most
recent study on the crystal stmcture of complex between isonicotinic acyl-NADH and
InhA provides the basis for the design of agents that inhibits InhA without the
involvement of KatG activation. The pathway of mycolic acid biosynthesis is
essential to corynebacteria, therefore the detail study of InhA is very cmcial.
Therefore, cost and time efficient investigation of INH resistance in Corynebacterium
will require a strategy for targeted mutation analysis, which is beyond the scope of
this thesis.

Chapter 6
Sequencing and sequence analysis of the inhA gene in Brevibacterium
species and comparison with C. glutamicum.
6.1 INTRODUCTION
Previous studies have shown that C glutamicum is much more difficult to protoplast
and transform than B. lactofermentum and B. flavum and subsequently most workers
have concentrated theh effort on the latter species in the saprophytic corynebacteria
group (Liebl and Sinskey et al, 1987). Studies of Britz and colleagues (1989) with
different Corynebacterium species using cell wall modifier (Tween 80, INH and
glycine) in growth medium showed that Tween 80 had significant effects on the
electroporation frequency of B. lactofermentum in particular. B. lactofermentum
based on 16S rfiNA sequence analysis, has been transferred to Corynebacterium
species and a new name C. lactofermentum has been proposed for this species.
Similarly INH also had a significant effect on the elecfrotransformation frequency,
which increased 10-100 fold for some strains. These reports, however, showed that B.
lactofermentum is much more sensitive than C. glutamicum to growth inhibition by
INH and that growth in the presence of INH did not significantiy improve
electrotransformation frequency of fi. lactofermentum. Studies of Jang e? aZ. (1997)
as well as the present studies on the effect of INH on the growth of different
corynebacterial species further showed that B. lactofermentum behaves differently to
INH-containing media compared with C. glutamicum and B. flavum. It is not clear
why B. lactofermentum is more sensitive to INH than C. glutamicum but this may
suggest a significant difference in cell wall composhion of these species. Studies on
the mycolic acid composition showed that both Brevibacterium strains, BF4 and BLl
showed similar patterns of mycolic acids to each other in terms of both quantitative
and qualitative composition. It is for this reason that the present study focussed on
exploring the inhA genes involved in mycolic acid biosynthesis of these strains,
particularly the gene dose of this gene.

In this chapter we report the presence of an inhA gene equivalent in these two species,
B. lactofermentum BLl and B. flavum BF4, plus the cloning and sequencing of this
gene. This chapter also focussed on the comparative analysis of amino acid
sequences of the InhA proteins of C. glutamicum and the two Brevibacterium species
BLl and BF4 in order to determine wether a relationship exists between the ease of
protoplasting and changes in the cell surface chemistry of these three corynebacterial
species at a genetic level. The deduced biochemical and physical properties of three
InhA proteins, the molecular basis of physiological differences observed and
differences in the predicted secondary stmctures of these proteins are analysed and
discussed.
6.2 CLONING AND SEQUENCING OF THE inhA GENE IN B.
LACTOFERMENTUM STRAIN BLl BY PCR
The strategy used to sequence the inhA gene from BLl was based primarily on PCR
amplification directly from genomic DNA. Since the PCR conditions were optimized
and gene was sequenced previously in three strains of C. glutamicum, there was no
need of constmcting a separate genomic library.
6.2.1 PCR amplification of the inhA gene in B. lactofermentum
PCR amplified fragments from BLl are shown in Figures 6.1 and 6.2. PCR fragments
were amphfied from the genomic DNA of BLl using primers sets mentioned in Table
4.1 under similar PCR conditions used to amplify the inhA gene from three
corynebacterial stirains (Table 4.2). The inhA gene from BLl was amplified as four
overiapping fragments and ASOl9 genomic DNA was used as a control in this
experiment to confirm the sizes of the bands. The sizes of the PCR fragments
obtained from BLl using the primers sets INH1-CGP4, CGP5-CGP2, CGP3-CGP4,
CGP3-INH2 were similar to those expected for each primer set. To further confirm
the identity of the inhA gene in Brevibacterium, Southern hybridisation was
performed using the inhA probe from ASOl9. The same strategy was used to
sequence the inhA gene from Brevibacterium as was used for C. glutamicum strain
MLB 133. Sequence assembly of this is reported in section 6.2.2.1.

6.2.2 Southern hybridisation and identification of inhA gene in B.
lactoferm entum.
The PCR amplified products of CGP3-INH2 primers set from C. glutamicum stram
ASOl9 were radiolabelled and probed against the genomic DNA digest of BLl.
Figure 6.3 shows the results of Southern hybridisation of the genomic DNA digest of
BLl with various restriction enzymes. Table 6.1 summarizes the calculated molecular
weight of the different hybridization bands obtained. The hybridisation pattem
obtained for BLl was quite different from that seen for ASOl9, however, the
observation of the occurrence of multiple copies of the gene was common in the two
Brevibacterium species. For example, with Hindm digestion, the probe showed one
strong signal of 8.5 kb and other feint signals were also observed. With EcoRl
digestion, two major and other minor signals were seen. The minor signal could have
arisen due to non-specific binding of the probe. With Pstl digestion, of BLl apart
from the three main signals, the probe also showed very strong binding with two very
smaU molecular weight (250, 100 bp) fragments (as seen for ASOl9) of unknown
origin. The identity of these fragments is not known: they could have originated due
to the non-specific binding of the probe with BSA which was added in the digestion
mixture, as Pstl was shown not to cut in the inhA sequence (see Figure 6.6b). The
hybridisation experiment confirmed the presence of the inhA gene in BLl, which was
further confirmed by cloning and sequencing of the PCR fragments.
6.2.3 Sequencing and cloning of the PCR amplified inhA gene
fragments from BLl.
PCR fragments obtained from the BLl genomic DNA were WIZ purified. Each of
the PCR fragments was used as template in automated DNA sequencing, using the
relevant PCR primers as sequencing primers. Sequencing data for each of these PCR
amplified fragments was analysed using BLASTN, FASTA and BLASTX homology
search programs via NCBI. The data showed highest similarity with mycobacterial
proteins and confirmed the presence of the inhA gene in B. lactofermentum.

To unambiguously determine the sequence and to get more sequence data at the end,
the longer PCR fragment obtained using the INH1-CGP4 primer set was directly
sequenced with the respective primer and cloned into PCR 2.1 vector. The inhA
positive clones were screened by PCR amplification using specific primers (INHl-
CGP4) and the presence of insert was further confirmed by EcoRl restriction
digestion. The cloned fragments were sequenced using the T7 and M13 primers.
Figure 6.4 a and b respectively showed the PCR and EcoRl restriction digestion
pattern of selected inhA positive PCR 2.1 clones.
6.2.4 Sequence assembly for BLl
Sequences data obtaining for the four PCR fragments from BLl (as shown in Figures
6.1 and 6.2) were used to build one continuous inhA gene sequence. All sequences
were analysed for their overlap portions and then assembled manuahy as well as using
the GCG program of the WEB ANGIS. Figure 6.5 summarises the entire sequence
strategy. Complete sequence of the inhA gene of BLl from position 1-850 was
obtained after sequence assembly (Figure 6.6). The nucleotide sequence of the inhA
gene of BLl was deposited in the GenBank.
6.2.5 Sequence analysis of assembled inhA gene for BLl
The entire inhA gene sequence of BLl was analysed for the extent of identity with
mycobacterial genes and other genes in the databases using BLASTN and FASTA
programs. The BLASTN, BLASTX and FASTA search results of the completed inhA
gene for BLl are summarised in Tables 6.2, 6.3 and 6.4. The highest homology score
was found to be with inhA gene of corynebacterial (95%) and mycobacterial species
(80-95%). Less homology score was recorded with other proteins for example 41%
identity with envM proteins of S. typhimurium and E. coli short chain alcohol
dehydrogenase. The nucleotide sequence of inhA gene was translated using Etranslate
program of the WEBANGIS. Table 6.3 summarises the resuhs of BLASTX
homology search for InhA deduced protein of BLl. Amino acids comparison and
calculated similarity scores of InhA deduced protein for strain BLl and M. smegmatis
and BLl v.y AS019 using the GCG/BESTFTT and GCG/GAP program was 92.9%.

1 2 3 4 5 6 7 8
ISOObp
780bp
500bp 500 bp
Figure 6.1 PCR amplification of the inhA gene from genomic DNA of
Brevibacterium and Corynebacterium species. Lanes 1 and 5 contained the 100 bp
DNA ladder; Lanes 2 to 4 contained inhA gene fragment obtained using the INHl-
CGP4 primer set with templetes from AS019, BLl and BF4; Lanes 6 to 8 contained,
inhA gene fragment using CGP5-CGP2 primer set from ASOl9, BLl and BF4.

1 2 3 4 1 2 3 4
500 bp
164 bp 256 bp
Figure 6.2 PCR amplification of the inhA gene from genomic DNA of
Brevibacterium and Corynebacterium species.
a PCR amplification using the primer sets CGP3-CGP4. Lane 1 contained the 100 bp
DNA ladder; Lanes 2 to 4 contained ASOl9, BLl and BF4.
b PCR amplification of inhA gene using the primers set CGP3-INH2. Lane 1
contained the 100 bp DNA ladder; Lanes 2 to 4 contained AS019, BLl and BF4.

8.5kb 6. Ikb 4.8kb
3.5kb
2.8kb
1.9kb
1.5kb
l.lkb
720bp
360bp
Figure 6.3 Southern blot hybridisation of genomic DNA restriction digests of B.
lactofermentum probed with a 250 bp PCR product obtained using primer set CGP3-
INH2 and labehed using ^^P. Lane 1, SPPl/£coRl size markers; Lanes 2 to 4
contained Pstl, EcoRl and Hindlll digested genomic DNA of B. lactofermentum
strain BLl.

Table 6.1 Molecular weights of the hybridisation fragments obtained when the inhA gene probe was used against the genomic DNA from B. lactofermentum strain BLl with various enzymes.
S?? 11 EcoRl markers 8.5 7.3 6.1 4.8 3.5 2.8 1.9 1.8 1.5 1.3
MW in (kb) of the bands detected Pstl 5.2 3.5 2.8 0.36 0.25 0.1
EcoRl 6.1 5
Hindlll 8.3 1.5

780 bp
21.kb
5.Ikb
2.02kb
0.94kb
0.54kb
PCR2.1 vector
780 bp
Figure 6.4 PCR amplification and restriction digestion analysis of recombinant
PCR 2.1 clones containing PCR amplified inhA gene from B. lactofermentum and B.
flavum.
a PCR amplification and of inhA gene using INH1-CGP4 primers sets. Lane 1; PCR
size markers; Lanes 2 to 3 contained BLl and BF4 respectively.
b Restriction digestion of clone PCR2.1 with EcoRl resfriction enzymes. Lane 1
EcoRl/HindlU digested Lambda DNA size markers; Lanes 2 to 3 contained BLl, BF4
respectively.

B4CG5.Seq(140-500) L_
•"•-> (172-350)BLP2 V.
(321-778)
(l-471)3L3f.Seq — ^ 1
o c n O J U
B4P3 (637-780) B4P4
> (594-723)
(BL3Fn)
1 ^l982T7(850-779)
98Mb.SeQ*" 1 (813-850) 1 1 1
Figure 6.5 Schematic illustration of inhA gene sequence from B. lactofermentum (BLl).

1 CCGGACACAC AAGATTTCTC GCTCACAAGG AGTCACCAAA TGACAGGCCT
51 ACTCGAAGGC AAGCGCATCC TTGTCACGGG GATCATCACC GATTCGTCGA
101 TCGCGTTCCA CATCGCCAAG GTCGCCCAGG TGGCCGGCGC CGAACTGGTG
151 CTGACCGGTT TCGACCGCCT GAAGTTGGTC AAGCGCATCG CCGACCGCCT
201 GCCCAAGCCG GCCCCGCTGC TGGAACTCGA CGTGCAGAAC GAGGAGCACC
251 TGTCGACTCT GGCCGACCAG ATCACCGCCG AGATCGGTGA GGGCAACAAG
301 ATCGACGGTG TGGTGCACTC GATCGGGTTC ATGCCGCAGA GCGGTATGGG
351 CATCAACCCG TTCTTCGACG CGCCGTACGA GGATGTGTCC AAGGGCATCC
401 AAATCTCQGC GTACTCGTAC GCCTCGCCCG CCAAAACCGT TCTGCCGATC
451 ATGAATCCGG GCGGCGGCAT CGTCGGCATG GACTTCGACC CTACGCGCGC
501 GATGCCGGCC TACAACTGGA TGACCGTCGC CAAGAGCGCG CTTGAATCGG
551 TCAACCGGTT CGTCGCGCGT GAGGCGGGCA AGGTGGGCGT GCGCCCGAAT
601 CTCGCTGCGG CAGGACCGAT CCGCACGCTG GCGATGAGCG CAATCGTGGG
651 CGGTGCGCTG GGCGACGAGG CCGGCCAGCA GATGCAGCTG CTCGAAGAGG
701 GCTGGGATCA GCGCGCGCCG CTGGGCTGGA ACATGAAGGA CCCGACGCCC
751 GTCGCCAAGA CCGTGTGCGC ACTGCTGTCC GAGTGGGGAC TGCTCGCGGT
801 CGGTCTCAAG ATCTGGGTTC TCGGAAGCGC CAGCACGCAG CTGTTGTGAT
Figure 6.6a Nucleotide sequence of inhA gene for B. lactofermentum strain BLl
based on the designed primers (INHl, INH2, CGP2, CGP3, CGP4, CGP5, and
CGP6.) derived from the M. smegmatis inhA gene sequence.

Figure 6.6b Linear restriction map of the inhA gene of BLl using MAP orosram of WEBANGIS ^ ^
H P h I
MT Has iep nI4 fI5 III
PM 11 ey II
Ca veS ilt JIu III
FT oa kq II
H B C i s a n tH c P Fh 8 1 5a I I II
/
MT asS epfB I4as I5N1 IIII /
H P h I
M b o I
D P n I
A 1 w I
H P a I I
/ // CCGGACACACAAGATTTCTCGCTCACAAGGAGTCACCAAATGACAGGCCTACTCGAAGGC + + + ^ ^ ^ gQ
GGCCTGTGTGTTCTAAAGAGCGAGTGTTCCTCAGTGGTTTACTGTCCGGATGAGCTTCCG
H B B B iT TM DsPs sS nf ab pivt at fi qo nEuU Jy II II IIII II / / /
AAGCGCATCCTTGTCACGGGGATCATCACCGATTCGTCGATCGCGTTCCACATCGCCAAG 61 + + + + _,_ _ 120
TTCGCGTAGGAACAGTGCCCCTAGTAGTGGCTAAGCAGCTAGCGCAAGGTGTAGCGGTTC
H H N BBBPS BCC Ba HiH gN BBH B
M sssscBEMsvaBseHBanpKNNolBS Assp T As B w astprgawricaalhbePaaaaMasf gara a ci s 0 JKNGFleoFJ8nHIaeIlIserIIro eWFI q iE 1 1 IIIIIIIIIIIIIIIIIIIIIIVVII IIII I II I
/ // / / / IIIIIIII I I I I I GTCGCCCAGGTGGCCGGCGCCGAACTGGTGCTGACCGGTTTCGACCGCCTGAAGTTGGTC
CAGCGGGTCCACCGGCCGCGGCTTGACCACGACTGGCCAAAGCTGGCGGACTTCAACCAG
H MFN S BCCHCa sng N a svapveMANpuoBlFuT ricaiIwcaA4Msaa9s
FJ8IJIoielHIlIu6e IIIIIIIIIIIVIVIII / / / / / / //
AAGCGCATCGCCGACCGCCTGCCCAAGCCGGCCCCGCTGCTGGAACTCGACGTGCAGAAC JI + ^ + _ ^ _ 240
TTCGCGTAGCGGCTGGCGGACGGGTTCGGCCGGGGCGACGACCTTGAGCTGCACGTCTTG
H i n H P h 1 a I I
E c o 5 7 I
S B fAs aci NiE III
/
C a c 8 I
B b V
I
T a
q I
M aB et
Ir II
C TvM ain
iRl III /
Bs sp H il iBH H2MPSABnsiT KSllacscena AGyelcglRfq IIIIIIIIIII
E a e I
H Ca veH ilp JIh III
M b o I
D P n I
A c i I
MBDM bcpn ognl IIII
HM pb ho
/// II II I / ^^GGAGCACCTGTCGACTCTGGCCGACCAGATCACCGCCGAGATCGGTGAGGGCAACAAG 41 + + ^ ^ _ _!_ 2QQ
CTCCTCGTGGACAGCTGAGACCGGCTGGTCTAGTGGCGGCTCTAGCCACTCCCGTTGTTC

DT pa nq II
B s t 4 C I
A P a L I
B Bs sp
C Bil B vBsH2MTDsP iceK8bapiv RgSAGoqnEu IIIIIIIIII
// / /
N F 1 n aAu Ic4 liH III /
B BAs ser liB III
/
M w o I
M b o I I
S f a N I
ATCGACGGTGTGGTGCACTCGATCGGGTTCATGCCGCAGAGCGGTATGGGCATCAACCCG 301
TAGCTGCCACACCACGTGAGCTAGCCCAAGTACGGCGTCTCGCCATACCCGTAGTTGGGC -+ 360
T a q I
Bi BC snHMssHR tPhnipgs UlalW6aa IIIIIIII / / /
F o k I
s B t sS F at 5 Jy I II
/
s Ft oF kS II
S fB as Nl II
C sR ps 6a II
BC ssR ips W6a III
361 TTCTTCGACGCGCCGTACGAGGATGTGTCCAAGGGCATCCAAATCTCGGCGTACTCGTAC
-+ 420
c MAa wcc oi8 III /
M n 1 I
F a u I
B s t 4 C I
M w o I
S f a N I
N 1 a I I I
AAGAAGCTGCGCGGCATGCTCCTACACAGGTTCCCGTAGGTTTAGAGCCGCATGAGCATG
N F F B HI BH S n n
M Ds iaTspNc AuBABu b pp nifsacr c4scc4 0 nH fliKIiF iHligH 1 II IIIIIII m i l l
// / / GCCTCGCCCGCCAAAACCGTTCTGCCGATCATGAATCCGGGCGGCGGCATCGTCGGCATG 421 H -\ ^ I
CGGAGCGGGCGGTTTTGGCAAGACGGCTAGTACTTAGGCCCGCCGCCGTAGCAGCCGTAC ^
B H H H N S sBBC B iBiCHCa g
T f sssaBsHHnsnapveMMNo a a HttccthhPrPcailwwaM q N lUUBgUaalFlBIJIooel I I IIIIIIIIIIIIIIIIIIV
/ / //// / / ///// GACTTCGACCCTACGCGCGCGATGCCGGCCTACAACTGGATGACCGTCGCCAAGAGCGCG
481 + + + + + + 54 0 CTGAAGCTGGGATGCGCGCGCTACGGCCGGATGTTGACCTACTGGCAGCGGTTCTCGCGC
B s 1 I
B s r I
BB SS
tt F4 5C II
F o k I
BH siBC
MsnsaH wHPtch oIlUBa IIIIII / //
H 1
Hn hP al II //
H iT nf fi II /
H i n c I I
BBH Assp gara eWFI IIII ///
H BiB
MsnsFH ntPtah lUlUua IIIIII
/ //
M w o I
A c i I
C a c 8 I
M w o I
C a c 8 I
H i
BnH bPh via III /
H iT nf fi II /
CTTGAATCGGTCAACCGGTTCGTCGCGCGTGAGGCGGGCAAGGTGGGCGTGCGCCCGAAT 541 + + + + + +
GAACTTAGCCAGTTGGCCAAGCAGCGCGCACTCCGCCCGTTCCACCCGCACGCGGGCTTA 600
F n Tu s4 eH II
F n
Au c4 iH II
S Aa Avu la9 wl6
III /
M b o
I
D P n
I
A c i
I
C a c 8
I
B s 1
I
C a c 8
I
H i
Mn H wP h ol a
II I
A c i
H 1
n H P h 1 a
M n 1
I I I
CTCGCTGCGGCAGGACCGATCCGCACGCTGGCGATGAGCGCAATCGTGGGCGGTGCGCTG 601 + + + + + +
GAGCGACGCCGTCCTGGCTAGGCGTGCGACCGCTACTCGCGTTAGCACCCGCCACGCGAC 660

661
781
841
F Cn
HH N F F M BCC CC aaH gSCn C n sP C M SvaEBvaFeepNofvuMAvEuMpvTTBT v MbD ricabicsIIaaMai4wlia4nAuasbs i bop FJ8evJ8eIIIeINRHouJrHllIqeve J oIn IIIIIIIIIIIIVIIIIIIIIIIIIIII I III / / / IIIIIII I I IIIIII I
GGCGACGAGGCCGGCCAGCAGATGCAGCTGCTCGAAGAGGGCTGGGATCAGCGCGCGCCG + + + + ^ ^
CCGCTGCTCCGGCCGGTCGTCTACGTCGACGAGCTTCTCCCGACCCTAGTCGCGCGCGGC
BH B si sBBC snAsssa.i.au HPlHttccc4 IlwIUU8i8H IIIIIIIIII / //// //
720
H HM iCis
HHHnvnpM hhhPiPAw aaalJllo IIIIIIII //// ///
N 1 a I I I
c o S
AONPa vllpu a0au9 I9IM6 IIVII / //
B s a H I
P s h A I
H g a I
B s t 4 C I
H i nFBH Psth Ipsa IIII
/
T s P R I
721 CTGGGCTGGAACATGAAGGACCCGACGCCCGTCGCCAAGACCGTGTGCGCACTGCTGTCC
+ + + + + + GACCCGACCTTGTACTTCCTGGGCTGCGGGCAGCGGTTCTGGCACACGCGTGACGACAGG
780
C B As ct iU II /
BB ss im EF II /
S m 1 I
H i n P 1 I
HC Haa hec aI8 III
F n Tu s4 eH II
BBB BgssDM slmtpb alAYno IIIIII
//// GAGTGGGGACTGCTCGCGGTCGGTCTCAAGATCTGGGTTCTCGGAAGCGCCAGCACGCAG
+ + + + + + CTCACCCCTGACGAGCGCCAGCCAGAGTTCTAGACCCAAGAGCCTTCGCGGTCGTGCGTC
M CsP vpv B iAu Jll III /// CTGTTGTGAT
+ GACAACACTA
840
b V
I
850
Enzymes t h a t do not c u t
Aatll Apal BamHI Bmrl BsmBI BstDSI Dral EcoRV MslI Pad Pstl SexAI Sphl Xbal
Acc65I Apol Banll BplI BspEI BstEII Drain Hindm
Ncol Pcil
RsrII Sfcl Srfl Xcml
Acll AscI Bbsl Bpml BspMI BstXI DrdI Hpal Ndel PflMI Sad Sfil Sspl Xhol
Afel Asel BbvCI BpulOI BsrDI
BstZ17I EagI Kpnl Nhel Pmel
SacII Sgfl Swal Xmal
Aflll Aval BciVI BsaAI BsrGI
Bsu36I Ecil Mfel NotI Pmll
SanDI SgrAI TatI XmnI
Afllll Avrll Bell BsaBI BssSI Btgl
EC1136II Mlul Nrul
PpulOI Sapl Smal Tlil
Ahdl Bael Bfal
BseMII BstAPI Clal EcoNI MscI Nsil Psil Sbfl SnaBI
Tsp509I
AlwNI Bael BlpI BsmI BstBI Ddel
EcoRI Msel Nspl
PspOMI Seal Spel
Tthllll

H-1
I
I
J3
05
O u c
•S
O
;3 1/1 a>
6 o
00 <
PQ
ii
H
bq Co
O
3 K
o "3
Co
J m ^ K
o Tt vo o vO oo —
I i n
o m o
o^ 0\ 0\ i n i n i n
o o 1 ^H
CX) r<-) i n
r-- oo oo
o o
p o -Q
^ o oo
m oo
o o •—I
o m o OS ^
o o
PQ CO 3
1-a
a ^
&
si o ^ Bo .S s ..s ...»
.S ^ ^ ^' :^ O a: CO t*q

(U Ol
T3 I-H rn u % c o
CQ ^+-1 o
cn U >H
o ^ u
_o "o E o
X H c/3 <
CQ
•
H
»: a S< — c O
c oq W
. "5 2 , . c kl OJ
0-
u <
0 0 r*
'* m
• *
r<
Tj-i n
CT)
•
T f i n
•S a •I
Co
o a.
> c w
Q 2 - 5
c
^
u u
1 3 1> I k.1
5 OH Q U ;< <
z — J § CQ W
U <
I
o c w
i n
'1-
o
o — o '^ —
o r~- o ON —
i n Ti-
i n so in o
o o
i n IT) i n IT)
o o
r~-t^ ^ oo
t^ 00
o o . — 1
OO 0 0 o o
as
o o
o o ^^ *.» c ca
T5 C U OH U
-o 1
I
(U 1/1 ca •^ o 3
T3 1> 1 1
cu Q U < < Z J oa
1
">> o c w
"-* ca
t>0 & o
^ Q '>^ ^ • < § •<; Z w
c ca u
^ ^ 1)
ca
.2 t > — o
Hi 5
to O
o
Co k'
t>5
DQ

Table 6.4 FASTA homology search results of inhA gene of BLl
Organism Gene % homology
M. smegmatis inhA gene 95.88
M. tuberculosis inhA gene 80.53
M. bovis putative ketoacyl ACP 83
M tuberculosis mutant NADH-dehdrogenase 80.64
M. avium strain GIR transcriptase 80.64
P. aeruginosa Enoyl-ACP reductase ffabi) 52.30
E. coli
E. coli
Short chain alcohol
dehydrogenase
envM gene
53.32
53.32

6.3 CLONING AND SEQUENCING OF THE inhA GENE IN B.
FUVUM STRAIN BF4 BY PCR
6.3.1.1 PCR amplification of m M gene in B. flavum Br4
The PCR amplified fragments from BF4 are shown in Figure 6.1 and 6.2. Based on
the strategy adopted for strain BLl, PCR products were amplified dkectly from the
genomic DNA of B. flavum as four overlapping fragments obtained using the same
sets of primers and same PCR profiles as described in Tables 4.1 and 4.2.
6.3.1.2 Southern hybridisation using the B. flavum genomic DNA probed with
PCR fragments.
Figure 6.7 shows the results of Southem hybridisation of the genomic DNA digestion
of BF4 with various restriction enzymes and probed with the 256 bp PCR amphfied
product of inhA gene from AS019. The hybridisation pattern obtained for BF4 was
slightly different from BLl. After confirming the presence of inhA in BF4, attempts
were made to determine the sequence of this gene.
6.3.1.3 Sequencing of the inhA gene from BF4
PCR fragments of inhA gene amplified from BF4 were sequenced using their relevant
primers. Sequencing data of each genomic fragment obtained by PCR amplification
was analysed individually using BLASTN, FASTA and BLASTX homology search
programs via NCBL
The longer PCR fragments of INH1-CGP4 primers sets were sequenced with their
respective primers and further cloned into the EcoRl site of the PCR 2.1 vector to get
more reliable sequence data at the end. The putative clones containing the inhA
fragments were identified by mean of PCR amplification using the specific primers
and by EcoRl restriction digestion. Figure 6.4 a and b shows the PCR and EcoRl
restriction digestion patterns of inhA positive PCR2.1 clones. T7 and Ml3 primers
were used to sequence the cloned fragments.
6.3.1.4 Sequence assembly for BF4
Sequence data of four overlapping PCR fragments obtained from the BF4 inhA gene
were joined together to obtained one continuous sequence: Figure 6.8 summarises the
amphfication strategy for inhA gene of B. flavum. The complete sequence of the
inhA gene of BF4 from position 1-850 was obtained after sequence assembly (Figure
6.9). The nucleotide sequence and deduced InhA protein from BLl was analysed for
homology through NCBI database. Tables 6.5, 6.6 and 6.7 summarises the results of
BLASTN, BLASTX and FASTA homolgy for BF4.

0.48kb •
0.36kb —^
Figure 6.7 Southern blot hybridisation of restriction enzyme digested genomic DNA
of B. flavum strain BF4 probed with a 250 bp PCR product obtained using primer set
CGP3-INH2 from AS019 and labelled using ^¥. Lane 1, SPPl/EcoRl size markers;
Lane 2 to 3 contained Hindlll, Pstl digested genomic DNA of B. flavum strain BF4.

BPF3 633-738 >
BFP4 (601-726)
82P4(308-737)'
82inha . Seq (37 -560
PCRbf2P4.Seq V, (1-480)
99MB. Seq (813-850)—>
PCRBf2.Seq (327-778)
850bp
Figure 6.8 Schematic illustration of the sequencing assembly for B. flavum (BF4).
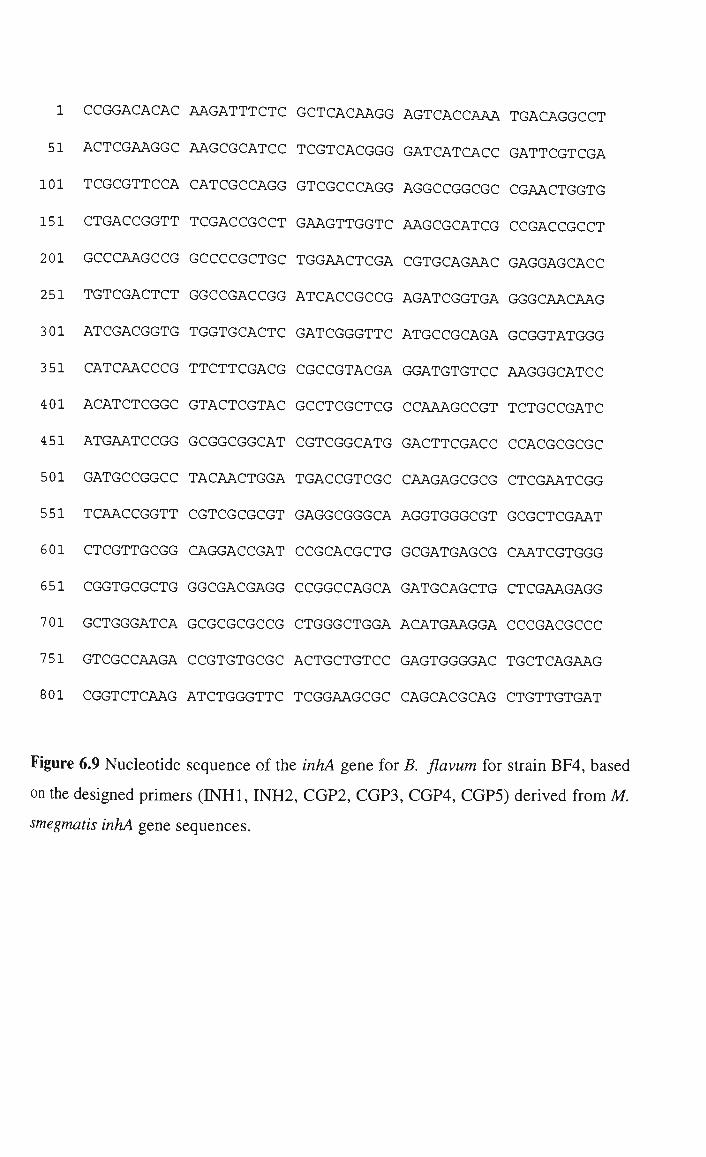
1 CCGGACACAC AAGATTTCTC GCTCACAAGG AGTCACCAAA TGACAGGCCT
51 ACTCGAAGGC AAGCGCATCC TCGTCACGGG GATCATCACC GATTCGTCGA
101 TCGCGTTCCA CATCGCCAGG GTCGCCCAGG AGGCCGGCGC CGAACTGGTG
151 CTGACCGGTT TCGACCGCCT GAAGTTGGTC AAGCGCATCG CCGACCGCCT
201 GCCCAAGCCG GCCCCGCTGC TGGAACTCGA CGTGCAGAAC GAGGAGCACC
251 TGTCGACTCT GGCCGACCGG ATCACCGCCG AGATCGGTGA GGGCAACAAG
301 ATCGACGGTG TGGTGCACTC GATCGGGTTC ATGCCGCAGA GCGGTATGGG
351 CATCAACCCG TTCTTCGACG CGCCGTACGA GGATGTGTCC AAGGGCATCC
401 ACATCTCGGC GTACTCGTAC GCCTCGCTCG CCAAAGCCGT TCTGCCGATC
451 ATGAATCCGG GCGGCGGCAT CGTCGGCATG GACTTCGACC CCACGCGCGC
501 GATGCCGGCC TACAACTGGA TGACCGTCGC CAAGAGCGCG CTCGAATCGG
551 TCAACCGGTT CGTCGCGCGT GAGGCGGGCA AGGTGGGCGT GCGCTCGAAT
601 CTCGTTGCGG CAGGACCGAT CCGCACGCTG GCGATGAGCG CAATCGTGGG
651 CGGTGCGCTG GGCGACGAGG CCGGCCAGCA GATGCAGCTG CTCGAAGAGG
701 GCTGGGATCA GCGCGCGCCG CTGGGCTGGA ACATGAAGGA CCCGACGCCC
751 GTCGCCAAGA CCGTGTGCGC ACTGCTGTCC GAGTGGGGAC TGCTCAGAAG
801 CGGTCTCAAG ATCTGGGTTC TCGGAAGCGC CAGCACGCAG CTGTTGTGAT
Figure 6.9 Nucleotide sequence of the inhA gene for B. flavum for strain BF4, based
on the designed primers (INHl, INH2, CGP2, CGP3, CGP4, CGP5) derived from M.
smegmatis inhA gene sequences.

H Ca veS ilt JIu III //
FT oa kq II
C a c 8 I
H i n P 1 I
B s tH Fh 5a II /
MT asS epfB I4as I5N1 IIII /
HMM pnb hlo III
D
P n I
A 1 w I
Figure 6.9b A linear restriction map of the inhA gene of B. flavum strain BF4 using
MAP program of the WEB ANGIS.
MT H Has p H iep PM a p nI4 11 I h fI5 ey I I III II
/ CCGGACACACAAGATTTCTCGCTCACAAGGAGTCACCAAATGACAGGCCTACTCGAAGGC
+ + + + - + + 60 GGCCTGTGTGTTCTAAAGAGCGAGTGTTCCTCAGTGGTTTACTGTCCGGATGAGCTTCCG
H B B BBBPS iT TM DsPs ssssc nf ab pivt satpr fi qo nEuU KJNGF II II IIII m i l / / //
AAGCGCATCCTCGTCACGGGGATCATCACCGATTCGTCGATCGCGTTCCACATCGCCAGG g]_ + + + + + + 120
TTCGCGTAGGAGCAGTGCCCCTAGTAGTGGCTAAGCAGCTAGCGCAAGGTGTAGCGGTCC
B s 1 I
GTCGCCCAGGAGGCCGGCGCCGAACTGGTGCTGACCGGTTTCGACCGCCTGAAGTTGGTC 121 + + + + + + 180
CAGCGGGTCCTCCGGCCGCGGCTTGACCACGACTGGCCAAAGCTGGCGGACTTCAACCAG
H MFN S BCCHCa sng N a M C SvapveMANpuoBlFuT T aB TvM ricaiIwcaA4Msaa9s a et ain
FJ8IJIoielHIlIu6e q Ir iRl IIIIIIIIIIIVIVIII I II III
/ / / / / / / / / / AAGCGCATCGCCGACCGCCTGCCCAAGCCGGCCCCGCTGCTGGAACTCGACGTGCAGAAC
181 + + _,_ ^ _ _ 24 0
TTCGCGTAGCGGCTGGCGGACGGGTTCGGCCGGGGCGACGACCTTGAGCTGCACGTCTTG B
Bs sp H H il iBH Ca BBH H2MPSABnsiT E veH sspM D A A MBDM HM KSllacscena a ilp aiab p c 1 bcpn pb A6yelcgIRfq e JIh WEIo n i w ognl ho IIIIIIIIIII I III IIII I I I IIII II /// / / / / / / /
GAGGAGCACCTGTCGACTCTGGCCGACCGGATCACCGCCGAGATCGGTGAGGGCAACAAG 241 + + + + _ ^ 3QQ
CTCCTCGTGGACAGCTGAGACCGGCTGGCCTAGTGGCGGCTCTAGCCACTCCCGTTGTTC
M w o I
M n 1 I
BBBPS sssscBM astprgw JKNGFlo IIIIIII / // /
H H N BCC Ba HiH gN SvaBseHBanpKNNolBS ricaalhbePaaaaMasf FJSnHIaelllserlIro IIIIIIIIIIIIIIVVII / / IIIIIIII 1
BBH Assp gara eWFI IIII ///
T a q I
B As ci iE II /
H i n H P h
1 a I I
E c o 5
7 I
S B fAs aci
NiE III
C a c
8 I
B b
V
I

DT pa nq II
B s t 4 C I
A P a L I
B Bs sp
C Bil B vBsH2MTDsP iceKSbapiv RgSAGoqnEu IIIIIIIIII
// / /
N F 1 n aAu Ic4 liH III
/
B BAs scr liB III
/
M w o I
[,.]
b o I I
S f a N I
ATCGACGGTGTGGTGCACTCGATCGGGTTCATGCCGCAGAGCGGTATGGGCATCAACCCG 301 + + + + + + 360
TAGCTGCCACACCACGTGAGCTAGCCCAAGTACGGCGTCTCGCCATACCCGTAGTTGGGC
T a q I
H Bi BC snHMssHR tPhnipgs UlalW6aa IIIIIIII / / /
F o k I
B s t F 5 I
B sS at Jy II /
B s
Ft oF k5 II
S fB as Nl II
C sR ps 6a II
BC ssR ips W6a III
C Ma wc o8 II
M n 1 I
C V
1
J I
M w o I
S f a N I
N 1 a I I I
TTCTTCGACGCGCCGTACGAGGATGTGTCCAAGGGCATCCACATCTCGGCGTACTCGTAC 361 + + + + + + 4 20
AAGAAGCTGCGCGGCATGCTCCTACACAGGTTCCCGTAGGTGTAGAGCCGCATGAGCATG
N F F B HI BH S n n
M Ds iaTspNc AuBABu b pp nifsacr c4scc4 0 nH fliKIiF iHligH 1 II IIIIIII IIIIII
// / / GCCTCGCTCGCCAAAGCCGTTCTGCCGATCATGAATCCGGGCGGCGGCATCGTCGGCATG
CGGAGCGAGCGGTTTCGGCAAGACGGCTAGTACTTAGGCCCGCCGCCGTAGCAGCCGTAC
B H H H N BB BH S sBBC B iBiCHCa g ss siBC
T f sssaBsHHnsnapveMMNo B B tt F MsnsaH a a HttccthhPrPcailwwaM s s F4 o wHPtch q N lUUSgUaalFlSIJIooel 1 r 5C k ollUSa I I IIIIIIIIIIIIIIIIIIV I I II I IIIIII
/ / //// / / ///// / // GACTTCGACCCCACGCGCGCGATGCCGGCCTACAACTGGATGACCGTCGCCAAGAGCGCG
481 + + + + + + 54 0
CTGAAGCTGGGGTGCGCGCGCTACGGCCGGATGTTGACCTACTGGCAGCGGTTCTCGCGC
H H H H i H i BBH BiB C C i H
HnTiT n A s s p MsnsFH M A a M a n H T i T hPanf c g a r a n t P t a h w c c w c P h a n f a l q f i I eWFI l U l U u a o i S o S l a q f i m i l I I I I I I I I I I I I I I I I I I I I I / / / / / / / / / / / CTCGAATCGGTCAACCGGTTCGTCGCGCGTGAGGCGGGCAAGGTGGGCGTGCGCTCGAAT
541 + + ^ + ^ ^ gQQ
GAGCTTAGCCAGTTGGCCAAGCAGCGCGCACTCCGCCCGTTCCACCCGCACGCGAGCTTA
F S H H n Aa C C i i
Au Avu M D A a B a M n H A n H M c4 l a 9 b p c c s c w P h c P h n iH wI6 o n i S l S o l a i l a l I I I I I I I I I I I I I I I J J J
^ ^ CTCGTTGCGGCAGGACCGATCCGCACGCTGGCGATGAGCGCAATCGTGGGCGGTGCGCTG
GAGCAACGCCGTCCTGGCTAGGCGTGCGACCGCTACTCGCGTTAGCACCCGCCACGCGAC ^^^

661
HH N F F M BCC CC aaH gSCn C n sP SvaEBvaFeepNofvuMAvEuMpvTTBT ricabicsIIaaMai4wlia4nAuasbs FJ8evJ8eIIIeINRHouJrHllIqeve IIIIIIIIIIIIVIIIIIIIIIIIIIII / / / IIIIIII I I IIIIII I
GGCGACGAGGCCGGCCAGCAGATGCAGCTGCTCGAAGAGGGCTGGGATCAGCGCGCGCCG + + + + _ ^
CCGCTGCTCCGGCCGGTCGTCTACGTCGACGAGCTTCTCCCGACCCTAGTCGCGCGCGGC
C v i J I
M MbD bop oIn III
BH B F si sBBC Cn snAsssaAau HPlHttccc4 IlwIUUSiSH IIIIIIIIII / //// //
720
721
N 1 a I I I
E c o S
AONPa vllpu a0au9 I9IM6 IIVII / //
B s a H I
P s h A I
H q a I
H HM iCis
HHHnvnpM hhhPiPAw aaalJllo IIIIIIII //// /// CTGGGCTGGAACATGAAGGACCCGACGCCCGTCGCCAAGACCGTGTGCGCACTGCTGTCC
_ + + + + + + GACCCGACCTTGTACTTCCTGGGCTGCGGGCAGCGGTTCTGGCACACGCGTGACG^JCAGG
B s t 4 C I
H i nFBH Psth Ipsa IIII
/
T s P R I
H i n P 1 I
HC Haa hec aI8 III
C a c 8 I
F n Tu s4 eH II
A 1 u I
780
B B s BBB
D As S eBgssDM d cm m Mslmtpb e iF 1 lalAYno I II I IIIIIII
/ //// GAGTGGGGACTGCTCAGAAGCGGTCTCAAGATCTGGGTTCTCGGAAGCGCCAGCACGCAG
CTCACCCCTGACGAGTCTTCGCCAGAGTTCTAGACCCAAGAGCCTTCGCGGTCGTGCGTC
M CsP vpv B iAu b Jll V III I /// CTGTTGTGAT
841 + 850 GACAACACTA
Enzyme that do not cut:
Aatll Apal BamHI Bmrl BspEI BstEII DrdI Hpal Ndel PflMI Sad Sfil Sspl Xhol
Acc65I Apol Banll BplI BspMI BstXI EagI Kpnl Nhel Pmel SacII Sgfl Swal Xmal
Acll AscI Bbsl Bpml BsrDI
BstZ17I Ecil Mfel NotI Pmll
SanDI SgrAI TatI XmnI
Afel Asel BbvCI BpulOI BsrGI Bsu36I
EC1136II Mlul Nrul
PpulOI Sapl Smal Tlil
Aflll Aval BciVI BsaAI BssSI Btgl EcoNI MscI Nsil Psil Sbfl SnaBI
Tsp509I
Afllll Avrll Bell BsaBI BstAPI
Clal EcoRI Msel Nspl
PspOMI Seal Spel
Tthllll
Ahdl Bael Bfal BsmI BstBI Dral EcoRV MslI Pad Pstl SexAI Sphl Xbal
AlwNI Bael BlpI BsmBI BstDSI Drain Hindlll
Ncol Pcil
RsrII Sfcl Srfl Xcml

CQ
c3
o
(U
s:
o
3 CO
o
o
on <
PQ
H
o
.s o
•S ^ -S O
S r
1 S ^
5a
3
-^ fe •S DQ
»0 i n
ON ON IT) >o
OS ( ^
OO 00
o r o ON —1
oo o o
o o
ON
m
o o
oo o o
o o
o o
nhA
*»»*
BF
4 /«
Av4
M
.sm
egm
atis
• S ^ i>i ~ c
M.tu
berc
ulo
M.
bovi
s in
,
c
trai
^ ^
§2
1>3
O
P.
aeru
gin
fabI
^
rim
s
iS.
typ
him
E
nvM
^ 5
£•.
coli
Em

a
+-"
CQ U
o rife CQ
O
3 (U
o kH ca (U
"o E o
X H < ffl so
JQ R
H
&5
s: o c u
<
r < C
^ .s •s o
u Tr o 03 , . , cs
•^ cs
c CS D
o c
5U
C u
II Cu
<
^ o PQ W
00 cn
Ti-<n in
cn
O
o o
o r-- o ON —
typh
.
Co
l - c
0 .
> c w
• *
i n ^ i n T f i n
MD i n
0 t—
0 0 '—'
<N in in in in
o o
c t~- ^ 00 r-~ 00
0 0 --<
00 00
o o
o cn O ON '-^
0 0 r—1
- * - »
dan
c u a, (U T3
1
ffi
cS
0 ^ "O
cu Q U < < Z • *
U H
yl-
0 c
^^ cS
CQ W si
c cs m
T3 M
C ^ u o -a -^
< § Z W
o o ^ ^ w ci w Si
i -I Co Ctq
Co
s;

Table 6.7 FASTA results for B. flavum
Organism Gene % Homology
M. smegmatis
M. tuberculosis
M. bovis
P. aeruginosa
E. coli
E. coli
S. typhimurium
Actinomadura hibisca
inhA
inhA
Putative keto acylACP
M. avium strain GIRIO transcript
enoyl-ACP-reductase (fabI)
97.05
81.31
81.31
81.62
52.74
envM protein gene 53.47
Short chain alcohol dehydrogenase 53.47
envM protein gene
Polyketide synthase
53.38
54.13

6.4 SEQUENCES OF THE inhA GENE OF BREVIBACTERIUM
SPECIES
By comparison with the nucleotide sequence of the inhA gene of M. smegmatis
(Banerjee et al, 1994) and C. glutamicum strain ASOl9, the translation initiation
codon (ATG) and termination codon (TGA) of inhA genes of B. lactofermentum and
Brevibacterium strains BLl and BF4 were found to be at sites homologous to that of
M. smegmatis inhA gene, as expected. Therefore the inhA genes cloned here
consisted of 850 bp.
Amino acid sequences of InhA proteins of Brevibacterium species are aligned with
that of M. smegmatis and AS019 through the PRETTYBOX program (Fig 6.10a).
Alignments of sequences of the four proteins showed that all four proteins aligned
almost perfectly as expected, however, the InhA protein of BLl showed several
amino acid differences at various points. A putative NADH binding site in InhA for
nicotinamide or flavin nucleotide is underlined for the four strains ie AS019, BLl,
BF4 and M. smegmatis (Fig 6.10).
6.4 1 Submission of the inhA gene sequence to the GenBank
The inhA gene sequences of B. lactofermentum and B. flavum strains BLl and BF4
were deposited to the GenBank. These sequences were assigned accession numbers
as shown in Table 6.8.

Table 6.8 Accession numbers of the inhA gene sequences of Brevibacterium strains
submitted to the GenBank.
ORGANISM B. lactofermentum (BLl)
B. flavum (BF4)
ACCESSION NUMBER AF139473
AF145897

PEETTfBOK o f : /home/vutb£t00/amatul/ftHfl .Ti;L2/BLBEASH.ji isf T ( IFoveiiiber 13, 19100 1 3 : 5 6 : 3 4 56
o i o : 9 b l 3 f - p e p
TTiscinai
p c r b f Z p l . p e p
nmtnnrKKirn H T G L L E G L p. I H T G L L E G K P. I H T G L L E G K P. I
Consensu. IllrWff^f'f^ga E S E B S S i a ^ i*iJi»MWgTO J^BSMSMSE
as019 b l J f - p e p
7nse3TKi p c r b f 2 p 4 . p e p
Consensus
asOiS b l 3 f . p e p
inseiTiGi p c r b f 2 p 4 . p e p
L E L D V O i r E E t l L E L D V O l F E E t l L E L D V Q i r E E R L E L D V O i r E E R H L S T L A D P . I T A
EnasasiaMa SSSSMSBSB ass^ssMsm f^EE
«o 80 80
E I G E G I F K I D G
^H ffij^gan W H S E G E H P O H 3 G H G r ir P F E n
H s G H G I i r P F F D f»-J.»«MC»M0B5M»l Consensus EaEEBIi9]13 UMJMMJiiJgi w j A M * n j j j a o s i a i l B B B a 120
flsoig b l 3 £ . p e p _0
insejnci pcrbf 2p4 . p e p
i»Aa«aism3 A K 0 V L P I H ir P
Consensus l « M * f * A * » W M » A I B * J l l i l H 3
G G G I V G H D E D B P T R A H P H Y i r W
P H G G G r VGHD F D_, „.....-. - ., - "G G G E V G H D F D B P T P. AHPAY ir w
G G G I V G H D F D B P T P . A H P A V i r W
160 150 160 160 160
asOlS b l 3 f . p e p
jnseiiKi pcrb£2p4 -pep
I T V A K S A L E
H T V A K S A L E S H T V A K 3 A L E S
nraav^nnra PL V G V P.QII L Q A IL V G V P. S ir L V A PL V G V R S ir L V A
Consensus Q E S E Q ^ H S » * l i * * > M ^ J M [ ^ ^ i S E D E E B K H # f * i f i l i B 200
o s 0 1 9 b l 3 f . p e p
irisenni p c i b £ 2 p 4 - p e p
A G O O H Q L L E E A G O Q M Q L L E E A G O O M O L L E E
l l i l J l i l * * * W ^ i t 240 240 240
"'"'^'"^wwnwn 240 Consensus M * > M A » g J T g l U J . l » l i l . l » « a i W A f l l . » » M W ; g ] U l t i t t l * * * * ^ 240
It H PL r P T P V A K
bl3f.pcp
pcrbf2pi,pcp
Consensus l iH*fcB»W
A S T 0 L L A S T O L I. A 3 1 0 L 1 A 3 T O L L
^EBsa
269
269
263
269
2"fO
Figure 6.10 a Alignment of the InhA proteins of C. glutamicum strain ASOl9 and M. smegmatis (Msmeg) with two B. lactofermentum (BL3f) and B. flavum (pcrbf2p4) using the program PRETTYBOX. Identical amino acids are shown in black boxes. Gaps are introduced to maximise similarity.

101 150
ASOl9 SGMGIDPFFD APYEDVSKGI HIPAYSYASL AKAV-LPIMNP GGGIVGMDFD
BLl SGMGINPFFD APYEDVSKGI QISAYSYASP AKTV-LPIMNP GGGIVGMDFD
Msemg SGMGINPFFD APYEDVSKGI HISAYSYASL AKAV-LPIMNP GGGIVGMDFD
BF4 SGMGINPFFD APYEDVSKGI HISAYSYASL AKAV-LPIMNP GGGIVGMDFD
151 200
AS019 PTRAMPGYNW MTVAKSALES VNRFVAREAG KVGVRSNLVA AGPIRTLAMS
BLl . PTRAMPAYNW MTVAKSALES VNRFVAREAG KVGVRPNLAA AGPIRTLAMS
Msemg PTRAMPAYNW MTVAKSALES VNRFVAREAG KVGVRSNLVA AGPIRTLAMS
BF4 PTRAMPAYNW MTVAKSALES VNRFVAREAG KVGVRSNLVA AGPIRTLAMS
Figure 6.10 b A putative NADH binding site in InhA for nicotinamide or flavin
nucleotide is underlined in the four proteins of C. glutamicum, B. lactofermentum, B.
flavum strains ASOl9, BLl, BF4 and M. smegmatis. The red letters indicate the
points of variation.

6.4.2 Comparison of inhA gene of C. glutamicum and Brevibacterium
6.4.2.1 Southern hybridisation analysis
Figure 6.11 and 6.12 and 6.13 show the Southem hybridisation patterns obtained
when using an inhA gene probe from C. glutamicum strain ASOl9 against Hindlll,
BglR and EcoRl genomic digest of Corynebacterium strains (AS019, MLB 194,
MLB133) and two Brevibacterium strains (BLl, BF4). Tables 6.9, 6.10 and 6.11
summarise the sizes of different hybridization bands obtained. The hybridisation
pattern for corynebacterial and brevibacterial species is consistent with the previously
observed Southern results for each species individually, however, minor visual
differences can be explained due to different experimental conditions each time (e.g
% of agarose, voltage, different volumes of digestion mixture and different running
conditions etc). Two different hybridisation patterns can be seen for C. glutamicum
strains and Brevibacterium strains.
The results show that the three strains of C. glutamicum (AS019, MLB194, MLB133)
show similar hybridisation patterns among themselves with three enzymes, two
Brevibacterium strains BLl and BF4 however, have similar patterns with BglU but a
slightly varied pattern was observed with Hindlll genomic DNA digestion. These
results, however, reveal the presence of more than one copy of the gene in different
Corynebacterium species.

2 3 4 5 6
5. Ikb 4.2kb
0.94kb 0.83kb
0.54kb
Figure 6.11 Southern blot hybridisation analysis of Hindlll digested genomic DNA of
different strains of C. glutamicum, B. lactofermentum and Brevibacterium probed
with a 250 bp PCR product obtained using the primer sets CGP3-INH2 using the ^¥
radioactive labeUing system. Lambda DNA HindlU/EcoRl size markers Lane 2, 3, 4,
5, 6, C. glutamicum strains AS019, MLB 194, MLB 133, B. lactofermentum (BLl), B.
flavum (BF4).

Table 6.9 Molecular weights of the hybridisation fragments obtained when CGP3-INH2 probe was used against the genomic DNA digest of various corynebacterial species digested with Hindlll.
XDNA markers
21.22 5.1 4.2 3.5 2.02 1.9 1.5 1.3 0.94 0.54
MW (kb) of the bands detected C. glutamicum
strains AS019,
MLB194, MLB133
12.2 10 1.6
B. lactofermentum strain BLl
13 8.5 3.5 1.5
B. flavum BF4
12.2 8.5 3.5 1.5
strain

21.2kb
5. Ikb 4.2kb 3.5kb
- •
- >
2.02kb L9kb
0.94kb • 0.83kb •
0.54kb
Figure 6.12 Southern blot hybridisation analysis of BgUl digested genomic DNA of
various species of C. glutamicum with a 250 bp PCR amplified product obtained
from C. glutamicum strain ASOl9 using primers sets CGP3-INH2. Lane 1 Lambda
DNA digested HindUllEcoRl size markers. Lanes 2, 3, 4, C. glutamicum strains
ASOl9, MLB 194, MLB 133, and Lanes 5,6 B. lactofermentum and B. flavum strains
BL1,BF4.

Table 6.10 Molecular weights of the hybridizaton fragments obtained when CGP3-INH2 probe was used against the genomic DNA digest of various corynebacterial species digested with Bglll.
XDNA markers
21.22 5.1 4.2 3.5 2.02 1.9 1.5 1.3 0.94 0.54
MW (kb) of the bands detected C. glutamicum
strains AS019,
MLB 194, MLB 133
8-9 5.1 2.3 1.2
B. lactofermentum strain BLl
6.6 6.0 2.3 1.2
B. flavum strain BF4
6.6 6.0 2.3 1.2

21.2kb
5. Ikb 4.2kb
3.5kb
2.02kb
1.5kb
1.3kb
0.54kb
Figure 6.13 Southern blot hybridisation analysis of EcoRl digested genomic DNA of
various species of C. glutamicum with a 250 bp PCR amplified product obtained
from C. glutamicum strain AS019 using primers sets CGP3-INH2. Lane 1 Lambda
DNA digested HindlUlEcoRl size markers. Lanes 2, 3, 4; C. glutamicum strains
ASOl 9, MLB 194, MLB 133, Lanes 5, 6; B. lactofermentum and B. flavum strains
BL1,BF4.
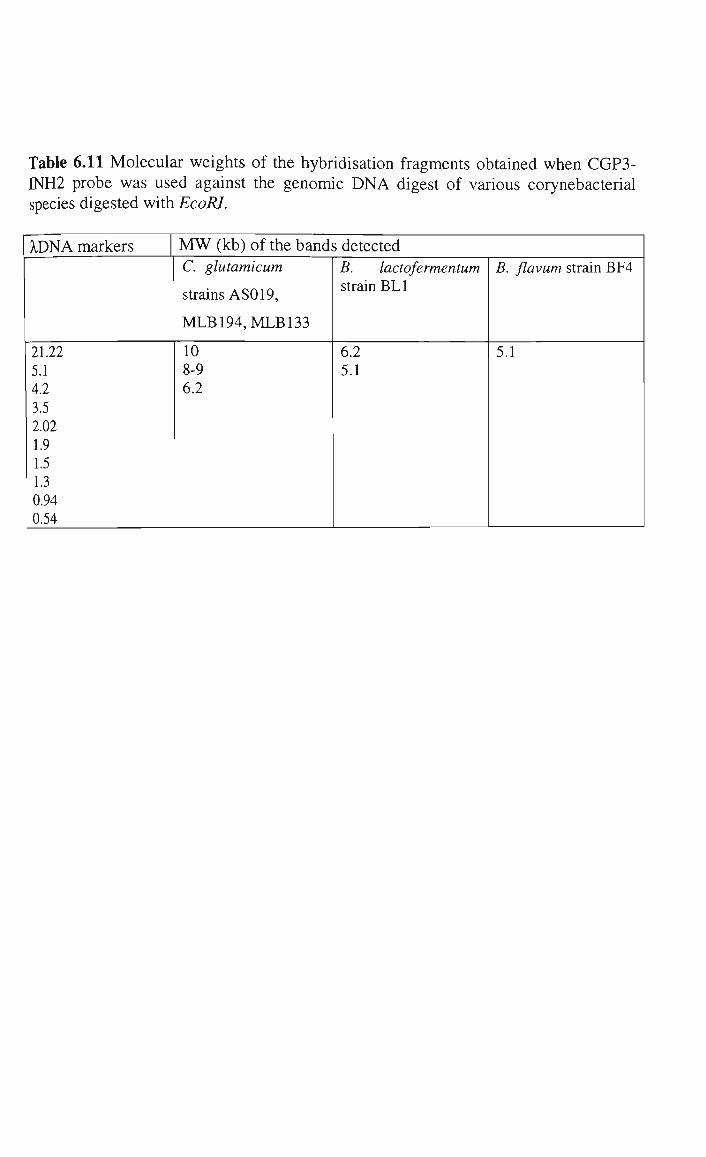
Table 6.11 Molecular weights of the hybridisation fragments obtained when CGP3-INH2 probe was used against the genomic DNA digest of various corynebacterial species digested with EcoRI.
XDNA markers
21.22 5.1 4.2 3.5 2.02 1.9 1.5 1.3 0.94 0.54
MW (kb) of the bands detected C. glutamicum
strains AS019,
MLB194,MLB133
10 8-9 6.2
B. lactofermentum strain BLl
6.2 5.1
B. flavum strain BF4
5.1

6.4.2.2 Base composition of inhA genes in C. glutamicum and Brevibacterium
By comparison of the base composition (Table 6.12) of the gene sequences between
the initiation codon (ATG) and termination codon (TGA), it was found that there was
a marked GC bias in the inhA genes of different Corynebacterium and Brevibacterium
species. The GC contents of the five inhA genes of three Corynebacterium strains and
two Brevibacterium species was 66.12% and 64.46, 64.70 % respectively, similar to
that of the corresponding inhA gene of M. smegmatis (65.50 %).
6.4.2.3 Sequence comparison of inhA genes of C. glutamicum and Brevibacterium
with mycobacterial inhA gene
The inhA gene is highly conserved in different corynebacterial species indicating its
unique involvement in mycolic acid biosynthesis. The inhA genes of Corynebacterium
and Brevibacterium exhibited the best identity with each other and with mycobacterial
inhA genes. The percentage identity between C. glutamicum strain ASOl9 and M.
smegmatis is 99.62, the two mutants MLB 194 and MLB 133 exhibited 98.507 and
96.28 % identity with AS019. Similarly the two Brevibacterium species B.
lactofermentum and B. flavum exhibited 97.16 % identity with each other and 94.42
to 96.65 % with C glutamicum (AS019) and M. smegmatis respectively.

Table 6.12 Base composition (%) of the inhA genes of different Corynebacterium
species.
C. glutamicum B. lactofermentum B. flavum M. smegmatis
Contents AS019 MLB 194 BLl BF4 mc2
A 18.58 18.69
G 32.82 33.01
C 32.94 32.66
T 15.64 15.62
The base composition of the different inhA gene sequences was determined using the
Ecomposition ANGIS and then converted to % of each base out of total.
18.94
32.70
31.76
16.58
18.94
32.94
31.76
16.35
18.70
32.70
32.82
15.76

6.4.3 Analysis of the deduced amino acids sequences of the InhA
proteins
The amino acid sequences of the five InhA proteins, AS019, MLB194, MLB133,
BLl, BF4, were deduced from their respective gene sequences. The deduced
biochemical and physical properties, the molecular basis of electrophoretic
differences observed and differences in the predicted secondary structures of these
InhA proteins are analysed and discussed below.
6.4.3.1 Sizes of the InhA proteins
The inhA genes of Corynebacterium and Brevibacterium had the same total length
(850 bp) from the translation initiation codon (ATG) to the termination codon (TGA)
and encoded 269 amino acid of proteins. InhA proteins deduced from the sequences
of inhA genes had calculated molecular weights ranging from 28.41 kd to 30.04 kd.
Table 6.13 shows the comparision of InhA proteins of C. glutamicum strains AS019,
MLB194 and MLB133 with BLl, BF4,M. smegmatis and M. tuberculosis. These
results are in complete agreement with InhA proteins deduced from the sequences of
respective genes in mycobacterial species.
6.4.3.2 Biochemical properties of the InhA proteins
InhA proteins of different corynebacterial and brevibacterial strains (ASOl9,
MLB194, MLB133 and BLl, BF4) were composed of 269 amino acids very similar to
those of M. smegmatis. All of these proteins have acidic deduced isoelectric points
ranging from pi 5.03 of AS019 to pi 6.16 of BF4 and net negative charges (-7 of
ASOl9 to -3 of BF4) compared to mycobacterial species which had pi in the ranges of
pi 5.19 for M. smegmatis to pi 6.04 for M. tuberculosis and net negative charges of -
6 and -4 respectively.

Table 6.13 Comparison of InhA proteins of Corynebacterium and Brevibacterium species
Proteins Number MW pi Charge Average residue weight of A. As
InhAAS019 269 28.52 5.03 -7 106.036
InhA 194 268 28.41 5.19 -6 106.016
InhA 133 259 27.79 5.17 -5 107.312
InhA BLl 269 28.55 5.44 -4 106.171
InhABF4 269 28.73 6.16 -3 106.171
M. smegmatis 269 28.52 5.19 -6 106.047
M tuberculosis 269 28.52 6.04 -4 106.050
The molecular weights (MW), isoelectric points (pi) and charges of different InhA
proteins were calculated using the Pepstat program of ANGIS. InhA of ASOl9,
MLB 194, MLB 133, BLl and BF4 were deduced from their respective sequences.
Sources of InhA protein data for M. smegmatis and M. tuberculosis is Banerjee et al
(1994).

6.4.3.3 Differences in the amino acid sequences of InhA proteins of
corynbacterial and mycobacterial species
All amino acids substitutions between InhA proteins of C. glutamicum and
Brevibacterium were caused by single nucleotide differences. DNA sequences
responsible for amino acids substitution in the InhA proteins are shown in Table 6.10.
and 5.11. Table 6.10 shows the amino acid differences in three InhA proteins of C.
glutamicum (AS019, MLB194, MLB133) and M smegmatis. There are three amino
acids substitutions in ASOl9 and M. smegmatis, asparagine, serine and alanine at
position 106, 123 and 157, are replaced by aspartic acid, proline and glycine.
MLB 194 and MLB 133 are very similar to M. smegmatis except for position 194
where isoleucine in MLB 194 is replaced by asparagine.
There are 10 amino acid variations between these in B. lactofermentum and B.
flavum at positions 27, 31, 77, 121, 130, 186, 189, 253 and 254 respectively, these
substitutions are similar as seen in C. glutamicum strain ASOl9 and B.
lactofermentum except for position 27 and 123 where there are arginine and serine in
BF4. The two proteins of BLl and BF4 are similar towards the end but show greater
degree of variations with the InhA potein of ASOl9 in terms of amino acid
composition (see Table 6.14 for details).
6.4.3.4 Composition of amino acid of the InhA proteins of Corynebacterium
Although the deduced biochemical properties of the various corynebacterial InhA
proteins were quite similar (Table 6.13) there were subtle differences to be found in
proportions of various amino acids groups (Table 6.15). For example, composition of
charged amino acids in the D+E+H+K+R groups in InhA proteins of C. glutamicum
strains ASOl9, MLB 194, MLB 133 and Brevibacterium strains BLl and BF4 were
21.190, 20.896 and 19.703, 21.190 respectively. However, the apparently minor
aherations might have relatively large effect on the predicted secondary structures of
these InhA proteins.
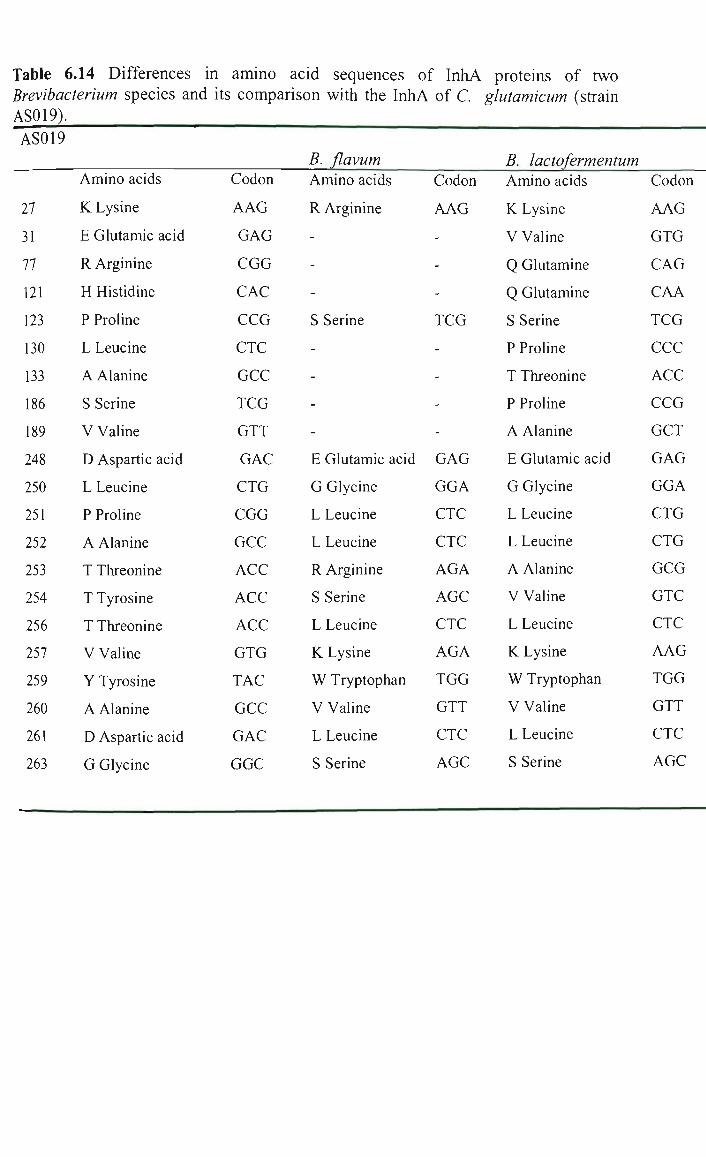
Table 6.14 Differences in amino acid sequences of InhA proteins of two Brevibacterium species and its comparison with the InhA of C. glutamicum (strain AS019). AS019
27
31
77
121
123
130
133
186
189
248
250
251
252
253
254
256
257
259
260
261
263
Amino acids
K Lysine
E Glutamic acid
R Arginine
H Histidine
P Proline
L Leucine
A Alanine
S Serine
V Valine
D Aspartic acid
L Leucine
P Proline
A Alanine
T Threonine
T Tyrosine
T Threonine
V Valine
Y Tyrosine
A Alanine
D Aspartic acid
G Glycine
Codon
AAG
GAG
CGG
CAC
CCG
CTC
GCC
TCG
GTT
GAC
CTG
CGG
GCC
ACC
ACC
ACC
GTG
TAC
GCC
GAC
GGC
B. flavum Amino acids
R Arginine
-
-
-
S Serine
-
-
-
-
E Glutamic acid
G Glycine
L Leucine
L Leucine
R Arginine
S Serine
L Leucine
K Lysine
W Tryptophan
V Valine
L Leucine
S Serine
Codon
AAG
-
-
-
TCG
-
-
-
-
GAG
GGA
CTC
CTC
AGA
AGC
CTC
AGA
TGG
GTT
CTC
AGC
B. lactofermentum Amino acids
K Lysine
V Valine
Q Glutamine
Q Glutamine
S Serine
P Proline
T Threonine
P Proline
A Alanine
E Glutamic acid
G Glycine
L Leucine
L Leucine
A Alanine
V Valine
L Leucine
K Lysine
W Tryptophan
V Valine
L Leucine
S Serine
Codon
AAG
GTG
CAG
CAA
TCG
CCC
ACC
CCG
GCT
GAG
GGA
CTG
CTG
GCG
GTC
CTC
AAG
TGG
GTT
CTC
AGC

O
cq
1/3
'o a 1/3
OQ
a
if)
cn cn
OS
5
OS
o <
^ o^
^ <U
X) a 3 :2
^
u
a 3
^
- H
^ i n
( N
OO
m
cn cn ON
CN
OS i n
^ H
0 0
r-o
OS <N
OS
o ^ o
oo ( N
OS O •^ o
0 0 ( N
r-~ m o o
C--<N
r-i n
m so
^ ^
OS ( N
r-~ ^
i n ^
^ 0 0
r-d
OS <N
i n VO
9.6
•sO ( N
SO OS OS
( N
r~-«n
cn o r~-ON
cn <n
so OS Os
od
OC
r-
SO OS ON
0 0
OO t--
0 0 ^
5.9
so
0 0 "sl-
5.9
so
OS
oo vo d
a |z; in
0)
a 3 o
so
+
a oo
oo d
OS so OS
— I 1 ^ ^
OS cn oi
oo CN
OS CN
SO OS (N
OO in
OS (N
O cn
in CN
1^ in
+ 00
X
o
+
<
o (N
O
m
oo
so
SO
,015
\ 0 (N o^ (N
.194
^
,821
o
SO
r~
,075
o
896
o CN
866
SO <N
O
5.9
imbe
i
Z in
305
xP (N o^ (N
O cn
781
o 1-H
OS ( N
152
iz
so
,726
so
CN
,729
o
so m
,191
( N
(N
,881
CN
SD
0 0
Os i n
so
a + z + + Q
<u T3
'a < i^ <:
p
i + ffi
sic
cd PQ
Pi + ^
+ ffi + + Q
T3
&0 ^
U
;>
+ S + J
+
hob
a o
hyd
Sm
all
>^ + ^
+ U-i
atic
a o ^
73 C ca k H
<U qui
=3
z 00
O Z < t M o
>. 13 *^-J O
a , c/3 <u ^ i/T
.g '5 o I H
a< ea &) o U l
X ^ (U
< = - ^ •+-»
eps
cu
00 c . .—1 (/I :3
•73
upe
o ^ a>
^ c/l (U
'o
spe
13
o 03
x> (D
ryn
o o -» C
(D
iff
T3 t M O Ol
. C
'S o ^ &
< X !
^ o
J3 ^—> t M O IZI
r2 o rt O
UT
a <
t M o
; 0
'o c3 o
'a c3 t M o I - I
a 3 c c3 O
(U
4 - »
o +-»
rt c 0)
CX 1/3
. ^ J
rt CX 3 o &
rt <u
_c 1/3
TS
o a o c "a rt tM
o k H
(U X
a :3 c <D
X +-» <U
o '-B _g

X
o . 1 H
CX
o o T3 C rt
T3 c rt c
bo
1/1 (U o
t ^
OS
5
cn cn
m
bo
0\
o 00
c o T3 O U
CJ
rt O
<
o •T3 o U
o rt O
o o
U
o 73 o U
u o u o < < u ^ u y u o a u < H a u u H o
g 'Bb rt J3 CX 1/3
1)
•c (U
00 00
g 'a '5b
o
tu fl • f-^
M rt rt CX 1/1
<
Z
(U
_g 'G (U
00 00
tu g 'a rt
< <
'S '51
g "a rt
< <
u
c (1> 1/3
>. U
OJ
c u "1
< ON P^ U <
y o u u a o u < u o o u H u < H o u a < o
.g
^ -I
o u u a a u u u o u H u H o u o < o
3 ac
ic
a <
acil
o
lart
VI
< z
fl
Seri
00
<u UIU
Ala
<
<u C
gin
h ^
^
(U
.g
Ian
<
<
tu
g •fl o
<u
^
D UIU
Ala
<
U < o T3
part
ic a
ci
Vi
< Q
so o
a u u
rolin
e
cu
OH
cn CN)
U o o
lyci
ne
O
a
t---i n
U o u
•gin
ine
)M
^
cn i n
o u o
anin
e
< <
-^ i n
o H <
ethi
onin
e
S ^
i n i n
U o o
ycin
e
O O
r-i n
rt
rt > (U
UJ
c2 fl o
73 O
U •2 •G
I 73 fl
OS
cn c^
PQ "A
t3S Tp si 00 •=:
.a o rt tu H CX
S ^ .^ -5
1 ° S tu
^ g . <U
t+H (U
o M
.1 ^ o Q ^ a
<; t t i ^ ^ HH (U
c .a " ^ rt
.a o
T3 O • f j 1/3
O fl fl O

6.4.3.5 Comparison of the InhA proteins of different corynebacterial species with
other bacterial and plant proteins catalysing similar function.
When the Swiss-PROT databases were searched for the text strings associated with
InhA proteins, 41 sequences satisfied the expectation threshold parameter value of 10.
InhA proteins of mycobacterial species were amongst those showing high degree of
homology besides a few plants and bacterial proteins which are supposed to be
involved in fatty acid biosynthesis. These latter proteins showed significant
homology (59%) with corynebacterial InhA proteins when alignment was performed
using the Pileup program of WEBANGIS (Fig. 6.14).
Amino acid sequences of InhA proteins from AS019, MLB133, MLB194, and
Brevibacterium strains BLl and BF4 showed that the InhA proteins are highly
conserved among corynebacterial strains. The average identity between InhA of
Mycobacterium and C. glutamicum was > 95%. The various envM proteins were
also highly conserved among themselves. A putative binding site in InhA for
nicotinamide or flavin is underlined (Fig. 6.14).
350

Fig. 6.14 Alignment of deduced sequences of InhA proteins from C. glutamicum strains, AS019, MLB 194, MLB 133, B. lactofermentum, (BLl) and B. flavum (BF4) with InhA from M. smegmatis, M. tuberculosis (M2j, envM proteins from E. coli (E), S. typhimurium (S), Enoyl ACP reductase from P. aeruginosa (P) and B. nappus (Brassica). The amino acid sequences are aligned using the Pileup program of ANGIS.
AS019
Msemg
133
194
BF4
BLl
M2
E
S
P
Brassica
ASOl 9 Msemg
133
194
BF4
BLl
M2
E
S
P
Brassica
ASOl 9 Msemg
133
194
BF4
BLl
M2
E
S
P
Brassica
.MTGLLEGKR ILVTGIITDS SIAFHIAKVA QEAGAELVLT
__GF.-S
__GF._S
AEN*VADKER T-GF.-T
SESSESKASS GLPID-R
VASKL
VASKL
A-IV-VASKL
_V
R-- --Q--Q
YG--QAM HRE . . .
YG--QAM HRE . . .
SG--AAM HRE . . .
-ILVG APIA--AD-N GYGWAV--SL AA
GF DRLKLVKRIA DRLPKPAPLL EL
R-IQ--T AK
-K-- GRVE -FAAQLGS-- DIVLQCDVAE
-K-- GRVE -FAAQLGS-- SIVLPCDVAE
-K-R GRVE -FASGWGSRP ELCFPCDVAD
TS-RRG-FDQ S-VLPDGS-M -IKKVYPLDA VFDNPEDVPE
..--AFTYQN
..--AFTYQN
..--AFTYQN
TWVPALNIFE
DVQNEEHLST LADRITAEIG EG NKI DGWHSIGFM PQSGMGIDPF
N--
N--
N--
N---N-
AS
-ASIDTMFAE
-ASIDAMFAE
-S-I-AVFAA
--KANKRYAG
--G-V-EA-- A L
-GK VWP-F --F-
-GN VWP-F --F-
-GK HWDGL -II-
SSNWTVQ-AA -CVRQDFGS- -IL-
-_T N--
A -GDQLDG-YV
A -GDQLDG-YV
-V--A -GDQLDG-FT
-..LA NGPEVSKPLL
39
50
50
50
49
50
50
46
46
46
50
63 100
100
100
99
100
100
82
82
82
100
108 150
150
150
149
150
150
123
123
123
148
351

AS019 FDAPYEDVSK GIHIPAYSYA SLAKAVLPIM .NPGGGIVGM DF.DPTRAMP 156
Msemg S 200
133 S 200
194 S PRC_ 200
BF4 S 199
BLl --Q-S P--T 200
M2 A S -M---L S S 200
E NAVTR-GFKI AHD-SS--FV AM---CRSML SALLTL SYLGAE--I- 173
S NAVTR-GFKV AHD-SS--FV AM---CRTML SALLTL SYLGAE--I- 173
P AVTTR-GFRI AHD-S---FI A GREM- KGRN-SLLTL SYLGAE-T-- 173
Brassica E.TSRKGYLA A-SASS--FV --LSHF ASISL TYIASE-II- 197
ASOl9 GY.NWMTVAK SALESVNRFV AREAGKV.GV RSNLVAAGPI RTLAMSAIVG 204
Msemg A 250
133 A 250
194 A N 250
BP4 A 249
BLl A -P--A 250
M2 A Y 250
E N V-GL-- AS--ANV-YM -NAM-P.E-- -V-AIS A-G-.. 220
S N V-GL-- AS--ANV-YM -NAM-P.E-- -V-AIS A-G-.. 220
P N V-GM-- AS--AGV-YL -GSL-A.E-T -V-A-S A-G-.. 220
Brassica --GGG-SS-- A DT-VL -F RKQNI -V-TIS L GSR-AK--.. 245
ASOl9 GALGDEAGQQ MQLLEEGWDQ RAPLGWNMKD PTPVAKTVCA LLSDWLPATT 2 54 Msemg 300
133 --*-RVRTA. 299
194 300
BF4 E-GLLRS 299
BLl E-GLLAV 300
M2 E A- I 1 A 300
E KD FRKMLAHCEA VT-IRRTV.T lED-GNSAAF -C--LSAGIS 261
S KD FRKMLAHCEA VT-IRRTV.T lED-GNSAAF -C--LSAGIS 261
P KS FRKMLAANER QT--RR-V.T lEE-GNAGAF -C--LASGIS 261
Brassica GF IDTMI-YSYN N--IQKTL.T ADE-GNAAAF -V-PLAS-I- 286
352

AS019 GTVIYADGGA STQLL* 270
Msemg 335
133 318
194 .. 333
BF4 -LK-WVL-S- 334
BLl -LK-WVL-S- 335
M2 -DI H 335
E -E-VHV F -I..AAMNEL ELK 294
S -E-VHV F -I..AAMNEL ELK 294
P -EIL-V F N-..TAMGPL DDD*SPRP*K MAASS 294
Brassica -AT--V-N-L NSMGVALDSP VFKDLDK 321
353

6.5 DISCUSSION
hi this chapter we report that the inhA genes of two Brevibacterium species BLl and
BF4 have been successfully cloned and sequenced using PCR approaches. The
sequences of the two inhA genes of Brevibacterium species and their deduced InhA
proteins showed amino acid variations at several points, when compared to other
known InhA proteins of Mycobacterium species. The inhA genes of the two
Brevibacterium species and their deduced proteins were compared with the
corresponding genes in C. glutamicum and number of interesting observations were
made which will be discussed in the following.
6.5.1 Differences in the Southern hybridisation pattern of C. glutamicum and
Brevibacterium
Southern hybridisation experiments reveals two unique patterns for the three-
cornebacterial species tested. In one experiment, where BglU digested genomic DNA
of three corynebacterial species was probed with an inhA probe from ASOl9,
differences were seen in the banding pattern of the three (Fig. 6.13). Three C.
glutamicum strains AS019, MLB133 and MLB194 showed similar hybridisation
patterns indicating the homologous nature of genome, as expected for strains derived
from the same parent. The two Brevibacterium strains BLl and BF4 generated
similar patterns among themselves but slightly different from the C. glutamicum
strains. In the second experiment, where the same inhA probe was used against the
HindlU digested genomic DNA of these three corynebacterial species, three patterns
were seen (Fig. 6.12). The three C. glutamicum strains AS019, MLB 133 and
MLB 194 generated one specific pattern showing more than one copy of the inhA
gene, the two Brevibacterium species, however, showed two patterns that had no
similarity with each other nor with C. glutamicum. For B. lactofermentum one
strong signal was obtained with Hindlll but other enzymes like, Pstl, BgUl, EcoRl
showed multiple fragments, therefore the controversy still remained unsolved whether
it contained a single copy or multiple copies of the gene. Similarly, for B. flavum one
signal was obtained with EcoRl and more than one signal were seen with other
enzymes. In both of these experiments, the gels included the M. smegmatis genomic
354

DNA digest as well but no signal was obtained with either of the two enzymes used,
only Pstl digested genomic DNA of M. smegmatis showed binding of the probe with
a single 3 kb fragment. From these results two conclusions can be drawn.
1 Firstly the two Brevibacterium species and to a lesser degree the C. glutamicum
strains are closely related from the point of view of biochemical and morphological
characteristics, but they represent a heterogenous family of isolates with different
genome structures. Whether this diversity results from deep chromosome
rearrangements will be clarified by the fine mapping and determination of relative
gene positions on the genome of these strains.
2 Secondly, although the hybridisation results varied from species to species they
emphasise the presence of more than one copy of the inhA gene in the different
corynebacterial species. In Mycobacterium, the probe binds only to a 3 kb Pstl
fragment, indicating the presence of one copy of the gene in this species.
6.5.2 The comparison of the deduced InhA proteins of different corynebacterial
species.
The InhA proteins of the different corynebacterial species AS019, BLl and BF4,
deduced from their respective gene sequences, had the same number of amino acids,
but exhibited slight differences in their calculated molecular weights and isoelectric
points (Table 5.9). There are ten amino acid substitutions in a total of 269 amino acid
of the two Brevibacterium species BLl and BF4 at positions 27, 31, 77, 121, 130,
133, 186, 189, 253. The most important is arginine (MW=174 Da, pl 10.76) at
positions 77 and 253 in BF4 which is replaced by lysine and alanine in BLl. Another
important amino acid is proline, which is supposed to have a pronounced effect on the
three dimensional structure of these protein.
Overall the composition of the InhA proteins of Corynebacterium and Brevibacterium
species showed significant differences among the three strains examined. The lower
portion of the InhA proteins (from position 248-269) of BLl and BF4 is almost
identical (except at position 253 and 254) but this region is different for AS019 and
the mutants MLB133 and MLB194. In the upper region (from position 1-247) of the
355

InhA proteins of C. glutamicum strains ASOl9 and B. flavum BF4 show two
differences: lysine and proline at position 27 and 123 m AS019 are replaced by
arginine and serine in BF4.
Similarly in C. glutamicum (strain ASOl9) and B. lactofermentum there are eight
differences (from position 1-247), glutamic acid, arginine, histidine, proline, leucine,
alanine, serine, valine, at position 31, 77, 121, 123, 133, 186, 189 in C. glutamicum
strain ASOl9, are replaced by valine, glutamine, glutamine, serine, proline, threonine,
proline, and alanine in B. lactofermentum. It is very interesting to note that exactly
the same substitutions have occurred at these positions with the same amino acid
between BF4 and BLl. In other words amino acids composition of BF4 is more
similar to that of ASOl9. These results are consistent with the previous observations,
which indicate that
1 Among the three corynebacterial species tested C. glutamicum strain ASOl9 and B.
flavum BF4 were less sensitive to inhibition by INH and ETH (similar values of MICs
16mg/ml for INH) where as B. lactofermentum BLl was more sensitive to inhibition
by these two analogs (MICs 4mg/ml for INH). This may indicate the close
relatedness between the cell structure of the two strains, ASOl9 and BF4, but at the
same time it may also reflect the role or activity of the InhA proteins in these species.
2 Studies of the Jang et at.( 1997) on the restriction modification barriers also
indicated that methylation patterns in B. flavum strain BF4 are similar to those of C.
glutamicum strain ASOl9, whereas B. lactofermentum showed different methylation
patterns on genomic DNA..
Two possibilities could explain the differences in amino acid sequences between these
corynebacterial species. Firstly, a few point mutations in InhA proteins have arisen
which could have lead to the differential activity of the InhA proteins. This possibilty
is supported by our results, which indicate that point mutations could result in
distinguishable differences between AS019, BF4 and BLl.
Secondly, genetic polymorphism might exist between different corynebacterial
species used in this study.
356

Our results indicate the presence of one copy of the inhA gene in M. smegmatis but
more than one copy of this inhA gene in C. glutamicum. Certainly more copies of the
gene will lead to more enzymatic activity and hence more drug would be needed to
inactivate the organism, which may unravel the mystery of why C glutamicum is
naturally more resistant to INH compared to Mycobacterium. Alternatively, mutations
that cause the over-expression of InhA (for example, in the inhA gene promoter or in a
regulatory gene) or gene amplification could also mediate the increase level of
resistance to the drug.
The hypersensitivity of B. lactofermentum to INH and ETH relative to C
glutamicum can also be explained by a lower copy number of the inhA gene in BLl
but evidence for this is not strong because Southem results with Hindlll genomic
DNA digestion showed one major band and few minor bands in BLl but BglU
genomic DNA digestion showed a similar pattem for BF4 and BLl, however, BgUl
digests indicated the same copy number in the three corynebacterial species tested.
This variation can simply be explained as a result of heterologous nature of genome of
the three species. However, these data indicate the presence of multiple gene copies
in these species, suggesting that INH MICs and gene copy may not be related,
although all of the corynebacterial species were more highly resistant to INH then
Mycobacterium species.
6.5.3 Properties of amino acid sequences of InhA proteins
In the previous two chapters, a subgenomic library was constmcted for two
corynebacterial strains, ASOl9 and MLB 194, and an unsuccessful attempt was made
to sequence the entire inhA positive clone. Although the inhA sequences were
amplified from these clones, the exact posifion of the gene in these clones was not
located so this study failed to determine what other genes are located in upstream and
downstream regions of inhA. However, the resuhs indicated that the deduced amino
acid sequences of InhA proteins have high homology with InhA proteins of
mycobacterial species, envM proteins of E. coli and S. typhimurium, Enoyl acyl
carrier proteins of B. napus, and P. aeruginosa. All these proteins are thought to
participate in fatty acid biosynthesis. The location of the inhA gene copies in the
357

corynebacterial genomes may help to determine the role of this gene in fatty acid and
mycolic acid synthesis including the regulation of this gene in cognate operons. This
is the subject of another Ph.D thesis in our laboratory.
The similarities of InhA proteins with several other bacterial and plants proteins
involved in fatty acid biosynthesis is consistent with the Southem results which
indicated that multiple copies of the gene are present in different corynebacterial
species. Mycobacterium and Corynebacterium are two closely related species in
terms of the presence of the mycolic acids; however, mycolic acid composition of the
two is different, where the latter has relatively simple mycolic acids. Although the
fact that more copies of the inhA gene are present in corynebacteria explains the
different behaviour of two bacteria towards INH but at the same time may reflect a
possible different role of InhA proteins in Mycobacterium and Corynebacterium.
Although the present study did not attempt to assay InhA activity, this should be done
in future work to determine the difference between gene dose, expression and enzyme
activity.
358

Chapter 7
Disruption of inhA gene by mean of homologous recombination and characterization of mutants
7.1 INTRODUCTION
The studies reported in previous chapters identified the presence of a gene encoding
for an Enoyl-acyl carrier protein (ACP) reductase in C. glutamicum and related
corynebacterial species. The gene was sequenced and homology searches results
showed clearly its relationship to inhA genes of the mycobacterial family. In
mycobacteria Enoyl-ACP reductases catalyses the nucleotide (NADH)-dependant
reduction of the double bond at position two of a growing fatty acid chain linked to
ACP, an enzymatic activity common to all fatty acid biosynthetic pathways.
Mycobacteria utilise the products of InhA catalysis to create mycolic acids, which are
important components of their cell wall. The taxonomic relatedness of mycobacteria
to corynebacteria in particular has already been mentioned in chapterl (section 1.4 ).
The deduced InhA protein in corynebacteria are likely to play a similar role in
mycolic acid biosynthesis, but the nature of this role has not been determined
previously in Corynebacterium species. However, several differences were observed
in terms of copy number of the inhA gene and different levels of INH resistance seen
between C. glutamicum and two Brevibacterium species. Therefore it was important
to investigate the functional role of the inhA gene, which shows extremely high
similarity to mycobacterial inhA genes. Elucidation of the function of such inhA
genes will require multiple approaches, including classical biochemical approaches
such as enzymatic assays with InhA proteins, as well as molecular genetic approaches
including cloning of the genes, targeted gene disruption and testing of biochemical
and physiological consequences. An enzymatic assay with InhA protein is not
possible unless complete functional enzyme is isolated. Therefore, our intention was
to inactivate the inhA gene in C. glutamicum and analyse the resulting mutants to
deduced correlation between genetic and physiological changes. This chapter
describes several approaches to gene inactivation and the resulting mutants obtained.
359

7.2 ESTABLISHING A METHOD FOR DISRUPTION OF THE
inM GENE INC. GLUTAMICUM
The first part of this work was done to establish parameters necessary for introducing
genes: determining antibiotic sensitivity to select which marker genes could be used
in this background and establishing gene transfer systems such as conjugation /
electroporation with the strains under study.
7.2.1 MICs
The MICs of the antibiotics were determined prior to introduction of plasmids into C.
glutamicum strains. The genetic exchange methods for C. glutamicum employing bi-
parental matings and electroporation were performed in sections 2.3.5. 1. The MICs
for antibiotics used in counter selection of transconjugants or transformants were
determined using LAG (Luria agar) supplemented with 2% glucose, BHIA and ET at
30°C using a range of concentrations of selected antibiotics (5 to 100 |ig/ml) (Table
7.1). C. glutamicum displayed higher MICs for all strains when using BHIA and ET
compared to LA and the concentrations used to select transconjugant strains were
chosen on the basis of these antibiotic sensitivity pattems. The C. glutamicum strains
showed strong resistance to nalidixic acid and sensitivity to kanamycin and
chloramphenicol, as expected from their known phenotypes and lack of plasmids.
The E. coli strains showed sensitivity to nalidixic acid with few colonies appearing at
10 \ig/ml. The experimental results indicated that 50 \ig/ml of Km and 100 |ig/ml of
nalidixic acid could be used to select transconjugants in rich media and to suppress
the growth of parental strains after conjugation or electroporation for the
tranconjugants (Table 7.2).
360

Table 7.1 Determination of MICs of selected antibiotics. The antibiotics were used at
concentrations of 5, 10, 20, 30, 40, 50, 100 |ig/ml in LAG plates supplemented with
2% glucose and results recorded after incubation at 30°C for up to 48-72 h and the
numbers shown are MICs.
Antibiotics
Itg/ml
AS019 MLB133 BLl RM4 E. coli SI7-1 with
S-17-1 pKlSmob
Kanamycin 100
Rifampicin 50 30 25 25
Chloramphenicol 20
Nalidixic acid 100 90 100 100 10 10
means MIC < 5 pg/ml
361

Table 7.2 Selection of antibiotic markers to introduce mobilizable plasmids carrying
intemal fragments of the inhA gene. The symbols indicated that (+) for growing and
(-) for non-growing status.
Strains Nalidixic Kanamycin Chloramphenicol Kanamycin+
acid^ Nalidixic acid
E. coli S17-1 _ + _
pK18mo^::mM
E.coli LysAy.int - + + _
C. glutamicum + _ _ _
Transconjugant + -i- + +
^ Antibiotics concentrations (p-g/ml): Nalidixic acid (50-70), Km (50), Cm (7.5)
362

7.2.2 Failed attempts and strategies for inhA gene disruption
This section describes the use of methods and selection media adopted by different
research groups for the genetic engineering of C. glutamicum by mean of gene
dismption and their application in attempt ion to obtain mutants with the inhA gene
dismpted..
7.2.2.1 Construction of mobilizable pKl8mob-inhA
Figure 7.1 shows the restriction map of suicide vector pKlSmob. This plasmid was
supplied from Schafer et al. (1994) and was used because of the following advantages
1. it carries the Tn5 Km* marker;
2. it is small and offers a higher cloning capacity;
3. the pK vector carries unique multiple cloning sites (MCS) and plasmids carrying
insertions cloned into the MCS can easily be identified using the Lac colour reaction;
4. Inserts can be directly sequenced using the standard Ml3 sequence primers.
For gene dismption experiments, a 700 bp intemal fragment of the inhA gene was
amphfied from chromosomal DNA of ASOl9. The PCR product was ligated into
mobilizable vector pKlSmob, which was previously digested with Pstl (cutting in the
MCS). The Hgation mixture was transformed into E. coli S17-1 (Simon et al, 1983),
a strain with an RP4 derivative in the chromosome, which provides the transfer
functions necessary for mobilization. Transformants were selected on LAG agar
plates containing X-gal, IPTG and 50 p.g/ml of Km to allow blue and white colony
screening. The positive clones were checked for the presence of insert by
1. EcoRl restriction digestion
2. By sequencing using M13 primers.
The positive clones carrying inhA internal fragments were designated pK18mofe-inM,
which carries an inhA gene internal fragment and are efficiently mobilisable by E.
coliSn-l.
363

Figure 7.1 Detailed physical map of the mobilizable ipKlSmob Schafer et al (1994).
The Km gene, and the lacZ fragment are represented by arrows indicating the
direction of transcription. The oriV and the oriT (as the part of RP4mob) are shown
as small boxes. The asterisk indicates the plasmid labels 18 or 19 respectively.
Unique restriction sites for cloning purposes in the MCS of pKlSmob are: EcoRI,
Smal, BamHI, Xbal, Sail, Pstl, Sphl and Hindlll. The universal primer-binding site
is located downstieam from the Hindlll site and the reverse primer binds upstream the
£coRl-site of the MCS in the lacZa fragment. The plasmid pKlSmo^ is efficientiy
mobilizable by E. coli S17-1.
364

7.2.2.2 Transconjugation
For C. glutamicum and related species, RP4-mediated intergeneric conjugation is the
most efficient system to introduce foreign DNA (Schafer et al, 1990). Initially
attempts were made to transfer the pKlSmob-inhA into sti-ains C. glutamicum and B.
lactofermentum by transconjugation.
For conjugal transfer of pKlSmob-inhA to coryneform recipient strains, donor stiain
E. coliSn-l pKlSmob-inhA were grown to the late exponential phase in LB medium
containing 50 |i.g/ml of kanamycin per ml. In the contiol experiment plasmid
pSUP301 carrying a lysA gene intemal fragment (the resulting vector is called
p30llysA-inf) was mobilized by S17-1 into C. glutamicum strain AS019 to dismpt the
chromosomal copy of the lysA gene. Recipient strains were grown in LB medium to
an optical density at 580 nm of 3 to 4. About 5 x 10^ donor and 3.5x10^ recipient cells
were mixed and pelleted by centrifugation at 20°C for a short time. The mating
mixture was then resuspended in residual LB medium and carefully spread onto 0.45
|i.m pore size cellulose acetate filter placed on a pre-warmed LA plates. After 20 hrs
of incubation at 30°C, the cells were washed from the filter with 1 ml of LB medium
and mechanical agitation. Transconjugants were selected by plating onto LAG
containing 25 |ig/ml of kanamycin and 50 }J.g/ml of nalidixic acid. Altematively, the
mixture was also plated on BHIA and LAG plus fatty acids and mycolic acids extract
from normal cells. Since the inhA gene is supposed to inhibit mycolic acid
biosynthesis it was likely that its inactivation might be lethal for cells and resulting
transconjugants might need some mycolic acids or fatty acid supplement into the
growth media for their survival. Mycolic acids are not available commercially
therefore mycolic acids and fatty acids extiact was prepared from C. glutamicum
strains as described in section 2.4.2.3 and spread on BHIA and LAG plates containing
antibiotic.
Recipient cells of C. glutamicum strain ASOl9 was reported to have low fertility in
intergeneric mating (Schafer et al, 1990) because of the presence of an effective
restiiction system. Therefore the cells were subjected to heat treatment for 9 mins at
49°C to inactivate the restiiction barrier. It was reported that B. lactofermentum
strains showed satisfactory mating with E. coli for insertional mutagenesis of the
365

desired genes using intemal fragments as mutagenic tools (Chater and Burton, 1983)
therefore these cells were not heat-treated.
7.2.2.3 Results of the Transconjugation
The tiansconjugation mixture for ipKlSmob-inhA was plated on LAG and BHIA
plates as above. Parental strains did not appear on selection media but also no
transconjugants colonies were isolated after 36-72 h on antibiotic plates. Owing to
the fact that pKlSmob does not contain a corynebacterial origin of rephcon,
transconjugants can only be recovered after a single recombination event between the
plasmid borne inhA gene and the chromosomal gene. Failure to obtain any viable
colonies indicated that the integration event has not taken place. However, in the
control experiment using S17-1 (p301/j5'A-int) donor and C. glutamicum recipient
cells, several transconjugant colonies appeared. Plasmid p301/j5A-int is not able to
replicate into C. glutamicum but a single recombination event between the plasmid
borne lysA gene fragment and the chromosomal copy would lead to incorporation of
the vector into the genome. As a result of integration, the lysA gene will be split into
two incomplete genes lacking either 5' or 3' terminus. The tiansconjugants appeared
at frequencies of 5x10 . The number of transconjugants obtained with B.
lactofermentum was 5-10 fold higher than with ASOl9 after heat tieatment. Transfer
frequencies were expressed as the number of tiansconjugants per final donor colony.
The transconjugants were grown on minimal media and supplemented with (10
|ig/ml) kanamycin and lysine (0.3 mM). Transconjugants were resistant to kanamycin
and auxotiophic for lysine. Free plasmid DNA was not detected after alkaline lysis of
few randomly chosen clones on agarose gel electiophoresis.
7.2.2.4 Southern hybridisation to confirm integration of lysA
Southern hybridisation was carried out to confirm the integration of p301/y5'A-int in
the genome of ASOl9. Two transconjugants Tl and T2 were selected. Genomic
DNAs were purified using Nucleospin kit as per the manufacturer's instmction,
digested witii Pstl and tiansferred to a nitiocellulose membrane as described in
section 2.3.7. Probe pSUP301 DNA and p301/y5A-int plasmid DNA were
radiolabelled with a^^PdCTP (3,000 Cl/mmol, Brestech and hybridisation was
366

performed) as described in section 2.3.7. The membrane was washed with SSPE
buffer containing 0.1% SDS at room temperature and exposed to Kodak X-ray film at
-80°C and developed as described in section 2.3.3. As seen in Fig 7.2, the Pstl
cleaved chromosomal DNA of transconjugants showed two signals (MW 7.3 and 1.6
kb), which is in accordance with the previously reported results of Schwarzer and
Puhler (1991).
These results demonstrated that p30llysA-int had successfully integrated into the
genome of C. glutamicum by homologous recombination thus splitting the
chromosomal copy of lysA into two parts. This control experiment provides
substantial evidence that the transconjugation method had worked efficiently for lysA
but not for introduction of inhA.
The transconjugation process failed to isolate transconjugants with inhA dismption
although all the necessary parameters reported by other researchers were taken into
consideration. This failure would be attributed to several factors including.
• No integration had occurred because of the unsuccessful inttoduction of plasmid
DNA into the host system, possibly, due to restriction barriers or cell-to-cell
contact during mating failed.
• Integration had occurred and disruption of the inhA gene leads to the occurrence
of a lethal mutation. If InhA is involved in mycolic acids biosynthesis as occurs
in Mycobacterium species, then tiansconjugants might lack mycolic acids and
therefore ordinary media cannot support their growth.
367

1 2 3
8.5kb
4.5kb
3.5kb
1.9kb
1.85kb
7.3 kb
1.6 kb
Figure 7.2 Southern analysis of the lysA dismpted mutants of ASOl9. Lane 1:
Sppl/jEcoRl markers; Lane 2: Plasmid pSUP301 containing lysA gene; Lanes 3 to 4;
Total DNA isolated from the ASOl9 lysA~ mutants Tl and T2. digested with
restriction enzyme Pstl and probed with radio-labelled p30llysA-int. Two signals
corresponding to the MWs of 7.3 and 1.6kb appeared in mutants confirming the
previously reported results of Schwarzer etal (1991).
368

Attempts to obtained transconjugants of C. glutamicum showed limited or no success,
as no transconjugants were obtained for inhA inactivation on LAG, BHIA or various
other selective media. Also few transconjugants were produced in contiol
experiments and very poor efficiency was seen when ASOl9 was used as recipient for
lysA and inhA dismption. This promoted an examination of using electroporation and
ET media developed by Britz and Best, (1986).
7.2.3 Gene disruption using electroporation
7.2.3.1 Electroporation and selection of mutants
Electroporation is an efficient mean of introduction of plasmid DNA into C.
glutamicum. ET is the regeneration medium designed for the recovery of protoplasts
based on similar media described by Chang and Cohen (1979) and Gabor and
Hotchkiss (1979). Using various combinations and concentrations of the constitutes
Best and Britz (1986) showed that lowering phosphate levels and CaCli resulted in
more rapid regeneration of protoplasts. Sodium succinate, the osmotic stabiliser, was
used at 0.3 M as higher concenfrations, inhibited growth of protoplasts and, indeed,
untreated cells of these particular strains. This media was also used for the selection
and facilitated recovery of electrotransformants Hynes and .Britz (1990).
For electioporation cells of several different stiains of corynebacteria were grown at
30°C in LBG containing appropriate concentrations of INH and glycine to the desired
Aeoo (0.2 to 0.4) and harvested by centrifugation. The recipient cells were washed,
concentiated 10-fold and finally resuspended in 15% glycerol. The concentrated cells
(40 |il) containing approximately 10^ cells were transferred to a cold polypropylene
tube. One to five 5 |ig of DNA were mixed with the cell suspension and
electroporation was performed as described in section 2.3.4. A single pulse (2.5kv,
MF) was applied and then the cells were diluted with recovery media
(LBG+CaCl2+MgCl2) described in section 2.2.2. After incubating at 30°C, the
mixture was plated onto ET, LAG, BHIA, LAG plus fatty acid and mycolic acids
media containing Km+Nx (25 and 50jLig/nil) and incubated at 30°C for 2 to 3 days. In
the contiol experiment, plasmid PCR2.1 containing the cspl fragment from C.
369

glutamicum was mixed similarly and electroporation performed as described for
pK18mob-mM plasmid.
After 72 hour of incubation, plates were examined and transformants appeared for
both control and for the experimental gene. However, it was interesting to note that
for the contiol (i.e. cspl) mutants appeared on LAG, BHIA and ET plates but inhA
mutants appeared only on ET plates. Since ET is a rich media and it increases the
MICs, exclude the possibihty of contaminants transformants were subcultured on ET
plates containing higher concentrations of antibiotics (50 |i.g/ml of Km and 80 [ig/ml
of Nx). Transformants of strains AS019, RM3, RM4 and BLl grew on successive
subculture on Km-Nx-ET indicating that integration of the plasmid pKlSmob-inhA
has probably integrated into the chromosome by homologous recombination.
7.2.3.2 Proof of integration
The integration event is explained in Figure 7.3. When insertional mutation by
homologous recombination occurs successfully, the suicide vector used is integrated
into the region that is homologous between the insert of the suicide vector and the
chromosomal DNA of recipient strains. As a result of the integration of a suicide
vector, the gene will generate two incomplete genes lacking either 5' or 3' terminus of
the coding region. Transformants were Km resistant and Gram positive. Free
plasmid DNA was not detected after alkaline lysis from 14 randomly chosen clones of
BLl transformants named mob 4, 5, 7, 8, 13, 14 for Southern analysis. "Although
inhA disrupted mutants were isolated from C. glutamicum strains AS019, RM4 and
MLB 133 and some preliminary characterization was undertaken, these mutants did
not survive long-term storage in glycerol broth. Mutants of BLl did survive so that
all of the analysis was performed using these mutants."
To confirm the presence of relative location of pKlSmob-inhA integration onto
chromosome Southern blot hybridisation and several other biochemical test were
performed. The genomic DNA from transformants and wild type BLl was isolated as
described in section 2.4.4, digested with Pstl and other enzymes, subjected to agarose
gel electiophoresis, transferred to nylon membranes and probed with a radio-labelled
inhA gene or pKlSmob-inhA. Figure 7.4 a, b and c show Pstl, Hindlll and EcoRl
digests of mob 4, 5, 6, 7, 8, 13, 14 probed with pKlSmob-inhA.
370

Vector Construction
Used for cloning VOObp inhA fragment
EcoRl Smal BamHI Xbal Sail
Sphl Hindlll
Km'
Figure 7.3 a Constmction of mobilizable shuttie vector pKlSmob-inhA. This vector
was derived from mobilizable pKlSmob . Plasmid pKlSmob was digested with Pstl
at MCS and 700 bp intemal fragment of the inhA gene was ligated into the MCS.
371

Chromosome
Replication
II
Gene of insert
-TSS
Hindm Sphl
700 bp insert
E, S, B, X, S
Km'
^
inhA sequence before homologous insert starts
inhA sequences after homologous insert stops
Figure 7.3 .b Scheme illustrating the recombinational integration and disintegration
of inhA containing plasmids into the chromosomal DNA. I Homologous
recombination between the inhA sequence in suicide vector and the chromosomal
DNA. The arrows show the direction and course of DNA replication. Replication
proceeds around vector from first point of homology 1 to 2 then back to the
chromosome. II. The resulting stmcture of inhA gene inserted with 3.76 kb. MCS is
introduced into the chromosome. Km is the kanamycin resistance gene.
372

To confirm the presence of relative location of pKlSmob-inhA integration onto
chromosome Southem blot hybridisation and several other biochemical test were
performed. The genomic DNA from transformants and wild type BLlwas isolated as
described in section 2.4.4, digested with Pstl and other enzymes, subjected to agarose
gel electrophoresis, transferred to nylon membranes and probed with a radio-labelled
inhA gene or pKlSmob-inhA. Figure 7.4 a, b and c show Pstl, Hindlll and EcoRl
digests of mob 4, 5, 6, 7, 8, 13, 14 probed with pKlSmob-inhA.
The Pstl digest of wild type BLl strain of B. lactofermentum showed a 2.8kb major
band with inhA gene. If integration has occurred at that position then in principle the
size of the resulting inhA gene would be 2.8kb plus 4.45kb (3.8kb vector plus 0.7kb
insert) add up to 7.3kb. In Southern hybridisation Pstl digested genomic DNA of
mutants (0.7kb PCR amplified inhA gene was ligated into Pstl digested pK18moZ?,
one Pstl site is conserved) should show two hybridisation fragments with pklSmob-
inhA probe and sum of expected DNA fragment should be 7.3kb. Fig 7.4a showed the
results of Pstl digested mutants lanes 3, 4, 8, 9 (mutants mob 4, 5, 13, 14
respectively). Lanes 3 and 4 showed only two signals corresponding to 2.8kb which
showed no integration in mob 4 and 5 whereas in lane 8 and 9 (mob 13 and 14) two
and three signals appeared. According to the Fig 7.4a the calculated mol.wt of the
two divided inhA gene signals which appeared in mutants (mob 13, 14 lane 8, 9) is 2.8
+1.6 kb and 2.8+ 2+1.6kb which adds up to 4.6 and 6.6 kb respectively. From this
result it can be predicted that integration has occurred in mutants mob 13 and 14
however, the sum of sizes of the two divided inhA gene signals is smaller than the
expected 7.3 kb fragment.
As predicted in Fig 7.3b integration of vector would introduce MCS into the BLl
genome along with Km' and this would be intact. If integration has occurred then in
Southern hybridisation analysis of Hindlll and EcoRl genomic DNA digests of
mutants two bans should be detected. With EcoRl the genomic digest of BLl showed
two major bands of 6.1 and 5.2kb respectively. In mutants the two bands
(6.1+4.4=10.7 or 5.1+4.5=9.6kb) depending on where integration has occurred should
be seen. Similarly, Hindlll digestion of BLl genomic DNA showed one major band
of 8.5kb with the inhA gene probe. And in mutants two fragments 8.5 plus 4.5kb that
adds up to 13.5kbshould be seen.
373

Fig 7.4b showed the results of Hindlll digestion of mutants. Only one mutant mobl4
(lane 9) showed presence of integration where two bands can be seen. The band
corresponding to 8.5kb is at higher position. This can be explained by that the
mutants were growing on ET plates for DNA isolation moreover DNA is not digested
properly.
Similarly, with EcoRl the genomic DNA of mutants was not digested. As can be
seen in Fig 7.4c fransformant mob 14 (lane 9) showed double band which are not
separated so their sizes can not be measured
374

1 2 3 4 5 6 7 8 9
21.2kb
'W # •
Figure 7.4 a Southem analysis of the putative mM-dismpted mutants of BLl. Lane
1, Lambda HindlU/EcoRl markers; Lane 2, EcoRl digested total genomic DNA of
BLl; Lanes 3, 4, 8, 9 contained total genomic DNA of transconjugants mob 4, 5, 13,
14 digested with Pstl. Lanes 5, 6, 7 contained genomic digest of transconjugants mob
6, 7, 8, digested with EcoRl restiiction enzyme and probed with labelled pKlSmob-
inhA suicide plasmid.
375
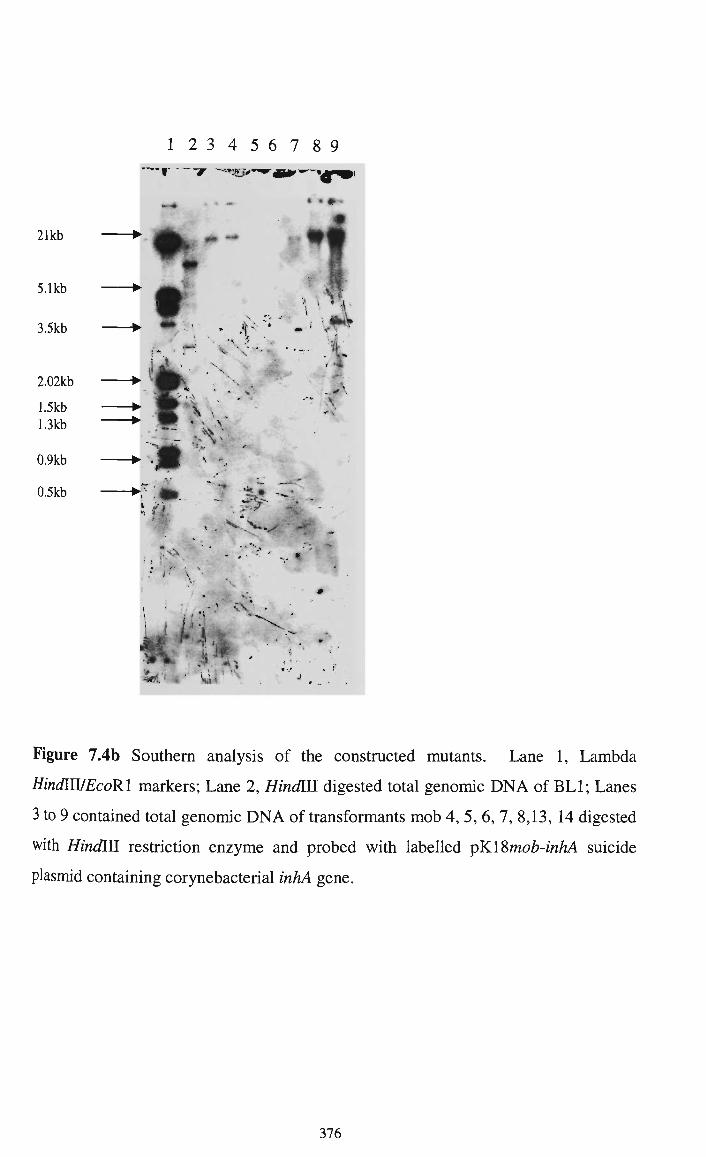
1 2 3 4 5 6 7 8 9
21kb
5.1kb
3.5kb
2.02kb
l.Skb 1.3kb
0.9kb
0.5kb
"t" w "'^•?&'
<<i*^iit^
f* % -.
« »fi»»
.f- ' «•' V
A,
• ^ i ^ ^ -1 i^£!
7 « * « . . «
v..^ - w'
' \
•;\
Figure 7.4b Southern analysis of the constmcted mutants. Lane 1, Lambda
Hindlll/EcoRl markers; Lane 2, Hindlll digested total genomic DNA of BLl; Lanes
3 to 9 contained total genomic DNA of transformants mob 4, 5, 6, 7, 8,13, 14 digested
with Hindlll resttiction enzyme and probed with labelled pKlSmob-inhA suicide
plasmid containing cor5mebacterial inhA gene.
376

21kb
1 2 3 4 5 6 7 8 9
5.1kb
3.5kb
2.02kb
0.9kb
0.5kb
r.ii¥«VWf^sssfc. ;<a,<SS<iS-K.-S.:
Figure 7.5c Southem analysis of the putative mM-dismpted mutants. Lane 1,
Lambda HindlU/EcoRl markers; Lane 2, EcoRl digested total genomic DNA of BLl;
Lanes 3 to 9 contained total genomic DNA of transconjugants mob 4, 5, 6,7, 8, 13, 14
digested with EcoRl restriction enzyme and probed with labelled pKlSmob-inhA
suicide plasmid containing corynebacterial inhA gene.
377

7.3 PRELIMINARY CHARACTERISTICS OF THE
TRANSFORMANTS
7.3.1 Gram staining
Both parents and transformants were Gram stained to compare them with respect to
their morphology. To get an overall view of cells, samples were examined (using a
light microscope) and photo taken. The morphology of transformants after growth on
ET plates was found to be a mixture of round, oval and irregular shaped.cells
compared with their parents, which are a mixture of round, short and long rods.
Change in morphology of the mutants strongly suggests that gene dismption has a
profound effect on cell wall formation. These mutants have defective cell wall.
7.3.2 Inability of the mutants to grow on normal media
The use of media emerged as an issue for the selection of transformants in early
experiments and success occurred due to the use of osmotically protective media.
Therefore it was important to study the growth of these mutants on different media for
their characterisation. Both parents and mutants were stieaked onto LBG, BHI, NA
and Baired Parker agar. On Baired Parker agar, the C. glutamicum sttains formed
black colonies, the mutants failed to grow but little black spots at the points of
streaking indicated that these mutants tried to grow but failed. Similarly, other media,
which supplement the growth of normal cells failed to support the growth of these
mutants indicating they have altered cell wall surfaces and are osmotically sensitive,
therefore these mutants need osmotically protective media to grow. The sodium
succinate, CaCli and MgCh in the ET media provides osmotic protection and helps
growth. Figure 7.6 showed the growth of parents and selected tiansconjugants on
LAG and ET media.
378

379

< l * / * > ^ yt*
Figure 7.5 Gram staining of parents and mutant strains of B. lactofermentum BLl
following growth on different media. Plates a, b and c show BLl grown on LAG,
LAG plus 2% glycine and Baired Parker agar, respectively. Plate d shows mutant
strain mob 13 grown on ET agar.
380

7.3.3. MICs of mutants for INH and ETH
The constmcted mutants were checked for their sensitivity to INH by performing
MICs. For that purpose two types of ET plates were prepared: ET plates containing
different concentrations of INH, ET plates containing different concenttations of INH
and 50 ig + 80 |lg/ml of Km + Nx. Overnight cultures of parents and mutants were
transferred onto these plates using a multiprong replicator (as described in section
2.3.4). As described in Chapter 3, light and heavy inocula were used and tests were
performed in duplicate. After 24 to 48 hrs, growth was recorded. Table 7.3 shows the
MIC results of both parents and mutants. It is very interesting to note that mutants
showed similar MIC values for INH and ETH as seen for the parent BLl and no
variations were observed as seen between ASOl9 parent and mutants MLB 133 and
MLB 194. These mutants in addition to resistance to Km also showed resistance to
INH higher than the parent BLl. Photographs of MICS plates are taken and are
shown in Figure 7.6.
381

Staph
3 4 3 4
Figure 7.6 Growth of Staphylococcus, C. glutamicum strain ASOl9, B.
lactofermentum, and mutants of BLl (clock wise) on different media.
a Staph, AS019, Bil, mutants mob 4,5 6, 7, 8.
b staph, AS019, BLl, mob 4,5, 13, 14, PEll , PEL
Plate 1.Growth on Baired Parker agar AS019, BLl formed black colonies.
Staphlococcus can be differentiated by dark shinny colonies. Clear areas represent no
growth, tranformants failed to grow on Baired Parker agar.
Plate 2.Growth on ET plates containing 80 ^tg/ml Km and 100 p-g/ml Nx.
Plate 3.Growth on LAG Plates containing 80 jig/ml Km and 100 ^ig/ml Nx.
Plate 4.growth on BHI brain heart infusion media containing 80 M-g/ml Km and 100
Hg/ml Nx.
382

0.6 0.8 "
-o'e fe"i>,. •%il/ « • ^ \
<» » ® • « « '
• • * » • « % /
M* • • * * W'< • ' ! ^
m o ^ ' *I
"'•\ « • • • * / \ » • • ^ W
BBBIBIH' 1 III II' I ' l l n i l ' 1 1 . I I I '
•
/
0.3 0.4 0.5
Figure 7.7 a,b Photograph of MICs plates for mM-inactivated mutants of B.
lactofermentum (mob 4, 6, 8) and parent strains BLl. A multiprong replicator was
used to tiansfer small drops of overnight cultures and dilution onto INH-containing
ET plates. The control plate (0) did not contain any INH. These plates have
increased INH concentration from (0-4 mg/ml). Bacterial isolates were as follow
(identical on each plate).
Row 1-2 BLl undiluted, then dilution 10" to 10"
Row 3 mob4 undiluted, then diluted 10" to 10"
Row 4 mob6 undiluted, then diluted 10' to 10"
Row 6-7 mobS undiluted, then diluted 10' to 10"
383

3
•-o
s H W c . ^ H
s 3 O
''•mi
s s 3 »iS (SO
u <4H
o
nts
a 4 - 1
3
s TJ tu
4 - >
ca >
^ C
• i - <
^ -«: .c H 4
0 <*5 1/1
u I-H
S ffi § n h V
Tab
!
1 Ob S to
u >> ^
1
in m
g io
n tr
at
c (U o o o ffi 5
1/3
c
Str
ai
^ -"
m
CN
"
o —^
as
oc
r^
^
>o
'^
cn
<N
^
OO
d
Tl-
1
.
+
+ +
+ +
+ +
a
+ + +
BL
l ^
1
1 1
1
1
1
1
1 1
1
1
•
;
+
+ +
+ +
+ +
+ + +
• ^
"t
, '
;
+
+ +
+ +
+ +
+ + +
VO
Mob
T t
1 1
1 1
1
1
1
1
1 [
1
1
, *
:
+
+ +
+ +
+ +
+ + +
00
Mob
^
, "
;
+
+ +
+ +
+ +
+ + +
cn 1—H
Mob
• *
, *
:
+
+ +
+ +
+ +
+ + +
• ^
mob
c3
^ O o .S >. > c5 (U .c c Vi 3
Td (U c
rmi
(U (U -a
MIC
s fo
r
Q
^ o ; H
bO O c
1
<u » — ^ X Vi
> . ^ j
Vi P
• ^ X I ' 4 - '
^ O i-* W)
J C .4—)
^ o bH U ) (/) c/3 u
~^ II +
.-+ + X
o L H
til) Td o o II
+ + +
used
bo
ls
00

B 3
• 1-H
e m
s Co
Vi C
•c3
C«
Vi
C
13 CLi
c 03
T3 (U
> . 4 - ^ o cj G
• • -H
O 1/3
u
H W
H
s "Bb B a • ^ H
OJ
u 1—(
/ml
00
6 d •I-H
O .^H +-> rt H
4) O
o o ffi H W
V3 £=
Stia
i
VO
i n
•^
cn
<N
00
c5
d
CNl o
^^ d
cs
1
1
+
1
+
+
+
+ +
+ +
ea
,__,
PQ
CN
1
1
+
1
+
+
+
+ +
+ +
+ + +
^
i
CN
1
1
+
1
+
+
+
+ +
+ +
+ + +
'^ X o
CN
1
1
+
1
+
+
+
+ +
+ +
r-X o
<N
1
1
+
1
+
+
+ +
+ +
+ + +
00 X o
CN
1
1
+
1
+
+
+
+ +
+ +
+ + +
m ^ H
X o
o o
>
X bJO C Vi
3 Vi <o c
L-I
* - > (D
Vi
u L-I
a . 4 . ^
Q
o LH
OX)
o
o s - l
00 v> Vi
in II + +
O LH
00
O O 00
+ + + <u Vi
3
O
I OO
H W o
>
c« C <u Vi
o
rt
73 C rt
G <u LH
si
O X
>
O X Vi
> Vi U
O X 1/3
§
T3 G rt
G (D LH
rt
O X
LH
rt
OO

7.3.4 Analysis of lipids
Results reported in the previous chapters indicated the presence of multiple copies of the
inhA gene in Corynebacterium in contrast to its neighbour mycobacterial species. The
biochemical approaches used to smdy the function of inhA gene in Mycobacterium
clearly showed the involvement of InhA protein in mycohc acid biosynthesis. To smdy
the counter function of this gene in C. glutamicum a different approach was used which
involves gene dismption and inactivation. The Southern results showed the disruption of
one chromosomal copy in BLl.
To see whether this dismption had some effect on mycolic acid biosynthesis or not,
analysis of lipids of whole cells of the Km resistant mutants was performed. For this
purpose 50 jig dried cells of mutants and parent strain BLl were transferred to a glass
tube, 2 mg/ml of internal standard (LAME) was added into each sample and mycolic
acids were prepared as described previously in Chapter 2 (section 2.4.2.3). Each
extraction was dried separately, silylated and analysed by GC. The control was 100 |il (2
|j.g/ml) of LAME which was derivatised and extracted as above. The area of LAME in
each sample was compared to that of the control and the extraction yield of each sample
was obtained. The peaks were identified by comparison with the retention time of the
external standards (Sigmal89-6, 189-17).
The results are shown in Table 7.5. These showed the presence of hexadecanoic Ci6:o,
octadecenoic Cign and stearic Ci8:3 acids peaks and internal standard peak appeared but
no peak was seen after 86 minutes for mutants compared to the parents strains. The
presence of these three fatty acids peaks were also confirmed by co-injecting purified
FAMEs plus external standards (FAMEs, Sigma). Since all peaks corresponding to the
mycolic acids appeared at above 280°C it was therefore assumed that these cells have no
mycohc acids or that the mycohc acid concentiation was too low to be detected by GC.
386

Table 7.5 Fatty acid composition of selected inhA dismpted mutants of BLl.
Strains
BLl
13mob
8mob
7mob
6mob
4mob
C 16:0
49.34
28.41
30.24
46.51
24.84
31.56
Fattv acids
C 18:1
40.65
55.07
54.97
47.7
50.62
56.14
C 18:3
9.99
16.50
13.46
13.55
24.53
13.66
387

Therefore, in a second experiment about 100 mg of dry cells were subjected to lipid
extraction the results were similar as seen when 50 mg of the dried cells were used. The
results showed that fatty acids remained the same even with lOOmg of cells and no
visible peak corresponding to mycohc acids appeared at above 280°C. This showed that
dismption of the inhA gene had significant impacts on mycohc acids biosynthesis.
7.3.5 16S ribosomal RNA (rRNA) gene analysis of the mutants
Since the tianformants had changed morphology from the parent stiains and they failed to
grow on ordinary media 16S rRNA gene analysis was performed to prove the identity of
these stiains.
7.3.5.116S rRNA gene amplification
The analysis of 16S rRNA genes was aided by using PCR to amplify target sequences in
transformants mob4, 7, 8, 13, and 14. Two primers were used to amphfy approximately
1,300 bp of a consensus 16S RNA (Figure 7.8): forward primer 63f (5'-CAG GCC TAA
CAC ATG CAA GTC-3') (Marchesi et al, 1998) and reverse primer 1387r (5'-GGG
CGG TGT GTA CAA GGC-3') (Pharmacia; Marchesi et al, 1998) were purchased from
Pacific Ohgos. PCR amplification was performed according to Expand Long Template
PCR system (Boehringer Mannheim) and 500ng of genomic DNA was used as the
template.
7.3.5.2 168 rDNA sequences
The PCR products were sequenced directly using the same primer, used for amplification
(63f and 1387r). Sequence similarity was checked against the 16S rDNA sequences of
other bacteria in the GenBank database using BLASTN program, ANGIS. The sequence
data showed 96 % similarity to known strains of these species, 93% similarity with C.
glutamicum 16S DNA operon and various other similar stiains.
388

7.3.5.3 rRNA operon copy number
Based on partial rRNA sequence information. Southern blot analysis of genomic DNA
digests was performed to provide some information on rRNA copy number and to
compare the "ribotype" of the mutants relative to the parent. Southem blotting was
performed using a PCR ''^P-labelled probe constmcted from strain B. lactofermentum
genomic DNA with two rRNA primers: 63f and 1387r. The probe was hybridised to
restriction enzyme digested genomic DNA of the tiansconjugants. The restriction sites in
the 16S rRNA gene sequences obtained were analysed to determine which restriction
enzyme did or did not cut within the fragment. The digests for stiains showed several
bands, depending on the restriction enzyme used. The blot results may propose a copy
number for the rRNA operon in these strains. The Southern blots shown in Figure 7.9
indicated two or three bands from Hindlll, Pstl digest etc. From these observations, it is
proposed that the copy number for the 16S rRNA gene of strain is two or three. Mob 14
showed identical patterns for restriction digestion of the 16S rRNA gene, proving that
this mutant was B. lactofermentum.
389

Figure 7.8. Agarose gel electrophoresis of 16S rRNA gene PCR amphfication products.
Lane 1, 1KB DNA ladder consisted of 13 fragments with 10,000, 8,000, 6,000, 5,000,
4,000, 3,000, 2,500, 2,000, 1,500, 1,000, 750, 500, 250 bp. Lanes 2-7 contained mob 4,8,
13, 14, PEl, PEll; Lane 8 BLl.
390

21.2kb
5. Ikb
3.5kb
2.02kb
1.5kb
0.9kb
0.5kb
Figure 7.9 a Analysis of 16S rRNA gene of transformants by Southern hybridisation of
genomic DNA digests, probing with an amphfied 16S rRNA PCR product.
a The genomic DNA was digested with selected restiiction enzymes at appropriate
temperatures and 2|j.g of DNA were resolved on large agarose gels by electiophoresis.
Hybridisation was performed by ^ P labelling protocols as described previously. Lane 1
^Hindlll/EcoRl markers; Lanes 2 to 8 genomic DNA of tiansformants mob 4, 5, 8, 13,
14 digested with Hindlll; Lane 9, Hindlll digest genomic DNA of BLl.
391

21.2kb
5. Ikb
2.02kb
•< 2.02kb
^ 1.5kb
< 0.9kb
< 0.5kb
b The genomic DNA was digested with selected restriction enzymes at appropriate
temperatures and 2|a.g of DNA were resolved on large agarose gels by electiophoresis.
Hybridisation was performed by ^ P labelling protocols as described previously. Lane 1,
XHindlUlEcoRl markers; Lanes 2 to 8 genomic DNA of transconjugants mob 4, 5, 8, 13,
14 digested with. Pstl; Lane 9, Pstl digested genomic DNA of BLl ( Numbering starts
from right to left).
392

7.4 DISCUSSION
Dismption of a chromosomal gene by integration of a vector with an internal fragment of
a well-characterised or sequenced gene is a rapid way to analyse its function. This
approach was taken to elucidate the function of the inhA gene in C. glutamicum. This
chapter described the means and methods adapted to get inhA dismpted mutants and
physiological and biochemical consequences of this phenomena on the emerging
mutants. Unhke previous systems, which were largely based on well-established media
for the selection of transformants, part of the work reported in this chapter involved the
choice and development of suitable media for the selection and proper maintenance of
these unique mutants. Preliminary dmg tests were performed, to determine the MICs in
LAG plates with concentration ranges from 0 to 100 p-g/ml for donor and recipients.
Based on antibiotic sensitivity, kanamycin and nahdixic acid were chosen to suppress the
parental strains. The transconjugation experiments were carried out using the method
described by Schafer et al. (1990). In control experiments lysA transconjugants were
successfully recovered on LA plates supplemented with 2% glucose while inhA
transconjugants failed to appear, indicating that a lethal mutation may have occurred or
that ordinary media could not support mutant growth. Since InhA is known to block
mycolic acid biosynthesis in mycobacteria, similarity with mycobacterial counterpart
stiongly suggested its involvement in mycolic acids biosynthesis. To elucidate the
function of the inhA gene in corynebacteria gene inactivation was carried out.
Inactivation of the inhA gene may lead to the inhibition of mycolic acid biosynthesis in
corynebacteria and hypothetically, the resulting mutants might have defective cell wahs
resulting in lethal effects on the emerging transconjugants.. Therefore this study was
focussed on the design of media for the recovery of transconjugants or transformants that
may have defective cell surfaces. There are reports in the literature showing the use of
ET media for the recovery of spherolplasts. One of the important components in ET
media is CaCla and MgCl2 both of these component help in the attachment of
peptidoglycan and arabinogalactan and help in the cell wall formation. Therefore this
medium was used to recover potentially damaged cell. Transformants failed to grow on
LAG, and all other media tested for this purpose indicating the requhement of
393

osmotically protective media. ET media was used previously for the recovery of
electrotiansformants and spheroplasts. Failure of the tiansconjugants to grow on any
other media except ET strongly suggested that these mutants might have altered cell
surface structures.
Results of the integration are shown in Fig 7.4 a, b. The insert was located in the Pstl
site of cloning vector as seen in Fig. 7.4a where mutants were digested with this enzyme
(Fig 7.4a) and probed with inhA fragment two signals appeared indicating the bifurcation
of gene into two haves after integration. Schwarzer and Phiiler (1991) also identified the
structure of lysA gene fragment integrated with the suicide vector using the same strategy.
Lipids profiles of the mutants showed that mycolic acids were not present, as no mycolic
acid peak was detected, except for one mutant where a small peaks was detected which
have the same retention time as was seen for the parent strains. This indicated the
presence of small amounts or no mycolic acids in the mutants. The inability of the
mutants to grow on any other media except ET and the absence of mycolic acids suggests
that the mutants were osmotically fragile. Previous studies in C. glutamicum showed
enzymatic removal of the cell wall, leaving behind sepheroplast, which could be
propagated. Although the mutants lacking mycohc acids as determined by GC analysis
but fatty acids Ci6:o, Ciga, Ci8:3 were detected. The presence of Ci8:i is interesting as this
fatty acid is found rarely but appears to be characteristic of corynebacteria.
The most recently described model for the synthesis of corynemycolic acids is described
in detail in Chapter 1 (section 1.6.4) where two molecules of palmitic acid condense
without an intermediate carboxylation step in the course of the synthesis of mature
mycolic acids. This condensation reaction involves a highly activated enolate
intermediate. However, the nature of the acyl carrier groups is not known but is
presumably an ACP (Lee et a/., 1997). The deduced InhA proteins of coryne inhA genes
are enoyl-ACPs: this protein in Mycobacterium is believed to catalyses the NADH-
dependant reduction of the double bond at position two of a growing fatty acid chain
linked to ACP, an enzymatic activity common to all known fatty acids biosynthetic
394

pathways. InhA preferentially reduces long-chain substrates (those containing 16 or
more carbon atoms). Mycobacterium utihzes the products of InhA catalyses to create
long chained (C40 to Ceo) a-branched fatty acids. The present study supports this
hypothesis since dismption of inhA gene (deduced protein 2-trans-enoyl ACP) lead to
failure of the mutants to produce mycolic acids. The namre of the presumed ACP in C.
glutamicum and related species must be the InhA protein. However, biochemical studies
to elucidate the functional role of this protein are needed. This study is first step towards
understanding the genetics of mycolic acid synthesis in these species.
Results of Jang (1997) reported that INH causes the disruption of mycohc acids
attachment, which indicates that INH function differently in coryne and mycobacteria.
Another important point to be consider is that mycobacteria have a complex lipid
stmcture and large number of enzymes are involved in its biosynthesis. Recentiy, the
mas gene was disrupted in M. bovis BCG using a constmct in which an internal 2kb
segment in the mas gene was replaced with the hygromycin-resistant gene (hyg) of
approximately the same size, such that the hyg was flanked by 4.7 and 1.4kb segments of
mas (Azad et al, 1996). The gene-dismpted mutant was not able to synthesise mycoside
B. Obviously, mycocerosic acids that constitute the major acyl moieties in mycoside B
cannot be substituted thus mycoside could not be produced by the mutants in the absence
of mycocerosic acids. On the other hand, the acyl portion of the wax-type esters is
composed of methyl-branched acids shorter than mycocerosic acids and some
mycocerosic acids. The ma.y-disrupted mutants produced phthiocerol esters, which
contained only the shorter methyl-branched acids. Obviously, these branched acids are
produced by enzymes other than MAS. In fact, a protein fraction that catalysed the
synthesis of these specific branched acids was obtained from the extiacts of a mas-
disrupted mutants (Kolattkudy et al, 1997), thus clearly distinguished two enzymes
involved in branched fatty acids synthesis. Similarly, in corynebacteria although the
biochemical consequences of inhA dismption were clear, the functional consequences are
not yet known.
395

Secondly InhA proteins play a slightiy different role in two phylogenetically similar
genera because of the different pathways of mycolic acid biosynthesis, wherein
mycobacteria it is a complicated because of the involvement of several enzymes and in
Corynebacterium it is mere condensation of two molecules with the need of an important
ACP.
The results presented further showed there is no direct or indkect interactions between
isoniazid and InhA proteins, as inhA dismpted mutants showed similar MICs values to
the parents. However, further studies of the mutants (like effect of INH on specific
growth, protoplasting and transformation efficiencies) need to be elucidated. In
mycobacteria, it has been proven that INH indirectiy interacts with InhA. Several lines of
evidence prove the theory that, to inhibit InhA, isoniazid requires conversion to an
activated form of the drug and that a catalase-peroxidase (katG) participates in isoniazid
activation. This may indicate that the two protein although showing high homology, still
different functional role in two closely related species.
396

APPENDIX 1
MEDIA, REAGENTS AND SUPPLIERS OF CHEMICALS, MEDIUM
CONSTITUENTS AND ACCESSORIES
A. Preparation of chemicals and medium
Antibiotic solutions were prepared from Sigma chemicals as follows: kanamycin, (50mg/ml) neomycin (lOmg/ml), ampicilhn (50mg/ml), and streptomycin (lOmg/ml) were prepared aseptically in sterile distilled water and filtered through 0.22 \im filter (Milhpore, GS). Nahdixic acid (50mg/ml) in IN NaOH. Chloramphenicol (50 mg/ml) was prepared in ethanol and tetracycline (5 mg/ml) and rifampicin (10 mg/ml) in methanol.
Derivatising agent (Tri-Sil Z') for preparation of trimethylsilyl (TMS) was from Pierce Chemical. Co., Rockford, Ilhnois, U.S.A.
Fatty acids were identified by gas chromatography by comparing retention times of then-methyl ester derivatives with the sigma "standard" methyl esters (Sigma 189-17). This standard contained the following weight percentage of each methyl ester: for 100 mg of fatty acids standard 1 (Sigma 189-17); Myristic acid methyl ester (Ci4:o), 4%; Palmitic acid methyl ester (Ci6:o), 10%; Stearic acid methyl ester (Ci8:o), 6 %; Oleic acid methyl ester (Ci8:i cis-9), 25%; Elaidic acid methyl ester (Ci8:i trans-9), 10%; Linoleic acid methyl ester (Ci8:2, cis-9, 12), 34%; Linolelaidic acid methyl ester (C na, trans-9, 12), 2% ; Linoleic acid methyl ester methyl ester (Ci8:3 cis-9, 12, 15), 5%; Arachidic acid methyl ester (C20:i), 2%; Behenic acid methyl ester (Cairo), 2%. Lignoceric acid methyly ester, C25H50O2, Sigma L6766 was used as an internal standard.
Isonicotinic acid hydrazide (INH) was obtained from Sigma (catalogue number 1-3377) and stock (100 mg/ml prepared in deionised water) was sterihsed at 109°C for 25 min and stored at room temperature in brown bottles.
Lysozyme was from hen egg white and had an activity of 250,000 units/mg, Boehringer Mannheim.
Phenol was from Wako (Tokyo, Japan).
Polaroid films (type 665 and type 667) were from Polaroid
DNA standards were obtained from Promega, MBI and Sigma.
Other chemicals and medium constituents are also hsted below.
397

Reagent Source
Acetic acid
Agar
Bromophenol
BSA (for protein assay)
Casoamino acid
Caesium chloride
Chloroform
Diethyl ether
Dithiothreitol
DNA grade agarose
EDTA (di-sodium salt)
Fohn-Ciocalteu's reagent
Glucose
Glycerol
Hexane
Isopropanol
Isoamylalcohol
Maleic acid
Methanol
Middlebrook 7H9
Peptone
Petroleum ether
Potassium accetate
SDS
Sucrose
a- ^ P Deoxycytidine 5'- Triphosphate
Tris
Tween 80
Tween 40
Urea
BDH
Oxoid
BDH
Sigma
Difco
Boehringer Mannheim
BDH
BDH
Sigma
Progen
Sigma
AJAX
BDH
AJAX
BDH
BDH
BDH
Sigma
BDH
Difco
Oxoid
BDH
Sigma
Pierce
BDH
Bresatec
Sigma
Promega
Promega
Promega
398

Yeast extract Oxoid
B. SUPPLIERS and ADRESSES
AJAX chemicals Ltd
AldrickSigma-Aldrick Pty Ltd
B. Braun Melsunger AG, Australia
Beckman instruments P/L
BDH Laboratories supplies
Bio-Rad Laboratories P/L
2113
Boehringer Mannheim Biochemica
Australia P/L
Disposable Produce P/L
Essendon Produce P/L
FSE Du Pont Australia Ltd
Merck (BDH distiibutor)
Millipore
Oxoid
Pharmacia Australia P/L
Pierce
Polaroid Austialia Pty Ltd
QIAGEN Pty Ltd
Selby Scientific Laboratory Equipment
Sigma-Aldrick Pty Ltd
Varian Austraha P/L
Wako/Novachem Pty. Ltd
18 Hamlet St. Cheltenham, Vic 3192
Unit 2, 10 Anella Ave, Castie Hill, NSW 2154.
10 Arcae Rd, Box Hill Nth, Vic 3153
24 College St, Gladesville, NSW 2111
Poole, BHI5 HD, England
Unit 11, 112-118 Talavera Rd, Nth Ryde, NSW
26-28 Ellingworth Parade, Box Hill, Vic 3128
16 Park Way, Technology Park, S.A. 5095
16 Rusell St, Essendon, Vic 3040
Medical products Dept. Healthcare Block C,
Centre Court Industrial Estate, 25-27 Paul St,
Nth Northside, NSW 2113
207 Colchester Rd, Kilsyth, Vic 3137
PO Box 721, Richmond, Vic 3121
PO Box 220, West Heidelberg, Vic 3081
4 Byfeild St, Nth Ryde, NSW 2113
PO Box 117, Rockford, IL U.S.A 61105
13-15 Lyon Park Road, North Ryde NSW 2113
PO Box 25 Chfton Hill Victoria 3068
368 Ferntree Gully Rd, Notting Hill, Vic 3168
Unit 2, 10 Anella Ave, Castle Hill, NSW 2154
679 Springvale Rd, Mulgrave, Vic 3170
50 Garden street. South Yarra VIC 3141
Australia
399

APPENDIX 2
BUFFERS, REAGENTS AND ENZYMES FOR MOLECULAR WORK
All media, buffers, reagents and enzyme preparations described in this section are taken from Sambrook and Maniatis (1989).
5.0 M Ammonium Acetate Dissolve 385.4g-ammonium acetate in 1 htre of distilled water
Denhardt's Solution (50X) Dissolve the following ingredients in succession in 500 ml of H2O: 5g of Ficoll™ 5g of polyvinylpyrrohdone (PVP), and 5g of bovine serum albumin. Filter sterilise using 0.45(xm filters Millipore and store at -20°C.
Denaturing Solution The composition of the denaturation solution was 1.5 M NaCl and 0.5 M NaOH. The solution was freshly prepared each time prior to use.
0.5 M EDTA (pH8.0) Add 186.1g of disodium ethylenediaminetetra-acetate-2H20 to 800ml of H2O. Sth on a magnetic stkrer. Adjust the pH to 8.0 with NaOH (approximately 20g of NaOH pellets). Dispense into aliquots and sterilise by autoclaving.
Ethidium Bromide Solution Add Ig of ethidium bromide to 100 ml of distilled H2O. Stir on a magnetic stirrer for several hours to ensure that the dye has dissolved. Wrap the container in aluminium foil or keep the solution in a dark bottle and store at 4°C..
Gel-Loading Buffer
DNA sample loading dye (6X) was used for agarose gel electiophoresis and contained
0.25% bromephenol blue, 0.25% xylene cyanol FF, and 40%(w/v) sucrose in water
Hybridisation Wash (Low Strengency) This washing solution consist of 0.2X SSC and 0.1% SDS. The hybridisation wash solution was prepared by combining stock solution of respective constitutes and diluting with appropriate volume of H2O. The stock solution was stored at room temperamre and heated to 65°C prior to use.
Hybridisation Wash (High Strengency) This solution contained 2X SSC and 0.1% SDS. The hybridisation wash solution was prepared by combining stock solution of respective constitutes and diluting with
400

appropriate volume of H2O. The stock solution was stored at room temperamre and heated to 65°C prior to use.
IPTG, 0.1 M Stock Solution To 1.2 g IPTG (Sigma Cat # V3955) 50 ml of water was added. The solution was filter sterilised through a 0.2 )im filter unit and store at 4°C. Luria Broth (LB) LB was used to cultiire bacteria for molecular biology-based sttidies. Medium contained per htie: lOg of tryptone, 5g of yeast extract, and lOg of sodium chloride. pH was adjusted to 7.0 with 5 N NaOH, and sterilised by autoclaving for 20 min at 121°C. Lysozyme Prepare a stock solution of lysozyme at a concentration of 10 mg/ml in water. Dispense into ahquots and store at -20 °C. Discard each after use.
Neutralising Solution 1.0 M Ammonium acetate, 0.2 M NaOH.
0.4 N NaOH Dissolve 16.0g of NaOH in distilled H2O. Dispense into aliquots and steriUse by autoclaving.
5.0 M NaCI Dissolve 292.2g NaCl in 800 ml of H2O. Adjust the volume to 1 htte with H2O. Dispense into aliquots and sterilise by autoclaving.
Peptone solution
This solution was made by dissolving peptone in water at a final concenttation of 50
mg/ml and sterilized by autoclaving. The stock solution was stored at room temperature.
1.0 M Potassium Acetate (pH 7.5) Dissolve 9.82g of potassium in 90 ml of H2O (Milh-Q or equivalent). Adjust the pH to 7.5 with 2.0 M acetic acid. Add pure H2O to 100 ml. Divide the solution into aliquot and store at -20°C
Prehybridisation /Hybridisation Solution Hybridization solutions consisted of 5X Denhard's reagent, 6X SSC, 0.5% SDS, and 1.0 mg/ml denatured salmon sperm DNA. Solutions were prepared by combining stock solutions of the respective constituents. Hybridisation solution was stored at 4°C.
Probe Washing Solution. Per 100 ml of probe wash solution: 0.5 ml of 20X SSC, 1.0ml of 10% SDS, 10.0 ml of 2.0 M Tris.HCl (pH 7.5). Adjust the volume to 100 ml by adding distilled water. Proteinase K (stock solution 20 mg/ml in H2O)
401
Dissolve 100 mg of Proteinase K was dissolved in TE (pH 8.0) to achieve the final concentration of 20 mg/ml and stored at -20°C.
RNase (DNase free) Dissolve 100 mg pancreatic RNase (RNase A) in 10 ml of sterile TE buffer, pH 8.0. Heat in boiling water bath for 5 minutes, then switch off the water bath and leave the solution for another 10-15 min. Allow cooling slowly at room temperamre. Dispense into ahquots and store at -20°C.
20X SSC Dissolve 175.3 of NaCl and 88.2g of sodium citrate in 800ml of H2O. Adjust the pH to 7.0 with a few drops ION solution of NaOH. Adjust the volume to 1 litte with H20.Dispense into aliquots. Sterilise by autoclaving.
10 % Sodium Dodecyl Sulphate (SDS) Dissolve lOOg of electtophoresis grade SDS in 900ml of H2O. Heat to 60°C to assist dissolution Adjust the pH to 7.2 by adding a few drops of concenttated HCl. Adjust the volume to 1 htte with H2O. Dispense into ahquots.
3.0 M Sodium Acetate (pH 5.2) Dissolve 408.Ig of sodium acetate in 800 ml of H2O. Adjust the pH to 5.2 with glacial acetic acid and make up the volume to 1 litte with H2O. Dispense into with ahquots and sterilise by autoclaving.
STE Buffer The composition of STE was 0.1 M NaCl, 10 mM Tris.HCl (pH 8.0), 1.0 mM EDTA (pH 8.0). The stock solution was stored at room temperamre.
TE Buffer, pH 8.0 TE buffer consist of lOmM Tris.HCl (pH 8.0) and 1 mM EDTA (pH 8.0). TE buffer was made by combining stock solutions of the respective constituents and diluting with appropriate volume of H2O.
1.0 M Tris Dissolve 121.14g of Tris base in 800 ml of H2O. Adjust the pH to the desired value by adding concentrated HCl. Allow the solution to cool to room temperature before making the final adjustments to the pH. Adjust the volume of the solution to 1 litre with H2O. Dispense into ahquots and sterilise by autoclaving at 121°C.
X-gal Stock solution 20 mg/ml was prepared by dissolving X-gal in dimethylforamide.
402

APPENDIX 3
BUFFERS AND REAGENTS FOR MEMBRANE PREPARATION AND FOR PROTEIN ASSAY
Bovine Serum Albumin (BSA) The stock solution of BSA (5.0 %) was diluted in 0.45 N NaHP04 to achieve the final concentration of lOOug/ml. The BSA solution was stored at 4°C.
Folin Ciocalteau Reagent (Diluted) Dilute Folin reagent was prepared by mixing 2.0 ml of concenttated Folin Ciocalteau reagent with 3.0 ml of deionised water. The reagent was prepared immediately before protein assay.
Lowery Reagent A
Reagent A consisted of 20.0 g of Na2C03 in 1 litre of 0.1 N NaOH. The solution was stored at room temperature.
Lowery Reagent B Reagent B consisted of 0.5 g of CUSO4.5H2O in 100 ml of 1.0 % (w/v) aqueous solution of K-Na-tarttate. The pH was adjusted to 9.00 by and the solution was stored at 4°C.
Lowery Reagent C Reagent C was prepared by mixing 50.0 ml of reagent A and 1.0 ml of reagent B. Reagent C was prepare just before use and discarded after one day.
0.45M NaH2P04 Buffer Dissolve 54.0 g of NaH2P04 in litte of distilled water. Sterilise by autoclaving at 121°C for 15 minutes.
4.6 N NaOH Dissolve 184.0 g of NaOH in 1 htte of distilled water.
O.NNaOH Dissolve 4.0 g of NaOH in 1 litte of distilled water. Sterihse by autoclaving at 121°C for 15 min DNA sample loading dye (6X) was used for agarose gel electtophoresis and contained 0.25% bromophenol blue and 40% (w/v) sucrose in water.
Triton X-lOO Solution 20% v/v ttiton X-100 solution was prepared by dissolving 20 ml of tritonX-100 in 80 ml of water and heating 60-80°C.
403

Veronal Buffer Veronal buffer consisted of 572 mg Veronal, 375 mg Veronal sodium, 27 mg CaC^. 2H2O and 109 mg MgS04. 7H2O, in 1000 ml distilled water. The solution was stored at 4°C.
Veronal /HCl Buffer (pH 9.5) Veronal /HCl buffer consisted of 0.1 M Veronal sodium solution and pH was adjusted to 9.5 with 1 M-HCl
404

Appendix 4
Sequence of the 16sRNA for strain AS019 using 63F primer
1 TTTCCAATNC CCTCGCTNTN GNGGATGAGT GGCGAACGGG TGAGTAACAC 51 GTGGGTGATC TGCCCTACAC TTTGTGATAN NCCTGGGAAA CTGGGTCTAA 101 TNCCGAATAT TCACACCACC GTAGGGGTGG TGTGGAAAGC NTTATGCGGT 151 GTGGGATGAG CCTGCGGCCT ATCAGCTTGT TGGTGGGGTA ATGGCCTACC 201 AAGGCGTCGA CGGGTAGCCG GCCTGAGAGG GTGTACGGCC ACATTGGGAC 251 TGAGACACGG CCCAGACTCC TACGGGAGGC AGCAGTGGGG AATATTGCAC 301 AATGGGCGCA AGCCTGATGC AGCGACGCCG CGTGGGGGAT GAAGGCCTTC 351 GGGTTGTAAA CTCCTTTCGC TAGGGACGAA GCCTTATGGN GACGGNACCT 401 GGAGAAGAAN CACCGGCTAA CTACNTGCCN NCAGCCGCGG NAATACGTAN 451 GGNGCGAGCG TTGTCCGGAA TTACTGGGCG TAAAGAGCTC GTANGTGGNT 501 TGTCGCGTCN TCTGTGAAAT CCCGGGGCTT AACTTCGGGC GTGCACGCGA 551 TACGGGCATA ACTTGAGTGC TGTAGGGGAG ACTGGAATTN CTGGTGTAGC 601 CGGTGAAATN CCGCACATAT CANGAGGAAC ACCAATGGCG AAAGCAGGTC 651 TNTGGGCAGT AACTGACCTG AAGAGCNAAA CATGGGTAGT GNACAAGATT 701 ANATACCCTG GTAGTCCATG CCNTAAACCG NGGGGCGCTA GGTGTANGGG 751 TCTTTCACCA CTTTTGGGCC GCACTTACCC ATTAAACGCC CCCCTGGGGA 801 GTTCCNGCNC ANGGNTTTAA ACTNCAAAGG NATTTGACCC GGGGGCCCCA 851 CAAANCCGGN GGGGCATTGT NGGTTTAAAT TNATTNCAAC CCNAAAAAAA 901 CCTTANCNCG GGCTTGGACA TTGGANCCCG ATNNGGCGGG ANAAANACCN 951 TTTTCCCTTT TTNGGNTCNG GTCCACCAGG GGGGGGCCT
Sequence of the 16sRNA.for strain AS019 using 1387R primer.
1 TTCCATCTCC NACACCANTG ATGTTGATCT GCGATTNCTA GCGACTCCGA 51 CTTCATGGGG TCGAGTTGCA GACCNNAATN TTAACTGAGG CCGGCTTTAA 101 GAGNTTAGNT CCACCTCACG GTGTGGCAAC TCGCTGTACC GACCATTGTA 151 GCATGTGTGA AGCCCTGGAC ATAAGGGGCA TGATGATTTG ACGTCATCCC 201 CACCTTCCTC CGAGTTAACC CCGGCAGTCT CTCATGAGTA CCCACCANAA 251 TGTGCTGGCA ACATAAGACA AGGGTTGCGC TCGTTGCGGG ACTTAACCCA 301 ACATCTCACG ACACGAGCTG ACGACAACCA TGCACCACCT GTGAACCGAC 351 CACAAGGGAA AACGTATCTC TACGCCGATC CGGTCCATGT CAAGCCCAGG 401 TAAGGTTCTT CGCGTTGCAT CGAATTAATC CACATGCTCC GCCGCTTGTG 451 CGGGCCCCCG TCAATTCCTT TGAGTTTTAG CCTTGCGGCC GTACTCCCCA 501 GGCGGGGCGC TTAATGCGTT AGCTGCGGCA CAGAAGTCGT GGAAGACCCC 551 TACACCTAGC GCCCACCGTT TACGGCATGG ACTACCAGGG TATCTAATCC 601 TGTTCGCTAC CCATGCTTTC GCTCCTCAGC GTCAGTTACT GCCCAGAGAC 651 CTGCCTTCGC CATTGGTGTT CCTNCTGATA TCTGCGCATT TCACCGCTAC 701 ACCAGGAATT NCAGTCTTCC CTACAGCACT CAAGTTATGC CCGTATCGCC 751 TGCACGCCCC GAAGTTAAAC CCCNGGATTT CACAAGACAA CGCGACAAAC 801 CACCTACGAG CTNTTTACGC CCAATAATTN CGGACAACGC TTGGACCCTT 851 ACGTATTACC CGCGGGTGNT GGCACGTAAT TAAGCCGGNG CTTNTTTTTC 901 AAGGACCCGC ACCATAAAGG TTTTGNCCTT ACCGAAAGGG GGTTACAACC 951 CCNAAGGCTT TATTCCCCCC CCG
405

Table: BASTN Homology Saearch Results for the 16S rRNA gene of strain AS019 from NCBI database.
DNA Sequence
16S rRNA gene 16S rRNA gene 16S rRNA gene
rrnE operon 16S rRNA 16S rRNA gene 16S rRNA gene
16S ribosomal gene
Organism
C. glutamicum C. acetoacidophilum Corynebacterium species T14433
C. glutamicum C. efficiens C. pseudotuberculosis Corynebacterium sp ATCC43833
Corynebacterium bovis
% Homology for 63 f and 1387r 96% 96% 96%
96% 93% 92% 96%
93%
95% 96% 94%
95% 94%
95%
406

Sequence of the 16sRNA. Strain MLB133 using 1387R primer.
1 TTNNTTTNTA CCCAGNGTNG CTGATCTGCG ATACTAGCGA CTCCGACTTC 51 ATGGGGTCGA GTTGCAGACC NTATTTTAAC TGAGGCCGGC TTTAAGAGNT 101 TAGGTCCANN TCACGGTGTG GCAACTCGCT GTACCGACCA TTGTAGCATG 151 TGTGAAGCCC TGGACATAAG GGGCATGATG ATTTGACGTC ATCCCCACCT 201 TCCTCCGAGT TAACCCCGGC AGTCTCTCAT GAGTACCCAC CANAATGTGC 251 TGGCAACATA AGACAAGGGT TGCGCTCGTT GCGGGACTTA ACCCAACATC 301 TCACGACACG AGCTGACGAC AACCATGCAC CACCTGTGAA CCGACCACAA 351 GGGAAAACGT ATCTCTACGC CGATCCGGTC CATGTCAAGC CCAGGTAAGG 4 01 TTCTTCGCGT TGCATCNAAT TAATCCACAT GCTCCGCCGC TTGTGCGGGC 451 CCCCGTCAAT TCCTTTGAGT TTTAGCCTTG CGGCCGTACT CCCCAGGCGG 501 GGCGCTTAAT GCGTTAGCTG CGGCACAGAA GTCGTGGAAG ACCCCTACAC 551 CTAGCGCCCA CCGTTTACGG CATGGACTAC CANGGTATCT AATCCTGTTC 601 GCTACCCATG CTTTCGCTCC TCANCGTCAG TTACTGCCCA GAGACCTGNC 651 TTCGCCATTG GTGTTNCCTC CTGATATCTG CCCATTTNAC CGCTACACCC 701 ACGAATTCCA NGTNTTCCCC TACNNCCTCA ANNTATTGCC CNTATCNCCT 751 GCNCGCCCNA NNTAAACCCC CGGGATTTAC ANACGACTCN ACCAACCCAC 801 CTACNAGCTT NTTTACCCCC CNTAATTTCC GNGACCANCC GNTTTCGAAC 851 CCCTACCTNN TTAACCNCCC GNNGCNTGGC CNCCNTAANC TTAANCCNNG 901 CNGCNTTCCT TTTTTCACGG GCCCCCNCNN CCCATTAANG GNCTTTTNNC 951 CCCTTNCCCN CNNNGGNGNT TTNCCNNCCC CNCANNGGGC CCCTATTTCC
1001 CCCCCCNCCT
407
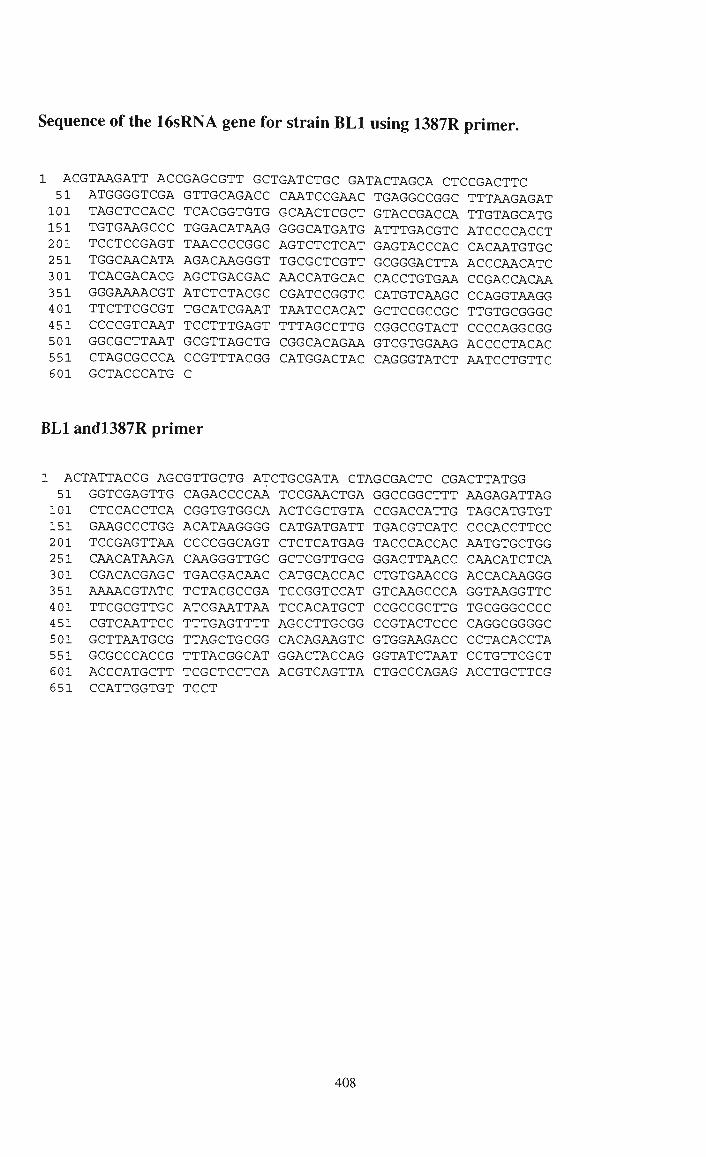
Sequence of the 16sRNA gene for strain BLl using 1387R primer.
L ACGTAAGATT ACCGAGCGTT GCTGATCTGC GATACTAGCA CTCCGACTTC 51 ATGGGGTCGA GTTGCAGACC CAATCCGAAC TGAGGCCGGC TTTAAGAGAT 101 TAGCTCCACC TCACGGTGTG GCAACTCGCT GTACCGACCA TTGTAGCATG 151 TGTGAAGCCC TGGACATAAG GGGCATGATG ATTTGACGTC ATCCCCACCT 201 TCCTCCGAGT TAACCCCGGC AGTCTCTCAT GAGTACCCAC CACAATGTGC 251 TGGCAACATA AGACAAGGGT TGCGCTCGTT GCGGGACTTA ACCCAACATC 301 TCACGACACG AGCTGACGAC AACCATGCAC CACCTGTGAA CCGACCACAA 351 GGGAAAACGT ATCTCTACGC CGATCCGGTC CATGTCAAGC CCAGGTAAGG 401 TTCTTCGCGT TGCATCGAAT TAATCCACAT GCTCCGCCGC TTGTGCGGGC 451 CCCCGTCAAT TCCTTTGAGT TTTAGCCTTG CGGCCGTACT CCCCAGGCGG 501 GGCGCTTAAT GCGTTAGCTG CGGCACAGAA GTCGTGGAAG ACCCCTACAC 551 CTAGCGCCCA CCGTTTACGG CATGGACTAC CAGGGTATCT AATCCTGTTC 601 GCTACCCATG C
BLl andl387R primer
L ACTATTACCG AGCGTTGCTG ATCTGCGATA CTAGCGACTC CGACTTATGG 51 GGTCGAGTTG CAGACCCCAA TCCGAACTGA GGCCGGCTTT AAGAGATTAG 101 CTCCACCTCA CGGTGTGGCA ACTCGCTGTA CCGACCATTG TAGCATGTGT 151 GAAGCCCTGG ACATAAGGGG CATGATGATT TGACGTCATC CCCACCTTCC 201 TCCGAGTTAA CCCCGGCAGT CTCTCATGAG TACCCACCAC AATGTGCTGG 251 CAACATAAGA CAAGGGTTGC GCTCGTTGCG GGACTTAACC CAACATCTCA 301 CGACACGAGC TGACGACAAC CATGCACCAC CTGTGAACCG ACCACAAGGG 351 AAAACGTATC TCTACGCCGA TCCGGTCCAT GTCAAGCCCA GGTAAGGTTC 401 TTCGCGTTGC ATCGAATTAA TCCACATGCT CCGCCGCTTG TGCGGGCCCC 451 CGTCAATTCC TTTGAGTTTT AGCCTTGCGG CCGTACTCCC CAGGCGGGGC 501 GCTTAATGCG TTAGCTGCGG CACAGAAGTC GTGGAAGACC CCTACACCTA 551 GCGCCCACCG TTTACGGCAT GGACTACCAG GGTATCTAAT CCTGTTCGCT 601 ACCCATGCTT TCGCTCCTCA ACGTCAGTTA CTGCCCAGAG ACCTGCTTCG 651 CCATTGGTGT TCCT
408

Table: BASTN Homology Saearch Results for the 16S rRNA gene of strain MLB133 from NCBI database.
DNA Sequence
16S rRNA gene 16S rRNA gene 16S rRNA gene
rrnE operon 16S ribosomal DNA rrn gene for 16S rRNA
Organism
C. glutamicum C. acetoacidophilum Corynebacterium species T14433
C glutamicum C. glutamicum Corynebacterium spp
% Homology for 63 f and 1387r 97% 97% 97%
97% 97% 93%
Table: BASTN Homology Saearch Results for the 16S rRNA gene of strain BLl from NCBI database.
DNA Sequence
16S rRNA gene 16S rRNA gene 16S rRNA gene
rrnE operon
Organism
C. glutamicum C. acetoacidophilum Corynebacterium species T14433
C. glutamicum
% Homology for 63 f and 1387r 100% 100% 99%
99%
409

Figure Sequencing data obtained from IF clone
T3 as a sequencing primer on If clone.
1 51 101 151 201 251 301 351 401 451 501 551
attnctttat nctgcatcca gtgtcttttg gcatcaccca ngananaaaa tggcatcctc aacaatcaat nacnctattt cacctctang acgctcgcnc cctnncgttn tctttgtctn
ttttgacccg ttcaancgat tagaatttca cgtgccgcgt ccatggcaac aanggctctg cccggctatn ttgctgcang gggggcncgg accngccntc cccntcttaa nttatctatt
tttaaacgtt catccttcaa taatctgaac ccgaattatt cacnttgctg cccagggcnt ggtcttgant aattctatat tanccaactc ntttttncta tccncttttc aagctntntc
taaaatagtg gctcaataac ttttgtttga aacacctana gacctcacca tcccgctcnc cntccnnctt caagcttatt nccctatatt cttcnttgac ttnncatctc tctattctcn
cctccngccg tcaaacagaa actctnttcg aacctgtgga aacttatcga tcagtacggg acctacctcn gataccgntc nagtcttatt tgggaaanan tctnttccct ctt
Figure T7 as a sequencing primer on If clone.
ttattntctt tttnggcccg ttggnnccnt tttaacnacn ggncccatgg 51 gccngatatc naattcctgc attaaaaata gcgtccgagg tatgtaagct 101 ggaggagtca ataccaatag ccgcgantgc ttgttcccct actgcgtgag 151 cgggaacgcc ctgggcanag cccttgagga tgccatcgat aagtttggtg 201 aggtccanca acgtggttgc catggttttc tctcctccac aggtttctag 251 gtgttaataa ttcggacncg gcacgtgggt gatgccgaaa agagttcaaa 301 caaaatttca cattatgaaa ttctacaaaa nacacttctg tttgagttat 351 tgancttgaa ngatgatcgg ttctgtggct gcngcccggg ggatccacta 401 tttctatanc ggccgccacc gcngtgganc tccacctttt gttcccttta 451 ntganggtta attgcgcnct tggcgtattc ntggtcatag ctgnttccng 501 tgtgaaattg taacccgctc ccaattcccc ctcaacnnta ctatcctcga 551 tnccatanag tgtttaagcc ntgttggtnc ctattnatt
410

Table: BLASTN Homology search results for DNA sequencing data generated for clone
IF selected from MLB 194 genomic hbraries
DNA Sequence Organism % Homology
IF Clone
T3 as a sequencing primer
T7 as a sequencing primer on
IF
C. glutamicum ATCC 13032 DNA complete
C. glutamicum ftsi, murE, murF, gene
penecilhn-binding protein, UDP-N-
acetylmuramoyl-L-alanyl-D-glutamate,
UDP-N-acetylmuramoyl-L-alanyl-D-
glutamyl-meso-diaminopimelate,
complete and partial cds length
C. glutamicum ATCC 13032 DNA complete
C. glutamicum ftsI, murE, murF, gene
penecilhn-binding protein, UDP-N-
acetylmuramoyl-L-alanyl-D-glutamate, UDP-
N-acetylmuramoyl-L-alanyl-D-glutamyl-
meso-diaminopimelate, complete and partial
cds length
93%
92
96%
95%%
411

Figure Sequencing data obtained from IC clone
1 cgctctagaa atagngnatc ccccgggctg cagaaatact agagattgtg 51 gccaagaaca ccctgaggtg cacctcgagc gcgaattcct ccaaaacacc 101 gtggagcttg tcaccggagt gtgcgacacc gtccccgaag cggtggcaga 151 gctttcccac gatctagatg cgctgaaaga agcagcggat tctctcgggc 201 ttcggttgtg gacctctgga tcccacccat tttcggattt ccgcgaaaac 251 ccagtatctg aaaaaggctc ctacgacgag atcatcgcgc gcacccaata 301 gtggggaaac cagatgttga tttggggcat tcacgtccac gtgggcatca 351 gccatgaaga tcgcgtgtgg ccgatcatca atgcgctgct gacaaattac 401 ycrsacctgt tggcactttc tgcaagctct ccagcatggg acggacttga 451 taccggttat gcctccaacc ggacgatgct ctaccaacag ctgcctacag 501 ccggactgcc ataccaattc caaagctgga tgaatggtgc aactacatgg 551 cggatcaaga taaatccggt gtcatcaacc acaccggatc catgcacttt 601 gatatccgcc ccgcatccaa atggggaacc atcgaagtcc gcgtggccga 651 ttctacctcc aacmtgcggg aactgtctgc catcgtggcg ttgacccact 701 gtctcgtggt gcactacgac cgcatgatcg acgctggcga agagcttccc 751 tccctgcaac aatggcacgt ttcggaaaat aaatggcgcg cggctaggta 801 tggtctggat gccgaaatca tcatttccag agacaccgat gaagcgatgg 851 ttcaagacga actcccgccg actagtagcg caattgatgc ctcttagccc 901 aacgaactcg gctgcgctcg tgagcttgaa cttgtttttg trtwggaaat 951 ccctggaacg ttggtgggtg gattacgaaa cgcccacgca gagtgtttaa 1001 agaaactggc agttggaaag ctgcaggaat tcgatattca ngc
412

Table: BLASTN Homology search results for DNA sequencing data generated for
clone IC selected from MLB 194 genomic libraries.
DNA sequence Organism % Homology
IC sequence generated from
t3 primer walk
C. glutamicumATCCl3032
IS fingertype 4-5
C glutamicumATCCl3032
DNA, complete genome, sect
C. effeciens YS-314 DNA complete genome, section 9
C. diphtheria gravis
NCTCl3129, complete
genome segment 7/8
96%
96%
82%
78%
413

Appendix 5
Figure 4.1 Analysis of the 16S rRNA gene of the C. glutamicum stiam AS019 by Southem hybridization of genomic DNA digest, probing with an amplified 16S rRNA PCR product.
The genomic DNA was digested vdth selected restriction enzymes at appropriate temperature and lp.g of DNA was resolved on large agarose slab gel by electiophoresis. Hybridisation was performed by P radioactive labeling system. Lane 1, Lambda phage DNA Hindlll digest (size markers); Lanes 2, 3, 4, BglE, Hindlll, Pstl digested genomic DNA of C. glutamicum stiain AS019. Lane 5, Pstl digested genomic DNA of M. smegmatis mc 155.
414

-i*.
i ^
V^S WM '-^^Se
* ^
^ ^ . ^^ffir^:;
WW^y.
^»^^
1
-1'
'"ii
Figure 4 III Analysis of the 16S rRNA gene of the B. lactofermentum sttain BLl by Southem hybridization of genomic DNA digest, probing with an amplified 16S rRNA PCR product.
Tlie genomic DNA was digested with selected restriction enzymes at appropriate temperature and 1 p,g of DNA was resolved on large agarose slab gel by electtophoresis. Hybridisation was performed by ^ P radioactive labeling system. Lane 1, Lambda phage DNA Hindlll /EcoRl digest (size markers); Lanes 3, 4, and 5 BglR, digested genomic DNA of C. glutamicum strain ASOl9 B. lactofermentum (BLl) and B. flavum (BF4)
415

Figure 4 II Analysis of the 16S rRNA gene of strain MLB 133 by Southem hybridization of genomic DNA digests, probing with an amplified 16S rRNA PCR product.
The genomic DNA was digested with selected restriction enzymes at appropriate temperatures and 2 pg of DNA were resolved on large agarose slab gels by electtophoresis. Hybridisation was performed by ^ P labelling protocol as described in section 2.4. Lane I, Hindlll/EcoRl markers. Lane 2, Ps'/l digested M smegmatis mc^. Lanes 3,4, 5 and 6 Pstl, Bglll, EcoRl and Hindlll digested genomic DNA of C. glutamicum sttain MLB 133
416

APPENDIX 6
Conclusions and further recommendations
Major findings of the thesis are summarized in dot points below.
MICs studies and effect of INH and glycine on the cell wall lipids composition after
growth in INH and glycine and INH plus glycine are briefly summarized.
• Our studies show C. glutamicum is relatively insensitive to INH compared with
mycobacteria.
• ASOl9 and BF4 were the most resistant among all the sttains tested (16 -17mg/ml).
• Mutants MLB 194 and MLB 133 both had low MICs relative to their parent.
• BLl and RM4 were the most sensitive to INH (4mg/ml).
• ETH (ethionamide), which is an analog of INH are assumed to share a common target
however, MIC results for these were not the same. Differential sensitivity as seen
with INH was not observed with ETH and ETH was found to be a more potent drug.
• Analysis of cell wall lipids showed that it was richer in unsaturated MA compared
with the whole cells when grown in LBG.
• In 2% glycine the level of unsatiu-ated MA (C34:i, Cjea) decreases with the relative
increase in the level of saturated MA (C32:o) compared with whole cells
• Growth in INH and INH+glycine also had a similar effect, that is a decrease in
unsaturated and increase in saturated MA.
417
• Studies also indicate the presence of FA in cell wall. There was a ttend towards
decrease in FAMEs after growth in LBG-G, LBG-I implying that including glycine
and INH in the growth medium not only affected mycohc acids but also impacted on
fatty acids composition.
• If the FA are used as precursor for MA then decrease in their level might impaks MA
synthesis (decrease in MA level) (Jang et al, reported that the cell wall become thiner
after growth in INH and glycine).
Identification of an inhA homologue in corynebacteria
• Southern hybridization was used as a mean to identify an inhA gene homologue in
C glutamicum strain ASOl9. PCR amplified inhA fragment from M. smegmatis
was probed against the genomic DNA digest of ASOl9 with various restriction
enzymes to detect the inhA gene. Southem hybridization results confirmed the
existence of an inhA gene in C. glutamicum. DNA-DNA hybridization results
further indicate the presence of several copies of the gene in the genome.
• To amphfy putative inhA gene from ASOl9, various sets of primers were
designed based on the published inhA sequences of M. smegmatis. To confirm
the identity of the inhA gene, two approaches were used subsequentiy:
construction of the sub-genomic library in pBluescript and sequencing the gene
directiy from PCR products of genomic DNA.
• Gene was sequenced using the PCR primers, and assembled. A restriction map of
the gene created via WEBANGIS did not show any restriction site for the
enzymes used in Southern hybridization. This confu-med the phenomena of the
existence of multiple copies of an inhA gene in the genome.
Nucleotide similarity searches showed 85% to 98% (M. tuberculosis to M.
smegmatis) sequence similarity with mycobacterial species.
418

•
•
From the deduced amino acid sequence it appeared that the inhA gene of ASOl9 is
a 2-enoyl-acyl-carrier reductase, which showed significant homologies with
enzymes involved in bacterial and plant fatty acids biosynthesis. The highest
identity score was 98% with the Mycobacterium family. This high degree of
similarity of C. glutamicum InhA protein with the mycobacterial InhA and other
proteins involved in fatty acids biosynthesis sttongly suggest its involvement in
lipid biosynthesis.
The DNA-DNA hybridization profile sttongly suggests that the gene is highly
conserved in parent and mutants and multiple copies of the gene are present.
Multiple sequence ahgnment of InhA proteins of ASOl9 with two mutants
MLB 194 and MLB 133 with that of M. smegmatis indicates that two mutants
MLB 194 and MLB 133 are more similar to M. smegmatis compared with then-
parent sttain AS019.
It can be speculated that the InhA protein of C. glutamicum might use
nicotinamide or flavin nucleotide as it has putative binding site for these
molecules. It is also possible that the structure of the InhA in C. glutamicum
might be such to allow decrease in molecular contact between isonicotinic acyl-
NADH and the active site of InhA and therefore higher concentrations of INH are
required to produce a significant change in MA composition.
The inhA gene was successfully cloned and sequenced in two Brevibacterium
species namely, B. lactofermentum and B. flavum, using PCR approaches. The
InhA proteins of the two Brevibacterium species showed amino acids variations at
several points.
Amino acid comparison of InhA proteins of C. glutamicum sttain ASOl9 with
two Brevibacterium species showed that B. flavum is similar to AS019. In the
upper region of the two InhA proteins (1-247) the only difference is at position 27
419

•
and 123 where lysine and prohne in ASOl9 are replaced by arginine and serine in
BF4. Whereas in the lower portion of the InhA (247-269) several differences are
observed.
Same differences are observed between M. smegmatis and BF4 at these positions.
InhA proteins of two Brevibacterium species B. lactofermentum and B. flavum
differed at eight points (from pos. 1-247) in terms of amino acid substimtion.
These are at positions 31, 77, 121, 123, 133, 186, 189. In BLl these amino acid
are replaced by valine, glutamine, glutamine, serine, proline, threonine, serine and
alanine instead of glutamic acid, arginine, histidine, leucine, alanine, serine and
valine in BF4. At position 33 there is lysine in BLl instead of arginine in BF4.
Both BF4 and AS019 share the common points of amino acid variation with BLl
except at position 123, where serine in BLl and BF4 occur instead of prohne in
AS019.
The lower region of the two InhA proteins (247-269) of BLl and BF4 are similar
except position 253 where arginine in BF4 is replaced by alanine in BLl. InhA
proteins of AS019 and BF4 vary significantiy from position 247-269.
Amino acid sequence homology of two InhA proteins (ASOl9 and BF4) is
consistent with the INH MICS results. This might suggest the similar sttucture of
two InhA proteins and further indicates the possibihty of same biochemical
function in the two species of C. glutamicum and B. flavum. Previously, studies
reported by Jang et al. (1997) on restriction modification barrier also indicates
similar methylation pattern in the above two species.
Southern hybridization experiments revealed two unique pattems for three
corynebacterial species tested. In one experiment where BgUl was used in
Southern blotting, the patterns of B. flavum and B. lactofermentum were similar.
However, linear restriction map of inhA gene of both BLl and BF4 showed an
420

intemal cutting site for Bglll (At position 810) whereas three corynebacterial
strains AS019, MLB 194, MLB 133 did not show any cutting site for Bglll.
Southern hybridization with Hindlll and EcoRl generated two types of pattern.
Three C. glutamicum strains, AS019, MLB 194 and MLB 133, showed one
specific pattern whereas BLl and BF4 showed a different pattem from each otiier
and also different from C. glutamicum. This showed heterogonous namre of
three genomes. For B. lactofermentum, Hindlll showed one major band whereas
other enzyme, EcoRl and Pstl, showed multiple signals. Similarly, BF4 showed
one major signal with EcoRl but multiple bands with Pstl and Hindlll.
Resttiction map of both BLl and BF4 does not indicate any intemal cutting site
for these enzymes (Pstl, EcoRl, Hindlll) in BLl and BF4. So ambiguity still
remains about the existence of multiple copies of inhA in Brevibacterium.
Therefore low level of resistance to INH in B. lactofermentum cannot be
attiibuted to low copy number of inhA genes.
To elucidate the functional properties of the inhA gene in corynebacteria, gene
inactivation by homologous recombination was carried out. Only B.
lactofermentum strains were used for inactivation experiments. Hence this study
does not answer what role InhA is playing in C. glutamicum and the differences
that appeared at genetic level in parents and mutants affect its function.
Results showed that the emerging mutants or ttansconjugants failed to grow on
ordinary rich media indicating the occurrence of lethal effect because of inhA
inactivation.
Inability of these mutants to grow only on osmotic protective media such as ET
also points to the presence of altered cell walls or its absence altogether.
421

• The results showed similar MICs values of 4mg/nil for parents and
transconjugants indicating that destmction of the inhA gene had no effect on INH
resistance. This fact implies that InhA protein is not the target for INH (isoniazid)
in corynebacteria and hence some other resistance mechanism is present. Other
reports showed that InhA is not the major target in mycobacteria Mdluh et al.
(1996).
• Lipids profile analysis showed the absence of mycohc acids in ttansconjugant.
Fatty acids, however, were detected in lower proportion as compare to parents.
Recent studies in corynebacteria postulates the condensation of two palmitic acids
molecules involving highly activated enolate intermediate most presumably ACPs
(Lee et al, 1997). The deduced InhA proteins of coryne-mM genes is trans-2-
enoyl-ACP-reductse, this protein in Mycobacterium is beheved to catalyze the
NADH-dependant reduction of the double bond at position two of growing fatty
acids chain linked to ACP, an enzymatic activity common to all known fatty acids
biosynthetic pathways. Since the present studies showed the ttansconjugants
lacking mycolic acid, it can be speculated that the highly activated enolate
intermediate step in corynebacteria must be catalyzed by the InhA enzyme.
However, biochemical studies like purification of InhA proteins and in vitro
assays to study its involvement in condensation reaction is needed.
Recommendations
• InhA gene was cloned and sequenced from the C. glutamicum sttains and two
Brevibacterium sttains. Initially, the project aimed to map the exact position
of gene within the chromosome and to see if it is located in an operon and. A
sub-genomic library was consttucted for that purpose but project failed to
provide such information. Therefore the location of the inhA gene with its
possible operon needs further investigation.
422

• MIC studies of transconjugants indicated that inhA disruption have no effect
on INH resistance of these bacteria, indicating there is no direct interaction
between InhA and isoniazid. In mycobacteria it has been proven that drug
indirectly interacts with InhA protein. INH resistance has been associated
with a variety of mutations affecting one or more genes such as those
encoding catalase-peroxidase (katG), the inhA and alkyl-hydroperoxide
reductase (ahpc). In corynebacteria only inhA has been smdied since the
exploration of other genes like katG, ahpc was beyond the scope of this thesis.
Therefore, studies to identify these genes and elucidate their functional
properties are necessary to understand the mechanism of high level INH
resistance in corynebacteria.
• The inhA gene has recentiy been shown to encode one of the enzymes of a
fatty acyl elongase complex (involve in FASII system Velchesze et al, 2000).
Therefore studies like cloning of cryne-mM gene in some expression vector,
large scale purification of InhA protein and enzyme assay with 2-enoyl-CoAs
of chain length 12-20 carbons should be conducted to find its target in
corynebacteria. Studies with InhA in mycobacteria showed it preferred
primers are C16 to C24 enoyl-ACP. These studies are important because the
emerging reports showed the involvement of Ci6 to Cig fatty acids for mycohc
acids biosynthesis in corynebacteria.
423

REFERENCES
Abe, S., Takayama, K.-I. and Kinoshita, S. 1967. Taxonomical smdies on glutamic acid-producing bacteria. J. Gen. Appl. Microbiol. 13:279-301.
Abe, S. and K. Takayama. 1972. Amino acid-producing microorganisms: variety and classification, p. 3-38. In Yamada, K., Konoshita, S., Tsunodo, T., K. Aida (ed.). The microbial production of amino acids. Tokyo: Kodansha Ltd.
Adachi, T., Yamagata, H., Tsukagoshi, N., S. Udaka. 1991. Repression of the cell wall protein gene operon in Bacillus brevis Al by magnesium and calcium ions. J. Bacteriol. 173: 4243-4245.
Ahkong, Q. A., Howell, J. I., Lucy, J. A., Safwat, E., Davy, M. R. and E. C. Cockinh. 1975. Fusion of hen erythrocytes with yeast protoplasts by polyethylene glycol. Nature. 255: 66-67.
Aiba, S., Imanaka, T. and H. Tsunekawa. 1980. Enhancement of ttyptophane production by Escherichia coli as an application of genetic engineering. Biotechnol. Lett. 2: 525.
Aida, K., Chibita, L., Nakayama, K., Takinami, K. and H. Yamada. 1986. Biotechnology of amino acids production. Elsevier, Amsterdam, The Netherlands.
Alshamaony, L., GoodfeUow, M., Minnikin, D. E. and H. Mordarkska. 1976a. Free mycohc acids as criteria in the classification of Gordona and "'Rhodochrous" complex. J. Gen. Microbiol. 92: 183-187.
Allen, S. P. and Blaschek, H. P. 1988. Electtoporation-induced ttansformation of intact cells of Clostridium perfringer. Appl. Environ. Microbiol. 54:2322-2324.
Altschul, S. F., Bogski, M. S., Gish, W. and J. C. Wooton. 1994. Issues in searching molecular sequence databases. Nat. Genet. 6: 119-129.
Altschul, S. F., Gish, W., Miller, W., Myers, E. W. and D. J. Lipman. 1990. Basic local alignment search tool. J. Mol. Biol. 215:403-410.
Amador, E., Castto, Jose M., Correia, A. and Juan F. Martin. 1999. Structtire and organisation of the rmD operon of 'Brevibacterium lactofermentum' analysis of the 16S rRNA gene. Microbiol. 145: 915-924.
Anderson, R. J. 1941. Structural peculiarities of acid fast bacterial lipids. Chem. Rev. 29: 225-243.
Anderson, S., Marks, C. B., Lazarus, R., Miller J., Stafford, K., Seymour, S., Light. D., Rastetter, W., D. Estell. 1985. Production of 2-keto-L-gluconate, an intermediate in L-
424

ascorbate synthesis by a genetically modified Erwinia herbicoba. Science. 230- 144-149.
Asselineau, J. 1950. Surla stincture chimique des acides mycoliques isoles de Mycobacterium tuberculosis var. Hominis; determination de la position de I'hydroxyle. Compte Redu hebdomadaire des Seances de I'Academie des Sciences. 230: 1,620-1,622.
Asselineau. J. and Lederer. E. 1950. Stmcture of the mycolic acids of mycobacteria. Nattire. London. 166: 782-783.
Assellineau, J. 1966. The bacterial lipids. Hermann: Paris.
Archer, J. A. C, Follettie, M. T. and Sinskey, A. J. 1989. Biology of Corynebacterium glutamicum: a molecular approach, p. 27. In Hershberger,C. L., Queenner, S. W. and G. Hegeman (eds.). Genetics and molecular biology of industtial microorganisms. ASM, Washington, D. C.
Athalye, M., Noble, W. C , Mallet, A. I. and D. E. Minnikin. 1984. Gas chromatography-mass spectrometry of mycolic acids as a tool in the identification of medically important coryneform bacteria. J. Gen. Microbiol. 130:513-519.
Aushel, F. M., Brent, R., Kingston, R. E., Moore, R. E., Seidman, J. G., Smith, J. A. and K. Stmhl. 1987. Current protocol in molecular biology. John wiley: New York.
Azuma, 1., Yamamura, Y. and K. Fukushi. 1968. Fractionation of mycobacterial cell wall. Isolation of arabinose mycolate and arabinogalactan from cell wall fraction of Mycobacterium tuberculosis strain Aoyama'Q. J Bacteriol. 96:1,885-1,887.
Azuma, I., Kanetsuna, F., Tanaka, Y., Mera, M., Yanagihara, Y., Mifiichi, I. and Y. Yamamura. 1973. Partial chemical characterisation of cell wall of Nocardia asteroides strain 131. Jap. J. Microbiol. 17: 154-159.
Azuma, I., Yamamura, Y. and E. E. Ribi. 1974. Preparation of adjuvant-active, tubemlin-free peptidoglycolipids from human mbercle bacilli. Jap. J. Microbiol. 18: 327-332.
Bake, A. L., Christiansen, L. and Staudmp, A. 1970. Bacterial genome sizes determined by DNA renaturation studies. J. Gen. Microbiol. 64:377-380.
Banerjee, A., Dubnau, E., Quemard, A., Balasubramaniau, V., Um, K-S., Wilson, T., Collins, D., de Lisle, G. and Jr. W. R. Jacobs. 1994. inhA, a gene encoding a target for isoniazid and ethionamide in Mycobacterium tuberculosis. Science. 263: 227-230.
Bardou, F., Quemard, A., Dupont, M.-A., Hom, C, Marchal, G., and Daffe, M. 1996. Effects of isoniazid on the ultta-stmcture of Mycobacterium aurum and Mycobacterium
425

tuberculosis and on a production of secreted proteins. Antimicrob. Agents and Chemother. 40: 2459-2467.
Barksdale, L. and K. S. Kim. 1977. Mycobacterium. Bacteriological Review 41: 217-372.
Barksdale, L. 1981. The genus Corynebacterium, p. I,S21-I,S31. /« Starr, M. P., Stolp, H., Tmper, H. G., Balows, A. and H. G. Schlegel (ed.). The prokaryotes. Springer Verlag, Berlin.
Barreau, C, Bimet, F., Kiredjian, M., RouUin, N. and C. Bizet. 1993. Comparative chemotaxonomic studies of mycolic acid-free coryneform bacteria of human origin. J. Clin. Microbiol.31: 2,085-2,090.
Barletta, R. G., Kim, D. D., Snapper, S. P., Bloom, B. R. and Jr. W. R. Jacobs,. 1992. Identification of expression signals of the mycobacteriophages, Bxbl, LI and TM4 using Escherichia-Mycobacterium shuttle plasmids pYUB75 and pYUB76 designed to create translational fiision to the/flcZ gene. J. Gen. Microbiol. 138:23-30
Barry, C. E. and K. Mdluli. 1966. Dmg sensitivity and environmental adaptation of mycobacterial cell wall components. Trends Microbiol. 4: 275-281.
Basso, L. A., Zheng, R., J. S Blanchard. 1996. Kinetics of inactivation of WT and C243S mutant of Mycobacterium tuberculosis enoyl reductase by activated isoniazid. J. Am. Chem. Soc. 118:11301-2.
Batt, C. A., Follettie, M. T., Shin, H. K., Yeh, P. and A. J Sinskey. 1985. Genetic engineering of coryneform bacteria, Trends Biotechnol. 3: 305-310.
Bathe, B., Kalinowski, J. and A. Piihler. 1996. A physical and genetic map of the Corynebacterium glutamicum ATCC13^32 c\vromosome. Mol. Gen. Genet. 252:255-265.
Beppu, T. 1986. Apphcation of recombinant DNA technology in breeding of amino acid producing strains, p. 24. In Aida, K., Chibita, L., Nakayama, K., Takinami, K., and H. Yamada (eds.). Biotechnology of amino acids production. Elsevier, Amsterdam,
Benigni, R., Antonov, R. P., and A. Carere. 1975. Estimate of the genome size by renaturation studies in Streptomyces. Appl. Microbiol. 30: 324-326.
Bendinger, B., Kroppenstedt, R. M., Klatte, S. and K. Altendorf 1992. Chemotaxonomic differentiation of coryneform bacteria isolated from biofilters. Int. J. Syst. Bacteriol. 42: 474-486.
Benz, R., and K. Bauer. 1988. Permeation of hydrophilic molecules through the outer membrane of gram-negative bacteria. Eur. J. Biochem. 176: 1-19.
426

Besra, G. S. and D. Chatterjee. 1994. Lipids and carbohydrates of Mycobacterium tuberculosis, p. 285-306. In B. R. Bloom, (ed.). Pathogenesis, protection, and conttol. Washington, DC: American Society for Microbiology,.
Besra, G. S., Sievert, T., Lee, R. E., Slayden, R. A., Brennan, P. J. and K. Takayama. 1994. Identification of the apparent carrier in mycolic acid synthesis. Proc. Natl. Acad. Sci. USA 91: 12,735-12,739.
Best, G. R., and M. L. Britz. 1984. Generation of chloramphenicol resistant sttains of Corynebacterium glutamicum after exposing protoplasts to pC194 plasmid DNA from Bacillus subtilis. VII Intemational Biotechnology Symposium, New Delhi, India, pp. 404-405.
Best, G. R. and M. L. Britz. 1986. Facilitated protoplasting in certain auxottophic mutants of Corynebacterium glutmicum. App. Microbiol. Biotechnol. 23: 288-293.
Bergler, H., Wallner, P., Ebeling, A., Leitinger, B., Fuchbichler, S., Aschauer, H., KoUenz, G., Hogenauer, G. and F. Tumowsky. 1994. Protein of EnvM is the NADH-dependant enoyl-ACP reductase (FabI) of Escherichia coli. J. Biol. Chem. 269: 5493-5496.
Bergler, H., Hogenauer, G. and F Tumowsky. 1992. Sequence of the envM gene and two mutated alleles in .sc/zenc/zza co/z. J. Gen. Microbiol. 138:2,093-2,100.
Billman-Jacobe, H., Hodgson, A. L. M., Lightowlers, M., Wood, P. R., and A. J. Radford. 1994. Expression of ovine gamma interferon in £. coli and C. glutamicum. Appl. Environ. Microbiol. 60: 1,641-1,645.
Bligh, E. G. and W. J. Dryer. 1959. A rapid method of total lipid exttaction and purification. Can. J. Biochem. Physiol. 37:911-917.
Bonamy, C, Guyonvarch, A., Reyes, O., David, F. and G. Leblon. 1990. Interspecies electto-ttansformation in corynebacteria. FEMS Microbiol. Lett. 66: 263-270
Bonnassie, S., Burini, J.-F., Oreglia, J., Trautwetter, A., Patte, J.-C. and A. M. Sicard. 1990. Transfer of plasmid DNA to Brevibacterium lactofermentum by electtoporation. J. Gen. Microbiol. 136:2107-2112.
Bousfield, I. J. 1972. A taxonomic sttidy of some coryneform bacteria. J. Gen. Microbiol. 71,441-455.
Bousfield, I. J. and A. G. Galley. 1978. Coryneform bacteria. Acedemic Press London.
Boyer, H. W. and D. Roulland-Dussoix. 1969. A complementation analysis of the restriction and modification of DNA in £'5c/zmc/z/aco/z. J. Mol. Biol. 41:459-472.
427

Boramann, E. R., Eikmanns, B. J. and Sahm, H. 1992. Molecular analysis of the Corynebacterium glutamicum gdh gene encoding glutamate dehydrogenase. Mol. Microbiol. 6: 317
Britz, M. L and A. L. Demian. 1985. Regulationof metabohte synthesis, p. 617-636. In Moo-Young, M. (ed). Comprehensive Biotechnology. Voll. Pergamon Press New York.
Brennan, P. J. 1989. Structure of mycobacteria: Recent developments in defining cell wall carbohydrates and proteins. Rev. Inf Dis. 11:420-430.
Brennan, P. J. 1988. MjcoZ^acrerzwrn and other actinomycetes, p. 251-278. /n Ratledge, C. and S. G. Wilkinson (eds.). Microbial hpids. Academic Press, London.
Brennan, P. J. and Nikaido, H. 1995. The envelope of mycobacteria. Annu. Rev. Biochem. 64: 29-63.
Broer, S., Eggeling, L. and R. Kramer. 1993. Sttains of Corynebacterium glutamicum with different lysine productivities may have different lysine excretion systems. Appl. Environ. Microbiol. 59: 316.
Bunch, A. W., and R. E. Harris. 1986. The manipulation of micro-organisms for the production of secondary metabohtes. Biotechnol. Genet. Eng. Rev. 4: 117-144.
Buchanan-Wollaston, V., Passiatore, J. E. and F. Cannon. 1987. The mob- and oriT mobilisation functions of a bacterial plasmid promote its ttansfer to plants. Nature (London) 328: 172-175.
Butier, W. R., Jost, Jr. C. and J. O. Kilburn. 1991. Identification of mycobacteria by high-performance hquid chromatography. J. Chn. Microbiol. 29: 2468-2472.
Cardini, G., and P. Jurtshuk. 1970. The enzymatic hydroxylation of n-octane by Corynebacterium sp. strain 7E1C. J. Biol. Chem. 245: 2789-2796.
Carlotti, A., Meugnier, H., Pommier, M. T., ViUard, J. and J. Freney. 1993. Chemotaxonomy and molecular taxonomy of some coryneform chnical isolates. Zbl. Bakt. 278: 27-33
Carlson, R. R. and A. K. Vidaver. 1982. Taxonomy of Corynebacterium plant pathogens including a new pathogen of wheat, based on polyacrylamide gel electtophoresis of cellular proteins. Int. J. Syst. Bacteriol. 32:315-326.
Charter, K. F. and C. J. Bruton. 1983. Mutational cloning in Streptomyces and the isolation of antibiotic production genes. Gene 26: 67-78.
428

Chevaher, J., Pommier, M-T., Creamier, A. and G. Mice. 1988. Influence of Tween 80 on the Mycolic acid composition of three cutaneous Corynebacteria J Gen Microbiol 134: 2457-2461.
Chang, D. C. 1992. Design of protocols for electtoporation and ttansfusion: selection of electtic parameters, p. 429-455. In Chang, D. C, Chassy, B. M., Saunders, J. A. and A. E. Sowers (ed.). Guide to electtoporation and electtofusion. Academic Press, San Diego.
Chassy, B. M. and J. L. Hickinger. 1987. Transformation of Lactobacillus casei by electtoporation. FEMS Microbiol. Lett. 44: 173-177.
Clement, Y., Escoffier, C, Trombe, M. C. and G. Laneelle. 1984. Is glutamate excreted by its uptake system in Corynebacterium glutamicum? a working hypothesis. J. Gen. Microbiol. 130: 2,589-2,594.
Clement, Y. and G. Laneelle. 1986. Glutamate excretion mechanism in Corynebacterium glutamicum: triggering by biotin starvation or by surfactant addition. J. Gen. Microbiol. 132: 925-929.
CockeriU, III, F. R., Uhl, J. R., Temesgen, Z., Zhang, Y., Stochman, L., Roberts, G. D., Williams, D. L. and B. C. Khne. 1995. Rapid identification of a point mutation of the Mycobacterium tuberculosis catalase-peroxidase (KatG) gene associated with isoniazid resistance. J. Infect. Dis. 171: 240-245
Cohn M. L., Kovitz, C , Oda, U. and G. Middlebrook. 1954. Studies on isoniazid and tubercle bacilli. II. The growth requirements, catalase activities, and pathogenic properties of isoniazid-resistant mutants. Am. Rev. Tuberc. 70:641-644.
Colhns, M. D., Pirouz, T., GoodfeUow, M. and D. E. Minnikin. 1977. Disfribution of menaquinones of actinomycete and related bacteria. J. Gen. Micobiol. 100:221-230.
Colhns, M., GoodfeUow, M. and D. E. Minnikin. 1979. Isoprenoid quinones in the classification of coryneform and related bacteria. J. Gen. Microbiol. 110:127-136.
CoUins, M. D., GoodfeUow, M. and D. E. Minnikin. 1982a. A survey of the stmcture of mycohc acids in Cory«eZ>ac?enMm and related taxa. J. Gen. Microbiol. 128: 129-149.
Collins, M. D., GoodfeUow, M. and D. E. Minnikin. 1982b. Fatty acid composition of some mycolic acid-containing coryneform bacteria. J. Gen. Microbiol. 128: 2,503-2,509.
Colhns, M. D., and C. S. Cummins. 1986. In Sneath, P. H. A., Mair, N. S., Sharpe, M. E. and J. E. Holt (ed.), Bergey's manual of systematic bacteriology, vol. 2, p. 1,266-1,276. The Williams and Wilkins Co., Baltimore.
429

Collins, M. D., Burton, R. A. and D. Jones. 1988. Corynebacterium amycolatum sp. nov. a new mycolic acid-less Corynebacterium species from human skin. FEMS Microbiol, lett. 49: 349-352.
Corina, D. L. and D. Sesardic. 1980. Profile analysis of total mycohc acids from skin corynebacteria and from named Corynebacterium strains by gas-liquid chromatography/Mass specttometry. J. Gen. Microbiol. 116: 61-68.
Correia, A., Martin, J. F. and J. M. Castro. 1994. Pulsed field electtophoresis analysis of the genome of amino acid producing corynebacteria: chromosome sizes and diversity of resttiction patterns. Microbiol. 140: 2,841-2,847.
Constantinide, A. 1980. Steroid transformation at high substtate concenttations using immobilised Corynebacterium simplex cells. Biotechnol. Bioeng. 22:119-136.
Cooper, D. G., Zijic, J. E. and D. E. F Gracey. 1979. Analysis of corynemycolic acids and other fatty acids produced by Corynebacterium lepus grown on kerosene. J. Bacteriol. 137:795-801.
Crombach, W. H. J. 1978. DNA base ratios and DNA hybridisation smdies of coryneform bacteria, mycobacteria and nocardiae, p. 161-179. In Bousfield, I. J. and A. G. Calley (ed.). Coryneform bacteria. London: Academic Press.
Cummins, C. S. and H. Harris. 1956. The chemical composition of the cell-wall in some Gram-positive bacteria and its possible value as a taxonomic character. J. Gen. Micobiol. 14:583-600.
Cummins, C. S. 1962. Chemical composition and antigenic stmcture of Corynebacterium, Mycobacterium, Nocardia, Actinomyces and Arthrobacter. J. Gen. Microbiol. 28: 35-50
Datta, N., Hedges, R. W., Shaw, E. J., Sykes, R. B. and M. H. Richmond. 1971. Properties of an R factor from Pseudomonas aeroginosa. J. Bacteriol. 108:1,244-1,249.
Datta, N., and R. W. Hedges. 1972. Host ranges of R factors. J. Gen. Microbiol. 70: 453-460
Davis, M. J., Gillespie Jr, A. G., Vidaver, A. K. and R. W. Harris. 1984. Clavibacter: a new species containing some phytopathogenic coryneform bacteria, including Clavibacter xyli subsp. Xyli sp. nov., subsp. nov. and Clavibacter xyli subsp. Cyanodoutis subsp. nov., pathogens that cause ratoon stunting disease of sugar-cane and Bermudagrass stunting disease. Int. J. Syst. Bacteriol. 34:107-117
Dawson, R. M. C, Elhoh, W. H. and K. M. Jones. 1986. PH, buffers and physiological media, p. 417-488. In Dawson, R. M. C, Ellioh, D. C, Elhoh, W. H. and K. M. Jones (ed.). Data for biochemical research -3rd Edition. Oxford University Press. New York.
430

Debadov, J. 1983. Constmction of strains producing L-threonine, p. 254-. /« Ikeda, Y. and Beppu, T. (eds.). Genetics of industrial microorganism. Kodansha, Tokyo.
Deretic, V., Philipp, W., Dhandayuthapani, S. 1995. Mycobacterium tuberculosis is a natural mutant with an activated oxidative-sttees regulatory gene: implication for sensitivity to isoniazid. Mol. Microbiol. 1:889-900.
De Sousa-D'Auria, C , Kacem, R., Puech, V., Tropis, M., Lellon, G., Houssin, C, M. Daffe . 2003. New insights into the biogenesis of the cell envelope of corynebacteria: identification and ftmctional characterization of five new mycoloyltransferase genes in Corynebacterium glutamicum. FEMS Mic. Letts. 224: 35-44.
Desomer, J., Crespi, M. and M. Van Montagu. 1991. Illegitimate integration of nonreplicative vectors in the genome of Rhodococcus fascians upon electtottansformation as an insertional mutagenesis system. Mol. Microbiol. 5:2,115-2,124.
Dessen, A., Quemard, A., Blanchard, J. S., Jacobs Jr, W. R. and J. C. Sacchettini. 1995. Crystal stmcture and function of the isoniazid target of Mycobacterium tuberculosis. Science. 267: 1,638-1,641.
Devereux, J. Haberli, P. and O. Smithies. 1984. Nucleic Acids Res. 12:387-395.
Dienes, L., Weinberger, J. H. and S. Madoff. 1950. The transformation of typhoid bacilli into L-forms under various conditions. J. Bacteriol. 59: 755-764.
Dolye, R. J. 1992. Cell walls of bacteria, p. 479-493. In, Lederberg, J., Alexander, M., Hopwood, D. A., Iglewski, B. H. and A. I. Laskin (ed). Encyclopedia of Micobiology Vol. 1, Academic Press, New York.
Dower, W. J., Miller, J. F. and C. W. Ragsdale. 1988. High efficiency transformation of E. coli by high voltage electroporation. Nucleic Acids Research. 16: 6,127-6,145.
Dubey, S. K. and D. S. Holmes. 1995. Biological cynide destmction mediated by microorganisms. Word J. Microbiol. Biotechnol. 11:257-265.
Dufrene, Y. F., van der Wal, A., Norde, W. and P. G. Rouxhet. 1997. X-ray photoelectton specttoscopy analysis of whole cell walls of Gram-positive bacteria: comparison with biochemical analysis. J. Bacteriol. 179: 1,023-1,028.
Dunbar, J. M. 1957. L'apparition de formes non-acidoresistantes de Mycobacterium tuberculosis en presence d'isoniazide, de cycloserine et de thioamide de I'acide a-ethyl isonicotinique. Ann. Inst. Pastuer. 92:451-458.
431

Dunican, L. K. and E. Shivnan. 1989. High frequency transformation of whole ceUs of amino acid producing coryneform bacteria using high voltage electroporation Biotechnol. 7: 1,067-1,070.
Eggehng, I., Cordes, C, Eggeling, L. and H. Sahm. 1987. Regulation of acetohydroxy acid synthase in Corynebacterium glutamicum during fermentation of a-ketobutyrate to L-isoleucine. Appl. Microbiol. Biotechnol. 25: 346-351.
Eikmanns, B. J., Kircher, M. and D. J Reinscheid. 1991. Discrimination of Corynebacterium glutamicum, Brevibacterium flavum and Brevibacterium lactofermentum by restiiction pattern analysis of DNA adjacent to hom gene. FEMS Microbiol. Lett. 82: 203-208.
Eikmanns, B. J., Eggehng, L. and H. Sahm. 1993. Molecular aspects of lysine, threonine, and isoleucine biosynthesis in Corynebacterium glutamicum. Antonie van Leeuwenhock, 64: 145-164
El-Yas, A. H., Nashed, S. M. and A. H. Yas. 1988. Bacteriological studies on mastitis in ewes and she-goats. J. Assiut. Vet. Med. 20: 37-42.Etemadi, A. H., Pinte, F., J. Markovits. 1966. Sur la structure des precurseurs evenmels des acides a-smegmamycohques. C. R. Acad. Sci. Paris. 262: 1,343-1,346.
Etemadi, A. H. 1967. Isomerisation die methyle en milieu alcalin. Chem. Phys. Lipids. 1: 165-175.
Fazal, A. M. and R. A. Jensen. 1980. Regulation of prephenate dehydratase on coryneform species of bacteria by L-phenylalanine and by remote effectors. Arch, Biochem. Biophys. 200: 165-176.
Fernandez-Garazabal, J. F., Colhns, M. D., Hutson, R. A., Gonzalez, I., Fernadez, E. and L. Domigguez. 1995. Int. J. Syst. Bacteriol. 48:463-468.
Ferrari, F. A., Nguyen, A., Lang, D. and J. A. Hoch. 1983. Construction and properties of an integrahle plasmid for Bacillus subtilis. J. Bacteriol. 154:1,513-1,515.
Fiedler, F., Schaffler, M. J. and E. Stackbrandt. 1981. Biochemical and nucleic acid hybridisation studies on Brevibacterium linens and related sttains. Arch. Microbiol. 129: 85-93
Fiedler S. and R. Writh. 1988. Transformation of bacteria with plasmid DNA by electtoporation. Anal. Biochem. 170: 38-44.
Foley-Thomas, E. M., Whipple, D. L., Breudez, L. E. and R. G. Barletta. 1995. Phage infection, ttansfection and tiansformation of Mycobacterium avium complex and Mycobacterium paratuberculosis. Microbiol. 141: 1,173-1,181.
432

Follettie, M. T. and A. J. Sinskey. 1986. Recombinant DNA technology for Corynebacterium glutamicum. Food Technol. 40: 88-94.
Freney, J., Duperron, M. T., Courtier, C , Hanse, W., Allard, F., Boeufgras. J. M., Monget, D. and J. Fleurette. 1991. Evaluation of API-Coryne in comparison with conventional methods for identifying coryneform bacteria. J. Chn. Microbiol. 29- 38-41.
Frieden, T. R., Steriing, T., Pablos-Mendez, A., Kilburn, J. O., Cauthen, G. M., S. W. Dooley. 1993. The emergence of dmg-resistant ttiberculosis: New York City. N Engl J. Med. 328: 521-526.
Fujioka, M., K. Shigetaka and M. Yukiyoshi. 1985. Novel glycosidic linkage between arabinogalactan and peptidoglycan in the cell wall skeleton of Nocardia rubra AN-115. J. Gen. Microbiol. 131: 1323-1329.
Funk, G., Hutson, R. A., Hilleringmann, M., Heizmann, W. R. and M. D. Colhn. 1977. Corynebacterium lipophiloflavum sp. nov. isolated from a patient with bacterial vaginosis. FEMS Microbiol. Lett. 150: 219-224. Funk, G., Lawson, P. A. and M. D. Collins. 1995. Heterogeneity within Centtes for Disease Control and Prevention coryneform group ANF-1 like bacteria and description of Corynebacterium auris sp. nov. Int. J. Syst. Bacteriol. 45: 735-739.
Funke, G., Pascual, C. and M. D. Colhns. 1997. Corynebacterium coyleae sp. nov., isolated from human clinical specimens. Int. J. Syst. Bacteriol. 47: 92-96.
Gabor, M. H. and R. O. Hotchkiss. 1979. Parameters goveming bacterial regeneration and genetic recombination after fusion of Bacillus subtilus protoplasts. J. Bacteriol. 137: 1,346-1,353.
Gailly, C, Sandra, P., Verzele, M. and C. Cocito. 1982. Analysis of mycolic acid from a group of corynebacteria by capillary gas chromatography and mass chromatography. Eur. J. Biochem. 125: 83-94.
Gavin, S. E., Leonard, R. B., Briselden, A. M. and M. B. Coley. 1992. Evaluation of rapid CORYNE identification system for Corynebacterium species and other coryneforms. J. Clin. Microbiol. 30: 1,962-1,965.
Gastambide-Odier, M. and E. Lederer. 1959. Biosynthesis of corynemycolic from two molecules of palmitic acid. Nature. 184:1,563-1,564.
Gastambide-Odier, M. and E. Lederer. 1960. Biosynthesis de I'acide corynemycolique a partir de deux molecules d'acide palmitique. Biochem. Zeitsch. 333: 285-295.
433

Gangadharam, P. R. J., Harold, F. M. and Schaefer, W. B. 1963. Selective inhibition of nucleic acid synthesis in Mycobacterium tuberculosis by isoniazid. Namre (Lond ) 198-712-714.
George, K. M., Yuan, Y., Sherman, D. R. and C. E. Barry, III. 1995. The biosynthesis of cyclopropanated mycolic acids in Mycobacterium tuberculosis. Identification and functional analysis of CMAS-2. J. Biol. Chem. 270:45.27,292-27,298.
GoodfeUow, M. 1967. Numerical taxonomy of some named bacterial cultures. Can. J. Microbiol. 13: 1365-1375. GoodfeUow, M., CoUins, M. D. and D. E. Minnikin. 1976. Thin layer chromatographic analysis of mycohc acid and other long-chain components in whole-organism methanolysates of coryneform and related taxa. J. Gen. Microbiol. 96:351-358.
Gordon, J. and M. Gordon. 1943. Involution forms of the genus Vibro produced by glycine. J. Pathol. Bacteriol. 55: 63-68.
Greez, N., Dack, D. M. and L. R. Hedrick. 1962. Antimicrobial agents of surface ripened cheese. II. Source and properties of active principles. J. Food. Sci. 27: 335-342. Gubler, M. E., Park, S. M., Jetten, M. S. M., Stephanopoulos, G. and A. J. Sinskey. 1994a. Effects of phosphoenol pyruvate carboxylase deficiency on metabolism and lysine production of Corynebacterium glutamicum. Appl. Microbiol. Biotech. 40: 857.
Gubler, M. E., Jetten, M. S. M., Lee, S. H. and A. J. Sinskey 1994b. Cloning of pyruvate kinase gene (pyk) of Corynebacterium glutamicum and the site-specific inactivation of pyK in a lysine producing Corynebacterium lactofermentum strain. Appl. Environ. Microbiol. 60: 2,469-2,500.
Gutmann, M., Hoischen, C. and R. Kramer. 1992. Carrier mediated glutamate secretion by Corynebacterium glutamicum under biotin limitation. Biochem. Biophys. Acta. 1112: 115-123.
Hagino, H. and K. Nakayama. 1975a. L-Tryptophan production by analog-resistant mutants derived from a phenylalanine and tyrosine double auxottoph of Corynebacterium glutamicum. Agric. Biol. Chem. 39: 343-349.
Hagino, H. and K. Nakayama. 1975b. The biosynthetic conttol in aromatic amino acid producing mutants of Corynebacterium glutamicum. Agric. Biol. Chem. 39:351-361.
Hamid, M. E., Minnikin, D. E., GoodfeUow, M. and M. RideU. 1993. Thin layer chromatographic analysis of glycopeptids and mycolic acids from Mycobacterium senegalense and related taxa. Zbl. Bakt. 279: 354-367.
434

Hamid, M. E., Minnikin, D. E. and M. GoodfeUow. 1993. A simple chemical test to distinguish mycobacteria from other mycolic-containing actinomycetes J Gen Microbiol. 139: 2,203-2,213.
Hammes, W., Schleifer, K. H. and O. Kandlers. 1973. Mode of action of glycine on the biosynthesis of peptidoglycan. J. Bacteriol. 116:1,029-1,053
Harringston, B. J. 1996. A numerical taxonomic stiidy of some corynebacteria and related organism. J. Gen. Microbiol. 45:31-40.
Hartmans, S. and J. A. M. De Bont. 1992. The genus Mycobacterium—nonmedical, p. 1,214-1,237. In Balows, A., Tmper, H. G., Dworkin, M., Harder, W. and K. H. Schleifer (ed.). The Prokaryotes, 2nd ed. Spring-Verlag, New York.
Haynes, J. and M. L. Britz. 1989. Electiansformation of Brevibacterium lactofermentum and Corynebacterium glutamicum: growth in Tween 80 increases ttansformation frequencies. FEMS Microbial. Lett. 61: 329-334.
Haynes, J. A. and M. L. Britz. 1990. The effect of growth conditions of Corynebacterium glutamicum on the transformation frequency obtained by electtoporation. J. Gen. Microbiol. 136: 255-263.
Hedgecock, L. W., O. I. Faucher. 1957. Relation of pyrogallol-peroxidase activity to isoniazid resistance in Mycobacterium tuberculosis. Am. Rev. Tuberc. 75: 670-674.
Hendrik, C. A., Haskin, W. P. and A. K. Vidaver. 1984. Conjugative plasmid in Corynebacterium flaccumfaciens subsp. ooriti that confers resistance to arsenite and antimony (III). Appl. Environ. Microbiol. 48: 56-60.
Herrera-Alcarzar, E., Valero-Guillen, P., Martin-Luengo, F. and M. Canteras-Jordana. 1993. Numerical analysis of fatty and mycolic acid profiles of Corynebacterium urealyticum and other related corynebacteria. Microbiologia. 9: 53-62.
Heym, B., Honore, N., Truffot-Pernot, C, Banerjee, A., Schurra, Jr, C. W. R. J., J. D. A. V. Embden,. 1994. Implications of multidrug resistance for the future of short-course chemotherapy of tuberculosis: a molecular study. Lancet. 344:293-298.
Heym. B., Alzari, P. M., Honore, N., S. T. Cole. 1995. Missense mutations in the catalase-peroxidase gene, KatG, are associated with isoniazid resistance in Mycobacterium tuberculosis. Mol. Micobiol. 15: 235-245.
Hirose, Y., Enei, H. and H. Shibai. 1985. L- Glutamic acid fermentation, p. 593-605. In M. Moo-Young (ed). Comprehensive Biotechnology. Vol 3. Pergamon press. Oxford, New York, Toronto, Sydney, Frankfurt.
435

Hishinuma, F., Izaki, K. and H. Takahashi. 1969. Effects of glycine and D-amino acids on growth of various microorganisms. Agr. Biol. Chem. 33: 1,577-1,586.
Hishinuma, F., Izaki, K. and H. Takahashi. 1971. Inhibition of L-alanine adding enzymes by glycine. Agr. Biol. Chem. 35: 2,050-2,058.
Hoischen, C. and R. Kramer. 1989. Evidence for an efflux carrier system involved in the secretion of glutamate by Corynebacterium glutamicum. Arch. Microbiol. 151: 342-347.
Hoischen, C. and R. Kramer. 1990. Membrane alteration is necessary but not sufficient for effective glutamate secretion in Corynebacterium glutamicum. J. Bacteriol. 172: 3,409-3,416.
Honkanen-Buzalski, T., MyUys, V. and L. Kulkas. 1996. Prevalence of bovin mastitis in Finland. Soum Elainlakaaril. 102:191-197.
Hopwood, D. A., Wright, H. M., Bibb, M. J. and S. N. Cohn. 1977. Genetic recombination through protoplast fusion in i'rreprc'wjcej'. Nature. 268: 171-174.
Hopwood, D. A. 1981. Genetic studies with bacterial protoplasts. Annu. Rev. Microbiol. 35: 237-272.
Howe, E. E., Jensen, G. R. and E. W. GilfiUan. 1965. Amino acid supplementation of cereal grains as related to the food supply. Am. J. Clin. Nutr. 16:315-320.
Hunter, S. W., Murphy, R. C, Clay, K., Goren, M. B., P. J. Brennan. 1985. J. Biol. Chem. 258: 10,481-10,487.
Ikeda, S., Fujita, I. and F. Yoshinaga. 1976. Screeninmg of L-isoleucine producers among ethionine resistant mutants of L-threonine producing bacteria. Agric. Biol. Chem. 40:511-516.
Ikeda, M. and A. Katsumata. 1992. Metabohc engineering to phenylalanine in a tryptophane-producing Corynebacterium glutamicum strain. App. Environ. Microbiol. 58: 781-785.
Ito, H., Sato, K., Matsui, K., Sano, H. Enei. and Y. Hkose. 1990. Molecular breeding of a Brevibacterium lactofermentum L-phenylalanine producer using a cloned prephenate dehydratase gene. Appl. Microbiol. Biotechnol. 33: 190 195.
Iwainsky, H. 1988. INH, mode of action, p. 476-508. InK. Bartmann (eds). Handbook of experimental pharmacology, vol. 84. Spring-Verlag, Berhn.
436

Jackett, P. S., Aber, V. R. and D. B. Lowrie. 1978. Vfrulence and resistance to superoxide, low pH and hydrogen peroxide among sttains of Mycobacterium tuberculosis. J. Microbiol. 104: 37-45.
Jacobs Jr, R. W., Ganjam, V. K., Jeffery, D. R., Lisa, P., Scott, B. S., Rupa, A. U., Wilber Jones, Raul G. B. and Barry R. Bloom. 1991. Genetic systems for mycobacteria. Methods Enzymol. 204, 537-556.
Jager, W., Schafer, A., Kahnowski, J. and A. Puhler. 1995. Isolation of insertion element from Gram-positive Brevibacterium, Corynebacterium, and Rhodococcus sttains using the Bacillus subtilis sacB gene as a positive selection marker. FEMS Microbial. Lett. 126:1-6 Jarher, V. and H. Nikaido. 1990. Permeabihty barrier to hydrophihc solutes in Mycobacterium chelonei. J. Bacteriol. 172:1418-1423.
Jarlier, V., Gutmann, L. and H. Nikaido. 1991. Interplay of cell wall barrier and [3-lactamase activity determines high resistance to |3-lactam antibiotics in Mycobacterium chelonae. Antimicrob. Agents. Chemother. 35: 1937-1939.
Jarher, V. and H. Nikaido. 1994. Mycobacterial ceU wall: sttucture and role in namral resistance to antibiotics. FEMS Microbiol. Lett. 123:11-18.
Jang, K. H., Chambers, P. J. and M. L. Britz. 1996. Analysis of nucleotide methylation in DNA from Corynebacterium glutamicum and related species. FEMS Microbiol. Lett. 136: 309-315.
Jang, K. H., Pierotti, D., Kemp, G. W., Best, G. R. and M. L. Britz. 1997. Mycohc acid composition of Corynebacterium glutamicum and its cell surface mutants: effects of growth with glycine and isonicotinic acid hydrazide. Microbiol. 143: 3209-3221.
Jang, K. H. 1997. Identification and characterisation of the cell surface and enzymatic barriers to plasmid ttansformation in Corynebacterium glutamicum and related species. Ph. D. thesis. Victoria University of Technology. Australia.
Jensen, H. L. 1952. The coryneform bacteria. Annu. Rev. Microbiol. 6: 77-90.
Jetten, M. S. M., Gubler, M. E., McCormick, M. M., Colon, G. E., Follettie, M. T. and A. Sinskey 1993. Molecular organisation and regulation of the biosynthetic pathway for aspartate derived amino acids in Corynebacterium glutamicum, p. 97. In Baltz, R., Hedgeman, G. and P. L. Skattud (eds.), Industtial Microorganisms: Basic and Apphed Molecular Genetics, American Society for Microbiology, Washington, D. C.
Jetten, M. S. M., Follettie, M. T. and A. J. Sinskey. 1994. Metabolic engineering of Corynebacterium glutamicum, p. 754. In Bajpai, R. and A. Prokop (eds.). Recombinant DNA Technology II, Annals of the New York Academy of Science, New York.
437

Jetten, M. S. M., FoUittie, M. T. and A. J. Sinskey 1995. Effect of different levels of aspartokinase on the lysine production of Corynebacterium lactofermentum, Appl. Microbiol. Biotechnol.
Johnsson, K. and P. G. Schultz. 1994. Mechanism of the oxidation of isoniazid by the cat2ilase peroxidase from Mycobacterium tuberculosis. 1. Am. Soc. 116:7,425-7,426.
Johff, G., Mathieu, L., Hahn, V., Bayan, N., Duchiron, F., Renaud, M., Shechter, E., G. Leblon. 1992. Cloning and nucleotide sequence of the cspl gene encoding PSl, one of the two major secreted proteins of Corynebacterium glutamicum: the deduced N-terminal region of PSl is similar to the j\^co6acterzww antigen 85 complex. Mol. Microbiol. 6: 2,349-2,362.
Jones, D. and R. M. Keddie. 1981. The genus Arthrobacter, p. 1,281-1,299. In Stolp, M. P., Tmper, H. G., Balows, A. and H. G. Schlegel (ed.), The prokaryotes. A handbook on habitates, isolation and identification of bacteria. Springer-Verlag, Berlin, Germany.
Jones, D. and M. D. CoUins. 1986. Irregular non-sporing Gram positive rods, p. 1,261-1,264. In Williams, S. T., Sharpe, M. E. and J. Hoh (ed.), Bergey's Manual of Systematic Bacteriology, vol. 2, Williams and Wilkins: Baltimore.
Kacem, K., De Sousa-D' Auria, C, Tropis, M., Chami, M., Gounon, P., Leblon, G., Houssin, C, M. Daffe. 2004. Importance of mycoloyltransferases on the physiology of Corynebacterium glutamicum. Microbiol. 150: (Pt 1): 73-84.
Kalpana, G. V., Bloom, B. R. and W. R. Jacobs, Jr. 1991. Insertional mutagenesis and illegitimate recombination in mycobacteria. Proc. Nati. Acad. Sci. USA. 88: 5,433-5,437.
Kaneko, H. and K. Sakaguchi. 1979. Fusion of protoplast and genetic recombination in Brevibacterium flavum. Agric. Biol. Chem. 43: 1,007-1,013.
Kapur, v., Li, L. L. and M. R. Hamick., 1995. Rapid Mycobacterium species assignment and unambiguous identification of mutations associated with antimicrobial resistance in Mycobacterium tuberculosis by automated DNA sequencing. Arch. Pathol. Lab. Med. 119: 131-138.
Karasawa, M., Tosaka, O., Ikeda, S. and H. Yoshii. 1986. Application of protoplast fusion to the development of L-threonine and L-lysine producers, Agric. Biol, chem., 50, 339.
Kato, F., Yoshimi, M., Araki, K., Motomura, Y., Mastsufime, Y., Nobunaga, H. and A. Murata. 1984. Screening of bacteriocins in amino acid or nucleic acid producing bacteria and related species. Agric. Biol. Chem. 48: 193-200.
438

Kato, F., Eguchi, Y., Nakano, M., Oshima, T. and A. Murata. 1991. Purification and characterization of linencin A, a bacteriocin of Brevibacterium linens Agric Biol Chem. 55:161-166.
Katsumata, R, Ozaki, A., Oka, T. and A. Fumya. 1984a. Recombinant DNA technology for Corynebacteria and Brevibacteria. Abstiacts, VII Int. Biotech. Symp. New Delhi, India, p 61.
Katsumata, R., Ozaki, A., Oka, T. and A. Fumya. 1984 b. Protoplast transformation of L-glutamate-producing bacteria with plasmid DNA. J. Bacteriol. 159: 306-311. Keddie, R. M. and G. L. Cure. 1977. The cell wall composition and disttibution of free mycolic acids in named stiains of corynebacteria and in isolates from various namral sources. J. Appl. Bacteriol. 42: 229-252.
Keddie, R. M. 1978. What do we mean by coryneform bacteria? In Bousfield, 1. J. and A. G. CaUey (ed.), Coryneform Bacteria,. Acedemic Press: London.
Kinoshita, S. 1985. Glutamic acid bacteria, p. 15-142. /z? Demain, A. L. and N. A. Solomon (eds.). Biology of industrial microorganisms. Butterworth publication, Stoneham, Mass.
Kinoshita, S. 1987. Amino acids and nucleotide fermentations: from their genesis to the current state. J. Ind. Microbiol. Supp. 1:1-12.
Kikuchi, S., Takeuchi, T., Yasui, M., Kusaka, T. and P. E. Kaolattukudy. 1989. A very long-chain fatty acid elongation system in Mycobacterium avium and a possible mode of action of isoniazid on the system. Agric. Biol. Chem. 53:1,689-1,698.
Kikuchi, S., Rainwater, D. L. and P. E. Kolattukudy. 1992. Purification and characterisation of an unusually large fatty acid synthase from Mycobacterium tuberculosis var. bovis'QCG. Arch. Biochem. Biophys. 295:318-326.
Kisumi, M., Komatsubara, S. and I. Chibata. 1977. Enhancement of hydroxamate-mediated growth inhibition and improvement of isoleucine-producing sttains of Serratia marcescens. Appl. Environ. Microbiol. 34: 647-653.
Klatte, S., Rainey, F. A., and R. M. Kroppenstedt. 1994. Transfer of Rhodococcus aichiensis Tsukamura 1982 and Nocardia amarae Lechevalier and Lechevalier 1974 to the genus Gordona as Gordona aichiensis comb. nov. and Gordona amarae comb. nov. Int. J. Syst. Bacteriol. 44: 769-773.
Kleemann, A., Leuchtenberger, W., Hoppe, B. and H. Tanner. 1985. Amino acids, p. 57-97. In Gerhartz, W (ed.), UUmanns' encyclopedia of industrial chemistry, vol. 2A. VCH Verlagsgesellschaft mbH, Weinheim, Germany.
439

Kolattukudy, P. E., Norvin, D. F., Azad, A. K., Fitzmaurice. A. M. and D. S. Tatiana 1997. Biochemistry and molecular genetics of cell-wall lipid biosynthesis in mycobacteria. Mol. Microbiol. 24: 163-270.
Kramer, R. 1994. Secretion of amino acids by bacteria: physiology and mechanism, FEMS Microbiol. Rev. 13, 75.
Krisna Murti, C. R. 1975. Isonicotinic acid hydrazide, p. 623-652. In Corcoran. J. W. and F. E. Hahn (ed.). Antibiotics III. Springer-Verlag, Berlin.
Labarre, J., Reyes, O., Guyonvarch, A., and G. Leblon. 1993. Gene replacement integration, and amplification at the gdhA locus of Corynebacterium glutamicum. J. Bacteriol. 175: 1,001-1,007
Lacave, C, Laneelle, M. A. and G. Laneelle. 1990a. Mycolic acid synthesis by Mycobacterium aurum cell-free extracts. Biochim. Biophys. Acta. 1,042: 315-323.
Lacave, C, Quemard, A. and G. Laneelle. 1990b. Cell free synthesis of mycolic acid in Mycobacterium aurum: radioactivity distribution in newly synthesised acids and presence of ceU wall in the system. Biochem. Biophys. Acta. 1045:58-68.
Laemmli, U. K. 1970. Cleavage of stmcmral proteins during the assembly of the head of bacteriophage T4. Nature (London) 227: 680-685.
Lambert, C, Erdmann, A., Eikmanns, M. and R. Kramer. 1995. Triggering glutamate excretion in Corynebacterium glutamicum by modulating the membrane state with local anaesthetics and osmotic gradients. Appl. Environ. Microbiol. 61:4,334-4,342.
Laneelle, G. 1989. Mycolic acid metabohsm. Acta. Leprol(suppl. 1), 7: 65-73.
Law, B. A., and M. E. Sharpe. 1978. Formation of methanethiol by bacteria isolated from raw milk and Cheddar cheese . J. Dairy Res. 45:267-275.
Lee. E. R, Armour, J. W., Takayama, K., Brennan, P. J., G. S. Bersa. 1997. Mycolic acid biosynthesis: definition and targeting of the Claisen condensation step. Bioch. Bioph. Acta. 1346: 275-284.
Lechevalier, M. P. and H. A. Lechevalier. 1970. Chemical composition as a criterion in the classification of aerobic c?z>7omj ce/e5. Int. J. Syst. Bacteriol. 20:435-443.
Lechevalier, M. P. 1976. The taxonomy of the genus Nocardia: Some light at the end of the ttinnel? p. 1-38. In GoodfeUow, M., Brownell, G. H., and J. A. Serrano (ed.). The Biology of Nocardiae, Academic Press: London.
Lederer, E. 1971. The mycobacterial ceU waU. Pure. Appl. Chem. 25:135-164.
440

Lehmann, K. B. and R. O. Neumann. 1907. Atlas und gmndriss der bakteriologichen diagnostik. J. F. Lehmann Munich.
Lemassu, A., Ortalo-Magne', A., Bardou, F., Silve, Laneelle, M.-A.G and Daffe',M. 1996. Extracellular and surface-exposed poly-saccharides of non ttiberculous mycobacteria. Microbiol: 142: 1513-1520.
Lewis, B. A. 1982. Correlation between thiol production and antifungal activity by Brevibacterium linens. Microbios Lett. 21: 75-78.
Liebl, W., Bayeri., A., Stillner, U. and K. H. Scheilfer. 1989. High frequency electroporation of intact Corynebacterium glutamicum cells. FEMS Microbiol. Lett. 65: 299-304.
Liebl, W., Ehrmann, M. Luwig, W. and K. H. Schleifer. 1991. Transfer of Brevibacterium diverticatum DSM 20297, Brevibacterium flavum DSM 20411, Brevibacterium lactofermentum DSM 20412 and DSM 1412, and Corynebacterium lilium DSM20317 to Corynebacterium glutamicum and their distinction by rDNA gene restriction pattems. Int. Syst. Bacteriol. 41:255-260.
Liebl, W., Sinskey, A. J. and K. H. Schleifer. 1992. Expression, secretion, and processing of staphylococcal nuclease by Corynebacterium glutamicum. J. Bacteriol. 174: 1,854-1,861.
Liebl, W. 1992. The genus Cozjweac^erzwzw-nonmedical, p. 1,157-1,171. In A. Balows, H. G. Tmper, M. Dworkin, W. Harder, and K. H. Schleifer (ed.). The Prokaryotes, 2nd ed. Springer-Verlag, Berlin.
Liu, J., Rosenberg, E. Y. and H. Nikaido. 1995. Fluidity of the lipid domain of cell wall from Mycobacterium chelonae. Proc. Nati. Acad. Sci. USA. 92:11,254-11,258.
Lopez-Marin, L. M., Quemard, A., Laneelle, G. and C. Lacave. 1991. Ethylenic mycolic acid biosynthesis: extension of the biosynthetic model using cell-free exttacts of Mycobacterium aurum and Mycobacterium smegmatis. Biochem. Biophys. Acta 1086: 22-28.
Low, K. B. and D. D. Porter. 1978. Modes of action of gene transfer and recombination in bacteria. Annu. Rev. Genet. 12:249-287.
MacNeil, D. G. 1987. Introduction of plasmid DNA into Streptomyces lividans by electtoporation. FEMS Microbiol. Lett. 42: 239-244.
Maniatis, T., Fritsch, E. F., and J. Sambrook. 1982. Molecular cloning. Cold spring Harbor Laboratory, New York.
441

Marklund. B. I., Speert, D. P. and R. W. Stokes. 1995. Gene replacement through homologous recombination in Mycobacterium intracellulare. J. Bacteriol 177- 6 100-6,105.
Marco, J. C. 1994. Mastitis en la oveja Latxa: epidemiologia, diagostico y conttol. PhD thesis. University of Zaragoza. Martin, J. F., Santamaria, R., Sandoval, H., del Real, G., Mateos, L. M., Gil, J. A. and A. Aguilar. 1987. Cloning systems in amino acid-producing Corynebacteria. Biotechnol. 5: 137-146.
Marrakchi, H., Ducasse. S., Labesse. G., Monttozier, H., Margeat, E., Emorine, L., Charpentier, X., Daffe', M., A. Quemard. 2002. MabA(FabGl), a Mycobacterium tuberculosis protein involved in the long-chain fatty acid elongation system FAS-II. Microbiol. 148(Pt 4): 951-60.
Martin, J. F., Cadenas, R. F., Malumbres, M., Mateos, L. M., Guerrero, C. and J. A. Gil. 1990. Constmction and utilisation of promoter-probe and expression vectors in corynebacteria. Characterisation of promoters, p. 283-292. In Heslot, H., Davies, J., Florent, J., Babichon, L., Durant, G. and L. Penasse (ed), Proceedings of the 6th Intemational Symposium of industtial Microorganisms. Societe Francaise de Micobiologie, Strasbourg, France.
Mateos. M. L., Schafer, A., Kalinowski, J., Martin, J. F. and A. Piihler. 1996. Integration of narrow-host-range vectors from Escherichia coli into the genomes of amino acid-producing Corynebacteria after integeneric conjugation. J. Bacteriol. 178: 5,768-5,775.
Mazodier, P., Petter, R. and C. Thompson. 1989. Intergeneric conjugation between Escherichia coli and Streptomyces species. J. Bacteriol. 171:3,583-3,585.
McAllister, K. A., Lee, H. and J. T. Trevors. 1996. Microbiol deregulation of pentachlorophenol. Biodegradation. 7: 1-40.
McGinely, K. J., Labows, J. N., Zechman, J. M., Nordstorm, K. M., Webester, G. F. and J. J. Leyden. 1985. Analysis of cellular components, biochemical reactions and habitat of human cutaneous lipophilic diphtheroids. J. Invest. Dermatol. 85: 374-377.
McNeil, M., Daffe, M. and P. J. Brennan. 1990. Evidence for the nattire of link between the arabinogalactan and peptidoglycan of mycobacterial ceU wall. J. Biological. Chem. 265: 18,200-18,206.
McNeil, M. R. and P. J. Brennan. 1991. Stincttire, function and biogenesis of the cell envelope of mycobacteria in relation to bacterial physiology, pathogenesis and dmg resistance; some thoughts and possibilities arising from recent sttuctural information. Res. Microbiol. 142:451-463.
442

Mdluli, K. and C. E. Barry, III. 1996. Dmg sensitivity and environmental adaptation of mycobacterial cell wall components. Trend Microbiol. 4: 275-281.
Mdluh, K., Sherman, D. R., Hickey, M. J., Kreiswrith, N. B., Morris, S., Stover, C. K., C. E. Barry, III. 1996. Biochemical and genetic data suggest that InhA is not the primary target for activated isoniazid in Mycobacterium tuberculosis. J. Infect Dis 174- 1 085-1,090.
Michel, G. and C. Bordet. 1976. Cell v^alls of Nocardiae, p. 141-159. /z7 GoodfeUow. M., Brownell, G. H. and J. A. Serrano (ed.), The Biology of Nocardiae. London: Academic Press.
Middlebrook, G. 1952. Sterilisation of tubercle bacilli by isonicotinic acid hydrazide and the incidence of variants resistant to the dmg in vitro. Am. Rev. Tuberc. 65: 765-767.
Middlebrook, G. 1954. Isoniazid-resistance and catalase activity in mbercle bacilli. Am. Rev. Tuberc. 69:471-472.
Middlebrook, G., Cohn, M. L., W. B. Schaefer. 1954. Smdies on isoniazid and tuberculosis bacilli. III. The isolation, dmg susceptibility, and catalase testing of tubercle bacilli from isoniazid-treated patients. Am. Rev. Tuberc. 70; 852-872. Miller, J. F., Dower, W. J. and L. S. Tompkins. 1988. High-voltage electroporation of bacteria: genetic transformation of Campylobacter jejuni with plasmid DNA. Proc. Natl. Acad. Sci. USA. 85: 856-860.
Milas, L. and M. T. Scott. 1978. Antitumor activity of Corynebacterium parvum. Adv. Cancer Res. 26:257-306.
Minnikin, D. E., Alshamaony, L. and M. GoodfeUow. 1975. Differentiation of Mycobacterium, Nocardia and related taxa by thin layer chromatography analysis of whole-organism methanolysates. J. Gen. Micobiol. 88: 200-204.
Minnikin, D. E., Patel, P. V., Alshamaony, L. and M. GoodfeUow. 1977. Polar lipids composition in the classification of Nocardia and related bacteria. Int. J. Syst. Bacteriol. 27: 104-117.
Minnikin, D. E., GoodfeUow, M. and M. D. Collins. 1978. Lipids composition in the classification and identification of coryneform and related taxa, p. 85-160. In Bousfield, I. J. and A. G. Callely (ed.), "Coryneform Bacteria"Academic Press: London.
Minnikin, D. E. and GoodfeUow. 1980. Lipid composition in the classification and identification of acid-fast bacteria, p. 189-256. In M. GoodfeUow and R. G. Board (ed.). Microbiological classification and identification. Academic Press. London.
443

Minnikin, D. E,, Hutchinson, I. G., Caldicott, and M. GoodfeUow. 1980. Thin layer chromatography of methanolysates of mycolic acid-containing taxa. J. Chromatogr. 188: 221-233.
Minnikin, D. E. 1982. Lipids: Complex lipids, their chemistry, biosynthesis and roles, p. 95-184. In C. Ratledge, J. L Stanfords (eds.), The Biology of the Mycobacteria, Vol.1.44. Physiology, Identification and Classification. Academic Press, London.
Minnikin, D. E. and A. G. O'Donnell. 1984. Actinomycete envelope lipids and peptidoglycan composition, p. 337-388. In GoodfeUow, M., Mordarski, M. and S. T. Williams (eds), The Biology of the Actinomycete. Academic Press. London.
Misaki, A., Seto, N. and 1. Azuma. 1974. Stmcture and immunological properties of D-arabino-D-galactans isolated from cell-walls of A co6acrmMZ77 species. J. Biochem. 76: 15-27.
Miwa, K., Tsuchida, T., Kurahashi, D., Nakamori, S., Sano, K. and H. Momose. 1983. Constmction of L-threonine over producing strains of Escherichia coU K-12 using recombinant DNA techniques. Agric. Biol. Chem. 47: 2,329,
Miwa, K., Matsui, H., Terabe, M., Ito, K., Ishida, M., Takagi, H., Nakamori, S. and K. Sano. 1985. Constiiiction of novel shuttle vectors and cosmid vector for the glutamic acid producing bacteria Brevibacterium lactofermentum and Corynebacterium glutamicum. Gene. 39: 281-
Momose, H., Miyashiro, S. and M. Oba. 1976. On the ttansducing phages in glutamic acid producing bacteria. J. Gen. Appl. Microbiol. 22: 119-
Morbach, S., Sahm, H. and L. Eggeling. 1995. Use of feedback-resistant threonine dehydratases of Corynebacterium glutamicum to increase carbon flux towards L-isoleucine. Appl. Environ. Microbiol. 61:4,315-4,320.
Mordarska, H., Mordarski, M. and M. GoodfeUow. 1972. Chemotaxonomic characters and classification of some nocardioform bacteria. J. Gen. Microbiol. 71:77-86.
Mordarski, M., GoodfeUow, M., Tkaez, A., Pulverer, G. and K. P. Schaal. 1980. Ribosomal ribonucleic acid similarities in the classification of Rhodococcus and related taxa. J. Gen. Microbiol. 118:313-319
Musser, J. M. 1995. Antimicrobial agent resistance in mycobacteria: molecular genetic insights'. Clin. Microbiol. Rev. 8:496-514.
Musser, J. M., Kapur, V., WiUiam, D. L., Kreiswirth, B. N., van Soolingen, D. and J. D. A. van Embden. 1996. Characterisation of the catalase-peroxidase gene (KatG) and inhA locus in isoniazid-resistant and susceptible strains of Mycobacterium tuberculosis by
444

automated DNA sequencing: restiicted array of mutations associated with dmg resistance. J. Infect. Dis. 173: 196-202.
Niederweis, M., Maier, E., Lichtinger, T., Benz, R. and R. Kramer. 1995. Identification of channel-forming activity in the cell wall of Corynebacterium glutamicum. J. Bacteriol. 177: 5,716-5,718.
Nikaido, H. and M. Vaara. 1985. Molecular basis of bacterial outer membrane permeabihty. Microbiol. Rev. 49: 1-32.
Nikaido. H., Kim, S.-H. and E. Y Rosenberg. 1993. Physical organisation of lipids in the cell^alX of Mycobacterium chelonae. Mol. Mirobiol. 8:1,025-1,030.
Noh, K-S., Kim, S-J., Lee, H-H., Hyun, H-H. and J-H. Lee. 1991. High frequency electtoporation-transformation of coryneform bacteria grown in the penicillin-G. Korean J. Biotechnol. Bioeng. 6: 223-230.
Osborn, M. J., Gander, J. E., Parisi, E. and J. Carlson. 1972. Mechanism of assembly of the outer membrane of Salmonella typhimurium. Isolation and characterisation of cytoplasmic and outer membrane. J. Biol. Chem. 247:3,962-3,972.
Ochi, K. 1989. Heterogeneity of ribosomal proteins among Streptomyces species and its application to identification. J. Gen. Microbiol. 135: 2,635-2,642. Ochi, K. 1995. Phylogenetic analysis of mycolic acid-containing Wall-Chemotype IV Actinomycetes and allied taxa by partial sequencing of ribosomal protein AT-L30. Int. J. Syst. Bacteriol. 45: 653-660.
Olsen, R. H. and P. Shipley. 1973. Host rang properties of the Pseudomonas R factor R1822. J. Bacteriol. 113:772-780.
Ortalo-Magne', A., Dupont, M.-A., Lemassu, A.,Andersen, A. B., Gounon, P. and Daffe',M. 1995. Molecular composition of the outermost capsular material of the ttibercle bacillus. Microbiol. 141:1609-1620.
Okanishi, M., Suzuki, K., and H. Umezawa. 1974. Formation and reversion of Streptomycete protoplasts: cultural conditions and morphological smdy. J. Gen. Microbiol. 80:389-400.
Ozaki, A., R. Katsumata, T. Oka. and A. Fumya. 1985. Cloning of the genes concerned in phenylalanine biosynthesis in Corynebacterium glutamicum and its application to breeding of phenylalanine producing sttain. Agric. Biol. Chem. 49: 2,925-2,930.
Ozaki, A., Katamata, R., Oka, T. and A. Fumya. 1984. Functional expression of the genes of Escherichia coli in Gram positive Corynebacterium glutamicum. Mol. Gen. Microbiol. 196: 175-178.
445

Paradish, F. W., Warren, D. G., Kilburn, D. G. and R. C. Miller, Jr. 1987. The expression of Cellulomonas fimi cellulase genes in Brevibacterium lactofermentum Gene 61: 199-206.
Patek, M., Ludvik, J., Benada, O., Hochmannova, J. and J. Stockrova. 1988. Transfection of Brevibacterium flavum with bacteriophage BFBIO DNA Folia Microbiol. 333: 247-254.
Patek, M., O. Navratil, J. Hochmanova., J. Nesvera., V. Kmmphanzl. and M. Bucko. 1989. Expression of the threonine operon fromf. coli in B. flavum and C. glutamicum. Biotechnol. Lett. 11:231-236.
Pearson, W. R., and D. J. Lipman. 1988. Improved tools for biological sequence comparison. Proc. Nati. Acad. Sci. U. S. A. 85, 2,444-2,448.
Peterswendisch, P. G., Eikmanns, B. J., Thierbach, G., Bachmann, B. and H. Sahm, 1993. Phosphoenol pymvate corboxylase in Corynebacterium glutamicum is dispensable for growth and lysine production. FEMS Microbiol. Lett. 112:269
Pierotti, D. 1987. An investigation of the relationship between cell surface chemistry and efficiency of protoplast formation in Corynebacterium glutamicum. Master thesis. Royal Melboume Institute of Technology, Australia.
Portevin, D., deSousa-D'Auria C, Montrozier, H., Hussin, C, Stella A., Laneelle, M. A., Bardou, F., Guilhot, C , Daffe, M. 2005. The acyl-AMP ligase Fad32 and AccD4-containing acyl-CoA carboxylase are required for the synthesis of mycolic acids and essential for mycobacterial growth: identification of the carboxylase components. J. Biol. Chem. Mar. ll;280(10):8862-74.
Portevin, D., deSousa-D'Auria C, Hussin, C, Grimmaldi. C, Chami. M., Daffe, M., C. Guilhot. 2004. A polyketide synthase catalyzes the last condensation step of mycolic acid biosynthesis in mycobacteria and related organisms. Proc. Natl. Acad. Sci. U. S. A.Jan 6; 101(1): 314-319.
Puech, v., Chami, M., Lemassu, A., Laneelle, M. A., Schiffler, B., Gounon, P., Bayan, N., Benz, R., M. Daffe'. 2001. Stmcture of ceU envelope of corynebacteria: importance of the non-covalently bound lipids in the formation of the cell wall permeability barrier and fracture plane. Microbiol. 147. 1365-1382.
Puech, V.,Bayan., Salim, K., Leblon, G., and M. Daffe'. 2000. Characterization of the in vivo acceptors of the mycoloyl residues tiansferred by the corynebacterial PSl and the related mycobacterial antigens 85. Mol. Microbiol. 35:1026-1041.
Powell, 1. B., Achen, M. G., Hillier, A. J. and B. E. Davidson. 1988. A simple and rapid method for genetic transformation of lactic streptococci by electroporation. Appl. Environ. Microbiol. 54: 655-660.
446

Quemard, A., Mazeres. S., Sut. A., Laneele, G. and C. Lacave. 1995. Certain properties of isoniazid inhibition of mycohc acid synthesis in ceU-free systems of M. aurum and M. avium. Biochim. Biopyhs. Acta. 1254: 98-104.
Quemard, A., Lacave, C. and G. Laneelle. 1991. Isoniazid inhibition of mycohc acid synthesis by cell extracts of sensitive and resistant sttains of Mycobacterium aurum. Antimicrob. Agents. Chemother. 35: 1,035-1,039.
Quemard, A., Dessen. A., Sogantio. M., Jacobs WR Jr., Sacchettini JC. 1996. Binding of the catalase-peroxidase-activated isoniazid to wild type and mutant Mycobacterium tuberculosis enoyl-ACP reductases. J. Am. Chem. Soc. 118: 1,561-1,562.
Rastogi, N. 1991. Recent observations concerning stmcture and function relationships in the mycobacterial cell envelope: elaboration of a model in terms of mycobacterial pathogenicity, virulence and dmg-resistance. Res. Microbiol. 142: 464-476.
Randall, J. R. and D. O. Andreas. 1992. in Archer Daniels Midland Annual Report, ADM, Decatur, IL, 16
Rastogi, N., Frehel, C. and L. H. Davis. 1986. The ttiple-layered stmcture of mycobacterial cell wall: evidence for the existence of a polysaccharide-rich outer layer in 18 mycobacterial species. Curr. Microbiol. 13. 237-242.
Redferarn, E. R. 1966. Mode of action of ubiquinones (coenzyme Q) in electton-transport systems. Vitam. Horm. 24: 465-468.
Reddy, C. A., Cornell, C. P. and A. M. Fraga. 1982. Transfer of Corynebacterium pyogenes (Glage) Eberson to the genus Actinomyces as Actinomyces pyogenes (Glage) comb. nov. Int. J. Syst. Bacteriol. 32:419-429.
Riegel, P., Ruimy, R., de Brial, D., Prevost, G., Jehl, F., Bimet, F., Christen, R. and H. Monteil. 1995. Genomic diversity and relationships among lipids-requiring diptheroids from human and characterisation of Corynebacterium macginleyi sp. nov. Int. J. Syst. Bacteriol. 45:128-133.
Riegel, P., de., Briel, D., Prevost, G., Jehl, F., Monteil, H. and , R. Minch. 1993. Taxonomic study of the Corynebacterium group ANF-1 sttains: proposal of Corynebacterium afermentans sp. nov. containing the subspecies C. afermentans subsp. afermentans subsp. nov. and C. afermentans subsp. lipophilum subsp. nov. and Int Syst Bacteriol. 43: 287-292.
Riegel, P., Ruimy, R., de Briel, D., Prevost, G., Jehl, F., Bimet, F., Christen, R. and H. Monteil. 1995. Corynebacterium argentoratense sp. nov. from human throat. Int J Syst. Bacteriol. 45: 533-537.
447

Riegel, P., Ruimy, R., de Briel, D., Prevost, G., Jehl, F., Bimet, F., Christen, R. and H, H. Monteil. 1995. Corynebacterium seminale sp. nov., a new species associated with genital infections in male patients. J Clin Microbiol. 33: 2,244-2,249.
Riley, P. S., Holhs, D. G., Utter, G. B., Weaver, R. E. and C. N. Baker. 1979. Characterisation of 95 dipheroid (JK) culttires isolated from chnical specimens. J. Chn. Microbiol. 9:418-427.
Richard E. Lee., Armour, K., Takayama., P. J. Brennan., G. S. Bersa. 1997. Mycohc acid biosynthesis: definition and targeting of the Claisen condensation step. Bioch. Bioph. Acta. 1346:275-284.
Rist, N. 1960. L'activite antituberculeuse de I'ethionamide. Adv. Tuberculosis Res. 10: 69-126.
Rislow, M., Mobhg. M., Rifai. M., Schatz, H., Fieldman. K., A. Pfeiffer. 1995. A new isoniazid/ethionamide resistance gene mutation and screening for multidrug-resistant Mycobacterium tuberculosis strains. Lancet. 310: 502-3
Rouse, D. A., Li, Z., Bai, G. H., L. S. Morris. 1995. Characterization of the katG and inhA genes of isoniazid resistant clinical isolates of Mycobacterium tuberculosis. Antimicrob. Agents Chemother. 39: 2472-2477.
Rozwarski, D. A., Grant. G. A., Barton, D. H.R., Jacobs, W. R. Jr., J. C. Sacchettini. 1998. Modification of the NADH of the isoniazid target (inhA) from Mycobacterium tuberculosis. Science. 279:98-102.
Salim, K., Haedens. V., Content, J., Leblon. G. and K. Huygen. 1997. Heterologous expression of the Mycobacterrium tuberculosis gene encoding antigen 85A in Corynebacterium gulatmicum. App. Environ. Microbiol. 63: 4392-440.
Sambrook, J., Fritsch, E. F. and T. Maniatis. 1989. Molecular cloning: a laboratory manual, 2nd ed. Cold Spring Harbour Laboratory Press, Cold Spring Harbor, N. Y.
Santamaria, R., Mesa, J. M., J. F. Martin. 1982. Genetic recombination by protoplast fusion in coryneform bacteria. Abstiacts, 4th International symposium on Genetics of Industtial Microorganisms, Kyoto, Japan, p. 60.
Santamaria, R., Gil, J. A., Mesas, J. M. and J. F. Martin 1984. Characterisation of an endogenous plasmid and development of cloning vectors and a tiansformation system in Brevibacterium lactofermentum. J. Gen. Microbiol. 130: 2,237-2,246.
Santamaria , R., Gil, J. A. and J. F. Martin. 1985. High-frequency tiansformation of Brevibacterium lactofermentum protoplasts by plasmid DNA. J. Bacteriol. 162: 463-467.
448

Schleifer, K. H., and Kandler. 1972. Peptidoglycan types of bacterial cell walls and then taxonomic imphcations. Bacteriol. Rev. 36:407-477.
Schwarzer, A. and A. Puhler. 1991. Manipulation of Corynebacterium glutamicum by gene dismption and replacement. Biotechnol. 9: 84-87.
Schaeffer, P., Cami, B. and R. D. Hotchkiss. 1976. Fusion of bacterial protoplasts. Proc. Nati. Acad. Sci. USA. 73: 2,151-2,155.
Schafer, A., Kahnowski, J., Simon, R., Seep-Feldhaus, R. A. and A. Puhler. 1990. High-frequency conjugal transfer from Gram-negative Escherichia coli to various Gram-positive coryneform bacteria, J. Bacteriol. 172: 1,663-1,666.
Schafer, A., Kalinowski, J. and A. Puhler. 1994a. Increased fertihty of Corynebacterium glutamicum recipients in intergeneric matings with Escherichia coli after sttess exposure, Appl. Environ. Microbiol., 60: 756-759.
Schafer, A., Kalinowski, J. and A. Puhler. 1994b. Cloning and characterisation of a DNA region encoding a stress-sensitive restriction system from Corynebacterium glutamicum ATCC 13032 and analysis of its role in intergeneric conjugation with Escherichia coli. J. Bacteriol. 176. 7309-7319
Schafer, A., Tauch, A., Jager, W., Kahnowski, J., Thierbach, G. and A. Puhler. 1994. Small mobilizable multi-purpose cloning vectors derived from the Escherichia coli plasmids pK18 and pK19: selection of defined deletions in the chromosome of Corynebacterium glutamicum. Gene. 145: 69-73.
Serwold-Davis, T. M., Groman, N. and M. Rabin. 1987. Transformation of Corynebacterium diphtheria, Corynebacterium ulcerans, Corynebacterium glutamicum, and Escherichia coli with C. diphtheria plasmid PNG2. Proc. Nati. Acad. Sci. USA. 84: 4964-4968 Shiio, I. 1983. Biochemical conditions for amino acid overproduction. In: I. Ikeda, T. Beppu. (eds.). Genetics of industtial organisms, p. 242-246. Kotdansha Ltd., Tokyo.
Sherman, D. R., Mudluh. K., Hickey. M. J., Arain. T. M., Morris. S. L., C. E. Barry. III.. 1996. Compensatory ahpC gene expression in isoniazid-resistant Mycobacterium tuberculosis. Science. 272: 1641-1643.
Sherman, D. R., Sabo, P. J., M. J. Hickey et al. 1995. Disparate responses to oxidative sttess in saprophytic and pathogenic mycobacteria. Proc. Nati. Acad. Sci. U.SA 92: 6625-6629.
Shimakata, T., Iwaka, M. and T. Kusaka. 1984. In vitro synthesis of mycohc acids by the fluffy layer fraction of Bacterionema matruchotii. Arch. Biochem. Biophys. 229: 329-339.
449

Shivarova, N., Forster, W., Jacob, H-E. and R. Grigorova. 1983. Microbiological implications of electtic field effects VH. Stimulation of plasmid ttansformation of Bacillus cereus protoplasts by electric field pulses. Z. AUg. Mikrobiol. 23: 595-599.
Simon, R., U. Priefer and A. Puhler. 1983. A broad host range mobilisation system for in vivo genetic engineering: ttansposon mutagenesis in Gram-negative bacteria. Biotechnol 1: 784-794.
Simon, R., O'ConneU, M., Labes, G. and A. Puhler. 1986. Plasmid vectors for the genetic analysis and manipulation of Rhizobia and other Gram-negative bacteria. Methods Enzymol. 118: 640-659.
Sophie, M. P. and J. Richard. 1995. Activity and purification of hnenscin OC2, an antibacterial substance produced by Brevibacterium linens OC2, an orange cheese coryneform bacteria. Appl. Envir. Microbiol. 61:1,847-1,852.
Somkuti, J. A. and D. H. Steinberg. 1978. Genetic ttansformation of Streptococcus thermophilus by electroporation. In: Neijssel, O. M., Van der Meer, R. R, Luyben KCHAM(eds.),p. 412 Proc. 4th Eur. Cong. Biotech, Voll, Elsevier, Amsterdam.
Smith M, D., Fhckinger, J. L., Lineberger, D. W. and B. Schmidt 1986. Protoplast ttansformation in coryneform bacteria and inttoduction of an a-amylase gene from Bacillus amyloliqefaciens into Brevibacterium lactofermentum. Appl. Environ. Microbiol. 51: 636-639.
Stackebrandt, E., Lewis, B. J. and C. R. Woese. 1980. The phylogenetic structure of the coryneform group of bacteria. Zenttalbl. Bakteriol. Mikrobiol. Hyg. Abt. 2 Orig. ReiheCl: 137-149.
Stakebrandt, E. and K. H. Schleifer. 1984. Molecular systematics of Actinomycetes and related organisms, p. 485-504. In Bojahl, L. F. (ed). Biological, biochemical and biomedical aspects of Actinomycetes. Academic Press. London.
Stackebrandt, E. and J. Smida. 1988. The phylogeny of the genus Mycobacterium as determined by 16S rRNA sequences, and development of DNA probes, p. 244-250. In Biology of Actinomycetes. Japan Scientific Societies press, Tokoyo.
Stoeckle, M. Y., Guan, 1., Riegler, N., Weitzman, I., Kreiswrith, B., J. Komblum. 1993. Catalase-peroxidase gene sequences in isoniazid-sensitive and -resistant strains of Mycobacterium tuberculosis from]<\ew York City. J. Infect. Dis. 168:1,063-1,065.
Stodola, F. H., Lesuk, A. and R. J. Anderson. 1938. The chemistry of lipids of tubercle baciUi. LIV. The isolation and properties of mycohc acid. J. Biol. Chem. 126. 505-513.
450

Sttominger. J. L., and C. H. Birge. 1965. Nucleotide accumulation in Staphylococcus aureus by glycine. J. Bacteriol. 89: 1,124-1,127.
Susskind, M. M. and D. Botstein. 1978. Molecular genetics of bacteriophage p22. Microbiol. Rev. 42: 385-413.
Suzuki, T., Tanaka, K., Matsubra, I. and S. Kinoshita. 1969. Trehalose lipids and a-hydroxy p-hydroxy fatty acid formed by bacteria grown on n-alkanes. Agric. Biol. Chem. 33: 1,619-1,627.
Suzuki, K. and K Komagata. 1983. Taxonomic significance of cellular fatty acid composition in some coryneform bacteria. Int. J. Syst. Bacteriol. 33:188-200.
Takayama, K. and L. A. Davidsons. 1979. Isonicotinic acid hydrazide, p. 98-119. In F. E. Holms (ed). Antibiotics V, part 1. Spring-verlag KG, Berhn.
Tauch, A., Kirchner, O., Wehmeier, L., Kalinowski, J. and A. Puhler. 1994. Corynebacterium glutamium DNA is subjected to methylation-restriction in Escherichia coli. FEMS Microbiol. Lett. 123: 343-348.
Telenti, A., Honore, N., Bernasconi, C. et al 1998. Genotypic assessment of isoniazid and rifampicin resistance in Mycobacterium tuberculosis: a bhnd study at refrence laboratory level. J. Chn. Microbiol. 35:719-723.
Thierbach, G., Schwarzer, A. and A. Puhler. 1988. Transformation of spheroplasts and protoplasts of Corynebacterium glutamicum. Appl. Microbiol. Biotechnol. 29:356-362.
Thibert, L. and S. Lapierre. 1993. Routine apphcation of high performance liquid chromatography for identification of mycobacteria. J. Chn. Microbiol. 31:1759-1763.
Tichy, P. and O. E. Landman. 1969. Transformation in quasi spheroplasts of Bacillus subtilis. J. Bacteriol. 97:42-51.
Tsukamura, M. and S. Tsukamura. 1963. Isotopic studies on the effect of isoniazid on protein synthesis of mycobacteria. Jap. J. Tuberc. 11: 14.
Tosaka, O., Enei, H. and Y. Hirose. 1983. The production of L-lysine by fermentation. Trend. Biotechnol. 1:70-74.
Tomiyasu, I., Toriyama, S., Yano, I. and M. Masui. 1981. Changes in molecular species composition of nocardomycolic acids in Nocardia rubra by the growth temperature. Chemistty and Physics of Lipids. 28: 41-45.
Tomiyasu, I. 1982. Mycohc acid composition and thermally adaptive changes in Nocardia asteroides. J. Bacteriol. 151: 828-837.
451

Tomiyasu, I. and I. Yano. 1984. Isonicotinic acid hydrazide induced changes and inhibition in mycolic acid synthesis in Nocardia and related taxa. Arch. Microbiol 137: 316-323.
Toriyama, S., Yano, I., Masui, M., Kusunose, E., Kusunose, M. and N. Akimori. 1980. Regulation cell wall mycolic acid biosynthesis in acid-fast bacteria. I. Temperamres induced changes in mycohc acid related compounds in Mycobacterium phli. J. Biochem. 88:211-221.
Trias, J., Jarher, V. and R. Benz. 1992. Porins in the ceU waU of mycobacteria. Science. 258: 1,479-1,481.
Trieu-Cout, P., Carher, C. and P. Courvalin. 1988. Conjugative plasmid transfer from Enterococcus faecalis to Escherichia coli. J. Bacteriol. 29: 356-362.
Trieu-Cout, P., earlier, C , Martin, P. and P. Courvalin. 1987. Plasmid transfer by conjugation from Escherichia coli to Gram-positive bacteria. FEMS Microbiol. Lett. 48: 289-294.
Turnowsky, F., Fuchs, K., Jeschek, C. and G. Hogenauer. 1989. envM genes of Salmonella typhimurium and Escherichia coli. J. Bacteriol. 171:6,555-6,565.
Valdes-Stauber, N. and S. Scherer. 1994. Isolation and characterisation of hnocin Ml8, a bacteriocin produced by Brevibacterium linens. Appl. Environ. Microbiol. 60: 3,809-3,814.
Vertes, A. A., Inui, M., Kobayashi, M., Kurusu, Y. and H. Yukawa. 1994a. Isolation and characterisation of 7531831, a transposable element from C. glutamicum. Mol. Microbiol. 11:739-746.
Vertes, A. A., Asai, Y., Inui, M., Kobayashi, M., Kurusu, Y. and H. Yukawa. 1994b. Transposon mutagenesis of coryneform bacteria. Mol. Gen. Genet. 245:397-405.
Vertes, A. A., Asai, Y., Inui, M., Kobayashi, M., Kurusu, Y. and H. Yukawa. 1994b. Transposon mutagenesis of coryneform bacteria. Mol. Gen. Genet. 245:397-405.
Walker, R. W., Prome, J. C. and C. S. Lacave. 1973. Synthesis of mycolic acids. Formation of a C32-p-ketoester from palmitic acid in a cell free system of Corynebacterium diphtheriae. Biochem. Biophys. Acta. 326: 52-62.
Weber, J. M. and R. Losick. 1988. The use of chromosome integration vector to map erythromycin resistance and production genes in Saccharopolyspora erythraea (Streptomyces erythraeus). Gene. 68:173-180.
452

Webster, M. 1995. Identification and differentiation of species and sttains of bifidobacteria and Lactobacillus acidophilus by the RAPD method of DNA profiling. Honours thesis. Victoria University of Technology.
Wehrmann. A., Ruether, K., EggleUng, L. and H. Sahm. 1993. Role of spht pathway in lysine synthesis of Corynebacterium: a genetical and physiological approach BioEnsin-9: 33.
Welby-Gieusse, M., Laneele, M-A. and J. Assehneau. 1970. Sttucmre des acides corynomycohques de Corynebacterium hofmanii et leur implication biogenetique. Europ. J. Biochem. 13: 164-167.
Welsh, M. and P. Osterrieth. A comparison of the transformation of Gram-negative rod "protoplast" under the influence of pencillin G and glycine. Antonie Van Leeuwenhock . J. Microb. 24: 257-272.
Wheeler, P. R. and P. M. Anderson. 1996. Determination of the primary target for isoniazid in mycobacterial mycolic acid biosynthesis with Mycobacterium aurumA+. Biochem. J. 318:451-457.
Willetts, N. and C. Crowther. 1981. Mobilisation of the non conjugative IncQ plasmid RSFIOIO. Genet Res. 37:311-316.
Wilkins, B. M. 1990. Factors influencing the dissemination of DNA by bacterial conjugation, p. 22-30. In Fry. J. C. and M. J. Day (eds.). Bacterial genetics in natural environments. Chapman and HaU. London. New York.
Wilson, T. M., M. D. Collins. 1996. ahpC, a gene involved in isoniazid resistance of the Mycobacterium tuberculosis complex. Mol. Microbiol. 19:1025-1034.
Winder, F. 1964. The antibacterial action of streptomycin, isoniazid and PAS, p. 111. In V. C. Barry, (ed.). Chemotherapy of Tuberculosis. London: Butterworth,
Winder, F. G. and P. Brennan. 1965. Effect of isoniazid on lipid metabohsm of Mycobacterium tuberculosis. Biochem. J. 96: 77.
Winder, F. G. and P. B CoUins. 1970. Inhibition by isoniazid of synthesis on Mycobacterium tuberculosis. J. Gen. Microbiol. 63: 41-48. Winder, F. G. and S. A. Rooney. 1970. The effects of isoniazid on the carbohydrates of Mycobacterium tuberculosis BCG. Biochem. J. 177: 335-368.
Winder, F. G., Colhns, P. B. and D. Whelan. 1971. Effects of ethionamide and isoxyl on mycolic acid synthesis in Mycobacterium tuberculosis BCG. J. Gen. Microbiol. 66: 379-380.
453

Winder, F. G. 1982. Mode of action of the antimicrobial agents and associated aspects of the molecular biology of the mycobacteria, p. 353-438. In Ratiedge, C. and Stanford (eds.). The Biology of Mycobacteria, voll. Academic Press, New York.
Wohlleben, W., Muth, G. and J. Kahnowski. 1993. Genetic engineering of Gram positive bacteria, p. 477. In Rehm, H. H., Reed, G., Puhler, A. and H. Sahm (eds.), Biotechnology genetics and fundamentals of genetic engineering. VCH Publishers, Weinheim, Germany.
Wolf, H., Puhler, A. and E. Neumann. 1989. Electtottansformation of intact and osmotically sensitive ceUs of Corynebacterium glutamicum. Appl. Microbiol. Biotechnol. 30: 283-362.
Umbarger, H. E. 1978. Amino acid biosynthesis and its regulation. Annu. Rev. Biochem. 47: 533-606.
Yano, I. and K. Saito. 1972. Gas chromatographic and mass spectromettic analysis of molecular species of corynemycohc acids from Corynebacterium ulcerans. FEBS Lett. 23: 352-356.
Yano, I., Saito, K., Furukawa, Y. and M. Kusunose. 1972. Sttuctural analysis of molecular species of nocardomycolic acids from Nocardia erythropolis by the combined system of gas chromatography and mass specttometty. FEBS Lett. 23: 215-219.
Yamada, K., Kinoshita, S., Tsunoda, T. and K. Aida. 1972. The Microbial Production Of Amino Acids. Wiley, New York.
Yamada, Y., G. Inouye., Y. Tahara. and K. Kondo. 1976. The menaquinone system in the classification of coryneform and nocardioform bacteria and related organisms. J. Gen. Appl. Microbiol. 22: 203-214.
Yamada, K. 1977. Bioengineering report: recent advances in industtial fermentations in Japan. Biotechnol. Bioeng. 19: 1563-1621. Yamada, Y., Won Seo, G. and H. Okada. 1985. Oxidation of acychc terpenoids by Corynebacterium sp. Appl. Envhon. Microbiol. 49: 960-963.
Youatt, J. 1961. The formation of 4-pyridylmethanol from isonicotinic acid hydrazide (isoniazid) by mycobacteria. Aust. J. Chem. 14: 308-311.
Youatt, J. 1969. A review of the action of isoniazid. Am. Rev. Respir. Dis. 99:729-749.
Yoshihama, M., Higashho, K., Rao, E. A., Akdo., M., Shanabruch, W. G., FoUittie, M T., Walker, G. C. and A. J. Sinskey. 1985. Cloning vector system for Corynebacterium glutamicum. J. Bacteriol. 162: 591-597.
454

Yuan, Y., Lee, R. E., Bersa, G. S., Behsle, J. T. and C. E. Barry, III. 1995. Identification of a gene involved in the biosynthesis of cyclopropanated mycolic acids in Mycobacterium tuberculosis. Proc. Nati. Acad. Sci. USA 92: 6,630-6,634.
Yuan, Y., and C. E. Barry, III. 1996. A common mechanism for the biosynthesis of methoxy and cyclopropyl mycolic acids in Mycobacterium tuberculosis. Proc. Natl Acad. Sci. USA 93: 12828-12833.
Zhang, Y., Heym, B., Allen, B., Young, D. and S. Cole. 1992. The catalase-peroxidase gene and isoniazid resistance of Mycobacterium tuberculosis. Namre. 358: 591-593.
Zhang, Y.,Garbe, T. and D. Young. 1993. Transformation with katG restores isoniazid-sensitivity in Mycobacterium tuberculosis isolates resistant to a range of dmg concentrations. Mol. Microbiol. 8: 521-524.
Zajic, J. E., H. Guignard, and D. F. Gerson. 1977. Emulsifying and surface active agents from Corynebacterium hydrocorboclastum. Biotechnol. Biioeng. 19:1295-1301.
Zinder, N. D. and Lederberg. 1952. Genetic exchange in Salmonella. J. Bacteriol. 64: 679-699.
Zuneda, M. C , Guillenea, J. J., Dominguez, J. B., Prado, A. and F. M. Goni. 1984. Lipid composition and protoplast forming activity of Streptomyces antibioticus. Lipids. 19: 223-228.
455
Copyright © 2022 FDOKUMEN