The genetic effects of Late Quaternary climatic changes over a tropical latitudinal gradient:...
13
The genetic effects of Late Quaternary climatic changes over a tropical latitudinal gradient: diversification of an Atlantic Forest passerine FERNANDO M. D’HORTA,* GUSTAVO S. CABANNE,*† DIOGO MEYER* and CRISTINA Y. MIYAKI* *Departamento de Gene ´tica e Biologia Evolutiva, Instituto de Biocie ˆncias, Universidade de Sa ˜o Paulo, Rua do Mata ˜o 277, 05508-090 Sa ˜o Paulo, SP, Brazil, †Divisio ´n de Ornitologı ´a, Museo Argentino de Ciencias Naturales ‘‘Bernardino Rivadavia’’, A ´ ngel Gallardo 470, Ciudad de Buenos Aires (C1405DJR), Argentina Abstract The increase in biodiversity from high to low latitudes is a widely recognized biogeographical pattern. According to the latitudinal gradient hypothesis (LGH), this pattern was shaped by differential effects of Late Quaternary climatic changes across a latitudinal gradient. Here, we evaluate the effects of climatic changes across a tropical latitudinal gradient and its implications to diversification of an Atlantic Forest (AF) endemic passerine. We studied the intraspecific diversification and historical demogra- phy of Sclerurus scansor, based on mitochondrial (ND2, ND3 and cytb) and nuclear (FIB7) gene sequences. Phylogenetic analyses recovered three well-supported clades associated with distinct latitudinal zones. Coalescent-based methods were applied to estimate divergence times and changes in effective population sizes. Estimates of divergence times indicate that intraspecific diversification took place during Middle–Late Pleisto- cene. Distinct demographic scenarios were identified, with the southern lineage exhibiting a clear signature of demographic expansion, while the central one remained more stable. The northern lineage, contrasting with LGH predictions, exhibited a clear sign of a recent bottleneck. Our results suggest that different AF regions reacted distinctly, even in opposite ways, under the same climatic period, producing simulta- neously favourable scenarios for isolation and contact among populations. Keywords: biogeography, historical demograhy, Neotropical Region, phylogeography, Sclerurus scansor Received 29 October 2010; revision received 30 January 2011; accepted 6 February 2011 Introduction The marked increase in biodiversity from regions of high to low latitudes is well documented across distinct taxonomic levels and constitutes a widely recognized biogeographical pattern (Fischer 1960; Simpson 1964; Stelli et al. 1969; Willig et al. 2003). While its underlying processes have intrigued ecologists, systematists and bi- ogeographers worldwide, few historically based hypoth- eses have been proposed to explain its origin (see Brown & Lomolino 1998). One such example is the notion that the latitudinal biodiversity gradient may reflect the dis- tinct influence of Pleistocene glacial–interglacial cycles in geographic space (Fischer 1960, Hewitt 2004). Pleistocene climate change strongly affected environ- mental ranges throughout the world (Pielou 1991; He- witt 2000). The effects of this dynamic are reflected in a diverse group of organisms, especially at higher lati- tudes, where postglacial expansion is usually consid- ered primarily responsible for current genetic diversity patterns (Hewitt 1996, 1999, 2000, 2004). Like their tem- perate counterparts, tropical habitats also expanded to higher latitudes since the last glacial period (Behling 1995; Behling & Negrelle 2001; Bauermann 2003; Carnaval & Moritz 2008). Thus, it is expected that Correspondence: Fernando Mendonc ¸a d’Horta, Fax: +55 +11 30917553; E-mail: [email protected] Ó 2011 Blackwell Publishing Ltd Molecular Ecology (2011) 20, 1923–1935 doi: 10.1111/j.1365-294X.2011.05063.x
Transcript of The genetic effects of Late Quaternary climatic changes over a tropical latitudinal gradient:...

Molecular Ecology (2011) 20, 1923–1935 doi: 10.1111/j.1365-294X.2011.05063.x
The genetic effects of Late Quaternary climatic changesover a tropical latitudinal gradient: diversification of anAtlantic Forest passerine
FERNANDO M. D’HORTA,* GUSTAVO S. CABANNE,*† DIOGO MEYER* and
CRISTINA Y. MIYAKI*
*Departamento de Genetica e Biologia Evolutiva, Instituto de Biociencias, Universidade de Sao Paulo, Rua do Matao 277,
05508-090 Sao Paulo, SP, Brazil, †Division de Ornitologıa, Museo Argentino de Ciencias Naturales ‘‘Bernardino Rivadavia’’,
Angel Gallardo 470, Ciudad de Buenos Aires (C1405DJR), Argentina
Corresponde
Fax: +55 +11
� 2011 Black
Abstract
The increase in biodiversity from high to low latitudes is a widely recognized
biogeographical pattern. According to the latitudinal gradient hypothesis (LGH), this
pattern was shaped by differential effects of Late Quaternary climatic changes across a
latitudinal gradient. Here, we evaluate the effects of climatic changes across a tropical
latitudinal gradient and its implications to diversification of an Atlantic Forest (AF)
endemic passerine. We studied the intraspecific diversification and historical demogra-
phy of Sclerurus scansor, based on mitochondrial (ND2, ND3 and cytb) and nuclear (FIB7)
gene sequences. Phylogenetic analyses recovered three well-supported clades associated
with distinct latitudinal zones. Coalescent-based methods were applied to estimate
divergence times and changes in effective population sizes. Estimates of divergence
times indicate that intraspecific diversification took place during Middle–Late Pleisto-
cene. Distinct demographic scenarios were identified, with the southern lineage
exhibiting a clear signature of demographic expansion, while the central one remained
more stable. The northern lineage, contrasting with LGH predictions, exhibited a clear
sign of a recent bottleneck. Our results suggest that different AF regions reacted
distinctly, even in opposite ways, under the same climatic period, producing simulta-
neously favourable scenarios for isolation and contact among populations.
Keywords: biogeography, historical demograhy, Neotropical Region, phylogeography, Sclerurus
scansor
Received 29 October 2010; revision received 30 January 2011; accepted 6 February 2011
Introduction
The marked increase in biodiversity from regions of
high to low latitudes is well documented across distinct
taxonomic levels and constitutes a widely recognized
biogeographical pattern (Fischer 1960; Simpson 1964;
Stelli et al. 1969; Willig et al. 2003). While its underlying
processes have intrigued ecologists, systematists and bi-
ogeographers worldwide, few historically based hypoth-
eses have been proposed to explain its origin (see Brown
& Lomolino 1998). One such example is the notion that
nce: Fernando Mendonca d’Horta,
30917553; E-mail: [email protected]
well Publishing Ltd
the latitudinal biodiversity gradient may reflect the dis-
tinct influence of Pleistocene glacial–interglacial cycles in
geographic space (Fischer 1960, Hewitt 2004).
Pleistocene climate change strongly affected environ-
mental ranges throughout the world (Pielou 1991; He-
witt 2000). The effects of this dynamic are reflected in a
diverse group of organisms, especially at higher lati-
tudes, where postglacial expansion is usually consid-
ered primarily responsible for current genetic diversity
patterns (Hewitt 1996, 1999, 2000, 2004). Like their tem-
perate counterparts, tropical habitats also expanded to
higher latitudes since the last glacial period (Behling
1995; Behling & Negrelle 2001; Bauermann 2003;
Carnaval & Moritz 2008). Thus, it is expected that

1924 F . M. D’HORTA ET AL.
within-population genetic diversity, as well as the
degree of genetic structure, should decrease from low
to high latitudes, along a tropical latitudinal gradient
(Miller et al. 2010).
The genetic effects of the glacial ⁄ interglacial periods
across the latitudinal gradient have been studied at
multiple geographic scales. Based on analysis of a
diverse group of vertebrates, Lessa et al. (2003)
observed different demographic histories across regions
at different latitudes in North America and the Ama-
zon. Taxa from North America exhibited clear signa-
tures of recent population expansion, while species
from the Amazon forest were apparently stable since
the end of the Pleistocene. A similar scenario was
observed by Pinho et al. (2007) in a more restricted geo-
graphic scale. An analysis of the effects of climatic
changes in closely related taxa (species of Podarcis liz-
ards) through the Iberian Peninsula and North Africa
indicated higher stability at lower latitudes, evidenced
by the greater genetic structure and diversity.
Carnaval et al. (2009) also showed similar findings,
working within the tropics. In their study with Atlantic
Forest (AF) amphibians, they reported higher levels of
genetic diversity and structure at low (central AF) than
at high latitudes (southern AF), corroborating paleoen-
vironmental inferences for this region (Carnaval &
Moritz 2008).
The hypothesis about the effects of climatic cycles
across the latitudinal gradient (latitudinal gradient
hypothesis – LGH) makes explicit predictions, also
applicable to the tropics: (i) populations from higher lat-
itudes experienced more pronounced changes in their
effective population sizes and therefore exhibit signa-
tures of recent demographic expansion and a lower
genetic structure; (ii) populations from lower latitudes
experienced smaller or no changes in effective sizes,
thus presenting high diversity and genetic structure.
Although the LGH makes explicit and testable predic-
tions at the population level, few studies have explicitly
tested it in a strictly tropical latitudinal gradient. Here,
we investigate the influences of the differential dynam-
ics of the environment throughout a tropical latitudinal
gradient on the genetic diversification and historical
demography of Sclerurus scansor (Menetries 1835).
Sclerurus scansor is a polytypic species formed by two
subspecies: Sclerurus scansor scansor (Menetries 1835)
that ranges from the southern limits of the AF to the
southern region of the state of Bahia and Sclerurus scan-
sor cearensis (Snethlage 1924) that restricts to the interior
of forest relicts of northeastern Brazil. This strictly forest
passerine is endemic to the AF region (Stotz et al. 1996).
Two reasons make it a powerful model for studying AF
biogeography. First, S. scansor is highly sensitive to
environmental changes, such as those caused by forest
fragmentation (Stotz et al. 1996; Hansbauer et al.
2008a,b). Second, it is distributed throughout the AF,
ranging from lat 3� to 32�S.
As stressed by Pinho et al. (2007), studies with closely
related taxa make the inferences simpler and straight-
forward, because ecological requirements, dispersal
ability and important quantitative information needed
to obtain estimates of demographic parameters (e.g.
mutational rate and generation time) can be assumed to
be similar for the entire range, without adding signifi-
cant noise to the analysis. Conversely, the analysis of a
single biogeographical entity (the AF) to test the predic-
tions associated with the LGH makes the inferences and
interpretation of the results more robust, because its
distribution is defined by the same general limits of
environmental conditions (e.g. soil, temperature and
precipitation).
In this study, we test the LGH predictions for AF
region based on the phylogeographic and demographic
history of S. scansor and analyse the hypothesis pro-
posed to explain the origin of current biogeographical
patterns of the AF.
Methods
Samples and markers
Tissue samples were obtained from the following collec-
tions: (i) Laboratorio de Genetica e Evolucao Molecular
de Aves (LGEMA), Sao Paulo, Brazil; (ii) Field Museum
of Natural History (FMNH), Chicago, USA; (iii) Louisi-
ana State University Museum of Natural Sciences
(LSUMNS), Baton Rouge, USA; and (iv) Laboratorio de
Biodiversidade e Evolucao Molecular, Universidade
Federal de Minas Gerais (UFMG), Belo Horizonte, Bra-
zil (Appendix S1, Supporting information).
Analyses were based on two data sets. Data set A:
NADH dehydrogenase subunit 2 (ND2) sequences
(1041 bp) from 85 samples, extracted from muscle and
blood tissues. This data set was used to analyse the
phylogeographic structure of Sclerurus scansor. This
analysis was carried out using Sclerurus albigularis (the
sister species of S. scansor) and Sclerurus mexicanus as
outgroups, based on a Sclerurus molecular phylogeny
(d’Horta 2009). Data set B: Based on the initial explor-
atory analysis (data set A), we sampled a subset of indi-
viduals that include all main geographic regions. For 48
individuals, we sequenced 1025 bp of cytochrome b
(cytb) and 345 bp of NADH dehydrogenase subunit 3
(ND3), and for 44 individuals, we sequenced 954 bp of
a nuclear locus and b-fibrinogen intron 7 (Fib7). Proce-
dures of DNA extraction, purification and sequencing
are described on Appendix S2 (Supporting informa-
tion).
� 2011 Blackwell Publishing Ltd

D IVERSIFICATION ACROSS ATLANTIC FOREST 1925
Data analyses, neutrality tests and recombination (datasets A and B)
Sequences of ND2 (data sets A and B), ND3, cyt b and
Fib7 (data set B) were used to perform phylogeographic
and demographic analyses. Sequences were compared
and edited using the program CodonCode Aligner
(CodonCode Corporation), and the alignment was per-
formed with Clustal X (Thompson et al. 1997) and then
manually checked.
Heterozygous nucleotide positions were identified by
double peaks in the electropherograms, in the case of
the nuclear locus. We used a Bayesian approach imple-
mented in the program PHASE 2.0 (Stephens et al. 2001;
Stephens & Donnelly 2003) to identify haplotypes of
Fib7. Heterozygous indels were not found. To test the
hypothesis of neutrality in mtDNA, the MacDonald and
Kreitman test (MK test – MacDonald & Kreitman 1991)
was applied, considering the sister species of S. scansor,
S. albigularis, as outgroup (d’Horta 2009). This test was
applied to the entire species distribution and also to
each lineage. To evaluate the existence of recombination
on Fib7, we applied the phi test, performed in the SPLIT-
STREE4.10 program (Huson & Bryant 2006). We chose
this test because of its sensitivity to recombination
events and its power to distinguish recombination
events from homoplasies (Bruen et al. 2006).
Haplotype identification and phylogenetic analyses(data sets A and B)
We used the NETWORK 4.5.0.0. software (http://www.fluxus-
technology.com) to identify ND2 and FIB7 haplotypes
and to obtain a network with the median joining method
(Bandelt et al. 1999).
The phylogenetic analyses were performed for
mtDNA (data sets A and B), using two methods, maxi-
mum-likelihood estimation (ML) and Bayesian analysis
(BA). To select the simplest model of molecular evolu-
tion with the highest likelihood for the data, we applied
a likelihood-ratio test (LRT) performed by the MODEL-
TEST program (Posada & Crandall 1998). The selected
model parameters were used for the ML analysis imple-
mented on PHYML program 2.4.4 (Guindon & Gascuel
2003). The robustness of the ML tree nodes was deter-
mined by 500 bootstrap replications.
The BA, with Markov chain Monte Carlo (MCMC)
sampling, was implemented with MrBayes 3.1 (Ron-
quist & Huelsenbeck 2003), considering the partitions of
the data set applying the partitioned likelihood method
(one partition per gene). Parameters were indepen-
dently estimated for each data partition (nst = 6;
rates = invgamma). Two independent analyses were
performed, each with 106 generations, sampling every
� 2011 Blackwell Publishing Ltd
1000 generations and with a burn-in of 20%,
determined by the convergence time of the likelihood
values. The posterior probability values of each node
were calculated by combining all sampled trees in a
consensus.
Population level analyses (data set B)
Broader population groups used for analysis of diver-
gence times (IMa) and historical demography (LAM-
ARC and neutrality tests) were defined based on
geographic criteria and corroborated by the analysis of
data set A (see Results).
Divergence times. Estimation of divergence times (t)
between pairs of S. scansor lineages (southern, central
and northern lineages; Fig. 3) were obtained applying
the isolation–migration model (Nielsen & Wakeley 2001;
Hey & Nielsen 2004), implemented by IMa program
(ver. 17 December 2009). Based on a coalescent and
MCMC method, IMa calculates the distribution of pos-
terior probability values of parameters considered in
the model (Nielsen & Wakeley 2001; Hey & Nielsen
2004). The effective population size was estimated for
current populations (h1 and h2) and the ancestral popu-
lation (ha). To obtain the divergence time estimates
between lineages, we set migration rates (m1 and m2) to
0. To define the priors, initial runs were carried out, fol-
lowed by five posterior runs, for each pair of popula-
tions, using distinct seed values, to verify the
convergence of parameter estimates. For each analysis,
a burn-in of 500 000 steps was applied, and they were
finished with at least 50 000 000 steps in the chain after
the burn-in stage and a minimum effective sample size
value of 150. To obtain the divergence time in years, we
considered t = t ⁄ u (Hey & Nielsen 2004), where t is esti-
mated by IMa and u is the geometric mean of muta-
tional rates (per year) of mitochondrial genes (cyt b,
ND2 and ND3) and Fib7. To calculate the u value, we
assumed a divergence of 2.1% per million of years for
mtDNA genes (Wier & Schluter 2007) and 0.72% for
Fib7 (Axelsson et al. 2004). All analyses were performed
using Hasegawa-Kishino-Yano (HKY – Hasegawa et al.
1985) evolutionary model.
Population expansion ⁄ decline. Tajima’s D (Tajima 1989),
Fu’s Fs test (Fu 1997) and R2 (Ramos-Onsins & Rozas
2002) were used to test the scenarios of population
expansion. The significance of the tests was determined
based on 10 000 coalescent simulations, which assumed
neutrality and equilibrium conditions. These analyses
were performed with DnaSP 4.10.9 program (Rozas et al.
2003). These three test statistics were selected because of
their power to detect population expansion scenarios in

1926 F . M. D’HORTA ET AL.
specific sampling conditions and population expansion
rate, time since the expansion, sample size and number
of segregation sites (Ramos-Onsins & Rozas 2002).
In addition to the tests with summary statistics, we
estimated genetic diversity levels (h) and exponential
population growth rates (g) using the LAMARC pro-
gram (Kuhner 2006). LAMARC calculates the likelihood
surface for h and g, allowing one to find values that
maximize the probability of originating data. These
parameters (h and g) were estimated for the three main
phylogeographic lineages identified in S. scansor, fixing
the migration rate to 0. For the LAMARC analyses, five
replicates of 10 short chains each (500 genealogies sam-
pled each 50 interactions and a burn-in of 1000 genealo-
gies) and two long chains (20 000 genealogies sampled
each 50 interactions and a burn-in of 1000 genealogies)
were performed. Because of the failure of the phi test in
rejecting the null hypothesis of nonrecombination, the
parameter r (recombination) was not considered for the
LAMARC analyses.
Results
Sequence variability
In data set A (1041 bp of ND2; n = 85), we identified 53
variable and 41 parsimony-informative sites. In data set
B for the mtDNA (total of 2432 bp, been 345 bp of ND3,
1041 bp of ND2 and 1046 bp of cytb; n = 48), we identi-
fied 93 (five for ND3, 49 for ND2 and 39 for cytb) vari-
able and 69 (three for ND3, 39 for ND2 and 27 for cytb)
parsimony-informative sites, and for the nuclear locus
(Fib7) in 954 bp (n = 44), we found 10 (1.05%) variable
sites, of which 9 (0.94%) were parsimony informative.
The results of MK test were nonsignificant (P > 0.1) for
2 steps
2 steps 8 steps
4 steps
11 steps
(b(a)
Fig. 1 Median joining networks based on (a) 1041 bp of ND2 (data
Lineage distribution, represented in black (SS), gray (SC) and light gr
all analyses (both treating Sclerurus scansor as a single
taxon and treating each phylogeographic lineage sepa-
rately). The phi test did not reject the null hypothesis of
nonrecombination for Fib7 (P > 0.1).
Twenty-five haplotypes were identified for the ND2
gene (data set A: 1041 bp, n = 85), while 30 were diag-
nosed for Fib7 (data set B: 954 bp, n = 44). The ND2 net-
work showed a strong geographic association of
haplotype groups (Figs 1a and 2). Three main groups
were identified, representing the northern (SN), central
(SC) and southern (SS) lineages. On the other hand, the
Fib7 network showed extensive sharing of haplotypes
between SC and SS. The SN lineage was the only one which
did not share haplotypes with other groups (Fig. 1b).
Nucleotide diversity (p) and haplotype diversity (H)
were low for all phylogeographic lineages (Table 1).
Lineage SC showed the highest values of p and H for
mtDNA (data set A and data set B; 0.0043 and 0.731 for
ND2; 0.0035 and 0.908 for concatenated mtDNA, respec-
tively). SS exhibited the lowest p and H values for
mtDNA (0.00116 and 0.706 for ND2; and 0.00118 and
0.808 for mtDNA concatenated). SN (cearensis) exhibited
intermediate values of p and H (0.002 and 0.630 for ND2;
0.0021 and 0.0846 for mtDNA concatenated). Among the
three groups analysed for Fib7, SN exhibited the lowest pand H values (0.00061 and 0.499, respectively), while the
SC the highest ones (0.0049 and 0.948), which can be
explained by the wide sharing of haplotypes observed
between the SS and SC lineages (Fig. 1b).
Evolutionary relationships, distribution and contactamong phylogeographic lineages
Three well-supported clades were identified for S. scan-
sor, based on mtDNA (data set B): (i) SS, which is
2 steps3 steps
10 steps
2 steps2 steps
2 steps)
set A) and (b) 884 bp of Fib7 (data set B) of Sclerurus scansor.
ay (SN) circles.
� 2011 Blackwell Publishing Ltd

D IVERSIFICATION ACROSS ATLANTIC FOREST 1927
distributed from the southern limit of the species’
occurrence to the central portion of Sao Paulo state; (ii)
SC, which ranges from the central portion of Sao Paulo
state, where it occurs in sympatry with SS, until south-
ern Bahia; (iii) SN, which occurs associated with forest
enclaves from the interior of the Caatinga, apparently
totally isolated from the SS and SC (Fig. 2). The rela-
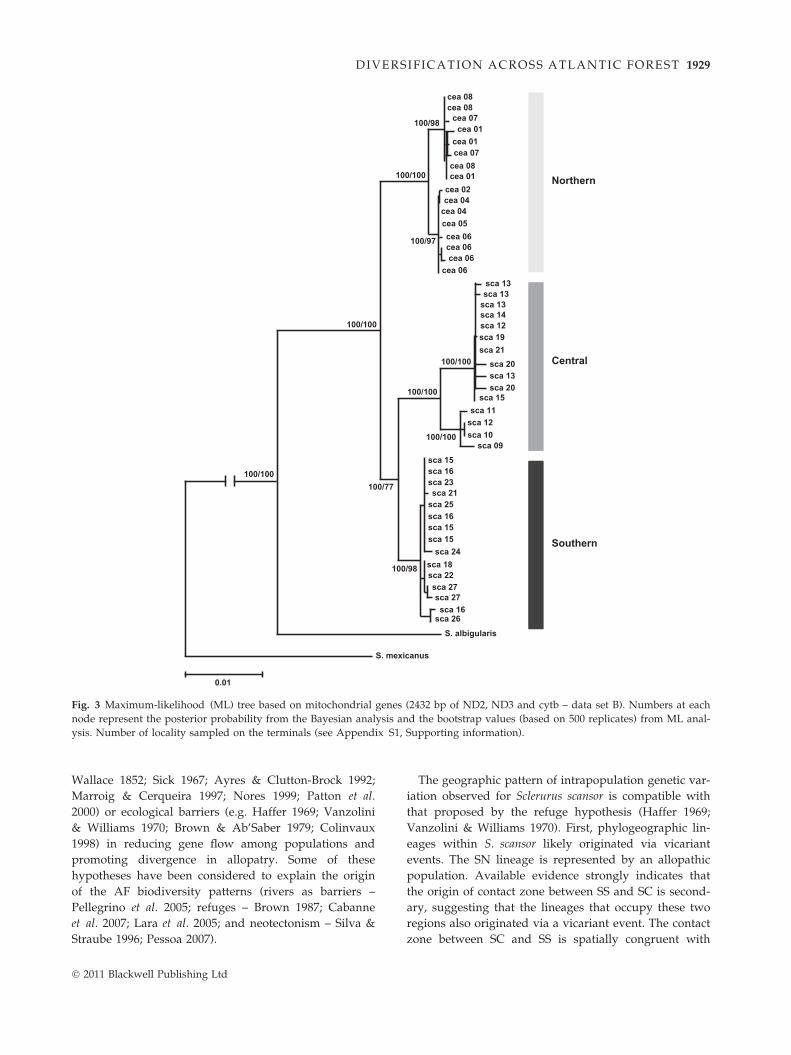
tionships among populations suggest a first split
between SN (cearensis) and the two southernmost clades
(SS and SC) followed by the split between SS and SC
(bootstrap of 77 and posterior probability of 100)
(Fig. 3).
For two lineages, SC and SN, two phylogeographic
subgroups were identified. In SN, we found two mito-
chondrial lineages that correspond to the two haplotype
clusters in the network (Fig. 1a), which comprise the
samples from the western SN range (Serra de Ibiapaba,
Serra das Almas and Chapada do Araripe) and the
samples from eastern SN range (Serra de Maranguape,
Serra de Baturite and Serra do Machado) (Figs 2 and
4). These results suggest that the contact within the
eastern as well as within western forest relicts was
more frequent and recent than between these two
groups. In SC, two lineages were also identified, one
comprising the samples lying north and the other, those
lying south of the Doce river region (Figs 2 and 4).
Among the main phylogeographic lineages of S. scan-
sor, contact is observed only between the SS and SC. Of
the total of 18 localities sampled SC and SS, only three
1 32
4567
8
9
1011
1213
2122
2324
2625
27
20
191814
171615
Fig. 2 Sample localities of Sclerurus scansor. Different circle colours re
SC and bright gray SN. The inset map depicts the zone of sympatry b
SS and SC lineages are reported. Dotted lines mark the position of the
� 2011 Blackwell Publishing Ltd
(those in the region of upper Tiete and Paraıba do Sul
rivers, see discussion) showed evidence of sympatry
between these lineages. The current distribution of
S. scansor scansor (SS and SC), as well as Sclerurus scan-
sor cearensis (SN), suggests a complete genetic isolation.
Population analyses
Our analysis of data set A showed a strong congruence
between geographic regions and clade membership.
The only exception to this patter was found for three
localities in the region of contact between SS and SC,
where haplotypes from different lineages are found in
sympatry. We argue that this contact zone arises as a
consequence of secondary contact (see Discussion) and
therefore that treating lineages as populations is justi-
fied. Our estimates of population expansion and diver-
gence times were thus applied on these lineages and
assumed zero migration rates.
Divergence times. The analysis of divergence times
between intraspecific lineages resulted in values that
point to a relatively recent process of intraspecific diver-
sification, with events of cladogenesis concentrated on
Middle and Late Pleistocene (Fig. 4 and Table 2).
Divergence times estimated by IMa (data set B – mito-
chondrial and nuclear markers), as well as the topology
based on mitochondrial genes, suggest a first event of
cladogenesis originating SN (cearensis) and the SC + SS
1419
21
15
13
16
2023
17
present the three main mitochondrial lineages. In black SS, gray
etween SS and SC. Black ⁄ gray circles show the localities where
brakes among internal phylogeographic units in SC and SN.

Table 1 Diversity values and the results of statistical tests to ND2; concatenated mtDNA (cytb, ND2 and ND3); and Fib 7
Lineages Taxa Gene N
Diversity Tests
p H D Fs R2
Southern Sclerurus scansor scansor ND2 30 0.00116 0.706 )1.6441 ns )7.300 ** 0.0571**
Mit 15 0.00118 0.808 )0.7652 ns )1.267 ns 0.1120 ns
Fib7 14 0.00350 0.791 )0.3216 ns )6.528* 0.1159 ns
Central S. scansor scansor ND2 19 0.00433 0.731 )0.5047 ns )0.588 ns 0.1090 ns
Mit 16 0.00350 0.908 )0.3645 ns )1.350 ns 0.1149 ns
Fib7 13 0.00490 0.948 )0.5230 ns )13.366 ** 0.1002 ns
Northern Sclerurus scansor cearensis ND2 36 0.00205 0.630 0.6128 ns 1.198 ns 0.1456 ns
Mit 17 0.00210 0.846 0.4534 ns 0.016 ns 0.1464 ns
Fib7 17 0.00061 0.499 1.5592 ns 1.711 ns 0.2496 ns
Total Sclerurus scansor ND2 85 0.01241 0.871 0.5944 ns )0.543 ns 0.1154 ns
Mit 48 0.01042 0.941 1.2173 ns 0.904 ns 0.1472 ns
Fib7 44 0.00403 0.875 )0.4057 ns )22.043** 0.0836 ns
N, number of sequences; p, nucleotide diversity; H, haplotypic diversity; D, Tajima’s D (1989); Fs, Fu (1997); R2, (Ramos-Onsins &
Rozas 2002).
ns, nonsignificant (P > 0.05); *Significant (P < 0.05); **Significant (P < 0.01).
1928 F . M. D’HORTA ET AL.
(scansor) lineages. A second event, near the end of the
Pleistocene, originated the SS and SC (Table 2). The
divergence time between SS and SC was estimated to
be approximately 0.06 Ma (CI 90%: 0.04–0.09 Ma).
Divergence times between SS and SN, and SC and SN
were estimated to be approximately 0.54 (CI 90%:
0.32–0.76 Ma) and 0.24 Ma (CI 90%: 0.06–0.39 Ma),
respectively.
Historical demography. The results of Tajima’s D test
were nonsignificant for all populations, thus not reject-
ing the hypothesis that they are in equilibrium. Fs, on
the other hand, showed that for SS, both ND2 (30 indi-
viduals) and Fib7 (12 individuals) had negative and sig-
nificant values, supporting the hypothesis of population
expansion. The R2 values for this same lineage also
point to the same scenario (when ND2 was used). The
data for the SC lineage showed that only the Fs for Fib7
resulted in significant values. Conversely, none of the
tests applied to the SN lineage resulted in significant
values, indicating demographic stability (Table 1).
Although Tajima’s D is relatively sensitive to demo-
graphic expansion, the simulations performed by
Ramos-Onsins & Rozas (2002) showed that it tends to
have less power than Fs (Fu 1997) and R2 (Ramos-On-
sins & Rozas 2002) in scenarios where time since expan-
sion is high and ⁄ or the sample size and ⁄ or the growth
rate are low.
The demographic analyses for the three main lin-
eages of S. scansor, based on genealogy sampling using
LAMARC, are partially congruent with the results
obtained using the tests based on summary statistics.
Concerning diversity levels, SS presented the lowest
values, much lower than those observed for SC and
SN, compatible with the scenario of deep changes in
forest distribution at higher latitude regions. On the
other hand, the estimates of exponential population
expansion rate (g) showed markedly different results
for the three lineages. For SS, the values indicate
recent population expansion, with a point value of
g = 4314.370 and the lower and upper limits of the
confidence interval indicating positive values (CI 95%:
3711.105–4698.091). Although the SC lineage exhibits
positive g values (g = 613.0905; CI 95%: 180.2021–
951.3234), they are much closer to 0 than those
obtained for SS (Fig. 5). Because of the tendency of g
to be shifted towards positive values, especially when
one or few markers are used (Kuhner et al. 1998;
Kuhner 2006), it is not possible to completely discard
the scenario of stability for SC. On the other hand, SN
(S. s. cearensis) exhibits g values that indicate a com-
pletely different demographic condition than the
observed for the other lineages. The values for the SN
(g = )1793.549, CI 95%: )4472.767 to )184.0114) are
compatible with a scenario of a population bottleneck
(Fig. 5), mainly if we consider the tendency for LAM-
ARC to overestimate g values.
Discussion
Hypothesis of vicariant events
Many vicariant hypotheses have been proposed to
explain the origin of the recurrent patterns of distribu-
tion of lineages ⁄ taxa in the Neotropical forests. These
hypothesis are based on the role of physiographic (e.g.
� 2011 Blackwell Publishing Ltd
Northern
cea 08cea 08
cea 08
cea 07
cea 07
cea 01
cea 01cea 02cea 04
cea 04cea 05cea 06cea 06cea 06
cea 06sca 13sca 13
sca 13sca 14sca 12
sca 12sca 10
sca 09
sca 19sca 21
sca 21sca 25
sca 20
sca 20sca 13
sca 15sca 11
sca 15
sca 15sca 15
sca 24sca 18sca 22sca 27sca 27
sca 16sca 26
S. albigularis
S. mexicanus
0.01
100/100100/77
100/97
100/98
100/98
100/100
100/100
100/100
100/100
100/100
sca 16
sca 16
sca 23
cea 01
Central
Southern
Fig. 3 Maximum-likelihood (ML) tree based on mitochondrial genes (2432 bp of ND2, ND3 and cytb – data set B). Numbers at each
node represent the posterior probability from the Bayesian analysis and the bootstrap values (based on 500 replicates) from ML anal-
ysis. Number of locality sampled on the terminals (see Appendix S1, Supporting information).
D IVERSIFICATION ACROSS ATLANTIC FOREST 1929
Wallace 1852; Sick 1967; Ayres & Clutton-Brock 1992;
Marroig & Cerqueira 1997; Nores 1999; Patton et al.
2000) or ecological barriers (e.g. Haffer 1969; Vanzolini
& Williams 1970; Brown & Ab’Saber 1979; Colinvaux
1998) in reducing gene flow among populations and
promoting divergence in allopatry. Some of these
hypotheses have been considered to explain the origin
of the AF biodiversity patterns (rivers as barriers –
Pellegrino et al. 2005; refuges – Brown 1987; Cabanne
et al. 2007; Lara et al. 2005; and neotectonism – Silva &
Straube 1996; Pessoa 2007).
� 2011 Blackwell Publishing Ltd
The geographic pattern of intrapopulation genetic var-
iation observed for Sclerurus scansor is compatible with
that proposed by the refuge hypothesis (Haffer 1969;
Vanzolini & Williams 1970). First, phylogeographic lin-
eages within S. scansor likely originated via vicariant
events. The SN lineage is represented by an allopathic
population. Available evidence strongly indicates that
the origin of contact zone between SS and SC is second-
ary, suggesting that the lineages that occupy these two
regions also originated via a vicariant event. The contact
zone between SC and SS is spatially congruent with

0
0.50
1.00
1.50
2.00
2.50
3.00
0 0.05 0.10 0.15 0.20 0.25
0
0.10
0.20
0.30
0.40
0 0.20 0.40 0.60 0.80 1.00 1.20
0
0.10
0.20
0.30
0.40
0.50
0 0.20 0.40 0.60 0.80 1.00
Ma
Ma
Ma
Prob
ability
Prob
ability
Prob
ability
Southern×
Central
Southern×
Northern
Central×
Northern
(a)
(b)
(c)
Fig. 4 Probability distributions of divergence times (million
years ago), estimated by IMa, between lineages pairs of Scleru-
rus scansor, based on mitochondrial genes and Fib7 (data set
B).
1930 F . M. D’HORTA ET AL.
those documented between phylogeographic lineages of
amphibians (Carnaval et al. 2009), birds (Xiphorhynchus
fuscus, Cabanne et al. 2007; and Conopophaga lineata,
Pessoa 2007), as well as between morphologically differ-
entiated populations of birds (Lepidocolaptes squammatus,
Silva & Straube 1996; and Heliobletus contaminatus, Silva
& Stotz 1992). This pattern of a common contact region
can be interpreted as evidence of a common vicariant
event (Cracraft 1985; Cracraft & Prum 1988).
Second, the S. scansor phylogeographic lineages pre-
sented, in different degrees, signatures of changes in
their effective population size, which is expected in a
refuge scenario. Finally, the estimates of the divergence
time between phylogeographic lineages point to events
during Middle and Late Pleistocene, a period for which
there are extensive records documenting changes in
forest distribution associated with climatic cycles
(Riccomini 1989; Behling 1995, 1997, 2002; Ledru et al.
1996, 2005; Behling & Lichte 1997; Behling & Negrelle
2001; Cruz et al. 2005; Carnaval & Moritz 2008). We
also noticed that the geographic distribution of the lin-
eages is congruent with what is expected according to
the mountain refuges hypothesis (Moreau 1966; Lara
et al. 2005). Based on the mountain refuge hypothesis,
during drier periods, forest formations were more likely
to occur in mountain areas, because of the higher plu-
viometric level resulting from the orographic effect.
Such phenomenon is currently observed in the north-
eastern region of Brazil, where the occurrence of humid
forests is strictly associated with areas of mountain
ridges.
The hypothesis of rivers as primary barriers (Pellegri-
no et al. 2005) is not supported owing to the very recent
origin of the phylogeographic lineages observed for
S. scansor, as well as for other avian species (Pessoa
2007; Cabanne et al. 2008). However, these rivers can
play an important role as a secondary barrier to disper-
sion, decreasing the migration between populations, or
even completely isolating them. Silva & Straube (1996)
propose that the tectonic activity associated with the
Paraıba valley would have caused the isolation of the
populations distributed in the north and south of this
region. Although the location of the phylogeographic
rupture between the SS and SC is relatively congruent
with this notion, the divergence time between them is
much more recent (Middle ⁄ Late Pleistocene, Table 2)
than the periods of higher tectonic activity in the
region, dated between the Miocene–Pliocene (about
15 Ma) and the Lower Pleistocene (about 1 Ma) (Petri &
Fulfaro 1983). Although there is evidence of recent tec-
tonic movements during the Pleistocene and Holocene
(Riccomini 1989), it would be necessary to admit that
these movements caused landscape changes capable of
imposing restrictions to gene flow between lineages SS
and SC for a long period of time. On the other hand,
analysing the deposition of Cenozoic sediments that fill
the basins of the Continental Rift of southeastern Brazil,
Riccomini (1989) recognized the effects of climatic
cycles on erosion dynamics: increased erosion happened
during drier climates, when vegetation cover was less
dense (savannas), and decreased erosion during wetter
climates, when vegetation covering was more dense
(forest), which is compatible with refugia predictions.
Latitudinal gradient and demographic history
The importance of the differential effects of glaciations
across latitudinal gradients, as well as their influence
on the determination of current biodiversity patterns, is
among the major subjects of Biogeography (Hewitt
1996, 2001; Brown & Lomolino 1998; Willig et al. 2003;
� 2011 Blackwell Publishing Ltd

Table 2 Estimates of divergence times (million years ago)
between pairs of phylogeographic lineages of Sclerurus scansor
Lineages
Divergence time (Ma)
Minimum
(CI 90%)
Point
estimates
Maximum
(CI 90%)
SS vs. SC 0.04 0.06 0.09
SS vs. SN 0.32 0.54 0.76
SC vs. SN 0.06 0.24 0.39
CI, confidence interval.
D IVERSIFICATION ACROSS ATLANTIC FOREST 1931
Wier & Schluter 2007; Marshall et al. 2008). The latitudi-
nal gradient has an important influence on the intensity
of vicariant events, genetic diversity and demography,
as demonstrated by Pinho et al. (2007) and Lessa et al.
(2003). The description of patterns of genetic diversity
and demographic history of populations across a tropi-
cal latitudinal gradient helps us to understand the dif-
ferential effects of glacial cycles over the landscape and
its importance in the origin of biodiversity patterns
observed in these regions.
The geographic pattern of genetic diversity exhibited
by lineages of S. scansor contrasts with the expectations
of the LGH for the tropics. Although SS presents the
lowest values of nucleotide and haplotype diversity for
mtDNA, the values for SC, and not for SN, were the
highest (Table 1). In the same way, the diversity values
0°
10°
20°
30°
5°
15°
25°
35°
–5000 –4000 –3000 –2000 –1000 0
–1793(–4472/–184)
g
Fig. 5 Estimated values of population growth rate (g) (CI 95%) of the
on mitochondrial genes and Fib7 (Data set B). Over the latitudinal a
represent the distribution of g values estimated for each lineage. Lin
(SN).
� 2011 Blackwell Publishing Ltd
of Fib7 were distinct from the expected for the SN. The
values of nucleotide and haplotype diversity for SN
were lower than those of the other lineages. SS showed
intermediate values for Fib7, while the SC exhibits the
highest (Table 1).
The results from demographic analyses support the
same scenario. First of all, estimates of exponential
growth rate (g) show a clear pattern of nonoverlapping
confidence intervals (95%) among lineages (Fig. 5),
which refutes the hypothesis of a similar demographic
history related to the different latitudinal zones of AF.
The SS lineage, distributed between latitudes 23� and
32�S, shows a clear positive value of g (Fig. 5). The
results from the present study, as well as from amphibi-
ans (Carnaval et al. 2009) and other birds (Cabanne
et al. 2007; Pessoa 2007), support a model of recent pop-
ulation expansion associated with strictly forest taxa in
higher AF latitude zones.
For the SC, which occurs between 24� and 14�S, a
positive g was also found. Although the confidence
interval does not include 0, owing to the tendency of
overestimation of g values by LAMARC (Kuhner et al.
1998; Kuhner 2006), it is not possible to completely
refute the hypothesis of recent stability of the effective
size for this population. The g values as well as the
highest genetic diversity for the SC lineages are in
accordance with the results of Carnaval et al. (2009),
showing a higher stability of forest distribution in the
central portion of AF. Either way, the results obtained
1000 2000 3000 4000 5000
613(180/951)
4314(3711/4698)
Latitude
three main lineages of Sclerurus scansor (SS, SC and SN), based
xis, the amplitude of lineage ranges is shown. Horizontal bars
eages are represented in black (SS), gray (SC) and bright gray

1932 F . M. D’HORTA ET AL.
for the SS and SC lineages corroborate the general pre-
dictions of the LGH, that is, of higher demographic
instability associated with higher latitude regions,
where forest distribution suffered deep changes in func-
tion of glacial cycles.
In contrast, the SN lineage, associated with the lowest
latitude zone (between 3� and 10�S), exhibits a signature
of a population bottleneck. The recent changes in the
effective size of the SN seem to have occurred in a mark-
edly distinct way from that observed for the other popu-
lations. As the g values tend to be overestimated by
LAMARC (Kuhner et al. 1998; Kuhner 2006), the sce-
nario of population bottleneck seems to be reliable.
These results contrast with the expected by the LGH to
the tropics, where the highest stability on the effective
size of the populations would be associated with the
lower latitude regions. The observed scenario is congru-
ent with the strict forest dependency of this species, and
with its fragmented distribution, associated with humid
forests from the interior of the northeastern Brazilian
region (‘brejos de altitude’). The ‘brejos de altitude’ are
forest relicts associated with mountain ridges, amidst
the semi-arid area of the Caatinga, where the precipita-
tion levels are significantly higher (over 1200 mm ⁄ year;
Andrade-Lima 1966, 1982) than the reported for the
adjacent areas (240–900 mm, IBGE 1985, Lins 1989). The
pluviometric regime of this region seems to respond in a
distinct way to the observed for other regions of the AF
(Auler & Smart 2001; Auler et al. 2004; Wang et al.
2004), which is compatible with the results for the SN
(Sclerurus scansor cearensis) that suggest a contraction of
forest distribution in a period during which southern
forest experienced a wide expansion. A similar phenom-
enon is documented by the demographic history of other
forest organisms (Carnaval & Bates 2007).
The general results of demographic analyses are con-
gruent with the scenario inferred by Carnaval & Moritz
(2008) based on modelling of AF paleo-distribution dur-
ing the Quaternary, where southern AF was the most
unstable area and the central region the most stable.
Our results are also congruent with the general results
obtained by Miller et al. (2010), who observed that cen-
tral populations of tropical bird are more diverse than
those from the edge of their ranges, indicating a history
of higher instability in the edge than in the centre of
their distributions.
The recent history of the S. scansor lineages indicates
that the AF region, and the organisms strictly depen-
dent on it, suffered deep changes in their distribution at
higher as well as at lower latitudes, differing from the
expected by the LGH for this region. Additionally, for-
ests from lower and higher latitudes could have reacted
even in opposite ways under the same climatic period.
While the AF at higher latitudes expanded, its distribu-
tion on lower latitudes became smaller and fragmented.
Conclusions
Because of the complexity of the physiographic and
ecological features of the AF, and the intrinsic com-
plexity of the ecophysiology of the AF organisms, it
seems too simplistic to imagine that a single diversifi-
cation mechanism can explain the origin of the cur-
rent biogeographical patterns exhibited by AF species.
However, this study of phylogeography and historical
demography of S. scansor strongly supports the
important role that Late Quaternary climatic changes
had to the origin of the current biogeographical
patterns.
The expected effects of the climatic cycles over the
AF latitudinal gradient, on the other hand, were not
confirmed by our results. The intraspecific evolution-
ary history of S. scansor indicates that different regions
of AF can react in opposite ways under the same
climatic period, generating asynchronous pulses of
expansion (and coalescence) and retraction (and frag-
mentation) of habitats, producing at the same time
favourable scenarios for isolation and contact between
populations.
Acknowledgements
We are very grateful to P. E. Vanzolini, A. C. Carnaval, J.
Fjeldsa and the anonymous referees who reviewed and
improved the manuscript, and C. Ribas, G. Marroig and A.
Aleixo for their helpful comments about the first manuscript.
We are indebted to the following curators, staff and their insti-
tutions, who provided us tissue samples: J. Bates and D. Wil-
lard (FMNH) and F. Santos (UFMG). We also thank R.
Brumfield and A. Cuervo (LSUMZ) that provide us the
sequences of the sample from Paraguay and W. Silva, C. Alb-
ano and R. Pessoa for field support. This research was sup-
ported by Coordenacao de Aperfeicoamento de Pessoal de
Nıvel Superior (CAPES), Fundacao de Amparo a Pesquisa do
Estado de Sao Paulo (FAPESP) and Conselho Nacional de De-
senvolvimento Cientıfico e Tecnologico (CNPq).
References
Andrade-Lima D (1966) Esboco fitoecologico de alguns
‘‘brejos’’ de Pernambuco. Boletim Tecnico. Instituto de
Pesquisas Agronomicas de Pernambuco, 8, 3–9.
Andrade-Lima D (1982) Present-day refuges in northeastern
Brazil. In: Biological Diversification in the Tropic (ed. Prance
GT), pp. 245–251. Columbia Univ. Press, New York.
Auler AS, Smart PL (2001) Late quaternary paleoclimate in
semiarid northeastern Brazil from U-Series dating of
travertine and water-table speleothems. Quaternary Research,
55, 159–167.
� 2011 Blackwell Publishing Ltd

D IVERSIFICATION ACROSS ATLANTIC FOREST 1933
Auler AS, Wanng A, Edwards RL et al. (2004) Quaternary
ecological and geomorphic changes associated with rainfall
events in presently semi-arid northeastern Brazil. Journal of
Quaternary Science, 19, 693–701.
Axelsson E, Smith NGC, Sundstrom H, Berlin S, Ellegren H
(2004) Male-biased mutation rate and divergence in
autosomal, Z-linked and W-linked introns of chicken and
turkey. Molecular Biology and Evolution, 18, 1538–1547.
Ayres JMC, Clutton-Brock TH (1992) River boundaries and
species range size in Amazonian primates. The American
Naturalist, 140, 531–537.
Bandelt HJ, Forster P, Rohl A (1999) Median-joining networks
for inferring intraspecific phylogenies. Molecular Biology and
Evolution, 16, 37–48.
Bauermann SG (2003) Analises palinologicas e evolucao
paleovegetacional e paleoambiental das turfeiras de Barrocadas e
Aguas Claras, Planıcie Costeira do Rio Grande do Sul, Brasil.
Tese de Doutorado, Instituto de Geociencias, Universidade
Federal do Rio Grande do Sul, Porto Alegre.
Behling H (1995) Investigations into the late Pleistocene and
Holocene history of vegetation and climate in Santa Catarina
(s. Brazil). Vegetation History and Archaeobotany, 4, 127–152.
Behling H (1997) Late Quaternary vegetation, climate and fire
history from the tropical mountain region of Morro de
Itapeva, SE Brazil. Palaeogeography, Palaeoclimatology,
Palaeoecology, 129, 407–422.
Behling H (2002) South and southeast Brazilian grasslands
during Late Quaternary times: a synthesis. Palaeogeography,
Palaeoclimatology, Palaeoecology, 177, 19–27.
Behling H, Lichte M (1997) Evidence of dry and cold climatic
conditions at glacial times in tropical southeastern Brazil.
Quaternary Research, 48, 348–358.
Behling H, Negrelle RRB (2001) Tropical rain forest and
climate dynamics of the Atlantic lowland, Southern Brazil,
during the late Quaternary. Quaternary Research, 56, 383–389.
Brown K (1987) Conclusions, synthesis, and alternative
hypotheses. In: Quaternary History in Tropical Americ (eds
Whitmore TC, Prance GT), pp. 175–196. Oxford University
Press, Oxford.
Brown KS, Ab’Saber AN (1979) Ice-age forest refuges and
evolution in Neotropics: correlation of paleoclimatological,
geomorphological and pedological data with biological
endemism. Paleoclimas, 5, 1–30.
Brown JH, Lomolino MV (1998) Biogeography. Sinauer
Associates, Sunderland, Massachusetts, USA.
Bruen TC, Philippe H, Bryant D (2006) A simple and robust
statistical test for detecting the presence of recombination.
Genetics, 172, 2665–2681.
Cabanne GS, Santos F, Miyaki CY (2007) Phylogeography and
demographic history of Xiphorhynchus fuscus (Passeriformes:
Dendrocolaptidae) in the southern Atlantic forest of Brazil
and Argentina. Biological Journal of the Linnean Society, 91, 73–
84.
Cabanne GS, d’Horta FM, Sari EHR, Santos FR (2008) Nuclear
and mitochondrial phylogeography of the Atlantic forest
endemic Xiphorhynchus fuscus (Aves: Dendrocolaptidae):
biogeography and systematics implications. Molecular
Phylogenetics and Evolution, 49, 760–773.
Carnaval AC, Bates JM (2007) Amphibian DNA shows marked
genetic structure and tracks Pleistocene climate change in
northeastern Brazil. Evolution, 61, 2942–2957.
� 2011 Blackwell Publishing Ltd
Carnaval AC, Moritz C (2008) Historical climate modelling
predicts patterns of current biodiversity in the Brazilian
Atlantic forest. Journal of Biogeography, 35, 1187–1201.
Carnaval AC, Hickerson MJ, Haddad CFB, Rodrigues MT,
Moritz C (2009) Stability predicts genetic diversity in the
Brazilian Atlantic Forest Hotspot. Science, 32, 785–
789.
Colinvaux PA (1998) A new vicariance model form Amazonian
endemics. Global Ecology and Biogeography, 7, 95–96.
Cracraft J (1985) Historical biogeography and patterns of
differentiation within the South American avifauna: areas of
endemism. Ornithological Monographs, 36, 49–84.
Cracraft J, Prum RO (1988) Patterns and processes of
diversification: speciation and historical congruence in some
neotropical birds. Evolution, 42, 603–620.
Cruz FW, Burns SJ, Karmann I et al. (2005) Insolation-driven
changes in atmospheric circulation over the past
116,000 years in subtropical Brazil. Nature, 434, 63–66.
d’Horta FM (2009) Filogenia Molecular e Filogeografia de Especies
de Passeriformes (Aves): Investigando a Historia Biogeografica da
Regiao Neotropical com enfase na Floresta Atlantica. Tese de
Doutorado, Instituto de Biociencias da Universidade de Sao
Paulo, Sao Paulo.
Fischer AG (1960) Latitudinal variation in organic diversity.
Evolution, 14, 64–81.
Fu Y-X (1997) Statistical tests of neutrality against population
growth, hitchhiking and background selection. Genetics, 147,
915–925.
Guindon S, Gascuel O (2003) A simple, fast, and accurate
algorithm to estimate large phylogenies by maximum
likelihood. Systematic Biology, 52, 696–704.
Haffer J (1969) Speciation in Amazonian forest birds. Science,
165, 131–137.
Hansbauer MM, Storch I, Leu S et al. (2008a) Movements of
neotropical understory passerines affected by anthropogenic
forest edges in the Brazilian Atlantic rainforest. Biological
Conservation, 141, 728–791.
Hansbauer MM, Storch I, Pimentel RG, Metzger JP (2008b)
Comparative range use by three Atlantic Forest understory
bird species in relation to forest fragmentation. Journal of
Tropical Ecology, 24, 291–299.
Hasegawa M, Kishino H, Yano T (1985) Dating of the human-
ape splitting by a molecular clock of mitochondrial DNA.
Journal of Molecular Evolution, 22, 160–174.
Hewitt GM (1996) Some genetic consequences of the ice ages
and their role in divergence and speciation. Biological Journal
of the Linnean Society, 58, 247–266.
Hewitt GM (1999) Postglacial recolonization of the European
biota. Biological Journal of the Linnean Society, 68, 87–612.
Hewitt GM (2000) The genetic legacy of the quaternary ice
ages. Nature, 405, 907–913.
Hewitt GM (2001) Speciation, hybrid zones and
phylogeography – or seeing genes in space and time.
Molecular Ecology, 10, 537–549.
Hewitt GM (2004) Genetic consequences of climatic oscillations
in the Quaternary. Philosophical Transactions of the Royal
Society B: Biological Sciences, 359, 183–195.
Hey J, Nielsen R (2004) Multilocus methods for estimating
population sizes, migration rates and divergence time, with
applications to the divergence of Drosophila pseudoobscura
and D. persimilis. Genetics, 167, 747–760.
1934 F . M. D’HORTA ET AL.
Huson DH, Bryant D (2006) Application of Phylogenetic
Networks in Evolutionary Studies. Molecular Biology and
Evolution, 23, 254–267.
IBGE (1985) Atlas Nacional do Brasil: Regiao Nordeste. IBGE, Rio
de Janeiro, Brasil.
Kuhner MK (2006) LAMARC 2.0: maximum likelihood and
Bayesian estimation of population parameters. Bioinformatics,
22, 768–770.
Kuhner MK, Yamato J, Felsenstein J (1998) Maximum
likelihood estimation of population growth rates based on
the coalescent. Genetics, 149, 429–434.
Lara MC, Geise L, Schneider CJ (2005) Diversification of small
mammals in the Atlantic forest of Brazil: testing the
alternatives. In: Mammalian Diversification: From Chromosomes
to Phylogeography (A Celebration of the Career of James L. Patto)
(eds Lacey EA, Myers P), pp. 311–335. University of
California Press Berkeley, Los Angeles, London.
Ledru MP, Braga PIS, Soubies F et al. (1996) The last
50.000 years in the Neotropics (Southern Brazil): evolution of
vegetation and climate. Palaeogeography, Palaeoclimatology,
Palaeoecology, 123, 239–257.
Ledru MP, Rousseau DD, Cruz FW, Riccomini C, Karmann I,
Martin L (2005) Paleoclimate changes during the last
100,000 yr from record in the Brazilian Atlantic rainforest
region and interhemispheric comparison. Quaternary
Research, 64, 444–450.
Lessa EP, Cook JA, Patton JL (2003) Genetic footprints of
demographic expansion in North America, but not in
Amazonia, during the late Quaternary. Proceedings of the
National Academy of Sciences of the United States of America,
100, 10331–10334.
Lins RC (1989) As areas de excecao do agreste de Pernambuco.
Sudene, Recife.
MacDonald JH, Kreitman M (1991) Adaptive protein evolution
at the Adh locus in Drosophila. Nature, 351, 652–654.
Marroig G, Cerqueira R (1997) Plio-Pleistocene South American
history and the Amazon Lagoon hypothesis: a piece in the
puzzle of Amazonian diversification. Journal of Comparative
Biology, 2, 103–119.
Marshall CR, Schluter D, Weir J (2008) Explaining latitudinal
diversity gradients. Science, 317, 451–453.
Miller MJ, Bermingham E, Klicka J, Escalante P, Winker K
(2010) Neotropical birds show a humped distribution of
within-population genetic diversity along a latitudinal
transect. Ecology Letters, 13, 576–586.
Moreau RE (1966) The Bird Faunas of Africa and its Islands.
Academic Press, New York.
Nielsen R, Wakeley J (2001) Distinguishing Migration from
Isolation: a Markov chain Monte Carlo Approach. Genetics,
158, 885–896.
Nores M (1999) An alternative hypothesis for the origin of
Amazonian bird diversity. Journal of Biogeography, 26, 475–
485.
Patton JL, da Silva MN, Malcolm JR (2000) Mammals of the rio
Jurua and the evolutionary and ecological diversification of
Amazonia. Bulletin of the American Museum of Natural History,
244, 1–306.
Pellegrino KCM, Rodrigues MT, Waite AN, Morando M,
Yassuda YY, Sites JW (2005) Phylogeography and species
limits in the Gymnodactylus darwinii complex (Gekkonidae,
Squamata): genetic structure coincides with river systems in
the Brazilian Atlantic Forest. Biological Journal of the Linnean
Society, 85, 13–26.
Pessoa RO (2007) Sistematica e Biogeografia Historica da Famılia
Conopophagidae (Aves: Passeriformes): Especiacao nas Florestas da
America do Sul. Tese de Doutorado, Instituto de Biociencias
da Universidade de Sao Paulo, Sao Paulo.
Petri S, Fulfaro VJ (1983) Geologia do Brasil – Fanerozoico.
Editora da Universidade de Sao Paulo, Sao Paulo.
Pielou C (1991) After the Ice Age. University of Chicago Press,
Chicago.
Pinho C, Harris DJ, Ferrand N (2007) Contrasting patterns of
population subdivision and historical demography in three
western Mediterranean lizard species inferred from
mitochondrial DNA variation. Molecular Ecology, 16, 1191–
1205.
Posada D, Crandall KA (1998) MODELTEST: testing the model
of the DNA substitution. Bioinformatics, 14, 817–818.
Ramos-Onsins SE, Rozas J (2002) Statistical properties of new
neutrality tests against population growth. Molecular Biology
and Evolution, 19, 2092–2100.
Riccomini C (1989) O Rift Continental do Sudeste do Brasil. Tese
de Doutorado. Instituto de Biociencias da Universiade de
Sao Paulo, Sao Paulo.
Ronquist F, Huelsenbeck JP (2003) MrBayes 3: Bayesian
phylogenetic inference under mixed models. Bioinformatics,
19, 1572–1574.
Rozas J, Sanchez-DelBarrio JC, Messeguer X, Rozas R (2003)
DnaSP, DNA polymorphism analyses by the coalescent and
other methods. Bioinformatics, 19, 2496–2497.
Sick H (1967) Rios e enchentes na Amazonia como obstaculo
para a avifauna. Simposio sobre a Biota Amazonica. Atas do
Simposio sobre a Biota Amazonica, 5, 495–520.
Silva JMC, Stotz DF (1992) Geographical variation in Sharp-
Billed Treehunter, Heliobletus contaminatus. Bulletin of the
British Ornithologist’s Club, 112, 98–101.
Silva JMC, Straube FC (1996) Systematics and biogeography of
Scaled Woodcreepers (Aves: Dendrocolpatidae). Studies on
Neotropical Fauna and Environment, 31, 3–10.
Simpson GC (1964) Species density of North American Recent
mammals. Systematic Zoology, 13, 57–73.
Stelli FG, Douglas RG, Newell ND (1969) Generation and
maintenance of gradients in taxonomic diversity. Science, 164,
947–949.
Stephens M, Donnelly P (2003) A comparison of Bayesian
methods for haplotype reconstruction from population
genotype data. American Journal of Human Genetics, 73, 1162–
1169.
Stephens M, Smith NJ, Donnelly P (2001) A new statistical
method for haplotype reconstruction from population data.
American Journal of Human Genetics, 68, 978–989.
Stotz DF, Fitzpatrick JW, Parker III TA, Moskovits DK (1996)
Neotropical Birds: Ecology and Conservation. University of
Chicago Press, Chicago.
Tajima F (1989) Statistical method for testing the neutral
mutation hypothesis by DNA polymorphism. Genetics, 123,
585–595.
Thompson JD, Gibson TJ, Plewniak F, Jeanmougin F,
Higgins DG (1997) The Clustal–windows interface: flexible
strategies for multiple sequence alignment aided by
quality analysis tools. Nucleic Acids Research, 24, 4876–
4882.
� 2011 Blackwell Publishing Ltd

D IVERS
Vanzolini PE, Williams EE (1970) South American anoles: the
geographic differentiation and evolution of the Anolis
chrysolepis species group (Sauria; Iguanidae). Arquivos de
Zoologia (Sao Paulo), 19, 1–298.
Wallace AR (1852) On the monkeys of the Amazon. Proceedings
of the Zoological Society of London, 20, 107–110.
Wang XF, Auler AS, Edwards RL et al. (2004) Wet periods in
northeastern Brazil over the past 210 kyr linked to distant
climate anomalies. Nature, 432, 740–743.
Wier JT, Schluter D (2007) The latitudinal gradient in recent
speciation and extinction rates of birds and mammals.
Science, 315, 1574–1576.
Willig MR, Kaufman DM, Stevens RD (2003) Latitudinal
gradients of biodiversity: patterns, process, scale and
synthesis. Annual Review of Ecology, Evolution and Systematics,
34, 273–309.
This study was part of Fernando M. d’Horta’s PhD project
developed under the supervision of Cristina Y. Miyaki and
Diogo Meyer. FM d’Horta studies biogeographical patterns of
neotropical birds and their underlying historical processes,
based on genetic and morphological data. Gustavo S. Cabanne
� 2011 Blackwell Publishing Ltd
works with phylogeography and conservation of South Ameri-
can birds. Diogo Meyer is an evolutionary geneticist whose
research is focused in phylogeography, population genetics,
speciation and evolution of HLA genes. The geneticist Cristina
Y. Miyaki is interested on systematics, biogeography and
conservation of neotropical birds.
IF ICATION ACROSS ATLANTIC FOREST 1935
Supporting information
Additional supporting information may be found in the online
version of this article.
Appendix S1 Localities of analyzed samples, tissue number,
vouchers, and GenBank accession numbers.
Appendix S2 Methods.
Please note: Wiley-Blackwell are not responsible for the content
or functionality of any supporting information supplied by the
authors. Any queries (other than missing material) should be
directed to the corresponding author for the article.
![HvFT1 (VrnH3) drives latitudinal adaptation in Spanish barleys [2011]](https://static.fdokumen.com/doc/165x107/6334165aa1ced1126c0a28cd/hvft1-vrnh3-drives-latitudinal-adaptation-in-spanish-barleys-2011.jpg)