The generation and validation of white matter connectivity importance maps
25
The generation and validation of white matter connectivity importance maps Amy Kuceyeski a,* , Jun Maruta b , Sumit N. Niogi c , Jamshid Ghajar b,d , and Ashish Raj a a Imaging Data Evaluation and Analytics Laboratory (IDEAL), Dept. of Radiology, Weill Cornell Medical College, 515 E. 71st St., New York, NY 10065, USA b Brain Trauma Foundation, 7 World Trade Center, 34th Floor, 250 Greenwich St, New York, NY 10007, USA c Department of Radiology, Weill Cornell Medical College, 1300 York Ave., New York, NY 10065, USA d Department of Neurological Surgery, Weill Cornell Medical College, 1300 York Ave., New York, NY 10065, USA Abstract Both the size and location of injury in the brain influences the type and severity of cognitive or sensorimotor dysfunction. However, even with advances in MR imaging and analysis, the correspondence between lesion location and clinical deficit remains poorly understood. Here, structural and diffusion images from 14 healthy subjects are used to create spatially unbiased white matter connectivity importance maps that quantify the amount of disruption to the overall brain network that would be incurred if that region were compromised. Some regions in the white matter that were identified as highly important by such maps have been implicated in strategic infarct dementia and linked to various attention tasks in previous studies. Validation of the maps is performed by investigating the correlations of the importance maps’ predicted cognitive deficits in a group of 15 traumatic brain injury patients with their cognitive test scores measuring attention and memory. While no correlation was found between amount of white matter injury and cognitive test scores, significant correlations (r > 0.68, p < 0.006) were found when including location information contained in the importance maps. These tools could be used by physicians to improve surgical planning, diagnosis, and assessment of disease severity in a variety of pathologies like multiple sclerosis, trauma, and stroke. Keywords white matter importance map; brain connectivity networks; graph theory; tractography; prediction of impairment; traumatic brain injury © 2011 Elsevier Inc. All rights reserved. * Imaging Data Evaluation and Analytics Laboratory (IDEAL), Dept. of Radiology, Weill Cornell Medical College, 515 E. 71st St. (S-125), New York, NY 10065, USA, Tel: (212) 746-1723, Fax: (212) 746-4189, [email protected] (Amy Kuceyeski), [email protected] (Jun Maruta), [email protected] (Sumit N. Niogi), [email protected] (Jamshid Ghajar), [email protected] (Ashish Raj) . Publisher's Disclaimer: This is a PDF file of an unedited manuscript that has been accepted for publication. As a service to our customers we are providing this early version of the manuscript. The manuscript will undergo copyediting, typesetting, and review of the resulting proof before it is published in its final citable form. Please note that during the production process errors may be discovered which could affect the content, and all legal disclaimers that apply to the journal pertain. NIH Public Access Author Manuscript Neuroimage. Author manuscript; available in PMC 2012 September 1. Published in final edited form as: Neuroimage. 2011 September 1; 58(1): 109–121. doi:10.1016/j.neuroimage.2011.05.087. NIH-PA Author Manuscript NIH-PA Author Manuscript NIH-PA Author Manuscript
-
Upload
sacklerinstitute -
Category
Documents
-
view
4 -
download
0
Transcript of The generation and validation of white matter connectivity importance maps
The generation and validation of white matter connectivityimportance maps
Amy Kuceyeskia,*, Jun Marutab, Sumit N. Niogic, Jamshid Ghajarb,d, and Ashish RajaaImaging Data Evaluation and Analytics Laboratory (IDEAL), Dept. of Radiology, Weill CornellMedical College, 515 E. 71st St., New York, NY 10065, USAbBrain Trauma Foundation, 7 World Trade Center, 34th Floor, 250 Greenwich St, New York, NY10007, USAcDepartment of Radiology, Weill Cornell Medical College, 1300 York Ave., New York, NY 10065,USAdDepartment of Neurological Surgery, Weill Cornell Medical College, 1300 York Ave., New York,NY 10065, USA
AbstractBoth the size and location of injury in the brain influences the type and severity of cognitive orsensorimotor dysfunction. However, even with advances in MR imaging and analysis, thecorrespondence between lesion location and clinical deficit remains poorly understood. Here,structural and diffusion images from 14 healthy subjects are used to create spatially unbiasedwhite matter connectivity importance maps that quantify the amount of disruption to the overallbrain network that would be incurred if that region were compromised. Some regions in the whitematter that were identified as highly important by such maps have been implicated in strategicinfarct dementia and linked to various attention tasks in previous studies. Validation of the maps isperformed by investigating the correlations of the importance maps’ predicted cognitive deficits ina group of 15 traumatic brain injury patients with their cognitive test scores measuring attentionand memory. While no correlation was found between amount of white matter injury andcognitive test scores, significant correlations (r > 0.68, p < 0.006) were found when includinglocation information contained in the importance maps. These tools could be used by physicians toimprove surgical planning, diagnosis, and assessment of disease severity in a variety ofpathologies like multiple sclerosis, trauma, and stroke.
Keywordswhite matter importance map; brain connectivity networks; graph theory; tractography; predictionof impairment; traumatic brain injury
© 2011 Elsevier Inc. All rights reserved.*Imaging Data Evaluation and Analytics Laboratory (IDEAL), Dept. of Radiology, Weill Cornell Medical College, 515 E. 71st St.(S-125), New York, NY 10065, USA, Tel: (212) 746-1723, Fax: (212) 746-4189, [email protected] (Amy Kuceyeski),[email protected] (Jun Maruta), [email protected] (Sumit N. Niogi), [email protected] (Jamshid Ghajar),[email protected] (Ashish Raj) .Publisher's Disclaimer: This is a PDF file of an unedited manuscript that has been accepted for publication. As a service to ourcustomers we are providing this early version of the manuscript. The manuscript will undergo copyediting, typesetting, and review ofthe resulting proof before it is published in its final citable form. Please note that during the production process errors may bediscovered which could affect the content, and all legal disclaimers that apply to the journal pertain.
NIH Public AccessAuthor ManuscriptNeuroimage. Author manuscript; available in PMC 2012 September 1.
Published in final edited form as:Neuroimage. 2011 September 1; 58(1): 109–121. doi:10.1016/j.neuroimage.2011.05.087.
NIH
-PA Author Manuscript
NIH
-PA Author Manuscript
NIH
-PA Author Manuscript
1. IntroductionMany brain pathologies, including stroke, multiple sclerosis and traumatic brain injury resultin functional disability. The location and size of the affected area greatly influences the leveland type of disability that the patient incurs. Current MRI-based diagnosis and assessment ofbrain injury is primarily qualitative, involving subjective interpretation of severity andprediction of impairment based on a physician’s general anatomic and physiologicknowledge or previous patient-based experience. Even when augmented by 3D imagingtools that allow for objective measurement of lesion or tumor volume, the effect on brainfunction cannot be sufficiently characterized. This shortcoming arises because functionalimpairment is determined by both the extent and location of damage, and can be properlyassessed only by also elucidating the structural connectivity of the affected gray matterregion to the rest of the brain via its white matter fiber architecture.
There have been, however, numerous studies correlating total lesion load with severity andprognosis in various diseases, without considering the location of damage. In particular, onestudy showed a statistically significant although moderate correlation (r = 0.3–0.5) of lesionload in MS with EDSS scores of disability (Filippi et al., 1996), while another found slightlyhigher correlation by combining information from various MR modalities (Mainero et al.,2001). The correlations are modest most likely because the location of the lesions plays alarge role in the patient’s disability. In fact, several studies using lesion location in theiranalysis have shown higher correlation with severity of disability in MS (Charil et al., 2003;Wilson et al., 2003; Vellinga et al., 2009) and with stroke severity and functional recovery instroke (Menezes et al., 2007; Nazzal et al., 2009). In Menezes et al. (2007), various selectedbrain structures were assigned a level of influence in stroke severity by two physicians.Using this map, a higher correlation (r = 0.79, p = 0.035) was found with the NationalInstitutes of Health Stroke Scale (NIHSS) scores than the correlation calculated by usingonly lesion volume (r = 0.62). Another study in normal and TBI subjects showed that the FAof particular tracts correlates better with various measures in the Attention Network Test(Niogi et al., 2008b, 2010). Singh et al. (2010) discovered white matter ROIs with decreasedFA in TBI patients and identified white matter tracts that appeared in equivalent ROIs in aseries of normal patients. While these studies show some promise in the consideration ofspatial location of damage, none of these has taken into account the location of the damagedtissue or tracts with respect to disruption in the overall brain connectivity network in aspatially unbiased manner.
1.1. Diffusion Imaging and TractographyThe structural brain network has recently become an area of wide interest due to theadvances in diffusion imaging that can elucidate white matter structures (Assaf andPasternak, 2008). DTI is a modality in MRI, introduced by Basser et al. (1994), that enablesthe localization and characterization of white matter fasciculi in the brain by assuming thedirection and magnitude of water molecule diffusion in the brain occurs at a higher ratealong white matter tracts than across them. Measurements are taken in numerous directionsand tensor decomposition is used to extract the direction and magnitude of parallel andperpendicular diffusivity of water molecules (Basser et al., 1994; Basser, 1995). Summarystatistics of the magnitude of diffusivities, such as the mean or the normalized standarddeviation (fractional anisotropy-FA), provide interpretable values and a basis forvisualization and construction of the white matter tracts (called tractography) (Basser andPierpaoli, 1996, 1998; Pierpaoli and Basser, 1996).
Many tractography algorithms have been developed that use diffusion information to mapthe location and size of probable white matter tracts in the brain. Streamline tractographyalgorithms, for example FACT (Mori et al., 1999), begin at a user defined seed voxel and
Kuceyeski et al. Page 2
Neuroimage. Author manuscript; available in PMC 2012 September 1.
NIH
-PA Author Manuscript
NIH
-PA Author Manuscript
NIH
-PA Author Manuscript
take steps in the direction of fastest diffusion. Failure of these methods occurs within voxelsthat contain noise or have fibers that are crossing, “kissing”, diverging or merging. In anattempt to overcome this limitation, probabilistic methods (Zhang et al., 2009; Behrens etal., 2003; Friman et al., 2006) measure the probability of connection between regions ratherthan the actual reconstruction of the white matter pathways. One probabilistic method(Iturria-Medina et al., 2008) considers the probability of connection between two brainregions to be proportional to the most probable tract between any voxel in the respectiveregions. Once the representations of the white matter tracts are constructed, the connectivityof different regions in the brain can be represented by a graph and analyzed using existingmethods in graph theory. In recent years, graphs and networks have been used to describeand analyze many different complex social, biological, and mathematical phenomena(Strogatz, 2001). These approaches have been used to investigate brain structure (Sporns etal., 2004), function (Achard et al., 2006), and a combination of the two (Bowman et al.,2009).
1.2. Graph Theory and Its Application to the Brain NetworkA graph G = (V, E) is defined by a set of vertices V that are linked pairwise by edges E(Gondran and Minoux, 1984). In a graph that represents brain connections, verticescorrespond to gray matter regions and edges to measures of their connectivity via whitematter tracts. Edges in a graph can be assigned a capacity or weight eij that gives thestrength of connection between any two vertices i and j, while the distance dij betweenvertices i and j can be taken as the inverse of the edge weight, i.e. dij = 1/eij. A path pkl fromvertex k to l is defined to be a set of vertices such that from each vertex in the set, an edgeexists to the next sequential vertex. Once all of the possible paths between vertices k and lare found, each path’s length, denoted |pkl|, can be found by summing the distances betweensequential vertices and subsequently the shortest path can be identified.
Three graph metrics, defined below, are used in this paper to quantify a graph’scharacteristics and make comparisons. These metrics are defined as:
• characteristic path length (cpl): average length of the shortest path between all pairs
of vertices, i.e. ,
• efficiency (eff): average of the inverse of the shortest path length, i.e.
,
• spectral radius (sr): two norm of the graph matrix, i.e. ,
where A ∈ Rm×m is the symmetric matrix representing the connectivity graph of m graymatter regions in the brain, whose element aij in the ith column and the jth row correspond tothe weight of the edge between gray matter regions i and j in the connectivity graph (aij = 0for i = j).
There have been a few recent studies that show promise in exploring changes in brainconnectivity network metrics in certain disease states. Zalesky et al. (2011) showed adecrease in the efficiency measure of structural connectivity networks in schizophrenicpatients compared to normal controls. The same study found significant correlationsbetween network efficiency and intellectual performance in normal controls, but not in thepatient population. Lo et al. (2010) showed an increase in path length and a decrease inefficiency in Alzheimer’s patients compared to normal age-matched controls. In addition, athird study (Wen et al., 2011) showed lower brain network efficiency measures correlatedwith increased age and decreased cognitive performance.
Kuceyeski et al. Page 3
Neuroimage. Author manuscript; available in PMC 2012 September 1.
NIH
-PA Author Manuscript
NIH
-PA Author Manuscript
NIH
-PA Author Manuscript
1.3. Paper ContributionThus far, analyses of brain network connectivity changes have depended on tractographyperformed on brains affected by a disease, injury, or aging. It is not known, however, iftractography methods that are highly sensitive to noise can yield physiologically meaningfulconnectivity information in abnormal brains. The method proposed in this papercircumvents this problem by assigning to a white matter region its relative importance tonetwork connectivity as an indicator of the amount of damage incurred when that region iscompromised.
A way to systematically and objectively quantify a white matter region’s importance tooverall brain connectivity has not yet been developed. Building on preliminary results(Kuceyeski and Raj, 2010), the current work uses diffusion data, structural MR images ofthe brain, and graph theory to systematically assign importance with respect to overall brainconnectivity to white matter regions to further elucidate the correspondence between lesionlocation and cognitive deficit. This information, presented in the form of a three dimensionalquantitative connectivity importance map of the brain, can improve surgical planning,diagnosis, and assessment of disease severity in a variety of pathologies such as multiplesclerosis, trauma, and stroke. The importance map itself is constructed independently of anypathological disease state, so evaluation of a patient’s brain disruption requires a measure ofthe individual’s white matter integrity. Since the severity of TBI has been shown tocorrespond to a decrease in FA (Rutgers et al., 2008; Niogi et al., 2008a), this measure isused to assess a TBI patient’s white matter integrity. Validation is performed by measuringthe correlation of the predicted overall brain connectivity disruption with test scores that ratedisability and cognitive deficit in TBI. While the correlations of conventional measures suchas amount of injury alone with these test scores were not found to be significant, the additionof the importance map information results in higher correlations that are significant.
2. Materials and methods2.1. Data
The data used in this study were collected under a joint study between Weill CornellMedical College and the Brain Trauma Foundation. It consists of 14 normal controls’ (9male and 5 female) and 15 traumatic brain injury patients’ (10 male and 5 female) structuralMR scans (T1 - FSPGR) and High Angular Resolution diffusion Images (HARDI). The mildTBI subjects were recruited through referrals from local concussion clinics. The conditionsfor inclusion were blunt, isolated TBI, post-traumatic amnesia, and a Glasgow Coma Scale(GCS) score of 13-15 at time of injury. The conditions for exclusion were pregnancy, ahistory of neurological or psychiatric diagnosis, seizure (prior to the injury), or drug oralcohol abuse. The ages of the normal controls and TBI patients were 23.1 ± 4.7 and 35.4 ±10.5, respectively, and all of the subjects were right-handed. The scans were performed 20.2± 17.4 months from the time of injury and all patients had a GCS of 15.
The data were collected on a 3 Tesla GE Signa EXCITE scanner (GE Healthcare,Waukesha, WI, USA). HARDI data were acquired using 55 isotropically distributeddiffusion-encoding directions at b = 1000 s/mm2 and one at b = 0 s/mm2, acquired at 72 1.8-mm thick interleaved slices with no gap between slices and 128 × 128 matrix size that waszero-filled during reconstruction to 256 × 256 with a field of view (FOV) of 230 mm. Thestructural scan was an axial 3D inversion recovery fast spoiled gradient recalled echo(FSPGR) T1 weighted images (TE = 1.5 ms,TR = 6.3 ms, TI = 400 ms, flip angle of 15)with 230 mm FOV and 156 1.0-mm contiguous partitions at a 256 × 256 matrix. In additionto image data, two tests of cognitive function that measure different components of attentionand verbal working memory were scored for the same set of patients, namely, the Attention
Kuceyeski et al. Page 4
Neuroimage. Author manuscript; available in PMC 2012 September 1.
NIH
-PA Author Manuscript
NIH
-PA Author Manuscript
NIH
-PA Author Manuscript
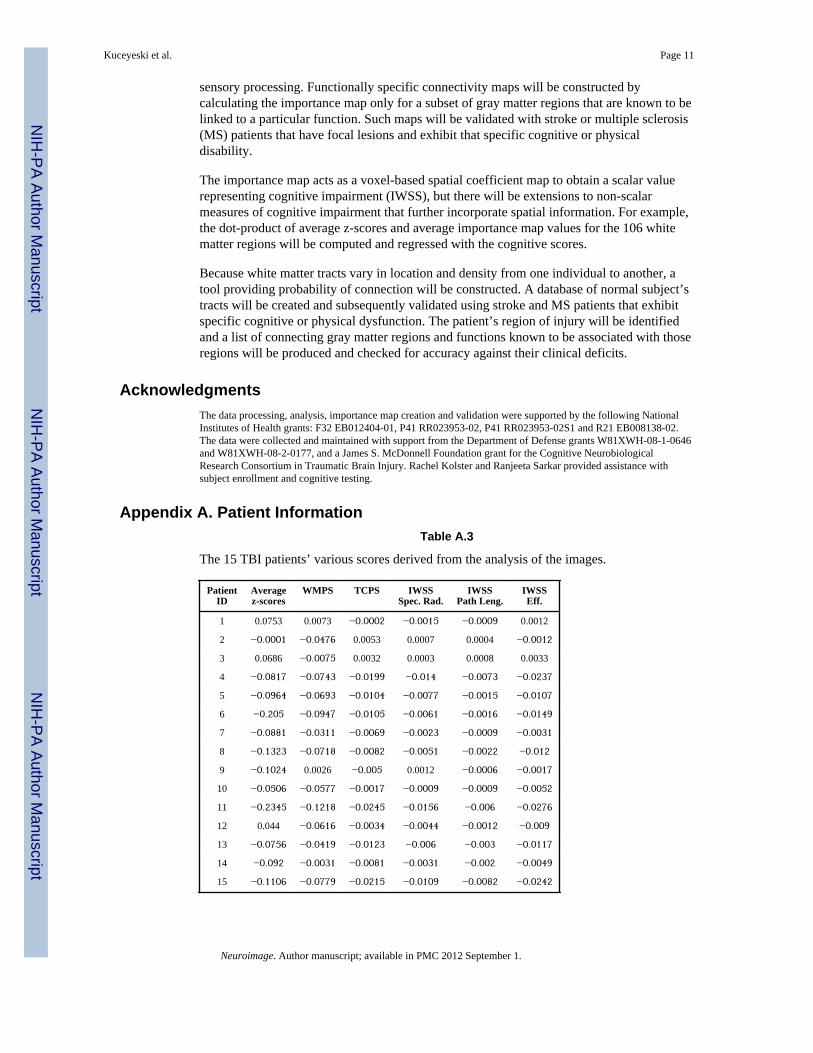
Network Test (ANT) (Fan et al., 2002) and California Verbal Learning Test - SecondEdition (CVLT-II, Pearson, San Antonio, TX, USA) (Jacobs and Donders, 2007; Niogi etal., 2008b). Detailed patient characteristics, including cognitive test scores, are listed inTable A.4 of Appendix A.
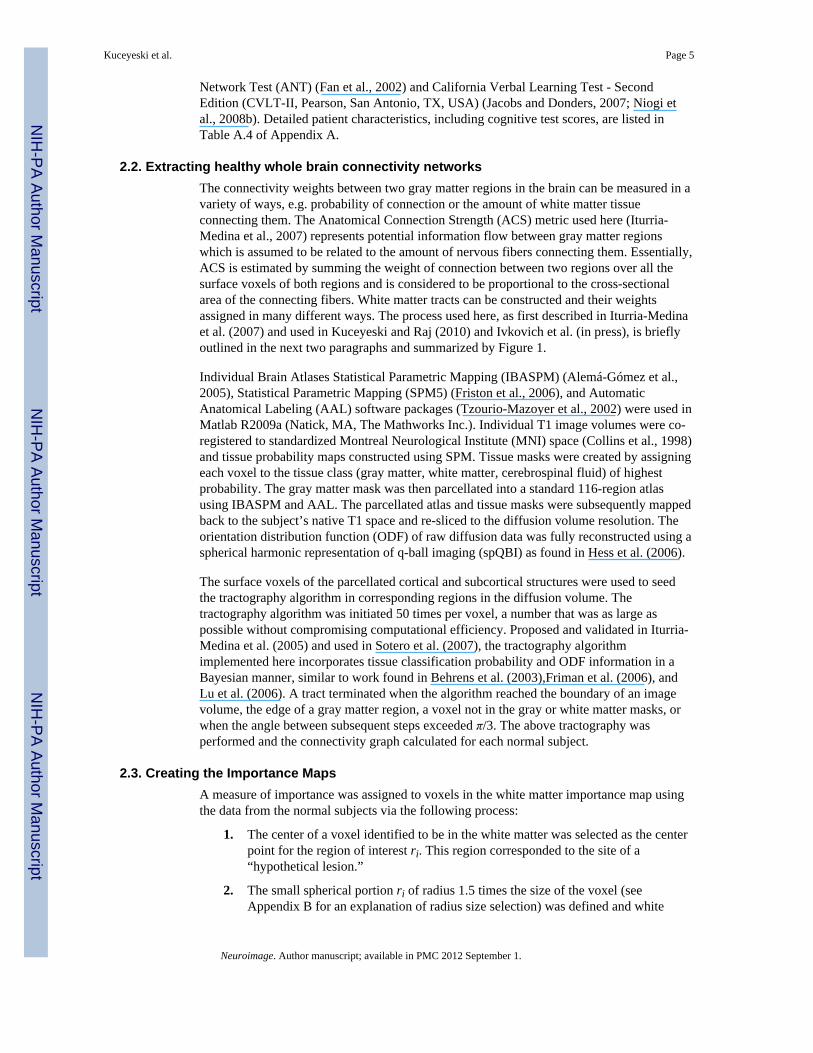
2.2. Extracting healthy whole brain connectivity networksThe connectivity weights between two gray matter regions in the brain can be measured in avariety of ways, e.g. probability of connection or the amount of white matter tissueconnecting them. The Anatomical Connection Strength (ACS) metric used here (Iturria-Medina et al., 2007) represents potential information flow between gray matter regionswhich is assumed to be related to the amount of nervous fibers connecting them. Essentially,ACS is estimated by summing the weight of connection between two regions over all thesurface voxels of both regions and is considered to be proportional to the cross-sectionalarea of the connecting fibers. White matter tracts can be constructed and their weightsassigned in many different ways. The process used here, as first described in Iturria-Medinaet al. (2007) and used in Kuceyeski and Raj (2010) and Ivkovich et al. (in press), is brieflyoutlined in the next two paragraphs and summarized by Figure 1.
Individual Brain Atlases Statistical Parametric Mapping (IBASPM) (Alemá-Gómez et al.,2005), Statistical Parametric Mapping (SPM5) (Friston et al., 2006), and AutomaticAnatomical Labeling (AAL) software packages (Tzourio-Mazoyer et al., 2002) were used inMatlab R2009a (Natick, MA, The Mathworks Inc.). Individual T1 image volumes were co-registered to standardized Montreal Neurological Institute (MNI) space (Collins et al., 1998)and tissue probability maps constructed using SPM. Tissue masks were created by assigningeach voxel to the tissue class (gray matter, white matter, cerebrospinal fluid) of highestprobability. The gray matter mask was then parcellated into a standard 116-region atlasusing IBASPM and AAL. The parcellated atlas and tissue masks were subsequently mappedback to the subject’s native T1 space and re-sliced to the diffusion volume resolution. Theorientation distribution function (ODF) of raw diffusion data was fully reconstructed using aspherical harmonic representation of q-ball imaging (spQBI) as found in Hess et al. (2006).
The surface voxels of the parcellated cortical and subcortical structures were used to seedthe tractography algorithm in corresponding regions in the diffusion volume. Thetractography algorithm was initiated 50 times per voxel, a number that was as large aspossible without compromising computational efficiency. Proposed and validated in Iturria-Medina et al. (2005) and used in Sotero et al. (2007), the tractography algorithmimplemented here incorporates tissue classification probability and ODF information in aBayesian manner, similar to work found in Behrens et al. (2003),Friman et al. (2006), andLu et al. (2006). A tract terminated when the algorithm reached the boundary of an imagevolume, the edge of a gray matter region, a voxel not in the gray or white matter masks, orwhen the angle between subsequent steps exceeded π/3. The above tractography wasperformed and the connectivity graph calculated for each normal subject.
2.3. Creating the Importance MapsA measure of importance was assigned to voxels in the white matter importance map usingthe data from the normal subjects via the following process:
1. The center of a voxel identified to be in the white matter was selected as the centerpoint for the region of interest ri. This region corresponded to the site of a“hypothetical lesion.”
2. The small spherical portion ri of radius 1.5 times the size of the voxel (seeAppendix B for an explanation of radius size selection) was defined and white
Kuceyeski et al. Page 5
Neuroimage. Author manuscript; available in PMC 2012 September 1.
NIH
-PA Author Manuscript
NIH
-PA Author Manuscript
NIH
-PA Author Manuscript
matter tracts that passed through that region were removed from the collection oftracts.
3. The modified connectivity graph Ari ∈ Rm×m (m = 116) was computed for the newset of white matter tracts and compared to the normal subject’s originalconnectivity graph A using the three metrics outlined in Section 1.2. These metricsgive information related to the change in connectivity when that region ri isremoved. This quantity was then recorded in the voxel corresponding to the regionri in the importance map I.
4. Steps 1-3 were repeated until all the white matter regions ri were lesioned, and theimportance map completed.
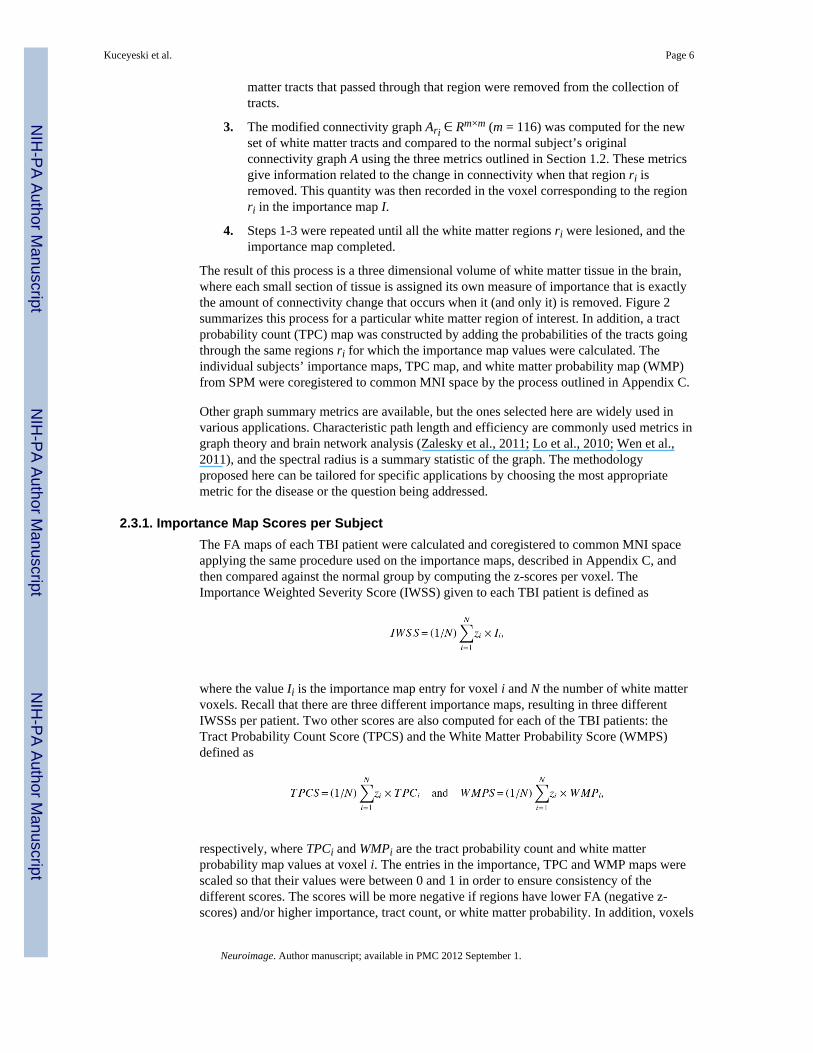
The result of this process is a three dimensional volume of white matter tissue in the brain,where each small section of tissue is assigned its own measure of importance that is exactlythe amount of connectivity change that occurs when it (and only it) is removed. Figure 2summarizes this process for a particular white matter region of interest. In addition, a tractprobability count (TPC) map was constructed by adding the probabilities of the tracts goingthrough the same regions ri for which the importance map values were calculated. Theindividual subjects’ importance maps, TPC map, and white matter probability map (WMP)from SPM were coregistered to common MNI space by the process outlined in Appendix C.
Other graph summary metrics are available, but the ones selected here are widely used invarious applications. Characteristic path length and efficiency are commonly used metrics ingraph theory and brain network analysis (Zalesky et al., 2011; Lo et al., 2010; Wen et al.,2011), and the spectral radius is a summary statistic of the graph. The methodologyproposed here can be tailored for specific applications by choosing the most appropriatemetric for the disease or the question being addressed.
2.3.1. Importance Map Scores per SubjectThe FA maps of each TBI patient were calculated and coregistered to common MNI spaceapplying the same procedure used on the importance maps, described in Appendix C, andthen compared against the normal group by computing the z-scores per voxel. TheImportance Weighted Severity Score (IWSS) given to each TBI patient is defined as
where the value Ii is the importance map entry for voxel i and N the number of white mattervoxels. Recall that there are three different importance maps, resulting in three differentIWSSs per patient. Two other scores are also computed for each of the TBI patients: theTract Probability Count Score (TPCS) and the White Matter Probability Score (WMPS)defined as
respectively, where TPCi and WMPi are the tract probability count and white matterprobability map values at voxel i. The entries in the importance, TPC and WMP maps werescaled so that their values were between 0 and 1 in order to ensure consistency of thedifferent scores. The scores will be more negative if regions have lower FA (negative z-scores) and/or higher importance, tract count, or white matter probability. In addition, voxels
Kuceyeski et al. Page 6
Neuroimage. Author manuscript; available in PMC 2012 September 1.
NIH
-PA Author Manuscript
NIH
-PA Author Manuscript
NIH
-PA Author Manuscript
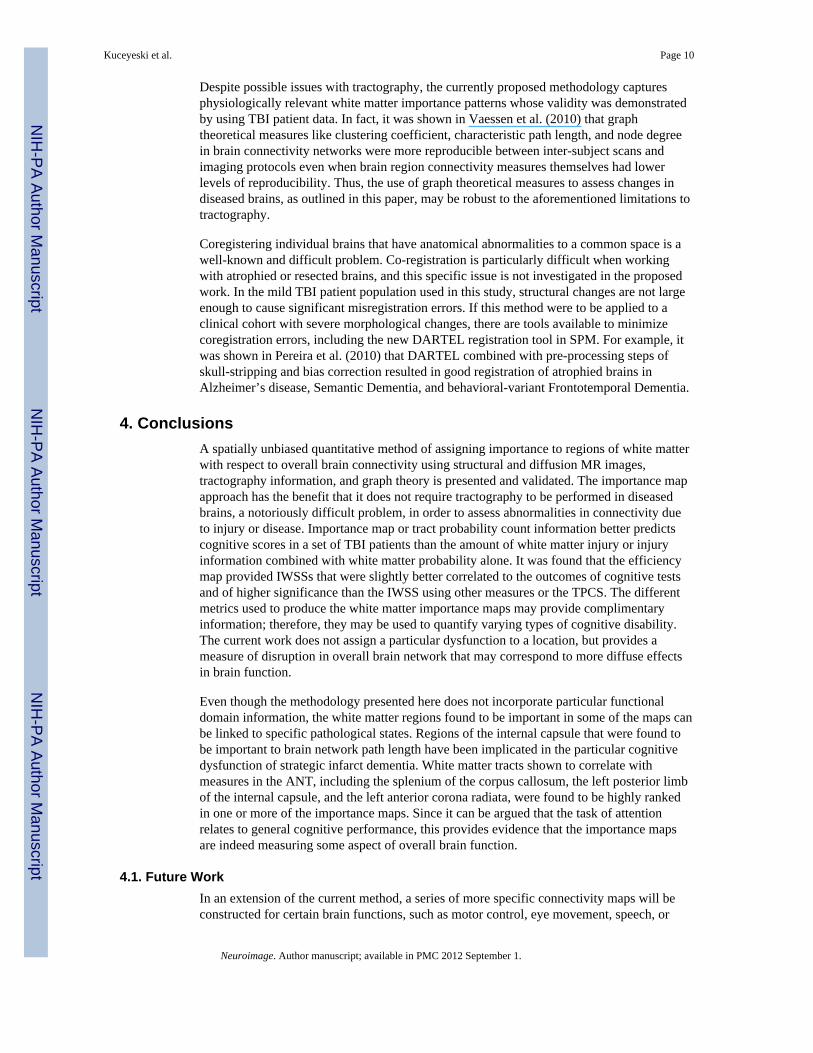
with an FA of less than 0.1 were excluded to ensure that only white matter structures wereused. A list of the various image-derived scores per patient are given in Table A.3 ofAppendix A.
3. Results and Discussion3.1. Comparison of the Maps
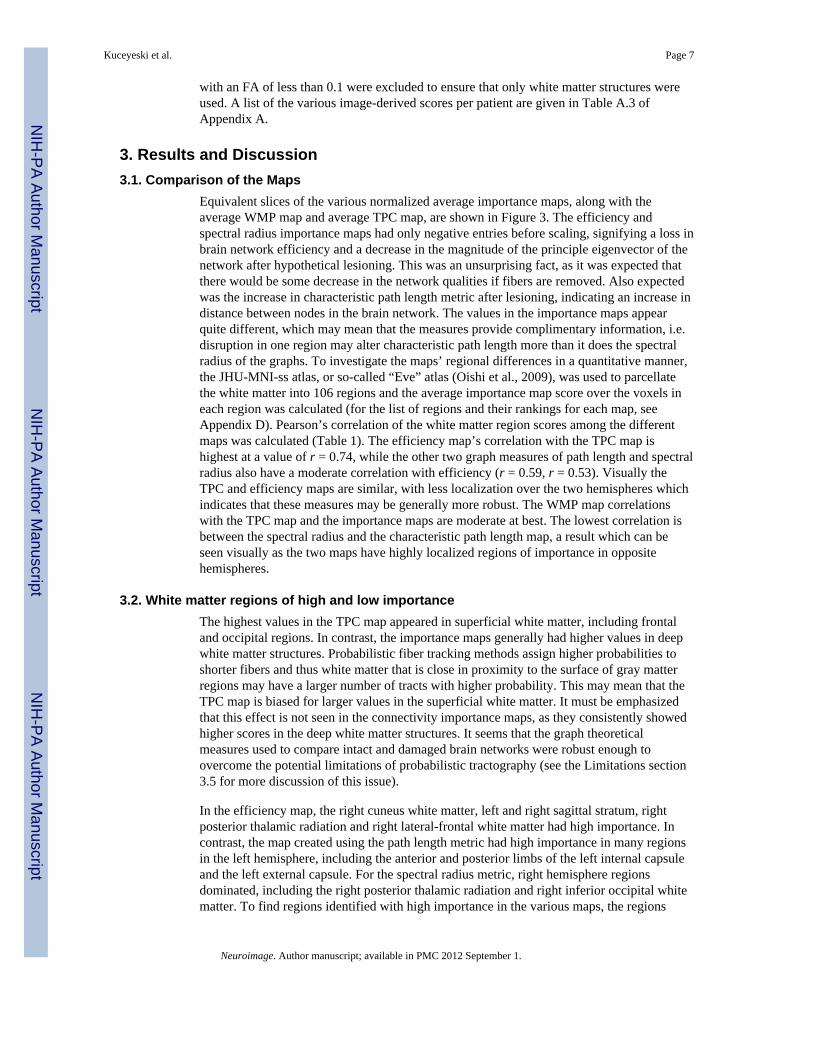
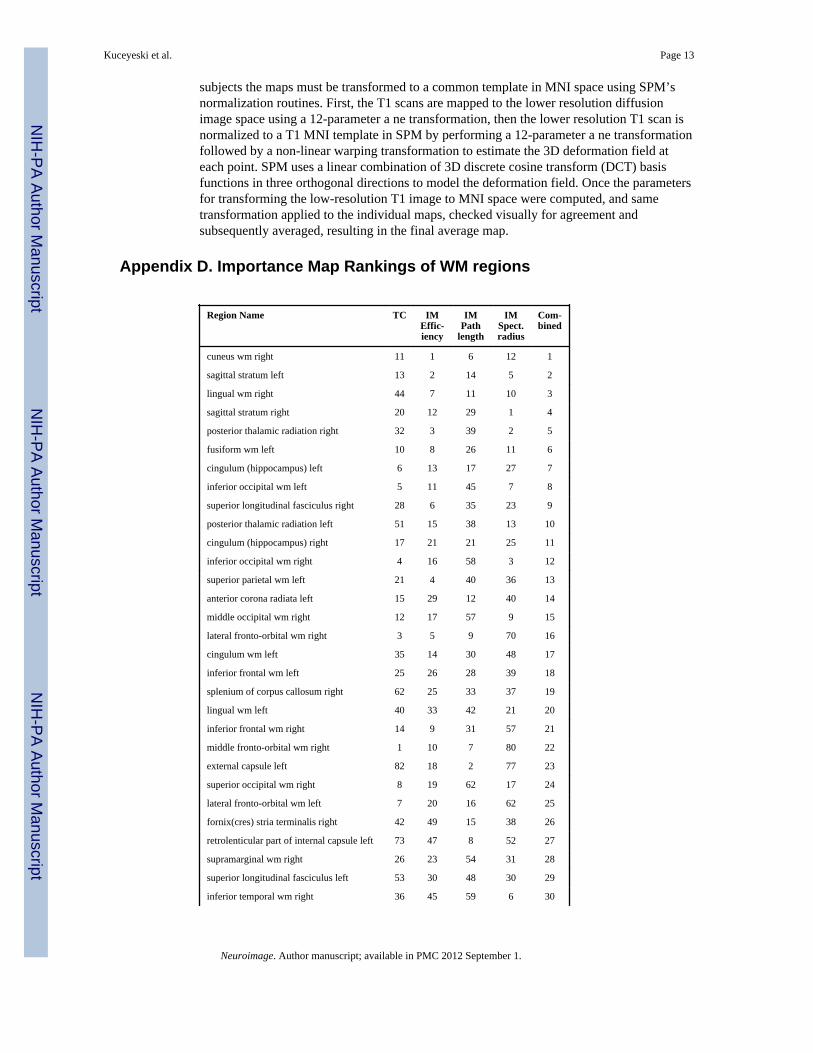
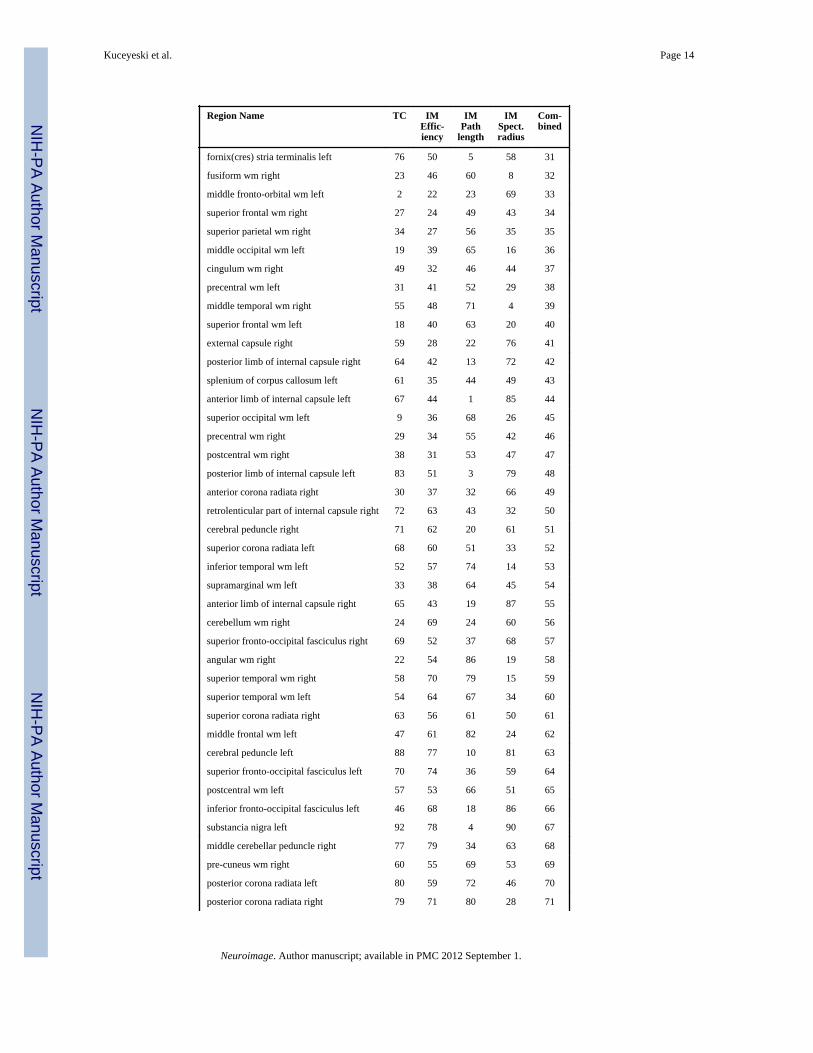
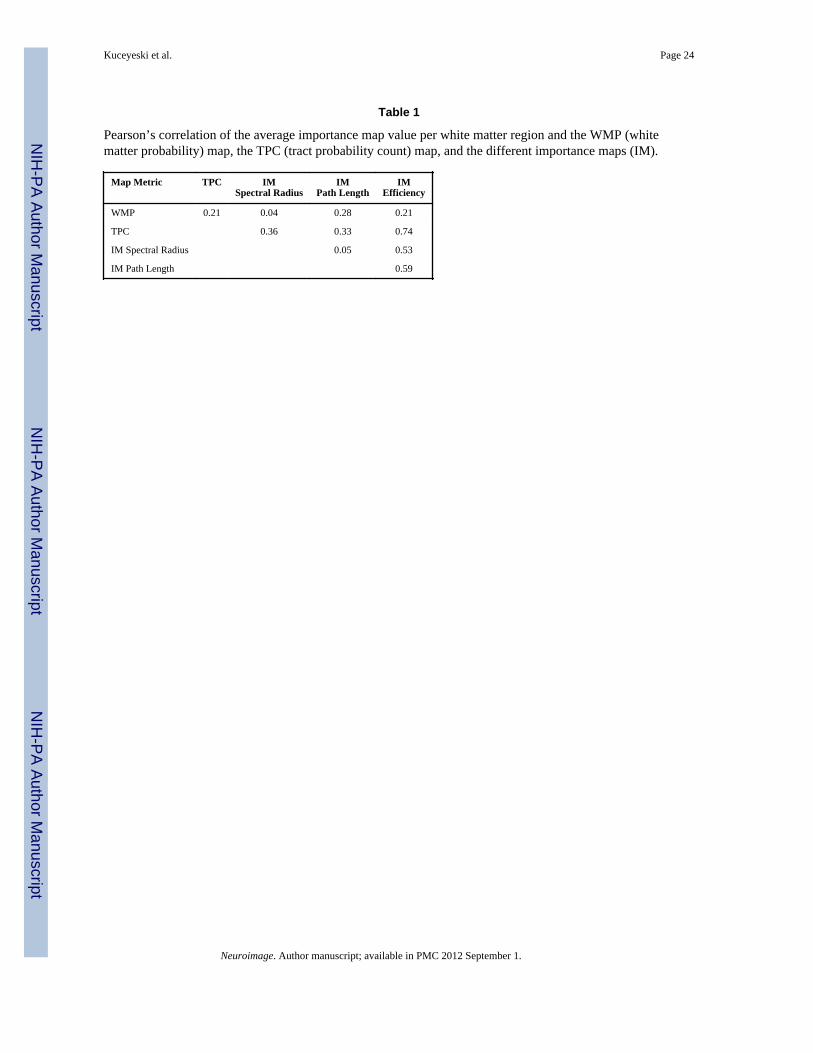
Equivalent slices of the various normalized average importance maps, along with theaverage WMP map and average TPC map, are shown in Figure 3. The efficiency andspectral radius importance maps had only negative entries before scaling, signifying a loss inbrain network efficiency and a decrease in the magnitude of the principle eigenvector of thenetwork after hypothetical lesioning. This was an unsurprising fact, as it was expected thatthere would be some decrease in the network qualities if fibers are removed. Also expectedwas the increase in characteristic path length metric after lesioning, indicating an increase indistance between nodes in the brain network. The values in the importance maps appearquite different, which may mean that the measures provide complimentary information, i.e.disruption in one region may alter characteristic path length more than it does the spectralradius of the graphs. To investigate the maps’ regional differences in a quantitative manner,the JHU-MNI-ss atlas, or so-called “Eve” atlas (Oishi et al., 2009), was used to parcellatethe white matter into 106 regions and the average importance map score over the voxels ineach region was calculated (for the list of regions and their rankings for each map, seeAppendix D). Pearson’s correlation of the white matter region scores among the differentmaps was calculated (Table 1). The efficiency map’s correlation with the TPC map ishighest at a value of r = 0.74, while the other two graph measures of path length and spectralradius also have a moderate correlation with efficiency (r = 0.59, r = 0.53). Visually theTPC and efficiency maps are similar, with less localization over the two hemispheres whichindicates that these measures may be generally more robust. The WMP map correlationswith the TPC map and the importance maps are moderate at best. The lowest correlation isbetween the spectral radius and the characteristic path length map, a result which can beseen visually as the two maps have highly localized regions of importance in oppositehemispheres.
3.2. White matter regions of high and low importanceThe highest values in the TPC map appeared in superficial white matter, including frontaland occipital regions. In contrast, the importance maps generally had higher values in deepwhite matter structures. Probabilistic fiber tracking methods assign higher probabilities toshorter fibers and thus white matter that is close in proximity to the surface of gray matterregions may have a larger number of tracts with higher probability. This may mean that theTPC map is biased for larger values in the superficial white matter. It must be emphasizedthat this effect is not seen in the connectivity importance maps, as they consistently showedhigher scores in the deep white matter structures. It seems that the graph theoreticalmeasures used to compare intact and damaged brain networks were robust enough toovercome the potential limitations of probabilistic tractography (see the Limitations section3.5 for more discussion of this issue).
In the efficiency map, the right cuneus white matter, left and right sagittal stratum, rightposterior thalamic radiation and right lateral-frontal white matter had high importance. Incontrast, the map created using the path length metric had high importance in many regionsin the left hemisphere, including the anterior and posterior limbs of the left internal capsuleand the left external capsule. For the spectral radius metric, right hemisphere regionsdominated, including the right posterior thalamic radiation and right inferior occipital whitematter. To find regions identified with high importance in the various maps, the regions
Kuceyeski et al. Page 7
Neuroimage. Author manuscript; available in PMC 2012 September 1.
NIH
-PA Author Manuscript
NIH
-PA Author Manuscript
NIH
-PA Author Manuscript
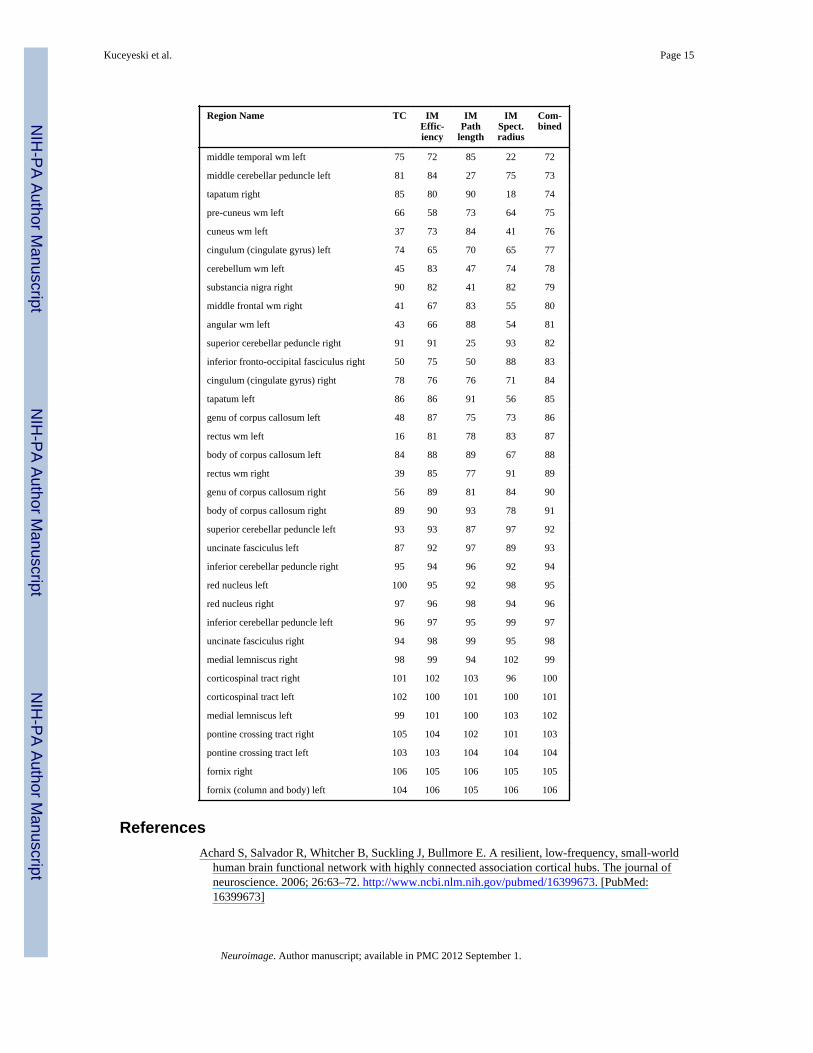
were assigned a rank of 1 to 106 depending on how important they were in the respectivemaps. These ranks were summed, and it was found that the right precuneus white matter, theright and left sagittal stratum, the right lingual white matter and the right posterior thalamicradiation were the most important across the connectivity map metrics. Also high on the listwere the left and right hippocampal cingulum and the left and right inferior occipital whitematter. The right precuneus white matter is a part of the resting network, and the sagittalstratum, as described in Schmahmann and Pandya (2006), is a major corticosubcorticalwhite matter bundle that connects regions of the parietal, occipital, cingulate, and temporalregions to subcortical thalamic regions, the nuclei of the basis pontis, and other brainstemstructures. For a complete list of rankings, see the table in Appendix D.
Regions with low values agreed among the three importance maps and TPC map. Thoseassigned low values were the column and body of the left fornix, the right fornix, thebilateral pontine crossing tracts, bilateral medial lemniscus, and bilateral cortico-spinaltracts. The inferior cerebellar peduncles and red nuclei also had low map values. Thesestructures had less than 1% of the maximum tract probability count, which would explainthe low values in the importance maps. This outcome may be an artifact, however, as thebrainstem is susceptible to movement with cardiac pulsations during the scan, resulting inextremely noisy diffusion data, a low amount of reconstructed tracts, and therefore lowconnectivity importance in these regions. The low tract count does not necessarily meanthese regions do not have fibers and are not important in the brain network, only that thenon-pulse gated imaging method used here cannot adequately capture its fiber architecture.
3.3. Comparison to findings in the literatureMany of the regions implicated in the different effects measured by the ANT (Niogi et al.,2008b, 2010) were shown to be highly ranked in one or more of the importance maps. Theleft anterior corona radiata, listed in the top 15% of regions in the combined rank and in thepath length map (Appendix D), was shown to have FA measures that correlated with theconflict effect of the ANT. The left and right splenium of the corpus callosum were found tobe correlated with the orienting effect in the ANT; here those structures appeared in the top35% of the efficiency importance map, with the right side of the structure appearing in thetop 20% of the combined importance map rankings. The left posterior limb of the internalcapsule, correlated to the alerting effect of the ANT, was third most important in the pathlength importance map while in contrast it was halfway down the lists of structures in theefficiency, spectral radius, and overall rank.
Other neurological studies have shown that strategic infarct dementia, a highly debilitatingcondition wherein the patient experiences fluctuating alertness, inattention, memory loss,apathy, abulia, and psychomotor retardation, results from stroke lesions in the genu of theinternal capsule (Tatemichi et al., 1995). The importance map for path length that ranked theleft anterior and posterior limbs of the internal capsule as the first and third most importantwhite matter regions may be capturing a center of connectivity that is affected in this type offocal stroke.
3.4. Quantitative Validation of MapsThe hypothesis that the importance maps provide more information than just the amount orprobability of white matter alone was tested by correlating the TBI patients’ map scores withtheir tests of cognitive function. Smaller (more negative) IWSS scores for a patient indicatelarger network disruption and/or greater FA loss, which should correspond to greaterfunctional loss and more abnormal cognitive scores. Since the goal of the importance map isto capture overall brain network disruption, and is not function specific, the cognitive testscore used to validate the map should be functionally unbiased. One solution is to create an
Kuceyeski et al. Page 8
Neuroimage. Author manuscript; available in PMC 2012 September 1.
NIH
-PA Author Manuscript
NIH
-PA Author Manuscript
NIH
-PA Author Manuscript
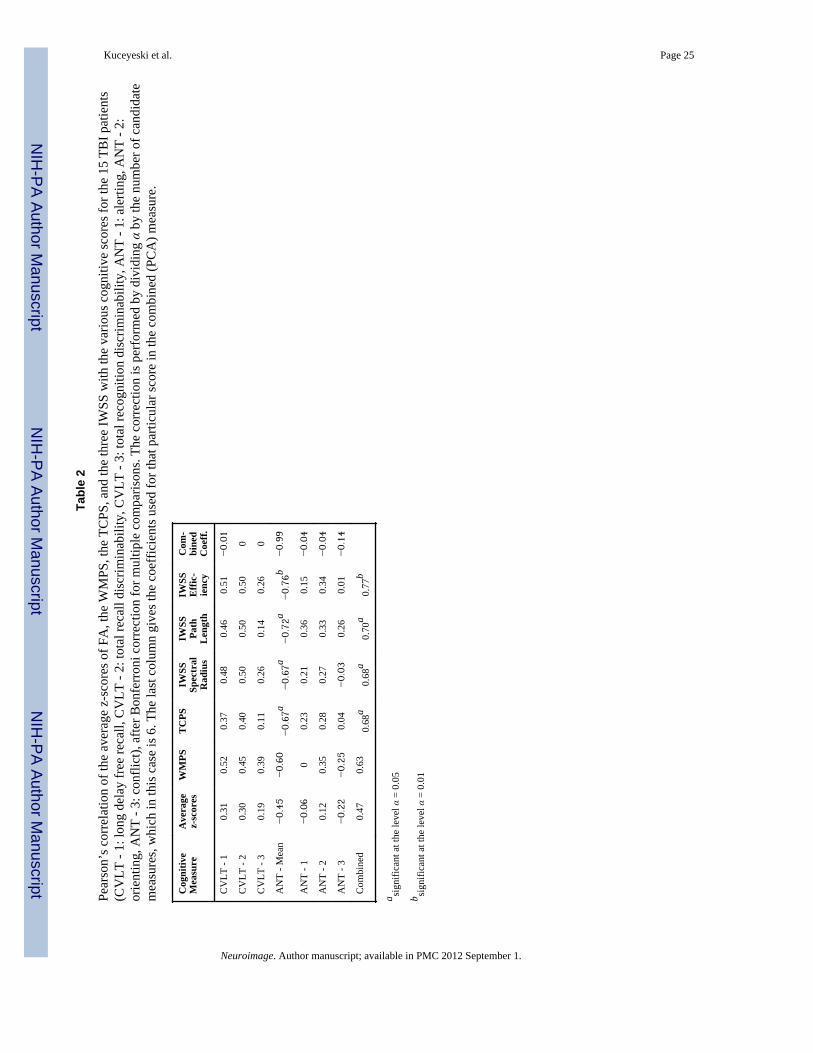
overall cognitive measure that combines the various tests of function (ANT and CVLT-II)into one score. The well-known process of Principal Component Analysis (PCA) (Pearson,1901) was used to create a combined cognitive score that has maximal variance over thepopulation and presumably captures all of the cognitive functions tested. The coefficients foreach cognitive measure are given in the last column of Table 2; note that the coefficients arenegative to mantain a positive correlation with the various imaging scores. Most of theweight is on the ANT mean, with a small contribution from the three other ANT scores. Dueto the disparity in coefficients, future studies may focus only on correlations with the ANTmean score.
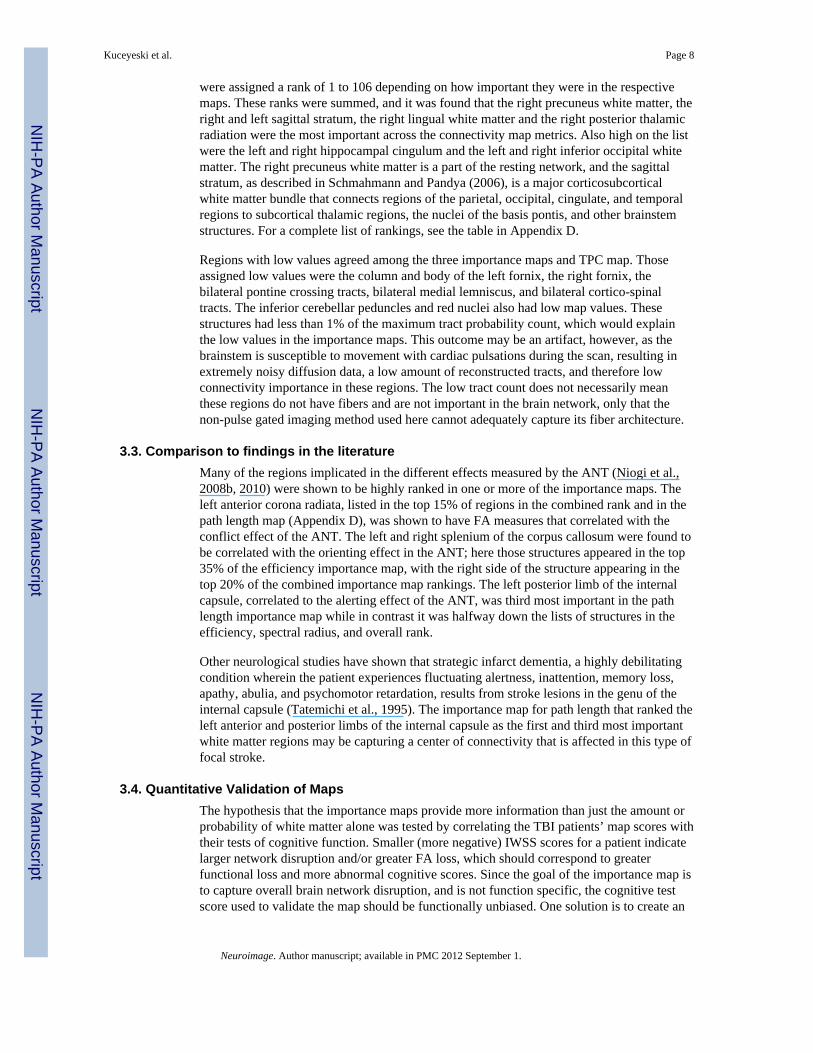
Table 2 lists Pearson’s correlation of the average z scores of FA, the WMPS, the TPCS, andthe three IWSS with each of the cognitive test scores and the combined cognitive measurefound using PCA. Figure 4 shows the scatter plots and lines of best fit along with the rootmean squared error (RMSE) of the fit. The correlations for the individual cognitive testscores are higher in general when including the WMP, TPC, and importance mapinformation than the z-scores of FA alone. Only the correlations between the TPCS andIWSS scores and the ANT mean reaction time and the combined cognitive score aresignificant at a level of α = 0.05 (with Bonferroni correction for multiple comparisons), withthe efficiency IWSS being significant at an even higher level (α = 0.01, with correction).The relatively low correlation that exists with the more specific cognitive measures likeANT alerting and conflict effects could be due to the lack of specificity of the map values toany functional subnetworks in the brain; recall that the maps measure overall brainconnectivity disruption, which is better captured by the ANT overall mean reaction time orthe combined cognitive measure.
It may be argued that graph theoretical measures for the TBI patients’ brain networkextracted from their own image data might provide more information about cognition lossthan the importance map method. However, it is not known how well tracts can bereconstructed in brains with disease-induced structural changes, including TBI, but it is aresearch topic of much interest (Singh et al., 2010). As comparison, the connectivitymatrices for each of the TBI patients were obtained using the same process for the normalsubjects described in 2.2, and the graph metrics of efficiency and characteristic path lengthcomputed directly on them. The graph metrics were then checked for correlations with thesame cognitive measures as listed in Table 2, but no correlations were found to besignificant. Therefore, the IWSS scores that estimated connectivity changes in injured brainswere a better predictor of cognitive performance than the properties of networks extractedusing tractography on image data from the TBI patient population.
3.5. LimitationsTractography is an imperfect tool at the present, especially in dealing with partial volumeeffects and crossing and kissing fibers. Probabilistic tractography, in particular, hasdrawbacks in that it assigns higher probabilities to shorter fibers and thus white matter that isadjacent to gray matter regions may have a larger number of tracts with higher probability.Therefore, it may be an artifact that the highest TPC values appeared in superficial WMregions. On the other hand, many U-fibers may be invisible to diffusion MRI due to limitedspatial and angular resolution. The two effects may partially cancel each other, but it iscurrently impossible to quantify the extent of these effects. The advancement oftractography techniques should remove many, if not all, of these concerns. It must be notedthat this paper is not proposing an alternative method for tractography, but merely its use forimportant clinical and exploratory analyses. The importance maps proposed here willcontinue to be useful as enhancements to tractography algorithms are made.
Kuceyeski et al. Page 9
Neuroimage. Author manuscript; available in PMC 2012 September 1.
NIH
-PA Author Manuscript
NIH
-PA Author Manuscript
NIH
-PA Author Manuscript
Despite possible issues with tractography, the currently proposed methodology capturesphysiologically relevant white matter importance patterns whose validity was demonstratedby using TBI patient data. In fact, it was shown in Vaessen et al. (2010) that graphtheoretical measures like clustering coefficient, characteristic path length, and node degreein brain connectivity networks were more reproducible between inter-subject scans andimaging protocols even when brain region connectivity measures themselves had lowerlevels of reproducibility. Thus, the use of graph theoretical measures to assess changes indiseased brains, as outlined in this paper, may be robust to the aforementioned limitations totractography.
Coregistering individual brains that have anatomical abnormalities to a common space is awell-known and difficult problem. Co-registration is particularly difficult when workingwith atrophied or resected brains, and this specific issue is not investigated in the proposedwork. In the mild TBI patient population used in this study, structural changes are not largeenough to cause significant misregistration errors. If this method were to be applied to aclinical cohort with severe morphological changes, there are tools available to minimizecoregistration errors, including the new DARTEL registration tool in SPM. For example, itwas shown in Pereira et al. (2010) that DARTEL combined with pre-processing steps ofskull-stripping and bias correction resulted in good registration of atrophied brains inAlzheimer’s disease, Semantic Dementia, and behavioral-variant Frontotemporal Dementia.
4. ConclusionsA spatially unbiased quantitative method of assigning importance to regions of white matterwith respect to overall brain connectivity using structural and diffusion MR images,tractography information, and graph theory is presented and validated. The importance mapapproach has the benefit that it does not require tractography to be performed in diseasedbrains, a notoriously difficult problem, in order to assess abnormalities in connectivity dueto injury or disease. Importance map or tract probability count information better predictscognitive scores in a set of TBI patients than the amount of white matter injury or injuryinformation combined with white matter probability alone. It was found that the efficiencymap provided IWSSs that were slightly better correlated to the outcomes of cognitive testsand of higher significance than the IWSS using other measures or the TPCS. The differentmetrics used to produce the white matter importance maps may provide complimentaryinformation; therefore, they may be used to quantify varying types of cognitive disability.The current work does not assign a particular dysfunction to a location, but provides ameasure of disruption in overall brain network that may correspond to more diffuse effectsin brain function.
Even though the methodology presented here does not incorporate particular functionaldomain information, the white matter regions found to be important in some of the maps canbe linked to specific pathological states. Regions of the internal capsule that were found tobe important to brain network path length have been implicated in the particular cognitivedysfunction of strategic infarct dementia. White matter tracts shown to correlate withmeasures in the ANT, including the splenium of the corpus callosum, the left posterior limbof the internal capsule, and the left anterior corona radiata, were found to be highly rankedin one or more of the importance maps. Since it can be argued that the task of attentionrelates to general cognitive performance, this provides evidence that the importance mapsare indeed measuring some aspect of overall brain function.
4.1. Future WorkIn an extension of the current method, a series of more specific connectivity maps will beconstructed for certain brain functions, such as motor control, eye movement, speech, or
Kuceyeski et al. Page 10
Neuroimage. Author manuscript; available in PMC 2012 September 1.
NIH
-PA Author Manuscript
NIH
-PA Author Manuscript
NIH
-PA Author Manuscript
sensory processing. Functionally specific connectivity maps will be constructed bycalculating the importance map only for a subset of gray matter regions that are known to belinked to a particular function. Such maps will be validated with stroke or multiple sclerosis(MS) patients that have focal lesions and exhibit that specific cognitive or physicaldisability.
The importance map acts as a voxel-based spatial coefficient map to obtain a scalar valuerepresenting cognitive impairment (IWSS), but there will be extensions to non-scalarmeasures of cognitive impairment that further incorporate spatial information. For example,the dot-product of average z-scores and average importance map values for the 106 whitematter regions will be computed and regressed with the cognitive scores.
Because white matter tracts vary in location and density from one individual to another, atool providing probability of connection will be constructed. A database of normal subject’stracts will be created and subsequently validated using stroke and MS patients that exhibitspecific cognitive or physical dysfunction. The patient’s region of injury will be identifiedand a list of connecting gray matter regions and functions known to be associated with thoseregions will be produced and checked for accuracy against their clinical deficits.
AcknowledgmentsThe data processing, analysis, importance map creation and validation were supported by the following NationalInstitutes of Health grants: F32 EB012404-01, P41 RR023953-02, P41 RR023953-02S1 and R21 EB008138-02.The data were collected and maintained with support from the Department of Defense grants W81XWH-08-1-0646and W81XWH-08-2-0177, and a James S. McDonnell Foundation grant for the Cognitive NeurobiologicalResearch Consortium in Traumatic Brain Injury. Rachel Kolster and Ranjeeta Sarkar provided assistance withsubject enrollment and cognitive testing.
Appendix A. Patient InformationTable A.3
The 15 TBI patients’ various scores derived from the analysis of the images.
PatientID
Averagez-scores
WMPS TCPS IWSSSpec. Rad.
IWSSPath Leng.
IWSSEff.
1 0.0753 0.0073 −0.0002 −0.0015 −0.0009 0.0012
2 −0.0001 −0.0476 0.0053 0.0007 0.0004 −0.0012
3 0.0686 −0.0075 0.0032 0.0003 0.0008 0.0033
4 −0.0817 −0.0743 −0.0199 −0.014 −0.0073 −0.0237
5 −0.0964 −0.0693 −0.0104 −0.0077 −0.0015 −0.0107
6 −0.205 −0.0947 −0.0105 −0.0061 −0.0016 −0.0149
7 −0.0881 −0.0311 −0.0069 −0.0023 −0.0009 −0.0031
8 −0.1323 −0.0718 −0.0082 −0.0051 −0.0022 −0.012
9 −0.1024 0.0026 −0.005 0.0012 −0.0006 −0.0017
10 −0.0506 −0.0577 −0.0017 −0.0009 −0.0009 −0.0052
11 −0.2345 −0.1218 −0.0245 −0.0156 −0.006 −0.0276
12 0.044 −0.0616 −0.0034 −0.0044 −0.0012 −0.009
13 −0.0756 −0.0419 −0.0123 −0.006 −0.003 −0.0117
14 −0.092 −0.0031 −0.0081 −0.0031 −0.002 −0.0049
15 −0.1106 −0.0779 −0.0215 −0.0109 −0.0082 −0.0242
Kuceyeski et al. Page 11
Neuroimage. Author manuscript; available in PMC 2012 September 1.
NIH
-PA Author Manuscript
NIH
-PA Author Manuscript
NIH
-PA Author Manuscript
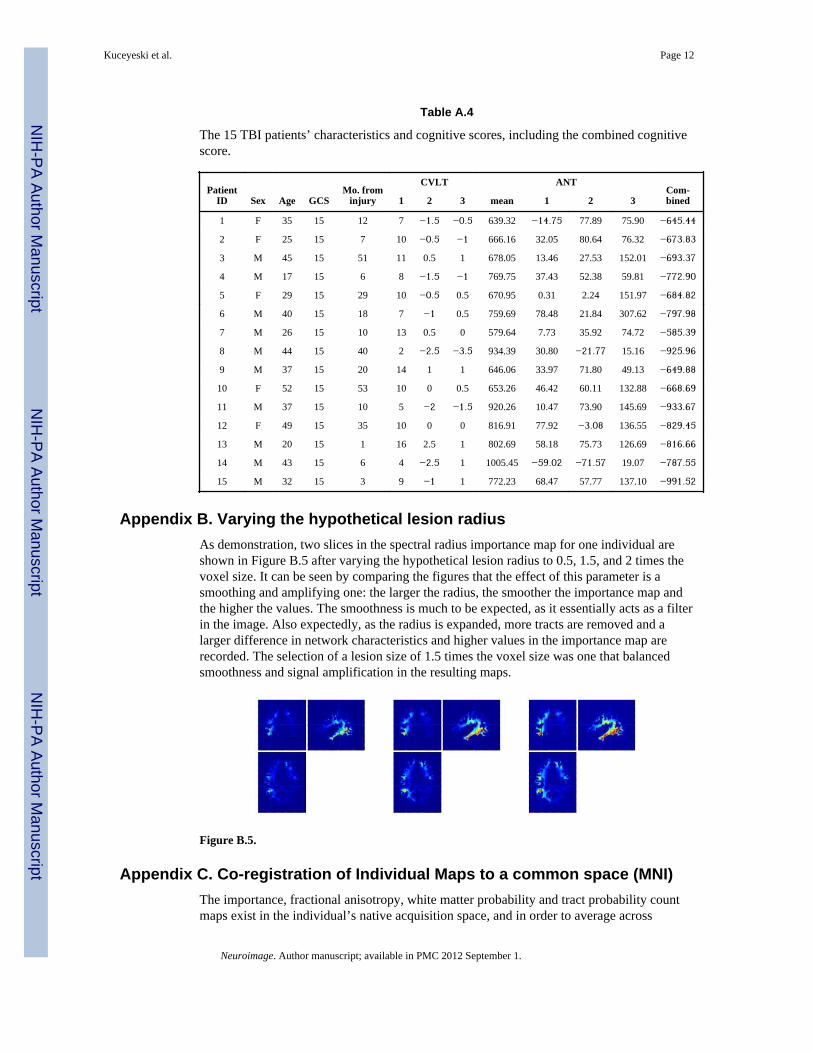
Table A.4
The 15 TBI patients’ characteristics and cognitive scores, including the combined cognitivescore.
PatientID Sex Age GCS
Mo. frominjury
CVLT ANTCom-bined1 2 3 mean 1 2 3
1 F 35 15 12 7 −1.5 −0.5 639.32 −14.75 77.89 75.90 −645.44
2 F 25 15 7 10 −0.5 −1 666.16 32.05 80.64 76.32 −673.83
3 M 45 15 51 11 0.5 1 678.05 13.46 27.53 152.01 −693.37
4 M 17 15 6 8 −1.5 −1 769.75 37.43 52.38 59.81 −772.90
5 F 29 15 29 10 −0.5 0.5 670.95 0.31 2.24 151.97 −684.82
6 M 40 15 18 7 −1 0.5 759.69 78.48 21.84 307.62 −797.98
7 M 26 15 10 13 0.5 0 579.64 7.73 35.92 74.72 −585.39
8 M 44 15 40 2 −2.5 −3.5 934.39 30.80 −21.77 15.16 −925.96
9 M 37 15 20 14 1 1 646.06 33.97 71.80 49.13 −649.88
10 F 52 15 53 10 0 0.5 653.26 46.42 60.11 132.88 −668.69
11 M 37 15 10 5 −2 −1.5 920.26 10.47 73.90 145.69 −933.67
12 F 49 15 35 10 0 0 816.91 77.92 −3.08 136.55 −829.45
13 M 20 15 1 16 2.5 1 802.69 58.18 75.73 126.69 −816.66
14 M 43 15 6 4 −2.5 1 1005.45 −59.02 −71.57 19.07 −787.55
15 M 32 15 3 9 −1 1 772.23 68.47 57.77 137.10 −991.52
Appendix B. Varying the hypothetical lesion radiusAs demonstration, two slices in the spectral radius importance map for one individual areshown in Figure B.5 after varying the hypothetical lesion radius to 0.5, 1.5, and 2 times thevoxel size. It can be seen by comparing the figures that the effect of this parameter is asmoothing and amplifying one: the larger the radius, the smoother the importance map andthe higher the values. The smoothness is much to be expected, as it essentially acts as a filterin the image. Also expectedly, as the radius is expanded, more tracts are removed and alarger difference in network characteristics and higher values in the importance map arerecorded. The selection of a lesion size of 1.5 times the voxel size was one that balancedsmoothness and signal amplification in the resulting maps.
Figure B.5.
Appendix C. Co-registration of Individual Maps to a common space (MNI)The importance, fractional anisotropy, white matter probability and tract probability countmaps exist in the individual’s native acquisition space, and in order to average across
Kuceyeski et al. Page 12
Neuroimage. Author manuscript; available in PMC 2012 September 1.
NIH
-PA Author Manuscript
NIH
-PA Author Manuscript
NIH
-PA Author Manuscript
subjects the maps must be transformed to a common template in MNI space using SPM’snormalization routines. First, the T1 scans are mapped to the lower resolution diffusionimage space using a 12-parameter a ne transformation, then the lower resolution T1 scan isnormalized to a T1 MNI template in SPM by performing a 12-parameter a ne transformationfollowed by a non-linear warping transformation to estimate the 3D deformation field ateach point. SPM uses a linear combination of 3D discrete cosine transform (DCT) basisfunctions in three orthogonal directions to model the deformation field. Once the parametersfor transforming the low-resolution T1 image to MNI space were computed, and sametransformation applied to the individual maps, checked visually for agreement andsubsequently averaged, resulting in the final average map.
Appendix D. Importance Map Rankings of WM regions
Region Name TC IMEffic-iency
IMPath
length
IMSpect.radius
Com-bined
cuneus wm right 11 1 6 12 1
sagittal stratum left 13 2 14 5 2
lingual wm right 44 7 11 10 3
sagittal stratum right 20 12 29 1 4
posterior thalamic radiation right 32 3 39 2 5
fusiform wm left 10 8 26 11 6
cingulum (hippocampus) left 6 13 17 27 7
inferior occipital wm left 5 11 45 7 8
superior longitudinal fasciculus right 28 6 35 23 9
posterior thalamic radiation left 51 15 38 13 10
cingulum (hippocampus) right 17 21 21 25 11
inferior occipital wm right 4 16 58 3 12
superior parietal wm left 21 4 40 36 13
anterior corona radiata left 15 29 12 40 14
middle occipital wm right 12 17 57 9 15
lateral fronto-orbital wm right 3 5 9 70 16
cingulum wm left 35 14 30 48 17
inferior frontal wm left 25 26 28 39 18
splenium of corpus callosum right 62 25 33 37 19
lingual wm left 40 33 42 21 20
inferior frontal wm right 14 9 31 57 21
middle fronto-orbital wm right 1 10 7 80 22
external capsule left 82 18 2 77 23
superior occipital wm right 8 19 62 17 24
lateral fronto-orbital wm left 7 20 16 62 25
fornix(cres) stria terminalis right 42 49 15 38 26
retrolenticular part of internal capsule left 73 47 8 52 27
supramarginal wm right 26 23 54 31 28
superior longitudinal fasciculus left 53 30 48 30 29
inferior temporal wm right 36 45 59 6 30
Kuceyeski et al. Page 13
Neuroimage. Author manuscript; available in PMC 2012 September 1.
NIH
-PA Author Manuscript
NIH
-PA Author Manuscript
NIH
-PA Author Manuscript
Region Name TC IMEffic-iency
IMPath
length
IMSpect.radius
Com-bined
fornix(cres) stria terminalis left 76 50 5 58 31
fusiform wm right 23 46 60 8 32
middle fronto-orbital wm left 2 22 23 69 33
superior frontal wm right 27 24 49 43 34
superior parietal wm right 34 27 56 35 35
middle occipital wm left 19 39 65 16 36
cingulum wm right 49 32 46 44 37
precentral wm left 31 41 52 29 38
middle temporal wm right 55 48 71 4 39
superior frontal wm left 18 40 63 20 40
external capsule right 59 28 22 76 41
posterior limb of internal capsule right 64 42 13 72 42
splenium of corpus callosum left 61 35 44 49 43
anterior limb of internal capsule left 67 44 1 85 44
superior occipital wm left 9 36 68 26 45
precentral wm right 29 34 55 42 46
postcentral wm right 38 31 53 47 47
posterior limb of internal capsule left 83 51 3 79 48
anterior corona radiata right 30 37 32 66 49
retrolenticular part of internal capsule right 72 63 43 32 50
cerebral peduncle right 71 62 20 61 51
superior corona radiata left 68 60 51 33 52
inferior temporal wm left 52 57 74 14 53
supramarginal wm left 33 38 64 45 54
anterior limb of internal capsule right 65 43 19 87 55
cerebellum wm right 24 69 24 60 56
superior fronto-occipital fasciculus right 69 52 37 68 57
angular wm right 22 54 86 19 58
superior temporal wm right 58 70 79 15 59
superior temporal wm left 54 64 67 34 60
superior corona radiata right 63 56 61 50 61
middle frontal wm left 47 61 82 24 62
cerebral peduncle left 88 77 10 81 63
superior fronto-occipital fasciculus left 70 74 36 59 64
postcentral wm left 57 53 66 51 65
inferior fronto-occipital fasciculus left 46 68 18 86 66
substancia nigra left 92 78 4 90 67
middle cerebellar peduncle right 77 79 34 63 68
pre-cuneus wm right 60 55 69 53 69
posterior corona radiata left 80 59 72 46 70
posterior corona radiata right 79 71 80 28 71
Kuceyeski et al. Page 14
Neuroimage. Author manuscript; available in PMC 2012 September 1.
NIH
-PA Author Manuscript
NIH
-PA Author Manuscript
NIH
-PA Author Manuscript
Region Name TC IMEffic-iency
IMPath
length
IMSpect.radius
Com-bined
middle temporal wm left 75 72 85 22 72
middle cerebellar peduncle left 81 84 27 75 73
tapatum right 85 80 90 18 74
pre-cuneus wm left 66 58 73 64 75
cuneus wm left 37 73 84 41 76
cingulum (cingulate gyrus) left 74 65 70 65 77
cerebellum wm left 45 83 47 74 78
substancia nigra right 90 82 41 82 79
middle frontal wm right 41 67 83 55 80
angular wm left 43 66 88 54 81
superior cerebellar peduncle right 91 91 25 93 82
inferior fronto-occipital fasciculus right 50 75 50 88 83
cingulum (cingulate gyrus) right 78 76 76 71 84
tapatum left 86 86 91 56 85
genu of corpus callosum left 48 87 75 73 86
rectus wm left 16 81 78 83 87
body of corpus callosum left 84 88 89 67 88
rectus wm right 39 85 77 91 89
genu of corpus callosum right 56 89 81 84 90
body of corpus callosum right 89 90 93 78 91
superior cerebellar peduncle left 93 93 87 97 92
uncinate fasciculus left 87 92 97 89 93
inferior cerebellar peduncle right 95 94 96 92 94
red nucleus left 100 95 92 98 95
red nucleus right 97 96 98 94 96
inferior cerebellar peduncle left 96 97 95 99 97
uncinate fasciculus right 94 98 99 95 98
medial lemniscus right 98 99 94 102 99
corticospinal tract right 101 102 103 96 100
corticospinal tract left 102 100 101 100 101
medial lemniscus left 99 101 100 103 102
pontine crossing tract right 105 104 102 101 103
pontine crossing tract left 103 103 104 104 104
fornix right 106 105 106 105 105
fornix (column and body) left 104 106 105 106 106
ReferencesAchard S, Salvador R, Whitcher B, Suckling J, Bullmore E. A resilient, low-frequency, small-world
human brain functional network with highly connected association cortical hubs. The journal ofneuroscience. 2006; 26:63–72. http://www.ncbi.nlm.nih.gov/pubmed/16399673. [PubMed:16399673]
Kuceyeski et al. Page 15
Neuroimage. Author manuscript; available in PMC 2012 September 1.
NIH
-PA Author Manuscript
NIH
-PA Author Manuscript
NIH
-PA Author Manuscript
Alemán-Gómez, Y.; Melié-García, L.; Valdés-Hernández, P. Ibaspm: Toolbox for automaticparcellation of brain structures; Presented at the 12th Annual Meeting of the Organization forHuman Brain Mapping; Florence, Italy. 2005; http://www.thomaskoenig.ch/Lester/ibaspm.htm
Assaf Y, Pasternak O. Diffusion tensor imaging (dti)-based white matter mapping in brain research: areview. Journal of molecular neuroscience: MN. 2008; 24:51–61. http://www.ncbi.nlm.nih.gov/pubmed/18157658. [PubMed: 18157658]
Basser P. Inferring microstructural features and the physiological state of tissues from diffusion-weighted images. NMR in Biomedicine. 1995; 8:333–344. http://doi.wiley.com/10.1002/nbm.1940080707. [PubMed: 8739270]
Basser P, Mattiello J, LeBihan D. Mr diffusion tensor spectroscopy and imaging. Biophysical Journal.1994; 66:259–267. http://linkinghub.elsevier.com/retrieve/pii/S0006349594807751. [PubMed:8130344]
Basser P, Pierpaoli C. Microstructural and physiological features of tissues elucidated by quantitative-diffusion-tensor mri. Journal of Magnetic Resonance, Series B. 1996; 111:209–219. http://linkinghub.elsevier.com/retrieve/pii/S1064186696900862. [PubMed: 8661285]
Basser P, Pierpaoli C. A simplified method to measure the diffusion tensor from seven mr images.Magnetic resonance in medicine. 1998; 39:928–34. http://www.ncbi.nlm.nih.gov/pubmed/9621916.[PubMed: 9621916]
Behrens T, Woolrich M, Jenkinson M, Johansen-Berg H, Nunes R, Clare S, Matthews P, Brady J,Smith S. Characterization and propagation of uncertainty in diffusion-weighted mr imaging.Magnetic Resonance in Medicine. 2003; 50:1077–1088. [PubMed: 14587019]
Bowman F, Derado G, Chen S, Organization for Human Brain Mapping 2009 Annual Meeting.Evaluating functional connectivity using fmri data with diffusion-based anatomical weighting.NeuroImage. 2009; 47:S147–S147.
Charil A, Zijdenbos A, Taylor J, Boelmana C, Worsleya K, Evansa A, Dagher A. Statistical mappinganalysis of lesion location and neurological disability in multiple sclerosis: application to 452patient data sets. NeuroImage. 2003; 19:532–544. http://linkinghub.elsevier.com/retrieve/pii/S1053811903001174. [PubMed: 12880785]
Collins D, Zijdenbos A, Kollokian V, Sled J, Kabani N, Holmes C, Evans A. Design and constructionof a realistic digital brain phantom. Medical Imaging, IEEE Transactions on 17. 1998:463–468.
Fan J, McCandliss BD, Sommer T, Raz A, Posner MI. Testing the efficiency and independence ofattentional networks. Journal of Cognitive Neuroscience. 2002; 14:340–347. [PubMed: 11970796]
Filippi M, Mammi S, Martinelli V, Campi A, Colombo B, Scotti G, Canal N, Comi G. Correlationbetween brain mri lesion volume and disability in patients with multiple sclerosis. ActaNeurologica Scandinavica. 1996; 94:93–96. [PubMed: 8891052]
Friman O, Farneback G, Westin C. A bayesian approach for stochastic white matter tractography.IEEE Transactions on Medical Imaging. 2006; 25:965–978. [PubMed: 16894991]
Friston, K.; Ashburner, J.; Kiebel, S.; Nichols, T.; Penny, W. Statistical parametric mapping: Theanalysis of functional brain images. Academic Press; 2006. p. 656
Gondran, M.; Minoux, M. Graphs and Algorithms. John Wiley and Sons; 1984. Discreet MathematicsSeries: 1-484
Hess C, Mukherjee P, Han E, Xu D, Vigneron D. Q-ball reconstruction of multimodal fiberorientations using the spherical harmonic basis. Magnetic Resonance in Medicine. 2006; 56:104–117. [PubMed: 16755539]
Iturria-Medina Y, Canales-Rodriguez E, Aleman-Gomez Y, Sotero R, Melie-Garcia L. Studying thehuman brain anatomical network via diffusion-weighted mri and graph theory. NeuroImage. 2008;40:1064–76. http://www.ncbi.nlm.nih.gov/pubmed/18272400. [PubMed: 18272400]
Iturria-Medina, Y.; Canales-Rodriguez, E.; Melie-Garcia, L.; Valdes-Hernandez, P. Bayesianformulation for fiber tracking; Presented at the 11th Annual Meeting of the Organization forHuman Brain Mapping; Toronto, Ontario, Canada. 2005; Available on CD-Rom in NeuroImage26(1)
Iturria-Medina Y, Canales-Rodriguez E, Melie-Garcia L, Valdes-Hernandez P, Martinez-Montes E,Aleman-Gomez Y, Sanchez-Bornot J. Characterizing brain anatomical connections using diffusionweighted mri and graph theory. NeuroImage. 2007; 36:645–660. [PubMed: 17466539]
Kuceyeski et al. Page 16
Neuroimage. Author manuscript; available in PMC 2012 September 1.
NIH
-PA Author Manuscript
NIH
-PA Author Manuscript
NIH
-PA Author Manuscript
Ivkovich M, Kuceyeski A, Raj A. Statistics of weighted brain networks reveal hierarchicalorganization and gaussian degree distribution. PLOS One. in press.
Jacobs M, Donders J. Criterion validity of the california verbal learning test-second edition (cvlt-ii)after traumatic brain injury. Archives of clinical neuropsychology: the official journal of theNational Academy of Neuropsychologists. 2007:143–149. http://www.ncbi.nlm.nih.gov/pubmed/17207963. [PubMed: 17207963]
Kuceyeski, A.; Raj, A. Analysis of connectivity of gray matter regions using dti and graph theory;Presented at the Joint Annual Meeting ISMRM-ESMRMB; Stickholm, Sweden. 2010; 2010. p.1676
Lo C, Wang P, Chou K, Wang J, He Y, Lin C. Diffusion tensor tractography reveals abnormaltopological organization in structural cortical networks in alzheimer?s disease. The Journal ofNeuroscience. 2010; 30:16876–16885. [PubMed: 21159959]
Lu Y, Aldroubi A, Gore J, Anderson A, Ding Z. Improved fiber tractography with bayesian tensorregularization. NeuroImage. 2006; 31:1061–1074. [PubMed: 16563804]
Mainero C, DeStefano N, Iannucci G, Sormani M, Guidi L, Federico A, Bartolozzi M, Comi G, FilippiM. Correlates of ms disability assessed in vivo using aggregates of mr quantities. Neurology.2001; 56:1331–4. http://www.ncbi.nlm.nih.gov/pubmed/11376183. [PubMed: 11376183]
Menezes NM, Ay H, Zhu MW, Lopez CJ, Singhal AB, Karonen JO, Aronen HJ, Liu Y, Nuutinen J,Koroshetz WJ, Sorensen AG. The real estate factor: quantifying the impact of infarct location onstroke severity. Stroke. 2007:194–197. http://stroke.ahajournals.org/cgi/content/full/38/1/194.[PubMed: 17122428]
Mori S, Crain B, Chacko V, Van Zijl P. Three-dimensional tracking of axonal projections in the brainby magnetic resonance imaging. Annals of Neurology. 1999; 45:265–269. http://doi.wiley.com/10.1002/1531-8249(199902)45:23.0.CO;2-3. [PubMed: 9989633]
Nazzal M, Saadah M, Saadah L, Trebinjac S. Acute ischemic stroke: relationship of brain lesionlocation and functional outcome. Disability and rehabilitation. 2009; 31:1501–6. http://www.ncbi.nlm.nih.gov/pubmed/19479508. [PubMed: 19479508]
Niogi S, Mukherjee P, Ghajar J, Johnson C, Kolster R, Sarkar R, Lee H, Meeker M, Zimmerman R,Manley G, McCandliss B. Extent of microstructural white matter injury in postconcussivesyndrome correlates with impaired cognitive reaction time: a 3t diffusion tensor imaging study ofmild traumatic brain injury. American Journal of Neuroradiology. 2008a; 29:967–73. [PubMed:18272556]
Niogi S, Mukherjee P, Ghajar J, McCandliss B. Individual differences in distinct components ofattention are linked to anatomical variations in distinct white matter tracts. Frontiers inNeuroranatomy. 2010; 4:1–12.
Niogi SN, Mukherjee P, Ghajar J, Johnson CE, Kolster R, Lee H, Suh M, Zimmerman RD, ManleyGT, McCandliss BD. Structural dissociation of attentional control and memory in adults with andwithout mild traumatic brain injury. Brain. 2008b; 131:3209–3221. http://brain.oxfordjournals.org/cgi/reprint/131/12/3209.pdf. [PubMed: 18952679]
Oishi K, Faria A, Jiang H, Li X, Akhter K, Zhang J, Hsu J, Miller M, van Zijl P, Albert M, LyketsosC, Woods R, Toga A, Pike G, Rosa-Neto P, Evans A, Mazziotta J, Mori S. Atlas-based wholebrain white matter analysis using large deformation diffeomorphic metric mapping: Application tonormal elderly and alzheimers’ disease participants. Neuroimage. 2009:486–99. http://www.ncbi.nlm.nih.gov/pmc/articles/PMC2885858/. [PubMed: 19385016]
Pearson K. On lines and planes of closest fit to systems of points in space. Philosophical Magazine.1901:559–572. http://stat.smmu.edu.cn/history/pearson1901.pdf.
Pereira J, Xiong L, Acosta-Cabronero J, Pengas G, Williams G, Nestora P. Registration accuracy forvbm studies varies according to region and degenerative disease grouping. NeuroImage. 2010;49:2205–2215. [PubMed: 19892022]
Pierpaoli C, Basser P. Toward a quantitative assessment of diffusion anisotropy. Magnetic Resonancein Medicine. 1996; 36:893–906. http://doi.wiley.com/10.1002/mrm.1910360612. [PubMed:8946355]
Kuceyeski et al. Page 17
Neuroimage. Author manuscript; available in PMC 2012 September 1.
NIH
-PA Author Manuscript
NIH
-PA Author Manuscript
NIH
-PA Author Manuscript
Rutgers D, Toulgoat F, Cazejust J, Fillard P, P. L, Ducreux D. White matter abnormalities in mildtraumatic brain injury: a diffusion tensor imaging study. American journal of neuroradiology:AJNR. 2008; 29:514–9. http://www.ncbi.nlm.nih.gov/pubmed/18039754.
Schmahmann J, Pandya D. Fiber Pathways of the Brain. Oxford Scholarship Online Monographs.2006
Singh M, Jeong J, Hwang D, Sungkarat W, Gruen P. Novel diffusion tensor imaging methodology todetect and quantify injured regions and affected brain pathways in traumatic brain injury.Magnetic Resonance Imaging. 2010; 28:22–40. [PubMed: 19608369]
Sotero R, Trujillo-Barreto N, Iturria-Medina Y, Carbonell F, Jimenez J. Realistically coupled neuralmass models can generate eeg rhythms. Neural Computation. 2007; 19:478–512. http://www.mitpressjournals.org/doi/pdf/10.1162/neco.2007.19.2.478. [PubMed: 17206872]
Sporns O, Chialvo D, Kaiser M, Hilgetag C. Organization, development and function of complex brainnetworks. Trends in cognitive sciences. 2004; 8:418–25. http://www.ncbi.nlm.nih.gov/pubmed/15350243. [PubMed: 15350243]
Strogatz S. Exploring complex networks. Nature. 2001; 410:268–76. http://www.ncbi.nlm.nih.gov/pubmed/11258382. [PubMed: 11258382]
Tatemichi T, Desmond D, Prohovnik I. Strategic infarcts in vascular dementia: a clinical and brainimaging experience. Arzneimittel-Forschung. 1995; 45:371–385. http://cat.inist.fr/?aModele=afficheN&cpsidt=3479182. [PubMed: 7763329]
Tzourio-Mazoyer N, Landeau B, Papathanassiou D, Crivello F, Etard O, Delcroix N, Mazoyer B,Joliot M. Automated anatomical labeling of activations in spm using a macroscopic anatomicalparcellation of the mni mri single-subject brain. NeuroImage. 2002; 15:273–289. [PubMed:11771995]
Vaessen M, Hofman P, Tijssen H, Aldenkamp A, Jansen J, Backes W. The effect and reproducibilityof different clinical dti gradient sets on small world brain connectivity measures. NeuroImage.2010; 51:1106–1116. [PubMed: 20226864]
Vellinga M, Geurts J, Rostrup E, Uitdehaag B, Polman C, Barkhof F, Vrenken H. Clinical correlationsof brain lesion distribution in multiple sclerosis. Journal of magnetic resonance imaging: JMRI.2009; 29:768–73. http://www.ncbi.nlm.nih.gov/pubmed/19306365. [PubMed: 19306365]
Wen W, Zhu W, He Y, Kochan N, Reppermund S, Slavin M, Brodaty H, Crawford J, Xia A, SachdevP. Discrete neuroanatomical networks are associated with specific cognitive abilities in old age.The Journal of Neuroscience. 2011; 31:1204–1212. [PubMed: 21273405]
Wilson M, Tench C, Morgan P, Blumhardt L. Pyramidal tract mapping by diffusion tensor magneticresonance imaging in multiple sclerosis: improving correlations with disability. Journal ofNeurology, Neurosurgery and Psychiatry. 2003; 74:203–207. http://jnnp.bmj.com/cgi/doi/10.1136/jnnp.74.2.203.
Zalesky A, Fornito A, Seal M, Cocchi L, Westin C, Bullmore E, Egan G, Pantelis C. Disrupted axonalfiber connectivity in schizophrenia. Biol Psychiatry. 2011; 69:80–9. [PubMed: 21035793]
Zhang F, Hancock E, Goodlett C, Gerig G. Probabilistic white matter fiber tracking using particlefiltering and von mises-fisher sampling. Medical image analysis. 2009; 13:5–18. http://www.ncbi.nlm.nih.gov/pubmed/18602332. [PubMed: 18602332]
Kuceyeski et al. Page 18
Neuroimage. Author manuscript; available in PMC 2012 September 1.
NIH
-PA Author Manuscript
NIH
-PA Author Manuscript
NIH
-PA Author Manuscript

Highlights for Kuceyeski, et al.
• We create and validate a white matter connectivity importance map
• It gives the amount of connectivity disruption that occurs when a region isdamaged
• Some tracts important in executive function were of high importance in maps
• We validate by correlating the map’s prediction vs cognitive scores of TBIpatients
• We find the correlation is higher when including map information
Kuceyeski et al. Page 19
Neuroimage. Author manuscript; available in PMC 2012 September 1.
NIH
-PA Author Manuscript
NIH
-PA Author Manuscript
NIH
-PA Author Manuscript

Figure 1.The process by which the connectivity matrices or graphs are obtained.
Kuceyeski et al. Page 20
Neuroimage. Author manuscript; available in PMC 2012 September 1.
NIH
-PA Author Manuscript
NIH
-PA Author Manuscript
NIH
-PA Author Manuscript
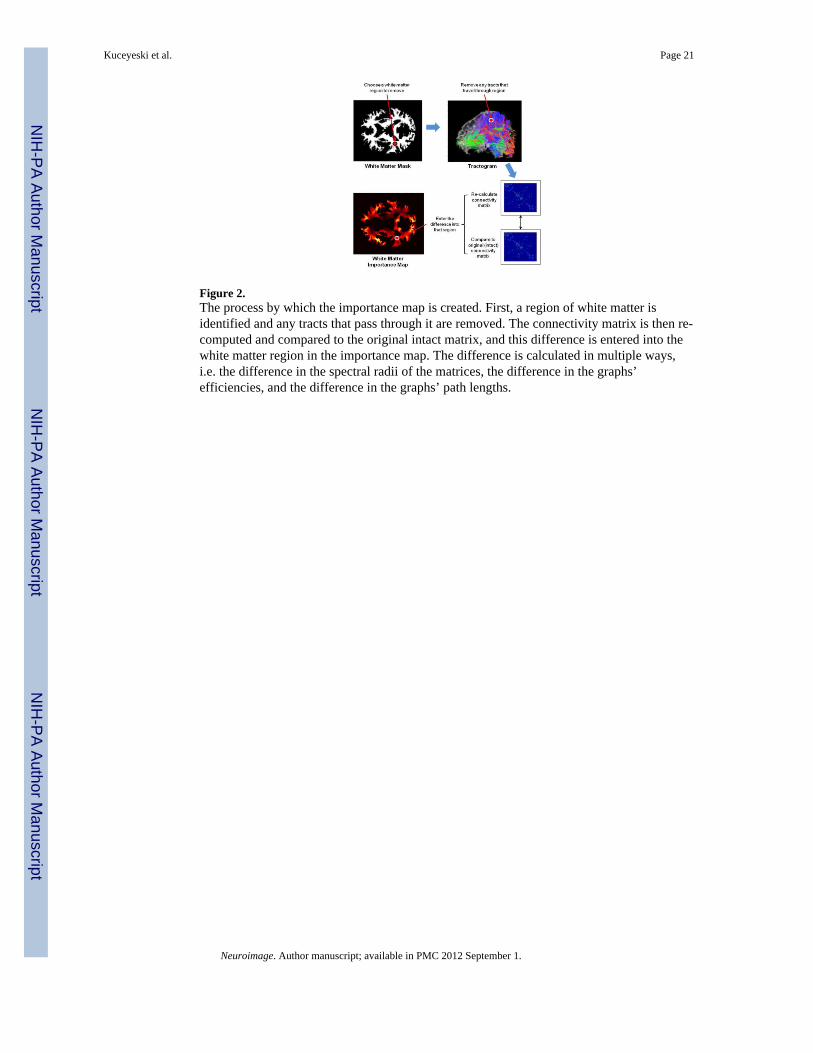
Figure 2.The process by which the importance map is created. First, a region of white matter isidentified and any tracts that pass through it are removed. The connectivity matrix is then re-computed and compared to the original intact matrix, and this difference is entered into thewhite matter region in the importance map. The difference is calculated in multiple ways,i.e. the difference in the spectral radii of the matrices, the difference in the graphs’efficiencies, and the difference in the graphs’ path lengths.
Kuceyeski et al. Page 21
Neuroimage. Author manuscript; available in PMC 2012 September 1.
NIH
-PA Author Manuscript
NIH
-PA Author Manuscript
NIH
-PA Author Manuscript
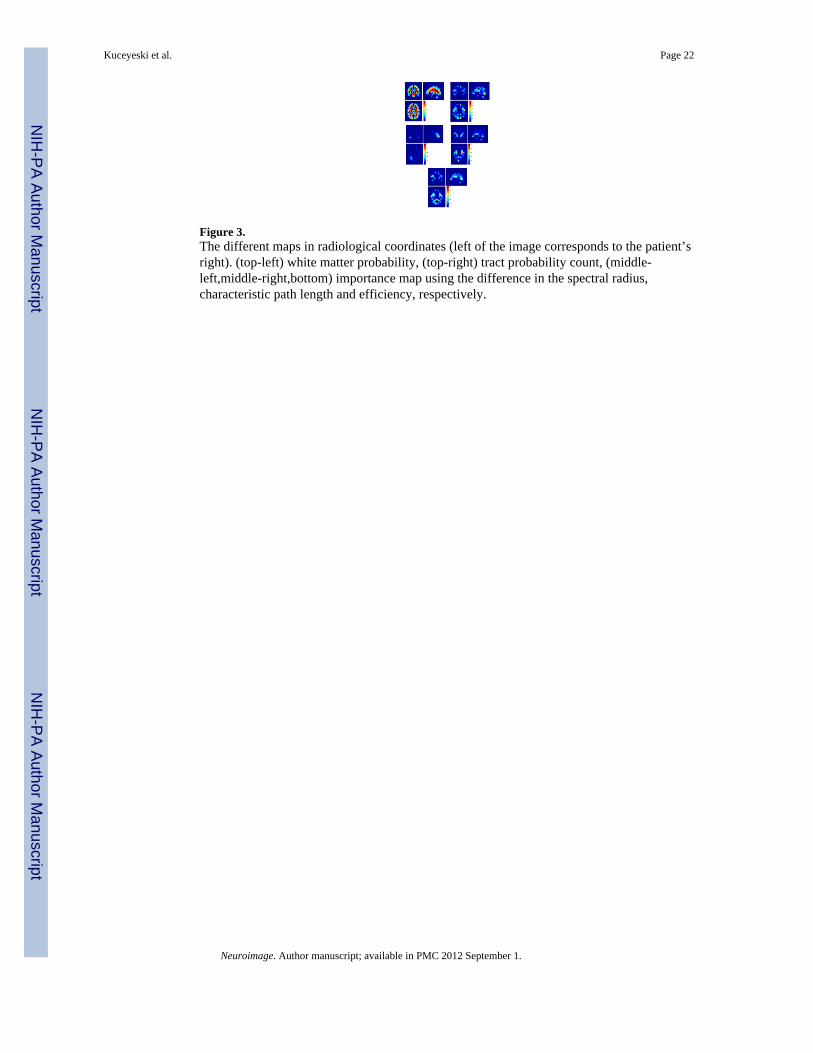
Figure 3.The different maps in radiological coordinates (left of the image corresponds to the patient’sright). (top-left) white matter probability, (top-right) tract probability count, (middle-left,middle-right,bottom) importance map using the difference in the spectral radius,characteristic path length and efficiency, respectively.
Kuceyeski et al. Page 22
Neuroimage. Author manuscript; available in PMC 2012 September 1.
NIH
-PA Author Manuscript
NIH
-PA Author Manuscript
NIH
-PA Author Manuscript
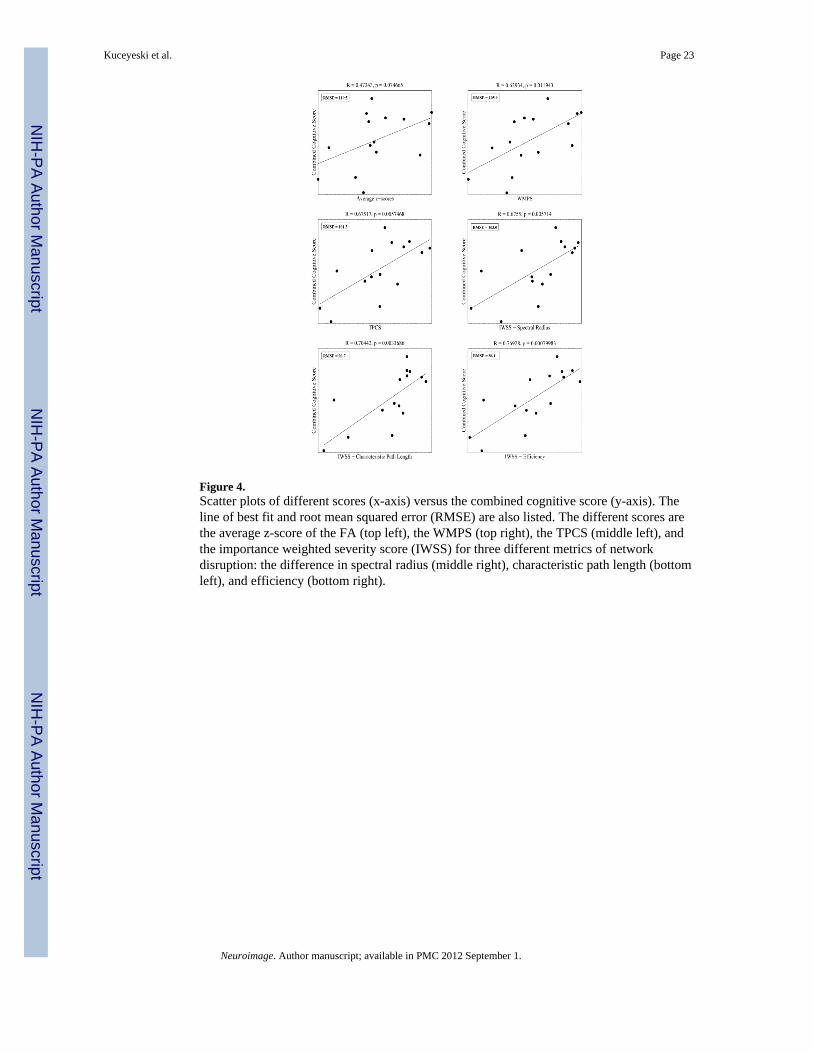
Figure 4.Scatter plots of different scores (x-axis) versus the combined cognitive score (y-axis). Theline of best fit and root mean squared error (RMSE) are also listed. The different scores arethe average z-score of the FA (top left), the WMPS (top right), the TPCS (middle left), andthe importance weighted severity score (IWSS) for three different metrics of networkdisruption: the difference in spectral radius (middle right), characteristic path length (bottomleft), and efficiency (bottom right).
Kuceyeski et al. Page 23
Neuroimage. Author manuscript; available in PMC 2012 September 1.
NIH
-PA Author Manuscript
NIH
-PA Author Manuscript
NIH
-PA Author Manuscript
NIH
-PA Author Manuscript
NIH
-PA Author Manuscript
NIH
-PA Author Manuscript
Kuceyeski et al. Page 24
Table 1
Pearson’s correlation of the average importance map value per white matter region and the WMP (whitematter probability) map, the TPC (tract probability count) map, and the different importance maps (IM).
Map Metric TPC IMSpectral Radius
IMPath Length
IMEfficiency
WMP 0.21 0.04 0.28 0.21
TPC 0.36 0.33 0.74
IM Spectral Radius 0.05 0.53
IM Path Length 0.59
Neuroimage. Author manuscript; available in PMC 2012 September 1.
NIH
-PA Author Manuscript
NIH
-PA Author Manuscript
NIH
-PA Author Manuscript
Kuceyeski et al. Page 25
Tabl
e 2
Pear
son’
s cor
rela
tion
of th
e av
erag
e z-
scor
es o
f FA
, the
WM
PS, t
he T
CPS
, and
the
thre
e IW
SS w
ith th
e va
rious
cog
nitiv
e sc
ores
for t
he 1
5 TB
I pat
ient
s(C
VLT
- 1:
long
del
ay fr
ee re
call,
CV
LT -
2: to
tal r
ecal
l dis
crim
inab
ility
, CV
LT -
3: to
tal r
ecog
nitio
n di
scrim
inab
ility
, AN
T - 1
: ale
rting
, AN
T - 2
:or
ient
ing,
AN
T - 3
: con
flict
), af
ter B
onfe
rron
i cor
rect
ion
for m
ultip
le c
ompa
rison
s. Th
e co
rrec
tion
is p
erfo
rmed
by
divi
ding
α b
y th
e nu
mbe
r of c
andi
date
mea
sure
s, w
hich
in th
is c
ase
is 6
. The
last
col
umn
give
s the
coe
ffic
ient
s use
d fo
r tha
t par
ticul
ar sc
ore
in th
e co
mbi
ned
(PC
A) m
easu
re.
Cog
nitiv
eM
easu
reA
vera
gez-
scor
esW
MPS
TC
PSIW
SSSp
ectr
alR
adiu
s
IWSS
Path
Len
gth
IWSS
Effi
c-ie
ncy
Com
-bi
ned
Coe
ff.
CV
LT -
10.
310.
520.
370.
480.
460.
51−0.01
CV
LT -
20.
300.
450.
400.
500.
500.
500
CV
LT -
30.
190.
390.
110.
260.
140.
260
AN
T - M
ean
−0.45
−0.60
−0.67
a−0.67
a−0.72
a−0.76
b−0.99
AN
T - 1
−0.06
00.
230.
210.
360.
15−0.04
AN
T - 2
0.12
0.35
0.28
0.27
0.33
0.34
−0.04
AN
T - 3
−0.22
−0.25
0.04
−0.03
0.26
0.01
−0.14
Com
bine
d0.
470.
630.
68a
0.68
a0.
70a
0.77
b
a sign
ifica
nt a
t the
leve
l α =
0.0
5
b sign
ifica
nt a
t the
leve
l α =
0.0
1
Neuroimage. Author manuscript; available in PMC 2012 September 1.