Chloride-Induced Stress Corrosion Cracking in Used Nuclear ...
Upload
khangminh22Category
view
1download
0
Ames Laboratory ISC Technical Reports Ames Laboratory
11-1955
The formation of thallium chloride complexes andtheir extraction into etherDonald Leonard HorrocksIowa State College
A. VoightIowa State College
Follow this and additional works at: http://lib.dr.iastate.edu/ameslab_iscreports
Part of the Chemistry Commons
This Report is brought to you for free and open access by the Ames Laboratory at Iowa State University Digital Repository. It has been accepted forinclusion in Ames Laboratory ISC Technical Reports by an authorized administrator of Iowa State University Digital Repository. For moreinformation, please contact [email protected].
Recommended CitationHorrocks, Donald Leonard and Voight, A., "The formation of thallium chloride complexes and their extraction into ether" (1955).Ames Laboratory ISC Technical Reports. 132.http://lib.dr.iastate.edu/ameslab_iscreports/132
brought to you by COREView metadata, citation and similar papers at core.ac.uk
provided by Digital Repository @ Iowa State University
The formation of thallium chloride complexes and their extraction intoether
AbstractThallium is one of a large group of elements which can be extracted into ethers from halogen acid solutions.The general lack of knowledge of the extraction process for these salts has given strong impetus to the study ofall aspects of it.
KeywordsAmes Laboratory
DisciplinesChemistry
This report is available at Iowa State University Digital Repository: http://lib.dr.iastate.edu/ameslab_iscreports/132
UNCLASSIFIED
UN CLASS I FlED
ISC-703
CHEMISTRY
UNITED STATES ATOMIC ENERGY COMMISSION
THE FORMATION OF THALLIUM CHLORIDE COMPLEXES AND THEIR EXTRACTION INTO ETHER
By Donald Leonard Horrocks A. Voigt
November 1955
Ames Laboratory Iowa State College Ames, Iowa
Technical Information Service Extension, Oak Ridge, Tenn.
Work performed under Contract No. W-7405-Eng-82.
LEGAL NOTICE This report was prepared as an account of Government sponsored work. Neither the
United States, nor the Commission, nor any person acting on behalf of the Commission:
A. Makes any warranty or representation, express or implied, with respect to the accuracy, completeness, or usefulness of the information contained in this report, or that the use of any information, apparatus, method, or process disclosed in this report may not infringe privately owned rights; or
B. Assumes any liabilities with respect to the use of, or for damages resulting from the use of any information, apparatus, method, or process disclosed in this report.
As used in the above, "per son acting on behalf of the Commission" includes any employee or contractor of the Commission to the extent that such employee or contractor prepares, handles or distributes, or provides access to, any information pursuant to his employment or contract with the Commission.
This report has been reproduced directly from the best available copy.
Printed in USA. Price 45 cents. Available from the Office of Technical Services, Department of Commerce, Washington 25, D. C.
AI!C, Oak Riclge, Te1111.
ISC-703
TABLE OF CONTENTS
ABSTRACT
INTRODUCTION
REVIEW OF LITERATURE
A. Thallium Chemistry in General B. Extraction from Acid Solutions by Ether
MATERIALS
A. Thallium-204 B. Thallium(III) Perchlorate C. Lithium Chloride D. Lithium Perchlorate E. Miscellaneous
. l·ffiTilOD OF INTERPRETATION OF DATA
EXPERIMENTAL INVESTIGATION
A. General Procedure B. · Preliminary Investigation C. Temperature Dependence of the Partition
Coefficient D. Empirical Formula of Compound in Ether Phase E. Determination of K.5 F. Low Lithium Chloride Concentrations G. Extraction Studies at . Constant I onic Strength
and High LiCl Concentrations H. Dependence of the Extraction upon Acid
Concentrations
SU1.'XAHY AND CONCLUSIONS
LITERATUaE CITED
iii
Page iv
1
1
1 3
7
7 8 9
10 10
10
16
16 18
24 29 37 37
42
61
69
72
iv ISC-703
THE FORMATION OF THALLIUM CHLORIDE COMPLEXES AND THEm
EXTRACTION INTO ETHER*
by
Donald Leonard Horrocks and A. Voigt
ABSTRACT
Thallium is one of a large group of elements which can be extracted into ethers from halogen acid solutions. The general lack of knowledge of the extraction process for these salts has given strong impetus to the study of all aspects of it.
Since there has been no previous investigation on the fundamental nature of the extraction of thallium-chloride complexes from HCl solutions, it was the purpose of this work to study the extraction under various conditions, using radio tracer techniques as the tool. This investigation, employing isopropyl ether, had as its immediate objective the determination of the empirical formula of the thallium compound in the ether phase and the equilibrium constant for the extraction process.
In this investigation it was found necessary to study the extraction at constant, but high, ionic strength. Since the extraction equilibrium constant is a function of the activities of the thallium-chloride complexes, the activity coefficients anu the concentrations of the various complexes need to be known, and the usual methods of determining the activity coefficients, such as simple extensions of the Debye-Huckel law, could not be used at these high values of the ionic strength. Methods and equations were developed to determine these activity coefficients. This method is applicable to systems in which the ionic strength is constant, the complex ions are large and the concentration's of the complexes are small.
It was found that the compound present in the ether phase was essentially HTlCll! and the equilibrium constant for the extraction was defined as:
K =
where the parentheses indicate activities and the subscript 11e 1t indicates the ether phase. For investigations performed at constant acidity a new extraction equilibrium constant was defined:
* This report is based on a Ph.~. thesis by Donald Leonard Horrocks submitted November, 1955 to Iowa State College, Ames, Iowa.
..
ISC-703 v
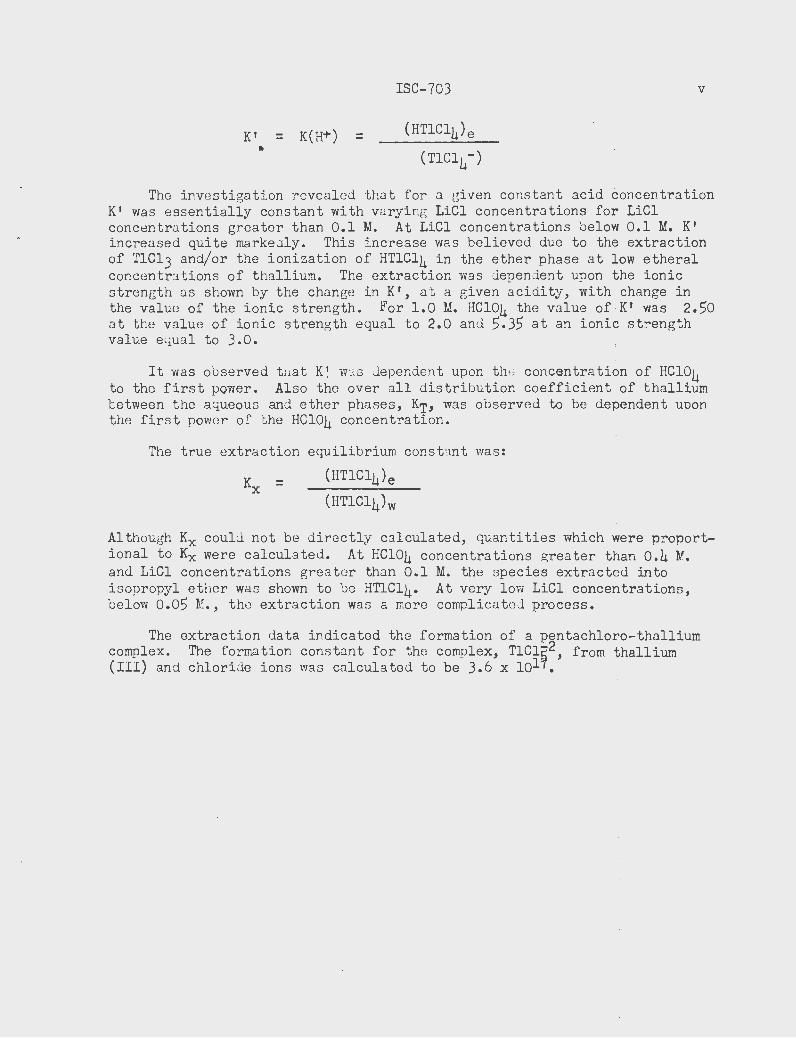
K' = K(H+) = •
The investigation revealed that for a given constant acid 6oncentration K1 was essentially constant with varying LiCl concentrations for LiCl concentr a tions greater than 0.1 M. At LiCl concentrations below 0.1 M. K' increased quite markedly. This increase was believed due to the extraction of TlCl3 and/or the ionization of HTlCl4 in the ether phase at low etheral concentra tions of thallium. The extraction was dependent upon the ionic strength as shown by the change inK', at a given acidity, withchange in the value of the ionic strength. For 1.0 M. HCl04 the value of ·K' was 2.50 at the value of -ionic strength equal to 2.0 and 5.35 at an ionic strength value equal to 3.0.
It was observed that K! w:-; s dependent upon the concentra tion of HCl04 to the first power. Also the over all distribution coefficient of thallium be tween the aqueous and ether phases, KT, was observed to be dependent upon the first power o f the HC104 concentration.
The true extra ction equilibrium cons t ant was :·
=
Although Kx could not be directly calculated, quantities which were proportional to Kx were calculated. At HCl04 concentrations great er than 0.4 Y.. and LiCl concentrations great er than 0.1 M. t he species extracted into i sopropyl ether was shown to be HTlCl4. At very low LiCl concentrations, below 0.05 M., tho extraction was a more complica t ed process.
The extraction data indicated the formation of a pentachloro-thalliurn complex. The formation cons tant for the complex, T1Cl~2, from thallium (III) and chloride ions was calculated to be 3.6 x lol1.
ISC-703 1
INTRODUCTION
.. !
Thallium is one of a large group of elements which are extracted into ether from halogen acid solutions. The general lack of knowledge of the extraction of these salts has given strong impetus to the study of all aspects of the extraction process.
As is the case with the trivalent cations of Group III B and many other trivalent cations, thallium, in its ~3 oxidation state, forms a series of halogen complexes in an aqueous solution of the corresponding halogen acid. The partition of the metal between an acid solution of the metal-halogen complexes and ether has been studied under many conditions , but virtually no investigations have been carried out at constant ionic strength on the fundamental dependence of the equilibrium between the aqueous and ether solutions upon the hydrogen and chlorideion concentration.
It is the purpose of this work to study, by means of radiochemical methods, the partition of thallium( III) chloride complexes between H ~104 -LiCl - LiCl04 solutions and iso-propyl ether. The investigation ha s as its immediate objective the determination of the empirical formula of the thallium compound in the ether solution and the equilibrium constant for the extraction process. In this manner, it is hoped that our knowledge of the extraction process of trivalent metal-halogen complexes, and the more general topic of liquid-liquid partition, will be increased by another small amount. ·
REVIEW OF LITERATURE
A. Thallium Chemistry in General
The chemistry and literature of thallium, prior to 1950, have been reviewed by Waggaman, Heffner and Gee (l) and Howe and Smith (2). These reviews .which inc ude a long list of references are exceedingly useful in reviewing the chemistry of thallium. Waggaman, Heffner and Gee (l) review the properties, sources, recovery and uses of the element and its compounds and report on the methods of analysis of thallium. Howe and Smith (2) discuss the history, chemistry and properties of thallium with special emphasis on its metallurgy.
The discovery of thallium is generally credited to W. Crookes (3) who noted a ne~ element while making a spectroscopic examination of seleniferous deposits in the lead chambers of a sulfuric aci d factory. He named the new element thallium, derived from the Latin word thallus, meaning a
2 ISC-703
budding twig, because of the characteristic green line it imparted to the spectrum.
In an independent investigation, A. Lamy (4) reported in 1862 that he had observed the characteristic green line while examiningthe sediment from the chambers of a sulfuric acid plant. He made valuable contributions in determining the physical and chemical properties of the new element.
Because of the comparative s carcity of thallium, it had continued to be a laboratory curiosity for many years. In 1919 the use of thallium in photosensitive cells was patented. Several new uses for thallium were developed in 1925, particularly as a poison for rodents and later as an insecticide. Thallium has now become a very important element.
Thallium sources are of two broad groups, natural occurrences and industrial wastes. The natural sources include deposits of thallium minerals in rocks or dissolved in brine. Thallium can be derived from industrial wastes and residues where the thallium from the original raw materials has been concentrated.
Hopkins (5) discussed the properties of thallium metal and its compounds quite thoroughly. He discussed at length many compounds of the two oxidation states of thallium; thallous and t hallic, Tl(I) and TL(III) respectively. Thallous resembles the ~nalogous compounds of the alkali metals in the soluble compounds and those of lead in the more difficulty soluble ones, while thallic resembles the compounds of iron and aluminum. Thallic compounds are considerabJy hydrolyzed and are s table only in the presence of an excess of acid. Thallous compounds are oxidized to thallic by KMn04, Cl2, Br2 and aqua regia but not by HN03 alone. The reduction of thallic to tnallous is easily accomplished by SnCl2, H2S03, metallic t hallium and FeSo4. Thallous and thallic salts readily f orm complex salts with each other, such as TlCl3 • 3TlCl.
Hillebrand, Lundell, Bright and Hoffman (6) discussed methods of separation and determination of thallium. Thallium is not precipitated by H2S in strong acid solutions, however, separations based on this fact are as a rule worthless, since thallium forms compounds with members of the H2S group, such as arsenic, antimony, tin or copper. Thallium is completely precipitated as Tl2S in acetic acid soluti ons by H2S or by (NH4)2S• Hillebrand, et al. (6) discuss the separation of thallium from lead, silver, cadmium, iroD; aluminum, chromium, cobalt, nickel, zinc, mangnese, alkaline earths, magnesium, gallium and alkalies. They also mention the separation of thallium from a number of elements based upon the repeated extraction of thallic chloride from 6N HCl solution by means of ether (7). They discussed several methods of determination of thallium, of which the most important are weighing as Tl2Cr04 (8), Tl203 (9), and Tli (10).
Noyes and Bray (11) discuss the qualitative behavior of thallium (I) and thallium (III). They review the methods of separation and detection of various compounds of thallium.
ISC-703 3
B. Extraction from Acid Solutions by Ether
Rothe (12) was the first to study the method of extraction of salts from acid solutions by means of ether. He studied the extraction of FeCl3 into ether from HCl solutions. Other early workers on the extraction of FeCl3 into ether included Langmuir (13), who applied it to the separation of iron and nickel, and Kern (14), who applied it to the separation of iron and uranium. The latter studies included work on the dependence of the extraction upon the concentration of the HCl. Speller (15) used the extraction method to separate iron from copper, manganese, aluminum, chrominum, cobalt ana nickel.
In 1908 Noyes, Bray and Spear (7) reportect the extraction of TlCl3 into ether from HCl solution. They noted that 15' mg. of thallium as TlCl3 in HCl (sp. gr., 1.12) was completely removed from the aqueous solution after two extractions with ether. They reported that 90-95 percent of the original thallium as TlCl3 was extracted when a 6 N HCl solution was shaken with ether.
Swift (16) reported that gallium, along with iron and thallium, was extracted by ether from a HCl solution. Experiments, carried out with small amounts of gallium in HCl solutions of various concentrations indicated that the extraction of gallium by ether was more nearly complete when the initial concentrations of the HCl was 5.5 N. Swift (16) showed that by treating a 4.9-.5.9 N solution of HCl containing gallium with an equal amount of ether, previously saturated with a solution of IICl of the same concentration, about 97 percent of the gallium was extracted.
Wada and Ishii (17) reported that TlBr3 can be separated from all other salts of metals except gold by shaking the HBr solution with ether. They showed that extraction of TlCl3 and TlBr3 could be carried out at much lower concentrations of acids than had been assumed earlier. They stated that 99 percent of the original thallium, present as TlBr3 in HBr, was extracted into diethyl ether when the initial HBr concentration was O.lN. At t his HBr concentration no Fe(III), Ga(III) or In (III) was extracted, however, 99 percent of the original Au(III) was extracted.
"Solvent Extraction and Its Applications to Inorganic Analysis" is the title of a paper written by Irving (18) in which he attempts to present a comprehensive survey of liquid-li<luid partition of inorganic substances. He discusses partition isotherms, extraction for removal and fractionation, factors favoring solvent extraction and the extraction of nitrates, chlorides, bromides, fluorides and other inorganic compounds. He also presents information about the extraction of organo-metallic complexes; dithizona tes, oxinates, cupferrates and other metal complexes.
Irving (18) pointed out the curious and analytically important alterations in extractability in passing down Group III B, in the extraction
4 ISC-703
from 6 N HCl by ether the extractabilities were approximately Al (0 percent), gallium (40-60 percent), indium (trace) and thallium (90-95 percent). The extraction of the metal bromides f rom 6 N HEr was approximately gallium (57 percent), indium (99 percent) and thallium (92 percent). Indium, which was extracted with difficulty from HCl solution, was removed completely from 4 to 6 N HEr solutions . The extraction of thallium(III) was complete over a large range of HBr concentrations, at least 99 percent extraction from 0.1 N to 5 .0 N HBr. Using 0.5 N HBr thallium(III) was separated from all metals except gold, which was 99 percent extracted as bAuBr4. 'fhe efficiency of extrac~ion of iron was reduced by replacing HCl by HEr and the acidity for maximum extraction was also lowered.
Oxidation produces great changes in the extractability of metals. Edwards and Voigt (19) found that the distribution coefficient of Sb(V) between iso-propyl ether and 6 . 5-8 . 5 N HCl was greater than 200, whereas that of Sb(III) was only 0.016. Irvi ng and Rossotti (20) report that Tl(III) can be extracted from dilute HCl so that very little iron or gallium are extracted. However, Tl(I) had a maximum extraction of 7.66 percent in 6.19 N HCl. When Tl(III) ether extracts are shaken with a reducing solution Tl(I) is transferred to the aqueous phasej thus giving a very good separation method for thallium. Irving (18) reports the following percentages of metal chloride oxi..dized--reduced pairs extracted by ether from 6 N HCl; Fe(II) (0 percent) and Fe(III) (99 percent), As(III) (68 percent) and As(V) (2-4 percent), Tl(I) (0 percent) and Tl(III) (90-95 percent), Sn(II) (15-30 percent) and Sn(IV) (17 percent) and Sb(III) (66 percent) and Sb(V) (81 percent) .
Irving, Rossotti and Drysdale (21) i nvestigated the extraction of indium by diethyl ether from halogen acids of various concentrations. They showed that the percentage of indium halide extracted by die thyl ether from the corresponding halogen acid increased in the order Cl (Br< I and the maximum extraction occurs at decreasing acid concentrations in the same order . Indium iodide was extracted quantitatively from HI of normalities between 0.5 and 2 . 5 1 the distribution coefficient being greatest at 1.5 N.
The partition of minute tracer amounts of Gac13 between ether and HCl was studied by Grahame and Seaborg (22) . They observed t hat the distribution ratio for CaCl3 between ether and 6 N HCl was fairly constant for initial quantities of lo-12 g. and 7 mg. 9 the distribution ratio being 17 . 5-19.0 and 16 . 9 respectively . Grahame and Seaborg (22) also reported the distribution ratios of several metallic halides between ether and HCl. at low concentrations by the use of radioactive isotopes. They studied the distribution of MnCl2, CoCl2 and FeCl1 between ether and HCl at various HCl concentrations . They observed that tne maximum extraction of GaClJ occurred in about 5 .5 N HClJ the same as reported by Swift (16) . Grahame and Seaborg (22) reported that the activity coefficient of the Gac13 in the ether phase, at very low concentrations 9 was proportional to the concentration because of the relatively large amount of HCl dissolved in the ether.
ISC-703 5
Irving and Rossetti (20), with the aid of radio-nuclides, studied the extraction by ether of GaBr3 and Gai3, InCl3 and Ini3, Tli3 and TlCl,TlBr and Tli from the correspondmg halogen acids over a range of acid normalities. They .reported changes in the volume after equilibrium of ether and aqueous phases increased with the strength of the halogen acid in the order BCl (HBr (HI., They report only a small change in the volume of the phases for HCl strength of up to $.0 N, while the volume change of the phases is very large for HBr strengths ab9ve 3.0 N and for HI strengths above 1.0 N.
Irving and Rossetti (20) showed that Ini3 was extracted quantitatively, over th~ range: o·.5 ·- 2.5 N HI, while Gai3 was not extracted under :similar condi tiorts. The;· showe~ that Tli3, 1.ike TlBr1 and TlCl3, was quantitiatively extracted from HI solutlons of strenGth 0.05 to 2.0 N. Small amounts of Tli and l+B~, but not r1c1, were extracted quantitatively from 0.5 - 2.5 N HI and- f:t:Yom 1.0 - 3.2 N HBr respectively. For all of the systems studies by Irving and Rossetti (20) the percentage extraction increased w:i..th acid normal,ity .and passed through a maximum; and the order of the halides for '"'Tich the maximum extraction occurs at lower acid concentrations was r.( Br'(Cl.
The distribution of GaCl3 between aqueous HCl and isopropyl ether was studied by Nachtrieb and Fryxell (23). They de termined the empirical formula of the. ga;:Llium complex in the ether phase by performing analyses of a n\unber of ether phases for gallium, chloride and ionizable hydrogen. They reported that essentially equimolecular amounts of HCl and Gac13 are co-extracted fro~ aqueous solutions initially less than 7 M.HCl. Extra'ctions from 8 M HCl gave HCl : GaCl3 ratios significantly greater than unity which corresponded to conditions favoring the formation of complex molecules containing more than one molecule of HCl. They stated that the empirica], formula for the gallium complex was quite analogous to that detennined 1or iron by Nachtrieb and Conway (24).
Nachtrieb and Fryxell(23) studied the variation of the dis tribution coefficient with GaCl3 concentrations. They stated that on the assumption of a polymerized galllum complex in the ether phase , the extraction at sufficiently low gallium concentrations corresponded to the 11ideal" behavior predicted by the simple Nernst distribution equation (25). However, at higher galliuin coneentrations the change is quite marked, possibly due to a dec~eas'e in the aqueous HCl concentration due to its extraction and the saturation of the gallium complex in the ether phase.
The distribution coefficients were determined as a function of tlj.e ac.idity for several initial gallium concentrations by Nachtrieb and Fryxell (23). They reported the optimum acidity for efficient extraction was about 7.2 M. They also reported the appearance of a three phase system for extrattions made from 8.0 and 9.0 M HCl. Near the lower gallium concentration limit of the three-phase region the volume of the intermediate ( 1'heavy ether1') phase was comparatively small but became larger at higher concentration ?f GaCl3, and at very high GaC13 concentrations the system again became two phases •
..
6 ISC-703
In an investigation of thallium, for the purpose of comparison it is of interest to discuss in some detail the extraction from HCl solutions into ether of its well-known homolog, iron. Since the early workers (7, 12-15}, very little work was reported on the extraction of Fec13 from HCl solutions by ether until the paper by Dodson, Forney and Sw~ft (26) in 1936. They studied the effects of varying the iron and acid concentrations, and of peroxide and alcohol upon the extraction of FeCl3 by isopropyl ether. The optimum HCl concentration for efficient extraction with isopropyl ether ranged from 6.5 to 8.5 M. as compared to a range of 5.5 to 6.5 M. for extraction with diethyl ether. At acid concentrations between 7.5 and 9.0 M. three phases were observed, two ether layers and an aqueous layer. The ''heavy11 ether layer of intermediate density contained most of the extracted iron. They reported that at acid concentrations of 8.6 and 9.3 M the separate ether phase was metastable and dissolved in the other phases on continued shaking. The percentage of iron extracted was found to vary with the total amount of iron. Isopropyl ether was found to be superior to diethyl ether for the extraction of both small and large quantities of iron.
Axelrod and Swift (27) studied the extraction of Fe(III) from HCl solutions by dichloroethyl ether and reported the formula of the iron compound in the ether phase. They stated that for their studies dichlorethyl ether had a practical advantage over either ether or isopropyl ether in that it separates as the lower phase. They r~ported no evidence of a decrease in the distribution ratio at HCl concentrations as high as 11.5 M which is contrary the results of Dodson, Forney and Swift (26) with diethyl and isopropyl ether. This indicated a continuous increase with increasing acid concentration of the concentration of the extracted compound. Axelrod! and Swift (27) report'ed the empirical formula of the iron compound in the ether phase as HFeCl4· 4-5 H2o, neglecting polymerization, and possible pr esence of ether in the molecule. This formula compared with the formula of 2(FeC13 • HC1)·9H2o • 15 (c2H5) 2o reported by Kato and Isii (28). . ·
· Nachtrieb and Conway (24) and Nachtrieb and Fryxell (29, 30) made a very thorough study of the extraction of Fec13 by isopropyl ether. Nachtrieb and Conway (24) showed that the emp~rical formula of the iron compound extracted from aqueous Fec13 which does not exceed 8 M. in HCl was HFeCl4. However, for aqueous HCl concentrations exceeding 8 M. the mole ratio of Fec13 to HCl exceuds 1:1. They reported ratios for Fec13 to HCl of 1:1.94 at 8.0 M.HCl, 1:1.96 at 9.0 M.HCl, 1:3.04 at 10.0 M.HCl and 1~4.04 at 11.0 M.HCl. The absorption ~pectrum of the ether phase did not alter noticeably when the ratio of FeCl1 to HC1 exceeds 1:1, therefore it did not seem to indicate the formation of mixtures of higher complexes of the type H2FeCl5, N3FeC16, etc. They studied the extraction of Fec13 as a function of temperature. Usin~ the van't Hoff equation a heat of extraction of -1970 calories per mole was found for 0.9595 M.FeCl3 in 3.50 M.HCl.
ISC-703 7
Nachtri eb and Fryxell (29) performed experiments in which the concentrations of aqueous hydrogen and culo:cide j_ons wore kept constant and the concentration of the total ~;ri valent cat.; 0ns was kept constant by making the combined concentrations of AlCl3 and FeClJ equal to 0.500 M. They reported that the effect of AlCl3 was to increase the efficiency of extraction of low concentrations of iron, but it did not make the distribution coefficient independent of the total iron concentration. Since a non-extractable salt was capable of increasing the efficiency of extraction, they believed that a polymerization with rising concentrations of iron does not explain this increase in the partition coefficient. A selfsalting· out effect of FeCl3 was postulated. They studied the distribution of FeCl3 between aqueous HCl and isopropyl ether at a series of constant HCl concentrations. They observed a constant partition coefficient for a particular HCl concentration for sufficiently dilute FeCl3 solutions.
Stoichiomntric activity coefficients as determined by an e.m.f. cell method for FeCl3 in SF HCl saturated with FeCl2 · H20 were reported by Nachtrieb and Fryxell T30} . They stated that the increase in the partition coefficient of FeCl3 between isopropyl ether and aqueous HCl with the increase in iron concentration was due t o the remarkable decrease in the activity coefficient of the component with increasing concentration.
Myers, Hetzler and Swift (31) s tudied the distribution of Fe(III) between HCl and isopropyl etb=~r solutions to determine the compound extracted. At low acidities, 3 M. in IICl, the ratio of chloride to iron and hydrogen to ·j_ron is approxirnately 4:1 and 1:1 respecti vely . At higher acid concentrations two ether phases appeared and the ratios were somewhat higher in both phases . The amount of water co-ordinated with the ethereal iron was determined at a nunber of acid concentrations . The ratio of moles of water to moles o1 iron in the ether phase varied from S.S to 4.8. They also studied the extraction of FeCl3 by isopropyl ether at a constant acid concentration, 5 .6 WF.HCl. At low iron concentrations the distribution ratio was approximately constant, but as the iron concentration increased the distribution ratio increased quite sharply. At quite high concentrations of iron the distribution ratio not only ceased to increase but actually decreased.
Myers and Metzler (32) calculated the effective polymerization of the ethereal iron. They studied the effect of the variation of the distribution constant with acid concentration and the effect of acid upon the apparent polymerization of the ethereal iron. They observed the formation of two ether phases at high acid concentrations and investigated the effect of acid concentration upon the composition of the two phases.
The visible and ultraviolet absorption spectrums of the isopropyl ether layers were examined by Netzler and Meyers (33). They also studied the molecular weight and magnetic susceptibility of the- iron compound in -the ether layer.
MATERIAL
A. Thallium - 204
In any investigation employing radiochemical methods it is necessary to select the isotope which will facilitate analysis. The isotope selected
8 ISC-703
for this investigation was Tl204, which decays by emission of 0.76 Mev. beta (34) with r- 4.1 ! 0.1 years half-life (3.5). The thallium was received as active TlN03 which was supplied by the Isotopes Branch, United States Atomic Energy Commission, Oak l~idge; Tennessee.
The active TlN01 had to be purified, the main impurities, both beil!g stable, were iron anu lead. The T1No3 was dissolved in aqua regia oxidizin~ the Tl (I) to Tl (III) which was extracted into isopropyl ether from a 6 M. HCl solution. The Tl (III) was re-extracted into water and reduced to Tl (I) with excess H2so3• After removing the excess H2so3 by boiling, the thallium was precipitated as Tli. The Tli was dissolved in a4ua r~gia and the extraction was repeated th~ee times with precipitation of Tl(O]) 3 between extraction steps. The. Tl(0'1) 3 from · the final precipitation was dried at 110° C. for approximately two hours converting it to Tl2o3 • The dark reddish-brown powder was stored in a weighing bottle for use in preparation of stock thallium solutions.
B. Thallium {III) Perchlorate
The Tl needed to make up solutions to the required concentrations was prepared as the perchlorate in order to be in a non-complexed state. A solution of ~l(ClOJ,) 3 was satisfactorily prepared from T;L203 by reaction with HClb~. The Tl?OJ was obtained from thallium metal which was oxidized and purified in t.fi.e same manner as the ac;tive thallium. The lie-sired amounts of purified inactive and active Tl2o3 were dissolved in excess HClOL· The resulting solution was diluted to 2 liters volume and used as tne stock solution in the subsequent experiments.
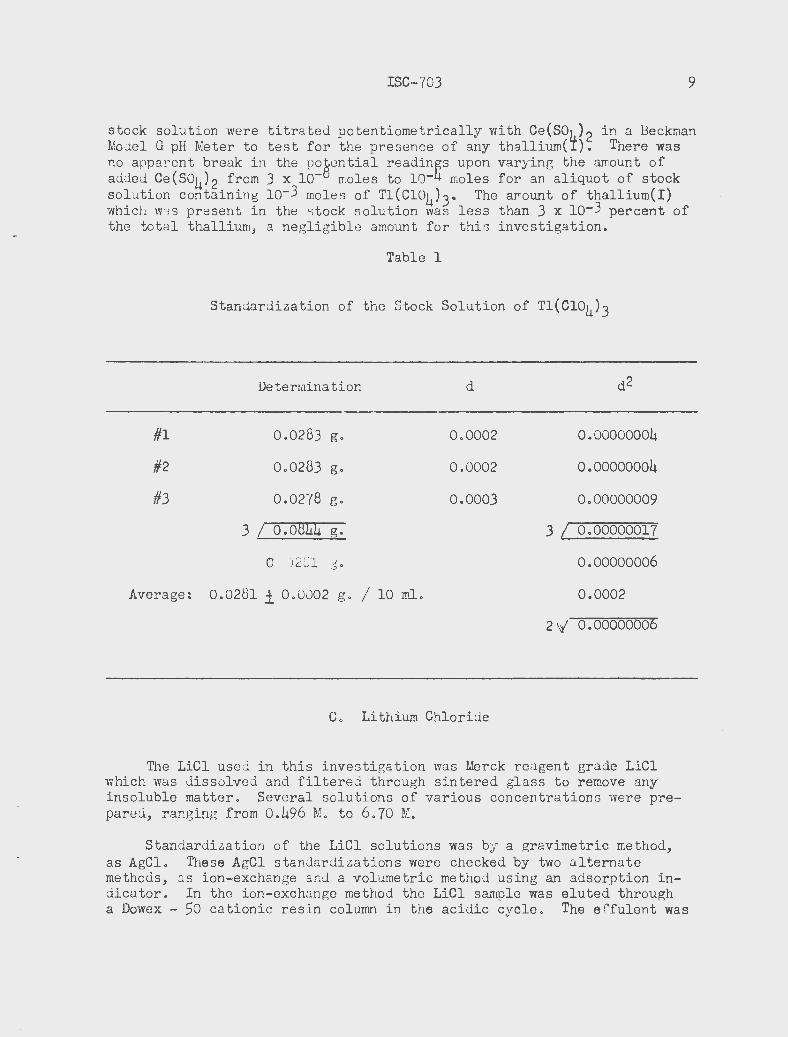
A procedure for standardization of ·thallium solutions was reported by Kleinberg (36). This procedure involved reduction with sulfite and precipitation of Tl2CrOJ, from a basic solution. The results of the standardization of the Tl(Cl04)J solution are shown in Table ~. The stock solution was found to contain 2.fL mg. of Tl2Cr04 per ml. of solution, which equaled 0.0106 M.
To determine the exact concentration of HCl04 in the stock solution, aliquots were titrated against standard NaCH to the phenolphthalein endpoint. Both the free acid and the Tl(Cl04)3 were titrated. Just be.fore the end-point the thallium precipitated as Tl(OH) 3, leaving a clear solution, so that the end-point was easily detected. By calculation, correcting for the Tl(Cl04) 3, the concentration of HCl04 i n the stock solution was 4.05 M.
The stock solution of Tl(ClOJ,) 3, 0.0106 M. in 4.05 M. HCl04, has been very stable and has shown virtually no evidence of decomposition after several months at room temperature. The solution which initially gave no · test for chloride ion, still g:we no test after one year. · Aliquots of the
ISC-703 9
stock solution were titrated potentiometrically with Ce(SOJ 1 ) 2 in a Beckman 1vlodel G pH Meter to test for the presence of any thallium( I). There was no appar ent break in the pogontial readiniTs upon varying the amount of adued Ce(S04) 2 from 3 4 10- moles to 10- moles for an aliquot of stock solution containing lo-3 moles of Tl(Cl04) 3" The amount of thallium( I) which was present in the s tock solution was less than 3 x lo-3 percent of the total thallium, a negligible amount for this investigation.
Table 1
Standardization of the Stock Solution of Tl(Cl04)3
Determination d d2
#1 0.0283 g. 0.0002 0.00000004
#2 0.0283 g. 0.0002 0.00000004
#3 0.0278 g. 0.0003 0.00000009
3 I o.o8u4 g. 3 I 0.00000017
a J 281 .J ;,::, Q 0.00000006
Average: 0.0281 i 0.0002 g. I 1o m1. 0.0002
2"1 0.00000006
C. Lithium Chloriue
The LiCl used in this investigation was Merck reagent grade LiCl which was dissolved and filtered through sintered glass to remove any insoluble matter. Several solutions of various concentrations were prepared, ranging from 0.496 M. to 6.70 M.
Standardization of the LiCl solutions was by a gravimetric method, as AgCl. These AgCl standardizations were checked by two alternate methods, as ion-exchange and a volumetric method using an adsorption indicator. In the ion-exchange method the LiCl sample was eluted through a Dowex - 50 cationic resin column in the acidic cycle. The ef fulent was
10 ISC-703
titrated with standard Na O!-l to the phenolphthalein end,-poant. In the volumetric metho'i the LiCl samples were titrated with s ~CJ,rraard AgNo3 solutions using di-chlorofluorescein as the indicator, In orner t o obtain consistent and correct results by t his method the sample has to be neutral during the titration . Doth of the check methods gave results which agreed with those of the AgCl method.
D. Lithium Perchlorate
Solutions of LiCl04 were prepared from G. Frederick Smith's reagent grade LiCl04 fo~ investigation of the extraction at constant ionic strength. ·
The LiClO!J solution was filtered through a fine sinterl!ld glass funnel and recrystallized from wateJ,". A stock solution was prepared from the recrystallized LiC~04. Two methods were used to determine the concentration of the LiCl04 solutions, ion-exchange and a gravimetric method. ln the ion-exchange method. the LiCl04 sample was eluted through a column of Dowex~ 50 cationic ~esin in the acidic cycle. The effulent was titrated with standard NaOII '"o the phenolphthalein end-point. In the gravimetric procedure the perchlorate was precipitated as tetraphenylarsonium perchlorate by the addition of tetraphenylarsonium chloride (37). The precipitate was coagulated by the addition of HCl, filtered onto sintered glass crucibles, washed with dilute HCl solution, dried at 1100 C. for one-half hour and weighed as tetraphenylarsonium perchlorate. The results of these two methods were in agreement.
E. Miscellaneous
Thr oughout the investigation G. Frederick Smith's doubly vacuum distilled HClO~ was used . Standa~rl solutions of NaOH were prepared f rom Baker and Adamson s reagent grade Nc OH Baker 1 s 11Baker Analyzed" reagent grade AgN03 was used to prepare AgN03 solutions. The pipettes and volumetric flasks used in the preparation of solutions were Kimble's Exax and Pyrex. All solutions were prepared with double distilled water.
METHOD OF INTERPRETATION OF DATA
From the data for counting of samples of the aqueous and other· phases a distribution ratio was calculated,
(1)
ISC-703 11
where:
rrti1 ._. ....., e = concentration of total thallium in the ether phase
I~ iiJ ~l lw ......;; .. _ = concentration of total thallium in the aqueous phase.
Since the measurements of KT were made at equilibrium conditions, the concentration of thallium in the ether phase must be proportional to the activity of one or more of the thallium-chloride complexes in the aqr eous phase, depending upon whether one or more of the chloride complexes are extracted.
It was of importance t o consider the various complexes present in the system. Benoit (38) reported the dissociation constants for the mono-, di-, tri- and tetra-chloro complexes of thallium:
kl --
k2 =
k3 --
k4 --
and the dissociation
(Tl~3) (cl-) lo-8.1 ' ~T1Clf2)
( Tl Cl t2) (Cl-) = lo-5.5 ' - -(TlCl~)
(TlClt) (cl-) - lo-2.2 - , (TlCl)
(TlClj) (Cl-) - lu-2.2 ' (T1Cl4)
y
constant for the first hydrolyzed thallium
(Tlf-3) (oH- ) (Tlrn-.+2)
10-13.2
species:
In the above equations the symbol ( ) designates the activities of t he various species present in the aqueous phase . By combining these equations a new set of constants was defined:
= (Tlcrf-2) (Tl+3) (cl-)
(TlCl~)
108 .1
1013.6
12
K3 --
K4 =
Ks =
and
ISC-703
(TlClJ) cn+3) (cr-)3
(TlClfi) (Tl* 3) (cl-)4
(T1Cls2) (Tl+3) (cl-)5
(TlOH .. 2 ) · (H+) (Tl+3)
1olS.8
- rol8
'
- 0.159.
,
A value of KS WQ.s obtained from the experimental data and it§ determination will be shown in Section E of Chapter V.
It will 'Qe shown in Section U of Chapter V that the thallium species present in the ether phase was HTlCl4. Knowing thi s, the extraction equilibrium constant may pe written as~
K = (HT1Cl4)e (Hf) (T1Cl4)
= (2)
where (X)e designates the activity of X in the ether phase and (X) desig-nates the activity· of X in the aqueous phase. .
Since the only thallium in the ether phase wa s present as HTlCl4, the activity of HTICl4 in the ether phase may be written::
(3)
where '€ ~TlCl4 represents the activity coeffi~ient of HTlCl4 in the ether
phase and (jjt e equals the concentration of HTlCl4 in the ether phase. The total concentration of thallium in the aqueous phase was equal to the sum of the concentrations of the various thallium species in the aqueous phase~
f!:klw = Ul +j t
\!lCliJ t
frrcl t~ + frrcl9
E1Cl5~ + ~JO]+~
+
(4) ..
..
ISC-703 13
Using the relation ship bhat the concentration is equal to the activity divided by the activity coefficient and the new set of constants obtained from the data of Benoit (38), namely K1, K2, K3, K4 and K5, equation (4) can be rewritten:
[!l]w • (Tl+3) / '(Tl'+3 + (TlC1+2) I {T1c1+2 +
(TlCl~) I YTlCl~ t (TlCl-,) I YT1Cl3 T
(TlC14 -) I YTlClfi +-· (Tlcl:s2> I Yrlcls2 +
(TlOH ... 2) I (H+) )(TlQH+2
= (Tlt3) I (T1+3 + ~1 (Tl+3) (cl-) I 8';101+2 +
K2 (T:+1) (cl-) 21 )(;1c12 t K3 (Tl+3) (cl-)3 1
YT1c13 + K4 (Tl+3) (cl-)4 1 I'T1cl4 + K5 (Tl+3)
(cl-)5 1 Yr1c152 + kH (Tl+3) 1 (H+)
(5).
Solving equation (5) for the activity of Tl+3 and substituting this quantity and equation (3) into equation (2) yields:
. K = @'l]e /'HTlCl4 . {;_ I 1';1+3 , K1 (cl-) I (!JJw (H+) ( Cl- ;4 K4 \-
rf1c1+2 + •.•
14 ISC-703
Hhere:
It 1m s asS1:unGC1 tl~at the act:i vit~r coefficient o:"' HTlCl4 in ether Has constant , since t he concentration of HTlCl4 in the ether phase vJCJs Sli'J.8.ll c:md the species j_s no t chc:trgetl, I t \B:s also assw:1erl ::.hat ·sl1e :v:::ti. vi ~,y nf the hydro[;en ion was constant f or a r:;i ven investigat i on slnce the extractions wer e studied at constant acid concentration and constant i onic streneth . In all of the extractions studied , the acid concentration was al1vays sufficiently hiGh t hat no hydrolr·ed thalli lli'll was preiient and the term involving the concentration of TlOW2wAs therefore eliminated. When these conditions are incorporated into the extract ion equilibrium constant of equation (6 ) a new extraction equilibrium constant can be calculated:
5
£ n @1-jn / 0 TlCl3-n K' = K (W) KT n = 0 Kn 0 Cl-
e (5 HTlCl4 K4 ~1-J 4 ~ ~1-
The value of K' shoul d be fairly constant at t he different LiCl concentrations , assuming that the activity coefficients of the thalliumchloride complexes and free chloride ion can be calculated.
Since the concentrat ions of the thallium-chloride complexes in the aqueous phase were kept smal l, it was assumed that their activity coefficients could be calculaterl by the extension of the Debye-Huckel expression:
n
(7)
- log 0 i = A zf ~ 1 + B ai~/1-'
(8)
where:
A= 0.513 at 30° C.,
zi = charee of thallium-chloride complex ,
B = 0 .3290 x 108 for water at 30° C.,
A;(;= i onic strength of the solution and
ai = neffective diameter " of the ion in the solution. In most cases of large i ons in aqueous s olutions t he product of Dai is assumed t o be 3.0. Since all of the thallium-chloride complexes are laree ions, equation ( 8 ) may be rewritten:
- l og 0 i = A zr r:= (9)
1 + 3~~
ISC-703 15
The activity coefficient of the chloride ion was estimated by two methods. For the first, the chloride activity coefficient was assumed to be constant as chloride and perchlorate concentrations were changed at a given ionic strength. Success ive approximations far values of chloride act i vity coefficient were substituted into equation (7) until the values of K' were fairly constant over the range of LiCl concentrations used.
The second method was more difficult. A constant value of chloride activity coefficient at a given ionic strength was not assumed but the values of the activity coefficients of HCl and LiCl reported by Harned and Owen (39) and by Stokes and Robinson (40) were used. In the cases in which the concentration of acid was greater than the concentration of the free chlori j e the activity coefficient of the chloride ion was taken as equal to the mean activity coefficient of HCl at the concentration of the free chloride. In those cases in which the concentration of free chloride was greater than the concentration of acid the activity coefficient of the chloride ion was taken as equal to the weighted ave rage of the activity coefficients of HCl and LiCl at the concentration of the free chloride.
Before K' could be calculated t he free chloride ion concentration had to be determined. At high LiCl concentrations the free chloride ion concentration was assumed to be equal to the initial concentration of the LiCl. At intermediate LiCl concentration essentially ~ll of the aqueous thallium was present at TlCl4. Since the thallium present in the ether phase as HTlCl~ also had four moles of chloride per mole of thallium, the free chloride ~on concentration was taken as the initial LiCl concentration minus four times the initial concentration of Tl(Cl04)3.
At very low LiCl concentrations the calculation of the free chloride ion concentration became rather difficult. The total concentration of the aqueous chloride was equal to the initial concentration of the LiCl minus four times the concentration of the etheral +.hallium. Also the total aqueous chloride concentration was equal to:
- [91 j +- ~1c1 +-2] + 2 (:1c1D +
4 ~lCl4 -] f 5 (T1C152 J ( 10)'
where ~1-Jw is the total aqueous concentration of chloride ion and [91~ is the free chloride ion concentration. To facilitate the calculation of the free chloride ion concentration the activity coefficients were neglected and K1, K2, K3, K4 and K5 were assumed to be a ratio of the concentration of the various species. Applying this assumption to equations (4) and (10) yields:
16
and
Solving yields~
ISe-703
[Ti]w - [!lt-3J (!lt-3J (K1 [e1-_] K2 ~rJ2 - t t t
K3 ~1-]3 1- K4 @lj4 t K5 C21-]5)
(1a-]w = [el-] t [Tlt~(5K5 [elf + 4K4 [91]4 t
3K3 [e1j + 2K2 ~1j t K1 [el-:J).
the se two equations for (!1+3_), equating and separating terms
[e1j6 (K5) t [e1j (5K5 LT1Jw- K5 [el]w t
\91.-]4 (4K4 [Tl_]w - K4 [_cr]w t K3 )
Kh : ) i
t [91-]3 (3K3
lTl]w - K3 [eljw t
K2 [cl-]w t K1 )
f 1 )
t [erf (2K2 Q'l]w -
(K1 [T1]w - K1 [e1-]w1
(11).
From equation (11) the concentration of free chloride ion can be determined by successive approximations.
It should be pointed out that this method gives a very good determination of the equilibrium constant, K1 , since it is evaluated at a number of different chloride concentrations. The accuracy of the constant is dependent not only upon the accuracy of the physical measurement~, but also upon the accuracy of the assumption that the values of K1, K2, K3 and K4 as calculated from data reported by Benoit (38) and the value of K5 as calculated from the extraction data can be applied to all of the conditions employed in this investigation. It also is very much dependent upon the assumptions made about the activity coefficients of the many species present in this complicated system.
EXPERIMENTAL INVESTIGATION
A. General Procedure
Preliminary inve s tiga tions showed that Tl(III) chloride complexes extracted very rapidly into isopropyl ether. A more complete investigation revealed that complete equilibrium was reached between t he aqueous and ether phases in approximately ten minutes. However, in most of the investiga tions the samples were shaken in a constant temperature bath for about 40 minutes and allowed to se ttle for about 30 minute~. This
ISC-703 17
longer contact time was used to ensure complete thermal equilibrium as well as the extraction equilibrium.
A simple extraction apparatus was as sembled to study the distribution of Tl(III) chloride complexes between the ether and aqueous phases. An E. H. Sargent and Company constant temperature ba th with a thermo-regulator mercury relay switch was used to regulate the temperature of the experiments. A Burrell Wris t-Action Shaker with automatic timer was used to shake · the reaction tubes . Two t ypes of reaction flasks were used in this invP.stigation, 50 ml. pyrex volumetric flasks and 35 mm. pyrex tubes with 34/45 ground glass female joints and accompaning 34/45 ground glass male caps.
In the ensuing inves tiga tions the aqueous layer was prepared by placing the desired concentration of r eactants in the r eaction tubes and adding an equal volume of isopropyl ether. In all of the experiments, the initial aqueous and ether phases were each 10 ml.
After the reaction tubes were shaken in the constant temperature bath and allowed to settle, the samples were withdrawn with pyrex volumetric pipettes. During the early investigations, after the ether samples were withdrawn, the remaining ether phase and a small amount of the aqueous phase were removed with a pipette before the aqueous sampl es were withdrawn. In the later experiments the remaining portion o.f the ether phase was not removed before tl:w aqueous samples were withdrawn. The pipette was passed through the remaining ether phase into the aqueous phase, a small amount o.f air was blown t hrough the pipette to discharge any of the ether phase which might have been tra;Jped in tho pipette and the aqueous sample was withdrawn . The results obtained by t11ese two sampling methods agreed within the limits of error o.f tho experimental methods.
Approxima tely 2 t o 3 ml. o.f v1ater >!er e ad·.leJ t.o tho e t her samples and the ether evapor:::~ ted by CJ.llor;inr; t lw sarr.ples to stand at room t emperature for · from 6 to 12 hours. Analyses wer e made for acid, chloride and t hallium. 'l'he acid an.J cl;l.loride anal yse s ·were done volumetrically, the thallium analysis radiochemically . Since the amount of t hallium present was not sufficient for precipitation anJ filtration, carrier Tl(N03) 3 in HN03 was added in a known amount.
Tllree methods of mounting the thallium samples were investiga ted with only one of them proving suitabl e . The two unacceptable methods were simple evaporation of an aliquot of each phase , and precipitation of the thallium as Tl(?H)3. T~e evaporati~n method.gave unreprodupible and very flaky samples wlth cons1derable seli -absorpt1on of the Tl204 beta particles by the salts which remained upon evaporation. Since Tl(OH) 3 is a very fine precipitate which adheres to glass, it was difficult to filter and mount.
18 ISC-703
The procedure for the thallium analysis which was used in all further investiga tions was t ha t used also for t ho s tandardization of the Tl(Cl04)3 solution (see page 8 ), with a few change s. Tho Tl2Cr04 prc:~ cipitates were allowed to digest a t room temperature for from 2 hours to 12 hqurs in various investigations . The time of digestion was not too critical.
The Tl2Cr04 samples were filtered onto 23 rnm. discs of Schleicher and Schuell, NO . 589, filter paper with the use of chimney and sintercd · glass filter apparatus. The precipitates were washed with water and absol ute alc0holand, dried at 110° C. for approximately 5 minutes. The samples were cooled to r oom temperature before mounting .
During the early inves tiga tions a chemical yield determination was made by weighing the Tl2Cr0u precipitate. The counting data we~ corrected to 100 percent chemical yie l d. However, in every case the chemical yield was be tween 93 and 104 percent, with the greatest majority of the yields being between 98 and 101 percent. It was believed that these yields were well within the limits of error of the radiocherr~cal methods employed. The determination of the chemical yield was discontinued after the early investigations and the yields were assumed to be 100 percent in all the l ater investigations.
The cooled samples were covered with 3.3 mg./cm.2 cellophanediscs of 26 mm. · diameter. The samples were mounted on cardboard backing and counted.
B. Preliminary Investigation
A series of preliminary i nvesti gations were preformed in order to observe the optimum conditions for the study of the extraction .
l. Time and rate of shaking
The extraction was studied at two rates of shaking for varying times of contact for the two phases. At the lower ·rate of shaking, approximately 350 vibrations per minute and 3/ 4 inch stroke, the equilibrium was not obtained with a contact time of less than 30 minutes. However, after a contact time of only 10 minute s at the higher shaking rate, approximately 350 vibrations per minute and l inch stroke, equilibrium was observed. In this investigation it is also necessary to obtain a thermal equilibrium between the two phases. Complete separation of the two phase s is an important condition. To satisfy these requirements, all subsequent investigation will be J:B rformed with the higher shaking rate, a contact time of 30 minutes and a stationary period of 30 minutes for separation.
2. Varying Lithium Chloride concentrations
The extr action was observed at various LiCl concentra tions and constant acid concentra tion. The results of several runs are shown in Figure l.
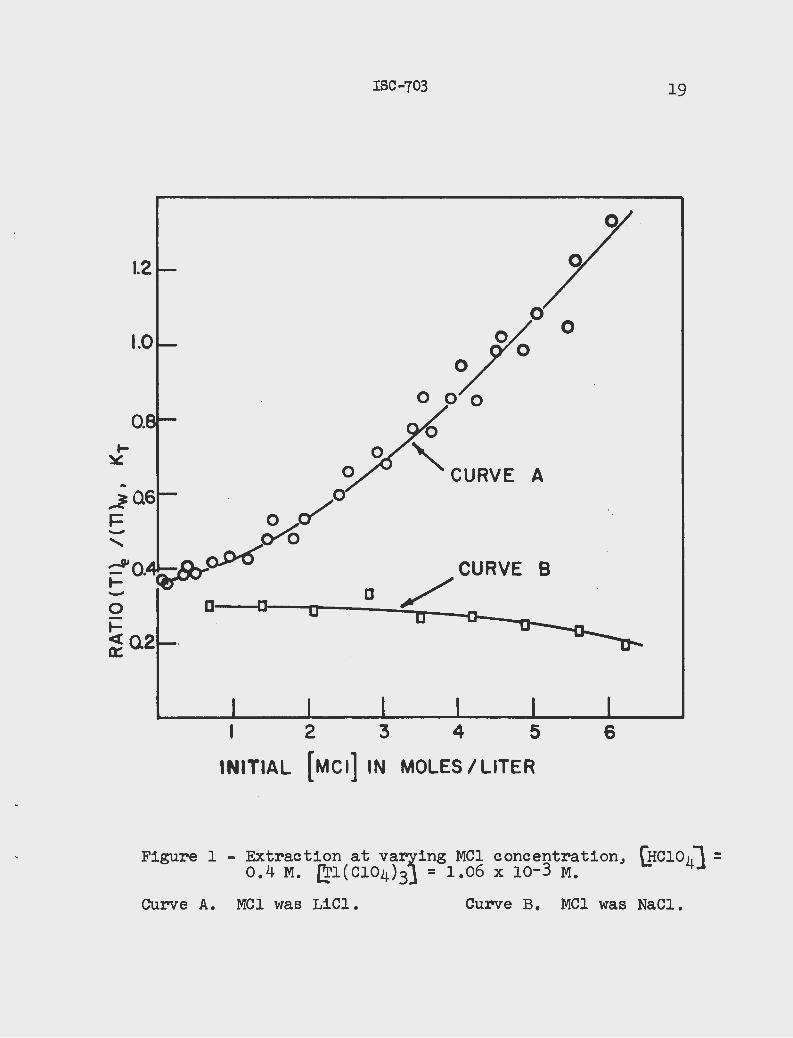
t-~
1.2
ISC-703
0
0~ 0
A
CURVE B
c--~a~--~c~---o--~~~--~ 0 -D-----"1]--~
0
·~
.1 2 3 4 5 6
INITIAL (Mel] IN MOLES I LITER
19
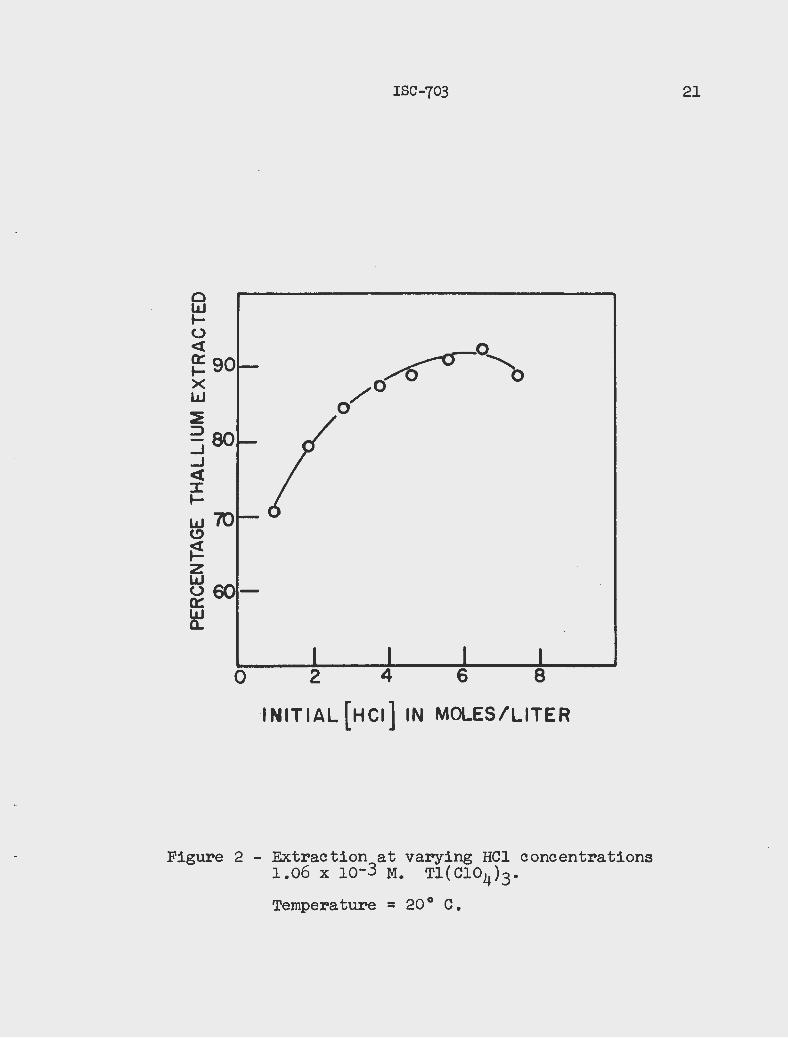
Figure 1 - Extraction at va~ing MC1 concentration, [HC1o4] = 0.4 M. {!1(C104)3J = 1.06 x 10⁻³ M.
CUrve A. MCl was LiCl. Curve B. MC1 was NaC1.
20 ISC-703
However, since the ionic strength was no b kept constant, t he effect of the concen tration of LiCl upon t he extraction could not be determined from t hese data.
3. Varying Hydrochloric Acid concentration
In previous investigations (17, 113 , 20) the extraction was. studied a t varying HCl concentrations, t he concentration of t hallium kept constant . The work of bhe previous investigators was ropnat ed and t he r esults shown in Figure 2. Howev,er, since the ionic strength was not maintained constant, the true effect of the concentration of HCl could not be determined.
The optimum extraction of about 92 percent occurred at appr oximately 6 .5 M. NCl. However, the earlier investigators (17, 18, 20) reported that Tl(III) was extr acted quantitatively from solutions of HCl concentrations as low as 2 M. by diethyl ether. Little comparison was made be.tween the results of the present and the earlier investigations because of the different extraction solvent and concentration of thallium used.
4. Varying Sodium Chloride concentrations
The extraction was sbudied at constant acid concentration using NaCl to vary the chloride ion concentration and the results are compared to the experimehts using LiCl in Figure 1. Once again no results were concluded from these data because the ionic strength was not kep t constant.
5. Varying ionic strength
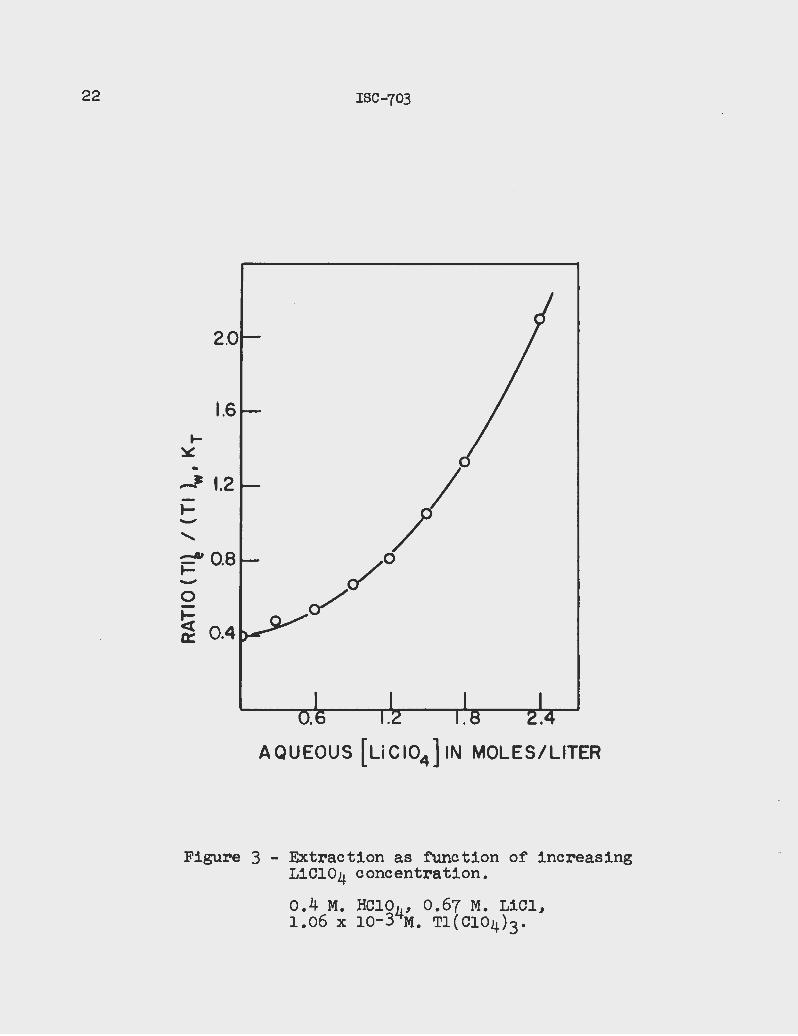
The extraction was investiga ted at constant HC10j1 , Tl(Cl0j 1) 3 and LiCl concentrations while vary~ng the ionic strength with LiCl04. The results of one of the runs are shown in Figure 3. The very marked effect of the i onic strength is shown by the approximately 5.3 fold increase tn the extraction coefficient for an increase in the concentration of LiCl04 from 0.0 M. to 2.4 !l . These data indica ted a very strong salting-out effect.
6. Purity of Iso-propyl Ether
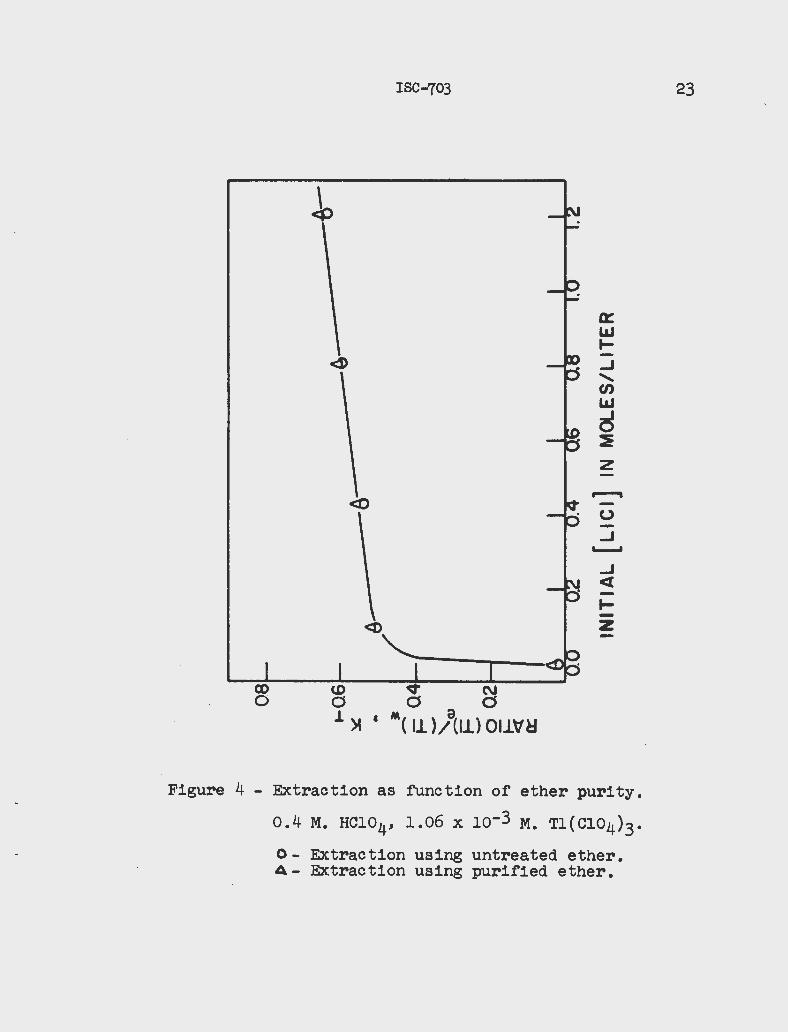
The need to purify the iso-nropyl ether obtained from the stock room, Matheson, Coleman and Bell iso~ropyl ether, was studied. The iso-propyl ether was purified by shaking wnh alkaline - KMn04 solution, drying over CaCl2 and distilling. The middle fraction boiling in the range 68.5 to 69.00 C. at atmospheric pressure was collected . Several extractions were run a t i dentical conditions using the normal and purified iso-pr opyl ether and the results are shown in Figure 4. Within the limit of error of th(!} methods used no di fference in the extraction was observed and i n all further studies the s tock room iso-propyl ether was used.
7. Varying i onic strength with Sodium Perchlorate
Since NaCl04 is more soluble than LiCl04, the extrac tion could be
ISC-703
0 2 4 6 8
·INITIAL ( HCI) IN MOLES/LITER
. '
Figure 2 - Extraction at varying HC1 concentrations 1.06 x 10⁻³ M. T1(C104 )3 •
Temperature = 20° c.
21
22 ISC-703
2.0
1.6 ~ ~ ..
/ ~ 1.2 t--....... ~0.8 c/0 -0 ~ ~ Q: 0.4
AQUEOUS [ LiCI04 ] IN MOLES/LITER
Figure 3 - Extraction as function of increasing LiCl04 concentration.
0.4 M. HC104, 0.67 M. LiCl, 1.06 x l0-3 M. Tl(Cl04)3.
ISC-703
0: LLJ .... _J
' CJ)
LLJ
d :E 2
..--.. <0
(.)
_J ~
_J <( -~
<0 z
v a o
M( 11 )/a(ll) Olltf~
Figure 4 - Extraction as function of ether purity.
0.4 M. HCl04, 1.06 x lo-3 M. Tl(Cl04 )3 •
0- Extraction using untreated ether. 4- Extraction using purified ether.
23
24 ISG-'(03
studied at higher salt conce'ntrati0ns. However, when NaCl04 was added to the reaction mixtures, the~chloride was oxidized to ch+orine because NaCl04 is such a strong q:x;idizing o.gent. Thus, in all further investigatiorts LiGl04 was .lised to ma~ntain the ionic strength constant.
C. " Temperature Dependence of the Partition Coefficient
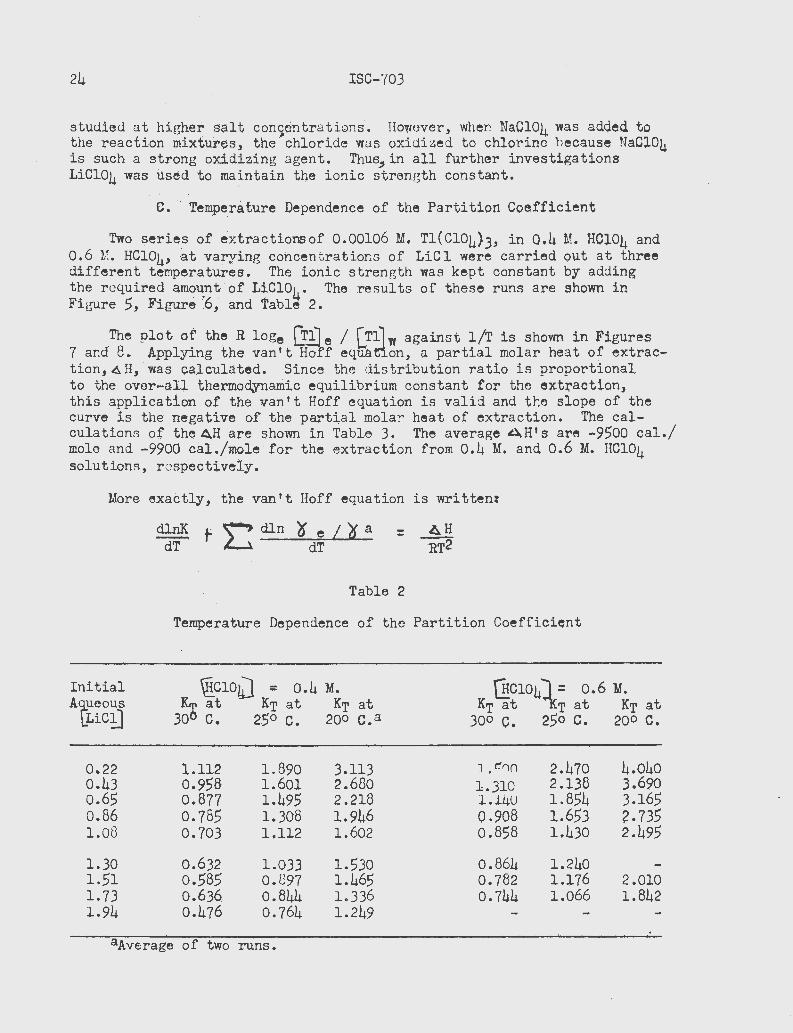
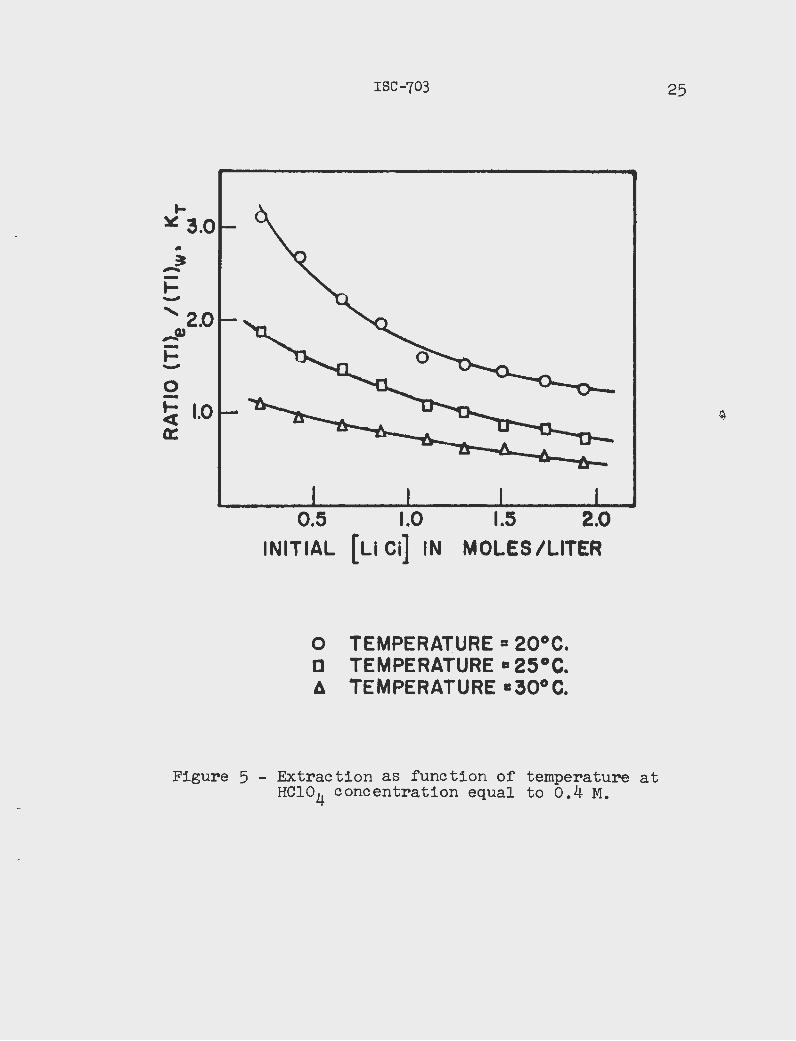
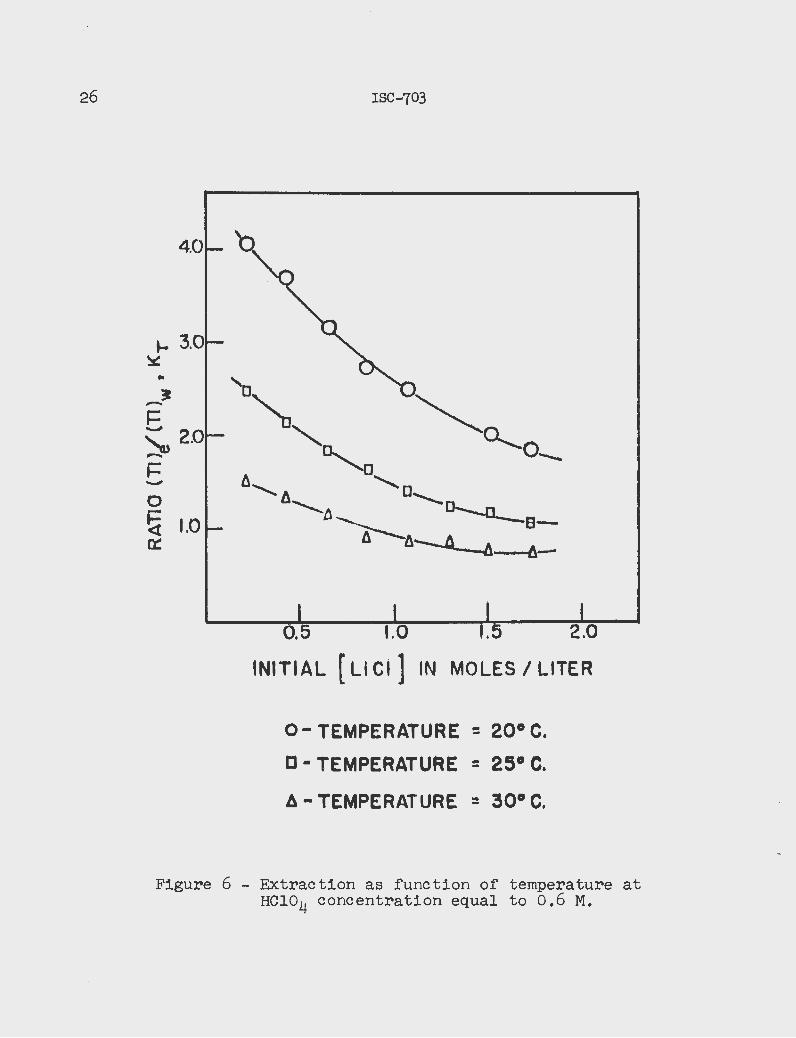
Two series of ex tractionsof 0.00106 M. Tl(Cl04)3, in 0.4 M. HOl04 and 0.6 M. HC104, at varying c6hcentrations of LiCl were carried out at three different temperatures. The ionic strength was kept constant by adding the requir~d amou_nt ·of_LiC104. The results of these runs are shown in Figure 5, Figure ·.6, and Table 2.
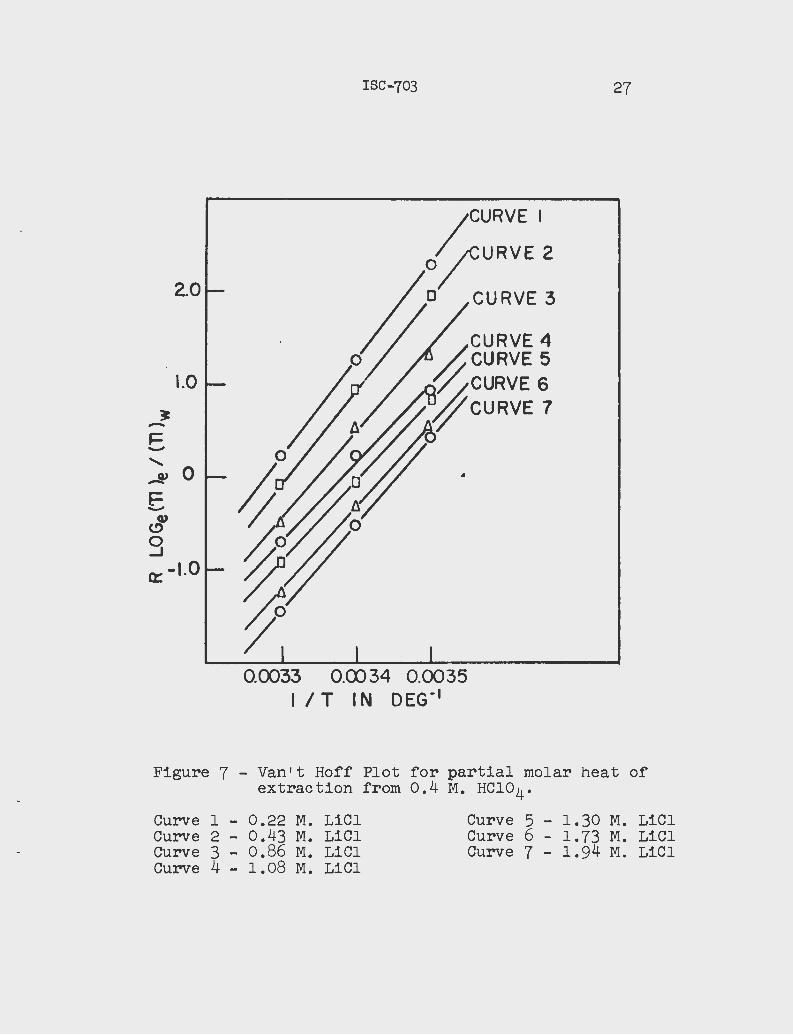
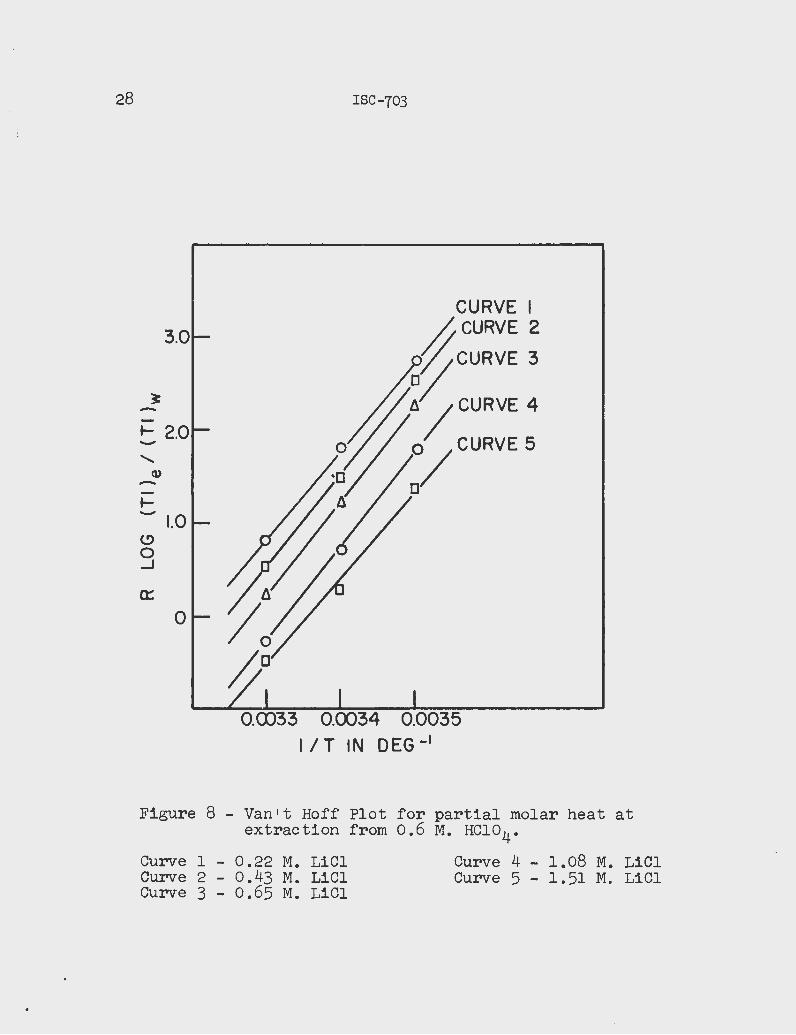
The plot of the R loge Q:'.l] e / [Tllw against 1/T is shown in Figures 7 and 8. Applying the van 1 t Hoff equation, a partial molar heat of extraction, 4 H, 'was calculated. Since the distribution ratio is proportional to the over.-au thermodynamic equilibrium constant for the extraction, this application of .thevan't Hoff equation is valid and the slope of the curve is the negative of the part:i,al molar heat of extraction. 'l'he calculations of the4E are shovm in Table 3. The average ~H's are -9500 cal./ mole and -9900 cal./molefor the extraction from 0.4 M. and 0.6 M. HCl04 solutions, r espectively.
More exactly, the van't Hoff equation is written:
. ~. f ~ dln '() e I )5 a dT L . dT
=
Table 2
Temperature Dependence of the Partition Coeffici~nt
Initial . ~ClokJ = 0.4 M. (gc1o4]k= o.6 M. AQueous Kb at KT at KT at KT at T at KT at LiG~ 30 c. 2.5° c. 200 c.a 300 c. 2.50 c. 200 c.
0.22 1;.112 1 . 890 3.113 J. r:::l")n 2.470 4.040 0.43 0.-958 1.601 2.680 1.310 2.138 3.690 0.65 0 .. 877 1.495 2.218 l.l4U 1.854 3.165 0.86 0.785 1.308 1.946 0.908 1.653 ?.735 1.08 0.703 1.112 1.602 o.8S8 1.430 2.495
1.30 0.632 1.033 1.530 0.864 1.240 1.51 0.585 o. en 1.465 0.782 1.176 2.010 l. 73 o~636 0.844 1.336 o. 744 1 •. 066 1.842 1.94 0.476 0.764 1.249
aAve;rage of two runs.
:c.
... ~ 3.0 .. ~ --.... -
'2.0 _OJ -.... -0 -.... 1.0 <[ 0:
ISC-703
0.5 1.0 1.5 2.0
INITIAL ( Li Ci] IN MOLES /LITER .
0 TEMPERATURE = 20°C. C TEMPERATURE ~ 25°C. 6. TEMPERATURE -=30°C.
Figure 5 - Extraction as function of temperature at HC104 concentration equal to 0.4 M.
25
t;);
26
.... 3. ~ .. ~ -E
'a, 2.0 -0
~ 1.0 a::
ISC-703
0.5 1.0 2.0
INITIAL ( Ll Cl) IN MOLES I LITER
0- TEMPERATURE = 20° C.
D ·TEMPERATURE = 25° C.
6- TEMPERATURE :: 30° C.
Figure 6 - Extraction as function of temperature at HCl04 concentration equal to 0.6 M.
2.0
1.0
~ -F -:;,o E ~ g 0:-1.0
ISC-703
/CURVE I
0 /URVE 2
0 CURVE 3
27
0.0033 0.00 34 0.0035 I IT IN DEG- 1
Figure 7 - Van't Hoff Plot for partial molar heat of extraction from 0.4 M. HCl04.
Curve 1 - 0.22 M. LiCl Curve 2 - 0.43 M. LiCl Curve 3 - 0. 86 M. LiCl Curve 4 - 1.08 M. LiCl
Curve 5 - 1.30 M. LiCl Curve 6 - 1.73 M. LiCl Curve 7 - 1.94 M. LiCl
28 ISC-703
CURVE I
3.0 r/;CURVE 2 CURVE 3
~ ~jCURVE 4 -.._ 2.0 - 0/CURVE 5 ........
Q) - [] .._ - 1.0 (.!)
0 _J
a:: 0
Figure 8 - Van 1 t Hoff Plot for partial molar heat at extraction from 0.6 M. HCl04 •
Curve 1 - 0.22 M. LiC1 Curve 4 - 1.08 M. LiCl Curve 2 - 0.43 M. LiC1 Curve 5 - 1.51 M. LiCl Curve 3 - 0.65 M. LiCl
...
ISC-703 29
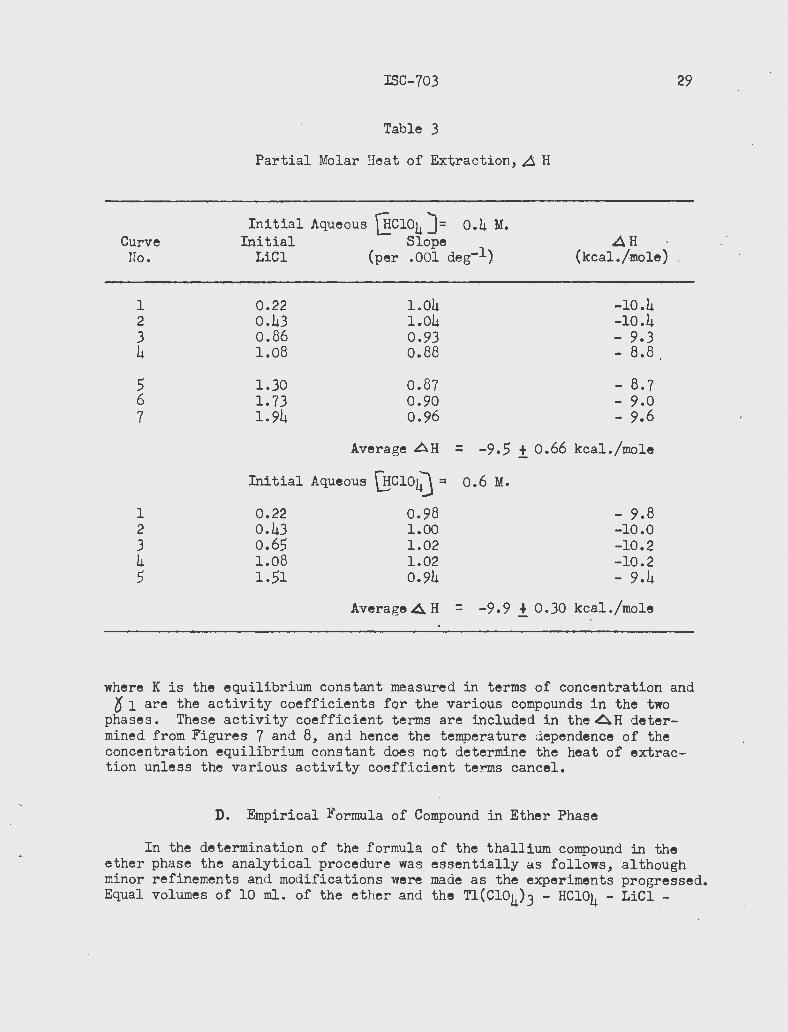
Table 3
Partial Molar Heat of Extraction, ~ H
Initial Aqueous ~Cl04 J= 0.4 M. AH Curve Initial Slope
No. LiCl (per .001 deg-1) (kcal./mole)
1 0.22 1.04 -10.4 2 0.43 1.04 -10.4 3 0.86 0.93 - 9.3 4 1.08 0.88 - 8.8.
5 1.30 0.87 - 8.7 6 l. 73 0.90 - 9.0 7 1.94 0.96 - 9.6
Average .AH = -9.5 ± 0.66 kcal./mole
Initial Aqueous wclo4) = 0.6 M.
1 0.22 0.98 - 9.8 2 0.43 1.00 -10.0 3 0.65 1.02 -10.2 4 1.08 1.02 -10.2 5 1.51 0.94 - 9.4
Average A H = -9.9 ± 0.30 kcal./mole
where K is the equilibrium constant measured in terms of concentration and ~ 1 are the activity coefficients for the various compounds in the two
phases. These activity coefficient terms are included in the 6.H determined from Figures 7 and 8, and hence the temperature dependence of the concentration equilibrium constant does not determine the heat of extraction unless the various activity coefficient terms cancel.
D. Empirical Formula of Compound in Ether Phase
In the determination of the formula of the thallium compound in the ether phase the analytical procedure was essentially as follows, although minor refinements and modifications were made as the experiments progressed. Equal volumes of 10 ml. of the ether and the Tl(Cl04)3 - HCl04 - LiCl -
30 ISC--703
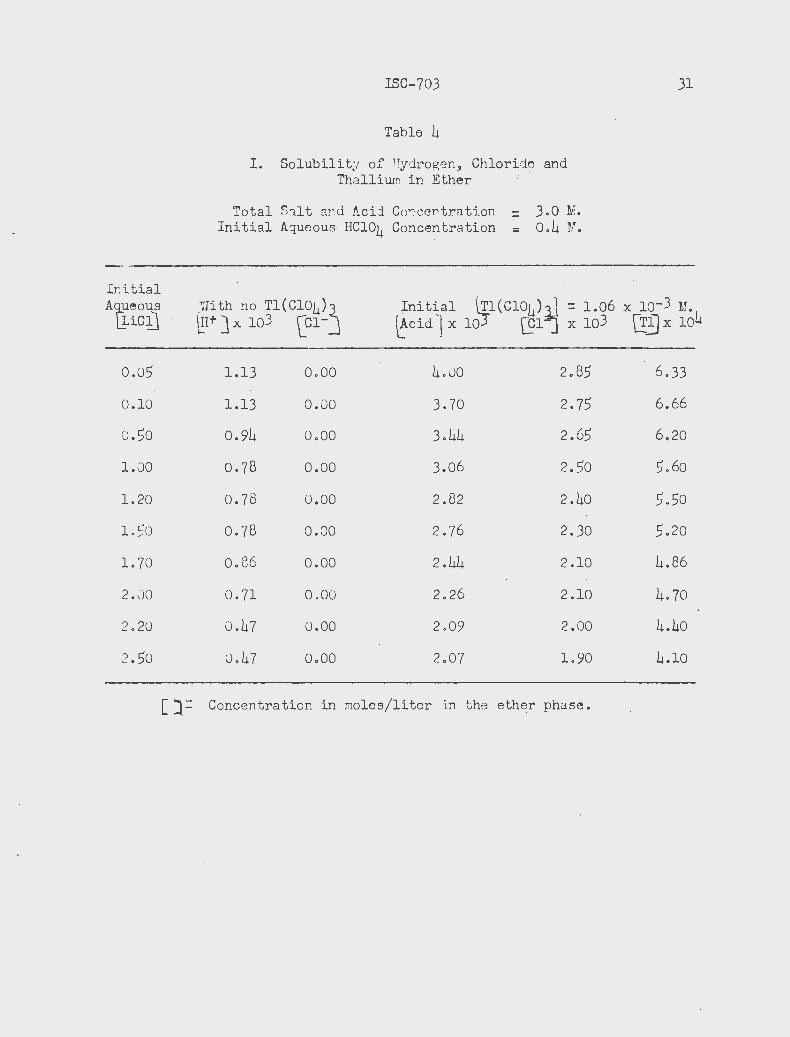
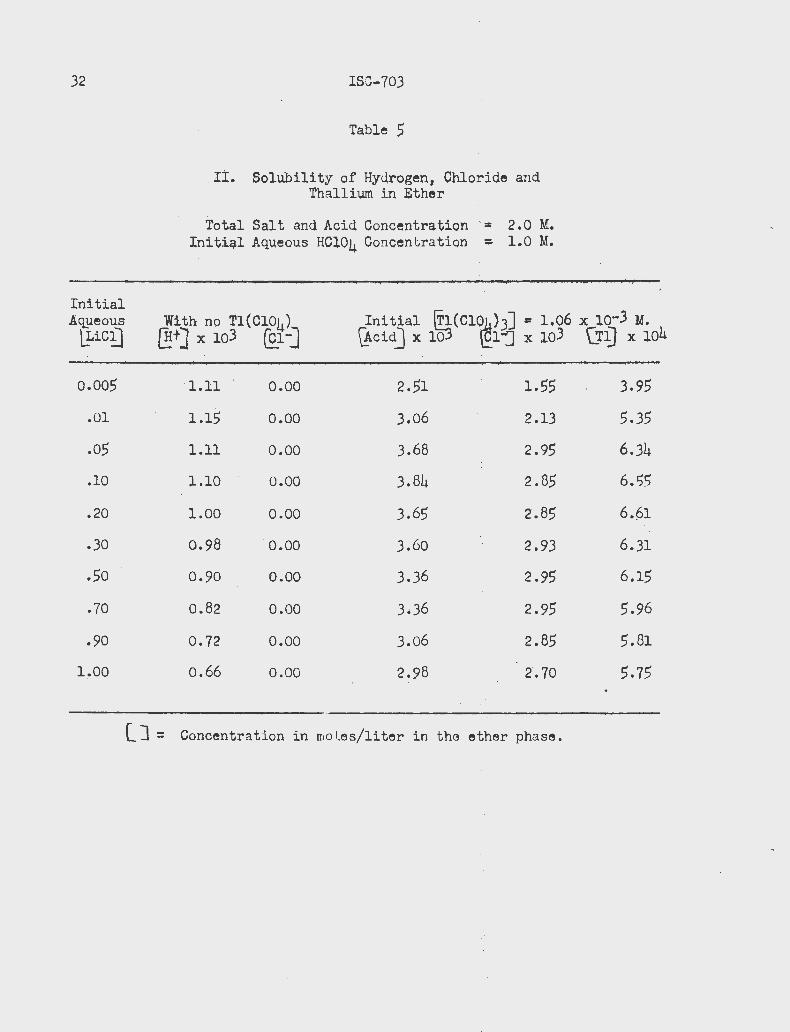
LiCl04 solutions were shaken together~ allowed to separate and the ether layer was analyze~ for chloride~ ionizable hydrogen and thallium content. The chloride content was determined by adding water to the ether sample and titrating with standard AgN03 to the dichlorofluorescein end-point. A second portion of the ether phase was analyzed ~or aci i and thallium(III) by adding water and titrating it with standard NaO"I to a phenolphthalein end-point. The amount of thallium i_n the ether phase was determined radiochemically by counting the Tl2Cr04 precipitate. The results are presented in Tables 4 9 S and 6 for three typical extraction experiments.
The amounts of hydrogen and chloride ions passing i nto the -ether layer from solutions of the same composition of HCl04 9 LiCl and LiCl04 with no Tl(Cl04)3 present were determi.ned. The results are shown in Tables 4 9 5 and o9 compared with the data of the extraction experiment with Tl(Cl04)3 present .
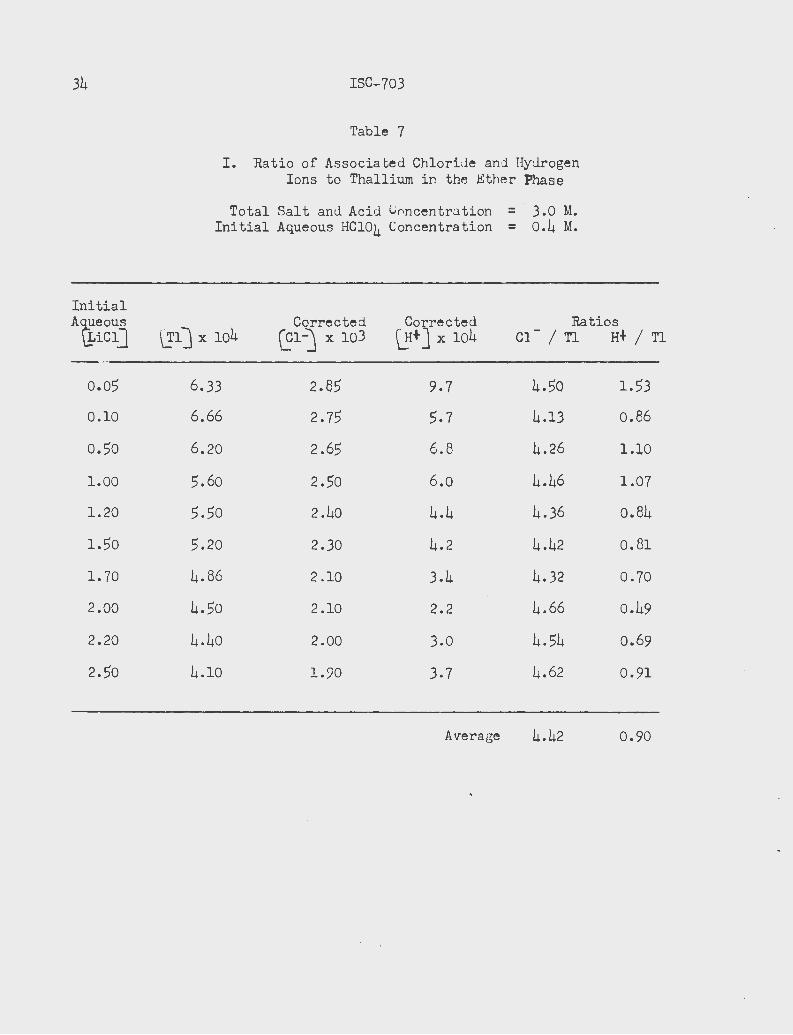
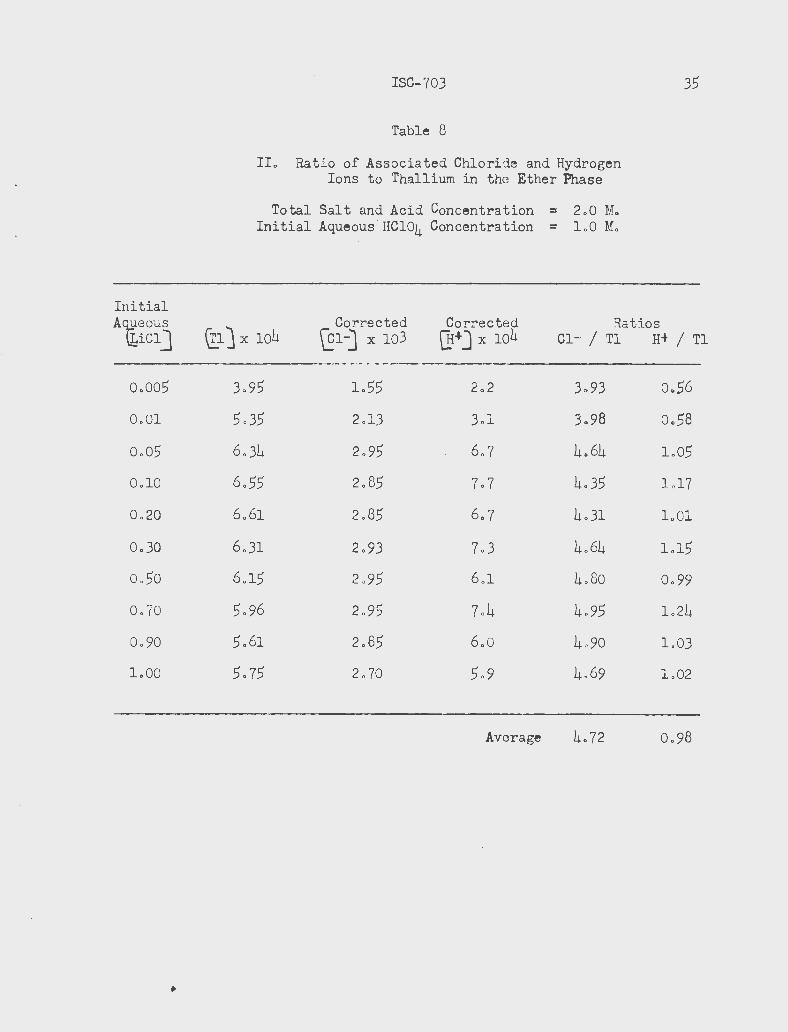
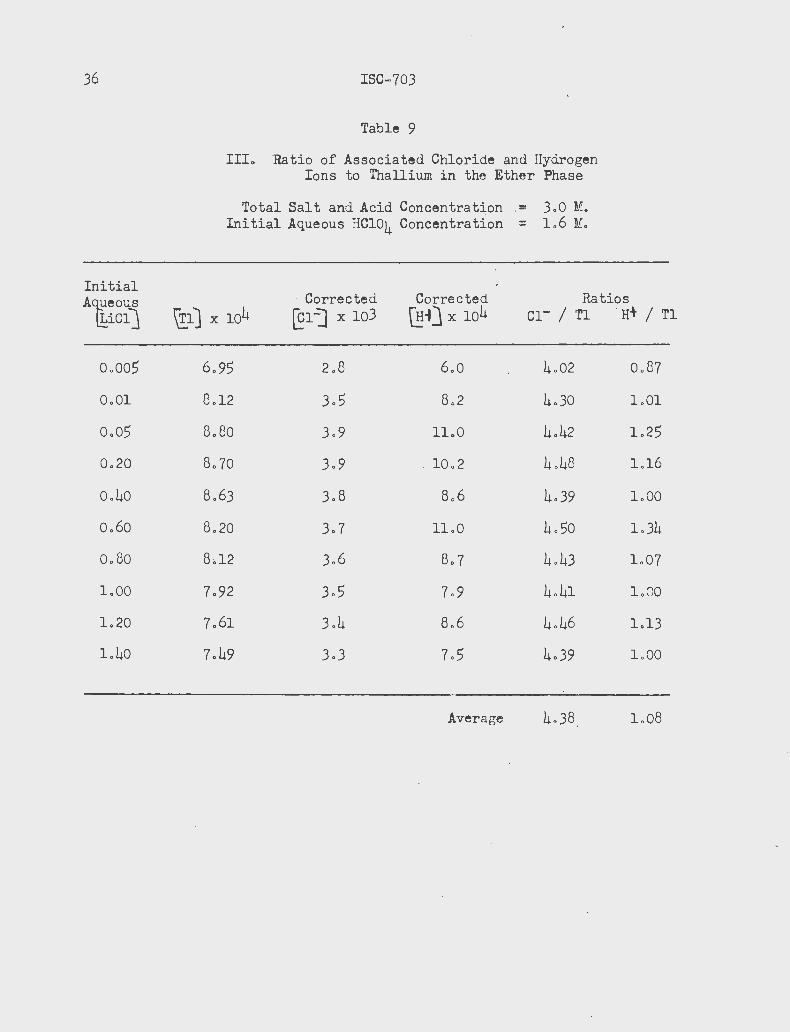
The ratios of associated chloride and of associated hydrogen to thallium were calculated and are shown in Table s 7, 8 and 9. The corrected chloride ion concentra tion was equal t o the amount extracted minus the amount of chloride ion soluble in ether at the given ionic strength and acid concentration . Since the amount of chloride soluble in the ether was below the limits of detection of the method of analysis in every experiment~ it was considered that the associated chloride was equal to the extracted chloride. The average ratios of associated chloride to thallium in the ether phase were 4 . 72, 4 .42 and 4.38. The amounts of chloride titrated in the ether samples were be~ween 4 x lo-S and l x lo-4 moles and any small error in titration w0uld produce a large error in the ratios . The calculated ratios are consistently higher than
) the predic.ted ratio of 4 . 0. This differe nce could be due. to two factors, the titration of the indicator or the solubility of amounts of chloride in the etr~r. which are relatively important but undetectible by the method of titration. The high chloride ratios might also be due to the extraction of thallium polymers of the type Li2TlCl5 or H2TlCi5. The ratio of associated chloride to thallium in the ether phase was accepted as 4.0 in all further investiga tions.
The corrected hydrogen ion concentration was equal to the equivalents of base -qsed minus three times the thallium concentration in the ether phase and minus the amount of acid which is soluble in ether at the given ionic strength ·and acid concentration. The average rat ios of associated hydrogen to thallium were 0.98 9 0.90~ and LOB. Since the amount of associated hydrogen was obtained as a small difference between three larger numbers, a small error in the titration would produce a large error in the r atios. The calculated ratios are fairly close to LO. In all further investigations the ratio of associated hydrogen to thallium in the ether phase will be LO .
From t his data it is assumed that there is only one t hallium compound in the e ther phase. The empirical formula of this compound is HTlCl4 • .
Initial AQeous
Li.Cij
0.05
0. 10
0 .50
1. 00
1.20
1.50
l. 70
2. 00
2.20
2. 50
[ J.=
ISC-703
Table 4
I. Solubility of Hydrogen, Chloride and Thallium in Ether
Total Salt and Acid Concentrat ion = 3.0 M. Initial Aqueous HCl04 Concentration = 0.4 1[.
31
J"fith no Tl(Cl04)~ ~Irjx lo3 · eel- ·
)nit~al ~l(Cl04)~ = 1.06 x lo-3 M. 4 ~cid__l X 10 [91- X 103 . ['!2] X 10
1.13 0.00 4. 00 2.85 6.33
1.13 0.00 3.70 2.75 6.66 ;
0.94 0.00 3.44 2.65 6.20
0.713 0.00 3.06 2.50 5.60
0.78 0.00 2.82 2.40 5.50
0.78 0.00 2.76 2.30 5.20
o. S6 o.oo 2.44 2.10 4.86
o. 7l 0.00 2.26 2.10 4.70
0 .47 0.00 2.09 2. 00 4.40
0.47 o.oo 2.07 1.90 4.10
Concentration in moles/liter in the ether phase.
32
Initial Aq_ueous
j}iC£}
o.oo5
.01
.05
.10
.20
.30
.so
.70
.. 90
1.00
ISC-703
Table S
.I!. Solubility of Hyclrogen, Chloride and Thal~ium in Ether
~Total Salt and Acid Concentl:'a tion :::; 2. 0 M.. Initial Aqueous HCl04 ConcenGration : 1.0 M.
With no Tl(Cl04)' (!!+] :x; 103 . (2.1-J
Initial ~(Cl0~)3] = 1.06 x lo-3 M. Q.cid] x 10 Cl-J x 103 \J'y x 104
'' l.ll o.oo 2.51 1.55 3.95
1.1.5 o.oo 3.06 2.13 5.35
1.11 o.oo 3.68 2.95 6.34
1.10 0.00 3.84 2.85 6.5~
1.00 0.00 3.65 2.85 6.61
0.98 0.00 3.60 2.93 6.31
. 0.90 o.oo 3.36 2.95 6.15
0.82 0.00 3d6 2.95 5.96
0.72 o.oo 3.06 2.85 5.81
.o.66 0.00 2.98 2.70 5.75
'' ' '
[_ J = Concentration in mol es/liter in the ether phase •
. '
Initial Aqueous (}.iC~ .
o.oo5
0.01
0.05
0.20
0.40
0.60
0.80
1.00
1.20
1.40
ISC-703
Table 6
III. Solubility of Hydrogen, Chloride and Thallium in Ether
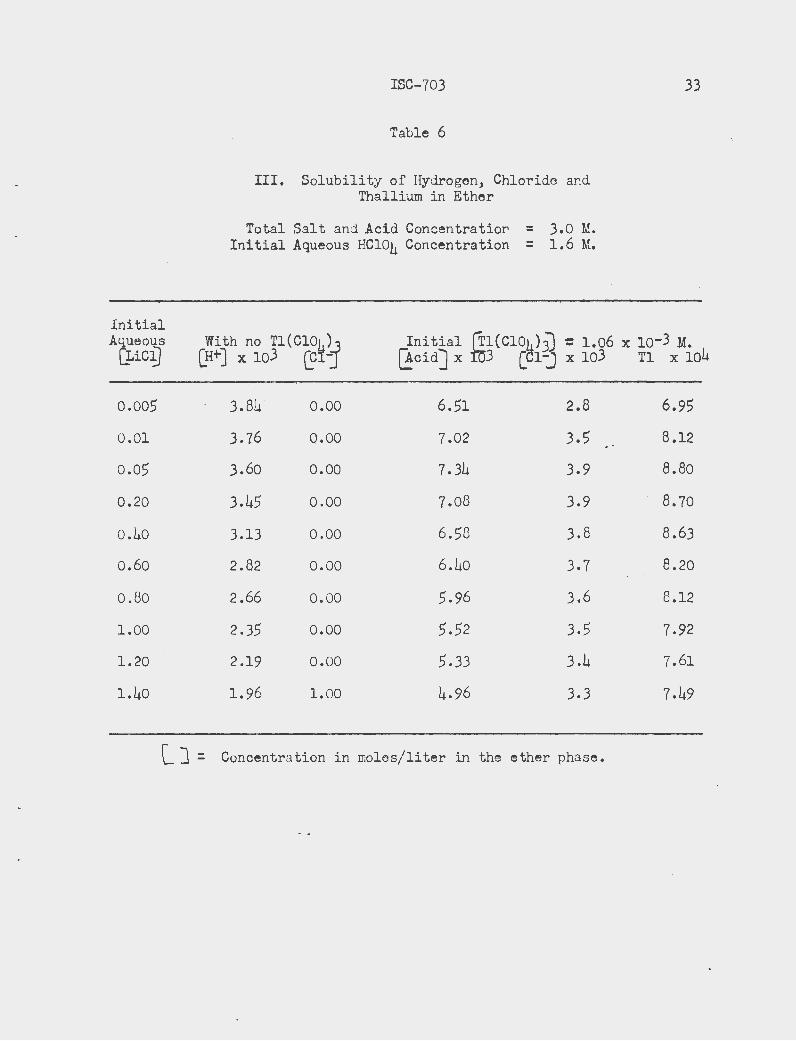
Total Salt and Acid ConcentratioD = 3.0 M • . Initial Aqueous HCl04 Concentration = 1.6 M.
33
With no Tl(ClO~)J [H+J x 103 ~1-
Initial ~l(ClO~)j) ~ 1.06 x lo-3 M. ~cid] X 3 c 1-J X 103 Tl X 104
3.84 0.00 6.51 2.8 6.95
3.76 o.oo 7.02 3.5 8.12 . ' 3.60 o.oo 7.34 3.9 8.80
3.45 0.00 7.08 3.9 8.70
3.13 0.00 6.58 3.8 8.63
2.82 o.oo 6.40 3.7 8.20 .
2.66 0. 00 5.96 3.6 8.12
2.35 o.oo 5.52 3.5 7.92
2 .19' 0.00 5.33 3.4 7.61
1.96 1.00 4.96 3.3 7.49
l] = Co~centration in moles/liter in the ether phase.
34
Initial AQeous
LiCl]
o.o5
0.10
0.50
1. 00
1.20
1.50
1. 70
2.00
2.20
2.)0
ISC-703
Table 7
I. 'Ratio of Associated Chloride and Hydrogen Ions to Thallium in the Ether Phase
Total Salt and Acid Concentration = · 3.0 M. Initial Aqueous HC104 Concentrati?n = 0.4 M.
(li] x lo4 Corrected Corrected Ratios
(91~ X 103 ~+]X 104 Cl- I Tl H+ I Tl
6.33 2.85 9.7 4.50 1.53
6.66 2.75 5.7 4.13 0.86
6.20 2.65 6.6 4.26 l.lO
5.60 2.50 6.0 4.46 1.07
5.50 2.40 4.4 4.36 0.84
5.20 2.30 4.2 4.42 0.81
4.86 2 .10 3.4 4.32 0.70
4.50 2.10 2.2 4.66 0.49
4.40 2.00 3. 0 4.54 0.69
4.10 1.90 3.7 4.62 0.91
Average 4.42 0.90
Initial A{teous
LiCl]
o.oo5
0.01
0.05
0.10
0.20
0.30
o.5o
0.70
0.90
1.00
•
ISC-703
Table 8
II. Ratio of Associated Chloride and Hydrogen Ions to Thallium in the Ether Phase
Total Salt and Acid Concentration = 2. 0 M. Initial Aqueous HCl04 Concentration = 1 .0 M.
35
\tlJ X 104 Corrected Corrected
Qr+J x lo4 Ratios
\El-] X 103 Cl- I Tl Ht I Tl
3. 95 L55 2. 2 3.93 0.56
5.35 2.13 3.1 3.98 0.58
6.34 2.95 6.7 4.64 1.05
6.55 2.85 7.7 4. 35 1.17
6.61 2.85 6.7 4. 31 1.01
6.31 2.93 7.3 4.64 1.15
6.15 2.95 6.1 4 .80 0.99
5.96 2.95 7. 4 4.95 1.24
5. 61 2.85 6.0 4 .90 1.03
5.75 2.70 5.9 4 . 69 1.02
Average 0.98
36
Initial Afueous
Licij
0 .005
0.01
0.05
0.20
0.40
0.60
o.8o
1.00
1.20
1.40
ISC-703
Table 9
III.. Ratio of Associated Chloride/ and Hydrogen Ions to Thallium in the Ether Phase
Total Salt and Acid Concentration 3.0 M. Initial Aqueous HCl04 Concentration = 1.6 M.
· Corrected Corrected Ratios \!1-] X 104 @1"] X 103 ~-fJ X 104 Cl- I Tl Ht I Tl
6.95 2.8 6.0 4 .02 0. 87
8.12 3.5 8.2 4.30 1.01
8.80 3.9 11.0 4.42 1.25
8.70 3.9 10.2 4J~8 1.16
8.63 3.8 8.6 4.39 1.00
8.20 3.7 11.0 4. 50 1.34
8.12 3.6 8.7 4. 43 1.07
7.92 3.5 7.9 4.41 1.00
7.61 3.4 8.6 4.46 1.13
7.49 3.3 7.5 4.39 1.00
Average 4.38 1.08
•
ISC-703 37
E. Determination of K5
Using the values for the formation constants of the thallium-chloride complexes as reported by Beno:i.t (38) to calculate the values of Kv K2, K3 and K4 and the long 'equation (7) in Chapter IV1 values of K5 were determined by successive approximations. The approximate values of K~ were determined at high LiCl concentrations where the assumption was made that the initial aqueous chloride concentration was nearly equal to the final aqueous free chloride concentration. The vat~e of K5 which gave consistently the best evaluation of K' was 3.6 x 10 •
F. Low Lithium Chloride Concentrations
The extraction of 0.00106 M. Tl(Cl04) 3 from acid solutions was studied at very low LiCl concentrations, not exceeding 0.009 M. Since the total salt and acid concentration was 1.0 M., the ionic strength was essentially constant in these experiments.
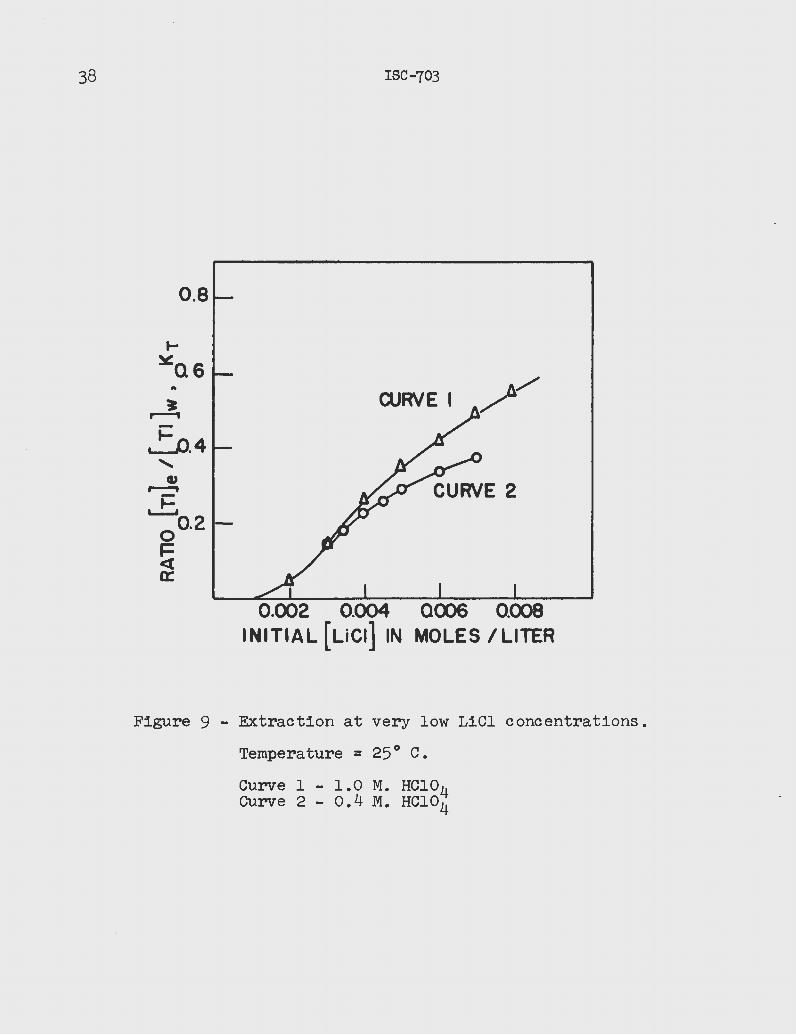
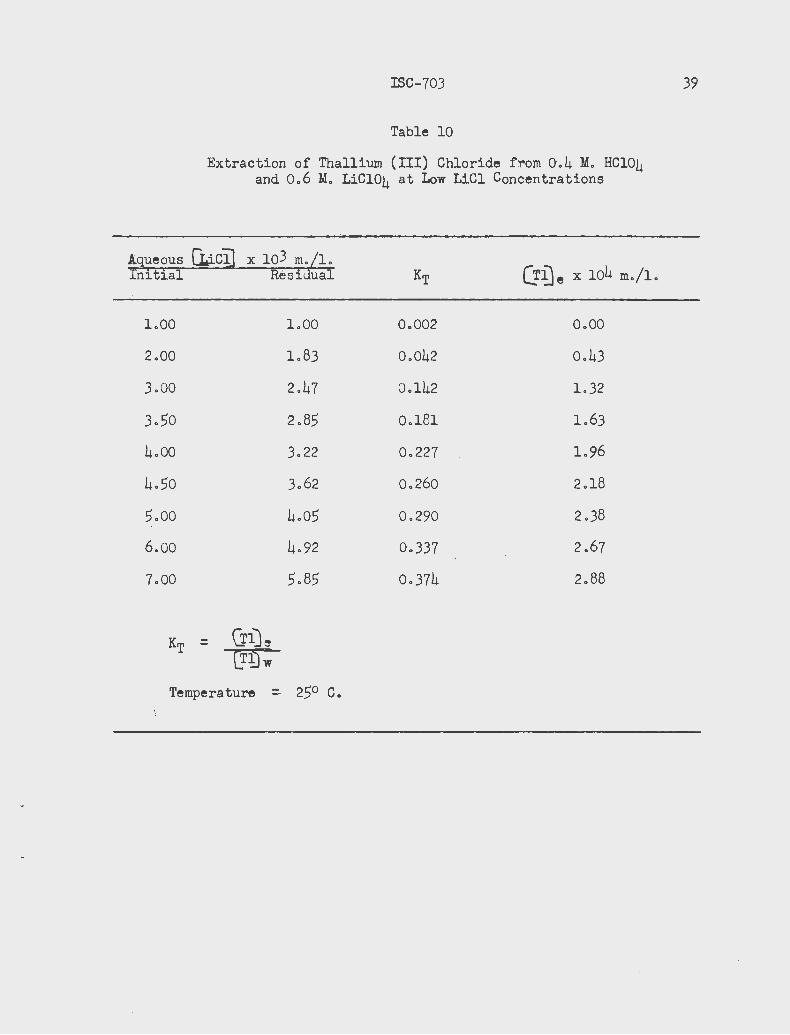
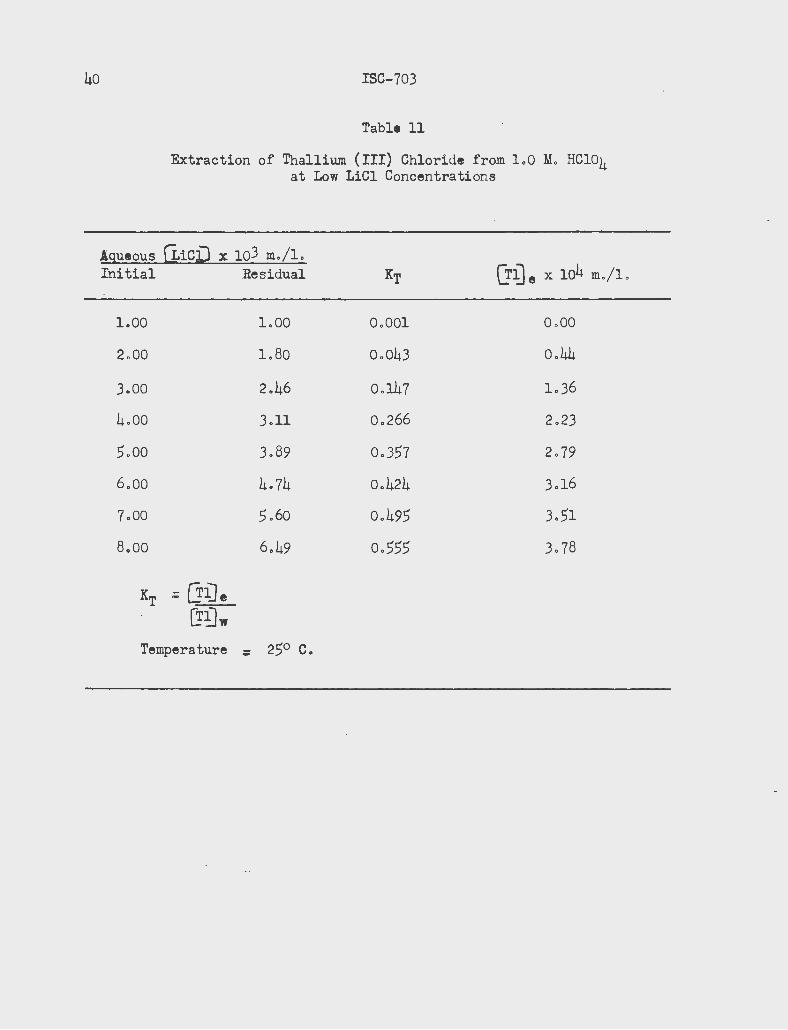
The extraction was studied at 25° C. for two acid concentrations, 0.4 M. and 1.0 M. HC104. In the extraction study at 0 . 4 M. HCl04 the solution was 0.6 M. in LiCl04 to maintain the total salt and acid concentration at 1.0 M~ The plot of the ratio of thallium in the ether phase to thallium in the aqueous phase, KT, against the initial concentration of LiCl is shown in Figure 9. The results are tabulated in Tables 10 and 11.
Using the method outlined :in Chapter IV tl::evalue of K' was determined for both HCl04 concentrations over the range of LiCl concentrations employed. In this investigation the activity coefficient of the free chloride was assumed to be the mean activity coefficient of HCl at the same concentration, since the concentration of HCl04 was in excess of the LiCl concentration at all times.
The activity coefficients of the thallium-chloride complexes were calculated from the extension of the Debye-Huckel theory~
- log '1 i = Azf J ~ • 1 + 3~~
The ionic strength,~ , was 1 .0, neglecting the concentra tions of Tl(Cl04) 3 and LiCl since they were too small to effect the calculation. The constant A is 0.5085 at 25° C. The values of the activity coefficients of the thallium-chloride complexes which were calculated in t hi s manner are shown -in Table 1~. It was not nece~sary to know t he _activity co~ffici~nts fo~ ~lC15-2 and Tl+3 slnce the concentratlon of the se specles at any glven LlCl concentration was too small to effect the calculation of K'.
38
0.8
~.4
.... ~0.2-
0 F <t a::
ISC-703
CURVE I
0.002 0.004 0006 0.008 INITIAL ( LiCI) IN MOLES I LITER
Figure 9 - Extraction at very low LiCl concentrations.
Temperature = 25° c.
Curve l - 1.0 M. HCl04 Curve 2 - 0.4 M. HCl04
ISC-703
Table 10
Extraction of Thallium (III) Chloride from 0.4 M. HC104 and 0.6 M. LiCl04 at Low LiCl Concentrations
Aqueous C1ic~ x 103 rn.[l. (jJ] e x 104 m./1. Initial Residual KT
1.00 1.00 0.002 0.00
2.00 1.83 0.042 0.43
3.00 2.47 0.142 1.32
3.50 2.85 0.181 1.63
4.00 3.22 0.227 1.96
4.50 3.62 0.260 2.18
5.00 4.05 0.290 2.38
6.00 4.92 0.337 2.67
7.00 5.85 0.374 2.88
Temperature =- 25° C.
39
40 ISC-703
Table 11
Extraction of Thallium (III) Chloride from 1.0 M. HCl04 at Low LiCl Concentrations
Agueous CiiciJ x 103 m./1. Initial Residual KT (}':De x 1o4 m,/1 .
LOO LOO 0.001 0. 00
2-.00 LBO 0.043 0.44
3.00 2.46 0.147 L36
4,00 3.11 0.266 2. 23
5.00 3.89 0.357 2. 79
6.00 4.74 0.424 3.16
7.00 5.60 0.495 3.51
8.00 6.49 0~555 3. 78
KT = GiJe L!fJw
Temperature = 25° c.
ISC-703
Table 12
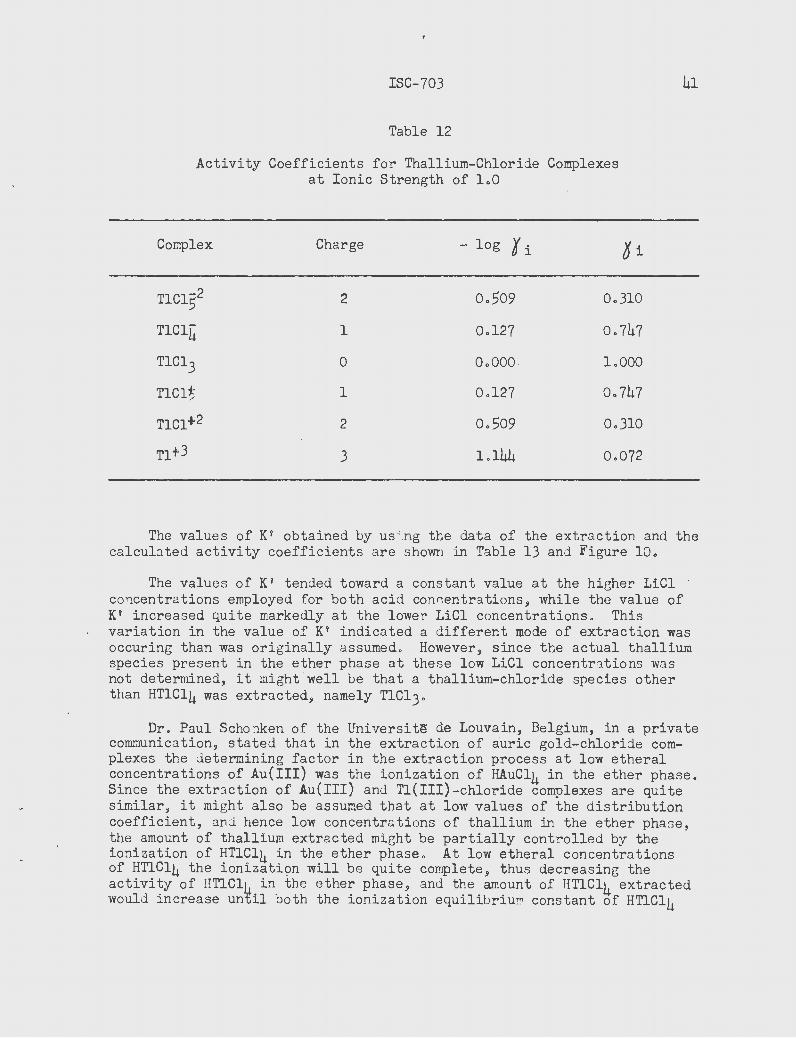
Activity Coefficients for Thallium-Chloride Complexes at Ionic Strength of 1.0
Complex Charge - log { i oi
TlC152 2 0.509 0.310
TlClfi 1 0.127 0.747
TlC13 0 o.ooo . 1.000
TlCl~ 1 0.127 0.747
T1c1+2 2 0.509 0.310
Tlt3 3 1.144 0.072
41
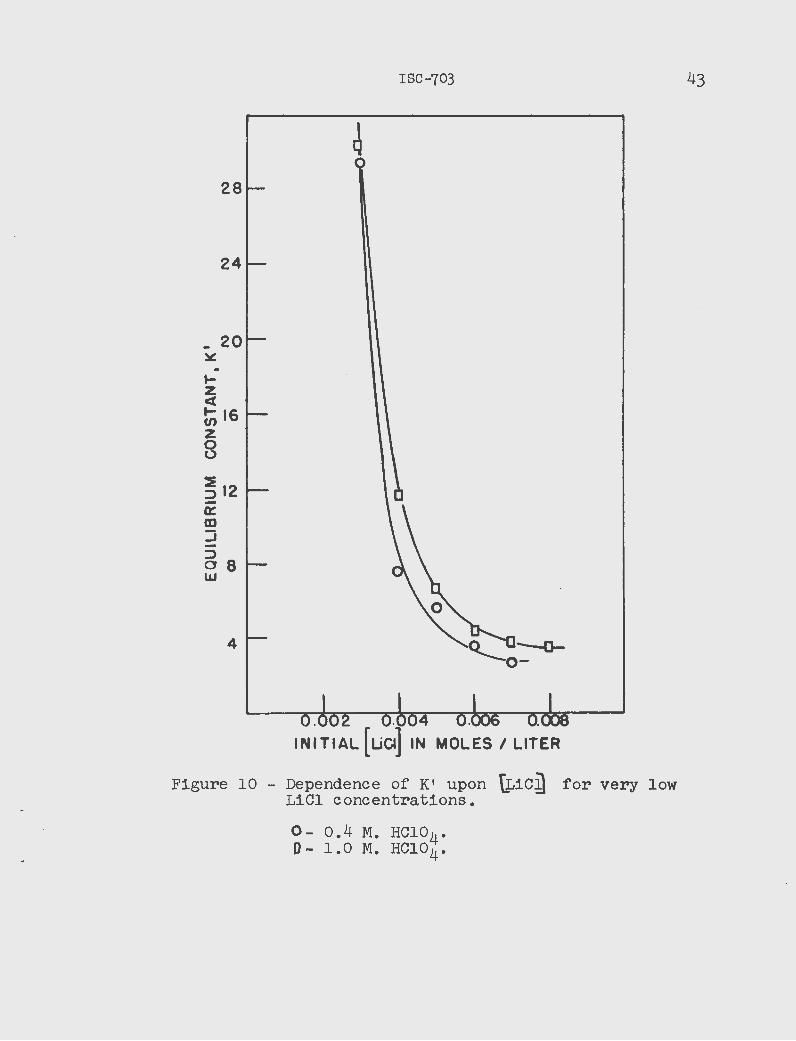
The values of K1 obtained by us i ng the data of the extraction and the calculated activity coefficients are showr1 in Table 13 and Figure 10.
The values of K' tended toward a constant value at the higher LiCl concentrations employed for both acid conr-entrations; while the value of K1 increased quite markedly at the lower LiCl concentrations. This variation in the value of K1 indicated a different mode of extraction was occuring than was originally assumed. However 9 since the actual thallium species present in the ether phase at these low LiCl concentrations was not de.termined, it might· well be that a thallium-chloride species other than HTlCl4 was extracted, namely TlCl3.
Dr. Paul Schonken of the Universite de Louvain, Belgium, in a private communication, stated that in the extraction of auric gold-chloride complexes the determining factor in the extraction process at low etheral concentrations of Au(III) was the ionization of HAuCl4 in the ether phase. Since the extr3ction of Au(III) and Tl(III)-chloride complexes are quite similar, it might also be assumed that at low values of the distribution coefficient, and hence low concentrations of thallium in the ether phase, the amount of thallium extracted might be partially controlled by the ionization of HTlCl4 in the ether phase. At low etheral concentrations of HTlCl4 the ionizati9n will be quite complete, thus decreasing the activity of HTlClh in the ether phase, and the amount of HTlCl4 extracted would increase un~il both the ionization equilibrium constant of HTlCl4
42 ISC-703
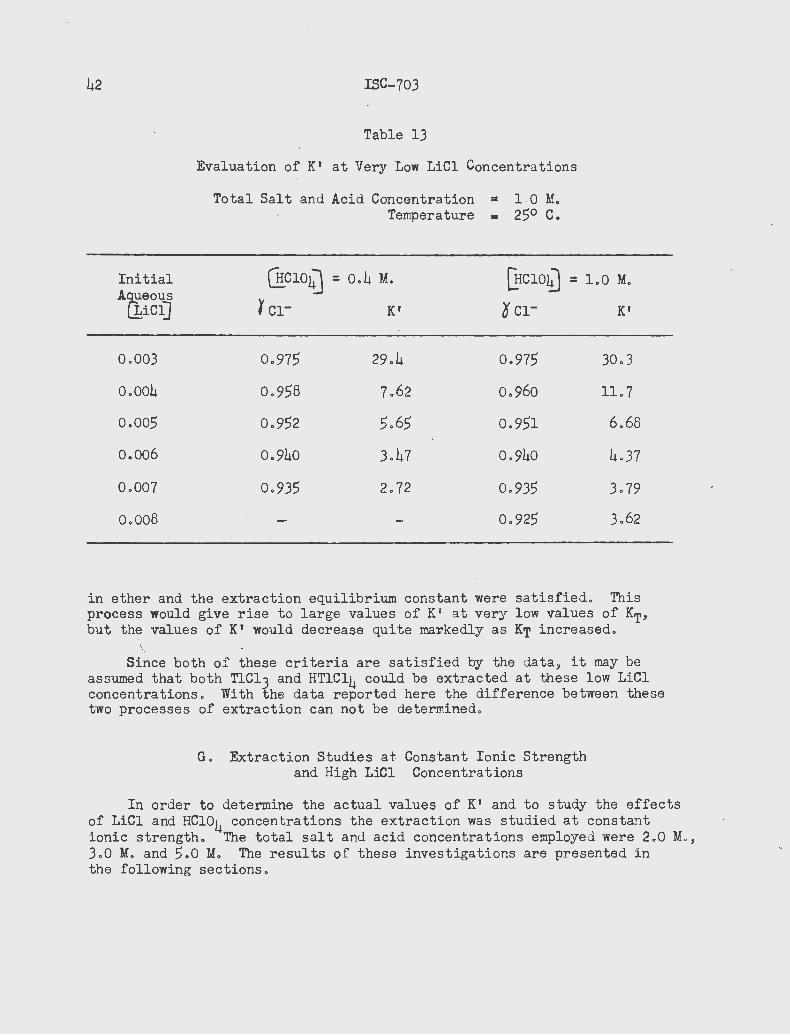
Table 13
Evaluation of K' at Very Low LiCl Concentrations
Total Salt and Acid Concentration = Temperature •
1 .0 M. 2.5° c.
Initial G!_c1o~ = 0.4 M. [lrc1ol!) = 1.0 M. A(1eous
iCl] ~ Cl- K' o c1- K'
0.003 0.97.5 29.4 0. 97.5 30.3
0.004 0.9.58 7.62 0.960 11.7
0.00.5 0.9.52 .5.6.5 0.9.51 6.68
o.oo6 0.940 3.47 0.940 4.37
0.007 0.93.5 2.72 0.93.5 3.79
0.008 0.92.5 3.62
in ether and the extraction equilibrium constant were satisfied. This process would give rise to large values of K1 at very low values of KT, but th~ values of K' would decrease quite markedly as KT increased.
\_ -Since both of these criteria are satisfied by the dataj it may be
assumed that both TlCl3 and HT1Cl4 could be extracted at these low LiCl concentrations. With the data reported here the difference between these two processes of extraction can not be determined.
G. Extraction Studies at Constant Ionic Strength and High LiCl Concentrations
In order to determine the actual values of K' and to study the effects of LiCl and HCl04 concent rations the extraction was studied at constant ionic strength. The total salt and acid concentrations employed were 2.0 M. , 3.0 M. and .5.0 M. The results of these investigations are presented in the following sections.
28
24
- 20 ~ .. 1-z <(
1-JS (/)
z 0 0
~ 12 a: m :J ::J oe w
4
ISC-703
IN;TIAL [ u~] IN MOLES I LITER
Figure 10 - Dependence of K1 upon ~iC~ for very low LiCl concentrations.
0- 0.4 M. HCl04 • 0- 1.0 M. HClO 4.
43
44 ISC-703
l . Total salt and acid concentration equal to 5.0 M.
In this investigation the HCl04 concentration was 4.0 M. and the sum of the concentrations of LiCl and LiCl04 was 1.0 Ma The initial aqueous concentration of Tl(Cl04)3 was 1.06 x lo-3 M. The results of this investigation are shown in Table 14.
Three phases were observed after the extraction equilibrium was obtained; a "light" ether, a "heavy" ether and an aqueous phase. The volume of each phase changed as the MCl conceritratio1l varied . It was also noted that at every LiCl concentration the total final volume obtained was 0 .5 - 1. 0 ml. less than the initial total volume. The heavy ether phase contained nearly all of the thallium, netween 90 ~ 96 percent of the original thallium.
The three phase region has been observed by Dodson, Forney and Swift (26), Myers and Metzler (32) and Nachtrieb and Fryxell ( JO ) in the investigation of the extraction of FeCl3 into ethera Nachtrieb and Fryxell (23) observed a three phase region in the extraction of GaClJ i nto isopropyl ether. Nachtrieb and Fryxell (30 ) suggested the explanation for the distribution anomaly of the three phase system was not provided by thermodynamics, but would require structural evidence. They stated that in the case of Fe(III) extraction it was not unreasonable to suppose that the normal extraction was a kind of generali 7.ed acid-base reaction in which hydrogen bonding links the HFeCl4 to the ether to form an "onium" salt:
R" I 0 • • o HFeCl4 • I
R
Deviation from the normal extraction may be due to polymers. Conceivably, chains might be formed by multiple hydrogen bonding.
R R R I f I 0. 0 . HFeCl5H • 0 . 0 0 0 o HFeCl.5H o . 0 0 I I l R R R
In this investigation,although empirical formulas have not been determined for the thallium species extracted,some approximate ratios of Cl-/Tl and H+/Tl in the ether phases have been calculated. The s olubility of LiCl and HCl04 in isopropyl ether was determined for the same salt and acid concentrations with no Tl(Cl04)3 present. The same three phases were present, but the volumes of like phases were not the same as when Tl(Cl04)3 was present. For this reason the actual correction of the etheral chloride and hydro gen ion concentrations for their solubility in ether could not be determined. Some of the approximate ratios were calculated and in the heavy ether phase it was noted that the ratios of Cl-/Tl and ~/Tl were greater than 4.0 and 1.0 respectively, which would indicate the
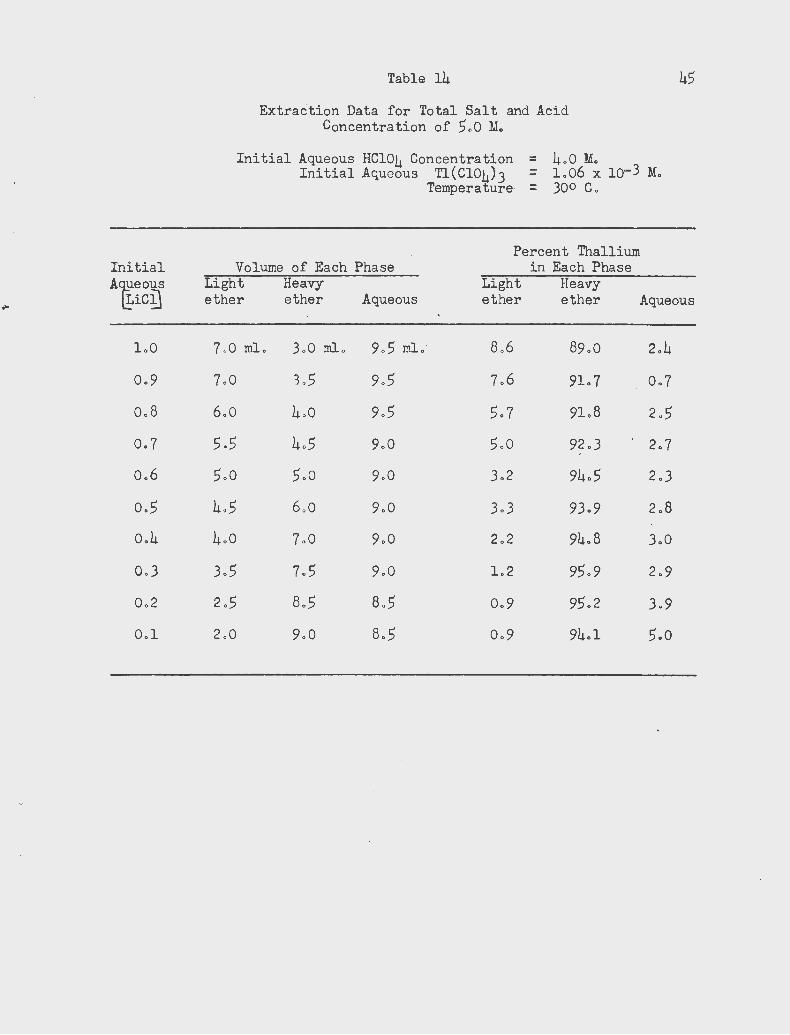
Initial
... A[!eous LiC~
LO
0.9
0.8
0.7
0. 6
0.5
0.4
0. 3
0.2
0 .1
Table 14
Extraction Data for Total Salt and Acid Concentration of 5. 0 hl.
Initial Aqueous HCl04 Concentration Initial Aqueous Tl ( ClOJ) 3
Temperature
= 4.0 M. = 1.06 x lo-3 M. = 300 c.
Percent Thallium Volume of Each Phase in Each Phase
Light Heavy Light Heavy
45
ether ether Aqueous ether ether Aqueous
7.0 mL 3. 0 mL 9.5 mL 8.6 89.0 2.4
7. 0 3.5 9.5 7.6 9L7 0.7
6.0 4 .0 9. 5 5. 7 9L8 2.5
5 .5 4.5 9. 0 5.0 92 . 3 2.7
5.0 5. 0 9. 0 3. 2 94.5 2.3
4.5 6. 0 9. 0 3. 3 93.9 2.8
4.0 7. 0 9.0 2. 2 94.8 3.0
3.5 7. 5 9. 0 1.2 95.9 2.9
2.5 8.5 8.5 0.9 95.2 3.9
2.0 9. 0 8. 5 0.9 94.1 5.0
46 ISC-703
possible formation of polymers in the heavy ether phase of the type ~TlCly, where x)l.O and y> 4.0.
However, it is believed that at these very low etheral concentrations of thallium, from 0.001 to 0.01 M. in the "heavy" ether phase, the formation of polymers which include thallium seemed very unlikely. These same three phases were observed with no thallium present, keeping the concentrations of LiCl, LiCl04 and HCl04 the same. It seems that the formation of this third phase was most likely due to the solubilities of HCl, HCl04 and their lithium salts in the iso-propyl ether.
Upon allowing the extractinn mixture to stand for long periods of time, one of the ether layers disappeared indicating that it is a metastable phase. However, the reason for this is unknown.
2. Total salt and acid concentrations equal to 2.0 M.
Since the system was so complicated at the higher acid and salt concentrations the investigation was shifted to a study at a lower total salt and' acid concentration equal to 2.0 M. The extraction eauilibrium was studied at three different HCl04 concentrations; 0.4 M., 1.0 M. and 1.6 M. For each HC104 concentration the LiCl concentration was varied keeping the total salt and acid concentration equal to 2.0 M. by the addition of required amounts of LiCl04 solutions. At thesfi lower concentrations of acid there was no noticeable difference in the volume of the ether and aqueous phase before and after the extraction equilibrium. The results of this investigation are shown in Figure ll and Tables 15, 16 and 17.
The general shape of the plot of KT against the initial LiCl concentration was similar for the extraction at the three acid concentrations. At LiCl concentrations below 0.1 - 0.2 M. KT increased very rapidly as the LiCl concentration increased. There was a maximum in the plot at LiCl concentration of 0.1 - 0.2 M. For LiCl concentrations greater than 0.2 M. the KT values decreased as the concentration of LiCl increased.
Since the concentrations of the thallium-chloride complexes were very small in every case, their activity coefficients were calculated from the extension of the Debye-Huckel theory:
-log 0 i '= A zf ..{;:7
l + 3J4-V
The ionic strength was essentially 2.0 since the concentrations of the thallium-chloride pomplexes were too small to effect the ionic strength. The con>ta~t A is 0.5130 at 30° C. The values of the activity coefficients of the thallium-chloride complexes which were calculated in this manner are shown in Table 18.
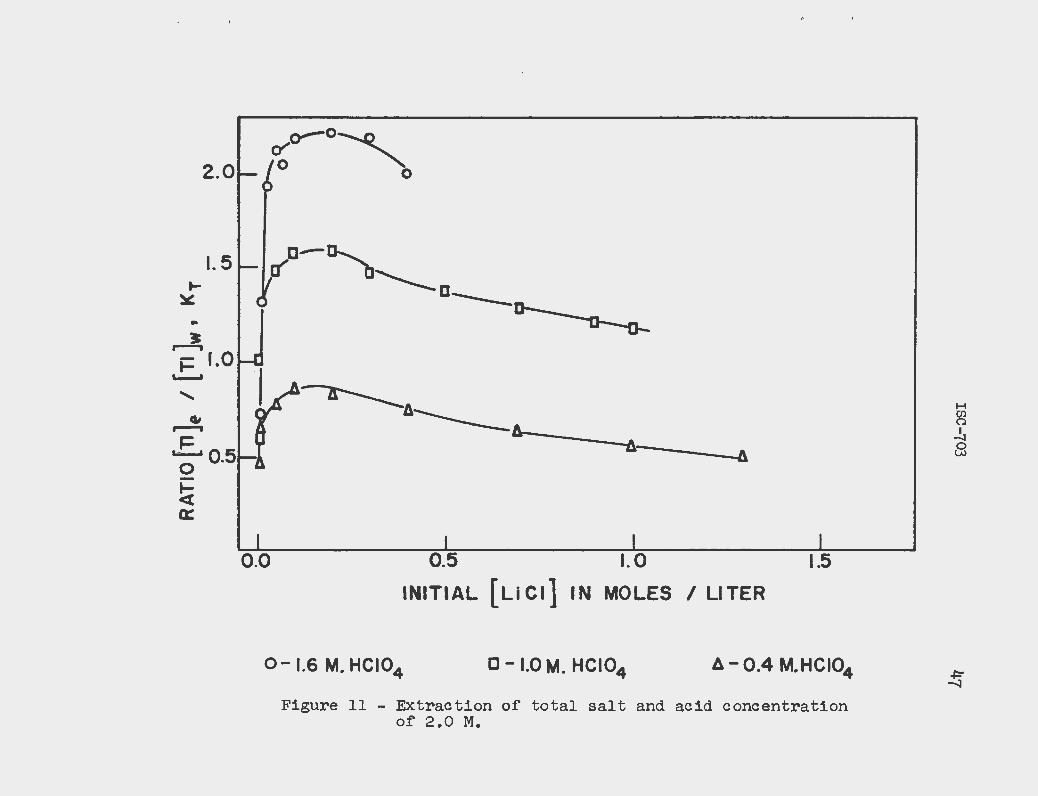
... ~
..
' ell ~
1.5
~ 0.5 0 -~ a:
o--O~ cf' 'o 0
a"a-~........._a __ ~
0 .0
~4 --------A-_____ _.
~----A
0.5 I. 0
INITIAL ( Li Cl) IN MOLES I Ll TER
1.5
o- 1.6 M. HCI04 c - 1.0 M. HCI04 A-0.4 M.HCI04
Figure 11 - Extraction of total salt and acid concentration of 2.0 M.
H Cf.l (')
~ £
~ -...:J
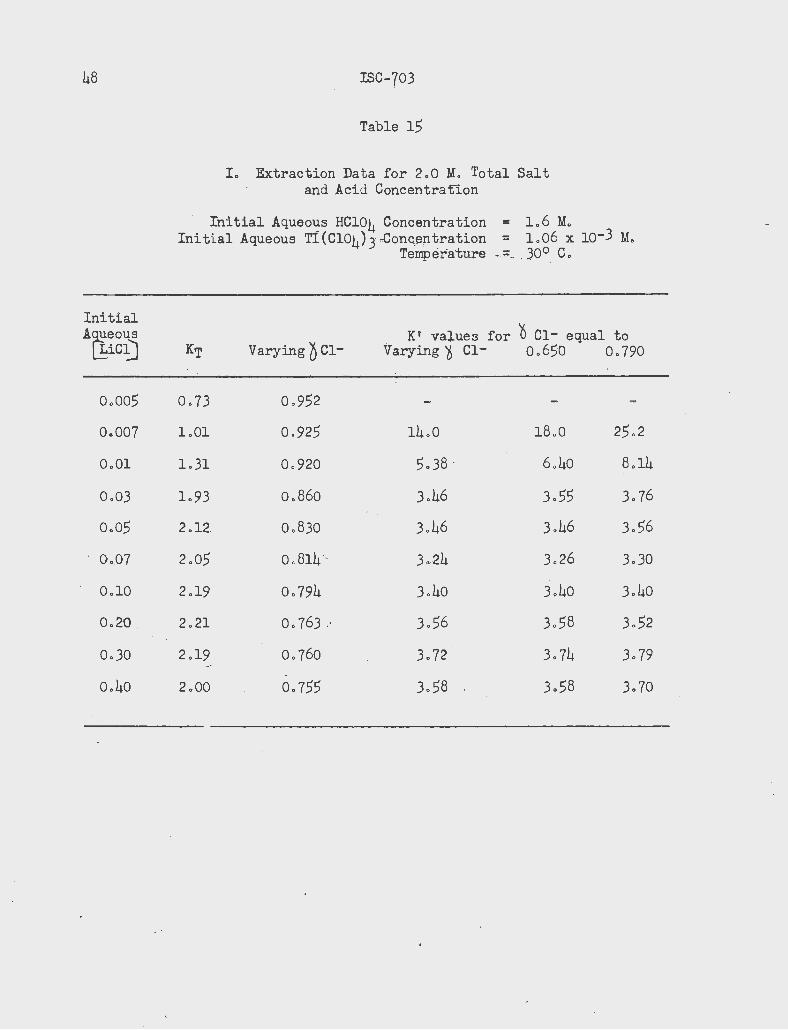
48
Initial A(teous
LiCJ]
0.005
0.007
0.01
0.03
0.05
0._07
0.10
0.2.0 .
0.30
o.4o
ISC-703
Table 15
I. Extraction Data for 2.0 M. Total Salt and Acid Concentra~ion
Initial .Aqueo~s HCl04 Concentration = 1. 6 M. Initial Aqueous Tl ( Cl04) 3 ,Conc,ep ~ration = L 06 x 10- 3 M.
Temperature __ :;: __ J0° c.
K' values for 0 Cl- equal to KT . Varying 0 Cl- Varying ~ Cl- o.65o 0. 790
0.73 0. 952'
1.01 0.925 14.0 18.0 25 . 2
1.31 0. 920 5.38 . 6. 40 8.14
1.93 0. 860 3.!16 3o55 3. 76
2.12: 0.830 3. 46 3.46 3.56
2. 05 0. 814 '· 3 .. 24 3. 26 3. 30
2.19 0. 794 3. 40 3.40 3. 40
2. 21 o. 763 . . • 3.56 3.58 3. 52
2.19 0. 760 3. 72 3. 74 3. 79 ·-·
2.00 0.755 3. 58 3.58 3.70
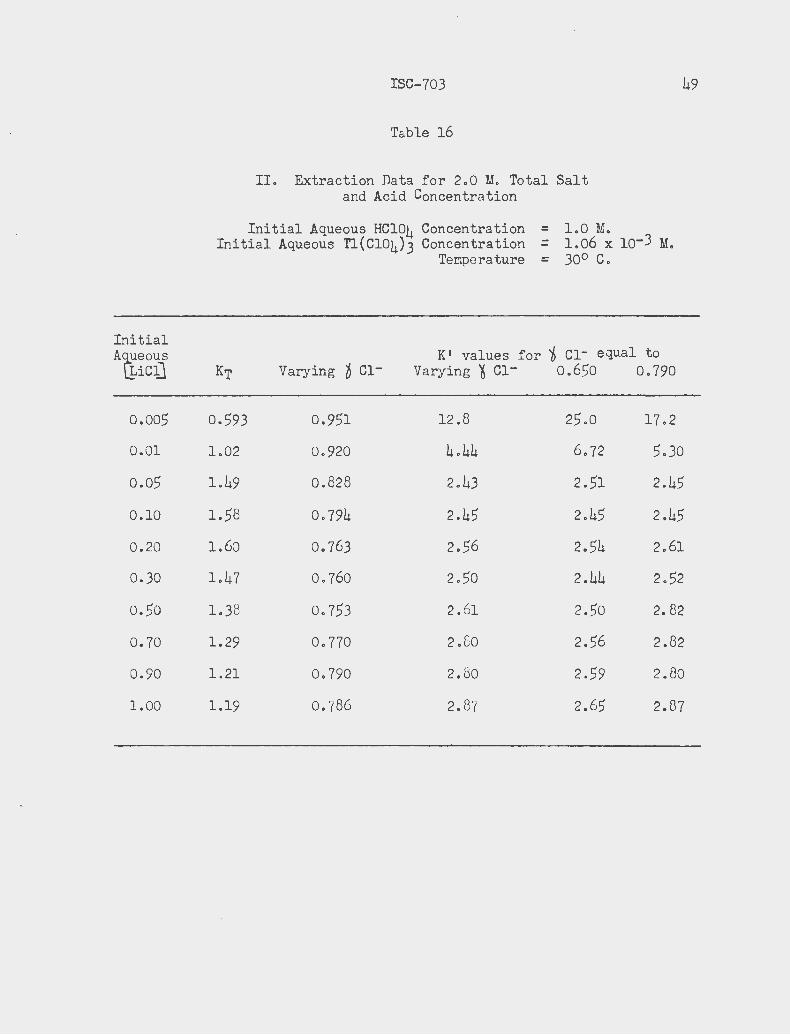
Initial AQeous
LiCU
0.005
0.01
0.05
0.10
0.20
0.30
0.50
0.70
0.90
1.00
ISC-703
To.ble 16
II. Extraction Data for 2.0 M. Total Salt and Acid Concentration
49
Initial Aqueous HC104 Concentration = 1.0 M. Initial Aqueous Tl(Cl04)3 Concentration = 1.06 x lo-3 M.
Temperature = 300 C.
K1 values for ~ Cl- equal to KT Varying ~ Cl- Varying ~ Cl- o.65o 0.790
0.593 0.951 12.8 25.0 17.2
1.02 0.920 4.44 6. 72 5.30
L49 0.828 2.43 2.51 2.45
1.58 0.794 2.45 2.45 2.45
1.60 0.763 2.56 2.54 2.61
1.47 0.760 2.50 2.44 2.52
1.38 0.753 2.61 2.50 2. 82
1.29 o. 770 2. 80 2.56 2.82
1.21 0.790 2.80 2.59 2. 80
1.19 0.786 2.87 2.65 2.87
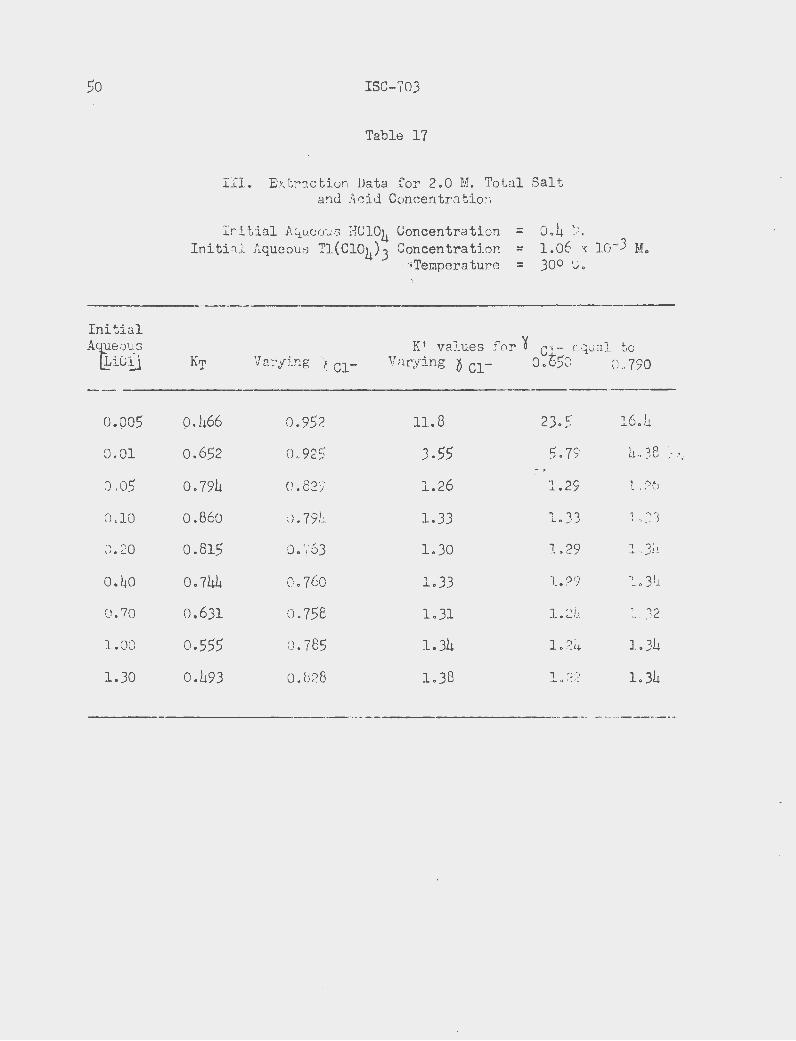
So
Initial AI1eous
Lief}
o. oo5
0.01
0.05
0.10
0.20
o.~o
0. 70
1.00
1.30
ISC-703
Table 17
III. Extraction Data for 2.0 M. Total Salt and Acid Concentration
Initial Aqueous HCl04 Concentration = 0.4 ~.l. Initial Aqueous Tl(Cl04) 3 Concentration = 1.06 x lo-3 M.
:;Temperature = 300 C.
K' val ues for ·~ ct- equal to KT Va-rying ~ c1- Varying 0 Cl- o. 5o o"790
o. 466 0.952 11.8 23.5 16. 4
0.652 0.925 3.55 5.79 4.38 :-- ~
0.794 0.829 1.26 1.29 1.26
0.860 o. 791+ 1.33 1.33 1.33
0.815 0. 763 1.30 1.29 L3lt
0.744 0.760 1.33 1.29 1.34
0.631 ,0. 758 1.31 1.24 L32
0.555 0 .785 1.34 1. 24 1. 34
0 .493 0. 828 1.38 lo 22 1. 34
...
-,., . )~·
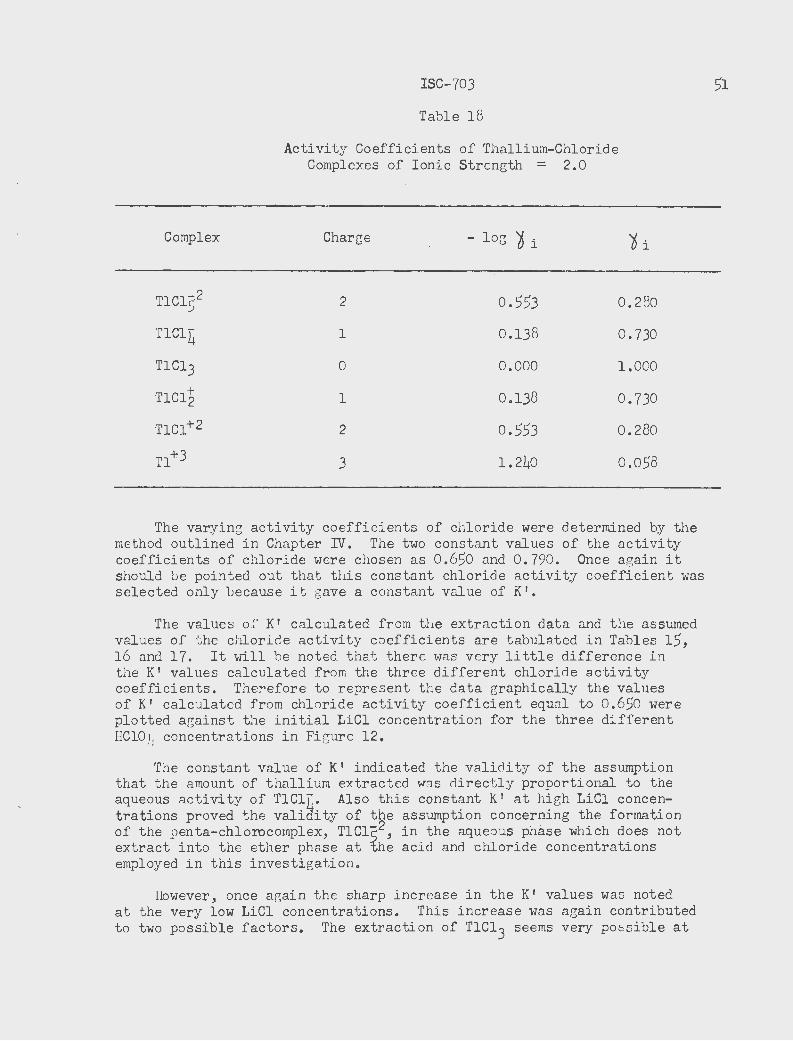
Complex
TlC152
TlCli;.
TlCl3
TlClt
TlCl+2
Tl+3
ISC-703
Table 18
Activity Coefficients of Thallium-Chl oride Complexes of Ionic Strength = 2. 0
Charge - log ~ i ~i
2 0.553 0.280
1 0.138 0.730
0 0.000 1.000
1 0.138 0.730
2 0.553 0.280
3 1.240 0.058
The varying activity coefficients of chloride were determined by the method outlined in Chapter IV. The two constant values of the activity coefficients of chloride were chosen as 0.650 and 0 .790 . Once again it should be pointed out that t his constant chloride activity coefficient -vms selected only because it gave a constant value of K'.
The values of K1 calculated from the extraction data and the assumed values of the chloride activity coefficients are tabul ated in Tables 15 , 16 and 1 7. It will be noted that there was very little difference i n the K1 values calculated from t he three different chloride activity coefficients. Therefore t o r epresent the data graphically t he values of K 1 calculated f r om chloride activity coef ficient equal to 0 .650 were plotted against the initial LiCl concentration for the three different HClO!( concentrations in Figure 12.
The constant value of K' i ndicated the validi t y of the assumption that the amount of thallium extracted was directly propor t ional to . the aqueous activity of TlCl[. Also this constant K' at hi gh LiCl concentrations proved the validity of the assumption concerning the formation of the penta-chlo:rocomplex, TlCl~2 , in the aqueous phase which does not extract into the ether phase at 'Lhe acid and chloride concentrations empl oyed in this investigation.
However, once again the sharp increase in the K' values was noted at the very low LiCl concentrations. This increase was again contributed to two possible factors. The extract ion of T1Cl3 seems very possible at
51
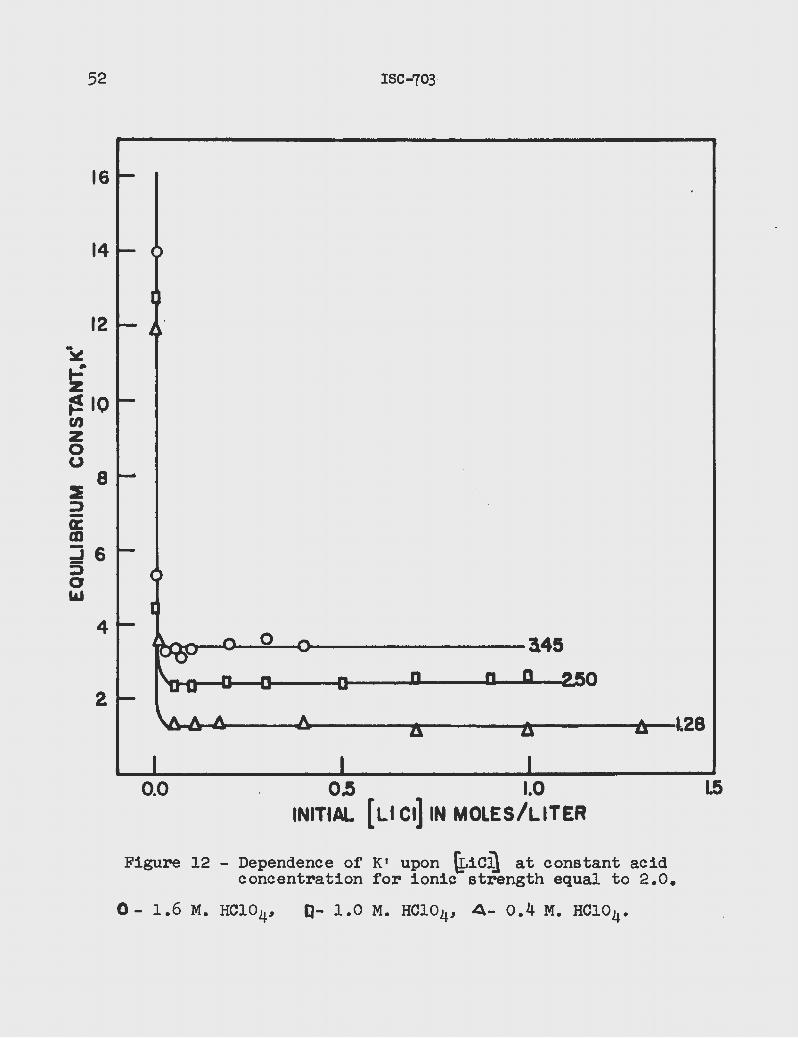
52
16
14
12
-~ .,: z ~10 (/)
z 0 u
2 8
~ -a: m d6 :;) 0 l&J
4
2
ISC-703
/
345
0
0.0 0.5 1.0 INITIAL ( Ll Cl) IN MOLES/LITER
Figure 12 - Dependence of K' upon ~iC~ at constant acid concentration for ionic strength equal to 2.0.
0- 1.6 M. HCl04, [l- 1.0 M. HCl04, 4- 0.4 M. HCl04•
t28
ISC-703 53
these low LiCl concentrations thus g1v1ng r ise to apparently large values of Kt. Also at these low etheral concentrations of HTlCl4 the ionization of HTlCl4 in the ether phase becomes very important. This ionization would result in the calculation of large values of K' from the method employed.
3. Total salt and acid concentration equal to 3.0 M.
The extraction equilibrium was studied at a total salt and acid concentration of 3 .0 M. for four different HC104 concentrations; 0.4 M., 1.0 M.j 1.6 M. and 2.2 M. The LiCl concentratton _wl:ls varied for each HClQ!:J: __ concentration keeping the total salt and acid concentration at 3.0 M. by the addition of required amounts of standard LiCl04 solutions. There was no noticeable difference in the initial and final etheral an.:l aqueous volumes. The results of this investigation are sho\vn in Figure 13 and Tables 19j 20, 21 and 22.
The plots of KT against the initial LiCl concentration have the same g•meral shape for the extraction at the four acid concentrations. A maximum in KT was observed at LiCl concentrations of approximately 0.05 -0.20 M. The width of the peak decreased quite markedly as the concentration of HC104 was increased. At LiCl concentrations below 0.05 M. the value of KT decreased very rapidly. There was a decrease in K~ at higher LiCl concentrations, an initial large decrease followed by a more gradual decrease.
As in the case of 2.0 M. total salt and acid concentration the concentrations of the thallium-chloride complexes were very small in every case and their activity coefficients were calculated from the extension of the L'ebye -Huckel theory . Neglecting the concentrations of the thalliumchloride complexesj since they were very small , the i onic strength was essentially 3.0 and the value of the constant A was taken as 0.5130 at 30° c. The calculated values of the activity coefficients of the thalliumchloride complexes are shown in Table 23.
Using the method outlined in Chapter IV the varying activity coefficients of chloride were calculated from the values of the mean activity coefficients of HCl and LiCl. The constant value of the chloride activity coefficient which appears to give the most constant value of K1
was 0.850. .
The values of KV calculated using the extraction data and the val11es of the chloride activity coefficients are presented i n Tables 19j 20, 21 and 22. At the low LiCl concentrations there is very little difference in the K' values calculated from the varying and the constant chloride activity coefficient . Howeverj at .the higher LiCl concentrations the values of Kt calculated from the varyi ng chloride activity coefficient increase slightly, whereas the values calculated with the chloride activity coefficient equal to 0.850 remain remarkably constant. The cons tancy of the values of KV calculated with the chloride activity
54
5.0
4.0
:E ,. 3.0 ;l ,_...
It= I
' Q)2.0 ,_... i=
L..--1
0 .... : 1.0
0.0
ISC-703
0.5 1.0 1.5 2.0 INITIAL ( Ll Cl) IN MOLES I LITER
e 2.2 M. HCI04 o 1.6 M.HCI04
c 1.0 M. HC 104 A 0.4 M. HCI04
2.5
Figure 13 - Extraction at total salt and acid concentration of 3.0 M.
•
ISC-703
Table 19
I. Extraction Data for J.O M. Total Salt and Acid Concentrationa
Initial Aqueous HCl04 Concentration = 2. 2 M. Initial Aqueous Tl(Cl04)j Concentration = 1.06 x lo-3 M.
Temperature = 300 C.
Initial K' values for A~eous ~ c1- equal to
LiC.IJ KT Varying y c1- Varying D c1- 0.850
0.005 2.11 ' 0.962 109. 138.
0.01 3.95 0.922 19.9 22.1
0.05 5.55 0.829 9.20 9.15
0.10 5.42 0.794 8.56 ·s.62
0.20 5.42 0.763 8.84 9.00
0.30 4.95 o. 759 8.57 8. 72
0.50 4.64 0.753 8.91 9.18
o.6o 4.30 0.762 8.68 9.00
o. 70 4.07 o. 770 8.62 8.91
0.80 3.90 0.780 8.70 9.00
aAverage of two runs.
55
56
Initial AQueous
Lief!
o.oo5
0.01
0.0.5
0.20
o.4o
0.60
0.80
1.00
1.20
1.40
a Average
ISC-703
Table 20
II. Extraction Data for 3.0 M. Total Salt and Acid Concentrationa
Initial Aqueous HCl04 Goncentra tion = 1.6 M. Initial Aqueous 'l;'l(Cl04)3 Concentration = 1.06 x lo-3 M.
Temperature = 30° ·· C.
K1 values for 0 Cl- equal to
KT Varying ~ Cl- Varying ( Cl- 0.8.50
1. 91 0. 962' 98 • .5 12.5.
3.27 0.922 18.3 18.9
4 . .58 0.829 7.39 7.34
4.30 0.763 7.01 7.14
4.0.5 0.7.56 7.37 7 • .57
3.42 0.762 6.87 7.12
3.32 0.780 7.40 7.6.5
2.93 0.802 7.2.5 7.4.5
2.69 0.834 7.37 7.4.5
2.42 0.868 7.33 7.26
of two runs.
Initial A(teous
LiCJ]
0.05
0.10
0.20
0.40
0.70
l.OO
1.20
1.50
l. 70
2.00
ISC-703
Table 21
III. Extraction Data for 3.0 M. Total Salt and Acid Concentrationa
Initial Aqueous HCl04 Concentration = 1.0 M. Initial Aqueous Tl(Cl04)3 Concentration = 1:06 x lo-3 M.
Temperature = 300 C.
K1 values for 't> Cl- equal to
KT Varying b Cl- Varying '6 c1- 0.850
3.47 0.829 5.55 5.55
3.61 0.794 5.67 5.92
3.45 0.763 5.62 5.72
2.90 0.756 5.31 5.42
2.35 o. 770 4.99 5.18
2.09 o. eo2 5.18 5.31
1.85 0.828 5.07 5.13
l. 72 0.867 5.41 5.36
l.)l 0.885 5.18 5.06
1.46 0.957 5.80 5.38
aAverage of two runs.
57
58 ISC-703
Table 22
IV. Extraction Data for 3.0 M. Total Salt and Acid Concentrationa
Initial Aqueous HCl04 Concentration = 0.4 M. Initial Aqueous Tl(Cl04) 3 Concentration = 1.06 x l o-3 M.
Temperature = 30o C.
Initial K' values for
A[!eous 0 cl- equal to LiClJ KT Varying ocl- Varying ~ Cl- 0.850
o.o5 1.48 0.829 2.39 2.39
0.10 1.64 0.794 2.58 2.59
0. 40 1. 81 0.756 3.29 3. 38
0.50 1.40 0.750 2.67 2. 77
0.70 1.45 0.760 3.06 3.17
1.00 1.10 0.816 2.74 2.79
1.50 0.924 0.845 2.87 2.87
l. 70 0.837 0.868 2.84 2.79
2.00 0. 770 0.927 3.00 2.84
2.20 0.705 1.000 3.07 2. 77
2.50 0.638 1.050 3.15 2. 71
a Average of two runs.
Complex
TlC1_52
T1Cl4
T1Cl3
T1Cl2
TlC1+2
Tl+3
ISC-703
Table 23
Activity Coefficients of Thallium~Chloride Complexes at Ionic Strength = 3.0 M.
Charge - log oi
2 0.573
1 0.144
0 o.ooo
1 0.144
2 0.573
3 1.290
59
¥i
0.267
o. 718
1.000
0.718
0.267
0.051
coefficient equal to 0.850 are shown in Figure 14 in a graph of K1 versus the initial LiCl concentrations. However, it should be noted that the values of K' calculated fr6m- the vanying Qhloride activity coefficient do not vary enough to say that this method is not correct. From the data present it was not possible to tell which method of determining the activity coeffi_cient of the chloride ion in the solution was the be s t.
Since the values of K1 were constant over such a wide range of LiCl concentrations it is felt that the initial assumptions about the equilibrium were correct. The amount of thallium extracted was directly proportional to the aqueous activity of TlClii· Since the values of K' would not be constant without including the term with K5, the assumption that a penta-chloro complex, T1Cl'_52, was f ormed in the aqueous phase and wan not extractable into the ether phase over the range of LiCl and HCl04 concentrations employed in this investigation was proven a valid assumption.
The sharp rise in the K' values at low LiCl concentrations was observed again, and once again this increase could be explained by the extraction of TlCl3 and/or the ionization of HTlOl4 in the ether phase.
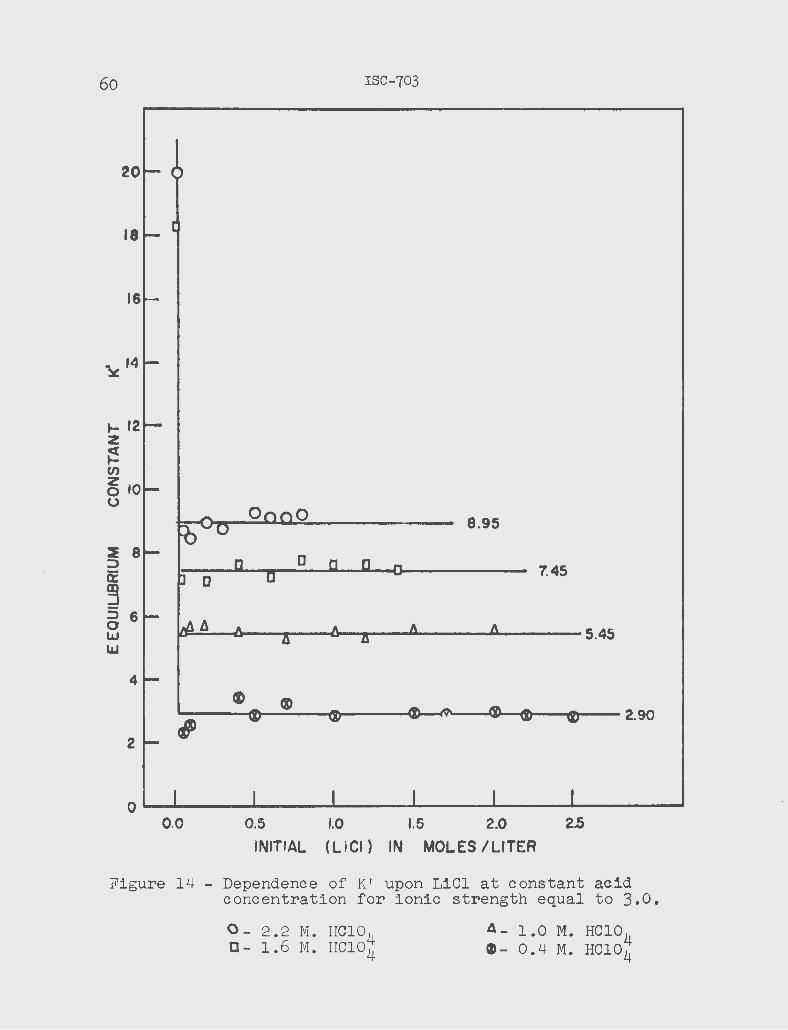
60 ISC-703
18
~14
4
2
0~--------~------~------~------~------~---------0.0 0.5 1.0 1.5 2.0 2.5
INITIAL (LiCI) IN MOLES /LITER
Figure 14 - Dependence of K' upon LiCl at constant ac.id concentration for ionic strength equal to 3.0.
0 - 2 • 2 M. HCl 0 4 D - 1 • 6 M. HCl 0 4
A - 1 • 0 M. HC 10 4 ~- 0.4 M. HC104
•'
ISC-703
H. Dependence of the Extraction upon Acid Concentration
61
In order to .iotermine the effect of acid concontration,the extraction wo. s studied at a series of constant IICl04 con con bra tions and a constant ionic s trongth. The results o (' this investigation are sr10wn in TalJle 2h. ln Fii'Ures 15 and lG the ralues of KT are plotted against the concentration of HClOLJ. at the total salt and acid concentr<1tions equal to 3.0 :W. and 2.0 M., respe ctivezy.
If · the plot of tho extraction equilibrium constant a gainst the activity of hydro gen ion is a strair,ht line, thG equUibrium constant must be a function of tho hydrogen ion activity to the first pOYIGr. The relationship will be of the order:
K t b
where a i s the s lope of the plot anJ b is the intercept of the plot on tho 11y:r axis.
If the plot of the lo;;:tr i t hm of trw c:: quilibrium constant a:~ainst the logarithm of t he:: activity of hydro[;C Yl ioT1 i s a strair;ht line, then the slope of that line v1:i ll J.etoruine tbA pmver to which the equj_lihrium constant is a f unction of the hy,J. r ogen ion activity.
For t hose case<3 in which the activity coefficient was not known it was not possible to use the hy dro~:;en :Lon activity in those plots. One can then use the acid concentration in place of the activity of tho hydrogen ion and make usc: of the r esulting graphs to [,'Uide in making assumptions about bho activity coefficients and their v~riation with concentration.
It will be noteJ in Figuro 15 that the plots of KT a ,~ainst HC104 concentrations for total salt anl aciJ. concentrations equal to 3.0 M. gnve straight lines at tho high concentrations of LiCl. At low LiCl concentrations the plots gave :'l traight lines at high HClOh concentrations but deviated negatively- at a low HCl04 concentrations. These results have indicated two conclusions. At high LiCl concentrations and over the range of HCl04 concentrations employed in this investigation KT was found to be proportional t o the concentration of HClOLJ., to the first power. At low LiCl concentrations and HClOLJ. concen~rations greater than 1.0 M. KT showed a first power Jependence on the concentration of HClOLJ., but at lower HCl04 concentrations was proportional to the concentration of ITCl04 to sorr:e hi gher power. The Jependence of KT on the concentration of HClOLJ. to the first power indicated that the species extracted contained one hydrogen and wac; probably HTlCl4, but the dependence upon higher powers of HClOLJ. concentrations inuicated that another process was being observed. Thi s higher power ::l.ependenco could be due to the depenJence of the extraction, at low LiCl concentrations, upon the : onization of HTlClh in
62
5.0
4.0
1-
~3.0 .. .J, -.... ...__,
0 ~ 1.0 <( a:
ISC-703
CURVE I
HCI04 CONCENTRATION IN MOLES /LITER
Figure 15 - Extraction as a function of concentration of HCl04 for total salt and acid concentration of 3.0 M.
Curve 1 - 1.10 M. LiCl Curve 2 - 0.20 M. LiCl Curve 3 - 0.40 M. LiCl Curve 4 - 0.70 M. LiCl
Curve 5 - 1.00 M. LiCl Curve 6 - 1.20 M. LiCl Curve 7 - 1.40 M. LiCl
2.0
1.5 .... ~
• ...---.. J:::_, 0
. t- 0.5 <X 0::
ISC-703
CURVE 2
0. 4 0.8 I. 2 1.6 2.0 HC 10 4 CONCENTRATION IN MOLES/LITER
Figure 16 - Extraction as a function of concentration of HClo4 for total salt and acid concentration of 2.0 M.
Curve 1 - 0.10 M. L1Cl Curve 2 - 0.05 M. LiCl Curve 3 - 0.40 M. LiCl
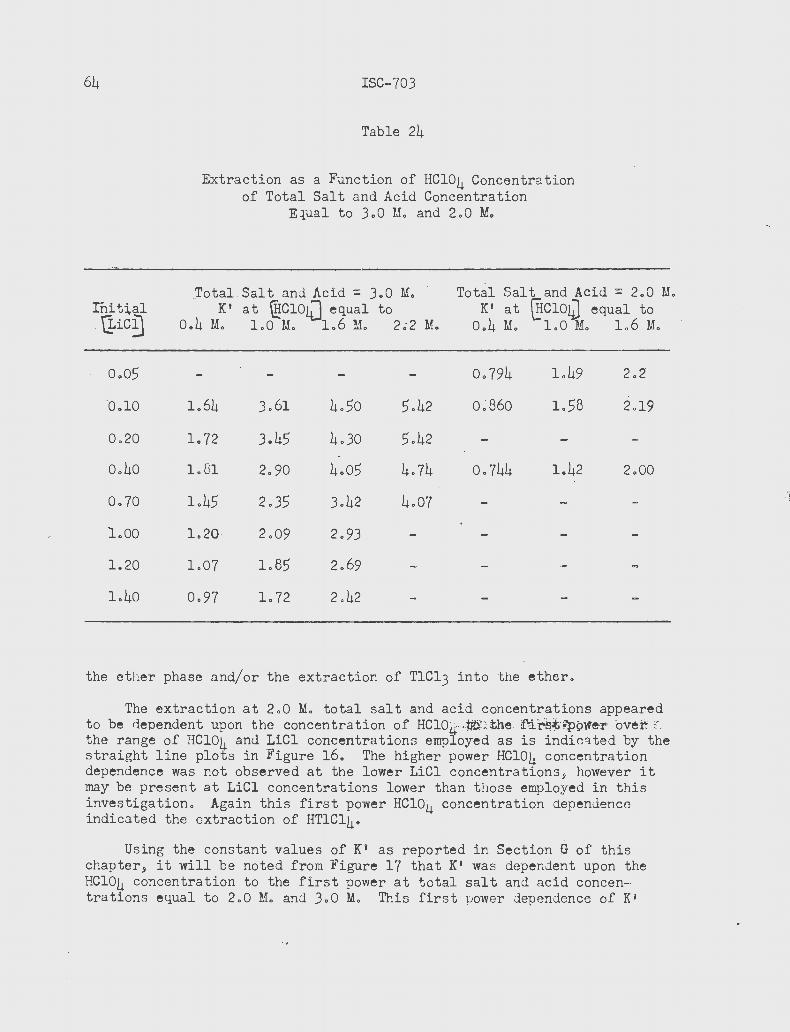
64
Init~al
. Q.ic~
0.05
0.10
0.20
0.40
0.70
Loo
1.20
1.40
ISC-703
Table 24
Extraction as a Function of HCl04 Concentration of Total Salt and Acid Concentration
Equal to 3.0 M. and 2.0 M.
Total Salt and Acid = 3.0 M. Total Salt and Acid = 2.0 M. K' at @clo() equal to K' at @c1o4J equal to
0.4 M. 1.0 M. 1.6 M. 2;2 M. 0.4 M. 1.0 M. 1.6 M.
0.794 1.49 2.2
1.64 3.61 4.50 5.42 0.860 1.58 2.19
l. 72 3.45 4.30 5.42
1.81 2.90 4.05 4.74 0.744 1.42 2.00
1.45 2.35 3.42 4.07
1.20 2.09 2.93
1.07 1.85 2.69
0.97 l. 72 2.42
the ether phase and/or the extraction of TlCl3 into the ether.
The extraction at 2.0 M. total salt and acid concentrations appeared to be dependent upon the concentration of HClOLJ:·/~J. the .fi.r~~fPpwe.r oyef.' ( the range of HCl04 and LiCl concentrations employed as is indicated by the straight line plots in Figure 16. The higher power HCl04 concentration dependence was not observed at the lower LiCl concentrationsj however it may be present at LiCl concentrations lower than those employed in this investigation. Again this first power HCl04 concentration dependence indicated the extraction of HTlCl4.
Using the constant values of K1 as reported in Section ~ of this chapter, it will be noted from Figure 17 that K1 was dependent upon the HCl04 concentration to the first power at total salt and acid concentrations equal to 2.0 M. and 3.0 M. This first power dependence of Ka
I I
' '~ ' l
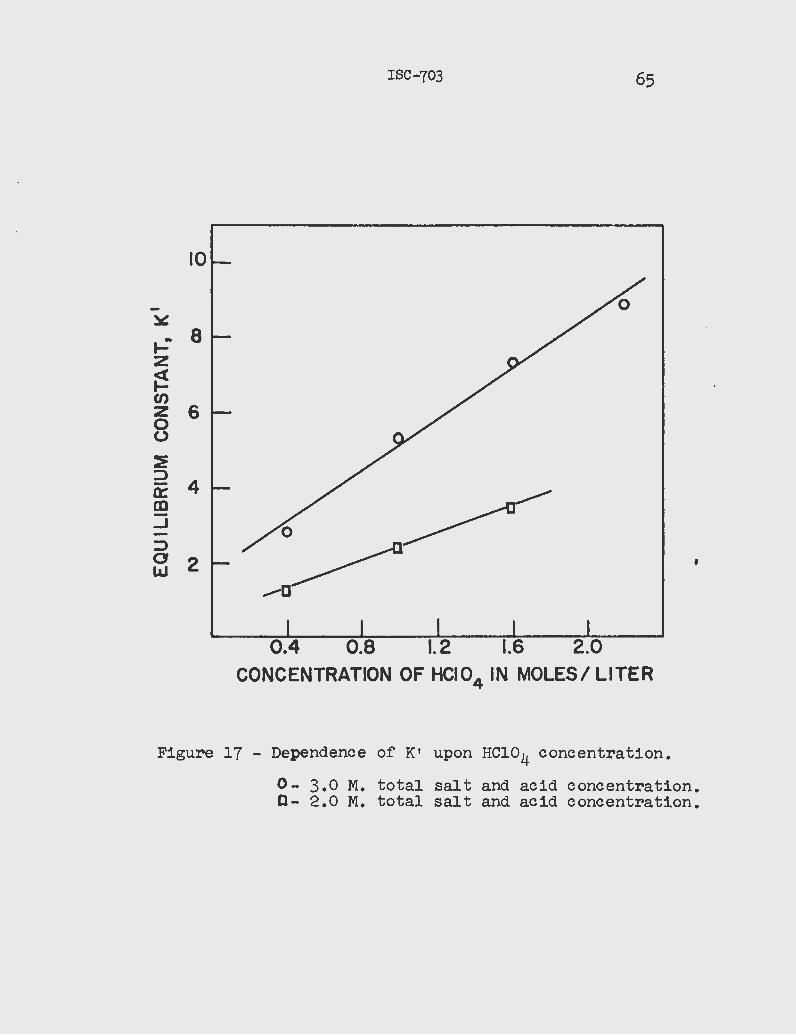
ISC-703 65
10
-~
,_: 8 :z ~ (/) :z 6 0 0
~ ::>
4 -a:: CD ..J -::> a 2 • LLJ
0.4 0.8 1.2 1.6 2.0 CONCENTRATION OF HCI04 IN MOLES/ LITER
Figure 17 - Dependence of K' upon HCl04 concentration.
0- 3.0 M. total salt and acid concentration. 0- 2.0 M. total salt and acid concentration.
66 ISC-703
upon the HCl04 concentration indicated the extraction of HTlCl4, since only one hydrogen ion is involved in the equilibrium constant . The linear dependence of K' upon the HCl04 concentration also indicated that the activity coefficient of hydrogen ion was constant for a given total salt and acid concentration.
However, the true equilibrium constant should be constant at different acid concen~rations. In order to explain this acid dependence two new constants were defined for the following equilibriums: ·
H- - TlCl[i ~ HTlClTI
HT1Cl4 ~ HT1Cl4
where w and e designate HTlCl4 in the aqueous and ether phases, respectively. The equilibrium constants for these equilibriums : are~
Ka = ~lCliJw X K HT1Cl4
[H+] \2'1Cl4-] ~H+ • 0 TlC~fi and
Kx = Q.!TlC14Je X . ~ ~TlCl!! @TlCliJw ~ HTlCl4
Multiplying Ka by Kx one obtainsg
From the acid dependence study the following was observed:
= K (W)
Rearranging equation (2) yields:
o( = K = K'
(1).
( 2-) 0
(3) .
ISC-703 67
Assuming that the activity coefficient of hydrogen ion is constant for a given total salt and acid concent ration yields:
(4).
The value of K11 should be constant for the different HCl04 concentrations at a given total salt and acid concentration if the activity coefficients of hydrogen ion and of HTlCl4 in the ether phase are constant.
Therefor~ at constant acid and proportional to the true extraction total salt and acid concentration. Kx should be inversely proportional in equation (4).
varying LiCl concentrations Ka is equilibrium constantj Kx~ for a given However 9 at varying acid concentrations to the acid concentration as is shown
Equation (2) is not quite true but should have added to it the term /$ , a constant which is determined by the intercept on the 11yn axis of the plot of K' versus HCl04 concentrations. Since the term is not zero 9 it might be considered as a measure of the Jependence of the extraction equilibrium constant upon the ionization of HTlCl4 in the ether phase or upon the extraction of TlC13 into the ether phase at low LiCl and HCl04 concentrations.
From equation (4) it is noted that the ratio of K1 to hydrogen ion concentration should be constant . In Table 25 the values of the ratio K1 I I}!ClO~ have been calculated for total salt·· and acid concentrations of 2.0 M. and ).0 M. It will be noted f rom Table 25 that for both total concentrations the ratio K1 I [Bcloil is fairly constant at ·HC104 concentrations greater than 1.0 M. At HCt64 concentrations below 1.0 M. the ratio is larger due to the fact that the term IS influences the ratio to a greater degree. For the explanation for this increase in the ratio it might be recalled that at low HCl04 concentrations other factors may influence the extraction equilibrium constant, such as the extraction of TlC13 or the ionization of HTlCl4 in the ether phase.
In this investigation the true extraction equilibrium constant J KxJ was not Jetermined. Rathe~ terms which were proportional to Kx were calculated. In order to determine the value of Kx the concentration of HTlCl4 in the aqueous phase or the value of Ka would have to be known. The activity coefficients of HTlCl4 in ether and of hydrogen ion in the aqueous phase at the given total salt and acid concentration would also have to be known. These values would have to be acquired by independent measurements.
It was believed t hat the various thallium-chloride complexes might absorb light at different wave lengths and that the concentration of each
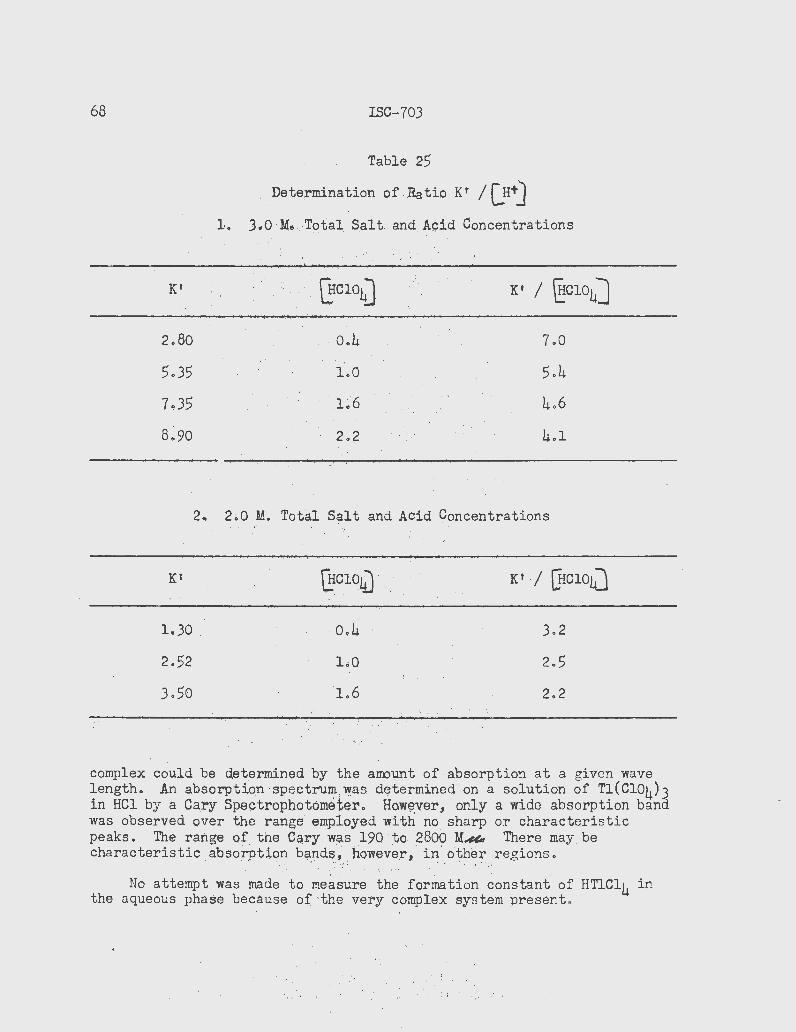
68
Ki
2.80
5.35 .
7.35
8.90
ISC-703
Table 25
Dete,rrrri:nation of Ratio Kt I [_H-t)
1. 3.0 · Mo~ . T~tal S.alt and. Acid Concentrations
. Qrc1o4] ·.•. [t / ~c1o4] .. ,
0.4 7.0
1~0 5.4 . .
·.,L6 . .
4 . 6 . •.
· ... 2.~ 4.1
2. 2.•0 .M • . 'I'otal Salt and Acid Concentrations
Kt . (:IcloJJ · Kt I (}ic1o4]
l.JO . · o.4 3.2
2.52 ·loO 2.5
3.50 . '1.6 2.2 '·• •' '•'
•'· ... ,.
complex could be . det.er.mined by the amo1,1nt of absorption at a given wave length. An absorpt :l~rt · sp~ctr\lm 1 ytas . ctE;ltermined on a solution of Tl ( Cl04) 3 in HCl by a Cary Speqtrophotometer. Bow~:ve:r, only a wide absorption band was observed over the range· empioyed with rJ.O sharp or characteris tic peaks. The range of the Ca,~y . wq.s 190 . to 2800 M~ There may . be characteristic . absoryt;i,.on b9-p.ds·, . however, · i n._6tbe'f . ;re~ions • ..
No at.tempt was : made \~ ·~~~~Ure ~h~· for~t~o~ .· ~~ns~~t of HTlCl4 i n the aqueous phase because of ·the very tomplex system present .
' ~- . .- .
. . ,. ,: .. ,' . ; .. . ~ . ' : ~ · . - . : .
(
·~
ISC-703 69
SUNMARY AND CONCLUSIONS
~ radiochemical study was made of the extraction of thallium-chloride complexes into iso-propyl ether from aqueous solutions o.f mixtures of LiCljl LiCl04jl HCl04 and Tl(C104)3. To ensure complete equilibrium9 both thermal and extractionll and separation between the e ther and aqueous phases, the proper rate of shaking, t i me of contact and time of ~eparation were selected. The extraction was observed to be markedly influenced by the ionic strengt~ and the investigations were performed at a given total salt and acid concentration, hence constant ionic strength.
The temperature dependence of the extraction was measured at two initial aqueous HC104 concentrations, 0.4 M. and 0.6 M., for varying LiCl concentrations maintaining a constant total salt concentration with additions of LiCl04. Using the van ' t Hoff equation and a graphica l method the partial molar heats of extraction were calculated as -9.5 kcal. I mole and -9.9 kcal. I mole for extraction from 0.4 M. and 0.6 M. HCl04 solutions 9
respectively.
The variation of the dis tribution coefficient, KT 9 with varying LiCl concentrations followed essentially the same pattern for the different values of total salt an,i. acid concentration employed in this investigation. As the LiCl concentration was increased from zero there is a sharp increase in KT and it reached a maximum at 0.1 to 0.2 M. LiCl. At higher LiCl concentrations the values of KT decreased.
The formation of a pentachloro-thallium complex in the aqueous phase was postulated to explain the decrease in the extraction at high LiCl concentrations. The formation constant, K5, for TlCls2 ~
K5 = ( TlCl52)
(Tlt3) (cl-)5
was calculated from the extraction data using the constants reported by Benoit (38) for the mono-, di-, tri- and tetrachloro-thallium complexes. The value for K5 of 3.6 x lol7 was determined by evaluation with successive approximations.
The empirical formula of the thallium compound in the ether phase was calculated for the total s :J.lt and acid concentrations equal to 2.0 M. and 3.0 M. by analyzing the ether phase for the thallium, chloride and ionizable hydrogen ion contents. After correcting the analyses for the solubility of LiCl and HClOJ 1 in ether the empirical formula was observed to be es sentially HTlCl4. Kctually. the ratio of Cl-ITl in the ether phase was slightly greater than 4.ojl but sufficiently close t o be within the limits of error of the methods employed.
70 ISC-703
The extraction was studied at very low LiCl concentrations, up to 9 x lo-3 M. with 1.06 x lo-3 M. Tl(Cl04) J~ for two HCl04 · concentrations, 0.4 J.1 . and 1.0 M., while the total salt and acid concentrations were maintained at 1.0 M. For these conditions the equilibrium constant for the extraction at constant . acid, K'> was obse:rv:ed to vary quite markedly with the LiCl concentration . . At the higher LiCl concentrations ·the value of Ki tended toward a ·constant value~ but K1. increased. to quite large values at the lower LiCl concentrations· •. · These large values of $ 1 might be explained by the extraction of . T1Cl3 and/or the ionization .of HT1Cl4· in ether at low etheral concentrations of thallium. · ·
At total salt and acid concentrations equal to 5.0 M.~ 4.0 M. HCl04 and 1.0 M. for the sum of LiCl and LiCl04 concentrations~ a three phase system, "light11 ether, 11heavytr ether and aqueous phases, was observed. The changing volumes of the three phases with varying LiCl concentrations made interpretation of these data quite difficu,lt • . In every case 89 to 96 percent of -the original, thallium app~ared in the 11heavy" . ether phase . It has been suggested: that the formation of the t~ird phas'e, the "heavy" ether phase, was due to the formation of:·Polymers of the form H:xTlC~ in the ether phase.; where x · arid yare greater than l.O . and 4.0, respectlvely; such as H2TlCl5~ H3TlC16, ei;,c. ..
At these low concentrations _of thallium, 0.001 to. 0.01 M. in the "heavy" ether phase, it is dif.ficult · to 'bel'ieve that _tpe thallium has much influence in the gross behavior of t he ether. In fact such three phase systems are observed in the absence of metal ions, such as thallium and iron. The formation of the third ,phase l.$ most likely due to the solubility of hydrochloric acid, perchloric acid and their alkali salts in the isopropyl ether.
The extraction was studied at totr1.l salt and acid concentrations equal to 2.0 M. and 3.0 M.- For the investigation at 3.0 M. the extraction was performed in 0~4 M., 1.0 M. 1 1.6 ·M. and.2~2 M'. ·HCl04 and at 2.0 M. in 0.4 M., LO M. and 1.6 M. ·HC104 with varying tiCl concentrations. At LiCl concentrations greater than Q.l-Mo. the e.quiJ,.:iJ;:Jr:i,um constant, Ki ~ was fairly constant for a given q.cid conce.ntraHon. , fhe mark~d increase in K1 at the low LiCl concentrations was again ·postulated :as an indication that the extraction p!'ocess .at low etheral concentrations was dependent upon the extraction of TlCl3 and/or .the . iOt,l.~zation o( H,TlCl4· in the ether phase.
' ' . l . ·'· ·; .·., .
In the study of the dependence of the extra¢tion upon acid concentraction it was observed that . the .extraction ~quiltbrium. constant was proport~on~~ to the HClo4· conc~:ntration to the first.power. It was ~s~umed from thls flrst power ,dependence .upon .th.e,, conc~ntrGitl.o,n that the actlvlty coefficient of .b.ydrogEm ion was>constant a.t· a .given . 'total salt and acid concentration.
It was conclUded· that the true extraction equilibrium between the aqueous and ether phases was~
. . . ' ~
' "· ..
l
ISC-703 71
for which:
Also in the aqueous phase the following equilibrium was postulated:-
Ht t TlClfi <: ) HT1Cl4
for which:-
Using the above assumptions it was shown that the true extraction equilibrium constant, Kx, was inversely proportional to the hydrogen ion concentration, assuming the activity coefficient of hydrogen ion is constant at a given total salt and acid concentration.
The true extraction equilibrium constant could not be calculated from the data reported. The value of Ka or some independent measurement of the concentration of one or morea che thallium-chloride complexes in the aqueous phase would be needed to calculate Kx• However, it has been shown that Kx is proportional to the etheral concentration of HTlCl4 and inversely proportional to the aqueous concentration of HCl04 and the aqueous activity of TlC14 at a given ionic strength.
72 ISC-703
LITERATURE CITED
l. Waggaman, W. H., Heffner, G. G., and Gee, E. H. , U.S. Bur . Mines Inform. Circ ., No . 7553, (1950).
2. Howe 2 H. E. , and Smith2 Jr. 2 A. A. 2 J. Electrochem. Soc .g 97, 167C-170C (1950).
3. Crookes, W., Chern. News, 3 ~ 193- 203 (1861); Bull . soc. chim. 2 3£ 211-289 (1861).
5. Hopkins ~ B. S., 11Chapters in the Chemis try of the Less F.1miliar Elements", Volume 1 ~ Stipes Publishing Co . 2 Champaign, Ill., 1939 .
6. Hillebrand, W. F., Lundell, G. E. F., Bright, H. A., and Hoffman, J . L 2 lrApplied Inorganic Analysis 11 " Second Edition" John Wiley aml
Sons , Inc ., New York , 1953.
8. Browning, P. E. 2 and Hutchins , G. P. 2 Am . J. Sci.,/~ ~2 460 (1899).
9. Mach~ F., and Lepper, W., z. anal. Chern. 68 2 41 (1926).
10. Werther 2 G., z. anal. Chern., 32 1 (1864).
11. Noyes, A. A." and Bray51 W. C. 2 "A System of Qualitative Analysis of the Rare Elements'9 2 The Macmillan Co ., New York, 1927.
12. Rothe 51 Stahl and Eisen, 12 2 105Z (1892); 13, 333 (1893).
13. Langmuir, A. C., J . Am. Chern . Soc ., 22 , 102 (1900).
14. Kern~ E. F., J . Am. Chern . Soc ., 23 2 689 (1901).
15. Speller, Chern. News~ 83 2 124 (1901).
16. Swift, E. H. 9 J • .Am. Chern. Soc. 2 46, 2375 (1924). ·
17. Wada.2 I., and Ishii, R. 2 Bun.··Inst. Phys . Chern. Res . Tokyo , 13, 264 (1934); LC· A. , 28, 3334 (1934)~
18. Irving, H. M., Quart . Rev., 5p 200 (1951).
19. Edwards , F. C., and Voigt 2 A. F., Analyt . Chem. 2 21, 1204 (1949).
ISC-703 73
20. Irving, H. M.j and Rossottij F. J. C., Analyst. 77j 801 (1952).
2l. Irving, H. M., Rossotti, F. J. C., and Drysdale, J. G., Nature (London), 169, 619 (1952) .
22. Graharne, D. C.j and Seaborg, G. T., J. Am. Chern. Soc.j 60, 2524 (1938).
23 . Nachtrieb, N.H., and Fryxell, R. E., J. Am . Chern. Soc ., 81, 4035 (1949).
24 . Nachtriebj N. H., and Conway, J. G., J. Am. Chern. Soc., 70 , 3547 (1948).
25 . Nernst, W. , z. physikal. Chern., 8, 110 (1891).
26. Dodson, R. W., Forney, G. J .j and Swift, E. H.; J. Am. Chern. Soc ., 58j 2573 (1936).
28 . Kato , J ., and Isii, R., Sci . Papers Inst . Phys. Chern. Research Tokyo, 36, 82-96 (1939). -
29. Nachtrieb, N. H., and Fryxell, ~.E., J. Am. Chern . Soc. 2 70, 3552 (1948) .
30 . Nachtrieb, N.H., and Fryxell, R. E., J. Am. Chern. Soc., 74ll 897 (1952).
3L
32.
33.
Myers, R. J., Metzler, D. E., 72, 3767 (1950).
Myers, R. J 0' and Metzler, D.
Metzler, D. E., and Myers, R.
and · Swift~ . E. "Hr; ll , J t')~m. 1 Qhem. Soc .,
E.ll J. Am. Chern. Soc.~ 72ll 3772 (1950) .
J 0' J . Am. Chern. Soc., 72, 3776 (1950).
34. Lidofsky, L.ll Macklin, P., and Wu, C. S.ll Phys. Rev.ll 87ll 391 (1952).
35. Horrocks, D. L.ll and Voigt, A. F.ll Phys. Rev.ll 95, 1205 (1954) .
36. Kleinberg, J ., "Collected Radiochemical Procedures!t, A. E. C. Document LA- 1721, Los Alamos Scientific Laboratoryll (1954).
37 . Willard, H. H.ll and Smith , G. M., Ind . Eng. Chern ., Anal. Ed., ll~ 186 (1939) .
38. Benoit, R.ll Bull. soc. chim. France 2 1949, 518 - - 24. . '-
39. Harned, H. S., and Owen, B. B., 11 The Physical Chemistry of Electrolytic Solutions", Second Edition, Reinhold Publishing Corporation, New York, 1950.
40. Stokes, R. H., and Robinson, R. A., J. Am . Chern. Soc . 2 70,1870 (1948).
Copyright © 2022 FDOKUMEN