The forensic analysis of office paper using carbon isotope ratio mass spectrometry—Part 2: Method...
10
The forensic analysis of office paper using carbon isotope ratio mass spectrometry. Part 3: Characterizing the source materials and the effect of production and usage on the d 13 C values of paper Kylie Jones a,b, *, Sarah Benson a , Claude Roux b a Forensic and Data Centres, Australian Federal Police, P.O. Box 401, Canberra, ACT 2601, Australia b Centre for Forensic Science, University of Technology, Sydney, P.O. Box 123, Broadway, NSW 2007, Australia 1. Introduction Forensic document examination is the study of documents to answer questions about them, typically for courts of law, during an investigation or for intelligence purposes [1,2]. This can include examining documents for authorship, authenticity, alteration or origin. As part of this, the constituents of documents (inks, papers and other components) can be compared physically and chemi- cally to determine whether they have originated from the same source [3–8]. Modern office papers are produced from cellulose pulp derived from any number of tree species. Fillers, such as kaolin clay, calcium carbonate or colourants (e.g. titanium dioxide) and additives are used to impart desirable physical properties to the sheet such as tear strength or ink permeability. The multi-stage production process includes subjecting the raw wood to heat, pressure, and a number of chemicals to break down the structured wood into its constituent fibres [9]. Wood pulping for paper production (in modern mills) uses the Kraft pulping process to break down fibres and remove lignin, considered a contaminant in papermaking due to its tendency to discolour via oxidation over time and disrupt internal bonding. To remove lignins, raw wood chips are placed in a digester with sodium sulphide and sodium hydroxide. The digester is heated, softening the fibres and dissolving a large proportion of the lignins [10]. For modern papermaking machines, pulping is undertaken in a continuous rather than batch process. After pulping, whitening (or bleaching) is used to remove residual lignins, cleaning the cellulose fibres into a white fibrous mixture free from contaminants. The chemicals used to whiten cellulose fibres can include: oxygen, chlorine dioxide, caustic soda, hydrogen peroxide and gaseous oxygen. The whitening process is comprised of various stages with water washes in between, and is Forensic Science International 233 (2013) 355–364 A R T I C L E I N F O Article history: Received 6 June 2013 Received in revised form 9 October 2013 Accepted 12 October 2013 Available online 19 October 2013 Keywords: Isotope Forensic Paper Document IRMS A B S T R A C T When undertaking any study of the isotope abundance values of a bulk material, consideration should be given to the source materials and how they are combined to reach the final product being measured. While it is demonstrative to measure and record the values of clean papers, such as the results published as part one of this series, the majority of forensic casework samples would have undergone some form of writing or printing process prior to examination. Understanding the effects of these processes on the d 13 C values of paper is essential for interpretation and comparison with clean samples, for example in cases where printed documents need to be compared to paper from an unprinted suspect ream. This study was undertaken so that the source materials, the effects of the production process and the effects of printing and forensic testing could be observed with respect to 80 gsm white office papers. Samples were taken sequentially from the paper production facility at the Australian Paper Mill (Maryvale, VIC). These samples ranged from raw wood chips through the pulping, whitening and refinement steps to the final formed and packed paper. Cellulose was extracted from each sample to observe both fractionation and mixing steps and their effect on the d 13 C values. Overall, the mixing steps were observed to have a larger effect on the isotopic values of the bulk materials than any potential fractionation. Printing of papers using toner and inkjet printing processes and forensic testing were observed to have little effect on d 13 C. These experiments highlighted considerations for sampling and confirmed the need for a holistic understanding of sample history to inform the interpretation of results. Crown Copyright ß 2013 Published by Elsevier Ireland Ltd. All rights reserved. * Corresponding author at: Forensic and Data Centres, Australian Federal Police, P.O. Box 401, Canberra, ACT 2601, Australia. Tel.: +61 2 62036078. E-mail address: [email protected] (K. Jones). Contents lists available at ScienceDirect Forensic Science International jou r nal h o mep age: w ww.els evier .co m/lo c ate/fo r sc iin t 0379-0738/$ – see front matter . Crown Copyright ß 2013 Published by Elsevier Ireland Ltd. All rights reserved. http://dx.doi.org/10.1016/j.forsciint.2013.10.011
-
Upload
independent -
Category
Documents
-
view
0 -
download
0
Transcript of The forensic analysis of office paper using carbon isotope ratio mass spectrometry—Part 2: Method...

Forensic Science International 233 (2013) 355–364
The forensic analysis of office paper using carbon isotope ratio massspectrometry. Part 3: Characterizing the source materials and theeffect of production and usage on the d13C values of paper
Kylie Jones a,b,*, Sarah Benson a, Claude Roux b
a Forensic and Data Centres, Australian Federal Police, P.O. Box 401, Canberra, ACT 2601, Australiab Centre for Forensic Science, University of Technology, Sydney, P.O. Box 123, Broadway, NSW 2007, Australia
A R T I C L E I N F O
Article history:
Received 6 June 2013
Received in revised form 9 October 2013
Accepted 12 October 2013
Available online 19 October 2013
Keywords:
Isotope
Forensic
Paper
Document
IRMS
A B S T R A C T
When undertaking any study of the isotope abundance values of a bulk material, consideration should be
given to the source materials and how they are combined to reach the final product being measured.
While it is demonstrative to measure and record the values of clean papers, such as the results published
as part one of this series, the majority of forensic casework samples would have undergone some form of
writing or printing process prior to examination. Understanding the effects of these processes on the d13C
values of paper is essential for interpretation and comparison with clean samples, for example in cases
where printed documents need to be compared to paper from an unprinted suspect ream.
This study was undertaken so that the source materials, the effects of the production process and the
effects of printing and forensic testing could be observed with respect to 80 gsm white office papers.
Samples were taken sequentially from the paper production facility at the Australian Paper Mill
(Maryvale, VIC). These samples ranged from raw wood chips through the pulping, whitening and
refinement steps to the final formed and packed paper. Cellulose was extracted from each sample to
observe both fractionation and mixing steps and their effect on the d13C values. Overall, the mixing steps
were observed to have a larger effect on the isotopic values of the bulk materials than any potential
fractionation. Printing of papers using toner and inkjet printing processes and forensic testing were
observed to have little effect on d13C.
These experiments highlighted considerations for sampling and confirmed the need for a holistic
understanding of sample history to inform the interpretation of results.
Crown Copyright � 2013 Published by Elsevier Ireland Ltd. All rights reserved.
Contents lists available at ScienceDirect
Forensic Science International
jou r nal h o mep age: w ww.els evier . co m/lo c ate / fo r sc i in t
1. Introduction
Forensic document examination is the study of documents toanswer questions about them, typically for courts of law, during aninvestigation or for intelligence purposes [1,2]. This can includeexamining documents for authorship, authenticity, alteration ororigin. As part of this, the constituents of documents (inks, papersand other components) can be compared physically and chemi-cally to determine whether they have originated from the samesource [3–8].
Modern office papers are produced from cellulose pulp derivedfrom any number of tree species. Fillers, such as kaolin clay,calcium carbonate or colourants (e.g. titanium dioxide) andadditives are used to impart desirable physical properties to the
* Corresponding author at: Forensic and Data Centres, Australian Federal Police,
P.O. Box 401, Canberra, ACT 2601, Australia. Tel.: +61 2 62036078.
E-mail address: [email protected] (K. Jones).
0379-0738/$ – see front matter . Crown Copyright � 2013 Published by Elsevier Irelan
http://dx.doi.org/10.1016/j.forsciint.2013.10.011
sheet such as tear strength or ink permeability. The multi-stageproduction process includes subjecting the raw wood to heat,pressure, and a number of chemicals to break down the structuredwood into its constituent fibres [9].
Wood pulping for paper production (in modern mills) uses theKraft pulping process to break down fibres and remove lignin,considered a contaminant in papermaking due to its tendency todiscolour via oxidation over time and disrupt internal bonding. Toremove lignins, raw wood chips are placed in a digester withsodium sulphide and sodium hydroxide. The digester is heated,softening the fibres and dissolving a large proportion of the lignins[10]. For modern papermaking machines, pulping is undertaken ina continuous rather than batch process.
After pulping, whitening (or bleaching) is used to removeresidual lignins, cleaning the cellulose fibres into a white fibrousmixture free from contaminants. The chemicals used to whitencellulose fibres can include: oxygen, chlorine dioxide, caustic soda,hydrogen peroxide and gaseous oxygen. The whitening process iscomprised of various stages with water washes in between, and is
d Ltd. All rights reserved.

K. Jones et al. / Forensic Science International 233 (2013) 355–364356
generally followed by a refinement step to further ensure thepurity of the cellulose mixture [11].
Prior to entering the papermaking machine, the refined bulkcellulose fibres are combined with a secondary source of fibres.Typically the bulk cellulose used is a species that produces shortfibred cellulose. At the Australian Paper Mill, this is a Eucalyptusfibre harvested from farmed sources within a 200 km radius of themill. Added to this, at approx.10% of dried weight, is a long fibrecellulose used to enhance and promote internal hydrogen bondingand add strength to the finished paper sheet. At the AustralianPaper Mill, this secondary long fibre source is imported as a pre-pulped sheet of pine fibres from a New Zealand mill.
In the final stage prior to production, the cellulose mixture isdiluted with water down to 1% fibre content and combined with anumber of fillers and additives. The fillers in particular make up thebulk of the additives, constituting 20–30% of the total dry paper.Filler material can vary but is typically calcium carbonate withtitanium dioxide to promote a bright white colour to the formedsheet. Other dyes, surface modification additives and starches areadded in small quantities to impart features based on the product.
To produce the paper sheet, the mixture is poured onto amoving wire that passes through vacuum units and a large flatroller to remove some of the moisture. Felt rollers are then used topick up the wet sheet and feed it through a long series of hot rollersheld between 60 and 80 8C that dry and flatten the paper. Additivesthat promote surface characteristics such as ink absorbance andwater resistance are then sprayed onto the surface of the paper,followed by an additional set of rollers to dry, smooth and polishbefore the fully formed paper leaves the press to be cut and packedinto reams [9].
The most common paper for home and office applications iswhite, A4 sized and 80 gsm (grams per square metre). Over 40brands of A4 paper are available in the Australian market withAustralian made paper originating from a single mill in Victoria. Inaddition, wood chips from plantations in the same geographiclocation as the Australian paper mill are exported to China forpaper production, potentially contributing to an overlap in therange of carbon values observed. Australia, China, Indonesia andThailand make up the four major countries of origin for papers onthe Australian market.
In order to evaluate the use of IRMS in forensic paperexamination, a comprehensive study utilizing carbon isotopeswas undertaken consisting of three phases. First, an examination ofthe population of papers within the Australian market wasundertaken which included a study of the homogeneity of papers,both within and between different brands. This study alsogenerated a confidence interval for the discrimination of samples[12]. An additional study defined and validated an analyticalmethod for the measurement of the d13C values of documentpapers [13]. A number of questions remained unanswered uponcompletion of phases 1 and 2, which had the potential to impactthe interpretation of forensic casework results. These questions arethe subject of this third paper.
The first key question posed in this study seeks to define what isbeing measured in a bulk sample of paper and how much of thatbulk value is related to the natural signals of the wood chips used inproduction. This has implications for future provenancing work,where models could be developed and used to eliminate regions ofinterest for suspect papers, if the measurement values of paperscould be directly compared to known environmental values (e.g.isoscapes [14,15]).
The secondary questions to be addressed in this study involvethe alteration of the surface of paper, either by printing or from therecovery of biometric material (including fingerprints and DNA)and the impact on d13C values. For these types of papers, printingwill be by a toner (laser) or inkjet printing process. These processes
vary in their ink type and delivery systems and hence may affectthe d13C values in different ways. Toner printing processes utilizepolymer particles that are heated to form a layer of text that sits onthe surface of the page. Inkjet inks are water based (fluid) inks thatare propelled by a nozzle on to the surface of the page andsubsequently absorbed by the fibres. Both printing methods leavescattered particles of toner/ink across the non-image areas of thepage creating a potential issue for IRMS sampling.
Document examination is typically performed prior to exami-nation for fingerprints and collection of trace DNA. There aresituations however where questions regarding the origin orauthenticity of documents are not asked prior to these otherforensic examinations taking place. In these cases, it is importantto have an understanding of the effect of these examinations on thed13C values of the paper.
1,2-Indandione-Zn treatment for latent fingerprint enhance-ment is commonly employed in forensic laboratories, followed bytape-lifting to collect trace DNA. 1,2-Indandione-Zn was firstinvestigated in 1997 as an amino acid attractive chemicaltreatment process that produces very strong luminescence infingerprints developed on porous surfaces (including paper) [16–18]. For development of latent prints, heat is applied using a heatpress around 1508 for up to 10 s. As the chemical soaks into thepaper sheet, there is the potential for interference from thechemical during subsequent IRMS measurements, or for fraction-ation to occur during heating.
Tape lifting is a simple technique to collect trace DNA byrepeatedly placing and removing adhesive tape on the surface ofpaper. Even though it is not a chemical process there still exists thepotential for alteration of IRMS results due to measurement ofadhesive residue or incomplete measurement of the paper due tothe removal of the surface layer of the sheet onto the tape. Once thepage has been tape lifted, paper fibres and other material removedfrom the sheet surface are visible on the tape.
2. Materials and methods
To examine the effect of the paper production process on the carbon isotopic
composition of paper, a site visit at the Australian Paper Mill (Maryvale, Victoria)
was conducted in February of 2011. Samples were collected at different stages of
the production process, including:
� Whole Eucalyptus wood chip (Wood Chip)
� Post-digester unbleached Eucalyptus pulp (Unbleach Euc)
� Samples from within the bleaching/whitening process
� Post oxygen wash (Ex O)
� Post ozone and peroxide wash (Ex ZD)
� Post caustic soda, oxygen and peroxide wash (Ex EOP)
� Post chlorine dioxide wash (Ex D)
� Refined bleached eucalyptus (Refined Bleach Euc)
� Refined bleached pine
� Directly from the paper decal roll, post paper production (Paper Decal)
� Paper packed into reams for shipping (Paper Packed)
� Paper filler material – calcium carbonate (CaCO3)
One sample from each production stage was collected in sequence from
throughout the process over a period of 4 h. Due to the continuous process, it cannot
be assumed that the source will be identical in all of these samples. Taking the
samples on the same day in sequence is as close as possible to following a batch of
wood chips through the production process. A number of these samples were
collected from wet processes and were dried as soon as practicable in a 60 8C oven
for 1–2 h before being re-packaged into glass vials with Teflon lined screw top lids
(Sigma–Aldrich, Australia) and sealed with Parafilm (Sigma–Aldrich, Australia).
As the removal of lignins is a process performed during both the pulping and
bleaching steps, it was necessary for a cellulose extraction to be performed on these
samples so that only one target compound was being measured (rather than a
mixture of changing proportions).
Samples from the paper production process were ground using a commercial
coffee grinder, packaged into Parafilm sealed glass vials and sent to the University of
California, Berkeley for an organic cellulose extraction [19,20] and measurement
using IRMS (the equipment required to perform a cellulose extraction was not

K. Jones et al. / Forensic Science International 233 (2013) 355–364 357
available to the authors). Where extracted sample sizes permitted, measurement of
the carbon isotope abundance values was performed in duplicate. Results were
reported directly to the author in the form of corrected d13C values. Information
about the correction process used by this laboratory can be found online at [21]
As a comparison to the cellulose extracted samples, measurements of the carbon
isotope abundances of the bulk and filler materials was undertaken using a Deltaplus
XP IRMS instrument (Thermo Finnigan, Bremmen, Germany) with a ConFlo III
interface and a Flash EATM 1112 attached to an AS128 autosampler. A quartz insert
was used to aid in ash removal. Samples and standards were weighed between 100
and 120 mg on a Genius ME5 (Sartorius, Goettingen, Germany) analytical balance
into 3.3 mm � 4 mm tin capsules for solids (IVA-Analysentechnik, Dusseldorf,
Germany).
For measurement, samples were dropped into the FlashEATM 1112 elemental
analyser combustion tube packed with silvered cobaltous/colbaltic oxide and
copper oxide held at 900 8C. An oxygen pulse was added for 3 s at a rate of 250 mL/
min. A reduction furnace containing reduced copper at 680 8C, a magnesium
perchlorate water trap and a packed GC column held at 45 8C followed. The refined
CO2 leaving the Flash EA was fed into a Conflo III interface. All gases utilized (He
carrier gas, O2 for the Flash EA pulse and CO2 reference gas) were purchased from
Coregas (Canberra, Australia) at purities higher than 99.99%. The software used to
control the system was Isodat 3.0.
Isotopic composition is expressed using delta notation (d) as the isotopic ratio of
a sample in relation to the known isotopic measurement of a standard material.
Corrected measurements are presented as per mil (%) values and for carbon, values
are scaled using Vienna Pee Dee Belemnite (VPDB) which is expressed as [22–24]:
d13
CVPDB ¼RSample
RStandard
� �� 1
where RStandard or RSample = (RHeavy/RLight).
All samples were run and corrected against international standards purchased
from the International Atomic Energy Agency (IAEA). For scale correction to VPDB,
IAEA-CH-6 (Sucrose) and IAEA-CH-7 (Polyethylene) were measured in replicates of
5 at the start and end of the sequence. IAEA-CH-3 (Cellulose) was measured in
triplicate in the middle of the sequence as a quality control material for acceptance
of the results. The raw results were processed using Grubbs test [25] to check for
outliers before a line of best fit was plotted using the measured and published
international standard values. Unknown sample values were corrected using this
calibration plot. The results were considered fit for purpose when the corrected
international cellulose values were within 2 � standard deviations of the published
value (IAEA published value, d13CVPDB = �24.724%).
Fractionation is defined as the change in isotopic value of a material after
undergoing a physical or chemical process or reaction. A fractionation factor can be
calculated, which is an expression of the difference in reaction rates between the
light and heavy isotopes. To calculate the fractionation factor, the equations in Fry
[26] were utilized, where fractionation (D) is defined as:
D ¼ dsource � dproduct
Table 1Paper samples measured before and after acidification using hydrochloric acid.
Sample number Paper country of origin Bulk paper m
d13CVPDB (%) �
1 Australia �23.10 � 0.06
2 Australia �23.19 � 0.04
3 Australia �24.59 � 0.14
4 Australia �23.05 � 0.08
5 Australia �23.30 � 0.07
6 Australia �23.16 � 0.08
7 Australia �23.85 � 0.06
8 Australia �23.50 � 0.15
9 Australia �23.50 � 0.08
10 Indonesia �29.58 � 0.04
11 Indonesia �28.37 � 0.09
12 Indonesia �27.57 � 0.07
13 Indonesia �26.56 � 0.04
14 Thailand �27.01 � 0.07
15 Thailand �27.88 � 0.02
16 Thailand �28.21 � 0.02
17 Thailand �28.54 � 0.05
18 Thailand �27.55 � 0.14
19 China �22.82 � 0.17
20 China �24.31 � 0.12
21 China �23.78 � 0.16
22 South Africa �25.00 � 0.09
23 India �25.61 � 0.06
24 China �23.40 � 0.10
25 Brazil �25.79 � 0.01
And the fractionation factor (a) of the chemical or physical fractionation process
is:
D ¼ ða � 1Þ � 1000
Mixing is when two or more source materials are combined to form a product
with a new isotopic value. Also taken from Fry [26], the equation used to establish
the % contribution d13C of the source materials to the final d13C value of the product
is:
dsample ¼ ðdsource 1Þ � f 1 þ ðdsource 2Þ � f 2
where f is the mole fraction of each component and is solved for f1 as:
f 1 ¼dsample � dsource 2
dsource 1 � dsource 2
To determine whether there was a simpler method for reduction of the sample to
pure cellulose, 25 paper samples were treated with hydrochloric acid to remove
calcium carbonate prior to measurement. To do this 1 cm samples of paper were cut
into small squares and placed into 10 mL glass beakers. Concentrated hydrochloric
acid (HCl, Sigma–Aldrich, Australia) was used to cover the surface of the paper and
was left until no further bubbling from the surface of the paper was observed.
Whilst being acidified, the beaker was agitated slightly by shaking to ensure that
the acid covered the surface of the paper. After this, the paper was thoroughly
washed using deionized water and dried by placing the acidified paper on to
Whatman filter paper (Sigma–Aldrich, Australia) over a vacuum. The papers tested
are detailed in Table 1.
The second part of this study measured samples taken from office printing
processes and forensically treated samples. The equipment and method utilized
was the same as the one used to measure bulk paper production samples described
above. To sample papers, a 1.2 mm micropunch (Harris Unicore, LabSciTech,
Australia) was used to remove circular pieces of paper that weighed between 120
and 150 mg of sample. To assess the effect of printing on the d13C values of papers, a
request through several networks in Australia was made for samples to be collected
and sent for measurement. The instructions provided asked for a 3-page test print to
be made and sent with plain paper from the same ream so that before and after
printing measurements could be taken. Information on the make, model and type of
printer was requested in addition to information with respect to the paper
including brand, packing date (if available) and purchase location of the paper ream
(alternatively the ream packaging itself could be sent).
46 toner and 13 inkjet test prints were received for measurement. The number of
inkjet samples was lower than hoped but this was likely due to business and
government departments using toner printers much more frequently for economic
reasons. A range of brands were received, and a number of repeats of the same
manufacturer and model were also received, increasing the comparability of the
test sample base. The papers and printers tested are detailed in Table 2 (toner
printers) and Table 3 (inkjet printers).
ean
1 st dev
After acidification mean
d13CVPDB (%) � 1 st dev
Difference (%)
�25.89 � 0.14 2.79
�26.67 � 0.01 2.08
�25.92 � 0.10 2.87
�25.87 � 0.12 2.57
�25.62 � 0.02 2.21
�26.01 � 0.05 2.84
�25.90 � 0.05 2.04
�26.39 � 0.09 2.88
�26.18 � 0.06 2.67
�29.73 � 0.06 0.15
�29.55 � 0.09 1.18
�27.90 � 0.05 0.33
�26.93 � 0.01 0.38
�27.19 � 0.01 0.18
�27.64 � 0.08 0.23
�27.74 � 0.07 0.47
�28.34 � 0.13 0.20
�27.44 � 0.03 0.11
�25.72 � 0.10 2.90
�27.45 � 0.16 3.14
�26.43 � 0.07 2.65
�25.75 � 0.05 0.75
�27.08 � 0.08 1.48
�25.93 � 0.06 2.53
�25.64 � 0.09 0.15

Table 2Printer manufacturer and paper information for toner printers tested.
Sample number Printer manufacturer Make Model Paper brand Paper country of production
1 Brother MFC 7340 Unknown N/A
2 Kyocer KM 2050 Office National N/A
3 HP Laserjet P1606dn Canon High Quality paper China
4 Fuji Xerox DocuCentre C2200 Office Elements Thailand
5 Canon LBP 3100 B Office Elements Thailand
6 Brother HL 2142 Office Elements Thailand
7 Toshiba Estudio 255 Office Elements Thailand
8 HP Laserjet P1505n Office Elements Thailand
9 Fuji Xerox DocuPrint 240A Australian Australia
10 Fuji Xerox DocuCentre 336 Australian Australia
11 Fuji Xerox Apeos Port IV C5570 Xerox Recycled supreme Japan
12 Fuji Xerox Apeos Port II C4300 Staples Carbon Neutral Australia
13 Lexmark T644 Staples Australia
14 Ricoh Aficio 2060 Staples Carbon Neutral Australia
15 Ricoh Aficio 2060 Staples Carbon Neutral Australia
16 HP 2605 4CC Sweden
17 Ricoh Aficio MP C2000 Staples Australia
18 HP Laserjet P4515x Unknown Unknown
19 Ricoh Aficio MP 3350 Reflex Australia
20 Ricoh Aficio 2075 Staples Australia
21 Fuji Xerox DocuColor 252 Xerox France
22 Konica Minolta Bizhub C280 Reflex Australia
23 Lexmark E450dn EXP800 Thailand
24 Fuji Xerox Apeos Port 5070 Staples Australia
25 Fuji Xerox Docucentre 336 Staples Australia
26 Fuji Xerox DocuPrint 240A Staples Australia
27 Lexmark HFDI C935 Mondi Colour Copy Paper Austria
28 Konica Minolta Bizhub C280 Officemax Multipurpose China
29 Konica Minolta Bizhub C280 EXP800 Thailand
30 Lexmark E450dn EXPGreen 50% Recycled Australia
31 Konica Minolta Bizhub C280 EXPGreen 50% Recycled Australia
32 HP Laserjet P1606dn Canon High Quality Paper China
33 HP Laserjet P1606dn Office Elements Thailand
34 Ricoh Aficio SP C420DN Xerox France
35 Ricoh Aficio 2060 Corporate Express Australia
36 HP 2605 Staples Australia
37 Ricoh Aficio SP C420DN Staples Australia
38 Lexmark E450dn Excellent Copy Paper Indonesia
39 Konica Minolta Bizhub C280 Excellent Copy Paper Indonesia
40 Lexmark E450dn Value Plus Unknown
41 Konica Minolta Bizhub Value Plus Unknown
42 Ricoh Aficio 2060 Unknown Unknown
43 Ricoh Aficio SP C430DN Unknown Unknown
44 Ricoh Aficio 2060 Reflex Australia
45 Lexmark E450dn Reflex Australia
46 Lexmark E450dn Officemax Multipurpose China
K. Jones et al. / Forensic Science International 233 (2013) 355–364358
Triplicate measurements were taken from each of the unprinted sheets, the
printed sheets in the non-image area and as a worst-case scenario, from directly on
top of the printed text. It was hoped that the printed text measurement could also
be used as a preliminary indicator for the potential for discrimination of the ink/
toner.
For IRMS analysis after typical forensic testing, duplicate sheets of paper from the
five brands in Table 4 were utilized. A 4 cm strip was taken from each of the sheets
prior to treatment and set aside as the untreated measurement. One sheet from
each brand was then subjected to either treatment with 1,2-Indandione-Zn or DNA
tape lifting. Note, no fingerprints or DNA were deposited on the surface of the pages
prior to testing in these evaluations.
For the tape lifting, a piece of adhesive tape was placed lightly on to the surface of
the sheet and removed. This was repeated multiple times.
3. Results and discussion
3.1. Source and production samples – change in d13C values of
cellulose due to paper pulping, bleaching and production
The results from the cellulose extracted paper process samplesare detailed in Table 5. This table also details the bulkmeasurements collected for each of the processing steps. Themain additives used in the process are detailed in Table 6.
Comparing the cellulose-extracted values with the bulkmeasurements in Table 6, a decrease in extraneous material
(reflected by an increase in the d13C value) is evident as sampleproduction proceeds. By the second whitening step (Ex ZD) thecellulose extracted and bulk values are comparable (within 2standard deviations) suggesting that the lignins and othercontaminant materials have been removed or are at trace levels.This also suggests that no fractionation is occurring during thesewhitening stages.
Also of interest, there is a noticeable difference between theextracted and bulk samples for refined eucalyptus. This wasunexpected as the advice from the paper mill was that at this stagein production the mixture should only contain pure, whitenedcellulose fibres. The bulk measurement contradicts this informa-tion and suggests that an additive has been placed into themixture. Alternatively, the refinement process could also havecaused a fractionation event. To confirm this, a bulk IRMSmeasurement was undertaken of the refined bleached pine sample,which is expected to be in the same form as the refined Eucalyptusfibres. The bulk refined pine sample was measured at d13CVPDB
�26.01% � 0.05. When compared to the cellulose extracted refinedpine sample in Table 6 (d13CVPDB�25.82% � 0.12) a similar differenceof approximately 0.2% is observed, re-affirming the likelihood ofthere being an additive present at this stage of the process or thatfractionation of the cellulose has occurred during refinement.

Table 3Printer manufacturer and paper information for inkjet printers tested.
Sample number Manufacturer Make Model Paper brand Paper origin
1 HP Business Inkjet 2800 Staples Australia
2 HP Deskjet 5652 Reflex Australia
3 Canon MX 870 Australian Australia
4 Canon Pixma iP4600 Unknown Unknown
5 Epson Stylus Photo R2400 Officemax Multipurpose China
6 Epson Stylus Photo R390 Unknown N/A
7 Epson Stylus Pro 4800 Canon High Quality 106 gsm Japan
8 Brother MFC 215C Ditto Australia
9 Epson Stylus Photo R2400 EXP800 Thailand
10 Epson Stylus Photo R2400 EXPGreen 50% Recycled Australia
11 Epson Stylus Photo R2400 Excellent Copy Paper Indonesia
12 Epson Stylus Photo R2400 Value Plus N/A
13 Epson Stylus Photo R2400 Reflex Australia
Table 4Brands of ream used as test samples for forensic test evaluation.
Paper brand Country of origin
Double A Thailand
Reflex Australia
Olympic Australia
Lazer IT Indonesia
Fuji Xerox China
Table 6Cellulose extracted and bulk measured d13CVPDB (%) � 1 standard deviation, for
additives used in paper production.
Additive name Mean d13CVPDB (%)
Dry Bleached Pine (cellulose extracted) �26.05 � 0.04
Refined Bleached Pine (cellulose extracted) �25.82 � 0.12
Calcium Carbonate Filler (bulk measured) 2.14 � 0.12
K. Jones et al. / Forensic Science International 233 (2013) 355–364 359
The difference between the dry and refined pine samples islikely due to a batch difference as the raw pine samples were takendry from a storage pallet whereas the refined samples wereprocessed ready for input into the wet paper process.
Fig. 1 is a plot of the d13C values of the extracted cellulose fromeach step in the production process. Fig. 2 contains the same data,plotted against bulk measurements for the same samples. Thissecond plot highlights steps in the process where more than justthe cellulose content of the paper is contributing to the d13C valuesmeasured.
The cellulose extracted process samples in Fig. 1 showfractionation of the cellulose occurring as it is processed fromraw wood chip through pulping and the first stage of bleaching.The fractionation is small however, at 0.6%. Utilizing the equationsfor calculating the fractionation factor (a) [26], the fractionationfactor for this reaction is calculated at 1.006, which reflects amodest fractionation and illustrates that the process was favouringthe lighter isotope.
A small difference in the d13C values measured was observedbetween the raw cellulose (�26.11%) and the formed paper(�25.92%) in Table 5. This showed a 0.2% difference between thewhitening and refinement steps of the process and the formed andpacked paper samples, i.e. between the start and the end of theactual paper production steps. While this may be an additionalfractionation process, the magnitude is very small and couldequally be explained by a natural variation of the source materialor due to addition of the slightly more depleted pine fibres.
Table 5Cellulose extracted and bulk measured d13CVPDB (%) � 1 standard deviation for paper so
Production step Step in process Extra
Raw Wood Chip �26.
Unbleached Eucalyptus After pulping �25.
Ex O First whitening step �25.
Ex ZD Second whitening step �25.
Ex EOP Third whitening step �25.
Ex D Last whitening step �25.
Refined Bleached Euc Last step before mixing with
other pulp and additives
�25.
Formed Paper After paper production �25.
Packed Paper After cutting and packing �25.
A more significant difference can be observed between the bulkand cellulose extracted sample measurements. A difference of over2% is observed between both the formed and packed papersamples when the cellulose is extracted and run in isolation. Frominformation obtained about the constitution of the paper, this isdue to the addition of a significant proportion of calcium carbonate(CaCO3) filler, added into the paper mixture to give thickness andstability to the formed sheet. The bulk CaCO3 was measured to bed13CVPDB 2.14% � 0.12 (Table 6), significantly different to thed13CVPDB �25.7% value of the Eucalyptus fibres. Putting aside thecontribution of the addition of the pine cellulose (which would beminimal due to its similar d13C value, measured at d13CVPDB
�25.82%), and the contribution of other additives (which wouldbe small due to their low percentage in the mixture), using the mixingequations presented in Fry [26] indicated that the formed papercontains approximately 8% CaCO3 filler. This is below the expectedrange of filler composition (10–25%) given by the paper mill and theliterature [9,27,28].
The measurement results of the bulk versus acidified samplesare shown in Table 1. Fig. 3 shows the differences between the twomeasurements. For Australian papers, the difference in d13C valueis close to the difference observed between the cellulose extractedand bulk samples measured and presented in Table 5.
Fig. 3 shows that the magnitude of the difference variesdepending on the region of production. From this we can draw twoconclusions – that CaCO3 content varies depending on where thepaper is produced and that other filler materials may be being used(e.g. kaolin clay, talc or titanium dioxide) that are either not
urce and production samples.
cted cellulose mean d13CVPDB (%) Bulk sample mean d13CVPDB (%)
11 � 0.3 �26.34 � 0.00
83 � 0.05 �25.60 � 0.05
51 � 0.06 �25.69 � 0.00
77 � 0.02 �25.77 � 0.06
77 � 0.05 �25.74 � 0.03
73 � 0.13 n/a
74 � 0.03 �26.02 � 0.05
92 (single measurement) �23.91 � 0.15
86 � 0.05 �23.50 � 0.13
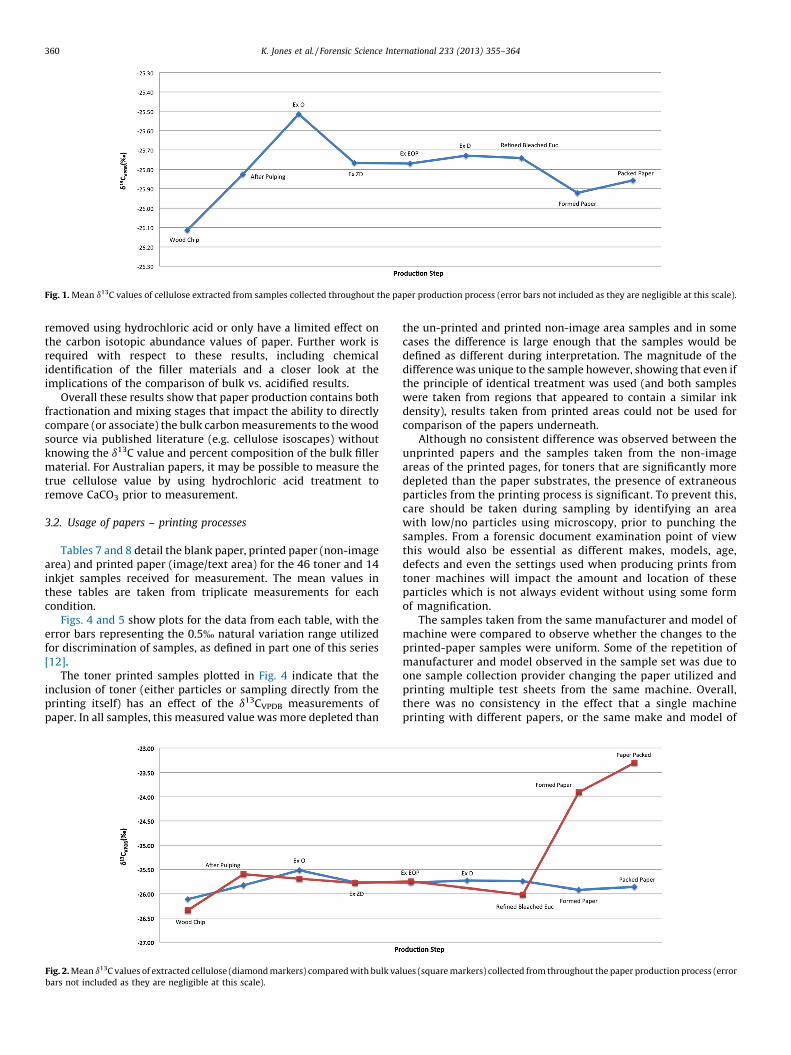
Fig. 1. Mean d13C values of cellulose extracted from samples collected throughout the paper production process (error bars not included as they are negligible at this scale).
K. Jones et al. / Forensic Science International 233 (2013) 355–364360
removed using hydrochloric acid or only have a limited effect onthe carbon isotopic abundance values of paper. Further work isrequired with respect to these results, including chemicalidentification of the filler materials and a closer look at theimplications of the comparison of bulk vs. acidified results.
Overall these results show that paper production contains bothfractionation and mixing stages that impact the ability to directlycompare (or associate) the bulk carbon measurements to the woodsource via published literature (e.g. cellulose isoscapes) withoutknowing the d13C value and percent composition of the bulk fillermaterial. For Australian papers, it may be possible to measure thetrue cellulose value by using hydrochloric acid treatment toremove CaCO3 prior to measurement.
3.2. Usage of papers – printing processes
Tables 7 and 8 detail the blank paper, printed paper (non-imagearea) and printed paper (image/text area) for the 46 toner and 14inkjet samples received for measurement. The mean values inthese tables are taken from triplicate measurements for eachcondition.
Figs. 4 and 5 show plots for the data from each table, with theerror bars representing the 0.5% natural variation range utilizedfor discrimination of samples, as defined in part one of this series[12].
The toner printed samples plotted in Fig. 4 indicate that theinclusion of toner (either particles or sampling directly from theprinting itself) has an effect of the d13CVPDB measurements ofpaper. In all samples, this measured value was more depleted than
Fig. 2. Mean d13C values of extracted cellulose (diamond markers) compared with bulk va
bars not included as they are negligible at this scale).
the un-printed and printed non-image area samples and in somecases the difference is large enough that the samples would bedefined as different during interpretation. The magnitude of thedifference was unique to the sample however, showing that even ifthe principle of identical treatment was used (and both sampleswere taken from regions that appeared to contain a similar inkdensity), results taken from printed areas could not be used forcomparison of the papers underneath.
Although no consistent difference was observed between theunprinted papers and the samples taken from the non-imageareas of the printed pages, for toners that are significantly moredepleted than the paper substrates, the presence of extraneousparticles from the printing process is significant. To prevent this,care should be taken during sampling by identifying an areawith low/no particles using microscopy, prior to punching thesamples. From a forensic document examination point of viewthis would also be essential as different makes, models, age,defects and even the settings used when producing prints fromtoner machines will impact the amount and location of theseparticles which is not always evident without using some formof magnification.
The samples taken from the same manufacturer and model ofmachine were compared to observe whether the changes to theprinted-paper samples were uniform. Some of the repetition ofmanufacturer and model observed in the sample set was due toone sample collection provider changing the paper utilized andprinting multiple test sheets from the same machine. Overall,there was no consistency in the effect that a single machineprinting with different papers, or the same make and model of
lues (square markers) collected from throughout the paper production process (error

Table 7Mean d13CVPDB and 1 � standard deviation results for 46 toner printed documents.
Sample
number
Blank paper
mean d13CVPDB (%)
Standard
deviation (%)
Printed paper
non-image area
mean d13CVPDB (%)
Standard
deviation (%)
Printed paper sampled
on image area
mean d13CVPDB (%)
Standard
deviation (%)
1 �23.95 0.05 �24.01 0.05 �24.38 0.01
2 �28.76 0.07 �28.75 0.03 �28.80 0.00
3 �23.99 0.06 �23.94 0.04 �25.16 0.05
4 �27.54 0.09 �27.54 0.08 �27.82 0.06
5 �23.75 0.00 �23.89 0.05 �25.03 0.14
6 �27.59 0.10 �27.55 0.06 �27.59 0.05
7 �27.55 0.11 �27.69 0.07 �27.86 0.06
8 �27.73 0.02 �27.80 0.08 �27.89 0.07
9 �23.82 0.19 �23.79 0.00 �24.16 0.07
10 �23.40 0.05 �23.41 0.12 �24.29 0.06
11 �24.60 0.04 �24.53 0.09 �25.24 0.02
12 �23.41 0.08 �23.46 0.09 �23.91 0.05
13 �23.76 0.08 �23.70 0.09 �24.54 0.00
14 �23.95 0.13 �23.96 0.03 �24.26 0.12
15 �23.46 0.08 �23.40 0.14 �23.84 0.08
16 �25.63 0.09 �25.65 0.09 �25.98 0.02
17 �23.44 0.11 �23.45 0.11 �23.86 0.05
18 �23.55 0.03 �23.63 0.03 �24.28 0.08
19 �23.56 0.04 �23.56 0.06 �23.97 0.11
20 �23.75 0.17 �23.74 0.03 �24.31 0.00
21 �25.17 0.57 �24.89 0.10 �25.20 0.03
22 �23.65 0.06 �23.55 0.04 �23.90 0.08
23 �26.21 0.14 �26.27 0.00 �26.41 0.06
24 �23.50 0.04 �23.58 0.06 �24.03 0.13
25 �23.62 0.11 �23.69 0.15 �24.30 0.05
26 �23.65 0.01 �23.66 0.01 �24.11 0.03
27 �26.09 0.09 �26.03 0.09 �26.27 0.09
28 �23.34 0.07 �23.65 0.12 �23.89 0.00
29 �26.21 0.14 �26.16 0.10 �26.38 0.07
30 �23.76 0.21 �23.85 0.11 �24.35 0.00
31 �23.76 0.21 �23.84 0.19 �24.24 0.08
32 �23.48 0.08 �23.68 0.06 �24.46 0.05
33 �27.72 0.11 �27.87 0.06 �28.04 0.04
34 �24.94 0.04 �24.98 0.08 �25.22 0.07
35 �23.24 0.05 �23.30 0.03 �23.90 0.06
36 �23.39 0.16 �23.51 0.06 �24.31 0.09
37 �23.43 0.12 �23.86 0.76 �23.88 0.05
38 �26.51 0.06 �26.58 0.14 �26.81 0.12
39 �26.51 0.06 �26.54 0.00 �26.64 0.06
40 �23.62 0.11 �23.60 0.11 �24.23 0.16
41 �23.62 0.11 �23.47 0.05 �23.98 0.20
42 �23.39 0.02 �23.57 0.07 �23.86 0.13
43 �23.36 0.10 �23.43 0.02 �23.83 0.02
44 �23.69 0.14 �23.58 0.02 �24.00 0.04
45 �23.54 0.02 �23.55 0.00 �24.09 0.06
46 �23.41 0.08 �23.48 0.08 �24.05 0.09
K. Jones et al. / Forensic Science International 233 (2013) 355–364 361
machine, had on the values of the papers and on the tonerprinted samples measured. It is hypothesized that this may bedue to non-uniform sample sizes for the toners being taken,which impacts on the amount of toner present and therefore the
Table 8Mean d13CVPDB and 1 � standard deviation results for 14 inkjet printed documents.
Sample
number
Blank paper
mean d13CVPDB (%)
Standard
deviation (%)
Printed paper
non-image area
mean d13CVPDB (%
1 �23.70 0.06 �23.64
2 �23.74 0.07 �27.73
3 �23.40 0.10 �23.63
4 �23.40 0.07 �23.63
5 �23.55 0.02 �23.48
6 �23.34 0.07 �23.33
7 �23.37 0.07 �23.33
8 �25.08 0.10 �25.05
9 �23.72 0.09 �23.69
10 �26.21 0.14 �26.18
11 �23.76 0.21 �23.84
12 �26.51 0.06 �26.52
13 �23.62 0.11 �23.44
14 �23.54 0.02 �23.48
measurement value in relation to the paper that is of a fairlyconstant mass.
The difference observed between the blank paper samples andthe toner/paper samples indicate that if toner can be effectively
)
Standard
deviation (%)
Printed paper on
sampled on image
area mean d13CVPDB (%)
Standard
deviation (%)
0.08 �23.81 0.03
0.03 �27.75 0.04
0.24 �23.61 0.00
0.03 �23.86 0.09
0.03 �23.72 0.04
0.12 �23.53 0.12
0.02 �23.49 0.04
0.03 �25.20 0.05
0.20 �23.97 0.14
0.17 �26.14 0.06
0.19 �24.24 0.08
0.12 �26.50 0.04
0.04 �23.55 0.04
0.06 �23.60 0.00
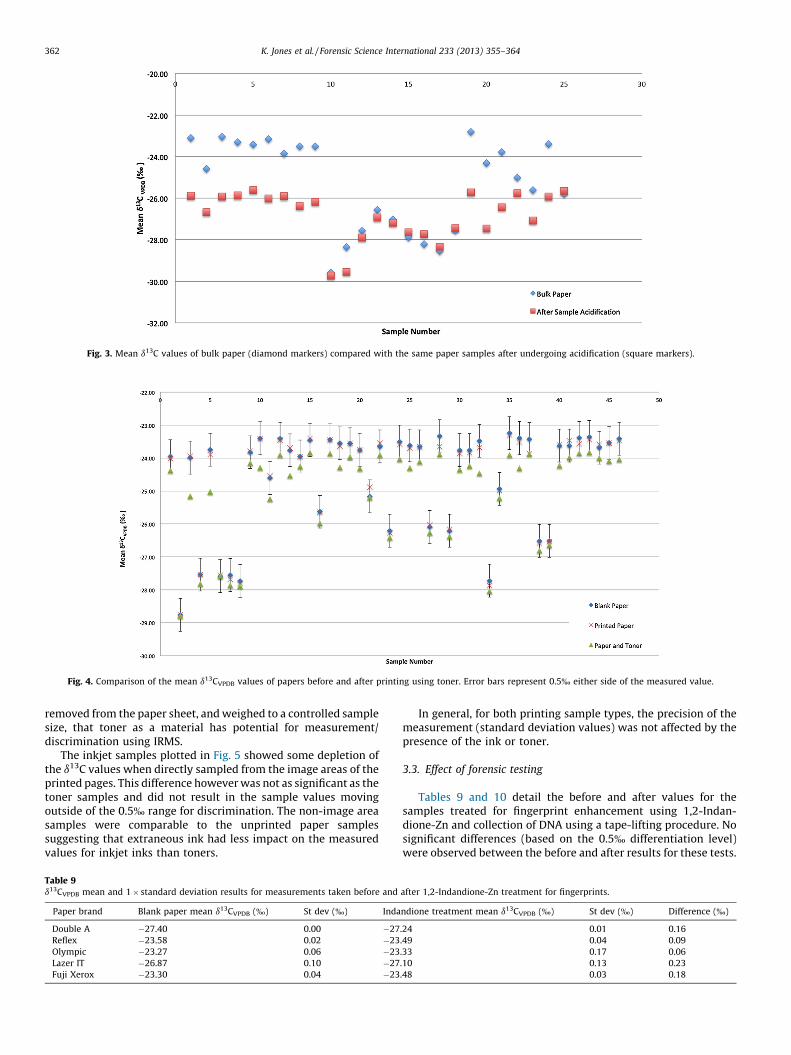
Fig. 3. Mean d13C values of bulk paper (diamond markers) compared with the same paper samples after undergoing acidification (square markers).
Fig. 4. Comparison of the mean d13CVPDB values of papers before and after printing using toner. Error bars represent 0.5% either side of the measured value.
K. Jones et al. / Forensic Science International 233 (2013) 355–364362
removed from the paper sheet, and weighed to a controlled samplesize, that toner as a material has potential for measurement/discrimination using IRMS.
The inkjet samples plotted in Fig. 5 showed some depletion ofthe d13C values when directly sampled from the image areas of theprinted pages. This difference however was not as significant as thetoner samples and did not result in the sample values movingoutside of the 0.5% range for discrimination. The non-image areasamples were comparable to the unprinted paper samplessuggesting that extraneous ink had less impact on the measuredvalues for inkjet inks than toners.
Table 9d13CVPDB mean and 1 � standard deviation results for measurements taken before and
Paper brand Blank paper mean d13CVPDB (%) St dev (%) Inda
Double A �27.40 0.00 �27
Reflex �23.58 0.02 �23
Olympic �23.27 0.06 �23
Lazer IT �26.87 0.10 �27
Fuji Xerox �23.30 0.04 �23
In general, for both printing sample types, the precision of themeasurement (standard deviation values) was not affected by thepresence of the ink or toner.
3.3. Effect of forensic testing
Tables 9 and 10 detail the before and after values for thesamples treated for fingerprint enhancement using 1,2-Indan-dione-Zn and collection of DNA using a tape-lifting procedure. Nosignificant differences (based on the 0.5% differentiation level)were observed between the before and after results for these tests.
after 1,2-Indandione-Zn treatment for fingerprints.
ndione treatment mean d13CVPDB (%) St dev (%) Difference (%)
.24 0.01 0.16
.49 0.04 0.09
.33 0.17 0.06
.10 0.13 0.23
.48 0.03 0.18

Table 10d13CVPDB mean and standard deviation results for measurements taken before and after tape-lifting treatment for trace DNA collection.
Paper brand Blank paper mean d13CVPDB (%) St dev (%) Tape-lifted mean d13CVPDB (%) St dev (%) Difference (%)
Double A �27.40 0.00 �27.22 0.07 0.18
Reflex �23.58 0.02 �23.55 0.07 0.03
Olympic �23.27 0.06 �23.18 0.16 0.09
Lazer IT �26.78 0.01 �27.01 0.04 0.23
Fuji Xerox �23.30 0.04 �23.47 0.02 0.17
Fig. 5. Comparison of the d13CVPDB values of papers before and after printing using inkjet ink. Error bars represent 0.5% either side of the measured value.
K. Jones et al. / Forensic Science International 233 (2013) 355–364 363
These results indicate that IRMS of papers is a feasible analyticaloption that can be conducted following the two commonly appliedtechniques for fingerprint development and collection of DNA.
4. Conclusions
The paper pulping and production process was examined indetail to determine if the chemical and physical manufacturingprocessing steps had any effect on the d13C values of cellulose. Amoderate fractionation was found to occur in the pulping and firststages of whitening. The largest effect however was observed to bea mixing step prior to the paper formation process, with theaddition of CaCO3 filler. This result means that the bulk carbonmeasurements are unable to be compared to or predicted bypublished literature (i.e. to cellulose isoscapes) without knowingthe d13C value and percent composition of the bulk filler material.Acidification with hydrochloric acid was shown to remove CaCO3
content, which was subsequently shown to vary considerablybetween different production locations and batches. Alternatively,a large scale background study of the area of interest may elucidatetrends with respect to the expected values of papers originatingfrom specified regions, as shown in part one of this series of papers.
The effect of printing on paper samples was examined and tonerprinting or photocopying processes were found to have thegreatest effect on changing the d13C values of the paper. From thisstudy, the following recommendations are made for considerationduring the forensic examination of papers:
1. Paper samples punched as samples for comparison from printeddocuments, should ideally not contain any ink.
2. In particular with respect to toner printed documents,microscopy or magnification should be used to ensure that noextraneous toner particles are included on the paper samples.
3. If toner can effectively be removed from the paper sheet andhence the sample size controlled, toner as a material in its ownright has potential for measurement/discrimination using IRMS.
4. For inkjet printed samples, the unprinted paper samples arecomparable to the printed non-image area samples and as such,microscopy prior to sampling is less important for this type ofprinting.
5. IRMS of papers is still feasible after 1,2-Indandione-Zntreatment for the visualization of fingerprints and tape-liftingfor DNA collection.
Further research is recommended to investigate the effect ofother common forensic processes that are likely to be appliedbefore a document is received by a forensic document examiner.Likewise, it would be advantageous for the paper production studyto be repeated, both at the same and different mills to confirm theobservations here.
References
[1] S. Baechler, O. Ribaux, P. Margot, 2012 student paper: toward a novel forensicintelligence model: systematic profiling of false identity documents, Forensic Sci.Policy Manage. Int. J. 3 (2) (2012) 70–84.
[2] D. Ellen, Scientific Examination of Documents: Methods and Techniques, CRC,Florida, USA, 2006.
[3] E. Fearon, W. McMillan, Examination of papers in questioned documents: differ-entiation by chemical tests, J. Crim. Law Criminol. 38 (1947) 282.
[4] M. Manso, M. Carvalho, Application of spectroscopic techniques for the study ofpaper documents: a survey, Spectrochim. B: Atom. Spectrosc. 64 (6) (2009) 482–490.
[5] T. Trejos, A. Flores, J.R. Almirall, Micro-spectrochemical analysis of documentpaper and gel inks by laser ablation inductively coupled plasma mass spectrome-try and laser induced breakdown spectroscopy, Spectrochim. Acta B: Atom.Spectrosc. 65 (11) (2010) 884–895.
[6] A.A. Cantu, Analytical methods for detecting fraudulent documents, Anal. Chem.63 (17) (1991) 847A–854A.
[7] C. Roux, et al., A study to investigate the evidential value of blue andblack ballpoint pen inks in Australia, Forensic Sci. Int. 101 (3) (1999) 167–176.
[8] R. Brunelle, R. Reed, Forensic Examination of Ink and Paper, Charles C Thomas,Illinois, USA, 1984.
[9] C. Biermann, Handbook of Pulping and Papermaking, Academic Press, California,USA, 1996.
[10] J. Roberts, The Chemistry of Paper, Royal Society of Chemistry, Cambridge, UK,1996.

K. Jones et al. / Forensic Science International 233 (2013) 355–364364
[11] R.P. Stoll, Analysis and Identification of Paper. Identification News, September,1963, 4–10.
[12] K. Jones, S. Benson, C. Roux, The forensic analysis of office paper using carbonisotope ratio mass spectrometry. Part 1: understanding the background popula-tion and homogeneity of paper for the comparison and discrimination of samples,Forensic Sci. Int. 231 (1) (2013) 354–363.
[13] K. Jones, S. Benson, C. Roux, The forensic analysis of office paper using carbonisotope ratio mass spectrometry. Part 2: method development, validation andsample handling, Forensic Sci. Int. 231 (1) (2013) 364–374.
[14] G. Bowen, Isoscapes: spatial pattern in isotopic biogeochemistry, Annu. Rev. EarthPlanet. Sci. 38 (2010) 161–187.
[15] J.B. West, G.J. Bowen, T.E. Dawson, Isoscapes: Understanding Movement, Pattern,and Process on Earth Through Isotope mapping, Springer Verlag, 2010.
[16] C. Wallace-Kunkel, et al., Optimisation and evaluation of 1,2-indanedione for useas a fingermark reagent and its application to real samples, Forensic Sci. Int. 168(1) (2007) 14–26.
[17] C.S. Wallace-Kunkel, C.J. Lennard, M. Stoilovic, C.P. Roux, Optimisation andevaluation of 1,2-indanedione for use as a fingermark reagent and its applicationto real samples, Forensic Sci. Int. 168 (1) (2007) 14–26.
[18] X. Spindler, R. Shimmon, C.P. Roux, C.J. Lennard, The effect of zinc chloride,humidity and the substrate on the reaction of 1,2-indanedione-zinc with aminoacids in latent fingermark secretions, Forensic Sci. Int. 212 (1–3) (2011) 150–157.
[19] F. Tao, Y. Liu, N. An, On the necessity of organic solvent extraction for carbonisotopic analysis of a-cellulose: implications for environmental reconstructions,Int. J. Environ. Anal. Chem. 90 (8) (2010) 605–619.
[20] J.B. Gaudinski, et al., Comparative analysis of cellulose preparation techniques foruse with 13C, 14C, and 18O isotopic measurements, Anal. Chem. 77 (22) (2005)7212–7224.
[21] University of California at Berkeley. Center for Stable Isotope Biogeochemistry.Available from: http://dawsonlab.synthasite.com/stable-isotope-lab.php(accessed 24.04.13).
[22] T.B. Coplen, Reporting of stable hydrogen, carbon, and oxygen isotopic abun-dances, Pure Appl. Chem. 66 (1994) 273–276.
[23] T.B. Coplen, Guidelines and recommended terms for expression of stable-isotoperatio and gas-ratio measurement results, Rapid Commun. Mass Spectrom. 25 (17)(2011) 2538–2560.
[24] T.B. Coplen, et al., New guidelines for d13C measurements, Anal. Chem. 78 (7)(2006) 2439–2441.
[25] D. Hibbert, J. Gooding, Data Analysis for Chemistry, Oxford University Press,New York, USA, 2006.
[26] B. Fry, Stable Isotope Ecology, Springer Verlag, New York, USA, 2006.[27] T.F. Wolfgang, R. Johannes, E. Kroker, Calcium Carbonate: From the Cretaceous
Period into the 21st Century, Springer, Basel, Switzerland, 2001.[28] J.P. Murphy, Paper Analysis Wiley Encyclopedia of Forensic Science, 2009.