The first steps of planet formation : studying grain growth with ...
15
The first steps of planet formation : studying grain growth with millimetre interferometers Lommen, D.J.P. Citation Lommen, D. J. P. (2009, April 23). The first steps of planet formation : studying grain growth with millimetre interferometers. Retrieved from https://hdl.handle.net/1887/13752 Version: Corrected Publisher’s Version License: Licence agreement concerning inclusion of doctoral thesis in the Institutional Repository of the University of Leiden Downloaded from: https://hdl.handle.net/1887/13752 Note: To cite this publication please use the final published version (if applicable).
-
Upload
khangminh22 -
Category
Documents
-
view
1 -
download
0
Transcript of The first steps of planet formation : studying grain growth with ...
The first steps of planet formation : studying grain growthwith millimetre interferometersLommen, D.J.P.
CitationLommen, D. J. P. (2009, April 23). The first steps of planet formation :studying grain growth with millimetre interferometers. Retrieved fromhttps://hdl.handle.net/1887/13752 Version: Corrected Publisher’s Version
License:Licence agreement concerning inclusion of doctoralthesis in the Institutional Repository of the Universityof Leiden
Downloaded from: https://hdl.handle.net/1887/13752 Note: To cite this publication please use the final published version (ifapplicable).

Chapter 1
Introduction
The Milky Way contains about 200 billion stars, of which the Sun is only one
unremarkable example. We live on Earth, one of eight planets1 revolving around
the Sun in a more or less flat plane. It was suggested a long time ago that our Sun
is not the only star with planets (Epicurus 300 B.C.; Bruno 1584). However, it
was only at the beginning of the last decade of the twentieth century that a planet
outside of our solar system was found (Bailes et al. 1991). This planet is orbiting
a neutron star, the remnant of a massive star whose life ended in a supernova, and
probably this planet had a very different formation history than our own Earth.
In 1995, a planet was discovered around a star more similar to our Sun, 51 Peg
(Mayor & Queloz 1995). Since then, more than 300 planets outside our solar
system, so-called exoplanets, have been found.
Planets are generally accepted to be the by-products of stars, which are formed
when interstellar clouds of gas and dust collapse under the forces of gravity. The
details of this formation process are still largely unknown and this thesis is part of
the world-wide effort to unravel the secrets of star and planet formation.
1.1 Star formation
Between smaller and larger groups of stars, there are clouds of gas and dust per-
meating the Galaxy, so-called Giant Molecular Clouds (GMCs). These clouds
can be stable over periods of millions upon millions of years, with gas pressure
and turbulence working against the gravity that might otherwise pull the clouds
together. Magnetic fields may also alter the dynamical state of a molecular cloud
sufficiently to prevent gravitationally unstable regions from collapsing (Shu et al.
1987). At some point in time, however, these clouds will become unstable and
1Pluto was demoted from a planet to a dwarf planet (e.g., Binzel 2006). The eight planets of
the solar system are, with increasing distance from the Sun: Mercury, Venus, Earth, Mars, Jupiter,
Saturn, Uranus, and Neptune.
1

Chapter 1 Introduction
start to collapse under their own gravity. This may happen when, for instance, a
supernova goes off nearby and sends a pressure wave through the cloud. This may
cause the neutral particles in the cloud to decouple sufficiently from the charged
particles (ambipolar diffusion, e.g., Mouschovias 1977), so that the support from
magnetic fields can be overcome. While hydrodynamical turbulence can perhaps
prevent global collapse, it can never completely prevent local collapse (Klessen
et al. 2000) and the cloud will start to fragment. Locally within the cloud, the
forces of gravity become larger and overcome the gas pressure. Several clumps
of material will start to collapse and one GMC may eventually harbour hundreds
or even thousands of dark cores, several of which may eventually form stars and
planets.
With pressure at least temporarily overcome, the dark core will continue to
collapse. However, in every cloud and core a net quantity of angular momentum
is present which prevents the core from collapsing spherically symmetrically and
a flattened structure must form. Material moves inwards through the structure
under the force of gravity while angular momentum moves outwards and thus
a disc-like structure with a bulge in the centre is naturally formed. As more and
more material falls onto the disc and the central protostar, the system can no longer
get rid of the excess angular momentum by moving it outward through the disc.
Consequently, possibly in conjunction with the magnetic field present in the disc,
jets are formed close to the central structure. These jets eject material from either
pole in the system, forming outflow cavities in the surrounding envelope in the
process. Thus, while in the outer part of the system material from the envelope
is still raining down on the disc, in the centre some of the material is ejected and
returned to the interstellar medium. In this phase, the system is an embedded
young stellar object, class I in the Lada classification (Lada & Wilking 1984,
and below). A schematic picture of a class I object is shown in the top panel of
Fig. 1.1.
After several hundred thousand years, the envelope is dispersed and we are left
with a young stellar object, consisting of a protostar surrounded by a protoplane-
tary disc. The temperature in the core of the central object is not yet high enough
for the fusion of atomic hydrogen and it derives most of its luminosity from con-
version of gravitational potential energy into kinetic energy and hence heat. The
disc around it has initially a consistency similar to that of the interstellar medium,
implying that some 99% of the mass is gas with the remaining 1% being dust.
The dust grains are silicate- and carbon-based and in the colder regions they are
covered with icy layers of, e.g., water, carbon dioxide, and methane. They have
sizes in the range of 0.003 μm up to ∼0.1 μm. It is from these tiny grains that
2

1.1 Star formation
Figure 1.1: An overview of the three so-called Lada classes of star formation
(Lada & Wilking 1984). On the left, schematic representations of the geometry
of the system are given, in which the protostar, the circumstellar disc, the enve-
lope, and eventually the pre-planetary system can be distinguished. On the right,
characteristic spectral energy distributions are shown (see Sect. 1.3.1).
eventually planets are formed. The evolution of a low-mass young stellar object
is depicted by a cartoon in Fig. 1.1.
This thesis is mainly concerned with these circumstellar discs in young stellar
objects. Using observations and computational models we will address the fol-
lowing questions. When does the disc form? How large is it? When, how fast,
and where in the disc do grains grow? Can we test the evolution of envelope, disc,
and stellar mass shown in Fig. 1.2 (based on Hueso & Guillot 2005)?
A natural way to describe the structure of a circumstellar disc is through the
regions that can be probed with different kinds of observations. Light is very
efficiently scattered by small particles and thus we can see circumstellar discs out
to large distances from the star through optical and near-infrared scattered light.
3

Chapter 1 Introduction
Figure 1.2: Schematic picture of the mass evolution of the disc and the central star
(based on Hueso & Guillot 2005). The dotted line shows how the stellar accretion
rate changes over time.
However, these observations only graze the disc surface. Mid-infrared images
and spectra probe the atmosphere of the disc, but only the warmer regions. These
regions may conveniently be called the inner disc, typically located within a few
AU from the young star. The outer disc, then, is best studied at (sub)millimetre and
centimetre wavelengths. At these wavelengths, most of the emission is optically
thin and the bulk of the disc matter can be probed. Finally, a region that cannot
be observed directly but is inferred from disc modelling is the so-called “dead
zone” in the mid-plane of the inner disc. This is a somewhat quiescent region
with less turbulence than elsewhere in the disc. However, it is important in the
sense that planetesimals may actually be formed near or in the “dead zone,” as
we will see below. A schematic picture of a protoplanetary disc with the most
important regions is shown in Fig. 1.3.
1.2 Grain growth and planet formation
The formation of kilometre-sized planetesimals fromwhat originally are submicron-
sized dust grains was studied in the classic work by Weidenschilling (1980) and
a comprehensive recent review can be found in Youdin & Johansen (2008). The
most important processes involved are described in this Section and summarised
in Fig. 1.4.
The first step in the long road from interstellar-sized grains to planets is when
4

1.2 Grain growth and planet formation
Figure 1.3: A schematic picture of a protoplanetary disc. Indicated are the outer
disc, the atmosphere of the inner disc, and the low-turbulence “dead zone.” The
mid-infrared emission, including the silicate features around 10 and 20 μm, orig-
inates in the atmosphere of the inner disc, while (sub)mm observations basically
probe the entire disc. Picture based on a presentation by Carsten Dominik.
grains less than a micron in size grow to sizes of a few microns. The particles
will behave in the ensuing gas as smoke in the air: they move in Brownian motion
under the influence of the gas molecules and will occasionally collide with each
other. Upon collision, two grains will usually stick at the very low relative veloc-
ities of a few cm s−1 produced by Brownian motion (Dominik & Tielens 1997;
Paszun & Dominik 2006; Blum & Wurm 2008). Models and laboratory exper-
iments show that grain growth from interstellar, submicron sizes to particles of
several milli- or centimetres in size is straightforward and fast.
Once the particles have reached sizes in the order of centimetres, they become
more likely to fragment upon collision (Blum & Wurm 2000). However, it turns
out that the largest particles will still grow if collisional charging and electrostatic
reaccretion (e.g., Blum 2004; Blum & Wurm 2008) or reaccreation by gas flow
(e.g., Wurm et al. 2001; Sekiya & Takeda 2003) are taken into account. In this
way the dust grains may grow to decimetres in size.
The growth of objects larger than decimetres in size can as yet not be studied
in the laboratory. Furthermore, at these large sizes, the interaction of the parti-
cles with the surrounding disc becomes more important and the problem is at-
5
Chapter 1 Introduction
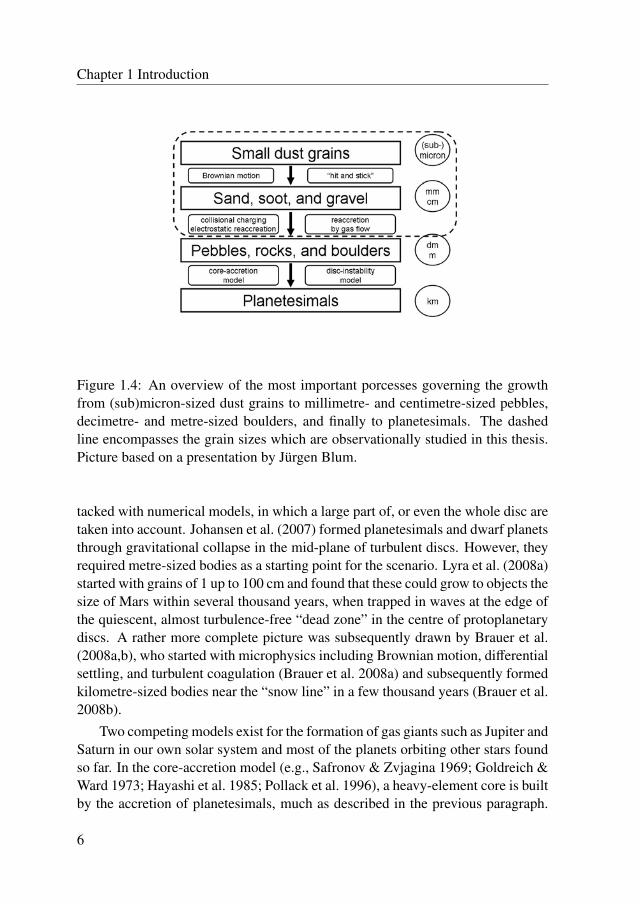
Figure 1.4: An overview of the most important porcesses governing the growth
from (sub)micron-sized dust grains to millimetre- and centimetre-sized pebbles,
decimetre- and metre-sized boulders, and finally to planetesimals. The dashed
line encompasses the grain sizes which are observationally studied in this thesis.
Picture based on a presentation by Jürgen Blum.
tacked with numerical models, in which a large part of, or even the whole disc are
taken into account. Johansen et al. (2007) formed planetesimals and dwarf planets
through gravitational collapse in the mid-plane of turbulent discs. However, they
required metre-sized bodies as a starting point for the scenario. Lyra et al. (2008a)
started with grains of 1 up to 100 cm and found that these could grow to objects the
size of Mars within several thousand years, when trapped in waves at the edge of
the quiescent, almost turbulence-free “dead zone” in the centre of protoplanetary
discs. A rather more complete picture was subsequently drawn by Brauer et al.
(2008a,b), who started with microphysics including Brownian motion, differential
settling, and turbulent coagulation (Brauer et al. 2008a) and subsequently formed
kilometre-sized bodies near the “snow line” in a few thousand years (Brauer et al.
2008b).
Two competing models exist for the formation of gas giants such as Jupiter and
Saturn in our own solar system and most of the planets orbiting other stars found
so far. In the core-accretion model (e.g., Safronov & Zvjagina 1969; Goldreich &
Ward 1973; Hayashi et al. 1985; Pollack et al. 1996), a heavy-element core is built
by the accretion of planetesimals, much as described in the previous paragraph.
6
1.3 Observing the evolution of young stellar objects
As the core becomes more massive, its ability to accrete gas from the surrounding
disc increases. At some point the core may become massive enough for rapid
accretion of gas and a gas giant is formed. In the disc-instability scenario (e.g.,
Kuiper 1951; Cameron 1978; Boss 1997), a sufficiently massive disc will fragment
into dense cores. These clumps can contract to form gas giants much in the same
way as proto-stellar systems are formed from their parental cloud (see previous
Section). Though some problems still exist for both scenarios, it is interesting
to note that some 90% of the exoplanets found so far can be reasonably well
explained with the core-accretion model, while the remaining 10% could have
been formed through the disc-instability model (Matsuo et al. 2007).
It thus seems that the processes leading from small grains to large planets
are fairly well understood. However, all models will eventually have to be tested
against experiments, or in the case of astronomy, observations. The observations
of young stellar objects are the subject of the following Section.
1.3 Observing the evolution of young stellar objects
1.3.1 A classification of young stellar objects
Lada & Wilking (1984) introduced an empirical classification of young stellar
objects, based on their spectral energy distributions (SEDs) in the infrared (see
Fig. 1.1). The SEDs of class I objects are completely dominated by emission
from the circumstellar envelope, which entirely obscures the central star. In class
II objects, the envelope has been dispersed and the central star has become visible.
A strong excess over the photosphere of the star is still present, though, due to the
warm gas in the circumstellar disc. Over time, also the gaseous disc is lost due
to accretion processes and photo-evaporation and what is left is an SED which is
dominated by the central star and only has a small excess due to the dust in a debris
disc. Though this classification has proved extremely useful, it is not foolproof.
For example, a system without an envelope that is viewed edge-on may produce a
class I SED. Van Kempen et al. (2009) found for a sample of more than 40 young
stellar objects in Ophiuchus that were at some point classified as class I objects,
that less than half were indeed genuine class I as originally defined in the Lada
classification. Different observables have been proposed to determine the evolu-
tionary stage of a young stellar object (e.g., Robitaille et al. 2006) and Crapsi et al.
(2008) concluded that one of the best diagnostics to determine whether an object
is embedded or not is by comparing the single-dish flux to the interferometric flux
at (sub)millimetre wavelengths (see also below).
7

Chapter 1 Introduction
1.3.2 Observing the growth from submicron to micron sizes with the10-μm silicate feature
Since new stars are formed from the interstellar medium, the dust composition is
initially also the same as that of the interstellar medium. More particularly, the
initial dust size distribution is that of the interstellar medium, with a typical size
of ∼0.1 μm. Due to coagulation, these dust grains will grow, first to sizes of a
few μm and later to larger sizes, and the high temperature locally in the inner disc
will anneal the mostly amorphous grains to more crystalline structures. These
very first steps of grain growth can be observed in the infrared, most notably us-
ing the silicate features around 10 and 20 μm. These features can be observed
from the ground as was done by, e.g., Meeus et al. (2001) and Przygodda et al.
(2003). Over the last several years, a large number of interferometric observa-
tions have been obtained in the infrared, in particular using the MIDI instrument
(Leinert et al. 2003) operating on the Very Large Telescope (Glindemann et al.
2000) around 10 μm. Ground-breaking results were obtained by van Boekel et al.
(2004), who used MIDI to observe the Herbig-Ae star HD 144432. The observa-
tions clearly showed the presence of more crystalline material in the inner disc,
whereas the dust in the outer disc was predominantly amorphous. Furthermore,
both the change from amorphous to more crystalline grains as well as the growth
of submicron sizes to sizes of several microns have been observed by the Infrared
Space Observatory (ISO, Malfait et al. 1998; van Boekel et al. 2005). More re-
cently, the Spitzer Space Telescope was used to observe the infrared spectra of
many more, also considerably weaker young stellar objects (e.g., Furlan et al.
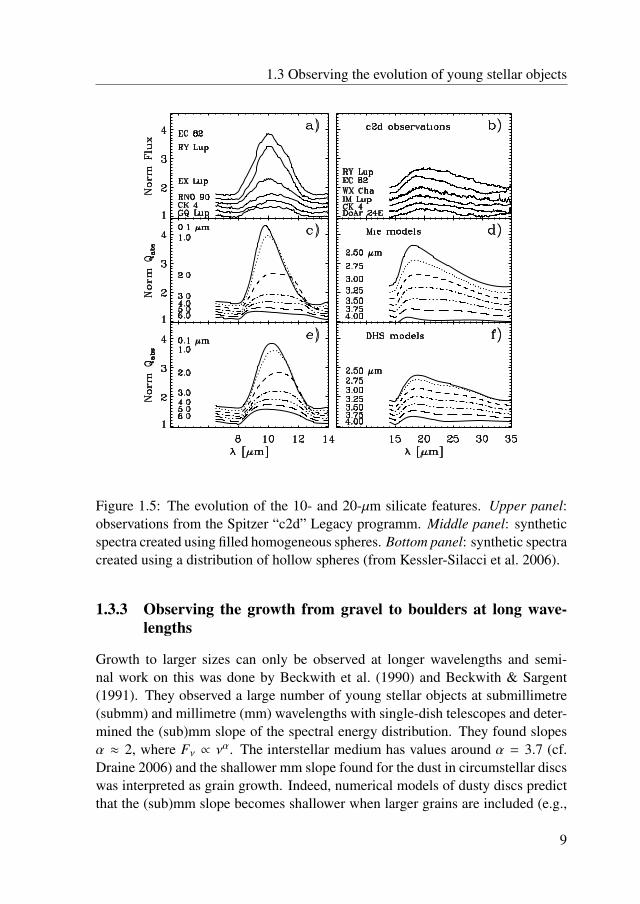
2006; Kessler-Silacci et al. 2006). A large range of 10-μm features was observed,
ranging from strong, peaked features to weak, flat-topped features. Compari-
son with synthetic spectra of small grains showed that the different features can
be quite naturally explained with grain growth: the 10-μm feature is strong and
peaked for interstellar grains of about 0.1 μm in size, whereas the feature is largely
gone by the time the grains have reached sizes of ∼6 μm (see Fig. 1.5). However,
processes other than grain growth have been proposed to explain the evolution
of the 10-μm feature. For example, if large grains settle to the mid-plane, they
no longer contribute to the 10-μm feature, which would thus over time attain the
stronger and more peaked shape associated with the smallest grains (Dullemond
& Dominik 2008).
8
1.3 Observing the evolution of young stellar objects
Figure 1.5: The evolution of the 10- and 20-μm silicate features. Upper panel:observations from the Spitzer “c2d” Legacy programm. Middle panel: syntheticspectra created using filled homogeneous spheres. Bottom panel: synthetic spectracreated using a distribution of hollow spheres (from Kessler-Silacci et al. 2006).
1.3.3 Observing the growth from gravel to boulders at long wave-lengths
Growth to larger sizes can only be observed at longer wavelengths and semi-
nal work on this was done by Beckwith et al. (1990) and Beckwith & Sargent
(1991). They observed a large number of young stellar objects at submillimetre
(submm) and millimetre (mm) wavelengths with single-dish telescopes and deter-
mined the (sub)mm slope of the spectral energy distribution. They found slopes
α ≈ 2, where Fν ∝ να. The interstellar medium has values around α = 3.7 (cf.
Draine 2006) and the shallower mm slope found for the dust in circumstellar discs
was interpreted as grain growth. Indeed, numerical models of dusty discs predict
that the (sub)mm slope becomes shallower when larger grains are included (e.g.,
9

Chapter 1 Introduction
Dullemond & Dominik 2004a). However, the observed shallow slopes can also
be caused by small, optically thick discs. Furthermore, there may be contribu-
tions from a (remnant) circumstellar envelope. It is therefore necessary to observe
these young systems with interferometers to filter out extended emission and re-
solve the discs spatially in order to unambiguously attribute the shallow spectral
slope to grain growth. This has been done in recent years (e.g., Natta et al. 2004;
Rodmann et al. 2006; Andrews &Williams 2007) and several dozen young stellar
objects with dust of at least mm sizes have been found. Even larger grains, or
pebbles, can only be observed at centimetre wavelengths. However, the detection
of thermal emission from dust is notoriously difficult at such long wavelengths
where the emission is tailing off and other emission mechanisms such as winds
or chromospheric activity may also contribute. Wilner et al. (2005) used the Very
Large Array to resolve and monitor the pre-main-sequence star TWHya and found
decimetre-sized pebbles in the disc.
1.4 Millimetre interferometers
As explained above, the first steps of planet formation are well observed in the
infrared and at (sub)mm and cm wavelengths. Observations have shown that dust
is processed in the discs around young stars. The next step is to find out where
exactly grain processing or growth is taking place. This requires high-spatial-
resolution observations, with which the systems can be spatially resolved. The
highest spatial resolution is obtained using the telescopes with the largest dishes
or mirrors. However, there are physical limitations to how large a single telescope
can be. Higher resolution can then be obtained using the technique of interfer-
ometry. With interferometry, an object is simultaneously observed with two (or
more) telescopes and the signals of the two telescopes are allowed to interfere, ei-
ther directly or after digitisation. The information that can be obtained in this way
has the same spatial resolution as if one were using a telescope with a diameter as
large as the distance between the two telescopes.
Interferometric observations of young stellar objects at mm and cm wave-
lengths are very useful, because they can resolve the circumstellar discs. As long
as a disc is unresolved, it is possible that the spectral slope is affected by a very
small, optically thick disc. Only if the emission at (sub)mm wavelengths is op-
tically thin, the flux is a rather direct measure of the disc’s mass. Furthermore,
(sub)mm interferometry allows us to separate disc emission from envelope emis-
sion, as is demonstrated in Fig. 1.6 (from Jørgensen et al. 2005). This Figure
shows the flux as a function of baseline length for NGC 1333-IRAS 2. Shorter
10

1.5 This thesis
Figure 1.6: The flux as a function of baseline for the embedded young stellar ob-
ject NGC 1333-IRAS 2, from Jørgensen et al. (2005). Overplotted are the flux
due to the circumstellar envelope, constrained by single-dish SCUBA observa-
tions (Jørgensen et al. 2002), and the flux due to the resolved circumstellar disc.
baselines probe larger scales and the flux drops towards longer baselines. This
can be explained as follows. On the smallest interferometer baselines the tele-
scope has a large beam and the detected flux is that of all the matter included
in the beam, in this case the circumstellar disc and the envelope. On the longer
baselines the telescope is sensitive to smaller scales and only the flux of the disc
is detected. In this way the emission of the disc and that of the envelope can be
neatly separated.
1.5 This thesis
This thesis is largely aimed at sources in the southern sky and the only mm and
cm interferometer that can currently observe the southern-most sources is the Aus-
tralia Telescope Compact Array (ATCA). We used the ATCA to observe T-Tauri
stars in the southern star-forming regions Lupus, Chamaeleon, and Corona Aus-
tralis at 3 mm and a number of sources at 7 mm, 3.5, and 6.3 cm. The sources
in Lupus and Corona Australis were also observed with the Submillimeter Array
(SMA) at 1 mm. The SMA is located on Mauna Kea on Hawaii and can still reach
several of the star-forming regions in the southern hemisphere. It is also used
11

Chapter 1 Introduction
to observe two embedded, class I, objects in the ρ Ophiuchi star-forming region.
Finally, the more northern Combined Array for Research in Millimeter-wave As-
tronomy (CARMA) and the Very Large Array (VLA) were used to observe a
number of class II objects in Serpens at 1 and 3 mm (CARMA) and at 7 mm, 1.3,
3.6, and 6.2 cm (VLA).
In Chapter 2, we present SMA observations of two embedded sources with
young discs. These two young stellar objects were previously classified as class
I in the Lada classification. A survey of bright T-Tauri stars in the southern con-
stellations Lupus and Chamaeleon was carried out using the ATCA at 3 mm, the
results of which are presented in Chapter 3. The Lupus sources were subsequently
observed with the SMA at 1 mm. The results of Chapter 3 were followed up with
a larger survey of T-Tauri stars, using the SMA, ATCA, CARMA, and VLA inter-
ferometers and the Spitzer Space Telescope in Chapter 4. Finally, in Chapter 5, we
show ATCA monitoring observations at centimetre wavelengths of three sources
from the sample presented in Chapter 3, allowing us to constrain the physical
processes responsible for the emission. RU Lup and WW Cha were the bright-
est sources in that sample and had fairly shallow millimetre slopes, indicating the
presence of large grains.
The main conclusions of this thesis are the following.
• Interferometric observations can separate the discs and envelopes of young
stellar objects at (sub)mm wavelengths as well as the objects from their
environment. The masses of the envelopes and discs of the class I objects
IRS 63 and Elias 29 have been determined, giving ratios of Menv/Mdisc of
0.2 for IRS 63 and 6 for Elias 29. High-spatial-resolution observations
of the motion of the molecular gas in the discs are used to determine the
masses of the central objects for the first time, 0.37 ± 0.13 M� for IRS 63
and 2.5 ± 0.6 M� for Elias 29 for a fiducial inclination of 30◦, indicatingthat the central stars have practically reached their final mass (Chapter 2).
• A total of 26 southern discs are detected at mm wavelengths with the SMA,
ATCA, and CARMA. Several of these sources are resolved, indicating that
the emission is optically thin at these wavelengths. The (sub)mm slope
α is determined and found to cluster around 3, where Fν ∝ να, implying
that millimetre-sized grains must be common in the discs of T-Tauri stars
(Chapters 3 and 4).
• A correlation is found between the strength of the 10-μm silicate features
and the mm slopes. As the 10-μm feature probes the surface layers of
the inner disc and the mm slope probes the outer disc, this means that
12

1.5 This thesis
grain growth must be fast throughout the disc. The sources are more or
less grouped by star-forming region in the 10-μm-feature versus mm-slope
diagram. Synthetic spectra were created using the radiative-transfer tool
RADMC and they show that this grouping can be explained if one assumes
that grain growth has progressed further in some of the star-forming regions
than in others. However, it may also point to a chemical variation between
the different star-forming regions (Chapter 4).
• RU Lup and CS Cha are found to have dust emission up to 7 mm and
WW Cha up to 1.6 cm, indicating the presence of pebble-sized grains.
Other mechanisms are responsible for the emission at longer wavelengths
for RU Lup and WW Cha (Chapter 5).
The study of young stellar objects with (sub)mm and cm interferometers is
a relatively young and very exciting field in which many interesting results have
been obtained in the past several years. The future of this field is extremely bright.
Firstly, the upgrade of the ATCA with the Compact Array Broadband Backend
(CABB), which will increase the bandwidth with a factor of 16, is practically fin-
ished. This will make surveys of young stellar objects at mm and cm wavelengths
in the southern sky much more feasible, which in turn will allow us to obtain the
necessary statistics to draw firmer and stricter conclusions. Likewise, the upgrade
of the VLA to form the Expanded Very Large Array (EVLA) will increase the con-
tinuum sensitivity by a factor of 5 to 20, giving a point-source sensitivity better
than 1 μJy between 7 mm and 15 cm and accessing the northern skies to simi-
lar surveys. The e-MERLIN telescope array, which will provide radio imaging,
spectroscopy, and polarimetry with 10-150 milliarcsecond resolution and μJy sen-
sitivity at cm wavelengths, is also nearing completion. Next, the Atacama Large
Millimeter/submillimeter Array (ALMA) is expected to start operations in a few
years time, opening up the southern skies to wavelengths between 0.35 and 3.6
millimeters. The unprecedented spatial resolution at these wavelengths will make
it possible to study the growth of grains to pebbles as a function of location in the
disc. Finally, the Square Kilometre Array (SKA) is being planned. Construction
of the first elements of the SKA is expected to start in 2012, with completion of
the array by 2020. The SKA will allow observations at about 1 cm and longer at
milliarcsecond resolutions to find rocks and boulders in protoplanetary discs.
13