The Federal Reserve in TimesofEconomic Crisis - IPE Berlin
50
Institute for International Political Economy Berlin The Federal Reserve in TimesofEconomic Crisis – Paths and Choices since 2007 Author: Sina Rüdiger Working Paper, No. 25/2013 Editors: Sigrid Betzelt Trevor Evans Eckhard Hein Hansjörg Herr Martin Kronauer Birgit Mahnkopf Achim Truger
-
Upload
khangminh22 -
Category
Documents
-
view
3 -
download
0
Transcript of The Federal Reserve in TimesofEconomic Crisis - IPE Berlin

Institute for International Political Economy Berlin
The Federal Reserve in Times!of!Economic Crisis – Paths and Choices since 2007 Author: Sina Rüdiger
Working Paper, No. 25/2013
Editors:
Sigrid Betzelt ! Trevor Evans ! Eckhard Hein ! Hansjörg Herr ! Martin Kronauer ! Birgit Mahnkopf ! Achim Truger

!
The Federal Reserve in Times of Economic Crisis – Paths and Choices since 2007*
Sina Rüdiger Berlin School of Economics and Law Berlin, Germany
Abstract
This paper studies the actions of the U.S. Federal Reserve Bank during the financial crisis
from 2007-2012. Whereas the first two parts concentrate on asset bubble theory and the
development of the housing bubble, the third part rates the performance of the Federal
Reserve during the crisis. The chosen scoring model approach shows that the average
performance of five specific measures taken by the Federal Reserve only ranks between fair
and good. Comparing Stiglitz (2010) viewpoints with those of the Federal Reserve, this paper
analyzes the federal funds rate, the bailout of AIG, the lending to Bear Stearns, the Term
Auction Facility and the failure of Lehman Brothers. This paper argues that the resulting
decisions were well intentioned but that the outcome was different from expectations because
of missing regulations and restrictions. Furthermore, the structure of the Federal Reserve is
examined and criticized.
Keywords: Federal Reserve, financial crisis, housing bubble, monetary policy
JEL Classification: E52, E58
Contact Information: Sina Rüdiger [email protected]
* I would like to thank Prof. Dr. Pédussel Wu and Prof. Dr. Hansjörg Herr for helpful comments. Remaining errors are, of course, mine.

!

1
Introduction
The subprime crisis that started in 2007 in the United States can be seen as the worst financial
crisis in the real economy since the Second World War (Herr, et al., 2011). It is therefore
necessary to understand how it came to such a development and if the responses following the
outbreak of the crisis were the right ones.
After the break down of the Bretton Woods system in the late 1960s and early 1970s, most of
the western countries followed neoliberal reforms which set the basis for the financial system
prevailing today (Herr and Kazandziska, 2011). The key elements are described by Dullien as
the deregulation of domestic and international financial markets as well as the deregulation of
labor markets. Non-bank financial institutions are getting more and more important,
securitization plays an increasing role and financial innovations and derivatives progressively
gain market shares. The shadow banking sector, a high risk sector, became more and more
important and the traditional banking system lost part of its importance. Due to the liberalized
system, shadow banking agents could now use not only their own stocks to speculate, but also
money from the commercial banking system (Herr and Kazandziska, 2011). The conservative
neoliberal reforms evoked not only a dynamically growing financial market, but also their
increasing instability (Bernanke and Gertler, 1999).
This paper studies the origins of asset bubbles in general and the detection of such in the first
part. The second part will focus more on the development of the housing bubble which then
burst during the subprime crisis in 2007. Therefore, this paper will describe the development
of the crisis concentrating on the major events in the early-2000s that helped feed the housing
bubble and will further analyze the main reasons that actually led to this bubble. After a short
introduction of the Federal Reserve System and its decision process in the first chapter of the
third part, the behavior of the Federal Reserve after the bursting of the bubble is analyzed
using the lessons learned from parts I and II. To do so, the second chapter introduces the
different measures taken by the Fed starting in mid-2007. Then, five specific actions will be
studied using a scoring model approach to evaluate the performance of the Federal Reserve.
The average of the measures analyzed is the overall grade of the Fed’s actions. Then the result
will be discussed.

2
Asset Bubbles and Asset Price Volatility
Asset bubbles have shaped the financial landscape for more than 300 years. Not only did they
become more frequent but also the characteristics of assets traded have changed in recent
years. There are several definitions of asset bubbles found in the literature. The popular press
uses the term for an asset whose price has increased significantly in a short period of time so
that a sudden collapse of the price is imaginable (Barlevy, 2007). Kindleberger (1978) defined
a bubble as “an upward price movement over an extended range that then implodes”.
According to Barlevy, most economists refer to bubbles as a movement, where the price of an
asset exceeds the fundamental value of the asset. In case the price of an asset falls short of the
fundamental value, one can speak of a negative bubble. Whereas the bubbles during the 17th
century were mostly driven by excitement over emerging markets, bubbles during the 18th
century were driven by infrastructure and land improvements. During the last century, the key
drivers were more of a technological and financial nature such as stocks, high yield bonds,
and real estate (Norman and Thiagarajan, 2009). Even though the drivers of bubbles changed
over time, most bubbles follow certain steps in their lifetime: Displacement, Boom, Euphoria,
Panic and Intervention.
The further analysis of asset bubbles and their creation is necessary as asset bubbles can
produce many dysfunctional effects. “The risk is not just that asset prices can go swiftly into
reverse. [Asset Bubbles] also distort price signals and can cause a misallocation of resources”
(The Economist, 2005). Of course, bubbles can have positive side effects and even be
desirable in some situations as they might facilitate trades that would not occur otherwise.1
Norman and Thiagarajan (2009) show that the bursting of a bubble leads to a relocation of
consumption and investment that in return will cause other negative effects related to
economic growth. One negative effect is excessive investment. In times of overly optimistic
outlook, investors tend to increase investments in start-ups and firm expansions because of the
belief that markets will continue to grow over a long period. Once the upward trend has
stopped and turned into a downward trend, investors have to liquidate excessive investments
on short notice. This sudden investment volatility can lead to destructive effects for economic
key drivers and also hurt businesses that cannot handle this sudden investment withdrawal.
Another negative effect caused by the bursting of bubbles is the impact of policy mistakes.
Governments and corporations are tempted to offer additional benefits for the population and
workers in times of economic boom. These benefits can include better health care services, 1 For further information see Barlevy (2007)

3
increases in pensions and compensation plans. When the bubble bursts, these benefits become
unsustainable and have to be changed radically. This provokes not only economic effects but
also social ones, as people see their just gained benefits decreasing again (Norman and
Thiagarajan, 2009).2
Origin of Asset Price Volatility and Asset Bubbles Economists name several factors that are at the origin of asset bubbles. Some approaches are
similar to others; some vary in the reasons named. According to most economists, bubbles can
vary in many different ways but most of them still have some common ingredients. This
section tries to give an overview of some of the main strands of research of the origins of
asset price volatility.
Sullivan (2009) argues that three factors often represent the main ingredients for a bubble:
financial innovation, investor emotions and speculative leverage. He underlines that most of
the bubbles of recent times were triggered by innovation either in the telecommunication,
technological or financial market combined with overconfidence of investors and leverage.
Innovations in financial markets are mainly driven by investors seeking to reduce, share or
transfer risk what results in more and more complex structures where the risk is actually hard
to evaluate. This behavior is increased by the desire of even higher returns. These innovations
get problematic when they fail to deliver what they originally promised and when they
multiply risk in the system as they are so hard to assess. Usually, regulation is not ahead of
time with innovation and therefore complex innovations made risk management by investors
and regulators more challenging contributing to a “Minsky moment”. That means a situation
with positive effects as financial growth but creating financial instability at the same time.
To profit more from the innovations, investors use speculative leverage. Leverage is a
necessary ingredient of the capitalistic system but needs adequate liquidity. According to
Sullivan (2009) the availability of liquidity is mostly depend on the shadow banking system -
that means profit- and risk-seeking financial intermediaries that are independent from the
central bank. The problem is that liquidity can drop easily and fast depending on the market’s
tolerance for risk. This makes the system fragile and volatile and only works as long as not
2 The International Monetary Fund has shown that bubbles usually lead to an output loss after their burst. Taking into consideration 40 crises, the average output loss as a share of GDP was 20.1% according to the IMF. The impact on emerging markets can be far more important than the impact on developed markets. The output loss of Thailand after the systemic banking crisis starting in 1997 was measured at 97.7%. This shows the possible destructive effect of a bursting bubble very clearly (Laeven and Valencia, 2008).

4
everybody wants his money back at the same time. In case liquidity is short, it provokes
forced selling which results in declining prices and a self-reinforcing, downward spiral.
Guttmann (2009) claims that two main factors are common to recent crises and bubbles: low
interest rates and financial innovation. Because of fear of deflation, the Federal Reserve kept
interest rates at a low level for a few years after a recession to enable a strong recovery.
Combined with financial innovations that mobilized even more additional financing this
creates a boom of assets. He also refers to the financial instability hypotheses of Kindleberger
and Minsky “according to which speculative bubbles inevitably triggered spectacular
financial crises sooner or later”. Furthermore, Guttmann names speculation as a driving factor
for the development of asset bubbles. As banks involved increasingly in securities, this
speculative activity reduces the velocity of money and is generally not even shown in
financial statements of banks. Speculation’s constraints usually only exist in the minds of the
users and not in any physical (capacity) form. Therefore these assets are climbing as long as
euphoria is stimulating investors’ investment decisions.
Dellas and Tavlas (2011) argue that the creation of asset bubbles is possible in situations of
increased liquidity. They bring forward the argument that an increase in liquidity stimulates
the demand for assets such as government bonds and real estate. This will lead to a price
increase of the assets and reduce the rate of return. According to the Austrian view, Dellas
and Tavlas state that this increase in liquidity can lead to asset bubbles of monetary policy
allows expanding credits what heats up asset price developments even more.
Shiller (2005) names 12 main reasons that explain stock market booms in recent years. These
reasons vary from bubble supporting monetary policy, new information technology and the
expansion of volume in trade to the decline of inflation and the effects of money illusion.
Nevertheless, in his book “the Subprime Solution” (2008) he argues that the most important
single factor for creating asset price volatility is the “social contagion of boom thinking”. The
observation of rising asset prices leads to so called “new era stories”, stories that tell that
something significant has changed what justifies rising prices. Due to social contagion
thinking, these stories seem to be more and more credible. People believe in such stories and
in a continuing boom because all the others seem to do the same and they hear more and more
stories about it. Feedback loops appear, that means increasing prices lead to stories, stories let
investors to have an optimistic view and invest more. More investments provoke rising prices
which will lead to more new era stories. This kind of loop is repeated over and over again in
times of a speculative bubble. The increasing prices and optimistic economic view tend to

5
increase spending which then leads to economic growth. Many investors fail to notice that the
prosperity is actually not caused by economic fundamentals but by the bubble itself because
of social contagion.
Shiller (2008) compares social contagion to an epidemic. According to him, every disease has
a contagion rate at which it is transmitted from one person to another. Furthermore, every
disease has a removal rate at which people are no longer contagious and therefore can’t
transmit the disease anymore (due to recovery or death). When the contagion rate exceeds the
removal rate, an epidemic starts and more and more people will be infected. The same
happens concerning social thinking. If certain factors arise that boost an optimistic view of the
economy and the removal rate of this optimistic view is significantly lower, then the
optimistic view will be widespread through the market and social contagion will replace
individual thinking and analysis. This will drive up asset prices and cause an asset price
bubble. Of course, Shiller underlines, social contagion is not the only explanation how asset
bubbles can arise. But according to him, this group thinking is one major factor as it is leading
to a decreasing quality of group thinking because everybody will ignore his individual
information to follow instead the general information.
This overview of recent strands in research concerning factors leading to asset price volatility
shows, that there is no common ingredient that will inevitably lead to the creation of an asset
bubble. Asset bubbles arise because of different circumstances and factors and every bubble is
unique in its way. Nevertheless, there are a few main reasons that economists seem to agree
on. The following table summarizes the above explained views.
Table 1: Origin of Asset Price Bubbles
Sullivan Guttmann Dellas/Tavlas Shiller
Innovation X x
Social Contagion X x
Leverage x
Low Interests x X
Increased
Liquidity
X

6
Therefore, Innovation, emotional behavior of investors and low interest rates that boost
spending and investments seem to be the most important factors that tend to lead to rising
asset prices without fundamental explanation. A situation showing signs of one or more of
these factors should therefore provoke a critical analysis of asset prices so that learning from
past bubbles might influence the out coming of future ones.
Regardless of the approach, certain similarities can be recognized and some factors can be
reduced to others. These factors can be helpful to understand what drives the creation of asset
bubbles in general which will help to analyze the recent asset bubble and the reactions of the
Federal Reserve.
Detection of Asset Bubbles? Asset bubbles are hard to prevent and to detect. The number of recent crises underlines this
fact. The International Monetary Fund counted 124 crises within the period 1997 to 2007
(Laeven and Valencia, 2008). If it would be easy to detect bubbles, then their impact on the
economy could have been at least reduced if not prevented at all. Nevertheless, opinions about
the detection of asset bubbles are widely spread. Some economists argue that identification in
time is impossible. Others propose methods or checklists that should make detection possible
before a burst. This chapter will explain a few theories of each side to show the ongoing
discussions. Nevertheless, the lack of agreement can be seen as a sign how difficult it is as
well.
As Alan Greenspan noted in his speech at a symposium about economic volatility in 2002
concerning the dot.com bubble “We at the Federal Reserve considered a number of issues
related to asset bubbles – that is, surges in prices of assets to unsustainable levels. As events
evolved, we recognized that, despite our suspicions, it was very difficult to definitively
identify a bubble until after the fact – that is, when its bursting confirmed its existence”
(Greenspan, 2002).
Siegel (2003) proposes an operational definition of an asset market bubble depending on
“whether the future realized return of the asset justifies the original price over a time period
long enough so that the present value of cash flows received by investors during this period
constitutes at least one-half of that price.” This future time period is defined by the duration of
that asset. Duration is the time-weighted average of all future expected cash flows of that
asset (dividends). If realized return and expected return are more than two standard deviations
away from each other taking into account prevailing risk and return conditions, the existence

7
of a bubble is confirmed. This means it is necessary to wait a sufficient amount of time (the
calculated duration) to be able to either confirm the accuracy of the expected return (that
means the asset price it is traded for) or disprove it by comparing the realized return with the
expected return. Siegel argues, that this definition makes it therefore impossible to judge
whether a price decrease indicates that there has been a bubble before that decline or not. He
outlines further, that it would be possible to call a price of an asset “irrationally low” promptly
after the movement when the future discounted cash flows exceed the price the asset is traded
for. Contrary to that, it is not feasible to make the same immediate statement with an asset
being “irrationally high” as future developments have to show whether the price was justified
at this time or not.
Even though some economists agree with this point of view, there are other approaches as
well. Borio and Lowe (2002) argue in their paper that the detection of asset bubbles is
difficult, but not impossible. They propose a pre-crisis indicator called credit gap that helps
identifying bubbles. Based on work by Kaminsky and Reinhart (1999) which were able to
define thresholds for growth rates of credit, Borio and Lowe look at three different measures
based on asset prices, credit and investment and found out that the one based on credit is the
most suitable indicator. The credit gap is based on ex ante data and is assumed as the
“difference between the current ratio of credit to GDP and a slowly changing measure of the
trend value of this ratio” (Federal Reserve Bank of San Francisco, 2009). A boom or bust is
therefore characterized by the event that the ratio of credit to GDP deviates significantly from
its trend (based on data of previous years). The critical point of this theory is the decision
which threshold level is used. Borio’s and Lowe’s tests have shown, that the accuracy of the
prediction is depending on the percentage of threshold used and the chosen time horizon. Best
results were accomplished by choosing a time horizon of three years and a threshold of four
percent. 79% of the crises could have been predicted and the percentage of falls alarms went
down to 20%.
These are just examples of how economists try to find measures that make predicting asset
bubbles easier so that wide economic reactions could be decreased or even prevented. This
field of research is highly discussed and there are many different points of views available.
The interest in this topic and the complexity of certain models prove that the identification of
a bubble is a complicated matter.
!

8
The Development of the Housing Bubble and its Burst since 2001
An Overview of the Creation of the Bubble 2000 – 2007 The bursting of the dot-com bubble in 2000 led to a significant decrease in the stock market.
After strong growth since the late 1990s, tech stock prices fell up to 75% until October 2002.
This led to a recession in March 2001. To fight this recession, Alan Greenspan, Chairman of
the Federal Reserve at that time, lowered the federal funds rate. When President George W.
Bush failed to stimulate the economy with its tax cuts for the rich, everything was relying on
monetary policy. Therefore, the Federal Reserve flooded the market with liquidity in form of
cheap money. Because of all the excess capacity in the economy, the cheap money did not
enhance investments in plants and equipment. Instead, consumption goods and real estate
were the new focus for investments at this time.3
According to Ceyla Pazarbasioglu, head of capital market research at the International
Monetary Fund, the global pool of money doubled in size in only six years (Davidson and
Blumberg, 2008). This global pool of money basically contains all the money the world is
saving at one precise moment and increased from 36 trillion dollars to 72 trillion between
2000 and 2006. This money is mainly put in investments with a low-risk and high-return
profile. When Alan Greenspan announced that the Fed Fund rate remains on a low level,
investment opportunities in treasury bills were ruined. Therefore mortgage-backed securities
became the focus of interest among other investment possibilities, providing a stable income
with underlying assets as securities.
Instead of focusing on the design of mature financial products, Wall Street was focusing on
products that were generating a higher profit in times of cheap money supply. They created
mortgages with high transaction costs, variable interest rates and no protection against falling
house prices or job loss. The designed products maximized the profits of lenders and
increased homeownership even though this increase was not a long term development.
According to Stiglitz (2010), there are two main functions of the banking system: providing
an efficient payment mechanism with facilitated transactions and transfers; and managing and
assessing risk and making loans. Unfortunately, most banks concentrated more on transaction
costs and other ways to make money instead of focusing on their core functions. They were 3 When the United States invaded Iraq in 2003, oil prices started to increase. The price per barrel went from $32 in March 2003 to $137 in July 2008. Therefore, the money spent to import oil increased to $1.4 billion per day – money that was spent for imports instead of investments that could help the economy at that time. Because of that and less inflationary pressure, Greenspan kept the interest rates low and money remained cheap (Stiglitz, 2010).

9
not focusing on lending to small and medium businesses even though this kind of investment
is necessary for a growing economy and job creation. Banks were focusing more on
securitization of mortgages.4
The global economy needs growing consumption. But growing consumption is only possible
if the income of the population increases in the long run. The income of Americans stagnated
for so long, nonetheless America acted as consumer of last resort many times. The solution
for most Americans was borrowing to finance this growing consumption behavior. The
average savings rate fell to about zero. As many rich Americans increased their savings this
means that the poorer part of the population had a negative savings rate and went further into
debt. The low interest rates of the Federal Reserve and lax regulation policies enhanced this
development. The borrowing was mostly based on the assumption that housing prices would
continue to increase. So people could take out loans for new cars based on their increased
home value and still have a certain amount left they could use for retirement. According to
Stiglitz (2010), two thirds to three quarters of the GDP before the burst of the bubble in 2007
was housing related. This included not only the construction of new homes, but also
borrowing on them and then spending the money on something else.
As house prices almost doubled from 2000 to 2006, real estate investments were considered
as safe investments. Many house owners even speculated on rising prices and so they were
able to reduce the necessary down payments for their loans (Sagemann and Reese, 2011).
Because of the increased global pool of money, more and more investors were looking for
investment opportunities with low risk and a reasonable steady return. To be able to fulfill the
low risk criteria, investment firms collected mortgages from smaller banks and brokers to
4 Securitization of mortgages has been used since the late 1970s. Subprime loans are more likely to default than prime loans. Because the subprime borrower made a smaller down payment than the prime borrower, he has less to lose in case of a default. Mortgage lenders therefore diversify among a high number of borrowers to reduce the risk exposure. This diversification only reduces specific or diversifiable risks as defaults due to job loss but not systematic risks such as house price decreases. To shift the risk, mortgage lenders use securitization of mortgages. Mortgages are pooled, repackaged and sold to different investors. Securitization became more and more popular since the late 1990s and was used with other types as loans as well such as credit card debt. Because of the high interest rates, subprime mortgages were very appealing for this kind of financial product. Mortgage originators or banks generally create special purpose vehicles that pool numerous residential mortgages to create residential mortgage-backed securities. The creation of special purpose vehicles removes the mortgages from the balance sheet and with that the risk exposure related to those mortgage loans. Less risk exposure on the balance sheet implicates lower capital requirements according to regulators and internal risk management systems which leads to more capital capacity that can be used to make even more loans. The residential mortgage-backed securities are structured into three tranches- a senior tranche with the lowest interest paid and the least risk exposure, an equity tranche with the highest returns paid as any losses are absorbed by this tranche first and the mezzanine tranche that falls between equity and senior tranche. In the case of subprime mortgage-backed securities, the senior tranche is supplemented by overcollateralization and excess spread that allows those securities to be rated with a AAA rating (Jacobs, 2009).

10
assemble them and sell tranches to the global pool of money. Due to this assemblage and
tranche system, investors of mortgage backed securities did not have to handle the hassle and
risk coming from single mortgages, e.g. default payments of client XY (Davidson and
Blumberg, 2008).
According to Davidson and Blumberg (2008), the demand for asset-backed securities
increased even more as the global pool of money went up steadily. As those investment
tranches are composed of many single mortgages, the demand for mortgages went up as well.
To satisfy this demand and as a result of rising house prices, the necessary criteria for clients
to get a mortgage loan decreased and more and more people were allowed to borrow money.5
Risk was put aside as all banks and brokers offered the same kind of loans. The fierce
competition on the asset-backed securities market made companies join the wave even though
they knew the traded mortgages were bad ones.
When housing prices started to decline in late summer 2006 due to an increase in supply and
decrease in demand, mortgage rates began to climb to a higher level. People began having
problems paying back the higher mortgage rates with their current income. Therefore more
and more lenders defaulted on their mortgage payments (Shiller, 2008). The SandP/ Case-
Shiller Home Price Index showed a drop of 33 % between 2006 and 2009. Consequently the
foreclosure rate went up and tripled to almost 3 million per month in 2008 (Sagemann and
Reese, 2011). The defaulted payments caused severe losses for banks and other investors as
the underlying securities of those bad loans were decreasing in value and therefore did not
cover the full initial loan sum. Consequently, investors had to face losses which were in no
relation to the calculated risk profile of the asset-backed securities they had bought before.
The subprime credit crisis first became public when HSBC had to announce a write-off of 11
billion USD due to mortgage debt investments. When other investors followed, the credit
crisis triggered worldwide turmoil in the capital markets. Banks and hedge funds were forced
to recapitalize followed by closed money market funds and the collapse of Bear Stearns and
Washington Mutual. In 2008 Lehman Brothers went bankrupt which symbolizes the largest
bank failure in history. Subsequently, many large banks and financial institutions had to ask 5 Once everyone who was qualified for a verified income, verified asset loan had already gotten a mortgage, guidelines got looser. The next form of loan was a stated income, verified asset loan. Applicants only had to state their income and prove the existence of their underlying assets. When guidelines loosened even further, stated income, stated asset loans evolved, where both factors were just stated and not verified. The next step was a no income, verified asset loan where people did not have to state their income at all, not even their job. Finally, so-called NINA loans were created – no income, no assets loans, where people did not have to state anything at all and just needed a credit score to be approved. This loose lending behavior of banks marked a new era. As banks did not hold these mortgages for a long time because they were sold to Wall Street after a few months, the brokers did not care about the potential risk anymore (Duttweiler, 2009) (Shiller, 2008).

11
for financial help from their respective governments and were consequently partially
nationalized.6
Major Reasons that led to this Bubble
The reasons that have caused the American subprime crisis and have subsequently led to a
global financial turmoil are numerous and cannot all be taken into consideration in this paper.
The focus of this section relies on some major reasons that help understand not only the
creation of the bubble but also the development once the bubble burst in 2007. Of course
there are many other factors that played a role during the financial crisis and this enumeration
does not claim to be complete.
The Housing Myth and Governmental Support
According to Shiller (2008), the overly optimistic view of the real estate market was one
major factor during the crisis. During a survey in 2005, a third of all questioned homebuyers
in the San Francisco area answered with exaggerated price expectations, sometimes exceeding
50%. The average expected price increase for the next 10 years was about 9% per year. These
expectations were mainly results of increasing house prices in the past and interpretations
from others concerning these increases. As explained in part one of this paper, the social
contagion created “new era” stories, making everybody belief that it must be true because
everyone couldn’t be wrong. The price increases supported economic optimism which
encouraged spending behavior. The increased spending endorsed economic growth and
created therefore even more optimism. As real estate prices were increasing steadily, people
considered housing as a safe investment and started basing their decisions on the actions of
others instead of their own assessment of the situation.
This behavior was encouraged by what Shiller (2008) calls the “real estate myth”. This is the
myth that real estate prices must increase over time as the population and economy are
growing and the amount of land available is limited. Therefore, people expect increasing
house prices as a result of growing GDP. But even though the fraction of income spend on
housing is stable over the years, the growing income is not invested in more expensive
housing, but in an increasing amount of housing. According to the U.S. Census Bureau, the
average floor area of one-family houses increased almost 50% from 1973 to 2006, and the
6 e.g. Citigroup Corporation and Commerzbank

12
average household size declined from 3.29 persons in the 1960 to 2.63 in the 1990s. This
means, people move in bigger houses and spread out among more houses, explaining the
increasing amount spent on housing and disproving the myth.
Government programs such as the Community Reinvestment Act (CRA) boosted housing
even more as they encouraged financial institutions to lend to underserved communities and
to make housing affordable. Also the privatized, government-sponsored enterprises Fannie
Mae and Freddie Mac contributed to boosting housing consumption as their purpose is to
expend the secondary mortgage market by securitizing mortgages. This securitization made it
possible that lenders could reinvest and led to more credit volume for real estate investments
to reasonable terms. Both enterprises regulate the quality and quantity of the real estate loan
market and are subject to strict oversight. The first mortgage-backed securities were issued in
1970 representing only a small portion of all loans traded. This situation changed after the
bursting of the dot.com bubble, when the amount of subprime loans and Alt-A loans increased
significantly (Herr, et al., 2011).
Furthermore, the drive of former President Bush for homeownership fueled the bubble.
According to George W. Bush, all Americans should own their own home and he tried to
expand homeownership especially among minority groups. With “his housing policies and
hands-off approach to regulation, [Bush] encouraged lax lending standards”(Becker, et al.,
2008).
The Federal Reserve’s Monetary Policy
As noted above, the interest rates of the United States Federal Reserve Board of Governors
remained at a low level. With these measures, the Fed tried to fight the economic downturns
following the burst of the internet bubble and the attacks of 11th of September 2001 as low
interest rates favor investments and economic development. Nevertheless, low interest rates
hold a certain risk of inflation if maintained for a longer period. Alan Greenspan believed that
the potential inflation coming from low long-term rates would be counterbalanced by
innovation and globalization boosting productivity and competition. During his 18 years as
the head of the Fed, Greenspan flooded the US economy with cheap money to encourage
spending and borrowing in times of financial crises. Market participants were relying more
and more on this behavior, also known as “Greenspan put” (Sagemann and Reese, 2011).
Therefore the Fed approved loose lending policies of banks and other financial institutions
because it encouraged consumption and was seen as an efficient tool to stimulate the growth

13
of the US economy. When house prices rose significantly, Ben Bernanke (2005), the
successor of Alan Greenspan, noted that this rise mostly reflected strong economic
fundamentals. According to the Fed, asset bubbles would not have an impact on the long-term
development of the economy. And this theory was not completely wrong as Americans had
been buying houses using debt financing for a long time.
Nevertheless, the low interest rates implemented by the Fed were driven by economic
conditions and cannot alone explain the nine year upward trend of real estate prices. Shiller
(2008) claims that the period of negative interest rates after inflation correction was 31
months long. This is just a third of the nine year price increase and therefore is not enough to
justify such a sharp increase over time. The Federal Reserve was mainly focused on
preventing a recession and deflation after the stock market crash and interpreted the home
price increases as a continuing trend.
Macro-Economic Trends
According to Norman and Thiagarajan (2009), four important macro trends enhanced the less
risk adverse behavior and development in recent years that were a crucial factor for recent
crises. The 1999 repeal of the Glass-Steagall Act plays an important role in this theory.
Introduced in 1933, this Act separated the commercial banking system from the investment
banking system and created barriers for banks to engage in speculative activities. When the
Glass-Steagall Act was repealed, banks were allowed to take part in transactions and
underwritings of instruments like mortgage-backed securities and collateralized debt
obligations. Because of the missing separation, banks became “too big to be allowed to fail”
which created “incentives for excessive risk-taking” (Stiglitz, 2010). The second important
macro trend is the effect of disintermediation. Norman and Thiagarajan (2009) claim that
removing banks as intermediaries caused that they are responsible for less than 25% of all
financial assets through loans. Non-financial-banks could offer lower spreads than banks and
therefore risk was transferred to the financial markets because non-bank financial
intermediaries were less regulated and allocated riskier investment opportunities. As Sullivan,
both authors argue that financial innovation was one reason leading to recent crisis. Even
though financial innovation is a positive force that drives up efficiency and productivity, the
evaluating systems were mostly inadequate for the new complex structures and led to
misjudgment of taken risks. Furthermore, increasing short term interests of investors led to
shorting of securities which has a negative effect concerning the propagation of bubbles.

14
Together with increasing equity volatility, covered stocks with high short term interest rates
led to additional investments in stocks enhancing the creation of a bubble. According to the
Norman and Thiagarajan (2009), “high levels of short interests also result in investors seeking
and propagating negative information about the company”.
Financial Innovation
As explained earlier in this chapter, financial innovation was one key driver of the housing
crisis. The securitization of mortgages and the selling of tranches led to complex structures
that were hard to assess and judge when it comes to the involved risk. According to Stiglitz
(2010), the financial markets failed to perform their functions of managing risk, allocating
capital and mobilizing savings while offering low transaction costs. “Instead, they had created
risk, misallocated capital, and encouraged excessive indebtedness while imposing high
transaction costs” (Stiglitz 2010; 7). Banks and other institutions not only misjudged the risks
involved in their transactions and the according rating of their investments, they also
misjudged the risk evolving with high leverage. Risky assets only hold small risk premiums
because Bankers were speculating that either the Federal Reserve or the Treasury would bail
them out in case something happened (which turned out to be right). Stiglitz (2010) argued
that wrong incentives and opportunities made bankers greedy. The deregulation made it
possible to create complex investments with increasing risk and information asymmetries.
Agency Problem and Poor Corporate Governance
There was also an agency problem in the process of investment. The people that took
investment decisions did invest on behalf of others and not on behalf of themselves. Therefore
the focus shifted to short-term returns for the decision-making investors instead of long-term
performance for those who provided the funds. For banks this meant that they were more
focusing on how to create more fees instead of focusing on the creation of better products.
Higher fees meant higher quarterly returns and higher returns usually translated into higher
stock market prices. That was all that management cared about as their pay depended on stock
market prices instead of long-term returns. Securitization not only separated lenders from
brokers, it also created imperfect information. The buyers of the mortgage-backed securities
have to trust the banks, which in return have to trust the mortgage originator. The problem
was that the mortgage originator cared only about quantity but not about quality. The bankers
used to blame the mortgage originators after the bursting of the bubble, but in fact they did
15
not study the mortgages well enough or just did not want to as their incentive was passing
these mortgages to investors.
Severe agency problems and externalities usually prevent markets from efficient outcomes.
This is one major argument for financial market regulation. But the government did not only
abandon existing regulation, it also failed to adopt new regulation that would respond to the
financial innovations. The repeal of the Glass-Steagall Act allowed banks to become too big
to fail which created a further incentive to engage in excessive risk. Together with the
“Greenspan put” this created a certain moral hazard.
Origins of the Housing Bubble – Comparison with the Theoretical Approach
As shown in earlier, there are many strands of research naming different criteria that are
encouraging the development of an asset bubble. According to the different approaches
explained in that chapter, the recent subprime mortgage bubble seems to be a textbook
example of an asset price bubble as it included all factors mentioned above:
Mortgage securitization and other new financial products are representing the innovation
driven by the purpose to reduce and shift risk from mortgage lenders. These innovations
spread very quickly as banks tried to maximize their profits. This behavior is coherent to
Sullivan’s (2009) first main ingredient for a bubble and also one of Guttmann’s (2009)
important factors. The belief that housing prices would increase continuously and the housing
myth represent the social contagion theory of Shiller (2008) and the investors’ emotion
approach from Sullivan (2009). Investors were caught in “new era stories” and wanted to
profit from the housing boom as well, what created a further increase until real estate prices
reached its peak. Furthermore, leverage played an important role during the subprime crisis.
As banks were holding many of their mortgage securities off their books, the capital
requirements were not adjusted to their actual risk engagement and the spare capacity could
therefore be used for further investments. This drove up the leverage even more. Low interest
rates and increasing liquidity were applying during the subprime bubble as well. When Alan
Greenspan kept the federal funds rate at a low level to stimulate the economy after the stock
market crash in 2001, money was cheap and the credit volume was expanding. The increase in
liquidity stimulated the demand for government bonds and real estate instead of investments
in plants and equipment due to the excess capacity of the economy.
This analysis shows that all the important factors that could feed a bubble were present during
the 2007 subprime asset bubble. All these factors combined with missing regulation and

16
reckless behavior of market participants fueled the development. This not only proves the
applicability of the theories discussed in the first part but also shows, how deep and
fundamental some problems were. As all factors played together and market participants kept
on believing that this upwards trend would not come to an end so soon, the effects of the
bursting of the bubble were disastrous. Nevertheless, this bubble has some unique features as
this time assets were concerned. Usually an economy builds up on is assets in times of
economic downturn. As this was not possible during this particular bubble, the treatment of
certain aspects of the bubble had to be different from usual approaches.
The Federal Reserve’s Reaction during the Subprime Crisis – Case Study
This part analyzes the Federal Reserve’s reaction during the subprime crisis. For a better
understanding of the mechanisms and processes involved when taking decisions, the Federal
Reserve System will be briefly explained at the beginning of this part. Then the focus lies on
five specific actions taken by the Federal Reserve. These are studied with the help of a scoring
model approach.
The Federal Reserve System – Organization, Monetary Policy and Tools
The history of central banks began in 1668 with the establishment of the Swedish Riksbank.
At this time and up until the late 1850s the main factor for creating these special banks was
war debt financing. Central banks were seen as havens for additional government debts in
times of war or civil strife. Since then, the purpose of those institutions has changed
remarkably as the main objective changed from financial and banking stability to mostly
monetary policy as a key function nowadays (Pollard, 2003).
Rather than being one single central bank, the Federal Reserve System is established as a
central bank system with a Board of Governors with its residency in Washington DC and 12
regional Reserve Banks widespread over the United States. These measures have been taken
into account to avoid strong governmental control over the Fed (Waller, 2011). The Federal
Reserve Banks do not correspond to political entities but comprise parts of different states and
follow county lines instead of state borders (Pollard, 2003). Section 2.1 of the Federal Reserve
Act specifies that there have to be “not less than eight nor more than twelve cities known as
Federal Reserve cities”.

17
To avoid that the twelve district banks concentrate too much on their respective area, the
Board of Governors in Washington DC constitutes an entity focusing on nationwide policies.
All seven members are nominated by the President and confirmed by the Senate of the United
States. Governors are appointed for a nonrenewable term of 14 years to ensure long term
decisions of the board. The terms are staggered so that one term expires theoretically every
two years. This ensures that no single government can nominate and appoint all members of
the Board of Governors, favoring the government’s political tendencies. Therefore the
appointment conditions do not only favor a certain independence of the Board to political
influences because there is no worry for reappointment from the President or Senate but
increases as well the accountability of the Board members as it is more likely, that they have
to deal with the outcomes of their earlier decisions within their term of 14 years (Waller,
2011). The Board of Governors has one chairman and one vice chairman. Both have to be
appointed by the U.S. President and confirmed by the Senate of the United States among the
existing members of the Board or simultaneous with appointment to the board (Pollard, 2003).
According to the Federal Reserve Act Section 10, the President has to make sure that in
appointing the members of the Board, financial, agricultural, industrial, and commercial
interests are fairly represented among the members. The same applies to the geographical
division of the country which implies that not more than one member can be selected from
any Federal Reserve district bank. In practice, these restrictions haven’t been obeyed very
closely in recent years. In fact, most members of the Board nowadays are economists and/or
bankers and their link to the district banks they have come from is often loose (Pollard, 2003).
To ensure that not all policy makers are political appointees, the presidents of the twelve
Federal Reserve Banks are chosen by the citizenry of the respective district in a non-electoral
manner (Waller, 2011). All twelve district banks contain a board of directors, consisting of
nine members. Section 4 of the Federal Reserve Act specifies that the members of the board
are classed into 3 categories: class A, B and C, each including three members. These members
are chosen from a wide range of sectors to provide a broad perspective of the economic well-
being of the district. The members of the board are therefore chosen for their professional
qualifications and not according to their political affiliation (Waller, 2011). The class A
directors represent the commercial member banks of that district, whereas class B and C
directors represent the public. Class A and B directors are elected by the member banks of
that district, the class C directors are appointed by the Board of Governors. Neither class B
nor class C directors may be officers or employees of a bank or bank holding company (Board
of Governors' Publications Committee, 2005). The president of a district bank is appointed by

18
the board of directors of that bank and has to be approved by the Board of Governors (Pollard,
2003).
The Federal Reserve Bank is a central bank with a focus on independence and accountability
even though these are contradictory ideas. The independence of the Fed is also enforced
through the financial independence given by Congress in form of budget autonomy. That
means that the Federal Reserve can earn its own income and spend it without government
interference as long as it returns any excess income to the government. This is ensured
through bank statements and balance sheets which are subject to auditing by an independent
auditing firm to ensure transparency. On the other hand, mandates are long-term oriented to
ensure accountability of the members. Even though accountability means some political
oversight and thus contradicts independence. The accountability of the Fed is especially after
the subprime crisis heavily discussed (Waller, 2011).
The objective of the Federal Reserve is written in the U.S. Code in paragraph 225A and
clarifies that the Fed should “maintain long run growth of monetary and credit aggregates,
combined with maximum employment, stable prices and moderate long term interest rates”
(USC, § 225A). These three goals are compatible in the long run but not at every given point
in time which implicates that the Federal Reserve must have an implicit ranking. In times of
turmoil, the Federal Reserve Bank usually concentrates only on the stability of the financial
system (Harris, 2008).
The monetary decisions of the Federal Reserve are usually taken by the Federal Open Market
Committee which consists of 12 members with the right to vote on decisions. These 12
consist of the seven members of the Board of Governors, the president of the Federal Reserve
Bank of New York on a continuous basis and four out of the remaining 11 presidents of the
other District Banks on a rotating basis. The rotating members are elected at the first meeting
each year by the boards of directors (Pollard, 2003). The non-voting members still attend and
participate in the policy discussions and contribute to the committee assessment of the
economic situation (Board of Governors' Publications Committee, 2005). There have to be at
least eight meetings per year; additional meetings can be scheduled anytime. According to
Harris (2008), the chairman of the Federal Reserve is despite of his equal position among the
others more powerful than any other FOMC member as long as he enjoys the respect of the
committee. Not only is the chair the public face of the Federal Reserve, he also shapes the
discussion, choice possibilities and agenda and most committee members fear that raising

19
their voice against him would undercut the institution. The beliefs and positioning of the
chairman are therefore guiding when it comes to the policy decisions of the Federal Reserve.
The Federal Reserve has three main tools to pursue its monetary policy decisions: open
market operations, the discount window and reserve requirements. At the Federal Reserve
meetings, the Fed sets a target funds rate that means the rate that banks pay each other to
borrow overnight. Those transactions are carried out on the federal funds market due to
changing amounts of reserves banks want to hold or buy/sell (The Federal Reserve Bank of
San Francisco, 2004). Due to the fact that the Federal Reserve can’t directly control this funds
rate, open market operations are carried out to influence the rate and keep it close to the target
rate. The open market operations comprise buying or selling of U.S. government securities,
usually in form of repurchase agreements with duration of maximal seven days. Therefore, the
Federal Reserve Bank of New York is active on a daily basis through its open market desk.
Important is, that the Federal Reserve, in comparison to other central banks only deals in U.S.
government securities and in USD (Pollard, 2003).
The discount window is another important tool for achieving the target federal funds rate. It
comprises the overnight loans from the Federal Reserve to financial institutions and therefore
“serves as backup source of liquidity for individual depository institutions” (Board of
Governors' Publications Committee, 2005). Every Fed Bank sets its own discount rate at
which financial institutions can borrow overnight, with the approval of the Board of
Governors. This rate lies below the federal funds rate target, usually up to 50 basis points
lower. The reserve requirements are not seen as an active tool as changes in the minimum
reserve requirements for financial institutions are very rare. Nevertheless, the reserve
requirements influence directly the transaction volume and risk-behavior of financial
institutions and therefore are a way to guide the economy.
The policy decision process includes an open discussion of all FOMC members and the point
of view of the chairmen. The latter summarizes the exchanged opinions and reads out a policy
directive that is coherent with the committee’s view. This directive is then subject of a vote of
all 12 voting members (Pollard, 2003).
Analysis of the Fed’s Behavior during the Crisis
Actions of the Federal Reserve
The severity of the financial crisis led to a variety of actions and measures taken by the
Federal Reserve. As described earlier, one main tool of central banks is the setting of a target

20
federal funds rate to influence the economy accordingly. The following graph shows the
reaction of the Federal Reserve before and after the bursting of the housing bubble. After the
dot.com bubble, the Federal Reserve tried to fight a threatening recession in lowering the rate
progressively to 1-2%. This was hoped to encourage spending and investment.
Figure 1: The Federal Reserve's Funds Rate from 1998 to 2011
Source: Federal Reserve’s Funds Rate Archive, own graph
When the first signs of an economic downturn appeared, the Board of Governors started
lowering the funds rate. From mid-2007 until the beginning of 2009 the interest rate dropped
from 5.25% to 0 - 0.25%. As this tool of monetary policy was not enough to prevent a
slowdown of the economy, the Federal Reserve had to use other tools as well. The following
paragraph gives an overview over the most important emergency programs and other Reserve
Bank involvements following the bursting of the subprime crisis in 2007.
!"#
$"#
%"#
&"#
'"#
("#
)"#
*"#
+"#
!(,!$,$--+# !$,$!,%!!!# %+,!),%!!&# %',!&,%!!)# $+,$%,%!!+# $',!-,%!$$#

21
Figure 2: Important Measures taken by the Federal Reserve
The tools used by the Federal Reserve can be divided into three sections. The first category
includes the provision of short-term liquidity to depository institutions, banks and other
financial institutions, representing the central bank’s role as lender of last resort. The second
set of tools comprises the provision of liquidity directly to borrowers and investors. The third
section comprehends the purchase of securities for the Fed’s portfolio. These actions do not
include support for specific institutions which will be explained subsequently.
Provision of short-term liquidity to depository institutions, banks and other financial
institutions
When the spread between the LIBOR and the Treasury bills was increasing and the
commercial paper market between large financial institutions froze at the end of 2007 and
beginning of 2008, the Federal Reserve responded by creating several programs that
reallocated funds to those institutions that were most affected by this “liquidity crisis”. From
August 2007, banks were able to borrow from the discount window for a period of up to 90
days instead of just overnight through the Term Discount Window Facility (Eisenbeis, 2010).
In December the same year, the Federal Reserve Board instituted the Term Auction Facility
(TAF) to address disruptions in U.S. term interbank lending markets. In contrast to the
discount window, TAF could be approached by several institutions at the same time,
borrowing at an interest rate set by auction and borrowing anonymously. Every borrower that
was eligible to borrowing at the discount window could bid at the auction as long as the
depository institution was in sound condition. The Term Auction Facility provided the

22
advantage that there was less stigma attached to the auctions than the traditional discount
window as funds were provided anonymously without the public noticing. Furthermore, funds
were not obtained directly but 3 days after the auction (Federal Reserve Bank Governance,
2012). TAF was auctioning money to any bank in the country and not just to primary dealers
anymore, trying to reduce the spread between LIBOR and the fed rates. With a lending
volume of $450 billion in 2008, this program was used more often than the normal discount
window with a lending volume of $90 billion (Wessel, 2009).
Also in December 2007, the Federal Reserve announced dollar swaps with several foreign
central banks to flood the market with dollar liquidity to provide the dollar funding markets
abroad with sufficient liquidity. Therefore, the Federal Reserve Bank of New York exchanged
dollars with a foreign central bank for their local currency for a fixed exchange rate.
Meanwhile, the foreign central bank agreed to buy their currency back for the same exchange
rate on a set date in the future. The dollar swap lines included agreements with countries such
as Japan, United Kingdom, Canada, Switzerland, Australia, Sweden, Norway and Denmark
and the European Central Bank (Federal Reserve Bank Governance, 2012).
In March 2008, the Fed created the Term Securities Lending Facility (TSLF), which
enabled primary dealers to borrow U.S. Treasury securities against their hard-to-sell
collaterals. Dealers could bid a fee to obtain the 28-day loans which they then could use to
borrow against in the repurchase agreement markets. There were two different schedules of
collateral that could be auctioned against. Whereas schedule I collateral just included the
collateral that the Federal Reserve Board of New York accepted in traditional open market
operations, the schedule II collateral included also highly rated mortgage-backed securities
and other assets. To be able to do so, the Federal Reserve Board had to invoke section 13(3)
of the Federal Reserve Act for the first time during the crisis. The range of assets accepted
was broadened when the crisis intensified (Federal Reserve Bank Governance, 2012). With
this program, the Fed could take up to $200 billion of the assets Wall Street could hardly sell
and exchange them into treasury securities, trying to prevent a downwards price spiral that
would have started if dealers were forced to sell these illiquid assets (Wessel, 2009). Because
the securities were lent out overnight and taken back every next morning through the lending
period, the TSLF was off balance sheet and had no influence on the bank reserves in the Fed’s
balance sheet. Nevertheless, successful bidders could use the provided securities to engage in
repurchase agreements and gain overnight liquidity (Federal Reserve Bank of New York,
2009). This allocated liquidity to primary dealers (Eisenbeis, 2010).

23
At around the same time, the Federal Reserve created the Primary Dealer Credit Facility
(PDCF), a facility that provided primary dealers with collateralized cash loans over night, in
case the situation with Bear Stearns creates a liquidity run to other banks. Primary dealers
include banks and security broker-dealers (Board of Governors of the Federal Reserve
System, 2012). Cash loans were therefore extended to investment banks and commercial
banks. PDCF was available on March 17, 2008 following the already implement tri-party
repurchase agreements with the primary dealers. Bear Stearns itself was the largest PDCF
borrower in the first month (Federal Reserve Bank Governance, 2012).
Provision of liquidity to borrowers and investors in key credit markets
In November 2008, the Term Asset-Backed Securities Loan Facility (TALF) was created,
trying to reopen the securitizations market. TALF opened in March 2009 and provided U.S.
companies and individuals access to credit in return for securities as collateral. Before the
burst of the bubble, many consumer loans such as credit card debt, student loans and auto
loans, were turned into securities. When the market for these securities froze in the fall of
2008, no securities were sold anymore and consequently consumer loans decreased
significantly. As this was threatening consumer spending, the Federal Reserve was trying to
reopen this consumer credit securities market again through offering loans to hedge funds and
other investors to buy these securities. The Treasury put in $20 billion of tax payers’ money
from TARP that would absorb the first losses so that when the Federal Reserve put in $180
billion, the total volume of loans that TALF could offer was $200 billion. Additionally, both
parties agreed that borrowers using TALF do not have to pay back the Federal Reserve in case
the end consumers behind the securities the borrowers bought would not pay back their loans.
In this case, the borrowing institution would just lose the additional collateral they had to post
with the Federal Reserve in the beginning, which usually was just a minor percentage of the
total loan. In June 2010, TALF was closed again (Wessel, 2009).
In October 2008, the Federal Reserve authorized the Commercial Paper Funding Facility
(CPFF) under section 13(3) of the Federal Reserve Act. The created limited liability company
CPFF LLC bought unsecured and asset backed commercial papers from U.S. issuers. Through
this method, the CPFF LLC tried to provide the commercial paper markets with sufficient
liquidity. Issuers had to pay fees up front. Together with the collateral provided to the LLC,
lending of the Federal Reserve to the limited liability company was secured. As commercial
paper issuers were reluctant to engage in longer-term maturities because they feared they

24
would be unable to issue new commercial papers to replace the maturing ones, CPFF tried to
reduce this risk and encourage the purchase of commercial papers at longer maturities. The
Commercial Paper Funding Facility was closed in February 2010 (Board of Governors of the
Federal Reserve System, 2011a).
In September 2008, the Asset-backed Commercial Paper Money Market Mutual Fund
Liquidity Facility (AMLF) was created to provide liquidity to money market mutual funds.
When Lehman Brothers failed, the value of a share of the large money market fund “Reserve
Primary Fund” broke the buck and fell from its original value of $1 to 97 cents a share
(Mankiw and Ball, 2010). Due to that and the fear of further declining prices, many investors
wanted to redeem their shares. The AMLF intended to assist money market funds to be able to
meet those redemptions. To make sure that the liquidity provided through the purchase of
high-quality asset-backed commercial papers was used in this way, the Federal Reserve
established redemption thresholds. Money market mutual funds were only eligible to AMLF
loans if they have experienced outflows of at least 5% of net assets in a single day or 10% of
net assets within the five prior business days (Board of Governors of the Federal Reserve
System, 2011a).
The creation of the Money Market Investor Funding Facility (MMIFF) was announced in
October 2008. The aim was to finance the purchase of short-term debt from money market
mutual funds. As MMIFF expired in October 2009 without having being used, no further
explanation for this funding facility is necessary (United States Government Accountability
Office, 2011).
Purchase of long-term securities for the Federal Reserve’s portfolio
The Federal Reserve has expended its traditional set of tools by purchasing longer-term
securities for the Federal Reserve’s portfolio. In November 2008, the Federal Reserve
announced that it would purchase government-sponsored debt and mortgage-backed
securities. In March 2009, the amounts were increased to up to $200 billion in government-
sponsored debt and $1.23 trillion in MBS. The availability of government-sponsored debt
decreased. To enhance a smooth transition, the Federal Reserve slowed down the purchases in
August and completed the whole program in October 2010.

25
Support for specific institutions
When Bear Stearns informed the Federal Reserve on 13 March, 2008 that it would have to
file for bankruptcy the next day without financial help from the Fed because of an increased
run on its liquidity, the FRB voted that the Federal Reserve Bank of New York (FRBNY)
would provide Bear Stearns with a bridge loan of $12.9 billion against a collateral of $13.8
billion Bear Stearns assets that had to be paid back on 17 March with interests of almost $4
million. This loan was supposed to provide Bear Stearns with some time to find an acquirer
who would stand behind its assets when markets reopened to circumvent bankruptcy. On 16
March, the FRB announced that the FRBNY would make a $30 billion nonrecourse loan
against certain Bear Stearns assets to enable the acquisition by J.P. Morgan Chase and Co
(Federal Reserve Bank Governance, 2012). J.P. Morgan first offered to pay shareholders a $2
share price and was standing behind Bear Stearns trades until shareholders voted about the
share price. As it was not sure if shareholders would agree to such a low offer and J.P.
Morgan feared it might have to guarantee Bear Stearns’ trades for a long while without
owning the company, the original offer was raised to $10 per share. Because shareholders
then got a better deal, the Federal Reserve wanted to renegotiate their offer as well. Criteria
were set for which assets would be in the Federal Reserve’s portfolio and J.P. Morgan Chase
agreed to cover the first $1 billion of losses (Wessel, 2009). After several negotiation
processes, the special-purpose vehicle Maiden Lane LLC was created to buy assets from Bear
Stearns, consisting of a senior loan of $28.82 billion from the Federal Reserve Bank of New
York and a subordinated loan of $1.15 billion from J.P. Morgan Chase and Co (Federal
Reserve Bank Governance, 2012).
American International Group Inc. (AIG) is an American multinational insurance
corporation that sold among other things insurances against borrowers’ defaulting, especially
in Europe. After its failure to raise private money to survive, AIG tried to obtain loans. But
when AIG’s debt was downgraded and the stock price was falling, its business partners
stopped trading with AIG and the Federal Reserve had to step in to rescue AIG from
bankruptcy. According to the Fed, AIG was a profitable insurance company where just the
hedge fund part was making huge losses (Wessel, 2009). On 16 September, 2008 the Federal
Reserve Board authorized the FRBNY to create a revolving credit facility with a volume of up
to $85 billion with interests of LIBOR+8.5% in exchange for 79.9% ownership in the
company. (Interests were lowered later when it was clear that AIG could not meet those
conditions.) When the condition of AIG continued to decline, the Federal Reserve created the
securities borrowing facility to provide support to a securities lending program that was

26
operated by domestic insurance companies that belonged to AIG. The securities borrowing
facility provided cash loans to AIG’s life insurance companies of up to $37.8 billion. When
the Federal Reserve restructured AIG’s debt in November 2008 to strengthen its financial
situation, Treasury purchased preferred stock worth of $40 billion. The cash provided through
that was used to diminish the outstanding amounts in the revolving credit facility.
Furthermore, the Federal Reserve created the special purpose vehicles (SPV) Maiden Lane II
and Maiden Lane III. Maiden Lane II replaced the securities borrowing facility and provided a
longer-term solution for the troubled securities lending program of AIG, buying residential
mortgage-backed security assets from subsidiaries of AIG. Maiden Lane III purchased
collateralized debt obligations from AIG’s counterparties that were in connection with the
termination of issued AIG credit default swaps contracts. Additionally in December 2009, as
part of the restructuring of AIG’s debt, the Federal Reserve Bank of New York received
preferred interest in the newly created special purpose vehicles AIA Aurora LLC and ALICO
Holdings LLC. which were holding outstanding stocks of American International Assurance
Company Ltd. (AIA) and American Life Insurance Company (ALICO). The aim of that was
to position both SPV for sale or initial public offering and reduce the line of credit provided to
AIG. In September 2010, AIG signed a recapitalization plan with the Treasury, the FRBNY
and the trustees of the AIG Credit Facility Trust concerning the repayment of AIG’s
obligations. In January 2011, the recapitalization plan was closed as the revolving credit
facility was fully repaid and any further lending terminated.
At the end of November 2008, the FRBNY provided Citigroup with a lending commitment
together with the Treasury and Federal Deposit Insurance Corporation (FDIC) to prevent the
banking organization from failure. The FRBNY agreed to lend to Citigroup after losses of
their assets reached a certain value. When the loss sharing agreement was terminated in
December 2009, the FRBNY never made a loan to Citigroup under this lending facility.
Citigroup subsidiaries used other Federal Reserve emergency programs such as TSLF and
TAF, using the “ring-fence” assets agreed in the loss sharing agreement as collateral. When
the agreement was terminated by Citigroup, the FRBNY received a $50 million termination
fee.
In January 2009, the Federal Reserve announced jointly with the Treasury and the FDIC that
they will provide assistance to Bank of America to ensure financial stability. Due to the
acquisition of Merrill Lynch and its amount of mortgage backed securities, Bank of America
saw its balance sheet threatened. Treasury and FDIC offered protection against unusual losses
from a portfolio of loans of $118 billion. In return Bank of America should have issued

27
preferred shares to both. Furthermore, the Treasury announced investments of $20 billion
from TARP in exchange for preferred stock with a dividend of 8%. But in May 2009, after
the results of the Supervisory Capital Assessment Program, Bank of America announced that
it did not want to continue with the announced package of support and paid an exit fee to
terminate the term sheet with all three parties. The Federal Reserve received an exit payment
of $57 million (Board of Governors of the Federal Reserve System, 2011c).
Stiglitz’s Point of View7
This section summarizes Stiglitz’s main arguments and critics concerning the Fed which will
build the basis for the evaluating process in the next step.
Stiglitz not only judged the actions once the bubble burst, he also brought forth that certain
behavior before 2007 aggravated the magnitude of the crisis. When Bernanke and Greenspan
argued that they could not tell if there was a bubble or not and even if they could tell that they
had no tools to do anything about it, he disagreed. According to Stiglitz, the Federal Reserve
could have pushed for higher down payments on houses or higher margin requirements for
stock trading to cool down the bubble before its burst. Furthermore, the Federal Reserve could
have lowered the maximum loan to value ratio instead of increasing it and restrict negative
amortization and low-documentation loans. On the contrary, during his tenure Alan
Greenspan allowed banks to engage in even riskier lending and encouraged homebuyers to
take variable mortgage loans that could later explode. The Greenspan-put was replaced by the
Bernanke-put and contributed to excessive risk taking as banks were betting that the Federal
Reserve would bail them out in case they are in trouble. In general, the Federal Reserve
underestimated the risk that banks were still holding; misjudged the securitization principles
and underestimated the incentives for excessive risk taking of bankers.
Monetary Policy
According to Stiglitz, the main mission of monetary policy in times of economic crisis is to
not make things worse. He refers to Maynard Keynes impotence of monetary policy as
lowering the federal funds rate in a crisis is like “pushing on a string”. Therefore, concerning
the interest rates, the Federal Reserve couldn’t have done more. 7 Economics Nobel prize winner Joseph Stiglitz is known for his economic foresight. In his book “Freefall – America, Free markets and the Sinking of the World Economy” (2010) he analysed the causes of the crisis and discussed the measures taken by several institutions when trying to rescue the financial markets. He also critically analyzed the behavior of the Federal Reserve before and during the housing bubble.

28
Due to the reduced competition and the low borrowing rates, banks could raise interest rates
and recapitalize themselves very fast. Low interest rates can help to increase growth and
investments if allocated efficiently. When banks borrowed cheap money from the Federal
Reserve in return for poor collateral, this money was used for risky trading and other
speculative transactions that even led to reported profits of some institutions in 2009. As
nothing is growing from speculation, the provided funds were not allocated sufficiently and
the taxpayers’ money was at stake. Stiglitz is therefore not criticizing the low interest rates,
but the missing regulation that would have forced institutions to use the provided funds for
the intended purposes. Consequently, banks could borrow at interest rates of almost 0% but
individuals had to face high interest rates.
Provision of Liquidity
At the first sign of problems in August 2007, the Fed started pumping money into the system
to stabilize financial markets. The Federal Reserve more than doubled its balance sheet from
September to December 2008. Through different tools such as TALF, the Federal Reserve
tried to get the securities market going again and flooded the market with liquidity.
Unfortunately while doing this, they did not pay attention to the underlying problem. Instead
they just focused on the symptoms and ignored that the models of the securities market were
badly flawed.
When lending froze, the Federal Reserve extended its safety net to other institutions than
banks. At the end, the Fed was lending to all kinds of market participants including
investment banks, hedge funds and companies. The safety net which was providing financial
help to corporations but not to individuals was extended to those who did not pay into the
insurance fund. Stiglitz again criticized the missing regulation. According to him, the Federal
Reserve just provided funds without making any important demands that could have stopped
the excessive risk taking. Another counterproductive issue that the Fed later on recognized
was that reserves which were hold at the Federal Reserve banks paid interest. This financial
benefit discouraged banks even more from lending. Another important fact was that the
Federal Reserve changed from being the banker’s banker to being the nation’s banker. It left
its traditional business and entered unknown territory where it had no qualification in
assessing risk accordingly. Through the several programs of the Federal Reserve, the risk
shifted to the Fed and the government.

29
Transparency and Corporate Governance
The Federal Reserve acknowledged that they were missing clear guidelines of principles
when it came to death or life decisions for major financial actors. Stiglitz has complained
about a lack of transparency concerning the actions taken by the Federal Reserve, as it is still
not clear how much of taxpayers’ money was put at risk and what the cost will be in the end.
Instead of increasing the transparency as Bernanke originally had planned, the secrecy
increased and left spectators wondering if the obscured reason was to hide mistakes and other
incorrect decisions such as resulting gifts to Goldman Sachs and foreign banks when the
Federal Reserve decided to bailout AIG.
Another problem that became visible through the economic crisis includes the corporate
governance at the Federal Reserve itself. Of course, when six out of nine directors from the
Federal Reserve Bank of New York come from the banking industry, they are interested in
continuing to make profits and therefore no re-regulation can be expected from this group of
people. The regulated chose the regulators. And those who created the mess in the form of the
housing bubble were put in charge of cleaning it up.
Evaluation of the Federal Reserve’s Reaction during the Subprime Crisis
To evaluate selected decisions of the Federal Reserve during the housing bubble starting
2007, a scoring model approach will be used. The scoring model is based on scores for
different criteria that are weighted according to their importance. Through the weighting, the
scores for every criterion will form a weighted average that then provides an overall score for
a certain project or action. The averages of all decisions or actions that have been analyzed
form the overall score.
Four different criteria
To perform this analysis, four different criteria have been chosen. The first criterion,
effectiveness, considers the reasoning and justification behind the decision of the Federal
Reserve and analyses if the target outcome was achieved or not. It compares the realized
effects of an action to the intensions of the Federal Reserve and analyses if the effects were
helping to stabilize the financial markets on a short- and long-term basis.
The second aspect, transparency, measures the communication approach of the Federal
Reserve and if their decisions were made transparent to the public and other market

30
participants. Furthermore, it considers the aspect of clear guidelines and tools that made the
process of choosing a particular action understandable.
Additionally, the scoring model takes into consideration whether there have been other
reaction possibilities for the Federal Reserve (according to their knowledge at the point of
time the decision was taken) and if so, whether the chosen decision was the best one, although
it is difficult to decide as the outcome of other actions is hard to predict.
The fourth criterion analyses the consistency of the Fed’s actions considering measures taken
before and after that specific situation. If it is a measure that was to be expected from previous
actions, it is considered to be consistent. If the decision taken contradicts other actions then it
is considered as inconsistent or fairly consistent.
Scoring system
Actions or decisions are graded with a scoring system from 1 to 4. Four different grade
options seem plausible as they deliver enough room for evaluation. Furthermore, with an even
number of grades, neutral grades are avoided. As the decisions involve relatively complex
structures which dealt with power limitations and were sometimes taken under time pressure,
grades of a more diversified and outspread scoring system would be hard to justify. The
scores are translated into the following:
• 1 – bad
• 2 – fair
• 3 – good
• 4 – very good
This classification allows judging the actions of the Federal Reserve accordingly, given that
bad (1) is the worst grade and very good (4) the best. Fair (2) represents a decision that was
either justified and following the right intentions but not satisfying in its results or involving
too much risk on the taxpayers’ side and creating wrong incentives for market participants.
Good (3) represents a decision that followed the right intensions and improved the overall
situation but still leaves room for improvement.
Weighting
As not all criteria are of the same importance, the contribution to the final grade for one
decision is adjusted through different weights for the different criteria. The effectiveness of an

31
action is considered to be the most important criterion of all. That is why its weighting in the
final grade is adjusted with a factor of 0.5. That leaves the remaining 50% of the grade are
split between transparency and consistency with each 20% and only 10% for the possibility of
other actions, as it is hard to tell what outcome other actions might have caused. In the end,
the weighted average of the scores of the different criteria is calculated thus grading the
overall decision.
After having analyzed and evaluated the important decisions an overall grade is calculated as
the mean of all decision grades, meaning all decisions are weighted equally thereby providing
a final grade of the Federal Reserve’s decisions and actions.
Implementation
Stiglitz analyzed the reasons for the housing bubble and the actions taken before and after the
bursting of the bubble in his book “Freefall- America, Free Markets, and the Sinking of the
World Econom”. Stiglitz is one of the economists publicly critizising major actions and
decisions of the Federal Reserve. As his opinion is quite strong and well reasoned, his point of
view is chosen as a contrast of the Federal Reserve’s own justification and opinion.
For the evaluation process actions and decisions of the Federal Reserve during the housing
bubble where chosen that were considered relevant and/or important. To conduct the grading
procedure, Stiglitz’s point of view is chosen regarding the different criteria for one action with
the published opinion of the Federal Reserve. This permits judging the decision from two
different and contrary angles that then leads to a specific score. The justification of that score
is an interpretation and explanation based on a study of both opinions and reasoned analysis.

32
!
Decision 1 of Federal Reserve : The Federal Funds Rate ! !Criteria Stiglitz's comment Fed's comment Score Justification/Explanation weight.
effective-
ness
According to Stiglitz, the effect
of lowering the federal funds
rate in an economic downturn is
not sufficient. But it is still
something that has to be done.
Even though the effectiveness of monetary policy in
times of crises is usually hampered, the monetary
policy actions of the Federal Reserve nevertheless
have worked to improve credit markets. The
aggressive funds rate cuts prevented interest rates
from climbing even higher levels. (Federal Reserve
Bank of San Francisco, 2009)
3
Like Keynes said: "monetary policy is like pushing on a string".
Still, the decision of the Federal Reserve to lower the rate to
almost 0 % over time was correct. The time frame in which they
were dropping from over 5% to almost 0% was unusually short.
0,5
trans-
parency no critics
Decision of the Open Market Committee. After
meetings, the outcome is presented to the public.
There are at least eight meetings per year, additional
meetings can be scheduled according to the
economic situation.
4
The federal funds rate is one main policy tool of the Federal
Reserve. The strategy is decided and voted for in the meetings of
the Federal Open Market Committee. The meeting schedules
and decisions are accessible for the public. No changes were
made in the procedure in comparison to the process before the
crisis.
0,2
possi-
bility of
another
action
none
The setting of the federal funds rate and the open
market operations are the main tools of the Federal
Reserve.
4
As the main policy tool of the Federal Reserve, lowering the
federal funds rate was the appropriate reaction. Only when these
actions did not show enough results, the Federal Reserve had to
consider other tools and actions.
0,1
consis-
tency with
other
actions
no critics
The lowering of the federal funds rate was the first
reaction during the crisis. All other measures
followed, when the low funds rate did not have the
hoped impacts.
4
Lowering the federal funds rate over time to almost 0 was hoped
to stimulate the markets and reduce interest rates by providing
cheap funds. This is consistent with other measures taken by the
Federal Reserve.
0,2
weighted average 3,5

33
Decision 2 of Federal Reserve : the Term Auction Facility !Criteria Stiglitz's comment Fed's comment Score Justification/Explanation weight.
effective-
ness No comment
The Term Auction Facility intended to reduce the
spread between LIBOR and T-Bill rates and provide
liquidity with fewer stigmas attached (due to
anonymous auctioning).
2
Research showed that the Term Auction Facility had only little or no impact
on the spread between LIBOR and T-Bill rates. On the other hand was TAF
a good way for banks to obtain loans without causing any negative publicity
(as would have been the case when using Discount window).
0,5
trans-
parency No comment
TAF was officially announced in December 2007. All
information needed was and is accessible on the
Federal Reserve's website.
4
Everything is accessible except the names of the institutions that were
bidding and those who actually received funds through TAF (what was part
of the program). Otherwise, the bidding process was transparent for all
market participants.
0,2
possi-bility
of another
action
No comment
The Federal Reserve tried to offset the negative stigma
attached to the discount window. When this did not
work, the Fed had to find a different way of lending to
banks that were in need of liquidity to stabilize the
financial system.
4
The idea behind the Term Auction Facility was good. The discount window
is one of the main tools of the Federal Reserve’s lending mechanism but the
stigma attached to it prevents banks to use it even though they might need it.
As the Term Auction Facility is based on the same principle only trying to
avoid the negative side effects, another action in this case is hard to
imagine.
0,1
consis-
tency with
other
actions
No comment TAF was part of the first set of tools : provision of
short-term liquidity. 4
The action was consistent with other measures taken to provide the financial
system with liquidity. 0,2
weighted average 3,0
!
! ! !

34
Decision 3 of Federal Reserve : Bailout Bear Stearns
Criteria Stiglitz's comment Fed's comment Score Justification/Explanation weight.
effective-
ness
The system would need preventive actions
to ensure that no too-big-to-fail or too-
intertwined-to-be-resolved or too-big-to-
be-resolved actors exist anymore.
The provision of funds to Bear Stearns prevented the
imminent insolvency of the company and bought time to find
a buyer for Bear Stearns. Until March 2012, most of the loans
were repaid by Maiden Lane LLC and the amount of the
outstanding loans of the Federal Reserve was reduced to $2.9
billion. (Federal Reserve Bank of New York, 2012)
2
The Federal Reserve was stuck with a portfolio they shouldn't have
whereas shareholders got a lot through the deal even though they should
have been punished. JPMorgan Chase profited from the deal as well -
aren't those the wrong people? Nevertheless, bankruptcy of Bear Stearns
was prevented, but this action just showed again how bad the situation
was. This action was not helping building trust in markets.
0,5
trans-
parency No comment
"Things happened very quickly and left very little time
window" (Bernanke in Wessel) 2
The deal was not transparent in the beginning. The Federal Reserve
ended up buying $30 billion of worst assets JPMorgan did not want to
buy. The communication about remaining outstanding loans on the Fed’s
website is now very good.
0,2
possi-bility
of another
action
Everything was so intertwined that even
the failure of a relatively small institution
as Bear Stearns could threaten the financial
system.
The imminent insolvency of Bear Stearns might have
threatened the whole financial sector. 3
Other possibilities were buying time to maybe find a counter offer,
helping Bear Stearns unwind its portfolio or just let Bear Stearns fail and
try to limit the damage. The first one would have been even more costly,
the second would have destabilized the markets even more and for the
third the outcome was unpredictable.
0,1
consis-tency
with other
actions
Shareholders got something, bondholders
were fully protected - in other cases this
was different so there is no consistency.
Furthermore, the Fed is now lending to an
investment bank (shadow banking system)
- Fed could no longer pretend that they are
only responsible for the oversight of the
banks.
“The actions that the Federal Reserve and the Treasury have
taken to stabilize systemically critical firms were essential to
protect the financial system as a whole, and, in particular, the
financial risks inherent in the credits extended by the Federal
Reserve were, in my view, greatly outweighed by the risks
that would have been faced by the financial system and the
economy had we not stepped in.” (Board of Governors of the
Federal Reserve System, 2009)
2
With lending to Bear Stearns, the Federal Reserve deviates from its
traditional path of only lending to banks. With lending to a financial firm
outside the regulatory net, the Federal Reserve now has to examine the
books of all investment banks. Furthermore, there is a lack of
consistency to shareholder and bondholder treatment.
0,2
weighted average 2,1

35
Decision 4 of Federal Reserve: let Lehman Brothers fail!! ! !Criteria Stiglitz's comment Fed's comment Score Justification/Explanation weight.
effective-
ness
Lehman's failure made the downturn of the
crisis faster because it untwined the cross
linking between the financial market actors.
The failure of Lehman Brothers was clear for
so long, markets had enough time to prepare
and protect themselves. The Federal Reserve
was sure that the failure would not pose any
systemic threat.
3
Even though the reaction of Lehman's failure was harder
than predicted, letting Lehman fail sent a clear signal to
the financial market. Furthermore, according to the
Federal Reserve, Lehman had no assets that anybody
would have liked to buy. Therefore it was not
predictable when or if the Fed would have been able to
recover the money invested.
0,5
trans-
parency
There was no set of principles that guided the
Fed through this kind of decision. This
presents a lack of transparency.
Fed itself states that they had no clear legal
framework for resolving big financial
institutions other than banks (Wessel).
2
There was a lack of clear principles that made an
understanding of the decision possible, but a decision
was necessary on short-notice, so there was not really
time and chance to follow standard protocols or make
new ones.
0,2
possi-bility
of another
action
Even when the Federal Reserve said that they
had not the power to react otherwise, it should
have gone to congress to ask for tools/legacy
instead of just saying they have no permission
to do anything.
According to Bernanke, Congress would
have never approved anything because they
did not see how bad it was at this point.
3
It is true that up to that point, congress would have never
approved any measures to rescue Lehman Brothers;
asking for something at that point might have ruined all
chances for later. (They had to wait for the right moment
to come.)
0,1
consis-tency
with other
actions
The Federal Reserve bailed out AIG just two
days later.
According to Bernanke, perfect consistency
simply wasn't possible given the Fed's
limited power (Wessel).
1 No consistency with other actions taken just a couple of
days and weeks later (ex. AIG) 0,2
weighted average 2,4
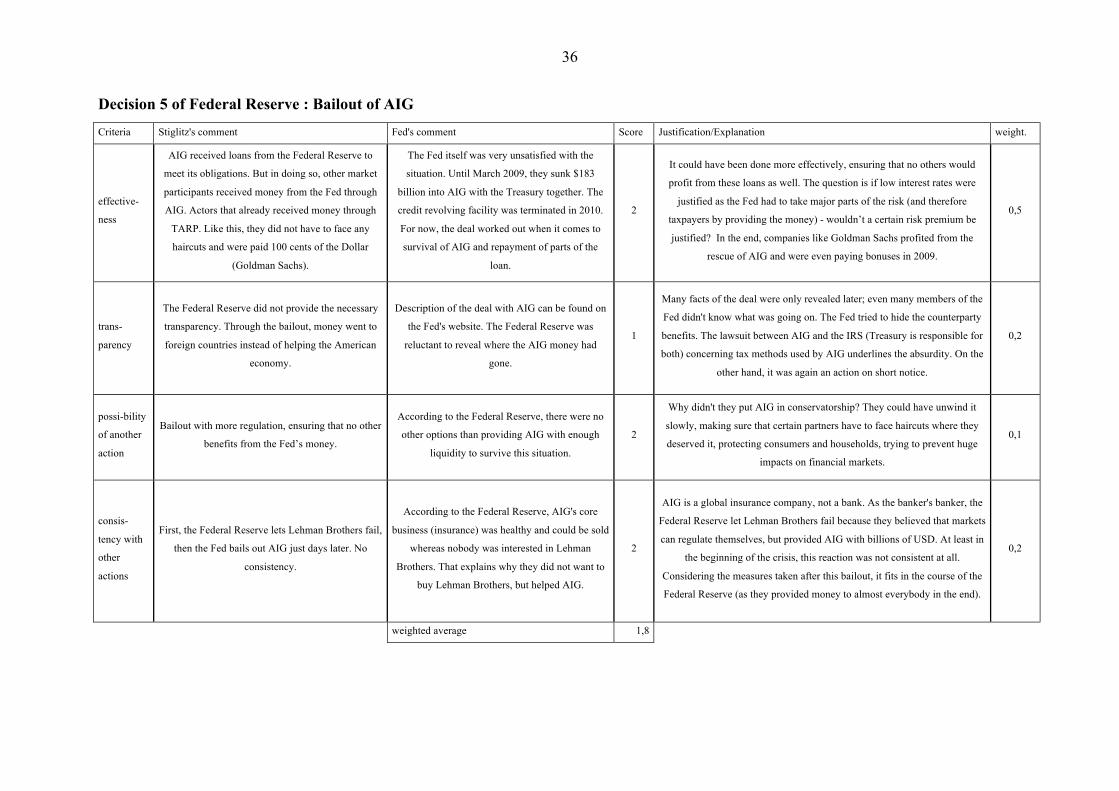
36
Decision 5 of Federal Reserve : Bailout of AIG
! ! !Criteria Stiglitz's comment Fed's comment Score Justification/Explanation weight.
effective-
ness
AIG received loans from the Federal Reserve to
meet its obligations. But in doing so, other market
participants received money from the Fed through
AIG. Actors that already received money through
TARP. Like this, they did not have to face any
haircuts and were paid 100 cents of the Dollar
(Goldman Sachs).
The Fed itself was very unsatisfied with the
situation. Until March 2009, they sunk $183
billion into AIG with the Treasury together. The
credit revolving facility was terminated in 2010.
For now, the deal worked out when it comes to
survival of AIG and repayment of parts of the
loan.
2
It could have been done more effectively, ensuring that no others would
profit from these loans as well. The question is if low interest rates were
justified as the Fed had to take major parts of the risk (and therefore
taxpayers by providing the money) - wouldn’t a certain risk premium be
justified? In the end, companies like Goldman Sachs profited from the
rescue of AIG and were even paying bonuses in 2009.
0,5
trans-
parency
The Federal Reserve did not provide the necessary
transparency. Through the bailout, money went to
foreign countries instead of helping the American
economy.
Description of the deal with AIG can be found on
the Fed's website. The Federal Reserve was
reluctant to reveal where the AIG money had
gone.
1
Many facts of the deal were only revealed later; even many members of the
Fed didn't know what was going on. The Fed tried to hide the counterparty
benefits. The lawsuit between AIG and the IRS (Treasury is responsible for
both) concerning tax methods used by AIG underlines the absurdity. On the
other hand, it was again an action on short notice.
0,2
possi-bility
of another
action
Bailout with more regulation, ensuring that no other
benefits from the Fed’s money.
According to the Federal Reserve, there were no
other options than providing AIG with enough
liquidity to survive this situation.
2
Why didn't they put AIG in conservatorship? They could have unwind it
slowly, making sure that certain partners have to face haircuts where they
deserved it, protecting consumers and households, trying to prevent huge
impacts on financial markets.
0,1
consis-
tency with
other
actions
First, the Federal Reserve lets Lehman Brothers fail,
then the Fed bails out AIG just days later. No
consistency.
According to the Federal Reserve, AIG's core
business (insurance) was healthy and could be sold
whereas nobody was interested in Lehman
Brothers. That explains why they did not want to
buy Lehman Brothers, but helped AIG.
2
AIG is a global insurance company, not a bank. As the banker's banker, the
Federal Reserve let Lehman Brothers fail because they believed that markets
can regulate themselves, but provided AIG with billions of USD. At least in
the beginning of the crisis, this reaction was not consistent at all.
Considering the measures taken after this bailout, it fits in the course of the
Federal Reserve (as they provided money to almost everybody in the end).
0,2
weighted average 1,8

37
Conclusion
The average grade of all actions analyzed is 2.56 according to the precedent method. This
evaluates the performance of the Federal Reserve only between fair and good. All in all, this
analysis shows that the decisions were not optimal and could have been improved most of the
time. Of course it is hard to judge if other measures would have resulted in a better economic
outcome than the ones the Federal Reserve chose. Especially, as every crisis is unique in its
procurement and settings. It is therefore impossible to say, that the decisions were simply
wrong and a specific other action would have improved the situation by far.
Nevertheless, as criticized during the analysis, there are certain things the Federal Reserve
could have done to improve the impact of the chosen policy tools. One example are
restrictions on lending, forcing banks that borrowed from the Federal Reserve at very low
interest rates to actually use that money to create loans for consumers and investors at
reasonable terms. This would have prevented that borrowers use the provided funds only to
recapitalize themselves. Another reason for this unsatisfying outcome is the structure of the
Federal Reserve. As described, the election process for the directors earlier, one can say that
the regulated (the banking sector) elect the regulator. The Federal Reserve with its main role
being the oversight of the financial sector can therefore not be seen as real independent, as
many important actors from the financial market were influencing the decision process within
the Federal Reserve. The question is if those weren’t wrong incentives that were driving the
decisions during the crisis. An institution that is responsible for the oversight of the financial
system should be willing to regulate the markets if necessary even though it might implicate
smaller profits and bonuses for certain actors. Furthermore, the fact that the Federal Reserve
was almost unprepared and continued to deny the existence of a bubble right before the
housing bubble burst, raises the question if the Federal Reserve is carrying out its mission of
oversight of the financial market carefully enough.
The actions of the Federal Reserve have provoked many discussions. This is not only due to
the fact that the Fed created new tools that haven’t been used before but also due to the lack of
transparency of many decisions of the Fed that were criticized earlier. It is not that this lack of
transparency sometimes destabilized the markets even more as market participants had the
feeling the situation worsened, it also gave the impression that the Federal Reserve was trying
to hide certain facts from the public (as was the case with AIG). This left certain market
participants believe that the Fed bailed out Wall Street but not Main Street which led to
protests, underlining the unsatisfying situation.
38
After extending the safety net so far, it is going to be difficult for the Federal Reserve to draw
back from this extension. Furthermore, the rescuing of financial market players during the
financial crisis sent wrong incentives to the financial market. These incentives have to be
changed. Banks and other financial institutions should not rely on the Federal Reserve
stepping in in case of problems. So it is important that the procedures are changed and not
only that the engine of the financial markets is running again. Otherwise, a repetition of the
situation is likely.
One major reason for the housing bubble was financial innovation. It is within the Federal
Reserve’s duty to understand, judge and if necessary regulate financial tools in order to ensure
the well-functioning of the financial markets. The recent past has shown that markets are not
working efficiently without regulation. One of the main duties of the Federal Reserve now is
therefore to close the gap and adopt regulation to the recent changes. If the Federal Reserve
was missing power in situations such as the failure of Lehman Brothers, it should have asked
Congress for that additional power. This underlines the need for changes in the future as it is
important to ensure that this will not happen again. But then the accountability of the Federal
Reserve has to be improved as well. By bailing out big market players during the financial
crisis, the Fed put billions of taxpayer’s money at risk.
All in all, five years after the bursting of the bubble, it is time to stop pointing fingers at who
was responsible. It is more important to learn from the lessons the financial crisis taught. New
regulations should be the main focus. The 2010 Dodd-Frank reform legislation of the Volcker
rule might be a start. Although the question is whether this reform will really help deal with
financial meltdowns without risking taxpayer’s money. A closer analysis of the reform would
be necessary to judge the outcome as it is important to see if the passed reforms really include
the lessons that should have been learned from the financial meltdown of recent years. This
analysis could be part of a new thesis. Furthermore, as shown in part I of this paper, the
frequency of asset bubbles has increased in the past. The analysis of this fact and methods to
prevent a further increase are also interesting aspects that could be considered in future work.
After discussing asset bubbles and their origins, the recent crisis development and the reaction
of the Federal Reserve, this paper showed that the asset bubble theory is an important field in
economic theory as the effects of such bubbles can be disastrous. As the amount of research
done and literature published is very extensive, the next important step is to learn lessons
from the past and prevent a repetition. Missing regulation and reckless behavior of market
participants fueled the recent crisis together with other origins that were explained in part II of

39
this paper. That is exactly the point where a change is necessary. Even though it is important
to improve the handling methods of a bubble, it is nevertheless even more important to
change the underlying conditions so that bubbles cannot arise in the first place. All bubbles
have common features but are nevertheless unique in their development and especially
outcome. Fighting the symptoms of a bubble is therefore riskier and less reliable than
eliminating or at least containing the causes of asset bubbles in general.
Bibliography
Barlevy, G., 2007. Economic theory and asset bubbles. Economic Perspectives, 3Q, pp. 44-
59.
Becker, J., Stolberg, S. G. & Labaton, S., 2008. The New York Times. [Online]
Available at: http://www.nytimes.com/2008/12/21/business/worldbusiness/21iht-
admin.4.18853088.html?pagewanted=all
[Accessed 5 July 2012].
Bernanke, B. & Gertler, M., 1999. Monetary Policy and Asset Price Volaility. s.l., Federal
Reserve Bank of Kansas City, pp. 17-51.
Board of Governors of the Federal Reserve System, 2009. Testimony Chairman Ben S.
Bernanke. [Online]
Available at:
http://www.federalreserve.gov/newsevents/testimony/bernanke20090210a.htm
[Accessed 25 June 2012].
Board of Governors of the Federal Reserve System, 2011a. Credit and Liquidity Programs
and the Balance Sheet. [Online]
Available at: http://www.federalreserve.gov/monetarypolicy/bst_lendingother.htm
[Accessed 8 July 2012].
Board of Governors of the Federal Reserve System, 2011b. Federal Reserve Bank Presidents.
[Online]
Available at: http://www.federalreserve.gov/aboutthefed/bios/banks/default.htm
[Accessed 14 July 2012].
Board of Governors of the Federal Reserve System, 2011c. Credit and Liquidity Programs
and the Balance Sheet - support for specific institutions. [Online]

40
Available at: http://www.federalreserve.gov/monetarypolicy/bst_supportspecific.htm
[Accessed 14 July 2012].
Board of Governors of the Federal Reserve System, 2012. Credit and Liquidity Programs and
the Balance Sheet. [Online]
Available at: http://www.federalreserve.gov/monetarypolicy/bst_lendingprimary.htm
[Accessed 26 June 2012].
Board of Governors' Publications Committee, 2005. The Federal Reserve System - Purposes
& Functions, Washington, D.C.: System Publication.
Case, K. E. & Shiller, R. J., 2003. Is There a Bubble in the Housing Market. Brookings
Papers on Economic Activity, pp. 299-362.
Davidson, A. & Blumberg, A., 2008. This American Life. [Online]
Available at: www.thisamericanlife.org/radio-archives/episode/355/the-giant-pool-of-
money
[Accessed 15 January 2012].
Dellas, H. & Tavlas, G. S., 2011. The Revived Bretton Woods System, Liquidity Creation,
and Asset Price Bubbles. Cato Journal, Vol. 31(No. 3).
Duttweiler, R., 2009. Managing Liquidity in Banks: A Top Down Approach. Chichester: John
Wiley & Sons Ltd.
Eisenbeis, R. A., 2010. The Financial Crisis: Miss-Diagnosis and Reactionary Responses.
Atlanta: International Atlantic Economic Society .
Ewing, J., 2010. Dealbook - The New York Times. [Online]
Available at: http://dealbook.nytimes.com/2010/01/27/schillers-list-how-to-diagnose-
the-next-bubble/
[Accessed 10 July 2012].
Federal Reserve Bank Governance, 2012. Appendix I: Federal Reserve Emergency Programs
and Reserve Bank Involvement, s.l.: U.S. Government Accountabiliy Office.
Federal Reserve Bank of New York, 2009. Term Securities Lending Facility: Program Terms
and Conditions. [Online]
Available at: http://www.newyorkfed.org/markets/tslf_terms.html
[Accessed 2 July 2012].
41
Federal Reserve Bank of New York, 2012. Maiden Lane Transactions. [Online]
Available at: http://www.newyorkfed.org/markets/maidenlane.html
[Accessed 1 July 2012].
Federal Reserve Bank of San Francisco, 2009. FRBSF Economic Letter. [Online]
Available at: http://www.frbsf.org/publications/economics/letter/2009/el2009-32.html
[Accessed 5 July 2012].
Federal Reserve Bank of San Francisco, 2009. Predicting Crises, Part 1: Do Coming Crises
Cast their Shadows before?. [Online]
Available at: http://www.frbsf.org/publications/economics/letter/2009/el2009-29.html
[Accessed 12 July 2012].
Federal Reserve Bank, n.d. Federal Reserve Act. [Online]
Available at: http://www.federalreserve.gov/aboutthefed/fract.htm
[Accessed 16 July 2012].
Greenspan, A., 2002. Economic Volatility - Remarks by Chairman Alan Greenspan at a
symposium sponsored by the Federal Reserve Bank of Kansas City, Jackson Hole,
Wyoming. s.l.:s.n.
Guttmann, R., 2009. Asset Bubbles, Debt Deflation, and Global Imbalances. International
Journal of Political Economy, Summer, Vol. 38(No. 2), pp. 46-69.
Harris, E. S., 2008. Ben Bernanke's Fed - the Federal Reserve after Greenspan. Boston:
Harvard Business Press.
Herr, H., Dullien, S. & Kellermann, C., 2011. Decent Capitalism: A Blueprint for Reforming
Our Economies. London: Pluto Press.
Herr, H. & Kazandziska, M., 2011. Macroeconomic Policy Regimes in Western Industrial
Countries. Abingdon: Routledge.
Jacobs, B. I., 2009. Tumbling Tower of Babel: Subprime Securitization and the Credit Crisis.
Financial Analyst Journal, Ahead of Print, pp. 1-14.
Kindleberger, C. P., 1978. Manias, Panics, and Crashes - a history of financial crises. New
York: Basic Books.
Laeven, L. & Valencia, F., 2008. Systemic Banking Crises: A New Database, s.l.:
International Monetary Fund Working Paper.
Mankiw, G. & Ball, L., 2010. Macroeconomics and the Financial System, s.l.: Worth
Publishers.

42
Milgrom, P. & Stokey, N., 1982. Information, trade and common knowledge. Journal of
Economic Theory, February , Vol. 26(No. 2), pp. 17-27.
Minsky, H. P., 1992. The Financial Instability Hypothesis. s.l.:s.n.
Norman, J. H. & Thiagarajan, R., 2009. Asset Bubbles and Market Crises. Journal of
Investing, Winter, Vol. 18(Issue 4), pp. 6-22.
Peláez, R. F., 2012. The housing bubble in real-time: the end of innocence. Journal of
Economics & Finance, pp. 211-225.
Pollard, P. S., 2003. A Look Inside Two Central Banks: The European Central Bank and the
Federal Reserve. Federal Reserve Bank of St. Louis - Review, January/February, pp.
11-30.
Sagemann, B. & Reese, P., 2011. The Great Subprime Credit Crisis and is Impact on Eastern
Europe. In: Financial Crisis in Eastern Europe. Wiesbaden: Gabler Verlag, pp. 21-62.
Shiller, R. J., 2005. Irrational Exuberance. 2nd ed. Princeton: Princeton University Press.
Shiller, R. J., 2008. The Subprime Solution - How Today's Global Financial Crisis Happened,
and What to Do about It. Princeton and Oxford: Princetion University Press.
Siegel, J. J., 2003. What is an Asset Price Bubble? An Operational Definition. European
Financial Management, Vol. 9(No. 1), pp. 11-24.
Standard & Poor's, 2009. Standard & Poor's. [Online]
Available at:
http://www.standardandpoors.com/servlet/BlobServer?blobheadername3=MDT-
Type&blobcol=urldata&blobtable=MungoBlobs&blobheadervalue2=inline%3B+filen
ame%3DMethdology_SP_CS_Home_Price_Indices_Web.pdf&blobheadername2=Co
ntent-Disposition&blobheadervalue1=applica
[Accessed 23 June 2012].
Standard & Poor's, 2011. Standard & Poors. [Online]
Available at:
http://www.standardandpoors.com/servlet/BlobServer?blobheadername3=MDT-
Type&blobcol=urldata&blobtable=MungoBlobs&blobheadervalue2=inline%3B+filen
ame%3Dfs-sp-case-shiller-home-price-indices-ltr.pdf&blobheadername2=Content-
Disposition&blobheadervalue1=appli
[Accessed 23 June 2012].

43
Standard & Poor's, 2012. Standard & Poor's. [Online]
Available at:
http://www.standardandpoors.com/servlet/BlobServer?blobheadername3=MDT-
Type&blobcol=urldocumentfile&blobtable=SPComSecureDocument&blobheadervalu
e2=inline%3B+filename%3Ddownload.pdf&blobheadername2=Content-
Disposition&blobheadervalue1=application%2Fpdf&blo
[Accessed 23 June 2012].
Stiglitz, J. E., 2010. Freefall - America, Free Markets, and the Sinking of the World Economy.
New York: W. W. Norton & Company Ltd..
Sullivan, R. N., 2009. Taming Global Village Risk II: Understanding and Mitigating Bubbles.
The Journal of Portfolio Management, Summer, pp. 131-141.
Summers, P. M., 2005. What Caused The Great Moderation? Some Cross-Country Evidence.
Economic Review, Third Quarter, pp. 5-32.
The Economist, 2005. Monetary Conundrums - America's monetary policy is off target.
[Online]
Available at: http://www.economist.com/node/3695942
[Accessed 10. July 2012].
The Federal Reserve Bank of San Francisco, 2004. U.S. Monetary Policy: An Introduction,
San Francisco: Federal Reserve Bank of San Francisco.
Tirole, J., 1987. Intertemporal efficiency, intergenerational transfers and asset pricing: An
introduction. In: Essays in Honor of Edmond Malivaud, Volume 1: Microeconomics .
Canbridge: MIT Press, pp. 116-142.
United States Government Accountability Office, 2011. Federal Reserve System -
Opportunities Exist to Strengthen Policies and Processes for Managing Emergency
Assistance, s.l.: s.n.
USC, 1., § 225A. Maintenance of long run growth of monetary and credit aggregates.
[Online]
Available at: http://www.law.cornell.edu/uscode/text/12/225a
[Accessed 16 February 2012].
Waller, C. J., 2011. Independence + Accountability: Why the Fed is a Well-Designed Central
Bank. Federal Reserve Bank of St. Louis - Review, September/October, pp. 293-301.

44
Wessel, D., 2009. In Fed We Trust - Ben Bernanke's War on the Great Panic. 1. Edition ed.
New York: Crown Business.
!

!

Paper No. 00, 09/2009Section Blindtexte & Wörter
EditorsVorname NameVorname Name
Imprint
Editors Sigrid Betzelt ! Trevor Evans ! Eckhard Hein ! Hansjörg Herr ! Martin Kronauer ! Birgit Mahnkopf ! Achim Truger
ISSN 1869-6406
Printed by HWR Berlin
Berlin September 2013
www.ipe-berlin.org