G d M i d t d t Good Morning my dear student viewers. I ... - KEA
Upload
independentCategory
view
3download
0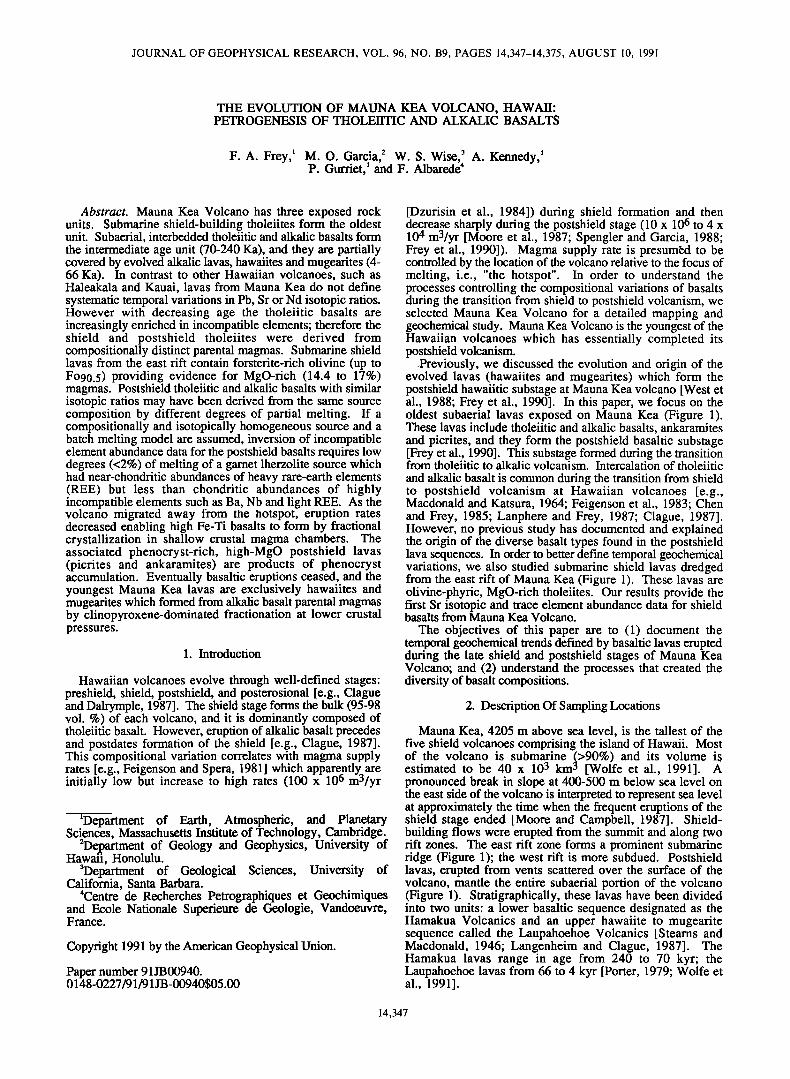
JOURNAL OF GEOPHYSICAL RESEARCH, VOL. 96, NO. B9, PAGES 14,347-14,375, AUGUST 10, 1991
THE EVOLUTION OF MAUNA KEA VOLCANO, HAWAII: PETROGENESIS OF THOLEIITIC AND ALKALIC BASALTS
F. A. Frey, • M. O. Garcia, 2 W. S. Wise, 3 A. Kennedy, • P. Gurriet, • and F. Albarede4
Abstract. Mauna Kea Volcano has three exposed rock units. Submarine shield-building tholeiites form the oldest unit. Subaerial, interbedded tholeiitic and alkalic basalts form the intermediate age unit (70-240 Ka), and they are partially covered by evolved alkalic lavas, hawaiites and mugearites (4- 66 Ka). In contrast to other Hawaiian volcanoes, such as Haleakala and Kauai, lavas from Mauna Kea do not define systematic temporal variations in Pb, Sr or Nd isotopic ratios. However with decreasing age the tholeiitic basalts are increasingly enriched in incompatible elements; therefore the shield and postshield tholeiites were derived from compositionally distinct parental magmas. Submarine shield lavas from the east rift contain forsterite-rich olivine (up to Fo90.5) providing evidence for MgO-rich (14.4 to 17%) magmas. Postshield tholeiitic and alkalic basalts with similar isotopic ratios may have been derived from the same source composition by different degrees of partial melting. If a compositionally and isotopically homogeneous source and a batch melting model are assumed, inversion of incompatible element abundance data for the postshield basalts requires low degrees (<2%) of melting of a garnet lherzolite source which had near-chondritic abundances of heavy rare-earth elements (REE) but less than chondritic abundances of highly incompatible elements such as Ba, Nb and light REE. As the volcano migrated away /¾om the hotspot, eruption rates decreased enabling high Fe-Ti basalts to form by fractional crystallization in shallow crustal magma chambers. The associated phenocryst-rich, high-MgO postshield lavas (picrites and ankaramites) are products of phenocryst accumulation. Eventually basaltic eruptions ceased, and the youngest Mauna Kea lavas are exclusively hawaiites and mugearites which formed from alkalic basalt parental magmas by clinopyroxene-dominated fractionation at lower crustal pressures.
1. Introduction
Hawaiian volcanoes evolve through well-defined stages: preshield, shield, postshield, and posterosional [e.g., Clague and Dalrymple, 1987]. The shield stage forms the bulk (95-98 vol. %) of each volcano, and it is dominantly composed of tholeiitic basalt. However, eruption of alkalic basalt precedes and postdates formation of the shield [e.g., Clague, 1987]. This compositional variation correlates with magma supply rates [e.g., Feigenson and Spera, 1981] which apparently. are initially low but increase to high rates (100 x 106 m3/yr
•Department of Earth, Atmospheric, and Planetary Sciences, Massachusetts Institute of Technology, Cambridge.
2Department of Geology and Geophysics, University of Hawaii, Honolulu.
3Department of Geological Sciences, University of California, Santa Barbara.
4Centre de Recherches Petrographiques et Geochimiques and Ecole Nationale Superieure de Geologie, Vandoeuvre, France.
Copyright 1991 by the American Geophysical Union.
Paper number 91JB00940. 0148-0227/91/91 JB-00940505.00
[Dzurisin et al., 1984]) during shield formation and then decrease sharply during the postshield stage (10 x 106 to 4 x 10⁴ m3/yr [Moore et al., 1987; Spengler and Garcia, 1988; Frey et al., 1990]). Magma supply rate is presumed to be controlled by the location of the volcano relative to the focus of melting, i.e., "the hotspot". In order to understand the processes controlling the compositional variations of basalts during the transition from shield to postshield volcanism, we selected Mauna Kea Volcano for a detailed mapping and geochemical study. Mauna Kea Volcano is the youngest of the Hawaiian volcanoes which has essentially completed its postshield volcanism.
Previously, we discussed the evolution and origin of the evolved lavas (hawaiites and mugearites) which form the postshield hawaiitic substage at Mauna Kea volcano [West et al., 1988; Frey et al., 1990]. In this paper, we focus on the oldest subaerial lavas exposed on Mauna Kea (Figure 1). These lavas include tholeiitic and alkalic basalts, ankaramites and picrites, and they form the postshield basaltic substage [Frey et al., 1990]. This substage formed during the transition from tholeiitic to alkalic volcanism. Intercalation of tholeiitic
and alkalic basalt is common during the transition from shield to postshield volcanism at Hawaiian volcanoes [e.g., Macdonald and Katsura, 1964; Feigenson et al., 1983; Chen and Frey, 1985; Lanphere and Frey, 1987; Clague, 1987]. However, no previous study has documented and explained the origin of the diverse basalt types found in the postshield lava sequences. In order to better define temporal geochemical variations, we also studied submarine shield lavas dredged from the east rift of Mauna Kea (Figure 1). These lavas are olivine-phyric, MgO-rich tholeiites. Our results provide the first Sr isotopic and trace element abundance data for shield basalts from Mauna Kea Volcano.
The objectives of this paper are to (1) document the temporal geochemical trends defined by basaltic lavas erupted during the late shield and postshield stages of Mauna Kea Volcano; and (2) understand the processes that created the diversity of basalt compositions.
2. Description Of Sampling Locations
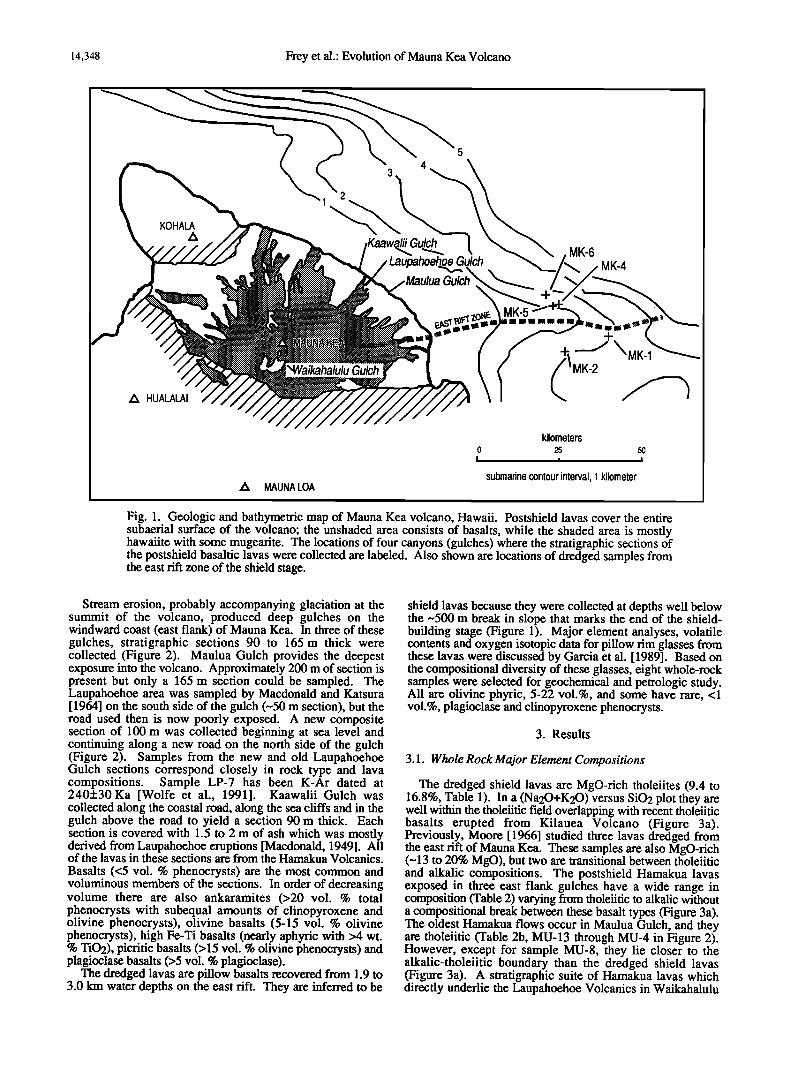
Mauna Kea, 4205 m above sea level, is the tallest of the five shield volcanoes comprising the island of Hawaii. Most of the volcano is submarine (>90%) and its volume is estimated to be 40 x 103 km 3 [Wolfe et al., 1991]. A pronounced break in slope at 400-500 m below sea level on the east side of the volcano is interpreted to represent sea level at approximately the time when the frequent eruptions of the shield stage ended [Moore and Campbell, 1987]. Shield- building flows were erupted from the summit and along two rift zones. The east rift zone forms a prominent submarine ridge (Figure 1); the west rift is more subdued. Postshield lavas, erupted from vents scattered over the surface of the volcano, mantle the entire subaerial portion of the volcano (Figure 1). Stratigraphically, these lavas have been divided into two units: a lower basaltic sequence designated as the Hamakua Volcanics and an upper hawaiite to mugearite sequence called the Laupahoehoe Volcanics [Stearns and Macdonald, 1946; Langenheim and Clague, 1987]. The Hamakua lavas range in age from 240 to 70 kyr; the Laupahoehoe lavas from 66 to 4 kyr [Porter, 1979; Wolfe et al., 1991].
14,347
14,348 Frey et al.: Evolution of Mauna Kea Volcano
, •aulua Gulc
kilometers 0 25 50
submarine contour interval, 1 kilometer MAUNA LOA
Fig. 1. Geologic and bathymetric map of Mauna Kea volcano, Hawaii. Postshield lavas cover the entire subaerial surface of the volcano; the unshaded area consists of basalts, while the shaded area is mostly hawaiite with some mugearite. The locations of four canyons (gulches) where the stratigraphic sections of the postshield basaltic lavas were collected are labeled. Also shown are locations of dredged samples from the east rift zone of the shield stage.
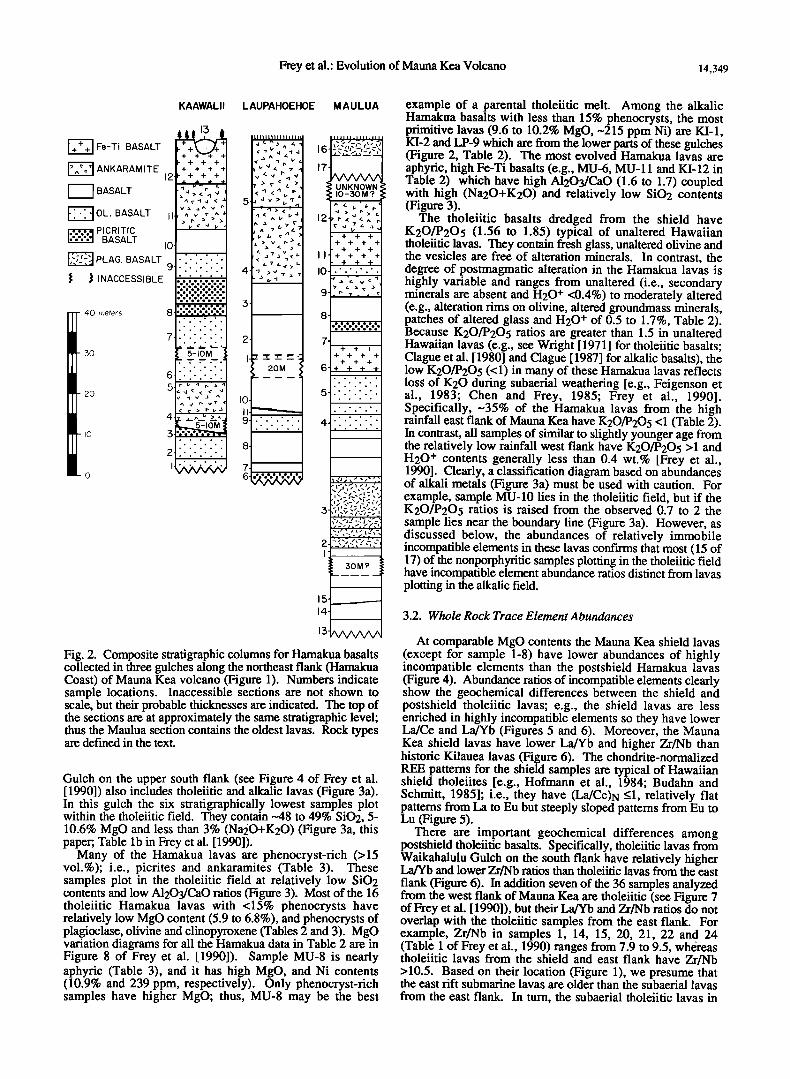
Stream erosion, probably accompanying glaciation at the summit of the volcano, produced deep gulches on the windward coast (east flank) of Mauna Kea. In three of these gulches, stratigraphic sections 90 to 165 m thick were collected (Figure 2). Maulua Gulch provides the deepest exposure into the volcano. Approximately 200 m of section is present but only a 165 m section could be sampled. The Laupahoehoe area was sampled by Macdonald and Katsura [ 1964] on the south side of the gulch (-•50 m section), but the road used then is now poorly exposed. A new composite section of 100 m was collected beginning at sea level and continuing along a new road on the north side of the gulch (Figure 2). Samples from the new and old Laupahoehoe Gulch sections correspond closely in rock type and lava compositions. Sample LP-7 has been K-Ar dated at 240+30 Ka [Wolfe et al., 1991]. Kaawalii Gulch was collected along the coastal road, along the sea cliffs and in the gulch above the road to yield a section 90 m thick. Each section is covered with 1.5 to 2 m of ash which was mostly derived from Laupahoehoe eruptions [Macdonald, 1949]. All of the lavas in these sections are from the Hamakua Volcanics. Basalts (<5 vol. % phenocrysts) are the most common and voluminous members of the sections. In order of decreasing volume there are also ankaramites (>20 vol. % total phenocrysts with subequal amounts of clinopyroxene and olivine phenocrysts), olivine basalts (5-15 vol. % olivine phenocrysts), high Fe-Ti basalts (nearly aphyric with >4 wt. % TiO2), picritic basalts (> 15 vol. % olivine phenocrysts) and plagioclase basalts (>5 vol. % plagioclase).
The dredged lavas are pillow basalts recovered from 1.9 to 3.0 km water depths on the east rift. They are inferred to be
shield lavas because they were collected at depths well below the -500 m break in slope that marks the end of the shield- building stage (Figure 1). Major element analyses, volatile contents and oxygen isotopic data for pillow rim glasses from these lavas were discussed by Garcia et al. [1989]. Based on the compositional diversity of these glasses, eight whole-rock samples were selected for geochemical and petrologic study. All are olivlne phyric, 5-22 vol.%, and some have rare, <1 vol.%, plagioclase and clinopyroxene phenocrysts.
3. Results
3.1. Whole Rock Major Element Compositions
The dredged shield lavas are MgO-rich tholeiites (9.4 to 16.8%, Table 1). In a (Na20+K20) versus SiO2 plot they are well within the tholeiitic field overlapping with recent tholeiitic basalts erupted from Kilauea Volcano (Figure 3a). Previously, Moore [1966] studied three lavas dredged from the east rift of Mauna Kea. These samples are also MgO-rich (--13 to 20% MgO), but two are transitional between tholeiitic and alkalic compositions. The postshield Hamakua lavas exposed in three east flank gulches have a wide range in composition (Table 2) varying from tholeiitic to alkalic without a compositional break between these basalt types (Figure 3a). The oldest Hamakua flows occur in Maulua Gulch, and they are tholeiitic (Table 2b, MU-13 through MU-4 in Figure 2). However, except for sample MU-8, they lie closer to the alkalic-tholeiitic boundary than the dredged shield lavas (Figure 3a). A stratigraphic suite of Hamakua lavas which directly underlie the Laupahoehoe Volcanics in Waikahalulu
Frey et al.- Evolution of Mauna Kea Volcano 14,349
KAAWALII LAUPAHOEHOE MAULUA
I+ + + I Fe-Ti BASALT
I I BASALT
ß i1•10L. BASALT
I::::=:::1 PICRITIC BASALT
z• PLA•. BASALT •, • INACCESSIBLE
40 meters
3O
2O
I- + + + + + +
t- + + +
•4.,,l 4- 4- ß
/• v >•- ß • t,.• ,4 > >
....
ß .
I.e.e.e.e.e.e.ele ....
....
....
....
: .. T T .'" m.'
.... ß
.... ß
eeeeeeee ß ß ß .....
....
.....
....
.....
....
I0'
9-
8
7
6
5
4-
3-
2
I
13-
Fig. 2. Composite stratigraphic columns for Hamakua basalts collected in three gulches along the northeast flank (Hamakua Coast) of Mauna Kea volcano (Figure 1). Numbers indicate sample locations. Inaccessible sections are not shown to scale, but their probable thicknesses are indicated. The top of the sections are at approximately the same stratigraphic level; thus the Maulua section contains the oldest lavas. Rock types are defined in the text.
Gulch on the upper south flank (see Figure 4 of Frey et al. [1990]) also includes tholeiitic and alkalic lavas (Figure 3a). In this gulch the six stratigraphically lowest samples plot within the tholeiitic field. They contain -48 to 49% $iO2, 5- 10.6% MgO and less than 3% (Na20•K20) (Figure 3a, this paper; Table lb in Frey et al. [1990]).
Many of the Hamakua lavas are phenocryst-rich (>15 vol.%); i.e., picrites and ankaramites (Table 3). These samples plot in the tholeiitic field at relatively low SiO2 contents and low AI203/CaO ratios (Figure 3). Most of the 16 tholeiitic Hamakua lavas with <15% phenocrysts have relatively low MgO content (5.9 to 6.8%), and phenocrysts of plagioclase, olivine and clinopyroxene (Tables 2 and 3). MgO variation diagrams for all the Hamakua data in Table 2 are in Figure 8 of Frey et al. [1990]). Sample MU-8 is nearly aphyric (Table 3), and it has high MgO, and Ni contents (10.9% and 239 ppm, respectively). Only phenocryst-rich samples have higher MgO; thus, MU-8 may be the best
example of a parental tholeiitic melt. Among the alkalic Hamakua basalts with less than 15% phenocrysts, the most primitive lavas (9.6 to 10.2% MgO, -215 ppm Ni) are KI-1, KI-2 and LP-9 which are from the lower parts of these gulches (Figure 2, Table 2). The most evolved Hamakua lavas are aphyric, high Fe-Ti basalts (e.g., MU-6, MU-11 and KI-12 in Table 2) which have high AI203/CaO (1.6 to 1.7) coupled with high (Na20+K20) and relatively low $iO2 contents (Figure 3).
The tholeiitic basalts dredged from the shield have K20/P205 (1.56 to 1.85) typical of unaltered Hawaiian tholeiitic lavas. They contain fresh glass, unaltered olivine and the vesicles are free of alteration minerals. In contrast, the degree of postmagmatic alteration in the Hamakua lavas is highly variable and ranges from unaltered (i.e., secondary minerals are absent and H20 + <0.4%) to moderately altered (e.g., alteration rims on olivine, altered groundmass minerals, patches of altered glass and H20 + of 0.5 to 1.7%, Table 2). Because K20/P205 ratios are greater than 1.5 in unaltered Hawaiian lavas (e.g., see Wright [1971] for tholeiitic basalts; Clague et al. [ 1980] and Clague [ 1987] for alkalic basalts), the low K20/P205 (<1) in many of these Hamakua lavas reflects loss of K20 during subaerial weathering [e.g., Feigenson et al., 1983; Chen and Frey, 1985; Frey et at., 1990]. Specifically,-35% of the Hamakua lavas from the high rainfall east flank of Mauna Kea have K20/P205 <1 (Table 2). In contrast, all samples of similar to slightly younger age from the relatively low rainfall west flank have K20/P205 > 1 and H20 + contents generally less than 0.4 wt.% [Frey et al., 1990]. Clearly, a classification diagram based on abundances of alkali metals (Figure 3a) must be used with caution. For example, sample MU-10 lies in the tholeiitic field, but if the K20/P205 ratios is raised from the observed 0.7 to 2 the sample lies near the boundary line (Figure 3a). However, as discussed below, the abundances of relatively immobile incompatible elements in these lavas confh'ms that most (15 of 17) of the nonporphyritic samples plotting in the tholeiitic field have incompatible element abundance ratios distinct from lavas plotting in the alkalic field.
3.2. Whole Rock Trace Element Abundances
At comparable MgO contents the Mauna Kea shield lavas (except for sample 1-8) have lower abundances of highly incompatible elements than the postshield Hamakua lavas (Figure 4). Abundance ratios of incompatible elements clearly show the geochemical differences between the shield and postshield tholeiitic lavas; e.g., the shield lavas are less enriched in highly incompatible elements so they have lower La/Ce and La/Yb (Figures 5 and 6). Moreover, the Mauna Kea shield lavas have lower La/Yb and higher Zr/Nb than historic Kilauea lavas (Figure 6). The chondrite-normalized REE patterns for the shield samples are typical of Hawaiian shield tholeiites [e.g., Hofmann et al., 1984; Budahn and Schmitt, 1985]; i.e., they have (La/Ce)N <1, relatively flat patterns from La to Eu but steeply sloped patterns from Eu to Lu (Figure 5).
There are important geochemical differences among postshield tholeiitic basalts. Specifically, tholeiitic lavas from Waikahalulu Gulch on the south flank have relatively higher La/Yb and lower Zr/Nb ratios than tholeiific lavas from the east flank (Figure 6). In addition seven of the 36 samples analyzed from the west flank of Mauna Kea are tholeiitic (see Figure 7 of Frey et al. [1990]), but their La/Yb and Zr/Nb ratios do not overlap with the tholeiitic samples from the east flank. For example, Zr/Nb in samples 1, 14, 15, 20, 21, 22 and 24 (Table 1 of Frey et al., 1990) ranges from 7.9 to 9.5, whtreas tholeiitic lavas from the shield and east flank have Zr/Nb >10.5. Based on their location (Figure 1), we presume that the east rift submarine lavas are older than the subaerial lavas from the east flank. In turn, the subaerial tholeiitic lavas in
14,350 Frey et al.: Evolution of Mauna Kea Volcano
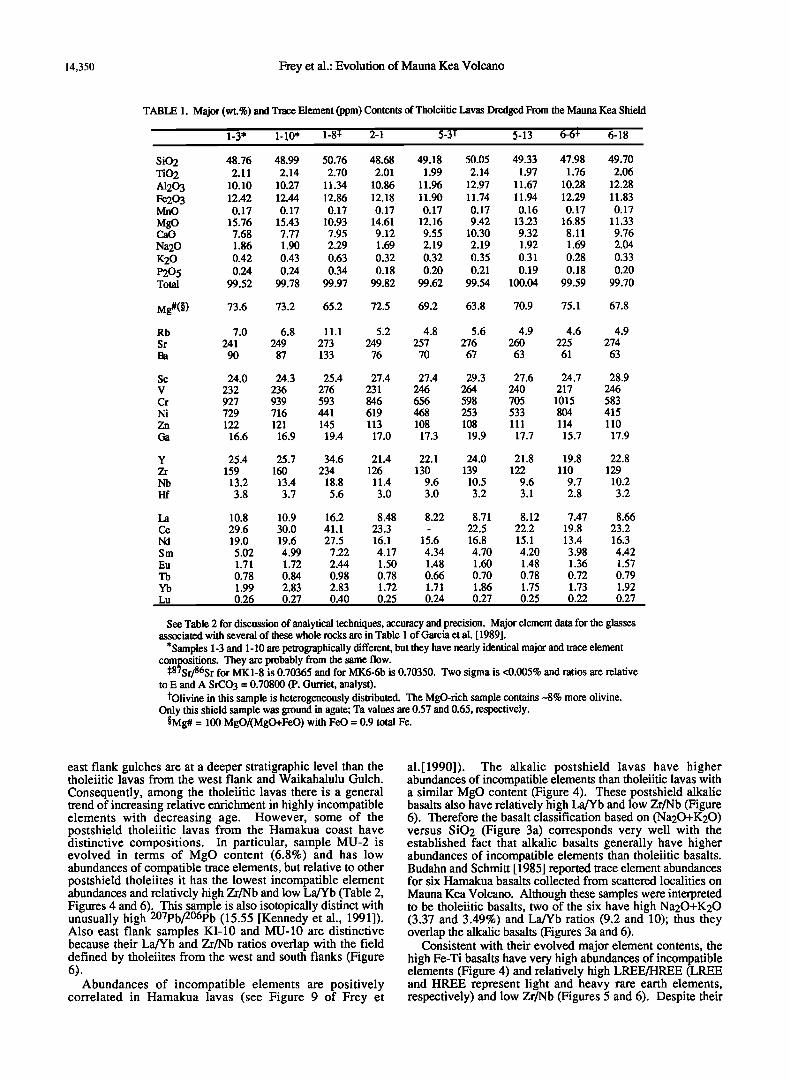
TABLE 1. Major (wt.%) and Trace Element (ppm) Contents of Tholeiitic Lavas Dredged From the Mauna Kea Shield
1-3' !-!0' !-8' 2-1 5-31 5-13 6-65 6-18
SiO2 48.76 48.99 50.76 48.68 49.18 50.05 49.33 47.98 49.70 TiO2 2.11 2.14 2.70 2.01 1.99 2.14 1.97 1.76 2.06 A1203 10.10 10.27 11.34 10.86 11.96 12.97 11.67 10.28 12.28 Fe203 12.42 12.44 12.86 12.18 11.90 11.74 11.94 12.29 11.83 MnO 0.17 0.17 0.17 0.17 0.17 0.17 0.16 0.17 0.17 MgO 15.76 15.43 10.93 14.61 12.16 9.42 13.23 16.85 11.33 CaO 7.68 7.77 7.95 9.12 9.55 10.30 9.32 8.11 9.76 Na20 1.86 1.90 2.29 1.69 2.19 2.19 1.92 1.69 2.04 K20 0.42 0.43 0.63 0.32 0.32 0.35 0.31 0.28 0.33 P205 0.24 0.24 0.34 0.18 0.20 0.21 0.19 0.18 0.20 Total 99.52 99.78 99.97 99.82 99.62 99.54 100.04 99.59 99.70
Mg#(õ) 73.6 73.2 65.2 72.5 69.2 63.8 70.9 75.1 67.8
Rb 7.0 6.8 11.1 5.2 4.8 5.6 4.9 4.6 4.9 Sr 241 249 273 249 257 276 260 225 274 Ba 90 87 133 76 70 67 63 61 63
Sc 24.0 24.3 25.4 27.4 27.4 29.3 27.6 24.7 28.9 V 232 236 276 231 246 264 240 217 246 Cr 927 939 593 846 656 598 705 1015 583 Ni 729 716 441 619 468 253 533 804 415 Zn 122 121 145 113 108 108 111 114 110 Ga 16.6 16.9 19.4 17.0 17.3 19.9 17.7 15.7 17.9
Y 25.4 25.7 34.6 21.4 22.1 24.0 21.8 19.8 22.8 Zr 159 160 234 126 130 139 122 110 129 Nb 13.2 13.4 18.8 11.4 9.6 10.5 9.6 9.7 10.2 Hf 3.8 3.7 5.6 3.0 3.0 3.2 3.1 2.8 3.2
La 10.8 10.9 16.2 8.48 8.22 8.71 8.12 7.47 8.66 Ce 29.6 30.0 41.1 23.3 - 22.5 22.2 19.8 23.2 bid 19.0 19.6 27.5 16.1 15.6 16.8 15.1 13.4 16.3 Sm 5.02 4.99 7.22 4.17 4.34 4.70 4.20 3.98 4.42 Eu 1.71 1.72 2.44 1.50 1.48 1.60 1.48 1.36 1.57 Tb 0.78 0.84 0.98 0.78 0.66 0.70 0.78 0.72 0.79 Yb 1.99 2.83 2.83 1.72 1.71 1.86 1.75 1.73 1.92 Lu 0.26 0.27 0.40 0.25 0.24 0.27 0.25 0.22 0.27
See Table 2 for discussion of analytical techniques, accuracy and precision. Major element data for the glasses associated with several of these whole rocks are in Table 1 of Garcia et al. [1989].
*Samples 1-3 and 1-10 are petrographically different, but they have nearly identical major and trace element compositions. They are probably from the same flow.
$87Sr/86Sr for MK1-8 is 0.70365 and for MK6-6b is 0.70350. Two sigma is <0.005% and ratios are relative to E and A SrCO3 = 0.70800 (P. Gurriet, analyst).
•'Olivine in this sample is heterogeneously distributed. The MgO-fich sample contains -8% more olivine. Only this shield sample was ground in agate; Ta values are 0.57 and 0.65, respectively.
õMg# = 100 MgO/(MgO+FeO) with FeO = 0.9 total Fe.
east flank gulches are at a deeper stratigraphic level than the tholeiitic lavas from the west flank and Waikahalulu Gulch.
Consequently, among the tholeiitic lavas there is a general trend of increasing relative enrichment in highly incompatible elements with decreasing age. However, some of the postshield tholeiitic lavas from the Hamakua coast have distinctive compositions. In particular, sample MU-2 is evolved in terms of MgO content (6.8%) and has low abundances of compatible trace elements, but relative to other postshield tholeiites it has the lowest incompatible element abundances and relatively high Zr/Nb and low La/Yb (Table 2, Figures 4 and 6). This sacple is also isotopically distinct with unusually high 207pb/206pb (15.55 [Kennedy et al., 1991]). Also east flank samples KI-10 and MU-10 are distinctive because their La/Yb and Zr/Nb ratios overlap with the field defined by tholeiites from the west and south flanks (Figure 6.).
Abundances of incompatible elements are positively correlated in Hamakua lavas (see Figure 9 of Frey et
a1.[1990]). The alkalic postshield lavas have higher abundances of incompatible elements than tholeiitic lavas with a similar MgO content (Figure 4). These postshield alkalic basalts also have relatively high La/Yb and low Zr/Nb (Figure 6). Therefore the basalt classification based on (Na20+K20) versus SiO2 (Figure 3a) corresponds very well with the established fact that alkalic basalts generally have higher abundances of incompatible elements than tholeiitic basalts. Budahn and Schmitt [1985] reported trace element abundances for six Hamakua basalts collected from scattered localities on
Mauna Kea Volcano. Although these samples were interpreted to be tholeiitic basalts, two of the six have high Na20+K20 (3.37 and 3.49%) and La/Yb ratios (9.2 and 10); thus they overlap the alkalic basalts (Figures 3a and 6).
Consistent with their evolved major element contents, the high Fe-Ti basalts have very high abundances of incompatible elements (Figure 4) and relatively high LREE/HREE (LREE and HREE represent light and heavy rare earth elements, respectively) and low Zr/Nb (Figures 5 and 6). Despite their
Frey et al.: Evolution of Mauna Kea Volcano 14,351
Hi Fe-Ti
Basalts
Waikahalulu Gulch
X XXX XX
X X
KILAUEA 8
Ankaramites Picrites
Shield
(Dredge)
0 , I , I , I • I , I [ I a I • 44 45 46 47 48 49 50 51 52
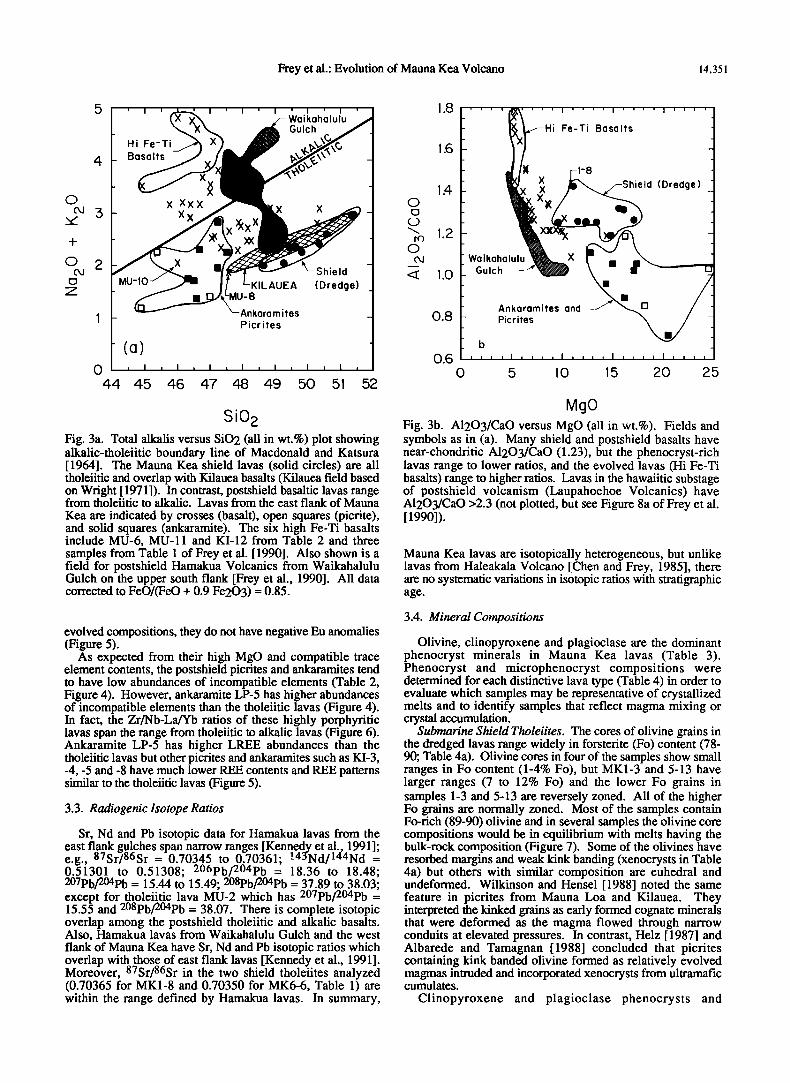
sio 2 Fig. 3a. Total alkalis versus SiO2 (all in wt.%) plot showing alkalic-tholeiitic boundary line of Macdonald and Katsura [1964]. The Mauna Kea shield lavas (solid circles) are all tholeiitic and overlap with Kilauea basalts (Kilauea field based on Wright [1971]). In contrast, postshield basaltic lavas range from tholeiitic to alkalic. Lavas from the east flank of Mauna
Kea are indicated by crosses (basalt), open squares (pierite), and solid squares (ankaramite). The six high Fe-Ti basalts include MU-6, MU-11 and KI-12 from Table 2 and three samples from Table 1 of Frey et al. [ 1990]. Also shown is a field for postshield Hamakua Volcanics from Waikahalulu Gulch on the upper south flank [Frey et al., 1990]. All data corrected to FeO/(FeO + 0.9 Fe203) = 0.85.
evolved compositions, they do not have negative Eu anomalies (Figure 5).
As expected from their high MgO and compatible trace element contents, the postshield pierites and ankaramites tend to have low abundances of incompatible elements (Table 2, Figure 4). However, ankaramite LP-5 has higher abundances of incompatible elements than the tholeiitic lavas (Figure 4). In fact, the Zr/Nb-La/Yb ratios of these highly porphyritic lavas span the range from tholeiitic to alkalic lavas (Figure 6). Ankaramite LP-5 has higher LREE abundances than the tholeiitic lavas but other picrites and ankaramites such as KI-3, -4, -5 and -8 have much lower REE contents and REE patterns similar to the tholeiitic lavas (Figure 5).
3.3. Radiogenic Isotope Ratios
Sr, Nd and Pb isotopic data for Hamakua lavas from the east flank gulches span narrow ranges [Kennedy et al., 1991]; e.g., 87Sr/86Sr = 0.70345 to 0.70361; !4•Nd/144Nd = 0.51301 to 0.51308; 206pb/204pb = 18.36 to 18.48; 207pb/204pb = 15.44 to 15.49; 208pb/204pb = 37.89 to 38.03; except for tholeiitic lava MU-2 which has 207pb/204pb = 15.55 and 208pb/204pb = 38.07. There is complete isotopic overlap among the postshield tholeiitic and alkalic basalts. Also, Hamakua lavas from Waikahalulu Gulch and the west flank of Mauna Kea have Sr, Nd and Pb isotopic ratios which overlap with those of east flank lavas [Kennedy et al., 1991]. Moreover, 87Sr/86Sr in the two shield tholeiites analyzed (0.70365 for MK1-8 and 0.70350 for MK6-6, Table 1) are within the range defined by Hamakua lavas. In summary,
1.8
1.6
1.4
1.2
1.o
0.8
0.6
rl-s l•_.J._ X,, • /-Shield (Dredge) '
W•ikahalulu ••.X •" . .•..• •
Gulch • -- I- • L ß -
Ankararnites and Picrites
, I , , I .... I , , , , I , , , , , , , , I
0 5 10 15 20 25
MgO Fig. 3b. A1203/CaO versus MgO (all in wt.%). Fields and symbols as in (a). Many shield and postshield basalts have near-chondritic A1203/CaO (1.23), but the phenocryst-rich lavas range to lower ratios, and the evolved lavas (Hi Fe-Ti basalts) range to higher ratios. Lavas in the hawaiitic substage of postshield volcanism (Laupahoehoe Volcanics) have A1203/CaO >2.3 (not plotted, but see Figure 8a of Frey et al. [1990]).
Mauna Kea lavas are isotopically heterogeneous, but unlike lavas from Haleakala Volcano [Chen and Frey, 1985], there are no systematic variations in isotopic ratios with stratigraphic age.
3.4. Mineral Compositions
Olivine, clinopyroxene and plagioclase are the dominant phenocryst minerals in Mauna Kea lavas (Table 3). Phenocryst and microphenocryst compositions were determined for each distinctive lava type (Table 4) in order to evaluate which samples may be representative of crystallized melts and to identify samples that reflect magma mixing or crystal accumulation.
Submarine Shield Tholeiites. The cores of olivine grains in the dredged lavas range widely in forsterire (Fo) content (78- 90; Table 4a). Olivine cores in four of the samples show small ranges in Fo content (1-4% Fo), but MK1-3 and 5-13 have larger ranges (7 to 12% Fo) and the lower Fo grains in samples 1-3 and 5-13 are reversely zoned. All of the higher Fo grains are normally zoned. Most of the samples contain Fo-rich (89-90) olivine and in several samples the olivine core compositions would be in equilibrium with melts having the bulk-rock composition (Figure 7). Some of the olivines have resorbed margins and weak kink banding (xenocrysts in Table 4a) but others with similar composition are euhedral and undeformed. Wilkinson and Hensel [1988] noted the same feature in picrites from Mauna Loa and Kilauea. They interpreted the kinked grains as early formed cognate minerals that were deformed as the magma flowed through narrow conduits at elevated pressures. In contrast, Helz [1987] and Albarede and Tamagnan [1988] concluded that picrites containing kink banded olivine formed as relatively evolved magrnas intruded and incorporated xenocrysts from ultramafic cumulates.
Clinopyroxene and plagioclase phenocrysts and

14,352 Frey et al.: Evolution of Mauna Kea Volcano
TABLE 2a. Major (wt%) and Trace Element (ppm) Contents of Hamakua Lavas From the Hamakua Coast of Mauna Kea Volcano: Laupahoehoe Gulch
Lav a Type ... Picrite Alkalic Tholeiitic Alkali½ Tholeiitic Anl•ar, aplite• A!kalic Tholeiitic
6 7 8 C-77 9 10 11 1 2 3 4 C-76 5 C-75 C-74
SiO2 44.43 TiO2 2.53 AI20 3 10.47 Fe203 14.34 MnO 0.19
MgO 15.90 CaO 8.82
Na20(*) 1.74 Na20(t) 1.91 K20 0.32 P205 0.31 Total 99.22
Mg# 68.7 H2 O+ 0.43
Rb 1.7 Sr 382
Ba 179
Sc 25.1
V 205 Cr 984 Co 80 Ni 615 Zn 121 Ga 18
Y 23 Zr 194 Nb 17.4 Hf 4.4 Ta 0.93 Th 0.6
La 14.9 Ce 36.7
Nd 22.3 $m 5.76 Eu 2.11 Tb 0.91
Ho 0.9 Yb 1.63
Lu 0.25
47.62 46.58 46.72 45.56 47.64 3.17 3.17 3.22 3.20 3.06
13.34 13.20 14.74 12.97 14.44 13.56 13.80 13.63 14.00 13.67
0.19 0.19 0.18 0.19 0.18 7.77 8.55 7.97 9.66 6.87 9.73 9.92 10.15 10.74 10.11 3.13 3.17 2.53 2.85 2.67
3.01 2.86 2.69 2.45 2.52
1.05 0.92 0.80 0.72 0.17 0.50 0.48 0.33 0.38 0.33
99.94 99.67 100.28 99.87 99.14
53.2 55.1 53.7 57.8 49.9 0.81 0.32 0.51 0.30 0.44
49.46 45.97 47.72 49.37 47.16 46.40 46.72 45.43 46.62 3.02 3.26 3.17 2.93 2.31 2.14 2.83 3.06 3.12
13.43 13.82 14.60 13.24 10.32 11.16 10.66 13.58 14.93 13.58 14.00 14.20 13.20 12.89 12.67 14.40 13.99 14.45 0.19 0.20 0.19 0.17 0.18 0.17 0.20 0.18 0.19 6.05 8.49 6.62 6.61 14.20 14.95 12.57 10.08 6.81
10.30 10.35 10.84 10.68 10.79 10.55 9.62 10.67 11.38 2.51 2.74 2.44 2.32 1.84 1.51 2.20 2.25 2.26
2.44 2.57 2.24 2.23 1.77 1.73 2.09 2.34 2.33
0.60 0.55 0.19 0.54 0.45 0.56 0.71 0.81 0.20 0.32 0.49 0.34 0.30 0.25 0.18 0.34 0.26 0.25
99.41 99.70 100.11 99.27 100 32 100.29 100.14 100.31 100.21
46.9 54.6 48.0 49.8 68.6 70.0 63.40 58.8 48.3 0.14 0.70 0.82 0.38 0.16 0.30 0.30 0.67 0.67
16.7 8.4 10.5 10.9 0.6 10.2 5.8 0.9 9.0 7.0 6.9 12.8 9.2 0.8 485 505 493 496 425 409 562 433 396 356 360 452 477 451 294 307 243 226 186 177 313 155 177 163 170 259 224 119
27.0 27.4 27.0 30.7 32.1+.1 29.6 28.1+.1 31.3 31.6+.6 32.2 32.3 27.8 30.7 32.9 235 227 250 261 285 278 263 301 260 253 227 240 258 313 298 338 252 420 109+1 58 338+4 85 221+13 1180 1180 918 430 64
51 54 52 61 49.1+0.1 47 53+1 49 46.8+.8 69 71 68 61 51 163 190 172 216 81 67 181 75 92 409 425 344 234 78 133 119 110 116 131 128 135 126 111 111 97 104 116 134 23 23 24 23 24 22 24 23 23 17 18 20 22 24
39 37 31 29 29 30 39 30 29 21 21 25 29 31 347 313 240 236 202 206 347 211 190 162 152 216 226 212
31.9 29.0 22.5 23.0 16.2 18.0 32.0 17.8 15.9 16.4 15.3 23.5 23.0 18.0 7.7 6.9 5.7 5.6 4.78+.04 4.9 7.5+. 1 4.7 4.6+.2 3.7 3.6 4.8 5.1 5.1 1.74 1.53 1.36 1.31 1.01+.01 0.95 1.67+.08 1.11 0.95+.04 0.90 0.98 1.38 1.39 1.08 1.9 1.5 1.4 1.1 0.9 0.9 2.0+. 1 0.6 0.8 0.6 0.6 0.9 1.4 1.0
28.! 25.9 21.1 20.6 15.0+.1 15.2 27.7+.1 15.1 14.5+.6 13.8 13.3 19.2 19.4 16.0 66.8 63.3 52.8 48.6 38.0+.04 37.7 66.3+.1 37.1 36.3+.1 35.2 34.2 45.0 49.1 40.6 38.5 36.7 31.6 28.9 25.0+.03 24.2 38.5+. 1 25.1 23.0+. 1 20.8 20.1 25.4 28.9 26.1
9.50 9.22 7.94 7.47 6.55+.20 6.64 9.71+.1 6.76 6.4+.3 5.09 5.10 6.25 7.21 6.96 3.31 3.15 2.76 2.69 2.43+.01 2.42 3.31+.04 2.45 2.32+.03 1.87 1.79 2.27 2.57 2.53 1.43 1.54 1.13 0.99 1.10+.15 0.96 1.31+.16 1.01 0.94+.08 0.67 0.82 0.97 1.12 1.11 1.5 1.1 0.9 1.0 1.05+.01 1.0 1.5+.1 0.9 0.99+.09 0.7 0.6 0.8 1.1 1.1 3.03 2.86 2.34 2.31 2.25+.03 2.37 2.95+.06 2.31 2.13+.02 1.64 1.54 1.89 2.10 2.48 0.38 0.37 0.32 0.31 0.31+.01 0.32 0.40+.01 0.33 0.29+.01 0.21 0.23 0.28 0.29 0.36
Samples in each gulch are in stratigraphic order, oldest to youngest (Figure 2). For Tables 1 and 2, major abundances of Rb, Sr, Ba, V, Ni, Zn, Ga, Y, Zr and Nb are means of duplicate analyses determined by X ray fluorescence at the University of Massachusetts (J.M. Rhodes, supervisor). Abundances of Sc, Cr, Co, REE, Hf, Ta and Th were analyzed by instrumental neutron activation analysis at the Massachuseus Institute of Technology (P. Ila, supervisor). Means of duplicate analyses are indicated for LP-10, LP-1, LP-3, MU-6, MU-17 and KI-9. Evaluations of precision and accurac 3, are in Table l d of Frey et al. [1990]. In addition, sample C-74 was analyzed by neutron activation by Budahn and Schmill [1985]. Most of their data are within 5% of our values, and all data agree within 10%. Major element data for "C" samples in Table 2c are from Macdonald and Katsura [1964], recalculated to be anhydrous and oxidized. Mg # = 100 MgO/(MgO+FeO*) on a molar basis with all Fe20 3 converted to FeO.
*Na20 determined by X-ray fluorescence. tNa20 determined by neutron activation.
microphenocrysts are rare in these shield lavas (Table 3). Clinopyroxene compositions are typical for tholeiitic lavas (i.e., low abundances of TiO2, A1203, CaO and Na20 but high SiO2; Table 4b). Plagioclase microphenocrysts are labradorites (An58-67; Table 4c). The low An grain from sample 1-8 is partially resorbed. The CaO/Na20 partition coefficients (i.e., KD for plagioclase/glass and plagioclase/whole-rock) are low (0.71-0.80). In anhydrous experimental systems this KD is -•1 at low pressure and increases with increasing pressure [e.g. Juster et al., 1989].
Hamakua Tholeiitic Basalts. Sample MU-8 may be the most magnesian postshield tholeiitic lava that is unambiguously a crystallized melt. The relatively MgO-rich nature of the melt is reflected by the rare magnesian olivine (Fo85.6) and clinopyroxene phenocrysts (Tables 4a and 4b).
Olivine microphenocryst whole rock Fe/Mg ratios yield a KD -•0.30_+.03 (Figure 7) which is consistent with the hypothesis that the bulk rock composition represents a melt composition. Sample MU-2 is an evolved (6.6% MgO) but compositionally distinctive tholeiite. Phenocryst core compositions (Fo79) are too forsteritic for the bulk rock composition (Figure 7). Therefore, the bulk rock composition is not representative of a melt composition. The olivine microphenocrysts are less magnesian (Fo61-69) and apparently reflect equilibrium with highly evolved residual melt.
Hamakua Alkalic Basalts. Sample LP-9 is MgO-rich (9.66%) and contains <2% phenocrysts (Table 3). The cores of the normally zoned olivine phenocrysts have compositions (Fo84) which are consistent with crystallization from a melt having the Fe/Mg ratio of the bulk rock (Figure 7).
Frey et al.: Evolution of Mauna Kea Volcano 14,353
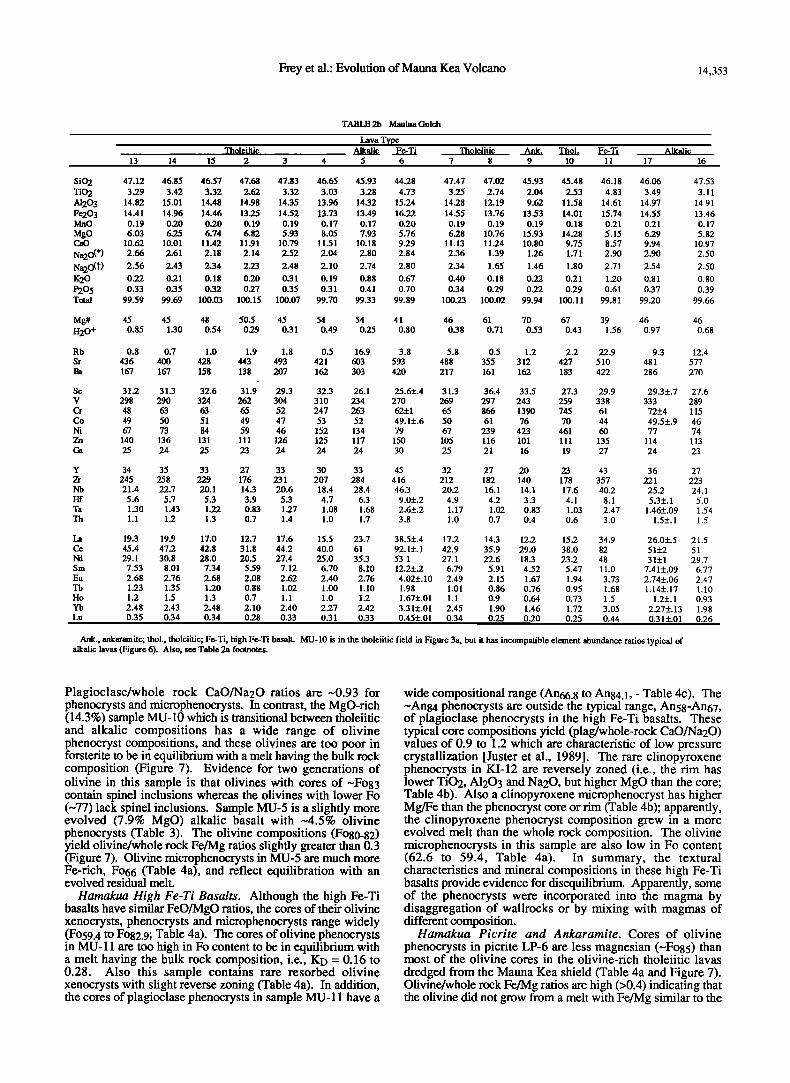
TABLE 2b Maulua Gulch
Lava Type Thol½iiti, Alkalic Fe-Ti Tholeiitic Ank. Thol. Fe-Ti Alkalic
13 14 15 2 3 4 5 6 7 8 9 10 11 17 16
SiO 2 47.12 46.85 46.57 47.68 47.83 46.65 45.93 44.28 47.47 47.02 45.93 45.48 46.18 46.06 47.53 TiO 2 3.29 3.42 3.32 2.62 3.32 3.03 3.28 4.73 3.25 2.74 2.04 2.53 4.83 3.49 3.11 AI203 14.82 15.01 14.48 14.98 14.35 13.96 14.32 15.24 14.28 12.19 9.62 11.58 14.61 14.97 14.91 Fe20 3 14.41 14.96 14.46 13.25 14.52 13.73 13.49 16.22 14.55 13.76 13.53 14.01 15.74 14.55 13.46 MnO 0.19 0.20 0.20 0.19 0.19 0.17 0.17 0.20 0.19 0.19 0.19 0.18 0.21 0.21 0.17
MgO 6.03 6.25 6.74 6.82 5.93 8.05 7.93 5.76 6.28 10.76 15.93 14.28 5.15 6.29 5.82 CaO 10.62 10.01 11.42 11.91 10.79 11.51 10.18 9.29 11.13 11.24 10.80 9.75 8.57 9.94 10.97
Na20(*) 2.66 2.61 2.18 2.14 2.52 2.04 2.80 2.84 2.36 1.39 1.26 1.71 2.90 2.90 2.50 Na20('D 2.56 2.43 2.34 2.23 2.48 2.10 2.74 2.80 2.34 1.65 1.46 1.80 2.71 2.54 2.50 K20 0.22 0.21 0.18 0.20 0.31 0.19 0.88 0.67 0.40 0.18 0.22 0.21 1.20 0.81 0.80 P205 0.33 0.35 0.32 0.27 0.35 0.31 0.41 0.70 0.34 0.29 0.22 0.29 0.61 0.37 0.39 Total 99.59 99.69 100.03 100.15 100.07 99.70 99.33 99.89 100.23 100.02 99.94 100.11 99.81 99.20 99.66
Mg# 45 45 48 50.5 45 54 54 41 46 61 70 67 39 46 46 H20+ 0.85 1.30 0.54 0.29 0.31 0.49 0.25 0.80 0.38 0.71 0.53 0.43 1.56 0.97 0.68
Rb 0.8 0.7 1.0 1.9 1.8 0.5 16.9 3.8 5.8 0.5 1.2 2.2 22.9 9.3 12.4 Sr 436 400 428 443 493 421 603 593 488 355 312 427 510 481 577 Ba 167 167 158 138 207 162 303 420 217 161 162 183 422 286 270
Sc 31.2 31.3 32.6 31.9 29.3 32.3 26.1 25.6+.4 31.3 36.4 33.5 27.3 29.9 29.3 +.7 27.6 V 298 290 324 262 304 310 234 270 269 297 243 259 338 333 289 Cr 48 63 63 65 52 247 263 62+1 65 866 1390 745 61 72+4 115 Co 49 50 51 49 47 53 52 49.1+.6 50 61 76 70 44 49.5+.9 46 Ni 67 73 84 59 46 152 134 79 67 239 423 461 60 77 74 Zn 140 136 131 111 126 125 117 150 105 116 101 111 135 114 113 Ga 25 24 25 23 24 24 24 30 25 21 16 19 27 24 23
Y 34 35 33 27 33 30 33 45 32 27 20 23 43 36 27 Zr 245 258 229 176 231 207 284 416 212 182 140 178 357 221 223 Nb 21.4 22.7 20.1 14.3 20.6 18.4 28.4 46.3 20.2 16.1 14.1 17.6 40.2 25.2 24.1 Hf 5.6 5.7 5.3 3.9 5.3 4.7 6.3 9.0+.2 4.9 4.2 3.3 4.1 8.1 5.3 +. 1 5.0 Ta 1.30 1.43 1.22 0.83 1.27 1.08 1.68 2.6+.2 1.17 1.02 0.83 1.03 2.47 1.46+.09 1.54 Th 1.1 1.2 1.3 0.7 1.4 1.0 1.7 3.8 1.0 0.7 0.4 0.6 3.0 1.5+. 1 1.5
La 19.3 19.9 17.0 12.7 17.6 15.5 23.7 38.5+.4 17.2 14.3 12.2 15.2 34.9 26.0+.5 21.5 Ce 45.4 47.2 42.8 31.8 44.2 40.0 61 92.1+.1 42.9 35.9 29.0 38.0 82 51+_2 51 Nd 29.1 30.8 28.0 20.5 27.4 25.0 35.3 53 1 27.1 22.6 18.3 23.2 48 31+1 29.7 Sm 7.53 8.01 7.34 5.59 7.12 6.70 8.10 12.2+.2 6.79 5.91 4.52 5.47 11.0 7.41+.09 6.77 Eu 2.68 2.76 2.68 2.08 2.62 2.40 2.76 4.02+. 10 2.49 2.15 1.67 1.94 3.73 2.74+.06 2.47 Tb 1.23 1.35 1.20 0.88 1.02 1.00 1.10 1.98 1.01 0.86 0.76 0.95 1.68 1.14+. 17 1.10 Ho 1.2 1.5 1.3 0.7 1.1 1.0 1.2 1.67+.01 1.1 0.9 0.64 0.73 1.5 1.2+. 1 0.93 Yb 2.48 2.43 2.48 2.10 2.40 2.27 2.42 3.31+.01 2.45 1.90 1.46 1.72 3.05 2.27+. 13 1.98 Lu 0.35 0.34 0.34 0.28 0.33 0.31 0.33 0.45+.01 0.34 0.25 0.20 0.25 0.44 0.31 +.01 0.26
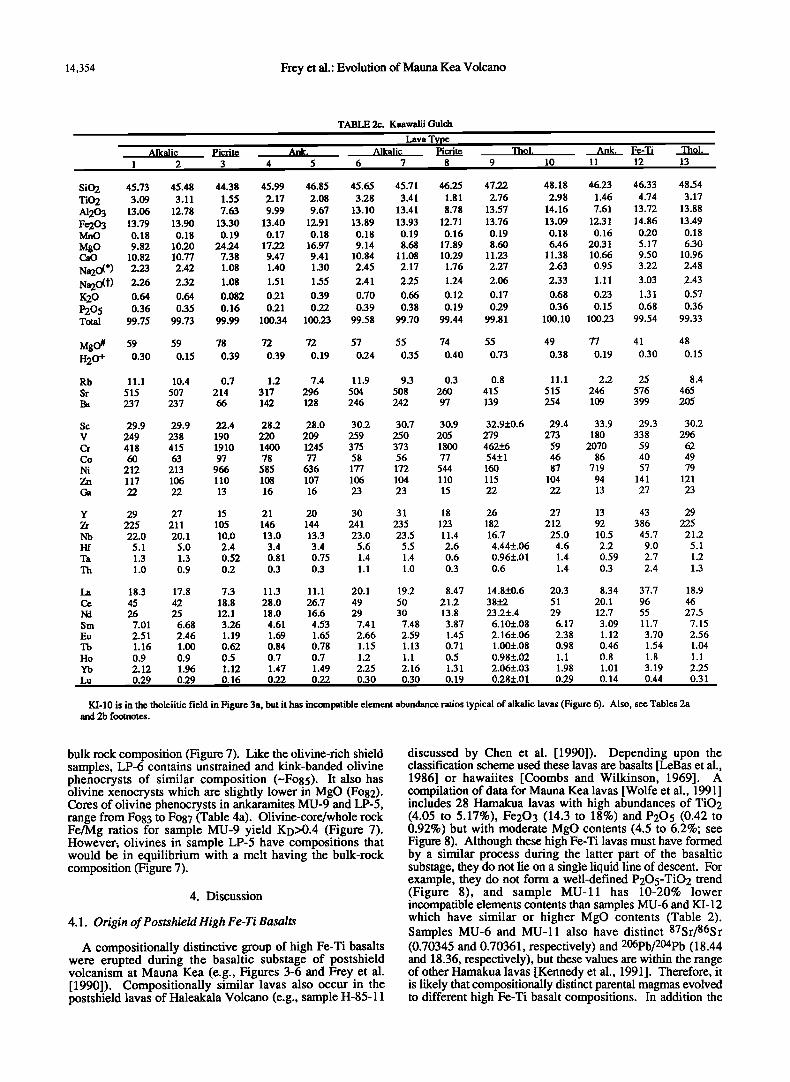
Ank., ankaramite; thol., tholeiitic; Fe-Ti, high Fe-Ti basalt. MU-10 is in the tholeiitic field in Figure 3a, but it has incompatible element abundance ratios typical of alkalic lavas (Figure 6). Also, see Table 2a footnotes.
Plagioclase/whole rock CaO/Na20 ratios are N0.93 for phenocrysts and microphenocrysts. In contrast, the MgO-rich (14.3%) sample MU-10 which is transitional between tholeiitic and alkalic compositions has a wide range of olivine phenocryst compositions, and these olivines are too poor in forsterite to be in equilibrium with a melt having the bulk rock composition (Figure 7). Evidence for two generations of olivine in this sample is that olivines with cores of NFo83 contain spinel inclusions whereas the olivines with lower Fo (-77) lack spinel inclusions. Sample MU-5 is a slightly more evolved (7.9% MgO) alkalic basalt with-4.5% olivine phenocrysts (Table 3). The olivine compositions (Fo80-82) yield olivine/whole rock Fe/Mg ratios slightly greater than 0.3 (Figure 7). Olivine microphenocrysts in MU-5 are much more Fe-rich, Fo66 (Table 4a), and reflect equilibration with an evolved residual melt.
Hamakua High Fe-Ti Basalts. Although the high Fe-Ti basalts have similar FeO/MgO ratios, the cores of their olivine xenocrysts, phenocrysts and microphenocrysts range widely (Fo59.4 to Fo82.9; Table 4a). The cores of olivine phenocrysts in MU-11 are too high in Fo content to be in equilibrium with a melt having the bulk rock composition, i.e., KD = 0.16 to 0.28. Also this sample contains rare resorbed olivine xenocrysts with slight reverse zoning (Table 4a). In addition, the cores of plagioclase phenocrysts in sample MU-11 have a
wide compositional range (An66.8 to An84.1, - Table 4c). The •'An84 phenocrysts are outside the typical range, An58-An67, of plagioclase phenocrysts in the high Fe-Ti basalts. These typical core compositions yield (plag/whole-rock CaO/Na20) values of 0.9 to 1.2 which are characteristic of low pressure crystallization [Juster et al., 1989]. The rare clinopyroxene phenocrysts in KI-12 are reversely zoned (i.e., the rim has lower TiO2, A1203 and Na20, but higher MgO than the core; Table 4b). Also a clinopyroxene microphenocryst has higher Mg/Fe than the phenocryst core or rim (Table 4b); apparently, the clinopyroxene phenocryst composition grew in a more evolved melt than the whole rock composition. The olivine microphenocrysts in this sample are also low in Fo content (62.6 to 59.4, Table 4a). In summary, the textural characteristics and mineral compositions in these high Fe-Ti basalts provide evidence for disequilibrium. Apparently, some of the phenocrysts were incorporated into the magma by disaggregation of wallrocks or by mixing with magmas of different composition.
Hamakua Picrite and Ankaramite. Cores of olivine
phenocrysts in picrite LP-6 are less magnesian (-•Fo85) than most of the olivine cores in the olibine-rich tholeiitic lavas
dredged from the Mauna Kea shield (Table 4a and Figure 7). Olivine/whole rock Fe/Mg ratios are high (>0.4) indicating that the olivine did not grow from a melt with Fe/Mg similar to the
14,354 Frey et al.: Evolution of Mauna Kea Volcano
TABLE 2c. Kaawalii Gulch
Lava Type A!kalic Picrite Ank. Alkalic Pictitc Thol. Ank. Fe-Ti
1 2 3 4 5 6 7 8 9 10 11 12
SiO 2 45.73 45.48 44.38 45.99 46.85 45.65 45.71 46.25 47.22 48.18 46.23 46.33 TiO 2 3.09 3.11 1.55 2.17 2.08 3.28 3.41 1.81 2.76 2.98 1.46 4.74 AI20 3 13.06 12.78 7.63 9.99 9.67 13.10 13.41 8.78 13.57 14.16 7.61 13.72 Fe20 3 13.79 13.90 13.30 13.40 12.91 13.89 13.93 12.71 13.76 13.09 12.31 14.86 MnO 0.18 0.18 0.19 0.17 0.18 0.18 0.19 0.16 0.19 0.18 0.16 0.20 MgO 9.82 10.20 24.24 17.22 16.97 9.14 8.68 17.89 8.60 6.46 20.31 5.17 CaO 10.82 10.77 7.38 9.47 9.41 10.84 11.08 10.29 11.23 11.38 10.66 9.50 Na20(*) 2.23 2.42 1.08 1.40 1.30 2.45 2.17 1.76 2.27 2.63 0.95 3.22 Na20('D 2.26 2.32 1.08 1.51 1.55 2.41 2.25 1.24 2.06 2.33 1.11 3.03 K20 0.64 0.64 0.082 0.21 0.39 0.70 0.66 0.12 0.17 0.68 0.23 1.31 P205 0.36 0.35 0.16 0.21 0.22 0.39 0.38 0.19 0.29 0.36 0.15 0.68 Total 99.75 99.73 99.99 100.34 100.23 99.58 99.70 99.44 99.81 100.10 100.23 99.54
MgO # 59 59 78 72 72 57 55 74 55 49 77 41 H20+ 0.30 0.15 0.39 0.39 0.19 0.24 0.35 0.40 0.73 0.38 0.19 0.30 Rb 11.1 10.4 0.7 1.2 7.4 11.9 9.3 0.3 0.8 11.1 2.2 25 Sr 515 507 214 317 296 504 508 260 415 515 246 576 Ba 237 237 66 142 128 246 242 97 139 254 109 399
Sc 29.9 29.9 22.4 28.2 28.0 30.2 30.7 30.9 32.9+0.6 29.4 33.9 29.3 V 249 23 8 190 220 209 259 250 205 279 273 180 338 Cr 418 415 1910 1400 1245 375 373 1800 462_+6 59 2070 59 Co 60 63 97 78 77 58 56 77 54+1 46 86 40 Ni 212 213 966 585 636 177 172 544 160 87 719 57 Zn 117 106 110 108 107 106 104 110 115 104 94 141 Ga 22 22 13 16 16 23 23 15 22 22 13 27
Y 29 27 15 21 20 30 31 18 26 27 13 43 Zr 225 211 105 146 144 241 235 123 182 212 92 386 Nb 22.0 20.1 10.0 13.0 13.3 23.0 23.5 11.4 16.7 25.0 10.5 45.7 Hf 5.1 5.0 2.4 3.4 3.4 5.6 5.5 2.6 4.44+.06 4.6 2.2 9.0 Ta 1.3 1.3 0.52 0.81 0.75 1.4 1.4 0.6 0.96+.01 1.4 0.59 2.7 Th 1.0 0.9 0.2 0.3 0.3 1.1 1.0 0.3 0.6 1.4 0.3 2.4
la 18.3 17.8 7.3 11.3 11.1 20.1 19.2 8.47 14.8+0.6 20.3 8.34 37.7 Ce 45 42 18.8 28.0 26.7 49 50 21.2 38+_2 51 20.1 96 Nd 26 25 12.1 18.0 16.6 29 30 13.8 23.2+.4 29 12.7 55 Sm 7.01 6.68 3.26 4.61 4.53 7.41 7.48 3.87 6.10+.08 6.17 3.09 11.7 Eu 2.51 2.46 1.19 1.69 1.65 2.66 2.59 1.45 2.16+.06 2.38 1.12 3.70 Tb 1.16 1.00 0.62 0.84 0.78 1.15 1.13 0.71 1.00+.08 0.98 0.46 1.54 Ho 0.9 0.9 0.5 0.7 0.7 1.2 1.1 0.5 0.98+.02 1.1 0.8 1.8 Yb 2.12 1.96 1.12 1.47 1.49 2.25 2.16 1.31 2.06+.03 1.98 1.01 3.19 Lu 0.29 0.29 0.16 0.22 0.22 0.30 0.30 0.19 0.28+.01 0.29 0.14 0.44
48.54
3.17
13.88
13.49
0.18
6.30
10.96 2.48
2.43
0.57
0.36
99.33
48
0.15
8.4
465 205
30.2
296 62 49 79
121
23
29 225
21.2 5.1
1.2
1.3
18.9 46
27.5 7.15 2.56 1.04
1.1
2.25 0.31
KI-10 is in the tholeiitic field in Figure 3a, but it has incompatible element abundance ratios typical of alkalic lavas (Figure 6). Also, see Tables 2a and 2b footnotes.
bulk rock composition (Figure 7). Like the olivine-rich shield samples, LP-6 contains unstrained and kink-banded olivine phenocrysts of similar composition (-•Fo85). It also has olivine xenocrysts which are slightly lower in MgO (Fo82). Cores of olivine phenocrysts in ankaramites MU-9 and LP-5, range from Fo83 to Fo87 (Table 4a). Olivine-core/whole rock Fe/Mg ratios for sample MU-9 yield KD>0.4 (Figure 7). However; olivines in sample LP-5 have compositions that would be in equilibrium with a melt having the bulk-rock composition (Figure 7).
4. Discussion
4.1. Origin of Postshield High Fe-Ti Basalts
A compositionally distinctive group of high Fe-Ti basalts were erupted during the basaltic substage of postshield volcanism at Mauna Kea (e.g., Figures 3-6 and Frey et al. [1990]). Compositionally similar lavas also occur in the postshield lavas of Haleakala Volcano (e.g., sample H-85-11
discussed by Chen et al. [1990]). Depending upon the classification scheme used these lavas are basalts [LeBas et al., 1986] or hawaiites [Coombs and Wilkinson, 1969]. A compilation of data for Mauna Kea lavas [Wolfe et al., 1991] includes 28 Hamakua lavas with high abundances of TiO2 (4.05 to 5.17%), Fe203 (14.3 to 18%) and P205 (0.42 to 0.92%) but with moderate MgO contents (4.5 to 6.2%; see Figure 8). Although these high Fe-Ti lavas must have formed by a similar process during the latter part of the basaltic substage, they do not lie on a single liquid line of descent. For example, they do not form a well-defined P205-TiO2 trend (Figure 8), and sample MU-11 has 10-20% lower incompatible elements contents than samples MU-6 and KI-12 which have similar or higher MgO contents (Table 2). Samples MU-6 and MU-11 also have distinct 87Sr/86Sr (0.70345 and 0.70361, respectively) and 206pb/204pb (18.44 and 18.36, respectively), but these values are within the range of other Hamakua lavas [Kennedy et al., 1991]. Therefore, it is likely that compositionally distinct parental magmas evolved to different high Fe-Ti basalt compositions. In addition the
Frey et al.' Evolution of Mauna Kea Volcano 14,355
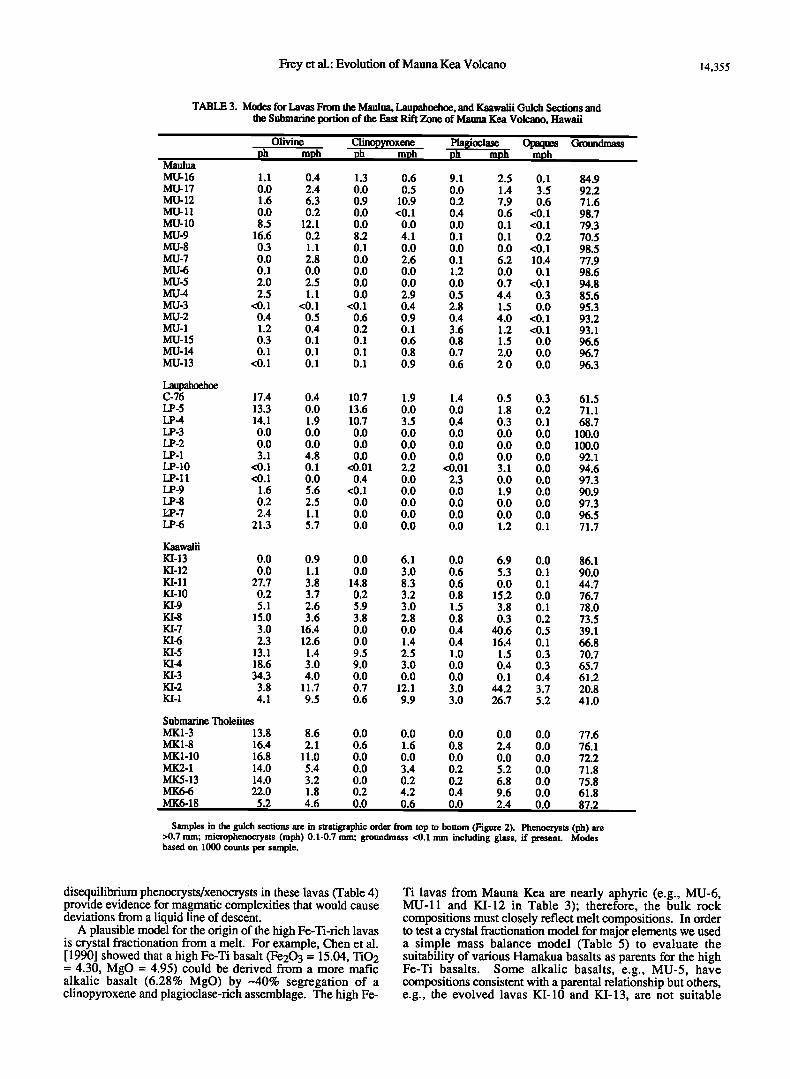
TABLE 3. Modes for Lavas From the Maulua, Laupahoehoe, and Kaawalii Gulch Sections and the Submarine portion of the East Rift Zone of Martha Kea Volcano, Hawaii
Olivine Clinopyroxene Plagioclase OI•ues Groundmass mph ph mph ph mph mph
Maulua
MU-16 1.1 0.4 1.3 0.6 9.1 2.5 0.1 84.9 MU-17 0.0 2.4 0.0 0.5 0.0 1.4 3.5 92.2 MU-12 1.6 6.3 0.9 10.9 0.2 7.9 0.6 71.6 MU-11 0.0 0.2 0.0 <0.1 0.4 0.6 <0.1 98.7 MU-10 8.5 12.1 0.0 0.0 0.0 0.1 <0.1 79.3 MU-9 16.6 0.2 8.2 4.1 0.1 0.1 0.2 70.5 MU-8 0.3 1.1 0.1 0.0 0.0 0.0 <0.1 98.5 MU-7 0.0 2.8 0.0 2.6 0.1 6.2 10.4 77.9 MU-6 0.1 0.0 0.0 0.0 1.2 0.0 0.1 98.6 MU-5 2.0 2.5 0.0 0.0 0.0 0.7 <0.1 94.8 MU4 2.5 1.1 0.0 2.9 0.5 4.4 0.3 85.6 MU-3 <0.1 <0.1 <0.1 0.4 2.8 1.5 0.0 95.3 MU-2 0.4 0.5 0.6 0.9 0.4 4.0 <0.1 93.2 MU-1 1.2 0.4 0.2 0.1 3.6 1.2 <0.1 93.1 MU-15 0.3 0.1 0.1 0.6 0.8 1.5 0.0 96.6 MU-14 0.1 0.1 0.1 0.8 0.7 2.0 0.0 96.7 MU-13 <0.1 0.1 0.1 0.9 0.6 2 0 0.0 96.3
ph
Laupahoehoe C-76 17.4 0.4 10.7 1.9 1.4 0.5 0.3 61.5 LP-5 13.3 0.0 13.6 0.0 0.0 1.8 0.2 71.1 LP4 14.1 1.9 10.7 3.5 0.4 0.3 0.1 68.7 LP-3 0.0 0.0 0.0 0.0 0.0 0.0 0.0 100.0 LP-2 0.0 0.0 0.0 0.0 0.0 0.0 0.0 100.0 LP-1 3.1 4.8 0.0 0.0 0.0 0.0 0.0 92.1 LP-10 <0.1 0.1 <0.01 2.2 <0.01 3.1 0.0 94.6 LP-11 <0.1 0.0 0.4 0.0 2.3 0.0 0.0 97.3 LP-9 1.6 5.6 <0.1 0.0 0.0 1.9 0.0 90.9 LP-8 0.2 2.5 0.0 0.0 0.0 0.0 0.0 97.3 I•-7 2.4 1.1 0.0 0.0 0.0 0.0 0.0 96.5 LP-6 21.3 5.7 0.0 0.0 0.0 1.2 0.1 71.7
Kaawalii
KI-13 0.0 0.9 0.0 6.1 0.0 6.9 0.0 86.1 KI-12 0.0 1.1 0.0 3.0 0.6 5.3 0.1 90.0 KI-11 27.7 3.8 14.8 8.3 0.6 0.0 0.1 44.7 KI-10 0.2 3.7 0.2 3.2 0.8 15.2 0.0 76.7 KI-9 5.1 2.6 5.9 3.0 1.5 3.8 0.1 78.0 KI-8 15.0 3.6 3.8 2.8 0.8 0.3 0.2 73.5 KI-7 3.0 16.4 0.0 0.0 0.4 40.6 0.5 39.1 KI-6 2.3 12.6 0.0 1.4 0.4 16.4 0.1 66.8 KI-5 13.1 1.4 9.5 2.5 1.0 1.5 0.3 70.7 KI4 18.6 3.0 9.0 3.0 0.0 0.4 0.3 65.7 KI-3 34.3 4.0 0.0 0.0 0.0 0.1 0.4 61.2 KI-2 3.8 11.7 0.7 12.1 3.0 44.2 3.7 20.8 KI-1 4.1 9.5 0.6 9.9 3.0 26.7 5.2 41.0
Submarine Tholeiites
MK1-3 13.8 8.6 0.0 0.0 0.0 0.0 0.0 77.6 MK1-8 16.4 2.1 0.6 1.6 0.8 2.4 0.0 76.1 MKl-10 16.8 11.0 0.0 0.0 0.0 0.0 0.0 72.2 MK2-1 14.0 5.4 0.0 3.4 0.2 5.2 0.0 71.8 MK5-13 14.0 3.2 0.0 0.2 0.2 6.8 0.0 75.8 MK6-6 22.0 1.8 0.2 4.2 0.4 9.6 0.0 61.8 MK6-18 5.2 4.6 0.0 0.6 0.0 2.4 0.0 87.2
Samples in the gulch sections are in stratigraphic order from top to bottom (Figure 2). Phenocrysts (ph) are >0.7 ram; rnicrophenocrysts (rnph) 0.1-0.7 ram; groundmass <0.1 mm including glass, if present. Modes based on 1000 counts per sample.
disequilibrium phenocrysts/xenocrysts in these lavas (Table 4) provide evidence for magmatic complexities that would cause deviations from a liquid line of descent.
A plausible model for the origin of the high Fe-Ti-rich lavas is crystal fractionation from a melt. For example, Chen et al. [1990] showed that a high Fe-Ti basalt (Fe203 = 15.04, TiO2 = 4.30, MgO = 4.95) could be derived from a more mafic alkalic basalt (6.28% MgO) by .-.40% segregation of a clinopyroxene and plagioclase-rich assemblage. The high Fe-
Ti lavas from Mauna Kea are nearly aphyric (e.g., MU-6, MU-11 and KI-12 in Table 3); therefore, the bulk rock compositions must closely reflect melt compositions. In order to test a crystal fractionation model for major elements we used a simple mass balance model (Table 5) to evaluate the suitability of various Hamakua basalts as parents for the high Fe-Ti basalts. Some alkalic basalts, e.g., MU-5, have compositions consistent with a parental relationship but others, e.g., the evolved lavas KI-10 and KI-13, are not suitable
14,356 Frey et al.: Evolution of Mauna Kea Volcano
3O
2O
t0
4OO
3OO
200
loo
Postshield Tholeiites
i Fe-Ti Basalt
for Homokuo Lavas
from West Flank and
Woikoholulu Gulch
LP-5 karomites +
Picrites
Shield
Tholeiites
4O
3O
2O
10
.... '1 .... I .... I"''' I ''•' HAMAKUA COAST
X LAVAS = X,g,I DREDGED SHIELD
LAVAS = ß xx
x
hield Tholeiites
ramites +
Picrites
ZField for Hamakua Lavas from West Flank and
Waikahalulu Gulch
Postshield'
Tholelites
Mu-
Shie Tholeiites
Hi Fe-Ti Basalt
Field for Hamakua Lavas from
West Flank ar•d Waikahalulu Gulch
•-Ankaramites +
Picrites
4O
3O
2O
i Fe-Ti Basalts
Field for Hamakua Lavas
from West Flank and
Waikahalulu Gulch
karomites +
Picrites
MU-IO
Postshield
Tholeiites 10 UU- i
Shield Tholeiites
0 ,,,, I .... I .... I .... I ....
0 5 10 15 20 25 0 5 i0 15 20
MgO MgO
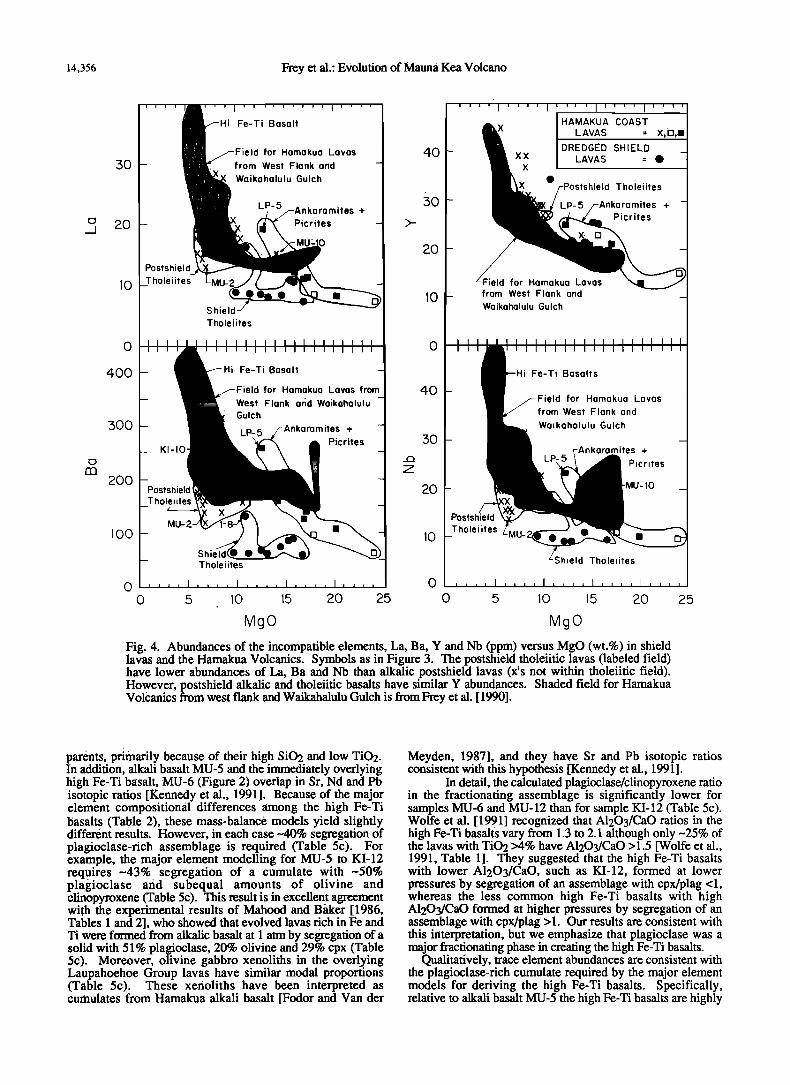
Fig. 4. Abundances of the incompatible elements, La, Ba, Y and Nb (ppm) versus MgO (wt.%) in shield lavas and the Hamakua Volcanics. Symbols as in Figure 3. The postshield tholeiitic lavas (labeled field) have lower abundances of La, Ba and Nb than alkalic postshield lavas (x's not within tholeiitic field). However, postshield alkalic and tholeiitic basalts have similar Y abundances. Shaded field for Hamakua Vo16anics from west flank and Waikahalulu Gulch is from Frey et al. [ 1990].
25
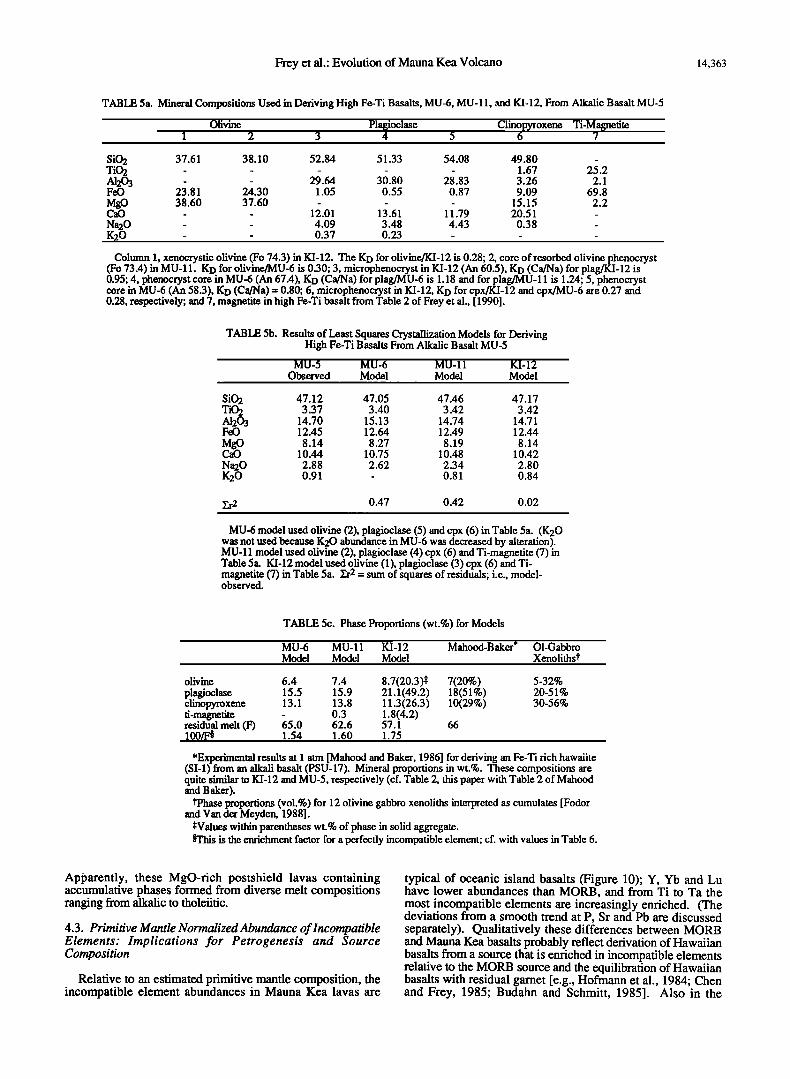
parents, primarily because of their high SiO2 and low TiO2. in addition, alkali basalt MU-5 and the immediately overlying high Fe-Ti basalt, MU-6 (Figure 2) overlap in Sr, Nd and Pb isotopic ratios [Kennedy et al., 1991]. Because of the major element compositional differences among the high Fe-Ti basalts (Table 2), these mass-balance models yield slightly different results. However, in each case-40% segregation of plagioclase-rich assemblage is required (Table 5c). For example, the major element modelling for MU-5 to KI-12 requires ~43% segregation of a cumulate with ~50% plagioclase and subequal amounts of olivine and clinopyroxene (Table 5c). This result is in excellent agreement wi.th the experimental results of Mahood and Baker [1986, Tables 1 and 2], who showed that evolved lavas rich in Fe and Ti were formed from alkalic basalt at 1 atm by segregation of a solid with 51% plagioclase, 20% olivine and 29% cpx (Table 5c). Moreover, olivine gabbro xenoliths in •he overlying Laupahoehoe Group lavas have similar modal proportions (Table 5c). These xenoliths have been interpreted as cumulates from Hamakua alkali basalt [Fodor and Van der
Meyden, 1987], and they have Sr and Pb isotopic ratios consistent with this hypothesis [Kennedy et al., 1991].
In detail, the calculated plagioclase/clinopyroxene ratio in the fractionating assemblage is significantly lowe• for samples MU-6 and MU-12 than for sample KI-12 (Table 5c). Wolfe et al. [1991] recognized that A1203/CaO ratios in the high Fe-Ti basalts vary from 1.3 to 2.1 although only -•25% of the lavas with TiO2 >4% have A1203/CaO > 1.5 [Wolfe et al., 1991, Table 1]. They suggested that the high Fe-Ti basalts with lower A1203/CaO, such as KI-12, formed at lower pressures by segregation of an assemblage with cpx/plag <1, whereas the less common high Fe-Ti basalts with high A1203/CaO formed at higher pressures by segregation of an assemblage with cpx/plag >1. Our results are consistent with this interpretation, but we emphasize that plagioclase was a major fractionating phase in creating the high Fe-Ti basalts.
Qualitatively, trace element abundances are consistent with the plagioclase-rich cumulate required by the major element models for deriving the high Fe-Ti basalts. Specifically, relative to alkali basalt MU-5 the high Fe-Ti basalts are highly
Frey et al.: Evolution of Mauna Kea Volcano 14,357
I I I I I I I I I I I [ I I [ I I I [ I I I I I I I I I I I
I POSTSHIELD: EAST FLANK I •(c) [ POSTS•H[ELD-'_ EAST_FLANKJ (b)' ........ •---' 100 ...•Ankoromite (LP-5, 12.6 Y• MgO)
70 ....... =..• ..:......:.....<.%.i.•.•;;i;f;i?.i•..;i.i.•. 50 •Ronge of $ Homokuo
= % .... •o 2o
• / -•••••• A lkolic B osol,s from. ••••.
from Loupohoehoe Gulch
• (6.1 to 6.9% MgO)
--
• 5-1 I I I I I I I I I I I t I I I I I I I I I I I I I I I • ',' • (o) [MAUNA KEA SHIELD J (d) [ POSTS••L•:_ _WA•6HA L•. •ULC•J
• •,• • = Ronge for 9 Alkolic BosoHs
so 40 • ••- •e• Average • -- 30 L
20 - •nge of 8 Mauna Kea 7 (9.4 to 16.8% MgO) • • • • I I I I I I I I I I I I I I I I I I I I
Lo Ce Pr Nd Pm Sm Eu Gd Tb Dy Ha Er Tm Yb Lu Lo Ce Pr Nd Pm SmEu Gd Tb Dy Ha Er Tm Yb Lu
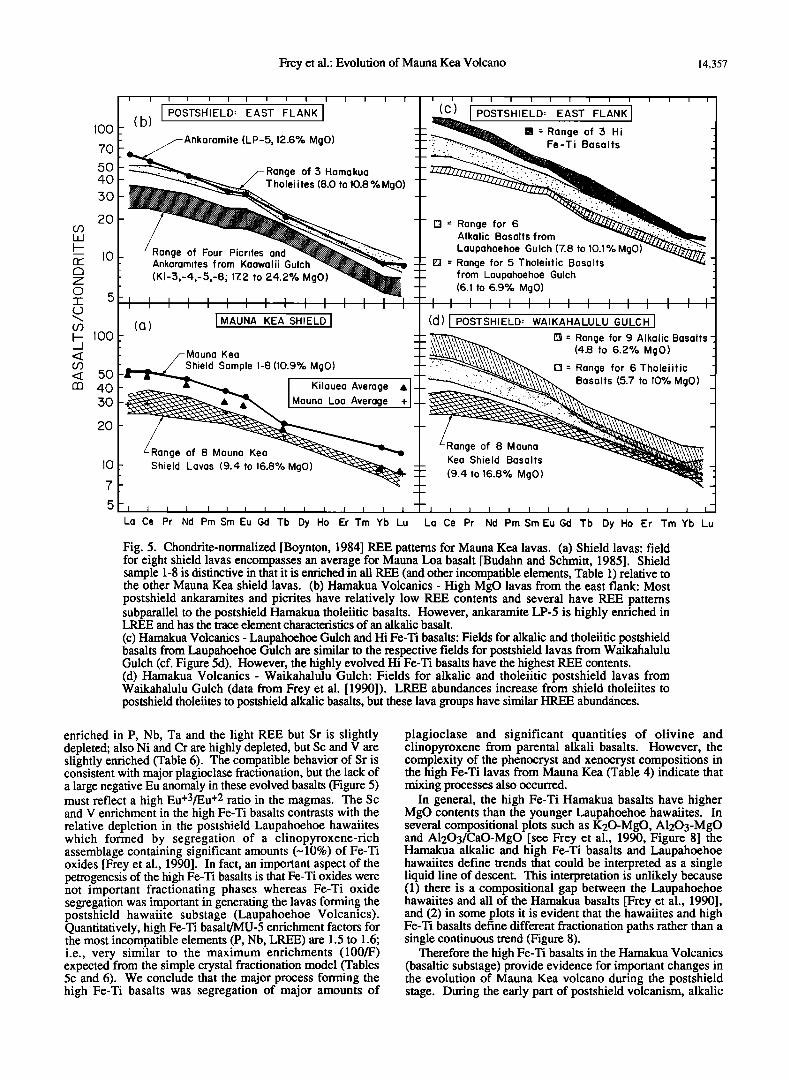
Fig. 5. Chondrite-normalized [Boynton, 1984] REE patterns for Mauna Kea lavas. (a) Shield lavas: field for eight shield lavas encompasses an average for Mauna Loa basalt [Budahn and Schmitt, 1985]. Shield sample 1-8 is distinctive in that it is enriched in all REE (and other incompatible elements, Table 1) relative to the other Mauna Kea shield lavas. (b) Hamakua Volcanics - High MgO lavas from the east flank: Most postshield ankaramites and picrites have relatively low REE contents and several have REE patterns subparallel to the postshield Hamakua tholeiitic basalts. However, ankaramite LP-5 is highly enriched in LREE and has the trace element characteristics of an alkalic basalt.
(c) Hamakua Volcanics - Laupahoehoe Gulch and Hi Fe-Ti basalts: Fields for alkalic and tholeiitic postshield basalts from Laupahoehoe Gulch are similar to the respective fields for postshield lavas from Waikahalulu Gulch (cf. Figure 5d). However, the highly evolved Hi Fe-Ti basalts have the highest REE contents. (d) Hamakua Volcanics- Waikahalulu Gulch: Fields for alkalic and tholeiitic postshield lavas from Waikahalulu Gulch (data from Frey et al. [1990]). LREE abundances increase from shield tholeiites to postshield tholeiites to postshield alkalic basalts, but these lava groups have similar HREE abundances.
enriched in P, Nb, Ta and the light REE but Sr is slightly depleted; also Ni and Cr are highly depleted, but Sc and V are slightly enriched (Table 6). The compatible behavior of Sr is consistent with major plagioclase fractionation, but the lack of a large negative Eu anomaly in these evolved basalts (Figure 5) must reflect a high Eu+3/Eu +2 ratio in the magmas. The Sc and V enrichment in the high Fe-Ti basalts contrasts with the relative depletion in the postshield Laupahoehoe hawaiires which formed by segregation of a clinopyroxene-rich assemblage containing significant amounts (-• 10%) of Fe-Ti oxides [Frey et al., 1990]. In fact, an important aspect of the petragenesis of the high Fe-Ti basalts is that Fe-Ti oxides were not important fractionating phases whereas Fe-Ti oxide segregation was important in generating the lavas forming the postshield hawaiite substage (Laupahoehoe Volcanics). Quantitatively, high Fe-Ti basalt/MU-5 enrichment factors for the most incompatible elements (P, Nb, LREE) are 1.5 to 1.6; i.e., very similar to the maximum enrichments (100/F) expected from the simple crystal fractionarian model (Tables 5c and 6). We conclude that the major process forming the high Fe-Ti basalts was segregation of major amounts of
plagioclase and significant quantities of olivine and clinopyroxene from parental alkali basalts. However, the complexity of the phenocryst and xenocryst compositions in the high Fe-Ti lavas from Mauna Kea (Table 4) indicate that mixing processes also occurred.
In general, the high Fe-Ti Hamakua basalts have higher MgO contents than the younger Laupahoehoe hawaiires. In several compositional plots such as K20-MgO, A1203-MgO and A1203/CaO-MgO [see Frey et al., 1990, Figure 8] the Hamakua alkalic and high Fe-Ti basalts and Laupahoehoe hawaiites define trends that could be interpreted as a single liquid line of descent. This interpretation is unlikely because (1) there is a compositional gap between the Laupahoehoe hawaiires and all of the Hamakua basalts [Frey et al., 1990], and (2) in some plots it is evident that the hawaiites and high Fe-Ti basalts define different fractionarian paths rather than a single continuous trend (Figure 8).
Therefore the high Fe-Ti basalts in the Hamakua Volcanics (basaltic substage) provide evidence for important changes in the evolution of Mauna Kea volcano during the postshield stage. During the early part of postshield volcanism, alkalic

14,358 Frey et al.: Evolution of Mauna Kea Volcano
14
13
12
11
10 Shield
Tholeiites
Postshield Tholeiitic
Basalt (East Flank)
ield Alkalic Basalt (East Flank)
-MU-10
Waikahalulu KI-1 Hi Fe-Ti
Gulch (South Flank) Basalt
Hi
Kilauea
Shield
i I i I
Postshield Mauna Kea
Tholeiitic Basalt
(East Flank)
Postshield Mauna Kea
Alkalic Basalt
(East Flank)
Postshield
Haleakalaa
4 5 6 7 8 9 10 11 12 6 8 10 12 14
La/Yb La/Yb
Fig. 6. Zr/Nb versus LaJYb for Mauna Kea shield lavas and the Hamakua Volcanics (note different LaJYb scales in the two panels). Because Nb and La are more incompatible than Zr and Yb, respectively, most basalt suites define inverse trends in this plot. (Left) Shield tholeiites have the lowest La/Yb and form a distinct field. Compared to the shield lavas, postshield tholeiites from the east flank have higher La/Yb and similar Zr/Nb. Postshield alkalic basalts from the east flank have lower Zr/Nb and higher La/Yb than shield or postshield tholeiites from the east flank. The evolved high Fe-Ti basalts have the most extreme values. Postshield basalts from Waikahalulu Gulch on the upper south flank also range from tholeiitic to alkalic (Figure 3a and Frey et al. [ 1990]; however, they are, in general, younger than postshield lavas from the east flank and they define a LaJYb-Zr•b field most similar to the alkalic postshield basalts. Labelled samples MU-10 and KI-10 (discussed in the text) are exceptions in that they are in the tholeiitic field in Figure 3a but they have higher La/Yb and lower Zr/Nb than other tholeiites from the east flank. The phenocryst-rich lavas (open and solid squares designating picrites and ankaramites, respectively) range widely in La/Yb and Zr/Nb. (Right) Comparison of fields for Mauna Kea lavas (shield tholeiites, postshield tholeiitic and alkalic basalts from the east flank) with fields for historic Kilauea tholeiites (data from Rhodes et al. [1989]) and postshield alkalic basalts (Kula Volcanics) from Haleakala Volcano (data from Chen and Frey [1985]). Important features are (1) The Mauna Kea shield lavas have higher Zr/Nb and lower La/Yb than Kilauea shield tholeiites; and (2) the postshield alkalic basalts from Mauna Kea generally have higher Zr/Nb and lower La/Yb than postshield alkalic basalts in the Kula Volcanics of Haleakala Volcano.
16
basalt magmas stagnated and fractionated at low pressures. Plagioclase fractionation was important, but segregation of Fe- Ti oxides was not a major process and residual melts were Fe- Ti rich basalts with A1203/CaO <2.1. However, later alkalic basalt magmas stagnated and fractionated at moderate pressures, and segregation of a clinopyroxene-rich assemblage containing Fe-Ti oxides was a major process in creating the hawaiires (A1203/CaO >2.3) of the Laupahoehoe Volcanics [Frey et al., 1990].
What caused this difference in the petrogenetic role of Fe-Ti oxides? Although it is difficult to infer oxygen fugacities during the melt-solid segregation processes that led to the high Fe-Ti basalts and hawaiires, there is no evidence that these distinctive lava types formed at different oxygen fugacity. For example, Frey et al. [ 1990] found that coexisting oxides in both lava types reflect equilibration close to the QFM buffer; whole-rocks have similar Fe203/FeO ratios (five of the six high Fe-Ti basalts studied have Fe203/FeO of 0.33 to 0.46 and several Laupahoehoe hawaiires have similar ratios (Table 1 of Wolfe et al. [1991]), and none of these lavas have significant Eu anomalies (Figure 5 and Figure 7 of West et al. []988]).
An alternative explanation for the different roles of Fe-Ti oxides in the two lava suites is that the Hamakua high Fe-Ti basaltic and Laupahoehoe hawaiitic magmas contained different concentrations of H20. In experimental studies of the liquid lines of descent of tholeiitic lavas, Spulber and Rutherford [1983] and Juster et al. [1989] found that at 1 arm under anhydrous conditions and a range of oxygen fugacities (QFM to -qW), Fe-Ti oxide crystallization does not occur until TiO2 contents reach •-5%; i.e., similar to the maximum values in the high Fe-Ti basalts (Figure 8). Similar experimental results were obtained by Mahood and Baker [1986], who studied a more alkalic basalt. However, with a tholeiitic composition at low oxygen fugacities (graphite-methane) but under hydrous conditions (fH20•-0.67 Pfluicl 1-2 kbar total pressure) Spulber and Rutherford [1983] found that Fe-Ti oxides were saturated at much lower, •-2%, TiO2 contents. Also, Baker and Eggler [ 1983, Figure 3] showed that Fe-Ti oxides are near liquidus phases in hydrous (4-6 wt % H20) basaltic melts at 2 kbar total pressure. Therefore a plausible explanation for the differing role of Fe-Ti oxides in the basaltic and hawaiitic substages is that in the moderate pressure magma chambers present during the hawaiite substage (see Figure 15

Frey et al.: Evolution of Mauna Kea Volcano 14,359
TABLE 4a. Olivine Compositions (wt.%) in Mauna Kea Lavas
Rock:
Type: Size:
(mm): Part:
SiO 2 FeO
MgO Total
Fo%
, ,
Submarine Shield Tholerites ,
MK1-3 MK1-8 MKl-10
Ph Ph Ph Ph Xeno Ph Ph Xeno 2.5 1.0 1.6 0.6 3.0 0.8 0.5 2.0
Core Core Rim Core Rim Core Rim Core Rim Core Rim Core Rim Core Rim
40.4 38.5 39.2 40.1 39.2 39.6 38.9 40.4 39.4 39.8 39.9 39.3 39.7 40.5 39.8
9.35 19.8 16.8 12.7 17.1 14.9 18.0 12.3 16.7 13.9 14.9 13.4 15.2 10.9 15.2 49.3 40.7 43.4 46.2 42.9 45.0 42.3 46.7 43.4 46.2 44.3 47.2 45.0 48.1 44.9 99.05 99.0 99.4 99.0 99.2 99.5 99.2 99.4 99.5 99.9 99.1 99.9 99.9 99.5 99.8 90.4 78.5 82.2 86.6 81.7 84.4 80.8 87.2 82.2 85.5 84.1 86.3 84.1 88.7 84.0
Submarine Shield Tholeiites Postshield Thole'fiitic Basalts
Rock: MK2-1 MK5-13 MK6-18 MU-2
Type: Ph Ph Ph Ph Ph Ph Xeno Ph Mph Size: 2.0 3.0 2.5 1.5 1.2 0.8 2.0 0.7 0.2
(mm): Part: Core Core Rim Core Core Rim Core Rim Core Rim Core Rim Core Rim Core Rim
SiO2 40.5 40.1 39.2 40.3 39.2 39.5 40.6 40.3 40.6 40.4 41.0 40.1 39.3 36.1 37.6 36.8 FeO 9.7 13.3 16.5 10.25 11.45 15.0 10.0 11.6 10.3 10.8 9.3 13.6 18.8 37.5 27.7 32.5
MgO 48.8 45.6 43.4 48.5 43.7 44.8 48.6 47.6 48.0 48.3 49.5 46.2 41.2 25.4 34.6 31.0 Total 99.0 99.0 99.75 99.05 99.35 99.3 99.2 99.5 98.9 99.5 99.8 99.9 99.3 99.0 99.9 100.3 Fo% 90.0 86.0 82.4 89.4 82.6 84.2 89.7 88.0 89.3 88.9 90.5 85.8 79.6 54.7 69.0 62.9
Type: Size:
(mm): Part:
Postshield Postshield Alkalic Basalt Postshield Picrite Tholeiific Basalts
MU-8 LP-9 MU-5 MU- 10 LP-6
Xeno Mph Xeno Ph Mph Ph Mph Xeno Ph Xeno Ph Ph 0.4 0.2 2.0 0.7 0.3 0.8 0.1 1.2 0.6 3.0 1.2 0.7
.
Core Rim Core Core Core Rim Core Core Corn Core Rim Core Core Core
SiO2 FeO
MgO Total
Fo%
Rock:
Type: Size:(mm): Part:
SiO2 FeO
MgO Total Fo%
39.7 39.9 40.4 39.5 39.8 39.2 39.3 39.3 37.7 38.7 39.5 39.5 39.5 40.0 14.6 14.7 13.7 17.1 15.1 18.2 17.9 16.8 29.4 21.3 15.7 16.9 14.6 14.5 44.8 44.6 45.6 42.8 44.5 42.2 42.5 43.3 34.5 40.1 44.2 43.6 45.8 45.0 99.1 99.2 99.7 99.4 99.4 99.6 99.7 99.4 99.6 100.1 99.4 100.0 99.9 99.5 84.5 84.5 85.6 81.7 84.0 80.5 80.9 82.1 66.3 77.0 83.4 82.1 84.9 84.7
•. Postshield Ankaramites MU-9 LP-5
Ph Ph Mph Mph Ph Ph Mph 2.0 1.2 0.3 0.2 2.8 2.1 0.3
Core Rim Core Core Core Core Rim Core Rim Core Rim 40.3 39.9 40.1 40.0 39.9 41.2 39.3 40.5 39.5 38.7 36.1 13.2 15.5 14.1 14.1 15.7 12.3 22.5 14.3 19.4 24.3 29.0 45.8 44.1 45.2 45.3 44.0 46.5 38.5 45.2 40.9 36.6 25.2 99.3 99.5 99.4 99.4 99.6 100.0 100.2 100.0 99.8 99.6 100.3 86.1 83.5 85.1 85.2 83.3 87.1 75.3 84.9 79.0 72.9 53.5
Rock:
Type: Size:(mm): Part:
SiO2 FeO
MgO Total
Fo%
Postshield High Fe-Ti Basalt MU-6 MU- 11 KI- 12
Gm Gm Ph Ph Mph Xeno Mph Mph Xeno - - 2.0 1.8 0.4 1.4 0.3 0.2 0.8
Core Core Core Rim Core Rim Core Core Rim Core Core Core ,
37.2 36.7 39.7 39.4 38.7 38.5 38.4 38.1 38.2 36.2 34.9 37.7 28.3 30.3 16.1 17.7 21.5 22.0 22.1 24.3 23.4 33.0 35.3 23.9 34.4 32.7 43.8 42.6 39.7 39.8 39.4 37.6 38.3 30.9 29.0 38.7 99.9 99.7 99.6 99.7 99.9 100.3 99.9 100.0 99.9 100.1 99.2 100.3 68.4 65.8 82.9 82.1 76.7 76.3 76.1 73.4 74.5 62.6 59.4 74.3
All data obtained by electron microprobe at the University of Hawaii. Ph, phenocryst; Mph, microphenocryst; Xeno, xenocryst (grains, >0.5 mm, with strongly resorbed margins).
14,360 Frey et al.: Evolution of Mauna Kea Volcano
TABLE 4b. Clinopyroxene Compositions in (wt.%) Mauna Kea Lavas
Submarine Shield Tholeiites
Rock: MK 1-8 MK6-18 MU-2 ,,
Type: Ph Mph Mph Mph Size (mm): 0.7 0.2 0.2 0.35 Part: Core Rim Core Rim Core Core
SiO 2 51.2 51.4 51.7 51.5 51.2 52.25 TiO 2 1.1 1.0 0.9 1.0 1.0 0.82 A120 3 3.0 2.5 2.6 2.9 4.2 2.45 Cr20 3 0.5 0.4 1.0 0.6 0.7 0.13 FeO 8.5 9.3 6.9 6.9 6.9 6.83 MgO 16.5 16.5 17.3 17.0 16.7 17.08 CaO 18.6 18.0 19.0 18.6 18.8 19.98 Na20 0.3 0.2 0.2 0.2 0.2 0.22 Total 99.7 99.3 99.6 98.7 99.7 99.76
Postshield Tholeiitic Basalts
MU-8
Mph 0.15
Rim Core Rim
'52.71 51.74 49.88 0.83 0.92 1.61
1.59 2.91 4.55
0.27 0.52 0.74
8.81 6.76 7.38 17.48 17.72 15.83 17.78 18.48 19.44 0.14 0.22 0.27
99.61 99.27 99.70
Wo 3 8.5 37.3 39.2 39.1 39.6 40.7 36.3 3 8.2 41.2 En 47.7 47.7 49.7 49.6 49.0 48.4 49.7 50.9 46.6 Fs 13.8 15.0 11.1 11.3 11.4 10.9 14.0 10.9 12.2
Postshield Ankaramites
Rock: MU-9 LP-5
Type: Ph Mph Ph Ph Size 0.75 0.35 1.2 0.8
(mm): , Part: Core Rim Core Core Rim Core
SiO 2 52.00 52.23 52.09 52.04 52.14 50.90 TiO 2 0.67 0.69 0.73 0.65 0.82 1.18 A1203 2.39 2.63 2.52 2.50 2.78 2.68 Cr20 3 1.07 1.17 0.93 1.10 1.44 0.28 FeO 4.77 4.65 5.01 4.83 4.90 8.29
MgO 17.13 17.02 17.05 17.04 16.89 15.70 CaO 21.35 21.72 21.24 20.73 20.91 20.15
Na20 0.24 0.21 0.24 0.25 0.29 0.30 Total 99.62 100.32 99.81 99.14 100.17 99.48
Postshield High Fe-Ti Basalt KI-12
Ph Mph 2.0 0.3
Rim Core Rim Core
48.89 45.4 46.8 49.4 1.92 3.2 2.8 1.6
4.50 7.3 6.0 3.3
0.45 0.3 0.1 0.2
8.82 9.4 9.0 9.0 14.72 12.6 13.2 15.0 20.17 21.4 21.1 20.3
0.27 0.6 0.5 0.4
99.74 100.2 99.5 99.2
Wo 43.7 44.3 43.5 43.0 43.4 41.6 En 48.7 48.3 48.5 49.2 48.7 45.1 Fs 7.6 7.4 8.0 7.8 7.9 13.3
#See Table 4a footnotes.
42.4 46.2 45.4 42.1
43.1 37.9 39.5 43.3 14.5 15.9 15.1 14.6
of Frey et al. [ 1990]) the magmas did not lose H20, and Fe-Ti oxides crystallized early in the liquid line of descent; in contrast, during the low pressure fractionation prevalent during the basaltic substage, magrnas were devolatilized and at the resulting low H20 contents Fe-Ti oxide saturation did not occur until residual melts contained -5% TiO2. Supporting evidence for evolution of the hawaiites and Fe-Ti basalts at
different PH20 are the high KD ((Ca/Na)plag/(Ca/Na)wR) ratios (>1.5) lq• the hawaiites [West et al., 1988] and the much lower ratios, 0.9 to 1.2, for the alkalic and high Fe-Ti basalts (Tables 2 and 4). Juster et al. [1989, p. 9266] noted that lower KD ratios,-•1, are typical of 1 atm anhydrous experiments, but higher KD ratios are typical of moderate pressure (1-2 kbar) experiments with H20-bearing melts.
4.2. Origin of Postshield MgO-rich Lavas
Lavas with high MgO contents (>12%) are important because they may be near-primary magmas. In particular, picritic lavas with 12 to 25% MgO have been proposed as the primary magmas for Hawaiian volcanoes [e.g., Wright, 1984; Wilkinson and Hensel, 1988; Nicholls and Stout, 1988]. At other volcanoes, ankaramites have also been proposed as representative of primary magmas [e.g., Thompson and
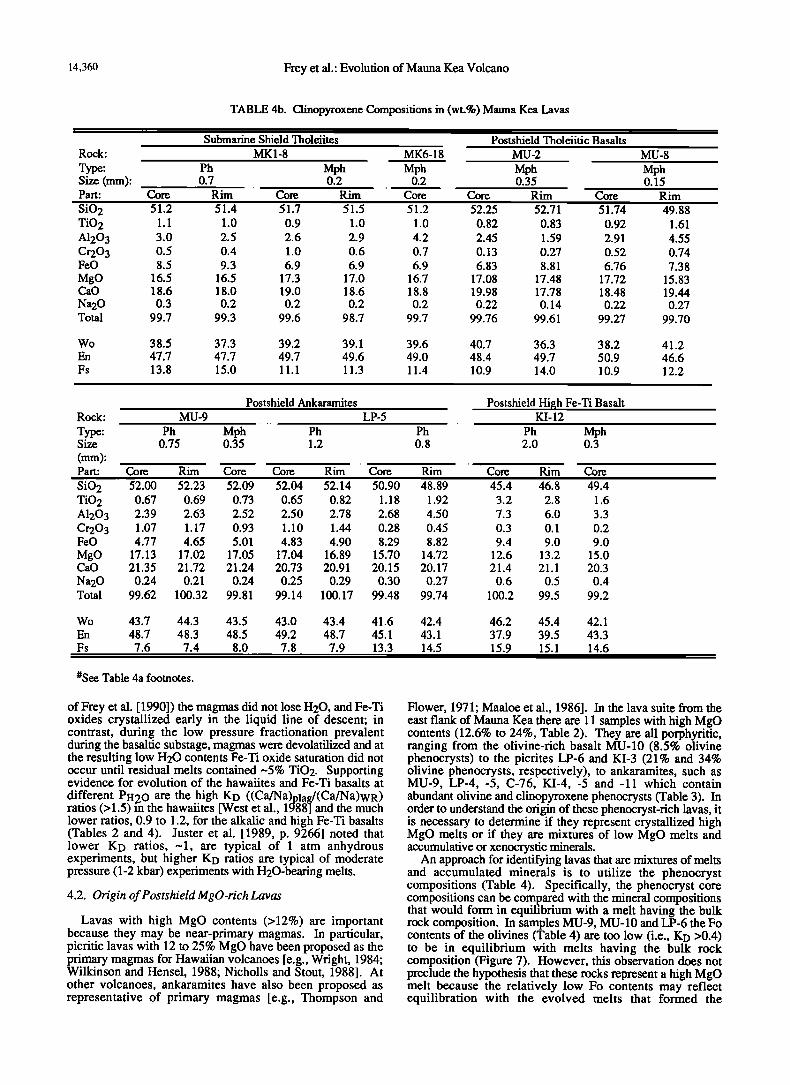
Flower, 1971; Maaloe et al., 1986]. In the lava suite from the east flank of Mauna Kea there are 11 samples with high MgO contents (12.6% to 24%, Table 2). They are all porphyfitic, ranging from the olivine-rich basalt MU-10 (8.5% olivine phenocrysts) to the picrites LP-6 and KI-3 (21% and 34% olivine phenocrysts, respectively), to ankaramites, such as MU-9, LP-4, -5, C-76, KI-4, -5 and - 11 which contain abundant olivine and clinopyroxene phenocrysts (Table 3). In order to understand the origin of these phenocryst-rich lavas, it is necessary to determine if they represent crystallized high MgO melts or if they are mixtures of low MgO melts and accumulative or xenocrystic minerals.
An approach for identifying lavas that are mixtures of melts and accumulated minerals is to utilize the phenocryst compositions (Table 4). Specifically, the phenocryst core compositions can be compared with the mineral compositions that would form in equilibrium with a melt having the bulk rock composition. In samples MU-9, MU-10 and LP-6 the Fo contents of the olivines (Table 4) are too low (i.e., KD >0.4) to be in equilibrium with melts having the bulk rock composition (Figure 7). However, this observation does not preclude the hypothesis that these rocks represent a high MgO melt because the relatively low Fo contents may reflect equilibration with the evolved melts that formed the
Frey et al.: Evolution of Mauna Kea Volcano 14,361
TABLE 4c. Plagioclase Compositions in Mauna Kea Lavas
Rock:
Type: Size (mm):
A1203 FeO CaO
Na2 ̧ K20 Total An%
Submarine Shield Tholeiites
MK1-8
Mph Mph 0.2 0.2
Core Core
53.4 51.9
28.7 29.5
0.8 0.9 11.9 13.3 4.6 3.6
0.2 0.1
99.6 99.3 58.2 67.0
MK6-18
Postshield Tholeiitic
MU-2
Mph Mph Mph 0.1 0.35 0.20
Core Core Core
52.4 47.00 47.00
29.3 33.20 33.10
0.8 0.70 0.65 12.9 16.65 16.50 3.8 1.90 2.15
0.1 0.05 0.05
99.3 99.50 99.45 64.9 82.3 80.7
Postshield Alkalic
Ph 1.0
Core
5O.45
31.05
0.50 13.85 3.40
0.15
99.40 68.6
LP-9
Mph 0.3
Core
50.75
33.75
0.80 13.65 3.45
0.25
99.65 67.6
Rock:
Type: Size (ram): Part:
Postshield Ankaramites
LP-5
Ph 1.25
Core Rim
MU-9
Mph Xeno Mph 0.50 0.40 0.35
Core Core Core
Postshield High Fe-Ti Basalts MU-6
Ph
2
Core
Mph 0.3
Rim Core Rim
SiO2 47.75 53.4 50.90 47.85 50.30 51.8 53.2 53.7 53.3 A120 3 33.25 28.1 30.60 33.25 31.30 29.5 28.9 29.0 29.0 FeO 0.55 1.3 0.70 0.60 0.75 0.6 0.6 0.7 0.6 CaO 16.50 11.8 13.75 16.35 14.40 13.1 12.2 11.9 11.9 Na20 1.90 4.3 3.10 2.00 3.10 3.8 4.1 4.4 4.4 K20 0.07 0.3 0.15 0.09 0.15 0.24 0.29 0.34 0.33 Total 100.02 99.2 99.20 100.14 100.00 99.0 99.3 100.0 99.5 An% 82.4 59.2 70.4 81.5 71.3 64.9 61.2 58.8 58.9
Rock:
Type: Size (mm): Part:
Postshield High Fe-Ti Basalts MU-11
Ph Ph Mph 1.6 2.2 0.3
KI-12
Mph Xeno 0.4 0.8
Core Rim Core Rim Core Core Core Core
SiO2 47.4 47.4 51.4 50.6 51.5 52.6 52.6 53.1 A1203 33.0 32.8 30.1 30.5 29.8 29.4 29.5 29.4 FeO 0.6 0.6 0.7 0.6 0.8 0.7 1.0 0.9 CaO i 7.2 i 6.5 i3.4 i 4.2 i 3.6 i 2.7 i 2.0 12.0 Na20 1.8 2.0 3.6 3.2 3.6 4.0 4.1 4.0 K20 0.14 0.1 0.21 0.16 0.19 0.27 0.37 0.36 Total 99.9 99.4 99.4 99.3 99.5 99.7 99.5 99.8 An% 84.1 81.6 66.8 70.7 66.8 62.7 60•5 60.8
See Table 4a footnotes.
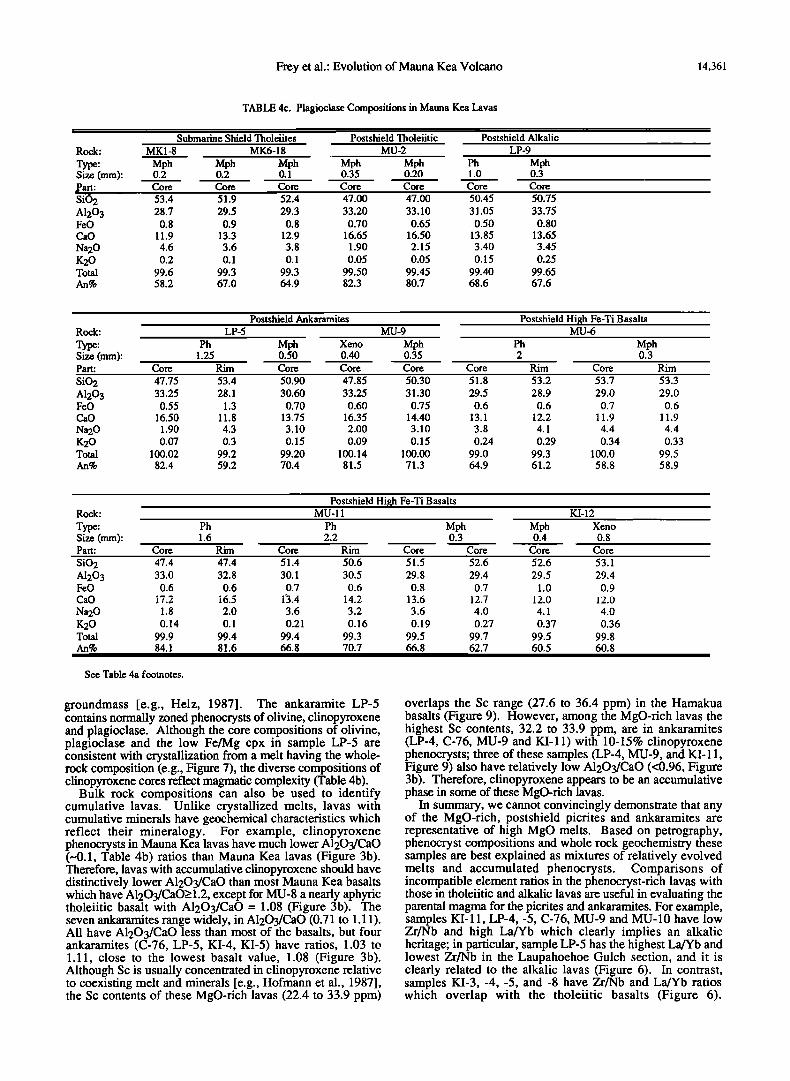
groundmass [e.g., Helz, 1987]. The ankaramite LP-5 contains normally zoned phenocrysts of olivine, clinopyroxene and plagioclase. Although the core compositions of olivine, plagioclase and the low Fe/Mg cpx in sample LP-5 are consistent with crystallization from a melt having the whole- rock composition (e.g., Figure 7), the diverse compositions of clinopyroxene cores reflect magmatic complexity (Table 4b).
Bulk rock compositions can also be used to identify cumulative lavas. Unlike crystallized melts, lavas with cumulative minerals have geochemical characteristics which reflect their mineralogy. For example, clinopyroxene phenocrysts in Mauna Kea lavas have much lower A1203/CaO (-0.1, Table 4b) ratios than Mauna Kea lavas (Figure 3b). Therefore, lavas with accumulative clinopyroxene should have distinctively lower A1203/CaO than most Mauna Kea basalts which have A1203/CaO>_ 1.2, except for MU-8 a nearly aphyric tholeiitic basalt with A1203/CaO = 1.08 (Figure 3b). The seven ankaramites range widely, in A1203/CaO (0.71 to 1.11). All have A1203/CaO less than most of the basalts, but four ankaramites (C-76, LP-5, KI-4, KI-5) have ratios, 1.03 to 1.11, close to the lowest basalt value, 1.08 (Figure 3b). Although Sc is usually concentrated in clinopyroxene relative to coexisting melt and minerals [e.g., Hofmann et al., 1987], the Sc contents of these MgO-rich lavas (22.4 to 33.9 ppm)
overlaps the Sc range (27.6 to 36.4 ppm) in the Hamakua basalts (Figure 9). However, among the MgO-rich lavas the highest Sc contents, 32.2 to 33.9 ppm, are in ankaramites (LP-4, C-76, MU-9 and KI-11) with 10-15% clinopyroxene phenocrysts; three of these samples (LP-4, MU-9, and KI-11, Figure 9) also have relatively low A1203/CaO (<0.96, Figure 3b). Therefore, clinopyroxene appears to be an accumulative phase in some of these MgO-rich lavas.
In summary, we cannot convincingly demonstrate that any of the MgO-rich, postshield picrites and ankaramites are representative of high MgO melts. Based on petrography, phenocryst compositions and whole rock geochemistry these samples are best explained as mixtures of relatively evolved melts and accumulated phenocrysts. Comparisons of incompatible element ratios in the phenocryst-rich lavas with those in tholeiitic and alkalic lavas are useful in evaluating the parental magma for the picrites and ankaramites. For example, samples KI- 11, LP-4, -5, C-76, MU-9 and MU- 10 have low Zr/Nb and high La/Yb which clearly implies an alkalic heritage; in particular, sample LP-5 has the highest La/Yb and lowest Zr/Nb in the Laupahoehoe Gulch section, and it is clearly related to the alkalic lavas (Figure 6). In contrast, samples KI-3, -4, -5, and -8 have Zr/Nb and La/Yb ratios which overlap with the tholeiitic basalts (Figure 6).
14,362 Frey et al.: Evolution of Mauna Kea Volcano
9O
85
SHIELD
65 70 75 55 60 65 70
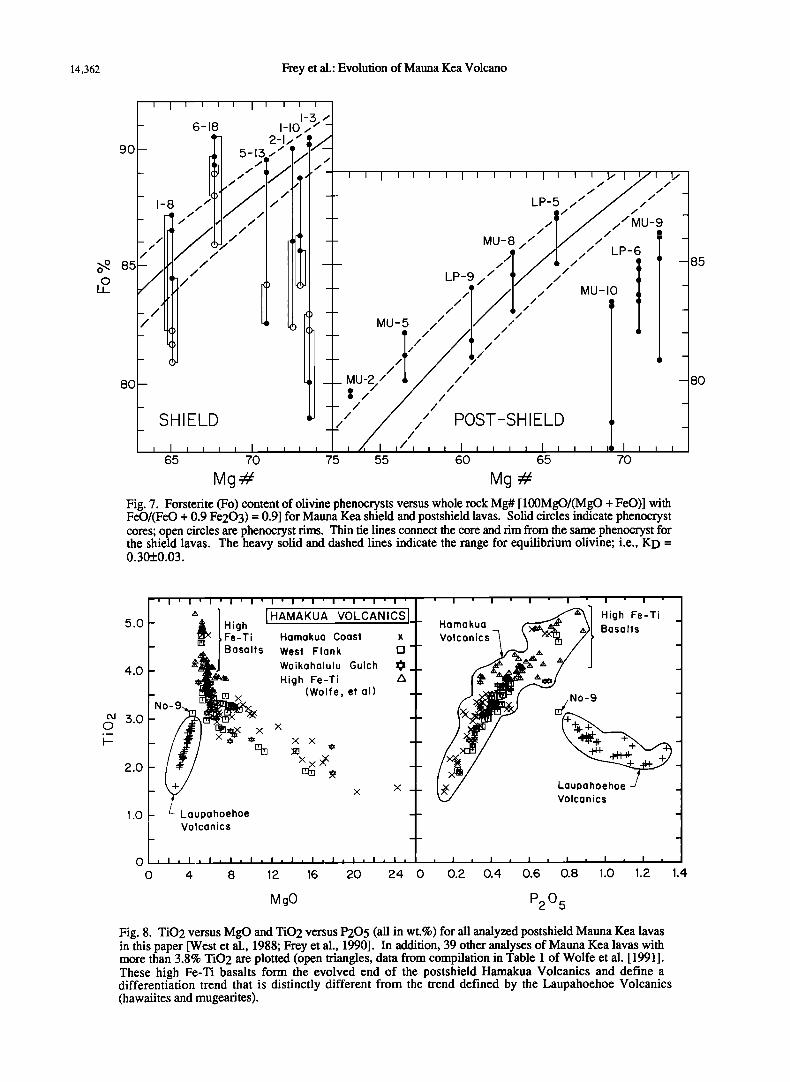
Mg# Mg # Fig. 7. Forsterite (Fo) content of olivine phenocrysts versus whole rock Mg# [ 100MgO/(MgO + FeO)] with FeO/(FeO + 0.9 Fe203) = 0.9] for Mauna Kea shield and postshield lavas. Solid circles indicate phenocryst cores; open circles are phenocryst rims. Thin tie lines connect the core and rim from the same phenocryst for the shield lavas. The heavy solid and dashed lines indicate the range for equilibrium olivine; i.e., KD = 0.30_+0.03.
8O
5.0
4.0
3.0
2.0
1.0
-' I ' I ' I ' I ' I ' I ' I ' I ' I ' I ' I ' I ' ' I ' I ' I ' I ' I ' I '
- ilk. HAMAKUA VOLCANICS I_ High Fe-Ti _ - Hamakua t" Basalts
• •Fe-Ti Hamakua Coast x Volcanics• - '•' I B West Flank [] Waikahalulu Gulch • •'" y J - • High Fe-Ti :• "" %No-9 - [] x (Wolfe, et al)
No-9
x
x x
x x
• Volcanics - Laupahoehoe - Volcanics
, I , I_..A__[ • I ; _l •, i_ , i , I , i • I , I , I , , I , I , I , i , I , I ,
0 4 8 12 16 20 24 0 0.2 0.4 0.6 0.8 1.0 1.2
MgO P2 05
Fig. 8. TiO2 versus MgO and TiO2 versus P205 (all in wt.%) for all analyzed postshield Mauna Kea lavas in this paper [West et al., 1988; Frey et al., 1990]. In addition, 39 other analyses of Mauna Kea lavas with more than 3.8% TiO2 are plotted (open triangles, data from compilation in Table 1 of Wolfe et al. [1991]. These high Fe-Ti basalts form the evolved end of the postshield Hamakua Volcanics and define a differentiation trend that is distinctly different from the trend defined by the Laupahoehoe Volcanics (hawaiires and mugearites).
i
Frey et al.: Evolution of Mauna Kea Volcano 14,363
TABLE 5a. Mineral Compositions Used in Deriving High Fe-Ti Basalts, MU-6, MU-11, ,.and KI-12, From Alkalic Basalt MU-5
Olivine P1 ioclase Clinopyroxene Ti-M%metite 1 2 3 a• 5 6 7 SiO2 37.61 38.10 52.84 51.33 54.08 49.80 - TiO2 ..... 1.67 25.2 A1203 - - 29.64 30.80 28.83 3.26 2.1 FeO 23.81 24.30 1.05 0.55 0.87 9.09 69.8 MgO 38.60 37.60 - - - 15.15 2.2 CaO - - 12.01 13.61 11.79 20.51 - Na20 - - 4.09 3.48 4.43 0.38 - K20 - - 0.37 0.23 - - -
Column 1, xenocrystic olivine (Fo 74.3) in KI-12. The KD for olivine/KI-12 is 0.28; 2, core of resorbed olivine phenocryst (Fo 73.4) in MU-11. KD for olivine/MU-6 is 0.30; 3, microphenocryst in KI-12 (An 60.5), KD (Ca/Na) for plag/KI-12 is 0.95; 4, phenocryst core in MU-6 (An 67.4), KD (Ca/Na) for plag/MU-6 is 1.18 and for plag/MU-11 is 1.24; 5, phenocryst core in MU-6 (An 58.3), KD (Ca/Na) = 0.80; 6, microphenocryst in KI-12, KD for cpx/KI-12 and cpx/MU-6 are 0.27 and 0.28, respectively; and 7, magnetite in high Fe-Ti basalt from Table 2 of Frey et al., [1990].
TABLE 5b. Results of Least Squares High Fe-Ti Basalts
Crystallization Models for Deriving From Alkalic Basalt MU-5
MU-5 MU-6 MU-11 KI-12 Observed Model Model Model
SiO2 47.12 47.05 47.46 47.17 TiO2 3.37 3.40 3.42 3.42 A1203 14.70 15.13 14.74 14.71 FeO 12.45 12.64 12.49 12.44
MgO 8.14 8.27 8.19 8.14 CaO 10.44 10.75 10.48 10.42 Na20 2.88 2.62 2.34 2.80 K20 0.91 - 0.81 0.84
Er 2 0.47 0.42 0.02
MU-6 model used olivine (2), plagioclase (5) and cpx (6) in Table 5a. (K20 was not used because K20 abundance in MU-6 was decreased by alteration). MU-11 model used olivine (2), plagioclase (4) cpx (6) and Ti-magnetite (7) in Table 5a. KI-12 model used olivine (1), plagioclase (3) cpx (6) and Ti- magnetite (7) in Table 5a. Er2 = sum of squares of residuals; i.e., model- observed.
TABLE 5c. Phase Prolx)rtions (wt.%) for Models
MU-6 MU-11 KI-12 Model Model Model
Mahood-Baker* O1-Gabbro Xenolithst
olivine 6.4 7.4 8.7(20.3)$ 7(20%) plagioclase 15.5 15.9 21.1(49.2) 18(51%) clinopyroxene 13.1 13.8 11.3(26.3) 10(29%) fi-magnetite 0.3 1.8(4.2) residual melt (F) •5.0 62.6 57.1 66 100/Fõ 1.54 1.60 1.75
5-32% 20-51% 30-56%
*Experimental results at 1 arm [Mahood and Baker, 1986] for deriving an Fe-Ti rich hawaiite (SI-1) from an alkali basalt (PSU-17). Mineral proportions in wt.%. These compositions are quite similar to KI-12 and MU-5, respectively (cf. Table 2, this paper with Table 2 of Mahood and Baker).
tPhase proportions (vol.%) for 12 olivine gabbro xenoliths interpreted as cumulates [Fodor and Van der Meyden, 1988].
•Values within parentheses wt.% of phase in solid aggregate. õThis is the enrichment factor for a perfectly incompatible element; cf. with values in Table 6.
Apparently, these MgO-rich postshield lavas containing accumulative phases formed from diverse melt compositions ranging from alkalic to tholeiitic.
4.3. Primitive Mantle Normalized Abundance of Incompatible Elements: Implications for Petrogenesis and Source Composition
Relative to an estimated primitive mantle composition, the incompatible element abundances in Mauna Kea lavas are
typical of oceanic island basalts (Figure 10); Y, Yb and Lu have lower abundances than MORB, and from Ti to Ta the most incompatible elements are increasingly enriched. (The deviations from a smooth trend at P, Sr and Pb are discussed separately). Qualitatively these differences between MORB and Mauna Kea basalts probably reflect derivation of Hawaiian basalts from a source that is enriched in incompatible elements relative to the MORB source and the equilibration of Hawaiian basalts with residual garnet [e.g., Hofmann et al., 1984; Chen and Frey, 1985; Budahn and Schmitt, 1985]. Also in the
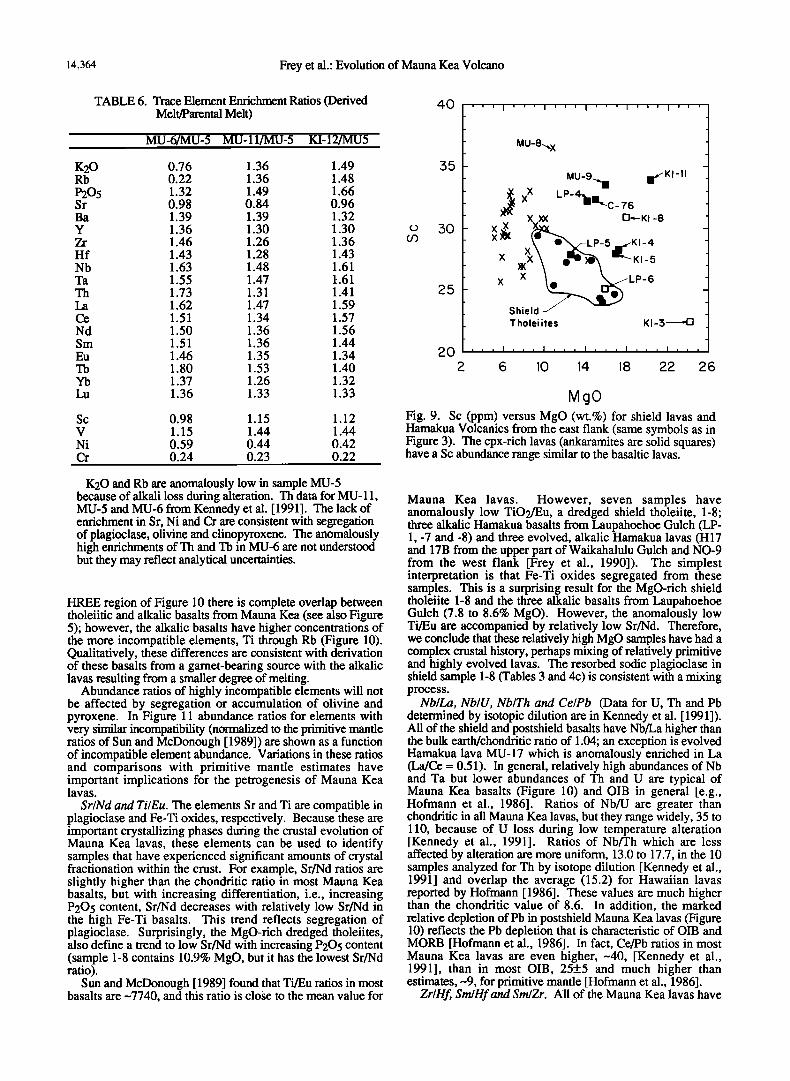
14,364 Frey et al.: Evolution of Mauna Kea Volcano
TABLE 6. Trace Element Enrichment Ratios (Derived Melt/?a•ntal Melt)
MU-6/MU-5 MU-11/MU-5 KI-12/MU5
K20 0.76 1.36 1.49 Rb 0.22 1.36 1.48 P205 1.32 1.49 1.66 Sr 0.98 0.84 0.96 Ba 1.39 1.39 1.32 Y 1.36 1.30 1.30 Zr 1.46 1.26 1.36 Hf 1.43 1.28 1.43 Nb 1.63 1.48 1.61 Ta 1.55 1.47 1.61 Th 1.73 1.31 1.41 La 1.62 1.47 1.59 Ce 1.51 1.34 1.57 Nd 1.50 1.36 1.56 Sm 1.51 1.36 1.44 Eu 1.46 1.35 1.34 Tb 1.80 1.53 1.40 Yb 1.37 1.26 1.32 Lu 1.36 1.33 1.33
Sc 0.98 1.15 1.12 V 1.15 1.44 1.44 Ni 0.59 0.44 0.42 Cr 0.24 0.23 0.22
40 '''!'''l'''l'''l'''l'''
35
c> 3o
25
2o
MU-8-... X
•K1-11 MU-9..1 -
• xx LP-4•ll'-c - 76 X•
xX •• X• LP-5•KI-4 -
X X •LP-6 Shield •
Tholeiites KI-3•
, , , I , , , I , , , I , , , ! , , , I , , ,
6 10 14 18 22 26
MgO Fig. 9. Sc (ppm) versus MgO (wt.%) for shield lavas and Hamakua Volcanics from the east flank (same symbols as in Figure 3). The cpx-rich lavas (ankaramites are solid squares) have a Sc abundance range similar to the basaltic lavas.
K20 and Rb are anomalously low in sample MU-5 because of alkali loss during alteration. Th data for MU- 11, MU-5 and MU-6 from Kennedy et al. [1991]. The lack of enrichment in Sr, Ni and Cr are consistent with segregation of plagioclase, olivine and clinopyroxene. The anomalously high enrichments of Th and Tb in MU-6 are not understood but they may reflect analytical uncertainties.
HREE region of Figure 10 there is complete overlap between tholeiitic and alkalic basalts from Mauna Kea (see also Figure 5); however, the alkalic basalts have higher concentrations of the more incompatible elements, Ti through Rb (Figure 10). Qualitatively, these differences are consistent with derivation of these basalts from a garnet-bearing source with the alkalic lavas resulting from a smaller degree of melting.
Abundance ratios of highly incompatible elements will not be affected by segregation or accumulation of olivine and pyroxene. In Figure 11 abundance ratios for elements with very similar incompatibility (normalized to the primitive mantle ratios of Sun and McDonough [1989]) are shown as a function of incompatible element abundance. Variations in these ratios and comparisons with primitive mantle estimates have important implications for the petrogenesis of Mauna Kea lavas.
Sr/Nd and Ti/Eu. The elements Sr and Ti are compatible in plagioclase and Fe-Ti oxides, respectively. Because these are important crystallizing phases during the crustal evolution of Mauna Kea lavas, these elements can be used to identify samples that have experienced significant amounts of crystal fractionation within the crust. For example, Sr/Nd ratios are slightly higher than the chondritic ratio in most Mauna Kea basalts, but with increasing differentiation, i.e., increasing P205 content, Sr/Nd decreases with relatively low Sr/Nd in the high Fe-Ti basalts. This trend reflects segregation of plagioclase. Surprisingly, the MgO-rich dredged tholeiites, also define a trend to low Sr/Nd with increasing P205 content (sample 1-8 contains 10.9% MgO, but it has the lowest Sr/Nd ratio).
Sun and McDonough [1989] found that Ti/Eu ratios in most basalts are -7740, and this ratio is close to the mean value for
Mauna Kea lavas. However, seven samples have anomalously low TiO2/Eu, a dredged shield tholeiite, 1-8; three alkalic Hamakua basalts from Laupahoehoe Gulch (LP- 1, -7 and -8) and three evolved, alkalic Hamakua lavas (H17 and 17B from the upper part of Waikahalulu Gulch and NO-9 from the west flank [Frey et al., 1990]). The simplest interpretation is that Fe-Ti oxides segregated from these samples. This is a surprising result for the MgO-rich shield tholeiite 1-8 and the three alkalic basalts from Laupahoehoe Gulch (7.8 to 8.6% MgO). However, the anomalously low Ti/Eu are accompanied by relatively low Sr/Nd. Therefore, we conclude that these relatively high MgO samples have had a complex crustal history, perhaps mixing of relatively primitive and highly evolved lavas. The resorbed sodic plagioclase in shield sample 1-8 (Tables 3 and 4c) is consistent with a mixing process.
Nb/La, Nb/U, Nb/Th and Ce/Pb (Data for U, Th and Pb determined by isotopic dilution are in Kennedy et al. [ 1991]). All of the shield and postshield basalts have Nb/La higher than the bulk earth/chondritic ratio of 1.04; an exception is evolved Hamakua lava MU-17 which is anomalously enriched in La (La/Ce = 0.51). In general, relatively high abundances of Nb and Ta but lower abundances of Th and U are typical of Mauna Kea basalts (Figure 10) and OIB in general [e.g., Hofmann et al., 1986]. Ratios of Nb/U are greater than chonddtic in all Mauna Kea lavas, but they range widely, 35 to 110, because of U loss during low temperature alteration [Kennedy et al., 1991]. Ratios of Nb/Th which are less affected by alteration are more uniform, 13.0 to 17.7, in the 10 samples analyzed for Th by isotope dilution [Kennedy et al., 1991] and overlap the average (15.2) for Hawaiian lavas reported by Hofmann [1986]. These values are much higher than the chondritic value of 8.6. In addition, the marked relative depletion of Pb in postshield Mauna Kea lavas (Figure 10) reflects the Pb depletion that is characteristic of OIB and MORB [Hofmann et al., 1986]. In fact, Ce/Pb ratios in most Mauna Kea lavas are even higher,-40, [Kennedy et al., 1991], than in most OIB, 25+5 and much higher than estimates, -9, for primitive mantle [Hofmann et al., 1986].
Zr/Hf, Sm/Hf and Sm/Zr. All of the Mauna Kea lavas have

Frey et al.: Evolution of Mauna Kea Volcano 14,365
I I I I I I I I I I I I I I I I I I I I I I ,.50 - , Postshield (Hamakua) -
_• Alkalic Basalt (MU-5) = ß 30 ]• •leiitic Basalt MU-8) :X -
• lo F
5 To 0.93
> /I ,I, I I I I I I I I I I I I I I
- I- k- 30 ge of 8 Mauna Kea -- ß ß Shield Tholeiitic Lavas
• 20 ß FF ß ß F1 ß • lo
<r 5
2 Depleted MORB KILAUFA BHVO-I: ß
[lb Ba Th U Nb To K La Ce Pb SF P Nd ZF Hf Sm Fu Ti Tb Dy Y Yb Lu
Fig. 10. Incompatible element abundances in Mauna Kea lavas normalized to primitive mantle estimates [Hofmann, 1988]. Lower panel shows field for shield tholeiites compared with a MORB average from Hofmann [1988]. The shield lavas define a generally convex-upwards pattern with valleys at K and P. Shown for comparison are data for BHVO-1 from Kilauea Volcano. Upper panel shows patterns for typical Hamakua Volcanics, alkali basalt MU-5, and tholeiitic basalt MU-8. The K and Rb depletions in MU-8 reflect alkali loss during postmagmatic alteration. Data for Th, U, and Pb from Kennedy et al. [ 1991].
higher Zr/Hf than the primitive mantle/chondritic ratios of--36; specifically, the seven shield samples range in Zr/Hf from to 43 and Hamakua lavas range from --41 to 47. Although a systematic analytical error is possible, Budahn and Schmitt [1985] report a similar range (average 45.1) for Mauna Kea lavas. Ratios of Sm/Hf in the shield and postshield lavas are very similar and their average is close to the primitive mantle/chondritic ratio of 1.44. In contrast, all Mauna Kea shield and postshield lavas have Sm/Zr ratios (0.033+0.002 in the shield samples) less than the primitive mantle/chondritic ratio of 0.040. Therefore, the relatively high Zr/Hf ratio in Mauna Kea lavas is caused by relatively high Zr contents. Either the source of Mauna Kea lavas has relatively high Zr/Hf or Hf was preferentially retained in the residue during partial melting. The Kilauea sample BHVO-1 used as a geochemical standard also has Sm/Zr _< 0.035 (e.g., Table l d of Frey et al. [1990]).
P/Nd. The bulk Earth abundance of P is difficult to estimate. However, Sun and McDonough [ 1989], report that P/Nd = 74+13 in MORB and OIB. In contrast, P/Nd is less than 70 in all Mauna Kea lavas; e.g., P/Nd is 48.8 to 58.7 in the eight shield tholeiites. Kilauea sample BHVO-1 also has a low P/Nd ratio (47.3); therefore, the relatively low P/Nd in Mauna Kea lavas is not an analytical bias.
Ba/Rb and Ba/Nb. The Ba/Rb range, 12.0 to 14.6 in seven shield tholeiites lies between the mean MORB ratio 11.4 [Hofmann and White, 1983] and the average value 14.7+1.4 given by Hofmann [1986] for Hawaiian tholeiitic basalts. These values are close to the primitive mantle estimate of 11.3 [Hofmann and White, 1983]. Also, Ba/Nb ratios in the postshield lavas are very similar to primitive mantle estimates.
In summary, Sr/Nd and Ti/Eu ratios show that some high MgO lavas are probably mixtures containing an evolved
component. However, the range of Sr/Nd, Ti/Eu, Ba/Nb, Sm/Hf and La/Ce in Mauna Kea basalts encompasses the estimates for primitive mantle, and most basalts have ratios that are within 20% of primitive mantle values. In contrast, the range of other ratios, such as Nb/La, Sm/Zr, Zr/I-If, P/Nd, Nb/Th and Pb/Ce, in Mauna Kea lavas does not encompass estimates for primitive mantle. These differences require a non-primitive mantle source or changes in abundance ratios caused by partial melting.
4.4. Shield Tholeiites: Implication for Primary Magma Composition and Relationship to Postshield Tholelites
The submarine lavas dredged from the Mauna Kea shield are MgO-rich tholeiites (9.4 to 16.8% MgO, Table 1) containing abundant olivine phenocrysts and microphenocrysts (9.8 to 27.8%, Table 3) and relatively low MgO glasses (5.3 to 6.7% [Garcia et al., 1989]). Several of these samples represent mixed magmas. Evidence for a mixing component with a relatively evolved composition is the wide range of olivine-phenocryst compositions (cores range from 78.5 to 90.4% Fo) and the reversely zoned olivine phenocrysts in samples 1-3 and 5-13 (Table 4a). Also sample 1-8 contains sodic (An58), resorbed plagioclase (Table 4c), and the whole rock has the most extreme composition; compared to the other shield lavas it is anomalously enriched in incompatible elements (Figure 4), has anomalously low Ti/Eu and Sr/Nd (Figure 11) but relatively high A1203/CaO (e.g., Figure 12). These are characteristics of an evolved basalt which has
fractionated plagioclase, clinopyroxene and Fe-Ti oxides. Also the glass in sample 1-8 has relatively low MgO (5.3%) and high K20, P205, and H20 contents (Garcia et al., 1989).

14,366 Frey et al.: Evolution of Mauna Kea Volcano
1.4
•.o
0.8
1.3 1.2
1.1 z
1.2
1.0
0.9
0.8
0.7 0.6
' 1.2
•, •.o
0.8
0.0
I x o
XMU-17
''' l' :'I ':' I'''
SH iLP_l,7, 8 ß :. I. :.I. :. I.:.
X M X X9 X-o x x -•C-74,75,76,77
'' :q : : : ', : : '. I ', ; .'
X x X.••.,
X X• X .•"•SHIELD
ß ß ,n4• •, ß ß I ß ß I I I I I
0.2 0.4 0.6 0.8
P205
1.1
-•, 0.8 ß • 0.7
0.6
1.4
0.9
0.8 0.7
•' 1.2
• •.o
0.8
[] Shield
x East Flank
0 West Flank
H Upper South Flank
Fe-Ti •. ß SHIELD • 1-8 HI71• HI7
LP-l,7,8 • NO-90
I' "$ II''' 11' : : I : : :
x
''' I :'' : ' '. '. I : '. '.
6-6
I • o • • s
LP-1,7,
X •-tJ47
M
SHIELD
x •
Xx x M xx
I x xx
gHELD •'q• ß
ß , , i , , , i , , , i , , i
0.0 0.2 0.4 0.6 0.8
P205
Fig. 11. Normalized abundance ratios of elements with very similar incompatibility (in a peridotire-melt system) versus P205 content (wt. %) in shield lavas from the submarine east rift and basaltic postshield lavas from the east, west and upper south flanks. Normalization ratios (see vertical axis) are estimates of primitive mantle ratios from Sun and McDonough [ 1989]. Important features are that many Mauna Kea lavas have Sr/Nd, Ti/Eu, Nb/La, Sm/Hf, La/Ce and Ba/Nb ratios similar to primitive mantle ratios. However, the shield lavas have relatively low Ba/Nb, Ba/La and La/Ce (except for sample 1-8, which also has the lowest Sr/Nd and Ti/Eu). In general, alkalic postshield basalts have >0.35% P205. Alkalic samples LP-1, -7 and -8, have relatively low Sr/Nd and Ti/Eu). Sample MU-17 has an anomalously high La content (La/Ce, not plotted, is 0.51), and it may be contaminated. The low P/Nd for C74, C75, C76 and C77 reflects anomalously low P205 data from Macdonald and Katsura [ 1964]. Data for shield and east flank Hamakua Volcanics from this paper; data for Hamakua Volcanics from the west flank and Waikahalulu Gulch from Frey et al. [1990] except for the following data (ppm) which were incorrectly reported in Table lb of Frey et al. [1990] [sample 65-3: Ba = 226; sample H-14: Sr = 557, Ba = 302, Th = 1.9, sample 65-4: Sr = 587, sample H-15: Ba = 324, Nb = 31.4]. Error ranges indicate + 1 standard deviation based on replicate analyses of BHVO- 1.

Frey et al.: Evolution of Mauna Kea Volcano 14,367
2O
15
10
x x x x
X•x Xx•xx XX "•' /)•Xx
,---Chondrites X {e(X xX • • X•Lp-'
Shie Id• X ' Tholeiites
1-8 Hi Fe-Ti Bosolt
0.5 1.0 1.5 2.0
AI203/CoO Fig. 12. Sr/Nd versus A1203/CaO for dredged shield samples (solid circles) and all Hamakua Volcanics from the east flank (crosses). The most evolved lavas have low Sr/Nd and high A1203/CaO, and this trend reflects plagioclase and clinopyroxene control.
We conclude that the bulk rock is a mixture of an evolved magma and olivine.
The MgO content of the most primitive melt can be inferred from the most forsterite-rich olivine (90.5 in sample 6-18, Table 4a) by using an olivine/melt KD for Fe/Mg (e.g., 0.3) and assuming an FeO content for the primitive melt equal to that in sample 6-18. The latter assumption is reasonable because FeO contents of basaltic lavas are not sensitive to accumulation or fracfionafion of olivine [e.g., Langmuir and Hanson, 1980, p. 392]. As an example, the total Fe content in the eight shield lavas varies only by 9% (relative) as MgO varies from 9.4 to 16.9% (Table 1). The inferred MgO content of the equilibrium lava for Fo90.5 olivine ranges from 14.4% to 17.0% for a range in FeO/(FeO+0.9 Fe203) from the commonly assumed value of 0.85 to the maximum value of 1. This MgO range is similar to estimates for Hawaiian primary tholeiific magmas (12-15% for Mauna Loa, Kilauea, and Kauai [Wilkinson and Hensel, 1988; Nicholls and Stout, 1988; Maaloe et al., 1989 and 16.6% for Haleakala Volcano [Chen, 1990]).
We have 87Sr/86Sr data for only two shield samples, 0.70365 for 1-8 and 0.70350 for 6-6. These values are significantly different, but they overlap the range found in Hamakua lavas (0.70336 to 0.70361 [Kennedy et al., 1991]). Some abundance ratios involving elements of very similar incompatibility in a peridotite-melt system are also similar in the shield (except for 1-8) and postshield basalts; e.g., Ti/Eu, Nb/La, Sm/Zr and Sm/Hf (Figure 11). However, the shield lavas have lower Ba/Nb, Ba/La and La/Ce (except for 1-8, Figure 11). These ratios in the shield lavas are lower than chondrific ratios whereas the postshield lavas have chondritic (Ba/Nb) or greater than chondrific ratios (Ba/La and La/Ce). Thus, the shield lavas have a more depleted character. These differences in incompatible element ratios must reflect differences in source composition or a range in degree of melting. The Sr isotopic similarity of shield and postshield lavas provides no evidence for different source components, but this inference must be evaluated with more isotopic data for the shield samples. If the same source components are
involved, the different incompatible element abundance ratios require that the shield lavas were derived by higher degrees of melting.
Possibly the sequence shield tholeiites-postshield tholeiites- postshield alkalic basalts represents a systematic decrease in degree of melting of a compositionally homogeneous source. For example, relative to postshield tholeiitic basalts the alkalic basalts have substantially higher La/Yb and Nb/Zr, (Figure 6) and similar La/Ce ratios (Figure 5). These differences are consistent with differences :_n peridotite/melt partition coefficients, and the hypothesis that the alkalic basalts formed by lower degrees of melting. Surprisingly, the differences between the shield and postshield tholeiitic lavas in BaJNb, Ba/La and LaJCe are much greater than the differences between postshield tholeiitic and postshield alkalic lavas (Figure 11). Because the largest change in abundance ratios of incompatible elements must occur at the lowest degrees of melting (e.g., Figure 13 of Chen et al. [1991]), the large differences in Ba/Nb, Ba/La and La/Ce between tholeiitic shield and postshield basalts require that the postshield tholeiitic basalts formed by significantly lower degrees of melting than the shield tholeiites. Alternatively, the postshield and shield basalts were derived from compositionally different sources.
4.5. Relationship Between Tholeiitic and Alkalic Mauna Kea Lavas
The relationship between tholeiitic and alkalic basalts is a classical problem in igneous petrology. Recent studies of Hawaiian lavas bear directly on this problem. For example, at Haleakala Volcano, Chen and Frey [1985] and Chen et al. [1991] found Sr and Nd isotopic differences between tholeiitic basalts (Honomanu Basalts) and the overlying postshield alkalic basalts (Kula Volcanics). However, at Mauna Kea Volcano the oldest subaerial postshield lavas are intercalated tholeiitic and alkalic basalt which have overlapping radiogenic isotopic ratios. This was first demonstrated for Pb isotopes by Tatsumoto [ 1978], who found that Pb isotopic ratios were the same within analytical error for two postshield lavas, an alkalic basalt (C-78) and tholeiitic basalt (C-74) from Laupahoehoe Gulch. More recently, Kennedy et al. [1991] showed that intercalated tholeiitic and alkalic postshield Mauna Kea lavas have very similar Sr, Nd and Pb isotopic ratios. Isotopically similar alkalic and tholeiitic basalts have also been found at Kohala Volcano (Pololu Basalt [Feigenson et al., 1983; Lanphere and Frey, 1987; Hofmann et al., 1987]) and Haleakala Volcano (Honomanu Basalt [Chen et al., 1991]).
Comparisons of incompatible element abundances in phenocryst-poor tholeiitic and alkalic Mauna Kea basalts with very similar isotopic ratios shows that the alkalic basalts have higher abundances of incompatible elements and MgO (Figure 13). Therefore, the incompatible element enrichments of the alkalic basalts were not caused by post-melting, crystal-melt fractionation. The simplest interpretation of these data are that these postshield tholeiitic and alkalic lavas formed from a compositionally homogeneous source by different degrees of melting. If this is a valid hypothesis, then the compositions of the lavas may be used to constrain the composition and mineralogy of the sources of the postshield lavas [e.g., Feigenson et al., 1983].
However, these Hamakua lavas are not primary basalts (i.e., postmelting processes have caused significant compositional changes). Thus the effects of post-melting processes, such as fractional crystallization, must be evaluated before the lava compositions can be inverted to constrain source characteristics. In order to minimize the uncertainties
resulting from the effects of fractional crystallization, we focus on abundance ratios of highly incompatible elements in lavas with A1203/CaO ratios ranging from 1.15 to 1.40 and assume that these samples have primarily been affected by olivine fractionation. (Most Hawaiian tholeiites have A1203/CaO in

14,368 Frey et al.' Evolution of Mauna Kea Volcano
2.0
o -1-
• 1.4
a3 1.2
0.8 Rb Ba Th
HAMAKUA (<3% Phenocryst) Tholeiite (LP-II) Alkalic (LP-8)-
MgO 6.05 8.55 Norm 2.5% Ql'z 0.2% Hy 87/86 Sr 0.70349 0.70357 143/144 Nd 0.513041 0.513026 206/204 Pb 18.419 18.413
K Ta Nb La Ce Sr Nd P Hi Zr Sm Ti Y Yb
2.O I 17
Rb
HAMAKUA (< 6% Phenocrys,) Tholeiil'e (MU 15) Alkalic (MU 5)
MgO 6.74 7.9:5 Norm 13%Hy 0.2% Ne 87/86 Sr 0.70346 0.70345 143/144 Nd 0.51;5034 0.51;5035 - 206/204 Pb 18.421 18.422
I I I Rb Ba Th K Ta Nb La Ce Sr Nd P Hf Zr Sm Ti Y Yb
Fig. 13. Incompatible element abundances in pairs of postshield tholeiitic and alkalic basalts (Hamakua Volcanics) with similar isotopic ratios (isotopic data from Kennedy et al. [1991]. In each case, the alkalic basalt has higher abundances of incompatible elements and a higher MgO content. The anomalous points for K and Rb reflect postmagmatic alteration.
this range; e.g., in a summary of average tholeiitic basalt compositions for 14 Hawaiian volcanoes, Kirkpatrick et al. [1980] found a range of 1.22 to 1.59. Also the chondritic ratio, perhaps characteristic of the primitive mantle source component is 1.23.) Within this A1203/CaO range there are 26 Hamakua lavas varying in MgO from-6% to 10%. Mauna Kea lavas with obvious complex or extensive crustal history, such as the ankaramites and high Fe-Ti basalts, have lower or higher A1203/CaO, respectively (Figure 3b). We could not use the more stringent criteria of selecting only samples with more than 7% MgO because most of the postshield tholeiitic
basalts have 6 to 7% MgO (Table 2). Although it is likely that Hawaiian lavas with 6 to 7% MgO have experienced olivine, plagioclase and clinopyroxene fractionation and many of these lavas have phenocrysts of all three phases (Table 3), it is difficult to properly correct for plagioclase and clinopyroxene fractionation. Rather than make poorly constrained fractionation corrections, we used Sr/Nd ratios to identify samples that may have fractionated plagioclase. Specifically, alkalic basalts LP-1,-7 and-8 have A1203/CaO at the high end (1.33 to 1.37) of the selected range, and they have atypically low Sr/Nd ratios (Figures 11 and 12). Therefore these
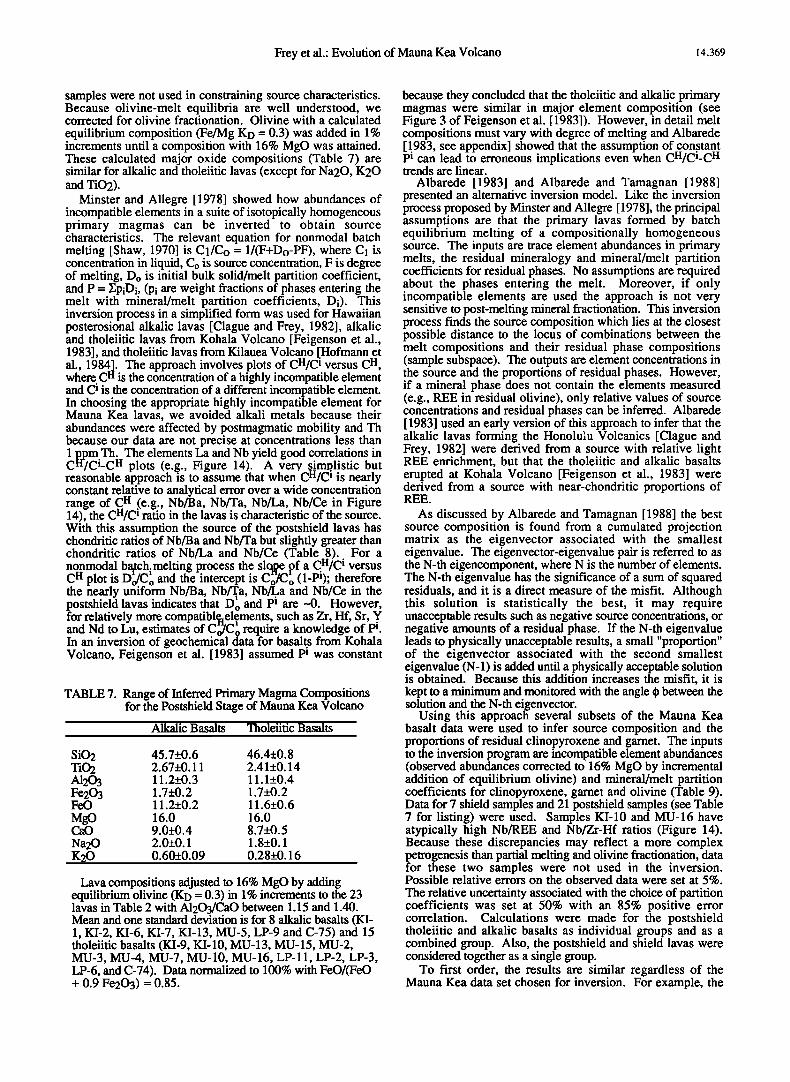
Frey et al.: Evolution of Mauna Kea Volcano 14,369
samples were not used in constraining source characteristics. Because olivine-melt equilibria are well understood, we corrected for olivine fractionation. Olivine with a calculated
equilibrium composition (Fe/Mg KD = 0.3) was added in 1% increments until a composition with 16% MgO was attained. These calculated major oxide compositions (Table 7) are similar for alkalic and tholeiitic lavas (except for Na20, K20 and TiO2).
Minster and Allegre [1978] showed how abundances of incompatible elements in a suite of isotopically homogeneous primary magmas can be inverted to obtain source characteristics. The relevant equation for nonmodal batch melting [Shaw, 1970] is C1/Co = 1/(F+Do-PF), where C1 is concentration in liquid, Co is source concentration, F is degree of melting, Do is initial bulk solid/melt partition coefficient, and P = ZpiDi, (Pi are weight fractions of phases entering the melt with mineral/melt partition coefficients, Di). This inversion process in a simplified form was used for Hawaiian posterosional alkalic lavas [Clague and Frey, 1982], alkalic and tholeiitic lavas from Kohala Volcano [Feigenson et al., 1983], and tholeiitic lavas from Kilauea Volcano [Hofmann et al., 1984j. The approach involves plots of CH/C • versus C H, where C a is the concentration of a highly incompatible element and C i is the concentration of a different incompatible element. In choosing the appropriate highly incompatible element for Mauna Kea lavas, we avoided alkali metals because their abundances were affected by postmagmatic mobility and Th because our data are not precise at concentrations less than 1 ppm Th. The elements La and Nb yield good correlations in CH-/ci-c H plots (e.g., Figure 14). A very simplistic but reasonable approach is to assume that when cH/c • is nearly constant relative to analytical error over a wide concentration range of C H (e.g., Nb/Ba, Nb/Ta, Nb/La, Nb/Ce in Figure 14), the cH/C i ratio in the lavas is characteristic of the source. With this assumption the source of the postshield lavas has chondritic ratios of Nb/Ba and Nb/Ta but slightly greater than chondritic ratios of Nb/La and Nb/Ce (Table 8). For a nonmodal batch. melting process the slope of a cH/c i versus C H plot is D•/C•o and the intercept is Co'n/C•o (1-ei); therefore the nearly uniform Nb/Ba, Nb/Ta, Nb/La and Nb/Ce in the postshield lavas indicates that D•o and pi are 4). However, for relatively more compatible. elements, such as Zr, Hf, Sr, Y ß I'l ! .
and Nd to Lu, eramates of C•/Co reqmre a knowledge of pi. In an inversion of geochemical data for basalts from Kohala Volcano, Feigenson et al. [1983] assumed pi was constant
TABLE 7. Range of Inferred Primary Magma Compositions for the Postshield Stage of Mauna Kea Volcano
Alkalic Basalts Tholeiitic Basalts
SiO2 45.7+0.6 46.4+0.8 TiO2 2.67+0.11 2.41+0.14 A1203 11.2+0.3 11.1+0.4 Fe203 1.7+0.2 1.7+0.2 FeO 11.2+0.2 11.6+0.6
mgO 16.0 16.0 CaO 9.0+0.4 8.7+0.5 Na20 2.0+0.1 1.8+0.1 K20 0.60-•-_0.09 0.28+0.16
Lava compositions adjusted to 16% MgO by adding equilibrium olivine (KD = 0.3) in 1% increments to the 23 lavas in Table 2 with A1203/CaO between 1.15 and 1.40. Mean and one standard deviation is for 8 alkalic basalts (KI- 1, KI-2, KI-6, KI-7, KI-13, MU-5, LP-9 and C-75) and 15 tholeiitic basalts (KI-9, KI-10, MU-13, MU-15, MU-2, MU-3, MU-4, MU-7, MU-10, MU-16, LP-11, LP-2, LP-3, LP-6, and C-74). Data normalized to 100% with FeO/(FeO + 0.9 Fe203) = 0.85.
because they concluded that the tholeiitic and alkalic primary magmas were similar in major element composition (see Figure 3 of Feigenson et al. [1983]). However, in detail melt compositions must vary with degree of melting and Albarede [ 1.983, see appendix] showed that the assumption of constant P• can lead to erroneous implications even when CH/ci-c H trends are linear.
Albarede [1983] and Albarede and Tamagnan [1988] presented an alternative inversion model. Like the inversion process proposed by Minster and Allegre [ 1978], the principal assumptions are that the primary lavas formed by batch equilibrium melting of a compositionally homogeneous source. The inputs are trace element abundances in primary melts, the residual mineralogy and mineral/melt partition coefficients for residual phases. No assumptions are required about the phases entering the melt. Moreover, if only incompatible elements are used the approach is not very sensitive to post-melting mineral fractionation. This inversion process finds the source composition which lies at the closest possible distance to the locus of combinations between the melt compositions and their residual phase compositions (sample subspace). The outputs are element concentrations in the source and the proportions of residual phases. However, if a mineral phase does not contain the elements measured (e.g., REE in residual olivine), only relative values of source concentrations and residual phases can be inferred. Albarede [ 1983] used an early version of this approach to infer that the alkalic lavas forming the Honolulu Volcanics [Clague and Frey, 1982] were derived from a source with relative light REE enrichment, but that the tholeiitic and alkalic basalts erupted at Kohala Volcano [Feigenson et al., 1983] were derived from a source with near-chondritic proportions of REE.
As discussed by Albarede and Tamagnan [1988] the best source composition is found from a cumulated projection matrix as the eigenvector associated with the smallest eigenvalue. The eigenvector-eigenvalue pair is referred to as the N-th eigencomponent, where N is the number of elements. The N-th eigenvalue has the significance of a sum of squared residuals, and it is a direct measure of the misfit. Although this solution is statistically the best, it may require unacceptable results such as negative source concentrations, or negative amounts of a residual phase. If the N-th eigenvalue leads to physically unacceptable results, a small "proportion" of the eigenvector associated with the second smallest eigenvalue (N-1) is added until a physically acceptable solution is obtained. Because this addition increases the misfit, it is kept to a minimum and monitored with the angle { between the solution and the N-th eigenvector.
Using this approach several subsets of the Mauna Kea basalt data were used to infer source composition and the proportions of residual clinopyroxene and garnet. The inputs to the inversion program are incompatible element abundances (observed abundances corrected to 16% MgO by incremental addition of equilibrium olivine) and mineral/melt partition coefficients for clinopyroxene, garnet and olivine (Table 9). Data for 7 shield samples and 21 postshield samples (see Table 7 for listing) were used. Samples KI-10 and MU-16 have atypically high Nb/REE and Nb/Zr-Hf ratios (Figure 14). Because these discrepancies may reflect a more complex petrogenesis than partial melting and olivine fractionation, data for these two samples were not used in the inversion. Possible relative errors on the observed data were set at 5%.
The relative uncertainty associated with the choice of partition coefficients was set at 50% with an 85% positive error correlation. Calculations were made for the postshield tholeiitic and alkalic basalts as individual groups and as a combined group. Also, the postshield and shield lavas were considered together as a single group.
To first order, the results are similar regardless of the Mauna Kea data set chosen for inversion. For example, the
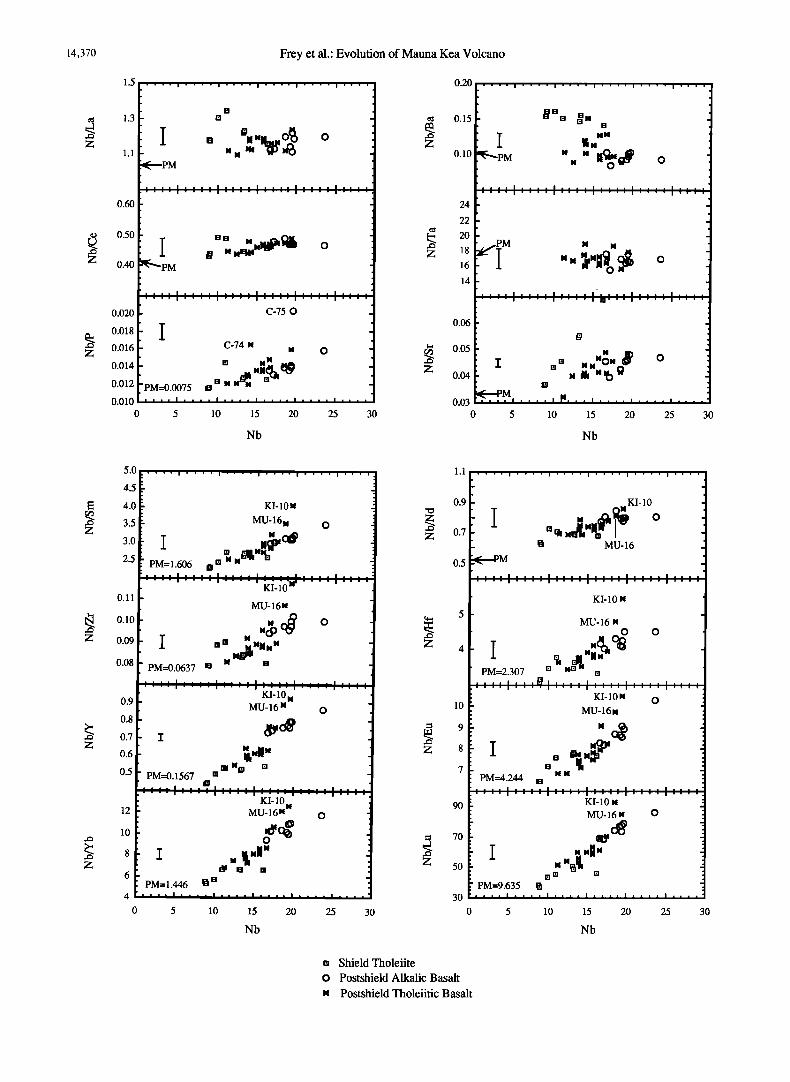
14,370 Frey et al.' Evolution of Mauna Kea Volcano
1.5
1.3
1.1
0.60
0.50
0.40
ß
O.O2O ß
0.018
0.016 ß
0.014 ß
0.012 ß
O.OLO
o
[] []
gt N NEI, H '•PM
C-75 O
i . .
C-74 N N O
•N N - []NN PM=0.0075 I•
ß
ß ß i i I .... I .... J .... I . ß i i J i i i i
5 10 15 20 25 30
Nb
0.15
0.10
24
22
20
18
16
14
0.06
0.05
0.03
0
•"•PM N
N []
NN •N N
.
N N I [] NN O# t 0
•-•PM N .... I .... I .... I ß ß i I I I I I I I I I I I
5 10 15 2O 25 3O
Nb
5.0
4.5
4.0
3.5
3.0
2.5
0.11
0.10
0.09
0.08
0.9
0.8
0.7
0.6
0.5
4
0
I PM=1.606
PM=0.0637 []
KI-10N
MU-16 N
[]NN
KI-10
MU-16N
[][] NNNN N []
PM=0.1567
KI-10
MU-16 N
NJl N rml Milli []
PM=1.446
KI-10
MU-16 N
O
N 1il NNN
10 15 20 25 30
1.1
0.9
Z 0.7
0.5
• 9
90
70
50
30
.... i .... i .... i .... i .... i ß ß ß ß ß ß
ß
KI-10
O
[] •! Ni N ' • MU-16 '
ß
ß
KI-10 N
MU-16 N
PM=2.307 [] N s :: ::',:: :0.', .... ', .... ','',,I,,,I
KI-10n O MU-16n
NN P•.2• •
:::::::::::::::::::::::::::: .... KI-10 N
•U-16 N O
I N N•
P•=•.6}5 •
5 10 15 20 25
Nb
30
[] Shield Tholerite
0 Postshield Alkalic Basalt
N Postshield Tholeiitic Basalt
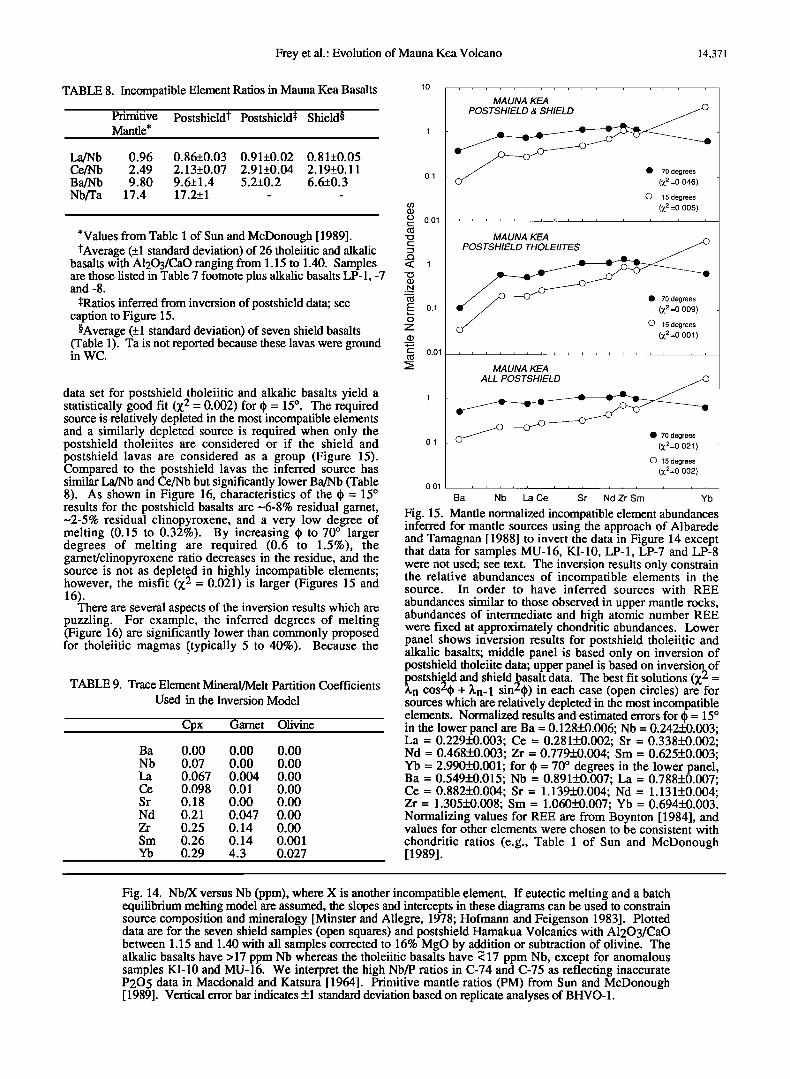
Frey et al.' Evolution of Mauna Kea Volcano 14,371
TABLE 8. Incompatible Element Ratios in Mauna Kea Basalts
Primitive Postshield• Postshield$ Shieldõ Man fie*
La/Nb 0.96 0.86+0.03 0.91+0.02 0.81+0.05 Ce/Nb 2.49 2.13+0.07 2.91+0.04 2.19+0.11 Ba/Nb 9.80 9.6+1.4 5.2+0.2 6.6+0.3 Nb/Ta 17.4 17.2+1 - -
0.1
co 0.01
*Values from Table 1 of Sun and McDonough [ 1989]. rAverage (+1 standard deviation) of 26 tholeiitic and alkalic
basalts with A1203/CaO ranging from 1.15 to 1.40. Samples < 1 are those listed in Table 7 footnote plus alkalic basalts LP-1 -7 and -8. ._•
$Ratios inferred from inversion of postshield data; see E 0.1 caption to Figure 15.
õAverage (+1 standard deviation) of seven shield basalts 7 (Table 1). Ta is not reported because these lavas were ground
0.01 in WC.
data set for postshield tholeiitic and alkalic basalts yield a statistically good fit (Z 2 = 0.002) for • = 15 ø. The required source is relatively depleted in the most incompatible elements and a similarly depleted source is required when only the postshield tholeiites are considered or if the shield and postshield lavas are considered as a group (Figure 15). Compared to the postshield lavas the inferred source has similar La/Nb and Ce/Nb but significantly lower Ba/Nb (Table 8). As shown in Figure 16, characteristics of the • = 15 ø results for the postshield basalts are -6-8% residual garnet, -2-5% residual clinopyroxene, and a very low degree of melting (0.15 to 0.32%). By increasing O to 70 ø larger degrees of melting are required (0.6 to 1.5%), the garnet/clinopyroxene ratio decreases in the residue, and the source is not as depleted in highly incompatible elements; however, the misfit (Z 2 = 0.021) is larger (Figures 15 and 16).
There are several aspects of the inversion results which are puzzling. For example, the inferred degrees of melting (Figure 16) are significantly lower than commonly proposed for tholeiitic magmas (typically 5 to 40%). Because the
TABLE 9. Trace Element Mineral/Melt Partition Coefficients Used in the Inversion Model
Cpx Garnet Olivine
Ba 0.00 0.00 0.00 Nb 0.07 0.00 0.00 La 0.067 0.004 0.00 Ce 0.098 0.01 0.00 Sr 0.18 0.00 0.00 Nd 0.21 0.047 0.00 Zr 0.25 0.14 0.00 Sm 0.26 0.14 0.001 Yb 0.29 4.3 0.027
0.1
0.01
MAUNA KEA
(Z2 =0.046)
0 15 degrees (x 2 =0.005)
MAUNA KEA
• • ß 70_ degrees ß • (Z2 =0'009)
0 15 degrees (Z2=0.001)
MAUNA KEA ALL POSTSHIELD
ß 70 degrees (Z2=0.021)
0 15 degrees (Z2=0.002)
Ba Nb La Ce Sr Nd Zr Sm Yb
Fig. 15. Mantle normalized incompatible element abundances inferred for mantle sources using the approach of Albarede and Tamagnan [1988] to invert the data in Figure 14 except that data for samples MU-16, KI-10, LP-1, LP-7 and LP-8 were not used; see text. The inversion results only constrain the relative abundances of incompatible elements in the source. In order to have inferred sources with REE
abundances similar to those observed in upper mantle rocks, abundances of intermediate and high atomic number REE were fixed at approximately chondritic abundances. Lower panel shows inversion results for postshield tholeiitic and alkalic basalts; middle panel is based only on inversion of postshield tholeiite data; upper panel is based on inversion of ostshi•ld and shield basalt data. The best fit solutions (Z 2 = n cosZO + 3m-1 sin2O) in each case (open circles) are for
sources which are relatively depleted in the most incompatible elements. Normalized results and estimated errors for • = 15 ø in the lower panel are Ba = 0.128_+0.006; Nb = 0.242_+0.003; La - 0.229_+0.003; Ce - 0.281_+0.002; Sr = 0.338_+0.002; Nd = 0.468+0.003; Zr = 0.779_+0.004; Sm - 0.625+0.003; Yb = 2.990_+0.001; for ½ = 70 ø degrees in the lower panel, Ba = 0.549_+0.015; Nb = 0.891_+0.007; La = 0.788_+0.007; Ce = 0.882_+0.004; Sr = 1.139_+0.004; Nd = 1.131_+0.004; Zr = 1.305_+0.008; Sm = 1.060_+0.007; Yb = 0.694_+0.003. Normalizing values for REE are from Boynton [1984], and values for other elements were chosen to be consistent with
chondritic ratios (e.g., Table 1 of Sun and McDonough [1989].
Fig. 14. Nb/X versus Nb (ppm), where X is another incompatible element. If eutectic melting and a batch equilibrium melting model are assumed, the slopes and intercepts in these diagrams can be used to constrain source composition and mineralogy [Minster and Allegre, 1978; Hofmann and Feigenson 1983]. Plotted data are for the seven shield samples (open squares) and postshield Hamakua Volcanics with A1203/CaO between 1.15 and 1.40 with all samples corrected to 16% MgO by addition or subtraction of elivine. The alkalic basalts have > 17 ppm Nb whereas the tholeiitic basalts have • 17 ppm Nb, except for anomalous samples KI-10 and MU-16. We interpret the high Nb/P ratios in C-74 and C-75 as reflecting inaccurate P205 data in Macdonald and Katsura [1964]. Primitive mantle ratios (PM) from Sun and McDonough [ 1989]. Vertical error bar indicates _+1 standard deviation based on replicate analyses of BHVO-1.
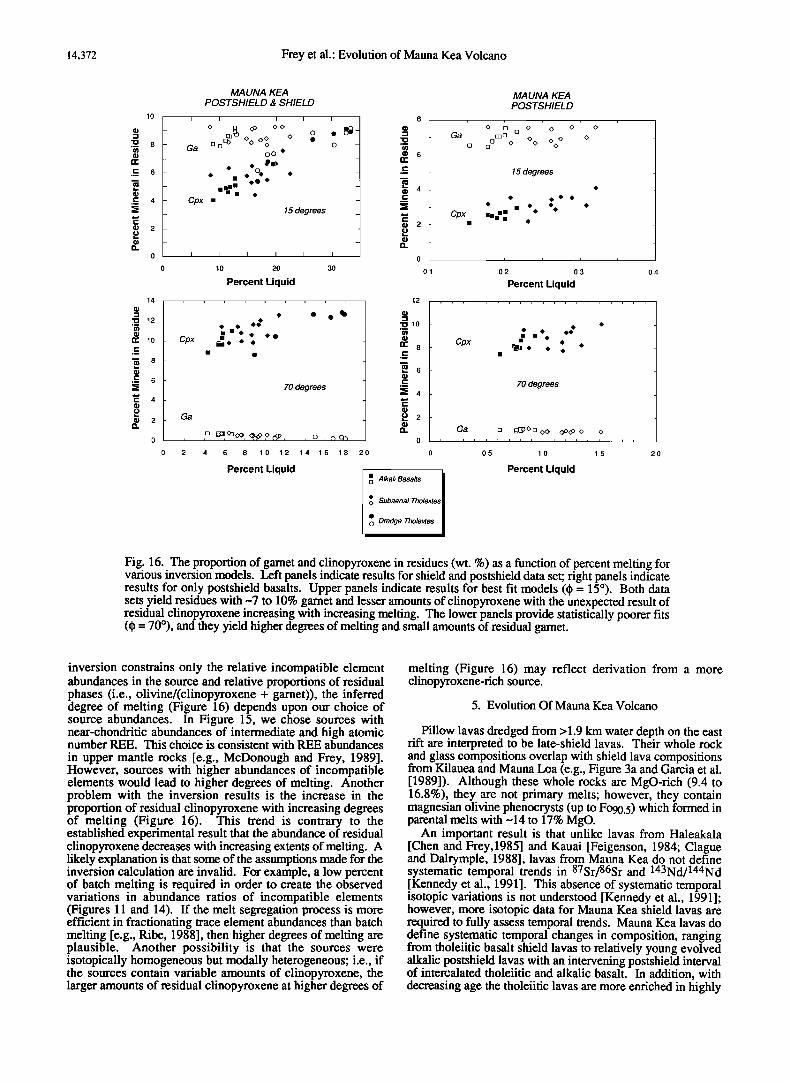
14,372 Frey et al.: Evolution of Mauna Kea Volcano
14
n- 10
._c • 8
.-• 6
•- 4
ß 2
MAUNA KEA POSTSHIELD & SHIELD
- Ga [] •q> o o o• o - oo
_ _
- ß ß ee øe ß - - Opx ß - _ 15 degrees _
_ _
_ _
I I I I I I
ß 10 .20 .30
Percent Liquid
Cpx
Sa
70degrees
0.1
Sa
Cpx
MAUNA KEA POSTSHIELD
15 degrees
--:: o
02 03 04
Percent Liquid
70degrees
.4 .6 .8 1.0 1.2 1.4 1.6 1.8 2 0 0 0.5 1.0
Percent Liquid Percent Liquid
Ga [] G;• ::•øu o,o co, d> o o
ß Alkali Basalts
• Subaerial Tholeiites
ß Dredge Tholelites o
1.5 2.0
Fig. 16. The proportion of garnet and clinopyroxene in residues (wt. %) as a function of percent melting for various inversion models. Left panels indicate results for shield and postshield data set; right panels indicate results for only postshield basalts. Upper panels indicate results for best fit models (• = 15ø). Both data sets yield residues with -7 to 10% garnet and lesser amounts of clinopyroxene with the unexpected result of residual clinopyroxene increasing with increasing melting. The lower panels provide statistically poorer fits (• = 70ø), and they yield higher degrees of melting and small amounts of residual garnet.
inversion constrains only the relative incompatible element abundances in the source and relative proportions of residual phases (i.e., olivine/(clinopyroxene + garnet)), the inferred degree of melting (Figure 16) depends upon our choice of source abundances. In Figure 15, we chose sources with near-chondritic abundances of intermediate and high atomic number REE. This choice is consistent with REE abundances
in upper mantle rocks [e.g., McDonough and Frey, 1989]. However, sources with higher abundances of incompatible elements would lead to higher degrees of melting. Another problem with the inversion results is the increase in the proportion of residual clinopyroxene with increasing degrees of melting (Figure 16). This trend is contrary to the established experimental result that the abundance of residual clinopyroxene decreases with increasing extents of melting. A likely explanation is that some of the assumptions made for the inversion calculation are invalid. For example, a low percent of batch melting is required in order to create the observed variations in abundance ratios of incompatible elements (Figures 11 and 14). If the melt segregation process is more efficient in fractionating trace element abundances than batch melting [e.g., Ribe, 1988], then higher degrees of melting are plausible. Another possibility is that the sources were isotopically homogeneous but modally heterogeneous; i.e., if the sources contain variable amounts of clinopyroxene, the larger amounts of residual clinopyroxene at higher degrees of
melting (Figure 16) may reflect derivation from a more clinopyroxene-rich source.
5. Evolution Of Mauna Kea Volcano
Pillow lavas dredged from > 1.9 km water depth on the east rift are interpreted to be late-shield lavas. Their whole rock and glass compositions overlap with shield lava compositions from Kilauea and Mauna Loa (e.g., Figure 3a and Garcia et al. [1989]). Although these whole rocks are MgO-rich (9.4 to 16.8%), they are not primary melts; however, they contain magnesian olivine phenocrysts (up to Fo90.5) which formed in parental melts with ~14 to 17% MgO.
An important result is that unlike lavas from Haleakala [Chen and Frey, 1985] and Kauai [Feigenson, 1984; Clague and Dalrymple, 1988], lavas from Mauna Kea do not define systematic temporal trends in 87Sr/86Sr and 143Nd/144Nd [Kennedy et al., 1991]. This absence of systematic temporal isotopic variations is not understood [Kennedy et al., 1991]; however, more isotopic data for Mauna Kea shield lavas are required to fully assess temporal trends. Mauna Kea lavas do define systematic temporal changes in composition, ranging from tholeiitic basalt shield lavas to relatively young evolved alkalic postshield lavas with an intervening postshield interval of intercalated tholeiitic and alkalic basalt. In addition, with decreasing age the tholeiitic lavas are more enriched in highly
Frey et al.: Evolution of Mauna Kea Volcano 14,373
incompatible elements. If a common source composition is assumed for the late shield and postshield tholeiites, the lower incompatible element content of the shield tholeiites and their lower Barb, Ba/La and La/Ce ratios require that the shield tholeiites formed by significantly higher degrees of melting.
During the basaltic substage of postshield volcanism, tholeiitic and alkalic basalts with very similar isotopic ratios (Sr, Nd and Pb) were erupted. During this growth stage eruption rates were decreasing precipitously [Frey et al., 1990], presumably reflecting a decreasing magma supply as Mauna Kea moved away from the mantle plume. As a result, it is plausible that basalts of similar age formed by significantly different degrees of melting thereby forming stratigraphic sections of intercalated tholeiitic and alkalic basalt. The
basaltic substage also includes high Fe-Ti basalts which formed principally by crystal-melt segregation at shallow crustal levels. Eventually, the decrease in eruption and magma production rates led to crystallization of shallow magma chambers, cessation of basaltic eruptions and stagnation of basaltic magma deep within the crust. Cooling and extensive mineral-melt segregation at lower crustal pressures formed the evolved, low density, alkalic lavas which comprise the hawaiitic substage of postshield volcanism on Mauna Kea Volcano [Frey et al., 1990].
6. Implications For The Generation Of Hawaiian Basalts
Important questions are (1) Was the source or mixture of source components enriched in incompatible elements relative to a primitive mantle composition? (2) What was the range in degree of melting? (3) Were residual garnet and clinopyroxene important in controlling melt composition?
From a geochemical perspective the first two questions are inter-related. The principal facts are that Hawaiian shield lavas are enriched in incompatible elements relative to MORB (e.g., Figure 10), and they have Sr and Nd isotopic ratios; consistent with long-term depletion in highly incompatible elements (i.e., Rb/Sr and Nd/Sm less than bulk Earth ratios). Therefore the observed enrichment of incompatible elements resulted from relatively small degrees of melting of a long-term depleted source or larger degrees of melting of a recently enriched source. To date, all inversion models based on the incompatible element contents of Hawaiian shield lavas require a source that is relatively depleted in highly incompatible elements [e.g., Albarede, 1983; Feigenson et al., 1983; Hofmann et al., 1984; Budahn and Schmitt, 1985; this paper]. Of course, this is a rigorous constraint only if the assumptions used in the inversion models are valid; e.g., batch melting of a source with uniform composition, isotopic ratios and modal mineralogy. Although the batch melting model is unrealistically simple, it is not evident that more complex melting models would require an enriched s9urce [e.g., Richter, 1986; Ribe, 1988].
Finally, the third question, particularly, the role of residual ghrnet is clearly answered by trace element abundances. Specifically, the relative uniformity of the fractionation corrected Y and HREE contents (Y = 24.1+1.6 ppm and Yb = 1.80-•-_0.11 pm in postshield Mauna Kea lavas, which range in Nb from 11.3 to 23.7 ppm) requires a residual phase that
m•n/melt > 1 preferentially incorporates Y and HREE, i.e., D . The only likely phase is garnet. Also, Hofmann et al. [ 1984] noted the uniformity of Yb in tholeiitic basalts from Kilauea, and they argued strongly that source and residues of Ki!auea basalts contain garnet.
Acknowledgments. Several individuals provided important contributions to our geochemical analysis program. We thank Elizabeth Neilsen for helping with sample collection along the Hamakua coast, C.-Y. Chen and Amy Moser for assistance in sample preparation, T. Furman, D. Gerlach, R. Hickey- Vargas, and D. Tormey for their efforts in obtaining XRF
data, R. Multhaup for assistance with microprobe analyses, and P. Ila in obtaining NA data. We thank J.M. Rhodes for access to the University of Massachusetts XRF lab, S. Hart for access to the MIT Mass Spectrometry Lab, and R. Price (LaTrobe University) for Fe+3/Fe +2 determinations, H.-J. Yang for assistance with graphics, and D. Frank for word processing. In addition, this paper benefitted from review comments by D. Clague, M. Feigenson, A. Hofmann, and M. Rutherford and discussions with T. Grove and T. Sisson. Neutron irradiations were done at MIT Nuclear Reactor. This research was supported by NSF grants EAR 8218982, EAR8419723, and EAR875809 to (F.A.F.), and EAR826787, OCE87167042 (M.O.G.) and EAR8018798 (W.S.W.). SOEST Contribution 2500.
References
Albarede, F., Inversion of batch melting equations and the trace element pattern of the mantle, J. Geophys. Res., 88, 10,573-10,583, 1983.
Albarede, F., and V. Tamagnan, Modelling the recent geochemical evolution of the Piton de la Fournaise Volcano, Reunion Island, J. Petrol., 29, 997-1030, 1988.
Baker, D.R., and D.H. Eggler, Fractionation paths of Atka (Aleutians) high alumina basalts: constraints from phase relations, J. Volcanol. Geotherm. Res., 18, 387-404, 1983.
Boynton, W.V., Cosmochemistry of the rare earth elements: meteorite studies, in Rare Earth Element Geochemistry, edited by P. Henderson, pp.63-114, Elsevier, New York, 1984.
Budahn, J.R., and R.A. Schmitt, Petrogenetic modeling of Hawaiian tholeiitic basalts: A geochemical approach, Geochim. Cosmochim. Acta, 49, 67-87, 1985.
Chen, C.-Y., High magnesium primary magmas from Haleakala Volcano, Hawaii, Eos Trans. A GU, 71,968, 1990.
Chen, C.-Y., and F.A. Frey, Trace element and isotopic geochemistry of lavas from Haleakala volcano, East Maui, Hawaii: Implications for the origin of Hawaiian basalts, J. Geophys. Res., 90, 8743-8768, 1985.
Chen, C.-Y., F.A. Frey, and M.O. Garcia, Evolution of alkalic lavas at Haleakala Volcano, East Maui, Hawaii: Major, trace element and isotopic constraints, Contrib. Mineral. Petrol., 105, 197-218, 1990.
Chen, C.-Y., F.A. Frey, M.O. Garcia, and B. Dalrymple, The tholeiite to alkalic basalt transition at Haleakala
Volcano, Maui, Hawaii: Petrogenetic interpretations based on major and trace element and isotope geochemistry, Contrib. Mineral. Petrol., 106, 183-200, 1991.
Clague, D.A., Hawaiian alkaline volcanism, in Alkaline Igneous Rocks, Geol. Soc. London Spec. Publ., 30, 227- 252, 1987.
Clague, D.A., and G.B. Dalrymple, The Hawaiian-Emperor Volcanic Chain, part 1, Geologic evolution, U.S. Geol. Surv. Prof. Pap., 1350, 5-54, 1987.
Clague, D.A., and G.B. Dalrymple, Age and petrology of alkalic postshield and rejuvenated-stage lava from Kauai, Hawaii, Contrib. Mineral. Petrol., 99, 202-218, 1988.
Clague, D.A., and F.A. Frey, Petrology and trace element geochemistry of the Honolulu Volcanics, Oahu: Implications for the oceanic mantle below Hawaii, J. Petrol., 23,447-504, 1982.
Clague, D.C., E.D. Jackson, and T.L. Wright, Petrology of Hualalai volcano, Hawaii: Implication for mantle composition, Bull. Volcanol., 43,641-656, 1980.
Coombs, D.S., and J.F.G. Wilkinson, Lineages and fractionation trends in undersaturated volcanic rocks from
the East Otago volcanic province (New Zealand) and related rocks, J. Petrol.• 10, 440-501, 1969.
14,374 Frey et al.: Evolution of Mauna Kea Volcano
Dzurisin, D., R.Y. Koyanagi, and T.T. English, Magma supply and storage at Kilauea Volcano, Hawaii, 1956- 1983, J. Volcanol. Geotherrn. Res.,21, 177-206, 1984.
Feigenson, M.D., Geochemistry of Kauai volcanics and a mixing model for the origin of Hawaiian alkali basalts, Contrib. Mineral. Petrol., 87, 109-119, 1984.
Feigenson, M.D., and F.J. Spera, Dynamical model for temporal variation in magma type and eruption interval at Kohala volcano,Hawaii, Geology, 9, 531-533, 1981.
Feigenson, M.D., A.W. Hofmann, and F.J. Spera, Case studies on the origin of basalt, II, The transition from tholeiitic to alkalic volcanism on Kohala volcano, Hawaii, Contrib. Mineral. Petrol., 84, 390-405, 1983.
Fodor, R.V., and H.J. Van der Meyden, Petrology of gabbroic xenoliths from Mauna Kea Volcano, Hawaii, J. Geophys. Res., 93, 4435-4452, 1988.
Frey, F.A., W.S. Wise, M.O. Garcia, H. West, S.-T. Kwon, and A. Kennedy, Evolution of Mauna Kea volcano, Hawaii: Petrologic and geochemical constraints on postshield volcanism, J. Geophys. Res., 95, 1271-1300, 1990.
Garcia, M.O., D. Muenow, and K.E. Aggley, Major element, volatile, and stable isotope geochemistry of Hawaiian submarine tholeiitic glasses, J. Geophys. Res., 94, 10,525- 10,538, 1989.
Helz, R.T., Diverse olivine types in lavas of the 1959 eruption of Kilauea Volcano and their bearing on eruption dynamics, U.S. Geol. Surv. Prof. Pap., 1350,. 691-722, 1987.
Hofmann, A.W., Nb in Hawaiian magmas: Constraints on source composition and evolutuion, Chern. Geol., 57, 17- 30, 1986.
Hofmann, A.W., Chemical differentiation of the earth: the relationship between mantle, continental crust, and oceanic crust, Earth Planet. Sci. Lett., 90, 297-314, 1988.
Hofmann, A.W., and M.D. Feigenson, Case studies on the origin of basalt, I., Theory and reassessment of Grenada basalts, Contrib. Mineral. Petrol., 84, 382-389, 1983.
Hofmann, A.W., and W.M. White, Ba, Rb, and Cs in the Earth's mantle, Z. Naturforsch., 38a, 256-266, 1983.
Hofmann, A.W., M.D. Feigenson, and I. Raczek, Case studies on the origin of basalt, III., Petrogenesis of the Mauna Ulu eruption, Kilauea, 1969-1971, Contrib. Mineral. Petrol., 88, 24-35, 1984.
Hofmann, A.W., K.P. Jochum, M. Seufert, and W.M. White, Nb and Pb in oceanic basalts: New constraints on mantle evolution, Earth Planet. Sci. Lett., 79, 33-45, 1986.
Hofmann, A.W., M.D. Feigenson, and I. Raczek, Kohala revisited, Contrib. Mineral. Petrol., 95, 114-122, 1987.
Juster, T.C., T.L. Grove, and M. Perfit, Experimental constraints on the generation of Fe-Ti basalts, andesires and rhyodacites at the Galapagos spreading center, 85øW and 95øW, J. Geophys. Res., 94, 9251-9274, 1989.
Kennedy, A.K., S.-T. Kwon, F.A. Frey, and H.B. West, The isotopic composition of postshield lavas from Mauna Kea volcano, Hawaii, Earth Planet. Sci. Lett., 103,339- 353, 1991.
Kirkpatrick, R.J., D.A. Clague, and W. Freisen, Petrology and geochemistry of volcanic rocks, DSDP leg 55, Emperor Seamount Chain, Initial Rep. Deep Sea Drill. Proj., 55, 509-557, 1980.
Langenheim, V.A.M., and D.A. Clague, The Hawaiian- Emperor Volcano Chain, part 2, Stratigraphic framework of volcanic rocks of the Hawaiian Islands, U.S. Geol. Surv. Prof. Pap., 1350, 55-84, 1987.
Langmuir, C.H., and G.N. Hanson, An evaluation of major element heterogeneity in the mantle sources of basalts, Philos. Trans. R. Soc. London. Ser. A., 247, 383-407, 1980.
Lanphere, M., and F.A. Frey, Geochemical evolution of Kohala Volcano, Hawaii, Contrib. Mineral. Petrol., 95, 100-112, 1987.
LeBas, M.J., R.W. LeMaitre, A. Streckeisen, and B. Zanettin, A chemical classification of volcanic rocks based on the total alkali-silica diagram, J. Petrol., 27, 745-750, 1986.
Maaloe, S., I.B. Sorensen, and J. Hertogen, The trachybasaltic suite of Jan Mayen, J. Petrol., 27, 439-468, 1986.
Maaloe, S., O. Tumyr, and D. James, Population density and zoning of olivine phenocrysts in tholeiites from Kauai, Hawaii, Contrib. Mineral. Petrol., 101,176-186, 1989.
Macdonald, G.A., Petrography of the Island of Hawaii, U.S. Geol. Surv. Prof. Pap., 214-D, 96 pp., 1949.
Macdonald, G.A., and T. Katsura, Chemical compositions of Hawaiian lavas, J. Petrol., 5, 82-133, 1964.
Mahood, G.C., and D.R. Baker, Experimental constraints on depths of fractionation of mildly alkalic basalts and associated felsic rocks: Pantelleria, Strait of Sicily, Contrib. Mineral. Petrol., 93, 251-264, 1986.
McDonough, W.F., and F.A. Frey, Rare earth elements in upper mantle rocks, Geochemistry and Mineralogy of Rare Earth Elements, eds. B.R. Lipin and G.A. McKay, Rev. Mineral., 21, 99-145, 1989.
Minster, J.F., and C.J. Allegre, Systematic use of trace elements in igneous processes, part III, Inverse problem of batch partial melting in volcanic suites, Contrib. Mineral. Petrol., 68, 37-52, 1978.
Moore, J.G., Rate of palagonization of submarine basalt adjacent to Hawaii, U.S. Geol. Surv. Prof. Pap., 550-D, D163-D171, 1966.
Moore, J.G., and J.F. Campbell, Age of tilted reefs, Hawaii, J. Geophys. Res., 92, 2641-2646, 1987.
Moore, R.E., D.A. Clague, M. Rubin, and W.A. Bohrson, Hualalai Volcano: A preliminary summary of geologic, petrologic and geophysical data, U.S. Geol. Surv. Prof. Pap., 1350, 571-585, 1987.
Nicholls, J., and M.Z. Stout, Picritic melts in Kilauea - Evidence from the 1967-68 Halemaumau and Hidaka eruptions, J. Petrol., 29, 1031-1057, 1988.
Porter, S.C., Quaternary stratigraphy and chronology of Mauna Kea, Hawaii, Geol. Soc. Am. Bull., part II, 90, 980-1093, 1979.
Rhodes, J.M., K.P. Wenz, C.A. Neal, J.W. Sparks, and J.P. Lockwood, Geochemical evidence for invasion of Kilauea's plumbing system by Mauna Loa magma, Nature, 337, 257- 260, 1989.
Ribe, N.M., Dynamical geochemistry of the Hawaiian plume, Earth Planet. Sci. Lett., 881, 37-46, 1988.
Richter, F.M., Simple models for trace element fractionation during melt segregation, Earth Planet. Sci. Lett., 77, 333- 344, 1986.
Shaw, D.M., Trace element fractionation during anatexis, Geochirn. Cosrnochirn. Acta, 34, 237-243, 1970.
Spengler, S.R., and M.O. Garcia, Geochemistry of the Hawi lavas, Kohala Volcano, Hawaii, Contrib. Mineral. Petrol., 99, 90-104, 1988.
Spulber, S.D., and M.J. Rutherford, The origin of rhyolite and plagiogranite in oceanic crust: An experimental study, J. Petrol., 24, 1-25, 1983.
Steams, H.T., and G.A. Macdonald, Geology and ground- water resources of the island of Hawaii, Hawaii D.V. Hydrogr. Bull., 9, 363 pp., 1946.
Sun, S.-S., and W.F. McDonough, Chemical and isotopic systematics of oceanic basalts: Implications for mantle composition and processes, in Magmatism in the Ocean Basins, eds. A.D. Saunders and M.J. Norry, Geol. Soc. Spec. Publ., London,42,313-345, 1989.
Tatsumoto, M., Isotopic composition of lead in oceanic basalt and its implication to mantle evolution, Earth Planet. Sci. Lett., 38, 63-87, 1978.
Thompson, R.N., and M.F.J. Flower, One-atmosphere melting and crystallization relations of lavas from Anjouan,
Frey et al.: Evolution of Mauna Kea Volcano 14,375
Comores Archipelago, eastern Indian Ocean, Earth Planet. Sci. Lett., 12, 97-107, 1971.
West, H.B., M.O. Garcia, F.A. Frey, and A. Kennedy, Nature and cause of compositional variation among the Alkalic Cap Lavas of Mauna Kea Volcano, Hawaii, Contrib. Mineral. Petrol., 100, 383-387, 1988.
Wilkinson, J.F.G., and H.D. Hensel, The petrology of some picrites from Mauna Loa and Kilauea Volcanoes, Hawaii, Contrib. Mineral. Petrol., 98, 326-345, 1988.
Wolfe, E.W., B. Dalrymple, and W.S. Wise. The geology and petrology of Mauna Kea Volcano: A study of postshield volcanism, U.S. Geol. Prof. Pap., in press, 1991.
Wright, T.L., Chemistry of Kilauea and Mauna Loa lava in space and time, U.S. Geol. Surv. Prof. Pap., 735, 40 pp., 1971.
Wright, T.L., Origin of Hawaiian tholeiite: A metasomatic model, J. Geophys. Res., 89, 3233-3252, 1984.
F. Albarede, Centre de Recherches Petrographiques et Geochimiques and Ecole Nationale Superieure de Geologie Vandoeuvre, FRANCE 54501.
F.A. Frey, P. Gurriet, and A. Kennedy, Department of Earth, Atmospheric, and Planetary Sciences Massachusetts Institute of Technology, Cambridge, MA 02139.
M.O. Garcia, Department of Geology and Geophysics, University of Hawaii, Honolulu, HI 96822.
W.S. Wise, Department of Geological Sciences, University of California, Santa Barbara, CA 93106
(Received June 12, 1990; revised March 29, 1991;
accepted March 29, 1991.)
Copyright © 2022 FDOKUMEN