Updating the 1/50.000 geological maps of IGME with remote sensing data, marine geology data, GPS...
11
Updating the 1/50.000 geological maps of IGME with Remote Sensing data, Marine Geology data, GPS measurements and GIS techniques. The case of KEA Island Konstantinos G. Nikolakopoulos *a , Panagiotis I. Tsombos a Dimitrios Mitropoulos a , Alexandra Zervakou a , Bernhard Grasemann b , Christoph Iglseder b , Konstantin Petrakakis b , Monica Müller b , A. Hugh N. Rice b , Klaus Voit b , Andras Zámolyi b and Erich Draganits c a Institute of Geology & Mineral Exploration (IGME), Olympic Village Entrance C, 13677 Acharnae, Greece, [email protected] b University of Vienna, Department of Geodynamics & Sedimentology, Vienna, Austria, c University of Technology, Institute for Engineering Geology, Vienna, Austria, ABSTRACT In this study the combined use of field mapping and measurements, remote sensing data analysis and GIS techniques for the geological mapping of KEA Island at a 1/50.000 scale, is presented. The geological formations, geotectonic units and the tectonic structure were recognized in situ and mapped. Interpretation of high resolution satellite images (Quickbird) and medium resolution satellite images (Landsat 7 ETM and ASTER) has been carried out in order to detect the linear or not structures of the study area. The in situ mapping was enhanced with data from the digital processing of the satellite data. Marine geology data such as bathymetric data and seismic profiles were also taken into account. All the analogical and digital data were imported in a geodata base specially designed for geological data. After the necessary topological control and corrections the data were unified and processed in order to create the final layout at 1/50.000 scale. Keywords: KEA Island, geological mapping, satellite images, GIS 1. INTRODUCTION The basic cartographic scale for geological mapping at the Institute of Geological and Mineral Exploration of Greece (IGME) is 1:50,000; at this scale, the whole country has been covered, by 325 map sheets (Figure 1). Field work for these maps was undertaken during the last six decades, by both Greek and other geologists. As a result of this procedure, there are still significant problems regarding the standardisation of geological terms (lithostratigraphic and structural names) and about where the stratigraphic and tectonic boundaries lie within Greece. In many regions, it has been noted that adjacent geological maps show marked inconsistencies at their boundaries. These have arisen because the different geologists, working at different times, have interpreted their mapping with different geological and geotectonic models. A particular problem is that the currently used model for the geotectonic zones of Greece was developed after 1970. The Institute of Geological and Mineral Exploration of Greece (I.G.M.E), acting within the framework of CSF 2000– 2006 (Community Support Framework 2000-2006, Operational Program Competitiveness, Priority axis 7: Energy and Sustainable Development, Measure 7.3: Exploitation of natural recourses and support in meeting environmental commitments, Action 7.3.1) has been implementing a project called “Collection, codification and documentation of geothematic information for urban and suburban areas in Greece - pilot applications”. The sixth sub-project has been concerned with updating fifty 1:50,000 geological map sheets, using GIS and remote sensing techniques. The geological map sheet, Kea Island, has been included in the updating project and a new geological map is being produced by IGME, in collaboration with the University of Vienna. Remote Sensing for Environmental Monitoring, GIS Applications, and Geology IX, edited by Ulrich Michel, Daniel L. Civco, Proc. of SPIE Vol. 7478, 74780O · © 2009 SPIE · CCC code: 0277-786X/09/$18 · doi: 10.1117/12.830268 Proc. of SPIE Vol. 7478 74780O-1
-
Upload
independent -
Category
Documents
-
view
1 -
download
0
Transcript of Updating the 1/50.000 geological maps of IGME with remote sensing data, marine geology data, GPS...

Updating the 1/50.000 geological maps of IGME with Remote Sensing data, Marine Geology data, GPS measurements and GIS techniques.
The case of KEA Island
Konstantinos G. Nikolakopoulos*a, Panagiotis I. Tsombosa Dimitrios Mitropoulosa, Alexandra Zervakoua, Bernhard Grasemannb, Christoph Iglsederb, Konstantin Petrakakisb, Monica Müllerb, A.
Hugh N. Riceb, Klaus Voitb, Andras Zámolyib and Erich Draganitsc aInstitute of Geology & Mineral Exploration (IGME), Olympic Village Entrance C,
13677 Acharnae, Greece, [email protected] bUniversity of Vienna, Department of Geodynamics & Sedimentology, Vienna, Austria, cUniversity of Technology, Institute for Engineering Geology, Vienna, Austria,
ABSTRACT
In this study the combined use of field mapping and measurements, remote sensing data analysis and GIS techniques for the geological mapping of KEA Island at a 1/50.000 scale, is presented. The geological formations, geotectonic units and the tectonic structure were recognized in situ and mapped. Interpretation of high resolution satellite images (Quickbird) and medium resolution satellite images (Landsat 7 ETM and ASTER) has been carried out in order to detect the linear or not structures of the study area. The in situ mapping was enhanced with data from the digital processing of the satellite data. Marine geology data such as bathymetric data and seismic profiles were also taken into account. All the analogical and digital data were imported in a geodata base specially designed for geological data. After the necessary topological control and corrections the data were unified and processed in order to create the final layout at 1/50.000 scale.
Keywords: KEA Island, geological mapping, satellite images, GIS
1. INTRODUCTION The basic cartographic scale for geological mapping at the Institute of Geological and Mineral Exploration of Greece (IGME) is 1:50,000; at this scale, the whole country has been covered, by 325 map sheets (Figure 1). Field work for these maps was undertaken during the last six decades, by both Greek and other geologists. As a result of this procedure, there are still significant problems regarding the standardisation of geological terms (lithostratigraphic and structural names) and about where the stratigraphic and tectonic boundaries lie within Greece.
In many regions, it has been noted that adjacent geological maps show marked inconsistencies at their boundaries. These have arisen because the different geologists, working at different times, have interpreted their mapping with different geological and geotectonic models. A particular problem is that the currently used model for the geotectonic zones of Greece was developed after 1970.
The Institute of Geological and Mineral Exploration of Greece (I.G.M.E), acting within the framework of CSF 2000–2006 (Community Support Framework 2000-2006, Operational Program Competitiveness, Priority axis 7: Energy and Sustainable Development, Measure 7.3: Exploitation of natural recourses and support in meeting environmental commitments, Action 7.3.1) has been implementing a project called “Collection, codification and documentation of geothematic information for urban and suburban areas in Greece - pilot applications”. The sixth sub-project has been concerned with updating fifty 1:50,000 geological map sheets, using GIS and remote sensing techniques. The geological map sheet, Kea Island, has been included in the updating project and a new geological map is being produced by IGME, in collaboration with the University of Vienna.
Remote Sensing for Environmental Monitoring, GIS Applications, and Geology IX, edited by Ulrich Michel, Daniel L. Civco,Proc. of SPIE Vol. 7478, 74780O · © 2009 SPIE · CCC code: 0277-786X/09/$18 · doi: 10.1117/12.830268
Proc. of SPIE Vol. 7478 74780O-1

2. GEOLOGY OF THE ISLAND Field work on Kea, updating the previous 1972-73 work (Figure 2), has shown that two major geotectonic units are present on the island. An autochthonous low metamorphic grade footwall and an overlying fault zone, seen as numerous minor klippen, formed during top-to-SSW extension. No hangingwall has been unequivocally identified.
Fig. 1. The Greek territory is covered by 325 geological maps at 1/50.000 scale. With red color some of the geological
maps that are being updated. With blue color the KEA map sheet.
The metamorphic footwall, which dominates the island, with a tectonic thickness of >380 m, has two major units:
• Marbles, 0.1-30m thick, medium to very finely crystalline, mostly monomineralic, thin laminated, of a whitish, bluish or grey colour, often intensely folded and boudinaged on both small- and large-scales. This is a calcite (ultra)-mylonite. Thin quartzofeldspathic layers may occur within the marbles.
• Chloritic schists with lithologically lensoid variations in quartz, carbonate, epidote, actinolite, biotite and talc. These schists predominate, except along the eastern and southern margins of the island, where marbles are very common.
The fault-rock zone comprises ultra-mylonitic calcitic marbles and dolostone breccias. The former have a white to light grey colour whilst the latter are pale buff coloured. In some instances, the dolostone breccia has been ankeritised, giving it a dark rust colour. These low-angled fault-rocks are common in the northern (Korisia-Chalara) and southern (Petroussa) parts of the island and also on hill tops in the central-SE part of the island (e.g. Agios Simeon, Kefala).
Proc. of SPIE Vol. 7478 74780O-2

3. REMOTE SENSING DATA AND GIS TECHNIQUES Landsat imagery was successfully used throughout the years for geological structure recognition due to its synoptic view over large areas, enabling the detection of regional geological features. In particular, lineament analysis of remotely sensed data, either by visual or automatic interpretation, is a valuable source of information for studying the structural setting. Although, Landsat satellite TM data has proved useful for regional geological studies [1], its coarse spectral resolution provoked difficulties to a detailed mapping of geological composition. This obstacle was overpassed with the launch of Landsat 7 and Terra satellites. Both ASTER instrument and ETM with a spatial resolution (for the Vnir and panchromatic band respectively) gave a new impulse to the use of satellite data for geological mapping.
Different algorithm has been applied in geological research, especially to detect geological lineaments such as fault, joints, dykes, and shear zones [2]. Other researchers [3] used Hough transform for automated lineament analysis using parts of Landsat TM images. The synergistic use of optical and radar data for the detection of active faults was proposed [4]. Digital Elevation Models were also used for the detection of linear features and the extraction of the topographic structure [5].
3.1 GIS
The existing geological map [6] was georenferenced to the HGRS 87.All the tectonic lines were digitized and classified to the following categories (Figure 3): Fault (FL), Possible Fault (PF), Fault and Boundary (FLB), Overthrust (DO), Possible Overthrust (PO), Thrust Fault (DU), Possible Thrust Fault (PU). The tectonic lines database was enhanced by the lineament analysis of satellite data and the DEM of the island.
Fig. 2. The previous geological map-sheet of KEA Island.
Proc. of SPIE Vol. 7478 74780O-3

3.2 Lineament Analysis
Lineament analysis is one of the most frequently used routines in remote sensing for structural geological study. The large coverage of Landsat image mosaic and the improved spatial resolution of the panchromatic band allow an analysis at both regional and local scale. Moreover the zooming facility provided by the GIS software environment enormously eases the interpretation process and allows an interactive spatial correlation between local and regional structures. Although some authors propose fully automatic techniques for lineament detection, visual interpretation is still the most reliable means for geological lineament analysis because human perception can discriminate this from other lineaments of diverse nature (roads, crop-field boundaries) using contextual information. A Landsat ETM+ image with a spatial resolution of 15m and an ASTER image with the same spatial resolution (Figure 3) were also georenferenced to the HGRS 87 and used for the detection and mapping of other tectonic features. Different RGB combinations of the satellite images were also used for the allocation and separation of the different geological formations. High resolution satellite image (Quickbird) was orthorectified and also used for the geological mapping and the allocation of the boundaries of the different formations. All these features were implemented in a Mobile Mapper CE GPS using Arcpad GIS and checked in situ.
4. IN SITU MAPPING Extended field work, including new geological mapping, GPS measurements and field data collection was undertaken in September 2007 and April 2008. In Figure 4 the locations of the in situ measurements are presented. Every tectonic line was checked and verified in the field (Figures 5, 6 and 7). Every formation and all the geological boundaries were checked during the geological mapping and the changes were recorded digitally using the Arcpad GIS. The accuracy of the GPS measurements was better than 3m (DGPS mode using EGNOS).
Fig. 3. The tectonic features of KEA Island as digitized from the previous geological map and enhanced from the satellite
images. A Landsat 7 ETM and an ASTER VNIR image were used.
Proc. of SPIE Vol. 7478 74780O-4

5. MARINE GEOLOGY DATA Marine geology data were also used for the understanding of the tectonic status of KEA Island. In Figure 8 the Surficial Sediment Map of the Aegean Sea Floor of the broader area is presented. In Figure 9 diverse seismic profiles of the sea floor around the Island of KEA are also presented. The bathymetric model of the broader area can be observed in Figure 10. From the seismic profiles it was extracted that there are two major directions of the faults. The first direction is NNE-SSW and the second one is NNW-SSE (Figure 8). The existence of the fault zone at the east of KEA Island is also verified from the bathymetric measurements. As it can be observed in Figure 10 there is a very deep valley at the East of KEA Island and a smaller valley at the West of the Island. At the east valley the depth reaches -360m while the respective depth at the west valley is -300m.
Fig. 4. Allocation of the in situ measurements.
Proc. of SPIE Vol. 7478 74780O-5
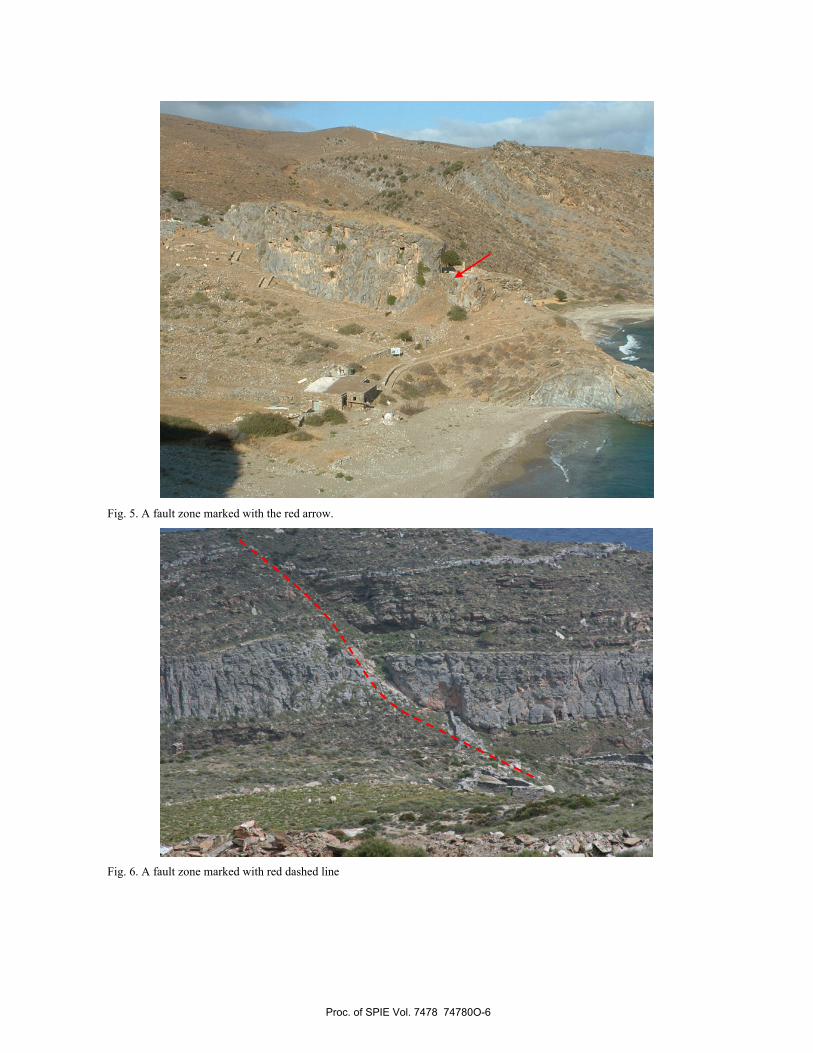
Fig. 5. A fault zone marked with the red arrow.
Fig. 6. A fault zone marked with red dashed line
Proc. of SPIE Vol. 7478 74780O-6

Fig. 7. A fault zone marked with red dashed line.
Proc. of SPIE Vol. 7478 74780O-7

Fig. 8. Surficial Sediment Map of the Aegean Sea Floor.
Fig. 9. Seismic profiles of the sea floor around KEA Island.
Proc. of SPIE Vol. 7478 74780O-8
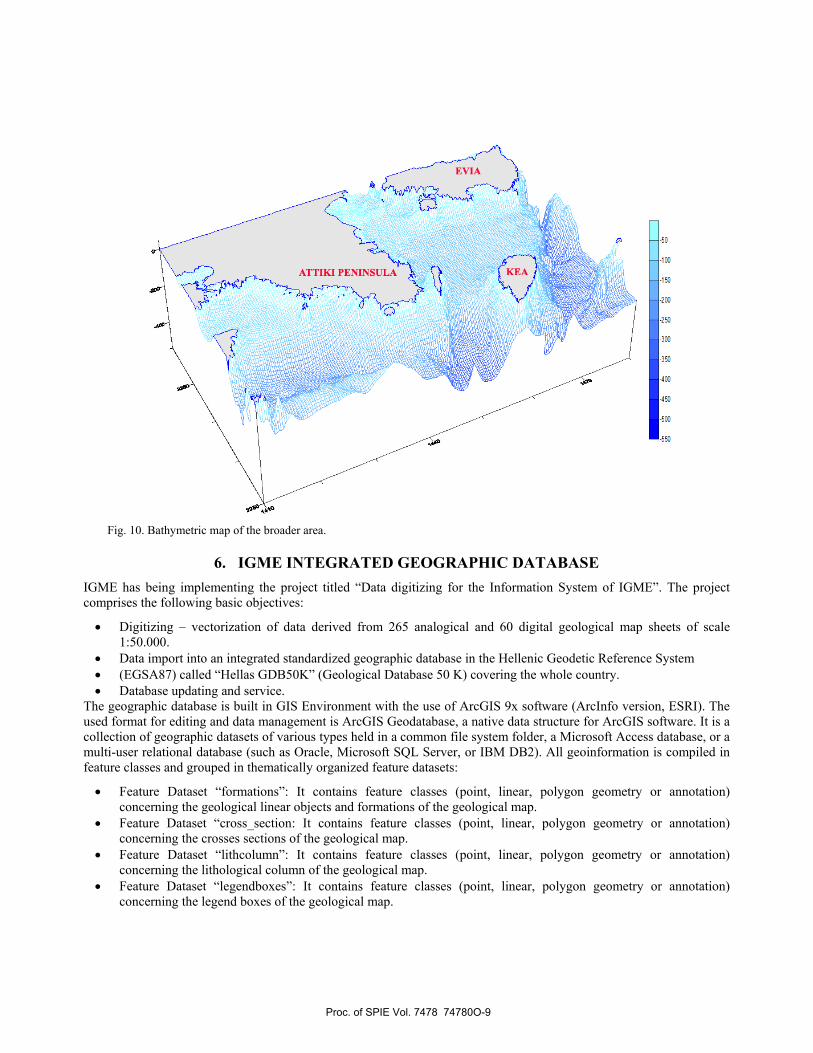
Fig. 10. Bathymetric map of the broader area.
6. IGME INTEGRATED GEOGRAPHIC DATABASE IGME has being implementing the project titled “Data digitizing for the Information System of IGME”. The project comprises the following basic objectives:
• Digitizing – vectorization of data derived from 265 analogical and 60 digital geological map sheets of scale 1:50.000.
• Data import into an integrated standardized geographic database in the Hellenic Geodetic Reference System • (EGSA87) called “Hellas GDB50K” (Geological Database 50 K) covering the whole country. • Database updating and service.
The geographic database is built in GIS Environment with the use of ArcGIS 9x software (ArcInfo version, ESRI). The used format for editing and data management is ArcGIS Geodatabase, a native data structure for ArcGIS software. It is a collection of geographic datasets of various types held in a common file system folder, a Microsoft Access database, or a multi-user relational database (such as Oracle, Microsoft SQL Server, or IBM DB2). All geoinformation is compiled in feature classes and grouped in thematically organized feature datasets:
• Feature Dataset “formations”: It contains feature classes (point, linear, polygon geometry or annotation) concerning the geological linear objects and formations of the geological map.
• Feature Dataset “cross_section: It contains feature classes (point, linear, polygon geometry or annotation) concerning the crosses sections of the geological map.
• Feature Dataset “lithcolumn”: It contains feature classes (point, linear, polygon geometry or annotation) concerning the lithological column of the geological map.
• Feature Dataset “legendboxes”: It contains feature classes (point, linear, polygon geometry or annotation) concerning the legend boxes of the geological map.
Proc. of SPIE Vol. 7478 74780O-9

• Feature Dataset “legend”: It contains feature classes (point, linear, polygon geometry or annotation) concerning the legend of the geological map.
Through the integration of the specific geological database additional processes will be carried out
• Integrate legends (general and detailed) and codification for the entire geographic database. • Local adjustments of point, linear, polygon features in the overlapping area of adjacent map sheets • Domains and subtypes creation, common for the entire geodatabase. • Metadata creation for the geographic database based on ISO standards.
7. THE NEW GEOLOGICAL MAP OF KEA In the frame of a more general project, concerning the updating and homogenizing in a common geodata base the 1/50.000 geological maps of Greece, the map sheets of KEA Island was revised.
Remote sensing data, GPS measurements, marine geology data and GIS techniques were extensively used in order to facilitate and make more accurate the geological mapping. All the data are implemented in the IGME integrated geographic database. The preliminary new geological map is presented in Figure 11.
Fig. 11. The new map-sheet of KEA Island. Preliminary edition.
Proc. of SPIE Vol. 7478 74780O-10

REFERENCES
[1] M.J. Abrams, D.A. Rothery and A. Pontual, “Mapping in the Oman using enhanced Landsat Thematic Mapper images,’ Tectonophysics, vol 151, pp. 387-401, (1988). [2] Cross, A., and Wadge, G., Geological lineaments detection using the Hough transform, IGARSS’88 Proceedings, pp. 1779-1782, (1988). [3] Wang J., and Howarth, P. J., Use of the Hough transform in automated lineament detection, IEEE Transaction on Geoscience and Remote Sensing, Vol. 28, No. 4, pp. 561-566, (1990). [4] Parcharidis Issaak, Nikolakopoulos Konstantinos, Serelis Konstantinos & Baskoutas Ioannis, “Synergistic use of Optical and Radar data for active faults and corresponding displaced landforms detection in Kozani Basin (Greece)”. Geocarto International, a multi-disciplinary journal of Remote Sensing and GIS, ISSN: 1010-6049, Vol 16 No 3, p.17-23 (2001). [5] Jenson S. K., and Domingue, J. O., Extracting topographic structure from digital elevation data for geographic information system analysis, Photogrammetric Engineering and Remote Sensing, Vol. 54, No. 11, pp. 1593-1600, (1988). [6] E. N Davis, KEA ISLAND:Geological Map of Greece1/50.000, Publication: Institute of Geology and Mineral Exploration (IGME), (1982).
Proc. of SPIE Vol. 7478 74780O-11