COMPANY NOTE - Mauna Kea Technologies
26
MAUNA KEA TECHNOLOGIES SA Medical Technology 10 October 2019 07:55 BST COMPANY NOTE EQUITY RESEARCH MARTIN PIEHLMEIER Research Analyst T +44 (0) 203 897 6658 [email protected] OUTPERFORM Target Price €4.10 Current Price €0.91 FINANCIAL SUMMARY Net Cash/Debt (M): 1.60 MARKET DATA Current Price: €0.91 Target Price: €4.10 52 Week Range: €3.00 - €0.84 Total Enterprise Value: 30 Market Cap (M): 23 Shares Out (M): 25.2 Float (M): 24.6 Average Daily Volume: 246,620 PRICE PERFORMANCE Mauna Kea Technologies SA MKEA-FR 10/18 01/19 04/19 07/19 10/19 3.5 3 2.5 2 1.5 1 0.5 Source: Factset KEY TAKEAWAY Earlier this year, Mauna Kea announced successful FDA clearance for the use of the Cellvizio® system in the field of interventional pulmonology ("IP"). This paves the way for entry into the large lung cancer diagnostics market and would allow Mauna Kea to leverage its existing expertise in the field of gastroenterology to maximise adoption. In our view, IP represents a promising commercial opportunity based on (1) a large market with a vast clinical need, (2) Cellvizio's® unique ability to facilitate biopsy guidance and in vivo characterisation, and (3) first mover advantage with a well- differentiated product that is compatible with conventional bronchoscopes, emerging endoluminal robotic platforms as well as existing advanced navigational bronchoscopy platforms. We maintain and reiterate both our OUTPERFORM recommendation and €4.10 target price ("TP"), and await further details regarding the future strategy before including the opportunity into our TP. 1. Lung cancer diagnostics market estimated to exceed $4.0bn by 2024E With more than 2 million newly diagnosed patients per year, lung cancer is the most common as well as most deadly cancer worldwide, accounting for c.143,000 deaths annually in the US alone. The global lung cancer diagnostics market is projected to grow from $2.1bn in 2015 to $4.0bn in 2020E at a 14% CAGR, driven mainly by increasing momentum in the field of endoluminal robotics, including Auris’ Monarch and Intuitive Surgical’s ION system. The recent $3.4bn acquisition of Auris Health by Johnson & Johnson is testimony of the increasing traction in the space, and we anticipate an arms race between large players to create a significant commercial opportunity for Cellvizio®. 2. Using CLE to reduce the clinical and economic toll associated with lung cancer Mauna Kea's value proposition in IP includes two key points: (1) Improving biopsy guidance by providing intralesional visualisation and (2) enabling physicians to characterise tissues in vivo and in real time. Several clinical initiatives are under way in order to assess how these value propositions translate into improving the diagnostic yield. We expect further details to follow in Q4/2019E. 3. First mover advantage and lack of competition facilitate market penetration Mauna Kea’s AQ-Flex 19 Confocal Miniprobe™ is the only nCLE product on the marketplace and the only technology capable of characterising tissues in vivo, in real time and at a cellular level. As such, the company is ideally positioned to drive accelerated market penetration following market entry. In our view, the fact that the company's AQ-Flex 19 Miniprobe, which is designed to be introduced into suspected tumours through a fine needle, is compatible with both conventional bronchoscopes as well as emerging endoluminal robotic bronchoscopes, allows Cellvizio® to integrate into the existing and future diagnostic landscape and provides a strong rationale for collaboration between Mauna Kea and larger diagnostics players active in IP. H1/2019 financial review Mauna Kea reported strong underlying sales growth in H1/2019 with revenues of €3.9m (+45% YoY). A 49% YoY increase in COGS was partly offset by a decline in R&D expenses (-8% YoY). Higher administrative (25% YoY) and S&M (5% YoY) expenses yielded larger than expected operating and net losses of €6.6m and €8.1m, respectively. Cash as at 3rd July 2019 was €8.8m. We maintain and reiterate our TP of €4.10 Our TP of €4.10 per share is based on an EV/Sales multiple approach using our €25.1m revenue estimate for 2022E, a discount rate of 14% and a probability rate of 80%. We continue to believe that Mauna Kea is well positioned to enter a period of accelerated growth as the new commercial strategy and established sales infrastructure start to pay off. We expect revenues to reach €8.6m in 2019E and €14.5m in 2020E, representing 27% and 70% growth, respectively, and anticipate profitability from 2022E. Additional upside is expected from entry into new markets such as IP. Mauna Kea Technologies SA (MKEA-FR) Evaluating interventional pulmonology as the next value driver This is a marketing communication. For professional investors and institutional use only. The information herein is considered to be an acceptable minor non-monetary benefit as defined under FCA COBS 2.3A19(5). GPSL is authorised and regulated by the Financial Conduct Authority (FRN 225563). GPSL does and seeks to do business with companies / issuers covered in its research reports. As a result, investors should be aware that GPSL may have a conflict of interest that could affect the objectivity of this research report. Investors should consider this research report as only a single factor in making their investment decision. GPSL has a formal client relationship with Mauna Kea Technologies SA. Please see analyst certifications, important disclosure information, and information regarding the status of analysts on pages 22 - 24 of this research report.
-
Upload
khangminh22 -
Category
Documents
-
view
3 -
download
0
Transcript of COMPANY NOTE - Mauna Kea Technologies

MAUNA KEA TECHNOLOGIES SA Medical Technology
10 October 2019 07:55 BST
COMPANY NOTE
EQUITYRESEARCH
MARTIN PIEHLMEIER
Research AnalystT +44 (0) 203 897 6658
OUTPERFORMTarget Price €4.10
Current Price €0.91
FINANCIAL SUMMARY
Net Cash/Debt (M): 1.60
MARKET DATA
Current Price: €0.91
Target Price: €4.10
52 Week Range: €3.00 - €0.84
Total Enterprise Value: 30
Market Cap (M): 23
Shares Out (M): 25.2
Float (M): 24.6
Average Daily Volume: 246,620
PRICE PERFORMANCE
Mauna Kea Technologies SA
MKEA-FR
10/18 01/19 04/19 07/19 10/19
3.5
3
2.5
2
1.5
1
0.5
Source: Factset
KEY TAKEAWAY
Earlier this year, Mauna Kea announced successful FDA clearance for the use of theCellvizio® system in the field of interventional pulmonology ("IP"). This paves theway for entry into the large lung cancer diagnostics market and would allow MaunaKea to leverage its existing expertise in the field of gastroenterology to maximiseadoption. In our view, IP represents a promising commercial opportunity based on(1) a large market with a vast clinical need, (2) Cellvizio's® unique ability to facilitatebiopsy guidance and in vivo characterisation, and (3) first mover advantage with a well-differentiated product that is compatible with conventional bronchoscopes, emergingendoluminal robotic platforms as well as existing advanced navigational bronchoscopyplatforms. We maintain and reiterate both our OUTPERFORM recommendation and€4.10 target price ("TP"), and await further details regarding the future strategy beforeincluding the opportunity into our TP.
1. Lung cancer diagnostics market estimated to exceed $4.0bn by 2024EWith more than 2 million newly diagnosed patients per year, lung cancer is the mostcommon as well as most deadly cancer worldwide, accounting for c.143,000 deathsannually in the US alone. The global lung cancer diagnostics market is projected to growfrom $2.1bn in 2015 to $4.0bn in 2020E at a 14% CAGR, driven mainly by increasingmomentum in the field of endoluminal robotics, including Auris’ Monarch and IntuitiveSurgical’s ION system. The recent $3.4bn acquisition of Auris Health by Johnson &Johnson is testimony of the increasing traction in the space, and we anticipate an armsrace between large players to create a significant commercial opportunity for Cellvizio®.
2. Using CLE to reduce the clinical and economic toll associated with lung cancerMauna Kea's value proposition in IP includes two key points: (1) Improving biopsyguidance by providing intralesional visualisation and (2) enabling physicians tocharacterise tissues in vivo and in real time. Several clinical initiatives are under wayin order to assess how these value propositions translate into improving the diagnosticyield. We expect further details to follow in Q4/2019E.
3. First mover advantage and lack of competition facilitate market penetrationMauna Kea’s AQ-Flex 19 Confocal Miniprobe™ is the only nCLE product on themarketplace and the only technology capable of characterising tissues in vivo, inreal time and at a cellular level. As such, the company is ideally positioned to driveaccelerated market penetration following market entry. In our view, the fact that thecompany's AQ-Flex 19 Miniprobe, which is designed to be introduced into suspectedtumours through a fine needle, is compatible with both conventional bronchoscopesas well as emerging endoluminal robotic bronchoscopes, allows Cellvizio® to integrateinto the existing and future diagnostic landscape and provides a strong rationale forcollaboration between Mauna Kea and larger diagnostics players active in IP.
H1/2019 financial reviewMauna Kea reported strong underlying sales growth in H1/2019 with revenues of €3.9m(+45% YoY). A 49% YoY increase in COGS was partly offset by a decline in R&D expenses(-8% YoY). Higher administrative (25% YoY) and S&M (5% YoY) expenses yielded largerthan expected operating and net losses of €6.6m and €8.1m, respectively. Cash as at 3rdJuly 2019 was €8.8m.
We maintain and reiterate our TP of €4.10Our TP of €4.10 per share is based on an EV/Sales multiple approach using our €25.1mrevenue estimate for 2022E, a discount rate of 14% and a probability rate of 80%. Wecontinue to believe that Mauna Kea is well positioned to enter a period of acceleratedgrowth as the new commercial strategy and established sales infrastructure start to payoff. We expect revenues to reach €8.6m in 2019E and €14.5m in 2020E, representing27% and 70% growth, respectively, and anticipate profitability from 2022E. Additionalupside is expected from entry into new markets such as IP.
Mauna Kea Technologies SA (MKEA-FR)
Evaluating interventional pulmonology as the nextvalue driver
This is a marketing communication. For professional investors and institutional use only. The information herein is considered to be an acceptable minor non-monetary benefit as defined under FCA COBS 2.3A19(5).GPSL is authorised and regulated by the Financial Conduct Authority (FRN 225563). GPSL does and seeks to do business with companies / issuers covered in its research reports. As a result, investors should beaware that GPSL may have a conflict of interest that could affect the objectivity of this research report. Investors should consider this research report as only a single factor in making their investment decision. GPSLhas a formal client relationship with Mauna Kea Technologies SA.Please see analyst certifications, important disclosure information, and information regarding the status of analysts on pages 22 - 24 of this research report.

Contents INVESTMENT SUMMARY .................................................................................................................. 1
Cellvizio® extensively validated in gastroenterology........................................................................ 1 Lung cancer diagnostics market to exceed $4.0bn by 2024E ........................................................... 1 First mover advantage and competitive edge ................................................................................. 1 Valuation summary ....................................................................................................................... 1
FUNDAMENTALS IN GI UNDERPIN FUTURE GROWTH ........................................................................ 2 CLE clinical rationale – Improving clinical outcomes ........................................................................ 2
EXPANDING INTO INTERVENTIONAL PULMONOLOGY ........................................................................ 3 Lung cancer epidemiology ............................................................................................................. 3 Lung cancer diagnostics market to exceed $4.0bn by 2024E ........................................................... 4
Emerging endoluminal robotic platforms are expected to drive market growth ................................ 4 Smaller nodules increase the need for accurate biopsy targeting systems ......................................... 5
Large unmet clinical need .............................................................................................................. 5 Early detection: the key to improved treatment outcomes and survival ............................................. 5
Growing cancer prevalence creates a large economic toll ............................................................... 6 Pancreatic cysts as a proxy for cost benefit ........................................................................................... 6
Limiting the economic burden of late stage disease ........................................................................ 6 1. USING CLE TO IMPROVE BIOPSY TARGETING ................................................................................. 7
Restrictions in visualisation limit biopsy targeting at present ........................................................... 7 Imaging and sampling challenges in lung cancer using EBUS ............................................................... 7
Advantages of using nCLE as an adjunct to current modalities ........................................................ 8 Mauna Kea’s AlveoFlex and AQ-Flex ...................................................................................................... 8 nCLE improves biopsy guidance and may improve diagnostic yield ..................................................... 9
2. CLE FOR EARLY IN VIVO TUMOUR CHARACTERISATION ................................................................. 10 The importance of characterising tissue in vivo .................................................................................. 10 nCLE suitability for early characterisation and more accurate disease staging ................................. 10 Paving the way for precision medicine… .............................................................................................. 10 …and accurate treatment response monitoring .................................................................................. 11
nCLE for real time diagnosis and staging of lung cancer ................................................................. 11 Competitive landscape & Mauna Kea competitive edge ................................................................. 11
FUTURE GROWTH DRIVERS ............................................................................................................. 12 Intrinsic factors – expanding the use of CLE ................................................................................... 12
Endoscopic and laparoscopic intraoperative image- and molecular guided cancer surgery ............ 12 CLE image standardisation catalyses development of AI-supported diagnostics .............................. 12 Paving the way for partnerships in robot-assisted surgery ................................................................. 13
Extrinsic factors – growth of complementary technologies ............................................................ 13 Improvements in diagnostic modalities drive the need for CLE ......................................................... 13 The importance of phenotypic information for diagnosis and treatment planning .......................... 13 Cellvizio® aids patient stratification and facilitates targeted therapy ................................................ 13
VALUATION SUGGESTS FAIR VALUE OF €4.10 PER SHARE ................................................................. 14 EV/Sales multiple analysis based on 2022E revenues ..................................................................... 14 10-year DCF analysis captures long-term value .............................................................................. 14
FINANCIALS .................................................................................................................................... 16 H1/2019 financial review .............................................................................................................. 16 Financial Models .......................................................................................................................... 17
This is a marketing communication. For professional investors and institutional use only. The information herein is considered to be an acceptable minor non-monetary benefit as defined under FCA COBS 2.3A19(5).GPSL is authorised and regulated by the Financial Conduct Authority (FRN 225563). GPSL does and seeks to do business with companies / issuers covered in its research reports. As a result, investors should beaware that GPSL may have a conflict of interest that could affect the objectivity of this research report. Investors should consider this research report as only a single factor in making their investment decision. GPSLhas a formal client relationship with Mauna Kea Technologies SA.Please see analyst certifications, important disclosure information, and information regarding the status of analysts on pages 22 - 24 of this research report.

Investment summary In February 2019, Mauna Kea announced that it received its 16th FDA clearance for the use of the Cellvizio® needle-based AQ-Flex 19 Confocal Miniprobe™ through existing bronchoscopes, transbronchial needles and other bronchoscopic accessories [510(k) number: K183640]. This opens the doors to the large interventional pulmonology market, allowing Mauna Kea to leverage its existing expertise in the field of gastroenterology to enter the next stage of growth. Needle-based confocal endomicroscopy (“nCLE”) is complementary to Mauna Kea’s existing probe-based CLE (“pCLE”) portfolio and allows the real-time imaging and characterisation of benign and malignant cellular structures inside pulmonary nodules with through-the-needle visualisation. The company is currently evaluating the commercial opportunity for Cellvizio® in the interventional pulmonology market, which, in our view, represents a promising strategy and significant commercial opportunity. We maintain and reiterate both our OUTPERFORM recommendation and €4.10 target price.
Cellvizio® extensively validated in gastroenterology Cellvizio’s® existing commercial track record in gastroenterology complements the mounting evidence supporting the feasibility and safety of CLE in interventional pulmonology, and the clinical significance of CLE as a lone or complimentary method for in-vivo real time endomicroscopic imaging of the lungs. We expect CLE to play an increasingly prominent role in the future diagnostic landscape by enabling accurate biopsy guidance as well as reliable real-time characterisation of lung cancer and solitary pulmonary nodules in vivo, thus paving the way for rapid analysis of malignancy in patients with suspected lung cancer. While CLE is unlikely to replace conventional biopsies for lung cancer in the near term, the technology can provide significant clinical benefit in the existing diagnostic paradigm by increasing the accuracy and rate of representative biopsies.
Lung cancer diagnostics market to exceed $4.0bn by 2024E With more than 2 million newly diagnosed patients per year, lung cancer is the most common as well as most deadly cancer worldwide, accounting for c.143,000 deaths annually in the US alone. As such, lung cancer represents a significant medical and economic challenge as well as a commercial opportunity for players developing innovative diagnostics solutions, such as Mauna Kea. The global lung cancer diagnostics market is projected to grow from $2.1bn in 2015 to $4.0bn in 2020E at a 14% CAGR, representing the fastest growing segment of the cancer diagnostics market (CHART 1). Continued market expansion is projected to be driven largely by (1) a growing need for precision medicine, (2) increasing pressure to reduce unnecessary intervention due to over-diagnosis and (3) a significant need to alleviate the economic burden of late-stage therapy.
First mover advantage and competitive edge Mauna Kea’s AQ-Flex 19 Confocal Miniprobe™ is the only nCLE product on the market and the only technology capable of characterising tissues in vivo and in real time. In our view, the lack of competition and unique ability to enable intralesional visualisation at a magnification of x1,000 and 12 frames per second puts Mauna Kea in an ideal position to drive accelerated penetration following market entry. Moreover, the fact that the AQ-Flex 19 Miniprobe™ is compatible with conventional bronchoscopes (including EBUS bronchoscopes), advanced navigational systems (e.g. Medtronic’s superDimension) and emerging endoluminal robotic platforms (e.g. Auris’ Monarch and Intuitive Surgical’s ION), allows Cellvizio® to seamlessly integrate into the evolving diagnostic landscape in interventional pulmonology, paving the way for significant future sales growth on the back of accelerated adoption of emerging complementary technologies. With the recent acquisition of Auris Health by Johnson & Johnson for c.$3.4bn upfront and an additional $2.4bn in milestone payments, the interventional pulmonology space is seeing increasing momentum. We expected the arms race between J&J and Intuitive Surgical to create a significant commercial opportunity for Mauna Kea’s Cellvizio® to be used in adjunct with these systems.
Valuation summary Our target price of €4.10/share is based on an EV/Sales multiple approach using our 2022E revenue estimate of €25.1m and the EV/Sales multiples of companies with a comparable commercial focus and maturity. Mauna Kea is well differentiated and does not have many close peers. We therefore selected a range of companies in the medical imaging and diagnostic devices space that, in our view, bear similarities to Mauna Kea, for example a focus on in vivo imaging and endomicroscopy and who are still relatively early stage with limited revenues. We have also performed a discounted cash flow analysis (“DCF”) to capture the long-term growth potential, which yields a fair value of €4.00/share (CHART 2). Finally, we performed a sensitivity analysis to provide alternative valuation scenarios.
CHART 1: Global lung cancer diagnostics market growth
Source: Grand View Research
CHART 2: Mauna Kea valuation
APPROACH VALUATION
EV/Sales €4.10 per share
DCF €4.00 per share
Source: goetzpartners Research estimates. Warning Note: Forecasts are not a reliable indicator of future results or performance. The return may increase or decrease as a result of currency fluctuations.
0
2,000
4,000
6,000
Ma
rke
t si
ze $4,046m
20202015
$2,098m
+93%
The recently 510(K) cleared Cellvizio® AQ-Flex 19 confocal Miniprobe™ opens doors to potential expansion into interventional pulmonology
The AQ-Flex 19 Miniprobe™ is a needle-based confocal microscope small enough to be advanced into tumours through a 19-gauge biopsy needle
As the only FDA-cleared needle-based CLE system, Cellvizio® has a significant head start in interventional pulmonology
This is a marketing communication. For professional investors and institutional use only. The information herein is considered to be an acceptable minor non-monetary benefit as defined under FCA COBS 2.3A19(5).GPSL is authorised and regulated by the Financial Conduct Authority (FRN 225563). GPSL does and seeks to do business with companies / issuers covered in its research reports. As a result, investors should beaware that GPSL may have a conflict of interest that could affect the objectivity of this research report. Investors should consider this research report as only a single factor in making their investment decision. GPSLhas a formal client relationship with Mauna Kea Technologies SA.Please see analyst certifications, important disclosure information, and information regarding the status of analysts on pages 22 - 24 of this research report.
Page 1

Fundamentals in GI underpin future growth With Cellvizio®, Mauna Kea have shrunk the microscope into the head of a small probe, enabling it to be inserted into the patient via an endoscope for microscopic in vivo visualisation and characterisation. This has profound implications for the diagnostic paradigm and streamlines patient management by allowing the identification of precancerous tissues and morphological changes during early stages of cancerous growth (CHART 3). With global cancer treatment shifting to more targeted intervention, early detection is paramount to a successful treatment outcome. The larger the target becomes, the more heterogenous and complex the surgical and / or pharmacological intervention will need to be. This means that the chances of a positive treatment outcome diminish with progression, requiring radical intervention with less specific drugs, with a broader side effects profile.
CLE clinical rationale – Improving clinical outcomes Research suggest that up to 96% of peripheral pulmonary nodules discovered during screening are false positives. Current imaging modalities commonly fail to detect abnormalities in some instances (“false negatives”), while wrongly identifying healthy tissue as abnormal in other instances (“false positives”). Due to superior magnification and resolution, Cellvizio® can be used to visualise abnormalities on a cellular level which can be leveraged to (1) improve biopsy targeting on a microscopic level, and (2) aid in the characterisation of tissue in situ. This could improve diagnostic rates while minimising overdiagnosis. As a result, abnormalities can therefore be identified earlier, when they are just developing, paving the way for earlier intervention and more successful treatment outcomes, while at the same time minimising the economic burden.
CHART 3: Cellvizio® enhances the standard of care
Source: Company data, goetzpartners Research
Microscopic imaging (x1,000)
Tumour marker analysis
Random biopsy protocols
Dead tissue
Delayed information
Requires pathologist
FACILITATES BIOPSY TARGETING AND REAL TIME
CHARACTERISATION
Endoscopy
Minimally-invasive
Real time information
Macroscopic imaging (x30 – x50)
Scope
Microscopic imaging (x1,000)
Biopsy targeting
Minimally-invasive
Real time information
Physician or pathologist
Physical BiopsyCellvizio
In vivo
Macroscopic
Ex vivo
Microscopic
In vivo
Microscopic
Cellvizio® can help to reduce false negatives as well as false positives, streamlining the diagnostic process and thus creating substantial social and economic savings
Cellvizio’s® value proposition: 1. Biopsy needle guidance to the
right location 2. Intralesional visualisation
enabling real time in vivo tissue characterisation
This is a marketing communication. For professional investors and institutional use only. The information herein is considered to be an acceptable minor non-monetary benefit as defined under FCA COBS 2.3A19(5).GPSL is authorised and regulated by the Financial Conduct Authority (FRN 225563). GPSL does and seeks to do business with companies / issuers covered in its research reports. As a result, investors should beaware that GPSL may have a conflict of interest that could affect the objectivity of this research report. Investors should consider this research report as only a single factor in making their investment decision. GPSLhas a formal client relationship with Mauna Kea Technologies SA.Please see analyst certifications, important disclosure information, and information regarding the status of analysts on pages 22 - 24 of this research report.
Page 2

Expanding into interventional pulmonology Mauna Kea in the past repeatedly communicated its intentions to evaluate the interventional pulmonology market as the next big value driver for the company. Interventional pulmonology is a sub-segment of pulmonology medicine and specifically deals with the minimally invasive endoscopic and percutaneous procedures used for the diagnosis and treatment of a number of respiratory disorders, with lung cancer representing the largest segment. Lung cancer is the leading cause of cancer deaths, accounting for c.1.8 million deaths in 20181. Age is one of the main risk factors for developing respiratory cancer and other upper airway disorders, and future demographic shifts will increase demand in this field, making interventional pulmonology one of the fastest growing endoscopy segments. Mauna Kea has had an increased focus on applications of Cellvizio® in the gastroenterology segment in the past, but with the FDA approval of the AQ-Flex 19 Miniprobe™ for interventional pulmonology announced earlier this year, Mauna Kea is ideally positioned to leverage its existing expertise in CLE technology and commercialisation in the vast pulmonology market, which is characterised by a significant clinical need (CHART 4). As such, interventional pulmonology may represent the next value driver for the company.
Lung cancer epidemiology Lung cancer is the leading cause of cancer death, accounting for 12.9% of all new cancer cases. The average age at diagnosis for lung cancer is 70 years old (CHART 6), limiting the use of systemic treatment as well as surgical resection due to an increased risk of adverse events and complications. This makes lung cancer particularly difficult to treat, which is in part reason for the high level of disease recurrence characteristic for lung cancer, thus further emphasising the need for effective, minimally invasive diagnostic methods that can characterise tumours earlier. At present, only 19.4% of patients survive for more than 5 years (CHART 7). While the vast majority of patients are currently diagnosed at the symptomatic stage (CHART 8), improvements in diagnostics are expected to increase the proportion of patients that are diagnosed at earlier stages, increasing the chance for potentially curative treatment. In turn, improvements in lung cancer treatment are expected to increase the demand for better diagnosis.
1 World Health Organization – www.who.int
CHART 4: Estimated distribution of cancer deaths (2019)
Source: NIH – SEER Program, goetzpartners Research
CHART 5: Cancers with the lowest 5-year survival rate in the US
ESTIMATED NEW CASES[1] ESTIMATED DEATHS[1] 5-YEAR SURVIVAL[2]
PANCREAS 56,770 45,750 9.3%
LIVER 42,030 31,780 18.4%
LUNG AND BRONCHUS 228,150 142,670 19.4%
OESOPHAGUS 17,650 16,080 19.9%
STOMACH 27,510 11,140 31.5%
BRAIN / CNS 23,820 17,760 32.9%
OVARY 22,530 13,980 47.6%
MYELOMA 32,110 12,960 52.2%
LARYNX 12,410 3,760 60.3%
LEUKAEMIA 61,780 22,840 62.7%
[1] Estimates for 2019, [2] 2009 - 2015 average Source: National Institute of Health – SEER Program, goetzpartners Research
CHART 6: Percent of new cases by age group CHART 7: 5-year relative survival CHART 8: Percent of cases by stage
Source: National Institute of Health – SEER Program, goetzpartners Research
Localised: confined to primary site; Regional: spread to regional lymph nodes; Distant: metastasised; Unknown: unstaged Source: National Institute of Health – SEER Program, goetzpartners Research
Localised: confined to primary site; Regional: spread to regional lymph nodes; Distant: metastasised; Unknown: unstaged Source: National Institute of Health – SEER Program, goetzpartners Research
24%
8%
8%
7%
54%Pancreas
Lung/bronchus
Colon/rectum
Other
Breast
0
10
20
30
40
>84
Perc
ent
of
new
case
s
35-44 45-54
10%
55-64 75-8465-74
1%
7%
22%
34%
27%
0
10
20
30
40
50
60
70
Distant
Perc
ent
surv
ivin
g
Localised Unknown
57%
8%
Regional
31%
5%
16%
22%
57%
4%
Localised
Regional
Distant
Unknown
Lung cancer accounts for 12.9% of new cases, but for 23.5% of all cancer deaths, killing a disproportionate number of patients
This is a marketing communication. For professional investors and institutional use only. The information herein is considered to be an acceptable minor non-monetary benefit as defined under FCA COBS 2.3A19(5).GPSL is authorised and regulated by the Financial Conduct Authority (FRN 225563). GPSL does and seeks to do business with companies / issuers covered in its research reports. As a result, investors should beaware that GPSL may have a conflict of interest that could affect the objectivity of this research report. Investors should consider this research report as only a single factor in making their investment decision. GPSLhas a formal client relationship with Mauna Kea Technologies SA.Please see analyst certifications, important disclosure information, and information regarding the status of analysts on pages 22 - 24 of this research report.
Page 3

Lung cancer diagnostics market to exceed $4.0bn by 2024E With more than 2 million newly diagnosed patients per year, lung cancer is the most common as well as most deadly cancer worldwide, accounting for c.143,000 deaths annually in the US alone. As such, lung cancer represents a significant medical challenge as well as a commercial opportunity for new entrants developing effective therapies and innovative diagnostics solutions. The global lung cancer diagnostics market is projected to grow from $2.1bn in 2015 to $4.0bn in 2020E at a 14% CAGR, representing the fastest growing area of cancer diagnostics (CHART 10). Lung cancer is expected to remain the second largest segment of the $13.2bn cancer diagnostics market following breast cancer, accounting for 31% of the total market. Within this segment, imaging tests represent the vast majority of the market (CHART 9). North America accounts for the largest share of the global market (35%), followed by Europe (30%) and Asia (15%), respectively.
Emerging endoluminal robotic platforms are expected to drive market growth The lung cancer diagnostics market is expected to expand rapidly over the coming years, driven mainly by the development of new technologies in the field of endoluminal robotics, including Auris’ (Johnson & Johnson) Monarch and Intuitive Surgical’s ION system (CHART 12). These systems are being developed with the aim to improve clinical outcomes by more accurately identifying smaller lesions, reaching peripheral areas of the lung and increasing the notoriously low diagnostic yield associated with lung cancer historically. Early results of Auris’ ongoing BENEFIT study indicated encouraging results earlier this year by demonstrating improved reach beyond a conventional thin bronchoscope. However, beyond improving navigation, the systems have yet to deliver evidence for being able to translate into meaningful clinical outcomes. The fact that these systems are limited to the visualisation of lesions within the airways – rather than the parenchyma, where 85% of lesions are located – could provide a large opportunity for Mauna Kea, which can empower these systems to drive biopsy targeting, and thus improve diagnostic yield beyond what is possible without Cellvizio®.
CHART 9: Global Lung cancer market by test (2020)
Source: Grand View Research, goetzpartners Research
CHART 10: Cancer diagnostics market forecast to 2020E
[1] Includes breast cancer, colorectal cancer, melanoma and others Source: MarketsandMarkets, goetzpartners Research estimates
CHART 11: The Monarch platform
Source: Auris Health
CHART 12: Drivers & Challenges
DRIVERS CHALLENGES
CLINICAL
▪ Increasing focus on interventional pulmonology by large medtech and diagnostics players
▪ Increasing emergence of endoluminal robotics ▪ Clinical validation of improvements in diagnostic yield ▪ Growing need for precision medicine ▪ Potential to reduce metastatic disease and mortality ▪ Need for less invasive tests to improve patient experience ▪ Incentive to reduce unnecessary intervention due to
over-diagnosis
▪ Identification of biomarkers suitable for non- or minimally invasive analysis
▪ Development of markers for both cancer detection and risk profiling
▪ Need for extended large-scale longitudinal studies
ECONOMIC
▪ Need to alleviate the economic burden of late stage therapy ▪ Global shift towards value-based payment models ▪ Increasing number of early detection companies entering the
market
▪ Need for more flexible payment structures ▪ Building a strong economic rationale ▪ Competitive pressure of major providers
SCIENTIFIC ▪ Proliferation of specific disease and prognostic biomarkers ▪ Increasing number of cutting-edge genome sequencing
technologies
▪ Need for more sensitive and precise diagnostic technology ▪ Need for more powerful and flexible data analysis techniques
OTHER ▪ Raising awareness of early diagnosis benefits ▪ Growing influence of healthcare lobbies ▪ Population aging
▪ High fragmentation of the global healthcare landscape ▪ Numerous ethical questions surrounding early diagnosis ▪ Substantial regulatory barriers
Source: goetzpartners Research
50%
15%
14%
12%
8%Sputum cytology
Imaging tests
Molecular tests
Biopsies
Others
Total
$4,046m
4,574 4,777 5,071
9,1171,863 1,960 2,098
4,046
0
2,000
4,000
6,000
8,000
10,000
12,000
14,000
6,437
Glo
bal c
ance
r dia
gno
stic
s
mark
et
(USD
m)
2013 20152014 2020
6,738 7,169
13,163
Lung cancer Others[1]
MARKET SIZE MARKET GROWTH
TYPE CAGR% (2015-2020)
Lung cancer 14.0%
Breast cancer 12.5%
Colorectal cancer 12.4%
Melanoma 11.6%
Others 12.7%
This is a marketing communication. For professional investors and institutional use only. The information herein is considered to be an acceptable minor non-monetary benefit as defined under FCA COBS 2.3A19(5).GPSL is authorised and regulated by the Financial Conduct Authority (FRN 225563). GPSL does and seeks to do business with companies / issuers covered in its research reports. As a result, investors should beaware that GPSL may have a conflict of interest that could affect the objectivity of this research report. Investors should consider this research report as only a single factor in making their investment decision. GPSLhas a formal client relationship with Mauna Kea Technologies SA.Please see analyst certifications, important disclosure information, and information regarding the status of analysts on pages 22 - 24 of this research report.
Page 4
Smaller nodules increase the need for accurate biopsy targeting systems The routine uses of minimally invasive cancer screens such as liquid biopsy tests, which can detect cancer, but at the same time avoid over-diagnosis, is still some time away. However, given the enormous benefits of early diagnosis both in terms of saving lives and reducing the proportion of cancer patients requiring expensive and frequently unpleasant late stage therapy, the movement towards early diagnosis is inevitable and strongly depends on the development and implementation of the appropriate technology. In our view, in vivo imaging that facilitates biopsy targeting will play an increasingly important role in the future, in order to meet the demand for earlier characterisation without fuelling overdiagnosis. Technologically advanced robotic guidance systems, as compared to manual systems, offer multiple additional benefits including improved navigation to difficult-to-reach locations. We expect Cellvizio® to be well positioned to penetrate the market as a routinely used adjunct to existing and future robotic systems.
Large unmet clinical need The increasing demand for improved and more efficient lung cancer diagnostics is strongly driven by the fact that only 16% of all lung cancer cases in the US get diagnosed at a localised stage, while the remaining cases develop into more aggressive forms before detection, which reduces the 5-year survival rate to only 5% in the most advanced patient group (CHART 8). The benefits of early diagnosis in cancer are well-established and evidence has shown that early diagnosis provides a compelling case for improving cancer survival, as shown by the National Lung Screening Trial (“NLST”), which demonstrated that screening high risk patients with low dose chest computed tomography (“CT”) reduced mortality from lung cancer by 20%2. However, lung cancer has historically been characterised by a notoriously low diagnostic yield, with 96% of the positive screens subsequently being found to be non-malignant. This highlights the urgent need for accurate diagnostic tools with high specificity as this minimises overdiagnosis and reduces the clinical burden associated with lung cancer.
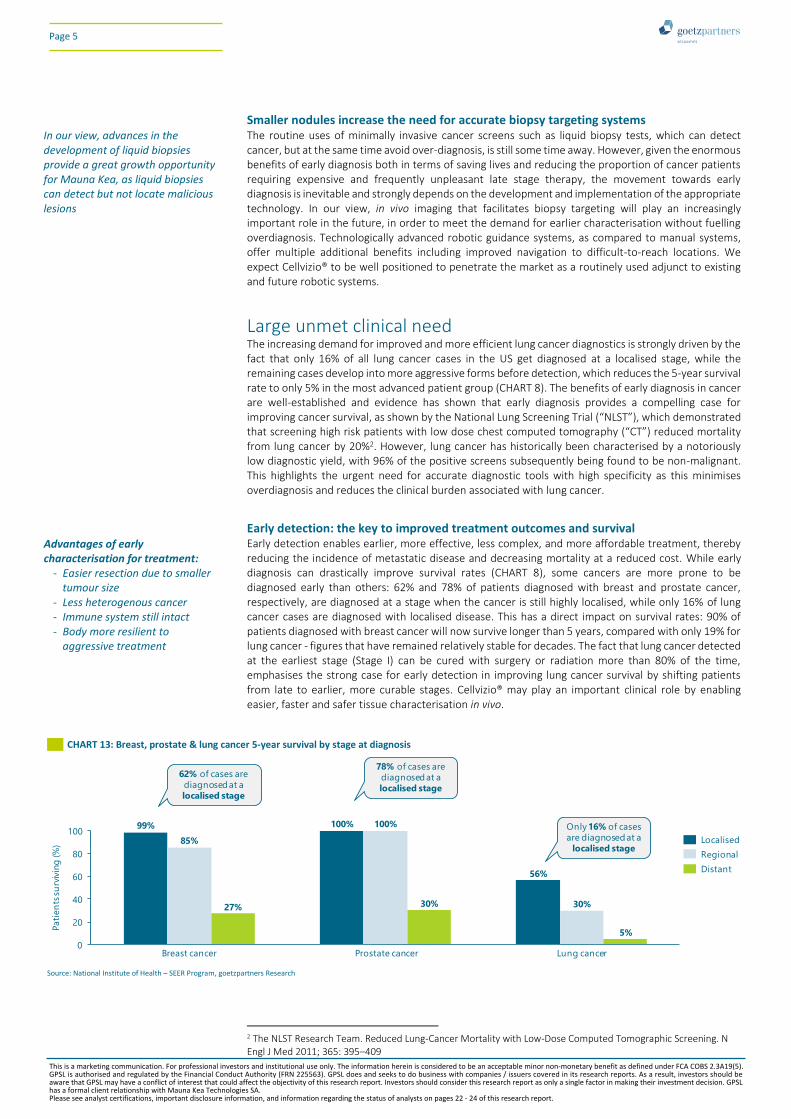
Early detection: the key to improved treatment outcomes and survival Early detection enables earlier, more effective, less complex, and more affordable treatment, thereby reducing the incidence of metastatic disease and decreasing mortality at a reduced cost. While early diagnosis can drastically improve survival rates (CHART 8), some cancers are more prone to be diagnosed early than others: 62% and 78% of patients diagnosed with breast and prostate cancer, respectively, are diagnosed at a stage when the cancer is still highly localised, while only 16% of lung cancer cases are diagnosed with localised disease. This has a direct impact on survival rates: 90% of patients diagnosed with breast cancer will now survive longer than 5 years, compared with only 19% for lung cancer - figures that have remained relatively stable for decades. The fact that lung cancer detected at the earliest stage (Stage I) can be cured with surgery or radiation more than 80% of the time, emphasises the strong case for early detection in improving lung cancer survival by shifting patients from late to earlier, more curable stages. Cellvizio® may play an important clinical role by enabling easier, faster and safer tissue characterisation in vivo.
2 The NLST Research Team. Reduced Lung-Cancer Mortality with Low-Dose Computed Tomographic Screening. N Engl J Med 2011; 365: 395–409
CHART 13: Breast, prostate & lung cancer 5-year survival by stage at diagnosis
Source: National Institute of Health – SEER Program, goetzpartners Research
0
20
40
60
80
100
Pati
en
ts s
urv
ivin
g (%
)
Prostate cancerBreast cancer Lung cancer
99% 100%
85%
27%
100%
30%
56%
30%
5%
Only 16% of cases
are diagnosed at a
localised stage
78% of cases are
diagnosed at a
localised stage
62% of cases are
diagnosed at a
localised stage
Localised
Regional
Distant
Advantages of early characterisation for treatment:
- Easier resection due to smaller tumour size
- Less heterogenous cancer - Immune system still intact - Body more resilient to
aggressive treatment
In our view, advances in the development of liquid biopsies provide a great growth opportunity for Mauna Kea, as liquid biopsies can detect but not locate malicious lesions
This is a marketing communication. For professional investors and institutional use only. The information herein is considered to be an acceptable minor non-monetary benefit as defined under FCA COBS 2.3A19(5).GPSL is authorised and regulated by the Financial Conduct Authority (FRN 225563). GPSL does and seeks to do business with companies / issuers covered in its research reports. As a result, investors should beaware that GPSL may have a conflict of interest that could affect the objectivity of this research report. Investors should consider this research report as only a single factor in making their investment decision. GPSLhas a formal client relationship with Mauna Kea Technologies SA.Please see analyst certifications, important disclosure information, and information regarding the status of analysts on pages 22 - 24 of this research report.
Page 5

Growing cancer prevalence creates a large economic toll The economic impact of cancer is significant and increasing. The total annual economic cost of cancer in 2010 was estimated at approximately $1.2 trillion, and rising prevalence and subsequent productivity loss are expected to exacerbate this economic burden. According to estimates, lung cancer is associated with the highest economic cost (15% of overall cancer costs), followed by breast cancer (12%), colorectal cancer (10%), and prostate cancer (7%). This is largely due to the significant morbidity associated with lung cancer as compared to other cancers, such as persistent breathlessness, chronic cough and chest infections. Increasing implementation of large-scale screening is only expected to increase this cost further.
Pancreatic cysts as a proxy for cost benefit While limited data is available for the cost effectiveness of nCLE in lung cancer, the analysis of pancreatic cysts can be used as a proxy. A study by Le Pen et al. (2017) investigated the economic benefit associated with needle-based CLE (“nCLE”) for the diagnosis of pancreatic cysts in France. The study reports that the use of nCLE in addition to conventional endoscopic ultrasound-guided fine-needle aspiration (“EUS-FNA”) led to a 23% overall reduction in the number of surgical interventions. The cost-savings were reported to exceed the additional cost of the diagnostic technique, translating into overall cost-savings of 14% and 13% in the private and public sectors, respectively. Moreover, according to the study the additional use of nCLE would save the lives of 4 in 1000 patients by eliminating mortality associated with unnecessary intervention, which further highlights the medico-economic benefits associated with CLE.
Limiting the economic burden of late stage disease Early detection not only improves patient outcomes but can also provide significant cost savings by avoiding the high treatment costs associated with life-threatening metastatic disease. CHART 14 outlines the stage-specific costs of treatment for several cancers in the UK. Overall, treatment for Stage III and Stage IV cancers costs the NHS more than two times the amount spent on treatment for Stage I and Stage II cancers. More accessible diseases, such as colon cancer, can be treated at a relatively low-cost if detected early but treatments costs tend to rise sharply as the disease progresses. However, for less accessible cancers such as those in the lung, which involve complex resection of localised disease, the cost difference between early and late-stage treatment appears relatively low compared to other cancers, implying lower potential cost-savings from earlier diagnosis on a patient-basis. However, on a population-wide basis, this trend quickly reverses due to the much higher incidence of lung cancer.
CHART 14: Treatment costs significantly less at earlier stages of disease
Source: Cancer Research UK, goetzpartners Research
0
2,000
4,000
6,000
8,000
10,000
12,000
14,000
16,000
£3,373
Lung cancer
£4,449
Co
st o
f tr
eatm
ent (£
) £12,519£11,815
Rectal cancerColon cancer Ovarian cancer
£7,952
£13,078
£5,328
£15,081
+271%+166% +64%
+183%
Stage I
Stage IV
Use of needle-based CLE in addition to gold standard endoscopy in pancreatic cysts can reduce the number of surgical interventions by 23%
Indirect costs, like morbidity and informal care, represent 60% of total cancer costs to societies
Cellvizio’s core value proposition of increasing diagnostic yield would not only help to limit the clinical, but also the large economic burden associated with lung cancer
This is a marketing communication. For professional investors and institutional use only. The information herein is considered to be an acceptable minor non-monetary benefit as defined under FCA COBS 2.3A19(5).GPSL is authorised and regulated by the Financial Conduct Authority (FRN 225563). GPSL does and seeks to do business with companies / issuers covered in its research reports. As a result, investors should beaware that GPSL may have a conflict of interest that could affect the objectivity of this research report. Investors should consider this research report as only a single factor in making their investment decision. GPSLhas a formal client relationship with Mauna Kea Technologies SA.Please see analyst certifications, important disclosure information, and information regarding the status of analysts on pages 22 - 24 of this research report.
Page 6
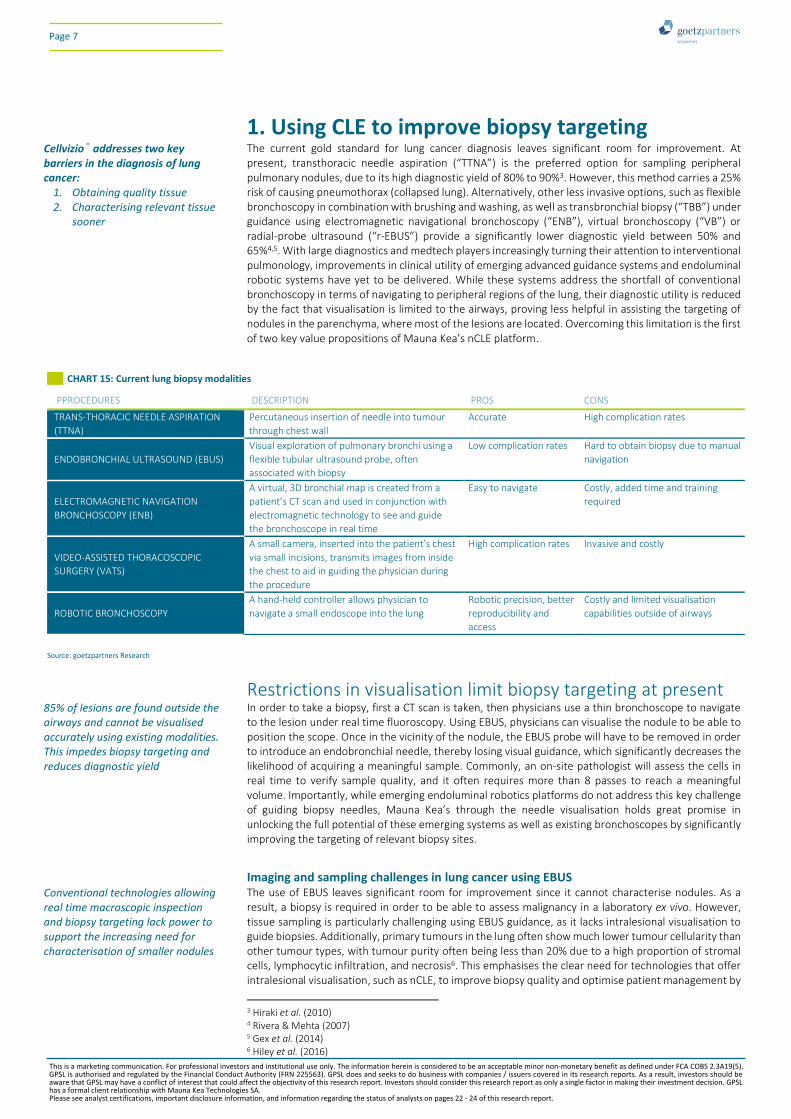
1. Using CLE to improve biopsy targeting The current gold standard for lung cancer diagnosis leaves significant room for improvement. At present, transthoracic needle aspiration (“TTNA”) is the preferred option for sampling peripheral pulmonary nodules, due to its high diagnostic yield of 80% to 90%3. However, this method carries a 25% risk of causing pneumothorax (collapsed lung). Alternatively, other less invasive options, such as flexible bronchoscopy in combination with brushing and washing, as well as transbronchial biopsy (“TBB”) under guidance using electromagnetic navigational bronchoscopy (“ENB”), virtual bronchoscopy (“VB”) or radial-probe ultrasound (“r-EBUS”) provide a significantly lower diagnostic yield between 50% and 65%4,5. With large diagnostics and medtech players increasingly turning their attention to interventional pulmonology, improvements in clinical utility of emerging advanced guidance systems and endoluminal robotic systems have yet to be delivered. While these systems address the shortfall of conventional bronchoscopy in terms of navigating to peripheral regions of the lung, their diagnostic utility is reduced by the fact that visualisation is limited to the airways, proving less helpful in assisting the targeting of nodules in the parenchyma, where most of the lesions are located. Overcoming this limitation is the first of two key value propositions of Mauna Kea’s nCLE platform.
Restrictions in visualisation limit biopsy targeting at present In order to take a biopsy, first a CT scan is taken, then physicians use a thin bronchoscope to navigate to the lesion under real time fluoroscopy. Using EBUS, physicians can visualise the nodule to be able to position the scope. Once in the vicinity of the nodule, the EBUS probe will have to be removed in order to introduce an endobronchial needle, thereby losing visual guidance, which significantly decreases the likelihood of acquiring a meaningful sample. Commonly, an on-site pathologist will assess the cells in real time to verify sample quality, and it often requires more than 8 passes to reach a meaningful volume. Importantly, while emerging endoluminal robotics platforms do not address this key challenge of guiding biopsy needles, Mauna Kea’s through the needle visualisation holds great promise in unlocking the full potential of these emerging systems as well as existing bronchoscopes by significantly improving the targeting of relevant biopsy sites.
Imaging and sampling challenges in lung cancer using EBUS The use of EBUS leaves significant room for improvement since it cannot characterise nodules. As a result, a biopsy is required in order to be able to assess malignancy in a laboratory ex vivo. However, tissue sampling is particularly challenging using EBUS guidance, as it lacks intralesional visualisation to guide biopsies. Additionally, primary tumours in the lung often show much lower tumour cellularity than other tumour types, with tumour purity often being less than 20% due to a high proportion of stromal cells, lymphocytic infiltration, and necrosis6. This emphasises the clear need for technologies that offer intralesional visualisation, such as nCLE, to improve biopsy quality and optimise patient management by
3 Hiraki et al. (2010) 4 Rivera & Mehta (2007) 5 Gex et al. (2014) 6 Hiley et al. (2016)
CHART 15: Current lung biopsy modalities
PPROCEDURES DESCRIPTION PROS CONS
TRANS-THORACIC NEEDLE ASPIRATION
(TTNA)
Percutaneous insertion of needle into tumour
through chest wall
Accurate High complication rates
ENDOBRONCHIAL ULTRASOUND (EBUS)
Visual exploration of pulmonary bronchi using a
flexible tubular ultrasound probe, often
associated with biopsy
Low complication rates Hard to obtain biopsy due to manual
navigation
ELECTROMAGNETIC NAVIGATION
BRONCHOSCOPY (ENB)
A virtual, 3D bronchial map is created from a
patient’s CT scan and used in conjunction with
electromagnetic technology to see and guide
the bronchoscope in real time
Easy to navigate Costly, added time and training
required
VIDEO-ASSISTED THORACOSCOPIC
SURGERY (VATS)
A small camera, inserted into the patient’s chest
via small incisions, transmits images from inside
the chest to aid in guiding the physician during
the procedure
High complication rates Invasive and costly
ROBOTIC BRONCHOSCOPY
A hand-held controller allows physician to
navigate a small endoscope into the lung
Robotic precision, better
reproducibility and
access
Costly and limited visualisation
capabilities outside of airways
Source: goetzpartners Research
Conventional technologies allowing real time macroscopic inspection and biopsy targeting lack power to support the increasing need for characterisation of smaller nodules
Cellvizio® addresses two key barriers in the diagnosis of lung cancer:
1. Obtaining quality tissue 2. Characterising relevant tissue
sooner
85% of lesions are found outside the airways and cannot be visualised accurately using existing modalities. This impedes biopsy targeting and reduces diagnostic yield
This is a marketing communication. For professional investors and institutional use only. The information herein is considered to be an acceptable minor non-monetary benefit as defined under FCA COBS 2.3A19(5).GPSL is authorised and regulated by the Financial Conduct Authority (FRN 225563). GPSL does and seeks to do business with companies / issuers covered in its research reports. As a result, investors should beaware that GPSL may have a conflict of interest that could affect the objectivity of this research report. Investors should consider this research report as only a single factor in making their investment decision. GPSLhas a formal client relationship with Mauna Kea Technologies SA.Please see analyst certifications, important disclosure information, and information regarding the status of analysts on pages 22 - 24 of this research report.
Page 7

maximising diagnostic yield. Importantly, biopsy targeting will play an increasingly prominent role in the future, as advancements in screening and liquid biopsy technologies drive a need for reliable imaging techniques that can accurately characterise smaller nodules.
Advantages of using nCLE as an adjunct to current modalities CLE lends itself to the accurate and rapid onsite pathologic evaluation of suspected malignancies, but with a significantly higher magnification and a much higher diagnostic resolution than EBUS. This has widespread implications for improving the overall outcome of the diagnostic process and allows doctors to look beyond the tissue’s surface morphology. As a result, doctors can examine biopsy samples as they are obtained and request additional samples to be taken immediately if needed, thereby increasing sample quality and reducing waiting times for patients.
Mauna Kea’s AlveoFlex and AQ-Flex Since pCLE, where the probe is inserted through the operating channel of a conventional endoscope, is limited to scanning the surface of lung tumours, Mauna Kea have developed the needle-based AQ-Flex 19 CLE, which is small enough to be introduced into tissue through a 19-gauge biopsy needle. This creates the possibility for real time microscopic visualisation within the parenchyma to (1) guide biopies and (2) characterise tissues in situ. The AQ-Flex 19 Miniprobe™ is preloaded into a 19-gauge FNA (“fine-needle aspiration”) needle, which is inserted into the lung tumour / lymph node under real-time ultrasound guidance (CHART 18). The nCLE is then advanced into the tissue, whereafter video sequences from within the tumour are transmitted and recorded while moving the nCLE under EUS guidance. It only takes a few minutes to image a lymph node over the full diameter in a single plane using nCLE, representing minimal added effort to doctors. Following image acquisition, the nCLE is removed and the needle is passed back and forth in the same plane as the previous miniprobe, allowing sampling of the most relevant tumour regions as identified by nCLE. FNA samples are then processed on glass slides and analysed with conventional staining and immunohistochemistry techniques.
CHART 16: Technical, logistical and biological challenges in lung cancer diagnosis
TECHNICAL LOGISTICAL TUMOUR BIOLOGY
▪ Low diagnostic yield due to limitations in current imaging modalities in navigating the needle to the right location
▪ Multiple tests with the potential for discordant results (e.g. immunohistochemistry vs. fluorescence in-situ hybridisation for anaplastic lymphoma kinase mutation)
▪ Technology-specific failures due to differences in sensitivity
▪ Return of test results to clinicians in a clinically relevant timeframe
▪ Desirability of local, real time testing approaches ▪ Education and training of laboratory and clinical
staff in new technology ▪ Standardisation of assessment criteria usable by
clinicians
▪ Diversity of molecular subgroups within lung cancers and interpatient heterogeneity
▪ Significant intra-tumour heterogeneity ▪ Treatment evolution and resistance in response
to treatments ▪ Evolving treatment paradigms and biomarkers ▪ Increasing complexity of detectable genomic
changes in cancer
Source: Hiley et al. (2016)
CHART 17: 85% of lesions are located outside the airways
Source: Adapted from wikipedia.com
CHART 18: Mauna Kea’s interventional pulmonology probes: AlveoFlex and AQ-Flex
Source: Company data, goetzpartners Research
Airways
Lesions
Working distance
0-50μm
Incident laser light (488nm)
Working Distance (Focal point)
Resolution 3.5 μm
Parenchyma
AlveoFlex
Resolution 3.5 μm
AQ-Flex
Airways
Depth of field30-70μm
Mauna Kea have developed a needle-based CLE that can be introduced through a 19-gauge needle and used to visualise malignancy on a cellular level from inside the tumour in real time
This is a marketing communication. For professional investors and institutional use only. The information herein is considered to be an acceptable minor non-monetary benefit as defined under FCA COBS 2.3A19(5).GPSL is authorised and regulated by the Financial Conduct Authority (FRN 225563). GPSL does and seeks to do business with companies / issuers covered in its research reports. As a result, investors should beaware that GPSL may have a conflict of interest that could affect the objectivity of this research report. Investors should consider this research report as only a single factor in making their investment decision. GPSLhas a formal client relationship with Mauna Kea Technologies SA.Please see analyst certifications, important disclosure information, and information regarding the status of analysts on pages 22 - 24 of this research report.
Page 8

nCLE improves biopsy guidance and may improve diagnostic yield Identifying the optimal area for tissue sampling increases the accuracy while reducing the overall number of biopsies required as well as the frequency of false negatives. With lung biopsies being costly procedures and considering the high percentage of false negatives, better targeting of tissue biopsies can lead to more meaningful biopsies and has wide implications on overall costs and cost effectiveness. Moreover, by being able to visualise malignancy on a cellular level within tumours, the core can be analysed more carefully thus increasing the chance of capturing a sample of the 20% of malignant tissue normally present in lung tumours. This provides valuable location-specific information necessary to reach a clinically meaningful diagnosis. Having insight into the tumour at 12 frames per second also provides an advantage for moving targets, as is the case with nodules in the lung.
Overcoming challenges seen in conventional EBUS: CLE can analyse tumour cross sections and better target the 20% of cancerous cells in a tumour that will support a meaningful diagnosis
This is a marketing communication. For professional investors and institutional use only. The information herein is considered to be an acceptable minor non-monetary benefit as defined under FCA COBS 2.3A19(5).GPSL is authorised and regulated by the Financial Conduct Authority (FRN 225563). GPSL does and seeks to do business with companies / issuers covered in its research reports. As a result, investors should beaware that GPSL may have a conflict of interest that could affect the objectivity of this research report. Investors should consider this research report as only a single factor in making their investment decision. GPSLhas a formal client relationship with Mauna Kea Technologies SA.Please see analyst certifications, important disclosure information, and information regarding the status of analysts on pages 22 - 24 of this research report.
Page 9

2. CLE for early in vivo tumour characterisation At present, patients – whether at high risk and outwardly healthy or symptomatic – undergo a series of steps to first confirm the presence of lung cancer, followed by further testing to determine whether the disease is life-threatening and eligible for aggressive treatment, too advanced for disease-modifying intervention, or benign. The second key value proposition of Mauna Kea’s nCLE probe is to streamline this process, by providing doctors with real-time information on pathology during the initial steps of the diagnostic pathway. This helps to (1) reduce the number of false positives as well as false negatives, and (2) provides accurate insights into disease stage and progression in case of cancer presence, allowing earlier and better treatment planning. This not only saves time but also minimises overtreatment and the need for repeated invasive tissue biopsies to rule out disease. Providing endoscopists with real time feedback is especially critical in lung cancer, as over 50% of cases of carcinoma in situ are estimated to progress to an invasive cancer within a 6-month time period, highlighting the importance of reaching a diagnostic conclusion at the earliest time possible.
The importance of characterising tissue in vivo The profound advantages from being able to characterise the malignancy status in vivo are directly linked to the current clinical paradigm: At present, pulmonary lesion assessed in vivo must meet 8 different diagnostic criteria in order to be defined as benign. In c.50% of cases not all 8 of these criteria are met, which means the test is considered inconclusive and the lesion is subsequentially surgically removed. However, nearly a third of these resections are found to be benign following ex vivo assessment, highlighting the large need for modalities such as nCLE, which can differentiate if a nodule is clearly cancerous or not cancerous at all.
nCLE suitability for early characterisation and more accurate disease staging Pathologists are increasingly front and centre in cancer care. Rapid advances in our molecular understanding of cancer are allowing earlier diagnosis and better targeting and personalisation of cancer therapies, driving the need for diagnostic methods that support the identification of earlier tumours and smaller nodules. While the diagnostic yield of all conventional in vivo imaging technologies decreases as nodule size decreases, imaging with Cellvizio® is agnostic to changes in tumour size as it allows analysis from within the tumour at a cellular level. This can improve diagnosis as well as disease management. Based on its established clinical validity and ability to seamlessly integrate into existing diagnostic workflows, Cellvizio® looks ideally placed to play an increasingly important role in the personalisation of cancer therapy by facilitating the differentiation between aggressive and benign pathology, allowing patients to receive the most effective treatment for their specific cancer and to avoid the discomfort and expense of unnecessary, ineffective and / or highly invasive surgeries.
Paving the way for precision medicine… Substantial advances in the characterisation of the human genome have led to a much better understanding of the genetic mechanisms underlying different types of cancer. A key observation is the fact that cancer cells within the same tumour can display different genotypic, phenotypic and morphological profiles (tumour heterogeneity), driven by their underlying genetic make-up (CHART 19). On one hand, tumour heterogeneity represents a significant challenge in designing effective treatment, however, an increased understanding and characterisation of tumour biology forms the basis of more accurate molecular profiling of individual patients, enabling better stratification and prognosis, thus paving the way for tailored therapeutic regimens utilising more refined treatment strategies with higher therapeutic yield and reduced risk of adverse events. Since precision medicine in oncology is currently still largely dependent on the analysis of tissue biopsies taken from the tumour, Cellvizio® could help in capturing more tumour cells with all clinically relevant markers present.
CHART 19: Tumour heterogeneity impedes accurate diagnosis
Source: goetzpartners Research (adapted from PC Nowell (1976) – The clonal evolution of tumour cell population)
Progression
Healthy cell Tumour population 1 Tumour population 2 Tumour population 3
nCLE provides real-time information regarding the malignancy status of lung tumors and mediastinal nodes and could improve bronchoscopic diagnostics and thus:
- Improve diagnostic rates - Reduce the number of surgical
diagnostic procedures required - Shorten the time-before-
treatment interval - Reduce costs
Precision medicine: Using genetic and biologic information to classify patients into subpopulations with different therapy needs and to predict response to treatment
The more we understand about tumour biology and related patient segmentation, the more precisely health technologies will have to be to characterise cancer subtypes and stages
This is a marketing communication. For professional investors and institutional use only. The information herein is considered to be an acceptable minor non-monetary benefit as defined under FCA COBS 2.3A19(5).GPSL is authorised and regulated by the Financial Conduct Authority (FRN 225563). GPSL does and seeks to do business with companies / issuers covered in its research reports. As a result, investors should beaware that GPSL may have a conflict of interest that could affect the objectivity of this research report. Investors should consider this research report as only a single factor in making their investment decision. GPSLhas a formal client relationship with Mauna Kea Technologies SA.Please see analyst certifications, important disclosure information, and information regarding the status of analysts on pages 22 - 24 of this research report.
Page 10
…and accurate treatment response monitoring Real time in vivo assessment of tumour morphology following treatment onset enables longitudinal monitoring of patient-specific treatment response and assessment of the tumour’s susceptibility to particular drugs. This information can be used to detect resistance and to determine the right targeted therapy as early as possible, thus improving long term outcomes and extending survival. Furthermore, cellular visualisation using CLE in combination with fluorescent immunohistochemical markers could facilitate optimal stapling of the parenchyma around the nodule prior to surgical resection, thus allowing for as much healthy tissue to be spared as possible while reducing the risk of adverse effects.
nCLE for real time diagnosis and staging of lung cancer Needle-based endomicroscopic imaging has been shown to provide accurate results on the nature of pulmonary lesions and metastatic lymph nodes, by enabling a 90% accuracy for detecting malignancy, with substantial intra- and inter-observer agreements. These findings support the fact that nCLE might serve as an important adjunct to navigation bronchoscopy for real-time targeting and identification of lung tumours. The below clinical data illustrates Cellvizio’s® ability to support precise guidance to identify the optimal area for sampling as a real-time feedback technique for diagnostic, staging and treatment procedures in lung tumours.
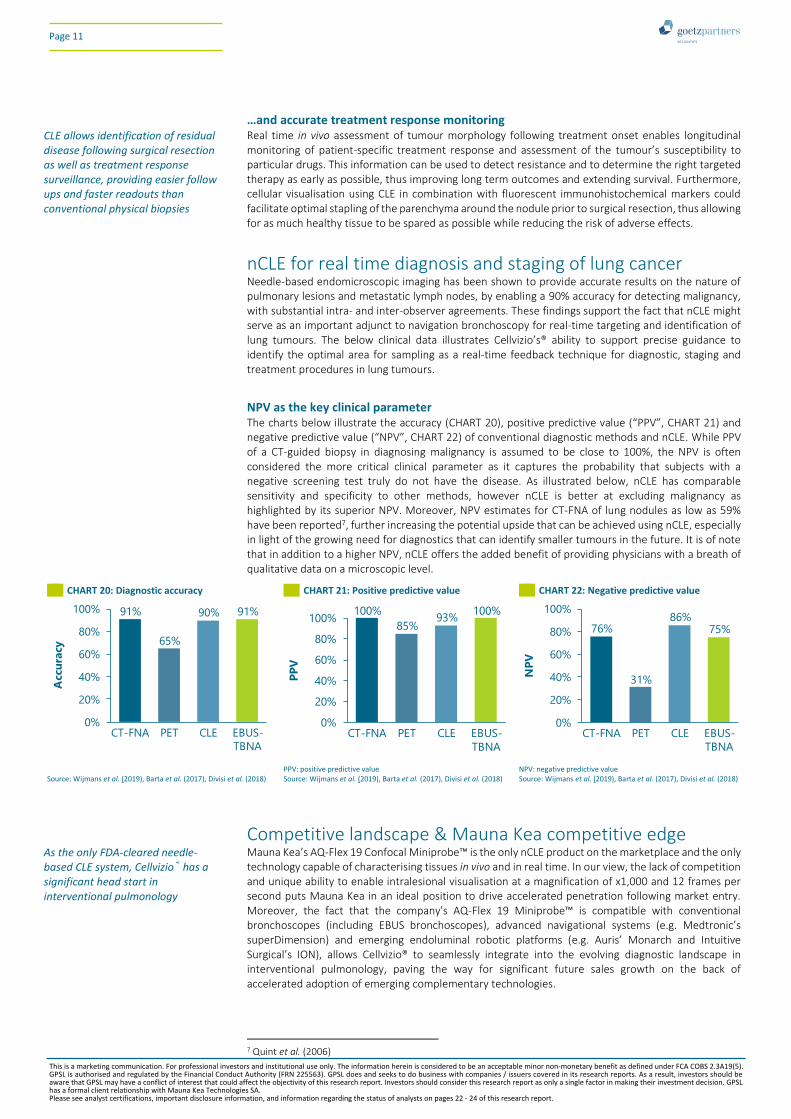
NPV as the key clinical parameter The charts below illustrate the accuracy (CHART 20), positive predictive value (“PPV”, CHART 21) and negative predictive value (“NPV”, CHART 22) of conventional diagnostic methods and nCLE. While PPV of a CT-guided biopsy in diagnosing malignancy is assumed to be close to 100%, the NPV is often considered the more critical clinical parameter as it captures the probability that subjects with a negative screening test truly do not have the disease. As illustrated below, nCLE has comparable sensitivity and specificity to other methods, however nCLE is better at excluding malignancy as highlighted by its superior NPV. Moreover, NPV estimates for CT-FNA of lung nodules as low as 59% have been reported7, further increasing the potential upside that can be achieved using nCLE, especially in light of the growing need for diagnostics that can identify smaller tumours in the future. It is of note that in addition to a higher NPV, nCLE offers the added benefit of providing physicians with a breath of qualitative data on a microscopic level.
Competitive landscape & Mauna Kea competitive edge Mauna Kea’s AQ-Flex 19 Confocal Miniprobe™ is the only nCLE product on the marketplace and the only technology capable of characterising tissues in vivo and in real time. In our view, the lack of competition and unique ability to enable intralesional visualisation at a magnification of x1,000 and 12 frames per second puts Mauna Kea in an ideal position to drive accelerated penetration following market entry. Moreover, the fact that the company's AQ-Flex 19 Miniprobe™ is compatible with conventional bronchoscopes (including EBUS bronchoscopes), advanced navigational systems (e.g. Medtronic’s superDimension) and emerging endoluminal robotic platforms (e.g. Auris’ Monarch and Intuitive Surgical’s ION), allows Cellvizio® to seamlessly integrate into the evolving diagnostic landscape in interventional pulmonology, paving the way for significant future sales growth on the back of accelerated adoption of emerging complementary technologies.
7 Quint et al. (2006)
CHART 20: Diagnostic accuracy CHART 21: Positive predictive value CHART 22: Negative predictive value
Source: Wijmans et al. (2019), Barta et al. (2017), Divisi et al. (2018)
PPV: positive predictive value Source: Wijmans et al. (2019), Barta et al. (2017), Divisi et al. (2018)
NPV: negative predictive value Source: Wijmans et al. (2019), Barta et al. (2017), Divisi et al. (2018)
91%
65%
90% 91%
0%
20%
40%
60%
80%
100%
Acc
ura
cy
CT-FNA PET EBUS-
TBNA
CLE
100%
85%93%
100%
0%
20%
40%
60%
80%
100%
PP
V
EBUS-
TBNA
CT-FNA PET CLE
76%
31%
86%75%
0%
20%
40%
60%
80%
100%
EBUS-
TBNA
NP
V
CT-FNA PET CLE
CLE allows identification of residual disease following surgical resection as well as treatment response surveillance, providing easier follow ups and faster readouts than conventional physical biopsies
As the only FDA-cleared needle-based CLE system, Cellvizio® has a significant head start in interventional pulmonology
This is a marketing communication. For professional investors and institutional use only. The information herein is considered to be an acceptable minor non-monetary benefit as defined under FCA COBS 2.3A19(5).GPSL is authorised and regulated by the Financial Conduct Authority (FRN 225563). GPSL does and seeks to do business with companies / issuers covered in its research reports. As a result, investors should beaware that GPSL may have a conflict of interest that could affect the objectivity of this research report. Investors should consider this research report as only a single factor in making their investment decision. GPSLhas a formal client relationship with Mauna Kea Technologies SA.Please see analyst certifications, important disclosure information, and information regarding the status of analysts on pages 22 - 24 of this research report.
Page 11

Future growth drivers While we believe Cellvizio® is ideally positioned to penetrate the existing interventional pulmonology market given its unique selling propositions when it comes to improving existing diagnostic paradigms, we also believe that technological progress of complementary technologies will further drive the need for Cellvizio® in the future. The future opportunity can broadly be divided into (1) intrinsic factors, including the potential to combine CLE with in vivo immunohistochemistry, and (2) extrinsic factors, such as advances in complementary diagnostic as well as therapeutic modalities, such as liquid biopsies and targeted therapies. As the line between diagnosis and therapy is becoming increasingly fluid, technologies that can facilitate treatment planning as well as execution based on underlying pathology subtype, such as Cellvizio®, will become increasingly important. As such, Mauna Kea could help to shape the future diagnostic paradigm of lung cancer and other cancers.
Intrinsic factors – expanding the use of CLE Endoscopic and laparoscopic intraoperative image- and molecular guided cancer surgery Surgery remains the cornerstone and first-line treatment for many solid tumours. While a wide variety of imaging modalities are available for staging prior to surgery, surgeons still rely primarily on visual and haptic cues in the operating environment. Image and molecular guidance might improve surgical resection outcomes through enhanced tumour definition and margin detection in situ. Intraoperative image- and molecular-guided cancer surgery involves injection of a fluorophore, which is excited at a specific wavelength and the emitted fluorescent photons are detected, allowing surgeons to identify tissue properties and differentiate between tumours and healthy tissue. To date, Cellvizio® is the only system that provides this optionality at a microscopic level while being small enough to fit within a needle). New fluorophores could be developed to stain some pathophysiological processes, therapeutic targets, or enzyme activities, providing surgeons with additional insights. It should be noted, that nCLE in its current form cannot be used as a substitute for pathology, as nCLE with fluorescein does not allow for tumour marker analysis, which is important in determining lung cancer subtypes and the optimal treatment strategy. Using CLE in combination with antigen-specific probes, as has been done in gastroenterology before, may be a promising future strategy, enabling real-time confirmation of malignancy status of the nodule under investigation, paving the way for immediate bronchoscopic treatment.
CLE image standardisation catalyses development of AI-supported diagnostics Due to an acceleration in the development and application of robot-assisted surgery and artificial intelligence (“AI”) in the field of healthcare, it comes as no surprise that Mauna Kea is actively pursuing ways to harness the full power of the latest AI techniques to optimise its diagnostic platform in line with rapid technological advances in AI and data-driven surgery. The primary focus for Mauna Kea lies in the AI-assisted interpretation of medical images (CHART 23). As the outcome of image interpretation is highly dependent on the resolution and quality of the data input, Cellvizio® has a clear competitive advantage in this quickly advancing field. Furthermore, improvements in technology as well as increasing CLE imaging standardisation can be harnessed to train algorithms to identify lesions more accurately in the future. More transparent regulatory pathways, increasing recognition of AI-mediated benefits in the field of medical technology and a steep learning curve (CHART 24) will, in our view, continue to boost adoption of Cellvizio® over the long term.
CHART 23: Diagnosis of bladder cancer by AI and urologists CHART 24: CLE learning curve in diagnosing GI cancer
Source: Mauna Kea, Joe Liao et al. Source: Rapat Pittayanon et al. (2012)
60%
80%
20%
100%
40%
0%
Specificity
82%90%
Sensitivity
77%79%
Accuracy
87%79%
UrologistMachine
60%
80%
20%
100%
40%
0%
Specificity
87%
72%
Sensitivity
98%
83%
Accuracy
81%91%
Week 6Week 0
Due to technical superiority of Cellvizio® compared with related technologies, Cellvizio® is the most likely to find widespread application in the AI market
This is a marketing communication. For professional investors and institutional use only. The information herein is considered to be an acceptable minor non-monetary benefit as defined under FCA COBS 2.3A19(5).GPSL is authorised and regulated by the Financial Conduct Authority (FRN 225563). GPSL does and seeks to do business with companies / issuers covered in its research reports. As a result, investors should beaware that GPSL may have a conflict of interest that could affect the objectivity of this research report. Investors should consider this research report as only a single factor in making their investment decision. GPSLhas a formal client relationship with Mauna Kea Technologies SA.Please see analyst certifications, important disclosure information, and information regarding the status of analysts on pages 22 - 24 of this research report.
Page 12

Paving the way for partnerships in robot-assisted surgery Data-driven surgery helps surgeons to identify margins and to determine what action to take. With FDA clearance and CE marking for use of Cellvizio® in conjunction with surgical robotic systems now in place [510(k) number: K172844], and with increasing integrability of Cellvizio® into other platforms, Mauna Kea is well-positioned to enter potential strategic alliances with major players in the field of robotic surgery, such as Intuitive Surgical, the largest manufacturer of surgical robots with a global installed base of more than 4,000 systems. Improved identification of resection margins and nerve sparing are key drivers for increased application in this field. The steep learning curve associated with Cellvizio® and lack of need for extensive specialist training mean faster clinical benefits, further driving adoption.
Extrinsic factors – growth of complementary technologies Improvements in diagnostic modalities drive the need for CLE There is a clear need for modalities that can shift diagnostic rates from later stages of lung cancer to earlier stages in order to reduce the socio-economic burden. Continuous improvements in diagnostics mean that more cancers will be detected at an earlier stage, when nodules are smaller and more difficult to locate, identify and analyse, thus increasing the clinical need for Cellvizio® as well as market size. Importantly, while lung cancer screening has already been implemented in the US, it is still under consideration in Europe. However, widespread routine screening is expected to be implemented in Europe in the near future, which would significantly increase the number of lung nodules being diagnosed. Furthermore, with the development of liquid biopsies and screening tools progressing rapidly, macroscopic imaging using CT, PET or other imaging modalities will become increasingly insufficient and increase the frequency of false positives and inconclusive results. As such, Cellvizio® can be used to maximise the benefits of advancements in screening and liquid biopsies, by allowing navigation to and targeting of smaller nodules without a loss in sensitivity and accuracy compared with other conventional modalities that, in contrast to CLE, lose diagnostic accuracy as tumour size decreases, calling for more sophisticated in vivo diagnostics.
The importance of phenotypic information for diagnosis and treatment planning Tumour genotyping and genetic sequencing enable the identification of genetic abnormalities that drive particular tumours. Despite rapid improvements in both cost and speed of sequencing an entire genome over the last decades, sequencing remains expensive for routine application. While leveraging genome sequencing will improve cancer diagnosis and guide pathologists towards the optimal choice of therapy, Cellvizio®, in our view, will remain a tool that can provide phenotypic context about the genetic data, allowing pathologists to form a comprehensive diagnostic view by providing detailed morphological context that aids accurate classification and identification of tumour subtypes. Furthermore, the combined use of Cellvizio® and fluorescent imaging to visualise molecular cancer markers holds vast promise for the future of both cancer diagnostics as well as care.
Cellvizio® aids patient stratification and facilitates targeted therapy As cancer therapies are becoming increasingly targeted, the pressure to get the right treatment to the right patient increases. Technological improvements in the field of proton therapy, for example, enable better targeting of smaller tumours, and Cellvizio® could play a key role in the placement of fiducial markers to optimise tumour targeting prior to radiotherapy. Targeted proton therapy has been shown to improve survival in NSCLC compared with photon therapy, while simultaneously reducing the risk of side effects such as inflammation of the lungs and oesophagus. As illustrated in CHART 8, c.38% of patients are currently diagnosed at a regional or localised stage, representing a large patient population suitable for PT, which is only expected to expand as diagnostic and screening modalities further improve, creating large demand for modalities such as Cellvizio®, which can support the image-guided placement of fiducial markers (small metal objects that are placed within the tumour to help pinpoint tumour location with great accuracy). This allows maximisation of the radiation dose to the tumour while sparing surrounding healthy tissue.
Cellvizio’s® integrability with current technologies in robot-assisted surgery suggest large opportunity for strategic partnerships
Liquid biopsies are being developed to detect epigenetic changes, circulating tumour cells, or other molecular markers characteristic for cancerous/pre-cancerous growth
While liquid biopsies may in the near future be able to reliably detect the presence of cancer, CLE will allow them to be localised and characterised beyond genotype
Clinical evidence supports the use for PT in lung cancer, Cellvizio® can be used to navigate treatment by enabling accurate placement of fiducial markers
This is a marketing communication. For professional investors and institutional use only. The information herein is considered to be an acceptable minor non-monetary benefit as defined under FCA COBS 2.3A19(5).GPSL is authorised and regulated by the Financial Conduct Authority (FRN 225563). GPSL does and seeks to do business with companies / issuers covered in its research reports. As a result, investors should beaware that GPSL may have a conflict of interest that could affect the objectivity of this research report. Investors should consider this research report as only a single factor in making their investment decision. GPSLhas a formal client relationship with Mauna Kea Technologies SA.Please see analyst certifications, important disclosure information, and information regarding the status of analysts on pages 22 - 24 of this research report.
Page 13

Valuation suggests fair value of €4.10 per share Our target price of €4.10/share is based on an EV/Sales multiple approach using our 2022E revenue estimate of €25.1m and the EV/Sales multiples of companies with a comparable commercial focus and maturity. We have also performed a discounted cash flow analysis (“DCF”) to capture the long-term growth potential (CHART 25). Finally, we performed a sensitivity analysis (CHART 26, CHART 27) to provide alternative valuation scenarios.
EV/Sales multiple analysis based on 2022E revenues Mauna Kea is well-differentiated and does not have many close peers. We therefore selected a range of companies in the medical imaging and diagnostic devices space that, in our view, bear similarities to Mauna Kea (CHART 28), for example a focus on in vivo imaging and endomicroscopy and who are still relatively early-stage with limited revenues. We then calculated the median LTM EV/Sales trading multiple, which we applied to our 2022E sales forecast for Mauna Kea. We discounted this value back using our estimate for Mauna Kea’s WACC of 14% and applied a probability of success rate of 80% to capture the commercial risk associated with Mauna Kea achieving our forecasts. This yields a fair value of €4.10 per share (CHART 25).
10-year DCF analysis captures long-term value Our DCF analysis for Mauna Kea is shown in CHART 29. We forecasted Mauna Kea’s financial performance for 15 years to 2033E and applied a terminal value using a 4.0x exit multiple. Free cash flows (“FCF”) are discounted and risk-adjusted using the same parameters as in the EV/Sales valuation above, i.e. a WACC of 14% and probability of success of 80%. This yields an equity value of €101m and a fair value of €4.00/share.
CHART 25: Mauna Kea valuation
APPROACH VALUATION
EV/Sales €4.10 per share
DCF €4.00 per share
Source: goetzpartners Research estimates
CHART 26: Sensitivity analysis for EV/Sales valuation CHART 27: Sensitivity analysis for DCF valuation
Source: goetzpartners Research estimates Warning Note: Forecasts are not a reliable indicator of future performance. The return may increase or decrease as a result of currency fluctuations.
Source: goetzpartners Research estimates Warning Note: Forecasts are not a reliable indicator of future performance. The return may increase or decrease as a result of currency fluctuations.
CHART 28: Companies with a comparable focus area as Mauna Kea
Source: FactSet, goetzpartners Research Market data as at COB 8th October 2019 Warning Note: Past performance and forecasts are not a reliable indicator of future performance. The return may increase or decrease as a result of currency fluctuations.
EV/Sales multiple WACC
103.3 5.1x 6.1x 7.1x 8.1x 9.1x
70% 68 79 91 102 114
75% 72 84 96 109 121
80% 76 89 102 115 128
85% 80 94 108 122 136
90% 84 99 114 129 143Pro
bab
ilit
y
of
succ
ess
WACC
100.9 16% 15% 14% 13% 12%
70% 72 81 90 100 112
75% 77 86 96 107 119
80% 81 91 101 113 127
85% 86 96 107 120 134
90% 90 101 113 126 141Pro
bab
ilit
y
of
succ
ess
EURm
Company Name Country Period Market cap Enterprise value Sales (LTM) EV/Sales
Mauna Kea FR 06/30/2019 24 30 8 3.8x
Intuitive Surgical US 06/30/2019 55,200 52,891 3,539 14.9x
FUJIFILM Holdings JP 06/30/2019 20,014 20,912 18,933 1.1x
Olympus JP 06/30/2019 16,847 17,410 6,269 2.8x
Carl Zeiss Meditec DE 03/31/2019 9,731 9,912 1,334 7.4x
Ambu B DK 06/30/2019 3,746 3,895 394 9.9x
SuperSonic Imagine FR 06/30/2019 35 59 25 2.4x
Optiscan Imaging AU 06/30/2019 14 13 1 19.7x
BioView Ltd IL 12/31/2018 10 6 6 1.1x
SciBase Holding SE 06/30/2019 8 3 1 4.2x
Average 7.1x
This is a marketing communication. For professional investors and institutional use only. The information herein is considered to be an acceptable minor non-monetary benefit as defined under FCA COBS 2.3A19(5).GPSL is authorised and regulated by the Financial Conduct Authority (FRN 225563). GPSL does and seeks to do business with companies / issuers covered in its research reports. As a result, investors should beaware that GPSL may have a conflict of interest that could affect the objectivity of this research report. Investors should consider this research report as only a single factor in making their investment decision. GPSLhas a formal client relationship with Mauna Kea Technologies SA.Please see analyst certifications, important disclosure information, and information regarding the status of analysts on pages 22 - 24 of this research report.
Page 14

CHART 29: Mauna Kea discounted cash flow analysis
Source: goetzpartners Research estimates. Warning Note: Forecasts are not a reliable indicator of future performance. The return may increase or decrease as a result of currency fluctuations.
Discounted cash flow 2019E 2020E 2021E 2022E 2023E 2024E 2025E 2026E 2027E 2028E 2029E 2030E 2031E 2032E 2033E
Dec YE (GBPm) 31-Dec-19 31-Dec-20 31-Dec-21 31-Dec-22 31-Dec-23 31-Dec-24 31-Dec-25 31-Dec-26 31-Dec-27 31-Dec-28 31-Dec-29 31-Dec-30 31-Dec-31 31-Dec-32 31-Dec-33
EBITDA (9.5) (5.2) (1.9) 3.2 8.1 14.0 21.2 29.1 39.3 51.6 66.2 83.6 104.0 128.2 156.5
Tax - - - (0.4) (1.0) (3.5) (6.0) (9.1) (12.6) (16.8) (21.8) (27.7) (34.7) (43.0) (52.7)
tax rate 0.0% 0.0% 0.0% (35.0%) (35.0%) (35.0%) (35.0%) (35.0%) (35.0%) (35.0%) (35.0%) (35.0%) (35.0%) (35.0%) (35.0%)
CapEx (0.7) (1.2) (1.5) (2.0) (2.5) (3.1) (3.9) (4.7) (5.7) (7.0) (8.4) (10.2) (12.2) (14.6) (17.4)
% sales (8.0%) (8.0%) (8.0%) (8.0%) (8.0%) (8.0%) (8.0%) (8.0%) (8.0%) (8.0%) (8.0%) (8.0%) (8.0%) (8.0%) (8.0%)
DWC (0.7) (1.5) (0.6) (1.0) (0.6) 0.0 (1.5) (0.0) (1.7) (2.0) (2.4) (2.8) (1.5) (3.5) (4.1)
% growth 2613.0% 123.4% (63.3%) 75.8% (40.0%) (102.0%) (12358.1%) (97.2%) 4068.6% 18.8% 17.1% 17.8% (45.5%) 129.8% 16.7%
FCF (10.9) (8.0) (3.9) (0.2) 3.9 7.3 9.8 15.2 19.2 25.8 33.6 42.9 55.6 67.1 82.3
PV free cash flows 64
PV terminal value 50
Net present value 91
Net debt YE2019E 9.5
Equity value 101
Shares in issue (m) 25.2
FV per share (€) 4.00
This is a marketing communication. For professional investors and institutional use only. The information herein is considered to be an acceptable minor non-monetary benefit as defined under FCA COBS 2.3A19(5).GPSL is authorised and regulated by the Financial Conduct Authority (FRN 225563). GPSL does and seeks to do business with companies / issuers covered in its research reports. As a result, investors should beaware that GPSL may have a conflict of interest that could affect the objectivity of this research report. Investors should consider this research report as only a single factor in making their investment decision. GPSLhas a formal client relationship with Mauna Kea Technologies SA.Please see analyst certifications, important disclosure information, and information regarding the status of analysts on pages 22 - 24 of this research report.
Page 15

Financials
H1/2019 financial review Mauna Kea reported strong underlying sales growth in H1/2019 with revenues of €3.9m (+45% YoY). A 49% YoY increase in COGS was partly offset by a decline in R&D expenses (-8% YoY). Higher administrative (25% YoY) and S&M (5% YoY) expenses yielded larger than expected operating and net losses of €6.6m and €8.1m, respectively.
CHART 30: H1/2019 results below our estimates (in 000s)
Source: Company data, goetzpartners Research estimates Warning Note: Past performance and forecasts are not a reliable indicator of future results or performance. The return may increase or decrease as a result of currency fluctuations
P&L items H1/2018A H1/2019A YoY GPS H1/2019E Δ vs. GPS
Revenue 2,707 3,937 45% n.a. n.a.
Cost of sales (987) (1,468) 49% (1,033) 42%
Gross profit/(loss) 1,720 2,469 44% 2,903 (15%)
R&D expenses (2,235) (2,050) (8%) (2,373) (14%)
Administrative expenses (2,069) (2,578) 25% (2,016) 28%
S&M (4,376) (4,597) 5% (4,639) (1%)
Operating profit/(loss) (6,479) (6,614) 2% (5,596) 18%
Profit/(loss) for the period (6,834) (8,096) 18% (5,989) 35%
This is a marketing communication. For professional investors and institutional use only. The information herein is considered to be an acceptable minor non-monetary benefit as defined under FCA COBS 2.3A19(5).GPSL is authorised and regulated by the Financial Conduct Authority (FRN 225563). GPSL does and seeks to do business with companies / issuers covered in its research reports. As a result, investors should beaware that GPSL may have a conflict of interest that could affect the objectivity of this research report. Investors should consider this research report as only a single factor in making their investment decision. GPSLhas a formal client relationship with Mauna Kea Technologies SA.Please see analyst certifications, important disclosure information, and information regarding the status of analysts on pages 22 - 24 of this research report.
Page 16

Financial Models
CHART 31: Mauna Kea profit and loss model
Source: goetzpartners Research estimates. Warning Note: Past performance and forecasts are not a reliable indicator of future performance or results. The return may increase or decrease as a result of currency fluctuations.
Profit & Loss Statement 2017A 2018A H1 2019A H2 2019E 2019E 2020E 2021E 2022E 2023E 2024E 2025E
Dec YE (EURk except EPS) units 31-Dec-17 31-Dec-18 30-Jun-19 31-Dec-19 31-Dec-19 31-Dec-20 31-Dec-21 31-Dec-22 31-Dec-23 31-Dec-24 31-Dec-25
Revenue EURk 6,687 6,760 3,937 4,632 8,568 14,548 18,489 25,103 31,463 39,180 48,432
COGS EURk (2,129) (2,058) (1,468) (781) (2,249) (4,120) (4,492) (5,826) (7,192) (8,815) (10,736)
% revenue % (32%) (30%) (37%) (17%) (26%) (28%) (24%) (23%) (23%) (22%) (22%)
Gross profit EURk 4,558 4,702 2,469 3,851 6,320 10,428 13,997 19,277 24,272 30,365 37,696
% revenue % 68% 70% 74% 72% 76% 77% 77% 78% 78%
R&D expenses EURk (4,265) (4,653) (2,050) (2,696) (4,746) (4,841) (4,938) (5,037) (5,137) (5,240) (5,345)
% revenue % 64% 69% 52% 58% 55% 33% 27% 20% 16% 13% 11%
S&M expenses EURk (7,586) (9,097) (4,597) (4,682) (9,279) (9,465) (9,654) (9,847) (10,044) (10,245) (10,450)
% revenue % 113% 135% 117% 101% 108% 65% 52% 39% 32% 26% 22%
Administrative expenses EURk (3,350) (3,953) (2,578) (1,454) (4,032) (4,113) (4,195) (4,279) (4,364) (4,452) (4,541)
% revenue % 50% 58% 65% 31% 47% 28% 23% 17% 14% 11% 9%
Other operating expenses/income EURk - - - - - - - - - - -
% revenue % 0% 0% 0% 0% 0% 0% 0% 0% 0% 0% 0%
Total operating expenses (15,202) (17,703) (9,226) (8,831) (18,057) (18,418) (18,787) (19,162) (19,546) (19,936) (20,335)
Other expenses EURk (210) (138) (432) 294 (138) (138) (138) (138) (138) (138) (138)
Other income EURk 1,144 1,141 576 566 1,141 1,141 1,141 1,141 1,141 1,141 1,141
Operating profit/(loss) EURk (9,710) (11,998) (6,614) (4,121) (10,734) (6,988) (3,786) 1,118 5,729 11,432 18,364
% revenue % (145%) (177%) (168%) (89%) (125%) (48%) (20%) 4% 18% 29% 38%
D&A expense (1,074) (1,130) (630) (570) (1,200) (1,746) (1,920) (2,112) (2,324) (2,556) (2,812)
% revenue % 16% 17% 16% 12% 14% 12% 10% 8% 7% 7% 6%
EBITDA EURk (8,636) (10,868) (5,984) (3,551) (9,535) (5,242) (1,866) 3,230 8,053 13,987 21,175
Financial revenues 205 116 58 58 116 116 116 116 116 116 116
Financial expenses (740) (902) (451) - (451) - - - (2,875) (1,500) (1,250)
Profit/(loss) before tax EURk (10,245) (12,785) (7,007) (4,063) (11,070) (6,872) (3,671) 1,234 2,970 10,047 17,229
growth % 5% 25% 3% (32%) (13%) (38%) (47%) (134%) 141% 238% 71%
Income tax - - - - - - - (432) (1,039) (3,516) (6,030)
Tax rate 0% 0% 35% 35% 35% 35% 35% 35% 35% 35% 35%
Net income/(loss) EURk (10,245) (12,785) (8,096) (4,063) (11,070) (6,872) (3,671) 802 1,930 6,531 11,199
This is a marketing communication. For professional investors and institutional use only. The information herein is considered to be an acceptable minor non-monetary benefit as defined under FCA COBS 2.3A19(5).GPSL is authorised and regulated by the Financial Conduct Authority (FRN 225563). GPSL does and seeks to do business with companies / issuers covered in its research reports. As a result, investors should beaware that GPSL may have a conflict of interest that could affect the objectivity of this research report. Investors should consider this research report as only a single factor in making their investment decision. GPSLhas a formal client relationship with Mauna Kea Technologies SA.Please see analyst certifications, important disclosure information, and information regarding the status of analysts on pages 22 - 24 of this research report.
Page 17

CHART 32: Mauna Kea balance sheet model
Source: goetzpartners Research estimates. Warning Note: Past performance and forecasts are not a reliable indicator of future performance or results. The return may increase or decrease as a result of currency fluctuations.
Balance Sheet 2017A 2018A 2019E 2020E 2021E 2022E 2023E 2024E 2025E
Dec YE (EURk) 31-Dec-17 31-Dec-18 31-Dec-19 31-Dec-20 31-Dec-21 31-Dec-22 31-Dec-23 31-Dec-24 31-Dec-25
ASSETS
CURRENT ASSETS 24,043 15,806 11,562 13,736 15,697 17,385 19,779 14,879 19,632
Cash and cash equivalents 17,453 8,623 3,913 3,215 4,557 4,605 5,883 485 3,279
Trade receivables 2,034 1,643 2,348 3,587 4,052 4,814 5,172 5,367 6,635
Inventories & Work in progress 1,969 2,456 2,156 3,725 3,815 4,629 5,320 5,555 6,177
Other current assets 2,587 3,083 3,145 3,208 3,272 3,338 3,404 3,472 3,542
NON-CURRENT ASSETS 3,704 3,956 3,442 2,860 2,419 2,315 2,508 3,087 4,150
Tangible assets, net 1,466 1,985 1,934 1,875 1,831 1,821 1,840 1,898 2,004
Intangible assets, net 2,100 1,838 1,375 852 455 361 535 1,056 2,012
Non-current financial assets 138 133 133 133 133 133 133 133 133
TOTAL ASSETS 27,747 19,762 15,004 16,596 18,116 19,700 22,287 17,966 23,782
LIABILITIES
CURRENT LIABILITIES 4,153 4,904 4,078 5,404 5,456 6,101 18,120 13,130 14,566
Trade payables 1,663 2,087 1,848 3,161 3,200 3,831 4,335 4,830 5,295
Short-term loans and borrowings 386 600 - - - - 11,500 6,000 6,957
Staff and social security payable 1,438 1,554 1,554 1,554 1,554 1,554 1,554 1,554 1,554
Other current liabilities 666 662 675 689 703 717 731 746 760
NON-CURRENT LIABILITIES 6,850 6,879 13,879 19,879 24,879 24,879 13,379 7,379 422
Long-term loans and borrowings 6,567 6,457 13,457 19,457 24,457 24,457 12,957 6,957 -
Non-current provisions 283 422 422 422 422 422 422 422 422
TOTAL LIABILITIES 11,003 11,783 17,957 25,283 30,335 30,980 31,499 20,509 14,988
EQUITY
SHAREHOLDERS' EQUITY 16,744 7,979 (2,953) (8,687) (12,220) (11,280) (9,212) (2,543) 8,794
Issued capital 974 1,008 1,008 1,008 1,008 1,008 1,008 1,008 1,008
Share premium 87,973 91,753 91,753 92,753 92,753 92,753 92,753 92,753 92,753
Reserves (61,957) (71,998) (84,645) (95,577) (102,311) (105,844) (104,904) (102,836) (96,167)
Profit/(loss) (10,245) (12,785) (11,070) (6,872) (3,671) 802 1,930 6,531 11,199
TOTAL LIABILITIES & SHAREHOLDERS' EQUITY 27,747 19,762 15,004 16,596 18,116 19,700 22,287 17,966 23,782
This is a marketing communication. For professional investors and institutional use only. The information herein is considered to be an acceptable minor non-monetary benefit as defined under FCA COBS 2.3A19(5).GPSL is authorised and regulated by the Financial Conduct Authority (FRN 225563). GPSL does and seeks to do business with companies / issuers covered in its research reports. As a result, investors should beaware that GPSL may have a conflict of interest that could affect the objectivity of this research report. Investors should consider this research report as only a single factor in making their investment decision. GPSLhas a formal client relationship with Mauna Kea Technologies SA.Please see analyst certifications, important disclosure information, and information regarding the status of analysts on pages 22 - 24 of this research report.
Page 18
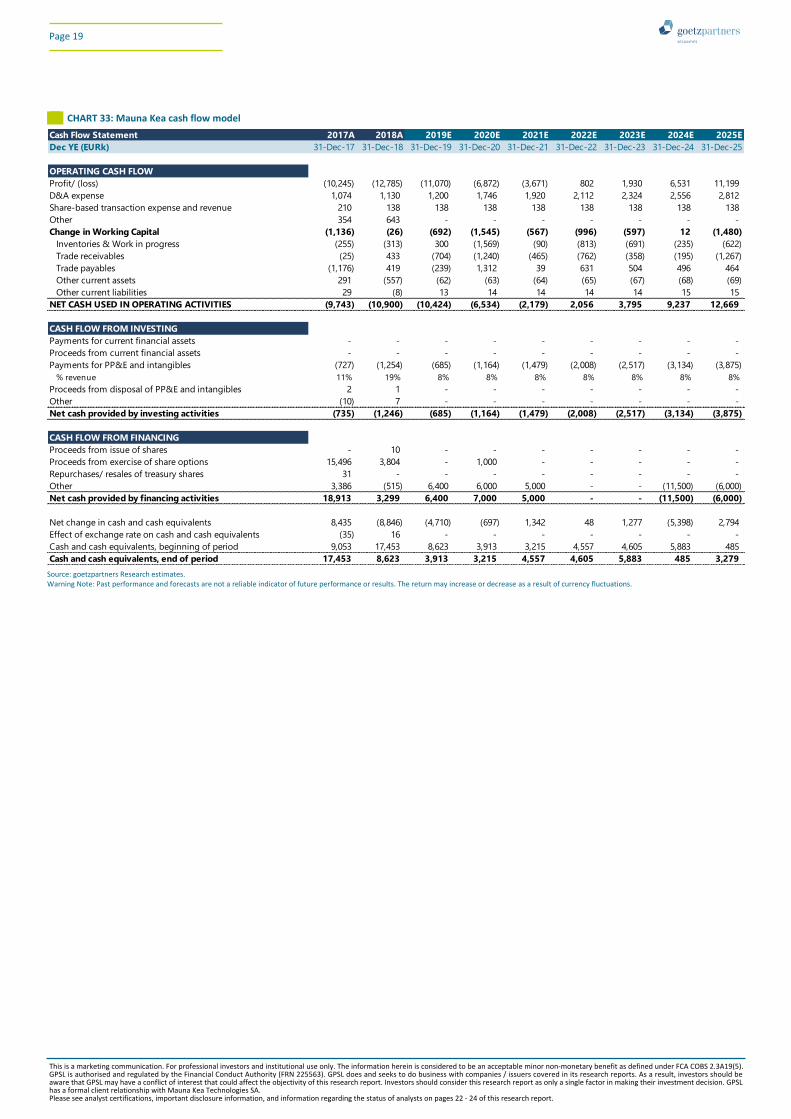
CHART 33: Mauna Kea cash flow model
Source: goetzpartners Research estimates. Warning Note: Past performance and forecasts are not a reliable indicator of future performance or results. The return may increase or decrease as a result of currency fluctuations.
Cash Flow Statement 2017A 2018A 2019E 2020E 2021E 2022E 2023E 2024E 2025E
Dec YE (EURk) 31-Dec-17 31-Dec-18 31-Dec-19 31-Dec-20 31-Dec-21 31-Dec-22 31-Dec-23 31-Dec-24 31-Dec-25
OPERATING CASH FLOW
Profit/ (loss) (10,245) (12,785) (11,070) (6,872) (3,671) 802 1,930 6,531 11,199
D&A expense 1,074 1,130 1,200 1,746 1,920 2,112 2,324 2,556 2,812
Share-based transaction expense and revenue 210 138 138 138 138 138 138 138 138
Other 354 643 - - - - - - -
Change in Working Capital (1,136) (26) (692) (1,545) (567) (996) (597) 12 (1,480)
Inventories & Work in progress (255) (313) 300 (1,569) (90) (813) (691) (235) (622)
Trade receivables (25) 433 (704) (1,240) (465) (762) (358) (195) (1,267)
Trade payables (1,176) 419 (239) 1,312 39 631 504 496 464
Other current assets 291 (557) (62) (63) (64) (65) (67) (68) (69)
Other current liabilities 29 (8) 13 14 14 14 14 15 15
NET CASH USED IN OPERATING ACTIVITIES (9,743) (10,900) (10,424) (6,534) (2,179) 2,056 3,795 9,237 12,669
CASH FLOW FROM INVESTING
Payments for current financial assets - - - - - - - - -
Proceeds from current financial assets - - - - - - - - -
Payments for PP&E and intangibles (727) (1,254) (685) (1,164) (1,479) (2,008) (2,517) (3,134) (3,875)
% revenue 11% 19% 8% 8% 8% 8% 8% 8% 8%
Proceeds from disposal of PP&E and intangibles 2 1 - - - - - - -
Other (10) 7 - - - - - - -
Net cash provided by investing activities (735) (1,246) (685) (1,164) (1,479) (2,008) (2,517) (3,134) (3,875)
CASH FLOW FROM FINANCING
Proceeds from issue of shares - 10 - - - - - - -
Proceeds from exercise of share options 15,496 3,804 - 1,000 - - - - -
Repurchases/ resales of treasury shares 31 - - - - - - - -
Other 3,386 (515) 6,400 6,000 5,000 - - (11,500) (6,000)
Net cash provided by financing activities 18,913 3,299 6,400 7,000 5,000 - - (11,500) (6,000)
Net change in cash and cash equivalents 8,435 (8,846) (4,710) (697) 1,342 48 1,277 (5,398) 2,794
Effect of exchange rate on cash and cash equivalents (35) 16 - - - - - - -
Cash and cash equivalents, beginning of period 9,053 17,453 8,623 3,913 3,215 4,557 4,605 5,883 485
Cash and cash equivalents, end of period 17,453 8,623 3,913 3,215 4,557 4,605 5,883 485 3,279
This is a marketing communication. For professional investors and institutional use only. The information herein is considered to be an acceptable minor non-monetary benefit as defined under FCA COBS 2.3A19(5).GPSL is authorised and regulated by the Financial Conduct Authority (FRN 225563). GPSL does and seeks to do business with companies / issuers covered in its research reports. As a result, investors should beaware that GPSL may have a conflict of interest that could affect the objectivity of this research report. Investors should consider this research report as only a single factor in making their investment decision. GPSLhas a formal client relationship with Mauna Kea Technologies SA.Please see analyst certifications, important disclosure information, and information regarding the status of analysts on pages 22 - 24 of this research report.
Page 19
Charts CHART 1: Global lung cancer diagnostics market growth ............................................................................ 1 CHART 2: Mauna Kea valuation ..................................................................................................................... 1 CHART 3: Cellvizio® enhances the standard of care ..................................................................................... 2 CHART 4: Estimated distribution of cancer deaths (2019) .......................................................................... 3 CHART 5: Cancers with the lowest 5-year survival rate in the US ............................................................... 3 CHART 6: Percent of new cases by age group .............................................................................................. 3 CHART 7: 5-year relative survival .................................................................................................................. 3 CHART 8: Percent of cases by stage .............................................................................................................. 3 CHART 9: Global Lung cancer market by test (2020) ................................................................................... 4 CHART 10: Cancer diagnostics market forecast to 2020E ........................................................................... 4 CHART 11: The Monarch platform ................................................................................................................ 4 CHART 12: Drivers & Challenges ................................................................................................................... 4 CHART 13: Breast, prostate & lung cancer 5-year survival by stage at diagnosis ...................................... 5 CHART 14: Treatment costs significantly less at earlier stages of disease .................................................. 6 CHART 15: Current lung biopsy modalities ................................................................................................... 7 CHART 16: Technical, logistical and biological challenges in lung cancer diagnosis................................... 8 CHART 17: 85% of lesions are located outside the airways ......................................................................... 8 CHART 18: Mauna Kea’s interventional pulmonology probes: AlveoFlex and AQ-Flex ............................. 8 CHART 19: Tumour heterogeneity impedes accurate diagnosis ............................................................... 10 CHART 20: Diagnostic accuracy ................................................................................................................... 11 CHART 21: Positive predictive value ........................................................................................................... 11 CHART 22: Negative predictive value .......................................................................................................... 11 CHART 23: Diagnosis of bladder cancer by AI and urologists .................................................................... 12 CHART 24: CLE learning curve in diagnosing GI cancer .............................................................................. 12 CHART 25: Mauna Kea valuation ................................................................................................................. 14 CHART 26: Sensitivity analysis for EV/Sales valuation ................................................................................ 14 CHART 27: Sensitivity analysis for DCF valuation ....................................................................................... 14 CHART 28: Companies with a comparable focus area as Mauna Kea ....................................................... 14 CHART 29: Mauna Kea discounted cash flow analysis ............................................................................... 15 CHART 30: H1/2019 results below our estimates (in 000s) ....................................................................... 16 CHART 31: Mauna Kea profit and loss model ............................................................................................. 17 CHART 32: Mauna Kea balance sheet model ............................................................................................. 18 CHART 33: Mauna Kea cash flow model ..................................................................................................... 19
This is a marketing communication. For professional investors and institutional use only. The information herein is considered to be an acceptable minor non-monetary benefit as defined under FCA COBS 2.3A19(5).GPSL is authorised and regulated by the Financial Conduct Authority (FRN 225563). GPSL does and seeks to do business with companies / issuers covered in its research reports. As a result, investors should beaware that GPSL may have a conflict of interest that could affect the objectivity of this research report. Investors should consider this research report as only a single factor in making their investment decision. GPSLhas a formal client relationship with Mauna Kea Technologies SA.Please see analyst certifications, important disclosure information, and information regarding the status of analysts on pages 22 - 24 of this research report.
Page 20

FINANCIAL CALENDAR COMPANY DESCRIPTION 17-Oct-2019: Q3/2019 Sales Mauna Kea Technologies SA, a medical device company, develops and sells endomicroscopy and optical
biopsy for the diagnosis and treatment of cancer and other diseases. Its flagship product is Cellvizio,a confocal laser system with fiber optic probes that are intended to allow imaging of the internalmicrostructure of tissues, including the identification of cells and vessels and their organization orarchitecture. The company was founded in 2000 and is headquartered in Paris, France.
SCENARIOS Base Case - GP Investment Case Bluesky Scenario Downside riskMauna Kea may enjoy widespread adoptionof Cellvizio in the US, followed by furtherexpansion into Asian markets. Mauna Keafinds global distribution partners for Cellvizioand existing partnerships will start bearingfruits.
The new consignment business model allowsMauna Kea to quickly establish a largeinstalled base in the US, facilitating theuptake in the GI market and expansioninto other applications including robot-assisted surgery and neurology. Cellviziobecomes imaging standard for its approvedapplications given its attractive profilecompared with other imaging technologies.
Uptake of new technologies by healthcareproviders can be slow and the developmentof alternative imaging methods pose themain risk to Mauna Kea in the field of GI.
Peer Group Analysis
SWOT Strengths - Established technologicalsuperiority and increasing reimbursementrates. Large patent portfolio and goodpotential to expand into further indications
Weaknesses - Sales growth in Chinadependent on collaboration with YouHeMedical Technologies
Opportunities - Provide technologicallysuperior imaging solutions for medicalconditions associated with inadequateoptions for early diagnosis
Threats - Market entry by competitors andalternative technologies could erode sales
This is a marketing communication. For professional investors and institutional use only. The information herein is considered to be an acceptable minor non-monetary benefit as defined under FCA COBS 2.3A19(5).GPSL is authorised and regulated by the Financial Conduct Authority (FRN 225563). GPSL does and seeks to do business with companies / issuers covered in its research reports. As a result, investors should beaware that GPSL may have a conflict of interest that could affect the objectivity of this research report. Investors should consider this research report as only a single factor in making their investment decision. GPSLhas a formal client relationship with Mauna Kea Technologies SA.Please see analyst certifications, important disclosure information, and information regarding the status of analysts on pages 22 - 24 of this research report.
Page 21
Important Disclosures: Non-Independent Research
Analyst CertificationI, Martin Piehlmeier, hereby certify that the views regarding the companies and their securities expressed in this research report areaccurate and are truly held. I have not received and will not receive direct or indirect compensation in exchange for expressing specificrecommendations or views in this research report.
Meaning of goetzpartners Research Ratingsgoetzpartners securities Limited (“GPSL”) publishes investment recommendations, which reflect the analyst’s assessment of a stock’spotential relative return. Our research offers 4 recommendations or ‘ratings’:
OUTPERFORM - Describes stocks that we expect to provide a relative return (price appreciation plus yield) of 15% or more within a 12-month period.
NEUTRAL - Describes stocks that we expect to provide a relative return (price appreciation plus yield) of plus 15% or minus 10% withina 12-month period.
UNDERPERFORM - Describes stocks that we expect to provide a relative negative return (price appreciation plus yield) of 10% or morewithin a 12-month period.
NON-RATED – Describes stocks on which we provide general discussion and analysis of both up and downside risks but on which we donot give an investment recommendation.
Companies Mentioned in this report• (MEDTRONIC PLC (MDT US))• (JOHNSON & JOHNSON (JNJ US))• (INTUITIVE SURGICAL INC (ISRG US))• Mauna Kea Technologies SA (MKEA-FR)• Medical Technology (MT)
Valuation MethodologyGPSL's methodology for assigning recommendations may include the following: market capitalisation, maturity, growth / value, volatilityand expected total return over the next 12 months. The target prices are based on several methodologies, which may include, but arenot restricted to, analyses of market risk, growth rate, revenue stream, discounted cash flow (DCF), EBITDA, EPS, cash flow (CF), free cashflow (FCF), EV/EBITDA, P/E, PE/growth, P/CF, P/FCF, premium (discount)/average group EV/EBITDA, premium (discount)/average group P/E, sum of the parts, net asset value, dividend returns, and return on equity (ROE) over the next 12 months.
FrequencyThis research will be reviewed at a frequency of 3 months. Any major changes to the planned frequency of coverage will be highlightedin future research reports.
Conflicts of interestGPSL is required to disclose any conflicts of interest which may impair the firm’s objectivity with respect to any research recommendationscontained herein. Please click on the link to view the latest version of our Conflicts of Interest policy.
We are also required to disclose any shareholdings of the firm or our affiliates in any relevant issuers which exceed 5% of the total issuedshare capital or any other significant financial interests held:
GPSL shareholdings in relevant issuers >5% - None.
GPSL wishes to disclose that it is party to a formal client agreement with Mauna Kea Technologies SA relating to the provision of adviceand equity research services.
To avoid potential conflicts of interest arising, restrictions on personal account dealing are placed on analysts and other staff. The firm’spersonal account dealing policy expressly prohibits staff and / or relevant connected persons from dealing in the securities of a relevantissuer. Analysts must not trade in a manner contrary to their published recommendation or deal ahead of the publication of any researchreport.
If our contractual relationship with clients ceases, then please be advised that GPSL will no longer publish equity research on the specificclient and any recipients of our equity research publications should not rely on our forecasts / valuation that have previously beenpublished in the last full company research publication. Please note that GPSL will not publish a cessation of coverage notice to the market.Also, in accordance with the provision of MiFID2 – if clients are not contractually paying GPSL to write and publish equity research, thenwe will not publish any future equity research publications to the market on the issuer until all of our unpaid fees have been paid.
To comply with the regulatory requirement to disclose. We disclose the monthly proportion of recommendations that are OUTPERFORM,NEUTRAL, UNDERPERFORM and NON-RATED. We also disclose a summary of the history of our analysts' investment recommendations (inaccordance with EU MAR rules effective 3rd July 2016). goetzpartners publishes this information on the following link: Research Summary.
This is a marketing communication. For professional investors and institutional use only. The information herein is considered to be an acceptable minor non-monetary benefit as defined under FCA COBS 2.3A19(5).GPSL is authorised and regulated by the Financial Conduct Authority (FRN 225563). GPSL does and seeks to do business with companies / issuers covered in its research reports. As a result, investors should beaware that GPSL may have a conflict of interest that could affect the objectivity of this research report. Investors should consider this research report as only a single factor in making their investment decision. GPSLhas a formal client relationship with Mauna Kea Technologies SA.Please see analyst certifications, important disclosure information, and information regarding the status of analysts on pages 22 - 24 of this research report.
Page 22

Country-Specific DisclosuresUnited Kingdom: goetzpartners securities Limited (“GPSL”) is authorised and regulated by the Financial Conduct Authority ("FCA");registered in England and Wales No. 04684144; Registered Office / Address: The Stanley Building, 7 Pancras Square, London, N1C 4AG,England, UK; telephone +44 (0)20 3859 7725. GPSL’s FCA Firm Reference Number is: 225563. In the United Kingdom and EuropeanEconomic Area, this research report has been prepared, issued and / or approved for distribution by GPSL and is intended for use onlyby persons who have, or have been assessed as having, suitable professional experience and expertise, or by persons to whom it canbe otherwise lawfully distributed. It is not intended to be distributed or passed on, directly or indirectly, to any other class of persons.This marketing communication is classed as ‘non-independent research’ and, as such, has not been prepared in accordance with legalrequirements designed to promote the independence of investment research. GPSL has adopted a Conflicts of Interest managementpolicy in connection with the preparation and publication of research, the details of which are available upon request in writing to theCompliance Officer or on the web link above in the Conflicts of Interest section above. GPSL may allow its analysts to undertake privateconsultancy work. GPSL’s conflicts management policy sets out the arrangements that the firm employs to manage any potential conflictsof interest that may arise as a result of such consultancy work.
Other EU Investors: This research report has been prepared and distributed by GPSL. This research report is a marketing communicationfor the purposes of Directive 2004/39/EC (MiFID). It has not been prepared in accordance with legal requirements designed to promotethe independence of investment research, and it is not subject to any prohibition on dealing ahead of the dissemination of investmentresearch. GPSL is authorised and regulated in the United Kingdom by the FCA in connection with its distribution and for the conduct of itsinvestment business in the European Economic Area. This research report is intended for use only by persons who qualify as professionalinvestors or eligible counterparties (institutional investors) in the applicable jurisdiction, and not by any private individuals or otherpersons who qualify as retail clients. Persons who are unsure of which investor category applies to them should seek professional advicebefore placing reliance upon or acting upon any of the recommendations contained herein.
U.S. PERSONS: This research report has been prepared by GPSL, which is authorised to engage in securities activities in England and Walesand to conduct designated investment business in the European Economic Area. GPSL is not a registered broker-dealer in the United Statesof America and therefore is not subject to U.S. rules regarding the preparation of research reports and the independence of researchanalysts. This research report is provided for distribution in the United States solely to “major U.S. institutional investors” as defined inRule 15a-6 under the Securities Exchange Act of 1934.
Other countries: Laws and regulations of other countries may also restrict the distribution of this research report. Persons in possessionof research publications should inform themselves about possible legal restrictions and observe them accordingly.
Mauna Kea Technologies SA Rating History as of 10/10/2019powered by: BlueMatrix
6
5
4
3
2
1Jan 17 Apr 17 Jul 17 Oct 17 Jan 18 Apr 18 Jul 18 Oct 18 Jan 19 Apr 19 Jul 19 Oct 19
I:(BUY):€4.1012/07/2018
Closing Price Target Price
Risks
This is a marketing communication as defined by the Financial Conduct Authority ("FCA"). The information herein is considered anacceptable minor non-monetary benefit as defined under FCA COBS 2.3A19(5). Information relating to any company or security is forinformation purposes only and should not be interpreted as a solicitation to buy or sell any security or to make any investment. Theinformation in this research report has been compiled from sources believed to be reliable, but it has not been independently verified.No representation is made as to its accuracy or completeness, no reliance should be placed on it and no liability is accepted for any lossarising from reliance on it, except to the extent required by the applicable law. All expressions of opinion are subject to change withoutnotice. Opinions, projections, forecasts or estimates may be personal to the author and may not reflect the opinions of goetzpartnerssecurities Limited ("GPSL"). They reflect only the current views of the author at the date of the research report and are subject to changewithout notice. GPSL's research reports are not intended for Retail Clients as defined by the FCA. This research report is intended forprofessional clients only. Research reports are for information purposes only and shall not be construed as an offer or solicitation forthe subscription or purchase or sale of any securities, or as an invitation, inducement or intermediation for the sale, subscription or
This is a marketing communication. For professional investors and institutional use only. The information herein is considered to be an acceptable minor non-monetary benefit as defined under FCA COBS 2.3A19(5).GPSL is authorised and regulated by the Financial Conduct Authority (FRN 225563). GPSL does and seeks to do business with companies / issuers covered in its research reports. As a result, investors should beaware that GPSL may have a conflict of interest that could affect the objectivity of this research report. Investors should consider this research report as only a single factor in making their investment decision. GPSLhas a formal client relationship with Mauna Kea Technologies SA.Please see analyst certifications, important disclosure information, and information regarding the status of analysts on pages 22 - 24 of this research report.
Page 23

purchase of any securities, or for engaging in any other transaction. The analysis, opinions, projections, forecasts and estimates expressedin research reports were in no way affected or influenced by the issuer. The authors of research reports benefit financially from theoverall success of GPSL. The investments referred to in research reports may not be suitable for all recipients. Recipients are urged tobase their investment decisions upon their own appropriate investigations. Any loss or other consequence arising from the use of thematerial contained in a research report shall be the sole and exclusive responsibility of the investor and GPSL accepts no liability for anysuch loss or consequence. In the event of any doubt regarding any investment, recipients should contact their own investment, legal and /or tax advisers to seek advice regarding the appropriateness of investing. Some of the investments mentioned in research reports maynot be readily liquid investments which may be difficult to sell or realise. Past performance and forecasts are not a reliable indicator offuture results or performance. The value of investments and the income derived from them may fall as well as rise and investors maynot get back the amount invested. Some investments discussed in research publications may have a high level of volatility. High volatilityinvestments may experience sudden and large falls in their value which may cause losses. Some of the information or data in this researchreport may rely on figures denominated in a currency other than that of GBP (the currency should be stated), the return may increaseor decrease as a result of currency fluctuations. International investment includes risks related to political and economic uncertainties offoreign countries, as well as currency risk. To the extent permitted by applicable law, no liability whatsoever is accepted for any direct orconsequential loss, damages, costs or prejudices whatsoever arising from the use of research reports or their contents.
GPSL record electronic and phone communications in accordance with FCA and MiFID2 regulations, they are monitored for regulatoryand training purposes.
CompensationGPSL has received compensation from Mauna Kea Technologies SA for the provision of research and advisory services within the previoustwelve months.
MKEA-FR€4.10 | Company Update10 October 2019
goetzpartners securities LimitedThe Stanley Building, 7 Pancras Square, London, N1C 4AG, England, UK.
Tel: +44 (0)203 859 7725
www.goetzpartnerssecurities.com
This is a marketing communication. For professional investors and institutional use only. The information herein is considered to be an acceptable minor non-monetary benefit as defined under FCA COBS 2.3A19(5).GPSL is authorised and regulated by the Financial Conduct Authority (FRN 225563). GPSL does and seeks to do business with companies / issuers covered in its research reports. As a result, investors should beaware that GPSL may have a conflict of interest that could affect the objectivity of this research report. Investors should consider this research report as only a single factor in making their investment decision. GPSLhas a formal client relationship with Mauna Kea Technologies SA.Please see analyst certifications, important disclosure information, and information regarding the status of analysts on pages 22 - 24 of this research report.
Page 24