Catalogue of engraved gems of the classical style - Wikimedia ...
arX
iv:a
stro
-ph/
0411
772v
1 2
9 N
ov 2
004
Draft: January 6, 2014
Preprint typeset using LATEX style emulateapj v. 25/04/01
THE EVOLUTION OF EARLY-TYPE RED GALAXIES WITH THE GEMS SURVEY:LUMINOSITY–SIZE AND STELLAR MASS–SIZE RELATIONS SINCE Z ∼ 1
Daniel H. McIntosh1, Eric F. Bell2, Hans-Walter Rix2, Christian Wolf3, CatherineHeymans2, Chien Y. Peng4,5, Rachel S. Somerville4, Marco Barden2, Steven V. W.
Beckwith4,6, Andrea Borch2, John A. R. Caldwell4,7, Boris Haußler2, Knud Jahnke9,Shardha Jogee4,8, Klaus Meisenheimer2, Sebastian F. Sanchez9,10, Lutz Wisotzki9
1 Astronomy Department, University of Massachusetts, 710 N. Pleasant St., Amherst, MA 01003, USA;[email protected]
2 Max-Planck-Institut fur Astronomie, Konigstuhl 17, D-69117 Heidelberg, Germany3 Department of Physics, Denys Wilkinson Bldg., University of Oxford, Keble Rd., Oxford, OX1 3RH, UK
4 Space Telescope Science Institute, 3700 San Martin Drive, Baltimore MD, 21218, USA5 Steward Observatory, University of Arizona, 933 N. Cherry Ave., Tucson AZ, 85721, USA
6 Johns Hopkins University, Charles and 4th St., Baltimore, MD 21218, USA7 Present address: University of Texas, McDonald Observatory, Fort Davis, TX 79734, USA
8 Present address: Department of Astronomy, University of Texas at Austin, 1 University Station C1400,Austin, TX 78712-0259, USA
9 Astrophysikalisches Institut Potsdam, D-14482 Potsdam, Germany10 Present address: Centro Astronomico Hispano Aleman, E-04004 Almeria, Spain
Draft: January 6, 2014
ABSTRACT
We combine imaging from the Hubble Space Telescope Advanced Camera for Surveys, as part of theGEMS (Galaxy Evolution from Morphologies and SEDs) survey, with redshifts and rest-frame quantitiesfrom COMBO-17 to study the evolution of morphologically early-type galaxies with red colors sincez = 1. From 0.5 × 0.5 imaging, we draw a large sample of 728 galaxies with centrally-concentratedradial profiles (i.e. n ≥ 2.5 from Sersic fits) and rest-frame (U − V ) colors on the red sequence. Weexplore how the correlations of rest-frame V -band luminosity and of stellar mass with intrinsic half-light size change over the last half of cosmic time. By appropriate comparison with the well-definedlocal relations from the Sloan Digital Sky Survey, we find that the luminosity–size and stellar mass–sizerelations evolve in a manner that is consistent with the passive aging of ancient stellar populations. Byitself, this result is consistent with a completely passive evolution of the red early-type galaxy population.If instead, as demonstrated by a number of recent surveys, the early-type galaxy population builds upin mass by roughly a factor of two since z ∼ 1, our results imply that new additions to the early-typegalaxy population follow similar luminosity–size and stellar mass–size correlations, compared to theolder subset of early-type galaxies. Adding early-type galaxies to the red sequence through the fading ofpreviously prominent disks appears to be consistent with the data. Through comparison with models,the role of dissipationless merging is limited to < 1 major merger on average since z = 1 for the mostmassive galaxies. Predictions from models of gas-rich mergers are not yet mature enough to allow adetailed comparison to our observations. We find tentative evidence that the amount of luminosityevolution depends on galaxy stellar mass, such that the least massive galaxies show stronger luminosityevolution compared to more massive early types. This could reflect a different origin of low-mass early-type galaxies and/or younger stellar populations; the present data is insufficient to discriminate betweenthese possibilities.
Subject headings: galaxies: evolution — galaxies: fundamental parameters (luminosities, stellar masses,radii) — galaxies: general — surveys
1. introduction
The formation and evolution of massive, early-type galax-ies constitutes a long-standing and crucial problem in cos-mology. In all hierarchical models, e.g. a Λ-dominatedCold Dark Matter (ΛCDM) cosmology, the massive early-type galaxies seen now are expected to have formed throughmergers of smaller galaxies over time (White & Frenk 1991;Cole et al. 2000). Yet, within these models it is difficult topredict robustly at what point during this assembly moststars formed. In order to constrain the star formation (SF)and assembly histories of the early-type galaxy population,it is necessary to explore the evolution of their numberdensity and various scaling relations, such as the funda-mental plane (van Dokkum & Franx 1996; Kelson et al.2000; van Dokkum et al. 2001; Treu et al. 2002; Wuytset al. 2004; van der Wel et al. 2004), the luminosity–size
relation (Barrientos et al. 1996; Pahre et al. 1996; Schadeet al. 1997; Barger et al. 1998; Schade et al. 1999; Ziegleret al. 1999), and the stellar mass–size relation (Trujilloet al. 2004b). To this end, we use the GEMS (GalaxyEvolution from Morphology and SEDs; Rix et al. 2004)survey in conjunction with COMBO-17 (Classifying Ob-jects by Medium-Band Observations in 17 Filters; Wolfet al. 2003, 2004) to construct the largest sample to dateof distant (0.2 < z ≤ 1.0) early-type galaxies with HubbleSpace Telescope (HST) imaging to explore the evolution ofluminosity and stellar mass as functions of galaxy size.
Most initial studies of z ≤ 1 early-type galaxies focusedon galaxies in some of the richest clusters at each epoch(e.g., van Dokkum & Franx 1996; van Dokkum et al. 1998;Kelson et al. 2000), and found that the mass-to-light ratios(M/L) of massive galaxies in this environment changed as
1
2 McIntosh et al.
expected for passive fading of a population formed exclu-sively at very early epochs. In recent years, greatly ex-panded studies of “red” galaxies in random cosmologicalvolumes have been carried out, extending to redshifts of atleast z ∼ 2 (Chen et al. 2003; Rusin et al. 2003; Bell et al.2004b; Drory et al. 2004; Fontana et al. 2004; McCarthyet al. 2004). From colors and spectra, these studies in-ferred that massive galaxies existed at all observed epochsand that red galaxies at any given epoch contain almostexclusively old (relative to the observational epoch) stel-lar populations. Yet, the age distribution of the stars inthese galaxies does not by itself speak to their dynamicalassembly.
While the optical colors of massive red early-type galax-ies would indeed be consistent with a population that hasevolved only through fading since z∼ 2, other data in-dicate that more must have happened. In particular, theco-moving total stellar mass density in red-sequence galax-ies is lower at earlier epochs, amounting to a factor of∼ 2 buildup since z ∼ 1 (Chen et al. 2003; Bell et al.2004b; Cross et al. 2004). Several factors are expectedto contribute to this evolution: (1) in galaxies with wan-ing and disappearing SF, the disk will fade and the bulgegain prominence in comparison; (2) spheroidal componentsmay newly form from gas-rich disk mergers or from in-ternal disk instabilities; or (3), galaxies within the redsequence could undergo dissipationless merging, changingtheir masses and structures while leaving their stellar pop-ulations unchanged. All processes are expected to con-tinue to the present epoch in a hierarchical universe (e.g.,Cole et al. 2000; Steinmetz & Navarro 2002; Khochfar &Burkert 2003). The relative importance of the effects isexpected to be a strong function of galaxy mass: gas-richmergers, disk instabilities, and disk fading are expected tocontribute strongly at low masses, whereas dissipationlessmergers may dominate for high-mass galaxies (Khochfar& Burkert 2003).
The aging of a stellar population not only implies red-der colors but also dimming. We exploit this to apply anindependent test for the population evolution of massivegalaxies. This test uses the morphological and structuralinformation for a large sample of early-type, red galaxiesto z ∼ 1, which we draw from the COMBO-17 redshiftand spectral energy distribution (SED) survey (Wolf et al.2003, 2004) and the GEMS HST imaging survey (Rix et al.2004). By constructing the luminosity–size (LV −r50) andstellar mass–size (M⋆ − r50) relations for subsamples ofmorphologically selected early-type, red galaxies at differ-ent redshifts, one can test the hypothesis of passive evo-lution and provide constraints for other evolutionary sce-narios. In practice, the concentration of the light profile,specified by the Sersic index n ≥ 2.5 is used as a quanti-tative proxy for morphology.
For the most strict version of passive evolution (no newstars; no merging) the prediction is clear: the M⋆ − r50
relation will remain unchanged 1 and the LV − r50 rela-tion should change in the sense that galaxies of a givensize would have been brighter by about 1 magnitude in V -1 This is true neglecting the possible change in effective radius thatmight occur in a galaxy with a substantive age gradient. Stellar massloss in an aging stellar population would lead also to slow changesin the M⋆ − r50 relation.
band at z = 1, if the observed color evolution (Bell et al.2004b) is a guide to the stellar M/L evolution. The pre-dictions for the evolution of these relations in the presenceof merging are maturing rapidly. Gas-free dissipationlessmergers (see e.g., Naab & Burkert 2003; Dantas et al. 2003;Nipoti et al. 2003) will slowly move galaxies away from theLV − r50 and M⋆ − r50 relations (Nipoti et al. 2003); wediscuss this issue in detail later. Existing constraints fromthe color-magnitude relation (CMR) or fundamental plane(FP) limit the amount of dissipationless merging that canoccur to a factor of a few in terms of mass growth in thismerging mode, if roughly equal-mass mergers dominatethe mass growth (Bower et al. 1998; Dantas et al. 2003;Nipoti et al. 2003; Gonzalez-Garcıa & van Albada 2003;Evstigneeva et al. 2004). Predictions for gas-rich mergersare less mature, and it is not clear what to expect for theevolution of the LV − r50 and M⋆ − r50 relations in thiscase.
As shown persuasively by Simard et al. (1999), any suchtest for passive or other physical evolution requires care-ful accounting for redshift-dependent selection effects. Wewill address this issue extensively, as the systematics ofthe sample selection become increasingly important overdiminishing statistical errors for larger samples. Also, allexisting surveys that are deep enough to reach z ∼ 1cover such a small area that their volumes at low redshifts(z ≤ 0.2) become too small. Therefore, we will combinethe COMBO-17/GEMS data at z ≥ 0.2 with the present-day LV − r50 and stellar M⋆ − r50 relations for early-typegalaxies (Shen et al. 2003) from the Sloan Digital Sky Sur-vey (SDSS; York et al. 2000). Both for Shen et al. (2003)and the 0.2 < z < 1.0 sample presented here, stellar mass-to-light ratios are estimated from the spectra and SEDs.
In this paper, we bring to bear the largest sample of mor-phologically and color-selected early-type galaxies with HSTimaging for a comprehensive analysis of the evolution ofthe LV − r50 and M⋆ − r50 relations. Measuring the evo-lution of relationships between these fundamental galaxyproperties over 0 < z < 1 can place further constraintson galaxy formation and evolution models. Specifically,we have two goals: (1) to quantify the expected luminos-ity evolution of galaxies of a given size due to the simpleaging of their ancient stars with the best accounting of se-lection effects to date; and (2) to test whether stellar massevolution occurs at different fixed galaxy sizes, which mayprovide constraints on the merging history of these systemsof old stars. The outline of this paper follows. We describeour early-type galaxy data in §2, including relevant discus-sions of the GEMS imaging survey, the rest-frame quanti-ties from COMBO-17, the early-type sample selection, andour galaxy size measurements. In §3 we explore the evolu-tion of the luminosity and stellar mass scaling relations ofearly-type galaxies with z ≤ 1. We discuss our results in §4and give our conclusions in §5. For rest-frame luminosi-ties, stellar masses, and physical sizes we assume a flat,Λ-dominated cosmology with Ωm = 0.3, ΩΛ = 0.7, andH0 = 100hkm s−1 Mpc−1. When estimating expected pas-sive stellar population evolution, we adopt a flat universewith the WMAP parameters (H0 = 72km s−1 Mpc−1 andΩm = 0.27, Spergel et al. 2003), which give a Hubble timeof 13.5Gyr, to account for stellar M/L and color evolutionin the most realistic way possible at this time.
Evolution of Early-type Red Galaxies with GEMS 3
2. early-type galaxy data
We select a well-defined sample of early-type galaxieswith HST imaging from GEMS, and high-precision photo-metric redshifts and rest-frame luminosities from COMBO-17. In this section we discuss briefly the high-resolutionimaging and the aspects of the COMBO-17 data relevantto this study. Furthermore, we outline the early-type sam-ple selection and its completeness, and we describe thegalaxy size measurements from the HST data.
2.1. High-resolution Imaging
The GEMS survey has obtained a large, two passband(F606W and F850LP) Advanced Camera for Surveys (ACS)image mosaic over an area of 28′ × 28′, encompassing theExtended Chandra Deep Field South (E-CDFS). This isthe largest contiguous color map of the cosmos obtainedwith HST and consists of a grid of 78 mostly overlap-ping images taken with the ACS wide field camera dur-ing November 2002. The full details of the imaging grid,observations, data reduction, calibration, and data qualityassessment will be presented in Caldwell et al. (in prepara-tion, C05). An overview of the GEMS survey experimentaldesign is given in Rix et al. (2004). The foremost goal ofGEMS is to quantify the internal structural evolution ofgalaxies using statistically significant samples of galaxiesat known redshifts. To this end we selected the E-CDFSfield with an existing redshift data set from COMBO-17. Furthermore, a fraction of GEMS overlaps with theGOODS (Giavalisco et al. 2004), Ultra Deep Field (UDF),and UDF parallels (Bouwens et al. 2004) programs, thusproviding a wealth of deeper, multi-wavelength data.
Hereafter, we concentrate our analysis on measuringgalaxy sizes from the longest rest-frame wavelength possi-ble at which galaxy profiles appear most uniform and thecontamination from star-forming regions in disk galaxiesis minimized. Therefore, we measure sizes by fitting sim-ple models to the two-dimensional galaxy imaging in theF850LP filter.
For each pointing in the GEMS mosaic we have indi-vidual F850LP images, which are multi-drizzle combina-tions of three dithered exposures (720–762 seconds each;see C05 for details). Briefly, the exposures were processedindividually prior to combining (i.e. bias and dark cur-rent correction, flat fielding). The final frames are freeof most cosmic rays and remapped onto a fine 0.′′03/pixelscale. The full suite of 78 F850LP images are quite flatwith background differences between images considerablyless than 0.2 ADU, and the local galaxy background mea-surements across each frame have a typical RMS of 0.2ADU. In addition, we have a variance image (necessary forsource detection) with the same scale for each frame. Theimages are flux calibrated for photometric uniformity overthe large mosaic of ACS frames, which assures unbiasedgalaxy size measurements. We calibrate the astrometryof each image to the ground-based epoch J2000.0 systemof COMBO-17, which allows precise image/redshift crosscorrelation. The reduced frames have angular resolution of0.′′077 FWHM, corresponding to a physical scale of 700 pcat z ∼ 0.75, comparable to the resolution of Coma galaxycluster observations with 1′′ seeing.
The final GEMS source catalog contains 41,681 uniqueobjects detected in the F850LP imaging. For source de-
tection we employ SExtractor (Bertin & Arnouts 1996)in a two-step strategy discussed in detail in Rix et al.(2004). Briefly, first we use a conservative (“cold”) de-tection and deblending configuration that avoids spuriousdeblending of large galaxies with strong features, yet is in-complete for faint, low surface brightness objects found inCOMBO-17 . Next we use a “hot” configuration to detect99% of known COMBO-17 sources down to a total appar-ent magnitude of Rtot = 24 (Vega), the limit at whichthe redshift performance drops dramatically. The exactconfiguration parameters are given in Rix et al. (2004).In each case, separate catalogs for each GEMS pointingare constructed from the combined F850LP image and aweight map (∝ var−1). The use of weight maps reducesthe number of spurious detections in low signal-to-noise(S/N) areas of each image (e.g., near image edges).
For each field we combine all “cold” sources plus thesubset of “hot” sources residing outside of the isophotalarea of any cold detections, and then we remove dupli-cate sources to produce the final catalog with the followingproperties: (1) contains 99% of all objects in the Rtot ≤ 24mag COMBO-17 sample; (2) avoids spurious deblendingof large, bright galaxies exhibiting strong substructure inHST images from spiral features, etc.; and (3) provides ahomogeneous, flux and surface brightness limited catalogof all sources in the F850LP ACS mosaic, regardless ofCOMBO-17 or other external information. Through de-tailed simulations (Haußler et al., in preparation, hereafterH05) we find that galaxy detection in GEMS is completeto effective surface brightnesses in the F850LP-band ofµ50 ∼ 25 mag arcsec−2 (within the half-light radius) forr1/4 spheroids and µ50 ∼ 24 mag arcsec−2 for exponen-tial disks. The GEMS SExtractor source catalog will bepublished and described in complete detail in C05.
2.2. Rest-frame Quantities from COMBO-17
COMBO-17 is a deep photometric survey comprised offive (three completed) disjoint fields, each ∼ 0.25 squaredegree in size, with flux measurements in 5 broad and 12medium passbands (between 3500 and 9000 angstroms).This survey provides data for ∼ 25, 000 galaxies with Rtot <24 mag in the range 0.2 < z < 1.2. The COMBO-17 data,associated uncertainties, sample selection, and complete-ness are discussed in detail in Wolf et al. (2004).
The deep 17-passband data combined with stellar, AGN,and non-evolving galaxy template spectra allow nearly all(98%) objects to be assigned redshifts and SED classifica-tions. The redshift accuracies depend primarily on R-bandaperture magnitude, with δz/(1 + z) ∼ 0.02 for Rap < 22mag. When going fainter the errors reach δz/(1+z) ∼ 0.05at Rap = 24 mag (Wolf et al. 2004). Reliable redshift es-timates allow the construction of rest-frame luminositiesand colors. Depending on the redshift in question, rest-frame luminosities are determined either by interpolationor mild extrapolation. For this study we use the rest-frameV -band absolute magnitudes for the luminosity parameter,which are extrapolated for galaxies with z > 0.7. Never-theless, the leverage of the COMBO-17 filter set continuesto provide accurate V -band magnitudes to z = 1, with typ-ical uncertainties of ∼ 10% (z < 0.7) and ∼ 15% (z > 0.7).We note that the quoted redshift accuracies correspond to. 15% fractional distance errors for z > 0.2.
4 McIntosh et al.
We cross correlate the positions of sources from theGEMS F850LP imaging with source coordinates from theCOMBO-17 E-CDFS catalog2. We find 6152 galaxies withredshifts 0.2 ≤ z ≤ 1.0 and Rap ≤ 24 mag. This is ouroverall galaxy sample. We note that the COMBO-17 mag-nitude limit corresponds to the reliability of estimatingredshifts, which is brighter than the limit to detect galaxieswith high completeness both in COMBO-17 and GEMS.For red-selected galaxies, which are the primary concernof this paper, the completeness limit owing to redshift re-liability depends somewhat on redshift: for 0.2 < z < 0.6the mean 90% limit occurs at Rap ∼ 23.5, while at largerredshifts (0.6 < z < 1.0) the sample is fully complete downto Rap = 24 mag. At redshifts above z = 1, COMBO-17remains complete to the magnitude limit, yet this limitbegins restricting the sample to only the very luminous(MV < −21 + 5 log10 h at z ∼ 1) red galaxies. We there-fore adopt a strict z = 1 cut for our analysis.
We use stellar mass M⋆ estimates based on direct mod-eling of the COMBO-17 SEDs (Borch et al., in prepara-tion). The 17-passband COMBO-17 SEDs were comparedwith a library of galaxy template spectra obtained fromthe Pegase code (see Fioc & Rocca-Volmerange 1997, fora description of an earlier version of the code). From eachgalaxy’s SED we estimate directly its stellar M/L ratio(M⋆/L), and hence M⋆; M⋆ uncertainties include contri-butions from redshift uncertainty. We use a Kroupa et al.(1993) stellar initial mass function (IMF), which producesM⋆/L values comparable to those from a Kroupa (2001)IMF, and ∼ 0.3 dex lower than from a Salpeter (1955)IMF. For red-selected galaxies, these stellar masses agreeto within . 40% (0.11 dex), and show no average offsetwhen compared to stellar masses based on the simple re-lation between (B − V ) color and M⋆/L from Bell et al.(2003), assuming the same IMF. The stellar mass esti-mates suffer from a number of random and systematic un-certainties, such as uncertainties in galaxy age, bursts ofSF in the last 1-2 Gyr, and variations in the relationshipbetween dust reddening and extinction (see e.g., Bell & deJong 2001; Bell et al. 2003, for a more in-depth discussionof the relevant sources of uncertainties). Generally theseuncertainties amount to ∼ 0.3 dex; for the red-sequencegalaxies studied here, it is likely that the stellar mass esti-mates are more accurate than this, as relatively old stellarpopulations are somewhat easier to model robustly withsimplistic SFH prescriptions.
2.3. Early-type Galaxy Selection
In very generic terms, the visual appearances of galaxiesfall into two broad types: (1) early-type refers to a galaxywith spheroid or bulge-dominated (centrally-concentrated)morphology; and (2) late-type corresponds to a disk-dominatedor irregular system. In the local universe, several classesfrom the familiar Hubble (1926) sequence are consideredearly-type in morphology – ellipticals (E), lenticulars (S0),and spirals with dominant bulges and small disks withtightly wound spiral arms (Sa). In addition to physicalappearance, the optical colors of galaxies are broadly dif-ferent – early types have typically red colors suggestive ofa dominant population of old stars with little or no current2 Available at http://www.mpia-hd.mpg.de/COMBO/combo index.html.
SF; late types tend to be bluer in color as a result of on-going SF and some fraction of young stars. This bimodaldistribution of galaxies in color space is observed both lo-cally (Strateva et al. 2001; Hogg et al. 2002; Blanton et al.2003b; Baldry et al. 2004) and out to z ∼ 1 (Bell et al.2004b; Weiner et al. 2004). Furthermore, red galaxies atz ∼ 0.7 contain the same predominance (∼ 85% by op-tical luminosity density) of early-type galaxies (E/S0/Sa)as locally (Bell et al. 2004a), with a small contaminationby edge-on disk galaxies with colors reddened by internalextinction. For this study we are interested in early-typegalaxies with red colors, thus we select our sample usingboth color and morphology.
2.3.1. Red Sequence
Red-color selection permits an objective and empiricalfirst cut for defining early-type galaxies over the last half ofcosmic history. We use the empirical fit to the CMR evo-lution (including local comparison points) from Bell et al.(2004b)3 to select red-sequence galaxies at a given redshiftz with rest-frame colors redder than
(U − V ) = 1.05 − 0.31z − 0.08(MV − 5 log10 h + 20). (1)
This color cut is 0.25 mag redder than the fit to the CMRevolution, and similar in philosophy to the Butcher &Oemler (1984) criteria, except that we select red ratherthan blue galaxies. The color evolution of red-sequencegalaxies selected with this definition is in good agreementwith the expected evolution of a single-age stellar popu-lation anchored to z = 0. There are 1166 red-sequenceobjects with 0.2 < z ≤ 1.0 and GEMS imaging.
To facilitate meaningful profile fitting, we visually in-spect the F850LP images of the red-sequence sample. COMBO-17 is expected to misclassify a small number of red M-classstars as moderate-redshift red-sequence galaxies (Wolf et al.2004). With the superior resolution of GEMS, we can di-rectly detect 69 misclassified stars, which are shown inFigure 5 for completeness, and are omitted from the anal-ysis hereafter. We note that these stars are also separatedcleanly from galaxies using a SExtractor CLASS STAR≥0.85 cut. Additionally, we remove 50 red-sequence galaxieswith poor S/N found near GEMS image edges or withininter-chip gaps. This leaves 1047 red-sequence galaxieswith useful GEMS imaging. Last, we remove 84 galax-ies with morphologies where reliable fits are not possible(14 with prominent dust lanes, 29 irregulars, and 41 pe-culiar/interacting). We are left with a final sample of 963morphologically “normal” red galaxies with the followingbreakdown of coarse types: 699 E/S0, 162 Sa, and 102late-type spirals (Sb–Sd). Owing to the subjective natureof visual classifications, we divide the sample morphologi-cally using a quantitative method in the next section.
2.3.2. Quantitative Morphology
We refine our sample further by determining which red-sequence galaxies have early-type morphology using a quan-tifiable and repeatable method. The simple Sersic (1968)3 This cut is slightly bluer than that given by Bell et al. (2004b). Ow-ing partially to uncertainties in photometric calibration and galacticforeground extinction, the red sequence has slightly different colorsin the three COMBO-17 fields, and the cut we use here is moreappropriate for the E-CDFS.

Evolution of Early-type Red Galaxies with GEMS 5
model, which describes the radial surface brightness pro-file of a galaxy by Σ(r) ∝ exp (−r1/n), is the most widely-used parametric function. The Sersic index n describeshow centrally-concentrated a galaxy appears, with n = 4describing the familiar r1/4 profile of ellipticals (de Vau-couleurs 1948), and n = 1 representing the exponentialprofile commonly seen in spiral disks. Studies with theSDSS have adopted empirical cutoffs around n = 2.5 toseparate morphologically early and late types (Blantonet al. 2003b; Shen et al. 2003; Hogg et al. 2004). In ad-dition, using a sample of nearly 1500 GEMS galaxies inthe thin redshift slice 0.65 ≤ z ≤ 0.75, Bell et al. (2004a)showed that an n = 2.5 cut was reliable at distinguishingbetween visually-classified early and late types. To remainconsistent, we adopt n ≥ 2.5 to denote early types in thisstudy.
We note that the n = 2.5 cut is a crude concentra-tion cut that takes no account of the real diversity ofgalaxy forms seen in nature. In particular, this cut doesnot account explicitly for dynamically-distinct bulge anddisk components, and we reserve a detailed fitting of thephoto-bulge and photo-disk components to future papers.Nevertheless, it is unclear whether bulge/disk decomposi-tions will be any more robust or physical than the simplen = 2.5 cut. We note two additional sources of concernwith the n ≥ 2.5 selection. First, (1+z)4 dimming of disksmay cause a systematic bias such that large disks at highredshift may be too faint to detect and, thus, appear asbulge-dominated galaxies (larger n values). Second, a cor-relation exists between n and absolute B-band magnitudefor visually-selected ellipticals (e.g., Trujillo et al. 2004a).Therefore, a strict n = 2.5 cut is effectively a luminositycut of roughly MV = −17+5 log10 h. This magnitude limitis below our redshift reliability cutoff at all redshifts ex-cept for the z ≤ 0.3 interval, at which the drop in numbersof galaxies fainter than −17.5+5 log10 h may be explainedby this effect. Ultimately, we accept these caveats with theunderstanding that we have a repeatable and empirically-motivated early-type galaxy sample.
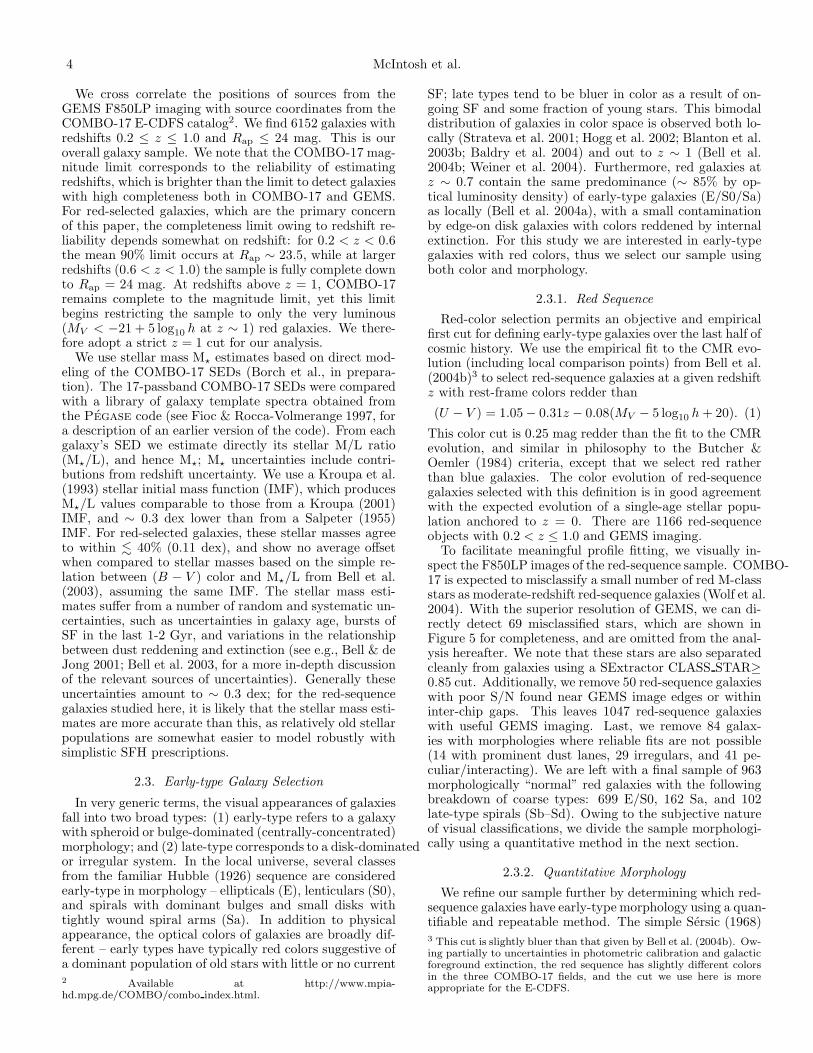
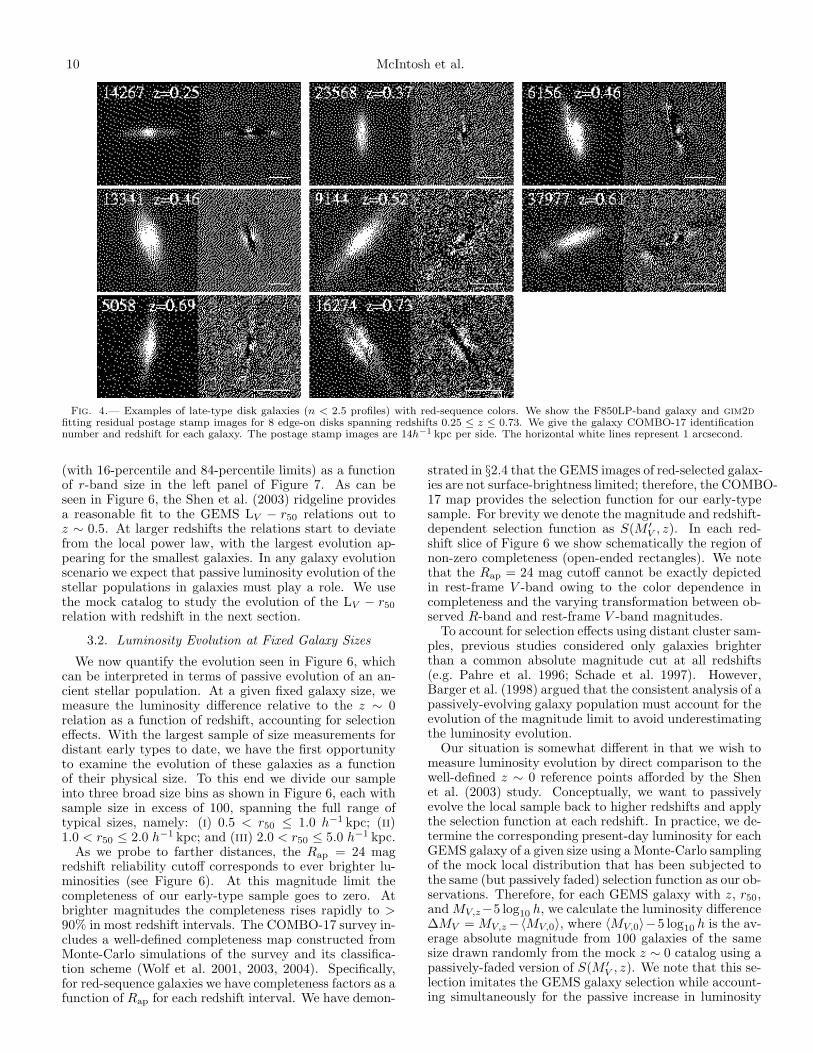
In Appendix A, we describe our method for fitting aSersic model to each galaxy’s two-dimensional luminosityprofile from the F850LP imaging. Briefly, we use the fit-ting code gim2d (Simard et al. 2002) to fit the sample of963 red-sequence galaxies and find that 96% (928) are fitsuccessfully. The majority of fitting failures are the resultof gim2d reaching the Sersic parameter limit of n = 8. Weestimate uncertainties of δn/n ∼ 0.25. Our final samplecontains 728 red galaxies out to z = 1 with n ≥ 2.5. Ingeneral, using an n = 2.5 cut does a good job separatingred-selected galaxies into morphologically early and latetypes. We find only 3% of the red n ≥ 2.5 sample havelate-type (Sb-Sd) visual morphologies, while 14% of thevisually early types (E-Sa) have n < 2.5; this is typicalof what was found in the comparison of by-eye and Sersicclassifications at z ∼ 0.7 by Bell et al. (2004a). We showin Figures 1 – 3 that representative examples of the redGEMS galaxies with n ≥ 2.5 are visually early-type in ap-pearance. For contrast, in Figure 4 we display a handfulof the red-sequence galaxies with n < 2.5 that correspondto edge-on disks.
2.4. Effective Size Measurements
2.4.1. Galaxy Sizes
The main focus of this work is the measurement andanalysis of galaxy sizes as a function of redshift. gim2dcalculates the half-light semi-major axis length a50 by in-tegrating the best-fit Sersic model flux to infinity. Formeaningful comparison with SDSS results we adopt a cir-cular half-light radius, or geometric mean, given by r50 =a50
√1 − e, where e is the best-fit model ellipticity. We
have applied a robust method for determining the system-atic and random uncertainties of each model parameter bymeasuring their random offset and variance with respectto known values using a large sample of artificial galaxiesanalyzed in the same manner as the GEMS data (H05).This method has proven successful in other galaxy fittingwork (e.g., Tran et al. 2003; MacArthur et al. 2003). Wefind that r50 has typical random uncertainties of ∼ 35%with no systematic error. In addition, we find that gim2dr50 measurements are reliable for > 90% of galaxies withF850LP-band surface brightness of µ50 ≤ 24 mag asec−2.As seen in Figure 5, our early-type sample is well withinthis limit.
Sky level uncertainties are an important source of sys-tematic error in size measurements when applying profilefitting techniques (e.g., de Jong 1996). We estimate theerror in our fitting-derived sizes due to the uncertainty inour local background measurements (σbkg ∼ 0.2 ADU) byrepeating the fits with the sky level held to constant val-ues of ±1σbkg. We find that our size measurements haveaverage uncertainties due to the sky of ∼ 10%.
Finally, our galaxy sizes are based on r50 in a fixed, ob-served passband (F850LP), which corresponds roughly tothe SDSS z-band. Therefore, galaxy sizes at different red-shifts are measured at different rest-frame wavelengths;e.g., the central wavelength of the F850LP filter corre-sponds to rest-frame 7560 Aat z = 0.25 and 4846 Aat z =0.95. For a consistent comparison with the local scalingrelations from Shen et al. (2003), we correct each r50 mea-surement to rest-frame r-band. Early-type galaxies areknown to have internal radial color gradients (e.g., Franxet al. 1989; Peletier et al. 1990; Bernardi et al. 2003), withredder colors towards their centers. Such gradients shouldresult in a wavelength-dependent galaxy size. We esti-mate a correction to shift z-band sizes to rest-frame r-bandbased on typical color gradients of ∆(B − R)/∆log r =−0.09 and ∆(U − R)/∆log r = −0.22 from Peletier et al.(1990). We assume an r1/4 surface brightness profile andfind that this gradient will produce measured sizes in theU -band to be about 6.5% bigger than in the r-band; i.e.∆r/∆log λ = −0.25. Between z = 1 and z = 0 the sameobserved passband corresponds to a factor of 2 change inwavelength, or a 7.5% size correction per unit redshift.The correction to rest-frame r-band (z-band observed atz ∼ 0.45) is then given by
∆r
robs= −0.075(z − 0.466). (2)
Owing to the mild color gradients this correction is quitesmall, amounting to only 4.0% (1.5%) decrease (increase)in observed size for z = 1 (z = 0.25), and as such it doesnot significantly affect our conclusions. We note that ellip-ticals with blue cores (i.e. inverted color gradients) havebeen observed by Menanteau et al. (2001) in the HubbleDeep Field (HDF), yet these galaxies are globally bluer
6 McIntosh et al.
than our red-sequence cut. The assumptions we make re-garding color gradients are based on red galaxies; there-fore, it is fair to apply this correction to our red-selectedsample.
2.4.2. Magnitude-Size Distributions
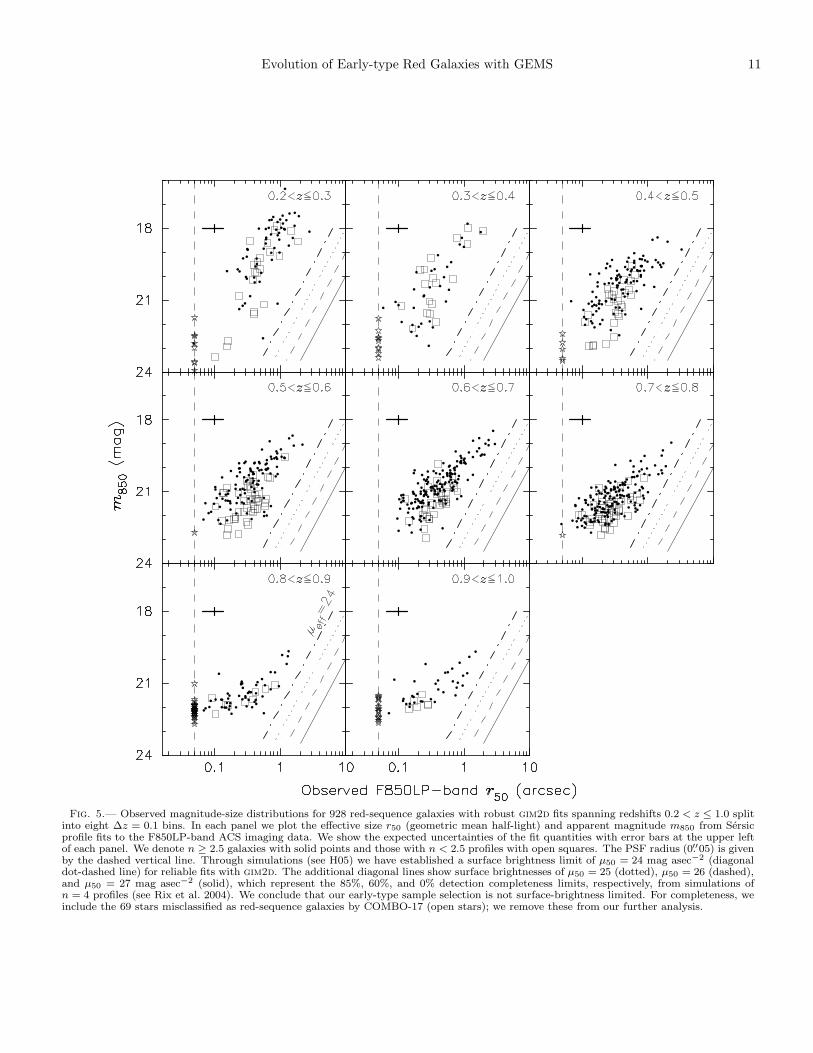
Before proceeding with our analysis of scaling relationsusing rest-frame quantities, we plot in Figure 5 the magnitude-size distributions in the observed F850LP-band frame forall 928 red-sequence galaxies (split into eight bins of width∆z = 0.1 spanning redshifts 0.2 < z ≤ 1.0) to illustrateseveral aspects of our sample. We calculate the apparentmagnitude m850 of each galaxy from the total intensity ofthe best-fit model (see Appendix A). We see that galaxyapparent magnitudes and angular sizes are correlated outto z = 1, such that bigger galaxies are brighter. We notethat the effects of (1 + z)4 cosmological dimming appearas a shift of the magnitude-size correlation towards lowersurface brightnesses at increasing redshifts. Specifically,between z = 0.25 and z = 0.75 the mean relation has fadedby the expected 1.5 mag. Furthermore, nearly all galax-ies have r50 < 1.′′0, clearly illustrating the need for HSTresolution to obtain accurate size measurements for dis-tant galaxies. All red-selected galaxies are well-resolved,and have effective surface brightnesses > 1.0 mag brighterthan the gim2d reliability limit and > 2.0 mag brighterthan the 85% detection completeness limit. Therefore, ourearly-type sample is limited only by the Rap = 24 mag cut-off (corresponding to m850 ∼ 22) for reliable photometricredshifts inherent to the COMBO-17 survey.
In addition, we show where n < 2.5 (open squares in Fig-ure 5) red-selected galaxies are found in the magnitude-sizeplane. Most red n < 2.5 galaxies tend to have lower surfacebrightnesses relative to the spheroid-dominated n ≥ 2.5galaxies (solid symbols), and are for the most part highly-inclined disk galaxies. These results are in qualitativeagreement with the different magnitude-size correlationsfor reddened edge-on disks and early-type galaxies in thelocal universe (Blanton et al. 2003b).
3. scaling relations of early-type galaxies with0.2 < z ≤ 1.0
3.1. Luminosity–Size Relation
We now present the LV − r50 relations for early-typegalaxies with 0.2 < z ≤ 1.0 and we will compare these tothe present-day distribution. In Figure 6, we divide oursample into eight redshift bins of ∆z = 0.1 and for each weplot the absolute V -band magnitude against the rest-framer-band size in physical units (h−1 kpc). The bulk of theearly-type population at each epoch spans roughly a 0.5 to5.0 h−1 kpc half-light size distribution, with a handful ofsmaller (< 0.5h−1 kpc) and larger (> 5.0h−1 kpc) galax-ies in some redshift slices. Starting at low redshift, theaverage number of galaxies per redshift slice increases aswe sample larger co-moving volumes, until z ∼ 0.75 wherethe counts start falling off as expected in a magnitude-limited sample. The second lowest redshift bin is quitesparsely-populated as a result of large-scale fluctuations.
For comparison, in each redshift interval of Figure 6 weshow the “ridgeline” of the present-day LV − r50 relationfor early-type galaxies. The z ∼ 0 ridgeline is given bythe median absolute V -band magnitude as a function of
galaxy size using a mock catalog of MV − 5 log10 h andr50 values that follow the luminosity function of SDSS-selected, red-sequence galaxies from Bell et al. (2004b),and the LV −r50 relation for n ≥ 2.5 galaxies in SDSS fromShen et al. (2003). Using a complete sample of n ≥ 2.5galaxies4 these authors found a LV − r50 scaling relationin the local universe that is well fit by a simple powerlaw, and they showed that SDSS early types of a givenluminosity follow a log-normal size distribution given by
f(r50, r50(L), σ(L)) =1√
2πσ(L)exp
[
− ln2(r50/r50(L))
2σ2(L)
]
dr50
r50,
(3)with characteristic median size r50(L) and dispersion σ(L).The Shen et al. (2003) work is based on half-light radii andtotal absolute magnitudes from Sersic (PSF-corrected) fitsto the azimuthally-averaged surface brightness profiles inthe r-band (for radial profile fitting see Stoughton et al.2002). These present-day (0.05 < z < 0.15) sizes are givenin observed r-band; nevertheless, at a median redshift ofz ∼ 0.1 the sizes are within 1% of r-band rest-frame ac-cording to our passband correction calculation (§2.4). Us-ing k-corrections from Blanton et al. (2003a), the SDSSgalaxy luminosities have been corrected to the r-band rest-frame (z = 0), which we translate to rest-frame V -band inour adopted (h is free parameter) cosmology using a mean(V − r) = 0.33 color for E/S0s (Fukugita et al. 1995).Therefore, as a function of absolute V -band magnitudeM ′
V = MV − 5 log10 h, the local LV − r50 relation has me-dian r-band size (in units of h−1 kpc)
r50(M′
V ) = 10(−0.26M ′
V−4.93), (4)
with dispersion5 that increases with decreasing luminosityas
σ(M ′
V ) = 0.27 +0.18
1 + 10−0.8(M ′
V+19.78)
. (5)
Equation (3) does not directly allow one to plot theridgeline of the LV − r50 relation, because it does notaccount for the steeply-declining luminosity function ofearly-type galaxies, which at large size will shift the ridge-line towards fainter luminosities. To account for this weconstruct a large grid of galaxy luminosities and sizes thatsample the LV −r50 relation of z ∼ 0 early types with a log-normal dispersion in the size direction given by Equations(3-5). We then populate this grid so that the MV −5 log10 hdistribution matches the local B-band luminosity functiongiven in Bell et al. (2004b), which we transform to rest-frame V -band assuming a typical (B − V ) = 0.9 colorfor E/S0 types (Fukugita et al. 1995). The grid spans−24 < MV − 5 log10 h < −16 in 800 (0.01 mag) cells and0 < r50 < 25 h−1 kpc in 500 (0.05 h−1 kpc) cells, for a finegrid of 400,000 total cells with over 16.9 million LV , r50
values representative of the LV − r50 distribution of early-type galaxies in the present-day universe. We illustratethis mock catalog by plotting its median MV − 5 log10 h4 We note that the Shen et al. (2003) early-type sample is notcolor selected, thus, there will be some contamination from centrally-concentrated galaxies with blue colors. Yet, Shen et al. have statedthat the majority of n ≥ 2.5 SDSS galaxies have red colors of(g − r) > 0.7 (see also Blanton et al. 2003b).5 This expression fits the dispersion of the LV −r50 relation for bothearly and late types to within their respective error bars (see Fig. 6of Shen et al. 2003).
Evolution of Early-type Red Galaxies with GEMS 7
Fig. 1.— Representative examples of small (fixed-size bin i: 0.5 < r50 ≤ 1.0 h−1 kpc) early-type (n ≥ 2.5 profiles with red-sequence colors)galaxies in the redshift range 0.2 < z ≤ 0.7. All galaxies shown are visually early types. In each row we show the F850LP-band galaxy andgim2d fitting residual postage stamp images for three randomly-selected galaxies in each redshift interval. We give the galaxy COMBO-17identification number for each galaxy in the upper left. The postage stamp images are 7h−1 kpc per side. The horizontal white lines represent1 arcsecond.
8 McIntosh et al.
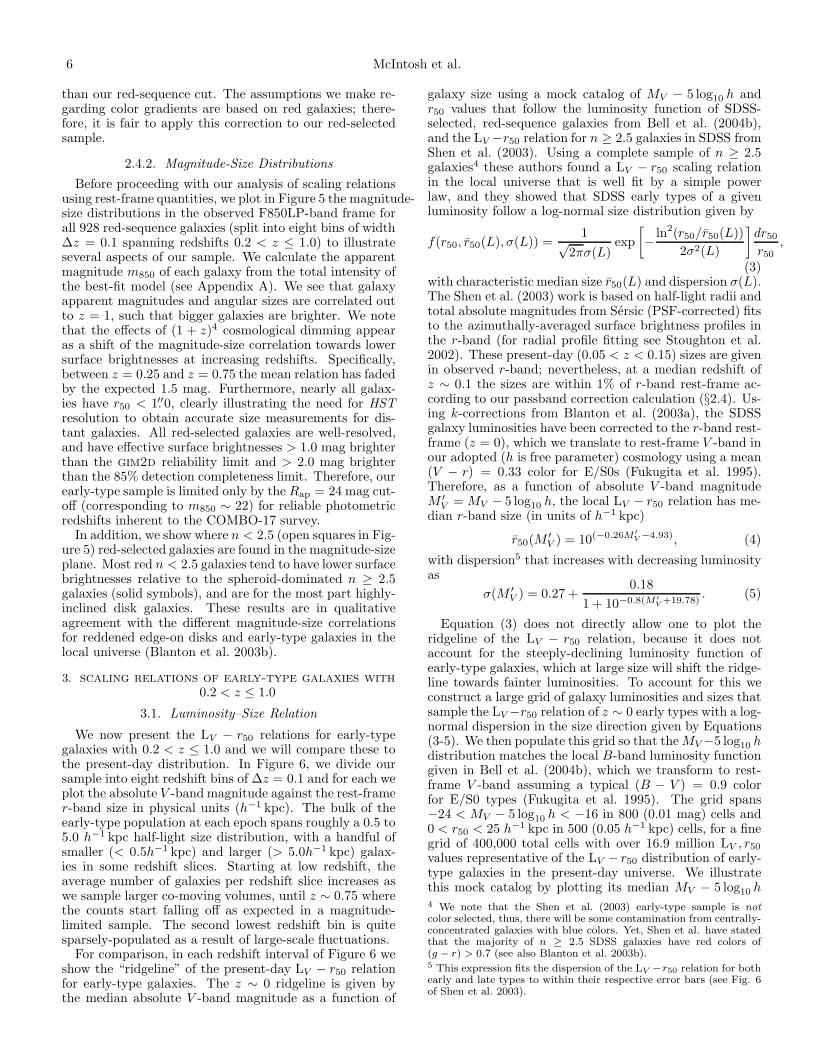
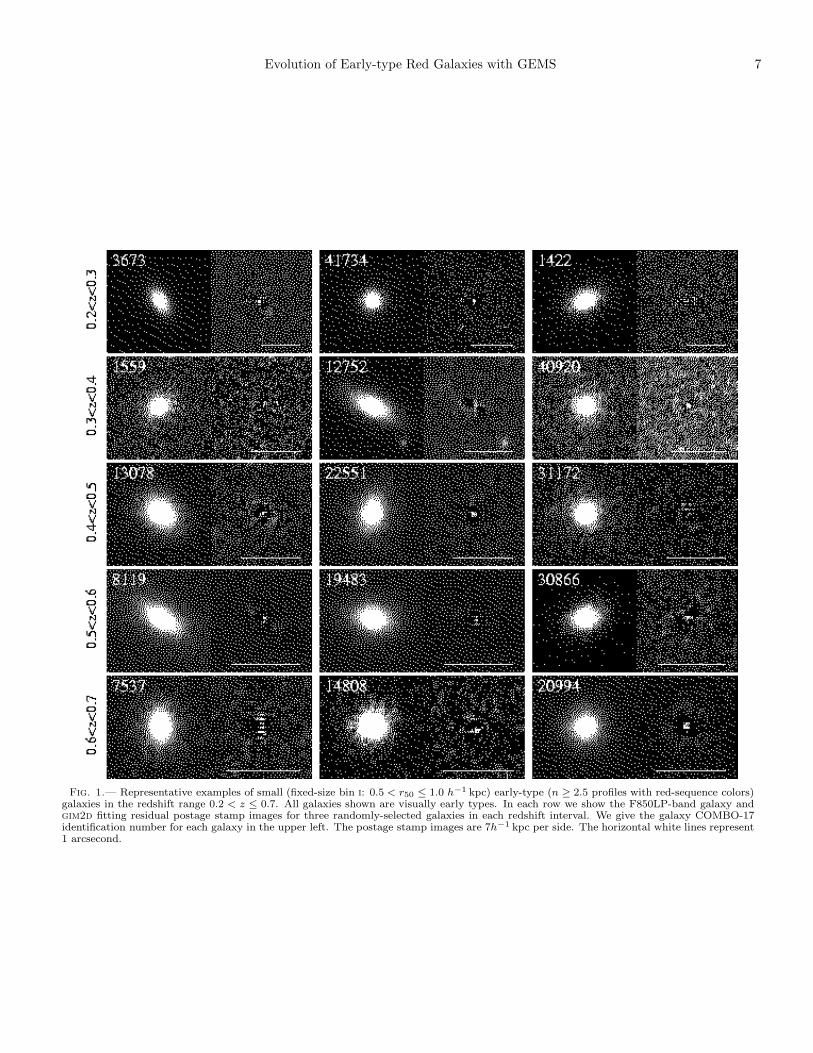
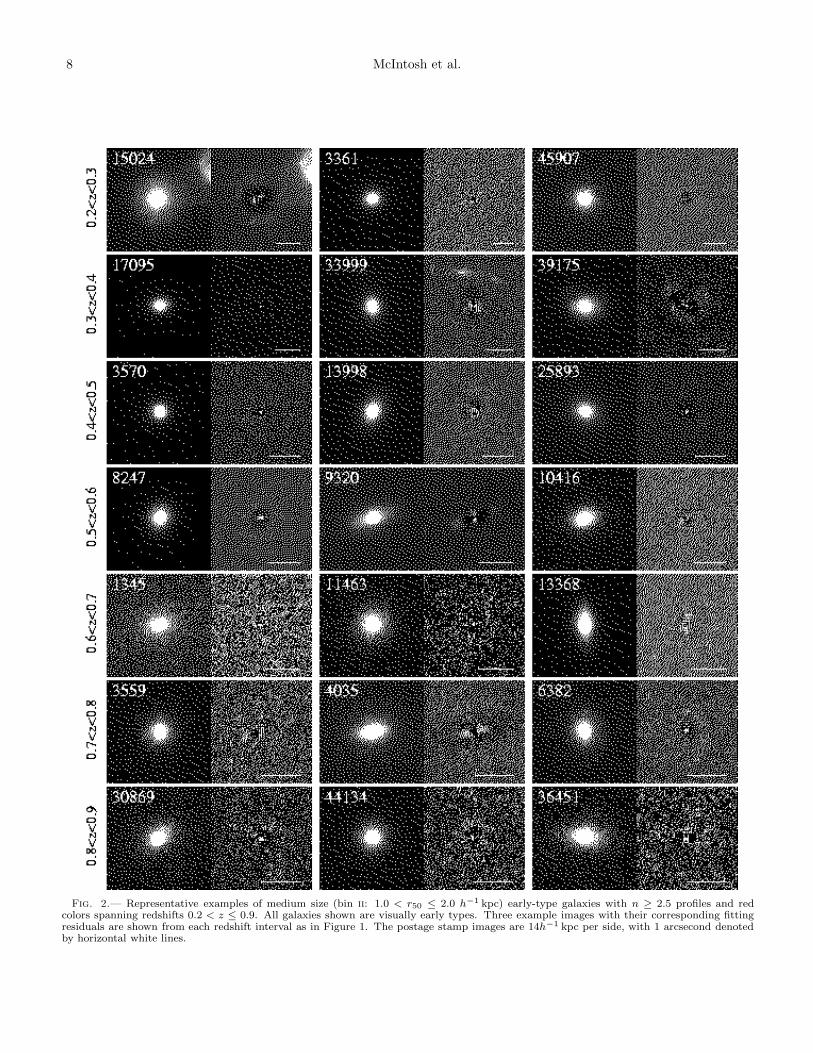
Fig. 2.— Representative examples of medium size (bin ii: 1.0 < r50 ≤ 2.0 h−1 kpc) early-type galaxies with n ≥ 2.5 profiles and redcolors spanning redshifts 0.2 < z ≤ 0.9. All galaxies shown are visually early types. Three example images with their corresponding fittingresiduals are shown from each redshift interval as in Figure 1. The postage stamp images are 14h−1 kpc per side, with 1 arcsecond denotedby horizontal white lines.

Evolution of Early-type Red Galaxies with GEMS 9
Fig. 3.— Representative examples of large size (bin iii: 2.0 < r50 ≤ 5.0 h−1 kpc) early-type galaxies with n ≥ 2.5 profiles and red colorsspanning redshifts 0.2 < z ≤ 1.0. All galaxies shown are visually early types. Galaxy and fitting residual images are shown from each redshiftinterval as in Figures 1 and 2. The postage stamp images are 21h−1 kpc per side, with 1 arcsecond denoted by horizontal white lines.
10 McIntosh et al.
Fig. 4.— Examples of late-type disk galaxies (n < 2.5 profiles) with red-sequence colors. We show the F850LP-band galaxy and gim2dfitting residual postage stamp images for 8 edge-on disks spanning redshifts 0.25 ≤ z ≤ 0.73. We give the galaxy COMBO-17 identificationnumber and redshift for each galaxy. The postage stamp images are 14h−1 kpc per side. The horizontal white lines represent 1 arcsecond.
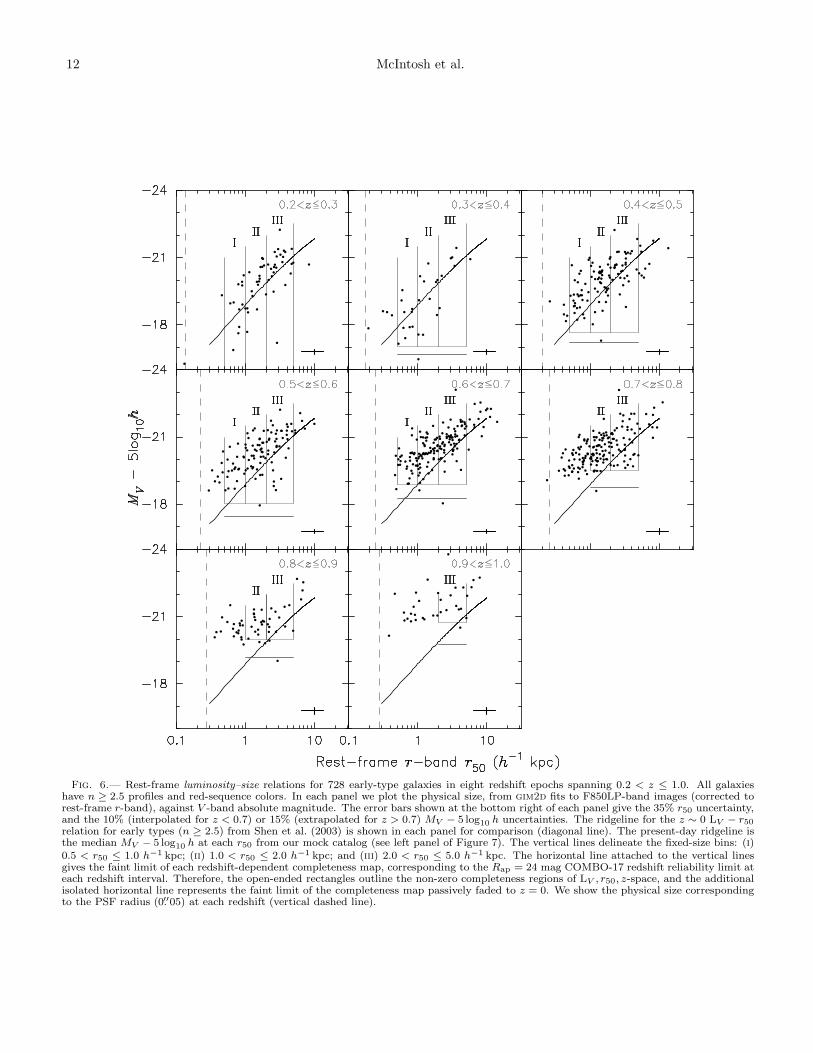
(with 16-percentile and 84-percentile limits) as a functionof r-band size in the left panel of Figure 7. As can beseen in Figure 6, the Shen et al. (2003) ridgeline providesa reasonable fit to the GEMS LV − r50 relations out toz ∼ 0.5. At larger redshifts the relations start to deviatefrom the local power law, with the largest evolution ap-pearing for the smallest galaxies. In any galaxy evolutionscenario we expect that passive luminosity evolution of thestellar populations in galaxies must play a role. We usethe mock catalog to study the evolution of the LV − r50
relation with redshift in the next section.
3.2. Luminosity Evolution at Fixed Galaxy Sizes
We now quantify the evolution seen in Figure 6, whichcan be interpreted in terms of passive evolution of an an-cient stellar population. At a given fixed galaxy size, wemeasure the luminosity difference relative to the z ∼ 0relation as a function of redshift, accounting for selectioneffects. With the largest sample of size measurements fordistant early types to date, we have the first opportunityto examine the evolution of these galaxies as a functionof their physical size. To this end we divide our sampleinto three broad size bins as shown in Figure 6, each withsample size in excess of 100, spanning the full range oftypical sizes, namely: (i) 0.5 < r50 ≤ 1.0 h−1 kpc; (ii)1.0 < r50 ≤ 2.0 h−1 kpc; and (iii) 2.0 < r50 ≤ 5.0 h−1 kpc.
As we probe to farther distances, the Rap = 24 magredshift reliability cutoff corresponds to ever brighter lu-minosities (see Figure 6). At this magnitude limit thecompleteness of our early-type sample goes to zero. Atbrighter magnitudes the completeness rises rapidly to >90% in most redshift intervals. The COMBO-17 survey in-cludes a well-defined completeness map constructed fromMonte-Carlo simulations of the survey and its classifica-tion scheme (Wolf et al. 2001, 2003, 2004). Specifically,for red-sequence galaxies we have completeness factors as afunction of Rap for each redshift interval. We have demon-
strated in §2.4 that the GEMS images of red-selected galax-ies are not surface-brightness limited; therefore, the COMBO-17 map provides the selection function for our early-typesample. For brevity we denote the magnitude and redshift-dependent selection function as S(M ′
V , z). In each red-shift slice of Figure 6 we show schematically the region ofnon-zero completeness (open-ended rectangles). We notethat the Rap = 24 mag cutoff cannot be exactly depictedin rest-frame V -band owing to the color dependence incompleteness and the varying transformation between ob-served R-band and rest-frame V -band magnitudes.
To account for selection effects using distant cluster sam-ples, previous studies considered only galaxies brighterthan a common absolute magnitude cut at all redshifts(e.g. Pahre et al. 1996; Schade et al. 1997). However,Barger et al. (1998) argued that the consistent analysis of apassively-evolving galaxy population must account for theevolution of the magnitude limit to avoid underestimatingthe luminosity evolution.
Our situation is somewhat different in that we wish tomeasure luminosity evolution by direct comparison to thewell-defined z ∼ 0 reference points afforded by the Shenet al. (2003) study. Conceptually, we want to passivelyevolve the local sample back to higher redshifts and applythe selection function at each redshift. In practice, we de-termine the corresponding present-day luminosity for eachGEMS galaxy of a given size using a Monte-Carlo samplingof the mock local distribution that has been subjected tothe same (but passively faded) selection function as our ob-servations. Therefore, for each GEMS galaxy with z, r50,and MV,z−5 log10 h, we calculate the luminosity difference∆MV = MV,z −〈MV,0〉, where 〈MV,0〉−5 log10 h is the av-erage absolute magnitude from 100 galaxies of the samesize drawn randomly from the mock z ∼ 0 catalog using apassively-faded version of S(M ′
V , z). We note that this se-lection imitates the GEMS galaxy selection while account-ing simultaneously for the passive increase in luminosity
Evolution of Early-type Red Galaxies with GEMS 11
Fig. 5.— Observed magnitude-size distributions for 928 red-sequence galaxies with robust gim2d fits spanning redshifts 0.2 < z ≤ 1.0 splitinto eight ∆z = 0.1 bins. In each panel we plot the effective size r50 (geometric mean half-light) and apparent magnitude m850 from Sersicprofile fits to the F850LP-band ACS imaging data. We show the expected uncertainties of the fit quantities with error bars at the upper leftof each panel. We denote n ≥ 2.5 galaxies with solid points and those with n < 2.5 profiles with open squares. The PSF radius (0.′′05) is givenby the dashed vertical line. Through simulations (see H05) we have established a surface brightness limit of µ50 = 24 mag asec−2 (diagonaldot-dashed line) for reliable fits with gim2d. The additional diagonal lines show surface brightnesses of µ50 = 25 (dotted), µ50 = 26 (dashed),and µ50 = 27 mag asec−2 (solid), which represent the 85%, 60%, and 0% detection completeness limits, respectively, from simulations ofn = 4 profiles (see Rix et al. 2004). We conclude that our early-type sample selection is not surface-brightness limited. For completeness, weinclude the 69 stars misclassified as red-sequence galaxies by COMBO-17 (open stars); we remove these from our further analysis.
12 McIntosh et al.
Fig. 6.— Rest-frame luminosity–size relations for 728 early-type galaxies in eight redshift epochs spanning 0.2 < z ≤ 1.0. All galaxieshave n ≥ 2.5 profiles and red-sequence colors. In each panel we plot the physical size, from gim2d fits to F850LP-band images (corrected torest-frame r-band), against V -band absolute magnitude. The error bars shown at the bottom right of each panel give the 35% r50 uncertainty,and the 10% (interpolated for z < 0.7) or 15% (extrapolated for z > 0.7) MV − 5 log10 h uncertainties. The ridgeline for the z ∼ 0 LV − r50
relation for early types (n ≥ 2.5) from Shen et al. (2003) is shown in each panel for comparison (diagonal line). The present-day ridgeline isthe median MV − 5 log10 h at each r50 from our mock catalog (see left panel of Figure 7). The vertical lines delineate the fixed-size bins: (i)0.5 < r50 ≤ 1.0 h−1 kpc; (ii) 1.0 < r50 ≤ 2.0 h−1 kpc; and (iii) 2.0 < r50 ≤ 5.0 h−1 kpc. The horizontal line attached to the vertical linesgives the faint limit of each redshift-dependent completeness map, corresponding to the Rap = 24 mag COMBO-17 redshift reliability limit ateach redshift interval. Therefore, the open-ended rectangles outline the non-zero completeness regions of LV , r50, z-space, and the additionalisolated horizontal line represents the faint limit of the completeness map passively faded to z = 0. We show the physical size correspondingto the PSF radius (0.′′05) at each redshift (vertical dashed line).
Evolution of Early-type Red Galaxies with GEMS 13
that a present-day galaxy would have at a given epoch.Moreover, our method is identical to passively evolving(brightening) the z ∼ 0 mock dataset to the mean redshiftof each epoch, applying S(M ′
V , z), and computing ∆MV .To quantify passive fading, we adopt the luminosity evo-
lution of a single-burst stellar population, with formationredshift zform = 3 and metallicity [Fe/H] = −0.2, usingthe Pegase model (Fioc & Rocca-Volmerange 1997). Be-low we discuss other formation redshifts and metallicities,including the null no-passive-evolution case. In each red-shift interval of Figure 6 we show the amount that passiveevolution shifts the z ∼ 0 selection function relative toS(M ′
V , z) by the isolated horizontal line. Since our selec-tion function is redshift-dependent, it is computationallyeasier to apply a passively-faded version of S(M ′
V , z) tothe z ∼ 0 mock distribution at each epoch, rather thanevolving the entire mock catalog at each epoch.
In Figure 8 we plot the luminosity evolution of the early-type population in three separate galaxy size bins. Thedistributions of ∆MV values with redshift show evolutionsuch that most galaxies of a given size are brighter at largerlook-back times. The scatter in the data is similar to thedispersion given by the log-normal distribution from Shenet al. (2003), as shown in the left panel of Figure 7. We fit aline (using ordinary least-squares linear regression) to the∆MV evolution in each panel of Figure 8, constrained tointercept the origin (z = 0, ∆MV = 0). We limit this anal-ysis to GEMS galaxies (solid circles) within each size binsout to a maximum redshift where the selection function is≥ 50% according to the mock z ∼ 0 catalog for a passivelyfading scenario. Therefore, as outlined with open rectan-gles in Figure 6, we do linear fits to galaxy samples fromthe three size bins as follows: (i) 102 with z ≤ 0.7; (ii) 227with z ≤ 0.9; and (iii) 222 with z ≤ 1.0. We exclude 57small (i) and 7 medium (ii) size early types (open circlesin Figure 8). In each panel, the sloped red band gives thelinear fit to the luminosity evolution with 1σ dispersion.The regression dispersion represents the 68-percentile dis-tribution of linear fits to 200 bootstrap resamples of the(∆MV , z) values. We find significant luminosity evolutionfor early-type galaxies of all sizes, from ∼ 1.0 mag for small(0.5 < r50 ≤ 1.0 h−1 kpc) systems between z = 0.7 andnow, to ∼ 0.7 mag for the largest galaxies between z = 1.0and the present time. We note that the apparently largechange in LV − r50 slope with redshift found in Figure 6is due mostly to our selection function cutting lower lumi-nosity galaxies at higher redshift. Nevertheless, once wecorrect for selection effects, the differing amounts of lumi-nosity evolution in each size bin of Figure 8 does representa significant change in LV − r50 slope with redshift notobserved in previous studies.
In Table 1 we tabulate the slopes of the constrained lin-ear fits to the luminosity evolution for each size bin. Werepeat this analysis using passive fading of S(M ′
V , z) thatis slightly stronger (zform = 2, [Fe/H] = −0.1) and slightlyweaker (zform = 5, [Fe/H] = −0.3)6. We see in Table 1 thatthe measured luminosity evolution is statistically equiva-lent (< 1σ differences) between the analyses using threedifferent passive fading parameters. In addition, we calcu-6 In both cases the metallicities are changed in concert with theformation redshifts to reproduce the observed color evolution of thered sequence; see e.g., Bell et al. (2004b) for more details
late ∆MV values under the null hypothesis of no passiveevolution. As Barger et al. (1998) pointed out, not includ-ing passive evolution of the luminosity cutoff (here definedby our completeness map) will underestimate the evolu-tion. Nonetheless, even under the null condition we stillfind significant luminosity evolution in early-type galax-ies of a given size. Furthermore, we find that the amountof evolution continues to vary between different fixed-sizegalaxy populations.
Last, we compare the constrained fit to the luminosityevolution with a fit that is not constrained to go throughthe z = 0, no evolution origin. For this test we use thesame ∆MV data based on the mock catalog selection withzform = 3 passive fading assumed, and the same methodincluding bootstrap estimation of dispersion. We plot theunconstrained fits with light grey bands in each panel ofFigure 8, and we provide the best-fit linear parameters(slope and z = 0 intercept) in Table 2. We point outthat the intrinsic scatter in the ∆MV , z correlation, andthe fairly restricted redshift range over which we fit, bothcombine to produce a less well-constrained fit for the small-est galaxies compared with the two larger size bins. In allcases, significant fading of the early-type galaxy popula-tion at a given size is clearly detected, and the differencein fading rates between small and large galaxies is pre-served independent of assumptions regarding passive evo-lution and fitting method.
The two methods of fitting luminosity evolution havedifferent merits. The constrained fitting is anchored di-rectly to z = 0, which allows the use of our full knowledgeof the local universe. Furthermore, the constrained fits arequite robust as illustrated by the very narrow dispersionwe find with bootstrap resampling. On the other hand,the unconstrained fits show clearly the differences betweenGEMS and SDSS photometric and size measurement cal-ibrations, and for slight deficiencies in our treatment ofselection effects; the z = 0 offset is . 0.25 mag in all bins.
3.3. Stellar Mass–Size Relation
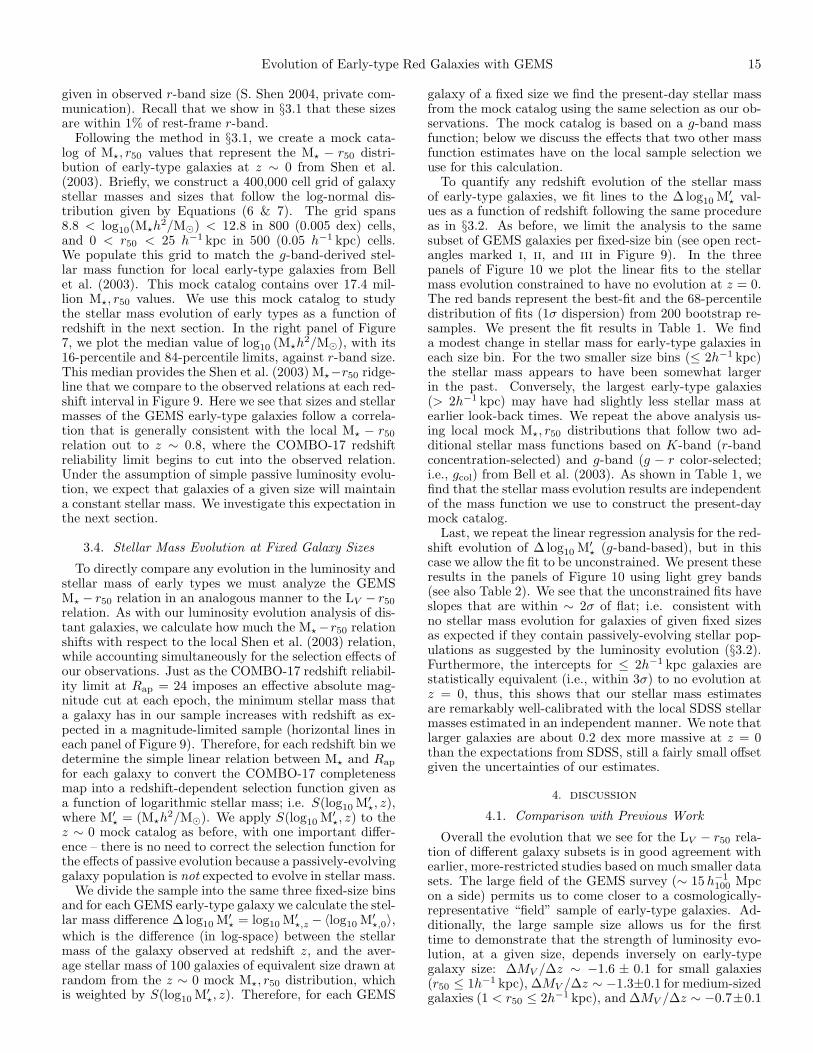
We turn our attention now to exploring the stellar massevolution of GEMS early-type galaxies as a function offixed size. In Figure 9 we present the M⋆ − r50 relationsfor 728 early types in eight ∆z = 0.1 redshift bins spanning0.2 < z ≤ 1.0. As with LV − r50, the M⋆ − r50 relationsare quite apparent to at least z ∼ 0.8.
In each panel of Figure 9 we display the M⋆ − r50 re-lation ridgeline for z ∼ 0 early-type galaxies from SDSS.Shen et al. (2003) showed that these galaxies also followa log-normal size distribution of the same general formas Equation (3) with a stellar mass dependence. Theseauthors derived stellar masses from SDSS Petrosian lumi-nosities using a model-dependent stellar M⋆/L from Kauff-mann et al. (2003)7. For our adopted (h is free parameter)cosmology, the local M⋆ − r50 relation has characteristicmedian size
log10 (r50/h−1kpc) = 0.56 log10 (M⋆h2/M⊙) − 5.52 (6)
with log-normal dispersion
σ(M⋆h2) = 0.29 +
0.53 × 10¹⁰M⊙
M⋆h2, (7)
7 Bell et al. (2003) showed that spectrally-derived and color-derivedstellar masses are the same to within 30%.
14 McIntosh et al.
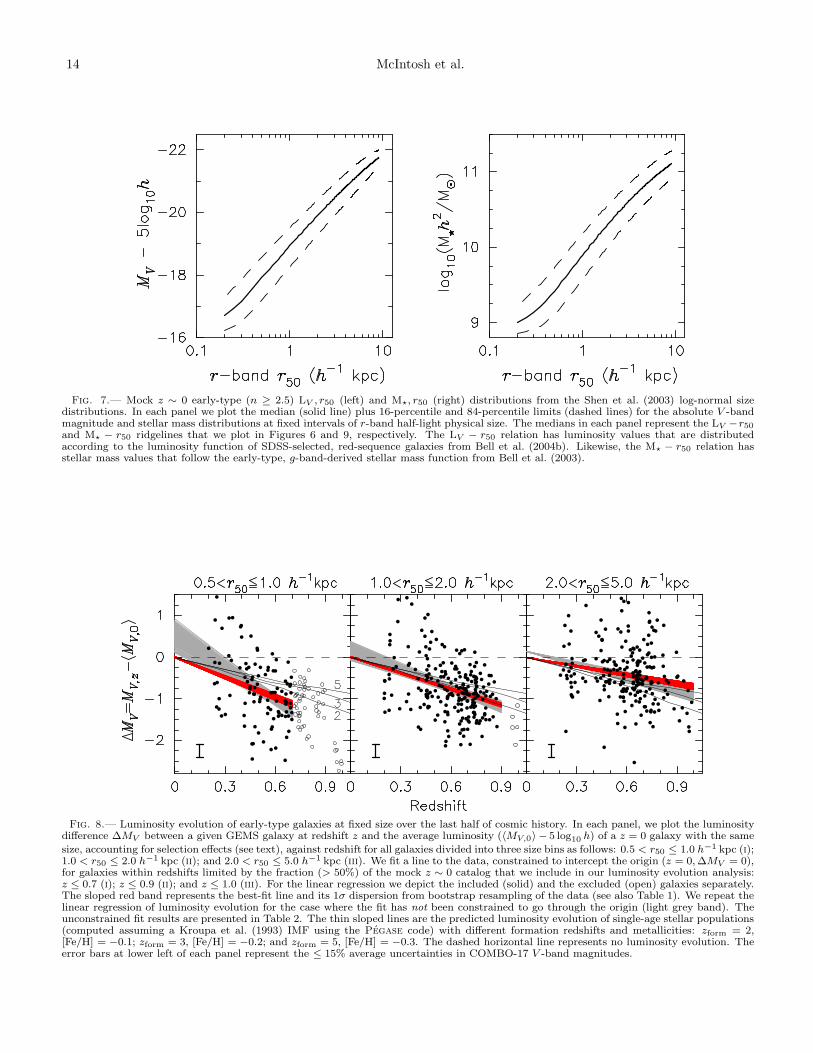
Fig. 7.— Mock z ∼ 0 early-type (n ≥ 2.5) LV , r50 (left) and M⋆, r50 (right) distributions from the Shen et al. (2003) log-normal sizedistributions. In each panel we plot the median (solid line) plus 16-percentile and 84-percentile limits (dashed lines) for the absolute V -bandmagnitude and stellar mass distributions at fixed intervals of r-band half-light physical size. The medians in each panel represent the LV −r50
and M⋆ − r50 ridgelines that we plot in Figures 6 and 9, respectively. The LV − r50 relation has luminosity values that are distributedaccording to the luminosity function of SDSS-selected, red-sequence galaxies from Bell et al. (2004b). Likewise, the M⋆ − r50 relation hasstellar mass values that follow the early-type, g-band-derived stellar mass function from Bell et al. (2003).
Fig. 8.— Luminosity evolution of early-type galaxies at fixed size over the last half of cosmic history. In each panel, we plot the luminositydifference ∆MV between a given GEMS galaxy at redshift z and the average luminosity (〈MV,0〉 − 5 log10 h) of a z = 0 galaxy with the same
size, accounting for selection effects (see text), against redshift for all galaxies divided into three size bins as follows: 0.5 < r50 ≤ 1.0 h−1 kpc (i);1.0 < r50 ≤ 2.0 h−1 kpc (ii); and 2.0 < r50 ≤ 5.0 h−1 kpc (iii). We fit a line to the data, constrained to intercept the origin (z = 0, ∆MV = 0),for galaxies within redshifts limited by the fraction (> 50%) of the mock z ∼ 0 catalog that we include in our luminosity evolution analysis:z ≤ 0.7 (i); z ≤ 0.9 (ii); and z ≤ 1.0 (iii). For the linear regression we depict the included (solid) and the excluded (open) galaxies separately.The sloped red band represents the best-fit line and its 1σ dispersion from bootstrap resampling of the data (see also Table 1). We repeat thelinear regression of luminosity evolution for the case where the fit has not been constrained to go through the origin (light grey band). Theunconstrained fit results are presented in Table 2. The thin sloped lines are the predicted luminosity evolution of single-age stellar populations(computed assuming a Kroupa et al. (1993) IMF using the Pegase code) with different formation redshifts and metallicities: zform = 2,[Fe/H] = −0.1; zform = 3, [Fe/H] = −0.2; and zform = 5, [Fe/H] = −0.3. The dashed horizontal line represents no luminosity evolution. Theerror bars at lower left of each panel represent the ≤ 15% average uncertainties in COMBO-17 V -band magnitudes.
Evolution of Early-type Red Galaxies with GEMS 15
given in observed r-band size (S. Shen 2004, private com-munication). Recall that we show in §3.1 that these sizesare within 1% of rest-frame r-band.
Following the method in §3.1, we create a mock cata-log of M⋆, r50 values that represent the M⋆ − r50 distri-bution of early-type galaxies at z ∼ 0 from Shen et al.(2003). Briefly, we construct a 400,000 cell grid of galaxystellar masses and sizes that follow the log-normal dis-tribution given by Equations (6 & 7). The grid spans8.8 < log10(M⋆h
2/M⊙) < 12.8 in 800 (0.005 dex) cells,and 0 < r50 < 25 h−1 kpc in 500 (0.05 h−1 kpc) cells.We populate this grid to match the g-band-derived stel-lar mass function for local early-type galaxies from Bellet al. (2003). This mock catalog contains over 17.4 mil-lion M⋆, r50 values. We use this mock catalog to studythe stellar mass evolution of early types as a function ofredshift in the next section. In the right panel of Figure7, we plot the median value of log10 (M⋆h
2/M⊙), with its16-percentile and 84-percentile limits, against r-band size.This median provides the Shen et al. (2003) M⋆−r50 ridge-line that we compare to the observed relations at each red-shift interval in Figure 9. Here we see that sizes and stellarmasses of the GEMS early-type galaxies follow a correla-tion that is generally consistent with the local M⋆ − r50
relation out to z ∼ 0.8, where the COMBO-17 redshiftreliability limit begins to cut into the observed relation.Under the assumption of simple passive luminosity evolu-tion, we expect that galaxies of a given size will maintaina constant stellar mass. We investigate this expectation inthe next section.
3.4. Stellar Mass Evolution at Fixed Galaxy Sizes
To directly compare any evolution in the luminosity andstellar mass of early types we must analyze the GEMSM⋆ − r50 relation in an analogous manner to the LV − r50
relation. As with our luminosity evolution analysis of dis-tant galaxies, we calculate how much the M⋆−r50 relationshifts with respect to the local Shen et al. (2003) relation,while accounting simultaneously for the selection effects ofour observations. Just as the COMBO-17 redshift reliabil-ity limit at Rap = 24 imposes an effective absolute mag-nitude cut at each epoch, the minimum stellar mass thata galaxy has in our sample increases with redshift as ex-pected in a magnitude-limited sample (horizontal lines ineach panel of Figure 9). Therefore, for each redshift bin wedetermine the simple linear relation between M⋆ and Rap
for each galaxy to convert the COMBO-17 completenessmap into a redshift-dependent selection function given asa function of logarithmic stellar mass; i.e. S(log10 M′
⋆, z),where M′
⋆ = (M⋆h2/M⊙). We apply S(log10 M′
⋆, z) to thez ∼ 0 mock catalog as before, with one important differ-ence – there is no need to correct the selection function forthe effects of passive evolution because a passively-evolvinggalaxy population is not expected to evolve in stellar mass.
We divide the sample into the same three fixed-size binsand for each GEMS early-type galaxy we calculate the stel-lar mass difference ∆ log10 M′
⋆ = log10 M′⋆,z −〈log10 M′
⋆,0〉,which is the difference (in log-space) between the stellarmass of the galaxy observed at redshift z, and the aver-age stellar mass of 100 galaxies of equivalent size drawn atrandom from the z ∼ 0 mock M⋆, r50 distribution, whichis weighted by S(log10 M′
⋆, z). Therefore, for each GEMS
galaxy of a fixed size we find the present-day stellar massfrom the mock catalog using the same selection as our ob-servations. The mock catalog is based on a g-band massfunction; below we discuss the effects that two other massfunction estimates have on the local sample selection weuse for this calculation.
To quantify any redshift evolution of the stellar massof early-type galaxies, we fit lines to the ∆ log10 M′
⋆ val-ues as a function of redshift following the same procedureas in §3.2. As before, we limit the analysis to the samesubset of GEMS galaxies per fixed-size bin (see open rect-angles marked i, ii, and iii in Figure 9). In the threepanels of Figure 10 we plot the linear fits to the stellarmass evolution constrained to have no evolution at z = 0.The red bands represent the best-fit and the 68-percentiledistribution of fits (1σ dispersion) from 200 bootstrap re-samples. We present the fit results in Table 1. We finda modest change in stellar mass for early-type galaxies ineach size bin. For the two smaller size bins (≤ 2h−1 kpc)the stellar mass appears to have been somewhat largerin the past. Conversely, the largest early-type galaxies(> 2h−1 kpc) may have had slightly less stellar mass atearlier look-back times. We repeat the above analysis us-ing local mock M⋆, r50 distributions that follow two ad-ditional stellar mass functions based on K-band (r-bandconcentration-selected) and g-band (g − r color-selected;i.e., gcol) from Bell et al. (2003). As shown in Table 1, wefind that the stellar mass evolution results are independentof the mass function we use to construct the present-daymock catalog.
Last, we repeat the linear regression analysis for the red-shift evolution of ∆ log10 M′
⋆ (g-band-based), but in thiscase we allow the fit to be unconstrained. We present theseresults in the panels of Figure 10 using light grey bands(see also Table 2). We see that the unconstrained fits haveslopes that are within ∼ 2σ of flat; i.e. consistent withno stellar mass evolution for galaxies of given fixed sizesas expected if they contain passively-evolving stellar pop-ulations as suggested by the luminosity evolution (§3.2).Furthermore, the intercepts for ≤ 2h−1 kpc galaxies arestatistically equivalent (i.e., within 3σ) to no evolution atz = 0, thus, this shows that our stellar mass estimatesare remarkably well-calibrated with the local SDSS stellarmasses estimated in an independent manner. We note thatlarger galaxies are about 0.2 dex more massive at z = 0than the expectations from SDSS, still a fairly small offsetgiven the uncertainties of our estimates.
4. discussion
4.1. Comparison with Previous Work
Overall the evolution that we see for the LV − r50 rela-tion of different galaxy subsets is in good agreement withearlier, more-restricted studies based on much smaller datasets. The large field of the GEMS survey (∼ 15 h−1
100 Mpcon a side) permits us to come closer to a cosmologically-representative “field” sample of early-type galaxies. Ad-ditionally, the large sample size allows us for the firsttime to demonstrate that the strength of luminosity evo-lution, at a given size, depends inversely on early-typegalaxy size: ∆MV /∆z ∼ −1.6 ± 0.1 for small galaxies(r50 ≤ 1h−1 kpc), ∆MV /∆z ∼ −1.3±0.1 for medium-sizedgalaxies (1 < r50 ≤ 2h−1 kpc), and ∆MV /∆z ∼ −0.7±0.1
16 McIntosh et al.
Fig. 9.— Stellar mass–size relations for 728 early-type galaxies with 0.2 < z ≤ 1.0 split into eight redshift slices as in Figure 6. In eachpanel we plot the physical size r50 (z-band corrected to r-band) against the COMBO-17 SED-based stellar mass. The error bars shown atthe bottom right of each panel give the 35% r50 and the factor of two (0.3 dex) random M⋆ uncertainties. Using our mock M⋆, r50 catalog(see right panel of Figure 7), we show the M⋆ − r50 relation ridgeline for z ∼ 0 early types (n ≥ 2.5) from Shen et al. (2003) in each redshiftslice for comparison (diagonal line). Following the format of Figure 6, we delineate the three fixed-size bins (i, iii, iii) with vertical lines,and we depict the low-mass cutoff (horizontal lines) corresponding to the limit for reliable COMBO-17 redshifts (Rap = 24 mag). Thus,the open-ended rectangles outline the non-zero completeness regions of M⋆, r50, z-space. The physical size corresponding to the PSF radius(0.′′05) at each redshift is shown by the vertical dashed line.
Evolution of Early-type Red Galaxies with GEMS 17
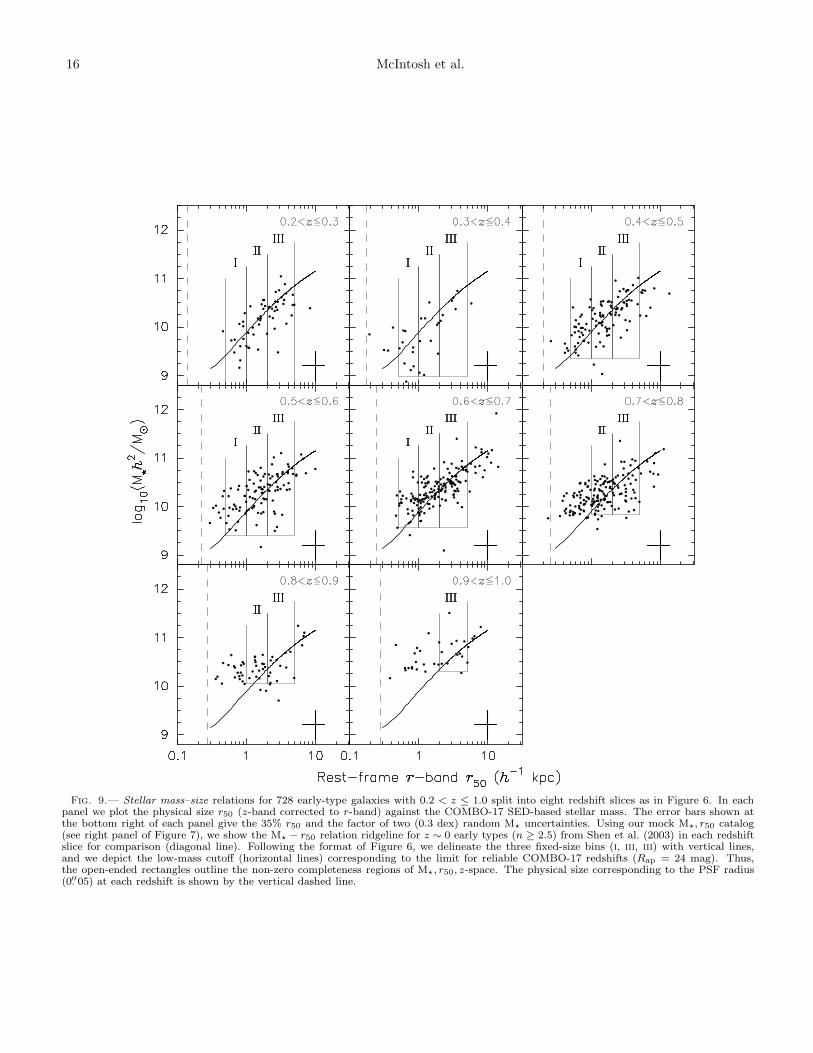
Fig. 10.— Stellar mass evolution of early-type galaxies with fixed physical sizes over last half of cosmic history. In each panel we plotthe stellar mass difference ∆ log10 M′
⋆ = log10 M′⋆,z − 〈log10 M′
⋆,0〉 (where M′⋆ = (M⋆h2/M⊙)) against redshift for all galaxies divided into
three size bins shown. ∆ log10 M′⋆ represents a measure of the stellar mass evolution from the z ∼ 0 Shen et al. (2003) M⋆ − r50 relation (see
text for details). As with our luminosity evolution analysis (see Figure 8), we perform a linear regression for the stellar mass evolution, bothconstrained (red bands) and not constrained (light grey bands) to intercept the origin (z = 0,∆ log10 M′
⋆ = 0). For these fits we use onlythose galaxies (solid circles) within the following redshifts: z ≤ 0.7 (i); z ≤ 0.9 (ii); and z ≤ 1.0 (iii). Furthermore, the set of red and greybands represent the 68-percentile distribution of best-fit lines to 200 bootstrap resamplings of the data. We tabulate the fit results in Tables1 and 2. The dashed horizontal line represents no stellar mass evolution. The error bars at lower left of each panel represent the 0.3 dexrandom uncertainties in our M⋆ estimates.
for large galaxies (2 < r50 ≤ 5h−1 kpc).Past work has been limited mostly to cluster environ-
ments (Barrientos et al. 1996; Pahre et al. 1996; Schadeet al. 1997; Barger et al. 1998; Ziegler et al. 1999), wherethe increased densities provided reasonable sample sizes(N < 200) within the small imaging field of WFPC2.These studies all found an increase in luminosity withlook-back time (at a given size) of about 1 magnitude inrest-frame B-band per unit redshift. Allowing for the Bversus V -band differences and comparing the evolution atcomparable sizes (∼ 3h−1 kpc), we find in comparison noevidence for environmental differences in evolution.
Schade et al. (1999) and Trujillo & Aguerri (2004) haveselected small early-type galaxy samples (N < 50) withWFPC2 observations that are sampled from “field” en-vironments at z < 1 in a way that should be statisti-cally representative of the cosmic average, and found sim-ilar luminosity evolution for galaxies of a fixed size in thefield as compared to clusters. For example, Trujillo &Aguerri found that small early-type galaxies in the HDFswere 1.35± 0.1 mag brighter in rest-frame V -band at z ∼0.7 when compared to the present-day relation from Shenet al. (2003).
Taking into account the changes in stellar M/L that areimplied by the color evolution of early-type galaxies inthe last 8 Gyr, we find that the largely passive luminos-ity evolution of the LV − r50 relation implies little or noevolution of the M⋆ − r50 relation since z ∼ 1. Figure 10shows that the average stellar mass in early-type galaxiesof a given size has remained fairly constant over the in-terval 0 < z < 1. Concentrating on the constrained fits(see also Table 1), we place an upper limit on the changein the M⋆ − r50 relation of 0.25 dex, in the sense thatgalaxies may have been slightly more massive at a givensize at z ∼ 1 than they are at the present. Our findingsagree with those of Trujillo et al. (2004b), who found verylittle stellar mass evolution since z ∼ 2.5 using a sample
of 168 galaxies of all morphological types from the HDF-South. In addition, we find that early-type galaxies of agiven fixed size had similar stellar masses at z ∼ 1 as theydo today. This is qualitatively consistent with studies ofthe Kormendy relation (e.g., Barger et al. 1998), absorp-tion lines (e.g., Ziegler & Bender 1997; Kelson et al. 2001),color–magnitude relation (e.g., Kodama et al. 1999; Bellet al. 2004b; Holden et al. 2004), and FP (e.g., Kelsonet al. 2000; van Dokkum et al. 2001; Treu et al. 2002;van de Ven et al. 2003; Gebhardt et al. 2003; van der Welet al. 2004), who all found changes in M/L consistent withpassive evolution of the stellar populations in early-typegalaxies since z ∼ 1.
The unconstrained fits to the data in Figure 10 may in-dicate marginally-significant evolution. In all cases, theobserved trends within the redshift ranges probed by thedata are 0.5 dex or less, in the sense that distant early-type galaxies may be denser than their low-redshift coun-terparts. This trend appears strongest for the 0.5 < r50 ≤1.0h−1 kpc sample, where we find stronger evolution of theLV − r50 relation (Figure 8, left panel). At this stage, it isdifficult to reliably assess the significance of this possibleevolution owing to systematic uncertainties of the stellarM/L ratios (which are ∼ 0.3 dex). In this context, it isinteresting to note first results of a systematic study of the0.7 < z < 1.1 early-type galaxy FP by van der Wel et al.(2004); they found that dynamically-derived M/L ratiosof six intermediate redshift early-type galaxies showed aslightly stronger color–M/L correlation than expected ina single burst model. The most straightforward interpre-tation of this would be an increasing importance of burstsof star formation in low mass (therefore small) early-typegalaxies; aging bursts bias color-based M/L estimates highby up to 0.3 dex (Bell & de Jong 2001). Thus, the appar-ently strong evolution of the M⋆ − r50 relation for small(low mass) galaxies could be enhanced artificially by theeffect of bursts of star formation, whose frequency is nat-
18 McIntosh et al.
urally expected to be higher at earlier times.
4.2. Understanding the Evolution of Early-Type GalaxyScaling Relations
Taken by themselves, the observed evolution of the LV −r50 and M⋆ − r50 scaling relations is insufficient to con-strain the characteristic evolutionary fates of individualearly-type galaxies. For example, one can imagine mor-phological transformations and changes in star formationhistory caused by galaxy mergers, disk re-growth, and fad-ing of previously star-forming disks that will cause galaxiesto drift in and out of the early-type and/or red-sequencegalaxy populations (e.g., Baugh et al. 1996; Steinmetz &Navarro 2002). Thus, evolution of the scaling relation ofthe populations should be interpreted in terms of the evo-lution of the early-type galaxy populations, rather thanin terms of the evolution of the individual galaxies them-selves.
Observationally, the results of this paper are consistentwith passive evolution of the early-type galaxy populationas predicted by the monolithic collapse scenario (Eggenet al. 1962; Larson 1974). This model describes the for-mation of present-day spherical systems through the col-lapse of a massive gas cloud followed by a brief burst of SFearly in the history of the universe (zform > 2). For thismodel any changes in the observed properties of early-typegalaxies over time are due to simple passive fading of thecoeval stellar populations.
Yet, a large number of works (Chen et al. 2003; Bellet al. 2004b; Drory et al. 2004; Conselice et al. 2004; Crosset al. 2004) have found that the total stellar mass densityin early-type galaxies, defined either by color or morphol-ogy, has built up by roughly a factor of two in the last 8Gyr since z ∼ 1. Regardless of the mechanisms drivingthis evolution (e.g., mergers, disk fading, etc), the lack ofdrastic evolution in the M⋆ − r50 relation indicates thatearly-type galaxies to first order either move along theM⋆−r50 relation as they evolve, or they appear on it whenthey join the sample of early-type red sequence galaxies.The lack of strong evolution in the M⋆ − r50 relation sincez ∼ 1 is an important constraint that early-type galaxyformation theories will have to satisfy.
It is interesting to note that both disk fading and galaxymergers may naturally satisfy the observational constraints.It is possible that some disk-dominated galaxies with rea-sonably massive bulges cease to form stars at intermediateredshift (owing perhaps to gas consumption or removal ofits gas supply). As the massive stars in the disk die, thedisk fades very quickly, increasing greatly the prominenceof the bulge. Under the assumption that the disk stel-lar mass–size correlation does not evolve with redshift (asjustified by Trujillo et al. 2004b, Barden et al., in prepa-ration), and noting that the local disk and bulge stellarmass–size correlations are within 0.2 dex of each other overa wide stellar mass range (see Fig. 11 of Shen et al. 2003), itis quite possible that disk fading would produce early-typegalaxies that adhere closely to the redshift-independentM⋆ − r50 relation.
Another possible formation mode for early-type galax-ies is through major galaxy mergers (e.g., Naab & Burkert2003; Khochfar & Burkert 2003), where the remnant hassuffered violent relaxation and is spheroidal and pressure-
supported (Toomre & Toomre 1972; Barnes 1992). De-tailed studies of close pairs have shown that an impor-tant fraction of ∼ L∗ galaxies may merge between z ∼ 1and the present day (Carlberg et al. 1994; Le Fevre et al.2000; Patton et al. 2002; Conselice et al. 2003), makingthis a potentially important formation mode for early-typegalaxies. Yet, it is unclear whether a merger between twogas-rich galaxies will lead to a remnant that will satisfyour observed lack of significant evolution in the M⋆ − r50
correlation (see e.g., Barnes 2002, for a systematic studyof gas-rich galaxy mergers; unfortunately the relationshipbetween progenitor and remnant size was not explored inthis work).
Mergers between gas-poor progenitors are easier to model,and numerous studies have found that merging early-typegalaxies will produce remnants that adhere reasonably wellto the FP, but slowly drift away from the M⋆−r50 relationof the progenitor population (Navarro 1990; Dantas et al.2003; Nipoti et al. 2003; Gonzalez-Garcıa & van Albada2003; Shen et al. 2003). Dantas et al. (2003), Nipoti et al.(2003) and Navarro (1990) showed that log10(rremnant/roriginal) ∼1.2 log10(Mremnant/Moriginal); that is, one dissipationless1:1 merger will lead to a size increase of ∼ 0.35 dex. Fora factor of two increase in stellar mass, the M⋆ − r50 re-lation (e.g., Equation 6) shows a ∼ 0.15 dex increase insize. Thus, galaxies undergoing dissipationless mergingwill gradually move towards radii that are larger thangalaxies not undergoing merging. As outlined earlier, dis-sipationless merging is expected to be a much more impor-tant process for high-mass galaxies (Khochfar & Burkert2003). Therefore, we can focus on the evolution of theM⋆ − r50 relation for galaxies with 2 < r50 ≤ 5h−1 kpc— here the observations place an upper limit of 0.25 dexon the evolution of the M⋆ − r50 relation zero point sincez ∼ 1, and show a scatter of ∼ 0.5 dex. Therefore, com-bining the model predictions (that one major merger willmove a remnant 0.2 dex from the M⋆ − r50 relation de-fined by the progenitor population) and the observationalupper limits on M⋆−r50 relation evolution and scatter, weconclude that the most massive galaxies have suffered atmost one major dissipationless merger since z ∼ 1 on aver-age (from the zero point evolution), and that only a smallfraction of massive early-type galaxies could have sufferedseveral major dissipationless mergers (from the scatter).
4.3. Strength of Luminosity Evolution Dependence onGalaxy Size
It is worth discussing briefly the size dependence in theevolution of the LV − r50 relation apparent in Figure 8.Focusing on the largest galaxies with 2 < r50 ≤ 5 h−1 kpc,we find that the intercept of the LV − r50 relation is ∼0.8mag brighter at z ∼ 1, compared to the present day.In contrast, smaller galaxies evolve more rapidly towardsthe present; extrapolated to z ∼ 1, we find 1.5–2 mag ofevolution in the LV − r50 relation.
This difference in evolution is statistically significant,thus leaving two possible classes of interpretation: (i) smallergalaxies have significantly younger luminosity-weighted stel-lar ages, leading to significantly more rapid luminosityevolution; and (ii) there is scale-dependence in the evolu-tion of the M⋆ − r50 relation related to different formationroutes for low- and high-mass early-type galaxies. At some
Evolution of Early-type Red Galaxies with GEMS 19
level, both effects should contribute; we will conclude herethat we cannot at this stage differentiate between thesetwo possibilities.
The interpretation that smaller galaxies have youngerstars compared to the larger systems, is consistent with re-cent deep determinations of galaxy cluster CMRs at 0.8 .z . 1 (Kodama et al. 2004; de Lucia & et al. 2004),where the faint end of the red sequence is systematicallysuppressed compared to the local universe8. This is alsoconsistent with analyses of the stellar populations anddynamically-derived M/L ratios of morphologically-selectedearly-type galaxies in the local universe (Kuntschner 2000;Trager et al. 2000; Thomas et al. 2003), and at z ∼ 1(van der Wel et al. 2004), where low-mass early-type galax-ies have younger stellar populations than high-mass earlytypes. In this interpretation, one expects that the bulk ofthe slope evolution in the LV −r50 relation is driven by therapid evolution in M⋆/L of low-mass galaxies, comparedto their older high-mass counterparts9.
There is also evidence from studies of local early-typegalaxies that low-mass early-types have different proper-ties than high-mass early-type galaxies (Kormendy & Ben-der 1996; Gebhardt et al. 1996; Faber et al. 1997; Ravin-dranath et al. 2001). Stereotypical high-mass early-typegalaxies have boxy isophotes, steep outer light profiles,constant surface brightness (or “cuspy”) cores, and aresupported primarily by random motions of stars in a tri-axial potential. In contrast, lower-mass early-type galaxiestend towards diskier isophotes, steep power-law light pro-files without a resolved core, and derive partial supportfrom organized rotation. These differences in propertiesare naturally interpreted in terms of different formationmechanisms, where higher-mass early-type galaxies sufferfrom late dissipationless major mergers and lower-massearly-type galaxies result from lower mass-ratio interac-tions and/or mergers of galaxies with significant gas con-tents (Naab & Burkert 2003; Khochfar & Burkert 2003).It is also possible that some low-mass early-type galaxiescould form through disk instabilities in small, very highsurface density disks (see e.g., Cole et al. 2000, for oneimplementation of this process). Interpreted in this way,the evolution of the slope of the LV − r50 relation could beattributed primarily to genuine evolution in the M⋆ − r50
relation, and differences in the rate of M⋆/L evolution asa function of stellar mass may play a secondary role.
Viewed in this context, the slight differences in stellarmass evolution (Figure 10) as a function of size suggeststhat it is impossible to rule out scenario (ii) at this stage.Yet, the earlier discussion made it clear that within the un-certainties inherent to the estimation of M⋆/L from opticalSEDs, it is impossible to convincingly argue against or in8 It is worth noting that one may well expect a change in CMR slopewith redshift if low-mass galaxies are on average younger.9 It is interesting to speculate that owing to biased galaxy formation(in the sense that the central parts of high-mass halos collapse athigher redshift than the central parts of lower-mass halos), one mayexpect a mild dependence of age on mass, under the assumption thatone can suppress late cooling in early-type galaxy halos. One mayexpect to see an age difference between cluster and field early-typesin this interpretation; the observational evidence in this regard iscontroversial, and the most fair statement that can be made is thatif there is an age difference as a function of environment, then thisdependence is rather weak (e.g., Bernardi et al. 1998; Hogg et al.2003).
favor of changes in the M⋆ − r50 relation. Therefore, weconclude that disentangling the relative importance of theabove two mechanisms in driving the redshift-dependentslope of the LV − r50 relation is impossible at this time.Future works, utilizing larger samples with spectroscopicredshifts and velocity dispersions, will clarify this issueconsiderably.
5. conclusions
In order to place constraints on the processes drivingearly-type galaxy evolution at z ≤ 1, we have analyzedthe evolution of the luminosity–size and stellar mass–sizerelations using a sample of 728 early-type galaxies with0.2 < z ≤ 1.0 from the GEMS survey in the extendedCDFS. The sample was selected to have concentrated lightprofiles with Sersic n ≥ 2.5 and rest-frame optical colorswithin 0.25 mag of the red-sequence ridge at its epoch. Ata given half-light radius r50, early-type galaxies were moreluminous in the past. Selection effects were carefully ac-counted for throughout using detailed completeness mapsderived for the parent COMBO-17 photometric redshiftcatalog. We find that the LV − r50 relation has evolvedin a manner that is consistent with the passive aging ofancient stellar populations. In addition, we find evidencefor an evolving tilt of the LV − r50 relation, in the sensethat smaller galaxies fade more rapidly towards the presentday than larger galaxies. Using stellar mass-to-light ratiosderived from the COMBO-17 SEDs, we rule out any sub-stantive evolution in the M⋆ − r50 relation, also consistentwith the simple passive evolution scenario.
Clearly, these results would be consistent with passiveevolution of the early-type galaxy population (i.e., passiveaging of existing stars, no merging), where a younger agefor smaller galaxies is indicated by the tilting LV − r50 re-lation. Yet, this interpretation is too simplistic; a numberof surveys have demonstrated that the total stellar massin the early-type galaxy population (as defined here) hasincreased by roughly a factor of two since z ∼ 1. Bearingin mind this evolution, our results imply that newly-addedearly-type galaxies follow LV − r50 and M⋆ − r50 relationssimilar to the more established early types. A disk-fadingorigin for the newly-added early-type galaxies appears tobe consistent with the data. Through comparison withmodels, the role of dissipationless merging is limited to< 1 major merger on average since z = 1 for the most mas-sive galaxies. The predicted evolution for gas-rich mergersis not yet robustly predicted, so it is impossible to com-ment on this possible formation route. In this context,the evolving tilt of the LV − r50 correlation could reflecta different origin of low-mass early-type galaxies and/oryounger stellar populations; the present data is insufficientto discriminate between these possibilities.
We are extremely grateful to Shiyin Shen for provid-ing r-band log-normal size distributions as a function ofstellar mass, and for helpful discussions regarding his all-important local scaling relations from SDSS. Support forthe GEMS project was provided by NASA through grantnumber GO-9500 from the Space Telescope Science Insti-tute, which is operated by the Association of Universitiesfor Research in Astronomy, Inc. for NASA, under contractNAS5-26555. DHM and SJ acknowledge support from the
20 McIntosh et al.
National Aeronautics and Space Administration (NASA)under LTSA Grant NAG5-13102 (DHM) and NAG5-13063(SJ) issued through the Office of Space Science. EFBand SFS acknowledge financial support provided throughthe European Community’s Human Potential Program un-der contract HPRN-CT-2002-00316, SISCO (EFB) andHPRN-CT-2002-00305, Euro3D RTN (SFS). CW is sup-ported by a PPARC Advanced Fellowship. CH acknowl-edges support from GIF. Thanks for useful discussions -Rose Finn, Kelly Holley-Bockelmann, Neal Katz, DusanKeres, Ari Maller, Houjon Mo, Ignacio Trujillo.
APPENDIX
Sersic fits
For our primary analysis we use gim2d (Galaxy IMage2D, Simard et al. 1999, 2002) to fit a single Sersic modelto the two-dimensional radial light profile of each galaxyfrom the F850LP imaging. The gim2d software takes intoaccount the point-spread function (PSF) by convolving itwith the best-fit model profile during fitting, and gim2duses the SExtractor-produced segmentation mask to de-blend galaxies from nearby companions. The profile fitsprovide information that allow us to select morphologicallyearly-type galaxies from the red sequence (as described in§2.3.2). In addition, effective size (i.e. half-light radii r50;see §2.4) measurements and other structural parametersare provided by the Sersic fitting.
Galaxy profile fitting requires a well-defined model ofthe PSF and precise knowledge of the background skylevel. We use a universal, high S/N PSF derived from548 bright but unsaturated stars from the Mark I suite ofGEMS ACS frames in the F850LP passband (for a firstimpression see Jahnke et al. 2004, plus Jahnke et al., inpreparation). Through detailed testing we find that thisPSF provides sufficient accuracy for the galaxy fitting (seeH05). Moreover, with our simulations we explore three dif-ferent methods for determining sky values: (1) using theSExtractor sky value “local” to each galaxy; (2) adoptinga fixed constant value per individual ACS frame given bythe SExtractor “global” estimate; and (3) letting gim2dcalculate the mean sky. We find that the Sersic fittingresults are most robust when using the first method, bear-ing in mind that other local sky estimates may performequally well or better.
The Sersic model is represented by seven free parame-ters: total intensity, semi-major axis scale length, elliptic-ity e, position angle, index n, and model x, y centering.For each galaxy fit, gim2d automatically determines theinitial values and limits for the parameter space to be ex-plored by using the segmentation mask, which is affectedby the choice of detection configuration (see § 2.1). Withour simulations we find that this method provides reliablefits for galaxies with surface brightnesses of µ50 < 24 magasec−2. As can be seen in Figure 5, all red-sequence galax-ies are brighter than this limit.
We check the fits using a variety of tests. First, we checkthe recovered ellipticity of each fit and find no trends withredshift or total m850 magnitude. Likewise, the Sersic ndistributions show no trends with z or m850 for galax-ies with n ≥ 2.5. As expected, we see a slight trendsuch that highly inclined sources have low n values (i.e.disk-dominated), and large n values are more often less
inclined. Lastly, we compare the gim2d total m850 mag-nitudes with the model-independent determinations fromSExtractor (mag best). We find a median offset of 0.29mag (independent of brightness) with a dispersion of 0.18mag, in the sense that gim2d recovers total galaxy fluxes(by integrating the model profile to infinity) that are sys-tematically brighter than the SExtractor measurements.These tests show that our fits, and the parameters thatwe derive from the fits, are well-defined.
For each galaxy, gim2d finds the best-fit (in a χ2ν sense)
Sersic model, produces model and residual images, andconverts each galaxy image into a set of structural param-eters including their internal measurement uncertainties.In Figures 1 – 3 we show GEMS F850LP-band galaxy andresidual postage stamp images for representative early-type examples selected randomly from the three fixed-sizebins out to z ∼ 1. We note that the majority of galax-ies have E/S0 visual morphologies, and that an inspectionof the fit residuals shows that the the fitting does a fairjob recovering the flux and overall profile shape. The fit-ting results presented here (r50 sizes and Sersic indices)will be published in their entirety by Haußler et al. (inpreparation).
REFERENCES
Baldry, I. K., Glazebrook, K., Brinkmann, J., Ivezic, Z., Lupton,R. H., Nichol, R. C., & Szalay, A. S. 2004, ApJ, 600, 681
Barger, A. J., Aragon-Salamanca, A., Smail, I., Ellis, R. S., Couch,W. J., Dressler, A., Oemler, A., Poggianti, B. M., & Sharples,R. M. 1998, ApJ, 501, 522
Barnes, J. E. 1992, ApJ, 393, 484—. 2002, MNRAS, 333, 481Barrientos, L. F., Schade, D., & Lopez-Cruz, O. 1996, ApJ, 460,
L89+Baugh, C. M., Cole, S., & Frenk, C. S. 1996, MNRAS, 283, 1361Bell, E. F., & de Jong, R. S. 2001, ApJ, 550, 212Bell, E. F., McIntosh, D. H., Barden, M., Wolf, C., Caldwell,
J. A. R., Rix, H.-W., Beckwith, S. V. W., Borch, A., Haussler,B., Jahnke, K., Jogee, S., Meisenheimer, K., Peng, C., Sanchez,S. F., Somerville, R. S., & Wisotzki, L. 2004a, ApJ, 600, L11
Bell, E. F., McIntosh, D. H., Katz, N., & Weinberg, M. D. 2003,ApJS, 149, 289
Bell, E. F., Wolf, C., Meisenheimer, K., Rix, H.-W., Borch, A., Dye,S., Kleinheinrich, M., Wisotzki, L., & McIntosh, D. H. 2004b, ApJ,608, 752
Bernardi, M., Renzini, A., da Costa, L. N., Wegner, G., Alonso,M. V., Pellegrini, P. S., Rite, C., & Willmer, C. N. A. 1998, ApJ,508, L143
Bernardi, M., Sheth, R. K., Annis, J., Burles, S., Finkbeiner, D. P.,Lupton, R. H., Schlegel, D. J., SubbaRao, M., Bahcall, N. A.,Blakeslee, J. P., Brinkmann, J., Castander, F. J., Connolly, A. J.,Csabai, I., Doi, M., Fukugita, M., Frieman, J., Heckman, T.,Hennessy, G. S., Ivezic, Z., Knapp, G. R., Lamb, D. Q., McKay, T.,Munn, J. A., Nichol, R., Okamura, S., Schneider, D. P., Thakar,A. R., & York, D. G. 2003, AJ, 125, 1882
Bertin, E., & Arnouts, S. 1996, A&AS, 117, 393Blanton, M. R., Brinkmann, J., Csabai, I., Doi, M., Eisenstein, D.,
Fukugita, M., Gunn, J. E., Hogg, D. W., & Schlegel, D. J. 2003a,AJ, 125, 2348
Blanton, M. R., Hogg, D. W., Bahcall, N. A., Baldry, I. K.,Brinkmann, J., Csabai, I., Eisenstein, D., Fukugita, M., Gunn,J. E., Ivezic, Z., Lamb, D. Q., Lupton, R. H., Loveday, J., Munn,J. A., Nichol, R. C., Okamura, S., Schlegel, D. J., Shimasaku, K.,Strauss, M. A., Vogeley, M. S., & Weinberg, D. H. 2003b, ApJ,594, 186
Bouwens, R. J., Illingworth, G. D., Thompson, R. I., Blakeslee, J. P.,Dickinson, M. E., Broadhurst, T. J., Eisenstein, D. J., Fan, X.,Franx, M., Meurer, G., & van Dokkum, P. 2004, ApJ, 606, L25
Bower, R. G., Kodama, T., & Terlevich, A. 1998, MNRAS, 299, 1193Butcher, H., & Oemler, A. 1984, ApJ, 285, 426Carlberg, R. G., Pritchet, C. J., & Infante, L. 1994, ApJ, 435, 540
Evolution of Early-type Red Galaxies with GEMS 21
Chen, H., Marzke, R. O., McCarthy, P. J., Martini, P., Carlberg,R. G., Persson, S. E., Bunker, A., Bridge, C. R., & Abraham,R. G. 2003, ApJ, 586, 745
Cole, S., Lacey, C. G., Baugh, C. M., & Frenk, C. S. 2000, MNRAS,319, 168
Conselice, C. J., Bershady, M. A., Dickinson, M., & Papovich, C.2003, AJ, 126, 1183
Conselice, C. J., Blackburne, J. A., & Papovich, C. 2004, (astro-ph/0405001)
Cross, N. J. G., Bouwens, R. J., Benıtez, N., Blakeslee, J. P.,Menanteau, F., Ford, H. C., Goto, T., Holden, B., Martel, A. R.,Zirm, A., Overzier, R., & et al. 2004, AJ, 128, 1990
Dantas, C. C., Capelato, H. V., Ribeiro, A. L. B., & de Carvalho,R. R. 2003, MNRAS, 340, 398
de Jong, R. S. 1996, A&AS, 118, 557de Lucia, G., & et al. 2004, (astro-ph/0406454)de Vaucouleurs, G. 1948, Annales d’Astrophysique, 11, 247Drory, N., Bender, R., Feulner, G., Hopp, U., Maraston, C., Snigula,
J., & Hill, G. J. 2004, ApJ, 608, 742Eggen, O. J., Lynden-Bell, D., & Sandage, A. R. 1962, ApJ, 136,
748Evstigneeva, E. A., de Carvalho, R. R., Ribeiro, A. L., & Capelato,
H. V. 2004, MNRAS, 349, 1052Faber, S. M., Tremaine, S., Ajhar, E. A., Byun, Y., Dressler, A.,
Gebhardt, K., Grillmair, C., Kormendy, J., Lauer, T. R., &Richstone, D. 1997, AJ, 114, 1771
Fioc, M., & Rocca-Volmerange, B. 1997, A&A, 326, 950Fontana, A., Pozzetti, L., Donnarumma, I., Renzini, A., Cimatti, A.,
Zamorani, G., Menci, N., Daddi, E., Giallongo, E., Mignoli, M.,Perna, C., Salimbeni, S., Saracco, P., Broadhurst, T., Cristiani,S., D’Odorico, S., & Gilmozzi, R. 2004, A&A, 424, 23
Franx, M., Illingworth, G., & Heckman, T. 1989, AJ, 98, 538Fukugita, M., Shimasaku, K., & Ichikawa, T. 1995, PASP, 107, 945Gebhardt, K., Faber, S. M., Koo, D. C., Im, M., Simard, L.,
Illingworth, G. D., Phillips, A. C., Sarajedini, V. L., Vogt, N. P.,Weiner, B., & Willmer, C. N. A. 2003, ApJ, 597, 239
Gebhardt, K., Richstone, D., Ajhar, E. A., Lauer, T. R., Byun,Y., Kormendy, J., Dressler, A., Faber, S. M., Grillmair, C., &Tremaine, S. 1996, AJ, 112, 105
Giavalisco, M., Ferguson, H. C., Koekemoer, A. M., Dickinson, M.,Alexander, D. M., Bauer, F. E., Bergeron, J., Biagetti, C., Brandt,W. N., Casertano, S., & Cesarsky, C. 2004, ApJ, 600, L93
Gonzalez-Garcıa, A. C., & van Albada, T. S. 2003, MNRAS, 342,L36
Hogg, D. W., Blanton, M., Strateva, I., Bahcall, N. A., Brinkmann,J., Csabai, I., Doi, M., Fukugita, M., Hennessy, G., Ivezic, Z.,Knapp, G. R., Lamb, D. Q., Lupton, R., Munn, J. A., Nichol, R.,Schlegel, D. J., Schneider, D. P., & York, D. G. 2002, AJ, 124, 646
Hogg, D. W., Blanton, M. R., Brinchmann, J., Eisenstein, D. J.,Schlegel, D. J., Gunn, J. E., McKay, T. A., Rix, H.-W., Bahcall,N. A., Brinkmann, J., & Meiksin, A. 2004, ApJ, 601, L29
Hogg, D. W., Blanton, M. R., Eisenstein, D. J., Gunn, J. E.,Schlegel, D. J., Zehavi, I., Bahcall, N. A., Brinkmann, J., Csabai,I., Schneider, D. P., Weinberg, D. H., & York, D. G. 2003, ApJ,585, L5
Holden, B. P., Stanford, S. A., Eisenhardt, P., & Dickinson, M. 2004,AJ, 127, 2484
Hubble, E. P. 1926, ApJ, 64, 321Jahnke, K., Sanchez, S. F., Wisotzki, L., Barden, M., Beckwith,
S. V. W., Bell, E. F., Borch, A., Caldwell, J. A. R., Haussler, B.,Heymans, C., Jogee, S., McIntosh, D. H., Meisenheimer, K., Peng,C. Y., Rix, H.-W., Somerville, R. S., & Wolf, C. 2004, ApJ, 614,568
Kauffmann, G., Heckman, T. M., White, S. D. M., Charlot, S.,Tremonti, C., Brinchmann, J., Bruzual, G., Peng, E. W., Seibert,M., Bernardi, M., Blanton, M., Brinkmann, J., Castander, F.,Csabai, I., Fukugita, M., Ivezic, Z., Munn, J. A., Nichol, R. C.,Padmanabhan, N., Thakar, A. R., Weinberg, D. H., & York, D.2003, MNRAS, 341, 33
Kelson, D. D., Illingworth, G. D., Franx, M., & van Dokkum, P. G.2001, ApJ, 552, L17
Kelson, D. D., Illingworth, G. D., van Dokkum, P. G., & Franx, M.2000, ApJ, 531, 184
Khochfar, S., & Burkert, A. 2003, ApJ, 597, L117Kodama, T., Bower, R. G., & Bell, E. F. 1999, MNRAS, 306, 561Kodama, T., Yamada, T., Akiyama, M., Aoki, K., Doi, M.,
Furusawa, H., Fuse, T., Imanishi, M., Ishida, C., Iye, M.,Kajisawa, M., Karoji, H., Kobayashi, N., Komiyama, Y., Kosugi,G., Maeda, Y., Miyazaki, S., Mizumoto, Y., Morokuma, T.,Nakata, F., Noumaru, J., Ogasawara, R., Ouchi, M., Sasaki, T.,Sekiguchi, K., Shimasaku, K., Simpson, C., Takata, T., Tanaka,I., Ueda, Y., Yasuda, N., & Yoshida, M. 2004, MNRAS, 350, 1005
Kormendy, J., & Bender, R. 1996, ApJ, 464, L119+Kroupa, P. 2001, MNRAS, 322, 231Kroupa, P., Tout, C. A., & Gilmore, G. 1993, MNRAS, 262, 545Kuntschner, H. 2000, MNRAS, 315, 184
Larson, R. B. 1974, MNRAS, 166, 585Le Fevre, O., Abraham, R., Lilly, S. J., Ellis, R. S., Brinchmann,
J., Schade, D., Tresse, L., Colless, M., Crampton, D., Glazebrook,K., Hammer, F., & Broadhurst, T. 2000, MNRAS, 311, 565
MacArthur, L. A., Courteau, S., & Holtzman, J. A. 2003, ApJ, 582,689
McCarthy, P. J., Le Borgne, D., Crampton, D., Chen, H., Abraham,R. G., Glazebrook, K., Savaglio, S., Carlberg, R. G., Marzke,R. O., Roth, K., Jørgensen, I., Hook, I., Murowinski, R., & Juneau,S. 2004, ApJ, 614, L9
Menanteau, F., Jimenez, R., & Matteucci, F. 2001, ApJ, 562, L23Naab, T., & Burkert, A. 2003, ApJ, 597, 893Navarro, J. F. 1990, MNRAS, 242, 311Nipoti, C., Londrillo, P., & Ciotti, L. 2003, MNRAS, 342, 501Pahre, M. A., Djorgovski, S. G., & de Carvalho, R. R. 1996, ApJ,
456, L79+Patton, D. R., Pritchet, C. J., Carlberg, R. G., Marzke, R. O., Yee,
H. K. C., Hall, P. B., Lin, H., Morris, S. L., Sawicki, M., Shepherd,C. W., & Wirth, G. D. 2002, ApJ, 565, 208
Peletier, R. F., Davies, R. L., Illingworth, G. D., Davis, L. E., &Cawson, M. 1990, AJ, 100, 1091
Ravindranath, S., Ho, L. C., Peng, C. Y., Filippenko, A. V., &Sargent, W. L. W. 2001, AJ, 122, 653
Rix, H.-W., Barden, M., Beckwith, S. V. W., Bell, E. F., Borch, A.,Caldwell, J. A. R., Haussler, B., Jahnke, K., Jogee, S., McIntosh,D. H., Meisenheimer, K., Peng, C. Y., Sanchez, S. F., Somerville,R. S., Wisotzki, L., & Wolf, C. 2004, ApJS, 152, 163
Rusin, D., Kochanek, C. S., Falco, E. E., Keeton, C. R., McLeod,B. A., Impey, C. D., Lehar, J., Munoz, J. A., Peng, C. Y., & Rix,H.-W. 2003, ApJ, 587, 143
Salpeter, E. E. 1955, ApJ, 121, 161Schade, D., Barrientos, L. F., & Lopez-Cruz, O. 1997, ApJ, 477,
L17+Schade, D., Lilly, S. J., Crampton, D., Ellis, R. S., Le Fevre,
O., Hammer, F., Brinchmann, J., Abraham, R., Colless, M.,Glazebrook, K., Tresse, L., & Broadhurst, T. 1999, ApJ, 525, 31
Sersic, J. L. 1968, Atlas de galaxias australes (Cordoba, Argentina:Observatorio Astronomico, 1968)
Shen, S., Mo, H. J., White, S. D. M., Blanton, M. R., Kauffmann,G., Voges, W., Brinkmann, J., & Csabai, I. 2003, MNRAS, 343,978
Simard, L., Koo, D. C., Faber, S. M., Sarajedini, V. L., Vogt, N. P.,Phillips, A. C., Gebhardt, K., Illingworth, G. D., & Wu, K. L.1999, ApJ, 519, 563
Simard, L., Willmer, C. N. A., Vogt, N. P., Sarajedini, V. L., Phillips,A. C., Weiner, B. J., Koo, D. C., Im, M., Illingworth, G. D., &Faber, S. M. 2002, ApJS, 142, 1
Spergel, D. N., Verde, L., Peiris, H. V., Komatsu, E., Nolta, M. R.,Bennett, C. L., Halpern, M., Hinshaw, G., Jarosik, N., Kogut, A.,Limon, M., Meyer, S. S., Page, L., Tucker, G. S., Weiland, J. L.,Wollack, E., & Wright, E. L. 2003, ApJS, 148, 175
Steinmetz, M., & Navarro, J. F. 2002, New Astronomy, 7, 155Stoughton, C., Lupton, R. H., Bernardi, M., Blanton, M. R., Burles,
S., Castander, F. J., Connolly, A. J., Eisenstein, D. J., Frieman,J. A., & Hennessy, G. S. 2002, AJ, 123, 485
Strateva, I., Ivezic, Z., Knapp, G. R., Narayanan, V. K., Strauss,M. A., Gunn, J. E., Lupton, R. H., Schlegel, D., Bahcall,N. A., Brinkmann, J., Brunner, R. J., Budavari, T., Csabai, I.,Castander, F. J., Doi, M., Fukugita, M., Gyory, Z., Hamabe, M.,Hennessy, G., Ichikawa, T., Kunszt, P. Z., Lamb, D. Q., McKay,T. A., Okamura, S., Racusin, J., Sekiguchi, M., Schneider, D. P.,Shimasaku, K., & York, D. 2001, AJ, 122, 1861
Thomas, D., Maraston, C., & Bender, R. 2003, MNRAS, 343, 279Toomre, A., & Toomre, J. 1972, ApJ, 178, 623Trager, S. C., Faber, S. M., Worthey, G., & Gonzalez, J. J. 2000,
AJ, 120, 165Tran, K. H., Simard, L., Illingworth, G., & Franx, M. 2003, ApJ,
590, 238Treu, T., Stiavelli, M., Casertano, S., Møller, P., & Bertin, G. 2002,
ApJ, 564, L13Trujillo, I., & Aguerri, A. L. 2004, (astro-ph/0407520)Trujillo, I., Burkert, A., & Bell, E. F. 2004a, ApJ, 600, L39Trujillo, I., Rudnick, G., Rix, H.-W., Labbe, I., Franx, M., Daddi,
E., van Dokkum, P. G., Forster Schreiber, N. M., Kuijken, K.,Moorwood, A., Rottgering, H., van de Wel, A., van der Werf, P.,& van Starkenburg, L. 2004b, ApJ, 604, 521
van de Ven, G., van Dokkum, P. G., & Franx, M. 2003, MNRAS,344, 924
van der Wel, A., Franx, M., van Dokkum, P. G., & Rix, H.-W. 2004,ApJ, 601, L5
van Dokkum, P. G., & Franx, M. 1996, MNRAS, 281, 985van Dokkum, P. G., Franx, M., Kelson, D. D., & Illingworth, G. D.
1998, ApJ, 504, L17+—. 2001, ApJ, 553, L39Weiner, B. J., Phillips, A. C., Faber, S. M., & et al. 2004, (astro-
ph/0411128)
22 McIntosh et al.
White, S. D. M., & Frenk, C. S. 1991, ApJ, 379, 52Wolf, C., Meisenheimer, K., Kleinheinrich, M., Borch, A., Dye, S.,
Gray, M., Wisotzki, L., Bell, E. F., Rix, H.-W., Cimatti, A.,Hasinger, G., & Szokoly, G. 2004, A&A, 421, 913
Wolf, C., Meisenheimer, K., & Roser, H.-J. 2001, A&A, 365, 660Wolf, C., Meisenheimer, K., Rix, H.-W., Borch, A., Dye, S., &
Kleinheinrich, M. 2003, A&A, 401, 73Wuyts, S., van Dokkum, P. G., Kelson, D. D., Franx, M., &
Illingworth, G. D. 2004, ApJ, 605, 677York, D. G., Adelman, J., Anderson, J. E., Anderson, S. F., Annis,
J., Bahcall, N. A., Bakken, J. A., Barkhouser, R., Bastian, S.,Berman, E., & et al. 2000, AJ, 120, 1579
Ziegler, B. L., & Bender, R. 1997, MNRAS, 291, 527Ziegler, B. L., Saglia, R. P., Bender, R., Belloni, P., Greggio, L., &
Seitz, S. 1999, A&A, 346, 13
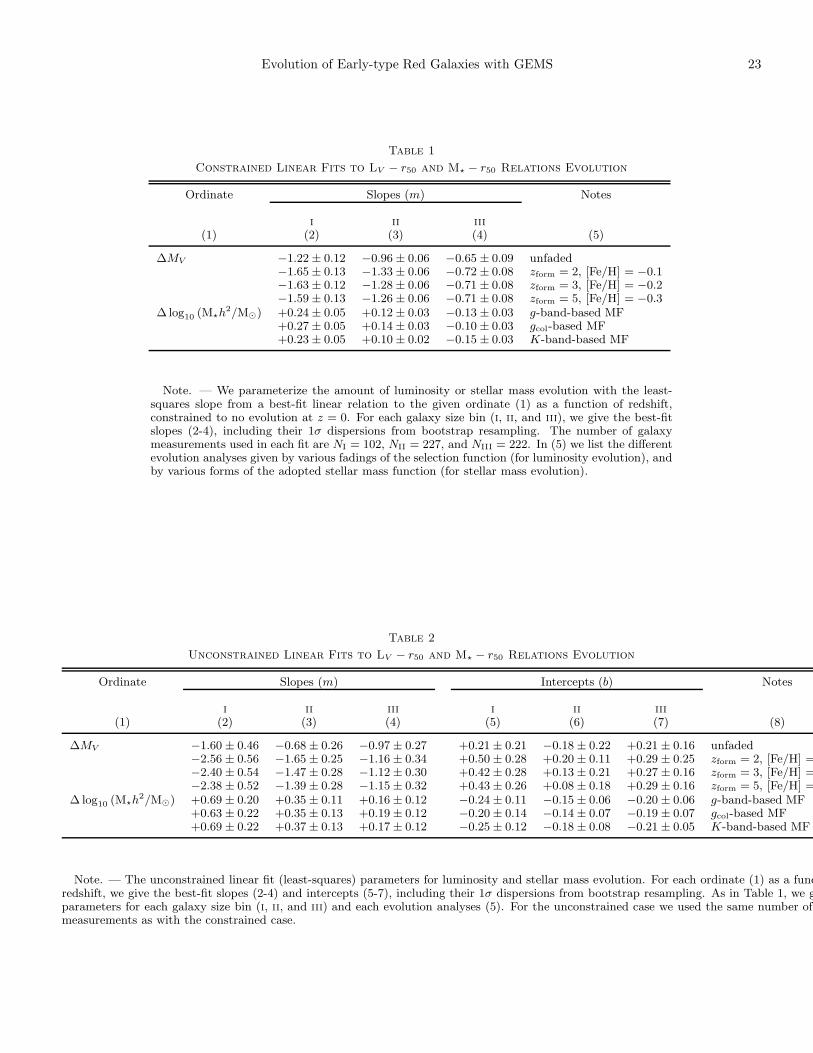
Evolution of Early-type Red Galaxies with GEMS 23
Table 1
Constrained Linear Fits to LV − r50 and M⋆ − r50 Relations Evolution
Ordinate Slopes (m) Notes
i ii iii(1) (2) (3) (4) (5)
∆MV −1.22 ± 0.12 −0.96 ± 0.06 −0.65 ± 0.09 unfaded−1.65 ± 0.13 −1.33 ± 0.06 −0.72 ± 0.08 zform = 2, [Fe/H] = −0.1−1.63 ± 0.12 −1.28 ± 0.06 −0.71 ± 0.08 zform = 3, [Fe/H] = −0.2−1.59 ± 0.13 −1.26 ± 0.06 −0.71 ± 0.08 zform = 5, [Fe/H] = −0.3
∆ log10 (M⋆h2/M⊙) +0.24 ± 0.05 +0.12 ± 0.03 −0.13 ± 0.03 g-band-based MF+0.27 ± 0.05 +0.14 ± 0.03 −0.10 ± 0.03 gcol-based MF+0.23 ± 0.05 +0.10 ± 0.02 −0.15 ± 0.03 K-band-based MF
Note. — We parameterize the amount of luminosity or stellar mass evolution with the least-squares slope from a best-fit linear relation to the given ordinate (1) as a function of redshift,constrained to no evolution at z = 0. For each galaxy size bin (i, ii, and iii), we give the best-fitslopes (2-4), including their 1σ dispersions from bootstrap resampling. The number of galaxymeasurements used in each fit are NI = 102, NII = 227, and NIII = 222. In (5) we list the differentevolution analyses given by various fadings of the selection function (for luminosity evolution), andby various forms of the adopted stellar mass function (for stellar mass evolution).
Table 2
Unconstrained Linear Fits to LV − r50 and M⋆ − r50 Relations Evolution
Ordinate Slopes (m) Intercepts (b) Notes
i ii iii i ii iii(1) (2) (3) (4) (5) (6) (7) (8)
∆MV −1.60 ± 0.46 −0.68 ± 0.26 −0.97 ± 0.27 +0.21 ± 0.21 −0.18 ± 0.22 +0.21 ± 0.16 unfaded−2.56 ± 0.56 −1.65 ± 0.25 −1.16 ± 0.34 +0.50 ± 0.28 +0.20 ± 0.11 +0.29 ± 0.25 zform = 2, [Fe/H] =−2.40 ± 0.54 −1.47 ± 0.28 −1.12 ± 0.30 +0.42 ± 0.28 +0.13 ± 0.21 +0.27 ± 0.16 zform = 3, [Fe/H] =−2.38 ± 0.52 −1.39 ± 0.28 −1.15 ± 0.32 +0.43 ± 0.26 +0.08 ± 0.18 +0.29 ± 0.16 zform = 5, [Fe/H] =
∆ log10 (M⋆h2/M⊙) +0.69 ± 0.20 +0.35 ± 0.11 +0.16 ± 0.12 −0.24 ± 0.11 −0.15 ± 0.06 −0.20 ± 0.06 g-band-based MF+0.63 ± 0.22 +0.35 ± 0.13 +0.19 ± 0.12 −0.20 ± 0.14 −0.14 ± 0.07 −0.19 ± 0.07 gcol-based MF+0.69 ± 0.22 +0.37 ± 0.13 +0.17 ± 0.12 −0.25 ± 0.12 −0.18 ± 0.08 −0.21 ± 0.05 K-band-based MF
Note. — The unconstrained linear fit (least-squares) parameters for luminosity and stellar mass evolution. For each ordinate (1) as a functionredshift, we give the best-fit slopes (2-4) and intercepts (5-7), including their 1σ dispersions from bootstrap resampling. As in Table 1, we givparameters for each galaxy size bin (i, ii, and iii) and each evolution analyses (5). For the unconstrained case we used the same number ofmeasurements as with the constrained case.
Copyright © 2022 FDOKUMEN