Paternity and kinship patterns in polyandrous moustached tamarins (Saguinus mystax
Upload
independentCategory
view
1download
0
The Equivocal Relationship Between Territorialityand Scent Marking in Wild Saddleback Tamarins(Saguinus fuscicollis)
Yvan Lledo-Ferrer & Fernando Peláez &
Eckhard W. Heymann
Received: 7 September 2010 /Accepted: 25 January 2011 /Published online: 13 April 2011# The Author(s) 2011. This article is published with open access at Springerlink.com
Abstract Researchers have often assumed that scent marking serves a territorialfunction in callitrichines, although some controversy exists. To fulfill such afunction, scent marks should 1) prevent intrusions, 2) ensure access to feeding resources,3) enable avoidance of intergroup encounters, or 4) play an important role in theaggressive encounters between groups. We studied 13 saddleback tamarins (Saguinusfuscicollis) belonging to 3 free-ranging groups, which formed mixed-species troopswith moustached tamarins (S. mystax) in the Amazonian rain forest of Peru. None ofthe predictions were confirmed. The tamarins used a border-marking strategy, markingmore on the periphery of their territory. However, feeding trees in overlap andencounter areas received more scent marking but were still visited by neighboringgroups. Intergroup encounters occurred more often than expected, and scent-markingfrequency was not higher during them than when no other group was present. Itappears that instead of defending a territory in the classic sense, the tamarins areoptimizing signal transmission by depositing their scents where the probability ofdetection by neighbors is higher. Saddleback tamarins may use shared areas of theirhome ranges to exchange information with neighboring groups, perhaps regardingreproductive opportunities.
Keywords Callitrichidae . Intergroupencounters . Resource defense . Scentmarking .
Territoriality
Int J Primatol (2011) 32:974–991DOI 10.1007/s10764-011-9516-9
Electronic supplementary material The online version of this article (doi:10.1007/s10764-011-9516-9)contains supplementary material, which is available to authorized users.
Y. Lledo-Ferrer (*) : E. W. HeymannAbteilung Verhaltensökologie & Soziobiologie, Deutsches Primatenzentrum, 37077 Göttingen,Germanye-mail: [email protected]
Y. Lledo-Ferrer : F. PeláezÁrea de Psicobiología, Facultad de Psicología, Universidad Autónoma de Madrid, Madrid, Spain

Introduction
Olfactory communication is substantially different from other forms of communi-cation, as scent marks are deposited on the substrate, even in the absence of thepotential receiver, and can be detected long after they were deposited, even in theabsence of the sender (Gosling and Roberts 2001a). Among the several andnonexclusive functions of scent marking in mammals, territorial defense hasreceived much attention. By scent matching, neighbors and intruders may be ableto assess territory holders without incurring the costs of direct confrontations(Gosling 1982, 1990; Gosling and McKay 1990). However, a territory holder mustmaximize the probability of its scents being detected by potential intruders, whilereducing the costs of their deposition (Gorman and Mills 1984; Roberts and Lowen1997). In economically defensible territories, animals should mark along the borders,e.g., Canis latrans (Gese and Ruff 1997), whereas in large territories, a hinterlandmarking strategy, with scents scattered within the territory, is more efficient, e.g.,Suricata suricatta (Jordan et al. 2007).
Chemical signals have been shown to play an important role in maintainingterritorial integrity and spacing (Gosling 1982). Scent marks may conveyinformation about competitive ability (Hurst and Beynon 2004), and intruders mightassess residents without direct confrontation by scent matching, enabling them toavoid the costs of escalating conflicts (Gosling and Roberts 2001a). In many species,scent marking is a conspicuous part of the aggressive display. Ropartz (1968) foundthat aggression in Swiss albino mice (Mus musculus) was mediated by olfactorycues, as a reduction of aggression occurred when the natural odors were masked byan artificial scent, and anosmic mice did not display any form of aggressivebehavior. Male rabbits (Oryctolagus cuniculus) and male house mice (Musdomesticus) whose scents are present in an experimental arena are more likely towin fights (Gosling and McKay 1990; Mykytowycz et al. 1976). Scent marking isalso part of the aggressive display in ring-tailed lemurs (Lemur catta: Gaspari andCrockett 1984). When groups meet, 2 males may anoint their own tails with theirown scents, face each other, and wave their tails at one another, which has receivedthe illustrative name of “stink fights” (Jolly 1966).
Olfactory communication is also an important feature of the social lives ofmarmosets and tamarins. These small-bodied New World Primates, which live in thedense canopy of the Amazonian rain forests, possess a well developed olfactorycommunication system, with specialized glands in the anogenital, suprapubic, andsternal regions (Epple et al. 1993) and a functional vomeronasal organ (Evans 2003).They can perceive information about species, subspecies, sex, and individual identityin the sender’s scent marks (Epple et al. 1993), and females also inform about theirreproductive condition through their scents (Washabaugh and Snowdon 1998;Ziegler et al. 1993). These peaceful cooperative breeders (Caine 1993) arenonetheless intolerant toward neighbors or strangers (French and Snowdon 1981;Goldizen 1987), and all group members participate in contests against neighbors(Lazaro-Perea 2001; Peres 1992). However, the intensity of the intergroupinteraction varies greatly from severe aggression to peaceful (Buchanan-Smith1991; Lazaro-Perea 2001), with extragroup copulations possible (Digby 1999). Incaptivity, scent marking is enhanced when the residents are confronted by strangers
Territoriality and Scent Marking in Wild Saddleback Tamarins 975

(French and Snowdon 1981; Harrison and Tardif 1989). Female cottontop tamarins(Saguinus oedipus) increase their anogenital and suprapubic marking frequencieswhen confronted with strangers (French and Snowdon 1981; Harrison and Tardif1989). It has been argued that anogenital marking is used in sociosexual contexts,whereas suprapubic marking is performed in situations of aggressive arousal(French and Snowdon 1981). However, researchers have found no functionaldistinction between the different glands in Saguinus fuscicollis (Belcher et al.1988).
Although all callitrichid species studied so far possess economically defensibleterritories (Heymann 2000), their home ranges overlap extensively with each other(Garber et al. 1993). The possible function of scent marking in territorial defense isnot clear for callitrichids (Heymann 2006). Apart from Mico intermedius (Rylands1990), no other species shows a clear border-marking pattern (Heymann 2000;Lazaro-Perea et al. 1999; Miller et al. 2003). Saddleback tamarins (Saguinusfuscicollis) marked the periphery of their home ranges more than the core area, butoverall, rates of scent marking were related to patterns of range use (Bartecki andHeymann 1990). Heymann (2000) observed the same in moustached tamarins(Saguinus mystax), where expected and observed rates of scent marking in peripheraland core areas did not differ. The latter study concluded that scent marks do notfulfill a territorial function in this species. Gosling and Roberts (2001b) challengedthis conclusion, arguing that the spatial pattern of scent marking should bedetermined by the distribution of resources in the territory. Indeed, marmosetsusually mark gouging holes where they feed on exudates (Lacher et al. 1981;Lazaro-Perea et al. 1999), although a territorial function is unlikely (Rylands 1985).On the other hand, intergroup encounters in mixed-species troops of tamarins takeplace in the vicinity of major feeding trees, so a resource defense function has beensuggested (Garber 1988). Feeding trees can also serve as landmarks for thedeposition of the signal (Macdonald 1985).
Scent marking can also serve a territorial defense function during directencounters with neighboring groups. By definition, 2 groups can meet only inareas of overlap between their home ranges. Therefore, if scent-markingfrequency increases during intergroup encounters, it is important to determineif the increase is related to the presence of the neighbor group, or only to the useof an overlap area.
We here reexamine the territorial function of scent marking in a tamarinspecies, taking the criticism by Gosling and Roberts (2001b) into account. Ourstudy is based on the following predictions: 1) Because saddleback tamarins haveeconomically defensible home ranges, scent marking should be concentrated inperipheral areas (border-marking strategy). 2) If scent marking serves a territorialfunction in the sense of defense of specific resources, a boundary-marking strategyshould be found if resources are homogeneously distributed. If resources areheterogeneous, scent marking should be associated with the resource and related totheir size or importance. 3) If scent marking allows avoidance of neighboringgroups, then intergroup encounters should occur, at best, on a random basis. 4) Ifscent marking serves a territorial defense function during intergroup encounters,then we would expect an increase in scent-marking behavior and its investigationduring encounters.
976 Y. Lledo-Ferrer et al.
Methods
Study Site and Focal Groups
We conducted the study at the Estación Biológica Quebrada Blanco (EBQB) in theAmazonian lowland rain forest of northeastern Peru (Heymann 1995). From May2007 to June 2008 we followed 3 well habituated groups of Saguinus fuscicollis(Table I) forming mixed-species troops with Saguinus mystax. We observed eachsaddleback group about 6 consecutive days/mo, from exiting a sleeping site(between 05:15 h and 06:00 h) to retiring to a sleeping site (between 15:30 h and16:35 h). All adult subjects were individually recognizable through natural marks, e.g.,genital pigmentation, shape of the tail, etc. In addition, we followed 8 neighboring, lesshabituated groups for a period ranging between 10 and 30 d from February to September2008.
Data Collection
We recorded scent-marking and olfactory behavior (Table II) via the behaviorsampling method (Martin and Bateson 1993). We noted the identity of the individualthat scent marked, and whether the scent received any response from other groupmembers. We usually recorded responses to scent marks in the 5 min after depositionbecause afterwards the group had typically definitively abandoned the area and thusthe scent could not receive any further response from other group members(Heymann 1998).
The behavior sampling method can bias the data toward more visible individuals(Martin and Bateson 1993). To correct this bias, we conducted scan samples every15 min, wherein we recorded the activity of each visible individual within 2 min.Because there were differences in visibility (expected vs. observed representation ofindividuals in scan samples) between individuals in group 1 (χ2 3=9.61, p<0.03)
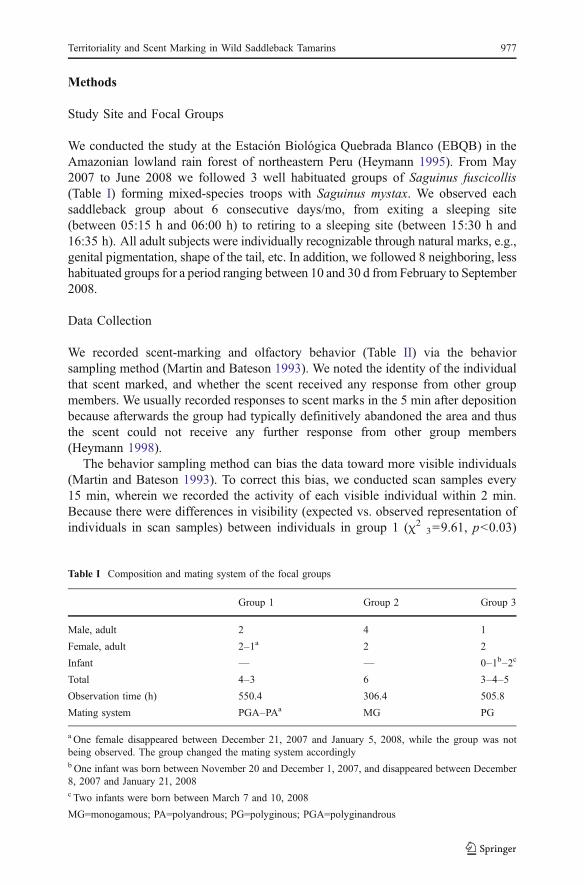
Table I Composition and mating system of the focal groups
Group 1 Group 2 Group 3
Male, adult 2 4 1
Female, adult 2–1a 2 2
Infant — — 0–1b–2c
Total 4–3 6 3–4–5
Observation time (h) 550.4 306.4 505.8
Mating system PGA–PAa MG PG
a One female disappeared between December 21, 2007 and January 5, 2008, while the group was notbeing observed. The group changed the mating system accordinglyb One infant was born between November 20 and December 1, 2007, and disappeared between December8, 2007 and January 21, 2008c Two infants were born between March 7 and 10, 2008
MG=monogamous; PA=polyandrous; PG=polyginous; PGA=polyginandrous
Territoriality and Scent Marking in Wild Saddleback Tamarins 977

and in group 2 (χ2 5=20.87, p<0.001), we corrected individual scent-markingfrequencies by dividing them by the proportion of scans where the respectiveindividual was visible.
We georeferenced scent-marking events on a Garmin etrex GPS, with precisionranging from 10 to 20 m. The location of the group was automatically recorded viathe TrackLog option on the GPS. We permanently marked each feeding tree visitedby the focal groups with a numbered aluminum tag, georeferenced it, and measuredits diameter at breast height (DBH).
We considered an intergroup encounter beginning when 2 groups were in visualcontact. However, the behavior of the group is likely to be influenced by theproximity of other groups before and after the encounter itself. Therefore, weincluded the data from 2 buffer intervals. The first interval begins when the presenceof a neighboring group was noticed by the human observers, or since the monkeysstarted emitting series of long calls, which are usually a prelude to an encounter(Garber et al. 1993; Lazaro-Perea 2001; Terborgh 1983). The second intervalincludes all data until the group stops emitting long calls (Miller et al. 2003), rests,or abandons the area.
We observed a total of 53 intergroup encounters. We discarded encounters withsolitary individuals because these interactions were extremely brief and aggressive,with the intruder fleeing immediately. We considered successive encounters thatwere separated by <30 min as a single encounter in the analysis (Lazaro-Perea2001). We located the encounter on GPS, and classified it as aggressive if chases andvigorous vocalizations occurred. If the groups stayed in proximity withoutexchanging behaviors apart from a few vocalizations, we considered the encountercalm. We also recorded extragroup copulations and feeding behavior duringencounters.
Data Analysis
Spatial Analyses We calculated the density of scent-marking events (SME/ha); theintensity of scent-marking (Heymann 2001), defined as the number of scent-markingacts per scent-marking event (SMA/SME); and the number of olfactory inspectionsper hectare (OI/ha). We expressed overmarking (OM) and scent inspections (SI) asthe proportion of scent-marking acts overmarked or inspected. We calculated feeding
Behavior Description
Scent-marking act Completed rubbing movement involving 1 of thescent glands: anogenital (AG), suprapubic (SP),or sternal (ST)
Scent-marking event Combination of scent-marking acts (Bartecki andHeymann 1990)
Overmarking Marking over a previous mark from anotherindividual
Scent inspection Sniffing, muzzle-rubbing, or licking a scent fromanother individual
Olfactory inspection Sniffing, muzzle-rubbing, or licking the substrate
Table II Behavioral coding
978 Y. Lledo-Ferrer et al.
tree density (no. of trees/ha); and as measures for the importance of the feedingresources, we calculated DBH density (sum of DBH of feeding trees/ha), mean DBHper tree (sum of DBH of feeding trees/no. of feeding trees), and visits per tree (sumof visits to feeding trees/no. of feeding trees).
We compared the observed vs. the expected spatial distribution of scent-markingevents based on the intensity of use of the overlap areas (Heymann 2000).We defined home ranges using the 100% minimum convex polygon (MCP)approach on ArcView GIS 3.3, and identified the overlapping areas, defined asportions of the home range used by >1 group. MCPs tend to overestimate the homeranges. This is conservative because scent-marking density would then be under-estimated. Moreover, because the neighboring, less habituated groups may nothave used their entire home range while being followed, overlap areas might beunderestimated.
We defined an encounter area as a 50-m-radius circle around each intergroupencounter, wherever 2 groups established visual contact. We also established another15-m-radius area around each feeding tree visited, and quantified scent markingwithin this circle.
We compared the density of scent-marking events, intensity of scent marking,proportion of scent-marking acts inspected and overmarked, and olfactory inves-tigations between exclusive and overlap areas, encounter and overlap areas where noencounter took place, feeding trees in exclusive and overlap areas, feeding trees inencounter and overlap areas, and feeding trees in overlap areas against overlap areasexcluding feeding trees. We square-root or log transformed data that did not meet therequirements of normality. We used general linear mixed models (GLMM), withindividual identity nested within a group as a random factor; sex, group, and area asfixed factors; and Bonferroni adjustment for multiple comparisons. As one femaledisappeared from group 1 between December and January, we analyzed data fromthis group after January 2008 separately.
We compared the distribution of food resources between exclusive and overlapareas, as well as between encounter and overlap areas where no encounter had takenplace, and analyzed these with a repeated measures ANOVA.
Intergroup Encounters We compared scent-marking patterns during intergroupencounters to 2 control periods. Because scent marking is strongly influenced bythe time of the day (Bartecki and Heymann 1990), we controlled for this variable byrecording the behavior of the group 24 h after the encounter. When these data werenot available, e.g., because another encounter was taking place, we considered aperiod 24 h previous to the encounter.
To control for variation due to the use of an overlap area, we recorded thebehavior of the group in the same area and at the same time of the day, but when noencounter was taking place.
We calculated individual frequencies of scent marking and olfactory explorationby dividing the observed frequencies by the observation time for each phase(Encounter, Next Day, and Same Area). We also calculated the proportion of scent-marking acts deposited with each epidermic gland. We compared scent-markingfrequency and intensity, overmarking, scent and olfactory inspections, and theproportion of scent-marking acts deposited with each scent-marking gland across the
Territoriality and Scent Marking in Wild Saddleback Tamarins 979

3 phases. We modeled data using general linear mixed models, with individualidentity nested within a group as a random factor, and sex, group, and phase as fixedfactors. We conducted multiple comparisons with the Bonferroni adjustment. Welog-transformed data that were not normally distributed.
We calculated the probability of intergroup encounters with the Waser Gas Model(Waser and Wiley 1979), which assumes that both groups move independently ofeach other, and that they can meet at any place in space, which is not the case fortamarins that have fixed territories and can meet only at overlap areas. Therefore weused the formula modified by Barrett and Lowen (1998)
f ¼ x4pv
psþ dð Þ
wherein
x the probability of finding the main study group in the overlap area (whenresources are shared, x ¼ o=2ð Þ=eþ o=2ð Þ; o=proportion of overlap area, ande=proportion of exclusive area)
ρ density of other groupsv group mean velocitys mean group spreadd approach distance between groups
The parameters used for this calculation are provided as electronic supplementarymaterial.
All tests were 2-tailed and performed in SPSS 16.0.
Results
Do Saddleback Tamarins Use a Border-marking Strategy?
The focal groups differed in home-range size and in the proportion of home-rangeoverlap (Table III, Fig. 1). Group 1 had the smallest home range and shared 50%of it with neighbors, whereas group 2 had the largest home range but shared only21%.
We found an increase in SME in overlap areas vs. the exclusively used areas(Fig. 2; Table IV). Moreover, there was a significant interaction between sex and area(GLMM: F(1,8)=16.48, p=0.04), wherein females marked more than males inexclusive areas, whereas males marked more in overlap areas. The tamarins markedmore in overlap areas than expected by the intensity of use (G1 2007: G=56.29, df=1,
Group Size (ha) Perimeter (m) Overlap (ha) Overlap (%)
1 42.2 2397 21.3 50.4
2 80.6 3381 17 21.1
3 50.1 2590 17.4 34.6
Table III Home-range charac-teristics of the focal groups
980 Y. Lledo-Ferrer et al.

p<0.001; G1 2008: G=18.54, df=1, p<0.001; G2: G=8.7, df=1, p<0.004; G3:G=37.89, df=1, p<0.001). The intensity of scent marking was higher in overlap areasvs. exclusive areas. There was also a significant interaction between sex and area(GLMM: F(1,11)=16.04, p=0.002), with males marking more intensely in exclusiveareas, whereas females marked more intensely in overlap areas.
Tamarins overmarked the same proportion of scents in exclusive and overlapareas, but inspected the substrate more often per hectare in overlap areas than inexclusive areas. There were more scent-marking events in the area of intergroupencounters vs. overlap areas where no encounter took place, but intensity did notvary. The tamarins overmarked the same proportion of scents in both encounter and
Fig. 2 Distribution of scent-marking events (group 1).
Fig. 1 Home ranges of the focal groups and overlap areas.
Territoriality and Scent Marking in Wild Saddleback Tamarins 981

overlap areas. However, the subjects inspected the substrate more in encounter areasthan in overlap areas.
How are Resources Distributed and Scent Marked?
Trees in overlap areas received more SME than in exclusive areas, and the subjectsscent marked more intensely (Table IV). The tamarins inspected the substrate closeto trees in overlap areas more than in exclusive areas. We found a trend forhigher proportion of overmarking in trees in overlap areas vs. trees in exclusiveareas.
Trees in the encounter area received more SME than in the overlap area, but theintensity of scent marking did not change. The tamarins performed more olfactoryinvestigations in trees in the encounter area. There was no difference in theproportion of scent marks that were overmarked.
Trees in overlap areas also received more SME than overlap areas with nofeeding trees in proximity, and there was a trend for higher intensity. Thetamarins also inspected the substrate more often near feeding trees than in therest of the overlap area, but there are no differences in the proportion of scentsovermarked.
Table IV Summary of results of the spatial analyses
Comparison SME Intensity Overmarking Olfactory inspection
Exclusive vs. overlap Overlap>exclusive Overlap>exclusive Overlap=exclusive Overlap>exclusive
17.7±0.56 vs.14.41±0.56
2.31±0.05 vs.1.98±0.05
0.11±0.01 vs.0.10±0.01
8.01±0.59 vs.5.61±0.59
F (1,8)=53.98,p<0.001
F (1,8)=102.95,p<0.001
F (1,15)=1.4,p=0.26
F (1,8)=24.16,p=0.01
Encounter vs. overlap Encounter>overlap Encounter=overlap Encounter=overlap Encounter>overlap
2.79±0.07 vs.1.26±0.06
2.17±0.1 vs.2.31±0.1
0.11±0.01 vs.0.11±0.01
1.81±0.21 vs.1.01±0.021
F (1,13.14)=360.57,p<0.001
F (1,15.66)=1.6,p=0.22
F (1,15.32)=0.06,p=0.81
F (1,15.39)=8.69,p=0.01
Tree exclusive vs.tree overlap
Overlap>exclusive Overlap>exclusive Overlap≥exclusive Overlap>exclusive
39.55±2.02 vs.19.59±2.02
2.44±0.06 vs.1.87±0.06
0.31±0.02 vs.0.27±0.02
20.55±1.65 vs.9.16±1.65
F (1,8)=69.76,p<0.001
F (1,8)=131.84,p<0.001
F (1,15)=3.88,p=0.068
F (1,8)=26.05,p=0.001
Tree encounter vs.tree overlap
Encounter>overlap Encounter=overlap Encounter=overlap Encounter>overlap
17.95±0.51 vs.8.48±0.51
2.51±0.13 vs.2.33±0.13
0.12±0.01 vs.0.10±0.01
0.03±0.004 vs.0.02±0.004
F (1,8)=179.02,p<0.001
F (1,8)=2.39,p=0.16
F (1,15)=1.04,p=0.32
F (1,8)=78.31,p<0.001
Tree overlap vs. overlapexcluding trees
Tree>overlap Tree≥overlap Tree=overlap Tree>overlap
3.37±0.08 vs.1.88±0.08
0.86±0.05 vs.0.73±0.05
0.13±0.01 vs.0.12±0.01
1.79±0.15 vs.0.42±0.15
F (1,11.53)=218.31,p<0.001
F (1,17.19)=3.16,p=0.09
F (1,14.54)=1.94,p=0.18
F (1,10.97)=48.65,p<0.001
982 Y. Lledo-Ferrer et al.

There are no differences in tree density (ANOVA: F(1,4)=1.23, p=0.33), DBH density(ANOVA: F(1,4)=1.56, p=0.28), DBH per tree (ANOVA: F(1,4)=0.31, p=0.61), orvisits per tree (ANOVA: F(1,4)=0.04, p=0.85) between exclusive and overlapareas. Moreover, there are also no differences between overlap and encounter areasin tree density (ANOVA: F(1,4)=0.004, p=0.95), DBH density (ANOVA: F(1,4)=0.016, p=0.77), DBH per tree (ANOVA: F(1,4)=4.02, p=0.12), or visits per tree(ANOVA: F(1,4)=0.35, p=0.59).
Do Intergroup Encounters Occur on a Chance Basis?
We observed a total of 53 intergroup encounters. Group 1 had 37 encounters (0.55encounters/d), group 2 had 7 (0.18/d), and group 3 was involved in 9 (0.15/d). Themean duration of encounters was 14 min (±17), with a minimum duration of 1 minand a maximum of 86 min.
According to Waser’s Gas Model, the probability of groups meeting each otherwas higher than expected if they had moved independently (Fig. 3). We classified41% of these encounters as calm and 59% as aggressive. Independently of theclassification of the encounter, we observed males herding females from their owngroup right before or during the encounter in 65% of cases. We observed 3 extrapaircopulations and 3 genital inspections that did not lead to copulation. Finally, on 7occasions we observed individuals feeding without interruption by the other group,during both calm and aggressive intergroup encounters.
Do Saddleback Tamarins Scent Mark More During Intergroup Encounters?
Phase had a significant effect on the frequency of SME (GLMM: F(2, 28)=6.14, p=0.006; Fig. 4a). Post hoc comparisons revealed that scent-marking frequency washigher during encounters than on the next day (p=0.007), but did not differ from thesame area (p=1). Females tended to mark more than males in all phases, althoughthis is not statistically significant (F(1,14)=3.2, p<0.10).
Fig. 3 Observed vs. expected frequency of intergroup encounters based on Waser’s Gas Model.
Territoriality and Scent Marking in Wild Saddleback Tamarins 983

The use of the different scent glands did not differ between phases (proportion ofAG: GLMM: F(2,24)=0.21, p=0.11). The intensity of scent marking was independentof phase (GLMM: F(2,28)=0.03, p=0.97) and sex (GLMM: F(1,14)=0.00, p=0.99).
Phase had a significant effect on the proportion of scents inspected by groupmates (GLMM: F(2, 30)=3.6, p=0.04). Post hoc comparisons revealed a tendency fora lower proportion of scents to be investigated during intergroup encounters vs. thesame area (Bonferroni p=0.059; Fig. 4b). There was no difference in the proportionof scent-marking acts that were overmarked by group mates (GLMM: F(2,22)=0.01,p=0.99). Only 4 times did we observe a scent receiving a response from a memberof the neighboring group during an intergroup encounter.
Phase had a significant effect on the frequency of olfactory inspections (GLMM:F(2,28)=6.96, p=0.004). This frequency was significantly lower during intergroupencounters vs. the next day (Bonferroni p=0.005; Fig. 5), but did not differcompared with the use of the same area (Bonferroni p=1).
Discussion
We found a clear border-marking strategy, which is consistent with an economicallydefensible home range. The tamarins deposited more scent marks and marked withhigher intensity in overlap areas, and this marking pattern could not be explained bya higher intensity of use of these areas. These results are in line with those ofBartecki and Heymann (1990), who demonstrated that saddleback tamarins markedmore on the periphery at the same study site. However, our results contrast sharplywith those of Heymann (2000), who did not find a definite spatial pattern of scent
Fig. 4 Scent-marking frequency a and frequency of olfactory inspections b during intergroup encounters,24 h later (Day), and when the group uses the same area of the encounter (Area), but no other group ispresent. **p<0.01.
984 Y. Lledo-Ferrer et al.

marking in sympatric moustached tamarins, although they invest more in boundarycontests than saddlebacks (Peres 1992). This different pattern of scent markingcannot be accounted for by feeding ecology, as the 2 species share 75–90% of theirvegetable diet (Knogge and Heymann 2003), and both studies were conducted at thesame study site. Moreover, the limiting factor for tamarins is not their vegetable dietbut the animal prey (Smith 2000). Indeed, animal prey is defended by depletion, andcapture success in saddleback tamarins is significantly lower at the periphery of theirhome range (Peres 1992).
Overlap areas received more scent-marking events than exclusive areas and theareas around intergroup encounters more than other shared areas where no encounterhad taken place. However, as Gosling and Roberts (2001b, F7) noted: “it is difficultto ascribe a function to a signal without some direct indication of the benefits thataccrue to the signaller.” One possible benefit may be related to the exclusion ofintruders. However, the large overlap between territories shows that scent marks arenot effective in maintaining spatial exclusivity and preventing intrusions.
Another possible benefit might be related to the defense of especially valuableresources. Feeding trees in overlap areas received more scent-marking events and ahigher scent-marking intensity than those in exclusive areas. When comparing thedistribution of scents within the overlap area, we found that feeding trees receivedmore scent-marking events and a slightly higher intensity of scent-marking than the restof the overlap area. Feeding trees in the encounter areas also received more scent-marking events vs. feeding trees on other overlap areas where no encounter had takenplace. Researchers have also reported this enhanced marking in food resources inCallithrix jacchus (Lazaro-Perea et al. 1999), C. penicillata (Lacher et al. 1981), Micointermedius (Rylands 1985), and Leontopithecus rosalia (Miller et al. 2003).
At first sight, this could be interpreted as evidence for a resource defense strategy,if major feeding trees were located close to intergroup encounters (Garber 1988).However, we found resources to be homogeneously distributed, so a boundary-marking strategy would be more appropriate, with no need for direct, additionalmarking close to the resource. Further, this strategy does not seem to be effectivebecause we observed different groups feeding on the same trees on different days, or
Fig. 5 Proportion of a group’sown scents inspected duringintergroup encounters, 24 hlater (Day), and when thegroup uses the same area ofthe encounter (Area), butno other group is present.
Territoriality and Scent Marking in Wild Saddleback Tamarins 985
during intergroup encounters. Moreover, overmarking other group members seemscounterproductive because it reduces the probability of the mark being detectedcompared to 2 separate marks.
One of the proposed functions of overmarking is signaling competitive ability ofterritory owners (Ferkin and Pierce 2007; Gosling and Roberts 2001a). This does notseem to be the primary function in saddleback tamarins. The perception of theseovermarks does not restrain intruders from feeding because monkeys feed evenduring intergroup encounters, without interference from the other group. Moreover,as intergroup encounters happened more often than expected by chance, the groupsdo not avoid confrontations. Thus, the tamarins may instead be using the informationcontained in the neighbors’ scents to search for them, as suggested for marmosets(Lazaro-Perea 2001; Lazaro-Perea et al. 1999; 2000).
Chemical communication has been said to play an important role in territorialagonistic behavior, as captive tamarins increase their scent-marking rates whenconfronted with intruders (Epple 1980; Epple and Alveario 1985; French andSnowdon 1981). Our groups increased their scent-marking frequency duringintergroup encounters vs. 24 h later. However, this increase was not related to theencounter with another group per se, as we found no difference in scent-markingfrequency in areas of intergroup encounters, and the same shared area of the homerange, when no other group was present.
The proportion of scents deposited with each gland did not vary, in contrast tothose in cottontop tamarins (French and Snowdon 1981) and ring-tailed lemurs (Palagiand Norscia 2009). It could be argued that saddleback tamarins do not show afunctional distinction between the anogenital and the suprapubic gland (Belcher et al.1988). However, it seems puzzling that 2 anatomically different glands transmitredundant information. It could also be that different glands do indeed transmitdifferent kinds of information, but that the tamarins transmit them all at a time(Lazaro-Perea 2001), or that different combinations of scent-marking acts fromdifferent glands within an event do transmit a different message.
During intergroup encounters the subjects tended to be less interested in their owngroup scents than in the same area when no other group was present. This may beexplained by the nature of these intergroup encounters, wherein individuals spreadover a large area and are often aggressively chased by neighbors. Thus, activelymonitoring group mates may be difficult in these conditions. But despite thisdecrease in scent inspections, the proportion of scents overmarked did not vary,which suggests that the tamarins nevertheless knew where the scents had beendeposited, possibly via volatile cues.
One way to obtain the information transmitted by neighbors is by directinspection of the substrate. Ideally, focal scent marks should be monitored, whichwas not possible in our study. We observed only 4 scents receiving a response fromthe neighboring group. Some other scents, unnoticed by the human observer, maynevertheless have been inspected. An indirect way of evaluating this possibility is bysubstrate inspection. Although the tamarins inspected the substrate with a higherfrequency during intergroup encounters vs. the next day, this was again related to theuse of an overlap area.
Olfactory communication does not seem to play a major role in the intergroupencounters of wild saddleback tamarins, in contrast to captive settings (Epple et al.
986 Y. Lledo-Ferrer et al.

1993). Indeed, in the wild neighbors are not complete strangers but rather dearenemies (Temeles 1994). Moreover, scent marking is not a very effectivecommunication channel owing to its poor directionality and slow transmissionspeed (Endler 1993). It is thus not well suited for intergroup encounters incallitrichids, which are characterized by vocal exchanges, chases, and freneticactivity. Thus, if scent marking does not prevent intrusions in the territory, does notensure exclusive access to resources, does not prevent territorial contests, and doesnot play a major role during intergroup encounters, does it have a function at all?
Most studies on territoriality have considered only deposition of the signal,neglecting its reception (cf. Gosling et al. 1996a, b; Palagi and Norscia 2009), whichgives an incomplete picture of the communication process (Kappeler 1998).Tamarins performed more olfactory inspections in overlap areas and close tofeeding trees in these areas. These results are the logical counterpart of the increasedscent density reported. If the neighboring groups are also extensive and intensivelymarking these areas, the focal group could be trying to gain as much information aspossible by inspecting the substrate where other groups may have deposited a largeamount of scents as well.
Tamarins might then be optimizing signal transmission by marking where theprobability of perception by other groups is higher, an economic strategy alsodescribed in antelopes (Brashares and Arcese 1999) and in ring-tailed lemurs (Palagiand Norscia 2009). In contrast to terrestrial mammals, in the dense, humid, 3-dimensional environment of callitrichid monkeys, the probability of detecting a scentfrom other group may be extremely low, and the signal may vanish quickly (Epple et al.1980). The latter might be overridden by an enhanced intensity of scent marking asseen in our study, while marking where the probability of finding an audience ishigher may partially override the former.
Thus, feeding trees in overlap areas may be a type of bulletin board, whereindividuals from different groups exchange information. A similar function wassuggested for the gouging holes of common marmosets, but only in intragroupcommunication (Lazaro-Perea et al. 1997; Rylands 1985). The spatial patternrevealed by our study suggests, instead, that it serves for intergroup communication.Indeed, feeding trees in overlap areas may be visited by different groups within thesame day, just as gouging holes in marmosets (Lacher et al. 1981). We observedseveral times the tamarins marking fruits from Wettinia augusta, without consumingthem, which would have obliterated the message. However, they fed on those treeson previous and subsequent days (see video on electronic supplementary material).
If overlap areas enable chemical information exchange between groups, it may beasked which kind of information is to be transmitted. The fact that the scent-markingpattern varies between males and females suggests that this information might berelated to mating competition. Males deposited more scents in overlap areas thanfemales did, whereas females marked more intensely. In another study, we found thatscent-marking frequency correlates with copulations in males, while intensity ofscent marking correlates with copulation in females (Lledo-Ferrer et al. in prep.). Itthus seems that both males and females perform scent marking in overlap areas insuch a way that key features for mate choice might be detected by extragroupindividuals. Indeed, extragroup copulations are common, which might explain theherding behavior observed. Moreover, males overmark females and vice versa
Territoriality and Scent Marking in Wild Saddleback Tamarins 987

(Lledo-Ferrer et al. in prep.), which suggests that overmarking may be a way ofconcealing chemical information, as in antelopes (Brashares and Arcese 1999;Roberts and Dunbar 2000), instead of ensuring predominance for scent matching.
Reproductive constraints are extremely heavy on callitrichids. Not only do mostmales delay breeding in their groups (Goldizen and Terborgh 1989), but fewer than halfof the females reach a reproductive position, as the number of adult females is higherthan the number of reproductive positions (Goldizen et al. 1996). Thus, scent marksmay allow individuals to determine which neighboring groups to meet and with whatfrequency to explore reproductive opportunities or to achieve extragroup copulations.Intergroup encounters may then rather be the dénouement of this continuousmonitoring and allow a visual, direct evaluation of neighbors (Lazaro-Perea 2001;see the “fight to learn” hypothesis: Getty 1989).
Even if further research, and larger sample size, is needed to determine how groupsize, sex ratio, and mating system influence scent-marking behavior, our results arenot likely to represent group idiosyncrasies. First, our results are in line withBartecki and Heymann’s (1990), whose saddleback tamarins marked more on theperiphery at the same study site. Second, our focal groups represented all possiblemating systems (Table I).
If scent marks are intended to exchange reproductive information betweengroups, the differences in the patterns of olfactory communication betweenSaguinus fuscicollis and S. mystax may reflect subtle yet important differences inthe mating system of the species (Heymann 2001). Huck et al. (2005) found a highintragroup relatedness in moustached tamarins at the EBQB study site, but matingpartners were not closely related and 1 extragroup paternity was detected.Moreover, partners usually did not share the same haplotype (Huck et al. 2007),which suggests that there is regular outbreeding. We hypothesize that relatednessamong saddleback tamarins may be higher than among moustached tamarins,which would put a higher premium on the former to look for reproductiveopportunities in neighboring groups.
Acknowledgments We thank the Instituto Nacional de Recursos Naturales in Lima for the authorizationto carry out field studies at the EBQB (authorization no. 106-2007-INRENA-IFFS-DCB), our fieldassistants Ney Shahuano Tello and Aladino Hidalgo, and Paloma Nuche for help in data collection. ConnyKraus patiently provided statistical advice. Y. Lledo-Ferrer thanks Fundación La Caixa and FundaciónCajamadrid for personal grants, the Spanish Ministry for Education and Science (MEC-DGI contract grantno. SEJ2005-00016), and the Ministry for Science and Innovation (MCINN-SGPI contract grant no.PSI2009-08581PSIC). We also thank the reviewers who helped to improve the original manuscript.
Open Access This article is distributed under the terms of the Creative Commons AttributionNoncommercial License which permits any noncommercial use, distribution, and reproduction in anymedium,provided the original author(s) and source are credited.
References
Barrett, L., & Lowen, C. B. (1998). Random walks and the gas model: spacing behaviour of grey-cheekedmangabeys. Functional Ecology, 12, 857–865.
Bartecki, U., & Heymann, E. W. (1990). Field observations on scent-marking behavior in saddle-backtamarins, Saguinus fuscicollis (Callitrichidae, Primates). Journal of Zoology, 220, 87–99.
988 Y. Lledo-Ferrer et al.

Belcher, A., Epple, G., Kuderling, I., & Smith, A. B. (1988). Volatile components of scent material fromcotton-top tamarin (Saguinus oedipus oedipus)—a chemical and behavioral study. Journal ofChemical Ecology, 14, 1367–1384.
Brashares, J., & Arcese, P. (1999). Scent marking in a territorial African antelope. II. The economics ofmarking with faeces. Animal Behaviour, 57, 11–17.
Buchanan-Smith, H. M. (1991). Encounters between neighbouring mixed species groups of tamarins inNorthern Bolivia. Primate Report, 31, 95–100.
Caine, N. G. (1993). Flexibility and co-operation as unifying themes in Saguinus social organization andbehaviour: The role of predation pressures. In A. B. Rylands (Ed.), Marmosets and tamarins:Systematics, behaviour, and ecology (pp. 200–219). Oxford: Oxford University Press.
Digby, L. J. (1999). Sexual behavior and extragroup copulations in a wild population of commonmarmosets (Callithrix jacchus). Folia Primatologica, 70, 136–145.
Endler, J. A. (1993). Some general comments on the evolution and design of animal communication systems.Philosophical Transactions of the Royal Society of London. Series B: Biological Sciences, 340, 215–225.
Epple, G. (1980). Relationships between aggression, scent marking and gonadal state in a primate, thetamarin Saguinus fuscicollis. In D. Mueller-Schwarze & R. M. Silverstein (Eds.), Chemical signals:Vertebrates and aquatic invertebrates (pp. 87–105). New York: Plenum Press.
Epple, G., & Alveario, M. C. (1985). Social facilitation of agonistic responses to strangers in pairs ofsaddle back tamarins (Saguinus fuscicollis). American Journal of Primatology, 9, 207–218.
Epple, G., Alveario, M. C., Golob, N. F., & Smith, A. B. (1980). Stability and attractiveness related to age ofscent marks of saddleback tamarins (Saguinus fuscicollis). Journal of Chemical Ecology, 6, 735–748.
Epple, G., Belcher, A. M., Küderling, I., Zeller, U., Scolnick, L., Greenfield, K. L., et al. (1993). Makingsense out of scents: Species differences in scent glands, scent-marking behaviour, and scent-markcomposition in the Callitrichidae. In A. B. Rylands (Ed.), Marmosets and tamarins: Systematics,behaviour, and ecology (pp. 123–151). Oxford: Oxford University Press.
Evans, C. S. (Ed.). (2003). Vomeronasal chemoreception in vertebrates: A study of the second nose.London: Imperial College Press.
Ferkin, M. H., & Pierce, A. A. (2007). Perspectives on over-marking: is it good to be on top? Journal ofEthology, 25, 107–116.
French, J. A., & Snowdon, C. T. (1981). Sexual dimorphism in responses to unfamiliar intruders in thetamarin, Saguinus oedipus. Animal Behaviour, 29, 822–829.
Garber, P. A. (1988). Diet, foraging patterns, and resource defense in a mixed species troop of Saguinusmystax and Saguinus fuscicollis in Amazonian Peru. Behaviour, 105, 18–34.
Garber, P. A., Pruetz, J. D., & Isaacson, J. (1993). Patterns of range use, range defense, and intergroupspacing in moustached tamarin monkeys (Saguinus mystax). Primates, 34, 11–25.
Gaspari, M. K., & Crockett, C. M. (1984). The role of scent marking in Lemur catta agonistic behavior.Zoo Biology, 3, 123–132.
Gese, E. M., & Ruff, R. L. (1997). Scent-marking by coyotes, Canis latrans: the influence of social andecological factors. Animal Behaviour, 54, 1155–1166.
Getty, T. (1989). Are dear enemies in a war of attrition? Animal Behaviour, 37, 337–339.Goldizen, A. W. (1987). Tamarins and marmosets: Communal care of offspring. In B. B. Smuts, D. L.
Cheney, R. M. Seyfarth, R. W. Wrangham, & T. T. Struhsaker (Eds.), Primate societies (pp. 34–43).Chicago: University of Chicago Press.
Goldizen, A. W., Mendelson, J., van Vlaardingen, M., & Terborgh, J. (1996). Saddle-back tamarin(Saguinus fuscicollis) reproductive strategies: evidence from a thirteen-year study of a markedpopulation. American Journal of Primatology, 38, 57–83.
Goldizen, A. W., & Terborgh, J. (1989). Demography and dispersal patterns of a tamarin population—possible causes of delayed breeding. The American Naturalist, 134, 208–224.
Gorman, M., & Mills, M. (1984). Scent marking strategies in hyaenas (Mammalia). Journal of Zoology,202, 535–547.
Gosling, L. M. (1982). A reassessment of the function of scent marking in territories. Zeitschrift fürTierpsychologie, 60, 89–118.
Gosling, L. M. (1990). Scent marking by resource holders: Alternative mechanisms for advertising thecosts of competition. In D. W. Macdonald, D. Mueller-Schwarze, & S. E. Natynczuk (Eds.), Chemicalsignals in vertebrates (pp. 315–328). Oxford: Oxford University Press.
Gosling, L. M., Atkinson, N., Collins, S., Roberts, R., & Walters, R. (1996a). Avoidance of scent-markedareas depends on the intruder’s body size. Behaviour, 133, 491–502.
Gosling, L. M., Atkinson, N., Dunn, S., & Collins, S. (1996b). The response of subordinate male mice toscent marks varies in relation to their own competitive ability. Animal Behaviour, 52, 1185–1191.
Territoriality and Scent Marking in Wild Saddleback Tamarins 989

Gosling, L. M., & McKay, H. V. (1990). Competitor assessment by scent matching—an experimental test.Behavioral Ecology and Sociobiology, 26, 415–420.
Gosling, L. M., & Roberts, S. C. (2001a). Scent-marking by male mammals: Cheat-proof signals tocompetitors and mates. In P. Slater (Ed.), Advances in the study of behavior (pp. 169–217). SanDiego: Academic Press.
Gosling, L. M., & Roberts, S. C. (2001b). Testing ideas about the function of scent marks in territoriesfrom spatial patterns. Animal Behaviour, 62, F7–F10.
Harrison, M. L., & Tardif, S. D. (1989). Species differences in response to conspecific intruders inCallithrix jacchus and Saguinus oedipus. International Journal of Primatology, 10, 343–362.
Heymann, E. W. (1995). Sleeping habits of tamarins, Saguinus mystax and Saguinus fuscicollis(Mammalia; Primates; Callitrichidae), in north-eastern Peru. Journal of Zoology, 237, 211–226.
Heymann, E. W. (1998). Sex differences in olfactory communication in a primate, the moustachedtamarin, Saguinus mystax (Callitrichinae). Behavioral Ecology and Sociobiology, 43, 37–45.
Heymann, E. W. (2000). Spatial patterns of scent marking in wild moustached tamarins, Saguinus mystax:No evidence for a territorial function. Animal Behaviour, 60, 723–730.
Heymann, E. W. (2001). Interspecific variation of scent-marking behaviour in wild tamarins, Saguinusmystax and Saguinus fuscicollis. Folia Primatologica, 72, 253–267.
Heymann, E. W. (2006). Scent marking strategies of new world primates. American Journal ofPrimatology, 68, 650–661.
Huck, M., Löttker, P., Bohle, U. R., & Heymann, E. W. (2005). Paternity and kinship patterns in polyandrousmoustached tamarins (Saguinus mystax). American Journal of Physical Anthropology, 127, 449–464.
Huck, M., Roos, C., & Heymann, E. W. (2007). Spatio-genetic population structure in mustachedtamarins, Saguinus mystax. American Journal of Physical Anthropology, 132, 576–583.
Hurst, J. L., & Beynon, R. J. (2004). Scent wars: the chemobiology of competitive signaling in mice.BioEssays, 26, 1288–1298.
Jolly, A. (1966). Lemur behavior: A Madagascar field study. Chicago: University of Chicago Press.Jordan, N. R., Cherry, M. I., & Manser, M. B. (2007). Latrine distribution and patterns of use by wild
meerkats: implications for territory and mate defence. Animal Behaviour, 73, 613–622.Kappeler, P. M. (1998). To whom it may concern: the transmission and function of chemical signals in
Lemur catta. Behavioral Ecology and Sociobiology, 42, 411–421.Knogge, C., & Heymann, E. W. (2003). Seed dispersal by sympatric tamarins, Saguinus mystax and
Saguinus fuscicollis: diversity and characteristics of plant species. Folia Primatologica, 74, 33–47.Lacher, T. J., da Fonseca, G., Alve, C. J., & Magalhaes-Castro, B. (1981). Exudate-eating, scent-marking,
and territoriality in wild populations of marmosets. Animal Behaviour, 29, 306–307.Lazaro-Perea, C. (2001). Intergroup interactions in wild common marmosets, Callithrix jacchus: territorial
defence and assessment of neighbours. Animal Behaviour, 62, 11–21.Lazaro-Perea, C., Castro, C. S. S., Harrison, R., Araujo, A., Arruda, M. F., & Snowdon, C. T. (2000).
Behavioral and demographic changes following the loss of the breeding female in cooperativelybreeding marmosets. Behavioral Ecology and Sociobiology, 48, 137–146.
Lazaro-Perea, C., Snowdon, C. T., & Arruda, M. D. (1999). Scent-marking behavior in wild groups ofcommon marmosets (Callithrix jacchus). Behavioral Ecology and Sociobiology, 46, 313–324.
Lazaro-Perea, C., Snowdon, C. T., & Santee, D. P. (1997). Competition and chemical communication inwild groups of common marmosets (Callithrix jacchus). Annals of the New York Academy ofSciences, 807, 534–537.
Macdonald, D. W. (1985). The carnivores: Order Carnivora. In R. E. Brown & D. W. Macdonald (Eds.),Social odours in mammals (pp. 619–722). Oxford: Clarendon Press.
Martin, P., & Bateson, P. (1993). Measuring behaviour—an introductory guide. Cambridge: CambridgeUniversity Press.
Miller, K. E., Laszlo, K., & Dietz, J. M. (2003). The role of scent marking in the social communication ofwild golden lion tamarins, Leontopithecus rosalia. Animal Behaviour, 65, 795–803.
Mykytowycz, R., Hesterman, E., Gambale, S., & Dudzinski, M. (1976). A comparison of the effectivenessof the odors of rabbits, Oryctolagus cuniculus, in enhancing territorial confidence. Journal ofChemical Ecology, 2, 13–24.
Palagi, E., & Norscia, I. (2009). Multimodal signalling in wild Lemur catta: economic design andterritorial function of urine marking. American Journal of Physical Anthropology, 139, 182–192.
Peres, C. A. (1992). Consequences of joint-territoriality in a mixed-species group of tamarin monkeys.Behaviour, 123, 220–246.
Roberts, S. C., & Dunbar, R. I. M. (2000). Female territoriality and the function of scent-marking in amonogamous antelope (Oreotragus oreotragus). Behavioral Ecology and Sociobiology, 47, 417–423.
990 Y. Lledo-Ferrer et al.

Roberts, S. C., & Lowen, C. (1997). Optimal patterns of scent marks in klipspringer (Oreotragusoreotragus) territories. Journal of Zoology (London), 243, 565–578.
Ropartz, P. (1968). The relation between olfactory stimulation and aggressive behaviour in mice. AnimalBehaviour, 16, 97–100.
Rylands, A. (1985). Tree-gouging and scent-marking by marmosets. Animal Behaviour, 33, 1365–1367.Rylands, A. B. (1990). Scent marking behaviour of wild marmosets, Callithrix humeralifer (Callitrichidae,
Primates). In D. W. MacDonald, D. Mueller-Schwarze, & S. E. Natynczuk (Eds.), Chemical signals invertebrates (pp. 415–429). Oxford: Oxford University Press.
Smith, A. (2000). Interspecific differences in prey captured by associating saddleback (Saguinus fuscicollis)and moustached (Saguinus mystax) tamarins. Journal of Zoology, (London), 251, 315–324.
Temeles, E. J. (1994). The role of neighbors in territorial systems: when are they dear enemies? AnimalBehaviour, 47, 339–350.
Terborgh, J. (1983). Five new world primates: A study in comparative ecology. Princeton, NJ: PrincetonUniversity Press.
Waser, P. M., & Wiley, R. H. (1979). Mechanisms and evolution of spacing in animals. In P. Marler & J.G. Vandenbergh (Eds.), Handbook of behavioral neurobiology (pp. 159–223). New York: PlenumPress.
Washabaugh, K., & Snowdon, C. T. (1998). Chemical communication of reproductive status in femalecotton-top tamarins (Saguinus oedipus oedipus). American Journal of Primatology, 45, 337–349.
Ziegler, T. E., Epple, G., Snowdon, C. T., Porter, T. A., Belcher, A. M., & Kuderling, I. (1993). Detectionof the chemical signals of ovulation in the cotton-top tamarin, Saguinus oedipus. Animal Behaviour,45, 313–322.
Territoriality and Scent Marking in Wild Saddleback Tamarins 991
Copyright © 2022 FDOKUMEN