Confidence of paternity, divorce, and investment in children by Albuquerque men

Paternity and Kinship Patterns in PolyandrousMoustached Tamarins (Saguinus mystax)Maren Huck,1,2* Petra Lottker,1,3 Uta-Regina Bohle,4 and Eckhard W. Heymann1
1Abteilung fur Sozbiologie, Deutsches Primatenzentrum, D-37077 Gottingen, Germany2Lehrstuhl fur Verhaltensforschung, Universitat Bielefeld, D-33615 Bielefeld, Germany3Abteilung Verhaltensbiologie, Institut fur Neuro- und Verhaltensbiologie, Westfalische Wilhelms-UniversitatMunster, D-48149 Munster, Germany4Arbeitsgruppe Primatengenetik, Deutsches Primatenzentrum, D-37077 Gottingen, Germany
KEY WORDS Saguinus mystax; polyandry; multiple paternity; microsatellites; kinshippatterns
ABSTRACT We studied patterns of genetic related-ness and paternity in moustached tamarins, small Neo-tropical primates living in groups of 1–4 adult males and1–4 adult females. Generally only one female per groupbreeds, mating with more than one male. Twin birth arethe norm. In order to examine the genetic consequences ofthis mating pattern, DNA was extracted from fecal sam-ples collected from two principal and six neighboringgroups. DNA was characterized at twelve microsatelliteloci (average: seven alleles/locus). We addressed the fol-lowing questions: Do all adult males have mating access tothe reproductive female of the group? How is paternitydistributed across males in a group? Can polyandrousmating lead to multiple paternity? Are nonparental ani-mals more closely related to the breeders than to thepopulation mean? And, are mating partners unrelated?
Breeding females mated with all nonrelated males. In atleast one group the father of the older offspring did notsire the youngest infant although he was still resident inthe group. We also found evidence for multiple paternityin a supposed twin pair. Yet, within each group the ma-jority (67–100%) of infants had the same father, suggest-ing reproductive skew. Relatedness within groups wasgenerally high (average R � 0.31), although both nonre-lated males and females occurred, i.e., immigrations ofboth sexes are possible. Mating partners were never foundto be related, hence inbreeding seems to be uncommon.The results suggest that while the social mating system ispolyandry, paternity is often monopolized by a single maleper group. Am J Phys Anthropol 127:449–464, 2005.© 2004 Wiley-Liss, Inc.
Classical evolutionary concepts assert that due tothe fundamental difference between the sizes ofmale and female gametes, females are predisposedto put most of their reproductive effort into the qual-ity of offspring (parental effort) while males morecommonly put it into quantity (mating effort)(Parker et al., 1972; Trivers, 1972). Consequently,males usually have potentially higher reproductiverates (Clutton-Brock and Vincent, 1991) and shouldcompete more intensely for mates than females do(Emlen and Oring, 1977). Hence social polyandry,i.e., societies in which two or more male share mat-ings with a single female, should be very rare inmammals, where internal fertilization and the longgestation period give males further opportunities todesert their partner. Deviations from general ruleshave the potential of providing valuable insightsinto ultimate causes of certain patterns and thuscontribute to refine the original assumptions.Within the primate order, polyandry has only bereported from a few human populations (e.g., Crookand Crook, 1988), and from some species within thesub-family Callitrichinae (marmosets and tamarins;e.g., Goldizen, 1987a; Heymann, 1996). Their groups
of 3–12 individuals include adults from both sexes.In females, reproductive success is strongly skewedwithin groups due to the monopolization of breedingby a single female (e.g., French et al., 1989; Garber,1997). The habitual dizygotic twin offspring areraised cooperatively by all or most group membersthrough carrying of and food provisioning to infants(e.g., Goldizen, 1987b; Tardif et al., 1993). Thesesmall Neotropical primates show highly flexible pat-terns of social organization and mating (for a recentreview, see Heymann, 2000).
It is well-known, however, that neither the socialorganization (who lives with whom) nor the social
Grant sponsor: DFG; Grant number: HE 1870/10-1,2.
*Correspondence to: Maren Huck, Deutsches Primatenzentrum,Kellnerweg 4, D-37077 Gottingen, Germany.E-mail: [email protected]
Received 26 March 2004; accepted 3 June 2004.
DOI 10.1002/ajpa.20136Published online 28 December 2004 in Wiley InterScience (www.
interscience.wiley.com).
AMERICAN JOURNAL OF PHYSICAL ANTHROPOLOGY 127:449–464 (2005)
© 2004 WILEY-LISS, INC.

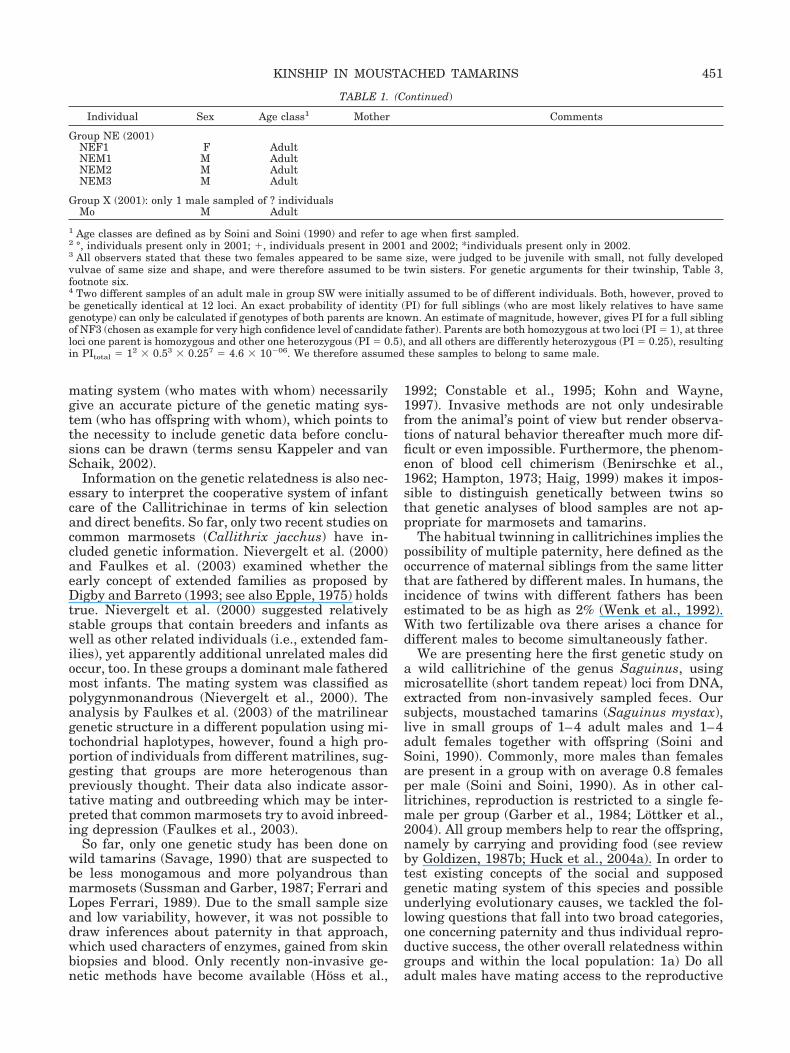
TABLE 1. Composition of two study groups (in bold) and neighboring groups, with year of sample collection in parentheses
Individual Sex Age class1 Mother Comments
Group W (2001)WF1 F AdultWF2 F Adult Emigrated before onset of studyWM1 M AdultWM2 M AdultWM3 M AdultWM4 M Juvenile WF2 Born February 22, 2000; twin brother to WM5WM5 M Juvenile WF2 Born February 22, 2000; twin brother to WM4WM6 M Infant WF1 Born February 24, 2001
Group WW (2003; territory of former group W)WWF3 F Adult Immigrated December/2001 (still old group)WWM7 M Adult Immigrated February/2003WWM8 M Adult Immigrated February/2003WWM9 M Juvenile Born end of 2002; immigrated February/2003
Group E (2001–2003)EF1 F AdultEF2 F Adult Emigrated in September/2001EF3 F Adult Emigrated in September/2001EM1 M Adult Disappeared in October/2002EM2 M AdultEM3 M Adult Disappeared in October/2002EM4 M Juvenile EF1 Born May/2000; twin-brother to EM5EM5 M Juvenile EF1 Born May/2000; twin to EM4; disappeared November/2000EM6 M Infant EF1 Born January 21, 2001; twin brother to EF4EF4 F Infant EF1 Born January 21, 2001; twin sister to EM6EM7 M Infant EF1 Born January/2002; twin brother to EM8EM8 M Infant EF1 Born January/2002; twin brother to EM7EM9 M Infant EF1 Born November/2002
Group N (2001–2003)NF1 F AdultNF2 F Subadult Born beginning of 2000NM1 M AdultNM2 M Juvenile NF1 Born beginning of 2001WM1(n) M Adult Immigrated in December/2001 from group WWM4(n) M Then adult WF2 Immigrated in December/2001 from group WNF3 F Infant NF1 Born beginning of 2002NM3 M Infant NF1 Born September/2002
Group S (2001/2002)2
SF1� F AdultSF2� F AdultSF3° F Subadult? Born beginning of 2000SM1� M AdultSM2° M AdultSM3° M Subadult? Born beginning of 2000SM4° M Juvenile Born beginning of 2001S10° ? ?SF4* F AdultSF5* F Juvenile Born 2002SM5* M AdultSM6* M AdultSM7* M Juvenile Born 2002
Group SW (2001; contained 2 adult females, 2 adult males, 2 juvenile females, 1 infant, and 1 of unknown age and sex)SWF1 F AdultSWF2 F (Sub?)adultSWF3 F Juvenile Born beginning of 2000; assumed twin of SWF43
SWF4 F Juvenile Born beginning of 2000; assumed twin of SWF33
SWM14 M AdultSW5 ? ?SW7 ? ? Probably infant (born beginning of 2001)SW10 ? ?
Group Wa (2001)WaF1 F AdultWaF2 F Adult(WaF3) F Adult No sampleWaF4 F Juvenile Born beginning of 2001WaM1 M AdultWaM2 M Adult
(continued)
450 M. HUCK ET AL.
mating system (who mates with whom) necessarilygive an accurate picture of the genetic mating sys-tem (who has offspring with whom), which points tothe necessity to include genetic data before conclu-sions can be drawn (terms sensu Kappeler and vanSchaik, 2002).
Information on the genetic relatedness is also nec-essary to interpret the cooperative system of infantcare of the Callitrichinae in terms of kin selectionand direct benefits. So far, only two recent studies oncommon marmosets (Callithrix jacchus) have in-cluded genetic information. Nievergelt et al. (2000)and Faulkes et al. (2003) examined whether theearly concept of extended families as proposed byDigby and Barreto (1993; see also Epple, 1975) holdstrue. Nievergelt et al. (2000) suggested relativelystable groups that contain breeders and infants aswell as other related individuals (i.e., extended fam-ilies), yet apparently additional unrelated males didoccur, too. In these groups a dominant male fatheredmost infants. The mating system was classified aspolygynmonandrous (Nievergelt et al., 2000). Theanalysis by Faulkes et al. (2003) of the matrilineargenetic structure in a different population using mi-tochondrial haplotypes, however, found a high pro-portion of individuals from different matrilines, sug-gesting that groups are more heterogenous thanpreviously thought. Their data also indicate assor-tative mating and outbreeding which may be inter-preted that common marmosets try to avoid inbreed-ing depression (Faulkes et al., 2003).
So far, only one genetic study has been done onwild tamarins (Savage, 1990) that are suspected tobe less monogamous and more polyandrous thanmarmosets (Sussman and Garber, 1987; Ferrari andLopes Ferrari, 1989). Due to the small sample sizeand low variability, however, it was not possible todraw inferences about paternity in that approach,which used characters of enzymes, gained from skinbiopsies and blood. Only recently non-invasive ge-netic methods have become available (Hoss et al.,
1992; Constable et al., 1995; Kohn and Wayne,1997). Invasive methods are not only undesirablefrom the animal’s point of view but render observa-tions of natural behavior thereafter much more dif-ficult or even impossible. Furthermore, the phenom-enon of blood cell chimerism (Benirschke et al.,1962; Hampton, 1973; Haig, 1999) makes it impos-sible to distinguish genetically between twins sothat genetic analyses of blood samples are not ap-propriate for marmosets and tamarins.
The habitual twinning in callitrichines implies thepossibility of multiple paternity, here defined as theoccurrence of maternal siblings from the same litterthat are fathered by different males. In humans, theincidence of twins with different fathers has beenestimated to be as high as 2% (Wenk et al., 1992).With two fertilizable ova there arises a chance fordifferent males to become simultaneously father.
We are presenting here the first genetic study ona wild callitrichine of the genus Saguinus, usingmicrosatellite (short tandem repeat) loci from DNA,extracted from non-invasively sampled feces. Oursubjects, moustached tamarins (Saguinus mystax),live in small groups of 1–4 adult males and 1–4adult females together with offspring (Soini andSoini, 1990). Commonly, more males than femalesare present in a group with on average 0.8 femalesper male (Soini and Soini, 1990). As in other cal-litrichines, reproduction is restricted to a single fe-male per group (Garber et al., 1984; Lottker et al.,2004). All group members help to rear the offspring,namely by carrying and providing food (see reviewby Goldizen, 1987b; Huck et al., 2004a). In order totest existing concepts of the social and supposedgenetic mating system of this species and possibleunderlying evolutionary causes, we tackled the fol-lowing questions that fall into two broad categories,one concerning paternity and thus individual repro-ductive success, the other overall relatedness withingroups and within the local population: 1a) Do alladult males have mating access to the reproductive
TABLE 1. (Continued)
Individual Sex Age class1 Mother Comments
Group NE (2001)NEF1 F AdultNEM1 M AdultNEM2 M AdultNEM3 M Adult
Group X (2001): only 1 male sampled of ? individualsMo M Adult
1 Age classes are defined as by Soini and Soini (1990) and refer to age when first sampled.2 °, individuals present only in 2001; �, individuals present in 2001 and 2002; *individuals present only in 2002.3 All observers stated that these two females appeared to be same size, were judged to be juvenile with small, not fully developedvulvae of same size and shape, and were therefore assumed to be twin sisters. For genetic arguments for their twinship, Table 3,footnote six.4 Two different samples of an adult male in group SW were initially assumed to be of different individuals. Both, however, proved tobe genetically identical at 12 loci. An exact probability of identity (PI) for full siblings (who are most likely relatives to have samegenotype) can only be calculated if genotypes of both parents are known. An estimate of magnitude, however, gives PI for a full siblingof NF3 (chosen as example for very high confidence level of candidate father). Parents are both homozygous at two loci (PI � 1), at threeloci one parent is homozygous and other one heterozygous (PI � 0.5), and all others are differently heterozygous (PI � 0.25), resultingin PItotal � 12 � 0.53 � 0.257 � 4.6 � 10�06. We therefore assumed these samples to belong to same male.
KINSHIP IN MOUSTACHED TAMARINS 451

female of the group? 1b) How is paternity distrib-uted across males in a group? 1c) Can polyandrousmating lead to multiple paternity? 2a) Are non-pa-rental animals (potential helpers) more closely re-lated to the breeders and their offspring than to thepopulation mean? 2b) Are mating partners unre-lated or even less related than the population mean?
METHODS
Study site, population, and sample collection
This study was part of a Ph.D. project of the firsttwo authors on the behavioral and endocrine mech-anisms of the mating system and their genetic con-sequences in moustached tamarins (S. mystax).Data and fecal samples were collected at the Esta-cion Biologica Quebrada Blanco (EBQB) in north-eastern Peru from January–December 2001. At4°21� S and 73°09� W and at an altitude of about120 m above sea level, the site is located in primevalAmazonian Lowland forest. For further details ofthis site, see Heymann (1995).
We studied two groups of wild, well-habituatedmoustached tamarins containing seven (group W)and nine (group E) individuals respectively(Table 1). The monkeys were under regular observa-tion since May 1999 (group W) and January 2000(group E) and were known individually by naturalmarkings. Although it was not possible to identifyindividuals under every circumstance, they had suf-ficient characteristics (scars in the ears, broken tailsor fingers, pigmentation of the genitals) to allowsure identification when the relevant character wasvisible. They had never been captured and handled,and therefore did not seem to be particularly dis-turbed by the continuous presence of one to threehuman observers (compared to nonhabituatedneighboring groups). Both groups were followeddaily (7 days a week) from the animals’ leaving fromtheir sleeping tree at dawn (about 06:00 h) to theirentering a new sleeping site at about 15:45 h. Dur-ing a total of 3,004 (group W) and 3,257 (group E)contact hours on 330 and 351 days, respectively,observations of sexual interactions (especially copu-lations) were recorded opportunistically (behaviorsampling sensu Martin and Bateson, 1993). Forsome litters, the mother was known because she wasseen pregnant and lactating after birth. For theseinfants the mother is stated in Table 1.
At least three fecal samples of each individual inboth study groups were collected and kept in DMSObuffer in twist-off PE tubes. Some additional sam-ples were stored in 96% ethanol. Of each individualof our main study groups we had at least one un-doubtedly identified sample, i.e., a sample that wascollected from an unequivocally identified individ-ual, and where the place the sample fell had beenseen clearly (“A-samples”). Other samples were col-lected when the (identified) individual was furtherof, so that the sample had to be searched (oftenfound with the help of flies and dung-beetles;“B-
samples”). A few samples (“C-samples”) were col-lected when we were in doubt of the true identity ofthe individual. In neighboring groups, we knew atleast the sex and relative age class (adult or imma-ture) of the individual a sample stemmed from. Sex-classes of adult individuals were always correctlyidentified. In some groups it was not possible tounequivocally distinguish between (for example)three adult males in a group. We knew, however,always the number of individuals of each sex-ageclass. We therefore collected several samples ofadult males, for example. When in the followinganalyses (see below) we found among the samplesthree different allele patterns we were sure to havesampled all (e.g.) three males. A total of 86% of allsamples was assigned correctly to the assumed in-dividuals. This figure includes “C” samples. The pro-portion of correctly assigned “A” and “B” sampleswas 91%. “A” samples were never falsely assigned.
PE tubes were labeled (date, time, individual,record number, and whether it was an “A,” “B,” or“C” sample) and sealed with Parafilm�. They werekept for up to three weeks at ambient temperature(i.e., 20–30°C) and were then stored in a refrigeratorat 4°C. Back in Germany, the samples were frozenat �20°C until further use. Different storage condi-tions might have an effect on sample integrity. How-ever, for several individuals we had two or moredifferent samples spanning the whole study period.Results were always consistent between these sam-ples.
Additional feces were collected from neighboringgroups, several infants born in 2002/2003, andnewly immigrated individuals between September–December 2001 and between December 2002–April2003, and stored as described above. The samples ofneighbors were collected by an experienced field as-sistant who followed the respective groups severalweeks until he knew individuals well enough to col-lect feces from identified individuals. In total weobtained samples from 62 tamarins. For details ofgroup compositions see Table 1. The known and theestimated home ranges of all groups are depicted inFigure 1 that also shows, which groups were neigh-bors. A human sample was collected as well andtreated like the others in order to see whether con-tamination of the sample with human DNA couldpose a problem. It showed no interpretable results in9 of 12 loci. In two loci (SB 8 and SO 252) we foundalleles with similar lengths to those of S. mystax(Table 2). In one (SB 24) the alleles were shifted by1 bp and thus could not be confounded with thetamarins’ samples. We are confident that we ampli-fied S. mystax loci (Table 2) since firstly, sampleswere never touched and did not come in contact withhuman clothing etc.; secondly, we would have no-ticed contamination with human DNA at locus SB24 due to the shift by 1 bp; and thirdly, we often usedseveral samples for each individual (on average 2.2),which gave consistent results.
452 M. HUCK ET AL.

Genetic analyses
For extraction of nuclear DNA from fecal sampleswe used the QIAamp� DNA Stool Mini Kit (Quiagen,Hilden, Germany), following the protocol for isola-tion of DNA from stool given in the handbook withsome modifications and executing all optional steps:we added only half a tablet inhibitEx to each sam-ple, and for dissolving the DNA in the final step weused millipore water instead of the provided buffer.Extracts were stored at �18°C until analysis startedand at 4°C during the weeks of analyses in order toavoid damage of the DNA by repeated freezing andthawing.
In total, 19 primer pairs originally designed foramplification of microsatellite loci in Saguinus bi-color, S. oedipus, and Callithrix jacchus (Bohle andZischler, 2002; Bohle et al., unpublished data; Niev-ergelt et al., 1998) were tested for applicability to S.mystax. Some failed to show alleles (SB 10afor/10irev, SB 37, SB 31i), were not variable (CJ 1) orgave inconsistent results (SB 28, SO 288). In the endeach sample was amplified with 12 primer pairs(Table 2). One primer of each pair was labeled withinfrared fluorescent dye (IRD 800).
Hot-start PCR was performed as described inBohle and Zischler (2002). Depending on the quan-tity of the extracted DNA between 1–10 �l (usually2 �l) of the extract were used for 35–50 cycles in aBiometra� Thermocycler. PCR for primers SB 2,SB 8, and SO 252 was done with 40 cycles. SB 38had to be reamplified: First, 25 PCR cycles wereperformed with both primers unlabeled. One micro-liter of unlabeled PCR product was then used astemplate for another 25 cycles of PCR with oneprimer labeled. With the remaining primers DNAwas amplified in 35 cycles. The DNA was denaturedat 92°C in an initial step for 60 sec and in all follow-ing steps for 45 sec. The annealing temperature for
primers SB 2, SB 8, SO 252, and SB 38 was set at45°C for 60 sec, for the remaining primers temper-ature was set at 50°C for 60 sec. Elongation tookplace at 72°C for 15 sec, and at 77°C for 60 sec in thefinal step.
One and a half microliters of the PCR productswere denatured for 2 min at 90–95°C and loadedonto a 10% acrylamide gel and detected on a LI-COR4000 DNA laser sequencer (MWG Biotech) alongwith a labeled standard (LI-COR STR marker 800).In order to keep scoring errors low, we used a mul-tiple tube approach (Taberlet et al., 1999; Taberletand Luikart, 1999) with at least four to seven re-peats (derived from independent PCRs and oftendifferent samples of the same individual) for ho-mozygots and in most cases at least two repeats forheterozygots. Genotypes were scored manually us-ing the Microsoft Photoshop software.
Parentage and kinship analyses
Parentage likelihood analyses were performed us-ing CERVUS 2.0 software (Marshall et al., 1998).Indices of relatedness between all individual dyadswere calculated with Relatedness 5.0.8 software(Queller and Goodnight, 1989). In total, the geno-types of 62 individuals at 12 loci were utilized.
The results of the electrophoresis were scored in-dependently by two of us (PL & MH) and prelimi-nary simulations yielded estimated error rates of0.00%. For these reasons, and because we used themultiple tube approach (see above), the typing errorrate was set at a relatively low level of 0.01%.
CERVUS estimates the critical values of its sta-tistics (see below) and the resolving power of the lociby generating pairs of parental and unrelated can-didate parent genotypes. It then produces an off-spring by Mendelian sampling of these hypotheticalparents’ alleles. Finally the program compares the
TABLE 2. Summary statistics of used microsatellite loci1
Locus AllelesSize range (bp)
in S. mystaxFound in
Homo sapiens HE HO
HW,�2-test PE1 PE2
SB 24 5 208–216 Many bands 0.576 0.548 n.s. 0.171 0.306SB 74 8 114–134 0.773 0.855 n.s. 0.377 0.555SB 84 6 222–232 228/228 0.772 0.742 n.s. 0.369 0.548SB 194 9 198–214 Many bands 0.852 0.902 n.s.2 0.527 0.694SB 244 8 124–140 153/143 0.818 0.918 n.s. 0.465 0.641SB 304 11 92–114 0.852 0.885 n.s.3 0.532 0.698SB 384 10 121–143 0.837 0.919 n.s.3 0.497 0.667SO 2515 5 131–139 0.641 0.677 n.s. 0.217 0.363SO 2525 8 128–144 136/134 0.832 0.790 n.s.2 0.478 0.651SO 2585 2 85–89 0.189 0.210 n.a.2 0.018 0.085SO 2845 8 162–178 0.708 0.726 n.s. 0.317 0.506CJ 126 4 140–146 0.652 0.710 n.s. 0.223 0.374Mean 7 0.708 0.740 0.996 0.999
1 HE, expected heterozygosity; HO, observed heterozygosity; n.s., not significant; n.a., not available; PE1, estimated exclusion proba-bility for an individual with one alleged parent; PE2, estimated exclusion probability for an individual with one confirmed and onealleged parent.2 Hardy-Weinberg (HW) equilibrium �2-test done with minimum expected frequency � 3.3 HW equilibrium test done with minimum expected frequency � 4.4 Origin: Saguinus bicolor, Bohle and Zischler, 2002.5 Origin: Saguinus oedipus, Bohle et al., unpublished data.6 Origin: Callithrix jacchus, Nievergelt et al., 1998.
KINSHIP IN MOUSTACHED TAMARINS 453

likelihoods of these true parents against the likeli-hood of parentage of each of the unrelated candidateparents for a large number of random offspring.Preliminary analyses of relatedness revealed thatgroups often contained adult relatives of the allegedparents (on average 1.5 for males and 1.1 for fe-males). In the advanced conditions of the final sim-ulations the value for included relatives, related tothe candidate parent, was set to “one” for mothersand to “two” for fathers with r � 0.5 in both cases.The program then calculates the ratio of the likeli-hoods that a given male from the real population isor is not the true father. The ratios of all loci arethen multiplied and log transformed (base e), givingthe LOD score (Marshall et al., 1998). These arecompared across candidate parents. Positive scoresindicate that the individual is more likely to be thetrue parent than a randomly chosen animal. Theindividual with the highest LOD score is (withoutfurther knowledge of group composition, age, etc.)considered to be the most likely parent. The differ-ence between its LOD score and the score of the nextlikely candidate is defined as the Delta statistics (�).The significance of � is assessed by the simulation,setting relaxed confidence limits at 80% and strictlimits at 95%.
Evidently, with 62 individuals we did not obtainsamples from all potential parents in the population.CERVUS considers this incomplete sampling whencalculating the simulations: We ran 100,000 simu-lations under the assumption that 44.4% of the can-didate fathers and 47.6% mothers were sampled.This value was obtained assuming that each groupcontained on average three adult males and twoadult females (calculated on base of our knowledgeof group composition in the population, the exactvalues are 2.54 average males and 1.67 females) andhad 20 direct and second next neighboring groups(Fig. 1). We further assumed extra-group copula-tions or immigrations among individuals that had totravel through more than one “hostile” territory to
be rather unlikely, since the results of Faulkes et al.(2003, for C. jacchus) and Goldizen et al. (1996, forS. fuscicollis) indicate that dispersal over long dis-tances apparently did not occur (but see Dawson,1977, describing one male (of several that wanderedless) migrating about 6.5 km). Hence three averagemales (or two females) in 21 groups (including theone of the offspring) give a “possible father (mother)population” of 63 (42), which means a proportion of0.444 (0.476) when 28 males (20 females) are sam-pled. We do not believe these proportions to begrossly overestimated but rather believe them to beconservative since we showed elsewhere (Lottker etal., 2004) that groups are often stable over severalyears and roaming individuals were rarely observedand, if noticed by the monkeys, harassed away im-mediately (personal observation by M.H., P.L., andE.W.H.).
Since for the older juveniles in group E and mostoffspring of neighboring groups mothers were notknown, we first performed an analysis for possiblemothers. We included the ten infants with knownmothers in order to get an estimate of the R-values(see Table 7) and confidence levels (see Table 3) inknown mother-offspring dyads. Afterwards pater-nity was analyzed including the data of the con-firmed mothers. If several females were possible asmother for a given offspring (i.e., had no mismatchesand/or high LOD scores) up to three analyses offatherhood were performed assuming each time adifferent alleged mother.
In order to assess whether parent-offspring rela-tionships existed between individuals that had beenadults when sampled, all 62 individuals (and notonly the 23 immatures) were included in the off-spring file. In the candidate mother and accordinglyfather files, all individuals from both study groupsand neighboring groups that were fully mature wereincluded. Subadults were included as well, since thedifference between this age class and adults is not aclear-cut one and we were well aware of possiblemisjudgments.
Parentage assessment focused on exclusions (mis-matches) and, if more than one individual could notbe excluded, LOD scores were used to identify themost likely parent. In ambiguous cases we inte-grated further information, trying to find the mostparsimonious explanation (see footnotes in Table 3for more details). As suggested by Blouin (2003; seealso Thompson, 1991), we additionally used the“identity by descent coefficients” to assess the rela-tive probabilities of certain relationship categories(like parent-offspring, full-sibling, and half-sibling).The authors point out that in an outbred populationparent-offspring dyads share at all loci exactly oneallele identical by descent. In contrast, full siblingsshare on average on 25% of their loci no alleles, on50% they share one, and on 25% both. While a singlemismatch already excludes the possibility of a par-ent-offspring relationship, the finding of “no mis-matches” does not allow to conclude unequivocally
Fig. 1. Home ranges of study and neighboring groups. Griddepicts paths of site.
454 M. HUCK ET AL.

that a dyad consists of a parent-offspring ratherthan a sibling or even half-sibling pair. We thereforeassessed for some relationship categories (parent-offspring, full-siblings, half-siblings, and the popu-
lation mean) the average R-values, number of mis-matches, and number of loci at which both alleleswere shared (k2-loci; see Blouin, 2003; Thompson,1991). In ambiguous cases these average values
TABLE 3. Most likely parents for all infants, with known mothers underlined1
OffspringCandidate
mother Candidate fatherConfidence level,
mother/fatherProbability of
exclusion Comments and additional hints
Group SWWM4 WF2 WM1 */* 0.998 All other males do not match in combination with motherWM5 WF2 WM1 */* 0.998 All other males do not match in combination with motherWM6 WF1 WM1 */* 0.995 All other males do not match in combination with mother
Group WWWWM9 SWF2 NM1 */* 0.999 Mm with all other individuals:2
Group EEM1 EF1 EM3 (or WM3) �/� 0.913 EM3 was resident;3 WM3 probably younger than EM1,
but cannot be excluded4
EF2 EF1 EM3 �/* 0.978 3EF3 EF1 EM3 �/* 0.978 3EM4 EF1 EM3 */* 0.979 Mm with all other females, all other males do not match
in comb. with motherEM5 EF1 EM3 �/� 0.944 All other males do not match in comb. with motherEM6 EF1 EM3 �/* 0.986 All other males do not match in comb. with motherEF4 EF1 EM3 �/* 0.996 All other males do not match in comb. with motherEM7 EF1 EM3 �/* 0.992 All other males do not match in comb. with motherEM8 EF1 EM3 */* 0.977 All other males do not match in comb. with motherEM9 EF1 EM3 �/* 0.992 All other males do not match in comb. with mother
Group NNF2 NF1 NM1 */* 0.998 Mm with all other individualsNF3 NF1 NM1 �/* 0.998 Mm with all other individualsNM2 NF1 NM1 */� 0.994 Mm with all other individualsNM3 NF1 WM1 (or WWM7) �/� 0.966 LOD lower for WM1, WM1 was resident male4
Group SSM3 SF1 SM2 �/* 0.999 Mm with all other individualsSM4 SF1 SM1 */* 0.995 Mm with all other individualsSF2 SF1 SM2 */* 0.994 Mm with all other individuals5
SM6 SF1 SM2 */* 0.998 Mm with all other individualsSF5 SF1 SM2 �/* 0.990 Mm with all other individuals
Group SWSWF3 SWF1 SWM1 */* 0.995 Mm with all other individualsSWF4 SWF1 # �/ 0.999 No Mm to SWF2; no father found with SWF2 as mother
either6
SW7 SWF1 SWM1 �/* 0.993 SW10 also possible mother or father7,8
Group WaWaF1 WaF2 WaM2 */* 0.996 All other males Mm in combination with WaF29
WaF4 WaF2 WaM2 �/* 0.999 Mm with all other individualsWaM1 WaF2 WaM2 �/* 1.000 In combination with WaF1 Mm to WaM2, Mm with all
other males9
1 Confidence levels: *95%; �, 80%; �, 80%. Ambiguous results are written in italics. Twins are framed together (known twins, solidlines, alleged twins, broken lines). Mm, mismatch(es); comb., combination.2 Sample of WWM9 was collected in 2003, of NM1 in 2001. NM1 disappeared from his group in December 2001.3 Theoretically different models could be possible. But only in this combination all individuals (except EM2) of this group have bothmother and father. If EF2 were mother, no father for EF1, EF3, and EM3 is found. If EF3 were mother, no father for EF1 and EM1is found. Additionally, EF1 is known mother of all subsequent infants. Hence, scenario with EF1 and EM3 as parents is mostparsimonious explanation.4 Though a nonresident male cannot be excluded as father, resident is more likely father. Firstly, he has more mating opportunities.Secondly, relatedness values (cf. Appendix B) of EM1 to EM3 (R � 0.50) and NM3 to WM1 (R � 0.51) resemble more typicallyparent-offspring dyads than those of EM1 to WM3 (R � 0.28) and NM3 to WWM7 (R � 0.39). (Half-siblings often have no mismatches(on average, 0.8 for full siblings and 1.5 for half-siblings; Table 7), and we suppose alleged nonresident father to be a (half-)brotherrather than true father. In this case, number of k2-loci (see Table 7) cannot help distinguish between half-siblings and parent-offspringpairs (numbers of k2-loci for EM1-EM3, EM1-WM3, NM1-WM1, and NM1-WWM7 are 4, 2, 5, and 2, respectively).5 Since ages are not known, two scenarios are possible: SF2 could be mother of SF1, or other way around. Only possible father of SF1with SF2 as mother has 1 Mm in that combination. If SF2 were mother (not daughter) of SM2, no father for SM2 is found.6 SWF3 and SWF4 were assumed to be twin sisters; cf. Table 1. Though SWF2 cannot be excluded as mother for SWF4, this is highlyunlikely. Firstly, SWF2 was probably only subadult herself (though estimation of age is difficult). Secondly, SWF4 had only threek2-loci (see Table 7 for explication) with SWF1, but four with SWF2. It is therefore more likely that SWF1 was mother of SWF4 thanthat she was her sister, while sisterhood for SWF2 is not unlikely. Thirdly, until now, no incidence of successful simultaneous breedingof two females was reported for wild moustached tamarins (Smith et al., 2001; Lottker et al., 2004). A later immigration of SWF4 ata very early age (she had been juvenile when first seen in that group) also seems improbable. SWF3 and SWF4 therefore are likelyto have same mother.7 Since age and sex of SW5, SW7, and SW10 are not known, it is difficult to assess relationship. It is assumed that SWF1 and SWM1are parents rather than offspring to these (for probable relationship to notably younger SWF3). No identified sample of group’s infant(known to be present) was collected, so one unidentified sample is probably infant’s (presumably SW7).8 SW7 has no Mm to SW10, but if SW10 were assumed to be mother, SWM1 (and all other males) has Mm in combination.9 Ages of WaF1, WaF2, WaM1, and WaM2 are not known. If WaM1 was father, WaM2 could not have been son to either WaF1 orWaF2. Likewise, if WaF1 was mother, no father could be found for WaF2, WaM1, or WaM2. Again, most parsimonious explanation isthat WaF2 and WaM2 are parents. Additionally, WaF2 and WaM2 are most probable parents of WaF4.
KINSHIP IN MOUSTACHED TAMARINS 455

were then compared with the values of dyads inquestion to evaluate which possibility is more likely.
For the calculation of indices of relatedness (R)(sensu Queller and Goodnight, 1989) the calculatedallele frequencies were corrected for a bias due topossibly higher average relatedness within groups.This assumption was supported by the results of thepaternity analyses. Therefore all dyads within eachgroup were excluded from the calculation of frequen-cies.
Statistics
The program CERVUS gave estimates of het-erozygosity and probability of exclusion (PE). It fur-ther calculated Hardy-Weinberg equilibrium tests(�2 test) for each locus. The minimum expected fre-quency was set at the default level of 5 in most locibut at 3 or 4, where the �2 test would not have beenpossible otherwise. Since each individual enters intovarious R-values, independence of all values cannotbe assumed (see Supporting Online Material inBaglione et al., 2003). (If female 1 in a group isrelated to female 2 and female 3, the dyad female 2and 3 will probably also show a high R.) We there-fore used a two-tailed randomization test (SsS 1.0b,1998, � Rubisoft Software GmbH) with 10,000 per-mutations to compare R-values of dyads withingroups against between-group dyads (“population”),within-group dyads against between-group dyads offemales and males, within-group dyads of femalesagainst males, and dyads of mating partners againstnon-partners. Mating partners were here defined aspairs that were seen copulating or had offspringtogether (compare Table 3). Significance values wereset at 5%. Before comparing within-group dyadswith between-group dyads for the whole populationwe arranged between-group dyads in ascending or-der and then omitted in a first run every second andin another run every eleventh value. Otherwise, thedata set would have been too large for the statisticalprogram. Since the distribution of between-groupvalues was normally distributed (Kolmogorov-Smirnov test, d � 0.031, P .05) and since we deletedthe same proportion of values in each frequencyclass, this reduced data set will not yield differentresults from the ones the complete set would havedone. Single R-values were judged to differ signifi-cantly from the population mean if they were higherthan a threshold of R � 0.2414 below which 95% ofall R-values of between-group dyads fell (comparelogic of the t-test for single means). Likewise ahigher threshold of R � 0.4067 was calculated belowwhich 99% of all between-group dyads fell.
RESULTS
Mating patterns
Overall, in 2001 twelve copulations were observedin group W and eight in group E during 3004 and3257 hours of observation respectively. In theformer, female WF1 mated with all three adult
males (WM1, WM2, WM3). Female EF1 of group E,the known mother of the infants during the studyperiod, was seen copulating with males EM2 andEM3 but not EM1. The other two females (EF2 andEF3) in this group were never observed to mate withany of the group males. EF3, though, copulated witha male of a neighboring group (Mo, group X) duringan inter-group encounter.
Patterns of paternity
The statistics on the twelve microsatellite loci aresummarized in Table 2. The genotypes of all indi-viduals are given in the Appendix 1. Observed het-erozygosity never deviated significantly from the as-sumed Hardy-Weinberg equilibrium where it waspossible to calculate it. Exclusion probabilities ofover 99% even when only one parent was knownshow that it is unlikely that an unsampled male isthe true father if a sampled males has already beenidentified as sire with high confidence. (The proba-bility of the occurrence of such roamers is incorpo-rated in the calculations of the program, see Meth-ods.) However, in some cases several individualscould have potentially been parent to a given tama-rin. In these cases, additional criteria were used. Asan example how these were used, we will explain thesituation in group E in more detail. Generally, aninfant gets one of its alleles at a heterozygous locusfrom its mother, one from its father. Theoretically, ifone potential parent does not have any of the twoalleles (mismatches � Mm) or only has the allelethat the infant must have from a known parent (Mmin combination with known parent), than this indi-vidual cannot be parent of the infant. Due to typingerrors or mutations this general rule might be vio-lated occasionally. Yet, CERVUS includes this prob-ability in its calculations. In group E three adultmales and females each were present at the begin-ning of the study. The three females (EF1, EF2, andEF3) and two of the males (EM1, EM3) could havebeen father or mother to all others having no mis-matches (except EF1 and EM3 that were unrelated).However, if EF2 were mother, no father for EF1,EF3 and EM3 could be found. If EF3 were mother,no father for EF1 and EM1 could be found, i.e., thepotential infants have mismatches with the allegedfather in combination with this alleged mother.Hence, only the scenario with EF1 and EM3 asparents of the others would result in satisfying par-entage for all other individuals and thus presentsthe most parsimonious explanation.
For two infants (EM1 and NM3) we found twopossible fathers (EM3 or WM3, and WM1 or WWM7,respectively). In both cases, one (EM3 and WM1)was resident of the infant’s group (at the timearound conception and birth) and thus has had moreopportunities than the other to fertilize the female.Furthermore, the relatedness values of the infantsto the resident male resemble more typically parent-offspring dyads than those to the other potential
456 M. HUCK ET AL.

males (see footnote4, Table 3). This interpretation,however, has certainly to be regarded with caution.
Summarizing it can be noted that in four (or threeif the ambiguous case in group E is regarded as anextra-group paternity) out of six groups with morethan one infants only one resident male sired alloffspring over several litters. In two of these fourgroups other adult males unrelated to the breedingfemale were present. For an overview which groupscontained infants, which included additional malesunrelated to the breeding female, whether all in-fants were sired by the same male, and over howmany litters paternity was thus monopolized seeTable 4. Between 67 and 100% of infants within eachgroup had the same father, but only a total of 7.1%of the infants of all groups (14.3%, if in the twoambiguous cases of EM1 and NM3 the non-residentwas assumed to be the father) was not sired by themain breeder. In group S, however, while most off-spring were sired by male SM2, one infant (SM4)was sired by the closely related SM1. Both werepresent in the group when sampled in 2001, and theson of SM1 had both older and younger half-siblingsfathered by SM2. Furthermore, in group SW wepossibly found a case of multiple paternity. For oneof the putative twins SWF3 and SWF4, one of thegroup’s adult males was proposed as a father byCERVUS, while none of all sampled males couldhave sired the alleged twin-sister (see notes3,6 Table1, and note,6 Table 3). The R-value for the two of0.26 (see Appendix B) suggests that their fatherswere probably not closely related. Whether SWF4’sfather had emigrated or died before sampling orwhether she was sired in an extra-group copulationcannot be decided. Thus, in one out of five (1 puta-tive and 4 confirmed) twin pairs two males probablyshared paternity.
Patterns of relatedness
Probable relationships between older individualswithin groups are described in Table 5. In sevencases it was not possible to distinguish between par-
ent-offspring and sibling pairs, because the respec-tive relative ages were not known.
Table 6 shows the mean relatedness and standarderrors within the different groups and in the popu-lation. For groups E, N, and S group compositionschanged between years. For these groups we onlycalculated the mean relatedness for individualspresent in 2001. The mean relatedness of individu-als to members of their own group was significantlyhigher than to members of other groups (randomiza-tion test, 10000 permutations, p 0.001; Fig. 2a;Table 6). Mean relatedness within groups washighest at intermediate group sizes and lowest insmall groups (Table 6). Within groups, mean re-latedness of females and males were significantlyhigher than between groups (both randomizationtest, 10000 permutations, p 0.001, Fig. 2b andc). A comparison between mean relatedness of fe-males within groups compared to males withingroups revealed no significant difference (random-ization test, 10000 permutations, p 0.6; compareopen bars of Fig. 2b and c). Two males (NeM1,WWM9) and one female (SF4) were not related toany other group members. Average relatedness toother group members were – 0.09, 0.04, and – 0.15for NeM1, WWM9, and SF4, respectively. MaleEM2 was not very closely related to EM3 (R �0.29) so that his relatedness values to other mem-bers of the group did not differ from the populationmean, i.e., lay within the 95% boundary.
There was no difference between the mean relat-edness of known mating pairs and the mean R ofthese individuals with other adults of the oppositesex in the population (randomization test, 10000permutations, p 0.7; Fig. 2d). The R-values of alldyads are given in the Appendix B.
For known and alleged parent-offspring, full-sib-ling, and half-sibling dyads, as well as for all non-related individuals (i.e., all dyads that fall below the95% threshold level of R � 0.2414) we give inTable 7 the mean R-values, the average number ofmismatches (Mm) over the 12 loci, and the number
TABLE 4. Group composition regarding number of infants, presence of multiple adult males, and paternity of infants
Group No. of offspring No. of littersNo. of unrelated
males1No. of infants sired
by main breeder
W 3 2 3 32
WW 3E 103 6–74 3 10 (or 9)5
Na 3 3 1 3Nb 1 1 2 1 (or 0)5
S 59 3–54 2 4SW 3 26 2 2Wa 3 2–34 1 3Ne 3
1 Unrelated to breeding female; for R-values, refer to Appendix B. Na, group N before replacement of NM1 by WM1 and WM4; Nb,group N after replacement of NM1 by WM1 and WM4.2 With two different females; all other cases are with same female.3 Includes individuals sampled in 2002 and 2003.4 Exact number of litters not known, since some offspring were already adult.5 Cf. fourth footnote, Table 3.6 Cf. fourth footnote, Table 1.
KINSHIP IN MOUSTACHED TAMARINS 457

TABLE 5. Relatedness between older individuals within groups (not listed in Table 3),with unrelated dyads with relatedness values of r � 0.2414 or lower not included1
Group Individuals R-value Comments
W WF1, WF2 0.50 No Mm; ages not known; probably mother and daughter (only 3 “k2-loci”) orsisters.
WM1, WM2, WM3 0.41–0.52 WM2 has no Mm with WM1 and WM3, and also only 2 and 4 “k2-loci,”respectively; might have been father to WM1 and WM3; WM1 and WM3probably brothers.
E EM2, EM3 0.29 2 Mms; probably half-brothers or uncle-nephew.S SM1, SM2 0.49 No Mm; probably father and son (only 3 “k2-loci”) or brothers; ages not known;
no parents found.SM5, SM1, SM2,SM6, SM7
0.35–0.74 At least 1 Mm (except SM1–SM2).
SM7, SM1 0.51 No Mm; SM7 is younger and could be son (only 3 “k2-loci”) or brother of SM1.SW SWF1, SWF2 0.44 No Mm; SWF2 appeared to be younger, probably daughter (only 3 “k2-loci”) or
sister of SWF1.SW5, SW7, SW10 0.29–0.59 Age and sex not known. SWF1 and SWM1 probably rather parents than
offspring to these (for probable relationship to notably younger SWF3). Noidentified sample of group’s infant was collected, so one unidentified sampleis infant’s (supposedly SW7). SW7 has no Mm to SW10, but if SW10 wereassumed to be mother, SWM1 (and all other males) has Mm in combination.
SW10, SWF1 0.60 No Mm; five “k2-loci”; SW10 probably infant or sibling to SWF1; but see above.Ne NeM2, NeM3 0.44 1 Mm; 4 “k2-loci”; probably brothers.
1 Mm(s), mismatch(es). “k2-loci” refer to number of loci where dyads share both alleles (refer also to Table 7).
Fig. 2. Frequencies of R-values. a: Between-group (solid bars, mean � �0.03, N � 751) and within-group (open bars, mean � 0.31,N � 161, P 0.001) dyads. b: Female between-group (solid bars, mean � �0.06, N � 110) and within-group (open bars, mean � 0.38,N � 10, P 0.001) dyads. c: Male between-group (solid bars, mean � �0.02, N � 175) and within-group (open bars, mean � 0.34, N �15, P 0.001) dyads. d: Dyads of mating partners (solid bars, mean � �0.06, N � 13) and nonmating partners (open bars, mean ��0.03, N � 303, P 0.7). All randomization test.
458 M. HUCK ET AL.

of loci at which dyads share both alleles (k2-loci).The mean R-values correspond well to the theoreti-cal coefficient of relatedness r of 0.5 for parents andsiblings and 0.25 for half-siblings. The results showthat it is often difficult to distinguish between sib-lings and parent-offspring pairs if respective agesare not known, since 26 out of 59 sibling pairs (44%)had no mismatches. As a rough estimate, we calcu-lated that with the given mean heterozygosity of0.74 one would need at least 17 loci to be nearlyalways able to distinguish between these relation-ships. A further point noteworthy is that all unre-lated dyads had at least one mismatch, whichstrengthens the assumption that it is unlikely thanan actually unrelated individual is falsely assumedto be a parent. In the number of k2-loci there was agreat overlap between relationship categories. Sinceall parent-offspring dyads share both alleles on oneto six loci while siblings share both alleles on four toeleven loci, values lower than four indicate that aparent-offspring relationship is more probable andvalues greater than six suggest a sibling relation-ship. Values between four and six are ambiguous.We are aware, however, that these data can only beused to strengthen (or weaken) assumptions madebecause of other facts. They do not provide reliablemeans to differentiate between different relation-ship categories, since the typical parameters (e.g. anR of 0.5 for siblings or 25% k2-loci) are averagevalues that can vary considerably.
DISCUSSIONMating patterns
While Nievergelt (2000) and Digby (1999) foundlittle evidence for polyandry in common marmosets,
the behavioral data of this study show that the so-cial mating system of the moustached tamarins atthe EBQB is polyandrous, as has been reported forseveral tamarin species before (review in Heymann,2000). All adult males within the two study groupsmated with the respective female, with the excep-tion of EM1, the probable son of EF1. The latterfinding is unlikely to be caused by lower visibility tothe human observer of that particular male since allindividuals in the two groups were well habituatedand EM1 was even slightly more visible than hisfather EM3 (10.3% compared to 8.7% of observationtime, unpubl. data). Together with the always lowrelatedness values between mating partners (R 0.1) this points to mechanisms of incest avoidance inwild tamarins.
Paternity
Despite matings of the breeding female with sev-eral group males, in the seven groups with infants(counting group N after the replacement of theformer resident and immigration of two new malesas a different group) the same resident male sired92.9% of the infants of a group (85.7%, if in the twoambiguous cases of EM1 and NM3 the non-residentwas assumed to be the father). Put in other words,only two (or four) out of 28 infants were not sired bythe main breeder.
Apart from mating with multiple males within agroup, extra-group copulations may likewise occur.While Terborgh and Goldizen (1985) never saw ex-tra-group copulations in S. fuscicollis, it was ob-served in a different population of the same species(Tirado Herrera, personal communication to Hey-mann, 2000) and in C. jacchus (Hubrecht, 1985;
TABLE 6. Mean relatedness and standard error within groups and in population
Group WW NE Wa N S W SW E Population
N (individuals) 4 4 5 5 8 8 8 10 62N (dyads) 6 6 10 10 28 28 28 45 1,640Mean 0.0609 0.0639 0.4637 0.5117 0.2283 0.2320 0.3542 0.3766 �0.0335SD 0.2062 0.2130 0.1753 0.2105 0.2391 0.2430 0.1805 0.2062 0.1608
TABLE 7. Average R-value, number of mismatches (Mm), and number of loci where dyads shareboth alleles (k2-loci) for different categories of relatedness1
Offspring/k. mothers
Offspring/a. mothers
Offspring/a. fathers
Betweenfull sibs
Betweenhalf sibs
Betweennonrelated
N 10 19 30 592 14 1,560R (mean) 0.483 0.484 0.467 0.508 0.282 �0.053R (SD) 0.088 0.072 0.074 0.166 0.123 0.139R (median) 0.508 0.476 0.467 0.526 0.257 �0.050Mm (mean) 0 0 0 0.814 1.500 4.547Mm (SD) 0 0 0 0.880 1.092 1.502Mm (median) 0 0 0 1 1 4Mm (range) 0 0 0 0–3 0–4 1–10k2-loci (mean) 3.4 3.7 3.1 6.2 2.9k2-loci (SD) 1.174 1.336 1.081 1.751 1.292k2-loci (median) 4 4 3 6.5 3k2-loci (range) 1–5 1–6 1–5 4–11 1–6
1 k., known; a., alleged. For parent-offspring and full-sibling dyads, this analysis was done only for dyads with no mismatches.2 In k2-loci analysis, only 26 full-sib dyads (all with no mismatches) were used.
KINSHIP IN MOUSTACHED TAMARINS 459

Digby, 1999), and S. mystax (this study), though weobserved it only once in a non-reproductive female.Given that inter-group encounters tend to be rathertumultuous, an underestimation of extra-groupmatings is possible. With the occurrence of extra-group matings, the chance of multiple paternity isadditionally heightened. The occurrence of aggres-sive herding of the female of the own group duringinter-group encounters in S. mystax and S. fuscicol-lis (Heymann, 1996) also suggest that there is a riskof loosing paternity to extra-group males.
The sample size of offspring (28, not countingWWM9 who was sired before group formation) ingeneral and confirmed twin pairs (four or five, cf.footnote 3, Table 1) in particular is too small to allowinferences about the true incidence of successful ex-tra-group matings and multiple paternity. Yet thefact that we probably found the latter at all withonly five twin pairs suggests that it is not uncom-mon.
Relatedness
Theoretical considerations, as the supposedlyhigher migration rate of tamarins compared to mar-mosets, led some authors to predict that the relat-edness of group members in tamarins must be rela-tively low (Garber et al., 1984; Sussman and Garber,1987; Ferrari and Lopes Ferrari, 1989). The mous-tached tamarins in our population that belonged tothe same group, however, were in general closelyrelated (mean R � 0.31), a value similar to that ofR � 0.34 found by Nievergelt (2000). In comparison,the average R-value in groups of long-tailed ma-caques (Macaca fascicularis) was 0.1, and withinmatrilines between 0.30 and 0.47 (Ruiter and Gef-fen, 1998). The relatedness in our groups is mainlydue to the relationship between the breeding pair toseveral litters of twins and the kinship among thesiblings. Some adults, though, are rather a brotheror sister to one of the breeders (not adult offspring),which may suggest that individuals migrate occa-sionally with a sibling or take over or inherit aterritory together. Since three individuals (NeM1,WWM9, and SF4) were not related to any othergroup member they (or all others) must have immi-grated.
One reason for the discrepancy to the prediction oflower relatedness in tamarins compared to marmo-sets by Garber et al (1984) could be founded ondeviating migration patterns since our groupsseemed to be fairly stable (Lottker et al., 2004). Thepopulation studied by Garber et al. (1984) had beenrecently introduced to an island. The stress of trap-ping and translocation might have affected groupstability and led to an unusually high migration rate(see Heymann, 1990). This suggestion is supportedby the more stable group composition reported in alater study by Garber et al (1993).
As shown in Table 6, the two medium sized groups(N, Wa) had the highest mean R value (mean overboth groups: R � 0.49). Both these groups consisted
of a breeding pair and their offspring from at leasttwo litters. In contrast, all larger groups (groups S,SW, W, E) contained unrelated or horizontally re-lated animals (siblings to the breeders; cf. to Table5), thus resulting in a lower mean R (average R �0.30). Small groups, i.e., probably newly foundedones (group WW was newly founded, for group NEwe cannot know), however, had the lowest averagewithin-group relatedness (R � 0.06). In these casesone female lived together with three males that werenot all closely related. Whether there are more un-related individuals in the largest groups than inmedium sized groups because the groups are largerand existed for a longer time, or the groups arelarger because additional helpers were helping toraise more infants successfully is not certain. Dataon more groups and long-term data on the samegroup are needed to evaluate whether this repre-sents a true biological pattern or an artifact of smallsample size.
In summary, we found that, though most groupmembers are related, completely unrelated individ-uals do occur. Several mechanisms that are usuallyinvoked to explain the occurrence of polyandrouscommunal breeding systems, seem to play a role inmoustached tamarins and most likely other cal-litrichines, which might explain the unusual flexi-bility in their system.
Outlook and afterthought
The results of this study also shed light on someprevious findings by Smith et al. (2001) andShahuano Tello et al. (2002). Smith et al. reportedallo-nursing of a female tamarin (our WF1) after herown infant had died. This female was distantly re-lated to the suckled infants WM4 and WM5 (R �0.14 and 0.13) and to their dam (our WF2) like amother, daughter or sister, i.e., she was probablyaunt, grandmother, or half-sister to them. In thecase of successful group defense against a Boa con-strictor reported by Shahuano Tello et al, (2002) thetwo most active helpers that rescued the attackedinfant WM5 were the father WM1 and the alreadymentioned female WF1.
Distinguishing between parent-offspring and sib-ling pairs was often impossible since 44% of siblingpairs had no mismatches. In order to differentiatethese relationships, at least 17 loci would have beennecessary. This would hardly be feasible in moststudies. With the additional analysis of mitochon-drial DNA differentiation should be easier at leastfor males (on condition of sufficient variability), be-cause they share the mtDNA with maternal broth-ers but not with their fathers or sons. The inclusionof new methods of pedigree analysis as reviewed byBlouin (2003) can provide additional insights. Moreaccurate knowledge of relationships would be valu-able for drawing conclusions concerning not onlypaternity but also migration and virtually all socialpatterns (for a mtDNA study on C. jacchus seeFaulkes et al., 2003).
460 M. HUCK ET AL.

The proximate mechanisms by which some malestry to monopolize access to the breeding female andby which others try to ensure their membership inthe group and thereby mating opportunities are sub-ject to ongoing analyses. The possibility of endocrineinhibition of subordinate males (Abbott et al., 1992;French and Schaffner, 1995) was not supported forthis population (Huck et al., 2005). While mateguarding seems to play a role in monopolization,direct aggressive competition does not seem to be alikely mechanism (Huck et al., 2004b). The patternsof relatedness described here will influence the pos-sible costs and benefits of helping behavior. Thisrelationship is analyzed in detail in a further study.
(Huck et al., 2004a) These, combined data will shedfurther light on the causes of the rare social systemfound in moustached and other tamarins, therebyhelping to adjust general models on the phenomenonof polyandry and non-maternal infant care.
ACKNOWLEDGMENTS
To be able to present this rather larger data setwould not have been possible without the invaluableassistance of all those who collected samples for usin the field, especially Camilo Flores Amasifuen,Ney, Manuel and Jeisen Shahuano Tello, MarcosOversluijs Vasquez and Jenni Perez Yamacita, butalso Janna Kirchhoff, Britta Muller, and Emerita R.
APPENDIX A. Alleles of 62 moustached tamarins from Estacion Biologica Quebrada Blanco, Peru, at 12 microsatellite loci
2A 2B 7A 7B 8A 8B 19A 19B 24A 24B 30A 30B 38A 38B 251A 251B 252A 252B 258A 258B 284A 284B CJ12A CJ12B
WF1 212 208 130 124 230 222 212 210 138 132 114 102 129 127 135 133 144 140 85 85 174 166 144 140WM6 212 208 128 124 230 226 210 198 132 128 114 94 139 127 137 135 144 138 85 85 172 166 146 140WM1 214 212 128 126 232 226 206 198 136 128 94 94 139 135 137 137 140 138 85 85 178 172 146 140WM2 214 212 128 128 226 222 198 198 136 128 112 94 139 139 137 135 144 140 85 85 178 172 144 140WM3 212 212 128 126 222 222 210 198 136 130 94 94 139 137 137 135 140 134 85 85 172 170 146 140WM4 214 212 130 126 228 226 210 198 136 132 114 94 141 139 137 133 140 140 85 85 174 172 146 140WM5 212 212 130 128 228 226 202 198 138 128 110 94 139 129 137 133 140 140 85 85 178 174 146 144WF2 212 212 130 130 230 228 210 202 138 132 114 110 141 129 137 133 140 140 85 85 174 174 144 140WWF3 214 208 128 114 226 222 212 210 138 132 106 106 137 129 133 131 136 134 85 85 172 166 142 140WWM7 212 212 128 118 232 226 212 198 136 124 110 94 139 131 137 137 140 140 85 85 172 170 140 140WWM8 214 212 128 118 222 222 212 206 130 128 104 94 139 131 137 135 140 134 85 85 172 172 142 140WWM9 216 212 128 122 232 222 208 204 134 128 100 98 139 127 135 135 140 132 85 85 172 168 142 140EF2 212 212 130 122 230 222 210 204 138 130 112 94 137 135 137 135 132 128 89 85 172 166 144 140EF3 214 212 130 122 228 222 210 206 138 130 108 94 137 135 137 135 132 128 89 85 172 166 144 140EM4 214 214 128 126 228 222 210 204 138 130 108 94 137 129 137 135 132 132 89 85 172 170 144 140EM5 214 212 130 128 230 222 210 206 138 130 112 94 137 129 137 135 140 128 85 85 172 166 144 140EF1 214 212 130 126 230 228 206 204 138 130 112 94 137 129 135 135 132 128 89 85 172 172 144 140EM6 212 212 130 128 230 230 210 206 138 130 112 94 137 135 137 135 140 128 89 85 172 170 144 140EF4 212 212 128 126 230 230 210 204 138 138 108 94 137 135 137 135 132 132 89 85 172 170 144 144EM3 214 212 128 122 230 222 210 210 138 138 112 108 135 129 137 137 140 132 89 85 170 166 144 140EM2 214 212 128 122 230 230 210 202 138 132 112 106 129 129 139 135 144 144 85 85 178 170 140 140EM1 214 212 130 128 230 222 210 204 138 130 112 94 137 129 137 135 140 132 89 85 172 170 144 140EM7 214 212 126 122 228 222 210 204 138 138 112 94 137 129 137 135 132 132 89 85 172 170 144 144EM8 212 212 128 126 230 228 210 204 138 130 112 94 137 135 137 135 140 132 89 85 172 170 144 140EM9 214 212 126 122 228 222 210 204 138 138 112 94 137 129 137 135 132 132 89 85 172 166 144 144MO 214 212 130 130 230 222 204 198 130 130 106 106 139 129 137 137 134 134 85 85 172 170 142 142NF2 214 214 128 124 226 226 204 204 140 138 112 104 139 135 135 135 144 132 85 85 178 168 144 140NF3 214 214 128 124 226 226 210 206 140 138 98 94 139 135 135 135 144 128 85 85 178 168 144 142NF1 214 214 130 124 226 226 210 204 138 130 104 94 139 137 135 135 144 140 85 85 178 170 144 140NM2 214 214 130 128 226 226 210 204 140 138 112 104 137 135 135 135 140 132 85 85 178 168 144 140NM1 216 214 128 128 226 222 206 204 140 134 112 98 135 127 135 135 132 128 85 85 172 168 142 140NM3 214 212 128 124 232 226 210 198 138 136 94 94 139 137 137 135 144 140 85 85 178 172 144 140SF1 214 214 124 124 226 222 204 198 138 130 104 94 141 137 137 135 144 138 85 85 174 172 144 140SF3 214 214 128 128 230 222 206 198 132 128 106 94 139 139 137 135 144 128 85 85 172 170 144 140SM3 214 214 128 124 230 226 214 198 130 124 106 104 137 137 139 137 138 128 85 85 172 172 144 144SM4 216 214 130 124 222 222 204 200 140 138 106 104 137 133 137 135 138 134 85 85 174 172 144 144SF2 214 214 130 124 230 226 210 204 138 124 106 104 141 137 137 133 138 128 85 85 174 172 144 144SM1 216 214 130 128 222 222 210 200 140 136 106 106 137 133 137 133 134 132 85 85 172 166 144 144SM2 214 214 130 128 230 222 214 210 140 124 108 106 137 129 139 133 134 128 85 85 172 172 144 144S10 214 212 130 128 226 222 204 198 136 128 94 94 139 131 137 137 140 140 85 85 172 172 140 140SM5 214 212 130 128 230 222 202 198 ? ? 108 106 137 129 139 133 134 128 85 85 174 172 144 144SM6 214 214 128 124 222 222 214 204 130 124 106 94 137 137 139 137 138 128 85 85 174 172 144 140SF4 214 208 128 128 226 222 202 202 138 128 94 92 143 127 137 133 144 132 89 85 168 166 142 142SM7 214 214 130 128 230 222 214 210 138 136 108 106 137 129 139 133 144 134 85 85 172 172 144 144SF5 214 214 130 124 230 226 214 204 138 124 106 94 141 137 139 137 144 134 85 85 172 172 144 140SWF2 214 212 130 122 232 226 208 200 138 128 112 100 139 121 135 135 144 140 85 85 172 172 144 140SWF3 214 214 128 122 230 222 202 200 138 134 112 110 133 129 137 135 144 134 85 85 172 172 144 140SWF4 214 214 122 118 232 222 208 200 130 128 114 112 139 127 135 135 144 140 85 85 172 168 144 142SWF1 214 214 130 122 232 222 202 200 134 128 112 106 139 133 137 135 144 132 85 85 172 172 142 140SWM1 214 212 128 124 230 224 210 202 138 130 110 104 137 129 137 135 140 134 85 85 172 172 144 142SW5 214 212 128 124 232 226 208 200 138 128 112 100 137 129 135 135 144 144 85 85 172 172 144 140SW7 214 212 130 124 224 222 202 200 138 134 106 104 137 133 135 135 144 140 85 85 172 172 144 140SW10 214 214 130 124 222 222 202 198 134 128 ? ? 133 129 137 135 144 140 85 85 172 172 144 140WaF1 216 214 130 124 228 226 ? ? 140 128 114 102 139 127 137 137 132 130 85 85 172 168 144 140WaF4 216 214 130 124 226 226 210 198 134 128 114 104 137 135 137 135 130 130 85 85 172 168 144 140WaF2 216 210 130 124 228 226 210 204 140 128 104 102 139 135 137 135 134 130 85 85 176 172 142 140WaM1 216 214 124 226 124 226 204 202 134 128 114 102 139 137 137 137 132 130 85 85 176 168 144 142WaM2 214 212 130 124 226 226 202 198 134 128 114 104 137 127 137 133 132 130 85 85 168 162 144 144NeF1 214 208 134 128 232 222 202 200 140 138 112 94 141 135 137 135 140 134 89 85 166 166 146 142NeM1 214 214 130 118 228 222 210 198 140 138 104 98 143 139 137 137 140 128 85 85 170 170 144 144NeM2 214 214 128 128 232 226 212 212 138 128 114 100 143 133 137 135 134 132 85 85 172 170 142 142NeM3 214 214 128 124 232 228 208 208 138 128 100 94 143 127 135 135 134 132 85 85 172 166 142 140
KINSHIP IN MOUSTACHED TAMARINS 461

AP
PE
ND
IXB
.R
-val
ues
for
all
poss
ible
dya
ds
ofsa
mpl
edin
div
idu
als1

Tirado Herrera. We are grateful to all “pichicos” whogenerously presented us their droppings. The Fac-ulty of Biology at the Universidad Nacional de laAmazonıa Peruana (UNAP) in Iquitos, Peru, kindlyprovided the refrigerator in which we could store oursamples until our return to Germany. Many thanksto Holger Herlyn, Christian Roos and ManfredEberle who gave helpful advice in the laboratory. Weare also grateful to Manfred Eberle, Peter Kappeler,Julia Ostner, Oliver Schulke, and Dietmar Zinnerfor fruitful discussions. We heartily thank VivienKramer for providing helpful comments, and TrauteHuck for improving our English grammar and spell-ing. This study is part of the Ph.D. project of the firsttwo authors. Field work was carried out under aletter of understanding between the UNAP and theDeutsches Primatenzentrum, and complied with Pe-ruvian laws.
LITERATURE CITED
Abbott DH, George LM, Ferreira BR. 1992. Endocrine and behav-ioral constraints on reproduction in subordinate male commonmarmosets. Am J Primatol 27:13.
Baglione V, Canestrari D, Marcos JM, Ekman J. 2003. Kin selec-tion in cooperative alliances of carrion crows. Science 300:1947–1949.
Benirschke K, Anderson JM, Brownhill LE. 1962. Marrow chi-merism in marmosets. Science 138:513–515.
Blouin MS. 2003. DNA-based methods for pedigree reconstruc-tion and kinship analysis in natural populations. Trends EcolEvol 18:503–511.
Bohle U-R, Zischler H. 2002. Polymorphic microsatellite loci forthe mustached tamarin (Saguinus mystax) and their cross-species amplification in other New World monkeys. Mol EcolNotes 2:1–3.
Clutton-Brock TH, Vincent ACJ. 1991. Sexual selection and thepotential reproductive rates of males and females. Nature 351:59–60.
Constable JJ, Packer C, Collings DA, Pusey AE. 1995. NuclearDNA from primate dung. Nature 373:393.
Crook JH, Crook SJ. 1988. Tibetan polyandry: problems of adap-tation and fitness. In: Betzig L, Borgerhoff-Mulder M, Turke P,editors. Human reproductive behaviour: a Darwinian perspec-tive. Cambridge: Cambridge University Press. p 97–114.
Dawson GA. 1977. Composition and stability of social groups ofthe tamarin, Saguinus oedipus, in Panama: ecological and be-havioral implications. In: Kleiman DG, editor. The biology andconservation of the callitrichidae. Washington, DC: Smithso-nian Institution Press. p 23–37.
Digby LJ, Barreto CE. 1993. Social organization in a wild popu-lation of Callithrix jacchus—I. Group composition and dynam-ics. Folia Primatol (Basel) 61:123–134.
Digby LJ. 1999. Sexual behavior and extragroup copulations in awild population of common marmosets (Callithrix jacchus). Fo-lia Primatol (Basel) 70:136–145.
Emlen ST, Oring LW. 1977. Ecology, sexual selection, and theevolution of mating systems. Science 197:215–223.
Epple G. 1975. The behavior of marmoset monkeys (Callitrichi-dae). In: Rosenblum, editor. Primate behavior. New York: Ac-ademic Press, pp. 195–239.
Faulkes CG, Arruda MF, Monteiro da Cruz MAO. 2003. Matri-lineal genetic structure within and among populations of thecooperatively breeding common marmoset, Callithrix jacchus.Mol Ecol 12:1101–1108.
Ferrari SF, Lopes Ferrari MA. 1989. A re-evaluation of the socialorganisation of the callitrichidae, with reference to the ecolog-ical differences between genera. Folia Primatol (Basel) 52:132–147.1
Dar
ksh
adin
gab
ove
99%
perc
enti
lebo
unda
ry(R
0.
4067
);lig
htsh
adin
g,ab
ove
95%
perc
enti
lebo
unda
ry(R
0.
2414
);pe
rcen
tile
boun
dari
esar
eca
lcul
ated
only
from
betw
een-
grou
pdy
ads.
KINSHIP IN MOUSTACHED TAMARINS 463

French JA, Inglett BJ, Dethlefs TM. 1989. The reproductive sta-tus of nonbreeding group members in captive golden lion tama-rin social groups. Am J Primatol 18:73–86.
French JA, Schaffner CM. 1995. Social and developmental influ-ences on urinary testosterone levels in male black tufted-earmarmosets (Callithrix kuhli). Am J Primatol 36:123.
Garber PA. 1997. One for all and breeding for one: cooperationand competition as a tamarin reproductive strategy. Evol An-thropol 6:187–199.
Garber PA, Encarnacion F, Moya L, Pruetz JD. 1993. Demo-graphic and reproductive patterns in moustached tamarinmonkeys (Saguinus mystax): implications for reconstructingplatyrrhine mating systems. Am J Primatol 29:235–254.
Garber PA, Moya L, Malaga C. 1984. A preliminary field study ofthe moustached tamarin monkey (Saguinus mystax) in north-eastern Peru: questions concerned with the evolution of a com-munal breeding system. Folia Primatol (Basel) 42:17–32.
Goldizen A, Mendelson J, van Vlaardingen M, Terborgh J. 1996.Saddle-back tamarin (Saguinus fuscicollis) reproductive strat-egies: evidence from a thirteen-year study of a marked popula-tion. Am J Primatol 38:57–83.
Goldizen AW. 1987a. Facultative polyandry and the role of infant-carrying in wild saddle-back tamarins (Saguinus fuscicollis).Behav Ecol Sociobiol 20:99–109.
Goldizen AW. 1987b. Tamarins and marmosets: communal careof offspring. In: Smuts BB, Cheney DL, Seyfarth RM, Wrang-ham RW, Struhsaker TT, editors. Primate societies. Chicago:Chicago University Press. p 34–43.
Haig D. 1999. What is a marmoset? Am J Primatol 49:285–296.Hampton SH. 1973. Germ cell chimerism in male marmosets.
Am J Phys Anthropol 38:265–268.Heymann EW. 1990. Social behaviour and infant carrying in a
group of moustached tamarins, Saguinus mystax (Primates:Platyrrhini: Callitrichidae) on Padre Isla, Peruvian Amazonia.Primates 31:183–196.
Heymann EW. 1995. Sleeping habits of tamarins, Saguinus my-stax and Saguinus fuscicollis (Mammalia; Primates; Cal-litrichidae), in north-eastern Peru. J Zool Lond 237:211–226.
Heymann EW. 1996. Social behavior of wild moustached tama-rins, Saguinus mystax, at the Estacion Biologica QuebradaBlanco, Peruvian Amazonia. Am J Primatol 38:101–113.
Heymann EW. 2000. The number of adult males in callitrichinegroups and its implications for callitrichine social evolution. In:Kappeler PM, editor. Primate males. Cambridge: CambridgeUniversity Press. p 64–71.
Hoss M, Kohn M, Paabo S, Knauer F, Schroder W. 1992. Excre-ment analysis by PCR. Nature 359:199.
Hubrecht RC. 1985. Home-range size and use and territorialbehavior in the common marmoset, Callithrix jacchus jacchus,at the Tapacura field station, Recife, Brazil. Int J Primatol6:533–550.
Huck M, Lottker P, Heymann EW. 2004a. The many faces ofhelping: possible costs and benefits of infant carrying and foodtransfer in moustached tamarins (Saguinus mystax). Behav-iour 141:915–934.
Huck M, Lottker P, Heymann EW, Heistermann M. 2004b. Char-acterization and social correlates of fecal testosterone and cor-tisol levels in wild male moustached tamarins (Saguinus mys-tax). Int J Primatol 26: in press.
Huck M, Lottker P, Heymann EW. 2004b. Proximate mechanismsof reproductive monopolization in male moustached tamarins(Saguinus mystax). Am J Primatol 64:39–56.
Kappeler PM, van Schaik CP. 2002. Evolution of primate socialsystems. Int J Primatol 23.
Kohn MH, Wayne RK. 1997. Facts from feces revisited. TrendsEcol Evol 12:223–227.
Lottker P, Huck M, Heymann EW. 2004. Group composition anddemographic events in wild moustached tamarins (Saguinusmystax). Am J Primatol. 1–64.
Marshall TC, Slate J, Kruuk LEB, Pemberton JM. 1998. Statis-tical confidence for likelihood-based paternity inference in nat-ural populations. Mol Ecol 7:639–655.
Martin P, Bateson P. 1993. Measuring behaviour—an introduc-tory guide. Cambridge: Cambridge University Press.
Nievergelt CM, Digby LJ, Ramkrishnan U, Woodruff DS. 2000.Genetic analysis of group composition and breeding system in awild common marmoset (Callithrix jacchus) population. Int JPrimatol 21:1–20.
Nievergelt CM, Mundy NI, Woodruff DS. 1998. Microsatelliteprimers for genotyping common marmosets (Callithrix jacchus)and other callitrichids. Mol Ecol 7:1431–1439.
Parker GA, Baker RR, Smith VGF. 1972. The origin and evolu-tion of gamete dimorphism and the male-female phenomenon.J Theor Biol 36:529–553.
Queller DC, Goodnight KF. 1989. Estimating relatedness usinggenetic markers. Evolution 43:258–275.
Ruiter JR, Geffen E. 1998. Relatedness of matrilines, dispersingmales and social groups in long-tailed macaques (Macaca fas-cicularis). Proc R Soc Lond [Biol] 265:79–87.
Savage A. 1990. The reproductive biology of the cotton-top tama-rin (Saguinus oedipus) in Colombia. Ph.D. thesis, University ofWisconsin, Madison.
Shahuano Tello N, Huck M, Heymann EW. 2002. Boa constrictorattack and successful group defence in moustached tamarins,Saguinus mystax. Folia Primatol (Basel) 73:146–148.
Smith AC, Tirado Herrera ER, Buchanan-Smith HM, HeymannEW. 2001. Multiple breeding females and allo-nursing in a wildgroup of moustached tamarins (Saguinus mystax). Neotrop Pri-mates 9:67–69.
Soini P, Soini M. 1990. Distribucion geografica y ecologia pobla-cional de Saguinus mystax. In: NE Castro-Rodrıguez, editor. Laprimatologıa en el Peru. Investigaciones primatologicas (1973–1985). Lima: Imprenta Propaceb. p 272–313.
Sussman RW, Garber PA. 1987. A new interpretation of the socialorganization and mating system of the callitrichidae. Int JPrimatol 8:73–92.
Taberlet P, Luikart G. 1999. Non-invasive genetic sampling andindividual identification. Biol J Linn Soc 68:41–55.
Taberlet P, Waits LP, Luikart G. 1999. Noninvasive genetic sam-pling: look before you leap. Trends Ecol Evol 14:323–327.
Tardif S, Harrison M, Simek M. 1993. Communal infant care inmarmosets and tamarins: relation to energetics, ecology, andsocial organization. In: Rylands AB, editor. Marmosets andtamarins. Systematics, behaviour, and ecology. Oxford: OxfordUniversity Press. p 220–234.
Terborgh J, Goldizen AW. 1985. On the mating system of thecooperatively breeding saddle-backed tamarin (Saguinus fusci-collis). Behav Ecol Sociobiol 16:293–299.
Thompson EA. 1991. Estimation of relationships from geneticdata. In: Rao CR, Chakraborty R, editors. Handbook of statis-tics. Elsevier Science. p 255–269.
Trivers RL. 1972. Parental investment and sexual selection. In:Campbell B, editor. Sexual selection and the descent of man.Chicago: Aldine. p 136–179.
Wenk RE, Houtz T, Brooks M, Chiafari FA. 1992. How frequentis hetreropaternal superfecundation? Acta Genet Med Gemellol41:43–47.
464 M. HUCK ET AL.
Copyright © 2022 FDOKUMEN