The environments of hyperluminous infrared galaxies at 0.44 < z < 1.55
10
arXiv:astro-ph/0312215v1 8 Dec 2003 Mon. Not. R. Astron. Soc. 000, 1–?? (2003) Printed 2 February 2008 (MN L A T E X style file v2.2) The environments of hyperluminous infrared galaxies at 0.44 <z< 1.55 D. Farrah, 1⋆ J. Geach, 2,3 M. Fox, 2 S. Serjeant, 4 S. Oliver, 5 A. Verma, 6 A. Kaviani, 2 and M. Rowan-Robinson 2 1 SIRTF Science Center, Jet Propulsion Laboratory, California Institute of Technology, Pasadena 91125, USA 2 Astrophysics Group, Blackett Laboratory, Imperial College, Prince Consort Road, London SW7 2BW, UK 3 Astronomy Unit, Queen Mary College, Mile End Road, London E1 4NS, UK 4 Centre for Astrophysics and Planetary Science, School of Physical Sciences, University of Kent, Canterbury, Kent, CT2 7NR, UK 5 Astronomy Centre, University of Sussex, Falmer, Brighton BN1 9QJ, UK 6 Max-Planck-Institut fur Extraterrestrische Physik, Postfach 1312, 85741 Garching, Germany 2 February 2008 ABSTRACT We present deep wide-field K s -band observations of six Hyperluminous Infrared Galax- ies (HLIRGs) spanning a redshift range 0.44 <z< 1.55. The sample resides in a wide variety of environments, from the field to Abell 2 clusters, with a mean galaxy-HLIRG clustering amplitude of 〈B gh 〉 = 190 ± 45Mpc 1.77 . The range in environments, and the mean clustering level, are both greater than those seen in local IR-luminous galaxies, from which we infer that the range of galaxy evolution processes driving IR-luminous galaxy evolution at z> 0.5 is greater than locally, and includes mergers between gas- rich spiral galaxies in the field, but also includes encounters in clusters and hierarchical buildup. The similarity in the range of environments and mean clustering amplitude between our sample and QSOs over a similar redshift range is consistent with the in- terpretation where evolutionary connections between IR-luminous galaxies and QSOs are stronger at z> 0.5 than locally, and that, at these redshifts, the processes that drive QSO evolution are similar to those that drive IR-luminous galaxy evolution. From comparison of the HLIRG and QSO host galaxies we further postulate that a larger fraction of IR-luminous galaxies pass through an optical QSO stage at z> 0.5 than locally. Key words: clusters: galaxies – galaxies: evolution – galaxies: starburst – galaxies: active – infrared: galaxies 1 INTRODUCTION Since the discovery by the Infrared Astronomical Satellite (IRAS) in 1983 of a large population of galaxies with sig- nificant infrared (IR) emission, substantial effort has been expended on understanding the nature of the most luminous end of this IR galaxy population. These sources, termed Ultraluminous Infrared Galaxies (ULIRGs) if their IR lu- minosity exceeds 10 12 L⊙, and HLIRGs if their IR lumi- nosity exceeds 10 13 L⊙, are found over a very wide range in redshift, with most lying at z< 0.1 (Soifer et al 1984; Saunders et al 2000), but with a significant number lying in the range 0.1 <z< 0.4, and a few lying at higher red- shifts. Although the consensus is now that ULIRGs and HLIRGs are powered by some combination of violent star formation and black hole accretion surrounded by large ⋆ E-mail: [email protected] masses of gas and dust, the triggers for this activity, and how these galaxies evolve, are not known. Locally, ULIRGs are thought to be mergers between two or more gas-rich spiral galaxies, taking place almost exclusively in poor en- vironments, and that a small number of these ULIRGs evolve into optically selected QSOs (Soifer et al 1984; Leech et al 1994; Sanders & Mirabel 1996; Rigopoulou et al 1999; Farrah et al 2001; Bushouse et al 2002; Tacconi et al 2002; Farrah et al 2003). At higher redshifts however, the picture is less clear. It has been suggested that a greater va- riety of galaxy formation processes may play a role amongst ULIRGs and HLIRGs at high redshift (Farrah et al 2002b), a change which may manifest itself in their environments. The Hyperluminous Infrared Galaxies (HLIRGs), which generally lie at z 0.3, have been studied extensively since their discovery, motivated by their extreme lumi- nosities which make them amongst the most luminous objects in the Universe. The first HLIRG to be found
-
Upload
independent -
Category
Documents
-
view
1 -
download
0
Transcript of The environments of hyperluminous infrared galaxies at 0.44 < z < 1.55
arX
iv:a
stro
-ph/
0312
215v
1 8
Dec
200
3
Mon. Not. R. Astron. Soc. 000, 1–?? (2003) Printed 2 February 2008 (MN LATEX style file v2.2)
The environments of hyperluminous infrared galaxies at
0.44 < z < 1.55
D. Farrah,1⋆ J. Geach,2,3 M. Fox,2 S. Serjeant,4 S. Oliver,5 A. Verma,6
A. Kaviani,2 and M. Rowan-Robinson21SIRTF Science Center, Jet Propulsion Laboratory, California Institute of Technology, Pasadena 91125, USA2Astrophysics Group, Blackett Laboratory, Imperial College, Prince Consort Road, London SW7 2BW, UK3Astronomy Unit, Queen Mary College, Mile End Road, London E1 4NS, UK4Centre for Astrophysics and Planetary Science, School of Physical Sciences, University of Kent, Canterbury, Kent, CT2 7NR, UK5Astronomy Centre, University of Sussex, Falmer, Brighton BN1 9QJ, UK6Max-Planck-Institut fur Extraterrestrische Physik, Postfach 1312, 85741 Garching, Germany
2 February 2008
ABSTRACT
We present deep wide-field Ks-band observations of six Hyperluminous Infrared Galax-ies (HLIRGs) spanning a redshift range 0.44 < z < 1.55. The sample resides in a widevariety of environments, from the field to Abell 2 clusters, with a mean galaxy-HLIRGclustering amplitude of 〈Bgh〉 = 190±45Mpc1.77. The range in environments, and themean clustering level, are both greater than those seen in local IR-luminous galaxies,from which we infer that the range of galaxy evolution processes driving IR-luminousgalaxy evolution at z > 0.5 is greater than locally, and includes mergers between gas-rich spiral galaxies in the field, but also includes encounters in clusters and hierarchicalbuildup. The similarity in the range of environments and mean clustering amplitudebetween our sample and QSOs over a similar redshift range is consistent with the in-terpretation where evolutionary connections between IR-luminous galaxies and QSOsare stronger at z > 0.5 than locally, and that, at these redshifts, the processes thatdrive QSO evolution are similar to those that drive IR-luminous galaxy evolution.From comparison of the HLIRG and QSO host galaxies we further postulate that alarger fraction of IR-luminous galaxies pass through an optical QSO stage at z > 0.5than locally.
Key words: clusters: galaxies – galaxies: evolution – galaxies: starburst – galaxies:active – infrared: galaxies
1 INTRODUCTION
Since the discovery by the Infrared Astronomical Satellite
(IRAS) in 1983 of a large population of galaxies with sig-nificant infrared (IR) emission, substantial effort has beenexpended on understanding the nature of the most luminousend of this IR galaxy population. These sources, termedUltraluminous Infrared Galaxies (ULIRGs) if their IR lu-minosity exceeds 1012L⊙, and HLIRGs if their IR lumi-nosity exceeds 1013L⊙, are found over a very wide rangein redshift, with most lying at z < 0.1 (Soifer et al 1984;Saunders et al 2000), but with a significant number lying inthe range 0.1 < z < 0.4, and a few lying at higher red-shifts. Although the consensus is now that ULIRGs andHLIRGs are powered by some combination of violent starformation and black hole accretion surrounded by large
⋆ E-mail: [email protected]
masses of gas and dust, the triggers for this activity, andhow these galaxies evolve, are not known. Locally, ULIRGsare thought to be mergers between two or more gas-richspiral galaxies, taking place almost exclusively in poor en-vironments, and that a small number of these ULIRGsevolve into optically selected QSOs (Soifer et al 1984;Leech et al 1994; Sanders & Mirabel 1996; Rigopoulou et al1999; Farrah et al 2001; Bushouse et al 2002; Tacconi et al2002; Farrah et al 2003). At higher redshifts however, thepicture is less clear. It has been suggested that a greater va-riety of galaxy formation processes may play a role amongstULIRGs and HLIRGs at high redshift (Farrah et al 2002b),a change which may manifest itself in their environments.
The Hyperluminous Infrared Galaxies (HLIRGs), whichgenerally lie at z > 0.3, have been studied extensivelysince their discovery, motivated by their extreme lumi-nosities which make them amongst the most luminousobjects in the Universe. The first HLIRG to be found
2 D. Farrah et al.
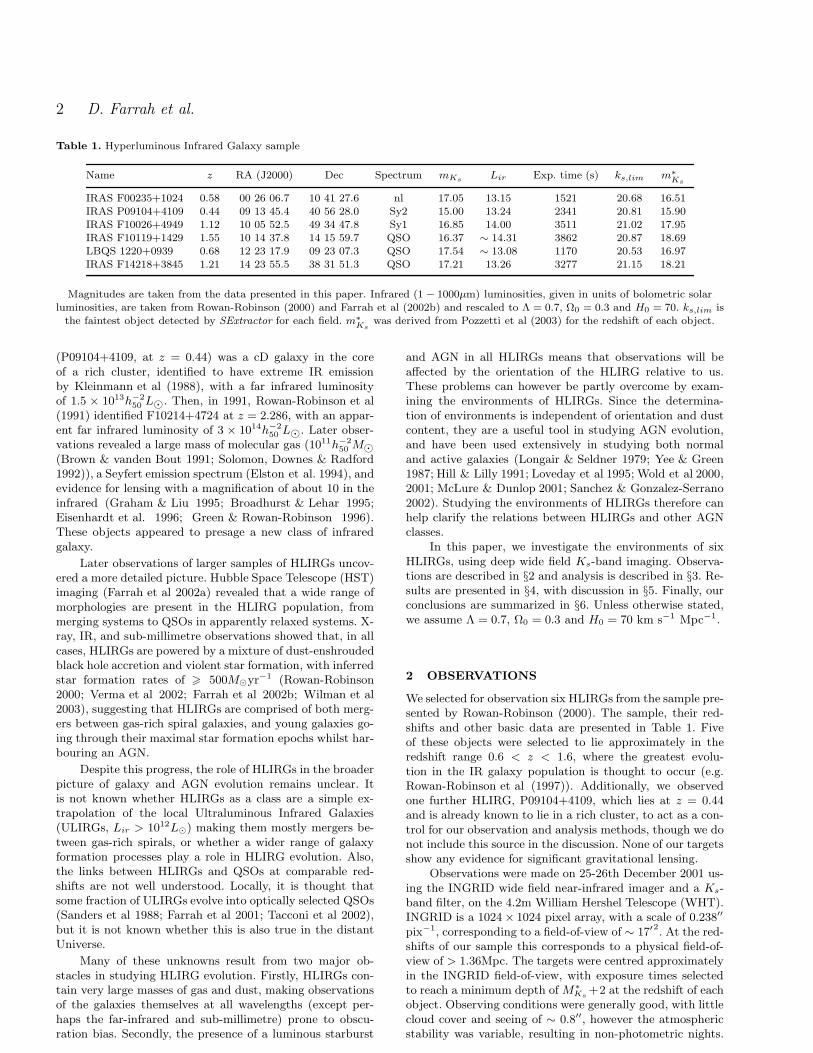
Table 1. Hyperluminous Infrared Galaxy sample
Name z RA (J2000) Dec Spectrum mKsLir Exp. time (s) ks,lim m∗
Ks
IRAS F00235+1024 0.58 00 26 06.7 10 41 27.6 nl 17.05 13.15 1521 20.68 16.51IRAS P09104+4109 0.44 09 13 45.4 40 56 28.0 Sy2 15.00 13.24 2341 20.81 15.90IRAS F10026+4949 1.12 10 05 52.5 49 34 47.8 Sy1 16.85 14.00 3511 21.02 17.95IRAS F10119+1429 1.55 10 14 37.8 14 15 59.7 QSO 16.37 ∼ 14.31 3862 20.87 18.69LBQS 1220+0939 0.68 12 23 17.9 09 23 07.3 QSO 17.54 ∼ 13.08 1170 20.53 16.97IRAS F14218+3845 1.21 14 23 55.5 38 31 51.3 QSO 17.21 13.26 3277 21.15 18.21
Magnitudes are taken from the data presented in this paper. Infrared (1 − 1000µm) luminosities, given in units of bolometric solarluminosities, are taken from Rowan-Robinson (2000) and Farrah et al (2002b) and rescaled to Λ = 0.7, Ω0 = 0.3 and H0 = 70. ks,lim is
the faintest object detected by SExtractor for each field. m∗Ks
was derived from Pozzetti et al (2003) for the redshift of each object.
(P09104+4109, at z = 0.44) was a cD galaxy in the coreof a rich cluster, identified to have extreme IR emissionby Kleinmann et al (1988), with a far infrared luminosityof 1.5 × 10¹³h−2
50 L⊙. Then, in 1991, Rowan-Robinson et al(1991) identified F10214+4724 at z = 2.286, with an appar-ent far infrared luminosity of 3 × 10¹⁴h−2
50 L⊙. Later obser-vations revealed a large mass of molecular gas (1011h−2
50 M⊙(Brown & vanden Bout 1991; Solomon, Downes & Radford1992)), a Seyfert emission spectrum (Elston et al. 1994), andevidence for lensing with a magnification of about 10 in theinfrared (Graham & Liu 1995; Broadhurst & Lehar 1995;Eisenhardt et al. 1996; Green & Rowan-Robinson 1996).These objects appeared to presage a new class of infraredgalaxy.
Later observations of larger samples of HLIRGs uncov-ered a more detailed picture. Hubble Space Telescope (HST)imaging (Farrah et al 2002a) revealed that a wide range ofmorphologies are present in the HLIRG population, frommerging systems to QSOs in apparently relaxed systems. X-ray, IR, and sub-millimetre observations showed that, in allcases, HLIRGs are powered by a mixture of dust-enshroudedblack hole accretion and violent star formation, with inferredstar formation rates of > 500M⊙yr−1 (Rowan-Robinson2000; Verma et al 2002; Farrah et al 2002b; Wilman et al2003), suggesting that HLIRGs are comprised of both merg-ers between gas-rich spiral galaxies, and young galaxies go-ing through their maximal star formation epochs whilst har-bouring an AGN.
Despite this progress, the role of HLIRGs in the broaderpicture of galaxy and AGN evolution remains unclear. Itis not known whether HLIRGs as a class are a simple ex-trapolation of the local Ultraluminous Infrared Galaxies(ULIRGs, Lir > 1012L⊙) making them mostly mergers be-tween gas-rich spirals, or whether a wider range of galaxyformation processes play a role in HLIRG evolution. Also,the links between HLIRGs and QSOs at comparable red-shifts are not well understood. Locally, it is thought thatsome fraction of ULIRGs evolve into optically selected QSOs(Sanders et al 1988; Farrah et al 2001; Tacconi et al 2002),but it is not known whether this is also true in the distantUniverse.
Many of these unknowns result from two major ob-stacles in studying HLIRG evolution. Firstly, HLIRGs con-tain very large masses of gas and dust, making observationsof the galaxies themselves at all wavelengths (except per-haps the far-infrared and sub-millimetre) prone to obscu-ration bias. Secondly, the presence of a luminous starburst
and AGN in all HLIRGs means that observations will beaffected by the orientation of the HLIRG relative to us.These problems can however be partly overcome by exam-ining the environments of HLIRGs. Since the determina-tion of environments is independent of orientation and dustcontent, they are a useful tool in studying AGN evolution,and have been used extensively in studying both normaland active galaxies (Longair & Seldner 1979; Yee & Green1987; Hill & Lilly 1991; Loveday et al 1995; Wold et al 2000,2001; McLure & Dunlop 2001; Sanchez & Gonzalez-Serrano2002). Studying the environments of HLIRGs therefore canhelp clarify the relations between HLIRGs and other AGNclasses.
In this paper, we investigate the environments of sixHLIRGs, using deep wide field Ks-band imaging. Observa-tions are described in §2 and analysis is described in §3. Re-sults are presented in §4, with discussion in §5. Finally, ourconclusions are summarized in §6. Unless otherwise stated,we assume Λ = 0.7, Ω0 = 0.3 and H0 = 70 km s−1 Mpc−1.
2 OBSERVATIONS
We selected for observation six HLIRGs from the sample pre-sented by Rowan-Robinson (2000). The sample, their red-shifts and other basic data are presented in Table 1. Fiveof these objects were selected to lie approximately in theredshift range 0.6 < z < 1.6, where the greatest evolu-tion in the IR galaxy population is thought to occur (e.g.Rowan-Robinson et al (1997)). Additionally, we observedone further HLIRG, P09104+4109, which lies at z = 0.44and is already known to lie in a rich cluster, to act as a con-trol for our observation and analysis methods, though we donot include this source in the discussion. None of our targetsshow any evidence for significant gravitational lensing.
Observations were made on 25-26th December 2001 us-ing the INGRID wide field near-infrared imager and a Ks-band filter, on the 4.2m William Hershel Telescope (WHT).INGRID is a 1024 × 1024 pixel array, with a scale of 0.238′′
pix−1, corresponding to a field-of-view of ∼ 17′2. At the red-shifts of our sample this corresponds to a physical field-of-view of > 1.36Mpc. The targets were centred approximatelyin the INGRID field-of-view, with exposure times selectedto reach a minimum depth of M∗
Ks+2 at the redshift of each
object. Observing conditions were generally good, with littlecloud cover and seeing of ∼ 0.8′′, however the atmosphericstability was variable, resulting in non-photometric nights.
The environments of hyperluminous infrared galaxies at 0.44 < z < 1.55 3
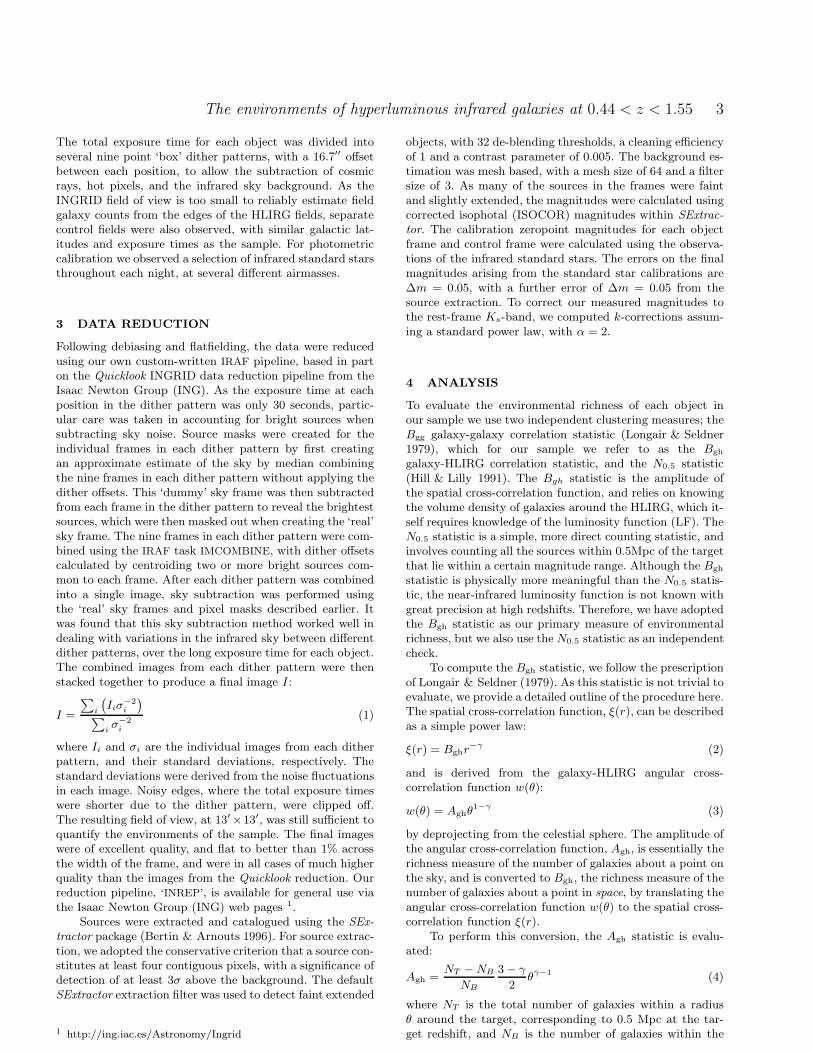
The total exposure time for each object was divided intoseveral nine point ‘box’ dither patterns, with a 16.7′′ offsetbetween each position, to allow the subtraction of cosmicrays, hot pixels, and the infrared sky background. As theINGRID field of view is too small to reliably estimate fieldgalaxy counts from the edges of the HLIRG fields, separatecontrol fields were also observed, with similar galactic lat-itudes and exposure times as the sample. For photometriccalibration we observed a selection of infrared standard starsthroughout each night, at several different airmasses.
3 DATA REDUCTION
Following debiasing and flatfielding, the data were reducedusing our own custom-written IRAF pipeline, based in parton the Quicklook INGRID data reduction pipeline from theIsaac Newton Group (ING). As the exposure time at eachposition in the dither pattern was only 30 seconds, partic-ular care was taken in accounting for bright sources whensubtracting sky noise. Source masks were created for theindividual frames in each dither pattern by first creatingan approximate estimate of the sky by median combiningthe nine frames in each dither pattern without applying thedither offsets. This ‘dummy’ sky frame was then subtractedfrom each frame in the dither pattern to reveal the brightestsources, which were then masked out when creating the ‘real’sky frame. The nine frames in each dither pattern were com-bined using the IRAF task IMCOMBINE, with dither offsetscalculated by centroiding two or more bright sources com-mon to each frame. After each dither pattern was combinedinto a single image, sky subtraction was performed usingthe ‘real’ sky frames and pixel masks described earlier. Itwas found that this sky subtraction method worked well indealing with variations in the infrared sky between differentdither patterns, over the long exposure time for each object.The combined images from each dither pattern were thenstacked together to produce a final image I :
I =
∑
i
(
Iiσ−2i
)
∑
iσ−2
i
(1)
where Ii and σi are the individual images from each ditherpattern, and their standard deviations, respectively. Thestandard deviations were derived from the noise fluctuationsin each image. Noisy edges, where the total exposure timeswere shorter due to the dither pattern, were clipped off.The resulting field of view, at 13′×13′, was still sufficient toquantify the environments of the sample. The final imageswere of excellent quality, and flat to better than 1% acrossthe width of the frame, and were in all cases of much higherquality than the images from the Quicklook reduction. Ourreduction pipeline, ‘INREP’, is available for general use viathe Isaac Newton Group (ING) web pages 1.
Sources were extracted and catalogued using the SEx-
tractor package (Bertin & Arnouts 1996). For source extrac-tion, we adopted the conservative criterion that a source con-stitutes at least four contiguous pixels, with a significance ofdetection of at least 3σ above the background. The defaultSExtractor extraction filter was used to detect faint extended
1 http://ing.iac.es/Astronomy/Ingrid
objects, with 32 de-blending thresholds, a cleaning efficiencyof 1 and a contrast parameter of 0.005. The background es-timation was mesh based, with a mesh size of 64 and a filtersize of 3. As many of the sources in the frames were faintand slightly extended, the magnitudes were calculated usingcorrected isophotal (ISOCOR) magnitudes within SExtrac-
tor. The calibration zeropoint magnitudes for each objectframe and control frame were calculated using the observa-tions of the infrared standard stars. The errors on the finalmagnitudes arising from the standard star calibrations are∆m = 0.05, with a further error of ∆m = 0.05 from thesource extraction. To correct our measured magnitudes tothe rest-frame Ks-band, we computed k-corrections assum-ing a standard power law, with α = 2.
4 ANALYSIS
To evaluate the environmental richness of each object inour sample we use two independent clustering measures; theBgg galaxy-galaxy correlation statistic (Longair & Seldner1979), which for our sample we refer to as the Bgh
galaxy-HLIRG correlation statistic, and the N0.5 statistic(Hill & Lilly 1991). The Bgh statistic is the amplitude ofthe spatial cross-correlation function, and relies on knowingthe volume density of galaxies around the HLIRG, which it-self requires knowledge of the luminosity function (LF). TheN0.5 statistic is a simple, more direct counting statistic, andinvolves counting all the sources within 0.5Mpc of the targetthat lie within a certain magnitude range. Although the Bgh
statistic is physically more meaningful than the N0.5 statis-tic, the near-infrared luminosity function is not known withgreat precision at high redshifts. Therefore, we have adoptedthe Bgh statistic as our primary measure of environmentalrichness, but we also use the N0.5 statistic as an independentcheck.
To compute the Bgh statistic, we follow the prescriptionof Longair & Seldner (1979). As this statistic is not trivial toevaluate, we provide a detailed outline of the procedure here.The spatial cross-correlation function, ξ(r), can be describedas a simple power law:
ξ(r) = Bghr−γ (2)
and is derived from the galaxy-HLIRG angular cross-correlation function w(θ):
w(θ) = Aghθ1−γ (3)
by deprojecting from the celestial sphere. The amplitude ofthe angular cross-correlation function, Agh, is essentially therichness measure of the number of galaxies about a point onthe sky, and is converted to Bgh, the richness measure of thenumber of galaxies about a point in space, by translating theangular cross-correlation function w(θ) to the spatial cross-correlation function ξ(r).
To perform this conversion, the Agh statistic is evalu-ated:
Agh =NT − NB
NB
3 − γ
2θγ−1 (4)
where NT is the total number of galaxies within a radiusθ around the target, corresponding to 0.5 Mpc at the tar-get redshift, and NB is the number of galaxies within the

4 D. Farrah et al.
Table 2. HLIRG clustering statistics
Name N0.5 σN0.5Agh σAgh
Bgh σBghAbell class
×103rad0.77 Mpc1.77
IRAS F00235+1024 7.69 2.77 0.66 0.28 208.63 88.31 fieldIRAS P09104+4109 29.65 5.45 2.75 0.40 819.75 119.77 2IRAS F10026+4949 17.81 4.22 1.73 0.40 611.46 141.01 1IRAS F10119+1429 8.88 2.98 0.72 0.31 384.32 167.33 0LBQS 1220+0939 3.77 1.94 0.40 0.26 143.78 94.25 fieldIRAS F14218+3845 4.45 2.11 0.06 0.21 21.84 81.27 field
Quoted errors only include the counting errors. The methods used to calculate the Bgh and N0.5 statistics, and the Abell classes, aredescribed in §4 and §5 respectively.
same radius in the control field for that object. We makethe assumption (Wold et al 2000, 2001) that γ = 1.77.The precise choice of γ will however not affect the de-rived clustering amplitudes, as it has previously been shown(Prestage & Peacock 1988, 1989) that Bgh is insensitive tothe choice of γ, as long as γ ∼ 2.
The Bgh statistic can now be calculated, and normalisedto the integral LF, Φ(ml, z) which represents the number ofgalaxies more luminous than ml per unit co-moving volumeat redshift z:
Bgh =ρgAgh
Φ(ml, z)Iγ
dγ−3θ (5)
where ρg is the average surface density of background galax-ies, dθ is the angular diameter distance to the target and Iγ
is an integration constant:
Iγ =2γ
γ − 1
Γ2[(γ + 1)/2]
Γ(γ)∼ 3.78 (6)
The integration to Φ(ml, z) is performed by taking a uni-versal LF of the form (Schechter 1976):
φ(L) ∼ (φ∗/L∗) (L/L∗)α
exp (−L/L∗) (7)
and integrating down to the completeness limit at the targetredshift L(ml, z):
Φ(ml, z) =
∫
∞
L(ml,z)
φ(L)dL (8)
For the parameters used in the LF, we use the most recentdetermination of the high redshift near-IR LFs as given byPozzetti et al (2003), who have determined the evolution ofthe near-IR LF in the J- and Ks-bands in redshift bins ofz = 〈0.20, 0.65〉 and z = 〈0.75, 1.30〉, using a spectroscopicsurvey of a magnitude limited sample of galaxies with Ks <20. In terms of absolute magnitudes the luminosity functioncan be expressed as:
φ(M) = Cf(M)(α+1) exp(−f(M)) (9)
where the constant C = 0.4 ln(10)φ∗, and:
f(M) = 10(−0.4(M−M∗)) (10)
As some of the galaxies in our sample lie outside of theredshift bins given by Pozzetti et al (2003), we must makeassumptions as to the nature of the LF at these magnitudes.In the redshift range 0.2 < z < 0.65, we have assumed α =−1.25, M∗ = −25.64 and φ∗ = 6.11 × 10⁻⁴Mpc−3. In theredshift range 0.75 < z < 1.55 we have assumed α = −0.98,
M∗ = −25.54 and φ∗ = 9.98 × 10⁻⁴Mpc−3. We note thatPozzetti et al (2003) find only mild evolution in the Ks-bandluminosity function over the redshift range 0 < z < 1.3,hence our use of their luminosity function at z = 1.55 isunlikely to be a major source of error.
The errors in Agh and Bgh were calculated following theprescription given by Yee & Lopez-Cruz (1999):
∆Agh
Agh=
∆Bgh
Bgh=
√
(NT − NB) + 1.32NB
NT − NB
(11)
which is based only upon (non-Poissonian) counting statis-tics. Other systematic errors are discussed in §5.2.
To compute the N0.5 statistic, we follow the proceduredescribed by Hill & Lilly (1991). This statistic is computedby counting all sources within a 0.5 Mpc radius of the tar-get, with a magnitude in the interval 〈m, m + 3〉, where mis the magnitude of the target. Subtracted from this numberis the expected number of background field galaxies in thesame magnitude interval calculated from the control fields.The resulting number is the N0.5 statistic. This measure-ment does not require integration of a luminosity function,although if the luminosities of HLIRGs and cluster galaxiesevolve very differently with redshift then the N0.5 statisticwill give inaccurate results. There is no evidence why thisshould be a major effect however, so we do not take it into ac-count. From Table 1, the limiting magnitude for each objectis fainter than mHLIRG + 3 except for two cases; the imagefor F10119+1429 reaches mHLIRG +2.18, and the image forF14218+3845 reaches mHLIRG + 2.94. In both these caseshowever the limiting depth is sufficiently near mHLIRG + 3that the N0.5 statistic is still usable.
5 RESULTS
5.1 Clustering statistics
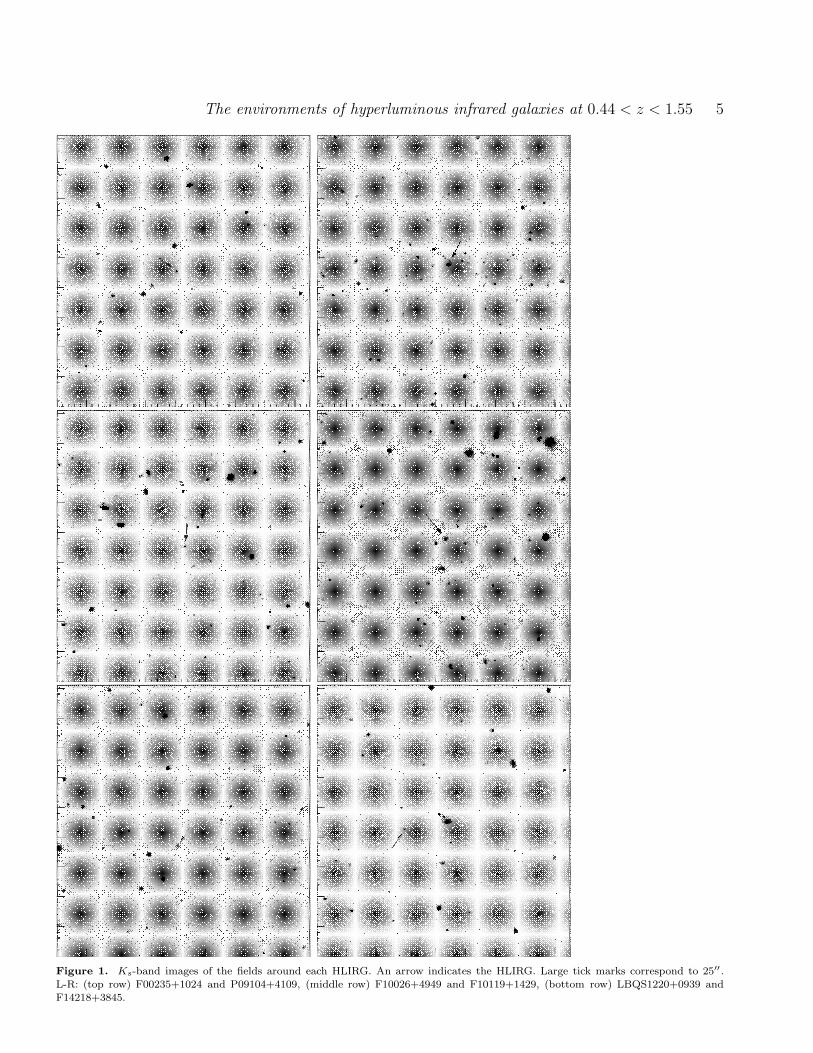
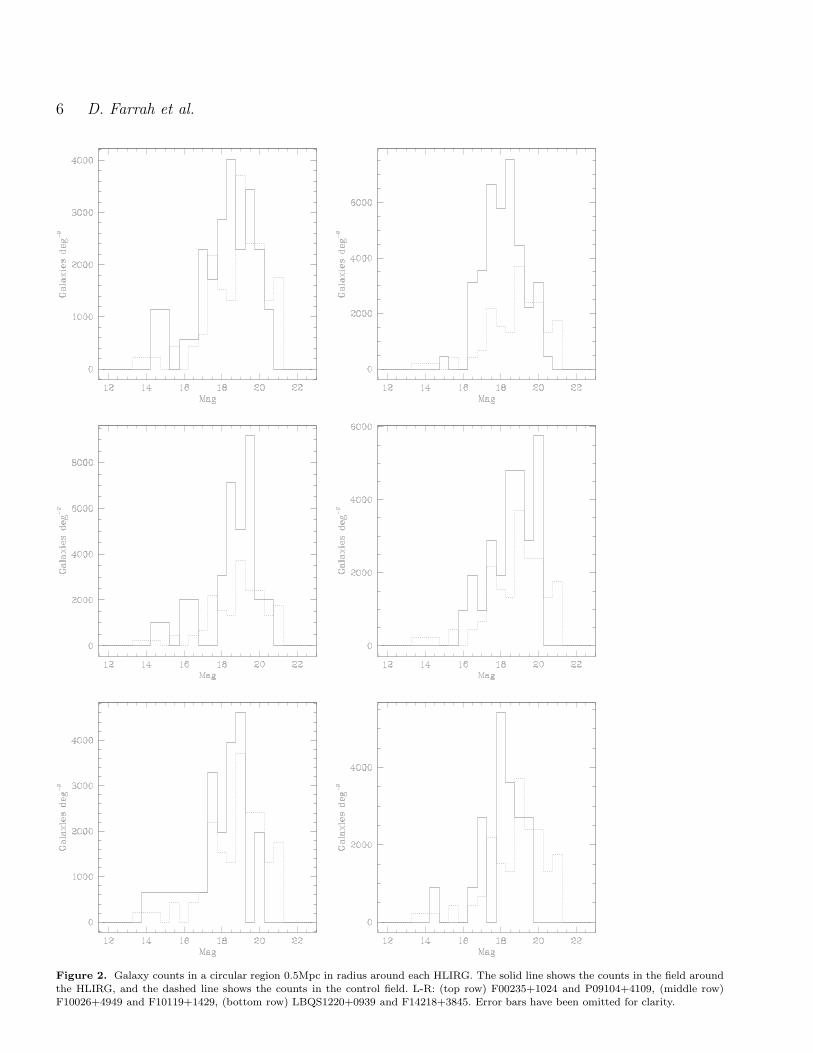
Images of the fields around each HLIRG are presented inFigure 1. In Figure 2 we plot the galaxy counts in a 0.5Mpcregion around each HLIRG, and the counts for the asso-ciated control field. The Bgh and N0.5 statistics for eachobject, and their errors, are given in Table 2. We also quotethe approximate Abell classes of our sample in this table,based on the conversions given by Hill & Lilly (1991), inour cosmology. We note however that these conversions arearbitrary, and hence we base our quoted Abell classes onboth the Bgh and N0.5 statistics.
A wide variety of environments can be seen amongst
The environments of hyperluminous infrared galaxies at 0.44 < z < 1.55 5
Figure 1. Ks-band images of the fields around each HLIRG. An arrow indicates the HLIRG. Large tick marks correspond to 25′′.L-R: (top row) F00235+1024 and P09104+4109, (middle row) F10026+4949 and F10119+1429, (bottom row) LBQS1220+0939 andF14218+3845.
6 D. Farrah et al.
Figure 2. Galaxy counts in a circular region 0.5Mpc in radius around each HLIRG. The solid line shows the counts in the field aroundthe HLIRG, and the dashed line shows the counts in the control field. L-R: (top row) F00235+1024 and P09104+4109, (middle row)F10026+4949 and F10119+1429, (bottom row) LBQS1220+0939 and F14218+3845. Error bars have been omitted for clarity.

The environments of hyperluminous infrared galaxies at 0.44 < z < 1.55 7
the objects in the sample. P09104+4109 resides in an Abell2 cluster, in agreement with previous results (Hines & Wills1993). For the remaining objects, three reside in poor en-vironments, and two, F10026+4949 and F10119+1429, re-side in clusters, of Abell class 1 and 0 respectively, thoughwe note that the detection of clustering for F10119+1429is marginal, at ∼ 2.5σ. Excluding P09104+4109, the errorweighted mean clustering amplitude for the remaining 5 ob-jects is 〈Bgh〉 = 190 ± 45Mpc1.77 .
We can compare the values of N0.5 and Bgh to eachother, as these quantities have been used by many previousauthors, and a well defined relation has been found betweenthem. Hill & Lilly (1991) derive Bgh ∝ 30N0.5. In Figure 3we plot this relation, together with Bgh vs. N0.5 for theobjects in our sample, and the conversions between Bgh
and Abell class given by Hill & Lilly (1991). We also plotthe best fit linear relation between Bgh and N0.5 for ourdata. The best fit is well matched to the relation derivedby Hill & Lilly (1991) and the objects in the sample followthis relation closely, hence we conclude that our computedvalues of N0.5 and Bgh are reasonable.
5.2 Error budget
The errors quoted in Table 2 for the Bgh and N0.5 statisticsare only the counting errors, and do not include three fur-ther, potentially important sources of error. In this section,we discuss these three error sources in turn.
The first of these is the luminosity function assumedin calculating the Bgh statistic. Due to the uncertainties inthe high redshift Ks-band LF used in this paper, this is animportant issue to address. Yee & Lopez-Cruz (1999) haveexamined the sensitivity of Bgh to the form of the LF, andfind that an error in the assumed value of M∗ of up to±0m.5 will still yield essentially the same results. Similarly,an error in α of up to ±0.3 will only affect Bgh by at most∼ 20%. Although the K band LF is not well constrained atthe redshifts of our targets, we do not expect that the trueLF differs from our assumed LF by such gross margins, andtherefore we conclude that uncertainties in our computedBgh statistics due to the assumed LF are at most 10%.
The second of these error sources is the method used tocompare the data to the luminosity function in calculatingthe Bgh statistic. This can be done in two ways. The datacan be k-corrected to the rest-frame Ks-band, and comparedto the Ks-band luminosity function given by Pozzetti et al(2003), or the data can be compared directly to the J bandluminosity function presented by Pozzetti et al (2003), with-out applying a k-correction, as observed frame Ks-band ap-proximately samples rest-frame J band at the redshifts ofour sample. Both methods have advantages and disadvan-tages; the rest-frame Ks-band is a less contaminated tracerof evolved stellar mass than the J band, but suffers from theextra uncertainties introduced by applying k-corrections. Al-though we chose to k-correct our data to the rest-frame Ks-band, we also examined the effect of comparing our data di-rectly to the rest-frame J-band luminosity function, withoutapplying k-corrections. We computed Bgh and σBgh
with-out applying k-corrections, and using the J-band luminos-ity function from Pozzetti et al (2003), and found that theBgh values were within 1σ of the values computed usingk-corrections and the Ks-band luminosity function for all
Figure 3. Bgh vs. N0.5 for our sample. Filled hexagons are theAbell calibrations taken from Hill & Lilly (1991), stars are ourdata. The solid line shows the relation Bgh ∝ 30N0.5 found byHill & Lilly (1991). The dashed line is a least squares fit of ourdata, which gives Bgh = 29.07N0.5 + 14.95
the objects except F10119+1429, which was within 1.5σ.Furthermore, each object still resided within the same typeof environment as before, with P09104+4109, F10026+4949and F10119+1429 residing in clusters (with the same signifi-cance of detection of clustering) and the other 3 objects lyingin the field. The values of Bgh and σBgh
were however in allcases slightly higher using the J-band luminosity functionand no k-corrections, with F10026+4949 and F10119+1429predicted to (just) lie in Abell 2 clusters. We conclude thatusing the Ks-band luminosity function with k-corrections,or just the J-band luminosity function, will not significantlychange our results, and that our choice of using the Ks-band luminosity function with k-corrections was the mostconservative.
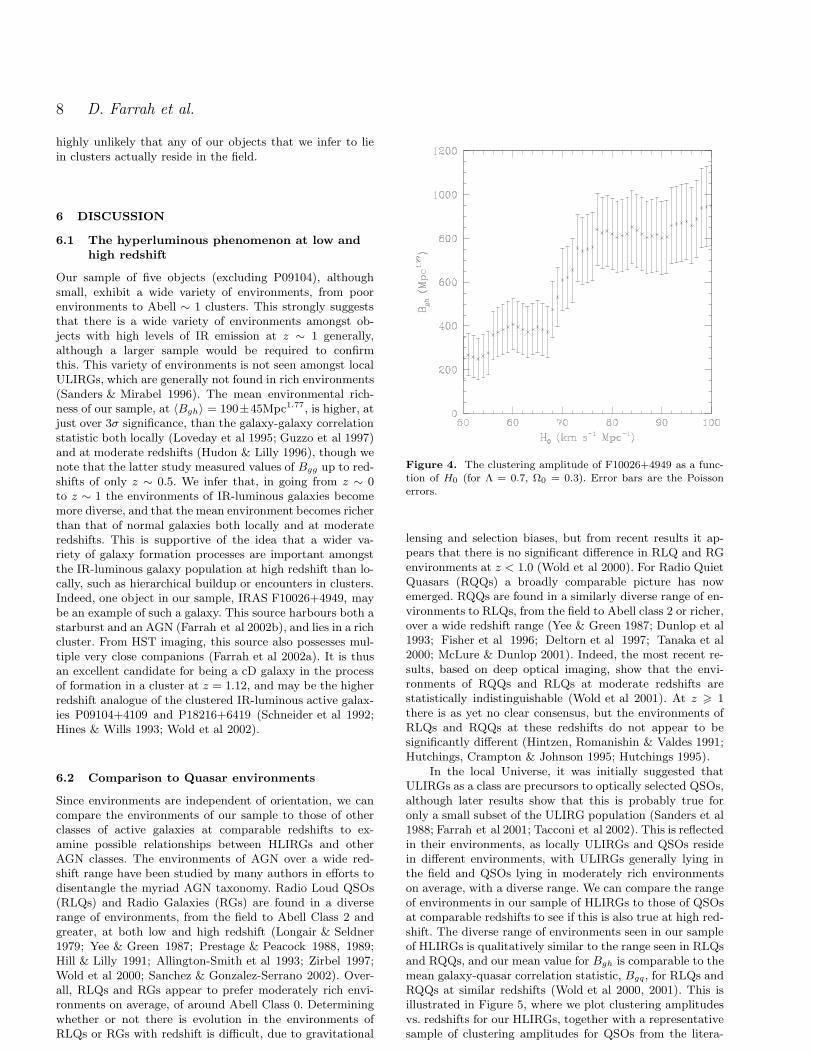
The third of these error sources is the choice of cosmol-ogy. Whilst both Bgh and N0.5 are relatively insensitive tothe choice of Λ and Ω0, the sensitivity to H0 is marked, par-ticularly in the range 65 < H0 < 80. This is illustrated inFigure 4, where we have plotted Bgh as a function of H0 forF10026+4949. By varying H0 over a relatively small range,the effect on Bgh is dramatic, changing from Bgh ∼ 350 forH0 = 65 to Bgh ∼ 800 for H0 > 75. Most current measure-ments of H0 produce values in the range 70 to 75, albeitwith a significant error (Freedman et al (2001) and refer-ences therein). Our adopted value of H0 = 70, and thereforeour derived clustering amplitudes, are therefore conserva-tive.
In summary, we conclude that, whilst there are fur-ther, significant sources of error than the Poisson errorson the derived clustering statistics, none of these sources oferror should significantly change our results. Furthermore,we have in all cases adopted the most conservative methodpossible in computing the clustering amplitudes, making it
8 D. Farrah et al.
highly unlikely that any of our objects that we infer to liein clusters actually reside in the field.
6 DISCUSSION
6.1 The hyperluminous phenomenon at low and
high redshift
Our sample of five objects (excluding P09104), althoughsmall, exhibit a wide variety of environments, from poorenvironments to Abell ∼ 1 clusters. This strongly suggeststhat there is a wide variety of environments amongst ob-jects with high levels of IR emission at z ∼ 1 generally,although a larger sample would be required to confirmthis. This variety of environments is not seen amongst localULIRGs, which are generally not found in rich environments(Sanders & Mirabel 1996). The mean environmental rich-ness of our sample, at 〈Bgh〉 = 190±45Mpc1.77, is higher, atjust over 3σ significance, than the galaxy-galaxy correlationstatistic both locally (Loveday et al 1995; Guzzo et al 1997)and at moderate redshifts (Hudon & Lilly 1996), though wenote that the latter study measured values of Bgg up to red-shifts of only z ∼ 0.5. We infer that, in going from z ∼ 0to z ∼ 1 the environments of IR-luminous galaxies becomemore diverse, and that the mean environment becomes richerthan that of normal galaxies both locally and at moderateredshifts. This is supportive of the idea that a wider va-riety of galaxy formation processes are important amongstthe IR-luminous galaxy population at high redshift than lo-cally, such as hierarchical buildup or encounters in clusters.Indeed, one object in our sample, IRAS F10026+4949, maybe an example of such a galaxy. This source harbours both astarburst and an AGN (Farrah et al 2002b), and lies in a richcluster. From HST imaging, this source also possesses mul-tiple very close companions (Farrah et al 2002a). It is thusan excellent candidate for being a cD galaxy in the processof formation in a cluster at z = 1.12, and may be the higherredshift analogue of the clustered IR-luminous active galax-ies P09104+4109 and P18216+6419 (Schneider et al 1992;Hines & Wills 1993; Wold et al 2002).
6.2 Comparison to Quasar environments
Since environments are independent of orientation, we cancompare the environments of our sample to those of otherclasses of active galaxies at comparable redshifts to ex-amine possible relationships between HLIRGs and otherAGN classes. The environments of AGN over a wide red-shift range have been studied by many authors in efforts todisentangle the myriad AGN taxonomy. Radio Loud QSOs(RLQs) and Radio Galaxies (RGs) are found in a diverserange of environments, from the field to Abell Class 2 andgreater, at both low and high redshift (Longair & Seldner1979; Yee & Green 1987; Prestage & Peacock 1988, 1989;Hill & Lilly 1991; Allington-Smith et al 1993; Zirbel 1997;Wold et al 2000; Sanchez & Gonzalez-Serrano 2002). Over-all, RLQs and RGs appear to prefer moderately rich envi-ronments on average, of around Abell Class 0. Determiningwhether or not there is evolution in the environments ofRLQs or RGs with redshift is difficult, due to gravitational
Figure 4. The clustering amplitude of F10026+4949 as a func-tion of H0 (for Λ = 0.7, Ω0 = 0.3). Error bars are the Poissonerrors.
lensing and selection biases, but from recent results it ap-pears that there is no significant difference in RLQ and RGenvironments at z < 1.0 (Wold et al 2000). For Radio QuietQuasars (RQQs) a broadly comparable picture has nowemerged. RQQs are found in a similarly diverse range of en-vironments to RLQs, from the field to Abell class 2 or richer,over a wide redshift range (Yee & Green 1987; Dunlop et al1993; Fisher et al 1996; Deltorn et al 1997; Tanaka et al2000; McLure & Dunlop 2001). Indeed, the most recent re-sults, based on deep optical imaging, show that the envi-ronments of RQQs and RLQs at moderate redshifts arestatistically indistinguishable (Wold et al 2001). At z > 1there is as yet no clear consensus, but the environments ofRLQs and RQQs at these redshifts do not appear to besignificantly different (Hintzen, Romanishin & Valdes 1991;Hutchings, Crampton & Johnson 1995; Hutchings 1995).
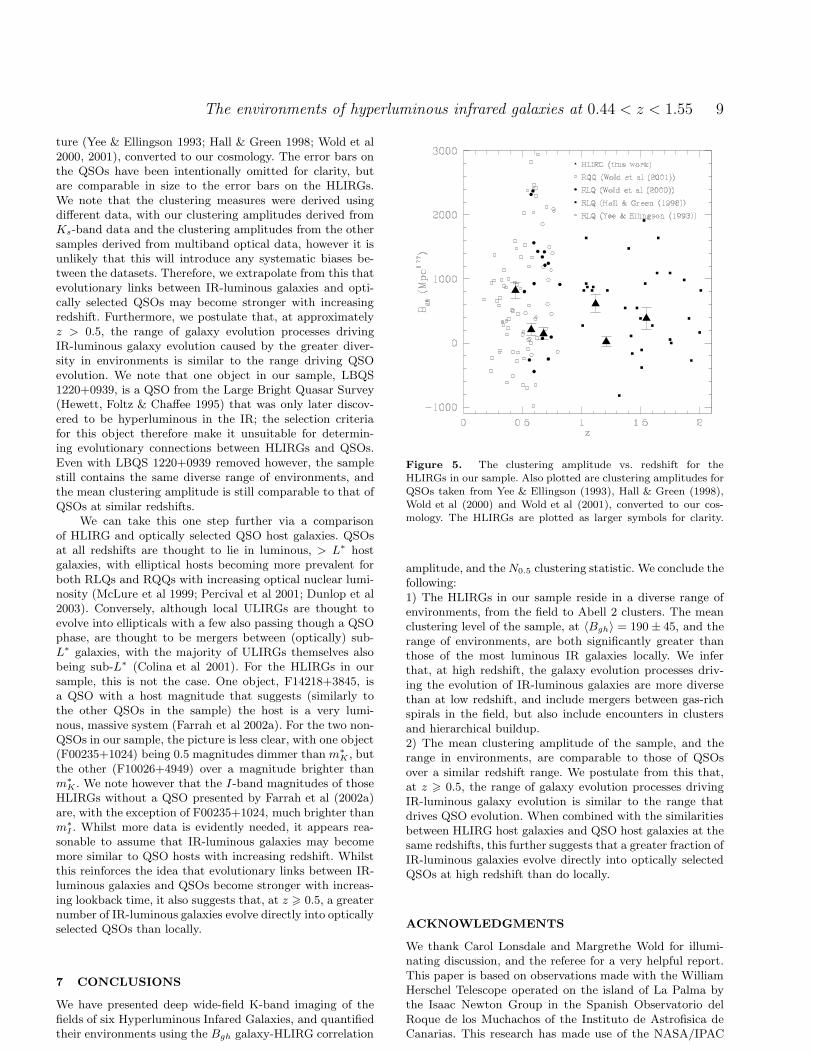
In the local Universe, it was initially suggested thatULIRGs as a class are precursors to optically selected QSOs,although later results show that this is probably true foronly a small subset of the ULIRG population (Sanders et al1988; Farrah et al 2001; Tacconi et al 2002). This is reflectedin their environments, as locally ULIRGs and QSOs residein different environments, with ULIRGs generally lying inthe field and QSOs lying in moderately rich environmentson average, with a diverse range. We can compare the rangeof environments in our sample of HLIRGs to those of QSOsat comparable redshifts to see if this is also true at high red-shift. The diverse range of environments seen in our sampleof HLIRGs is qualitatively similar to the range seen in RLQsand RQQs, and our mean value for Bgh is comparable to themean galaxy-quasar correlation statistic, Bgq, for RLQs andRQQs at similar redshifts (Wold et al 2000, 2001). This isillustrated in Figure 5, where we plot clustering amplitudesvs. redshifts for our HLIRGs, together with a representativesample of clustering amplitudes for QSOs from the litera-
The environments of hyperluminous infrared galaxies at 0.44 < z < 1.55 9
ture (Yee & Ellingson 1993; Hall & Green 1998; Wold et al2000, 2001), converted to our cosmology. The error bars onthe QSOs have been intentionally omitted for clarity, butare comparable in size to the error bars on the HLIRGs.We note that the clustering measures were derived usingdifferent data, with our clustering amplitudes derived fromKs-band data and the clustering amplitudes from the othersamples derived from multiband optical data, however it isunlikely that this will introduce any systematic biases be-tween the datasets. Therefore, we extrapolate from this thatevolutionary links between IR-luminous galaxies and opti-cally selected QSOs may become stronger with increasingredshift. Furthermore, we postulate that, at approximatelyz > 0.5, the range of galaxy evolution processes drivingIR-luminous galaxy evolution caused by the greater diver-sity in environments is similar to the range driving QSOevolution. We note that one object in our sample, LBQS1220+0939, is a QSO from the Large Bright Quasar Survey(Hewett, Foltz & Chaffee 1995) that was only later discov-ered to be hyperluminous in the IR; the selection criteriafor this object therefore make it unsuitable for determin-ing evolutionary connections between HLIRGs and QSOs.Even with LBQS 1220+0939 removed however, the samplestill contains the same diverse range of environments, andthe mean clustering amplitude is still comparable to that ofQSOs at similar redshifts.
We can take this one step further via a comparisonof HLIRG and optically selected QSO host galaxies. QSOsat all redshifts are thought to lie in luminous, > L∗ hostgalaxies, with elliptical hosts becoming more prevalent forboth RLQs and RQQs with increasing optical nuclear lumi-nosity (McLure et al 1999; Percival et al 2001; Dunlop et al2003). Conversely, although local ULIRGs are thought toevolve into ellipticals with a few also passing though a QSOphase, are thought to be mergers between (optically) sub-L∗ galaxies, with the majority of ULIRGs themselves alsobeing sub-L∗ (Colina et al 2001). For the HLIRGs in oursample, this is not the case. One object, F14218+3845, isa QSO with a host magnitude that suggests (similarly tothe other QSOs in the sample) the host is a very lumi-nous, massive system (Farrah et al 2002a). For the two non-QSOs in our sample, the picture is less clear, with one object(F00235+1024) being 0.5 magnitudes dimmer than m∗
K , butthe other (F10026+4949) over a magnitude brighter thanm∗
K . We note however that the I-band magnitudes of thoseHLIRGs without a QSO presented by Farrah et al (2002a)are, with the exception of F00235+1024, much brighter thanm∗
I . Whilst more data is evidently needed, it appears rea-sonable to assume that IR-luminous galaxies may becomemore similar to QSO hosts with increasing redshift. Whilstthis reinforces the idea that evolutionary links between IR-luminous galaxies and QSOs become stronger with increas-ing lookback time, it also suggests that, at z > 0.5, a greaternumber of IR-luminous galaxies evolve directly into opticallyselected QSOs than locally.
7 CONCLUSIONS
We have presented deep wide-field K-band imaging of thefields of six Hyperluminous Infared Galaxies, and quantifiedtheir environments using the Bgh galaxy-HLIRG correlation
Figure 5. The clustering amplitude vs. redshift for theHLIRGs in our sample. Also plotted are clustering amplitudes forQSOs taken from Yee & Ellingson (1993), Hall & Green (1998),Wold et al (2000) and Wold et al (2001), converted to our cos-mology. The HLIRGs are plotted as larger symbols for clarity.
amplitude, and the N0.5 clustering statistic. We conclude thefollowing:1) The HLIRGs in our sample reside in a diverse range ofenvironments, from the field to Abell 2 clusters. The meanclustering level of the sample, at 〈Bgh〉 = 190 ± 45, and therange of environments, are both significantly greater thanthose of the most luminous IR galaxies locally. We inferthat, at high redshift, the galaxy evolution processes driv-ing the evolution of IR-luminous galaxies are more diversethan at low redshift, and include mergers between gas-richspirals in the field, but also include encounters in clustersand hierarchical buildup.2) The mean clustering amplitude of the sample, and therange in environments, are comparable to those of QSOsover a similar redshift range. We postulate from this that,at z > 0.5, the range of galaxy evolution processes drivingIR-luminous galaxy evolution is similar to the range thatdrives QSO evolution. When combined with the similaritiesbetween HLIRG host galaxies and QSO host galaxies at thesame redshifts, this further suggests that a greater fraction ofIR-luminous galaxies evolve directly into optically selectedQSOs at high redshift than do locally.
ACKNOWLEDGMENTS
We thank Carol Lonsdale and Margrethe Wold for illumi-nating discussion, and the referee for a very helpful report.This paper is based on observations made with the WilliamHerschel Telescope operated on the island of La Palma bythe Isaac Newton Group in the Spanish Observatorio delRoque de los Muchachos of the Instituto de Astrofisica deCanarias. This research has made use of the NASA/IPAC
10 D. Farrah et al.
extragalactic database (NED) which is operated by the JetPropulsion Laboratory, California Institute of Technology,under contract with the National Aeronautics and SpaceAdministration.DF was supported by NASA grant NAG 5-3370 and by the Jet Propulsion Laboratory, California In-stitute of Technology, under contract with NASA. MF andAK were supported by PPARC.
REFERENCES
Allington-Smith J. R., Ellis R., Zirbel E. L., Oemler A.,1993, ApJ, 404, 521
Bertin E., Arnouts S., 1996, A&AS, 117, 393Broadhurst T., Lehar J., 1995, ApJ, 450L, 41Brown R. L., vanden Bout P. A., 1991, AJ, 102, 1956Bushouse H. A., et al, 2002, ApJS, 138, 1Colina L., et al, 2001, ApJ, 563, 546Deltorn J.-M., Le Fevre O., Crampton D., Dickinson M.,1997, ApJ, 483, L21
Dunlop J. S., Taylor G. L., Hughes D. H., Robson E. I.,1993, MNRAS, 264, 455
Dunlop J. S., McLure R. J., Kukula M. J., Baum S. A.,O’Dea C. P., Hughes D. H., 2003, MNRAS, 340, 1095
Eisenhardt P. R., Armus L., Hogg D. W., Soifer B. T.,Neugebauer G., Werner M. W., 1996, ApJ, 461, 72
Elston R., McCarthy P. J., Eisenhardt P., Dickinson M.,Spinrad H., Januzzi B. T., Maloney P., 1994, AJ, 107,910
Farrah D., et al, 2001, MNRAS, 326, 1333Farrah D., Verma A., Oliver S., Rowan-Robinson M.,McMahon R., 2002a, MNRAS, 329, 605
Farrah D., Serjeant S., Efstathiou A., Rowan-Robinson M.,Verma A., 2002b, MNRAS, 335, 1163
Farrah D., Afonso J., Efstathiou A., Rowan-Robinson M.,Fox M., Clements D., 2003, MNRAS, 343, 585
Fisher K. B., Bahcall J N., Kirhakos S., Schneider D. P.,1996, ApJ, 468, 469
Freedman W., et al, 2001, ApJ, 553, 47Graham J. R., Liu M. C., 1995, ApJ, 449L, 29Green S. M., Rowan-Robinson M., 1996, MNRAS, 279, 884Guzzo L., Strauss M. A., Fisher K. B., Giovanelli R.,Haynes M. P., 1997, ApJ, 489, 37
Hall P. B., Green R. F., 1998, ApJ, 507, 558Hewett P. C., Foltz C. B., Chaffee F. H., 1995, AJ, 109,1498
Hill G. J., Lilly S. J., 1991, ApJ, 367, 1Hines D. C., Wills B. J., 1993, ApJ, 415, 82Hintzen P., Romanishin W., Valdes F., 1991, ApJ, 366, 7Hudon J. D., Lilly S. J., 1996, ApJ, 469, 519Hutchings J. B., Crampton D., Johnson A., 1995, AJ, 109,73
Hutchings J. B., 1995, AJ, 109, 928Kleinmann S. G., Hamilton D., Keel W. C., Wynn-Williams C. G., Eales S. A., Becklin E. E., Kuntz K. D.,1988, ApJ, 328, 161
Leech K. J., Rowan-Robinson M., Lawrence A., Hughes J.D., 1994, MNRAS, 267, 253
Longair M. S.. Seldner M., 1979, MNRAS, 189, 433Loveday J., Maddox S. J., Efstathiou G., Peterson B. A.,1995, ApJ, 442, 457
McLure R. J., Kukula M. J., Dunlop J. S., Baum S. A.,O’Dea C. P., Hughes D. H., 1999, MNRAS, 308, 377
McLure R. J., Dunlop J. S., 2001, MNRAS, 321, 515Percival W. J., Miller L., McLure R. J., Dunlop J. S., 2001,MNRAS, 322, 843
Pozzetti L., et al, 2003, A&A, 402, 837Prestage R. M., Peacock J. A., 1988, MNRAS, 230, 131Prestage R. M., Peacock J. A., 1989, MNRAS, 236, 959Rigopoulou D., Spoon H. W. W., Genzel R., Lutz D., Moor-wood A. F. M., Tran Q. D., 1999, AJ, 118, 2625
Rowan-Robinson M., et al, 1991, Nat, 351, 719Rowan-Robinson M., et al, 1997, MNRAS, 289, 490Rowan-Robinson M., 2000, MNRAS, 316, 885Sanchez S. F., Gonzalez-Serrano J. I., 2002, A&A, 396, 773Sanders D. B., Soifer B. T., Elias J. H., Madore B. F.,Matthews, K., Neugebauer G., Scoville N. Z., 1988, ApJ,325, 74
Sanders D. B., Mirabel I. F., 1996, ARA&A, 34, 749Saunders W., et al, 2000, MNRAS, 317, 55Schechter P., 1976, ApJ, 203, 297Schneider D. P., Bahcall J. N., Gunn J. E., Dressler A.,1992, AJ, 103, 1047
Soifer B. T., et al, 1984, ApJ, 278, L71Solomon P. M., Downes D., Radford S. J. E., 1992, ApJ,398L, 29
Tacconi L. J., Genzel R., Lutz D., Rigopoulou D., BakerA. J., Iserlohe C., Tecza M., 2002, ApJ, 580, 73
Tanaka I., Yamada T., Aragon-Salamanca A., Kodama T.,Miyaji T., Ohta K., Arimoto N., 2000, ApJ, 528, 123
Verma A., Rowan-Robinson M., McMahon R., EfstathiouA., 2002, MNRAS, 335, 574
Wilman R. J., Fabian A. C., Crawford C. S., Cutri R. M.,2003, MNRAS, 338, L19
Wold M., Lacy M., Lilje P. B., Serjeant S., 2000, MNRAS,316, 267
Wold M., Lacy M., Lilje P. B., Serjeant S., 2001, MNRAS,323, 231
Wold M., Lacy M., Dahle H., Lilje P. B., Ridgway S. E.,2002, MNRAS, 335, 1017
Yee H. K. C., Green R., 1987, ApJ, 319, 28Yee H. K. C., Ellingson E., 1993, ApJ, 411, 43Yee H. K. C., Lopez-Cruz O., 1999, AJ, 117, 1985Zirbel E., 1997, ApJ, 476, 489