PDF Pre-Calculus - Detroit Public Schools Community District
Upload
khangminh22Category
view
3download
0
- - ----------
Report No. CG-D-10-78 ADA058550 I 111111111i111111111111111111111
THE EMISS IONS AND FUEl ECONOMY OF A DETROIT DIESEL 6-71 ENGINE
BURN ING A ID-PERCENT WATER-IN-FUEL EMULS ION
Robert A. Walter
U.S. DEPARTMENT OF TRANSPORTATION RESEARCH AND SPECIAL PROGRAMS ADMINISTRATION Transportation Systems Center Cambridge MA 02142
. .
:~ . . .
JULY 1978 FINAL REPORT
THIS DOCUMENT IS AVAILABLE TO THE U.S.PUBLIC THROUGH THE DEFENSE DOCUMENTATION CENTER, CAMERON STATION, ALEXANDRIA VA 22314
Prepared for
U.S. DEPARTMENT OF TRANSPORTATION
UNITED STATES COAST GUARD Office.of Research and Oeve1opment
Washington DC 20590
l--REPRODUCEDBY--·-----I
NATIONAL TECHNICAL INFORMATION SERVICE
u. S. DEPARTMENT OF COMMERCE SPRINGFIELD, VA. 22161
l I
--_./

... "...J
NOTICE
This document is disseminated. under the sponsorship . of the Department of Transportation in the interest
of information exchange. The United States Government assumes no liability for its contents or use thereof.
NOTICE 1 ___ ' r
Th~ United States Government does not endorse prouuct~:or manufacturers. Trade or manufacturers' names appear herein solely because they are considered essential to the object of this report.
, ,
, ,

Technical Report Documentation Fage
3. ReCiP~09 No.
.-~
5. Repor' D.:z:! r978j Jul~~ .-
6. P.rfor~onizo"on Code
8. Performl ~. LCiiO t No.
DOTfTSC-USCG-78-~~ 9. Performing Orgonll.otlon Name and Address
U.S. Department of Transportation Research and Special Programs Administration Transportation Systems Center Cambridge MA 02142
12, Sponsoring Agency Nome Clnd Address
U.S. Department of Transportation United States Coast Guard
10. Work Un" No. (T RAIS)
C-~.o.5c II. Contract or Grant No.
Office of Research and Develpoment 14, ponsoring Agency ,-oae
Washington DC 20590 _ ~ S~==~======::::===:::=::::::::=;---==-=,",~~.L..-·-
('liX~:b':7( A:_ VV3Jt: 0/) G-DSA
16. Abstract
Stabilized water-in-fuel emulsions were run in a marine-configured Detroit Diesel 6-71 engine on a dynamometer test stand. Measurements were made of engine performance, fuel consumption, and emissions. The engine was operated at variable speed, variable load conditions to simulate generator loading. In addition, the injection timing was varied from normal to 7.2 0 of retard and 7.2
0 of advance in 3.6
0 intervals. At all test points the engine was run with
both normal fuel and emulsion. The emulsion used was 10% water ~n fuel with 2.5% stabilizer which produced an average droplet s~ze of approximately 1 urn. The engine performed well with emulsion with a slight degradation ~n fuel economy at normal and advanced injection timing and no change at 7.2 0 of retarded injection timing. In general, with emulsions, NO and smoke decreased slightly, UBHC increased significantly and CO either increa~ed or decreased depending on engine speed and load.
17. K.~ Word. 18. Distribution Statement
DIESEL ENGINE, WATER FUEL EMULSION, FUEL ECONOMY, EMISSIONS
This Document is Available to the U.S. Public Through the Defense Documentation Center, Cameron Station Alexandria VA 22314
19. Secu"t~ Clo .. d. <of ,hio repor,1 20. Securi'~ Cloo.d. (of thi 0 pogel 21. No. of Poge. 22. P"ce
UnL! as s i fied Unclassified 82
Form DOT F 1700.7 (8-721 Reproduction of completed page authorized
o D
-


PREFACE
A preliminary study of water in fuel emulsions for use as
an alternative fuel in diesel engines was conducted. The results
reported here are with a 10% water in diesel fuel emulsion and a
boat-size, multi-cylinder engine. Further study is needed to
optimize the many variables involved in such testing. This
work was performed under the auspices of the United States Coast
Guard Office of Research and Development, LCDR J. Sherrard and
T. Marhevko, Project Officers.
·Grateful acknowledgement is made for the assistance of the
following people: R. Kinney and W. Pandolf of Gaulin Corp.,
and R. Roberts and C. Hoppen of TSC.
111

MET
RIC
C
ON
VER
SIO
N
FAC
TOR
S
""FlU
i_,. C
•• ". .
... -
a I,
...
"ic ..
.. u...
_~
."'"',,,
, C ...
. rsi
•••
her
. ''''r
ic •••
•••••.
-
,. 1
0_
1
....
Yo.
....
_.IIi,,,
., T
. f.
,,...
$.....
... ,.
1-
....
..,
h h fi_
.,...,
;
--
UH~
:= LE
N6T
H
-"" _
_ '
0.04
...-
~
CIf
l ~l"_'"
D.t
~
-_
_
1,1
_
..
~
2.5
~' ..
... I...
er
r. -_
.
....
..
1.1
,-.
...
f'I
...
.,
I:"'
~"""
CI
'I"I
--..
',-.-...
0.'
......
yd
,_
_
D.I
_
,
""te
, '.
6
",'~''''''''''''
~
::
=:
Alf
A
AIIE
A •
=
: •
=
awl
....
. ""
"' ..
.. 10
D.I
I ..... in
I::ftw
.
I.'
_
__
'"~.
,.5
-. .
.. c-
..fnI
t... ~
~
WlJ.
.............
W.2
..... 't
'1Ift
i. ttr
..
.,
....
....
..
0.0
1
....
....
. ~1o
rrt1
_ ..
. '
..... Iul~ 1
0
.4
............_~
~
....
.. ,
....
..
O.t
..... "
' •• ,
"til
---.
....
....
....
110
.GaD
ftI
I
2.1
IKft
S
t--'
. ",
,1
.---
m,s
..
2.5
..-,
.1I.
IGfI
'IM
....
,,(J
_
-<
_
0.4
-.......
...
~
-.A
SS
, .. i •• '
1 .A
SS
1"";,
." "
~
-...
....
. 0.
.Gl5
ca
n:..
..
001
Cll
Ull
QI
n ..,
....
9 -
_.,
... ....-
2.J
p
iUld
l ..
Itl
plU
'dli
0.
4.5
....
....
'"
...
==
-~ .. ,,
*,.,
1.1
..
....
. U
IQ
""7'
~~&1
0
.1
.......
-=-=--
---0-
VO
tU'1
f ~
-V
OlU
.E
=
"...,-
,,-
tip
~
faI II
i Ii...
,., =
,.
...
lIf'l-'
0.01
.
III
,..
....
....
....
11
lIb
'h""""
"'"
-I...
I.'
puna
It
..
fhn
d --
=--
., ... t
ht.
....
..
"'.
_ h
..
1.01
..
....
•
~
0..2
4 h
_.
I]
....
O~
"J~.
~J
PI
~'I
0.1
1
111f
t"
_ "\
CIo
IIbc
,,-,
,_.
~
::: ::.
.,.,
...
. ..."
O.J
IS
Ioq
.,
...
c\llll
Wc.
1ft
IIt.
en
.J
l1
li;
gallG
II..
l.a
....
..
I =
-..
. <
utI'e
'-
O.Q
l ""
"'" ..
....
..~,
-
=
n.l
'fll
AT
UlI
f 'I
.. C
I)
,."
C\II
Mc
'fW
d.
0.11
q
,btC
...,...
IIIJ
=
. .
TU
II'U
IAT
UR
f ,l
uc'
l ·c
C
oI_
. ." 1
_
f_,'
'.
=-
_ _
Ill
_
.~
,-""",t
5"
la
fW
C.'
a.u
..
'c
_ ..
....
....
....
....
..,.
....
....
. =
--.,
II
I -,
:s.z
....
8
1
---
---
.• :
/ "~
','
~;',
",'
?,' L
,I~O
, t
I,~ .. ,.
'I~L
ii =
I
-40
-1
0
0 1
0
~
eo
eo
~c
! =
\t.C
J7

Section
1.
2.
3.
4.
5.
6.
CONTENTS
INTRODUCTION ...............•...••...••.••.......
SUMMARY ..•......................................
CONCLUSIONS AND RECOMMENDATIONS ....••....•......
EXPERIMENT ...................•.........•........
Page
1
3
5
9
4.1 Test Engine and Fuels....... ....•.. .... •... 9 4.2 Test Equipment........... .....•............ 11 4.3 Test Procedure............................. 16
RESULTS AND DISCUSSION ......•..••............... 19
5.1 Fuel Economy............................... 21 5.2 Engine-Emissions........................... 31
REFERENCES ......•.....................•......... 73
v

Figure
1.
2.
3.
4.
5 -A.
5-B.
6.
7.
8.
9.
10.
11.
12.
13.
14.
15.
16.
17.
18.
ILLUSTRATIONS
Detroit Diesel (GM) 6-71 Engine ................ .
Gaulin Homogenizer ............................ .
Gaulin Homogenizer Principle of Operation ...... .
TSC Marine Engine Test Cell .................... .
Emulsion Batch #2 400X ........................ ..
Emulsion Batch #2 1000X ....................... ..
Fuel Consumption: Prop Load Curve, Standard Timing ......................................... .
Fuel Consumption: Prop Load Curve, 3.6 0 Retard
Fuel Consumption: Prop Load Curve, 7.20 Retard.
Fuel Consumption: Prop Load Curve, 3.6 0 Advance
Fuel Consumption: 1600 RPM, Variable Load, STD. Timing ..........................................
Fuel Consumption: 1600 RPM, Variable Load, 3.6 0
Retard ......................................... .
Fuel Consumption: 1600 RPM, Variable Load, 3.6 0
Advance ........................................ .
CO :Emissions: Standard Timing ..................
CO Emissions: 3.6 0 Retard Timing ............. /.
CO Emissions: 7.20 Retard Timing ...............
CO Emissions: 3.6 0 Advance Timing ..............
C~ ~missions: 1600 RPM, Variable Load, STD. T1m1ng ......................................... .
CO Emissions: 1600 RPM, Variable Load, 3.6 0
Retard ....... " .......... " I •••••••••• , •••••••••
Page
10
12
12
13
20
20
22
23
24
25
26
27
28
33
34
35
36
37
38
19. CO Emissions: 1600 RPM, Variable Load, 3.6 0
Advance. . . . . . . . . . . . . . . . . . . . . . . . . . . . . . . . . . . . . . . . . 39
Vl

Figure
20.
21.
22.
23.
24.
25.
26.
27.
28.
29.
30.
ILLUSTRATIONS (CONTINUED)
NOx Emissions: Prop Load, Standard Timing ... .
NO Emissions: Prop Load, 3.6 0 Retard ....... . x
NO Emissions: Prop Load, 7.20 Retard ....... . x
NOx Emissions: Prop Load, 3.6 0 Advance ...... .
NO Emissions: 1600 RPM, Variable Load, STD. Ti~ing, ............................. I •••••••••
NO Emissions: 1600 RPM, Variable Load, 3.6 0
Retard ....................................... .
NO Emissions: 1600 RPM, Variable Load, 3.6 0
Ad\5ance ...................................... .
THC Emissions: Prop Load, Standard Timing~ .. .
THC Emissions: Prop Load, 3.6 0 Retard ....... .
THC Emissions: Prop Load, 7.20 Retard ....... .
THC Emissions: Prop Load, 3.6 0 Advance ...... .
31. THC Emissions: 1600 RPM, Variable Load, STD.
Page
40
41
42
43
44
45
46
47
48
49
50
Timing. . . . . . . . . . . . . . . . . . . . . . . . . . . . . . . . . . . . . . . . 51
32.
33.
34.
35.
36.
37.
38.
THC Emissions: 1600 RPM, Variable Load, 3.6 0
Retard ....................................... . 52
THC Emissions: 1600 RPM, Variable Load, 3.6 0
Advance ...................................... . 53
CO 2 Emissions: Prop Load, Standard Timing ... . 54
CO 2 Emissions: Prop Load, 3.6 0 Retard ....... . 55
CO 2 Emissions: Prop Load, 7.20 Retard ....... . 56
CO 2 Emissions: Prop Load, 3.6 0 Advance ...... . 57
CO 2 Emissions: 1600 RPM, Variable Load, 3.6 0
Advance ...................................... . 58
Vl.l.

Figure
39.
40.
41.
42.
43.
44.
45.
46.
Table
l.
2.
ILLUSTRATIONS (CONTINUED)
Opacity: Prop Load, Standard Timing ..........
Opacity: Prop Load, 3.6 0 Retard ..............
Opacity: Prop Load, 7.20 Retard ..............
Opacity: Prop Load, 3.6 0 Advance .............
Exhaust Temp: Prop Load, Standard Timing .....
Exhaust Temp: Prop Load, 3.6 0 Retard .........
Exhaust Temp: Prop Load, 7.20 Retard .........
Exhaust Temp: Prop Load, 3.6 0 Advance ........
TABLES
Emissions Measured And Techniques Used ..•.•..
Engine Speed And Load Test Cycle ......•.......
Page
65
66
67
68
69
70
71
72
Page
14
16
3. Injector Timings For Emulsion Tests........... 17
4. Results Of Fuel And Emulsion Analysis......... 29
5. Actual Percentage Increase Or Decrease In Diesel Fuel Consumption....................... 30
6. Prop Load Curve CO Emiss ions. . . . . . . • • • • • • . . . • . 59
7. Variable Load, Constant Speed Curve CO Emissions 60
8. Prop Load Curve NOx Emissions................. 61
9. Variable Load, Constant Speed Curve NOx Em iss ion 5 • • • • • • • • • • • • • • • • • • • • • • • • • • • • • • • • • • • • • 6 2
10. Prop Load Curve THC Emissions................. 63
11. Variable Load, Constant Speed Curve THC Ern iss ion s ..•...........••..•..•.......• '. . . . . . • 64
viii

1. INTRODUCTION
The U.S. Coast Guard Office of R&D is investigating methods of pro-
ducing water/fuel emulsions, and burning these emulsions in diesel engines
and boilers. Tests performed by EPA and others (Reference 1,2) indicate
that fuel savings and emissions reductions can be achieved when burning
emulsions ~n oil-fired boilers. Emulsions may also improve the fuel con-
sumption and lower the em~ss~ons ~n other combustion processes, including
diesel engines. Diesel engines, because of inherently elevated combustion
temperatures, emit high levels of oxides of nitrogen (NO). Existing x
techniques for NO control in diesels result ~n decreased performance and x
fuel economy and, in some instances, increases in other emissions.
Ini t ial e Hart s ¢(.Re.£eTRnGe-A;-.4.). wi th wa ter / fue 1 emu Is ions in die se 1
engines were directed toward the control of NO~ More recent studies x
~~~ emphasized the use of emulsions to improve fue 1 economy. 'It
Jis believed that in a diesel engine combustion process, emulsified fuel
droplets would undergo micro-explosions that would decrease the heterogen
eity of~th~injector spray pattern and thus increase the efficiency and
fuel economy. Although all data in the literature indicate that emulsions
do lower the levels of NO~and smoke, carbon monoxide (CO) and hydrocarbons x
(HC) generally increase, depending on the amount of water in the emulsion,
and the engine type, speed, and load. Reported fuel economy either de-
creases or increases, again, dependent on the water content, engine type
and design, and engine speed and load. Other possible effects, such as
increased fuel injector corrosion, water dilution of the lubricating
1

---------~il, and the possibility of increased combustion chamber deposits have
not been studied.
The task reported here is a preliminary investigation of water/fuel
emulsions in a GM6-7l engine. Surface active agents (surfactants), were
used to produce the emulsions for this task. The purposes of this pre-
liminary effort were to resolve the conflicting results in the literature,
assess potent,ial problem areas, and aid in formulating future efforts .
.. -~--------- -
2

2. SUMMARY
The objectives of this study have been accomplished. These objec
tives were:
(1) Investigate the effects of a 10% water in fuel emulsion on the
emissions, fuel consumption, and performance of a GM6-71 engine.
(2) Assess potential operational and procedural problem areas.
(3)' Formulate future efforts in this area.
Emulsions are suspensions of small droplets of one liquid 1n
another liquid (the two liquids do not mix). The stability of the
emulsion is dependent on the characteristics of the liquids and the
size of the droplets. We define temporary emulsions as containing
droplets of 1 urn in diameter or larger, and permanent emulsions as
containing droplets of I um or less. In some instances, chemical emulsi
fiers or surfactants are used to increase the permanence of emulsions.
The use of these chemicals introduces another variable into the combus
tion process. They could affect the performance and emissions and
ultimately increase the cost of using an emulsion.
Two major problem areas remain to be resolved:
(1) Can water/fuel emulsions be produced of sufficient stability,
without the use of surfactants, as a fuel for diesel engines?
(2) Are water/fuel emulsions effective in lowering NOx emissions
and improving the fuel economy of diesel engines without compromising
other emissions or performance parameters?
This report addresses the second problem area by evaluating water/fuel
emulsions in a GM6-7l diesel engine. These pre1imin~ry tests used an emulsion
of 10% water and 2.5% surfactant by volume in diesel fuel. This emulsion was
produced in a homogenizing device manufactured by Gaulin Corp. Everett
3

Mass. The evaluation was performed in the Marine Engine Test Cell (Reference
6). The GM6-71 engine emissions, fuel consumption, and other performance
parameters were measured as a function of speed and load using diesel
fuel alone, diesel fuel with surfactant, and emulsion. In order to
simulate actual Coast Guard operating conditions, we performed the tests
under speeds and loads encountered when the engine is used as propulsion
(propeller-load curve) and when used as a ship-service generator (constant
speed, variable load curve). As the introduction of water in the fuel
would alter the time-pressure profile of the combustion process, the
fuel injection was varied between 7.2 0 retard and 3.6 0 advance in an
effort to optimize the timing for this particular emulsion. Both base-
line (diesel fuel only) and emulsion tests were performed at four different
timing settings.
4

3. CONCLUSIONS AND RECOMMENDATIONS
Based on the results reported in Section 5, we'have reached the
following conclusions:
o The droplet size of the emulsion, made with surpactants, used
for these tests was measured to be approximately l~m and the
emulsions were stable for up to four weeks.
o The GM6-71 engine would start and run on the emulsion. With
pmlllsions, the avera~e fuel consumption (lb/hr) per test
cycle was unchanged at 7.2° retarded timing and increased from
3% to 7.5% at other timing settings. However, fuel consumption
decreased 1% to 2% at certain low speed and load conditions
with retarded timing in tests with both simulated prop and
generator loading curves.
o With emulsions, the NO emissions ranged from a decrease of x
50% to a 10% increase, depending on speed, load, and timing.
o With emulsions, CO emissions ranged from a 28% decrease at
high speeds and loads to an increase of over 100% at idle
conditions.
o With emulsions, HC emissions ranged from an increase of 8% to
140%, depending on speed, load and timing.
o With emulsions, smoke opacity remained basically unchanged at
low speeds and loads and decreased up to 50% at high speeds
and loads.
o Exhaust temperatures decreased 5% with emulsions over the whole
operating range.
o Other emissions (C02 and 02)' as well as performanc~ parameters,
were basically unchanged.
5

o Retarded timins was the most effective setting for 10% water
emulsions.
It is recommended that further preliminary studies sho~ld be under
taken to optimize the following variables related to water/fuel emulsions
in diesel engines:
-1- Water content of the emulsion
-2- Emulsion droplet size
-3- Injection timing
The water content of the emulsions should be varied between 5% and
50% and the droplet sized measured by microscopy. It will be necessary
to optimize engine timing for each water/fuel mixture tested. Transducers
should be used to record individual cylinder pressure-time and pressure
volume profiles. A cost-benefit analysis should be performed whenever
sufficient data from this or other efforts are avilable. This study
should consider the benefits of potential fuel savings with emulsions
based on CG fleet total and class fuel consumption data verses costs of
shipboard emulsion production (hardware, maintenance and fuel), as well
as the need for fresh water production and tanking requirements. If the
data on anticipated fuel savings with emulsions are not available in six
months, analyses should be developed using assumed fuel savings of, for
instance, 1%, 2%, 5% and 10%. These analyses will permit the Coast
Guard to determine a fuel savings break-even point. If the tasks outlined
in the previous recommendations produce favorable results for the use of
emulsions, further extensive testing should be performed with different
engine types, injector systems, and combustion chambers. Special emphasis
should be on those engines that are the large fuel users of the Coast
Guard fleet. Tests should also be performed on the possible long term
6

effects of injector system corrosion, lubricating oil dilution and
possible increases in engine deposits and wear.
7/8


4. EXPERIMENT
This section briefly describes the engine, fuels, experimental equipment
and procedures used in this preliminary test. Only those details of the
experiment that are salient to the understanding of the results will be
discussed. A more detailed explanation of the experimental equipment can
be found in Reference 6.
4.1 TEST ENGINE AND FUELS
The engine used for these tests was a Detroit Diesel (GM) 6-71 two-stroke
cycle diesel rated 200 hp at 2000 rpm (Figure 1). The engine was marine
configured with a 1:06 to 1 reduction gear and a cooling-water heat exchanger.
The engine was on loan from the USCG Boston Support Center and had recently
been rebuilt by them. We have logged approximately 200 hrs of operating
time on the engine since this rebuilding. For the tests, the engine was
equipped with rebuilt type HV-7 injectors. The engine and injector set-up
are typical of the older style 71 series engines found in the Coast Guard
Fleet as main propulsion on boats and as ship-service generators on smaller
cutters. We performed two modifications on this. engine:
(1) Removal of the fuel-line filters to assure that the filtering
action would not "break down" the emulsion.
(2) Injector timing changes in an effort to optimize emulsion
combustion properties to engine compression characteristics.
The diesel fuel used was a standard commercial grade DF-2 fuel
that meets Mil F-16884F specifications. Gaulin Corp., Everett Mass.,
prepared the emulsions. The diesel fuel was batch mixed with 10%
water and 2.5% emulsifying agent (by volume). This mixture was then
emulsified by a Gaulin Homogenizer (Figure 2). This· unit uses a high
pressure (up to 8000 psig) positive displacement pump to force
9


the liquid product through a special homogenizing valve (Figu~e 3). This
valve emulsifies the product by shearing, cavitation, impaction, and
implosion. The pump was operated at 3000 psig pressure to produce the
water/fuel emulsions for this test. The emulsion droplet sizes were
determined by optical microscopy. Samples of the emulsion were bottled
and observed to determine demulsification times.
The emulsifying agent (2.5% by volume) used to produce this emulsion
was a mixture of two commercial products manufactured by leI, Wilmington,
DE, having the tradenames, Span SO and Tween SO. The Span-type materials
are partial esters of the common fatty acids (in this case oleic) and
hexital anhydrides. The Tween-type materials are derived from the Span-type
by adding polyoxyethylene chains to the nonesterified hydroxyls. The
mixture used here is 2.02% Span SO and 0.4S% Tween SO.
Samples of the diesel fuel, diesel fuel and emulsifier, and the
emulsion were analyzed, by ASTM methods, for hydrogen, carbon and water
content as well as specific gravity. For the emulsion analysis, the water
was first removed by centrifugation, and the remaining diesel fuel analyzed
for water content, specific gravity, hydrogen, and carbon.
4.2 TEST EQUIPMENT
The tests were performed at the TSC Marine Engine test cell (Figure
4). A water-brake type dynamometer was used for engine power absorption.
We measured engine emissions, fuel consumption, and performance para
meters at the various speed and load conditions given in Section 4.3.
Table 1 gives the emissions measured and the measurement techniques used.
11

......
N
FIG
UR
E 2
. G
AU
LIN
H
OM
OG
ENIZ
ER
DIS
CH
AR
GE
STA
GE
Hal
la
DR
S.M
.D.
ASS
EIIB
LY
Ver
tica
l se
ctio
n
of
fuel
en
ergy
co
nv
ener
va
lve
aaem
.bly
sh
owin
g fl
uid
flow
.
Th
e h
.. ic
pri
nci
ple
of
the
F.E
.C.
is t
he
mn
tro
l
of
Hui
d ve
loci
ty
thro
ug
h
an
adju
stab
le.
reo
stri
cted
or
ific
e.
Th
e
pro
du
ct
at
hig
h
pres
sure
ee
ten
it
con
trol
led
c1e
arnn
ce a
rea
bet
wee
n
the
valv
e (A
) an
d
seat
(B
).
At
this
po
int,
en
erg
y
wh
ich
has
bee
n s
tore
d a
s pr
essu
re i
s in
sr.a
nla
ne·
ousl
y re
leas
ed a
s a
high
vel
ocit
y st
ream
.
Vel
ocit
y is
a
fun
ctio
n
of
con
vers
ion
pr
essu
re
and
may
be
in e
xces
s of
950
ft.
per
sec
ond.
In
th
e h
igh
vel
ocit
y ar
ea.
betw
een
A
and
B.
the
pro
du
ct
is su
bjec
ted
to
inte
nse
turb
ulen
ce.
hydr
auli
c sh
ear
and
c3vi
lali
on.
Th
e p
rod
uct
th
en e
mer
ges
from
[h
e co
ntr
olle
d
clea
ran
ce
area
an
d
imp
inge
s w
ith
sh
atte
rin
g fo
rce
and
ch
ange
of
dir
ecti
on
on
the
imp
an
rin
g
(C).
T~is s
erie
s o
f an
ion
s, o
ccur
ring
in
as'
sh
on
an
inte
rval
as
a m
icro
-sec
ond.
is
the
proc
ess.
FIG
UR
E 3
. G
AU
LIN
H
OM
OG
ENIZ
ER
PRIN
CIP
LE
OF
O
PERA
TIO
N

'~:::f :.J<:,~._
"~:s.,,,,~,.,~
~:;t~~i~ 13

'.::J
TABLE 1.
Emission
Carbon monoxide (CO)
Carbon dioxide (C02
)
Oxygen (02)
Hydrocarbons (HC)
Oxides of Nitrogen
Smoke ?,
EMISSIONS MEASURED AND TECHNIQUES USED
~--------~----.~

4.2.2 Chemiluminescence Analyzer with Converter for NO and NOx (Scott Model
125)
NO is measured by ovserving the light produced from the decay of an
excited state of N02 formed when NO reacts with ozone (03
), The NO ~s x
converted to NO is a heated converter for subsequent analysis and measurement
by the chemiluminescence technique. This instrument has seven switch-
selectable ranges with full-scale readings from 2.5 to 10,000 ppm.
4.2.3 Paramagnetic Analyzer for 02 (Scott Model 105)
Oxygen is a paramagnetic gas. When a laminar flow of gas containing 02
~s directed through a magnetic field, a pressure-sensitive detector measures
the gradient developed across a gas stream, and produces a signal proportional
to the amount of 02 in the stream. This instrument has four ranges: 0 to 1%,
o to 5%, 0 to 10%, and 0 to 25%.
4.2.4 Flame-Ionization Detector (FID) For THC (Scott Model 215)
Total hydrocarbons are measured.with a flame-ionization detector. Carbon
atoms are "burned" in a clean hydrogen flame, forming ions and free electrons.
A fraction of these electrons produces a current proportional to the hydro-
carbon atoms present. This instrument employs a totally heated sampling
train to eliminate hydrocarbon condensation. The FID has 11 ranges from 1
ppm to 10 pph.
4.2.5 Data Recorders (Scott Model 200 Recorders)
Three strip-chart recorders produce a permanent record of the outputs
of the instruments described in Sections 4.2.1 through 4.2.4. The recorders
have 10 switch-selectable speeds from 3 in./hr. to 360 in./hr.
15

4.3 TEST PROCEDURES \
Two engine power and speed test cycles were used. 'The first cycle
duplicated the speed and power conditions that would be encountered by this
engine when it is used for main propulsion on boats (prop. load). The second
test cycle duplicated the conditions encountered when the engine is used as
a ship service generator (generator load), that is,of constant speed and
variable load. Table 2 gives the speeds and loads for these two cycles.
TABLE 2. ENGINE SPEED AND LOAD TEST CYCLE
Prop Load Cycle Generator-Load Cycle
RPM HP RPM HP
700 idle 1600 25
800 15.4 1600 75
1000 28.7 1600 107
1200 47.8 1600 125
1400 73.7
1600 107.1
1800 148.9
2000 200
Because changes in injection timing can change emissions and fuel
consumption, it was necessary to run each test cycle with both standard
fuel and emulsion, so that 14 test cycles, in all, were completed. We ran
105 complete test points where all emissions and performance parameters
were measured. In addition, we repeated test points if any inconsistencies
were noted.
16

As previously mentioned, in an effort l to optimize injector timing, we
ran these test cycles at the various injector timings shown in Table"].
TABLE 3. INJECTOR TIMINGS FOR EMULSION TESTS
Injector Lift BOr(l) EOI(2) Adv(A) or Ret(R) Prop Cycle Gen. Cycle in. deg. deg. from standard
deg.
1. 508 10.4 2.9* 7.2 R X
1.484 14.0 0.7* 3.6 R X X
1.460 17.6 4.2 STD X X
1. 436 21. 2 7.7 3.6 A X X
(1) Beginning of Injection (2) End of Injection
All degress below top dead center except * after top dead center
Generally, the engine was started and idled until operating temp-
eratures, fuel consumption, and emissions had stabilized (approximately
30 minutes). The appropriate speed and load was then applied to the
engine and, again, all parameters were allowed to stablize. All test
cycles were run from low to high power, as previous tests with this
engine indicated that the test order had no effect on results. For
emulsion tests, we generally started the engine on standard diesel fuel and
then switched to the emulsion while the engine was idling. If we were
operating on emulsion at the end of the test day, the engine fuel supply
was switched to standarddlesel fuel before shut-down. The test emulsions
were never left in the engine overnight.
2:ach speed and load condition was maintained until all engine 'pHa-
meters had stabilized. The fuel emulsion consumption rate (lbs/hr) was measured
17

by timing the usage of one-pound multiples. At least three consecutive
measurements of fuel, and fuel-emulsion consumption were taken at each
speed and load condition. The standard deviation for these measurements
varied between 0.5 and 1.5 percent. They were checked for consistency and
averaged to obtain the fuel, or fuel-emulsion consumption rate given in the
results.
18
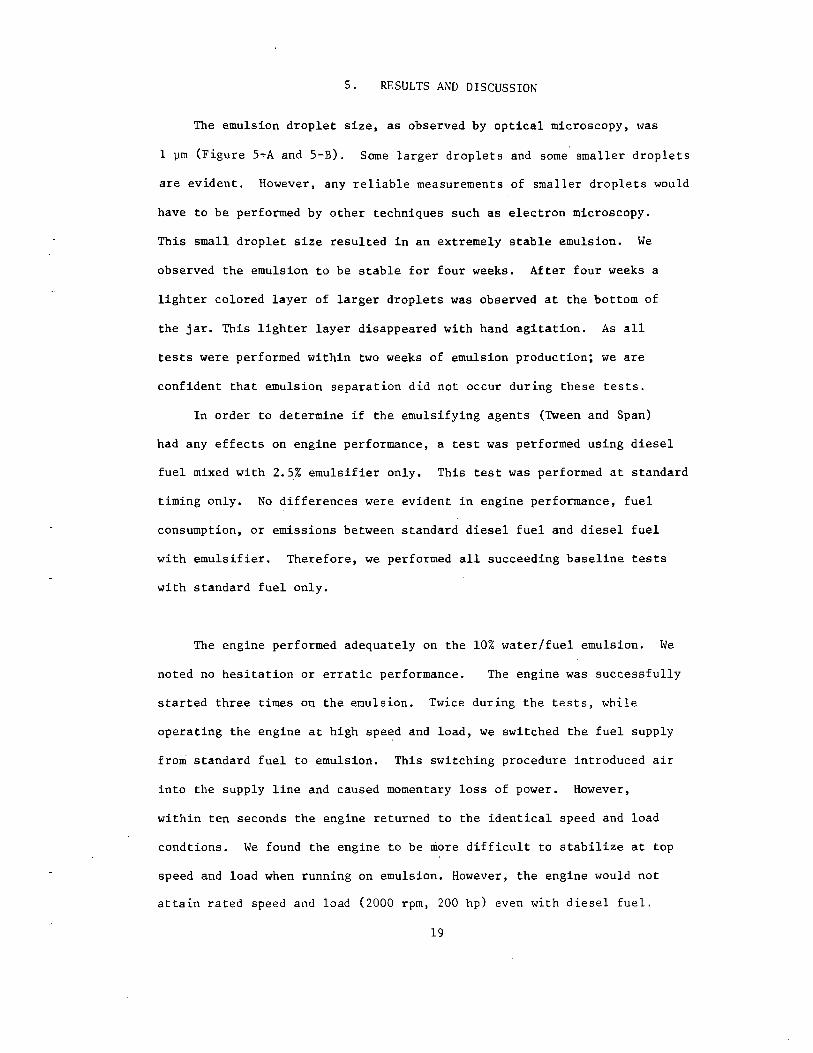
S. RESULTS AND DISCUSSION
The emulsion droplet size, as observed by optical microscopy, was
1 ~m (Figure 5~A and 5-B). Some larger droplets and some smaller droplets
are evident. However, any reliable measurements of smaller droplets would
have to be performed by other techniques such as electron microscopy.
This small droplet size resulted in an extremely stable emulsion. We
observed the emulsion to be stable for four weeks. After four weeks a
lighter colored layer of larger droplets was observed at the bottom of
the jar. This lighter layer disappeared with hand agitation. As all
tests were performed within two weeks of emulsion production; we are
confident that emulsion separation did not occur during these tests.
In order to determine if the emulsifying agents (Tween and Span)
had any effects on engine performance, a test was performed using diesel
fuel mixed with 2.5% emulsifier only. This test was performed at standard
timing only. No differences were evident in engine performance, fuel
consumption, or emissions between standard diesel fuel and diesel fuel
with emulsifier. Therefore, we performed all succeeding baseline tests
with standard fuel only.
The engine performed adequately on the 10% water/fuel emulsion. We
noted no hesitation or erratic performance. The engine was successfully
started three times on the emulsion. Twice during the tests, while
operating the engine at high speed and load, we switched the fuel supply
from standard fuel to emulsion. This switching procedure introduced air
into the supply line and caused momentary loss of power. However,
within ten seconds the engine returned to the identical speed and load
condtions. We found the engine to be more difficult to stabilize at top
speed and load when running on emulsion. However, the engine would not
attain rated speed and load (2000 rpm, 200 hp) even with diesel fuel.
19

FIGURE 5-A. EMULSION BATCH #2 400X
FIGURE 5-B. EMULSION BATCH #2 1000X
20

We attribute this to three factors:
1) Engine age,
2) Engine governor setting,.
3) Drive-train transmission losses.
However, the attainment of top speed and load are not germane to
the results of these tests, as CG boats and cutters are rarely, if ever,
run at full diesel power.
5.1 FUEL ECONOMY
Figures 6 through 12 give the fuel consumption in pounds per hour,
and the specific fuel consumption (SFC) in pounds per horsepower per hour
for standard fuel, and emulsion over each cycle and injection setting
tested. These curves reflect the total fuel consumed (fuel and fuel
plus water). In order to obtain actual changes in fuel economy, we had to
correct the emulsion fuel consumption results for water content. Three
emulsion samples as well as two standard fuel samples and one standard
fuel plus emulsifier sample were analyzed for water content. For the
emulsion analysis, the water was first removed by centrifugation and
measured. Although a clear product remained, the specific gravity
was higher than that for the diesel fuel and emulsifier only. This
led us to believe that centrifugation had not removed the very small
(much less than 1 urn) droplets. Therefore, the remaining water in
the oil was measured by the Karl Fisher titration method. This water
was then added to the water removed by contrifugation to give final
results in Table 4.
21

100
80
40
20
___ IDI ESEL FUEL
---- EMULSION
-.. " " , , .
" ........... ........... ---
1.0
0.8
-- ...... -- ...... -- .. ---- --..... 0.6
0.4
FIGURE 6. FUEL CONSUMPTION: PROP LOAD CURVE, STANDARD TIMING
22
U i-I-o CIl

lOG
80
60
40
20
--- DIESEL FUEL ---- EMULSION
., "
"-
" .... ......... .......... .......... ""
... " .... ,/
;';' 0
-------- ... -- -~
/' "..
,/
/
/ ./
./
" /
/ /
/ /
/
/
1.0
0.8
0.6
0.4
FIGURE 7. FUEL CONSUMPTION: PROP LOAD CURVE, 3.6 0 RETARD
23
u ~ U)

--- DIESEL FUEL ---- EMULSION
1.0
...... 0.8 .......... ..... ......... ----t.. ---
....... -- - - -&-- --_ ....... 0.6
0.4
10
RPM
FIGURE 8. FUEL CONSI~PTION: PROP LOAD CURVE, 7.20 RETARD
24

..... , ...
100
80
60
40
20
DIESEL FUEL EMULSION
,
1.0
... , 0.8 ..... ...... ..... ... , ........
........ ........ . -.... .... 0.6 ........ __ ..a. ___ ---
/ ~
/ /
/
/ /
/
• ,
.4
FIGURE 9. FUEL CONSUMPTION: c PROP LOAD CURVE, 3.6 0 ADVANCE
25
U >.L. CI)

80
60
40
:0
~------------------------------------------------'1.4
•
0\ \ \ \ \
\ \ , , ,
" " , ... ......
STD. FUEL
---- EJ'.1ULS ION
....... . .... ...... .........
Hp
.......... _-_. o
1.2
1.0
0.8
0.6
0.4
~IGURE 10. FUEL CO\SID!PTIO\: 1600 RP~!, \'ARIABLE LOAD, STD. TI'[I\C;
26

\
80
60
40
20
\ \ \
\ , , "-" " .... ........
--- DIESEL FUEL ---- EMULSION
1.2
1.0
0.8
...... "Q-
---- ..... -....._--0.6
- 0.4
Hp
FIGURE 11. FUEL CONSUMPTION: 1600 RPM, VARIABLE LOAD, 3.6 0 RETARD
27

80
60
40
20
T , \ \ \ \ \ \ \ ,
\ '\ '\
'\
" " "
--- DIESEL FUEL ---- EMULSION
..... ...... , ......
............ -- ........ --.!
Hp
1.4
1.2
1.0
0.8
0.6
0.4
U P-. CI)
FIGURE 12. FUEL CONSUMPTION: 1600 RPM, VARIABLE LOAD, 3.6 0 ADVANCE
28

TABLE 4. RESULTS OF FUEL AND EMULSION ANALYSIS
Carbon Hydrogen % bl Wt. % b:z: Wt. c LH Ratio H20% S.eec . Grav.
Diesel Fuel 83.48 13.91 6.00 trace . 8190
Diesel Fuel 82.84 14.13 5.86 trace .8210 & Surfacant
Emulsion* 83.48 13.89 6.01 12.25 .8377
*Avg. of three sampl~s
NOTE: During emulsion preparation, the water was mixed to be 10% volume (11.7 percent weight).
Table 5 gives the results for each test point corrected for water content.
Also given is the percentage increase or decrease in fuel consumption between
the standard fuel and emulsion at each timing setting, as well as the average
increase or decrease in fuel consumption for each injector setting. Two
conclusions are obvious:
(1) Retarded timing gives the best fuel economy with emulsions. Advanced
timine decreases fuel economy.
(2) Low speed and load points give the most favorable emulsion fuel
economy. However, these measured improvements are within ex-
perimental error.
This latter result may be especially important as the majority of Coast
Guard main propulsion operation ~s at lower speeds and loads (1/3, 2/3,
and standard speeds). These three speeds comprIse 80% of the operating
time of the ma~n diesel engines of a 378' Coast Guard High Endurance
Cutter.
29

TABLE 5. ACTUAL PERCENTAGE INCREASE OR DECREASE IN DIESEL FUEL CONSUMPTION
(Based on 12.25 Percent H20 by Weight)
Prop Load
RPM AP.HP Timing STD. 3."6 ~ Ret. 7. t Ret. 3. 6' Ady.
800 15 + 3.45 + 3.95 -3.65 + 3.95
1000 28 + 4.25 - O. 5 -2.55 + 4.55
1200 48 + 3.45 + 4.75 + 2.95 + 9.75
1400 74 + 4.25 + 1.95 -0.55 + 10.75
1600 107 + 3. 05 + 4.35 + 2.25 + 6.95
1800 149 + 5.35 + 3.45 + O. 85 + 8. 55
Mean + 3. 97 + 2.99 -0.12 + 7.42 STD. Dey. + 0.83 + 1. 97 + 2.63 + 2.77
Gen Load
1600 25 +0.35 -3.35 + 2.45
1600 75 + 2.95 + 0.15 + 7.35
1600 107 + 3.05 + 4.35 + 6.95
1600 125 + 2.65 + 1. 05 + 6. 45
Mean + 2. 25 + O. 55 + 5. 80
STD. Dey. + 1.28 + 3.17 + 2.26
30

5.2 ENGINE EMISSIONS
Figures 13 through 3Sgive the emissions of CO, NOxand HC in parts
per million by volume (ppm V), and CO2
emissions in percentages by volume
for each of the test cycles and injection settings. As with the fuel
consumption, we compare the emission results for the standard fuel and
fuel emulsion at the particular timing setting. This approach is
necessary, as the timing changes alone can affect the emission results.
In general, the shapes of the two emission curves (standard fuel and
fuel emulsion) in each figure are similar, except shifted up or down.
This reproducibility of curve shape gives us confidence in our data.
Tables 6 through 11 give the percentage increase or decrease for each
emission (except CO2
) at each test point. Some general observations are
in order:
CO emissions with emulsions increased 27% when averaged over all
test points. The increases were greatest at low speed and load points,
with some decreases measured at high speeds and loads. The generator
load cycle produced less CO than the prop cycle. It would appear that
the CO levels with emulsions are lower at high power levels, regardless
of engine speed.
The NO emissions with emulsion decreased 8% when averaged over all x
test points. The only NO increases were evident at the low speed and x
load points where fuel consumption decreased with emulsions. This
increase is indicative of improved combustion. It is of interest to note
that a more dramatic decrease in NO occurred by just retarding the timing x
to 7.20 with standard fuel. Retarded timing is a method for NO control. x
However, a penalty is usually paid in fuel consumption, performance
31

and other emissions. However, these penalties would not be as severe for
an engine operated over a propeller-load cycle where the po~er at any
speed is generally below rated power at that speed. In fact, there is
some indication that retarded timing increases fuel economy at low
speeds and loads. Retarded timing may be a viable alternative for
emission control in marine engines.
HC increased 35% with emulsions when averaged over all test points.
Contrary to other emissions, there were no test points that showed a
decrease in HC. Because HC are most indicative of fuel injection para
meters, these consistantly higher readings may indicate that the injection
parameters were never at optimum conditions for this emulsion. As
previously mentioned, for these tests the engine was equipped with HV
type injectors. These injectors give higher levels of HC than the
newer N-type injectors However, it can not be said at this time
that this injector design would in anyway contribute to the higher HC
levels with emulsions. The test should be performed with the N-type
injectors.
With emulsions, smoke opacity was unchanged at low speed and loads,
varying between 1% and 3%. At higher speeds and loads, emulsions decreased
opacity as much as 50% (Figure 39-42). The only other engine parameter
that showed any change was exhaust temperature. Exhaust temperature de
creased approximately 5% with emulsion fuel (Figure 43-46). This decreased
exhaust-temperature is consistent with the decreased combustion-tempera
tures caused by the water in the emulsion.
32

1800
1600
140
1200
s; p... 1000 o u
\ 800 \ \
600
o
\ \ ,
\ \
"
--- BASE FUEL ---- EMULSION
/ r;
I
I I
125
/ I
/
I I
I
,
150 IDLE Hp
FIGURE 13. CO EMISSIONS: STANDARD TIMING
33
175

1600
1400
1200
~ ~ 1000 o u
800
600
400
200
'~ , , \ \ ,
0... ...... .....
'0_ -- - -0---
BASE FUEL
EMULSION
o U5 IDLE Hp
FIGURE 14. CO EMISSIONS: 3.6 0 RETARD TIMING
34

2000~------------------------------------------~~
1800
1600
o IDLE
BASE FUEL
EMULSION ----
25 50 75 100 125 150 175 Hp
FIGURE 15. CO EHI SSIONS: 7.20 RETARD THlING
35

-~. p.. p..
a u
1800
1600
1400
1200
\ 1000
, , \ \ \
800
600
400
200
a IDLE
, \ \ ~
\ \ \ \ \ , .... ........
BASE FUEL EMULSION ----
I - :
---
Hp
I I
I I
/ I
I I
/
"
FIGURE 16. CO EMISSIONS: 3.6 0 ADVANCE TIMING
36
175

600
500
400
300
200
100
o IDLE Hp
STD. FUEL
EMULSION
175
FTGURF. 17. CO EMISSIONS: 1600 RPM, VARIABLE LOAD, STD. TIMING
37

:::E: p., p.,
0 u
600
500
400
300
200
100
o IDLE
25 50
___ STD. FUEL
---- EHULSION
7 I I I I I I I I I I I
75 100 125 Hp
150 175
FIGURE 18. CO EMISSION: 1600 RPM, VARIABLE LOAD, 3.6 0 RETARD
38

~ 0..
1000
800
700 -
600
0.. 500 o u
400
300
200
100
o IDLE
STD. FUEL --
EMULSION ----
.............................. ........ "" ....... -..;'/
Hp
7
175
FIGURE 19. CO EMISSIONS: 1600 RPM,VARIABLE LOAD, 3.6 0 ADVANCE
39

1000
90
800
700
600
soo
400
300
200
100
o IDLE
BASE FUEL ---
EMULSION
175 Hp
FIGURE 20. NOx EMISSIONS: PROP LOAD, STANDARD TIMING
40

..,.. """"' ~
900
800
700
600
0.. 500 o z
400
300
200
100
n IDLE Hp
BASELINE EMULSION
175
FIGURE 21. NO EMISSIONS: PROP LOAD, 3.6 0 RETARD x
41

600
500
400
300
200
100
o IDLE
25 50
BASELINE EHULSION
75 100 125 Hp
175
FIGURE 22. NOx EMISSIONS: PROP LOAD, 7.20 RETARD
42

1200
1100
1000
900
800
700
600
500
400
300
77
BASE FUEL --EMULSION ----
Hp 175
FIGURE 23. NOX EMISSIONS: PROP LOAD, 3,6 0 ADVANCE
43

:E p.. p..
0 z
900
800
700
600
500
400
300
200
100
a IDLE
',/
/ /
STD. FUEL
EMULSION
I / r ,
/ /
/ /
/ /
/
----
I I
I I
/ I
I I
) /
/ I
1 /
I /
I I
f' /
75 100 125 Hp
FIGURE 24. NOx EMISSIONS: 1600 RPM, VARIABLE LOAD, STD. TIMING
44

~ j:l.,. j:l.,.
0 Z
800
700
600
500
400
300
200
100
o IDLE
srD. FUEL EMULSION
'/ /'
" ~ ~
./ /
"
, I
I I
I I
I I
I /
/ /
/ /
/ /
/
125 Hp
FIGURE 25. NOx EMISSIONS: 1600 RPM,VARIABLE LOAD, 3.6 0 RETARD
45

~ p.. p..
0 z
lioo r--------------------------,
1100
1000
900
800
700
600
500
400
300
o IDLE
STD. FUEL
EMULSION
I /
/ /
I I
II I
I /
I /
I /
/ /
/ I
I /
/ ,
Hp
I /
FIGURE 26. NOxEMISSIONS: 1600 RPM, VARIABLE LOAD, 3.6,° ADVANCE
46

..,.. ",",
~ p,
u ::c ~
50 no
450n
4000
3500
3000
2500
2000
I I
I 1500
I
1000
500
o IDLE
/ /
I ( I I I I I I I I I I I I I
J
25
FIGURE .,'"1 L. I,
BASE FUEL
EMULSION ---- , I
I I
I I
/ I
", I I
I , I / " I
, I , I 'e... _______ ,-J'
I 50
I __ LI ____ ~ ______ L_ ____ ~
75 100 125 150 175 Hp
THe EMISSIONS: PROP LOAD, STANDARD TIMING
47

::2: Cl.. Cl..
u ::c: ~
4500
4000
3500
I 3000 ,
I I I I 2500 I
I I I I
2000 J
1500
1000
500
I I
I I
o IDLE
25
" I \ I
, \ I
I , I
, I ,
I
50
, ...... .... ' ............
BASE FUEL EMULSION
'" ",'"
_4' ,.'"
75 100 125 Hp
",,,,~ ",
175
FIGURE 28. THe EMISSIONS: PROP LOAD, 3.6 0 RETARD
48

4500
4000
3500
3000
2500
2000
1500
1000
500
'" '" ,/
o lDLl:
I I I I I I I I
)
I
BASE FUEL
EMULSION
" I "1 I ' / I', / /' I 1'1
........ -----~
75 100 Hp
125
I
I I
I
,.
150 175
FIGURE 29. THe EMISSIONS: PROP LOAD, 7.20 RETARD
49

" ,5900 5000~----------------------------~-L------------,
4500
4000
3500
3000
2500
2000
1500
1000
500
I /
I I
I
o IDLE
I I
I 9 I I I I I ,
I I I I I I I I I I I
25
/ /
I
BASELINE ~J
" EMUL S I ON----" ,." p-_-----o ,,'
,"
50 75 100 Hp
125 150
FIGURE 30. THC EMISSIONS: PROP LOAD, 3.6 0 ADVANCE
50
175

::E p... p...
u :c E--
sooo
4000
3000
2000
1000
1 I
I
/ /
/
o IDLE
I
STn. FUEL ---
EMULSION
------- ......... --...... / --- .................. ..,./ r---/
Hp
/ /
/
".-
FfCIJRE 31. THe HIISSIONS: 1600 RPM, VARIABLE LOAD, STD. TIM1N(:
51

500
4000
3000
2000
o IDLE
STD. FUEL EMULSION
Hp
FIGURE 32. THe EMISSIONS: 1600 RPM, VARIABLE LOAD, 3.6 0 RETARD
52

6000
5000
4000
3000
2000
loon
I /
I
o IDLE
r-I
I I
/ I
25
--
STD. FUEL __ _
EMULSION ----
-----..",.,....,. .........
_..-'
50 75 100 Hp
/ /
/~ /
125
FIGURE 33. THe EMISSIONS: 1600 RPM, VARIABLE LOAD, 3.ho ADVANCE
53

N
o u
7
6
5
4
3
2
1
o IDLE
25
BASE FUEL
EMULSION
50 75 100 125 150 175 Hp
FIGURE 34. CO 2 EMISSIONS: PROP LOAD, STANDARD TIHING
54

N o u
6
5
4
3
2
1
o IDLE
BASE FUEL EMULSION
Hp 175
FIGURE 35. CO 2 EMISSIONS: PROP LOAD, 3.6 0 RETARD
55

<10.0
N 0 u
7
6
5
4
3
2
1
o IDLE
25
BASE FUEL --EMULSION ----
;' ,. ~
~
50 75 100 Hp
'/ /
125 150 175
FIGURE 36. CO 2 EMISSIONS: PROP LOAD, 7.20 RETARD
56

7
6
5
N 4 o u
3
2
1
o IDLE
BASELINE __ _
EMULSION ----
25 50 75 100 125 150 175 Hp
FIGURE 37. CO 2 EMISSIONS: PROP LOAD, 3.6 0 ADVANCE
57

7
6
5
N 4 o u
3
2
1
o 25
BASE FUEL EMULSION
IDLE Hp
FIGURE 38. CO 2 EMISSIONS: 1600 RPM, VARIABLE LOAD, 3.6 0 ADVANCE
58

TABLE 6. PROP LOAD CURVE CO EMISSIONS
Increase or Decrease (%) STD. 3.6' 7.2 0 3.6 0
RPM HP Timing Retard Retard Advance
700 Idle +87.5 +51 +111 +]03
800 15.5 +35 +57 +69 +54.5
1000 28.2 +10.3 +43.2 +72 +27
1200 47.7 +33 +31 +46 +44
1400 73.9 +38 +10.2 01012.8 +30
1600 107.3 +16 +2.1 -26 +-31
1800 148.6 +22 0 -4.7 -28
AVG +34.5 +32.4 +40.0 +37.3

RPM
1600
1600
1600
TABLE 7. VARIABLE LOAD,CONSTANT SPEED CURVE CO EMISSIONS
HP
25
75
125
AVG
Increase or Decrease (%) STD. 3.60
Timing Retard
+5.4 +20
+32 +4.5
o -8.4
+12.4 +5.3
60
3.60
Advance
+48
+30
+4.6
+27.5

TABLE 8. PROP LOAD CURVE NOX EMISSIONS
Increase or Decrease (%) STD. 3.6 0 7.20 3.6,0
RPM HP Timing Retard Retard Advance
700 Idle -51.4 - 37 -39 -57
800 15.5 -17 .1 0 -6.6 -17
1000 28.2 -9,1 +5.8 -4.0 -10
1200 47.7 -9.7 +10.8 0 -2.5
1400 73.9 -10.8 +6.2 ··6.0 .:s. :;
1600 107.3 -10.4 -3.5 11.2 -1.8
1800 148.6 -13.0 -4.7 ·-5.0 -1. 8
AVG -17.4 -3.2 -10.2 -13.3
61

TABLE 9. VARIABLE LOAD,CONSTANT SPEED CURVE NOX EMISSIONS
Increase or DecreaSe (%) STD. 3.6 3.60
RPM HP Timing Retard Advance
1600 25 -6.4 +0.8 -9.1
1600 75 -1.8 -4.6 -5.3
1600 125 o -4.9 -4.5
AVG -2.7 -2.9 -6.3
62

TABLE 10. PROP LOAD CURVE THC EMISSIONS
Increase or Decrease (%) STD. '3.6
0 7.2
0 3.60
RP~1 HP Timing Retard Retard AdvaFlce
700 Idle +50.5 +58 j 36 +50. ,~
SOO 15.5 +29 +50 +26 + 21 . 7
]000 2S.2 +35 +28 +S.2 +41.8
1200 47.7 +45 +74.4 +52.2 +21.5
1400 73.9 +70.2 +44.1 +SS +5S.8
1600 107.3 +65 +31.5 +S5 +78
1800 148.6 +140 +S3.8 +193 +146
AVG +62 +48.5 +60.7 +59.3
63

TABLE 11. VARIABLE LOAD,CONSTANT SPEED CURVE THC EMISSIONS
Increase or Decrease (%)
RPM HP STD. 3.60
Timing Retard
1600 25 +34.3 +20.5
1600 75 +49 +44
1600 125 +76 +86
AVG +53.1 +50.1
64
3.60
Advance
+39
+15
+102
+52

10 .
8
4
BASE FUEL EMULSION
_ .. ___ --e--_-. --- 0 2r-----____ ~----~
o 800 IDLE
FIGURE 39. OPACITY: PROP LOAD, STANDARD TIMING
65

12
10
8
6
4
2
o IDLE
BASE FUEL EMULSION
•
FIGURE 40. OPACITY: PROP LOAD, 3.6 0 RETARD
66

18
16
14
12
10
8
6
4
2
BASE FUEL
EMULSION
-- . -_ ......... ------4---1-
o IDLE
--/
/ /
/ ,..,.
I
r I I I I I I I I I I
FIGURE 41. OPACITY: PROP LOAD, 7.20 RETARD
67

8
2 --
o IDLE
BASE FUEL EMULSION
._........ -----,..---- .... ----
FIGURE 42. OPACITY: PROP LOAD, 3.6 0 ADVANCE
68 ..

>-L, o
1000
900
800
700
600
500
400
300
200
o IDLE
BASE FUEL
EMULSION
FIGURE 43. EXHA11ST TEMP: PROP LOAD, STANDARD TIMING
69

100
90
80
700
~ 0
. 600 ~ :::?: P-l E-<
sao
400
300
200
BASE FUEL
----- EMULSION
a 800 IDLE
~
'/ '/
~
I /
I /
I /
'/ /
FIGURE 44. EXHAUST TEMP: PROP LOAD, 3.6 0 RETARD
70

100
90 ..
800
700
~ 0
~ 60
..,... ""-< ~ E-<
,. 500
400
300
200
o IDLE
--- B~SELINE ---- EMULSION
I I
J
I I
I
/ I
I I
FIGURE 45. EXHAUST TEMP: PROP LOAD, 7.20 RETARD
71

1000
900
800
700
~ 0
60Q. p.. ::E Ll.1 E-<
500
400
300
200
o IDLE
BASELINE EMULSIONS
FIGURE 46. EXHAUST TEMP: PROP LOAD, 3.6 0 ADVANCE
72
.-
•

•
•
REFERENCES
1. Barrett, R.E., J.W. Moody, and D.W. Locklin, "Preparation and
Firing of Emulsions of No. 2 Fuel Oil and Water," Batelle
Memorial Insitute, November 1968.
2. Hall, R. E., "The Effect of Water/Residual Oil Emulsion on Air
Pollutant Emissions and Efficiency of Commercial Boilers,"
Presented at the ASME Annual Meeting, Houston TX, December
1-5, 1975.
3. Valdmanis, D.W., and C.W. Liegmund, "The Effects of Emulsified
Fuels and Water on Diesel Combustion," In: SAE Vehicle
Emissions Part III, Progress in Technology, SAE 700736 (1970),
p. 570.
4. Marshall, W.F., "Use of a Water-Fuel Emulsion in a Diesel
Engine: Test Results," Presented at the Water-In-Fuel Con
ference, U.S. Department of Transportation, Transportation
Systems Center, Cambridge MA, April 20-21, 1977.
5. Murayama, T., et aI, "Experimental Reduction of NOx, Smoke,
and BSFC in a Diesel Engine Using Uniquely Produced Water
Fuel Emulsion," SAE Congress and Exposition, SAE 780224,
February 1978.
6. Klaubert, E.C., R.A. Walter, "Marine Engine-Exhaust Emissions
Test Cell," U.S. Department of Transportation, Report No.
CG-D-27-S, November 1974.
110 Copies
73/74

..
..
Copyright © 2022 FDOKUMEN