Immobilization of monolayer protected lipophilic gold nanorods on a glass surface
Upload
independentCategory
view
1download
0
The Elementary Mass Action Rate Constants of P-gp Transport fora Confluent Monolayer of MDCKII-hMDR1 Cells
Thuy Thanh Tran,*y Aditya Mittal,* Tanya Aldinger,y Joseph W. Polli,z Andrew Ayrton,§
Harma Ellens,y and Joe Bentz**Department of Bioscience & Biotechnology, Drexel University, Philadelphia, Pennsylvania 19104; yPreclinical Drug Metabolism andPharmacokinetics, GlaxoSmithKline, King of Prussia, Pennsylvania; zPreclinical Drug Metabolism and Pharmacokinetics, GlaxoSmithKline,Research Triangle Park, North Carolina; and §Preclinical Drug Metabolism and Pharmacokinetics, GlaxoSmithKline, Welwyn, England
ABSTRACT The human multi-drug resistance membrane transporter, P-glycoprotein, or P-gp, has been extensively studieddue to its importance to human health and disease. Thus far, the kinetic analysis of P-gp transport has been limited to steady-state Michaelis-Menten approaches or to compartmental models, neither of which can prove molecular mechanisms.Determination of the elementary kinetic rate constants of transport will be essential to understanding how P-gp works. Theexperimental system we use is a confluent monolayer of MDCKII-hMDR1 cells that overexpress P-gp. It is a physiologicallyrelevant model system, and transport is measured without biochemical manipulations of P-gp. The Michaelis-Menten massaction reaction is used to model P-gp transport. Without imposing the steady-state assumptions, this reaction depends uponseveral parameters that must be simultaneously fitted. An exhaustive fitting of transport data to find all possible parametervectors that best fit the data was accomplished with a reasonable computation time using a hierarchical algorithm. For threeP-gp substrates (amprenavir, loperamide, and quinidine), we have successfully fitted the elementary rate constants, i.e., drugassociation to P-gp from the apical membrane inner monolayer, drug dissociation back into the apical membrane innermonolayer, and drug efflux from P-gp into the apical chamber, as well as the density of efflux active P-gp. All three drugs hadoverlapping ranges for the efflux active P-gp, which was a benchmark for the validity of the fitting process. One novel findingwas that the association to P-gp appears to be rate-limited solely by drug lateral diffusion within the inner monolayer of theplasma membrane for all three drugs. This would be expected if P-gp structure were open to the lipids of the apical membraneinner monolayer, as has been suggested by recent structural studies. The fitted kinetic parameters show how P-gp efflux ofa wide range of xenobiotics has been maximized.
INTRODUCTION
Multi-drug resistance transporters are clinically important
because of their ability to render cells resistant to many
chemotherapeutic agents, such as anticancer drugs and
antibiotics (Borst and Elferink, 2002; Gottesman, 2002;
Poelarends et al., 2002; Ambudkar et al., 2003). In addition,
it has become increasingly clear over the past decade that
some mammalian multi-drug resistance transporters also
play an important role in the absorption, distribution, and
elimination of drugs and xenobiotics, and may be respon-
sible for clinically important drug-drug interactions (Lown
et al., 1997; Schinkel, 1998; Goh et al., 2002). Binding and
transport of substrates by P-gp (the P-glycoprotein product
of the human MDR1 gene) has been intensely studied,
providing important insights into the structure and function
of the protein (Gottesmann and Pastan, 1993; Senior et al.,
1995; Ambudkar et al., 1999, 2003; Loo and Clarke, 1999;
Hrycyna, 2001; Borst and Elferink, 2002; Schmitt and
Tampe, 2002; Seelig and Gatlik-Landwojtowicz, 2004). The
catalytic cycle of P-gp and its conformational changes have
been studied using purified P-gp remixed with lipids or
reconstituted proteoliposomes (Sharom et al., 1993; al-
Shawi et al., 2003; Loo et al., 2003; Urbatsch et al., 2003).
There is a dose-dependent response between ATPase activity
and transport activity in cells (Ambudkar et al., 1997) and
reconstituted P-gp proteoliposomes (Sharom et al., 1993;
Omote and al-Shawi, 2002).
Any model of the P-gp catalytic cycle must be tested
against a rigorous kinetic analysis of transport activity for
P-gp expressed in a physiologically relevant cell system and,
eventually, in vivo. To date, kinetics analyses of P-gp
transport have been limited to steady-state Michaelis-Menten
approaches (Stein, 1997; Ho et al., 1995; Doppenschmitt
et al., 1999; Kuh et al., 2000; al-Shawi et al., 2003; or
compartmental analyses (Demant et al., 1990; Ashida et al.,
1998; Ito et al., 1999), neither of which can prove transport
mechanism.
Our experimental system was the confluent monolayer of
MDCKII-hMDR1 cells that overexpress P-gp (Evers et al.,
2000; Tang et al., 2002a,b; Tran et al., 2004). This system
was chosen because it is a physiologically relevant model for
P-gp in tissue, and it involves no biochemical manipulations
to measure transport. Substrate can be added to either face of
the polarized cell monolayer, apical or basolateral, and
transport to the other chamber is monitored. A potent P-gp
Submitted May 24, 2004, and accepted for publication October 14, 2004.
Address reprint requests to Dr. Joe Bentz, Fax: 215-895-1273; E-mail:
Aditya Mittal’s present address is Dept. of Biochemical Engineering &
Biotechnology, Indian Institute of Technology, Hauz Khas, New
Delhi-110016 India.
� 2005 by the Biophysical Society
0006-3495/05/01/715/24 $2.00 doi: 10.1529/biophysj.104.045633
Biophysical Journal Volume 88 January 2005 715–738 715
inhibitor was used to independently measure passive
permeability through the cell monolayer. The P-gp substrates
used were amprenavir, an HIV protease inhibitor; quinidine,
a Na1 channel blocker; and loperamide, an antidiarrheal
drug. These drugs were chosen because they are good P-gp
substrates and show different mass balance problems (Tran
et al., 2004). Furthermore, amprenavir shows no evidence for
transport saturation (Polli et al., 2001; Bentz et al., un-
published data), rendering the standard Michaelis-Menten
analysis of P-gp transport useless. So amprenavir provided
a challenging test case.
A minimal comprehensive mass action model for P-gp
transport through a confluent cell monolayer must include
the known kinetic barriers to transport. This means that
several parameters must be fitted simultaneously, and each
has a wide range of potential values. This generates a very
large ensemble of initial parameter guesses to be fitted
against data. Thus, a hierarchical algorithm for fitting was
required to get fits in a reasonable time. This computationally
intensive approach is the only way to analyze the kinetics of
a system with three or more important elementary param-
eters. We have applied this approach successfully to the
kinetics of membrane fusion (Bentz, 2000; Mittal and Bentz,
2001; Mittal et al., 2002; Bentz and Mittal., 2003). Never-
theless, the first hypothesis of this study was that the data
from the experimental system would be consistent enough
and the kinetic analysis robust enough that a small compact
set of parameter values yielding best fits could be found at all.
The mass action model for P-gp transport is precisely the
same as used by all prior studies, i.e., the Michaelis-Menten
reaction. Our analysis is more complex because we fit all of
the parameters of this reaction. Past work has just used the
Michaelis-Menten (or Eadie-Hofstee or Wolf-Hanes) steady-
state equations to fit the data. For some data, e.g., the ATPase
activity of P-gp, the steady-state equations appear to work
well enough. The ATPase of P-gp is in the water, like a
soluble enzyme. For other data, e.g., transport through a
confluent monolayer of cells, we have found that these
equations yield very inaccurate predictions for the elemen-
tary parameters (Bentz et al., unpublished data). This is why
we focus only on the elementary parameters here.
There is a tendency to view a more complicated analysis
of a well-known problem as a way of curve fitting, with
enough parameters to make the fit look better. However,
aside from the rate constants of the Michaelis-Menten
reaction and the density of efflux active P-gp, every other
parameter we introduce was fitted to independent data with
the minimum flexibility possible. The rate constants of the
Michaelis-Menten reaction and the density of efflux active
P-gp had to be fitted simultaneously, just as would be the
case for a soluble enzyme when the active enzyme con-
centration is not known. To impose the steady-state
equations onto such data would be a choice based upon
assumptions. A rigorous fitting is always better and is now
possible.
Our findings suggest new hypotheses and, at the same
time, support the simplest picture for a transporter whose job
is to remove a wide range of amphipathic xenobiotic com-
pounds from epithelial cells as rapidly as possible. First,
it seems clear that the primary selective pressure on P-gp
function was to maintain a wide substrate range, which
means that the binding constants for nearly all substrates
should be weak. This is what we found for all three drugs. In
fact, were it not for the substantial partition coefficients of
these drugs into lipid bilayers, their membrane concen-
trations would be too low to show significant efflux. Second,
for P-gp to acquire the substrate rapidly, the on-rate to P-gp
from the inner apical monolayer should be fast. All three
drugs had very large association rate constants, suggesting
that lateral diffusion of the drug through the lipid bilayer was
the sole rate-limiting step. Third, the P-gp efflux rate con-
stants for quinidine and loperamide were about the same as
the currently known maximal rate of ATP hydrolysis by
P-gp, whereas that for amprenavir was substantially larger.
We also note that the combination of weak binding to P-gp
and ATP hydrolysis-limited efflux requires that efflux of
a substrate into the apical chamber occurs only after many
tens of thousands or even millions of substrate molecules
have visited the binding site and returned to the inner apical
monolayer.
The fitted value of the density of efflux active P-gp, was
substantially smaller than values measured by quantitative
Western blots in similar, but not identical, cell lines. We
believe the reason is not due to misfolded P-gp or substantial
intracellular sequestration, but rather due to the architecture
of the microvilli of the apical membranes of these cells. We
speculate that efflux into the apical chamber happens only
from the P-gp at the tips of the microvilli. Drug exiting from
P-gp at the base of a microvillus would undergo a long
random walk, involving many encounters with the same or
a nearby microvillus and the P-gp therein. The quantitative
Western blot gives whole cell P-gp estimates, whereas our
kinetic analysis estimates only the amount of P-gp that
actually succeeds in effluxing the drug directly into the apical
chamber. This hypothesis is being studied currently.
MATERIALS AND METHODS
Materials
Amprenavir and GF120918 were from GlaxoSmithKline, USA (Research
Triangle Park, North Carolina). Loperamide was from Sigma-Aldrich (St.
Louis, MO) and quinidine from Fisher Scientific (Hampton, NH).3H-Loperamide (10 Ci/mmole) and 3H-amprenavir (21 Ci/mmole) were
custom-synthesized by Amersham Pharmacia Biotech (Little Chalfont,
England). 3H-Quinidine (20 Ci/mmole) was from ICN Biomedical (Costa
Mesa, CA). Dimethylsulfoxide was from Sigma-Aldrich. Dulbecco’s modi-
fied Eagle’s medium (DMEM) was from MediaTech, VWR (Herndon, VA).
Transport medium (DMEM with 25 mM HEPES buffer, high glucose,
L-glutamine, pyridoxine hydrochloride, without sodium pyruvate, and without
phenol red) was from Gibco (Carlsbad, CA). Cholesterol and porcine brain
lipids were from Avanti Polar Lipids (Alabaster, AL). Transwell 12-well
716 Tran et al.
Biophysical Journal 88(1) 715–738
plates with polycarbonate inserts were obtained from Costar, (Acton, MA).
Ultima Gold scintillation cocktail was from PerkinElmer Life Sciences
(Boston, MA).
Cell line and culture conditions
The Madin-Darby canine kidney cell line, which overexpresses human
MDR1 (MDCKII-hMDR1), was purchased from the Netherlands Cancer
Institute (Amsterdam, The Netherlands). Cells were split twice a week and
maintained in culture medium (DMEM supplemented with 10% fetal bovine
serum, 50 units/ml penicillin and 50 mg/ml streptomycin). Cells were kept at
37�C in 5% CO2.
Transport assays
Cells were seeded in 12 well plates at a density of 200,000 cells per insert
and grown for 4 days in culture medium. Preliminary results using higher
and lower plating densities suggested that this density was optimal with
respect to obtaining transport stable confluent monolayers at 4 days. After
many preliminary experiments, the data presented here for amprenavir were
taken from cell passages No. 32 and No. 33 (50–90 mM), No. 34 (100 mM)
and No. 36 (1 and 10 mM). For quinidine, No. 36 and No. 37 were used, and
for loperamide, No. 39 and No. 40 were used. Cells were given fresh media
1 day after seeding.
Before the experiment, culture medium was removed and cells were
preincubated for 30 min with either transport medium alone (see above) or
transport medium supplemented with 2 mM GF120918 to inhibit P-gp.
Transport of a range of concentrations of amprenavir, loperamide, and
quinidine across the confluent monolayer of cells was measured in both
directions, i.e., apical to basolateral (A. B) and basolateral to apical (B. A)
in the presence and absence of GF120918. For incubations in the presence
of GF120918, the inhibitor was added to both chambers; 0.5 mCi/ml of3H-amprenavir, 3H-quinidine, or 3H-loperamide was added to each respec-
tive drug concentration to allow quantification of transport from donor to
receiver chambers by liquid scintillation counting. In addition, 14C-mannitol
(0.75 mCi/ml) was added to monitor cell monolayer integrity. At the indi-
cated time points, 25 mL samples were taken from both donor and receiver
chambers, mixed with 10 ml of Ultima Gold scintillation cocktail and
counted using a Hewlett Packard Liquid Scintillation Counter. The first time
point taken was after 6 min, and we used these data at the starting point for
fitting. This eliminated the need to correct for some drug binding to the
Costar Transwell apparatus and other initial transient effects (Tran et al.,
2004). All simulations accounted for the 25 mL aliquots, since loss of
volume was not negligible, especially in the apical chamber (Tran et al.,
2004).
Cell stability and substrate metabolism
Tran et al. (2004) showed that the stability of the cell monolayer and plasma
membrane with respect to passive and active transport was not affected by
the prolonged exposure times to amprenavir for at least 6 h. It was also
shown that metabolism or decomposition of substrates was insignificant for
all drugs on this timescale using Radio HPLC (Agilent Technologies, Palo
Alto, CA).
Liposome preparation
Three liposome preparations were used to roughly mimic the lipid com-
positions of the relevant monolayers of the plasma membrane (Hill and
Zeidel, 2000), while not exceeding ternary mixtures:
1. The apical membrane outer monolayer mimic was a (1:1:1) mixture of
phosphotidylcholine/sphingomyelin/cholesterol, denoted PC/SM/chol.
2. The basolateral membrane outer monolayer mimic was a (2:1) mixture
of phosphotidylcholine/cholesterol, denoted PC/chol.
3. The plasma membrane monolayer, facing the cytosol, mimic was
a (1:1:1) mixture of phosphotidylserine/phosphatidylethanolamine/
cholesterol, denoted PS/PE/chol.
Lipid mixtures were dried into thin lipid films in round bottom flasks
(Buchi Rotavapor R-200, Brinkmann Instruments, Herisau, Switzerland),
and freeze-dried overnight on a Flexi-Dry MP freeze-dryer (Kinetics, Union
City, CA). Lipid films were suspended in phosphate buffered saline pH 7.4
(Gibco), freeze-thawed in methanol over dry ice for 20 cycles and heated to
35–40�C, and stored at 4�C overnight. Extrusion was done with a Lipex
thermal extruder (Northern Lipids, Vancouver, Canada) through two 0.08
mm Nucleopore membranes for at least seven cycles at room temperature.
For the PC/SM/chol liposomes, the first three cycles were run at 65�C. Sizesof liposomes were measured by a NICOMP 380-Submicron Particle Sizer
(NICOMP, Santa Barbara, CA). The average diameters for all compositions
were 100 6 30 nm. The amount of lipid recovered after extrusion was
determined by the absorbance reading of rhodamine-PE, added to each lipid
mixture at 0.1 mol %. Lipid recovery as measured by rhodamine-PE was 80–
82%.
Equilibrium binding study
Binding of drugs to liposomes was determined by equilibrium dialysis using
a 20-cell equilibrium dialyzer (Spectrum, Fort Lauderdale, FL) and the
Spectra/Por 4 membrane (Spectrum), which has a 12–14 kD molecular mass
cutoff. The partitioning of 10 mM of each drug (amprenavir, loperamide, and
quinidine) into 10 mM liposomes was examined. Each half of the Teflon
cells received equimolar concentrations of the cold drug. The half cell with
liposomes received an additional 0.25mCi/ml of radiolabeled drug. The cells
were allowed to equilibrate in a 37�C water bath, and samples were taken
from both half cells at 8 h. Preliminary studies showed that partitioning was
independent of drug concentration (for the ranges used in this work), lipid
concentration (5–10 mM) and time after 6 h. At the indicated time points,
25 mL samples were removed from the donor and receiver chambers, mixed
with 10 ml of Ultima Gold scintillation cocktail and analyzed by a Packard
TriCarb 3100-RT liquid scintillation counter.
Partition coefficients were calculated as K ¼ Cm/Cw, where Cw was the
mol of drug per liter of aqueous buffer and Cm was the mol of drug per liter
of lipid using the average specific volume of 1.6 mL/mmol of total lipid
(Chen and Rand, 1997). The equilibrium partition coefficients measured are
shown (see Table 2). The molecular basis for differences is under inves-
tigation. However, they do show that for association time constants of
seconds, the time constants for release from the liposomes is on the order of
minutes, roughly validating our assumption of the partition equilibrium over
the hourly time course of transport.
Numerical integrations
We used the stiffest integrator in MATLAB, ode23s (The MathWorks,
Natick, MA). Other MATLAB integrators, although faster, were not
accurate enough at the later times of simulations. The time required for the
MATLAB subroutine fminsearch to find a local minimum depends on the
tolerances of numerical integration and minimization. Empirically, for our
data, we have found that setting the relative and absolute tolerances in
fminsearch to 10�6 was an adequate compromise between speed and
accuracy. The coefficient of variation, CV, is used to quantify the goodness
of fit. CV is defined as the root mean-square error between the data points for
a given drug concentration and the simulation generated by MATLAB,
divided by the initial substrate concentration in the donor chamber for that
data set, to normalize over all the drug concentrations. Termination of
fminsearch occurs when the routine detects a local minimum in CV. This
gives a vector of best-fitted parameters from the initial guess. That is, the
grid of initial guesses generates a set of ‘‘best fits’’, one for each initial
guess. As always, some ‘‘best fits’’ are better than others (Bentz, 2000;
Mittal and Bentz, 2001).
Elementary Parameters of P-gp Transport 717
Biophysical Journal 88(1) 715–738
KINETIC MODEL OF TRANSPORT ACROSS ACONFLUENT CELL MONOLAYER
MDCKII-hMDR1 cells polarize with the basolateral mem-
brane attached to the polycarbonate filters (Butor and
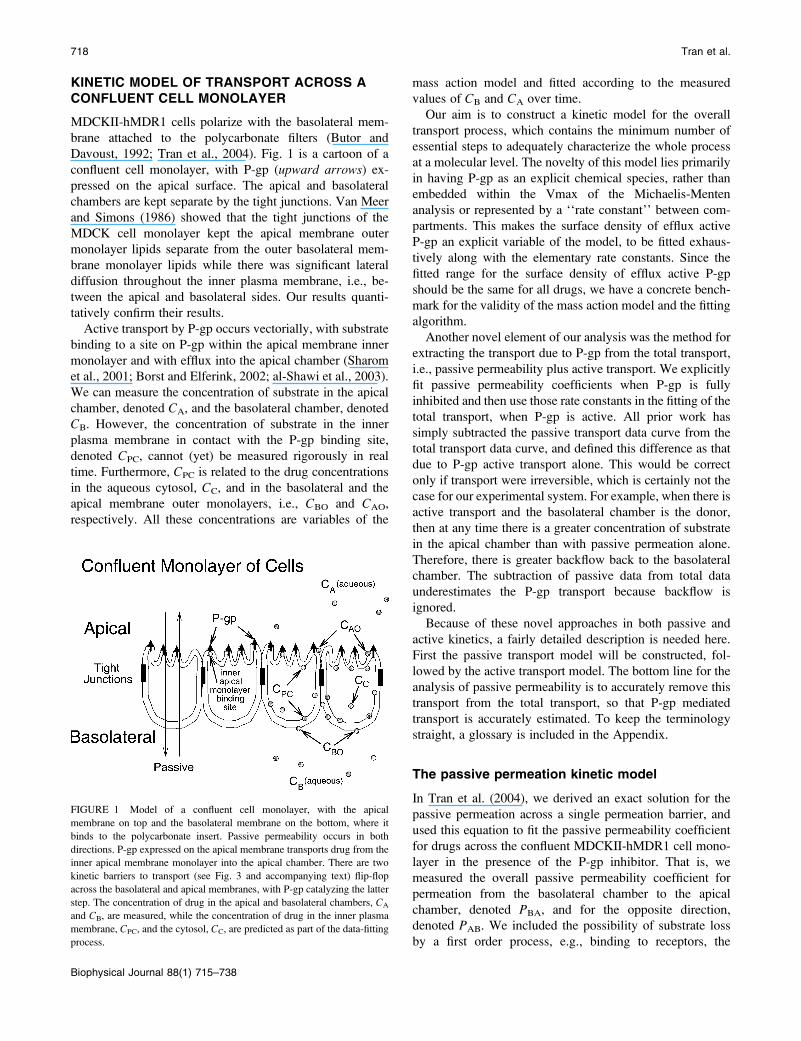
Davoust, 1992; Tran et al., 2004). Fig. 1 is a cartoon of a
confluent cell monolayer, with P-gp (upward arrows) ex-pressed on the apical surface. The apical and basolateral
chambers are kept separate by the tight junctions. Van Meer
and Simons (1986) showed that the tight junctions of the
MDCK cell monolayer kept the apical membrane outer
monolayer lipids separate from the outer basolateral mem-
brane monolayer lipids while there was significant lateral
diffusion throughout the inner plasma membrane, i.e., be-
tween the apical and basolateral sides. Our results quanti-
tatively confirm their results.
Active transport by P-gp occurs vectorially, with substrate
binding to a site on P-gp within the apical membrane inner
monolayer and with efflux into the apical chamber (Sharom
et al., 2001; Borst and Elferink, 2002; al-Shawi et al., 2003).
We can measure the concentration of substrate in the apical
chamber, denoted CA, and the basolateral chamber, denoted
CB. However, the concentration of substrate in the inner
plasma membrane in contact with the P-gp binding site,
denoted CPC, cannot (yet) be measured rigorously in real
time. Furthermore, CPC is related to the drug concentrations
in the aqueous cytosol, CC, and in the basolateral and the
apical membrane outer monolayers, i.e., CBO and CAO,
respectively. All these concentrations are variables of the
mass action model and fitted according to the measured
values of CB and CA over time.
Our aim is to construct a kinetic model for the overall
transport process, which contains the minimum number of
essential steps to adequately characterize the whole process
at a molecular level. The novelty of this model lies primarily
in having P-gp as an explicit chemical species, rather than
embedded within the Vmax of the Michaelis-Menten
analysis or represented by a ‘‘rate constant’’ between com-
partments. This makes the surface density of efflux active
P-gp an explicit variable of the model, to be fitted exhaus-
tively along with the elementary rate constants. Since the
fitted range for the surface density of efflux active P-gp
should be the same for all drugs, we have a concrete bench-
mark for the validity of the mass action model and the fitting
algorithm.
Another novel element of our analysis was the method for
extracting the transport due to P-gp from the total transport,
i.e., passive permeability plus active transport. We explicitly
fit passive permeability coefficients when P-gp is fully
inhibited and then use those rate constants in the fitting of the
total transport, when P-gp is active. All prior work has
simply subtracted the passive transport data curve from the
total transport data curve, and defined this difference as that
due to P-gp active transport alone. This would be correct
only if transport were irreversible, which is certainly not the
case for our experimental system. For example, when there is
active transport and the basolateral chamber is the donor,
then at any time there is a greater concentration of substrate
in the apical chamber than with passive permeation alone.
Therefore, there is greater backflow back to the basolateral
chamber. The subtraction of passive data from total data
underestimates the P-gp transport because backflow is
ignored.
Because of these novel approaches in both passive and
active kinetics, a fairly detailed description is needed here.
First the passive transport model will be constructed, fol-
lowed by the active transport model. The bottom line for the
analysis of passive permeability is to accurately remove this
transport from the total transport, so that P-gp mediated
transport is accurately estimated. To keep the terminology
straight, a glossary is included in the Appendix.
The passive permeation kinetic model
In Tran et al. (2004), we derived an exact solution for the
passive permeation across a single permeation barrier, and
used this equation to fit the passive permeability coefficient
for drugs across the confluent MDCKII-hMDR1 cell mono-
layer in the presence of the P-gp inhibitor. That is, we
measured the overall passive permeability coefficient for
permeation from the basolateral chamber to the apical
chamber, denoted PBA, and for the opposite direction,
denoted PAB. We included the possibility of substrate loss
by a first order process, e.g., binding to receptors, the
FIGURE 1 Model of a confluent cell monolayer, with the apical
membrane on top and the basolateral membrane on the bottom, where it
binds to the polycarbonate insert. Passive permeability occurs in both
directions. P-gp expressed on the apical membrane transports drug from the
inner apical membrane monolayer into the apical chamber. There are two
kinetic barriers to transport (see Fig. 3 and accompanying text) flip-flop
across the basolateral and apical membranes, with P-gp catalyzing the latter
step. The concentration of drug in the apical and basolateral chambers, CA
and CB, are measured, while the concentration of drug in the inner plasma
membrane, CPC, and the cytosol, CC, are predicted as part of the data-fitting
process.
718 Tran et al.
Biophysical Journal 88(1) 715–738
experimental apparatus, hydrolysis and/or metabolism.
Although the cell monolayer clearly has at least two
permeation barriers, the apical and basolateral membranes,
the characterization as through a single barrier is adequate for
most applications, since intracellular concentrations are not
measured. Here we must expand the treatment of passive
permeability to include explicitly the apical and basolateral
membranes, since P-gp picks up drug from the apical
membrane inner monolayer (Sharom et al., 2001; al-Shawi
et al., 2003).
Our major assumption was that the substrate concentration
in an aqueous compartment is at equilibrium with the lipid
monolayer facing the compartment, i.e., we can use a par-
tition coefficient to relate the two concentrations. This is
a reasonable assumption for this system, where transport
occurs on an hourly timescale. For example, Abreu et al.
(2003) have shown that the fluorophor Rhodamine Green-
tetradecylamide associates with lipid bilayers within a few
seconds. The assumption of partition equilibrium reduces the
number of equations to be fitted by about a factor of two.
This assumption also means that drug recycling is maximal,
since drug effluxed into the apical chamber is immediately
equilibrated with the outer apical monolayer.
Equilibrium dialysis binding of drugs to intact cells cannot
estimate these individual cell membrane monolayer partition
coefficients very well because these drugs are all permeable
enough to bind throughout the cell within an hour. Therefore,
we used 0.1 mm extruded unilamellar liposomes (LUV)
whose lipid compositions mimic, in a very simple way, the
lipid compositions of the respective membrane monolayers.
For example, we use the partition coefficient for the LUV
composedof sphingomyelin/phosphatidylcholine/cholesterol
(SM/PC/chol, 1:1:1) to relate the concentration of substrate
in the apical chamber, CA, which we can measure, to the
concentration in the apical membrane outer monolayer, CAO,
which we can’t measure. We use PC/chol (2:1) as a mimic for
the outer basolateral monolayer and phosphatidylethanol-
amine/phosphatidylserine/chol (PE/PS/chol,1:1:1)asamimic
for the inner plasma monolayer, i.e.,
KAOðPC=SM=chol; 1 : 1 : 1Þ ¼ CAO
CA
KBOðPC=chol; 2 : 1Þ ¼ CBO
CB
KPCðPE=PS=chol; 1 : 1 : 1Þ ¼ CPC
CC
: (1)
KBO, KAO, and KPC denote the respective partition
coefficients, while the LUV lipid compositions used are
given in parentheses. Obviously, cell membranes have much
more complex compositions (Hill and Zeidel, 2000), but we
did not want to exceed ternary mixtures or use exotic lipids.
The moles of drug in contact with the basolateral side of
the B . C kinetic barrier are VBCB 1 VBOCBO, due to the
assumption of partition equilibrium. The standard perme-
ability equation to predict the passive transport across the
basolateral membrane is
d
dtðVBCB 1VBOCBOÞ ¼ �PBCABðCB � CCÞ;
or
�VVB
dCB
dt¼ �PBCABðCB � CCÞ;
where
�VVB[VB 1KBOVBO: (2)
�VVB is simply the whole basolateral volume accessible to the
substrate, since KBOVBO is the aqueous equivalent volume of
the lipid in the basolateral side. AB denotes the area of the
basolateral outer membrane monolayer capable of perme-
ation. Note that PBCAB/�VVB has the units of a first-order rate
constant, s�1.
We assume that the passive permeability coefficient is
symmetric across the basolateral membrane into the cytosol,
i.e., PBC ¼ PCB. It is also the case that substrates can
permeate through cell monolayers between the cells, through
the tight junctions, which is called paracellular permeation
(Ho et al., 2000). Measured passive permeability coefficients
contain both terms, and perhaps others. For all our experi-
ments, radiolabeled C14-mannitol was used to estimate
paracellular permeability coefficients, which were ,3% of
the passive permeability coefficients measured for amprena-
vir, quinidine, and loperamide (Tran et al., 2004).
Following the same logic as for Eq. 2, the other mass
action equations for passive permeability are written as
�VVC
dCC
dt¼ 1PBCABðCB � CCÞ � PACAAðCC � CAÞ
�VVA
dCA
dt¼ 1PACAAðCC � CAÞ;
where
�VVA[VA 1KAOVAO
�VVC[VC 1KPCVPC: (3)
As with the basolateral membrane, we assume that passive
permeability across the apical membrane to the cytosol is
symmetric, i.e., PAC ¼ PCA. However, the permeability
coefficient across the apical membrane, PAC, need not equal
PBC. We cannot measure these permeability coefficients
directly in the cell monolayer, but we will account for their
effect on total transport as shown below.
When VDCD(0) is the total mols of drug initially added to
the donor side, whether basolateral or apical chamber, then
mass balance equations require at all times that
VDCDð0Þ ¼ VBCB 1VACA 1VCCC
1VBOCBO 1VAOCAO 1VPCCPC
¼ �VVBCB 1 �VVACA 1 �VVCCC: (4)
The passive mass action equations, Eqs. 2 and 3, satisfy mass
balance trivially.
Elementary Parameters of P-gp Transport 719
Biophysical Journal 88(1) 715–738
In Tran et al. (2004), we showed that loss of substrate,
defined as drug leaving the donor chamber and not arriving
in the receiver chamber in a timely fashion, could be
accounted for simply and quantitatively if loss were first
order, at least between the experimental time points. Of the
three drugs tested, only loperamide showed loss. The loss
was not due to metabolism or degradation/hydrolysis (Tran
et al., 2004), but rather due to binding to cells or the
experimental apparatus. Most importantly, the loperamide
loss was first order. The point of this correction was not to
discover the mechanism of loss, but rather to calculate the
correct passive permeability coefficients when mass balance
is a problem. We can add the substrate loss term, using kv todenote the first order rate constant of loss:
�VVB
dCB
dt¼ �PBCABðCB � CCÞ � kv �VVBCB
�VVC
dCC
dt¼ 1PBCABðCB � CCÞ � PACAAðCC � CAÞ
� kv �VVCCC
�VVA
dCA
dt¼ 1PACAAðCC � CAÞ � kv �VVACA: (5)
Whether drug loss occurs in the aqueous phase and/or in
membranes is irrelevant, due to the equilibrium partition
assumption.
When loss is first order, we can independently fit the value
of the loss rate constant using the average drug concentration
over the entire system, including cell plasma membranes.
This is defined by
ÆCðtÞæ ¼�VVBCB 1 �VVCCC 1 �VVACA
VT
;
where
VT ¼ �VVB 1 �VVC 1 �VVA: (6)
VT is the effective whole system volume, including
partitioning into the cell membranes.
We can now show that the average concentration depends
only upon the drug loss rate constant, i.e.,
VT
dÆCðtÞædt
¼ �VVB
dCB
dt1 �VVC
dCC
dt1 �VVA
dCA
dt
¼ �kvð �VVBCB 1 �VVCCC 1 �VVACAÞ¼ �kvVTÆCðtÞæ; (7)
using Eqs. 5 and 6. The solution to Eq. 7 is
ÆCðtÞæ ¼ ÆCð0Þæ expf�kvtg ¼ VDCDð0ÞVT
expf�kvtg: (8)
Thus, we can also measure total loss of substrate and correct
the estimation of passive permeability coefficients for that
loss, as done in Tran et al. (2004).
Finally, we need to consider the issue of estimating
membrane areas and the fitting of permeability coefficients.
In the passive permeation experiment, we fit the product of the
permeability coefficient and the area of membrane access. In
the preceding equations, AA and AB denoted the area of the
apical and basolateral membranes capable of permeation. The
question is: what area do we use? A morphometric electron
microscopy study has suggested that the total basolateral and
apical membranes of MDCKII cells grown on polycarbonate
filters, as we use here, have roughly the same area, and that
this area is;8 times the cross-sectional area of the cell (Butor
and Davoust, 1992). However, the actual membrane area of
access for permeation is unknown, e.g., due to apical mem-
brane invaginations and basolateral membrane tight binding to
the filter support.
It is customary to use the area of the insert onto which the
cells grow as the reference for accessible area, i.e., the
accessible area would be some multiple of this cross-
sectional area. We have assumed that both membranes had
areas of access two times that of the cross-sectional area of
the insert, i.e., like spheres attached at their equators by the
tight junctions. The reason for this choice was simply to
align the reported values of the permeability coefficients.
Typically, permeability coefficients are fitted assuming
a single barrier equation, as was done in Tran et al. (2004).
The same data fitted by a single static barrier model of area Aor by a two barrier model, each barrier with an area of 2A,will yield the same value for the passive permeability
coefficient. Since the bottom line of the passive permeation
kinetic analysis is to subtract its contribution to the total
transport, this approach is accurate and avoids the confusion
of having the same specific permeability represented by two
different numbers. Once the issue of membrane access area is
resolved, which will not be simple, corrected passive
permeability coefficients can be easily predicted from our
fitted values. This choice has no effect on the fitting of the
active transport parameters.
The second choice we made was how to estimate the
values of PBC and PAC, given that we could not make
intracellular measurements. We fit overall PBA and PAB
coefficients using the one barrier model (Tran et al., 2004),
i.e., the average value across both cell membranes in the
B . A or A . B directions, respectively. Depending upon
drug, Tran et al. (2004) found that PBA and PAB did not have
to be time independent or equal. The overall passive perme-
ability barrier of the cells depended upon which side was
the donor. To correct the total transport for the contribu-
tion by the passive transport, which is the goal in the first
place, we have chosen to set PBC ¼ PBA and PAC ¼ PAB.
This allows the donor face to dominate the estimated
permeation of drug into the cell, as found in Tran et al.
(2004). If the passive permeability coefficients were not
constant in time, which was the case for quinidine and
loperamide, then we best fit the values for each time interval
measured and used an ‘‘appropriate’’ value for each time
interval for fitting the active transport parameters, as ex-
plained in detail below.
720 Tran et al.
Biophysical Journal 88(1) 715–738
The active transport kinetic model
P-gp is generally assumed to follow the standard Michaelis-
Menten reaction (Stein, 1997; Ho et al., 2000; Ambudkar
et al., 2003). This reaction takes place within the apical
membrane inner monolayer:
T0 1CPC %k11
krl
T1 /k21
T0 1CA; (9)
where T0 is the empty transporter, CPC the substrate in the
apical membrane inner monolayer, T1 is the transporter
bound by substrate, and CA the substrate after efflux into the
apical chamber.
The nomenclature used here, e.g., k21, is read as the secondreaction for site 1. The first reaction is association to P-gp
and the second reaction is efflux into the apical chamber.
This nomenclature was developed to allow for the possibility
of two substrate binding sites, such as has been suggested by
equilibrium dialysis binding for P-gp (Martin et al., 2000)
and for the bacterial multi-drug resistance transporter LmrA
in Lactococcus lacti (van Veen et al., 1998). More sophis-
ticated models, including explicit ATP hydrolysis steps,
have been proposed (Senior et al., 1995; van Veen et al.,
2000; al-Shawi et al., 2003), based upon equilibrium dialysis
binding studies, ATP hydrolysis, and/or Michaelis-Menten
steady-state kinetic analysis. We shall see for P-gp that the
rate constant of association, k11, is so large that whether thereis one site or two roughly identical sites, both sites would be
filled or empty. Functionally, this means that the number of
sites is not kinetically relevant for single substrate measure-
ments. Future experiments examining substrate competition
can test the number of binding sites directly. Because of the
plan to examine competition, we have retained this notation.
In addition, functional two-site kinetics may apply to other
multi-drug resistance transporters.
When we append the active transport mass action reaction
to the passive permeability kinetics, we obtain the compre-
hensive kinetic equations for P-gp mediated transport:
�VVB
dCB
dt¼ �PBCABðCB �CCÞ � kv �VVBCB
�VVC
dCC
dt¼ 1PBCABðCB �CCÞ � PACAAðCC �CAÞ � kv �VVCCC
� VAOk11KPCCCT01VAOkr1T1
�VVA
dCA
dt¼ 1PACAAðCC �CAÞ � kv �VVACA1VAOk21T1
dT0
dt¼ �k11KPCCCT01 ðkr11 k21ÞT1
dT1
dt¼ �dT0
dt: (10)
Since we assume that the transporter captures the drug from
the apical membrane inner monolayer, the relevant volume is
VAO and the relevant partition coefficient is KPC. It might
appear that the volume for the receptor is 2VAO, since the
transporter crosses the membrane, but its active site is
thought to be restricted to the apical membrane inner
monolayer (Sharom et al., 2001; al-Shawi et al., 2003),
which technically has the volume of VAO. With respect to
fitting parameters, the difference is not significant.
There are several parameters here, but all are important
and necessary to obtain realistic estimates for the three
elementary rate constants (k11, kr1, k21) and the density of
efflux active P-gp in the apical membrane, denoted T(0).Again, passive permeability coefficients and rate constants
for loss are fitted in a separate experiment using the potent
P-gp inhibitor GF120918. Partition coefficients are estimated
using liposomes whose compositions roughly mimic the cell
membrane monolayers.
We can now complete the description of correcting the total
transport curve for the effects of passive permeability and loss
of drug. Tran et al. (2004) showed for amprenavir that the
fitted passive permeability coefficients, PAB and PBA, change
up to the first half hour and then stabilize. There was no
significant loss of amprenavir, but the calculated values for kvwere noisy for the first hour. The other drugs showed different
transients for PAB, PBA, and kv. Since the purpose of these
fittings was to remove the passive permeability from the total
transport, we needed to take these transients into account.
We assume that the passive permeability is the same
whether or not P-gp is inhibited by GF120918, so the PAB
and PBA values are taken in the presence of GF120918. It is
nearly impossible to test this assumption, but it is reasonable.
During active transport, the true system average drug
concentration would have to include the term for T1, sincethat is drug-bound to P-gp. When that is done in Eq. 6, then
Eq. 7 would contain dT1/dt and the sum gives the same
answer as Eq. 8. Thus, we can estimate the kv when P-gp is
active using Eq. 8. For loperamide, this makes a difference,
since Tran et al. (2004) showed that loperamide loss was
substantially greater in the presence of GF120918. The
reason for this is not known yet.
To incorporate the transients of passive permeability
coefficients and kv values requires a choice. One extreme
would be to use all of the individual measurements for PAB,
PBA, and kv for each time interval. This would be correct if
the passive permeability transients measured in the presence
of the P-gp inhibitor GF120918 were exactly the same as in
its absence, where we measure total transport. This seems
unlikely and we did not want to be fitting the noise of the
experiment. The other extreme would be to use the time
average of all of the individual measurements for PAB, PBA,
and kv. This would largely ignore the transients.
Our approach was to use the individual values until they
roughly stabilized and then use the time average from that
point on for fitting the remaining time intervals. However,
we did not want to make the decision for the stabilization
times for each data set, since that would introduce an
additional fitting decision. So we used the times found in
Tran et al. (2004). For both amprenavir and quinidine, we
used individual values for kv up to 1 h, and the average kv
Elementary Parameters of P-gp Transport 721
Biophysical Journal 88(1) 715–738
from all points after 1 h. For the passive permeability
coefficients, amprenavir was stable at half an hour, whereas
quinidine showed changes for 3 h. For loperamide, both
passive permeability coefficients and drug loss coefficients
changed for the first 3 h before stabilization.
ALGORITHM FOR HIERARCHICAL EXHAUSTIVEDATA FITTING
We now use the fitted passive permeability parameters to
find all active transport parameter vectors (T(0), k11, kr1, k21)that will best fit all of the data for total transport. We start by
creating a grid of initial vectors of parameter values that
spans all possible values for each of the four active transport
parameters. The problem of searching a large multi-variable
parameter space for kinetic best fits is there are likely to be
very many peaks and valleys in the CV surface, just like the
protein folding problem (Chan and Dill, 1998). Search
routines like fminsearch stop in the first valley encountered.
To illustrate this fitting surface, we use a cartoon with two
parameters and the oversimplified fitting surface in Fig. 2,
since the true fitting surface for our problem depends upon
four parameters and cannot be clearly visualized. The initial
parameter vector grid we set up can be represented by the
grid on the fitting surface, as projected up from the kinetic
parameter (X, Y) plane. For each initial vector, MATLAB
numerically integrates the kinetic equations, Eq. 10, com-
putes the CV between the data and the simulation, and then
the MATLAB function fminsearch adjusts the parameters
until a best local fit to the data is obtained. MATLAB’s
fminsearch stops when a local minimum in CV is reached
within the tolerances of the Nelder-Mead simplex (direct
search) method on which this minimization routine is based.
The consensus answer we seek will be the cluster of fit
vectors that are best fits for all drug concentrations used.
To find the best fit, i.e., the ‘‘deepest valley’’, the initial grid
point must be within the ‘‘foothills’’ of the valley with the
deepest well, shown by the deep spike in Fig. 2, which is why
an exhaustive search of the entire parameter space is
necessary. Furthermore, and just as importantly, the exhaus-
tive search will also determine whether there is more than one
‘‘deepest’’ valley, i.e., two or more widely separately sets of
parameters that fit the data equally well. A rule of thumb
appears to be that if the model is appropriate, i.e., realistic but
not overspecified, then as the fitting hierarchy proceeds, the
parameter space volume that fits the data best will decrease
until a small compact space is found. We call this box the
consensus fits, wherein any vector within the consensus space
will fit the data for all of the different substrate concentrations
equally well. Achieving smaller volumes than we reach
should be possible, but the computation time would be much
longer. We are studying this problem.
Initial parameter grid
For the rate constants, we begin with plausible ranges, but
these parameters are unconstrained, so that fminsearch in
MATLAB can move out of the initial range if there is a local
minimum for the CV out there. The rate constants are only
constrained to be positive.
The initial range for the association rate constant, k11, was106–1012 M�1s�1, the upper bound probably being above the
lipid lateral diffusion control (Keizer, 1987; Molski et al.,
1996; Hinterdorfer et al., 1997). The initial range for the
efflux rate constant, k21, was 1–104(s�1), which contains the
range of currently known ATP hydrolysis rate constants
(Urbatsch et al., 2003; Loo and Clarke, 2000). The initial
range for the dissociation rate constant, kr1, was actually
fixed by the substrate binding to P-gp, given by the binding
constant KB ¼ k11/kr1, which will start in the typical range of102–106 M�1 . Again, these are just starting ranges and the
fitting was not constrained to remain within these ranges.
The amount of P-gp per cell has been estimated for other
cell lines using quantitative Western blots (Ambudkar et al.,
1997), but not for the cells we use. Since the expression
levels of P-gp depends upon many factors, including some
that are unknown at this time, we believe that it is important
not to fix this parameter. We refer to T(0) as the density for
efflux active P-gp. The terminology used is not meant to
imply that other P-gp in the cell are misfolded or sequestered
within the cell, but our kinetic analysis only measures those
P-gp that efflux drug directly into the apical chamber. We
will refine this idea below.
On the other hand, the surface density for any membrane
protein has physical constraints. It must be less than the
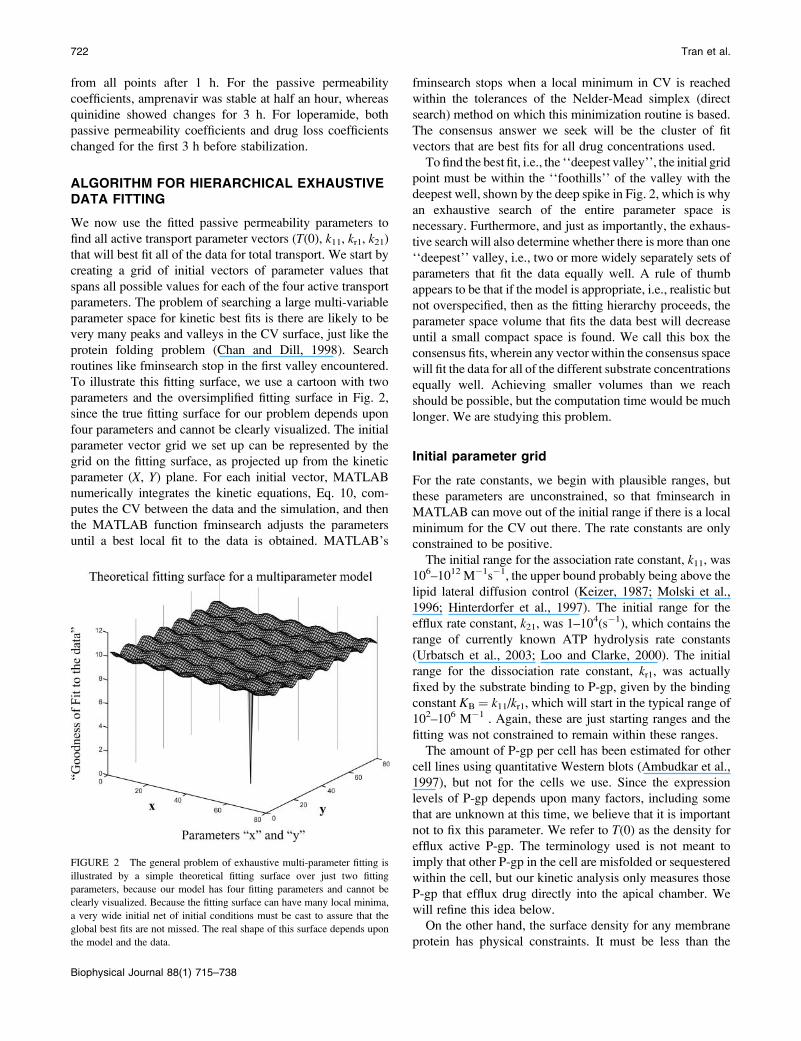
FIGURE 2 The general problem of exhaustive multi-parameter fitting is
illustrated by a simple theoretical fitting surface over just two fitting
parameters, because our model has four fitting parameters and cannot be
clearly visualized. Because the fitting surface can have many local minima,
a very wide initial net of initial conditions must be cast to assure that the
global best fits are not missed. The real shape of this surface depends upon
the model and the data.
722 Tran et al.
Biophysical Journal 88(1) 715–738
surface density of proteins known to closely pack on the
membrane surface, e.g., influenza hemagglutinin (HA) on
a viral surface, which is a homotrimer with three trans-
membrane domains and densely covers the viral surface. In
comparison, P-gp has 12 transmembrane domains, which
clearly constrains P-gp to a smaller surface density than
influenza HA. For computational convenience, T(0) was
expressed in mols P-gp/L(apical membrane inner mono-
layer), but this can be converted to P-gp/mm2 (of apical
membrane) simply by multiplying by 1.2 3 106, which
assumes a 2 nm thick acyl chain region in the apical mem-
brane inner monolayer. For example, the surface density of
influenza HA on the virion is ;16,000/mm2 (Mittal et al.,
2002), which would mean that T(0) , 16,000/1.2 3 106 M
¼ 0.013 M. We have chosen a minimum surface density for
P-gp of four orders of magnitude smaller, which amounts to
;1 P-gp/mm2, which is very conservative. Thus, the range
for T(0) has been fixed as 10�2 M . T(0) . 10�6 M. It will
turn out that the surface density of efflux active P-gp in these
cells was smaller than the estimates of P-gp densities
obtained from other cell lines using Western blots. In the
Discussion, we will suggest why this might be a perfectly
consistent result.
These generous ranges are necessary to make sure that all
possible parameter vectors that can fit the data are dis-
covered. The problem then becomes that the ranges are so
large that the initial search space is huge and cannot be
covered in a brute force way, i.e., starting at one end and
going to the other end in some linear fashion. Each of the
parameters has a theoretical range of at least four orders of
magnitude. On a unitary log scale, each parameter generates
nine values per decade, i.e., 1–9, with four decades per
parameter, yielding (9 3 4)4 ¼ 1.7 3 106 initial vectors.
Each initial vector was the starting point for a local best fit,
which requires at least 5 min on a 2.4 GHz PC. Brute force
would require more than 15 years of computation per drug
concentration. So we must build a fitting algorithm.
The hierarchical fitting algorithm
Previous experience in fitting kinetic equations for liposome
aggregation and fusion (Bentz and Nir, 1981; Bentz et al.,
1983), showed that the fitted ranges for the ‘‘forward’’
parameters were not likely to be very sensitive to the reverse
reaction. Since those differential equations were similar to
the mass action kinetic equations for the Michaelis-Menten
reaction, we took that as the first step of the fitting algorithm.
That is, as a start, the ‘‘forward’’ B . A data could be fitted
using only the ‘‘forward’’ parameters T(0), k11, and k21, withkr1 fixed at zero. This reduces the first search to three
parameters instead of four, which saves a lot of time since
fitting time increases roughly by the power of the number of
parameters being fitted. Once the forward parameters were
fitted to reduce their ranges, then the ‘‘reverse’’ A . B data
could be fitted using kr1 and the reduced range of values
found for T(0), k11, and k21. Of course, if this assumption
were wrong, the fit to the A . B data would find very
different parameter ranges for T(0), k11, and k21. We shall see
that this approach works very well and reduces the numbers
of initial grid vectors from more than a million to only a few
thousand, requiring ,2 weeks of computation per drug
concentration. The algorithm also produced an interesting
artifact, which we will discuss and discard below.
‘‘Model data’’ as a control
An extremely important control for fitting several parameters
to a kinetic model is to simulate ‘‘model data’’ and subject
that ‘‘model data’’ to the same analysis as the real data.
‘‘Model data’’, for the Michaelis-Menten mass action model
we have used, was simulated using a parameter vector from
the ‘‘center of the box’’ of the consensus vectors for the
amprenavir data, as obtained at the end of our data-fitting
process. If the transport of amprenavir by P-gp is modeled
adequately by the one-binding site Michaelis-Menten re-
action, then subjecting the ‘‘model data’’ to the same fitting
algorithm must yield the same basic results as observed for
the amprenavir data.
RESULTS
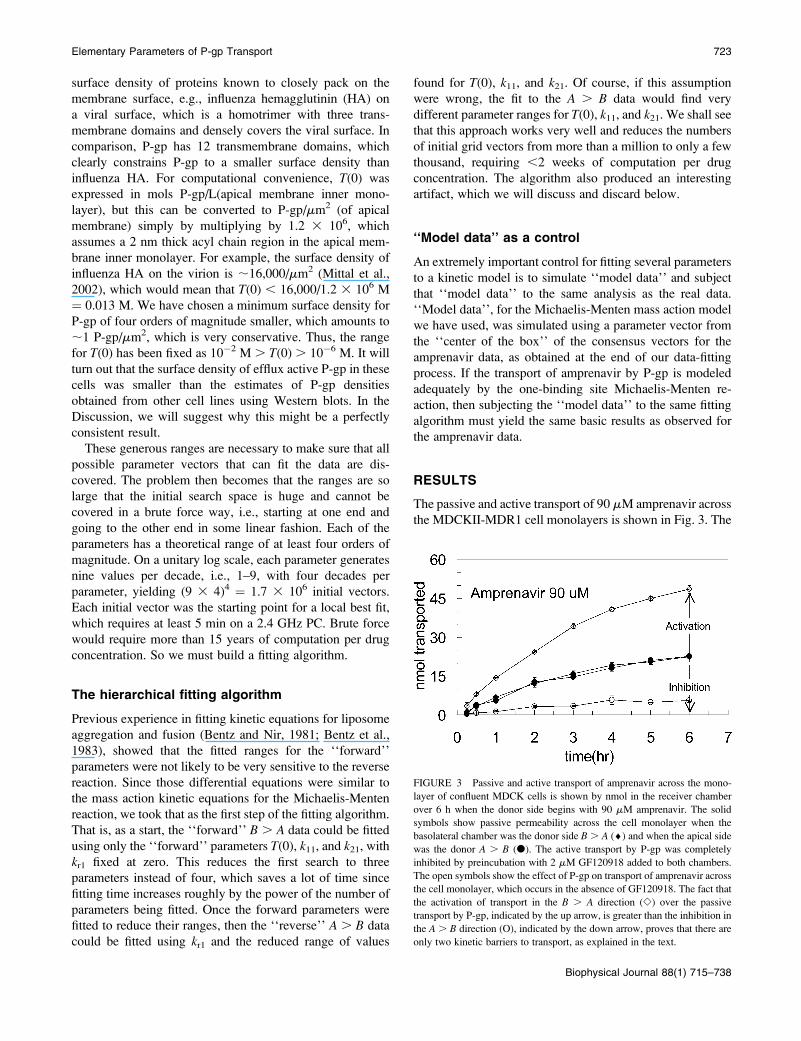
The passive and active transport of 90 mM amprenavir across
the MDCKII-MDR1 cell monolayers is shown in Fig. 3. The
FIGURE 3 Passive and active transport of amprenavir across the mono-
layer of confluent MDCK cells is shown by nmol in the receiver chamber
over 6 h when the donor side begins with 90 mM amprenavir. The solid
symbols show passive permeability across the cell monolayer when the
basolateral chamber was the donor side B. A (¤) and when the apical sidewas the donor A . B (d). The active transport by P-gp was completely
inhibited by preincubation with 2 mM GF120918 added to both chambers.
The open symbols show the effect of P-gp on transport of amprenavir across
the cell monolayer, which occurs in the absence of GF120918. The fact that
the activation of transport in the B . A direction (e) over the passive
transport by P-gp, indicated by the up arrow, is greater than the inhibition in
the A . B direction (O), indicated by the down arrow, proves that there are
only two kinetic barriers to transport, as explained in the text.
Elementary Parameters of P-gp Transport 723
Biophysical Journal 88(1) 715–738
passive permeability was determined in the presence of
2 mM GF120918, a potent inhibitor of P-gp (Hyafil et al.,
1993; Polli et al., 2001; Tran et al., 2004), shown by solid
symbols. The nmol transported is symmetric over time, i.e.,
the same for B. A and A. B, which would be expected fora static passive barrier. That was not the case for quinidine
and loperamide (Tran et al., 2004). The open symbols show
the total transport, when P-gp is active (i.e., without
GF120918), with triangles showing the P-gp mediated activ-
ation of transport in the B . A direction and the inhibition
of transport in the A . B direction. For amprenavir, the
passive permeability coefficients were symmetric and con-
stant in time after ;15 min, i.e., PBA ¼ PAB � 200 nm/s.
Amprenavir had no significant loss of substrate, i.e., kv ,
1 3 10�6 s�1.
Above, we have claimed there are only two kinetic
barriers for transport of the drugs studied here, i.e., the
basolateral and apical membranes. This means that a third
kinetic barrier between the apical and basolateral chambers,
e.g., through the cytosol, is kinetically irrelevant for these
drugs. We can now prove this assertion.
Relative to passive permeability, the activation of B . Atransport by P-gp, i.e., from the basolateral chamber to the
apical chamber, illustrated in Fig. 3 by the length of the
arrow aimed up, was always greater than the inhibition of
A. B transport by P-gp, i.e., from the apical chamber to the
basolateral chamber, illustrated by the length of the arrow
aimed down. Remarkably, this simple test is diagnostic for
there being only two barriers to active transport. If there were
an additional kinetic barrier between the basolateral
membrane inner monolayer and the apical membrane inner
monolayer, e.g., substrates following a path through the
cytosol, then the predicted shape of Fig. 3 would be just
the opposite. The activation arrow would be shorter than the
inhibition arrow (simulations not shown). The reason for this
is that the additional barrier slows access of substrate to P-gp
from the basolateral side, reducing activation, whereas
transport from the apical side is hardly affected, since drug
escape from P-gp into the apical membrane is rate limiting
anyway. Other drugs have shown this ‘‘two-barrier’’ shape
(Troutman and Thakker, 2003). Of course, this diagnostic
can identify substrates for which there is a third barrier.
Thus, it appears that the nearly all of B . A transport of
amprenavir, as well as loperamide and quinidine, follows the
path of binding to outer basolateral monolayer, flip-flopping
across the bilayer, and then rapid lateral diffusion within the
lipids to the apical membrane inner monolayer, where it
binds to P-gp, in a highly reversible way, and is effluxed out
into the apical chamber. A . B transport is simply the
opposite.
Passive and active transport data were collected for 100,
80, 70, 60, 50, 10, and 1 mM amprenavir, just as was done
for 90 mM amprenavir in Fig. 3. We did not use the data from
1 and 10 mM amprenavir for fitting parameters and they
became a tester data set at the end. The first fitting step is
a coarse fitting the B . A data using only the ‘‘forward’’
parameters, with kr1 ¼ 0. We set up a grid of initial vectors
covering a four-order of magnitude range for each parameter.
The grid and tolerance is shown in Run I of Table 1. All
possible combinations of the three parameters were used as
initial vectors, 729 in all.
Separate fitting runs were carried out for each substrate
concentration. Then, for each concentration, the fitted
parameters for each of the 729 fits were sorted by the
coefficient of variation. As an example, Fig. 4 shows the CV
as a function of CV rank order for 90 mM amprenavir, which
is the substrate concentration we will follow through the
analysis; ;609 of the fits had the same CV ; 0.03, which
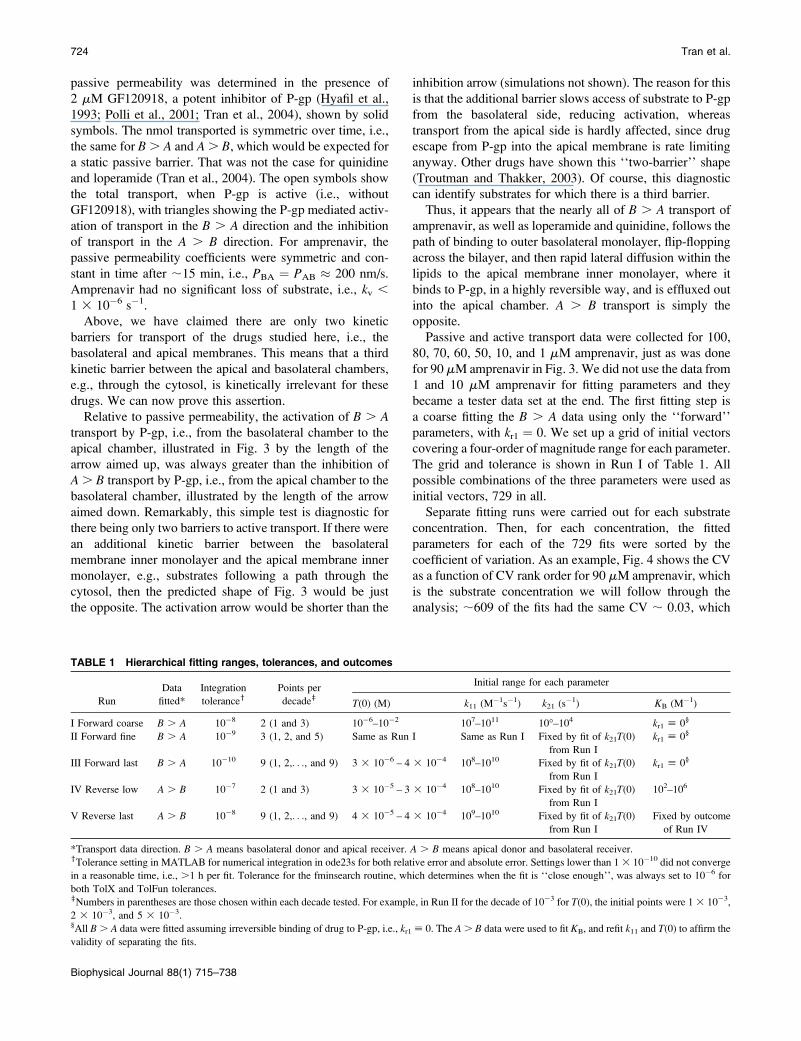
TABLE 1 Hierarchical fitting ranges, tolerances, and outcomes
Run
Data
fitted*
Integration
toleranceyPoints per
decadez
Initial range for each parameter
T(0) (M) k11 (M�1s�1) k21 (s
�1) KB (M�1)
I Forward coarse B . A 10�8 2 (1 and 3) 10�6–10�2 107–1011 10�–104 kr1 [ 0§
II Forward fine B . A 10�9 3 (1, 2, and 5) Same as Run I Same as Run I Fixed by fit of k21T(0)
from Run I
kr1 [ 0§
III Forward last B . A 10�10 9 (1, 2,. . ., and 9) 3 3 10�6 – 4 3 10�4 108–1010 Fixed by fit of k21T(0)
from Run I
kr1 [ 0§
IV Reverse low A . B 10�7 2 (1 and 3) 3 3 10�5 – 3 3 10�4 108–1010 Fixed by fit of k21T(0)
from Run I
102–106
V Reverse last A . B 10�8 9 (1, 2,. . ., and 9) 4 3 10�5 – 4 3 10�4 109–1010 Fixed by fit of k21T(0)
from Run I
Fixed by outcome
of Run IV
*Transport data direction. B . A means basolateral donor and apical receiver. A . B means apical donor and basolateral receiver.yTolerance setting in MATLAB for numerical integration in ode23s for both relative error and absolute error. Settings lower than 13 10�10 did not converge
in a reasonable time, i.e., .1 h per fit. Tolerance for the fminsearch routine, which determines when the fit is ‘‘close enough’’, was always set to 10�6 for
both TolX and TolFun tolerances.zNumbers in parentheses are those chosen within each decade tested. For example, in Run II for the decade of 10�3 for T(0), the initial points were 13 10�3,
2 3 10�3, and 5 3 10�3.§All B. A data were fitted assuming irreversible binding of drug to P-gp, i.e., kr1 [ 0. The A. B data were used to fit KB, and refit k11 and T(0) to affirm the
validity of separating the fits.
724 Tran et al.
Biophysical Journal 88(1) 715–738
gives a very good fit visually. The larger rank orders had
progressively worse fits. Thus, we discarded those fits with
CV . 0.03.
We will now look at the remaining fitted parameters to see
if good fits to the data, for 90 mM amprenavir in the example
being followed, reduce the fitting volume or show any
correlations that would reduce the number of parameters to
be fitted. Fig. 5 shows the plot of the fitted values for P-gp
density, T(0), and the association rate constant, k11. Fits arefound over the entire input range, showing that there has
been no reduction in the fitting volume. For some amprenavir
concentrations, including 90 mM, a few correlated points
were observed forming a straight line with the negative slope
of almost exactly �1. These points are an artifact of the
fitting algorithm applied to the Michaelis-Menten mass
action reaction, which we will address in detail below with
the last forward fit, i.e., Run III.
Fig. 6 shows the plot of the fitted values for P-gp density,
T(0), and the efflux rate constant, k21. Although it is clear thatthere has been no reduction in the fitting volume, the more
startling point was that fitted values for these two parameters
are essentially perfectly correlated. Each fitted value of T(0)defines the fitted value of k21 � 0.01/T(0) s�1. Thus, these
two parameters need not be independently fitted. This is
shown as the outcome of Run I in Table 1.
Why would these two parameters be correlated? Obvi-
ously, in terms of the classical Michaelis-Menten analysis,
k21T(0) is ‘‘Vmax’’. The correlation implies that the fit to the
whole time course for a single substrate concentration
contains an extrapolation to the k21T(0) anticipated at high
substrate concentrations.
To show that this correlation is not an artifact of the fitting
algorithm, we tested it with the ‘‘model data’’. We generated
computer-simulated data using a parameter vector within the
set of best fits for amprenavir, as defined in Table 4 below.
These ‘‘model data’’ represent perfect data for the case that
P-gp is a single site Michaelis-Menten type transporter and
there is no experimental error. We note here that the ‘‘model
data’’ for P-gp with one or two binding sites were the same,
assuming both sites had to be filled for one drug molecule
to be effluxed. This is because association was so rapid
(simulations not shown). The ‘‘model data’’ for all drug
concentrations were then fitted with the algorithm being
followed here. For each concentration of substrate, the fitting
gave a constant value for k21T(0), which is shown as the solidhyperbolic line in Fig. 7. Interestingly, the small substrate
concentrations predict a k21T(0) product that is smaller than
the value of k21T(0) used to simulate the data in the first
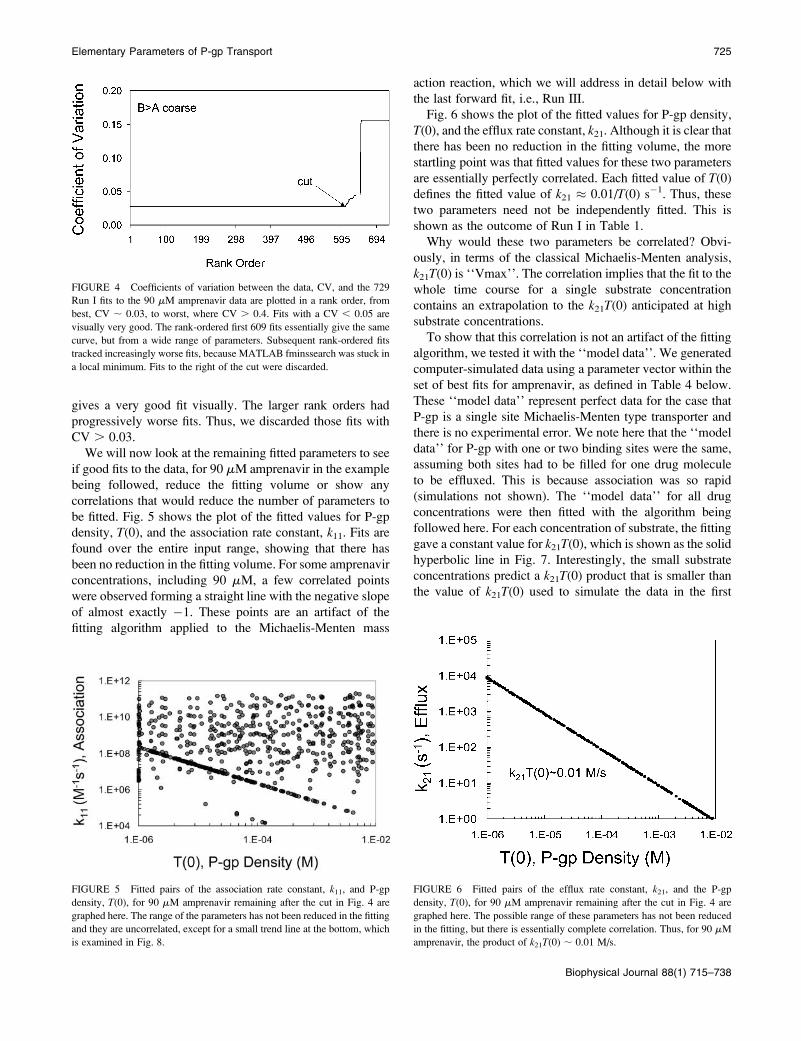
FIGURE 4 Coefficients of variation between the data, CV, and the 729
Run I fits to the 90 mM amprenavir data are plotted in a rank order, from
best, CV ; 0.03, to worst, where CV . 0.4. Fits with a CV , 0.05 are
visually very good. The rank-ordered first 609 fits essentially give the same
curve, but from a wide range of parameters. Subsequent rank-ordered fits
tracked increasingly worse fits, because MATLAB fminssearch was stuck in
a local minimum. Fits to the right of the cut were discarded.
FIGURE 5 Fitted pairs of the association rate constant, k11, and P-gp
density, T(0), for 90 mM amprenavir remaining after the cut in Fig. 4 are
graphed here. The range of the parameters has not been reduced in the fitting
and they are uncorrelated, except for a small trend line at the bottom, which
is examined in Fig. 8.
FIGURE 6 Fitted pairs of the efflux rate constant, k21, and the P-gp
density, T(0), for 90 mM amprenavir remaining after the cut in Fig. 4 are
graphed here. The possible range of these parameters has not been reduced
in the fitting, but there is essentially complete correlation. Thus, for 90 mM
amprenavir, the product of k21T(0) ; 0.01 M/s.
Elementary Parameters of P-gp Transport 725
Biophysical Journal 88(1) 715–738
place, i.e., 9 3 10�3 M/s. However, as the substrate con-
centration increased, the predicted k21T(0) becomes equal to
the correct value. Thus, even with model data, the correct
k21T0 value is obtained only when the substrate concentra-
tion is large enough. This fit was the outcome of Run I in
Table 1.
Fig. 7 also shows the k21T(0) values fitted from the
different amprenavir concentrations as diamond symbols.
We take the average of the highest three concentrations,
which is ;k21T(0) ¼ 9 3 10�3 M/s, which was the value
used to simulate the ‘‘model data’’. In terms of final
fitted values, whether we take k21T(0) ¼ 0.012, 0.009, or
0.006 M/s will be insignificant, since we are aiming for the
final parameter ranges to be within an order of magnitude
box. It is important to note here that we use the same average
value for k21T(0) ¼ 9 3 10�3 M/s for all subsequent fits,
rather than the individual values shown in Fig.7.
The second or fine fitting comes next. As explained in the
Fitting Algorithm section, this is a two-parameter fit to the
B . A data using T(0) and k11, with the parameter range of
the first, or coarse fit, but with a finer grid. Also, kr1 ¼ 0 and
k21 ¼ 0.009/T(0) s�1. A higher stringency is used with
ode23s; relative and absolute tolerances were set at 10�9.
The grid and tolerance is shown in Run II of Table 1. All
possible combinations of the two parameters were used as
initial vectors, 132 ¼ 169 in all. For economy, these fits are
not shown. The parameter ranges were reduced to 3 3 10�6
, T(0) , 3 3 10�4 and 108 , k11 , 1010, as shown as the
initial range of Run III in Table 1.
This brings us to the final forward fit, with the most
stringent tolerances on ode23s, relative and absolute at
10�10, and a unitary grid, i.e., 1, 2, . . . , 9, 10, 20, . . . . We use
the consensus box of the fine fit, but the exact boundaries are
not that crucial since this is an open fit, i.e., fminsearch can
find fits outside of the initial box. The grid and tolerance is
shown in Run III of Table 1. All possible combinations of the
two parameters were used as initial vectors, 18 3 19 ¼ 342
in all.
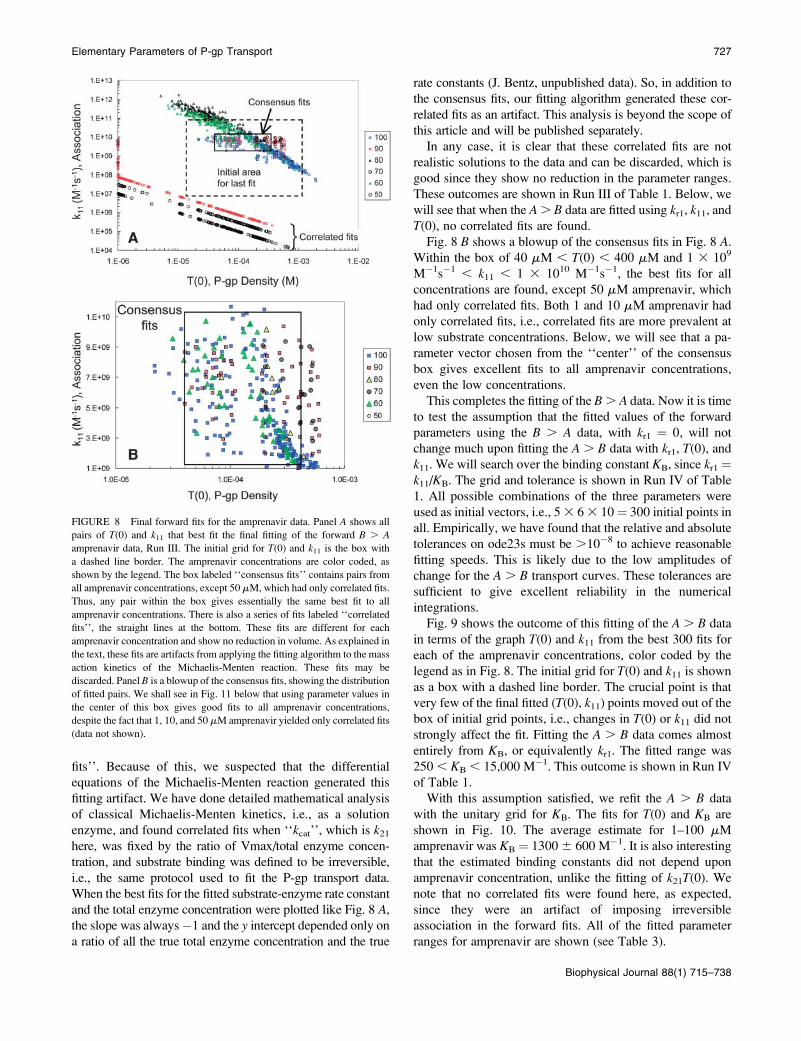
Fig. 8 A shows the outcome of this fitting in terms of the
graph T(0) and k11 from the best fits for all fitted amprenavir
concentrations, which are color coded, as shown in the
legend. The initial grid for T(0) and k11 is shown by the box
with a dashed line border. This plot shows that some fits
ended far away from the initial grid. With the smallest grid
and the highest stringency on the numerical integrations,
many possible fits still show up. We can reject the fits that lay
against the constraints on T(0) as being unphysical, as
explained above. Within the box labeled consensus fits, we
find the fit vectors for all amprenavir concentrations, which
is what we will use to complete the fitting process using the
A . B data.
Before proceeding, though, we need to explain the distinct
sets of fits at the bottom of the graph of Fig. 8 A, which we
have labeled the correlated fits, one of which was seen even
in the coarse fits shown in Fig. 5. For most of the amprenavir
concentrations, there was a distinct line of correlated fits with
a slope of ;�1, i.e., for the points on this line k11T(0) ¼constant. The MATLAB search function fminsearch has
found a good fit for the data for some (T(0), k11) pair and thatthe same curve can be retraced using a slightly larger T(0)and slightly smaller k11, and vice versa, over the entire fittingrange.
What is the origin of the correlated fits, and why are their
predicted k11 values so much smaller than those for the
consensus fits? To answer this question, we continued to use
the ‘‘model data’’, introduced at Fig. 7 for amprenavir. Even
though the model data were without error, the exact values
used in the simulation were not uniquely found; rather there
was a box of consensus fits that contained the ‘‘right an-
swer’’ (data not shown). More remarkably, a series of cor-
related fits were found as well, orders of magnitude below
the consensus fits and the values of k11 used to simulate the
model data, just like in Fig. 8 A. The only difference was thatall of the correlated fits for the ‘‘model data’’ lay on the same
straight line of slope �1, regardless of drug concentration.
This suggests that the offset y-intercepts seen in Fig. 8 A for
amprenavir were simply due to experimental error.
In Bentz and Nir (1981) and Bentz et al. (1983), we fitted
the aggregation and fusion kinetics of liposomes, which fol-
low similar differential equations, but found no ‘‘correlated
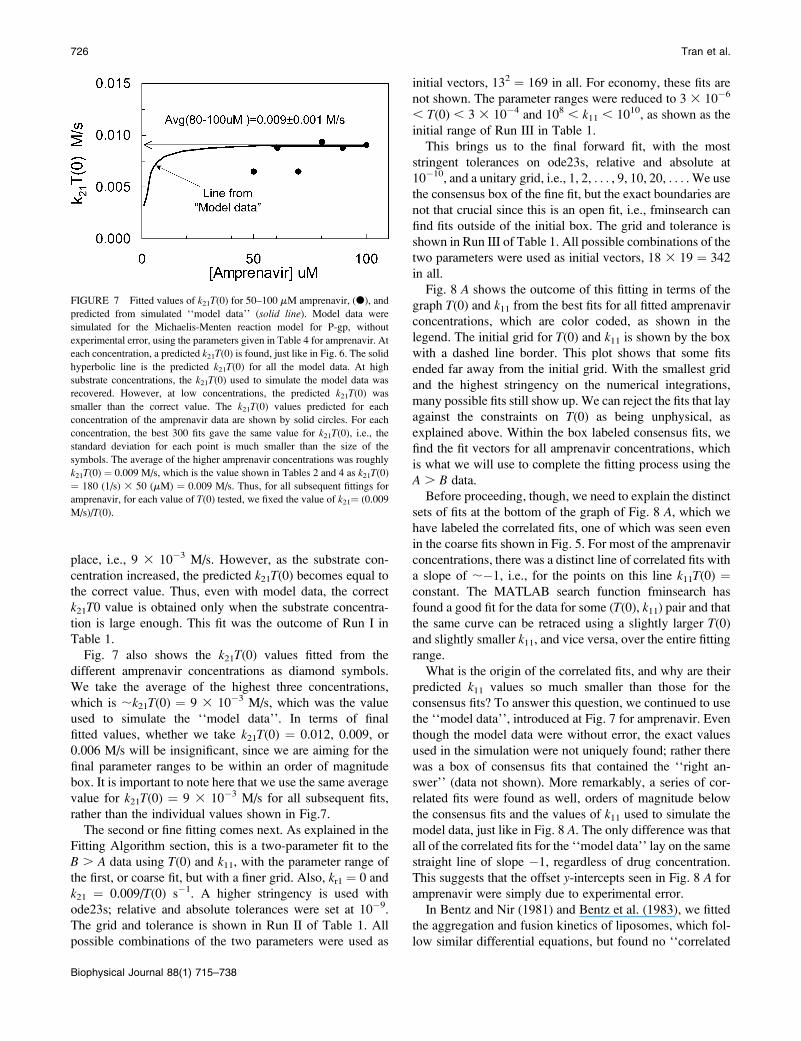
FIGURE 7 Fitted values of k21T(0) for 50–100 mM amprenavir, (d), and
predicted from simulated ‘‘model data’’ (solid line). Model data were
simulated for the Michaelis-Menten reaction model for P-gp, without
experimental error, using the parameters given in Table 4 for amprenavir. At
each concentration, a predicted k21T(0) is found, just like in Fig. 6. The solid
hyperbolic line is the predicted k21T(0) for all the model data. At high
substrate concentrations, the k21T(0) used to simulate the model data was
recovered. However, at low concentrations, the predicted k21T(0) was
smaller than the correct value. The k21T(0) values predicted for each
concentration of the amprenavir data are shown by solid circles. For each
concentration, the best 300 fits gave the same value for k21T(0), i.e., thestandard deviation for each point is much smaller than the size of the
symbols. The average of the higher amprenavir concentrations was roughly
k21T(0) ¼ 0.009 M/s, which is the value shown in Tables 2 and 4 as k21T(0)
¼ 180 (1/s) 3 50 (mM) ¼ 0.009 M/s. Thus, for all subsequent fittings for
amprenavir, for each value of T(0) tested, we fixed the value of k21¼ (0.009
M/s)/T(0).
726 Tran et al.
Biophysical Journal 88(1) 715–738
fits’’. Because of this, we suspected that the differential
equations of the Michaelis-Menten reaction generated this
fitting artifact. We have done detailed mathematical analysis
of classical Michaelis-Menten kinetics, i.e., as a solution
enzyme, and found correlated fits when ‘‘kcat’’, which is k21here, was fixed by the ratio of Vmax/total enzyme concen-
tration, and substrate binding was defined to be irreversible,
i.e., the same protocol used to fit the P-gp transport data.
When the best fits for the fitted substrate-enzyme rate constant
and the total enzyme concentration were plotted like Fig. 8 A,the slope was always�1 and the y intercept depended only ona ratio of all the true total enzyme concentration and the true
rate constants (J. Bentz, unpublished data). So, in addition to
the consensus fits, our fitting algorithm generated these cor-
related fits as an artifact. This analysis is beyond the scope of
this article and will be published separately.
In any case, it is clear that these correlated fits are not
realistic solutions to the data and can be discarded, which is
good since they show no reduction in the parameter ranges.
These outcomes are shown in Run III of Table 1. Below, we
will see that when the A. B data are fitted using kr1, k11, andT(0), no correlated fits are found.
Fig. 8 B shows a blowup of the consensus fits in Fig. 8 A.Within the box of 40 mM , T(0) , 400 mM and 1 3 109
M�1s�1 , k11 , 1 3 1010 M�1s�1, the best fits for all
concentrations are found, except 50 mM amprenavir, which
had only correlated fits. Both 1 and 10 mM amprenavir had
only correlated fits, i.e., correlated fits are more prevalent at
low substrate concentrations. Below, we will see that a pa-
rameter vector chosen from the ‘‘center’’ of the consensus
box gives excellent fits to all amprenavir concentrations,
even the low concentrations.
This completes the fitting of the B. A data. Now it is time
to test the assumption that the fitted values of the forward
parameters using the B . A data, with kr1 ¼ 0, will not
change much upon fitting the A . B data with kr1, T(0), andk11. We will search over the binding constant KB, since kr1 ¼k11/KB. The grid and tolerance is shown in Run IV of Table
1. All possible combinations of the three parameters were
used as initial vectors, i.e., 53 63 10¼ 300 initial points in
all. Empirically, we have found that the relative and absolute
tolerances on ode23s must be .10�8 to achieve reasonable
fitting speeds. This is likely due to the low amplitudes of
change for the A . B transport curves. These tolerances are
sufficient to give excellent reliability in the numerical
integrations.
Fig. 9 shows the outcome of this fitting of the A . B data
in terms of the graph T(0) and k11 from the best 300 fits for
each of the amprenavir concentrations, color coded by the
legend as in Fig. 8. The initial grid for T(0) and k11 is shownas a box with a dashed line border. The crucial point is that
very few of the final fitted (T(0), k11) points moved out of the
box of initial grid points, i.e., changes in T(0) or k11 did not
strongly affect the fit. Fitting the A . B data comes almost
entirely from KB, or equivalently kr1. The fitted range was
250, KB , 15,000 M�1. This outcome is shown in Run IV
of Table 1.
With this assumption satisfied, we refit the A . B data
with the unitary grid for KB. The fits for T(0) and KB are
shown in Fig. 10. The average estimate for 1–100 mM
amprenavir was KB ¼ 13006 600 M�1. It is also interesting
that the estimated binding constants did not depend upon
amprenavir concentration, unlike the fitting of k21T(0). We
note that no correlated fits were found here, as expected,
since they were an artifact of imposing irreversible
association in the forward fits. All of the fitted parameter
ranges for amprenavir are shown (see Table 3).
FIGURE 8 Final forward fits for the amprenavir data. Panel A shows all
pairs of T(0) and k11 that best fit the final fitting of the forward B . A
amprenavir data, Run III. The initial grid for T(0) and k11 is the box with
a dashed line border. The amprenavir concentrations are color coded, as
shown by the legend. The box labeled ‘‘consensus fits’’ contains pairs from
all amprenavir concentrations, except 50 mM, which had only correlated fits.
Thus, any pair within the box gives essentially the same best fit to all
amprenavir concentrations. There is also a series of fits labeled ‘‘correlated
fits’’, the straight lines at the bottom. These fits are different for each
amprenavir concentration and show no reduction in volume. As explained in
the text, these fits are artifacts from applying the fitting algorithm to the mass
action kinetics of the Michaelis-Menten reaction. These fits may be
discarded. Panel B is a blowup of the consensus fits, showing the distribution
of fitted pairs. We shall see in Fig. 11 below that using parameter values in
the center of this box gives good fits to all amprenavir concentrations,
despite the fact that 1, 10, and 50 mM amprenavir yielded only correlated fits
(data not shown).
Elementary Parameters of P-gp Transport 727
Biophysical Journal 88(1) 715–738
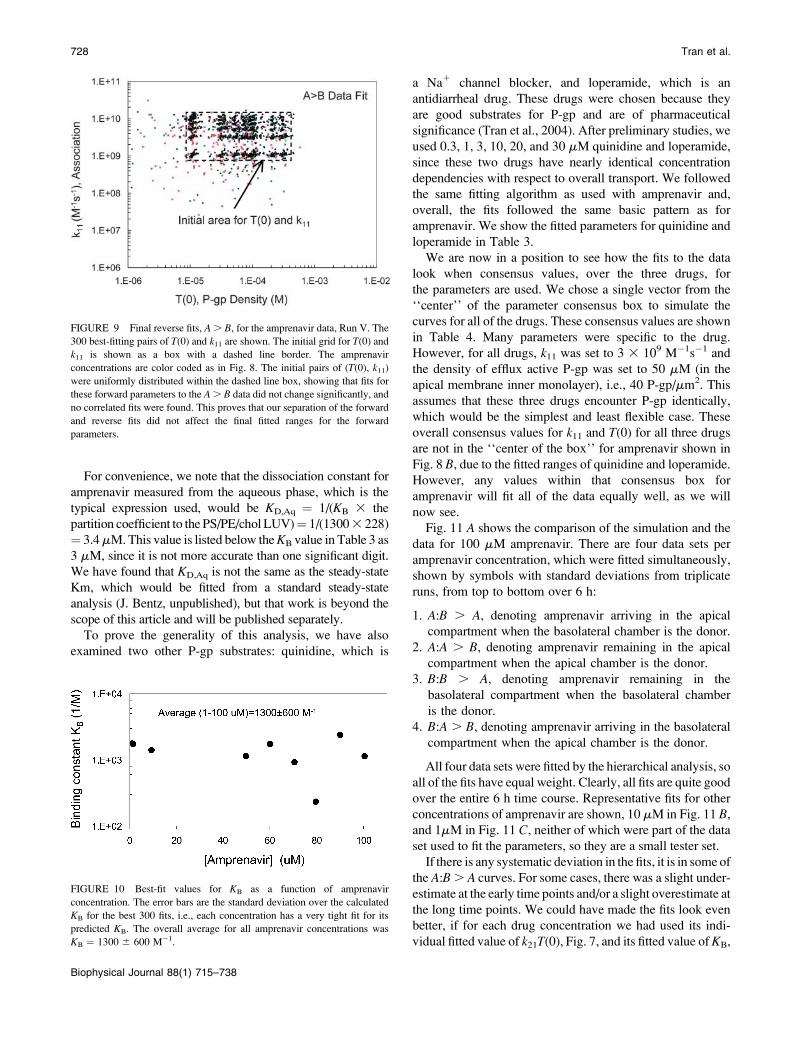
For convenience, we note that the dissociation constant for
amprenavir measured from the aqueous phase, which is the
typical expression used, would be KD,Aq ¼ 1/(KB 3 the
partition coefficient to the PS/PE/chol LUV)¼ 1/(13003 228)
¼ 3.4mM.This value is listed below theKB value in Table 3 as
3 mM, since it is not more accurate than one significant digit.
We have found that KD,Aq is not the same as the steady-state
Km, which would be fitted from a standard steady-state
analysis (J. Bentz, unpublished), but that work is beyond the
scope of this article and will be published separately.
To prove the generality of this analysis, we have also
examined two other P-gp substrates: quinidine, which is
a Na1 channel blocker, and loperamide, which is an
antidiarrheal drug. These drugs were chosen because they
are good substrates for P-gp and are of pharmaceutical
significance (Tran et al., 2004). After preliminary studies, we
used 0.3, 1, 3, 10, 20, and 30 mM quinidine and loperamide,
since these two drugs have nearly identical concentration
dependencies with respect to overall transport. We followed
the same fitting algorithm as used with amprenavir and,
overall, the fits followed the same basic pattern as for
amprenavir. We show the fitted parameters for quinidine and
loperamide in Table 3.
We are now in a position to see how the fits to the data
look when consensus values, over the three drugs, for
the parameters are used. We chose a single vector from the
‘‘center’’ of the parameter consensus box to simulate the
curves for all of the drugs. These consensus values are shown
in Table 4. Many parameters were specific to the drug.
However, for all drugs, k11 was set to 3 3 109 M�1s�1 and
the density of efflux active P-gp was set to 50 mM (in the
apical membrane inner monolayer), i.e., 40 P-gp/mm2. This
assumes that these three drugs encounter P-gp identically,
which would be the simplest and least flexible case. These
overall consensus values for k11 and T(0) for all three drugsare not in the ‘‘center of the box’’ for amprenavir shown in
Fig. 8 B, due to the fitted ranges of quinidine and loperamide.
However, any values within that consensus box for
amprenavir will fit all of the data equally well, as we will
now see.
Fig. 11 A shows the comparison of the simulation and the
data for 100 mM amprenavir. There are four data sets per
amprenavir concentration, which were fitted simultaneously,
shown by symbols with standard deviations from triplicate
runs, from top to bottom over 6 h:
1. A:B . A, denoting amprenavir arriving in the apical
compartment when the basolateral chamber is the donor.
2. A:A . B, denoting amprenavir remaining in the apical
compartment when the apical chamber is the donor.
3. B:B . A, denoting amprenavir remaining in the
basolateral compartment when the basolateral chamber
is the donor.
4. B:A . B, denoting amprenavir arriving in the basolateral
compartment when the apical chamber is the donor.
All four data sets were fitted by the hierarchical analysis, so
all of the fits have equal weight. Clearly, all fits are quite good
over the entire 6 h time course. Representative fits for other
concentrations of amprenavir are shown, 10 mM in Fig. 11 B,and 1mM in Fig. 11 C, neither of which were part of the dataset used to fit the parameters, so they are a small tester set.
If there is any systematic deviation in the fits, it is in some of
the A:B. A curves. For some cases, there was a slight under-
estimate at the early time points and/or a slight overestimate at
the long time points. We could have made the fits look even
better, if for each drug concentration we had used its indi-
vidual fitted value of k21T(0), Fig. 7, and its fitted value ofKB,
FIGURE 9 Final reverse fits, A. B, for the amprenavir data, Run V. The
300 best-fitting pairs of T(0) and k11 are shown. The initial grid for T(0) andk11 is shown as a box with a dashed line border. The amprenavir
concentrations are color coded as in Fig. 8. The initial pairs of (T(0), k11)
were uniformly distributed within the dashed line box, showing that fits for
these forward parameters to the A. B data did not change significantly, and
no correlated fits were found. This proves that our separation of the forward
and reverse fits did not affect the final fitted ranges for the forward
parameters.
FIGURE 10 Best-fit values for KB as a function of amprenavir
concentration. The error bars are the standard deviation over the calculated
KB for the best 300 fits, i.e., each concentration has a very tight fit for its
predicted KB. The overall average for all amprenavir concentrations was
KB ¼ 1300 6 600 M�1.
728 Tran et al.
Biophysical Journal 88(1) 715–738
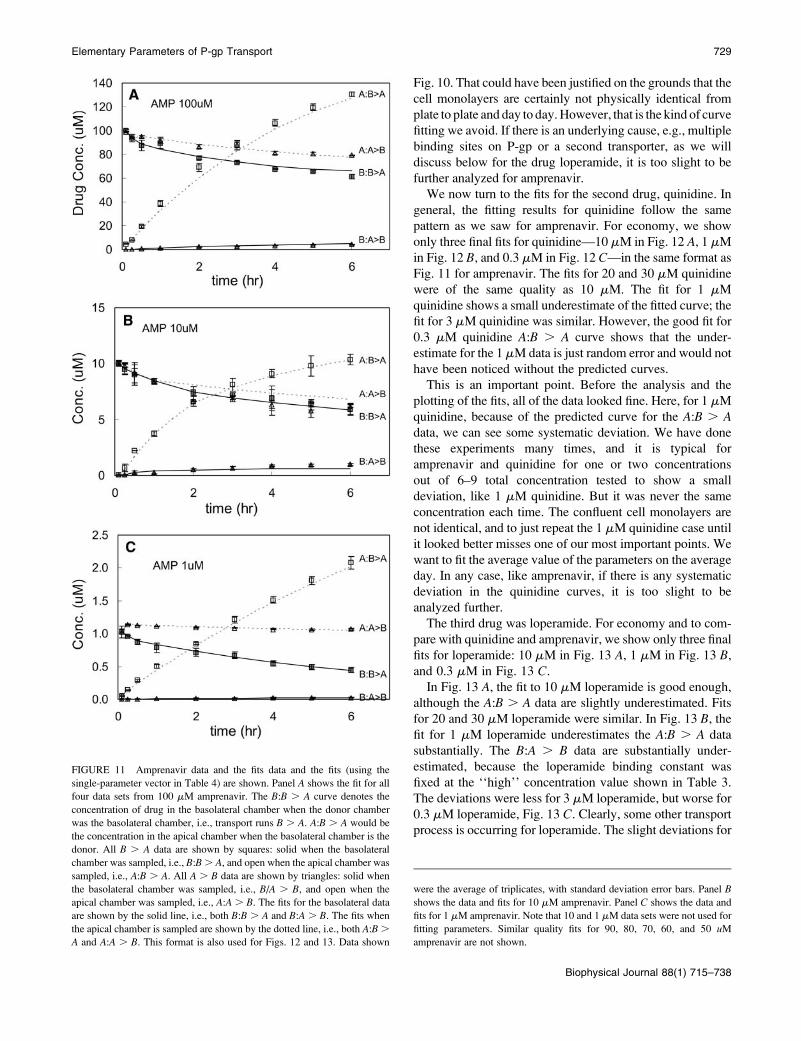
Fig. 10. That could have been justified on the grounds that the
cell monolayers are certainly not physically identical from
plate to plate and day to day.However, that is the kind of curve
fitting we avoid. If there is an underlying cause, e.g., multiple
binding sites on P-gp or a second transporter, as we will
discuss below for the drug loperamide, it is too slight to be
further analyzed for amprenavir.
We now turn to the fits for the second drug, quinidine. In
general, the fitting results for quinidine follow the same
pattern as we saw for amprenavir. For economy, we show
only three final fits for quinidine—10 mM in Fig. 12 A, 1 mMin Fig. 12 B, and 0.3 mM in Fig. 12 C—in the same format as
Fig. 11 for amprenavir. The fits for 20 and 30 mM quinidine
were of the same quality as 10 mM. The fit for 1 mM
quinidine shows a small underestimate of the fitted curve; the
fit for 3 mM quinidine was similar. However, the good fit for
0.3 mM quinidine A:B . A curve shows that the under-
estimate for the 1 mMdata is just random error and would not
have been noticed without the predicted curves.
This is an important point. Before the analysis and the
plotting of the fits, all of the data looked fine. Here, for 1 mM
quinidine, because of the predicted curve for the A:B . Adata, we can see some systematic deviation. We have done
these experiments many times, and it is typical for
amprenavir and quinidine for one or two concentrations
out of 6–9 total concentration tested to show a small
deviation, like 1 mM quinidine. But it was never the same
concentration each time. The confluent cell monolayers are
not identical, and to just repeat the 1 mM quinidine case until
it looked better misses one of our most important points. We
want to fit the average value of the parameters on the average
day. In any case, like amprenavir, if there is any systematic
deviation in the quinidine curves, it is too slight to be
analyzed further.
The third drug was loperamide. For economy and to com-
pare with quinidine and amprenavir, we show only three final
fits for loperamide: 10 mM in Fig. 13 A, 1 mM in Fig. 13 B,and 0.3 mM in Fig. 13 C.In Fig. 13 A, the fit to 10 mM loperamide is good enough,
although the A:B . A data are slightly underestimated. Fits
for 20 and 30 mM loperamide were similar. In Fig. 13 B, thefit for 1 mM loperamide underestimates the A:B . A data
substantially. The B:A . B data are substantially under-
estimated, because the loperamide binding constant was
fixed at the ‘‘high’’ concentration value shown in Table 3.
The deviations were less for 3 mM loperamide, but worse for
0.3 mM loperamide, Fig. 13 C. Clearly, some other transport
process is occurring for loperamide. The slight deviations for
FIGURE 11 Amprenavir data and the fits data and the fits (using the
single-parameter vector in Table 4) are shown. Panel A shows the fit for all
four data sets from 100 mM amprenavir. The B:B . A curve denotes the
concentration of drug in the basolateral chamber when the donor chamber
was the basolateral chamber, i.e., transport runs B . A. A:B . A would be
the concentration in the apical chamber when the basolateral chamber is the
donor. All B . A data are shown by squares: solid when the basolateral
chamber was sampled, i.e., B:B. A, and open when the apical chamber was
sampled, i.e., A:B . A. All A . B data are shown by triangles: solid when
the basolateral chamber was sampled, i.e., B/A . B, and open when the
apical chamber was sampled, i.e., A:A . B. The fits for the basolateral data
are shown by the solid line, i.e., both B:B . A and B:A . B. The fits when
the apical chamber is sampled are shown by the dotted line, i.e., both A:B.
A and A:A . B. This format is also used for Figs. 12 and 13. Data shown
were the average of triplicates, with standard deviation error bars. Panel B
shows the data and fits for 10 mM amprenavir. Panel C shows the data and
fits for 1 mM amprenavir. Note that 10 and 1 mM data sets were not used for
fitting parameters. Similar quality fits for 90, 80, 70, 60, and 50 uM
amprenavir are not shown.
Elementary Parameters of P-gp Transport 729
Biophysical Journal 88(1) 715–738
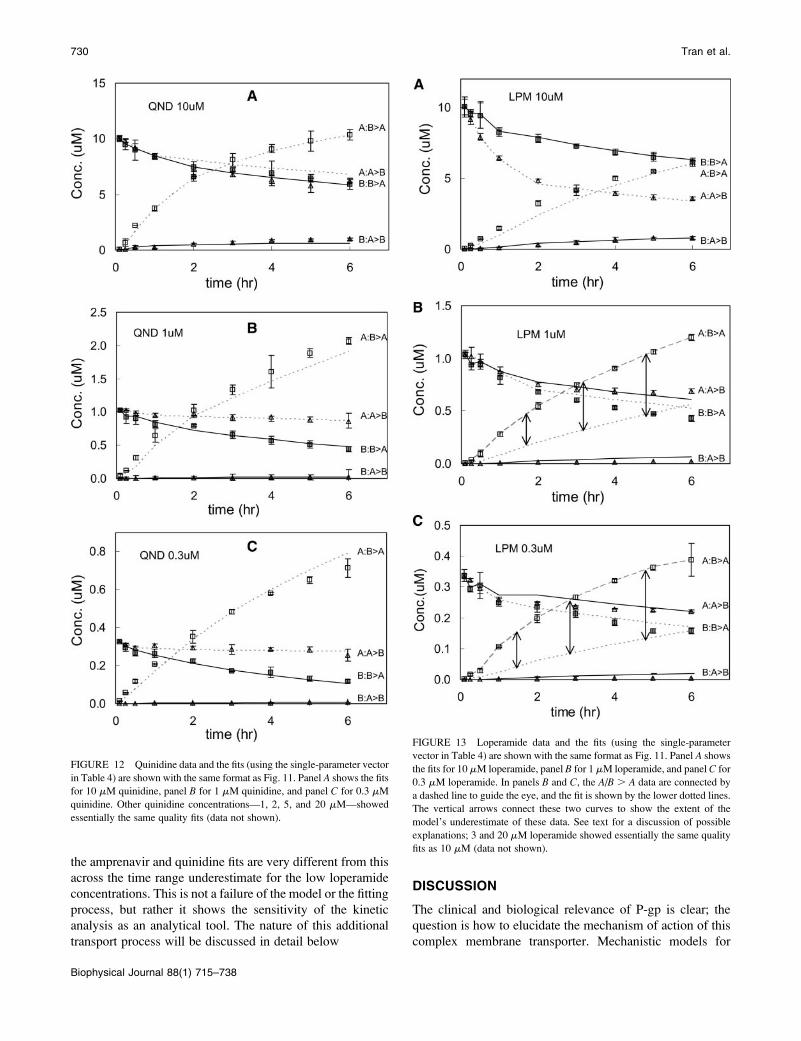
the amprenavir and quinidine fits are very different from this
across the time range underestimate for the low loperamide
concentrations. This is not a failure of the model or the fitting
process, but rather it shows the sensitivity of the kinetic
analysis as an analytical tool. The nature of this additional
transport process will be discussed in detail below
DISCUSSION
The clinical and biological relevance of P-gp is clear; the
question is how to elucidate the mechanism of action of this
complex membrane transporter. Mechanistic models for
FIGURE 12 Quinidine data and the fits (using the single-parameter vector
in Table 4) are shown with the same format as Fig. 11. Panel A shows the fits
for 10 mM quinidine, panel B for 1 mM quinidine, and panel C for 0.3 mM
quinidine. Other quinidine concentrations—1, 2, 5, and 20 mM—showed
essentially the same quality fits (data not shown).
FIGURE 13 Loperamide data and the fits (using the single-parameter
vector in Table 4) are shown with the same format as Fig. 11. Panel A shows
the fits for 10 mM loperamide, panel B for 1 mM loperamide, and panel C for
0.3 mM loperamide. In panels B and C, the A/B . A data are connected by
a dashed line to guide the eye, and the fit is shown by the lower dotted lines.
The vertical arrows connect these two curves to show the extent of the
model’s underestimate of these data. See text for a discussion of possible
explanations; 3 and 20 mM loperamide showed essentially the same quality
fits as 10 mM (data not shown).
730 Tran et al.
Biophysical Journal 88(1) 715–738
P-gp activity, and similar multi-drug transporters, have been
proposed based upon ATPase activity, Michaelis-Menten
steady-state analyses, and equilibrium binding studies of
purified/lipidated reconstitutions of P-gp and/or of plasma
membrane vesicles (Senior et al., 1995; van Veen et al.,
2000; Qu et al., 2003; al-Shawi et al., 2003; Loo et al., 2003;
Urbatsch et al., 2003). The confluent monolayer system that
we use is a better physiological model system of in vivo P-gp
activity, but it is more difficult to use. It requires a more
sophisticated kinetic analysis to extract the elementary rate
constants and the surface density of efflux active P-gp. The
confluent monolayer of cells does not readily permit
transport/ATP hydrolysis stoichiometric studies. Neverthe-
less, we believe that resolution of differences in parameter
estimates between the different expression systems will be
required to elucidate the in vivo activity of P-gp.
Our kinetic analysis was the unavoidable consequence of
not imposing the steady-state Michaelis-Menten equations
onto the data. P-gp active transport has (at least) four
kinetically important parameters, which become convolved
into the Vmax and Km of the Michaelis-Menten equation.
We felt that this convolution would hinder the resolution of
P-gp mechanism. This meant we had to simultaneously fit
the four most important kinetic parameters of P-gp transport.
Our kinetic data cannot address the question of multiple
substrate binding to P-gp, since the association and
dissociation kinetics for all drugs tested were so rapid that
any number of postulated binding sites on P-gp would be
empty or filled together. The predicted transport kinetics are
essentially identical (simulations not shown). Future work
involving substrate competition can address these issues
directly.
The two main questions we could address were: 1), would
the physiologically relevant polarized monolayer of
MDCKII-hMDR1 cells yield adequately precise data for
a rigorous analysis, and 2), was the simplest Michaelis-
Menten one-site mass action reaction adequate to fit the data
generated? The answer was yes, for both questions.
Simultaneous fitting of all parameters to all data was
attempted, but was too slow, i.e., after weeks only a small part
of the search space was covered. A much more sophisticated
search programwould be needed. However, the algorithmwe
constructedworked.A complete fit for one drug concentration
required;7–9 days on a 2.8 GHz PC. The keys to the success
of the fitting algorithm used here were:
1. The validity of the assumption that the data could be
fitted in two stages. First, the B . A forward data could
be used to yield good fits for the surface density of efflux
active P-gp, T(0), and the forward rate constants, k11 andk21, even though kr1 was fixed at zero for these fits to
reduce computation time. Second, the A . B reverse data
would be fitted essentially only by the dissociation rate
constant kr1, since the forward rate constants only weakly
affect the A . B fits. The correlated fits were unexpected,
but now it is known that they are artifacts for this fitting
algorithm used on the Michaelis-Menten mass action
reaction and can be discarded.
2. The unexpected, but understandable, finding that the
best fits to the B . A forward data had the product of
k21T(0) ¼ constant, like Vmax in the Michaelis-Menten
analysis, even though no steady-state assumption had
been imposed. This allowed us to reduce the dimensions
of the more refined forward fits to only T(0) and k11,thereby markedly accelerating the last fitting of the
‘‘forward’’ parameters.
The final fitted parameter ranges for all three drugs are
shown in Table 3. Clearly, the benchmark column was the
predicted surface density of efflux active P-gp on the apical
membrane. The independent analyses of each of the three
drugs yielded overlapping ranges. This overlap would not
occur if the model had ‘‘excess’’ parameters. There are just
too many different ways for different ranges to have been
chosen. Of course, the overlap does not prove that the fitted
values are accurate. There could be an unknown systematic
error that shifts the range from the ‘‘true’’ value. However,
the analysis of the model data, generated by simulations,
found the correct value of T(0), once the correlated fits were
discarded. This shows that the analysis, per se, was not
introducing any systematic error. There was no significantly
different outcome between the analysis of the model data and
that of the drug transport data. If there is a systematic error,
then it appears to be relatively minor.
So how do these fitted values for T(0) compare with
estimates for the amount of P-gp per cell made by quantitative
Western analysis? This has not been done with this cell line,
but has been done with similar cell lines (Ambudkar et al.,
1997; Ito et al., 1999). As stated above, since the expression
levels of P-gp depend upon many factors, not all of which are
necessarily known, we treated it as a fitted parameter.
However, it appears that the fitted value range for the surface
density of efflux active P-gp is at least 10 times smaller than
the total P-gp estimated inAmbudkar et al. (1997) for a similar
cell line. Because of the differences in cell systems, this
quantitative difference could be argued several ways, but we
speculate that both estimates are probably essentially correct.
So, how can more than 90% of P-gp in the confluent
monolayer not be efflux active? It is believed that most
expressed P-gp is in the plasma membrane, not sequestered
inside the cell, and we have no reason to believe that a large
fraction of the P-gp is misfolded. This is where the
appreciation of the interplay between the essential transport
parameters of P-gp and the details of the expression system
becomes important. By definition in the kinetic model, the
P-gp that are efflux active are those that send their drug
directly into the apical chamber, where it equilibrates
‘‘instantly’’, according to the partition coefficients, between
the sampling volume of the apical chamber and the outer
apical monolayer.
Elementary Parameters of P-gp Transport 731
Biophysical Journal 88(1) 715–738
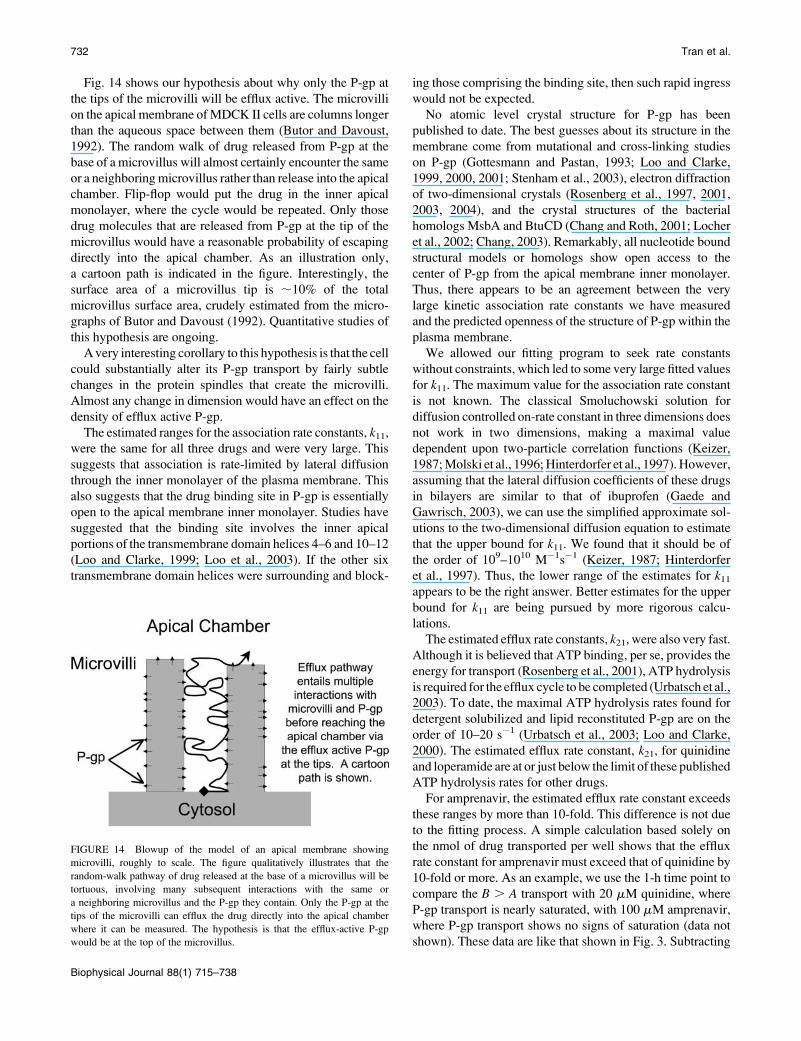
Fig. 14 shows our hypothesis about why only the P-gp at
the tips of the microvilli will be efflux active. The microvilli
on the apical membrane ofMDCK II cells are columns longer
than the aqueous space between them (Butor and Davoust,
1992). The random walk of drug released from P-gp at the
base of a microvillus will almost certainly encounter the same
or a neighboring microvillus rather than release into the apical
chamber. Flip-flop would put the drug in the inner apical
monolayer, where the cycle would be repeated. Only those
drug molecules that are released from P-gp at the tip of the
microvillus would have a reasonable probability of escaping
directly into the apical chamber. As an illustration only,
a cartoon path is indicated in the figure. Interestingly, the
surface area of a microvillus tip is ;10% of the total
microvillus surface area, crudely estimated from the micro-
graphs of Butor and Davoust (1992). Quantitative studies of
this hypothesis are ongoing.
Avery interesting corollary to this hypothesis is that the cell
could substantially alter its P-gp transport by fairly subtle
changes in the protein spindles that create the microvilli.
Almost any change in dimension would have an effect on the
density of efflux active P-gp.
The estimated ranges for the association rate constants, k11,were the same for all three drugs and were very large. This
suggests that association is rate-limited by lateral diffusion
through the inner monolayer of the plasma membrane. This
also suggests that the drug binding site in P-gp is essentially
open to the apical membrane inner monolayer. Studies have
suggested that the binding site involves the inner apical
portions of the transmembrane domain helices 4–6 and 10–12
(Loo and Clarke, 1999; Loo et al., 2003). If the other six
transmembrane domain helices were surrounding and block-
ing those comprising the binding site, then such rapid ingress
would not be expected.
No atomic level crystal structure for P-gp has been
published to date. The best guesses about its structure in the
membrane come from mutational and cross-linking studies
on P-gp (Gottesmann and Pastan, 1993; Loo and Clarke,
1999, 2000, 2001; Stenham et al., 2003), electron diffraction
of two-dimensional crystals (Rosenberg et al., 1997, 2001,
2003, 2004), and the crystal structures of the bacterial
homologs MsbA and BtuCD (Chang and Roth, 2001; Locher
et al., 2002; Chang, 2003). Remarkably, all nucleotide bound
structural models or homologs show open access to the
center of P-gp from the apical membrane inner monolayer.
Thus, there appears to be an agreement between the very
large kinetic association rate constants we have measured
and the predicted openness of the structure of P-gp within the
plasma membrane.
We allowed our fitting program to seek rate constants
without constraints, which led to some very large fitted values
for k11. The maximum value for the association rate constant
is not known. The classical Smoluchowski solution for
diffusion controlled on-rate constant in three dimensions does
not work in two dimensions, making a maximal value
dependent upon two-particle correlation functions (Keizer,
1987;Molski et al., 1996;Hinterdorfer et al., 1997). However,
assuming that the lateral diffusion coefficients of these drugs
in bilayers are similar to that of ibuprofen (Gaede and
Gawrisch, 2003), we can use the simplified approximate sol-
utions to the two-dimensional diffusion equation to estimate
that the upper bound for k11. We found that it should be of
the order of 109–1010 M�1s�1 (Keizer, 1987; Hinterdorfer
et al., 1997). Thus, the lower range of the estimates for k11appears to be the right answer. Better estimates for the upper
bound for k11 are being pursued by more rigorous calcu-
lations.
The estimated efflux rate constants, k21, were also very fast.Although it is believed that ATP binding, per se, provides the
energy for transport (Rosenberg et al., 2001), ATP hydrolysis
is required for the efflux cycle to be completed (Urbatsch et al.,
2003). To date, the maximal ATP hydrolysis rates found for
detergent solubilized and lipid reconstituted P-gp are on the
order of 10–20 s�1 (Urbatsch et al., 2003; Loo and Clarke,
2000). The estimated efflux rate constant, k21, for quinidineand loperamide are at or just below the limit of these published
ATP hydrolysis rates for other drugs.
For amprenavir, the estimated efflux rate constant exceeds
these ranges by more than 10-fold. This difference is not due
to the fitting process. A simple calculation based solely on
the nmol of drug transported per well shows that the efflux
rate constant for amprenavir must exceed that of quinidine by
10-fold or more. As an example, we use the 1-h time point to
compare the B . A transport with 20 mM quinidine, where
P-gp transport is nearly saturated, with 100 mM amprenavir,
where P-gp transport shows no signs of saturation (data not
shown). These data are like that shown in Fig. 3. Subtracting
FIGURE 14 Blowup of the model of an apical membrane showing
microvilli, roughly to scale. The figure qualitatively illustrates that the
random-walk pathway of drug released at the base of a microvillus will be
tortuous, involving many subsequent interactions with the same or
a neighboring microvillus and the P-gp they contain. Only the P-gp at the
tips of the microvilli can efflux the drug directly into the apical chamber
where it can be measured. The hypothesis is that the efflux-active P-gp
would be at the top of the microvillus.
732 Tran et al.
Biophysical Journal 88(1) 715–738
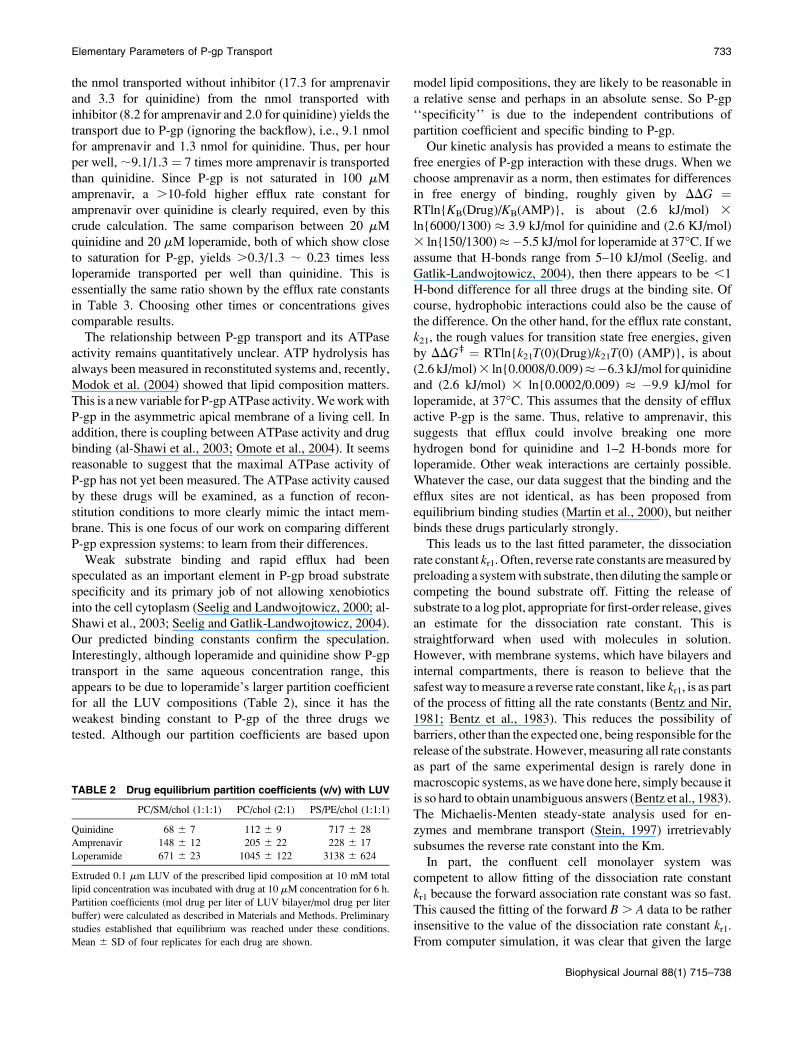
the nmol transported without inhibitor (17.3 for amprenavir
and 3.3 for quinidine) from the nmol transported with
inhibitor (8.2 for amprenavir and 2.0 for quinidine) yields the
transport due to P-gp (ignoring the backflow), i.e., 9.1 nmol
for amprenavir and 1.3 nmol for quinidine. Thus, per hour
per well,;9.1/1.3 ¼ 7 times more amprenavir is transported
than quinidine. Since P-gp is not saturated in 100 mM
amprenavir, a .10-fold higher efflux rate constant for
amprenavir over quinidine is clearly required, even by this
crude calculation. The same comparison between 20 mM
quinidine and 20 mM loperamide, both of which show close
to saturation for P-gp, yields .0.3/1.3 ; 0.23 times less
loperamide transported per well than quinidine. This is
essentially the same ratio shown by the efflux rate constants
in Table 3. Choosing other times or concentrations gives
comparable results.
The relationship between P-gp transport and its ATPase
activity remains quantitatively unclear. ATP hydrolysis has
always been measured in reconstituted systems and, recently,
Modok et al. (2004) showed that lipid composition matters.
This is a new variable for P-gpATPase activity.Weworkwith
P-gp in the asymmetric apical membrane of a living cell. In
addition, there is coupling between ATPase activity and drug
binding (al-Shawi et al., 2003; Omote et al., 2004). It seems
reasonable to suggest that the maximal ATPase activity of
P-gp has not yet been measured. The ATPase activity caused
by these drugs will be examined, as a function of recon-
stitution conditions to more clearly mimic the intact mem-
brane. This is one focus of our work on comparing different
P-gp expression systems: to learn from their differences.
Weak substrate binding and rapid efflux had been
speculated as an important element in P-gp broad substrate
specificity and its primary job of not allowing xenobiotics
into the cell cytoplasm (Seelig and Landwojtowicz, 2000; al-
Shawi et al., 2003; Seelig and Gatlik-Landwojtowicz, 2004).
Our predicted binding constants confirm the speculation.
Interestingly, although loperamide and quinidine show P-gp
transport in the same aqueous concentration range, this
appears to be due to loperamide’s larger partition coefficient
for all the LUV compositions (Table 2), since it has the
weakest binding constant to P-gp of the three drugs we
tested. Although our partition coefficients are based upon
model lipid compositions, they are likely to be reasonable in
a relative sense and perhaps in an absolute sense. So P-gp
‘‘specificity’’ is due to the independent contributions of
partition coefficient and specific binding to P-gp.
Our kinetic analysis has provided a means to estimate the
free energies of P-gp interaction with these drugs. When we
choose amprenavir as a norm, then estimates for differences
in free energy of binding, roughly given by DDG ¼RTln{KB(Drug)/KB(AMP)}, is about (2.6 kJ/mol) 3
ln{6000/1300) � 3.9 kJ/mol for quinidine and (2.6 KJ/mol)
3 ln{150/1300)��5.5 kJ/mol for loperamide at 37�C. If weassume that H-bonds range from 5–10 kJ/mol (Seelig. and
Gatlik-Landwojtowicz, 2004), then there appears to be ,1
H-bond difference for all three drugs at the binding site. Of
course, hydrophobic interactions could also be the cause of
the difference. On the other hand, for the efflux rate constant,
k21, the rough values for transition state free energies, given
by DDGz ¼ RTln{k21T(0)(Drug)/k21T(0) (AMP)}, is about
(2.6 kJ/mol)3 ln{0.0008/0.009)��6.3 kJ/mol for quinidine
and (2.6 kJ/mol) 3 ln{0.0002/0.009) � �9.9 kJ/mol for
loperamide, at 37�C. This assumes that the density of efflux
active P-gp is the same. Thus, relative to amprenavir, this
suggests that efflux could involve breaking one more
hydrogen bond for quinidine and 1–2 H-bonds more for
loperamide. Other weak interactions are certainly possible.
Whatever the case, our data suggest that the binding and the
efflux sites are not identical, as has been proposed from
equilibrium binding studies (Martin et al., 2000), but neither
binds these drugs particularly strongly.
This leads us to the last fitted parameter, the dissociation
rate constant kr1. Often, reverse rate constants aremeasured by
preloading a systemwith substrate, then diluting the sample or
competing the bound substrate off. Fitting the release of
substrate to a log plot, appropriate for first-order release, gives
an estimate for the dissociation rate constant. This is
straightforward when used with molecules in solution.
However, with membrane systems, which have bilayers and
internal compartments, there is reason to believe that the
safest way tomeasure a reverse rate constant, like kr1, is as partof the process of fitting all the rate constants (Bentz and Nir,
1981; Bentz et al., 1983). This reduces the possibility of
barriers, other than the expected one, being responsible for the
release of the substrate. However,measuring all rate constants
as part of the same experimental design is rarely done in
macroscopic systems, aswe have done here, simply because it
is so hard to obtain unambiguous answers (Bentz et al., 1983).
The Michaelis-Menten steady-state analysis used for en-
zymes and membrane transport (Stein, 1997) irretrievably
subsumes the reverse rate constant into the Km.
In part, the confluent cell monolayer system was
competent to allow fitting of the dissociation rate constant
kr1 because the forward association rate constant was so fast.This caused the fitting of the forward B. A data to be rather
insensitive to the value of the dissociation rate constant kr1.From computer simulation, it was clear that given the large
TABLE 2 Drug equilibrium partition coefficients (v/v) with LUV
PC/SM/chol (1:1:1) PC/chol (2:1) PS/PE/chol (1:1:1)
Quinidine 68 6 7 112 6 9 717 6 28
Amprenavir 148 6 12 205 6 22 228 6 17
Loperamide 671 6 23 1045 6 122 3138 6 624
Extruded 0.1 mm LUV of the prescribed lipid composition at 10 mM total
lipid concentration was incubated with drug at 10 mM concentration for 6 h.
Partition coefficients (mol drug per liter of LUV bilayer/mol drug per liter
buffer) were calculated as described in Materials and Methods. Preliminary
studies established that equilibrium was reached under these conditions.
Mean 6 SD of four replicates for each drug are shown.
Elementary Parameters of P-gp Transport 733
Biophysical Journal 88(1) 715–738
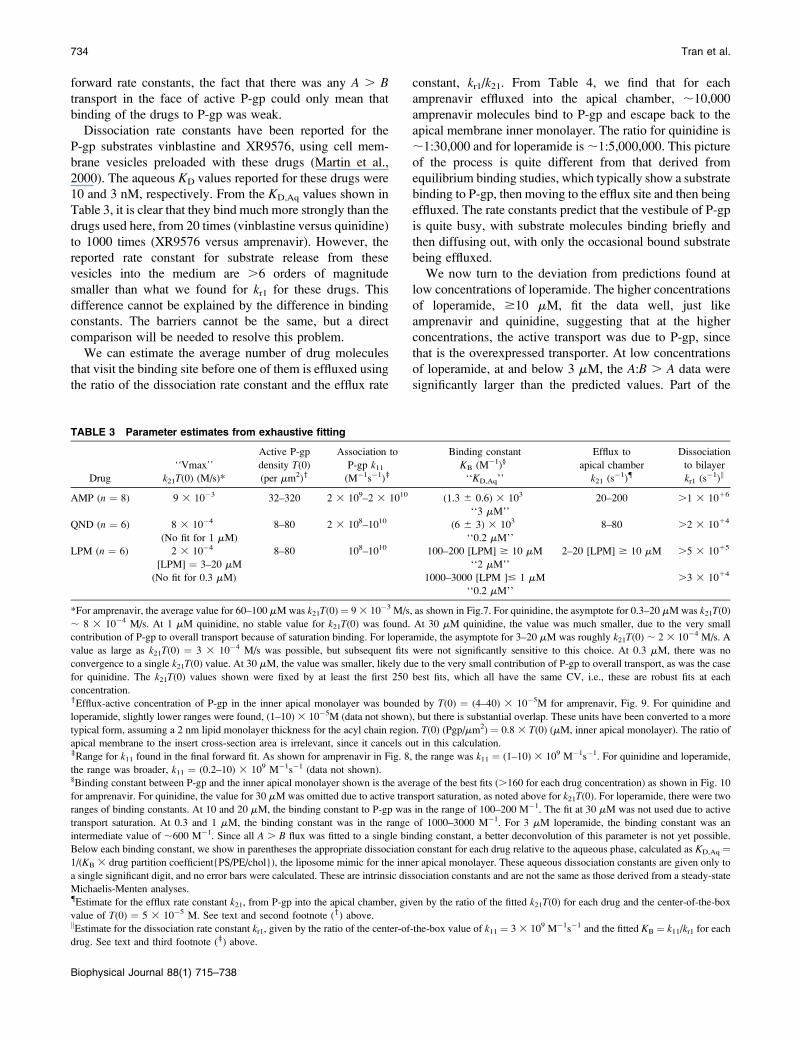
forward rate constants, the fact that there was any A . Btransport in the face of active P-gp could only mean that
binding of the drugs to P-gp was weak.
Dissociation rate constants have been reported for the
P-gp substrates vinblastine and XR9576, using cell mem-
brane vesicles preloaded with these drugs (Martin et al.,
2000). The aqueous KD values reported for these drugs were
10 and 3 nM, respectively. From the KD,Aq values shown in
Table 3, it is clear that they bind much more strongly than the
drugs used here, from 20 times (vinblastine versus quinidine)
to 1000 times (XR9576 versus amprenavir). However, the
reported rate constant for substrate release from these
vesicles into the medium are .6 orders of magnitude
smaller than what we found for kr1 for these drugs. This
difference cannot be explained by the difference in binding
constants. The barriers cannot be the same, but a direct
comparison will be needed to resolve this problem.
We can estimate the average number of drug molecules
that visit the binding site before one of them is effluxed using
the ratio of the dissociation rate constant and the efflux rate
constant, kr1/k21. From Table 4, we find that for each
amprenavir effluxed into the apical chamber, ;10,000
amprenavir molecules bind to P-gp and escape back to the
apical membrane inner monolayer. The ratio for quinidine is
;1:30,000 and for loperamide is;1:5,000,000. This picture
of the process is quite different from that derived from
equilibrium binding studies, which typically show a substrate
binding to P-gp, then moving to the efflux site and then being
effluxed. The rate constants predict that the vestibule of P-gp
is quite busy, with substrate molecules binding briefly and
then diffusing out, with only the occasional bound substrate
being effluxed.
We now turn to the deviation from predictions found at
low concentrations of loperamide. The higher concentrations
of loperamide, $10 mM, fit the data well, just like
amprenavir and quinidine, suggesting that at the higher
concentrations, the active transport was due to P-gp, since
that is the overexpressed transporter. At low concentrations
of loperamide, at and below 3 mM, the A:B . A data were
significantly larger than the predicted values. Part of the
TABLE 3 Parameter estimates from exhaustive fitting
Drug
‘‘Vmax’’k21T(0) (M/s)*
Active P-gp
density T(0)(per mm2)y
Association to
P-gp k11(M�1s�1)z
Binding constant
KB (M�1)§
‘‘KD,Aq’’
Efflux to
apical chamber
k21 (s�1){
Dissociation
to bilayer
kr1 (s�1)k
AMP (n ¼ 8) 9 3 10�3 32–320 2 3 109–2 3 1010 (1.3 6 0.6) 3 103
‘‘3 mM’’
20–200 .1 3 1016
QND (n ¼ 6) 8 3 10�4
(No fit for 1 mM)
8–80 2 3 108–1010 (6 6 3) 3 103
‘‘0.2 mM’’
8–80 .2 3 1014
LPM (n ¼ 6) 2 3 10�4
[LPM] ¼ 3–20 mM
8–80 108–1010 100–200 [LPM] $ 10 mM
‘‘2 mM’’
2–20 [LPM] $ 10 mM .5 3 1015
(No fit for 0.3 mM) 1000–3000 [LPM ]# 1 mM
‘‘0.2 mM’’
.3 3 1014
*For amprenavir, the average value for 60–100 mMwas k21T(0)¼ 93 10�3 M/s, as shown in Fig.7. For quinidine, the asymptote for 0.3–20 mMwas k21T(0)
; 8 3 10�4 M/s. At 1 mM quinidine, no stable value for k21T(0) was found. At 30 mM quinidine, the value was much smaller, due to the very small
contribution of P-gp to overall transport because of saturation binding. For loperamide, the asymptote for 3–20 mM was roughly k21T(0) ; 2 3 10�4 M/s. A
value as large as k21T(0) ¼ 3 3 10�4 M/s was possible, but subsequent fits were not significantly sensitive to this choice. At 0.3 mM, there was no
convergence to a single k21T(0) value. At 30 mM, the value was smaller, likely due to the very small contribution of P-gp to overall transport, as was the case
for quinidine. The k21T(0) values shown were fixed by at least the first 250 best fits, which all have the same CV, i.e., these are robust fits at each
concentration.yEfflux-active concentration of P-gp in the inner apical monolayer was bounded by T(0) ¼ (4–40) 3 10�5M for amprenavir, Fig. 9. For quinidine and
loperamide, slightly lower ranges were found, (1–10) 3 10�5M (data not shown), but there is substantial overlap. These units have been converted to a more
typical form, assuming a 2 nm lipid monolayer thickness for the acyl chain region. T(0) (Pgp/mm2) ¼ 0.8 3 T(0) (mM, inner apical monolayer). The ratio of
apical membrane to the insert cross-section area is irrelevant, since it cancels out in this calculation.zRange for k11 found in the final forward fit. As shown for amprenavir in Fig. 8, the range was k11 ¼ (1–10) 3 109 M�1s�1. For quinidine and loperamide,
the range was broader, k11 ¼ (0.2–10) 3 109 M�1s�1 (data not shown).§Binding constant between P-gp and the inner apical monolayer shown is the average of the best fits (.160 for each drug concentration) as shown in Fig. 10
for amprenavir. For quinidine, the value for 30 mMwas omitted due to active transport saturation, as noted above for k21T(0). For loperamide, there were two
ranges of binding constants. At 10 and 20 mM, the binding constant to P-gp was in the range of 100–200 M�1. The fit at 30 mM was not used due to active
transport saturation. At 0.3 and 1 mM, the binding constant was in the range of 1000–3000 M�1. For 3 mM loperamide, the binding constant was an
intermediate value of ;600 M�1. Since all A . B flux was fitted to a single binding constant, a better deconvolution of this parameter is not yet possible.
Below each binding constant, we show in parentheses the appropriate dissociation constant for each drug relative to the aqueous phase, calculated as KD,Aq ¼1/(KB 3 drug partition coefficient{PS/PE/chol}), the liposome mimic for the inner apical monolayer. These aqueous dissociation constants are given only to
a single significant digit, and no error bars were calculated. These are intrinsic dissociation constants and are not the same as those derived from a steady-state
Michaelis-Menten analyses.{Estimate for the efflux rate constant k21, from P-gp into the apical chamber, given by the ratio of the fitted k21T(0) for each drug and the center-of-the-box
value of T(0) ¼ 5 3 10�5 M. See text and second footnote (y) above.kEstimate for the dissociation rate constant kr1, given by the ratio of the center-of-the-box value of k11 ¼ 3 3 109 M�1s�1 and the fitted KB ¼ k11/kr1 for each
drug. See text and third footnote (z) above.
734 Tran et al.
Biophysical Journal 88(1) 715–738
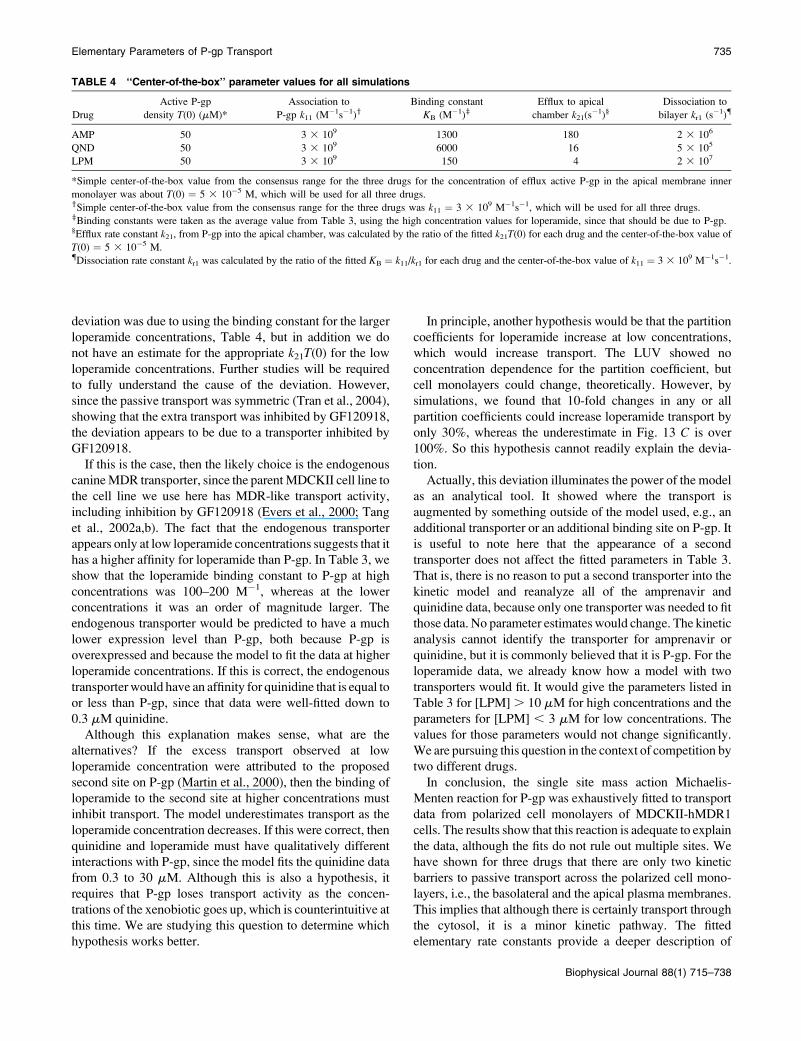
deviation was due to using the binding constant for the larger
loperamide concentrations, Table 4, but in addition we do
not have an estimate for the appropriate k21T(0) for the lowloperamide concentrations. Further studies will be required
to fully understand the cause of the deviation. However,
since the passive transport was symmetric (Tran et al., 2004),
showing that the extra transport was inhibited by GF120918,
the deviation appears to be due to a transporter inhibited by
GF120918.
If this is the case, then the likely choice is the endogenous
canineMDR transporter, since the parentMDCKII cell line to
the cell line we use here has MDR-like transport activity,
including inhibition by GF120918 (Evers et al., 2000; Tang
et al., 2002a,b). The fact that the endogenous transporter
appears only at low loperamide concentrations suggests that it
has a higher affinity for loperamide than P-gp. In Table 3, we
show that the loperamide binding constant to P-gp at high
concentrations was 100–200 M�1, whereas at the lower
concentrations it was an order of magnitude larger. The
endogenous transporter would be predicted to have a much
lower expression level than P-gp, both because P-gp is
overexpressed and because the model to fit the data at higher
loperamide concentrations. If this is correct, the endogenous
transporter would have an affinity for quinidine that is equal to
or less than P-gp, since that data were well-fitted down to
0.3 mM quinidine.
Although this explanation makes sense, what are the
alternatives? If the excess transport observed at low
loperamide concentration were attributed to the proposed
second site on P-gp (Martin et al., 2000), then the binding of
loperamide to the second site at higher concentrations must
inhibit transport. The model underestimates transport as the
loperamide concentration decreases. If this were correct, then
quinidine and loperamide must have qualitatively different
interactions with P-gp, since the model fits the quinidine data
from 0.3 to 30 mM. Although this is also a hypothesis, it
requires that P-gp loses transport activity as the concen-
trations of the xenobiotic goes up, which is counterintuitive at
this time. We are studying this question to determine which
hypothesis works better.
In principle, another hypothesis would be that the partition
coefficients for loperamide increase at low concentrations,
which would increase transport. The LUV showed no
concentration dependence for the partition coefficient, but
cell monolayers could change, theoretically. However, by
simulations, we found that 10-fold changes in any or all
partition coefficients could increase loperamide transport by
only 30%, whereas the underestimate in Fig. 13 C is over
100%. So this hypothesis cannot readily explain the devia-
tion.
Actually, this deviation illuminates the power of the model
as an analytical tool. It showed where the transport is
augmented by something outside of the model used, e.g., an
additional transporter or an additional binding site on P-gp. It
is useful to note here that the appearance of a second
transporter does not affect the fitted parameters in Table 3.
That is, there is no reason to put a second transporter into the
kinetic model and reanalyze all of the amprenavir and
quinidine data, because only one transporter was needed to fit
those data. No parameter estimates would change. The kinetic
analysis cannot identify the transporter for amprenavir or
quinidine, but it is commonly believed that it is P-gp. For the
loperamide data, we already know how a model with two
transporters would fit. It would give the parameters listed in
Table 3 for [LPM] . 10 mM for high concentrations and the
parameters for [LPM] , 3 mM for low concentrations. The
values for those parameters would not change significantly.
We are pursuing this question in the context of competition by
two different drugs.
In conclusion, the single site mass action Michaelis-
Menten reaction for P-gp was exhaustively fitted to transport
data from polarized cell monolayers of MDCKII-hMDR1
cells. The results show that this reaction is adequate to explain
the data, although the fits do not rule out multiple sites. We
have shown for three drugs that there are only two kinetic
barriers to passive transport across the polarized cell mono-
layers, i.e., the basolateral and the apical plasma membranes.
This implies that although there is certainly transport through
the cytosol, it is a minor kinetic pathway. The fitted
elementary rate constants provide a deeper description of
TABLE 4 ‘‘Center-of-the-box’’ parameter values for all simulations
Drug
Active P-gp
density T(0) (mM)*
Association to
P-gp k11 (M�1s�1)y
Binding constant
KB (M�1)zEfflux to apical
chamber k21(s�1)§
Dissociation to
bilayer kr1 (s�1){
AMP 50 3 3 109 1300 180 2 3 106
QND 50 3 3 109 6000 16 5 3 105
LPM 50 3 3 109 150 4 2 3 107
*Simple center-of-the-box value from the consensus range for the three drugs for the concentration of efflux active P-gp in the apical membrane inner
monolayer was about T(0) ¼ 5 3 10�5 M, which will be used for all three drugs.ySimple center-of-the-box value from the consensus range for the three drugs was k11 ¼ 3 3 109 M�1s�1, which will be used for all three drugs.zBinding constants were taken as the average value from Table 3, using the high concentration values for loperamide, since that should be due to P-gp.§Efflux rate constant k21, from P-gp into the apical chamber, was calculated by the ratio of the fitted k21T(0) for each drug and the center-of-the-box value of
T(0) ¼ 5 3 10�5 M.{Dissociation rate constant kr1 was calculated by the ratio of the fitted KB ¼ k11/kr1 for each drug and the center-of-the-box value of k11 ¼ 3 3 109 M�1s�1.
Elementary Parameters of P-gp Transport 735
Biophysical Journal 88(1) 715–738
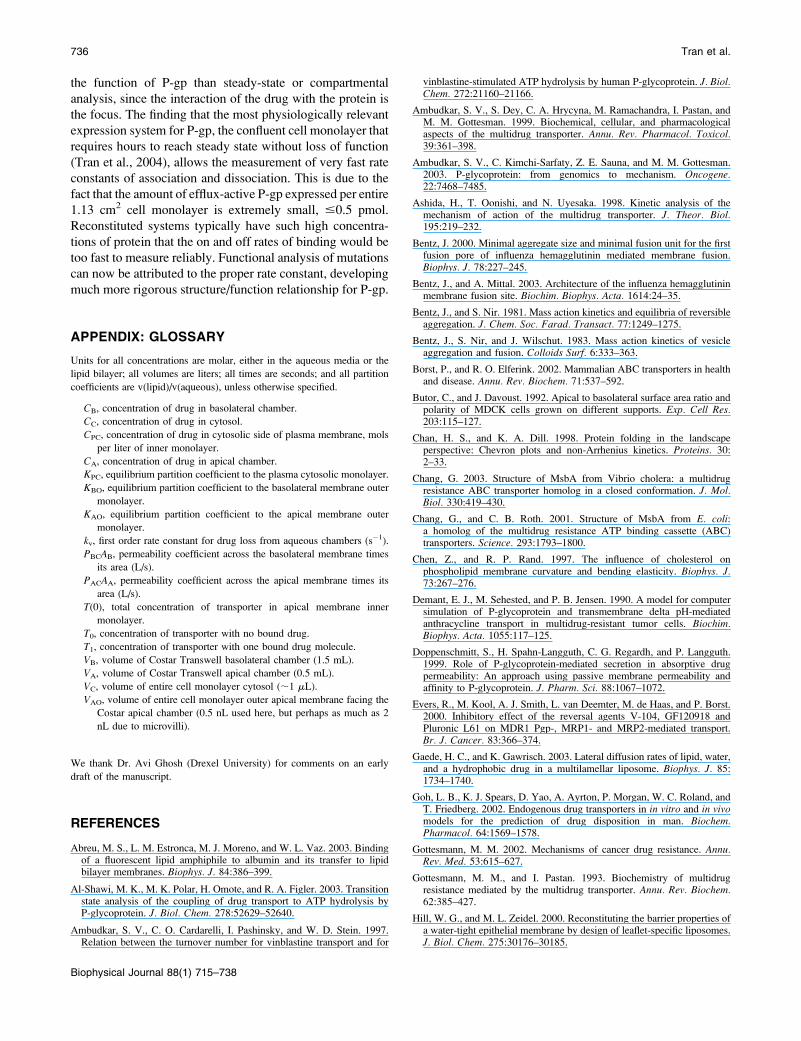
the function of P-gp than steady-state or compartmental
analysis, since the interaction of the drug with the protein is
the focus. The finding that the most physiologically relevant
expression system for P-gp, the confluent cell monolayer that
requires hours to reach steady state without loss of function
(Tran et al., 2004), allows the measurement of very fast rate
constants of association and dissociation. This is due to the
fact that the amount of efflux-active P-gp expressed per entire
1.13 cm2 cell monolayer is extremely small, #0.5 pmol.
Reconstituted systems typically have such high concentra-
tions of protein that the on and off rates of binding would be
too fast to measure reliably. Functional analysis of mutations
can now be attributed to the proper rate constant, developing
much more rigorous structure/function relationship for P-gp.
APPENDIX: GLOSSARY
Units for all concentrations are molar, either in the aqueous media or the
lipid bilayer; all volumes are liters; all times are seconds; and all partition
coefficients are v(lipid)/v(aqueous), unless otherwise specified.
CB, concentration of drug in basolateral chamber.
CC, concentration of drug in cytosol.
CPC, concentration of drug in cytosolic side of plasma membrane, mols
per liter of inner monolayer.
CA, concentration of drug in apical chamber.
KPC, equilibrium partition coefficient to the plasma cytosolic monolayer.
KBO, equilibrium partition coefficient to the basolateral membrane outer
monolayer.
KAO, equilibrium partition coefficient to the apical membrane outer
monolayer.
kv, first order rate constant for drug loss from aqueous chambers (s�1).
PBCAB, permeability coefficient across the basolateral membrane times
its area (L/s).
PACAA, permeability coefficient across the apical membrane times its
area (L/s).
T(0), total concentration of transporter in apical membrane inner
monolayer.
T0, concentration of transporter with no bound drug.
T1, concentration of transporter with one bound drug molecule.
VB, volume of Costar Transwell basolateral chamber (1.5 mL).
VA, volume of Costar Transwell apical chamber (0.5 mL).
VC, volume of entire cell monolayer cytosol (;1 mL).
VAO, volume of entire cell monolayer outer apical membrane facing the
Costar apical chamber (0.5 nL used here, but perhaps as much as 2
nL due to microvilli).
We thank Dr. Avi Ghosh (Drexel University) for comments on an early
draft of the manuscript.
REFERENCES
Abreu, M. S., L. M. Estronca, M. J. Moreno, and W. L. Vaz. 2003. Bindingof a fluorescent lipid amphiphile to albumin and its transfer to lipidbilayer membranes. Biophys. J. 84:386–399.
Al-Shawi, M. K., M. K. Polar, H. Omote, and R. A. Figler. 2003. Transitionstate analysis of the coupling of drug transport to ATP hydrolysis byP-glycoprotein. J. Biol. Chem. 278:52629–52640.
Ambudkar, S. V., C. O. Cardarelli, I. Pashinsky, and W. D. Stein. 1997.Relation between the turnover number for vinblastine transport and for
vinblastine-stimulated ATP hydrolysis by human P-glycoprotein. J. Biol.Chem. 272:21160–21166.
Ambudkar, S. V., S. Dey, C. A. Hrycyna, M. Ramachandra, I. Pastan, andM. M. Gottesman. 1999. Biochemical, cellular, and pharmacologicalaspects of the multidrug transporter. Annu. Rev. Pharmacol. Toxicol.39:361–398.
Ambudkar, S. V., C. Kimchi-Sarfaty, Z. E. Sauna, and M. M. Gottesman.2003. P-glycoprotein: from genomics to mechanism. Oncogene.22:7468–7485.
Ashida, H., T. Oonishi, and N. Uyesaka. 1998. Kinetic analysis of themechanism of action of the multidrug transporter. J. Theor. Biol.195:219–232.
Bentz, J. 2000. Minimal aggregate size and minimal fusion unit for the firstfusion pore of influenza hemagglutinin mediated membrane fusion.Biophys. J. 78:227–245.
Bentz, J., and A. Mittal. 2003. Architecture of the influenza hemagglutininmembrane fusion site. Biochim. Biophys. Acta. 1614:24–35.
Bentz, J., and S. Nir. 1981. Mass action kinetics and equilibria of reversibleaggregation. J. Chem. Soc. Farad. Transact. 77:1249–1275.
Bentz, J., S. Nir, and J. Wilschut. 1983. Mass action kinetics of vesicleaggregation and fusion. Colloids Surf. 6:333–363.
Borst, P., and R. O. Elferink. 2002. Mammalian ABC transporters in healthand disease. Annu. Rev. Biochem. 71:537–592.
Butor, C., and J. Davoust. 1992. Apical to basolateral surface area ratio andpolarity of MDCK cells grown on different supports. Exp. Cell Res.203:115–127.
Chan, H. S., and K. A. Dill. 1998. Protein folding in the landscapeperspective: Chevron plots and non-Arrhenius kinetics. Proteins. 30:2–33.
Chang, G. 2003. Structure of MsbA from Vibrio cholera: a multidrugresistance ABC transporter homolog in a closed conformation. J. Mol.Biol. 330:419–430.
Chang, G., and C. B. Roth. 2001. Structure of MsbA from E. coli:a homolog of the multidrug resistance ATP binding cassette (ABC)transporters. Science. 293:1793–1800.
Chen, Z., and R. P. Rand. 1997. The influence of cholesterol onphospholipid membrane curvature and bending elasticity. Biophys. J.73:267–276.
Demant, E. J., M. Sehested, and P. B. Jensen. 1990. A model for computersimulation of P-glycoprotein and transmembrane delta pH-mediatedanthracycline transport in multidrug-resistant tumor cells. Biochim.Biophys. Acta. 1055:117–125.
Doppenschmitt, S., H. Spahn-Langguth, C. G. Regardh, and P. Langguth.1999. Role of P-glycoprotein-mediated secretion in absorptive drugpermeability: An approach using passive membrane permeability andaffinity to P-glycoprotein. J. Pharm. Sci. 88:1067–1072.
Evers, R., M. Kool, A. J. Smith, L. van Deemter, M. de Haas, and P. Borst.2000. Inhibitory effect of the reversal agents V-104, GF120918 andPluronic L61 on MDR1 Pgp-, MRP1- and MRP2-mediated transport.Br. J. Cancer. 83:366–374.
Gaede, H. C., and K. Gawrisch. 2003. Lateral diffusion rates of lipid, water,and a hydrophobic drug in a multilamellar liposome. Biophys. J. 85:1734–1740.
Goh, L. B., K. J. Spears, D. Yao, A. Ayrton, P. Morgan, W. C. Roland, andT. Friedberg. 2002. Endogenous drug transporters in in vitro and in vivomodels for the prediction of drug disposition in man. Biochem.Pharmacol. 64:1569–1578.
Gottesmann, M. M. 2002. Mechanisms of cancer drug resistance. Annu.Rev. Med. 53:615–627.
Gottesmann, M. M., and I. Pastan. 1993. Biochemistry of multidrugresistance mediated by the multidrug transporter. Annu. Rev. Biochem.62:385–427.
Hill, W. G., and M. L. Zeidel. 2000. Reconstituting the barrier properties ofa water-tight epithelial membrane by design of leaflet-specific liposomes.J. Biol. Chem. 275:30176–30185.
736 Tran et al.
Biophysical Journal 88(1) 715–738
Hinterdorfer, P., H. J. Gruber, J. Striessnig, H. Glossmann, and H.Schindler. 1997. Analysis of membrane protein self-association in lipidsystems by fluorescence particle counting: application to the dihydropyr-idine receptor. Biochemistry. 36:4497–4504.
Ho, N. F. H., P. S. Burton, R. A. Conradi, and C. L. Barsuhn. 1995. Abiophysical model of passive and polarized active transport processes inCaco-2 cells: approaches to uncoupling apical and basolateral membraneevents in the intact cell. J. Pharm. Sci. 84:21–27.
Ho, N. F. H., T. J. Raub, P. S. Burton, C. L. Bausuhn, A. Adson, K. L.Audus, and R. Borchardt. 2000. Quantitative approaches to delineatepassive transport mechanisms in cell culture monolayers. In TransportProcesses in Pharmaceutical Systems. G. L. Amidon and P. I. Lee,editors. Marcel Dekker, New York. 219–316.
Hrycyna, C. A. 2001. Molecular genetic analysis and biochemicalcharacterization of mammalian P-glycoproteins involved in multidrugresistance. Semin. Cell Dev. Biol. 12:247–256.
Hyafil, F., C. Vergely, P. Du Vignaud, and T. Grand-Perret. 1993. In vitroand in vivo reversal of multidrug resistance by GF120918, anacridonecarboxamide derivative. Cancer Res. 53:4595–4602.
Ito, S., C. Woodland, B. Sarkadi, G. Hockmann, S. E. Walker, and G.Koren. 1999. Modeling of P-glycoprotein-involved epithelial drugtransport in MDCK cells. Am. J. Physiol. 46:F84–F96.
Keizer, J. 1987. Diffusion effects on rapid bimolecular chemical reactions.Chem. Rev. 87:167–180.
Kuh, H. J., S. H. Jang, M. G. Wientjes, and J. L. Au. 2000. Computationalmodel of intracellular pharmacokinetics of paclitaxel. J. Pharmacol. Exp.Ther. 293:761–770.
Locher, K. P., A. T. Lee, and D. C. Rees. 2002. The E. coli BtuCDstructure: a framework for ABC transporter architecture and mechanism.Science. 296:1091–1098.
Loo, T. W., M. C. Bartlett, and D. M. Clarke. 2003. Substrate-inducedconformational changes in the transmembrane segments of humanP-glycoprotein. Direct evidence for the substrate-induced fit mechanismfor drug binding. J. Biol. Chem. 278:13603–13606.
Loo, T. W., and D. M. Clarke. 1999. Determining the structure andmechanism of the human multidrug resistance P-glycoprotein usingcysteine-scanning mutagenesis and thiol-modification techniques. Bio-chim. Biophys. Acta. 1461:315–325.
Loo, T. W., and D. M. Clarke. 2000. Drug-stimulated ATPase activity ofhuman P-glycoprotein is blocked by disulfide cross-linking between thenucleotide-binding sites. J. Biol. Chem. 275:19435–19438.
Loo, T. W., and D. M. Clarke. 2001. Cross-linking of human multidrugresistance P-glycoprotein by the substrate, tris-(2-maleimidoethyl)amine,is altered by ATP hydrolysis. Evidence for rotation of a transmembranehelix. J. Biol. Chem. 276:31800–31805.
Lown, K. S., R. R. Mayo, A. B. Leichtman, H. L. Hsiao, D. K. Turgeon,P. Schmiedlin-Ren, M. B. Brown, W. Guo, S. J. Rossi, L. Z. Benet, andP. B. Watkins. 1997. Role of intestinal P-glycoprotein (mdr1) ininterpatient variation in the oral bioavailability of cyclosporine. Clin.Pharmacol. Ther. 62:248–260.
Martin, C., G. Berridge, C. F. Higgens, P. Mistry, P. Charlton, and R.Callaghan. 2000. Communication between multiple drug binding sites onP-glycoprotein. Mol. Pharmacol. 58:624–632.
Mittal, A., and J. Bentz. 2001. Comprehensive kinetic analysis of influenzahemagglutinin-mediated membrane fusion protein: role of sialatebinding. Biophys. J. 81:1521–1535.
Mittal, A., T. Shangguan, and J. Bentz. 2002. Measuring pKa of activationand pKi of inactivation for influenza hemagglutinin from kinetics ofmembrane fusion of virions and of HA expressing cells. Biophys. J.83:2652–2666.
Modok, S., C. Heyward, and R. Callaghan. 2004. P-glycoprotein retainsfunction when reconstituted into a sphingolipid and cholesterol richenvironment. J. Biol. Chem. In press.
Molski, A., S. Berling, and J. Keizer. 1996. Rapid chemical reactions in twodimensions: spatially nonlocal effects. J. Phys. Chem. 100:19049–19054.
Omote, H., and M. K. al-Shawi. 2002. A novel electron paramagneticresonance approach to determine the mechanism of drug transport byP-glycoprotein. J. Biol. Chem. 277:45688–45694.
Omote, H., R. A. Figler, M. K. Polar, and M. K. al-Shawi. 2004. Improvedenergy coupling of human P-glycoprotein by the glycine 185 to valinemutation. Biochemistry. 43:3917–3928.
Poelarends, G. J., P. Mazurkiewicz, and W. N. Konings. 2002. Multidrugtransporters and antibiotic resistance in Lactococcus lactis. Biochim.Biophys. Acta. 555:1–7.
Polli, J. W., S. A. Wring, J. E. Humphreys, L. Huang, J. B. Morgan, L. O.Webster, and C. S. Serabjit-Singh. 2001. Rational use of in vitroP-glycoprotein assays in drug discovery. J. Pharmacol. Exp. Ther.299:620–628.
Qu, Q., J. W. Chu, and F. J. Sharom. 2003. Transition state P-glycoproteinbinds drugs and modulators with unchanged affinity, suggestinga concerted transport mechanism. Biochemistry. 42:1345–1353.
Rosenberg, M. F., R. Callaghan, R. C. Ford, and C. F. Higgins. 1997.Structure of the multidrug resistance P-glycoprotein to 2.5 nm resolutiondetermined by electron microscopy and image analysis. J. Biol. Chem.272:10685–10694.
Rosenberg, M. F., A. B. Kamis, L. A. Aleksandrov, R. C. Ford, and J. R.Riordan. 2004. Purification and crystallization of the cystic fibrosistransmembrane conductance regulator (CFTR). J. Biol. Chem. 279: Inpress.
Rosenberg, M. F., A. B. Kamis, R. Callaghan, C. F. Higgins, and R. C.Ford. 2003. Three-dimensional structures of the mammalian multidrugresistance P-glycoprotein demonstrate major conformational changes inthe transmembrane domains upon nucleotide binding. J. Biol. Chem.278:8294–8299.
Rosenberg, M. F., G. Velarde, R. C. Ford, C. Martin, G. Berridge, I. D.Kerr, R. Callaghan, A. Schmidlin, C. Wooding, K. J. Linton, and C. F.Higgins. 2001. Repacking of the transmembrane domains of P-glycoprotein during the transport ATPase cycle. EMBO J. 20:5615–5625.
Schinkel, A. H. 1998. Pharmacological insights from P-glycoproteinknockout mice. Int. J. Clin. Pharmacol. Ther. 36:9–13.
Schmitt, L., and R. Tampe. 2002. Structure and mechanism of ABCtransporters. Curr. Opin. Struct. Biol. 12:754–760.
Seelig, A., X. L. Blatter, and F. Wohnsland. 2000. Substrate recognition byP-glycoprotein and the multidrug resistance-associated protein MRP1:a comparison. Int. J. Clin. Pharmacol. Ther. 2000 38:111–121.
Seelig, A., and E. Gatlik-Landwojtowicz. 2004. Biophysical characteriza-tion of inhibitors of multidrug efflux transporters: Their membrane andprotein interactions. J. Med. Chem. In press.
Seelig, A., and E. Landwojtowicz. 2000. Structure-activity relationship ofP-glycoprotein substrates and modifiers. Eur. J. Pharm. Sci. 12:31–40.
Senior, A. E., M. K. al-Shawi, and I. L. Urbatsch. 1995. The catalytic cycleof P-glycoprotein. FEBS Lett. 377:285–289.
Sharom, F. J., R. Liu, Q. Qu, and Y. Romsicki. 2001. Exploring thestructure and function of the P-glycoprotein multidrug transporter usingfluorescence spectroscopic tools. Semin. Cell Dev. Biol. 12:257–266.
Sharom, F. J., X. Yu, and C. Doige. 1993. Functional reconstitution of drugtransport and ATPase activity in proteoliposomes containing partiallypurified P-glycoprotein. J. Biol. Chem. 268:24197–24202.
Stein, W. D. 1997. Kinetics of the multidrug transporter (P-glycoprotein)and its reversal. Physiol. Rev. 77:545–590.
Stenham, D. R., J. D. Campbell, M. S. Sansom, C. F. Higgins, I. D. Kerr,and K. J. Linton. 2003. An atomic detail model for the human ATPbinding cassette transporter P-glycoprotein derived from disulfide cross-linking and homology modeling. FASEB J. 17:2287–2289.
Tang, F., K. Horie, and R. T. Borchardt. 2002a. Are MDCK cellstransfected with the human MRP2 gene a good model of the humanintestinal mucosa? Pharm. Res. 19:765–772.
Tang, F., K. Horie, and R. T. Borchardt. 2002b. Are MDCK cellstransfected with the human MDR1 gene a good model of the humanintestinal mucosa? Pharm. Res. 19:773–779.
Elementary Parameters of P-gp Transport 737
Biophysical Journal 88(1) 715–738
Tran, T. T., A. Mittal, T. Gales, B. Maleeff, T. Aldinger, J. W. Polli, A.Ayrton, H. Ellens, and J. Bentz. 2004. An exact kinetic analysis ofpassive transport across a polarized confluent MDCK cell monolayermodeled as a single barrier. J. Pharm. Sci. 93:2108–2123.
Troutman, M. D., and D. R. Thakker. 2003. Novel experimental parametersto quantify the modulation of absorptive and secretory transport ofsubstrates by P-glycoprotein in cell culture models of intestinalepithelium. Pharm. Res. 20:1210–1224.
Urbatsch, I. L., G. A. Tyndall, G. Tombline, and A. E. Senior. 2003.P-glycoprotein catalytic mechanism: studies of the ADP-vanadateinhibited state. J. Biol. Chem. 278:23171–23179.
Van Meer, G., and K. Simons. 1986. The function of tight junctions inmaintaining differences in lipid composition between the apical and thebasolateral cell surface domains of MDCK cells. EMBO J. 5:1455–1464.
van Veen, H. W., R. Callaghan, L. Soceneantu, A. Sardini, W. N. Konings,and C. F. Higgins. 1998. A bacterial antibiotic-resistance gene thatcomplements the human multidrug-resistance P-glycoprotein gene.Nature. 391:291–295.
van Veen, H. W., A. Margolles, M. Muller, C. F. Higgins, andW. N. Konings. 2000. The homodimeric ATP-binding cassettetransporter LmrA mediates multidrug transport by an alternatingtwo-site (two-cylinder engine) mechanism. EMBO J. 19:2503–2514.
738 Tran et al.
Biophysical Journal 88(1) 715–738
Copyright © 2022 FDOKUMEN