The Effects of Pedestrian Countdown Timers on Safety and Efficiency of Operations at Signalized...
82
University of Nebraska - Lincoln DigitalCommons@University of Nebraska - Lincoln Civil Engineering eses, Dissertations, and Student Research Civil Engineering 7-1-2011 e Effects of Pedestrian Countdown Timers on Safety and Efficiency of Operations at Signalized Intersections Jacob N. Schmitz University of Nebraska-Lincoln, [email protected] Follow this and additional works at: hp://digitalcommons.unl.edu/civilengdiss Part of the Civil Engineering Commons is Article is brought to you for free and open access by the Civil Engineering at DigitalCommons@University of Nebraska - Lincoln. It has been accepted for inclusion in Civil Engineering eses, Dissertations, and Student Research by an authorized administrator of DigitalCommons@University of Nebraska - Lincoln. Schmitz, Jacob N., "e Effects of Pedestrian Countdown Timers on Safety and Efficiency of Operations at Signalized Intersections" (2011). Civil Engineering eses, Dissertations, and Student Research. Paper 28. hp://digitalcommons.unl.edu/civilengdiss/28
Transcript of The Effects of Pedestrian Countdown Timers on Safety and Efficiency of Operations at Signalized...
University of Nebraska - LincolnDigitalCommons@University of Nebraska - LincolnCivil Engineering Theses, Dissertations, andStudent Research Civil Engineering
7-1-2011
The Effects of Pedestrian Countdown Timers onSafety and Efficiency of Operations at SignalizedIntersectionsJacob N. SchmitzUniversity of Nebraska-Lincoln, [email protected]
Follow this and additional works at: http://digitalcommons.unl.edu/civilengdissPart of the Civil Engineering Commons
This Article is brought to you for free and open access by the Civil Engineering at DigitalCommons@University of Nebraska - Lincoln. It has beenaccepted for inclusion in Civil Engineering Theses, Dissertations, and Student Research by an authorized administrator ofDigitalCommons@University of Nebraska - Lincoln.
Schmitz, Jacob N., "The Effects of Pedestrian Countdown Timers on Safety and Efficiency of Operations at Signalized Intersections"(2011). Civil Engineering Theses, Dissertations, and Student Research. Paper 28.http://digitalcommons.unl.edu/civilengdiss/28
THE EFFECTS OF PEDESTRIAN COUNTDOWN TIMERS ON SAFETY AND
EFFICIENCY OF OPERATIONS AT SIGNALIZED INTERSECTIONS
by
Jacob N. Schmitz
A THESIS
Presented to the Faculty of
The Graduate College at the University of Nebraska
In Partial Fulfillment of Requirements
For the Degree of Master of Science
Major: Civil Engineering
Under the Supervision of Professor Anuj Sharma
Lincoln, Nebraska
July 2011
THE EFFECTS OF PEDESTRIAN COUNTDOWN TIMERS ON SAFETY AND
EFFICIENCY OF OPERATIONS AT SIGNALIZED INTERSECTIONS
Jacob N. Schmitz, M.S.
University of Nebraska, 2011
Advisor: Anuj Sharma
Pedestrian countdown timers are becoming common at urban and suburban intersections.
The added information that pedestrian countdown timers provide to pedestrians can also
be used by approaching drivers. A before and after case study on the effects that
pedestrian countdown timers have on safety and efficiency of operations was performed
at two signalized intersections in Lincoln, Nebraska. The effects on both drivers and
pedestrians were analyzed. Performance measures for pedestrian analysis include
pedestrian compliance and average pedestrian walking speed. Performance measures for
the driver analysis include probability of stopping and speed at the stop bar of vehicles
during the yellow phase (vehicles passing through the intersection during the yellow
phase). Data was collected using a Wide Area Detector and a Pan-Tilt-Zoom video
camera. Data was collected using state of the art data collection software, Wonderware,
which displayed all traffic and pedestrian signal information, vehicle detections,
individual vehicle speeds and distances from stop bar, and the video from the PTZ
camera all on one computer screen.
Statistical models were estimated to understand the effects that pedestrian countdown
timers have on the performance measures. The resulting models identified statistically
significant factors that affected the performance measures. Pedestrian countdown timers

were found to increase pedestrian walking speed by 0.2 ft/sec, and decrease speed at the
stop bar of vehicles during the yellow phase by 1.0 mi/hr. The probability of stopping
curve became steeper after installation of pedestrian countdown timers, but the difference
in probability of stopping was not statistically significant.

ACKNOWLEDGMENTS
I would like to express the most sincere thanks to my advisor, Dr. Anuj Sharma, for all of
his help throughout my graduate program at Nebraska. I would like to thank him for his
kindness, support, guidance, and character towards me. It has truly been an honor
working for him, and I hope that our paths may cross again in the future.
Second, I would like to thank all of the graduate students at UNL who helped me
throughout this project. I would especially like to thank Nate Burnett, Shefang Wang,
Kevin Hock, Miao Wang, and Mo Zhao for their acts of selflessness in helping me
achieve my goals. Without them, I would not have been able to finish this thesis.
I am also grateful for the members of my examining committee, Dr. Larry Rilett and Dr.
Aemal Khattak. Their insight and previous project experience is greatly appreciated and
has helped me tremendously in gaining practical knowledge out of this project.
I am very thankful for my wonderful wife, Lindsey. She has been so great to me, and I
look forward to spending the rest of my life with her. I would also like to thank my
family and friends for their support.
Above all, I would like to thank the Lord God for all of his blessings to me.
i
Table of Contents
Page
List of Tables .............................................................................................................iii
List of Figures ............................................................................................................v
Chapter 1 – Introduction ............................................................................................1
Research Objectives and Hypotheses ..................................................................4
Innovations ...........................................................................................................5
Expected Benefits ................................................................................................5
Report Outline ......................................................................................................6
Chapter 2 – Literature Review ...................................................................................7
Phase Countdown Timers ....................................................................................7
Pedestrian Countdown Timers .............................................................................9
Summary ..............................................................................................................13
Chapter 3 – Data Collection .......................................................................................15
Intersection Selection ...........................................................................................15
Hardware in the Field...........................................................................................17
MOXA Ethernet Network Adapter ......................................................................21
Wonderware .........................................................................................................22
Vehicle Data.........................................................................................................25
Error Assessment .................................................................................................26
Pedestrian Data Error Reduction .........................................................................27
Driver Data Error Reduction ................................................................................28
Wide Area Detector Validation ...........................................................................28
ii
Chapter 4 – Data Analysis .........................................................................................31
Data Collection and Number of Observations .....................................................31
Pedestrian Data Analysis Results.........................................................................32
Pedestrian Compliance.........................................................................................32
Pedestrian Walking Speed ...................................................................................37
Driver Data Analysis Results ...............................................................................40
Probability of Stopping ........................................................................................40
Speed at the Stop Bar of Vehicles during Yellow Phase .....................................48
Summary of Findings ...........................................................................................54
Chapter 5 – Conclusions ............................................................................................57
List of References ......................................................................................................59
Appendix A – Variables Used in Statistical Models .................................................62
Appendix B – Locations of Sensys Sensors ..............................................................69
iii
List of Tables
Page
Table 1: Performance Measures Studied and Hypotheses Tested ..........................4
Table 2: Intersection Width ..................................................................................16
Table 3: Crosswalk Dimensions at 17th & G .......................................................16
Table 4: Wonderware Intouch Tags at 17th St & G St .........................................23
Table 5: Example Wonderware Historian Data ....................................................25
Table 6: Data Collection and Number of Observations Used Before
Installation of PCT ..................................................................................32
Table 7: Data Collection and Number of Observations Used After
Installation of PCT ..................................................................................32
Table 8: Pedestrian Compliance Model Results ...................................................36
Table 9: Pedestrian Walking Speed ......................................................................37
Table 10: Pedestrian Walking Speed Model .........................................................39
Table 11: Probit Model Before Installation of PCT at S 17th
St and G St ............42
Table 12: Probit Model After Installation of PCT at S 17th
St and G St ..............43
Table 13: Dilemma Zone Boundaries at S 17th
St and G St ..................................44
Table 14: Probit Model of Combined Data at S 17th
St and G St .........................45
Table 15: Probit Model Before Installation of PCT at 27th
St and
Cornhusker Highway ..............................................................................46
Table 16: Probit Model After Installation of PCT at 27th
St and
Cornhusker Highway ..............................................................................46
Table 17: Dilemma Zone Boundaries at 27th
St and Cornhusker Highway ...........47
iv
Table 18: Probit Model of Combined Data at 27th
St and Cornhusker
Highway ..................................................................................................48
Table 19: Speed at Stop Bar of Vehicles during Yellow Phase Model at S
17th St and G St ......................................................................................51
Table 20: Speed at Stop Bar of Vehicles during Yellow Phase Model at
27th St and Cornhusker Highway ...........................................................53
Table 21: Effects of Pedestrian Countdown Timers on Safety and
Efficiency of Operations .........................................................................55
Table 22: Hypothesis Verification ........................................................................56
v
List of Figures
Page
Figure 1: Plot of Pedestrian Compliance from Previous Studies ............................2
Figure 2: Traditional Pedestrian Signal (left) and Pedestrian Countdown
Signal (right) ............................................................................................3
Figure 3: 17th & G Crosswalk Dimensions ..........................................................17
Figure 4: Wavetronix SmartSensor Advance
(http://www.wavetronix.com/products/smartsensor/200) .....................18
Figure 5: Hardware in the Field ............................................................................19
Figure 6: Northbound Approach at 17th & G .......................................................20
Figure 7: PTZ Camera at 17th & G ......................................................................20
Figure 8: Eastbound Approach at 27th & Cornhusker..........................................21
Figure 9: PTZ Camera at 27th & Cornhusker .......................................................21
Figure 10: Example Screenshot of Wonderware for 17th & G ............................24
Figure 11: Wonderware and MATLAB Screenshot .............................................25
Figure 12: Axis Video Camera 24 Hour Response Time .....................................26
Figure 13: MOXA Device 24 Hour Repsonse Time ............................................27
Figure 14: Pedestrian Walking Speed Data Reduction .........................................28
Figure 15: Example Speed vs. Distance Plot for a Single GPS Run ....................29
Figure 16: Overall Relative Frequency of Error for all GPS Runs at 17th
&
G St ........................................................................................................30
Figure 17: Pedestrian Compliance Results ...........................................................33
Figure 18: Probability of Stopping at S 17th
St and G St ......................................43
vi
Figure 19: Probability of Stopping at 27th
St and Cornhusker Highway ..............47
Figure 20: Relative Frequency of Speed at Stop Bar of Vehicles during
the Yellow Phase at 17th & G ...............................................................49
Figure 21: Cumulative Distribution Function of Speed at Stop Bar of
Vehicles during the Yellow Phase at 17th & G .....................................50
Figure 22: Relative Frequency of Speed at Stop Bar of Vehicles during
the Yellow Phase at 27th St & Cornhusker Highway ...........................52
Figure 23: Cumulative Distribution Function of Speed at Stop Bar of
Vehicles during the Yellow Phase at 27th St & Cornhusker
Highway ................................................................................................52
1
Chapter 1 – Introduction
Pedestrian countdown timers are replacing traditional pedestrian signals at many
signalized intersections due to the increased information they provide to both pedestrians
and drivers. The effects of pedestrian countdown timers on drivers and pedestrians need
to be determined in order to justify whether their benefits outweigh their costs. The
effects of pedestrian countdown timers on pedestrians have been inconsistent among
studies, with some studies claiming that timers increase pedestrian compliance (1, 4, 14),
whereas others report increased pedestrian erratic behavior in the presence of countdown
timers (7) and a decrease in pedestrian compliance (2, 7). In addition, drivers behave
differently when pedestrian countdown timers are installed compared to when pedestrian
countdown timers are not installed (8). To visualize the inconsistencies among
pedestrian compliance studies, Figure 1 shows a plot of the percent change in pedestrian
violations after installation of pedestrian countdown timers, which includes findings from
multiple studies. Each data point in Figure 1 represents an intersection where pedestrian
countdown timers were installed.
2
Figure 1: Plot of Pedestrian Compliance from Previous Studies
As seen in Figure 1, pedestrian countdown timers have been found to either increase
pedestrian violations or decrease pedestrian violations. One possible reason of
contradictory results could be variability in pedestrian behavior due to regional
differences. This in turn makes it necessary to investigate the effect of pedestrian
countdown timers in Nebraska. In addition, contradictory results were also found at
different intersections within the same city, which could be due to site-specific
intersection characteristics. Another possible reason for unexpected results is that
differences in pedestrian violations may be due to other factors than pedestrian
countdown timers, such as conflicting traffic, time of day, the presence of other
pedestrians, etc. Using statistical modeling tools, the effects of pedestrian countdown
timers can be uniquely identified, and tested for significance. This thesis presents an in-
-30 -20 -10 0 10 20
Percent Change in Pedestrian Crosswalk Violations
Schattler, Wakim, Datta,
McAvoy (14, Peoria, IL)
Huang & Zegeer (7, Lake
Buena Vista, FL)
Eccles, Tao, & Mangum
(4, Montgomery County,
MD)
Arhin & Noel (1,
Washington, D.C.)
Botha, Zabyshny, & Day
(2, San Jose, CA)
Authors (Reference)
3
depth before and after analysis of driver and pedestrian behavior in the presence and
absence of pedestrian countdown timers using statistical modeling tools.
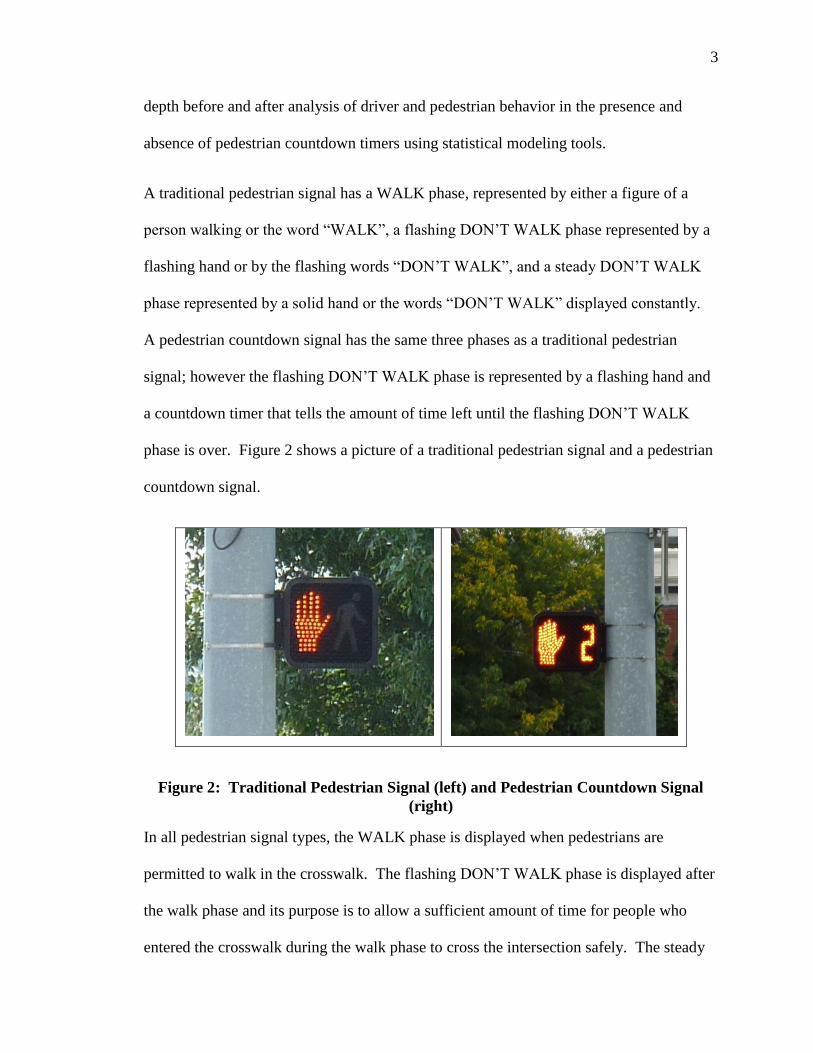
A traditional pedestrian signal has a WALK phase, represented by either a figure of a
person walking or the word “WALK”, a flashing DON’T WALK phase represented by a
flashing hand or by the flashing words “DON’T WALK”, and a steady DON’T WALK
phase represented by a solid hand or the words “DON’T WALK” displayed constantly.
A pedestrian countdown signal has the same three phases as a traditional pedestrian
signal; however the flashing DON’T WALK phase is represented by a flashing hand and
a countdown timer that tells the amount of time left until the flashing DON’T WALK
phase is over. Figure 2 shows a picture of a traditional pedestrian signal and a pedestrian
countdown signal.
Figure 2: Traditional Pedestrian Signal (left) and Pedestrian Countdown Signal
(right)
In all pedestrian signal types, the WALK phase is displayed when pedestrians are
permitted to walk in the crosswalk. The flashing DON’T WALK phase is displayed after
the walk phase and its purpose is to allow a sufficient amount of time for people who
entered the crosswalk during the walk phase to cross the intersection safely. The steady
4
DON’T WALK phase is displayed after the flashing DON’T WALK phase. It denotes
the time when it is illegal for pedestrians to be in the crosswalk because conflicting traffic
has a green signal.
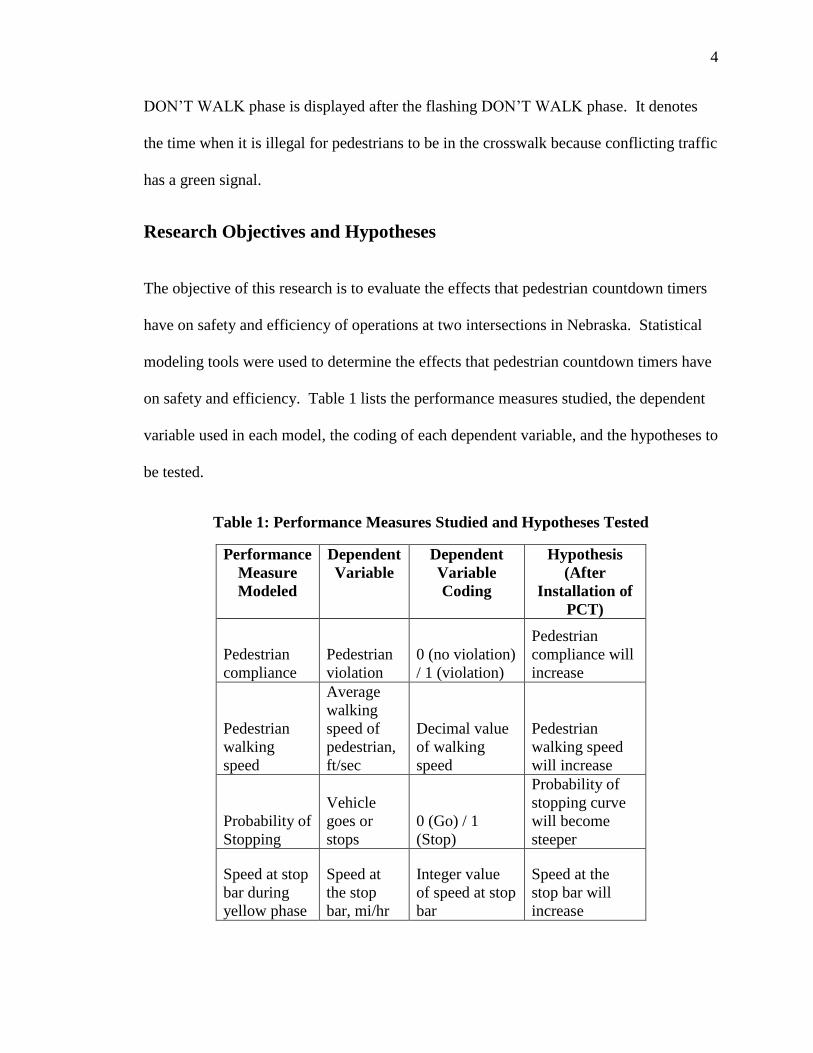
Research Objectives and Hypotheses
The objective of this research is to evaluate the effects that pedestrian countdown timers
have on safety and efficiency of operations at two intersections in Nebraska. Statistical
modeling tools were used to determine the effects that pedestrian countdown timers have
on safety and efficiency. Table 1 lists the performance measures studied, the dependent
variable used in each model, the coding of each dependent variable, and the hypotheses to
be tested.
Table 1: Performance Measures Studied and Hypotheses Tested
Performance
Measure
Modeled
Dependent
Variable
Dependent
Variable
Coding
Hypothesis
(After
Installation of
PCT)
Pedestrian
compliance
Pedestrian
violation
0 (no violation)
/ 1 (violation)
Pedestrian
compliance will
increase
Pedestrian
walking
speed
Average
walking
speed of
pedestrian,
ft/sec
Decimal value
of walking
speed
Pedestrian
walking speed
will increase
Probability of
Stopping
Vehicle
goes or
stops
0 (Go) / 1
(Stop)
Probability of
stopping curve
will become
steeper
Speed at stop
bar during
yellow phase
Speed at
the stop
bar, mi/hr
Integer value
of speed at stop
bar
Speed at the
stop bar will
increase
5
Innovations
As will be seen in the literature review presented in Chapter 2, a limitation to previous
research is that microscopic characteristics of both vehicles and pedestrians have not been
analyzed in previous studies. This research is innovative because an in-depth quantitative
analysis of microscopic characteristics was performed for both drivers and pedestrians
before and after installation of pedestrian countdown timers. The data collected for both
pedestrians and drivers will help understand the microscopic interactions among drivers
and pedestrians, which lead to the macroscopic results observed. The statistical modeling
results provide a better understanding of driver and pedestrian decision-making at
intersections with pedestrian countdown timers than has been achieved in previous
research studies.
Expected Benefits
The expected benefits of this study are a better understanding of the impacts of pedestrian
countdown timers on drivers and pedestrians. With two before and after studies at
separate approaches having different characteristics such as speed limit and traffic
volumes, an indication of the effects of pedestrian countdown timers on both drivers and
pedestrians in Lincoln, Nebraska can be seen. The statistical models will be useful in
better understanding the underlying behavior of drivers and pedestrians, as well as lead to
improvement in microscopic modeling tools.

6
Report Outline
Chapter 2 is composed of a thorough literature review of the effects of pedestrian
countdown timers on safety and efficiency of operations at signalized intersections.
Chapter 2 is divided into two sections: phase countdown timers (used outside of the
U.S.) and pedestrian countdown timers.
Chapter 3 describes the sites used for data collection. The hardware deployed for data
collection is explained. Then, the error reduction techniques are described. Chapter 3
concludes with the error tolerance of the hardware components in the field.
Chapter 4 explains the data analysis of this study. The days of data collection and the
number of observations used in data analysis are presented, followed by the results of this
study. This thesis ends with Chapter 5, which contains the conclusions drawn from this
research.
7
Chapter 2 – Literature Review
There have not been many studies evaluating the effects of pedestrian countdown timers
on traffic operations characteristics such as dilemma zone boundaries, and velocity of
vehicles during the yellow phase. Almost all literature on pedestrian countdown timers
has focused on pedestrian safety, pedestrian compliance, pedestrian understanding, red
light runners, and pedestrian-vehicular conflicts. However, some research has been
performed on phase countdown timers, primarily used in Asia, to quantify effects of
phase countdown timers on traffic characteristics. Therefore, the literature review will
cover research done on pedestrian countdown timers and phase countdown timers in
order to gain a thorough understanding of the effects that both pedestrian countdown
timers and phase countdown timers have on efficiency of operations and safety at
signalized intersections.
Phase Countdown Timers
Signalized intersections are important nodal points in transportation networks and their
efficiency of operation greatly influences the performance of the entire network. Several
European and Asian countries have started using phase countdown timers to provide
additional information to drivers, such as time until the beginning of the green phase. In
the U.S. there is still a debate going on regarding whether to provide phase countdown
timers, but several pedestrian countdown timers have been installed to provide additional
information to pedestrians. The presence of these timers is expected to affect both driver
and pedestrian behavior. Drivers may react differently on the onset of yellow because
they will have additional information on the time until the onset of yellow. This can
8
affect both safety and efficiency of performance of both vehicles and pedestrians at
signalized intersections.
He et al. (6) performed a study of drivers’ perceptions of phase countdown timers in
Beijing, China. They surveyed 200 drivers and were interested in the driver’s perception
of the effects that phase countdown timers have on driving behaviors and intersection
safety. They found that 75% of the surveyed drivers thought that phase countdown
timers could help them avoid using the emergency brake at the onset of the amber phase.
There was an overall consensus of all drivers that phase countdown timers can:
Reduce driver waiting anxiety by informing them of the time until the next phase
Provide a reference for drivers on when to turn off and turn on their engines in
order to save fuel and help the environment
Provide more information than traditional traffic signals.
Furthermore, they found that 87.5% of surveyed drivers prefer phase countdown timers to
traditional traffic signals. In addition, they found that 86.0% of drivers believed that
intersections with phase countdown timers are safer than traditional traffic signal
intersections. Other studies have been performed to analyze the effects that phase
countdown timers have on drivers (10, 17), which mainly focus on queue discharge
characteristics.
9
Pedestrian Countdown Timers
Schattler et al. (14) performed a study in Peoria, IL using a total of 13 intersections to
study the effect of pedestrian countdown timers on pedestrian compliance, yellow light
runners, and red light runners. In the study, three intersections were studied using a
before-and-after method, and ten intersections were studied using a comparative analysis
method (five intersections with pedestrian countdown timers installed and five with
traditional pedestrian signals). They found that pedestrian countdown timers do not
significantly increase or reduce the amount of red-light runners and yellow-light runners.
A comparative analysis at ten intersections also resulted in no significant differences in
YLR and RLR between the intersections with pedestrian countdown timers installed and
the intersections with traditional pedestrian signals. They also found that pedestrian
countdown timers significantly improve pedestrian compliance over traditional pedestrian
signals. The proportion of pedestrians that started walking during the walk or flashing
DON’T WALK (with countdown numbers) was higher after installation of pedestrian
countdown timers than with traditional pedestrian signals. At each intersection studied,
the percentage of pedestrians crossing during the “WALK” phase (W) and flashing
“DON’T WALK” phase (FDW) increased after installation of pedestrian countdown
timers. They performed a Z-test at 95% confidence and found that the average pedestrian
violation rate over the three intersections (% Peds. Crossing on DW) significantly
decreased after installation of pedestrian countdown timers.
Huang and Zegeer (7) performed a treatment and control study on five intersections, two
treatment intersections had pedestrian countdown timers installed, and three control
10
intersections had traditional pedestrian signals. Three measures of effectiveness were
studied: 1. Pedestrian compliance with the Walk Signal, 2. Pedestrians who ran out of
time, and 3. Pedestrians who started running when the flashing DON’T WALK signal
appeared. A pedestrian who complied with the walk phase began walking in the
crosswalk during the Walk phase, and did not comply by beginning to walk in the
crosswalk during any other phase. They found that pedestrian compliance to the walk
signal was significantly lower at intersections with pedestrian countdown timers, using
the chi-squared method at the 0.005 significance level. A pedestrian who ran out of time
was still walking in the crosswalk at the beginning of the DON’T WALK phase. They
found an insignificant difference in the proportion of pedestrians who ran out of time.
They found that pedestrian countdown timers reduce the amount of pedestrians who start
running when the flashing DON’T WALK appears. This is because pedestrians are
aware of how much time they have to cross the intersection before the solid DON’T
WALK signal appears, and can adjust their speed accordingly, not needing to run as
often. They concluded that pedestrian countdown signals are not recommended for use in
the state of Florida because of the negative effect of decreasing pedestrian compliance to
the Walk signal.
Huey and Ragland (8) found that drivers behave differently based on what type of
pedestrian signal is used. They tested two intersections for red-light runners and yellow-
light runners using traditional pedestrian signals and pedestrian countdown signals. They
found that with a pedestrian countdown timer installed, 67.5% of the vehicles observed at
the onset of yellow went through the intersection (observed from roughly 80 ft upstream
11
of the intersection). With a traditional pedestrian signal, 65.3% of the vehicles went
through the intersection. The difference was not found to be statistically significant.
Ma et al. (11) studied the effects of pedestrian countdown timers on pedestrians in
Shanghai, China. A comparative analysis was performed at two intersections, one with
pedestrian countdown timers installed and one with traditional pedestrian signals. They
studied pedestrian compliance in terms of pedestrians who enter the intersection during
the flashing DON’T WALK phase. Two age groups were considered: younger and
elder. Pedestrian countdown timers were found to increase pedestrian compliance in
elder people. For younger people, the proportion of pedestrians who enter the crosswalk
during the flashing DON’T WALK phase is about the same for both pedestrian
countdown signals and traditional pedestrian signals.
Washburn et al. (19) performed a before and after study in Gainesville, FL at five
intersections to study the effects of pedestrian countdown timers on pedestrians. They
mainly studied pedestrian compliance, by calculating the percentage of pedestrians
entering the crosswalk during the WALK, FDW, and DW indications. In addition, they
took a further look into the compliance with the FDW indications. Percentage of
pedestrians hesitating, running, or going back to the starting curb was calculated, as well
as percentage of pedestrian-vehicle conflicts. Washburn et al. found that the proportion
of pedestrians entering on the WALK indication increased at three of the five
intersections. Correspondingly, the proportion of pedestrians entering on the DW
interval decreased at the same three of the five intersections. It was found that there was
no increase in the proportion of pedestrians who entered during the FDW interval. In
addition, the pedestrian countdown timers had the positive effect of increasing the
12
proportion of pedestrians exiting on the FDW interval as opposed to the DW interval.
There was no trend in erratic pedestrian behavior, such as hesitating, running, or going
back to the starting curb. There was no significant increase or decrease in pedestrian-
vehicle conflicts. Overall, Washburn et al. found no negative effects of pedestrian
countdown timers and found positive effects including pedestrian compliance.
Eccles et al. (4) performed a before and after pedestrian countdown timer study of five
intersections in Montgomery County, Maryland. Eccles et al. studied pedestrian
compliance by counting the amount of pedestrians who entered the crosswalk during each
phase: WALK, flashing DON’T WALK, and solid DON’T WALK. Vehicle approach
speeds were measured by radar from approximately 400 ft upstream of the intersection.
Only vehicles that were unobstructed by other vehicles and that were recorded between
17 to 6 seconds from the onset of red were used for analysis. There was a significant
decrease in mean speed at one approach; otherwise, there were no significant changes in
mean speeds after installation of pedestrian countdown timers.
For the pedestrian compliance study, Eccles et al. studied each crosswalk separately at
the five intersections, for a total of 20 crosswalks. It was found that six out of 20
crosswalks had a significant increase in pedestrian compliance, which was measured as
percentage of pedestrians entering the crosswalk during the WALK indication, at the
95% confidence level. It was also found that two of the 20 crosswalks had a significant
decrease in pedestrian compliance. The other 12 crosswalks had insignificant results in
pedestrian compliance.

13
Schrock and Bundy (15) studied the effects of pedestrian countdown timers on drivers in
Lawrence, Kansas in a comparative analysis of a total of four intersections, two with
pedestrian countdown timers installed and two with traditional pedestrian signals, along
the same corridor. Vehicle speeds were measured using LIDAR from observers located
downstream of the intersection, facing oncoming traffic. Vehicles that were located in
the indecision zone during the flashing DON’T WALK phase were used for data.
Vehicles were categorized into one of the following categories: stopped (began
decelerating at or after the beginning of the amber phase); stopped but began decelerating
early (before the beginning of the amber phase); continued on normally through the
intersection; continued on through the intersection but accelerated in order to do so; and
continued on through the intersection but ran the red light in order to do so. They found a
significant decrease in drivers who accelerated in order to continue through the
intersection when a pedestrian countdown timer is present. They concluded that drivers
in the indecision zone were found to drive less aggressively at intersections with
pedestrian countdown timers installed.
Summary
Other previous studies (1, 2, 9, 12, and 24) have studied the effects of pedestrian
countdown timers on pedestrians and drivers with mixed results. Pedestrian countdown
timers have been reported to have both positive and negative effects on drivers and
pedestrians in different studies. Therefore, it is important to study the effects of
pedestrian countdown timers on both drivers and pedestrians in Lincoln in order to

14
understand the advantages and disadvantages of pedestrian countdown timers specific to
Lincoln drivers and pedestrians.
15
Chapter 3 – Data Collection
Intersection Selection
After a thorough literature review, a detailed research plan and methodology was
presented to the Nebraska Department of Roads Traffic Advisory Committee (TAC) on
June 4, 2009. The TAC, consisting of professionals from the State of Nebraska
Department of Roads and the City of Lincoln Public Works Department, chose two
intersections to perform the study in Lincoln, Nebraska: S 17th St & G St and N 27th St
& Cornhusker Highway. It was determined that the best approaches to perform the study
were the northbound approach at 17th St & G St, and the eastbound approach at 27th St
& Cornhusker Highway. At both of these locations, the pedestrian countdown timers can
easily be seen by oncoming traffic at distances over 500 ft. Other technical constraints,
met at both intersections selected, needed for this study were:
Presence of pedestrian signal recall: This will ensure that the countdown is
displayed at every cycle.
Presence of space in the cabinet: Enough space in the traffic cabinet to
accommodate the instrumentation for data collection purposes.
Availability of exterior hardware component storage: Mast arms (no span wires)
were needed to hold the wide area detectors, and light poles were needed to hold
PTZ cameras, etc.
Table 2 lists the intersection width at the two intersection approaches used to perform this
study.
16
Table 2: Intersection Width
Intersection Approach
Intersection Width
(ft)
17th & G NB 95
27th
& Cornhusker EB 160
Due to an inability to obtain accurate pedestrian walking speeds at 27th
& Cornhusker,
explained in detail later, pedestrian data was only reduced at the intersection of 17th
St &
G St.
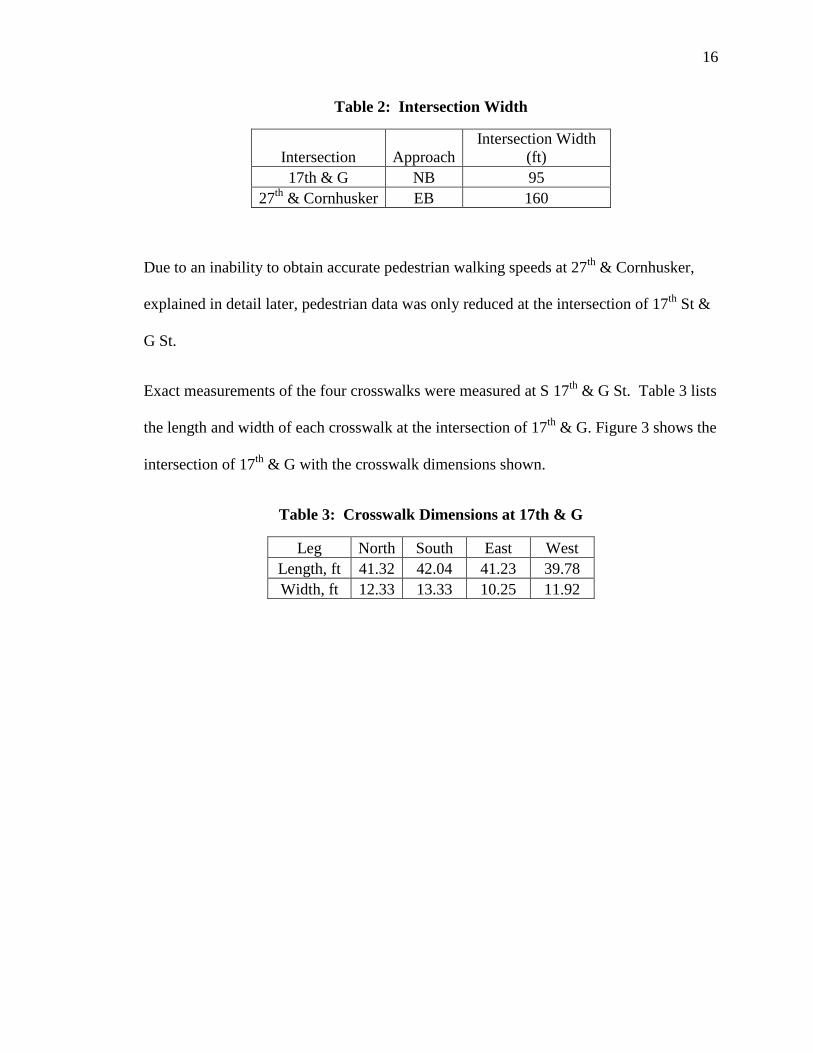
Exact measurements of the four crosswalks were measured at S 17th
& G St. Table 3 lists
the length and width of each crosswalk at the intersection of 17th
& G. Figure 3 shows the
intersection of 17th
& G with the crosswalk dimensions shown.
Table 3: Crosswalk Dimensions at 17th & G
Leg North South East West
Length, ft 41.32 42.04 41.23 39.78
Width, ft 12.33 13.33 10.25 11.92
17
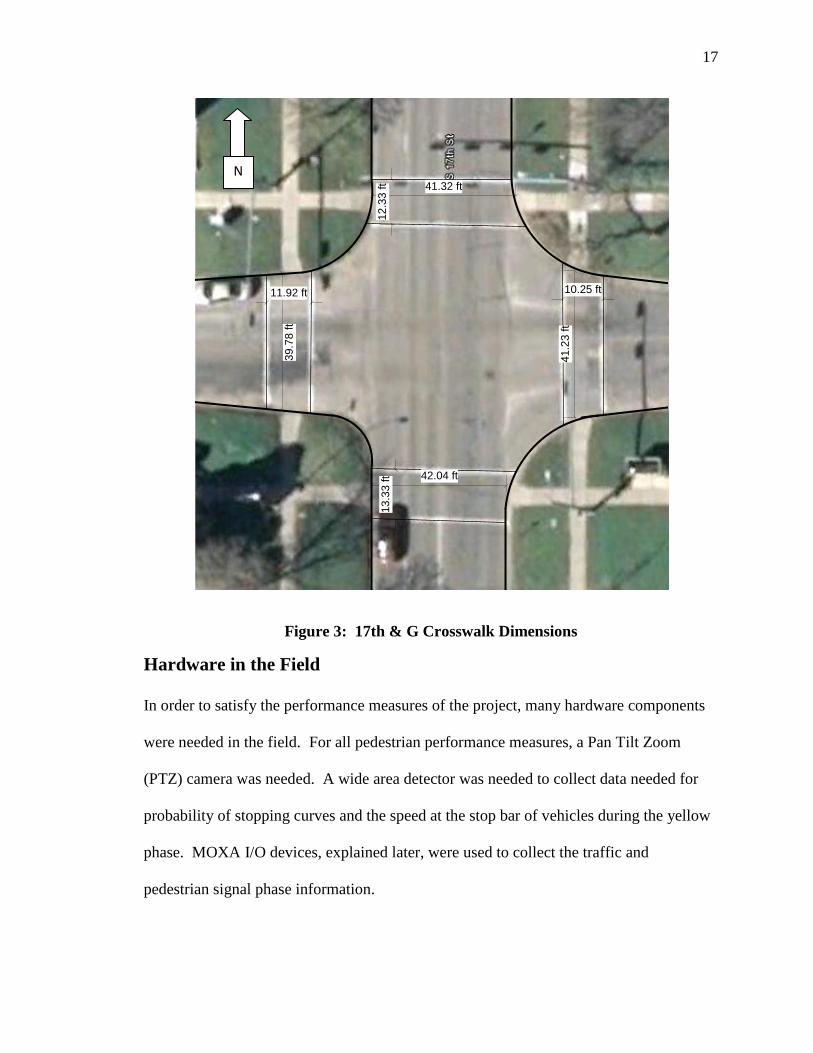
Figure 3: 17th & G Crosswalk Dimensions
Hardware in the Field
In order to satisfy the performance measures of the project, many hardware components
were needed in the field. For all pedestrian performance measures, a Pan Tilt Zoom
(PTZ) camera was needed. A wide area detector was needed to collect data needed for
probability of stopping curves and the speed at the stop bar of vehicles during the yellow
phase. MOXA I/O devices, explained later, were used to collect the traffic and
pedestrian signal phase information.
39
.78
ft
42.04 ft
41.32 ft
41
.23
ft
12
.33
ft
10.25 ft
13
.33
ft
11.92 ft
N
18
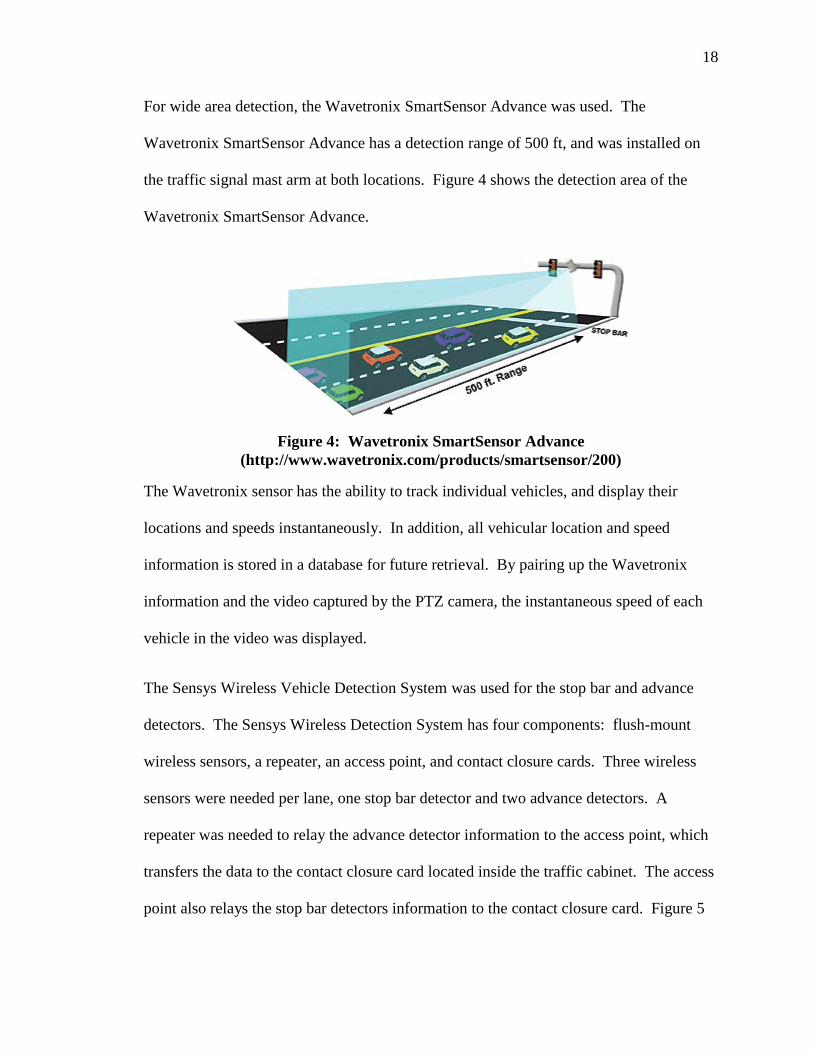
For wide area detection, the Wavetronix SmartSensor Advance was used. The
Wavetronix SmartSensor Advance has a detection range of 500 ft, and was installed on
the traffic signal mast arm at both locations. Figure 4 shows the detection area of the
Wavetronix SmartSensor Advance.
Figure 4: Wavetronix SmartSensor Advance
(http://www.wavetronix.com/products/smartsensor/200)
The Wavetronix sensor has the ability to track individual vehicles, and display their
locations and speeds instantaneously. In addition, all vehicular location and speed
information is stored in a database for future retrieval. By pairing up the Wavetronix
information and the video captured by the PTZ camera, the instantaneous speed of each
vehicle in the video was displayed.
The Sensys Wireless Vehicle Detection System was used for the stop bar and advance
detectors. The Sensys Wireless Detection System has four components: flush-mount
wireless sensors, a repeater, an access point, and contact closure cards. Three wireless
sensors were needed per lane, one stop bar detector and two advance detectors. A
repeater was needed to relay the advance detector information to the access point, which
transfers the data to the contact closure card located inside the traffic cabinet. The access
point also relays the stop bar detectors information to the contact closure card. Figure 5
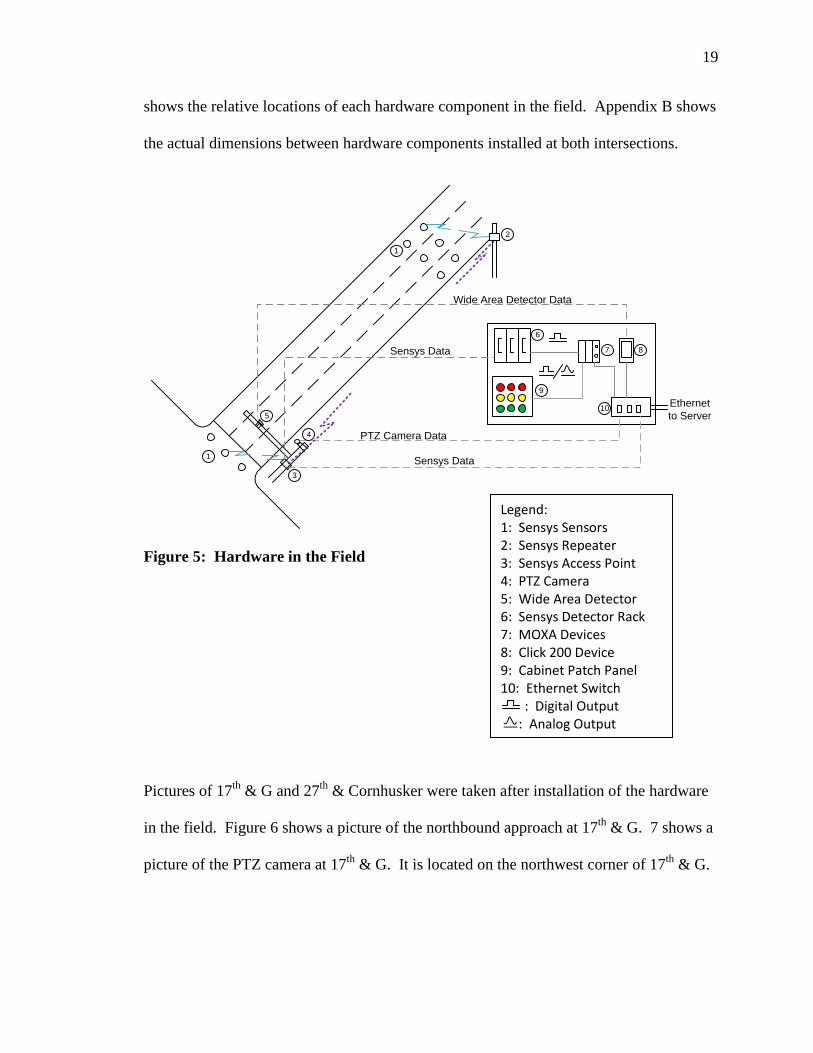
19
shows the relative locations of each hardware component in the field. Appendix B shows
the actual dimensions between hardware components installed at both intersections.
Figure 5: Hardware in the Field
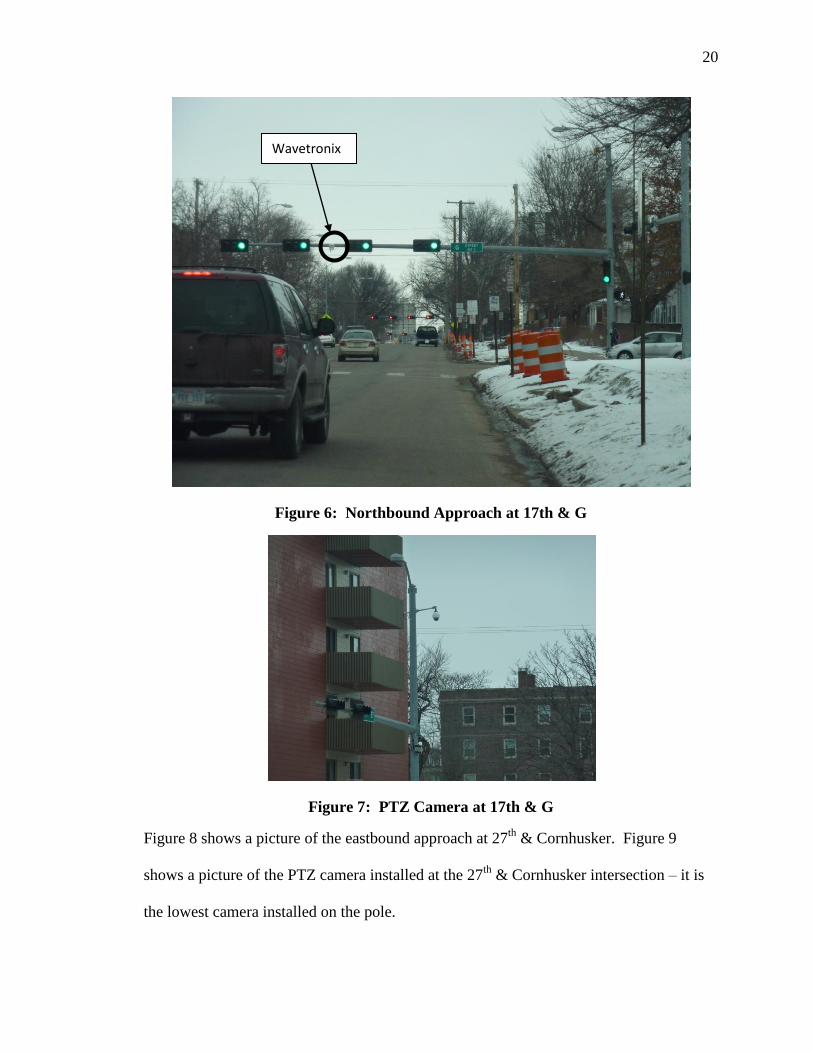
Pictures of 17th
& G and 27th
& Cornhusker were taken after installation of the hardware
in the field. Figure 6 shows a picture of the northbound approach at 17th
& G. 7 shows a
picture of the PTZ camera at 17th
& G. It is located on the northwest corner of 17th
& G.
Wide Area Detector Data
PTZ Camera Data
Sensys Data
Ethernet
to Server
1
2
5
3
4
1
6
7 8
9
10
Sensys Data
Legend: 1: Sensys Sensors 2: Sensys Repeater 3: Sensys Access Point 4: PTZ Camera 5: Wide Area Detector 6: Sensys Detector Rack 7: MOXA Devices 8: Click 200 Device 9: Cabinet Patch Panel 10: Ethernet Switch
: Digital Output : Analog Output
20
Figure 6: Northbound Approach at 17th & G
Figure 7: PTZ Camera at 17th & G
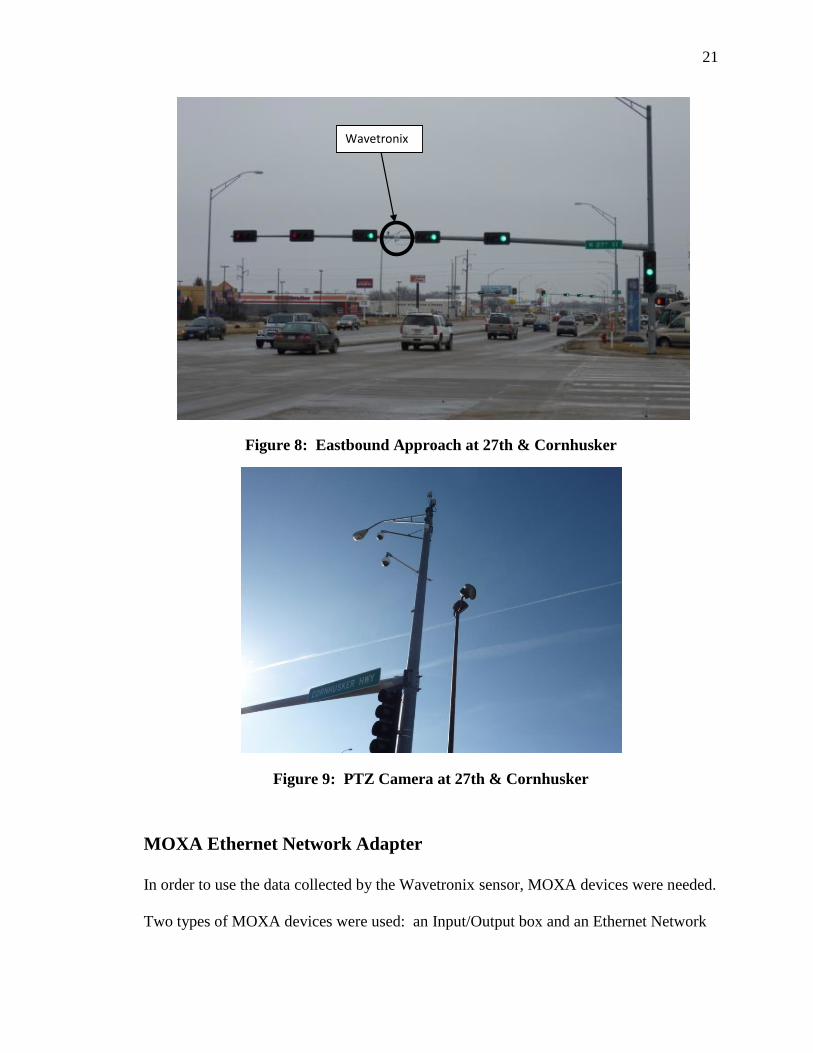
Figure 8 shows a picture of the eastbound approach at 27th
& Cornhusker. Figure 9
shows a picture of the PTZ camera installed at the 27th
& Cornhusker intersection – it is
the lowest camera installed on the pole.
Wavetronix
21
Figure 8: Eastbound Approach at 27th & Cornhusker
Figure 9: PTZ Camera at 27th & Cornhusker
MOXA Ethernet Network Adapter
In order to use the data collected by the Wavetronix sensor, MOXA devices were needed.
Two types of MOXA devices were used: an Input/Output box and an Ethernet Network
Wavetronix
22
Adapter (Modbus/TCP). The I/O box has 16 digital I/O channels, which took
information from the traffic signals and Sensys sensors, and connected to the Ethernet
Network Adapter. The Ethernet Network Adapter connected to the City of Lincoln
network. The information was accessed from the City of Lincoln Public Works
Department Engineering Services office, where a server computer collected all data.
Wonderware
To view the information collected in the field in real-time, the software Wonderware was
used. Wonderware has the ability to take MOXA information and display it on a
computer screen with the live video from the PTZ camera. Wonderware Intouch Tags
were created and assigned to each individual MOXA channel. Table 4 lists the MOXA
channel, Intouch Tag, and corresponding field data used at 17th
St & G St. Similarly,
field data from 27th
St & Cornhusker Hwy were assigned Intouch Tags from MOXA
channels.
23
Table 4: Wonderware Intouch Tags at 17th St & G St
MOXA
Channel Intouch Tag Field Data
0 10001 Phase 2 (17th) Red
1 10002 Phase 2 (17th) Yellow
2 10003 Phase 2 (17th) Green
3 10004
Phase 2 (17th) Pedestrian
Flashing DON’T WALK
4 10005
Phase 2 (17th) Pedestrian
Walk
5 10006
Phase 4 (G) Pedestrian
Flashing DON’T WALK
6 10007
Phase 4 (G) Pedestrian
Walk
7 10008 Sensys 300A
8 10009 Sensys 30C4
9 10010 Sensys A9A9
10 10011 Sensys 3063
11 10012 Sensys 30CD
12 10013 Sensys A9BF
13 10014 Sensys 3094
14 10015 Sensys 30F8
15 10016 Sensys AA17
An example screen shot of Wonderware, Wavetronix, and a flow chart of information is
presented in Figure 10. Wonderware can show the video from the PTZ camera, display
which detectors are sending pulses, display the timestamp, and display all phase
information for both traffic signals and pedestrian signals. In addition, Wonderware
stores all information in a historian that can be sorted and reduced. Data from a certain
time and date can be extracted easily and further analyzed. The computer screen can be
recorded at a 15-frames-per-second resolution.
24
Figure 10: Example Screenshot of Wonderware for 17th & G
Information from the Wonderware Historian can be accessed from Microsoft Excel by
obtaining data using a Microsoft Query, and typing in a Structured Query Language
(SQL) command. An example Wonderware Historian data set is shown in Table 5. In
Table 5, a value of 0 represents a time when the pedestrian phase was not flashing
DON’T WALK. A value of 1 means that the pedestrian signal phase was flashing
DON’T WALK. The example data presented in Table 5 shows one pedestrian signal
cycle on July 9, 2010. During this cycle, the flashing DON’T WALK phase began at
12:01:46 a.m., and ended at 12:01:56 a.m.
ID Range Velocity
1 300 50
2 0 30
2005/10/30 07:08:44.35
Screen recording utility capturing
to a 15 fps digital video file
Sensys
sensor
Phase
Information
Raw
Video
Server
Data logged to
*.txt or *.csv file
WonderwareData logged to
SQL DatabaseWide Area
Detector
Raw
Input
Screen recording utility capturing to
a 15 frames per second video file
25
Table 5: Example Wonderware Historian Data
TagName Date & Time Value
17th_FDW
2010-07-09
00:00:56.217 0
17th_FDW
2010-07-09
00:01:46.197 1
17th_FDW
2010-07-09
00:01:56.190 0
Vehicle Data
The software MATLAB was used to plot vehicle speed and distance from the stop bar
instantaneously. The plot was positioned next to the Wonderware screen, so that each
vehicle could be seen as it was being plotted. MATLAB stored all vehicle speed and
distances from the stop bar in files that can be accessed for data reduction purposes such
as dilemma zone boundaries. Figure 11 shows a screenshot of the MATLAB plots next
to the Wonderware screen.
Figure 11: Wonderware and MATLAB Screenshot
26
Error Assessment
To assess the amount of error incurred while collecting and reducing data, many
techniques were employed. First, it was important to know exactly the time difference
between the video that was displayed on screen and the time the video was taken in the
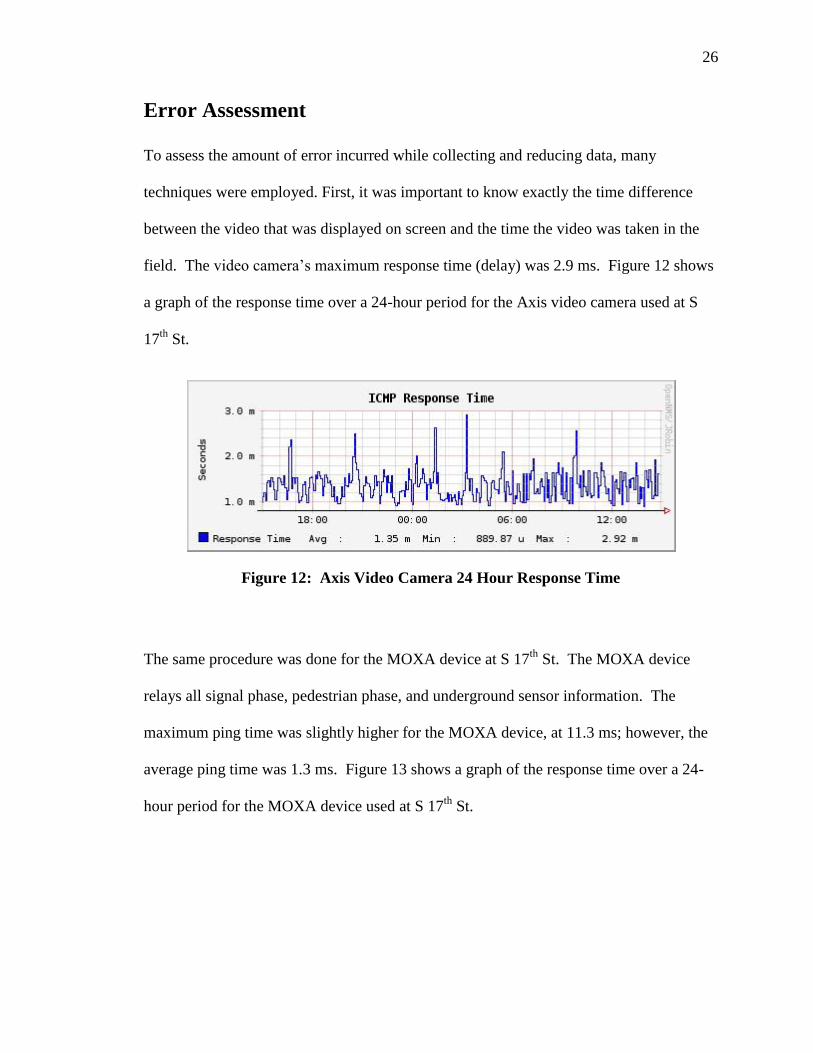
field. The video camera’s maximum response time (delay) was 2.9 ms. Figure 12 shows
a graph of the response time over a 24-hour period for the Axis video camera used at S
17th
St.
Figure 12: Axis Video Camera 24 Hour Response Time
The same procedure was done for the MOXA device at S 17th
St. The MOXA device
relays all signal phase, pedestrian phase, and underground sensor information. The
maximum ping time was slightly higher for the MOXA device, at 11.3 ms; however, the
average ping time was 1.3 ms. Figure 13 shows a graph of the response time over a 24-
hour period for the MOXA device used at S 17th
St.
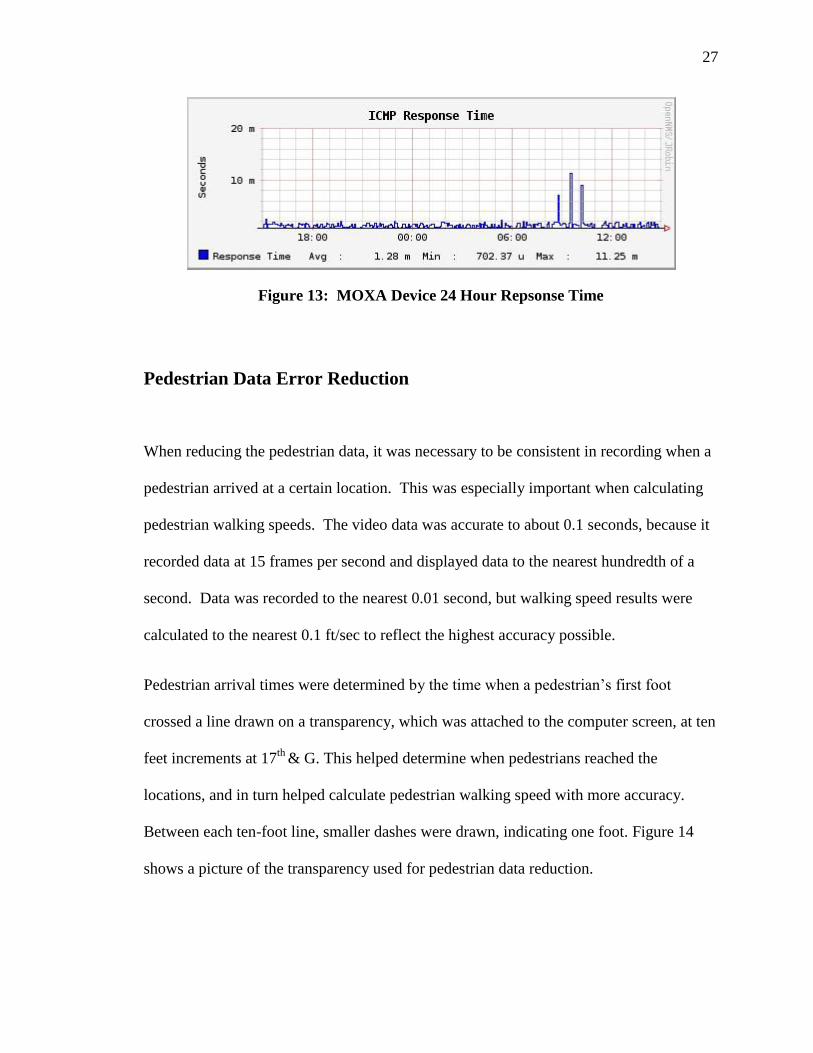
27
Figure 13: MOXA Device 24 Hour Repsonse Time
Pedestrian Data Error Reduction
When reducing the pedestrian data, it was necessary to be consistent in recording when a
pedestrian arrived at a certain location. This was especially important when calculating
pedestrian walking speeds. The video data was accurate to about 0.1 seconds, because it
recorded data at 15 frames per second and displayed data to the nearest hundredth of a
second. Data was recorded to the nearest 0.01 second, but walking speed results were
calculated to the nearest 0.1 ft/sec to reflect the highest accuracy possible.
Pedestrian arrival times were determined by the time when a pedestrian’s first foot
crossed a line drawn on a transparency, which was attached to the computer screen, at ten
feet increments at 17th
& G. This helped determine when pedestrians reached the
locations, and in turn helped calculate pedestrian walking speed with more accuracy.
Between each ten-foot line, smaller dashes were drawn, indicating one foot. Figure 14
shows a picture of the transparency used for pedestrian data reduction.
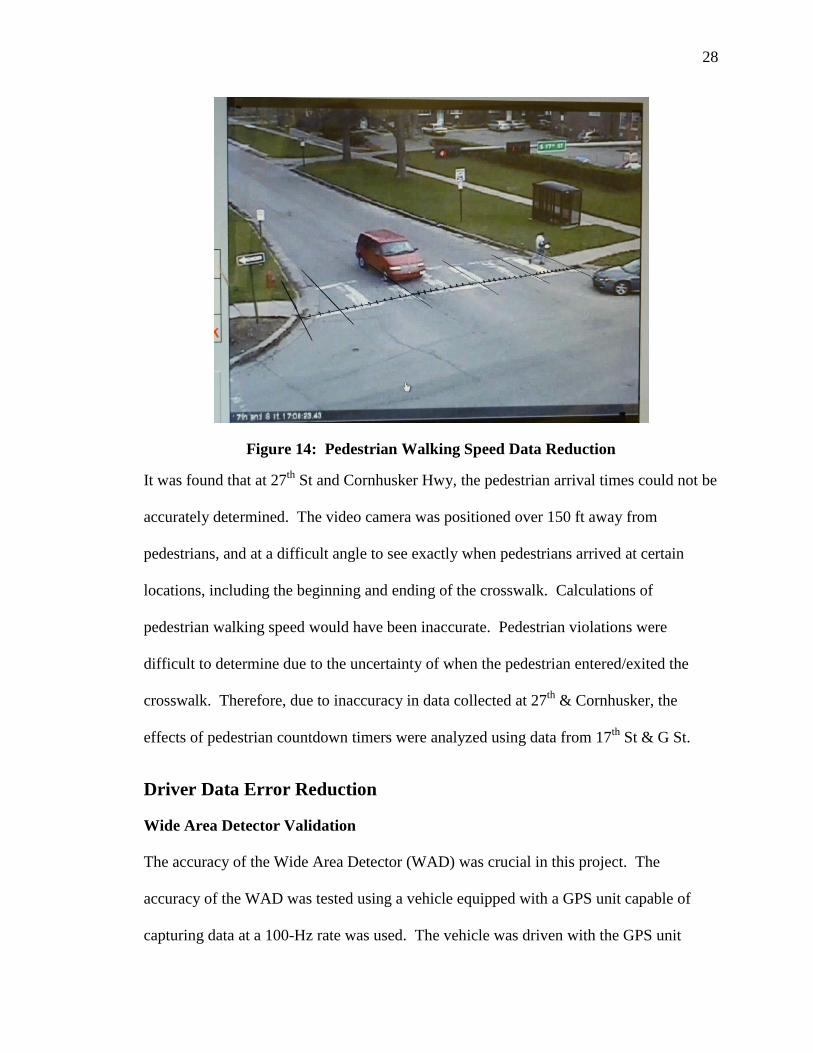
28
Figure 14: Pedestrian Walking Speed Data Reduction
It was found that at 27th
St and Cornhusker Hwy, the pedestrian arrival times could not be
accurately determined. The video camera was positioned over 150 ft away from
pedestrians, and at a difficult angle to see exactly when pedestrians arrived at certain
locations, including the beginning and ending of the crosswalk. Calculations of
pedestrian walking speed would have been inaccurate. Pedestrian violations were
difficult to determine due to the uncertainty of when the pedestrian entered/exited the
crosswalk. Therefore, due to inaccuracy in data collected at 27th
& Cornhusker, the
effects of pedestrian countdown timers were analyzed using data from 17th
St & G St.
Driver Data Error Reduction
Wide Area Detector Validation
The accuracy of the Wide Area Detector (WAD) was crucial in this project. The
accuracy of the WAD was tested using a vehicle equipped with a GPS unit capable of
capturing data at a 100-Hz rate was used. The vehicle was driven with the GPS unit
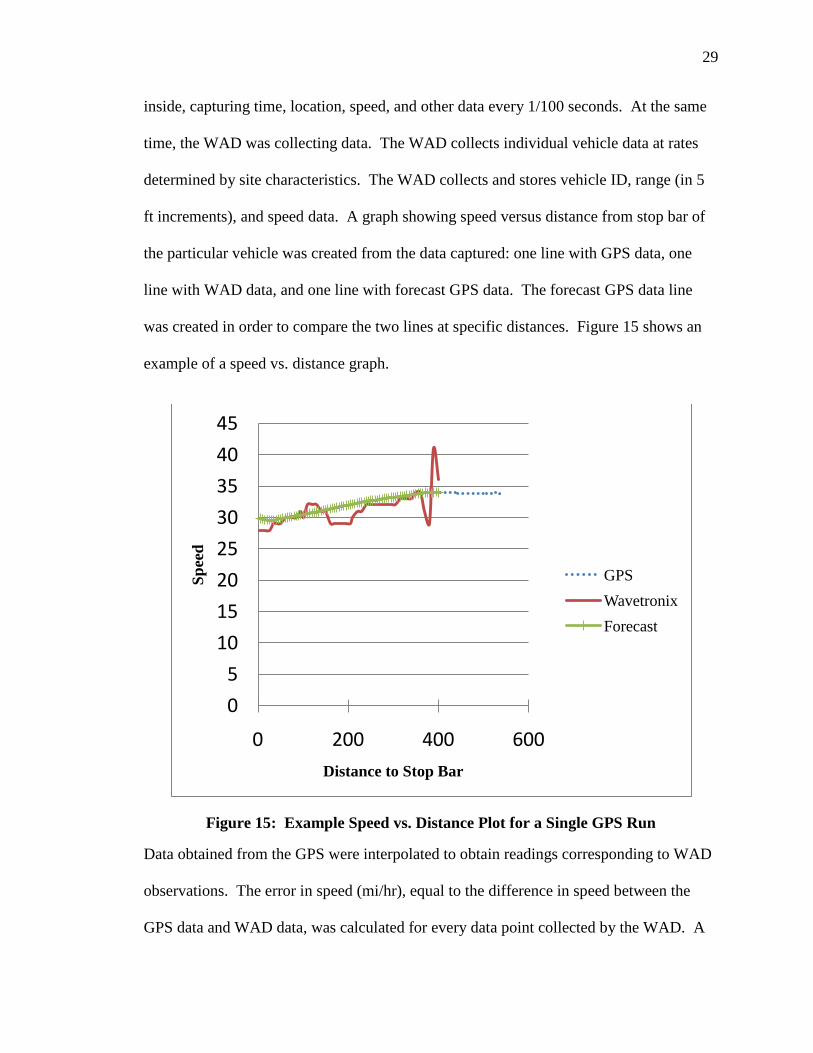
29
inside, capturing time, location, speed, and other data every 1/100 seconds. At the same
time, the WAD was collecting data. The WAD collects individual vehicle data at rates
determined by site characteristics. The WAD collects and stores vehicle ID, range (in 5
ft increments), and speed data. A graph showing speed versus distance from stop bar of
the particular vehicle was created from the data captured: one line with GPS data, one
line with WAD data, and one line with forecast GPS data. The forecast GPS data line
was created in order to compare the two lines at specific distances. Figure 15 shows an
example of a speed vs. distance graph.
Figure 15: Example Speed vs. Distance Plot for a Single GPS Run
Data obtained from the GPS were interpolated to obtain readings corresponding to WAD
observations. The error in speed (mi/hr), equal to the difference in speed between the
GPS data and WAD data, was calculated for every data point collected by the WAD. A
0
5
10
15
20
25
30
35
40
45
0 200 400 600
Sp
eed
Distance to Stop Bar
GPS
Wavetronix
Forecast
30
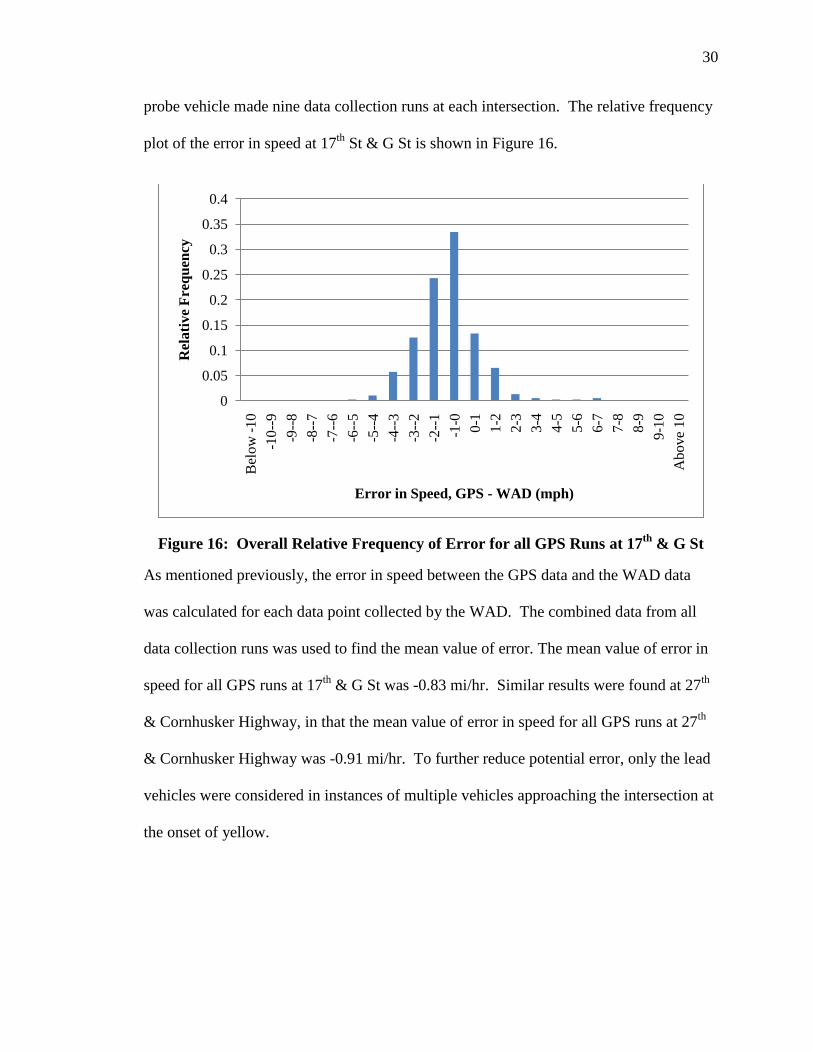
probe vehicle made nine data collection runs at each intersection. The relative frequency
plot of the error in speed at 17th
St & G St is shown in Figure 16.
Figure 16: Overall Relative Frequency of Error for all GPS Runs at 17th
& G St
As mentioned previously, the error in speed between the GPS data and the WAD data
was calculated for each data point collected by the WAD. The combined data from all
data collection runs was used to find the mean value of error. The mean value of error in
speed for all GPS runs at 17th
& G St was -0.83 mi/hr. Similar results were found at 27th
& Cornhusker Highway, in that the mean value of error in speed for all GPS runs at 27th
& Cornhusker Highway was -0.91 mi/hr. To further reduce potential error, only the lead
vehicles were considered in instances of multiple vehicles approaching the intersection at
the onset of yellow.
0
0.05
0.1
0.15
0.2
0.25
0.3
0.35
0.4
Bel
ow
-10
-10
--9
-9--
8
-8--
7
-7--
6
-6--
5
-5--
4
-4--
3
-3--
2
-2--
1
-1-0
0-1
1-2
2-3
3-4
4-5
5-6
6-7
7-8
8-9
9-1
0
Above
10
Rel
ati
ve
Fre
qu
ency
Error in Speed, GPS - WAD (mph)
31
Chapter 4 – Data Analysis
Data Collection and Number of Observations
At 17th
Street & G Street, vehicle data was collected at the northbound approach, and
pedestrian data was collected at the east crosswalk (parallel to 17th
St). At 27th
&
Cornhusker Highway, vehicle data was collected at the eastbound approach. For both
intersections, data was collected from April 2010 – May 2011. A thorough data
reduction process was used to eliminate possible erroneous data. All data was visually
inspected before being reduced and only data during fair weather days (no precipitation)
was used. In addition, no data collected during December 2010 – February 2011 was
used due to extreme cold temperatures experienced, and ice/snow on roadways. The
daily high temperature was used as an independent variable in the statistical models.
Studies have shown that probability of stopping curves, developed from probit models,
stabilize using a small sample size of approximately 150 observations (18, 25). In this
study, over 400 data points were collected at each location before and after installation,
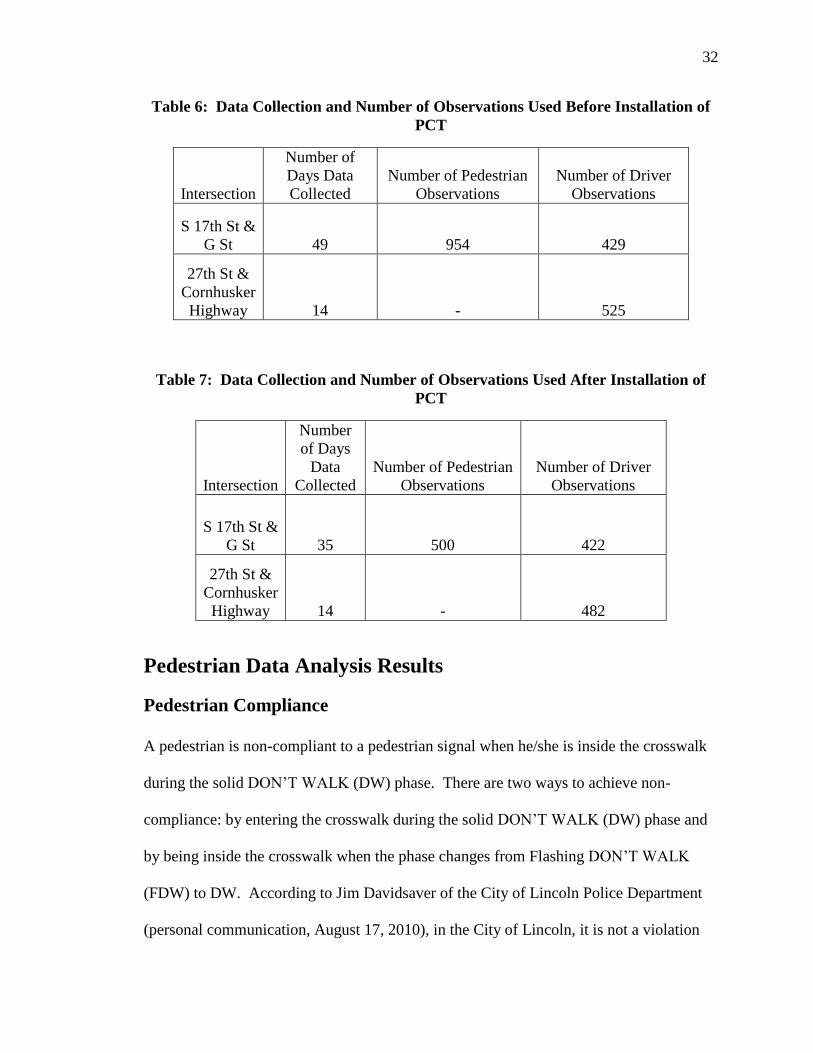
which is a sufficient amount of data based on previous research findings (18, 25). Tables
6 and 7 list the number of days of data collection, and number of observations used in the
data analysis of this study for both intersections, before and after installation of
pedestrian countdown timers, respectively.
32
Table 6: Data Collection and Number of Observations Used Before Installation of
PCT
Intersection
Number of
Days Data
Collected
Number of Pedestrian
Observations
Number of Driver
Observations
S 17th St &
G St 49 954 429
27th St &
Cornhusker
Highway 14 - 525
Table 7: Data Collection and Number of Observations Used After Installation of
PCT
Intersection
Number
of Days
Data
Collected
Number of Pedestrian
Observations
Number of Driver
Observations
S 17th St &
G St 35 500 422
27th St &
Cornhusker
Highway 14 - 482
Pedestrian Data Analysis Results
Pedestrian Compliance
A pedestrian is non-compliant to a pedestrian signal when he/she is inside the crosswalk
during the solid DON’T WALK (DW) phase. There are two ways to achieve non-
compliance: by entering the crosswalk during the solid DON’T WALK (DW) phase and
by being inside the crosswalk when the phase changes from Flashing DON’T WALK
(FDW) to DW. According to Jim Davidsaver of the City of Lincoln Police Department
(personal communication, August 17, 2010), in the City of Lincoln, it is not a violation
33
for a pedestrian to enter an intersection during the FDW phase as long as that pedestrian
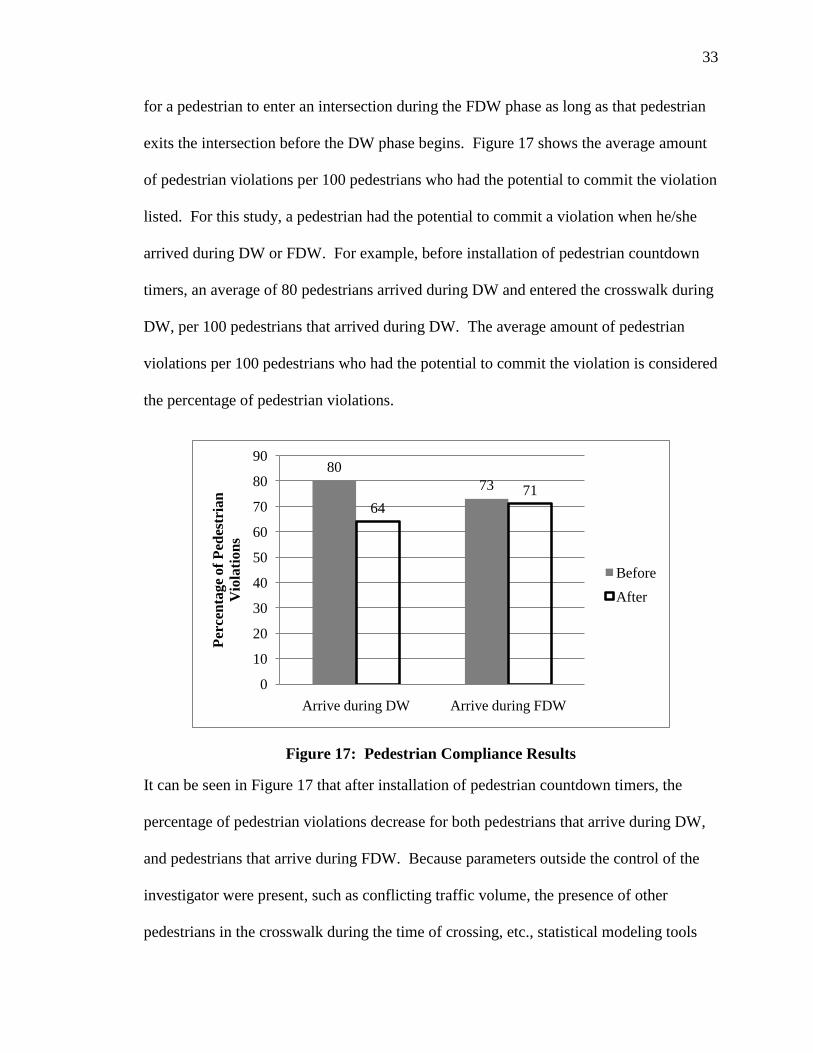
exits the intersection before the DW phase begins. Figure 17 shows the average amount
of pedestrian violations per 100 pedestrians who had the potential to commit the violation
listed. For this study, a pedestrian had the potential to commit a violation when he/she
arrived during DW or FDW. For example, before installation of pedestrian countdown
timers, an average of 80 pedestrians arrived during DW and entered the crosswalk during
DW, per 100 pedestrians that arrived during DW. The average amount of pedestrian
violations per 100 pedestrians who had the potential to commit the violation is considered
the percentage of pedestrian violations.
Figure 17: Pedestrian Compliance Results
It can be seen in Figure 17 that after installation of pedestrian countdown timers, the
percentage of pedestrian violations decrease for both pedestrians that arrive during DW,
and pedestrians that arrive during FDW. Because parameters outside the control of the
investigator were present, such as conflicting traffic volume, the presence of other
pedestrians in the crosswalk during the time of crossing, etc., statistical modeling tools
80
73
64
71
0
10
20
30
40
50
60
70
80
90
Arrive during DW Arrive during FDW
Per
cen
tage o
f P
edes
tria
n
Vio
lati
on
s
Before
After
34
were used to ascertain whether pedestrian countdown timers were responsible for an
observed change. For an in-depth analysis of pedestrian compliance, the probability of a
pedestrian violation was modeled.
Pedestrians can be either compliant or not compliant to the pedestrian signal. This can be
modeled using a probit model corresponding to the probability of a pedestrian violating a
pedestrian signal. The probit model is a binary choice model that takes the form:
'|1Pr XXY , where:
Pr(Y =1 | X) is the probability that the dependent variable is equal to 1 given the
independent variable X. This can be calculated using the CDF of the standard normal
distribution function, Φ(X’β), where β is estimated parameters using maximum
likelihood. In the pedestrian compliance model, the dependent variable tested was the
probability of a violation. Examples of independent variables (type) used were:
Five minute conflicting traffic volume (Integer)
High temperature, °F (Integer)
Day of week (Dummy)
Time of day (Dummy)
Average walking speed, ft/sec, of pedestrian (Decimal)
Presence of a car stopped on G St (Dummy)
Presence of another pedestrian inside the crosswalk (Dummy)
35
Phase that the pedestrian arrived during: WALK, FDW, or DW (Dummy)
Pedestrian delay time, sec, measured from time of arrival to time of departure
(Decimal)
Direction of travel (Dummy)
Presence of pedestrian countdown timers (Dummy)
Appendix A provides a complete list of all variables used, type of variable, and the
coding of the variable in the software used to model the results. The software NLOGIT
4.0, from Econometric Software, Inc. (22) was used to model the results. Among the
statistical models tested, the Akaike Information Criterion (AIC) value was used to
determine which model was the best fit (23). The AIC value was calculated as follows:
LnAIC ln22 , where:
n = number of parameters in statistical model, and
L = maximum value of likelihood function for the statistical model
When comparing two statistical models, the model with the lower AIC value was chosen
as the preferred model of the two. Table 8 lists the results of the pedestrian compliance
model.

36
Table 8: Pedestrian Compliance Model Results
Probit Model
Dependent Variable: Pedestrian Violation (0 = no violation, 1 = violation)
Number of observations: 1454
Unrestricted Log Likelihood = -788.389
Restricted Log Likelihood = -1358.735
AIC = 1.097 McFadden R2 = 0.420
Variable Name (Type)
Estimated
Coefficient T-stats
Constant -2.824 -16.207
5 min right turning traffic vol 17th
St (Integer) -0.070 -2.656
Presence of another pedestrian (Dummy) 0.092 2.832
Arrive during DW (Dummy) 3.537 23.451
Arrive during FDW (Dummy) 3.714 21.555
Delay time (Decimal) -0.097 -6.121
Presence of pedestrian countdown timers
(Dummy) -0.012 -0.117
At 95% confidence, the following is a list of independent variables that were significant:
five minute right turning volume on S 17th
St, presence of another pedestrian inside of the
crosswalk, arrived during DW, arrived during FDW, and delay time (s). The presence of
pedestrian countdown timers was not found to be a statistically significant variable in the
probability of a violation model because the absolute value of the calculated t-statistics
value was less than the critical value of 1.96.
As expected, the probability of a violation decreased with an increase in conflicting
traffic, and the probability of a violation increased with the presence of another
pedestrian and an arrival during DW or FDW. It is surprising that the probability of a
violation decreases with an increase in delay time because pedestrians would seemingly
get impatient and perform risky behavior when subjected to long delay times. It is
possible that the reason that delay time decreases the probability of a violation is that
37
pedestrians who had the longest delay time waited for the WALK signal and were
compliant. Frequently, pedestrians who arrived during the DW and were non-compliant
just looked to see if there was any conflicting traffic before departing, and the delay time
was minimal.
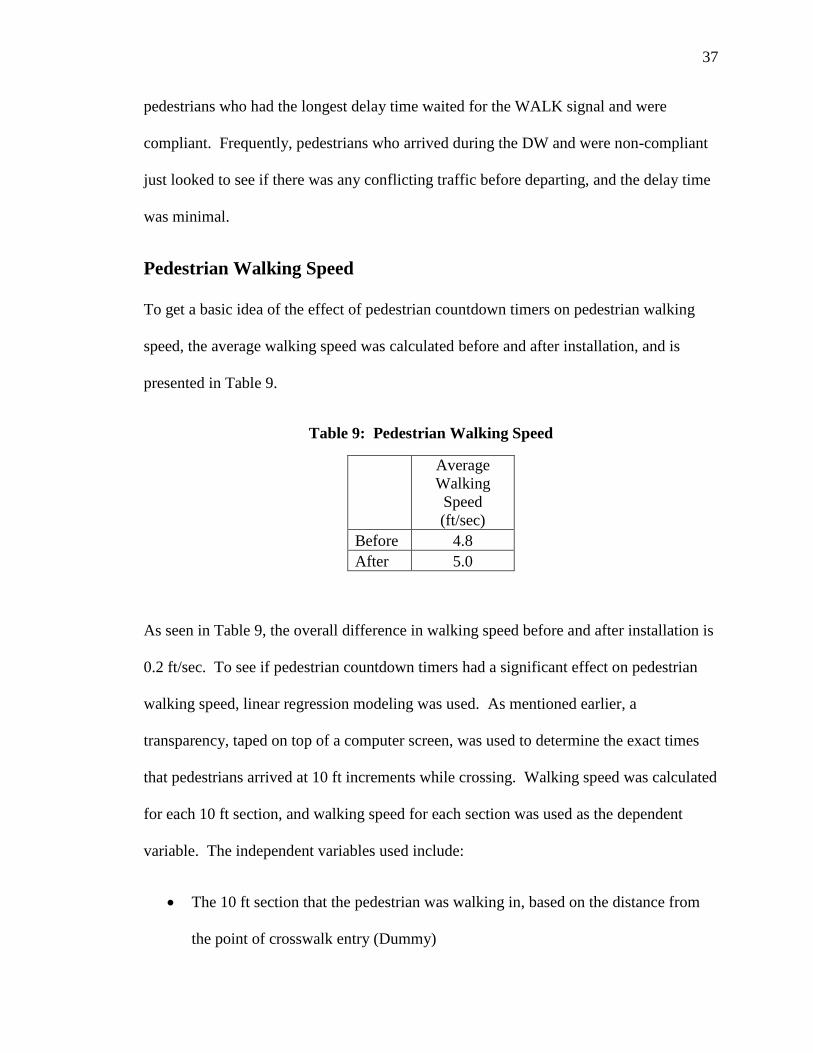
Pedestrian Walking Speed
To get a basic idea of the effect of pedestrian countdown timers on pedestrian walking
speed, the average walking speed was calculated before and after installation, and is
presented in Table 9.
Table 9: Pedestrian Walking Speed
Average
Walking
Speed
(ft/sec)
Before 4.8
After 5.0
As seen in Table 9, the overall difference in walking speed before and after installation is
0.2 ft/sec. To see if pedestrian countdown timers had a significant effect on pedestrian
walking speed, linear regression modeling was used. As mentioned earlier, a
transparency, taped on top of a computer screen, was used to determine the exact times
that pedestrians arrived at 10 ft increments while crossing. Walking speed was calculated
for each 10 ft section, and walking speed for each section was used as the dependent
variable. The independent variables used include:
The 10 ft section that the pedestrian was walking in, based on the distance from
the point of crosswalk entry (Dummy)

38
Five minute conflicting traffic (Integer)
Day of week (Dummy)
Time of day (Dummy)
Pedestrian compliance (Dummy)
Presence of a car stopped on G St (Dummy)
Presence of another pedestrian inside the crosswalk (Dummy)
Phase that the pedestrian arrived during: WALK, FDW, or DW (Dummy)
Delay time, sec, measured from time of arrival to time of departure (Decimal)
Direction of travel (Dummy)
Presence of pedestrian countdown timers (Dummy)
A complete list of all variables is listed in Appendix A. Linear regression was used to
model the pedestrian walking speed. The simple linear regression model is as follows
(20):
innjjiXXXXY ......
22110, where:
Yi = Estimated value of dependent variable during observation i,
β = Estimated coefficient of independent variable,
n = number of independent variables,
X = Value of independent variable j during observation i, and

39
ε = Disturbance term, normally distributed with mean = 0 and variance = σ2
Ordinary least squares regression was used to minimize the disturbance. Table 10
lists the results of the pedestrian walking speed model.
Table 10: Pedestrian Walking Speed Model
Linear Regression
Dependent Variable: Pedestrian Walking Speed, ft/sec
Number of observations: 5816
Unrestricted Log Likelihood = -1743.324
Restricted Log Likelihood = -1792.191
AIC = -0.425
Mean = 4.856
Std dev =
0.830
R2
= 0.065
Variable Name (Type)
Estimated
Coefficient t-stats
Constant 4.814 152.608
Presence of car stopped on G St (Dummy) 0.152 2.596
Presence of another pedestrian (Dummy) -0.163 -3.530
Arrives on FDW and doesn’t stop (Dummy) 0.269 4.021
Delay time (Decimal) -0.019 -4.751
Presence of pedestrian countdown timer
(Dummy) 0.177 3.775
This model shows many statistically significant variables at 95% confidence, including
the presence of a car stopped on G St, presence of another pedestrian inside of the
crosswalk, arrives on FDW and doesn’t stop, delay time (s), and the presence of
pedestrian countdown timers. Because the estimated coefficient of the presence of
pedestrian countdown timers variable is positive in the model, pedestrian countdown
timers statistically significantly increased pedestrian walking speed. The estimated
coefficient is approximately 0.2, meaning that pedestrians walked approximately 0.2
ft/sec faster after pedestrian countdown timers were installed, which does not have much
40
of a physical meaning. None of the 10 ft sections were statistically significant, indicating
that the pedestrians had a consistent walking speed throughout their trip.
The results of the pedestrian walking speed model indicate that when a car is stopped on
G St, pedestrian walking speed is significantly higher than when there are no cars stopped
on G St. In addition, pedestrian walking speed decreases when there are multiple
pedestrians in the crosswalk. Interestingly, the model shows that pedestrian walking
speed decreases when delay time increases. This could be due to the time it takes for
pedestrians to get up to their normal walking speed. For the pedestrians who experienced
some delay time, it was common for them to stop and wait right on the curb. This led to
a slight acceleration time in which they started to cross at a slower speed but then reached
their normal walking speed after a few steps. However, since there were not many
pedestrians who experienced delay time, the first 10 ft section did not have a significantly
slower walking speed than any other 10 ft section.
Driver Data Analysis Results
Probability of Stopping
When a driver approaches an intersection, the driver is forced to make a decision on
whether to go through the intersection, or come to a stop, at the onset of yellow. A probit
model, a type of binary discrete choice statistical model, can model the driver’s decision.
According to Sheffi & Mahmassani (18), the sample size required for estimating dilemma
zone boundaries is significantly reduced when using a probit model to model the driver’s
decision. The result of the probit model is a probability of stopping curve that gives the
probability of a driver choosing to stop at the intersection given the vehicle’s distance
41
from the stop bar at the onset of yellow at a certain speed. Using the probability of
stopping curve, dilemma zone boundaries can be determined. According to Zegeer (21),
the dilemma zone is a range of distances from the stop bar, beginning at a distance where
10% of vehicles stop, and ending at a distance where 90% of vehicles stop, where drivers
are forced to make a decision to either stop or go through the intersection at the onset of
yellow. The length of the dilemma zone is calculated as the difference between the
dilemma zone boundaries.
Following the methodology developed by Sheffi & Mahmassani (18), Sharma (16), and
Burnett (3), a probit model was developed to determine the probability of stopping of a
single vehicle approaching an intersection. The dependent variable was a dummy
variable corresponding to either the vehicle proceeding through the intersection (0) or the
vehicle coming to a stop (1). Example independent variables included in the model were:
High temperature, °F (Integer)
Day of week (Dummy)
Time of day (Dummy)
Time to stop bar assuming the vehicle traveled at a constant speed equal to the
speed it was going at the onset of yellow (Decimal)
Amount of acceleration required for the vehicle to proceed through the
intersection during the yellow phase (Decimal)
Amount of deceleration required for the vehicle to stop at the stop bar (Decimal)
42
15 min. volume of traffic on 17th
St (Integer)
Presence of a pedestrian waiting to cross 17th
St (Dummy)
Lane (Dummy)
Presence of pedestrian countdown timers (Dummy)
A complete list of variables is listed in Appendix A. Three separate probit models were
developed, one before installation, one after installation, and one with all data combined
from before and after installation of pedestrian countdown timers.
S 17th St and G St
The probit models for probability of stopping at S 17th
St & G St are presented in Tables
11 and 12.
Table 11: Probit Model Before Installation of PCT at S 17th
St and G St
Probability of Stopping Model
Dependent Variable: Vehicles Goes or Stops (Goes = 0 / Stops = 1)
Number of Observations: 429
Unrestricted Log Likelihood: -98.183 Restricted Log Likelihood: -292.107
Prob(X2)>value = 0.000 AIC value: 0.467 McFadden R
2 = 0.664
Variable Name (Type)
Estimated
Coefficient T-stats
Constant 0.55 4.343
Required Acceleration
(Decimal) 0.108 10.496

43
Table 12: Probit Model After Installation of PCT at S 17th
St and G St
Probability of Stopping Model
Dependent Variable: Vehicles Goes or Stops (Goes = 0 / Stops = 1)
Number of Observations: 422
Unrestricted Log Likelihood: -62.399 Restricted Log Likelihood: -292.489
Prob(X2)>value = 0.000 AIC value: 0.305 McFadden R
2 = 0.787
Variable Name (Type)
Estimated
Coefficient T-stats
Constant 0.7 4.676
Required Acceleration
(Decimal) 0.132 9.309
Developed by using the probit models presented in Tables 11 and 12, Figure 18 shows
the probability of stopping curves before and after installation of pedestrian countdown
timers at S 17th
St and G St.
Figure 18: Probability of Stopping at S 17th
St and G St
It can be seen in Figure 18 that the probability of stopping curve became steeper after
installation of pedestrian countdown timers. The steeper curve results in shifted dilemma
0
0.2
0.4
0.6
0.8
1
0 50 100 150 200 250 300 350 400
Pro
bab
ilit
y o
f S
top
pin
g
Distance from Stop Bar (ft)
After
Before
44
zone boundaries. Table 13 shows the dilemma zone boundaries before and after
installation of pedestrian countdown timers at S 17th
St and G St.
Table 13: Dilemma Zone Boundaries at S 17th
St and G St
Distance from Stop Bar (ft)
Begin Dilemma
Zone
End Dilemma
Zone
Length of
Dilemma Zone
(ft)
Before 104 211 107
After 113 200 87
The dilemma zone is shortened after installation of pedestrian countdown timers at S 17th
St and G St by 20 ft. This improves safety because there is less of an area where vehicles
could be caught in the dilemma zone. In addition, at S 17th
St & G St, the number of red
light runners reduced after installation of pedestrian countdown timers. Before
installation, 10 vehicles out of 429 vehicles (2.3%) ran the red light. After installation,
only 3 vehicles out of 422 vehicles (0.7%) ran the red light. This also leads to an
improvement in safety. A third probit model was developed that contained all data, to
determine if the presence of pedestrian countdown timers significantly affects the
probability of stopping curve. Table 14 lists the results of the combined model.
45
Table 14: Probit Model of Combined Data at S 17th
St and G St
Probability of Stopping Model
Dependent Variable: Vehicles Goes or Stops (Goes = 0 / Stops = 1)
Number of Observations: 851
Unrestricted Log Likelihood: -161.554
Restricted Log Likelihood:
-586.903
Prob(X2)>value = 0.000 AIC value: 0.387 McFadden R
2 = 0.725
Variable Name (Type) Estimated Coefficient T-stats
Constant 0.622 5.143
Required Acceleration (Decimal) 0.118 14.181
Presence of Pedestrian Countdown
Timers (Dummy) -0.004 -0.023
The addition of the pedestrian countdown timers did not statistically significantly affect
the probability of stopping model. The alternate hypothesis, that pedestrian countdown
timers have a significant effect on probability of stopping curve, is rejected. After testing
multiple other models, no other independent variables showed up as significant, therefore
the increased slope in the probability of stopping curves and the shift in dilemma zone
boundaries may be attributed to pedestrian countdown timers, but it is not statistically
significant.
27th
St and Cornhusker Highway
The probit models for probability of stopping at 27th
St and Cornhusker Highway are
presented in Tables 15 and 16.
46
Table 15: Probit Model Before Installation of PCT at 27th
St and Cornhusker
Highway
Probability of Stopping Model
Dependent Variable: Vehicles Goes or Stops (Goes = 0 / Stops = 1)
Number of Observations: 525
Unrestricted Log Likelihood: -150.891 Restricted Log Likelihood: -341.877
Prob(X2)>value = 0.000 AIC value: 0.582 McFadden R
2 = 0.559
Variable Name (Type)
Estimated
Coefficient T-stats
Constant 0.354 3.878
Required Acceleration
(Decimal) 0.100 12.216
Table 16: Probit Model After Installation of PCT at 27th
St and Cornhusker
Highway
Probability of Stopping Model
Dependent Variable: Vehicles Goes or Stops (Goes = 0 / Stops = 1)
Number of Observations: 482
Unrestricted Log Likelihood: -135.999
Restricted Log Likelihood: -
302.721
Prob(X2)>value = 0.000 AIC value: 0.573 McFadden R
2 = 0.551
Variable Name (Type)
Estimated
Coefficient T-stats
Constant 0.315 3.271
Required Acceleration (Decimal) 0.113 11.400
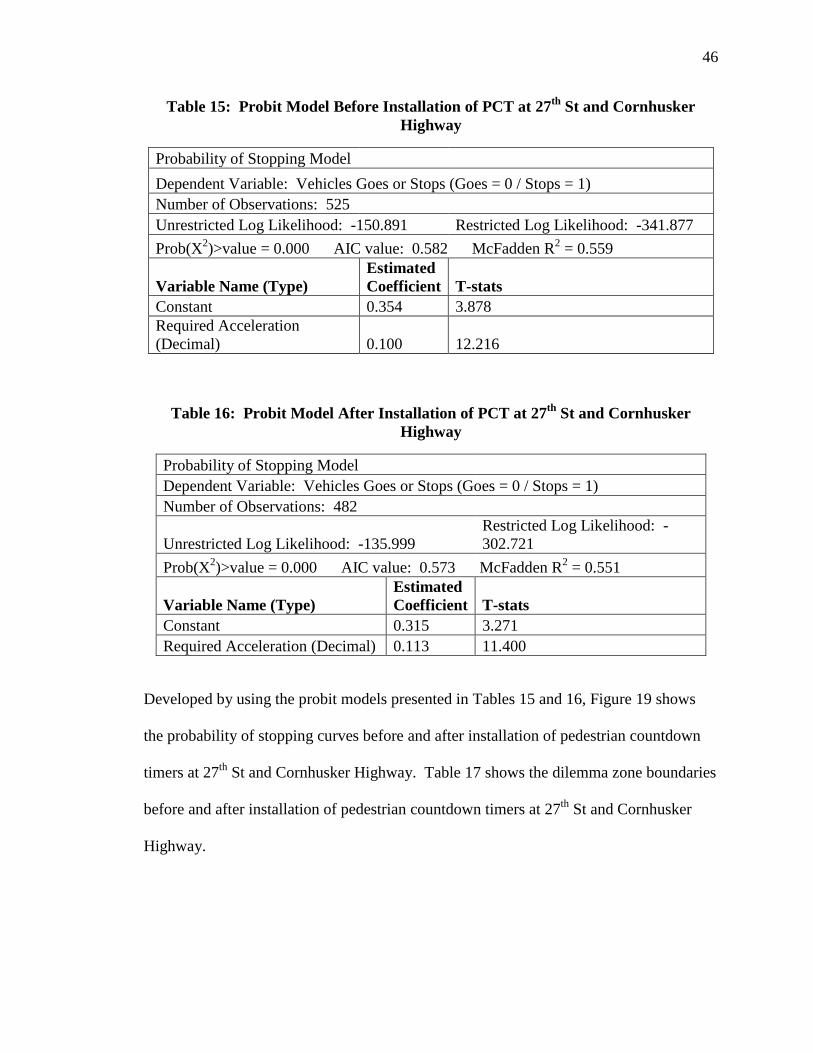
Developed by using the probit models presented in Tables 15 and 16, Figure 19 shows
the probability of stopping curves before and after installation of pedestrian countdown
timers at 27th
St and Cornhusker Highway. Table 17 shows the dilemma zone boundaries
before and after installation of pedestrian countdown timers at 27th
St and Cornhusker
Highway.
47
Figure 19: Probability of Stopping at 27th
St and Cornhusker Highway
Similar to the results found at 17th
St & G St, it can be seen in Figure 19 that the
probability of stopping curve became steeper after installation of pedestrian countdown
timers at 27th
St & Cornhusker Hwy. The steeper curve results in shifted dilemma zone
boundaries. Table 17 shows the dilemma zone boundaries before and after installation of
pedestrian countdown timers at S 17th
St and G St.
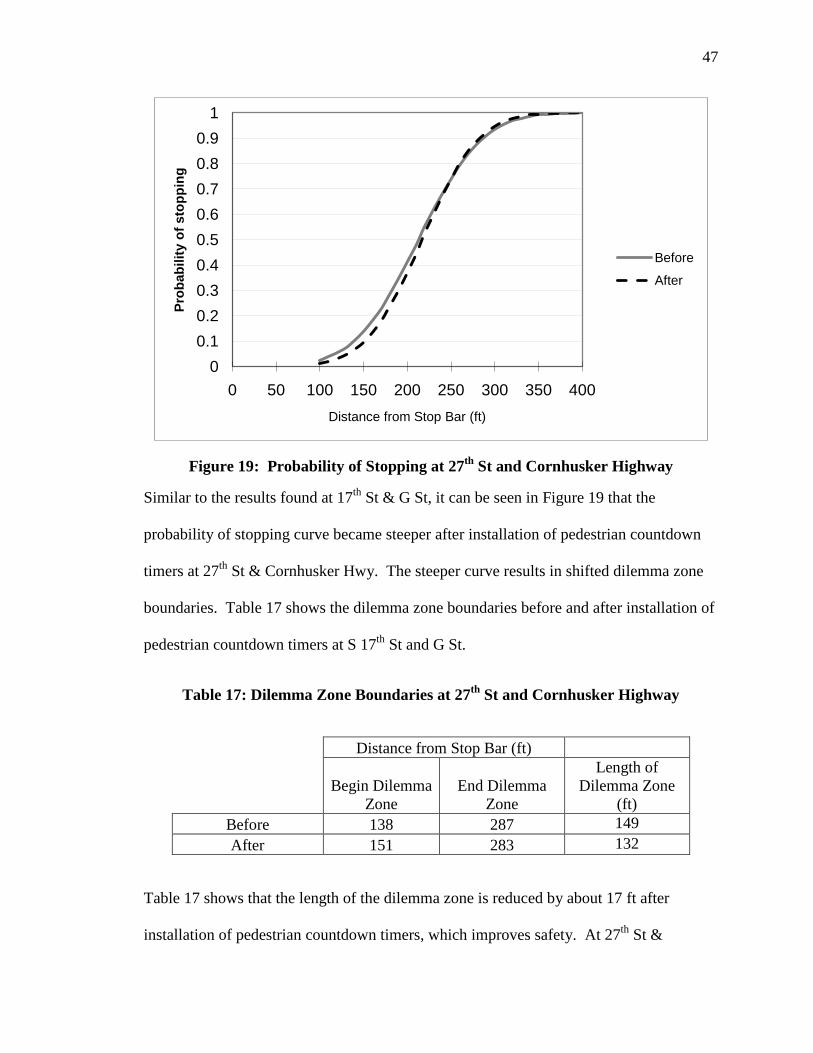
Table 17: Dilemma Zone Boundaries at 27th
St and Cornhusker Highway
Distance from Stop Bar (ft)
Begin Dilemma
Zone
End Dilemma
Zone
Length of
Dilemma Zone
(ft)
Before 138 287 149
After 151 283 132
Table 17 shows that the length of the dilemma zone is reduced by about 17 ft after
installation of pedestrian countdown timers, which improves safety. At 27th
St &
0
0.1
0.2
0.3
0.4
0.5
0.6
0.7
0.8
0.9
1
0 50 100 150 200 250 300 350 400
Pro
bab
ilit
y o
f sto
pp
ing
Distance from Stop Bar (ft)
Before
After
48
Cornhusker Hwy, approximately the same amount of vehicles ran the red light before and
after installation. Before installation, 7 vehicles out of 525 vehicles (1.3%) ran the red
light, and after installation, 8 vehicles out of 482 vehicles (1.6%) ran the red light. To
test if pedestrian countdown timers have a significant effect on the probability of
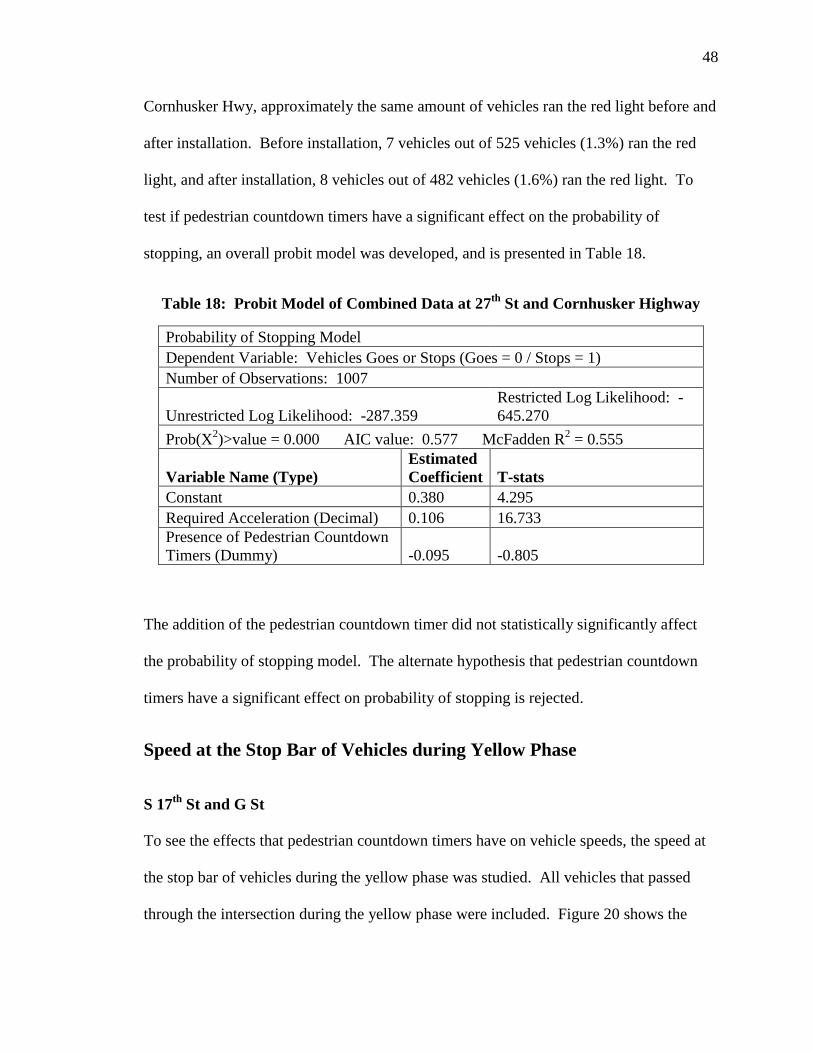
stopping, an overall probit model was developed, and is presented in Table 18.
Table 18: Probit Model of Combined Data at 27th
St and Cornhusker Highway
Probability of Stopping Model
Dependent Variable: Vehicles Goes or Stops (Goes = 0 / Stops = 1)
Number of Observations: 1007
Unrestricted Log Likelihood: -287.359
Restricted Log Likelihood: -
645.270
Prob(X2)>value = 0.000 AIC value: 0.577 McFadden R
2 = 0.555
Variable Name (Type)
Estimated
Coefficient T-stats
Constant 0.380 4.295
Required Acceleration (Decimal) 0.106 16.733
Presence of Pedestrian Countdown
Timers (Dummy) -0.095 -0.805
The addition of the pedestrian countdown timer did not statistically significantly affect
the probability of stopping model. The alternate hypothesis that pedestrian countdown
timers have a significant effect on probability of stopping is rejected.
Speed at the Stop Bar of Vehicles during Yellow Phase
S 17th
St and G St
To see the effects that pedestrian countdown timers have on vehicle speeds, the speed at
the stop bar of vehicles during the yellow phase was studied. All vehicles that passed
through the intersection during the yellow phase were included. Figure 20 shows the
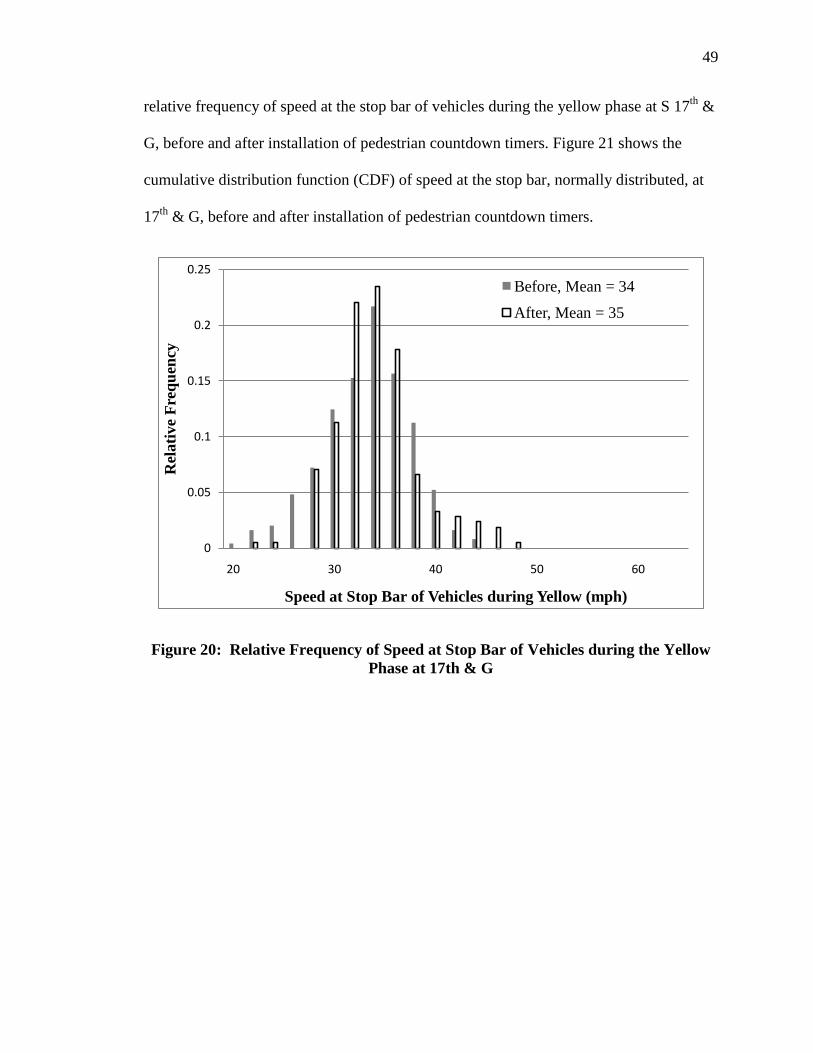
49
relative frequency of speed at the stop bar of vehicles during the yellow phase at S 17th
&
G, before and after installation of pedestrian countdown timers. Figure 21 shows the
cumulative distribution function (CDF) of speed at the stop bar, normally distributed, at
17th
& G, before and after installation of pedestrian countdown timers.
Figure 20: Relative Frequency of Speed at Stop Bar of Vehicles during the Yellow
Phase at 17th & G
0
0.05
0.1
0.15
0.2
0.25
20 30 40 50 60
Rel
ati
ve
Fre
qu
ency
Speed at Stop Bar of Vehicles during Yellow (mph)
Before, Mean = 34
After, Mean = 35
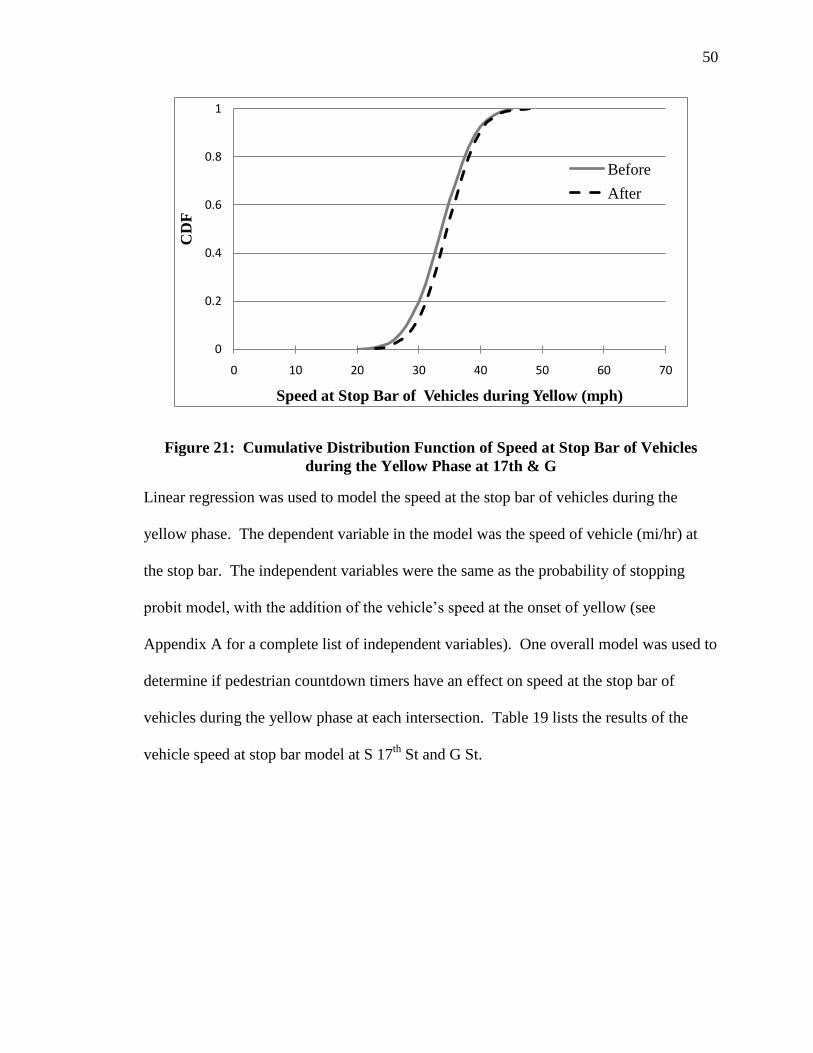
50
Figure 21: Cumulative Distribution Function of Speed at Stop Bar of Vehicles
during the Yellow Phase at 17th & G
Linear regression was used to model the speed at the stop bar of vehicles during the
yellow phase. The dependent variable in the model was the speed of vehicle (mi/hr) at
the stop bar. The independent variables were the same as the probability of stopping
probit model, with the addition of the vehicle’s speed at the onset of yellow (see
Appendix A for a complete list of independent variables). One overall model was used to
determine if pedestrian countdown timers have an effect on speed at the stop bar of
vehicles during the yellow phase at each intersection. Table 19 lists the results of the
vehicle speed at stop bar model at S 17th
St and G St.
0
0.2
0.4
0.6
0.8
1
0 10 20 30 40 50 60 70
CD
F
Speed at Stop Bar of Vehicles during Yellow (mph)
Before
After
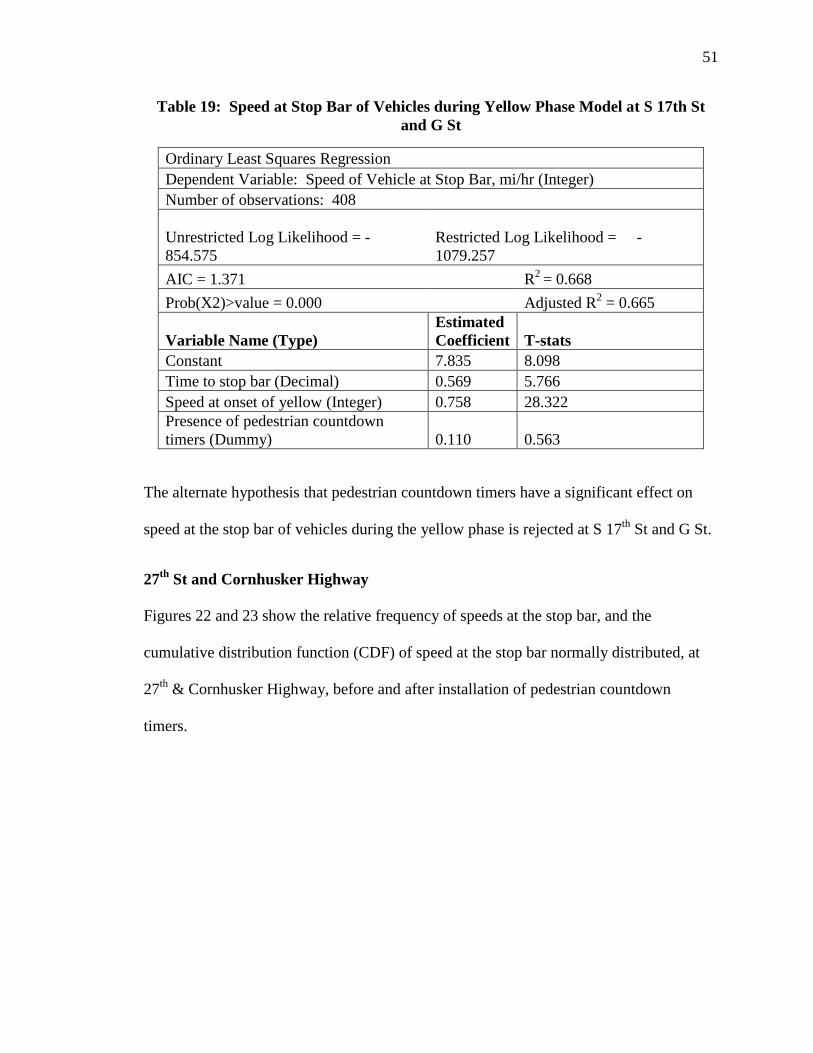
51
Table 19: Speed at Stop Bar of Vehicles during Yellow Phase Model at S 17th St
and G St
Ordinary Least Squares Regression
Dependent Variable: Speed of Vehicle at Stop Bar, mi/hr (Integer)
Number of observations: 408
Unrestricted Log Likelihood = -
854.575
Restricted Log Likelihood = -
1079.257
AIC = 1.371 R2
= 0.668
Prob(X2)>value = 0.000 Adjusted R2 = 0.665
Variable Name (Type)
Estimated
Coefficient T-stats
Constant 7.835 8.098
Time to stop bar (Decimal) 0.569 5.766
Speed at onset of yellow (Integer) 0.758 28.322
Presence of pedestrian countdown
timers (Dummy) 0.110 0.563
The alternate hypothesis that pedestrian countdown timers have a significant effect on
speed at the stop bar of vehicles during the yellow phase is rejected at S 17th
St and G St.
27th
St and Cornhusker Highway
Figures 22 and 23 show the relative frequency of speeds at the stop bar, and the
cumulative distribution function (CDF) of speed at the stop bar normally distributed, at
27th
& Cornhusker Highway, before and after installation of pedestrian countdown
timers.
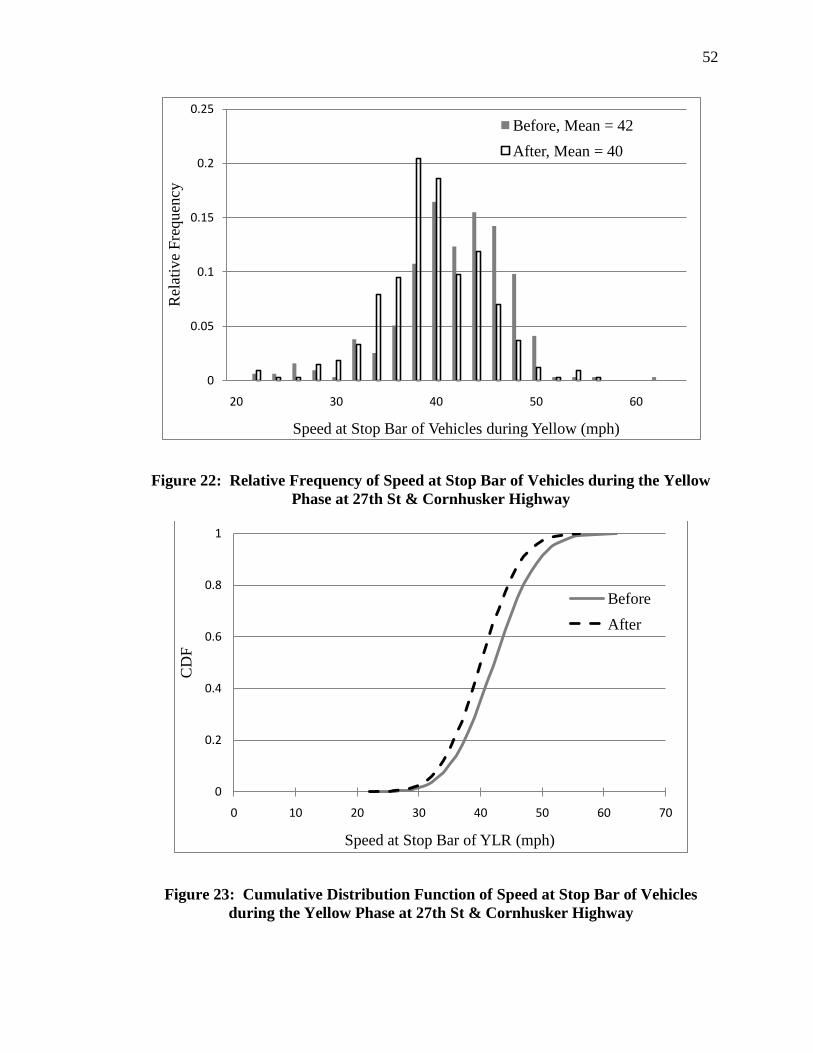
52
Figure 22: Relative Frequency of Speed at Stop Bar of Vehicles during the Yellow
Phase at 27th St & Cornhusker Highway
Figure 23: Cumulative Distribution Function of Speed at Stop Bar of Vehicles
during the Yellow Phase at 27th St & Cornhusker Highway
0
0.05
0.1
0.15
0.2
0.25
20 30 40 50 60
Rel
ativ
e F
requen
cy
Speed at Stop Bar of Vehicles during Yellow (mph)
Before, Mean = 42
After, Mean = 40
0
0.2
0.4
0.6
0.8
1
0 10 20 30 40 50 60 70
CD
F
Speed at Stop Bar of YLR (mph)
Before
After
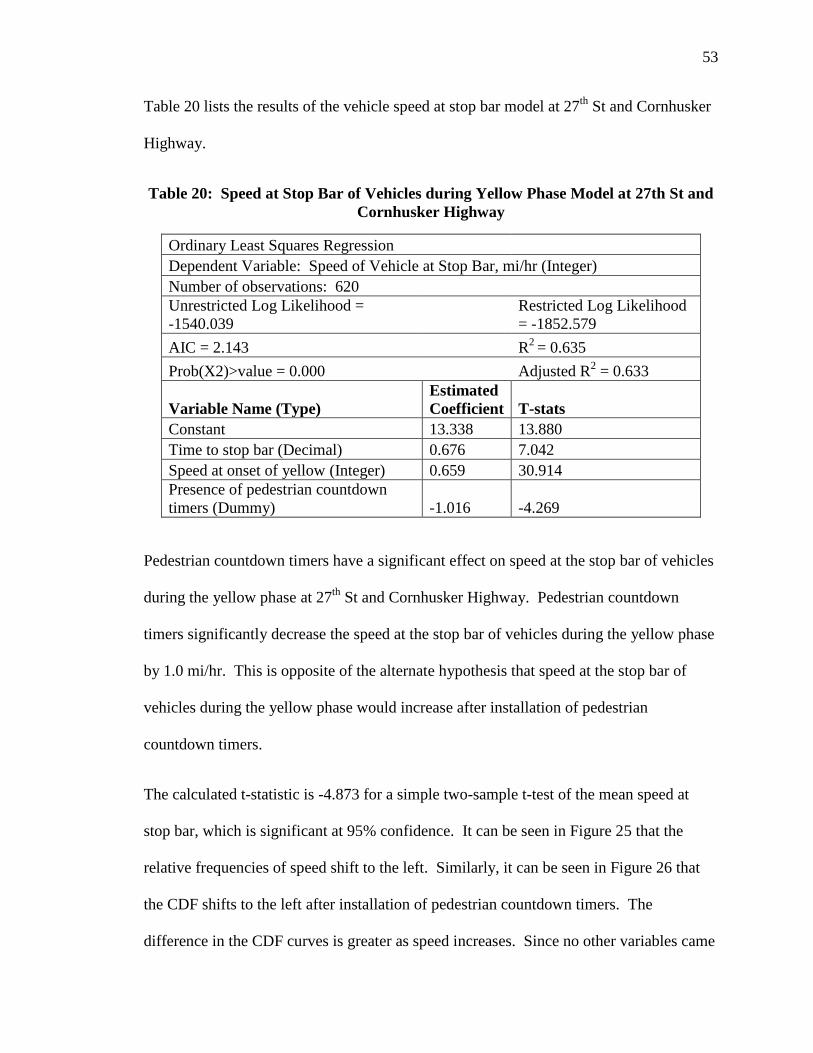
53
Table 20 lists the results of the vehicle speed at stop bar model at 27th
St and Cornhusker
Highway.
Table 20: Speed at Stop Bar of Vehicles during Yellow Phase Model at 27th St and
Cornhusker Highway
Ordinary Least Squares Regression
Dependent Variable: Speed of Vehicle at Stop Bar, mi/hr (Integer)
Number of observations: 620
Unrestricted Log Likelihood =
-1540.039
Restricted Log Likelihood
= -1852.579
AIC = 2.143 R2
= 0.635
Prob(X2)>value = 0.000 Adjusted R2 = 0.633
Variable Name (Type)
Estimated
Coefficient T-stats
Constant 13.338 13.880
Time to stop bar (Decimal) 0.676 7.042
Speed at onset of yellow (Integer) 0.659 30.914
Presence of pedestrian countdown
timers (Dummy) -1.016 -4.269
Pedestrian countdown timers have a significant effect on speed at the stop bar of vehicles
during the yellow phase at 27th
St and Cornhusker Highway. Pedestrian countdown
timers significantly decrease the speed at the stop bar of vehicles during the yellow phase
by 1.0 mi/hr. This is opposite of the alternate hypothesis that speed at the stop bar of
vehicles during the yellow phase would increase after installation of pedestrian
countdown timers.
The calculated t-statistic is -4.873 for a simple two-sample t-test of the mean speed at
stop bar, which is significant at 95% confidence. It can be seen in Figure 25 that the
relative frequencies of speed shift to the left. Similarly, it can be seen in Figure 26 that
the CDF shifts to the left after installation of pedestrian countdown timers. The
difference in the CDF curves is greater as speed increases. Since no other variables came
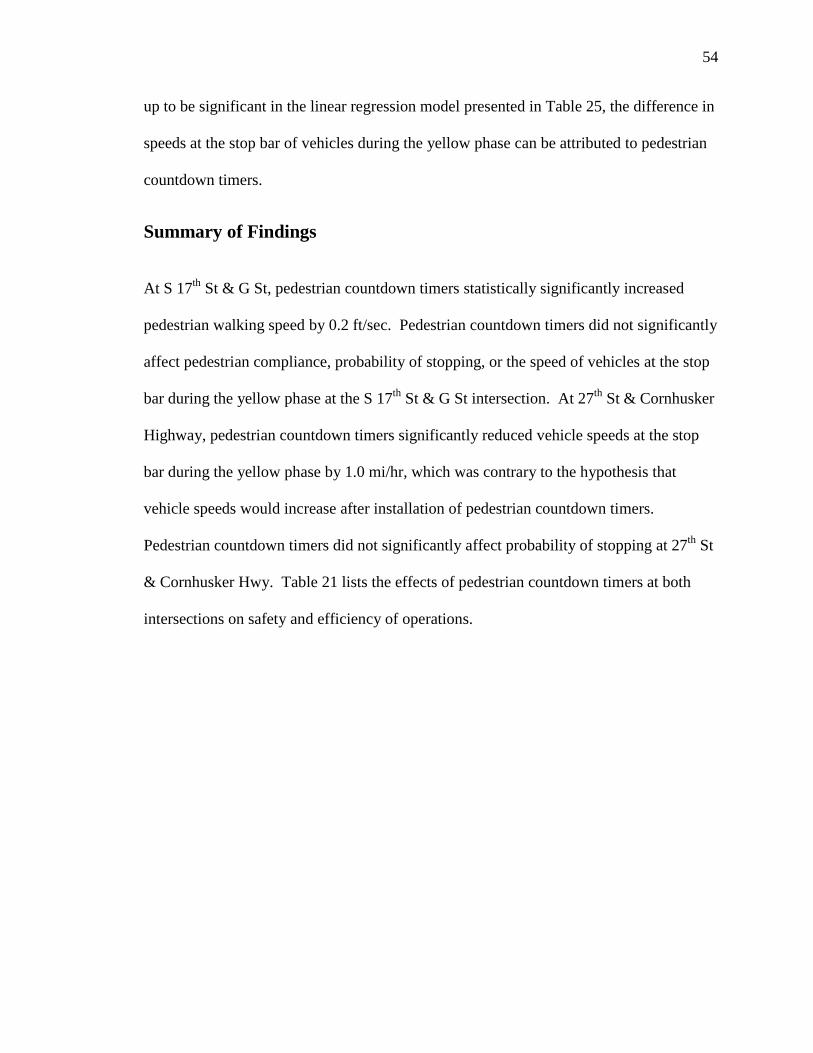
54
up to be significant in the linear regression model presented in Table 25, the difference in
speeds at the stop bar of vehicles during the yellow phase can be attributed to pedestrian
countdown timers.
Summary of Findings
At S 17th
St & G St, pedestrian countdown timers statistically significantly increased
pedestrian walking speed by 0.2 ft/sec. Pedestrian countdown timers did not significantly
affect pedestrian compliance, probability of stopping, or the speed of vehicles at the stop
bar during the yellow phase at the S 17th
St & G St intersection. At 27th
St & Cornhusker
Highway, pedestrian countdown timers significantly reduced vehicle speeds at the stop
bar during the yellow phase by 1.0 mi/hr, which was contrary to the hypothesis that
vehicle speeds would increase after installation of pedestrian countdown timers.
Pedestrian countdown timers did not significantly affect probability of stopping at 27th
St
& Cornhusker Hwy. Table 21 lists the effects of pedestrian countdown timers at both
intersections on safety and efficiency of operations.
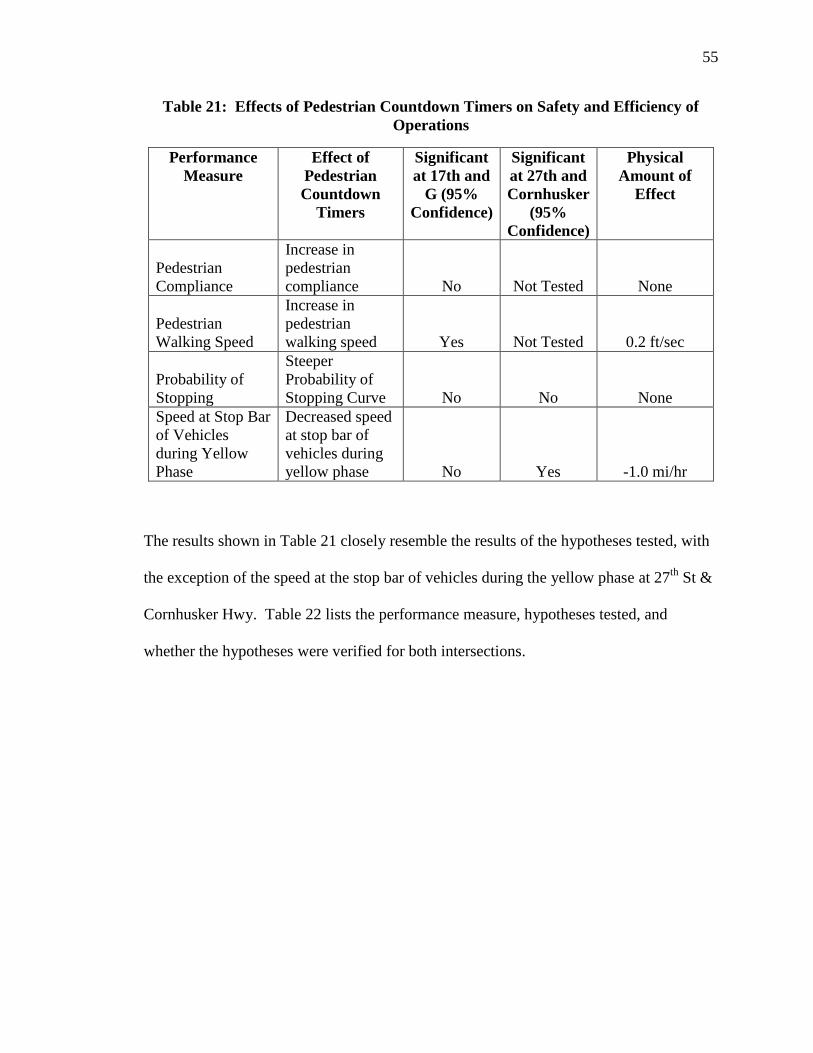
55
Table 21: Effects of Pedestrian Countdown Timers on Safety and Efficiency of
Operations
Performance
Measure
Effect of
Pedestrian
Countdown
Timers
Significant
at 17th and
G (95%
Confidence)
Significant
at 27th and
Cornhusker
(95%
Confidence)
Physical
Amount of
Effect
Pedestrian
Compliance
Increase in
pedestrian
compliance No Not Tested None
Pedestrian
Walking Speed
Increase in
pedestrian
walking speed Yes Not Tested 0.2 ft/sec
Probability of
Stopping
Steeper
Probability of
Stopping Curve No No None
Speed at Stop Bar
of Vehicles
during Yellow
Phase
Decreased speed
at stop bar of
vehicles during
yellow phase No Yes -1.0 mi/hr
The results shown in Table 21 closely resemble the results of the hypotheses tested, with
the exception of the speed at the stop bar of vehicles during the yellow phase at 27th
St &
Cornhusker Hwy. Table 22 lists the performance measure, hypotheses tested, and
whether the hypotheses were verified for both intersections.
56
Table 22: Hypothesis Verification
Performance Measure Hypothesis (After
Installation of PCT)
Hypothesis
Verified at
17th and G
Hypothesis
Verified at
27th and
Cornhusker
Pedestrian Compliance
Pedestrian compliance
will increase No Not Tested
Pedestrian Walking
Speed
Pedestrian walking
speed will increase Yes Not Tested
Probability of Stopping
Probability of stopping
curve will become
steeper No No
Speed at Stop Bar of
Vehicles during Yellow
Phase
Speed at the stop bar
will increase No No
In Table 22, the hypothesis was verified if the effect of pedestrian countdown timers was
statistically significant and was the same as the hypothesis tested. The hypothesis was
not verified if the effect was not statistically significant. The only result that was
opposite of the hypothesis was the speed at the stop bar of vehicles during the yellow
phase at 27th
St & Cornhusker Hwy. It was hypothesized that speed would increase after
installation of pedestrian countdown timers, which was opposite of the finding that
speeds decreased after installation.
57
Chapter 5 - Conclusions
In this thesis, a case study was performed at two intersections in Lincoln, NE: S 17th
St
& G St and 27th
St & Cornhusker Highway, testing the effects of pedestrian countdown
timers on safety and efficiency of operations. The effects were found using innovative
microscopic analysis, by using statistical modeling tools. The statistical modeling tools
determined the precise effects that pedestrian countdown timers had on safety and
efficiency. The effects of pedestrian countdown timers on safety are a slightly, but not
statistically significant, steeper probability of stopping curve, which improves safety.
The effects of pedestrian countdown timers on efficiency of operations are, from a
pedestrian analysis perspective, a significant increase in pedestrian walking speed, and
from a driver analysis perspective, a significant decrease of speed at the stop bar of
vehicles during the yellow phase. The increase in pedestrian walking speed is a desirable
effect because it increases efficiency of pedestrians. The reduction in speed at the stop
bar of vehicles during the yellow phase decreases efficiency of operations. Overall, the
conclusions to this study are as follows: pedestrian countdown timers increase safety,
increase pedestrian efficiency, and decrease vehicle efficiency of operations at signalized
intersections.
The effects that pedestrian countdown timers had on safety and efficiency of operations
were different at the two intersections studied, which concurs with past research that
found contradictory results at different intersections within the same city. Therefore,
pedestrian countdown timers were found to have site-specific effects on safety and
efficiency. Further research is needed to determine the causes of the site-specific effects.
If the causes of the site-specific effects can be determined, recommendations can be made

58
about where it may be beneficial to install pedestrian countdown timers, and where
pedestrian countdown timers may not benefit the intersection. However, it may still be
necessary to calculate the site-specific benefit to cost ratio before recommending
installation of pedestrian countdown timers.

59
References
1. Arhin, S. A., & Noel, E. C. (2007). Impact of countdown pedestrian signals on
pedestrian behavior and perception of intersection safety in the District of
Columbia. Intelligent Transportation Systems Conference, 337-342.
2. Botha, J., Zabyshny, A., Day, J., Northouse, R., Rodriguez, J., & Nix, T. (2002,
May). Pedestrian Countdown Signals: An Experimental Evaluation. San Jose
State University & City of San Jose Department of Transportation Final Report to
the California Traffic Control Devices Committee.
3. Burnett, N. (2011). Effect of Information on Driver’s Risk at the Onset of Yellow
at High-Speed Intersections (Master’s Thesis, University of Nebraska-Lincoln,
2011).
4. Eccles, K. A., Tao, R., & Mangum, B. C. (2003). Evaluation of Pedestrian
Countdown Signals in Montgomery County, Maryland. Transportation Research
Board CD-ROM
5. Hauer, E. (1997). Observational Before‐After Studies in Road Safety. Terrytown,
New York: Pergamon Press.
6. He, Y., Zhang, J., Sun, X., & Wei, R. (2009). Investigating Road Users’
Preference on Signal Countdown Devices at Intersections in Beijing.
Transportation Research Board CD-ROM
7. Huang, H., & Zegeer, C. (2000). The effects of pedestrian countdown signals in
Lake Buena Vista. Florida Department of Transportation.
8. Huey, S. B., & Ragland, D. (2007). Changes in driver behavior resulting from
pedestrian countdown signals. Transportation Research Board CD-ROM
60
9. Kim, K. W., Kim, Y., & Seo, H. Y. (2002). An evaluation of pedestrian
countdown signals. KSCE Journal of Civil Engineering, 6(4), 533-537.
10. Limanond, T., Chookerd, S., & Roubtonglang, N. (2009). Effects of countdown
timers on queue discharge characteristics of through movement at a signalized
intersection. Transportation Research Part C, 17, 662-671.
11. Ma, W., Wu, Z., & Yang, X. (2008). Empirical Analysis of Pedestrian
Countdown Signals in Shanghai: A Case Study. Transportation Research Board
CD-ROM.
12. Markowitz, F., Sciortino, S., Fleck, J. L., & Yee, B. M. (2006). Pedestrian
countdown signals: Experience with an extensive pilot installation. ITE Journal,
76(1), 43-48.
13. Perkins, S., & Harris, J. (1968). Traffic conflict characteristics - accident potential
at intersections. Highway Research Record, 225, 35-43.
14. Schattler, K., Wakim, J., Datta, T., & McAvoy, D. (2007). Evaluation of
pedestrian and driver behaviors at countdown pedestrian signals in Peoria,
Illinois. Transportation Research Record, 2002(98), 106.
15. Schrock, S. D., & Bundy, B. (2008). Pedestrian Countdown Timers: Do Drivers
Use Them to Increase Safety or Increase Risk Taking?. Transportation Research
Board CD-ROM
16. Sharma, A. (2008). Integrated behavioral and economic framework for improving
dilemma zone protection systems. Purdue University, West Lafayette, IN.
61
17. Sharma, A., Vanajakshi, L., & Rao, N. (2009). Effect of phase countdown timers
on queue discharge characteristics under heterogeneous traffic conditions.
Transportation Research Record, (Accepted for Publication 2009)
18. Sheffi, Y., and M. Mahmassani. (1981). A Model of Driver Behavior at High
Speed Signalized Intersections, Transportation Science, Vol. 15, pp. 51-61.
19. Washburn, S., Leistner, D., & Ko, B. (2007). An evaluation of the effectiveness of
pedestrian countdown signals. In K. G. Goulias (Ed.), Transport science and
technology (1st ed., pp. 311-326). Oxford, UK: Elsevier.
20. Washington, S., Karlaftis, M., & Mannering, F. (2003). Statistical and
Econometric Methods for Transportation Data Analysis. Boca Raton, FL:
Chapman & Hall/CRC.
21. Zegeer, C. (1977). Effectiveness of green-extension systems at high-speed
intersections. Research Report 472, Bureau of Highways, Kentucky Department
of Transportation, Lexington, KY.
22. Greene, W. (2007). NLOGIT 4.0: User’s Guide. Econometric Software, Inc.
Plainview, NY.
23. Akaike, Hirotugu (1974). A new look at the statistical model identification.
IEEE Transactions on Automatic Control, 19(6), 716-723.
24. Nambisan, S., & Karkee, G. (2010). Do pedestrian countdown signals influence
vehicle speeds? Transportation Research Record, 2149. 70-76.
25. Sharma, A., Bullock, D., & Peeta, S. (2011). Estimating dilemma zone hazard
function at high speed isolated intersection. Transportation Research Part C,
19(3). 400-412

62
Appendix A – Variables Used in Statistical Models
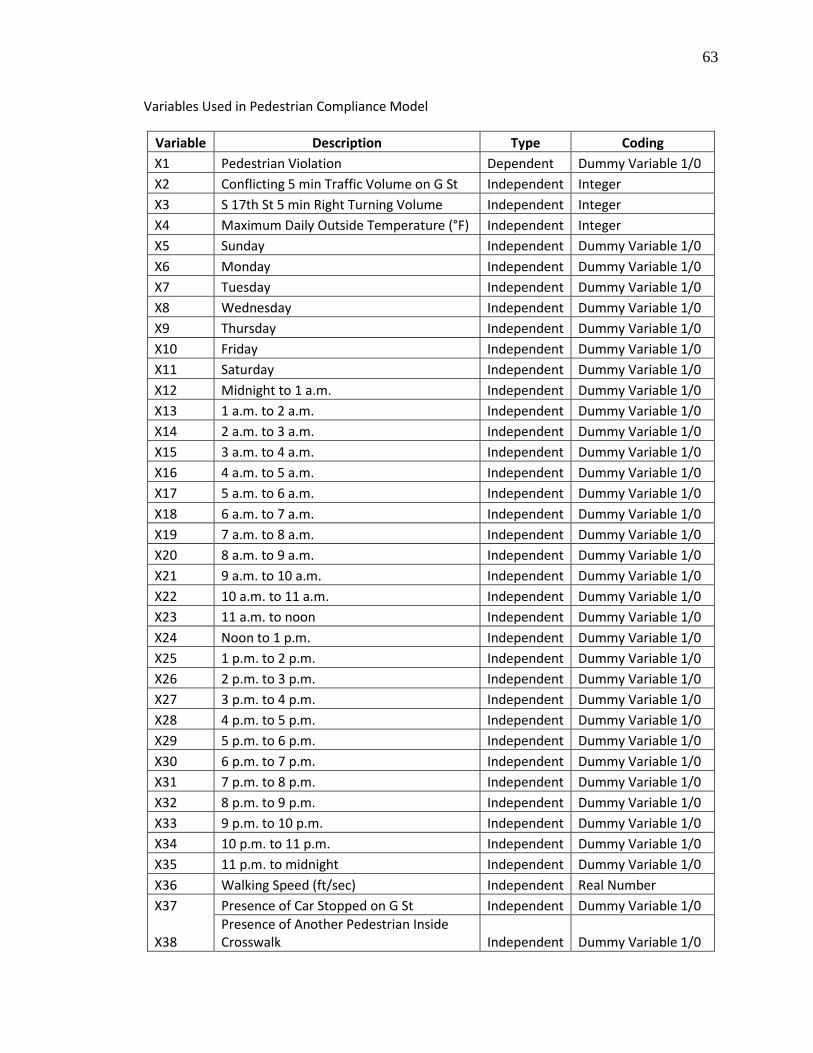
63
Variables Used in Pedestrian Compliance Model
Variable Description Type Coding
X1 Pedestrian Violation Dependent Dummy Variable 1/0
X2 Conflicting 5 min Traffic Volume on G St Independent Integer
X3 S 17th St 5 min Right Turning Volume Independent Integer
X4 Maximum Daily Outside Temperature (°F) Independent Integer
X5 Sunday Independent Dummy Variable 1/0
X6 Monday Independent Dummy Variable 1/0
X7 Tuesday Independent Dummy Variable 1/0
X8 Wednesday Independent Dummy Variable 1/0
X9 Thursday Independent Dummy Variable 1/0
X10 Friday Independent Dummy Variable 1/0
X11 Saturday Independent Dummy Variable 1/0
X12 Midnight to 1 a.m. Independent Dummy Variable 1/0
X13 1 a.m. to 2 a.m. Independent Dummy Variable 1/0
X14 2 a.m. to 3 a.m. Independent Dummy Variable 1/0
X15 3 a.m. to 4 a.m. Independent Dummy Variable 1/0
X16 4 a.m. to 5 a.m. Independent Dummy Variable 1/0
X17 5 a.m. to 6 a.m. Independent Dummy Variable 1/0
X18 6 a.m. to 7 a.m. Independent Dummy Variable 1/0
X19 7 a.m. to 8 a.m. Independent Dummy Variable 1/0
X20 8 a.m. to 9 a.m. Independent Dummy Variable 1/0
X21 9 a.m. to 10 a.m. Independent Dummy Variable 1/0
X22 10 a.m. to 11 a.m. Independent Dummy Variable 1/0
X23 11 a.m. to noon Independent Dummy Variable 1/0
X24 Noon to 1 p.m. Independent Dummy Variable 1/0
X25 1 p.m. to 2 p.m. Independent Dummy Variable 1/0
X26 2 p.m. to 3 p.m. Independent Dummy Variable 1/0
X27 3 p.m. to 4 p.m. Independent Dummy Variable 1/0
X28 4 p.m. to 5 p.m. Independent Dummy Variable 1/0
X29 5 p.m. to 6 p.m. Independent Dummy Variable 1/0
X30 6 p.m. to 7 p.m. Independent Dummy Variable 1/0
X31 7 p.m. to 8 p.m. Independent Dummy Variable 1/0
X32 8 p.m. to 9 p.m. Independent Dummy Variable 1/0
X33 9 p.m. to 10 p.m. Independent Dummy Variable 1/0
X34 10 p.m. to 11 p.m. Independent Dummy Variable 1/0
X35 11 p.m. to midnight Independent Dummy Variable 1/0
X36 Walking Speed (ft/sec) Independent Real Number
X37 Presence of Car Stopped on G St Independent Dummy Variable 1/0
X38 Presence of Another Pedestrian Inside Crosswalk Independent Dummy Variable 1/0
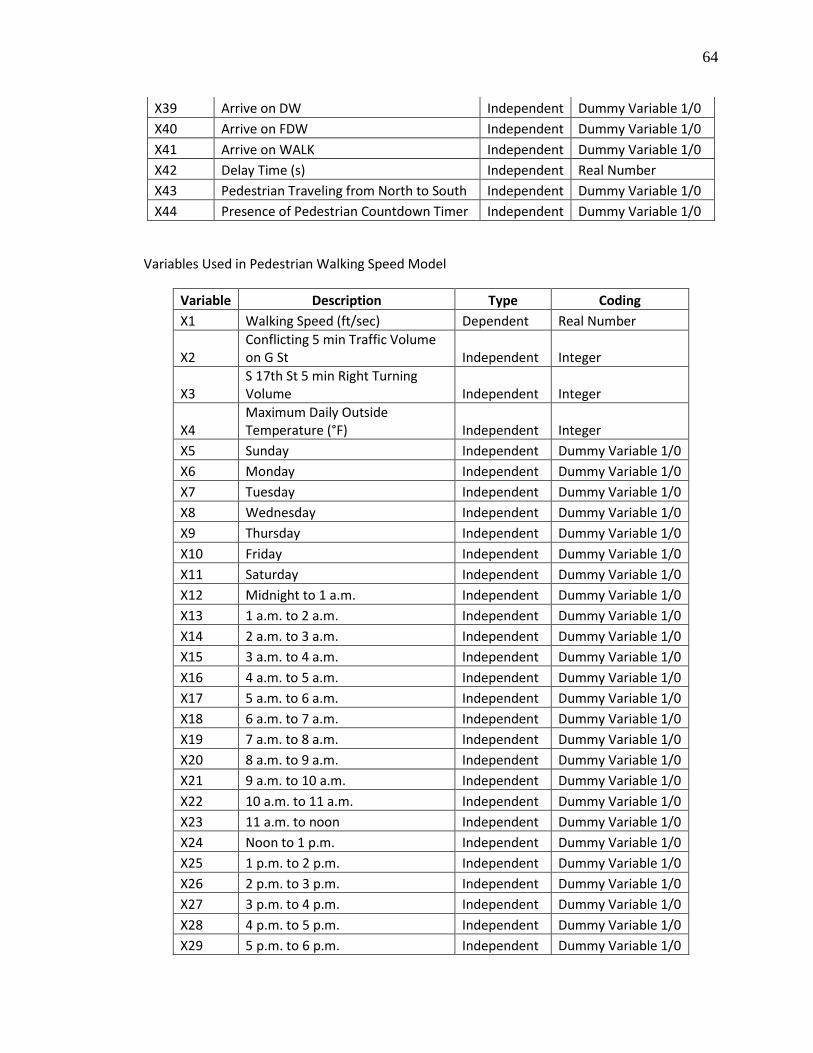
64
X39 Arrive on DW Independent Dummy Variable 1/0
X40 Arrive on FDW Independent Dummy Variable 1/0
X41 Arrive on WALK Independent Dummy Variable 1/0
X42 Delay Time (s) Independent Real Number
X43 Pedestrian Traveling from North to South Independent Dummy Variable 1/0
X44 Presence of Pedestrian Countdown Timer Independent Dummy Variable 1/0
Variables Used in Pedestrian Walking Speed Model
Variable Description Type Coding
X1 Walking Speed (ft/sec) Dependent Real Number
X2 Conflicting 5 min Traffic Volume on G St Independent Integer
X3 S 17th St 5 min Right Turning Volume Independent Integer
X4 Maximum Daily Outside Temperature (°F) Independent Integer
X5 Sunday Independent Dummy Variable 1/0
X6 Monday Independent Dummy Variable 1/0
X7 Tuesday Independent Dummy Variable 1/0
X8 Wednesday Independent Dummy Variable 1/0
X9 Thursday Independent Dummy Variable 1/0
X10 Friday Independent Dummy Variable 1/0
X11 Saturday Independent Dummy Variable 1/0
X12 Midnight to 1 a.m. Independent Dummy Variable 1/0
X13 1 a.m. to 2 a.m. Independent Dummy Variable 1/0
X14 2 a.m. to 3 a.m. Independent Dummy Variable 1/0
X15 3 a.m. to 4 a.m. Independent Dummy Variable 1/0
X16 4 a.m. to 5 a.m. Independent Dummy Variable 1/0
X17 5 a.m. to 6 a.m. Independent Dummy Variable 1/0
X18 6 a.m. to 7 a.m. Independent Dummy Variable 1/0
X19 7 a.m. to 8 a.m. Independent Dummy Variable 1/0
X20 8 a.m. to 9 a.m. Independent Dummy Variable 1/0
X21 9 a.m. to 10 a.m. Independent Dummy Variable 1/0
X22 10 a.m. to 11 a.m. Independent Dummy Variable 1/0
X23 11 a.m. to noon Independent Dummy Variable 1/0
X24 Noon to 1 p.m. Independent Dummy Variable 1/0
X25 1 p.m. to 2 p.m. Independent Dummy Variable 1/0
X26 2 p.m. to 3 p.m. Independent Dummy Variable 1/0
X27 3 p.m. to 4 p.m. Independent Dummy Variable 1/0
X28 4 p.m. to 5 p.m. Independent Dummy Variable 1/0
X29 5 p.m. to 6 p.m. Independent Dummy Variable 1/0
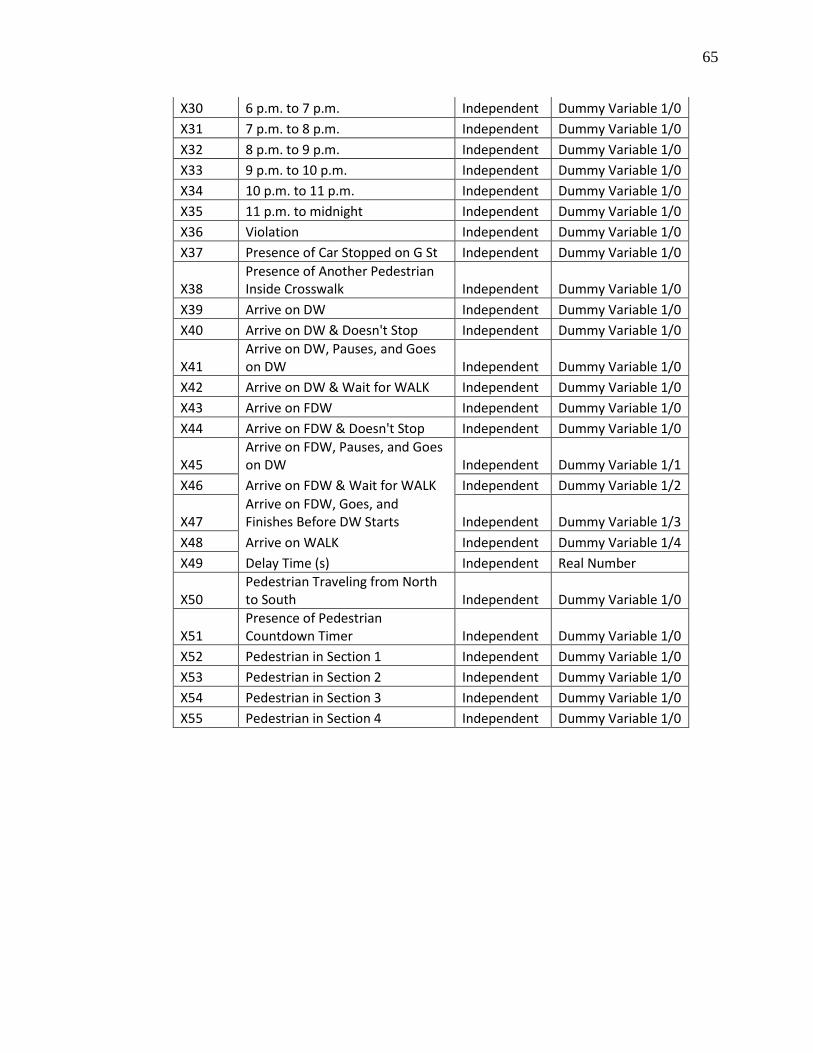
65
X30 6 p.m. to 7 p.m. Independent Dummy Variable 1/0
X31 7 p.m. to 8 p.m. Independent Dummy Variable 1/0
X32 8 p.m. to 9 p.m. Independent Dummy Variable 1/0
X33 9 p.m. to 10 p.m. Independent Dummy Variable 1/0
X34 10 p.m. to 11 p.m. Independent Dummy Variable 1/0
X35 11 p.m. to midnight Independent Dummy Variable 1/0
X36 Violation Independent Dummy Variable 1/0
X37 Presence of Car Stopped on G St Independent Dummy Variable 1/0
X38 Presence of Another Pedestrian Inside Crosswalk Independent Dummy Variable 1/0
X39 Arrive on DW Independent Dummy Variable 1/0
X40 Arrive on DW & Doesn't Stop Independent Dummy Variable 1/0
X41 Arrive on DW, Pauses, and Goes on DW Independent Dummy Variable 1/0
X42 Arrive on DW & Wait for WALK Independent Dummy Variable 1/0
X43 Arrive on FDW Independent Dummy Variable 1/0
X44 Arrive on FDW & Doesn't Stop Independent Dummy Variable 1/0
X45 Arrive on FDW, Pauses, and Goes on DW Independent Dummy Variable 1/1
X46 Arrive on FDW & Wait for WALK Independent Dummy Variable 1/2
X47 Arrive on FDW, Goes, and Finishes Before DW Starts Independent Dummy Variable 1/3
X48 Arrive on WALK Independent Dummy Variable 1/4
X49 Delay Time (s) Independent Real Number
X50 Pedestrian Traveling from North to South Independent Dummy Variable 1/0
X51 Presence of Pedestrian Countdown Timer Independent Dummy Variable 1/0
X52 Pedestrian in Section 1 Independent Dummy Variable 1/0
X53 Pedestrian in Section 2 Independent Dummy Variable 1/0
X54 Pedestrian in Section 3 Independent Dummy Variable 1/0
X55 Pedestrian in Section 4 Independent Dummy Variable 1/0
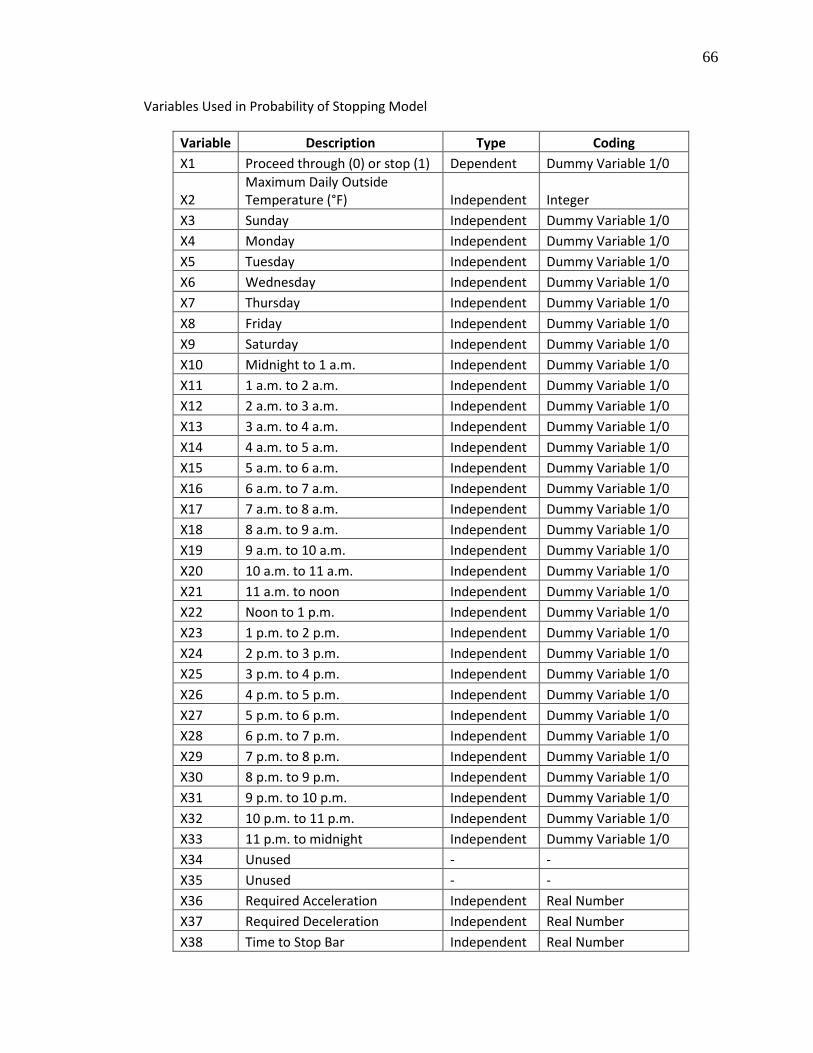
66
Variables Used in Probability of Stopping Model
Variable Description Type Coding
X1 Proceed through (0) or stop (1) Dependent Dummy Variable 1/0
X2 Maximum Daily Outside Temperature (°F) Independent Integer
X3 Sunday Independent Dummy Variable 1/0
X4 Monday Independent Dummy Variable 1/0
X5 Tuesday Independent Dummy Variable 1/0
X6 Wednesday Independent Dummy Variable 1/0
X7 Thursday Independent Dummy Variable 1/0
X8 Friday Independent Dummy Variable 1/0
X9 Saturday Independent Dummy Variable 1/0
X10 Midnight to 1 a.m. Independent Dummy Variable 1/0
X11 1 a.m. to 2 a.m. Independent Dummy Variable 1/0
X12 2 a.m. to 3 a.m. Independent Dummy Variable 1/0
X13 3 a.m. to 4 a.m. Independent Dummy Variable 1/0
X14 4 a.m. to 5 a.m. Independent Dummy Variable 1/0
X15 5 a.m. to 6 a.m. Independent Dummy Variable 1/0
X16 6 a.m. to 7 a.m. Independent Dummy Variable 1/0
X17 7 a.m. to 8 a.m. Independent Dummy Variable 1/0
X18 8 a.m. to 9 a.m. Independent Dummy Variable 1/0
X19 9 a.m. to 10 a.m. Independent Dummy Variable 1/0
X20 10 a.m. to 11 a.m. Independent Dummy Variable 1/0
X21 11 a.m. to noon Independent Dummy Variable 1/0
X22 Noon to 1 p.m. Independent Dummy Variable 1/0
X23 1 p.m. to 2 p.m. Independent Dummy Variable 1/0
X24 2 p.m. to 3 p.m. Independent Dummy Variable 1/0
X25 3 p.m. to 4 p.m. Independent Dummy Variable 1/0
X26 4 p.m. to 5 p.m. Independent Dummy Variable 1/0
X27 5 p.m. to 6 p.m. Independent Dummy Variable 1/0
X28 6 p.m. to 7 p.m. Independent Dummy Variable 1/0
X29 7 p.m. to 8 p.m. Independent Dummy Variable 1/0
X30 8 p.m. to 9 p.m. Independent Dummy Variable 1/0
X31 9 p.m. to 10 p.m. Independent Dummy Variable 1/0
X32 10 p.m. to 11 p.m. Independent Dummy Variable 1/0
X33 11 p.m. to midnight Independent Dummy Variable 1/0
X34 Unused - -
X35 Unused - -
X36 Required Acceleration Independent Real Number
X37 Required Deceleration Independent Real Number
X38 Time to Stop Bar Independent Real Number
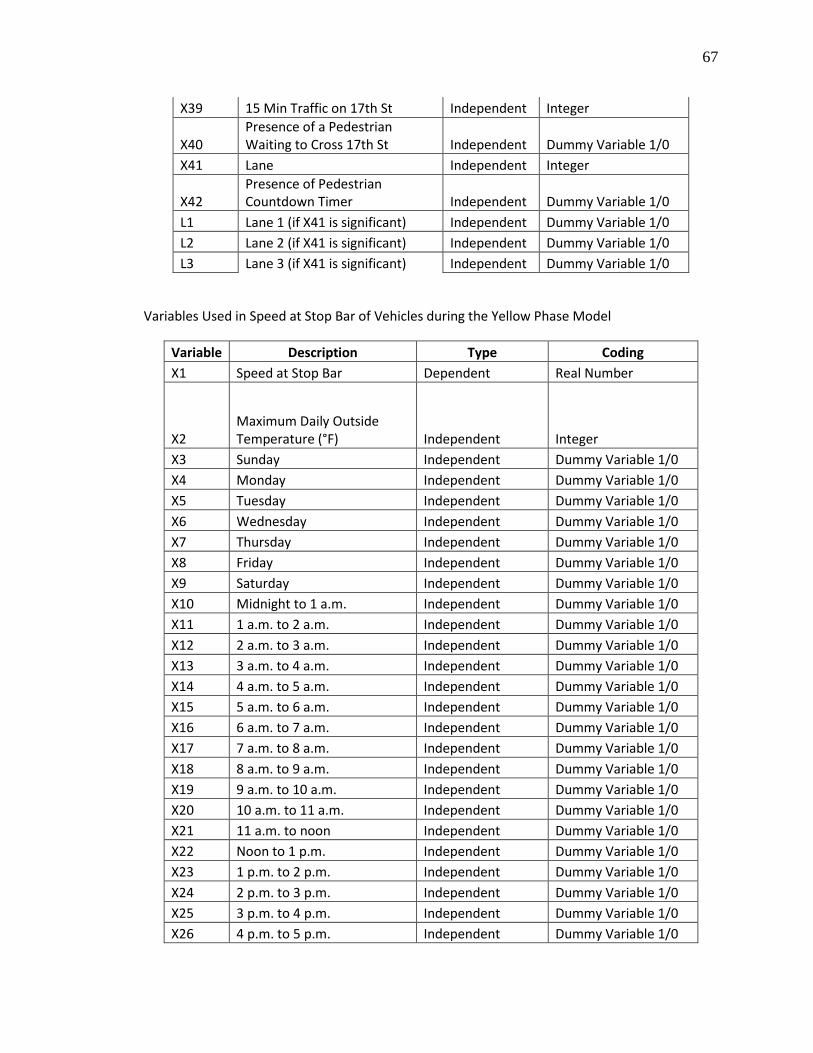
67
X39 15 Min Traffic on 17th St Independent Integer
X40 Presence of a Pedestrian Waiting to Cross 17th St Independent Dummy Variable 1/0
X41 Lane Independent Integer
X42 Presence of Pedestrian Countdown Timer Independent Dummy Variable 1/0
L1 Lane 1 (if X41 is significant) Independent Dummy Variable 1/0
L2 Lane 2 (if X41 is significant) Independent Dummy Variable 1/0
L3 Lane 3 (if X41 is significant) Independent Dummy Variable 1/0
Variables Used in Speed at Stop Bar of Vehicles during the Yellow Phase Model
Variable Description Type Coding
X1 Speed at Stop Bar Dependent Real Number
X2 Maximum Daily Outside Temperature (°F) Independent Integer
X3 Sunday Independent Dummy Variable 1/0
X4 Monday Independent Dummy Variable 1/0
X5 Tuesday Independent Dummy Variable 1/0
X6 Wednesday Independent Dummy Variable 1/0
X7 Thursday Independent Dummy Variable 1/0
X8 Friday Independent Dummy Variable 1/0
X9 Saturday Independent Dummy Variable 1/0
X10 Midnight to 1 a.m. Independent Dummy Variable 1/0
X11 1 a.m. to 2 a.m. Independent Dummy Variable 1/0
X12 2 a.m. to 3 a.m. Independent Dummy Variable 1/0
X13 3 a.m. to 4 a.m. Independent Dummy Variable 1/0
X14 4 a.m. to 5 a.m. Independent Dummy Variable 1/0
X15 5 a.m. to 6 a.m. Independent Dummy Variable 1/0
X16 6 a.m. to 7 a.m. Independent Dummy Variable 1/0
X17 7 a.m. to 8 a.m. Independent Dummy Variable 1/0
X18 8 a.m. to 9 a.m. Independent Dummy Variable 1/0
X19 9 a.m. to 10 a.m. Independent Dummy Variable 1/0
X20 10 a.m. to 11 a.m. Independent Dummy Variable 1/0
X21 11 a.m. to noon Independent Dummy Variable 1/0
X22 Noon to 1 p.m. Independent Dummy Variable 1/0
X23 1 p.m. to 2 p.m. Independent Dummy Variable 1/0
X24 2 p.m. to 3 p.m. Independent Dummy Variable 1/0
X25 3 p.m. to 4 p.m. Independent Dummy Variable 1/0
X26 4 p.m. to 5 p.m. Independent Dummy Variable 1/0
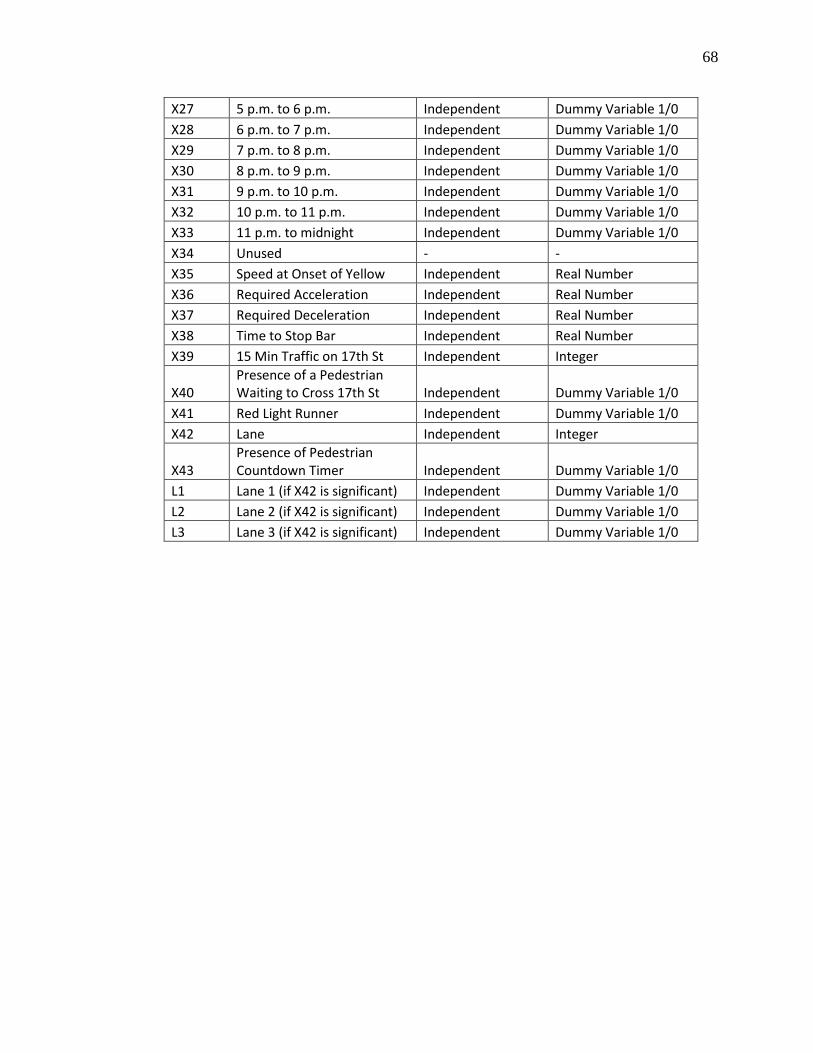
68
X27 5 p.m. to 6 p.m. Independent Dummy Variable 1/0
X28 6 p.m. to 7 p.m. Independent Dummy Variable 1/0
X29 7 p.m. to 8 p.m. Independent Dummy Variable 1/0
X30 8 p.m. to 9 p.m. Independent Dummy Variable 1/0
X31 9 p.m. to 10 p.m. Independent Dummy Variable 1/0
X32 10 p.m. to 11 p.m. Independent Dummy Variable 1/0
X33 11 p.m. to midnight Independent Dummy Variable 1/0
X34 Unused - -
X35 Speed at Onset of Yellow Independent Real Number
X36 Required Acceleration Independent Real Number
X37 Required Deceleration Independent Real Number
X38 Time to Stop Bar Independent Real Number
X39 15 Min Traffic on 17th St Independent Integer
X40 Presence of a Pedestrian Waiting to Cross 17th St Independent Dummy Variable 1/0
X41 Red Light Runner Independent Dummy Variable 1/0
X42 Lane Independent Integer
X43 Presence of Pedestrian Countdown Timer Independent Dummy Variable 1/0
L1 Lane 1 (if X42 is significant) Independent Dummy Variable 1/0
L2 Lane 2 (if X42 is significant) Independent Dummy Variable 1/0
L3 Lane 3 (if X42 is significant) Independent Dummy Variable 1/0

69
Appendix B – Locations of Sensys Sensors
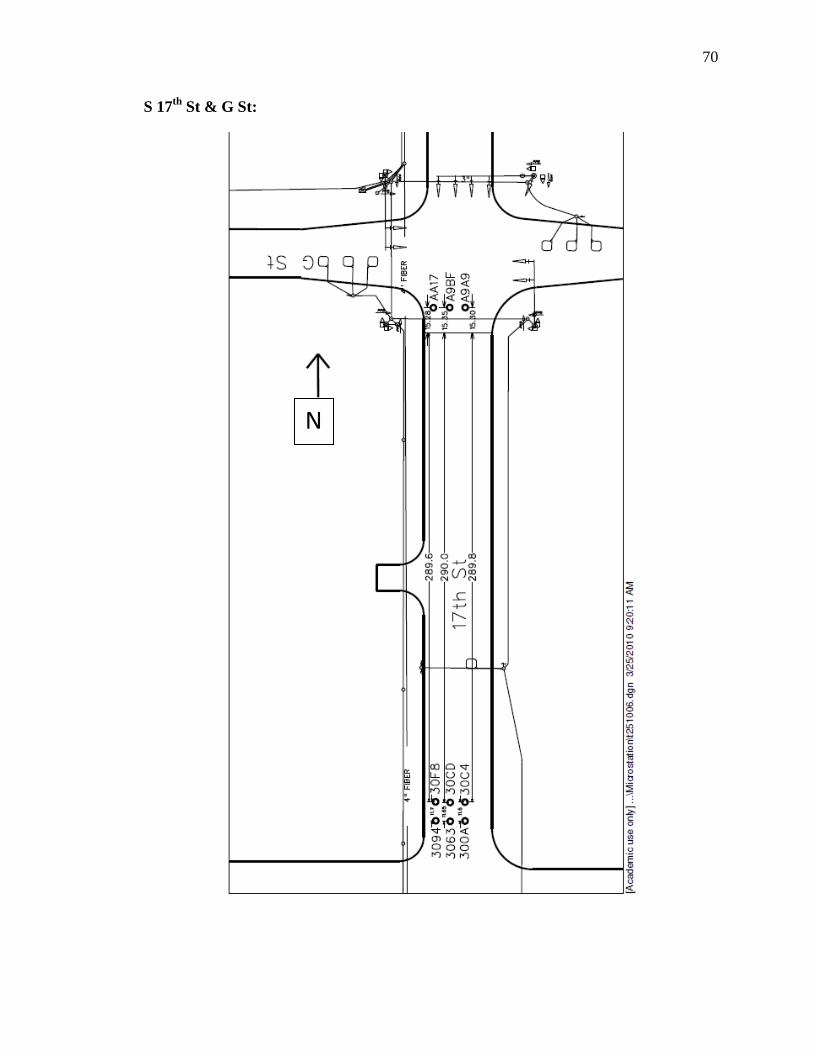
70
S 17th
St & G St:
N

71
N 27th
St & Cornhusker Hwy:
N