The Effects of Irrelevant Information and Minor Errors in Client ...
210
Virginia Commonwealth University Virginia Commonwealth University VCU Scholars Compass VCU Scholars Compass Theses and Dissertations Graduate School 2017 The Effects of Irrelevant Information and Minor Errors in Client The Effects of Irrelevant Information and Minor Errors in Client Documents on Assessments of Misstatement Risk and Sample Documents on Assessments of Misstatement Risk and Sample Size Size Edward Lynch Virginia Commonwealth University Follow this and additional works at: https://scholarscompass.vcu.edu/etd © The Author Downloaded from Downloaded from https://scholarscompass.vcu.edu/etd/4959 This Dissertation is brought to you for free and open access by the Graduate School at VCU Scholars Compass. It has been accepted for inclusion in Theses and Dissertations by an authorized administrator of VCU Scholars Compass. For more information, please contact [email protected].
-
Upload
khangminh22 -
Category
Documents
-
view
0 -
download
0
Transcript of The Effects of Irrelevant Information and Minor Errors in Client ...
Virginia Commonwealth University Virginia Commonwealth University
VCU Scholars Compass VCU Scholars Compass
Theses and Dissertations Graduate School
2017
The Effects of Irrelevant Information and Minor Errors in Client The Effects of Irrelevant Information and Minor Errors in Client
Documents on Assessments of Misstatement Risk and Sample Documents on Assessments of Misstatement Risk and Sample
Size Size
Edward Lynch Virginia Commonwealth University
Follow this and additional works at: https://scholarscompass.vcu.edu/etd
© The Author
Downloaded from Downloaded from https://scholarscompass.vcu.edu/etd/4959
This Dissertation is brought to you for free and open access by the Graduate School at VCU Scholars Compass. It has been accepted for inclusion in Theses and Dissertations by an authorized administrator of VCU Scholars Compass. For more information, please contact [email protected].

© Edward Lynch 2017
All Rights Reserved

ii
The Effects of Irrelevant Information and Minor Errors in Client Documents on
Assessments of Misstatement Risk and Sample Size
A dissertation submitted in partial fulfillment of the requirements for the degree of Doctoral of
Philosophy in Business at Virginia Commonwealth University.
by
Edward Lynch, CPA
Doctor of Philosophy
Accounting Department, School of Business
Virginia Commonwealth University
Director: Alisa G. Brink, Ph.D.
KPMG Teaching Excellence Fellow, Associate Professor of Accounting
Virginia Commonwealth University
Virginia Commonwealth University
Richmond, Virginia
June, 2017

iii
ACKNOWLEDGEMENT
I would like to express utmost gratitude to my family: my sister Sharon, and my parents, Robert
and Selma for supporting my academic pursuits.
I am grateful to my dissertation committee: Dr. Brink, my advisor and committee chairman, who
truly encourages intellectual exploration; Dr. Andiola, Dr. Ferguson and Dr. Glasscock for their
feedback and guidance; and Dr. Wier for his encouragement and valuable insight. I also want to
thank Dr. Park and Dr. Norman for looking out for the interests of grad students and for providing
valuable insight in teaching and research.
Finally, I send many praises to my friends and colleagues at Virginia Commonwealth University
who made all of this worthwhile and fun; you are too many to name; you know who you are.
ii

iv
TABLE OF CONTENTS
List of Tables …………………………………………………………………………………….v
List of Figures …………………………………………………………………………………...vi
Abstract …………………………………………………………………………………………vii
Part 1: The Effects of Irrelevant Information and Minor Errors in Client Documents on Auditor
Decisions
Introduction……………………………………………………………………………...1
Literature Review………………………………………………………………………..6
Hypothesis Development……………………………………………………………….28
Method………………………………………………………………………………….33
Results…………………………………………………………………………………..40
Conclusion……………………………………………………………………………....48
Part 2: If Eyes are the Window to Our Soul, What Role does Eye-Tracking Play in Accounting
Research?
Introduction……………………………………………………………………………..50
Eye-Tracking Metrics and Their Uses…………………………………………………..53
Literature Review Structure……………………………………………………………..55
Literature Review………………………………………………………………………..56
Directions for Future Research…...……………………………………………………...69
Conclusion……………………………………………………………………………….76
PART 3: The Effect of Irrelevant Information and Minor Errors in Client Documents on Audit
Student Decisions using Eye-Tracking
Introduction……………………………………………………………………………..78
iii
v
Hypothesis Development………………………………………………………………..80
Method…………………………………………………………………………………..81
Results…………………………………………………………………………………...89
Conclusion……………………………………………………………………………….95
References ………………………………………………………………………………………98
Appendix A ………………………………………………..…………………………………..126
Appendix B...……………………………………………..……………………………………144
Appendix C...……………………………………………..……………………………………146
Appendix D………………………………………………..…………………………………...164
Appendix E....……………………………………………..……………………………………173
Vita …………...………………………………………………………………………………..200
iv

vi
LIST OF TABLES
Table 1. Experiment 1 Participant Demographic Information.………………………………...173
Table 2. Participant Responses to Debriefing Questions.……………………………………....174
Table 3. Means and Standard Deviations for Misstatement Likelihood and Sample Size……..175
Table 4. Experiment 1 Two-way MANOVA Results....……………………………………….176
Table 5. Hurtt Scale Responses………………………………………………………………...177
Table 6. Experiment 1 Three-way MANOVA Results………………………………………...178
Table 7. Experiment 1 Client Competency Mediation Test Results (PROCESS Model 4)……179
Table 8. Common Eye-Tracking Hardware Companies………………………………………..180
Table 9. Key Terms Summary………………...………………………………………………..181
Table 10. Experiment 2 Participant Demographic Information………………………………..182
Table 11. Experiment 2 One-way ANOVA Results…………………………………………...183
Table 12. Kruskal-Wallis Test Results for Fixations and Dwell Times………………………..184
Table 13. Means and Standard Deviations for the Time to First Fixation and Number of Fixations
Before Across Variables………………………………………………………………………..165
Table 14. Experiment 2 Mediation Model Results (PROCESS Model 5)……………………..168
Table 15. Experiment 2 Mediation Model Results (PROCESS Model 4)……………………..169
Table 16. Experiment 2 Mediation Model Results (PROCESS Model 5)……………………..171
v
vii
LIST OF FIGURES
Figure 1. Model of Determinants of Professional Skepticism in Audit Performance…………185
Figure 2. A Model of Antecedents to and Outcomes of Skeptical Judgment and Action…......186
Figure 3. Proposed Interaction for Experiment 1……………………………………………....187
Figure 4. Change in Misstatement Likelihood…………………………………………………188
Figure 5. Change in Number of Items Selected………………………………………………..189
Figure 6. Experiment 1 Client Competency Analysis (PROCESS Model 4)………………….190
Figure 7. Example of a Heat Map………………………………………………………………191
Figure 8. Literature Review Organization……………………………………………………...192
Figure 9. Illustration of the Experimental Process……………………………………………...193
Figure 10. Audit Evidence Slides with Areas of Interest Indicated……………………………194
Figure 11. Heat Maps…………………………………………………………………………...198
Figure 12. Experiment 2 Skepticism Analysis (PROCESS Model 4)………………………….167
Figure 13. Experiment 2 Skepticism Analysis (PROCESS Model 5)………………………….172
vi
viii
ABSTRACT
The Effects of Irrelevant Information and Minor Errors in Client Documents on
Assessments of Misstatement Risk and Sample Size
By Edward Lynch, Ph.D., CPA
A dissertation submitted in partial fulfillment of the requirements for the degree of Doctor of
Philosophy at Virginia Commonwealth University.
Virginia Commonwealth University, 2017
Director: Alisa Brink, Ph.D., KPMG Teaching Excellence Fellow, Associate Professor of
Accounting, School of Business
This dissertation consists of three studies. The first study conducts a 2 by 2 experiment to
examine how auditors are influenced by the presence of irrelevant information and minor errors
(i.e., “dirty documents”) when reviewing audit evidence produced by the client. This study tasks
97 public accountants to review audit evidence and finds some evidence that dirty documents
influence an auditor’s assessment of the likelihood of account misstatement and the appropriate
sample size.
In order to demonstrate the usefulness of eye-tracking and to help generate potential
research topics, the second study reviews extant literature in other disciplines where eye-tracking
technology is applied to various judgment and decision-making contexts. This study suggests how
vii

ix
eye-tracking can enhance extant accounting research. Illustrative examples of promising research
opportunities (extending extant research) are provided. In addition, this study identifies how eye-
tracking can be applied to more contemporary decision making and educational circumstances.
The third study extends the first experiment through the use of eye-tracking technology.
This study utilizes the same 2 by 2 experiment as the first study, but in this case records the eye
movements of 43 auditing students while they review the audit evidence. The eye-tracking
technology provides additional detail as to the specific evidence participants’ focus on during their
review. This study finds that participants focus their attention differently depending on whether
irrelevant information or minor errors were present.
viii
1
PART 1: The Effects of Irrelevant Information and Minor Errors in Client
Documents on Auditor Decisions
I. INTRODUCTION
Reliable financial reporting is essential to maintaining confidence in our capital
markets. Audits are one mechanism that assist in maintaining reliable financial reporting
and create value for a number of stakeholders (e.g., investors, analysts, trade exchanges,
audit committees, client management, internal auditors, as well as external audit firms).
One important feature of every audit is the application of professional skepticism. The
auditor's daily exposure to increasingly unique and complex transactions, the expanded use
of judgment based estimates and measurements, and the emergence of big data all
contribute to an ongoing awareness of the need to properly apply professional skepticism
(Glover and Prawitt 2013).
This study examines the influence of client provided “dirty documents” on auditors’
skeptical judgments and actions. For purposes of this study, a “dirty document” is defined
as a client produced record that contains irrelevant information and/or minor errors.
Irrelevant information is extraneous information. Minor errors are errors that are
immaterial to the related account balance as well as to the overall financial results and do
not appear to be intentional or deceptive. However, although immaterial and unintentional,
minor errors may accumulate to a level (or form a pattern) that triggers an adjustment to
an auditor's assessment of risk. This study also examines whether dirty documents
contribute to over auditing, which is a waste of financial resources and an unnecessarily
stressful misuse of audit staff. Onsite auditors interact daily with the client's staff (e.g.,

2
requesting documents and related clarification). Therefore, an important aspect of the daily
auditor-client relationship centers around the quality of the client records provided to the
auditor; and the subsequent potential impact that the quality of the record has on the
auditor's application of professional skepticism.1
This study also examines the role of professional skepticism in the evaluation of
dirty documents. The Public Company Accounting Oversight Board (PCAOB) defines
professional skepticism as an attitude that includes a questioning mind, being alert to
conditions that may indicate possible misstatement due to fraud or error, and a critical
assessment of audit evidence (AS 1015). However, in practice the appropriate level of
professional skepticism rises and falls along a continuum or range of auditor behavior
depending on the circumstances (Glover and Prawitt 2013). In addition, applying the
appropriate level of professional skepticism requires achieving a balance between
gathering evidence and documentation vs. audit effectiveness and efficiency (including
controlling costs).
To examine how auditors are influenced by dirty documents, this study conducts
an experiment with 100 participants that have public accounting experience. In a
computerized task, participants assume the role of a staff auditor in completing the
accounts receivable portion of an audit. Participants review the audit evidence and then
assess the likelihood of account misstatement and the appropriate sample size. The
presence of irrelevant information and the presence of minor errors is then manipulated
between conditions. This paper examines three aspects related to auditor skepticism: trait
skepticism, skeptical judgment, and skeptical action. Trait skepticism is a measured
1 To illustrate, Mr. Paul Meyer, Regional Audit Director at Cherry, Bekaert, LLP, acknowledged dirty
documents as “a frequent occurrence that could potentially influence an auditor’s assessment of risk.”
3
independent variable captured using the Hurtt scale (2010). Skeptical judgment and
skeptical action are dependent variables that are captured from participants’ responses after
viewing the case materials.
With respect to the underlying behavioral theory, this study posits that the quality
of client records influences the application of professional skepticism. Specifically, when
auditors encounter client records contaminated with irrelevant information and/or minor
errors, how are their judgments and actions impacted? Recent research suggests process
accountability theory and epistemic motivation are related to higher quality auditor
judgment (e.g., Cohen, Krishnamoorthy, Peytcheva, and Wright 2013). Process
accountability is the expectation (regardless of the final outcome) of having to justify your
decision to others (Tetlock 1983; Siegel-Jacobs and Yates 1996). Epistemic motivation is
the desire to fully understand the problem at hand (Kruglanski 1989; Dreu and Carnevale
2003; Scholten, Van Knippenberg, Nijstad, and Dreu 2007).
Process accountability and epistemic motivation suggest that auditors encountering
dirty client records will perform more extensive audit testing than they otherwise would
with clean records. The same logic applies to irrelevant information and minor errors
operating separately. Auditors encountering irrelevant information and minor errors in
client provided records are expected to seek out additional explanations or perform
additional procedures and consequently make more skeptical judgments.
This study offers numerous contributions to the literature. First, the results show
that as much as 30 percent of an auditor’s time on-site can involve cleaning up dirty client
documents. This is an important result because this additional work not only impacts audit
efficiency and cost, but also contributes to auditor stress and burnout. Second, this study

4
finds that an auditor's skeptical judgment and action are impacted by both irrelevant
information and/or minor errors. This finding suggests that dirty documents contribute to
inefficient auditing. The results indicate that the presence of minor errors in audit evidence
leads to increases in the estimates of account misstatement likelihood and leads to increases
in sample size. When irrelevant information is present, auditors keep the likelihood of
misstatement constant, but respond by increasing the sample size. This suggests that the
presence of irrelevant information does not immediately cause auditors to conclude that
misstatements are more likely to occur, but still results in a more questioning mindset
leading to a larger sample size.
Third, this study examines how dirty documents influence auditors with different
levels of trait skepticism. Results indicate that trait skepticism does not influence an
auditor’s skeptical judgments or actions. Specifically, this result suggests that auditors
(regardless of their trait skepticism level) make similar skeptical judgments and take
similar action with respect to sample size. Perhaps the similar judgments and actions across
auditors with different trait skepticism levels indicates that auditor training acts as a
modifier for trait skepticism.
Fourth, this study is the first to use evidence that is experienced first-hand by the
auditor. Specifically, this study simulates use of records, containing irrelevant information
and minor errors, that are produced directly by the client versus the less personal second-
hand anecdotal evidence used in previous research (e.g., Hackenbrack 1992). The more
applied context adds a personal and possibly a more relevant and/or realistic experience to
the research setting. In addition, the significance of a more applied context is that a dirty

5
record prepared directly by the client may contribute to the auditor’s ongoing assessment
of client competence.
Fifth, this study provides evidence that a dilution effect does not always occur when
auditors are provided with superfluous information. Prior literature using second-hand
anecdotal evidence finds that the strength of auditor decisions is reduced when auditors are
provided with irrelevant information (e.g., Hoffman and Patton 1997; Shelton 1999). This
study’s audit setting utilizes records produced directly by the client (and therefore
experienced first-hand by the auditor) and finds no dilution effect occurs.
The results of this study should be useful to audit firms, clients and regulators who
have an interest in both the application of professional skepticism as well as avoiding the
time and expense associated with unnecessary auditing. First, the results should be useful
to audit firms, since they are continuously balancing audit risk and available auditor work
hours while avoiding the time and expense associated with unnecessary auditing. Second,
the results should be important to audit clients, who also are concerned with avoiding the
time and expense associated with unnecessary auditing. This study may also start a dialog
on the politically incorrect and controversial issue of what is the acceptable likelihood of
audit failure? Finally, the results may encourage a discussion to expand the PCAOB
definition of professional skepticism to recognize a concomitant obligation to avoiding
unnecessary auditing.
This rest of this study is organized into the following sections: Section II reviews
the current accounting literature on skepticism; Section III reviews the theories supporting
the hypotheses in Experiment 1, and concludes with my hypotheses; Section IV describes
the design of Experiment 1 including details about the participants, experimental task, as

6
well as the independent and dependent variables; Section V describes the results; and
Section VI provides conclusions on Experiment 1.
II. LITERATURE REVIEW
Professional Skepticism
The word skepticism comes from the root word “skeptic”, which comes from the
Greek word “skeptikos”, meaning inquiring or reflective (Glover and Prawitt 2013).
Therefore, someone labeled as being skeptical could also be described as having a
questioning mind, or as being doubtful. In an auditing context, the “presumptive doubt”
mindset defines professional skepticism as an attitude that includes a questioning mind and
critical assessment of audit evidence (e.g., Nelson 2009; PCAOB 2012; Carpenter and
Reimers 2013).2 Other studies (e.g., Bamber, Ramsay, and Tubbs 1997; Cushing 2003;
Hurrt 2007) assert that unless there is evidence to the contrary, the auditor's mindset should
be neutral (i.e., no presumption one way or the other as to management carelessness,
incompetence or fraud). In AU-C 200, the American Institute of Certified Public
Accountants (AICPA) defines professional skepticism as “an attitude that includes a
questioning mind, being alert to conditions that may indicate possible misstatement due to
error or fraud (2012).” However, it also states that “[an] auditor neither assumes that
management is dishonest nor assumes unquestioned honesty (2012)”. Glover and Prawitt
(2013) conceptualize the application of professional skepticism as falling along a
continuum ranging from complete doubt to total trust.3 In practice an auditor’s application
2 The PCAOB statutory regulations require a neutral mindset (i.e., "The auditor neither assumes that
management is dishonest nor assumes unquestioned honesty."). However, the Staff Audit Practice Alert
excludes this requirement from its overview of professional skepticism and due professional care.
Therefore, this study views the Staff Audit Practice Alert as encouraging a presumption of doubt mindset. 3 In practice, since an auditor always maintains a questioning mindset, it’s arguable that an auditor would
never embrace a position of total trust.

7
of skepticism is likely to fluctuate widely because of the ever changing circumstances,
documents and people encountered during an audit.
This study examines three aspects of professional skepticism: trait skepticism,
skeptical judgment, and skeptical action. Trait skepticism is comprised of “… individual
characteristics that enable auditors to determine when evidence does not “add up,” or traits
that allow auditors to exercise skeptical judgment (Hurrt, Brown-Liburd, Earley, and
Krishnamoorthy 2013 pp. 50). Skeptical judgment occurs when an auditor recognizes that
a potential issue may exist and decides that more work is necessary (2013). Lastly,
skeptical action is the final step where an auditor modifies their behavior based on their
judgment.
Relevant Literature on Professional Skepticism
Nelson (2009) and Hurtt et al. (2013) conduct detailed literature reviews on auditor
professional skepticism. The Nelson literature review synthesizes the literature and
proposes a model on skepticism. The Nelson model theorizes that auditor judgments and
actions are determined by auditor traits, knowledge, incentives and evidential input. Hurtt
et al. focus on more recent studies and extend Nelson’s model by creating a new category
of skepticism called antecedents of skeptical action and judgment. The antecedents of
skeptical action and judgment include auditor characteristics, evidential characteristics,
client characteristics, and external environment characteristics.
Figure 1 and Figure 2 illustrate the models developed in Nelson (2009) and Hurtt
et al. (2013). With respect to this study, each of the three variables of interest, trait
skepticism, skeptical judgment and skeptical action, are reflected in both models. Skeptical
action and judgment are directly identified as key components in both models. An auditor's

8
trait skepticism is reflected in the Nelson model under 'traits' and in the Hurtt et al. model
under 'auditor characteristics'. The irrelevant information and minor errors utilized in this
study are consistent with the 'evidential input' component of the Nelson model and in the
'evidential characteristics' component of the Hurtt et al. model. The following sections
discuss key elements of these models as that pertain to this study.
[Insert Figure 1 and 2 here]
Auditor Knowledge
An auditor’s inherent knowledge on a topic can play a part in subsequent judgments
and actions. Research on auditor knowledge (i.e., what Nelson (2009) breaks down into
frequency knowledge, pattern recognition, and specialization) identifies both positive and
negative effects of knowledge on professional skepticism. For example, extant research on
frequency knowledge (i.e., knowledge of the frequency of types of errors) indicates that
experienced auditors are familiar with error causes and effects, and this knowledge
increases with experience (Libby 1985; Ashton 1991; Frederick 1990). Similarly, research
on pattern recognition reveals that greater knowledge of error frequencies helps auditors
better analyze and respond to unexpected audit findings (Libby 1985; Frederick 1990;
Trompeter and Wright 2010). Lastly, research on auditor specialization finds that
experienced auditors are better able to disregard irrelevant data and are better able to make
connections among related pieces of evidence that might suggest an increased risk of error
(Brown and Solomon 1990, 1991; Bedard and Bigs 1991; Maletta and Kida 1993; Shelton
1999; Low 2004; Hammersley 2006).
There is also evidence that experience may have a negative effect on professional
skepticism. For instance, extant research suggests that more experienced auditors are more
9
likely to believe that exceptions noted during audits have reasonable non-error explanations
than less experienced auditors (Kaplan, Moeckel, and Williams 1992). Such reasoning
could negatively impact professional skepticism (Koonce 1992). There is evidence that
specialist auditors are more likely to believe that audit findings have non-error causes and
assess lower levels of inherent risk compared to non-specialist auditors (Solomon, Shields,
and Whittington 1999; Taylor 2000; Payne and Ramsay 2005). In other words, research
indicates that more experienced auditors tend to over rely on client explanations and are at
risk of assessing an inappropriately low level of risk. Therefore, while auditor knowledge
may improve an auditor’s ability to handle complexity in an audit, it may lead to auditors
becoming biased or less skeptical towards their clients.
Auditor Traits
Research also finds that certain personal traits influence an auditor’s judgment and
actions. Research on auditor traits includes non-knowledge related items such as problem
solving ability, ethical beliefs, and professional skepticism. As expected, extant research
on problem solving ability finds that higher ability is generally associated with higher
performance on professional skepticism related tasks (Bonner and Lewis 1990; Libby and
Tan 1994; Bierstaker and Wright 2001). Literature on ethics or moral reasoning finds
similar positive results. These studies, which tend to use assessment instruments like the
Rest (1986) defining issues test (DIT), find that auditors scoring higher in moral
development tend to be more sensitive to client competence and integrity (Ponemon 1993;
Ponemon and Gabhart 1993) and are more likely to identify potentially inappropriate client
activity (Bernardi 1994; Jones, Massey, and Thorne 2003). These findings suggest that

10
auditors who are inherently better at problem solving and more morally developed would
make more skeptical judgments than other auditors.
Skepticism Scales
This study adopts the Hurtt (2010) scale to measure trait skepticism in auditors. The
Hurtt scale is a relatively recent output from a stream of literature relating to measuring
skepticism (e.g., Schaub 1996; Rennie, Kopp, and Lemon 2007; Hurtt 2010). An early
study by Schaub (1996) compares peoples’ scores on a scale measuring peoples’ general
propensity to be skeptical and a scale measuring auditor trust in their client. The scale
measuring peoples’ general propensity to be skeptical includes two earlier scales developed
by Wrightsman (1974) that assess the belief that people are trustworthy and independent.
Schaub’s comparison reveals no relation between scores on the propensity to be skeptical
scale and the client-trust scale. Similarly, Rennie et al. (2007) conduct a related analysis
and find no association between the client trust measure from Schaub (1996), the auditors’
recalled trust in their client scale, and the auditors’ general predisposition to trust people
scale.
Hurtt (2010) develops and tests a scale that specifically measures auditor
professional skepticism (i.e., what this study refers to as trait skepticism). Hurtt’s 30-
question scale includes measures of six separate characteristics of skeptics supported by
philosophy literature that include: suspension of judgment, questioning mind, search for
knowledge, interpersonal understanding, self-confidence, and self-determination.
Consistent with the definitions of professional skepticism discussed previously, Hurtt’s
scale suggests that skeptics keep an open mind, question possible conclusions, and consider
the possibility that evidence is biased when searching and reviewing evidence.
11
Subsequent studies validate the Hurtt scale (e.g., Fullerton and Durtschi 2005;
Hurtt, Eining, and Plumlee 2008; Rosman 2011; Popova 2012; Faraq and Elias 2012;
Quadackers, Groot, and Wright 2009; 2014). For instance, Hurtt et al. (2008) apply the
Hurtt skepticism scale to a group of auditors to examine how skepticism influences
assessment of audit evidence and generation of alternative explanations for findings. They
find that under normal and higher risk audit situations, auditors scoring higher on the
skepticism scale engage in more skeptical behaviors than those that score low in
skepticism.
Fullerton and Durtschi (2005) apply the Hurtt scale to a study examining internal
auditors and their search for evidence. Their results indicate that internal auditors with
higher scores on the skepticism scale have a greater desire to search for explanations
regarding fraud symptoms. In other words, those determined to be more skeptical also have
a more questioning mindset towards potential fraud issues they encounter in the survey.
Lastly, in another related study, Quadackers et al. (2009) apply the Hurtt scale to a group
of Big-4 auditors in the Netherlands to examine the relationship between their scores on
the Hurtt scale and their subsequent judgments on an analytical procedures task. Similar to
Fullerton and Durtschi (2005), their results indicate that high scores on the Hurtt scale are
positively associated with skeptical auditor behaviors (e.g., the desire to perform further
testing and the generation of alternative explanations).
In a more recent study, Quadackers et al. (2014) re-examine the Hurtt scale’s
predictive ability in a comparison with the Rotter Interpersonal Trust scale (RIT; Rotter
1967).4 The Hurtt scale is a relatively unbiased instrument when compared to the RIT scale
4 The RIT scale measures an individual’s level of trust, thus to apply it to a skepticism setting they used the
inverse value of a participant’s score on the RIT scale.

12
which emphasizes a lack of trust and therefore tends to be negatively biased against the
client. Quadackers et al. predict and find, that although high scores on both scales are
associated with more skeptical auditor judgment, the RIT scale outperforms the Hurtt scale
in high-risk settings. The results make sense, as intuitively, someone scoring low on trust
is probably negatively biased against the client and therefore makes relatively more
skeptical judgments in all situations; low as well as high risk. For purposes of the study,
the Hurtt scale is used because it is less biased overall and it has been extensively validated
as a reliable research tool.
Auditor Incentives
Incentives, in addition to knowledge and traits, also influence an auditor’s judgment
and action. Due to the many powerful yet conflicting incentives auditors face on a regular
basis (e.g., the incentive to retain clients and the incentive to avoid litigation), there are
abundant studies across the various research methodologies investigating the impact and
interaction between various auditor incentives. For instance, analytical research on auditor
incentives focuses on the auditor-client interaction and argues that auditors are biased by
the types of incentives they encounter in the field (e.g., Nichols and Price 1976; DeAngelo
1981; Antle 1982, 1984; Fellingham and Newman 1985; Magee and Tseng 1990; Antle
and Nalebuff 1991; Teoh 1992; Bloomfield 1995; Johnstone, Sutton, and Warfield 2001).
Archival research examining auditor incentives primarily focuses on how non-audit
fees influence auditor independence. Although auditor independence is not the same as
auditor skeptical judgment and action, the three constructs are closely interrelated. For
instance, the suggestion by an auditor to limit discretionary accruals or to issue a going
concern statement (two common variables from this subset of audit archival research)

13
suggests they are exercising skeptical judgment and skeptical action. Some studies in this
subset of archival research find evidence of non-audit fees reducing auditor independence
(e.g., Frankel, Johnson and Nelson 2002; Larcker and Richardson 2004; Srinidhi and Gul
2006; Blay, and Geiger 2013; Causholli, Chambers, and Payne 2014), while other studies
find that non-audit fees have no effect on auditor independence (e.g., DeFond,
Raghunandan, and Subramanyam 2002; Ashbaugh, LaFond, and Mayhew 2003; Chung
and Kallapur 2003; Ruddock, Taylor, and Taylor 2006). Thus, from an archival standpoint
there is mixed evidence that non-audit fee incentives influence auditors’ actions.
Experimental research examining auditor incentives finds that auditors' judgments
and actions become more skeptical as the risk of litigation or reputation threats increase.
Experimental research in this area addresses auditor incentives such as client fee pressure
(e.g., Gramling 1999; Houston 1999; Beeler and Hunton 2002; Asare, Cohen, and
Trompeter 2005), client retention concerns (e.g., Farmer, Rittenberg, and Trompeter 1987;
Trompeter 1984; Chang and Hwang 2003; Blay 2005), audit partner compensation (e.g.,
Trompeter 1994), and litigation exposure (e.g., Hackenbrack and Nelson 1996; Braun
2001; Houston, Peters, and Pratt 1999; Hwang, and Chang 2010). However, there is some
evidence that certain incentives may cause auditors to jeopardize their application of
skepticism. For instance, Gramling (1999) finds that when fee pressure is high auditors are
more likely to rely on the work of internal auditors as part of their test work. Hackenbrack
and Nelson (1996) provide evidence that when engagement risk is moderate, auditors
permit their clients to take aggressive reporting stances. Lastly, Blay (2005) suggests that
when the risk of losing the client is high, auditors are more likely to recommend issuing a
clean audit report.

14
In a more recent literature review on skepticism, Hurrt et al. (2013) highlight that
auditors may lack positive incentives to make skeptical judgments. For instance, Bazerman
and Tenbrunsel (2011) raise the issue that a firm’s goals and reward incentives for auditors
could cause staff to sacrifice their level of skepticism to meet short term firm goals. In other
words, an auditor who is rewarded on results over high quality decisions, may choose the
more rewarding path of finishing the audit quickly instead of the more appropriate action
involving additional documentation and/or audit procedures. To address this issue,
Peecher, Solomon, and Trotman (2013) suggest a shift away from penalty based auditor
incentives, such as litigation, through the incorporation of more positive incentives.
Auditor Judgment
Since judgment is an integral part of every audit, there is an abundance of research
in this area (see Allen, Hermanson, Kozloski, and Ramsay 2006; Nelson 2009; and Hurrt
et al. 2013 for more detailed literature reviews). Relevant literature in this area includes
research on topics such as motivated reasoning (e.g., Wilks 2002; Kadous, Kennedy, and
Peeacher 2003; Glover, Prawitt, and Wilks 2005; Guiral, Ruiz, and Rodgers 2011), time
pressure (e.g., McDaniel 1990; Kelley and Margheim 1990; and Braun 2000), belief
updating (e.g., Ashton and Ashton 1990; McMillan and White 1993; and Bamber, Ramsay,
and Tubbs 1997), and irrelevant information (e.g., Hackenbrack 1992; Glover 1997;
Hoffman and Patton 1997; Shelton 1999).
Motivated Reasoning
There is an extensive body of research on motivated reasoning and its influence on
auditor judgment. In general, the results are consistent with motivated reasoning theory.
Motivated reasoning theory (see Pyszczynski and Greenberg 1987; Kunda 1990; Lundgren
15
and Prislin 1998) suggests that auditors who are motivated to reach a certain outcome
process information in a way that ultimately fits that preferred outcome. For instance,
Wilks (2002) examines audit manager judgments in an experiment manipulating whether
audit managers are aware of their audit partner’s beliefs prior to or after making their own
decision. Wilks finds that managers who know their audit partner’s beliefs ahead of time
tend to be biased towards the partner’s decisions.
Similarly, Glover et al. (2005) conduct a study examining why auditors sometimes
over-rely on evidence obtained from weak substantive analytical procedures. To examine
this issue they conduct an experiment where auditors rate the strength of evidence provided
by weak analytical procedures performed in relation to whether an account was materially
misstated. Results of Glover et al. reveal that auditors view evidence that confirms their
prior beliefs to be more persuasive than evidence differing from prior beliefs.
More recently, Guiral et al. (2011) investigate whether auditors’ beliefs about
evidence are influenced by a self-fulfilling prophecy. They examine this issue in a going
concern opinion case setting, where they have auditors review evidence and rate how much
it supports their initial beliefs about the client in the case. Results of the experiment show
that auditors are more sensitive to evidence that supports their initial belief than
disconfirming evidence. Thus, the overall results indicate that an auditor’s initial belief
influences their judgment.
Time Pressure
Another related stream of literature addresses how time pressure influences auditor
judgment. Time pressure is an ongoing issue for audit firms as they strive to manage their
staff in the most efficient way possible in order to maximize billable hours (McDaniel
16
1990). Time pressure is especially important where auditors are required to travel to the
client's site or complete the bulk of their work onsite. As expected, extant literature
suggests that time pressure can lead to an increase in efficiency at the cost of audit quality
(McDaniel 1990; Gramling 1999). Furthermore, time pressure can lead to auditors
overlooking critical pieces of evidence that might impact audit risk (Braun 2000). Time
pressure also increases the likelihood that auditors engage in inappropriate time-saving
behaviors, such as signing-off on procedures before they are fully completed (Kelley and
Margheim 1990). However, there is also evidence suggesting that time pressure may help
auditors avoid being distracted by irrelevant information (Glover 1997).
Belief Updating
Another stream of research on auditor judgment relates to belief updating. Initial
research in belief updating relies on the Bayes’ theorem. The Bayes’ theorem suggests that
auditor beliefs are determined by mathematical probabilities. Unfortunately, there are
many situations where the Bayes’ theorem failed to predict changes in auditor beliefs.
These deviations from the theoretical predictions are attributed to auditors failing to
consider all relevant information (Ashton and Ashton 1988). Consequently, more recent
research often uses the Hogarth and Einhorn belief revision model (1992), which does not
assume that individuals will exhaustively consider all relevant information.
The belief revision model describes how an initial hypothesis (e.g., the accounts
receivable account balance is misstated) is updated with the receipt of new evidence (see
Hogarth and Einhorn 1992 for further information on their belief revision model).
Procedurally, Hogarth and Einhorn’s model fits auditing research well, as auditors
approach much of their test work with an initial hypothesis, test their hypothesis with
17
various audit procedures, and then reach their final conclusion. Prior research finds that
changes in auditor beliefs when evaluating evidence are influenced by a recency effect
where more recent evidence is weighted more strongly than less recent evidence (e.g.,
Ashton and Ashton 1988; Tubbs, Messier, and Knechel 1990; Asare 1992; Krull, Reckers,
and Wong-on-Wing 1993), evidence presentation mode (e.g., Ashton and Ashton 1990;
Knechel and Messier 1990), and confirmation bias (e.g., Butt and Campell 1989; McMillan
and White 1993; Bamber, Ramsay, and Tubbs 1997).
Ashton and Ashton (1988) investigate various influences on auditor belief
updating in an extensive series of five experiments. Specifically, they ask participants to
assume an initial probability that an account is misstated. They then present different types
of evidence to the participants, and measure the change in the probability of a misstatement
from the initial anchor point. Using auditors as participants, they examine the direction of
evidence (confirming vs. disconfirming), strength of evidence (strong vs. weak), evidence
type (consistently in the same direction vs. additional evidence in mixed directions),
evidence order (strong first vs. weak first), and evidence presentation mode (sequential vs.
simultaneous). Their experiments provide evidence that weak initial anchor points are more
influenced by confirming evidence than relatively stronger initial anchor points. They also
find evidence of a recency effect as well as evidence of a dilution effect (i.e., relevant
information is under-utilized). These findings suggest that the manner in which evidence
is received, and whether it confirms or disconfirms initial beliefs, has a strong influence on
auditor judgment.
Tubbs et al. (1990) conduct four experiments relating to the recency effect on
auditor belief updating. Their first two experiments manipulate the order of evidence

18
(weaker first vs. stronger first), while the second two focus on mixed evidence cases (both
positive and negative information presented). Results of their study indicate that consistent
additional evidence (all positive or all negative) does not lead to a recency effect. However,
a recency effect can occur when the evidence is mixed (some positive and some negative).
Asare (1992) examines whether there is a recency effect with respect to going
concern decisions. Specifically, Asare examines whether the type and order of evidence
interact with auditors’ sequential processing of evidence in a going-concern setting.
Asare’s findings are consistent with Ashton and Ashton (1988), and Butt and Campell
(1989). Specifically, Asare finds in both belief revision and audit report decisions, that
when auditors assess the going concern of a company, they tend to be biased by a recency
effect in evidence evaluation. In other words, auditors who last review evidence suggesting
the company would continue to exist, ultimately issue fewer going concern opinions,
compared to settings where auditors last review evidence suggesting otherwise.
Krull et al. (1993) examine whether presentation order (mixed positive and negative
information) and fraud signals (present or absent) influence decisions. In addition, Krull et
al. examine whether experience influences decisions in their study. Instead of using
auditors, they investigate manager reactions in a fraud assessment case. They observe a
recency effect where the more experienced managers assign a greater weight to the last
pieces of evidence received.
Ashton and Ashton (1990) focus on whether evidence presentation mode influences
auditor judgment. In other words, they examine whether auditors react differently
depending on whether evidence is presented all at once or one piece at a time in a sequence.
Building on their initial study above, Ashton and Ashton conduct a study examining how

19
evidence presentation (sequential vs. simultaneous) and evidence type (positive vs.
negative) impacts auditor belief updating. They find that there are greater changes in
auditors’ beliefs when evidence is negative. They also find evidence presented sequentially
leads to greater changes in beliefs than evidence presented simultaneously. They compare
their findings to non-auditor participants by running similar experiments with business
executives. Contrary to their findings with auditors, business executives are not influenced
by positive or negative evidence; nor are they influenced by whether evidence is presented
sequentially or all at once. Therefore, this study suggests that auditor training may bias the
way evidence is evaluated.
Knechel and Messier (1990) also study whether evidence presentation mode
influences auditor judgment. In an experimental setting, they allow auditors to select which
additional sources of evidence to review in their analysis and whether to stop at that point
or to continue reviewing more evidence. Specifically, Knechel and Messier examine how
an auditor’s search for additional information influences their evaluation of audit evidence.
They find that when given a choice, auditors chose to focus on the more reliable pieces of
evidence. Additionally, their results indicate that auditors that stopped earlier in the
sequential search for evidence tend to have more extreme assessments. Lastly, consistent
with prior studies (e.g., Ashton and Ashton 1988), they find that auditor beliefs were more
impacted by negative evidence than positive evidence.
Butt and Campell (1989) look at evidence type (i.e., positive vs. negative) and how
auditors approach evidence evaluation. They investigate whether auditors implement an
earlier version of the belief revision model called the contrast/surprise model (see Einhorn
and Hogarth 1985) or whether they use a hypothesis testing strategy (i.e., they are

20
confirmation biased) when evaluating a company’s internal control system. Butt and
Campell find evidence that auditors are not confirmation biased. Their results also indicate
that auditors do not seek to confirm their initial assessments and are not more influenced
by evidence supporting their initial belief. Finally, they find evidence of a recency effect
on auditor decision making which is consistent with earlier studies.
McMillan and White (1993) look at how the framing of a hypothesis test influences
auditor skepticism. They are the first to examine how auditors react in error and non-error
settings. Non-error settings are situations where it is assumed that the error was not
intentional. Additionally, they also look at how experience and the type of evidence (i.e.,
confirming vs. disconfirming) influence auditors. The results of McMillan and White’s
study are consistent with prior studies such as Ashton and Ashton where they find that
auditors are more sensitive to disconfirming evidence. Their results also indicate that where
there is evidence of a possible confirmation bias, auditors tend to ignore disconfirming
evidence in the non-error frame. However, their results indicate that auditors are not prone
to pre-mature conclusions overall. Therefore, the results of this study are consistent with
previous studies’ findings that auditors are not confirmation biased in their decisions.
However, subsequent research suggests that auditors may be confirmation biased
(e.g., Bamber et al. 1997; Brown, Peecher, and Solomon 1999; Montague 2010). For
instance, Bamber et al. (1997) have a group of auditors examine the likelihood of fraud
involving inventory and the likelihood of collecting a material accounts receivable balance.
Results of their analysis indicate that auditors exhibit a confirmation bias in their
assessments. This suggests that auditors may be biased in certain situations towards their
initial hypotheses when evaluating audit evidence.

21
In summary, the findings in belief revision studies suggest that auditor evaluation
of evidence may be dependent on which pieces of evidence they encountered last, the
presentation of evidence, and their initial biases.
Irrelevant Information
The preceding review of belief updating research is an excellent lead-in to the
stream of literature regarding the influence of irrelevant information, as the two areas are
closely interrelated. However, please note that this study differs significantly from extant
research with respect to the source of the audit evidence. Specifically, this study simulates
use of records containing irrelevant information that are produced directly by the client
versus the second-hand anecdotal evidence used in previous research. Based on prior
research suggesting the source of evidence influences auditors’ assessment of risk (Hirst
1994), the results of the research studies discussed below may not hold in this more
personal applied context.
Extant research on literature examining irrelevant information generally finds that
irrelevant information diminishes the impact of fraud cues on auditor risk assessment
(Hackenbrack 1992; Glover 1997; Hoffman and Patton 1997; Shelton 1999). More
specifically, extant literature finds that a dilution effect (Nisbett, Zukier, and Lemley 1981)
takes place whereby the presence of additional information reduces the impact of the more
important information on auditor judgments. Furthermore, even prompting people to be
aware of a possible dilution effect seems to have no impact on preventing the effect from
occurring (Kemmelmeier 2004).
Hackenbrack (1992) examines the impact of diagnostic (i.e., relevant) and non-
diagnostic information (i.e., irrelevant information) on auditor decisions in a fraud

22
judgment scenario. Specifically, auditors read through a case study containing background
information on a company and the authors manipulate whether a fraud occurrence is
mentioned or not. Then, auditors rate a series of potential fraud indicators on whether they
would change their initial fraud risk assessment if they had been included in the case.
Hackenbrack’s results reveal that auditors given relevant and irrelevant information make
assessments that are less extreme than auditors given only relevant information. This
finding suggests that irrelevant information has a dilution effect.
Hoffman and Patton (1997), build on the work of Hackenbrack (1992) by
examining whether holding auditors accountable for their judgments helps prevent the
dilution effect. Their study utilizes a group of auditors making fraud risk assessments in
the presence of relevant and irrelevant information. In order to examine how accountability
impacts auditor judgments, some participants are required to later justify their answers to
a group of their superiors. Surprisingly, Hoffman and Patton find the dilution effect still
occurs whether auditors are held accountable for their judgments or not. However, the
authors note that auditors in the accountable condition make more conservative judgments
than those not held accountable.
Glover (1997) examines whether time pressure and accountability influences the
effect of irrelevant information on auditors. The study utilizes auditors making risk
assessments with irrelevant information present or not present. Auditor participants make
risk assessments regarding the possibility of an account being misstated. Similar to
Hoffman and Patton (1997), Glover finds that accountability has no impact on the dilution
effect of irrelevant information. Although, as mentioned earlier under the time pressure
section, Glover’s results reveal that time pressure reduces but does not eliminate the
23
dilution effect. In other words, when time pressure is present, there is evidence that auditors
are less swayed by the presence of irrelevant information.
Lastly, Shelton (1999) builds on the studies mentioned above by examining
whether experience plays a role in the appearance of the dilution effect. Shelton uses a
going concern scenario and compares the assessments of the likelihood of a company
staying in business made by staff auditors to the assessments made by audit managers and
partners. Shelton’s results indicate that the more experienced auditors were less distracted
by irrelevant information.
Overall, prior research suggests that the presence of irrelevant information impacts
an auditor’s judgment. However, all previous studies examine irrelevant information in
audit settings utilizing irrelevant information external to the records being reviewed. This
study builds on these prior studies by examining the impact of irrelevant information on
skeptical judgements and actions - within the context of a client generated record. The more
applied context in this study adds a more personal and possibly a more relevant and/or
realistic experience to the research setting. Based on prior research suggesting the source
of evidence influences auditors’ assessment of risk (Hirst 1994), the results of the research
studies discussed above may not hold in this more personal applied context.
Audit Evidence Characteristics
The “evidential inputs” component of Nelson’s model (2009) is particularly
relevant to this study’s research questions. The stream of research on evidential inputs is
extended in the Hurtt et al. (2013) model and literature review under the category of audit
evidence characteristics. Extant recent research on evidential characteristics and auditor
skepticism looks at confirming vs. disconfirming evidence (e.g., Fukukawa and Mock

24
2011; Trompeter and Wright 2012) and the source of evidence (e.g., Beaulieu 2001;
Kizirian, Mayhew, and Sneathen Jr. 2005; Harding and Trotman 2011).
Confirming vs. Disconfirming Evidence
Early studies examining confirming vs. disconfirming evidence are discussed in the
belief updating section above (e.g., Ashton and Ashton 1988; 1990). Typically, these
studies find that auditors tend to focus more on disconfirming evidence (e.g., Knechel and
Messier 1990). Disconfirming evidence typically takes the form of negative evidence or
evidence suggesting a misstatement is more likely (disconfirming an initial belief that
views the client positively or that there is no misstatement). However, positive evidence
would be disconfirming if the auditor’s initial belief is a negative assessment of the client.
More recent studies (e.g., Fukukawa and Mock 2011; Trompeter and Wright 2012)
focus on how evidence influences fraud related judgments in non-belief updating settings.
Fukukawa and Mock (2011) examine how positive or negative assertion framing impacts
the assessment of risk in a trade accounts receivable case. They also observe whether an
auditor’s risk assessment is influenced by a belief based or probability based approach to
assertion testing. Results of their study indicate that auditors make similar assessments
regardless of approach when evaluating positive assertions. However, when evaluating
negative assertions, they find that auditors are less likely to confirm management’s
assertions.
Similarly, Trompeter and Wright (2012) examine how auditor risk assessments
change based on third party information relating to client business performance.
Specifically, they examine how auditors react to three critical pieces of evidence in a fraud
setting: client provided evidence on the financial statement process, client provided

25
evidence on meeting their performance objectives, and externally obtained evidence on the
client meeting their performance objectives. They find that auditor fraud risk assessments
are most influenced by external evidence when the external evidence is inconsistent with
client provided evidence.
The above findings suggest that participants may react more strongly in situations
where irrelevant information or minor errors are present (since both manipulations could
be perceived as negative). In other words, auditors with prior negative experiences dealing
with client provided documents containing irrelevant information or minor errors may react
in a more skeptical manner than auditors without prior negative experiences with such
documents.
Source of Evidence
Auditing standards (e.g., SAS 99; AICPA 2002) require auditors to adjust their
level of skepticism based on evidence obtained. Therefore, the source of evidence is a
critical consideration in the evaluation of audit evidence. Prior research finds auditors place
greater trust in evidence received from external sources (i.e., third parties; Hirst 1994).
Harding and Trotman (2011) examine how evidence source influences auditor fraud risk
assessments in brainstorming sessions. They manipulate whether risk assessments come
from the auditor partner, from client management, or none were included. Their analysis
shows that auditors are most skeptical of assessments from the client - and respond by
making more skeptical judgments.
Other studies in this stream of research examine how management’s integrity
influences auditor evaluation of evidence (e.g., Beaulieu 2001; Kizirian et al. 2005).
Consistent with prior research, the results show that auditors tend to collect more evidence
26
from external sources when client management is viewed as being of low integrity. The
above findings suggest that auditors may react more skeptically in situations where
documents are provided by the client. In other words, when auditors are asked to make
assessments about a document provided by a client, they may be predisposed to be more
skeptical regardless of the audit evidence provided in the case.
Errors in Audit Evidence
Errors in audit evidence are discussed above in several different research streams.
For example, errors in audit evidence are included as part of auditor knowledge of errors
(e.g., Libby 1985; Ashton 1991) and belief updating (e.g., Ashton and Ashton 1988;
Fukuwa and Mock 2011). Other streams of research examine the characteristics of errors
(e.g., Kreutzfeldt and Wallace 1986; Maletta and Wright 1996; Chan, Lin, and Mo 2003)
and auditor performance when using sampling to detect errors (e.g., Wurst, Neter, and
Godfrey 1991; Allen and Elder 2005; Durney, Elder, and Glover 2014).
Studies examining errors in the context of audit sampling typically focus on finding
ways to improve auditor sampling techniques to better detect errors. For example,
examining new techniques, such as the use of rectification (Wurst et al. 1991) or modified
sieve sampling (Hoogduin, Hall, and Tsay 2010). In addition, other studies find that
auditors tend to fail to project errors found in their sampling results to the larger population
(e.g., Burgstahler and Jiambalvo 1986; Elder and Allen 1998; Allen and Elder 2005). More
recently, Durney et al. (2014) utilize historical audit firm data to identify the distribution,
frequencies and magnitudes of errors found in audits. They find a decline in post-SOX
error occurrence rates and increased use of larger sample sizes. Their findings suggest that
audit firms’ actions are more skeptical or focused on providing higher quality audits.
27
Numerous early studies examine the characteristics and causes of audit errors (e.g.,
Johnson, Leitch, and Neter 1981; Ham, Losell, and Smieliauskas 1985; Kreutzfeldt and
Wallace 1986). Hylas and Ashton (1982) examine 281 financial statement errors requiring
audit adjustments on 152 audits and find that most errors are unintentionally caused from
inexperienced client employees. They also find that most errors are caught from analytical
procedures and discussions with the client. Other studies in this area find that error
characteristics differ between cultures (e.g., errors are more prevalent and larger in
individualistic cultures; Chan et al. 2003) and more heavily regulated industries have less
errors (Maletta and Wright 1996).
More relevant to this study is research identifying the common errors auditors
encounter within specific types of accounts. Kreutzfeldt and Wallace (1986) identify the
types, frequencies, and size of errors in a dataset of 260 audit engagements across the 13
largest offices of Arthur Anderson & Co. They examine errors in accounts receivable,
inventory, fixed assets, accounts payable, and accrued liabilities. They find that errors
typically fall into one of the following categories: omission errors, duplication errors,
clerical errors, cutoff errors, judgment errors, and incorrect application of GAAP errors.
This study utilizes minor omission errors, duplication errors, clerical errors, and
cutoff errors. Moreover, in this study, minor errors are immaterial to the related account
balance as well as the overall financial results and do not appear to be intentional or
deceptive. However, in practice, minor errors may accumulate to a level (or form a pattern)
that triggers an adjustment in an auditor's level of skepticism. Therefore, this study seeks
to examine the influence of minor errors on an auditor's application of professional
skepticism.

28
III. HYPOTHESIS DEVELOPMENT
Irrelevant Information
According to the PCAOB, each individual auditor is responsible for appropriately
applying professional skepticism throughout the audit, including in the areas of identifying
and assessing the risk of account misstatements, and in the evaluation of audit evidence
(PCAOB 2012). Furthermore, the PCAOB states the objective of the auditor is to plan and
perform the audit to obtain appropriate audit evidence that is sufficient to support the
opinion expressed in the audit report (AS 15; 2010). As previously mentioned, this study
focuses on audit evidence. Irrelevant evidence is not something that, by itself, should raise
any sort of red flag to an auditor. By definition, this is evidence that is not relevant to the
decision at hand. Therefore, one might reason that the presence of irrelevant information
should have no impact on an auditor’s assessment of the sufficiency (i.e., the quantity) and
appropriateness (i.e., the quality) of audit evidence obtained or to be obtained.
However, extant research suggests that the presence of irrelevant information does
have an effect on auditors. Specifically, extant literature on irrelevant information suggests
that it can lead to a dilution effect where the strength of subsequent auditor decisions is
reduced as compared to situations where there is no irrelevant information (e.g.,
Hackenbrack 1992; Hoffman and Patton 1997). This study differs from prior studies, which
used second-hand anecdotal information. Instead, this study utilizes records produced
directly by the client (and therefore experienced first-hand by the auditor). Therefore, there
may be differences in the way irrelevant information affects auditor decisions in this
setting.
Process Accountability Theory and Epistemic Motivation
29
Recent research on process accountability theory and epistemic motivation
suggests both are related to higher quality auditor judgments (e.g., Cohen, Krishnamoorthy,
Peytcheva, and Wright 2013). Process accountability is the expectation of having to justify
your decision to others (Siegel-Jacobs and Yates 1996; Tetlock 1983). Given the
potentially harmful professional sanctions, plus the devastating costs associated with audit
failure, much auditor attention is directed towards avoiding circumstances involving
inadequate audit evidence and documentation. Therefore, the effects of accountability
could be especially evident for auditors, as they are subject to the several layers of
accountability (i.e., several layers of people reviewing their work) in an audit firm. For
instance, each workpaper prepared by a staff auditor is reviewed by more senior staff
auditors, senior auditors, supervisors or managers, directors, and sometimes even partners
and regulators, such as the PCAOB. Epistemic motivation is the desire to fully understand
the problem at hand (Scholten, Van Knippenberg, Nijstad, and Dreu 2007; Dreu and
Carnevale 2003; Kruglanski 1989). In an audit context, epistemic motivation could result
in doing additional work or consulting with an expert to gain additional comfort around an
issue.
Epistemic motivation and process accountability working in tandem or separately
could cause an auditor to exert extra audit effort that may potentially rise to the level of
unnecessary auditing. Consistent with prior research (e.g., Hoffman and Patton 1997),
when taking process accountability and epistemic motivation into account, auditors
encountering dirty client records with irrelevant information may perform additional
procedures (i.e., approach those documents with a more skeptical mindset) than they
otherwise would with clean records with no irrelevant information. Therefore, in my first
30
set of hypotheses below, I predict that auditors will have a tendency to make more skeptical
judgments and take more skeptical action when they encounter documents containing
irrelevant information. This discussion leads us to my first set of hypotheses:
H1a: Auditors presented with dirty records containing irrelevant information will
assess a greater likelihood of an account misstatement than auditors presented with
clean records.
H1b: Auditors presented with dirty records containing irrelevant information will
increase their sample size more than auditors presented with clean records.
Minor Errors
As with irrelevant information, at first glance, the presence of minor errors should
have no impact on an auditor’s assessment of the sufficiency (the quantity) and
appropriateness (the quality) of audit evidence. The presence of minor errors should have
no impact on the quality of the overall evidence obtained (assuming the errors can be
explained or fixed easily) and should not impact the overall quantity. However, auditors
are held accountable for their decisions by numerous parties (e.g., more senior auditors,
managers, directors, and partners). Therefore, they tend to make more conservative
judgments when encountering potential risks (e.g., Hackenbrack and Nelson 1996; Blay
2005; see the incentives discussion above for further detail). Accordingly, the presence of
minor errors could potentially motivate auditors to question the overall credibility of the
client documents and subsequently lead to over auditing. Thus, I predict in my second set
of hypotheses that auditors encountering minor errors in client provided records would seek
out explanations behind those errors and consequently make more skeptical judgments and
take more skeptical action. This discussion leads to my second set of hypotheses:

31
H2a: Auditors presented with dirty records containing minor errors will assess a
greater likelihood of an account misstatement than auditors presented with clean
records.
H2b: Auditors presented with dirty records containing minor errors will increase
their sample size more than auditors presented with clean records.
The Interaction between Irrelevant Information and Minor Errors
When taking both irrelevant information and minor errors into account, I predict
that the additional effort necessary to interpret the dirty records will make the minor errors
less salient and cause auditors to overlook them. This prediction is consistent with extant
skepticism research suggesting that in the presence of complex clients there is the potential
for auditors to become overwhelmed in information, potentially leading to a break down
in skepticism (Hurtt et al. 2013). Furthermore, the literature on irrelevant information and
belief updating discussed earlier (e.g., Ashton and Ashton 1988; Hackenbrack 1992)
suggests that a dilution effect can occur when information is presented simultaneously (all
at once). Such a dilution effect may cause auditors to make less skeptical judgments. Thus,
I predict in my third set of hypotheses that skepticism will be lower when irrelevant
information and minor errors are present as compared to when just one manipulation is
present (see Figure 3 below). This discussion leads us to the following hypotheses:
H3a: Auditors presented with dirty records containing irrelevant information and
minor errors will assess a greater likelihood of an account misstatement than
auditors presented with clean records, but will assess a lower likelihood than
participants presented with just irrelevant information or just minor errors.

32
H3b: Auditors presented with dirty records containing irrelevant information and
minor errors will select larger additional sample sizes than auditors presented with
clean records, but lower additional sample sizes than auditors presented with only
irrelevant information or minor errors.
[Insert Figure 3 here]
Skepticism Analysis
As noted previously, numerous studies have worked to create scales to measure a
person’s inherent level of skepticism (e.g., Schwaub 1996; Rennie et al. 2007; Hurtt 2010).
Extant literature has also examined whether scores on skepticism scales are related to
skeptical judgments (e.g., Fullerton and Durtschi 2005; Hurtt et al. 2008; Rosman 2011;
Quadackers et al. 2014). Consistent with prior studies, I intend to measure each
participant's level of skepticism to examine whether there is a relation between the
participant's inherent level of skepticism (trait skepticism) and their skeptical judgments in
this experiment. As noted earlier in the Skepticism Scales section, the Hurtt scale is most
closely related to the continuum definition of skepticism and has been validated in several
additional studies. Therefore, The Hurtt scale is used to measure participant skepticism in
this study. I predict, consistent with prior studies, that auditors who score higher on the
skepticism scale will make more skeptical judgments regardless of the circumstances. This
leads to the following hypothesis:
H4a: Auditors with higher level of trait skepticism will make larger assessments of
the likelihood of account misstatement.
H4b: Auditors with higher level of trait skepticism will select larger sample sizes.
33
IV. METHOD
Design and Participants
This study employs a 2 x 2 between-subjects design manipulating the presence of
irrelevant information in the client documents (i.e., present vs. absent) and whether there
are minor errors in the client documents (i.e., no errors vs. errors). This study also measures
each participant’s trait skepticism and examines whether it influences auditor skeptical
judgments or actions. The two primary dependent variables in this study are the increase
in the participant’s beliefs about account misstatement risk (i.e., a skeptical judgment) and
the increase in sample size (i.e., a skeptical action).
Accountants with public accounting experience were recruited through Qualtrics
Panel as participants in this study.5 Qualtrics Panel is part of a larger web-based survey
development application called Qualtrics. Qualtrics allows individuals to create surveys
and collect participant responses. Qualtrics Panel offers participant recruiting services for
researchers. A total of 100 accountants completed the instrument. Participants were
randomly assigned to one of four conditions. In addition to the Control Condition (with no
irrelevant information or minor errors) the other treatments consisted of: Treatment 1 with
no irrelevant information but minor errors are present; Treatment 2 with irrelevant
information and no minor errors; and Treatment 3 containing both irrelevant information
and minor errors.
Tasks and Procedures
Study participants were sent a link through Qualtrics Panel that provided a link to
the survey instrument.6 As shown in Appendix A, the first screen of the online instrument
5 This study was approved by the Internal Review Board at Virginia Commonwealth University. 6 The instrument in this study was pilot tested with 40 auditing students at a large southeastern university.
34
contained an information sheet describing the experiment and the voluntary nature of
participating.7 The next four screens of the instrument contained four multiple choice
screening questions designed to remove potential participants lacking accounting
experience and auditing knowledge (see Screens 2-5 in Appendix A). The first two
questions verified that participants had public accounting knowledge and experience. The
first question asked “How would you describe your primary area of expertise?” If
participants did not select “accounting/auditing” then they were removed from the survey.
The second question asked “Do you have public accounting experience?” In order to
proceed they had to answer “yes.”
Questions 3 and 4 verified participants had auditing knowledge. The third question
asked “On an audit engagement, if an account is described as high risk then which of the
following could take place?” To get this question right they had to select the answer labeled
“It’s highly likely the account is misstated.” The last question asked “On an audit
engagement, if an account is described as high risk, typically how will auditors respond
when selecting a sample of items to test?” The correct answer for this question was “They
will select a large sample of items to test.” Participants had to get all four screening
questions correct in order to proceed with the study.
Participants who passed the screening questions were then presented with a
hypothetical case scenario (see Screen 6 in Appendix A). The case scenario had
participants assume the role of a staff auditor performing the accounts receivable portion
of an audit of a hypothetical company called Sprandel, Inc., a mid-sized public company
7 Although participation was voluntary and subjects could quit at any time, Qualtrics would only
compensate them for their participation if they completed the full instrument.
35
specializing in the production of plastic shaped bottles.8 The case scenario indicated that
the audit team assessed the inherent risk for the account as high and the control risk for the
account as low. Thus, the overall risk for the account was described as moderate.
Participants were then given the task of assessing the likelihood of account
misstatement and determining the appropriate sample size. In order to provide a baseline
for assessing the likelihood of account misstatement, participants were informed that their
initial estimate of the account being misstated was 20 percent and in prior years the audit
team selected 10 items to test. Before proceeding to the review of audit evidence,
participants were required to pass a short quiz to verify they were aware of the initial risk
assessment and prior sample size (see Screen 7 in Appendix A). The first quiz question
asked them “What was your initial estimate of the likelihood of accounts receivable being
misstated?” The second question asked them “In prior years, how many items did your firm
select to sample?” In order to proceed participants had to select “20 percent” for the first
question and “10 items” for the second question. Unlike the earlier screening questions,
participants were allowed multiple attempts at selecting the correct answer.
The next screen (see Screen 8 in Appendix A) contained a task reminder to ensure
participants knew their task when reviewing the audit evidence. After that the audit
evidence screen was presented next (see Screen 9 in Appendix A). Participants were
required to view the audit evidence screen for at least 20 seconds, although the average
time participants viewed this screen across all four treatments was 60 seconds. Once
finished viewing the audit evidence, participants were presented with the two dependent
variable questions, followed by a series of debriefing questions.
8 The hypothetical company Sprandel, Inc., is adapted from a teaching case by Andiola, Lambert, and
Lynch (2017).

36
Independent Variables
The first independent variable was the presence of irrelevant information. As shown
in Appendix A (see Screen 9), this variable was manipulated at two levels (irrelevant
information present vs. not present). Participants assigned to the irrelevant information
absent condition were presented with a client document that had no irrelevant information.
This condition only showed the customer name, invoice number, invoice date, and invoice
amount. Alternatively, participants assigned to the irrelevant information present condition
were presented with a document that contained irrelevant information in the form of
unnecessary columns of information. The unnecessary columns contained information on
the state the customer is located in, the phone number of the customer, the skew code of
the items sold, and the name and number of items sold.9
The second independent variable examined the presence of minor errors. As shown
in Appendix A (see Screen 9), this variable was also manipulated at two levels (i.e., minor
errors present vs. minor errors absent). 10 In the minor errors present condition, participants
were presented with client provided audit evidence that contained five minor errors: the
total account balance did not tie to the balance sheet, there were minor typographical errors,
and there were blank spaces indicating that pieces of the information were potentially
missing. Participants assigned to the minor errors absent condition were presented with a
client document that was free from errors: the total account balance tied to the balance
sheet, there were no minor typographical errors in the information, and the information was
complete.
9 Three auditors with public accounting experience verified that the irrelevant information used in this
study accurately depicts examples of irrelevant information that auditors encounter in practice. 10 In order to determine the appropriate number and type of errors, this instrument was pilot tested with 40
undergraduate auditing students at a large southeastern university.

37
The final independent variable was a measured variable of each participant’s trait
skepticism. At the end of the experiment, participants completed the Hurtt (2010) 30 item
skepticism scale (see Screens 16-18 of Appendix A). The scale measures skepticism using
questions such as “I often accept other people’s explanations without further thought” or
“I am confident in my abilities.” Responses for each item were captured on a seven point
Likert scale with 1 representing “strongly disagree” and 7 representing “strongly agree.”
Dependent Variables
There are two primary dependent variables in this study (see Screen 10 in Appendix
A). The first dependent variable measured the participant’s beliefs about account
misstatement risk after encountering a clean versus a dirty client document. Consistent with
prior studies mentioned earlier in the belief updating section (e.g., Ashton and Ashton
1988), participants were given an initial estimate in the case description that the likelihood
of the account being misstated was 20 percent. Subsequently, after being presented with
audit evidence that varied across participants according to treatment, participants rated
their beliefs about the likelihood of the account being misstated on a scale ranging from 0
percent to 100 percent.
The second dependent variable was the participant’s choice of sample size after
encountering a clean vs a dirty client document. The initial sample size recommended to
participants was 10 client records based on prior experience with the client. However, after
reviewing the dirty document, participants were given the opportunity to choose any
sample size between 0 to 30 client records (ranging from 0 percent to 100 percent of the
items displayed).

38
Post-Experimental Questionnaire
After answering the dependent variable questions, participants completed a post-
experimental questionnaire. As shown in Appendix A (see Screens 11-19), the post-
experimental questionnaire included one manipulation check question, attention check
questions, debriefing items, demographic questions, and the scale measuring skepticism.
The manipulation check question verified errors were present and asked “Agree or
Disagree – The file sent by the client appeared to contain potential errors.” Participants
responded on a seven point Likert scale with 1 representing “strongly disagree” and 7
representing “strongly agree.” Since the presence of irrelevant information is something
participants may not be consciously aware of, there were no manipulation check question
relating to irrelevant information.
Attention check questions were added to the case to verify participants were still
actively reading each question. The first attention check question was presented after the
manipulation check questions and asked “complete this sentence: The balance sheet
equation is Assets = Liabilities + _____.” It was presented as a multiple choice question
and the correct answer was “Stockholders’ Equity.” The second attention check question
was included as part of the Hurtt (2010) skepticism scale. Instead of asking participants to
rate how closely a statement described themselves, this second attention check question
asked participants to “please select strongly disagree for this item.” This verified they were
actively reading the scale items and not just randomly selecting answers. Participants who
answered either of these questions incorrectly were removed from the study by Qualtrics
Panel.
39
The debriefing questions examined participant perceptions, experiences, and
beliefs about dirty documents. The first debriefing question used a seven point Likert scale
with 1 representing “strongly disagree” and 7 representing “strongly agree” and asked
“Agree or Disagree – Your review of the file increased you confidence in the client’s
competence.” The purpose of this question was to assess participant’s beliefs about client
competence based on how they felt about the audit evidence provided. The second
debriefing question used a seven point Likert scale with 1 representing “never” and 7
representing “all the time” and asked “How often do you or your audit team encounter
messy or dirty audit files from clients?” The next question built on the second question by
providing participants with an open ended question asking “Please briefly describe your
most noteworthy experience receiving messy/dirty files from clients.”
The next two questions examined how participants felt they are influenced by dirty
documents captured at the first and third person level. The first question captured responses
at the first person level and asked “Agree or Disagree – Client files that are messy/dirty
impact my application of professional skepticism.” While the second question addressed
the third person level and asked “Agree or Disagree – Messy/dirty documents provided by
the client can influence the application of professional skepticism by other members of my
audit team.” The purpose of the questions relating to the first and third person perspectives
was to identify whether a social desirability bias was present.
The demographic and experience questions captured age, years of public
accounting and other professional experience, and gender. In addition, participants were
asked more specifically “What types of public accounting firms have you worked for?”
and “Do you have any professional certifications?” Both questions provided several

40
potential answers in a multiple choice format and allowed participants to select more than
one answer.
V. RESULTS
Demographics and Covariates
Qualtrics rejected prospective participants that failed the screening and attention
check questions. A total of 100 accountants subsequently completed the experimental
survey questionnaire. Three participants were later removed for giving nonsensical
answers to the main dependent variables questions (e.g., they said they thought there was
a 100 percent likelihood the account was misstated, but then they selected to sample zero
items). Therefore, 97 accountants were ultimately included in the analysis.
Table 1 summarizes the demographic information of the remaining 97 participants.
As shown in Table 1, 32 percent of participants fell within the age range of 21 to 30, 26
percent within the age range of 31 to 40, 16 percent fell within the range of 41 to 50, and
27 percent were over 50 years old. The majority of participants spoke English as a first
language (93 percent). There was a fairly even number of male and female participants
with slightly more male participants (56 percent). The average years of public accounting
experience was 9.60 years, and the average years of other professional experience was 8.58
years. The most common professional certification was Certified Public Accountant (71
percent). Lastly, 27 percent had experience working for the Big 4/International (or
equivalent at the time) accounting firms, 26 percent had experience working for second tier
accounting firms, 28 percent had experience working for regional accounting firms, and 47

41
percent had experience working for local accounting firms.11 When these demographic
variables were added to the analysis as covariates, there was no evidence that the variables
were significant. Therefore, the demographic variables were not included as covariates in
subsequent analyses.
To determine whether random assignment to treatments had been achieved, the
presence of irrelevant information and the presence of minor errors were included as
independent variables in a MANOVA model, with the demographic variables mentioned
above included as dependent variables. A lack of significance was found for all
demographic variables. This finding provides some evidence that randomization was
achieved.
[Insert Table 1 here]
Debriefing Questions
As part of the post-experimental questionnaire participants answered a series of
debriefing questions designed to gauge how relevant dirty documents are in auditing. A
Likert scale was used to assign a value to the responses. As shown in Table 2, the first
question asked whether the participant’s review of the file increased their confidence in the
client’s competence. The mean response for treatments containing errors was 2.52, while
the mean responses for treatments not containing errors was 4.04. The difference between
these values is significant (p < 0.001) suggesting that the presence of minor errors had a
significant impact on participant perception of client competence. The mean for treatments
containing irrelevant information was 3.40, and the mean for conditions without irrelevant
information was 3.14. The differences between these values was insignificant (p > 0.10),
11 Since participants could select more than one answer to the questions relating to work experience and
certifications, the responses exceed 100 percent.
42
thus there were no significant differences between treatments containing irrelevant
information or not containing irrelevant information.
The second question asked how often the participant or their audit teams
encountered messy or dirty audit files. The mean response was a 4.24 where a 4.0
represented “occasionally” and a 5.0 represented “frequently.” The third and fourth
questions asked participants to agree or disagree with the statement that messy or dirty
audit files influence their application of professional skepticism and the skepticism of other
members of their audit team. The mean responses for their professional skepticism was a
5.36, and for the professional skepticism of their teammates the mean was a 5.22. The
responses to questions one, three, and four fell on a scale where 4.0 represented a neutral
response.
The last question asked how much time on average participants spent on client sites
cleaning up dirty or messy documents. This question was answered on a scale that included
a sliding bar that allowed participants to select any number between 0 and 100 percent. The
mean response was 32 percent, which suggests that cleaning up dirty or messy documents
fills a significant amount of audit staff time. In summary, the results of these questions
provide support for the motivation of this study.
[Insert Table 2 here]
Lastly, participants were asked in an open ended question to describe their most
noteworthy experience with messy or dirty files. Thirty-four participants responded to this
question (See Appendix B for a list of all the responses). Five of the responses specifically
contained the words irrelevant information and or minor/major errors. All 34 responses
described an experience where the files contained an error(s) or contained irrelevant
43
information. The responses to the open ended question suggest that fixing or addressing
minor errors and working with irrelevant information is an on-going issue for auditors and
lends further motivation to this study.
Manipulation Check Question
The manipulation check question addressed the presence of errors using seven point
Likert response scales with one representing “strongly disagree” and seven representing
“strongly agree.” The manipulation check question asked participants “Agree or Disagree
– The file sent by the client appeared to contain potential errors.” The mean response for
treatments containing errors was 5.82, and for treatments containing no errors the mean
was 3.98. There was a significant difference (p < 0.001) between conditions with and
without errors consistent with a successful manipulation of the presence of errors. The 3.98
overall mean for conditions with no errors was probably a result of using the “agree or
disagree” type Likert scale for responses. Participants who were unsure of whether errors
were present or not may have selected a neutral response of 4 representing “neither agree
nor disagree” to be safe. Additionally, the mean response for treatments containing
irrelevant information was 4.93, and the mean response for treatments without irrelevant
information was 4.92. There was no significant difference (p > 0.10) between these
treatments providing evidence that the presence of irrelevant information did not influence
participant’s perception of errors being present. Overall, the results of this question
indicates that the manipulation of the presence of minor errors was successful.
Test of Hypotheses
The two primary dependent variables are the increase in the likelihood of account
misstatement risk and the increase in sample size. The likelihood of account misstatement
44
was captured on a scale from 0 percent to 100 percent. Then the increase in likelihood of
account misstatement was calculated by subtracting the initial likelihood of misstatement
(20 percent) from each participant’s response. The sample size was captured on a scale
ranging from 0 items to 30 items. To calculate the increase in sample size, the initial sample
size (10 items) was subtracted from each participant’s response. Descriptive statistics are
summarized in Table 3.
[Insert Table 3 here]
Tests of Hypothesis 1a and 1b
To investigate how auditors as a whole are influenced by dirty documents,
Hypotheses 1, 2, and 3 were tested using a multivariate analysis of variance (general linear
model).12 The results are reported in Table 4 and shown in Figure 4 and 5. H1 examines
the main effect of irrelevant information on the increase in likelihood of account
misstatement and the increase in sample size. H1a predicts that auditors will assess a
greater likelihood of an account misstatement when they encounter irrelevant information.
Similarly, H1b predicts that auditors will select a larger sample size when they encounter
irrelevant information. As shown in Table 4, the main effect for irrelevant information is
insignificant for the increase in account misstatement likelihood (F(1, 93) = 2.263, p >
0.10) and significant for increase in sample size (F(1, 93) = 4.969, p < 0.05). These findings
fail to provide evidence in support of H1a, but find evidence in support of H1b. The change
in sample size suggests that irrelevant information may be perceived suspiciously and
while the risk assessment does not immediately increase, auditors cover themselves by
increasing the sample size.
12 Experience was examined as a co-variate in this model, but was not significant.

45
Tests of Hypothesis 2a and 2b
Hypothesis 2 examines the main effect of minor errors on the increase in likelihood
of account misstatement and the increase in sample size. H2a predicts that when minor
errors are present, auditors will assess a greater likelihood of an account misstatement.
Similarly, H2b predicts that when minor errors are present auditors will increase their
sample size. As shown in Table 4, the main effect for minor errors is significant for increase
in account misstatement ((F(1, 93) = 5.332, p < 0.05) and increase in sample size (F(1, 93)
= 4.969, p < 0.05). Consistent with H2a and H2b, these findings provide evidence that the
presence of minor errors significantly influences auditor judgment regarding the likelihood
of account misstatement and the audit sample size.
Tests of Hypothesis 3a and 3b
Hypothesis 3 examines the interaction between the presence of irrelevant
information and the presence of minor errors. Specifically, H3a and H3b predict that when
both manipulations are present then a dilution effect will occur where auditors react less
strongly than they would if only one manipulation was present. As shown in Table 4, the
interaction between irrelevant information and minor errors was insignificant for both the
increase in account misstatement likelihood (F(1, 93) = 0.032, p > 0.10) and for increase
in sample size (F(1, 93) = 0.499, p > 0.10). Thus, these results find no evidence of an
interaction between the presence of irrelevant information and the presence of minor errors.
[Insert Table 4 here]
To further analyze the main effects found above, a Games-Howell post hoc test was
conducted. A Games-Howell post hoc test was used after a Levene’s test for homogeneity
was found to be significant. Therefore, the assumption of equal variances could not be

46
assumed. Results of the Games’ Howell post hoc test reveal that the Control condition
(where neither irrelevant information nor minor errors were present) and Treatment 3
(where both irrelevant information and minor errors were present) were significant for both
change in misstatement amount (p < 0.10) and change in number of items (p < 0.05).
Consistent with the results above, these findings suggest that both irrelevant information
and minor errors influence auditor judgments and actions.
Tests of Hypothesis 4a and 4b
Hypothesis 4 examines whether auditors with higher levels of trait skepticism make
more skeptical judgments and take more skeptical action. H4a predicts that auditors with
higher levels of trait skepticism will make larger assessments of the likelihood of the
account being misstated than those with lower levels of skepticism. Similarly, H4b predicts
that auditors with higher levels of trait skepticism will select larger sample sizes. Consistent
with auditors tested in Hurtt (2010), the overall average skepticism score for participants
in Experiment 1 was 75.58 (see Table 5 for details on responses to the Hurtt scale).13
[Insert Table 5 here]
In addition, the consistency of trait skepticism scores was tested across the four
treatment conditions using a one-way ANOVA and no significant differences were noted
(p > 0.10). This finding suggests that the average trait skepticism score of participants was
constant across the four conditions and that viewing different manipulations did not
inadvertently bias skepticism scale scores. To investigate H4a and H4b, a multivariate
analysis of variance (general linear model) was used. As shown in Table 6, trait skepticism
did not have a significant impact (p > 0.10) on the likelihood of misstatement or sample
13 Auditors surveyed in Hurtt (2010) scored a 75 on one occasion and a 77 on another occasion.
47
size. There was also no interaction between trait skepticism and the presence of irrelevant
information or the presence of minor errors. Thus, H4a and H4b were not supported.
Therefore, inconsistent with prior trait skepticism studies (e.g., Hurtt et al. 2008; Rosman
2011; Quadackers et al. 2014) the results do not provide evidence that the auditors’ trait
skepticism influenced their decisions in the experiment. Perhaps the similar training
auditors receive is responsible for the lack of difference between high and low skeptics.
[Insert Table 6 here]
[Insert Figure 4 and 5 here]
Supplemental Analysis
In order to examine whether participant beliefs about client competency influenced
their skeptical judgment and skeptical action, a supplemental mediation analysis was
conducted using the Hayes (2012) PROCESS tool in SPSS. Table 7 and Figure 6 show the
results simple mediation model tests (PROCESS Model 4). As shown in Table 7 four
mediation models were tested to see if participant beliefs about client competency mediated
the relationship between irrelevant information and minor errors and the dependent
variables misstatement likelihood and sample size. As shown in Table 7 Panel B and in
Figure 6, client competency was found to fully mediate the association between minor
errors and misstatement likelihood (coeffminor errors = -1.52, p = 0.000 and coeffclient competency
= -5.72, p = 0.004). This suggests that participant judgments about the likelihood of account
misstatements were influenced by their beliefs about client competency. The lack of
significance when sample size was the dependent variable in the model suggests that
perceived client competency had no influence on the selected sample size. In addition, the
lack of results for irrelevant information, suggests that the presence of minor errors had a
48
greater influence on participant beliefs about client competency than the presence of
irrelevant information.
[Insert Table 7 here]
[Insert Figure 6 here]
VI. CONCLUSION
The purpose of this study was to investigate how auditors are influenced by the
presence of irrelevant information and minor errors when reviewing audit evidence
produced by the client. To address that question this paper conducted an experiment
designed to examine how public accountants respond to dirty documents. Participants with
public accounting experience assumed the role of a staff auditor completing the accounts
receivable portion of an audit. Their task was to review a client provided piece of audit
evidence and to determine what the likelihood of misstatement and the appropriate sample
size for the resulting audit test.
There are four key findings. First, the results indicate that the presence of irrelevant
information and minor errors influenced subsequent auditor skeptical judgments and
actions. Specifically, the presence of minor errors in audit evidence led to increases in the
estimates of account misstatement likelihood and led to increases in sample size. In
instances where irrelevant information was present, auditors kept the likelihood of
misstatement constant, but responded by increasing the sample size. The change in sample
size suggests that irrelevant information may be perceived suspiciously, and while the risk
assessment does not immediately increase, auditors cover themselves by increasing the
sample size. Perhaps the similar actions indicate that auditor training acts as a modifier for
trait skepticism. Second, this study provides evidence that a dilution effect does not always

49
occur when auditors are provided with irrelevant information. Prior literature using second-
hand anecdotal evidence finds that the strength of auditor decisions is reduced when
auditors are provided with irrelevant information. This study’s audit setting utilizes records
produced directly by the client (and therefore experienced first-hand by the auditor) and
finds that no dilution effect occurs.
Third, responses to debriefing questions indicate that as much as 30 percent of an
auditor’s time on-site can involve cleaning up dirty client documents. This finding serves
to support the notion that dirty documents may contribute to over auditing, which is a waste
of financial resources and a stressful misuse of audit staff. Lastly, although a number of
prior studies find trait skepticism to be influential, our study adds to the growing evidence
(e.g., Carpenter and Reimers 2013) that this may not always be the case. In other words,
auditors with higher levels of trait skepticism are not more likely to make more skeptical
judgments when evaluating audit evidence.
The results of this study are subject to the limitations that apply to any research that
employs a judgment and decision making setting. In addition, the lack of being able to
identify where auditors focused their attention when making their assessment of the audit
evidence is also a limitation. The results show that trait skepticism influences skeptical
judgment; however, without being able to identify what participants focused on while
reviewing the audit evidence it is difficult to fully understand how the auditor completes
their task. This limitation provides motivation to extend this experiment by using eye-
tracking technology to identify what specific audit evidence is perceived as most relevant.
Therefore, in Part 3, this paper utilizes eye-tracking equipment to record each participant’s
eye movements while reviewing the audit evidence.

50
Part 2: If Eyes are the Window to Our Soul, What Role does Eye-Tracking Play in
Accounting Research?
I. INTRODUCTION
Eye-tracking technology has the potential to be extremely useful in accounting
research. This paper discusses some key features of eye-tracking technology and reviews
eye-tracking JDM research. Eye-tracking technology enables us to identify the specific
factors focused upon in performing a decision making task. In addition, eye-tracking also
enables us to identify the visual search strategies employed in performing a decision
making task. Eye-tracking metrics provide evidence as to what data engage a person’s
attention. In a decision making setting, a person’s focus of attention suggests what
information is perceived as most relevant to the task (Glöckner and Herbold 2011; Oliveira
et al. 2016).
Contemporary state-of-the-art eye-tracking technology provides an unprecedented
opportunity for accounting research. Until recently, eye-tracking technology was a
relatively unknown and unwieldly tool to use. Early eye-tracking was a slow process that
required researchers to analyze eye-tracking data frame by frame. However, companies
like Apple, Microsoft, and Google ramped up interest by integrating eye-tracking features
into consumer electronic devices (Chen, Jermia, and Panggabean 2016). In addition,
companies such as Gazepoint, Eye Tribe, Locarna, and Tobii adapted the technology to
more practical desktop and laptop eye-trackers. The improved mobility, precision and
integrated analytic software tools raise eye tracking to an entirely new level of
functionality. For example, the eye-tracking equipment from Tobii captures images at a
51
rate of 60 images per second with an accuracy of 0.4 degrees (i.e., roughly the size of a
letter in a word file).
Prior to the development and increased availability of eye-tracking technology,
accounting researchers used verbal protocol analysis to conduct visual attention research
in accounting. Verbal protocol analysis requires participants to verbally think aloud or self-
report as they work through a task (Bouwman 1985). However, verbal protocol analysis
has several potential limitations. For example, participants may not be able to accurately
report their mental processes, the act of reporting may cause participants to think
differently, and the researcher could have trouble encoding and/or be biased in their coding
of participant responses (Hayes 1982; Hoque 2006).
Eye-tracking technology not only eliminates some of the problems associated with
verbal protocol analysis, but also offers certain advantages over verbal protocol analysis.
The advantages of eye-tracking technology include: (1) capturing data in real-time while a
test subject performs a decision making task; (2) gathering data relating to unconscious
cognitive processes that would otherwise be impossible to gather with self-reporting; (3)
measuring constructs that people are unable, uncomfortable, or unwilling to truthfully self-
report; and (4) a relatively autonomous data collection process which minimizes participant
manipulation, subjectivity bias, social desirability bias, and demand effects (Dimoka et al.
2012).
On the other hand, there are some relative disadvantages. The eye-tracking
equipment can be costly.14 Scheduling and calibrating multiple test subjects (one at a time)
for the eye-tracking lab may be time consuming and complicated. Also, large amounts of
14 The equipment manufacturers did not respond to my inquiries regarding cost. However, the VCU eye-
tracking equipment (2 computers) was $30,000.

52
eye scan data may be collected. Depending on the circumstances, it may be difficult to
interpret this data (Rayner 1998; Djamasbi 2014).
At first glance it may seem eye-tracking is the preferred method to use over verbal
protocol analysis. However, they could actually work to complement each other in practice.
For instance, eye-tracking highlights where peoples’ attention is focused when performing
a task, but does not explain why they focused their attention in that area. Verbal protocol
analysis offers the possibility that the participant may reveal why they are focusing their
attention on a particular area when performing a task.
Despite a call to use eye-tracking in accounting research by Birnberg and Shields
(1984), only four recent studies in accounting utilize eye-tracking technology (Kramer and
Maas 2016; Sirois, Bedard, and Bera 2015; Chen et al. 2016; Bellora-Bienengräber,
Mertins, and Bassen 2017). Perhaps accounting researchers were discouraged by the
unwieldiness and expense of earlier versions of eye-tracking equipment, and/or perhaps
the earlier analytical software was perceived as clumsy or imprecise. In any event, although
accounting research appears slow to utilize eye-tracking technology, other disciplines such
as psychology (e.g., Armstrong and Olatunji 2012), education (e.g., Lai et al. 2013), and
marketing (e.g., Wedel and Pieters 2008) extensively use eye-tracking technology.
Therefore, the purpose of this paper is to identify areas where eye-tracking may
enhance research in accounting. In addition, this paper reviews extant literature where eye-
tracking is applied to various judgment and decision-making contexts. Finally, this paper
provides an overview of the common eye-tracking metrics and their application in research.
The remainder of this paper will be organized into the following sections: Section II
provides background on eye-tracking technology, Section III describes the structure of the
53
literature review, Section IV reviews and synthesizes the literature, Section V provides
suggestions for future research, and Section VI presents the overall conclusions.
II. EYE-TRACKING METRICS AND THEIR USES
Orquin and Loose (2013) define attention as selectivity in perception. Since “[t]he
primary objective of accounting is to provide information that helps decision makers make
better decisions” (Bouwman 1985 pp1), it is important for researchers to investigate how
accountants and other related professionals make decisions. One component of examining
the decision-making process is determining on what or where people focus their attention
when making decisions. Extant research indicates that eye fixations (i.e., when someone
focuses their visual gaze on a single location) are a good indirect measure of visual
attention (e.g., Deubel and Schneider 1996; Hoffman and Subramaniam 1995; Glaholt and
Reingold 2009). Thus, eye-tracking technology allows researchers to examine where
attention is focused when making decisions (See Table 8 for examples of common eye-
tracking technologies used in studies reviewed in this paper). Common measures of
attention include: fixations, dwell time, areas of interest, saccades, and heat maps or gaze
plots.
[Insert Table 8 here]
Fixation is a term used to describe when someone looks at a particular data element
or location for an extended period of time (Duchowski 2002). The more times or the longer
someone fixates on a particular spot in an eye-tracking study, the greater the number of
fixations or fixation time. Extant research on fixations suggests that fixations reflect and
influence preferences (Armel et al. 2008; Krajbich et al. 2010, 2012) and that people have
a higher fixation likelihood on attributes relevant to reaching a decision (Glöckner and

54
Herbold 2011; Oliveira et al. 2016). Research in neuroscience also finds evidence that
fixations are associated with portions in the brain associated with decision making (Lim,
O’Doherty, and Rangel 2011).
Dwell time is a term used to describe the sum of fixations in one area before a
participant fixates on another area (Bialkova and van Trijp 2011). Longer dwell times,
fixation durations, gaze times indicate higher levels of processing (Velichokovsky 1999;
Velichokovsky, Rothert, Kopf, Dornhofer, and Joos 2002; Glöckner and Herbold 2011).
Longer fixations or dwell times spent on specific points could also suggest participants
have trouble interpreting evidence (Goldberg and Kotval 1999).
Areas of interest (AOI) or regions of interest are areas of visual interest defined by
the researcher during the experiment (Kim, Seligman, and Kable 2012; Su, Rao, Li, Wang,
and Li 2012; Ashby and Rakow 2015). Researchers use AOI’s to compare and contrast the
amount of time participants spend viewing particular areas of a visual stimulus. For
example, Chen and Pu (2010) examine how online shoppers react to two different
recommendation interfaces for products. They define areas of interest as groupings of
products in the two interfaces and investigate the frequency and dwell time participants
fixate on those areas.
Saccades are quick eye movements between locations or fixations (Sperling and
Weichselgartner 1995; Pieters and Warlop 1999; Su et al. 2012). Researchers use saccades
to track eye-movement, as well as to examine the number of times participants shift
between areas of interest or within areas of interest. For instance, Pieters and Warlop
(1999) find that the number of inter-brand saccades increase and the number of intra-brand
saccades decrease when consumers are making product decisions under time pressure.
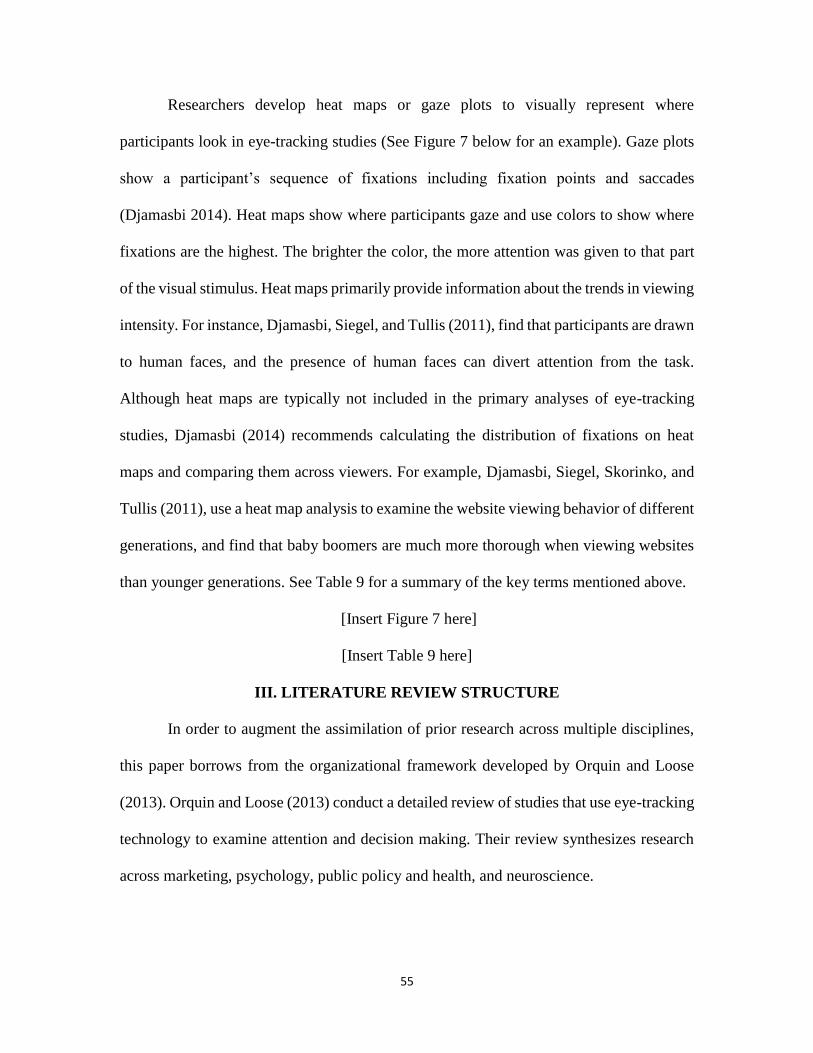
55
Researchers develop heat maps or gaze plots to visually represent where
participants look in eye-tracking studies (See Figure 7 below for an example). Gaze plots
show a participant’s sequence of fixations including fixation points and saccades
(Djamasbi 2014). Heat maps show where participants gaze and use colors to show where
fixations are the highest. The brighter the color, the more attention was given to that part
of the visual stimulus. Heat maps primarily provide information about the trends in viewing
intensity. For instance, Djamasbi, Siegel, and Tullis (2011), find that participants are drawn
to human faces, and the presence of human faces can divert attention from the task.
Although heat maps are typically not included in the primary analyses of eye-tracking
studies, Djamasbi (2014) recommends calculating the distribution of fixations on heat
maps and comparing them across viewers. For example, Djamasbi, Siegel, Skorinko, and
Tullis (2011), use a heat map analysis to examine the website viewing behavior of different
generations, and find that baby boomers are much more thorough when viewing websites
than younger generations. See Table 9 for a summary of the key terms mentioned above.
[Insert Figure 7 here]
[Insert Table 9 here]
III. LITERATURE REVIEW STRUCTURE
In order to augment the assimilation of prior research across multiple disciplines,
this paper borrows from the organizational framework developed by Orquin and Loose
(2013). Orquin and Loose (2013) conduct a detailed review of studies that use eye-tracking
technology to examine attention and decision making. Their review synthesizes research
across marketing, psychology, public policy and health, and neuroscience.

56
Orquin and Loose (2013) organize their findings from studies examining attention
and decision making into four categories: stimulus driven attention, goal-driven attention,
attention and working memory, and down-stream effects. For this review, this paper uses
three of the four categories from Orquin and Loose (See Figure 8 for further detail). The
fourth category was dropped because it is already covered as a subset of the other three. In
addition, this paper also includes more recent studies, including four in accounting. Lastly,
for each category this paper identifies potential areas of future research or application in
accounting.
[Insert Figure 8 here]
IV. LITERATURE REVIEW
Goal-Driven Attention
Goal-driven attention (also known as top-down processing or endogenous
attention) occurs when a person’s focus of attention pertains to the demands of the task
(Theeuwes 2010; Orquin and Loose 2013; Meißner, Musalem, and Huber 2016). One could
argue that eye-tracking research relating to goal-driven attention is particularly applicative
to accounting/auditing tasks. An auditor, for example, assigned the task of assessing the
likelihood of an account misstatement, must focus attention on data elements/information
that are relevant to the task. Consistent with Orquin and Loose (2013), this paper organizes
research in this area into the following five subcategories: task instructions, utility effect,
heuristics, attention phases, and learning effects.
Task Instructions
Goal-driven attention may be influenced by the nature of the task instructions or
goals. Research in this area finds that different task-specific instructions or different goals

57
can lead to different scan paths through the same stimuli (e.g., Yarbus 1967; Glöckner,
Fiedler, Hochman, Ayal, and Hilbig 2012; Kim et al. 2012; Toubia, de Jong, Stieger, and
Füller 2012). Other research focuses on how changes in task specific demands influence
attention (e.g., Pieters and Warlop 1999; Selart, Kuvaas, Boe, and Takemura 2006). For
instance, Pieters and Warlop (1999) examine how consumer brand choice varies depending
on the presence of time pressure and the presence of high motivation to perform well. They
find that people work faster under time pressure and slower when there is high motivation
to perform well. Specifically, in terms of eye-tracking, they find the presence of time
pressure leads to lower fixation durations among alternatives and increased inter-brand
saccades. While the presence of high motivation to perform well leads to higher fixation
durations and lower inter-brand saccades. Similarly, other studies investigate how changes
in task specific motivation (e.g., the motivation to select the healthy option) influence
attention and find results consistent with task specific demands (e.g., Visschers, Hess, and
Siegrist 2010; Bialkova and Trijp 2011; Van Herpen and Van Trijp 2011).
Utility Effect
Goal-driven attention may be influenced by a utility effect. The utility effect
basically says that people focus relatively more on information that is perceived to have
greater importance or value for the task (Glöckner et al., 2012). The utility effect is the
most robust finding from eye-tracking studies in decision making and has been
demonstrated across a variety of tasks (Orquin and Loose 2013). Important findings in this
area include that participants tend to have more fixations on attributes of greater importance
to their decision (Glöckner and Herbold, 2011; Glöckner et al., 2012; Meißner et al. 2016),
longer first fixation durations (Glaholt & Reingold, 2012), and longer first dwell durations

58
on the items of final selection (Glaholt and Reingold 2009, 2011; Schotter, Berry,
McKenzie, and Rayner 2010). In other words, people spend more time initially and more
time in general focusing on the items or the attributes of those items they believe are most
relevant to their decision.
Eye-tracking research also finds that people are likely to have their first and last
fixations on the item they ultimately select (Glaholt and Reingold 2011; Schotter et al.
2010; Krajbich and Rangel, 2011). Furthermore, numerous studies find that the likelihood
of fixating on the option they will ultimately select increases until the decision is made
(e.g., Atalay, Bodur, and Rasolofoarison 2012; Fiedler and Glöckner 2012). This emphasis
on the option of choice in decision making tasks is called the gaze cascade effect (Shimojo,
Simion, Shimojo, and Scheier 2003). This gaze cascade effect is supported by numerous
studies (e.g., Meißner et al. 2012; Shi et al. 2013). Conversely, recent studies such as
Nittono and Wada (2009) and Bird, Lauwereyns, and Crawford (2012) provide evidence
that gaze allocation (i.e., where people allocate their visual attention) has no impact on
final decisions and therefore reject the gaze cascade effect. As an alternative to the gaze
cascade effect, Glaholt and Reingold (2009a; 2009b; 2011) develop an analysis based on
dwell sequences that illustrates that dwell frequencies and dwell times increase towards the
chosen option in decision making.
Heuristics
Heuristics are methods or shortcuts people use to help solve problems and make
decisions more quickly in information rich environments (e.g., Gigerenzer et al. 1999).
Heuristics may also influence goal driven attention. Bounded rationality models (see
Simon 1957) suggest that people use heuristics to make decisions when they face situations
59
that exceed their processing capacity. Consistent with bounded rationality models, eye-
tracking research finds that heuristics influence attention (e.g., Day, Lin, Huang, and
Chuang 2009; Day 2010; Renkewitz and Jahn 2012). For instance, Day et al. (2009)
manipulate the type of decision making strategy employed by subjects (weighted additive
rule (WADD) vs. elimination by aspects method (EBA)). They find that participants using
the WADD search strategy view more information and spend more time re-visiting pieces
of information than participants using the EBA strategy. These findings suggest that the
type of heuristic used could influence where people focus their attention.
Despite the eye-tracking research findings suggesting heuristics influence attention,
efforts in eye-tracking to predict behavior using only one heuristic has often been
unsuccessful (e.g., Knoepfle, Tao-yi Wang, and Camerer 2009; Glöckner and Herbold,
2011; Shi et al. 2013). For example, Shi et al. (2013) investigate how consumers make
decisions on comparison websites that use matrices to evaluate different attributes between
products. Results of their eye-tracking analysis indicate that decision makers frequently
shift their attention between alternative and attribute-wise transition patterns within a single
decision task. In other words, they find that decision makers tend to shift between focusing
on different alternatives, and focusing on specific attributes of alternatives, suggesting that
consumers do not use one single heuristic when making decisions.
Attention Phases
Goal-driven attention may also be influenced by the phase of the task. Eye-tracking
research finds that attention during decision making tasks can be broken down into the
following three general phases: overview (beginning of the task), comparison (middle of
the task), and checking (end of the task) phases (Russo and Leclerc 1994; Clement 2007;

60
Glaholt and Reingold 2011). For example, Krajbich and Rangel (2011) and Krajbich et al.
(2012), provide evidence that fixations during the overview phase and checking phase are
much shorter than the fixations during the comparison phase. Similarly, Glöckner and
Herbold (2011) find evidence that the first 10-20 initial fixations in choice tasks are much
shorter than later fixations. These findings suggest that people focus their attention on
information more during the comparison phase.
Learning Effects
Goal-driven attention may also be impacted by a learning effect associated with
repeated exposure to the task. Eye-tracking research on learning effects looks at how
repeated trials influence the attention of participants when completing decision tasks.
Results of these studies indicate that as participant learning increases, the number of
fixations decreases (Bialkova and van Trijp 2011; Knoepfle et al. 2009; Fiedler and
Glöckner 2012; Ashby and Rakow 2016). In addition, there is evidence that the utility
effect (i.e., people tend to focus on the pieces of information they believe to be the most
relevant) increases with learning and participants fixate more on important attributes in
their decisions (Meißner and Decker 2010; Meißner et al., 2012; Meißner et al. 2016).
These results suggest that the more experience people have with tasks, the less time they
need to view details before reaching a decision.
In accounting, Kramer and Maas (2016) investigate whether learning effects lead
to an evaluation bias in a performance review setting. Kramer and Maas manipulate
whether subjects previously recommend for or against promoting a subordinate, and then
have subjects rate the performance of the same subordinate in the current period after
reviewing a balanced scorecard. Results of their analysis show that prior experience leads

61
to bias in performance judgments, but it does not have any impact on the attention placed
on the various attributes of the scorecard.
Stimulus Driven Attention
Stimulus driven attention (also known as bottom-up processing or exogenous
attention) describes situations where attention is influenced by the attributes of the
stimulus. These attributes include saliency, surface size, visual clutter, and position
(Corbetta and Schulman 2002; Theeuwes 2010; Orquin and Loose 2013). Eye tracking
research relating to stimulus-driven attention is potentially applicable to
accounting/auditing tasks. For example, in a set of financial statements, our attention may
be influenced by: a full page colorful graphics, bold text, the amount of detail or lengthy
footnotes, and the overall organization of the information. Consistent with Orquin and
Loose (2013), this paper organizes research observations in this area into the following
four subcategories: saliency, surface size, visual clutter, and position.
Saliency
In eye-tracking research saliency refers to objects that stand out compared to others.
Eye-tracking research on saliency finds that people pay relatively more attention to
attributes that stand out compared to others when making decisions (e.g., Lohse 1997;
Biaalkova and van Trijp 2011; Mormann, Navalpakkam, Koch, and Rangel 2012;
Mormann, Towal, and Koch 2013). For example, Lohse (1997) examines how people react
to changes in advertisement attributes in the yellow pages. He finds that people spend more
time viewing advertisements that stand out in terms of color or bold text. Similarly,
Bialkova and van Trijp (2011) and Mormann et al. (2012), find, in a consumer purchase
setting, that the relatively more salient attributes of products attract greater attention. This
62
bias ultimately has downstream effects as well (i.e., this bias influences the final decision),
as results indicate that consumers tend to make decisions in favor of the more salient option
(Lohse 1997; Mormann et al. 2012; Navalpakkam, Kumar, Li, and Sivakumar 2012;
Orquin, Scholderer, and Jeppesen 2012).
Surface Size
Surface size refers to the amount of space a visual object takes up. Eye-tracking
research on surface size finds that the greater the surface size the greater the level of
attention (e.g., Lohse 1997; Janiszewski 1998; Chandon, Hutchinson, Bradlow, and Young
2009). Lohse (1997) finds that advertisements that take up more space attract more
attention (i.e., the more fixations and longer dwell times) than smaller advertisements in
the yellow pages. Similarly, Chandon et al. (2009) examine surface size when considering
in-store arrangements of product. They find that the greater number of facings of a product
on a store shelf the more attention that product receives and the greater the likelihood of
its selection.
Visual Clutter
Visual clutter refers to the presence of excess items, level of detail, or general
organization of information within a specified viewing area. For instance, whether there
are five easy to read columns on a spreadsheet versus ten hard to read columns on a
spreadsheet. Eye-tracking research on visual clutter finds that people pay less attention to
individual attributes with cluttered products (e.g., Visschers et al. 2010; Orth and Crouch
2014). For instance, Visschers et al. (2010) examine consumer choice of breakfast cereals
with a focus on selecting a healthy option. Results indicate that with more cluttered product
designs participants spend less time (i.e., dwell time) looking at nutrition labels. This
63
suggests that the more stimuli a person has to take in when making a decision, the less
attention that person will use to assess the individual attributes of that decision.
Position
Numerous eye-tracking studies find that positioning of information impacts
attention (e.g., Sütterlin, Brunner, and Opwis 2008; Chandon et al., 2009; Huang and Kuo
2011; Scholz, Helversen, and Rieskamp 2015). For example, the location of information
in a list or among various options can determine the level of attention it receives. In eye-
tracking research, when consulting a list, a list position effect occurs (e.g., Sütterlin et al.
2008; Chen and Pu 2010; Huang and Kuo 2011; Shi, Wedel, and Pieters 2013). For
example, Sütterlin et al. (2008) find that items at the top of a list tend to receive more
attention (i.e., more fixations and longer dwell times) than items at the bottom of a list.
This is possibly a result of decision makers preferring to read left to right or top to bottom
(Orquin and Loose 2013). Therefore, items at the bottom of the list or to the right in an
assortment of options receive less attention.
In a consumer product choice setting, eye-tracking research finds evidence of a
central position effect (e.g., Chandon et al., 2009; Chen and Pu 2010; Glaholt, Wu, and
Reingold 2010; Navalpakkam et al. 2012; Shi, Wedel, and Pieters, 2013). For instance,
Chandon et al. (2009), examine consumer choice among products located on a store shelf.
They find that consumers give products on the center of the shelf more attention (i.e., more
fixations and longer dwell times) and are more likely to select them over products located
on other areas such as the bottom of the shelf. Tatler, Hayhoe, Land, and Ballard (2011)
argue this is because people tend to focus on the center of the screen, but Atalay et al.
64
(2012) provide evidence that people focus on the centrally positioned item regardless of
location of information.
Attention and Working Memory
Eye-tracking research in attention and working memory examines the biological
limitation in our ability to process relevant information (Awh, Vogel, and Oh 2006).
Although eye-tracking studies in this area include both stimulus-driven and goal-driven
attention processes, the unique nature of this research warrants its own separate section.
Consistent with Orquin and Loose (2013), this paper organizes research in this area into
the following seven subcategories: consideration sets, pairwise comparisons, information
complexity, presentation effects, decision difficulty, time pressure, and distractors.
Consideration Sets
Consideration sets are sub-sets of information within a set of choices that decision
makers base their decision on (Howard and Sheth 1969). For example, if you have ten
initial options, but narrow your final decision down to two or three options then those two
or three final options would be the consideration set. Eye-tracking research in this area is
motivated by the findings of several studies indicating that people ignore portions of
available information when making decisions (e.g., Chen and Pu 2010; Ghaholt, Wu, and
Reingold 2010; Toubia et al. 2012; Ashby and Rakow 2015). Thus, eye-tracking research
on consideration explores why people ignore portions of available information when
making decisions. Consideration sets tend to include one to four alternatives (Shi et al.
2013), options in the consideration set are more likely to be selected as the final choice
(Chandon et al. 2009), and there is also a tendency to focus attention on items in the
consideration set (Glaholt et al. 2009). Unfortunately, it is still unclear as to why certain

65
information is included or not included in a decision set. However, it appears that
consideration sets may function as an unconscious mechanism for reducing working
memory load (i.e., total mental effort).
Pair-wise Comparisons
Pair-wise comparisons refer to a situation where a person compares several items
by looking back and forth between them. Eye-tracking research finds that people use pair-
wise comparisons to evaluate two, three, or four alternatives (Russo and Rosen 1975; Russo
1978; Russo and Leclerc 1994). Studies in this area find people prefer to perform
comparisons among two items versus three or four (Glaholt and Reingold 2011), and that
people prefer comparing items located close together or under a similar brand (Russo and
Rosen 1975; Van Raaij 1977; Ballard, Hayhoe, and Pelz 1995). Overall, these results
suggest people unconsciously seek out ways to reduce working memory load when making
decisions.
Information Complexity
As used in eye-tracking research, information complexity refers to the number of
choices or number of attributes that must be processed in performing the task. Eye-tracking
research finds that as the number of choices or attributes increases, there is an increase in
the number of fixations, but a decrease in the total amount of information viewed (e.g.,
Horstmann, Ahlgrimm, and Glöckner 2009; Reutskaja, Nagel, Camerer, and Rangel 2011;
Wang, Yang, Liu, Cao, and Ma 2014). In terms of dwell time, eye-tracking research finds
conflicting results. In some instances, dwell time increases (Horstmann et al. 2009; Wang
et al. 2014) and others where dwell time decreases as information complexity increases
(Chen and Pu 2010; Reutskaja et al. 2011; Orth and Crouch 2014). These findings appear

66
to suggest that there is a biological limit as to how much available information a person
can process in working memory.
Presentation Effects
Presentation effects research in eye-tracking explores how the format of
information influences attention. Eye-tracking research indicates that the use of written
product representations or descriptions instead of images can lead to fewer fixations,
shorter dwell times, and different attributes being fixated on (Van Raaij 1977; Smead,
Wilcox, and Wilkes 1981; Van Herpen and Van Trijp 2011; Loose and Orquin 2012). For
example, Van Herpen and Van Trijp (2011) examine how consumers react to different
nutrition label formats when goals and time constraints are varied. They find that
consumers focus on product logos and packaging design instead of information in nutrition
tables. Similarly, Townsend and Kahn (2014) compare product choices when confronted
with verbal product descriptions versus visual product descriptions, and find evidence that
people take longer to process information with the visual stimuli compared to the verbal
stimuli. Thus, these studies suggest presentation format can influence working memory
load (i.e., total mental effort) and impact what attributes consumers fixate on.
In accounting, several recent eye-tracking studies examine how presentation effects
impact decision making (Sirois et al. 2015; Bellora-Bienengräber et al. 2017; Chen et al.
2016). Sirois et al. (2015) investigate whether adding a key audit matters section to an audit
report impacts non-professional investors. Their results indicate that the addition of a key
audit matters sections can increase attention to specific financial statement disclosures.
They also find evidence of a potential negative impact. Specifically, they find that non-
67
professional investors perceive there to be different levels of assurance between different
accounts and investors have lower perceptions of audit quality.
Bellora-Bienengräber et al. (2017) and Chen et al. (2016) both examine manager
decision making when using balanced scorecards. Bellora-Bienengräber et al. (2017)
examine how the format of corporate social responsibility (CSR) information in a balanced
scorecard influences manager evaluations of subordinates. They manipulate the presence
of time pressure and the format of CSR information in a balanced scorecard and measure
the impact on performance evaluations and bonus allocation. Results of their analysis
reveal that separating out CSR information in balanced scorecards leads to more attention
being focused on that information, but there is no impact on performance evaluations.
Chen et al. (2016) examine the role of visual attention on the promotion decisions
of managers. They manipulate the format of strategic information given in balanced
scorecards. Using eye-tracking technology, Chen et al. track what attributes of balanced
scorecards managers focus on when making promotion decisions. They find that managers
who focus more on strategically linked attributes regardless of presentation format made
better promotion decisions (i.e., they recommend promoting people whose prior
achievements coincide more with the objectives of the company) than managers who only
focus on attributes.
Decision Difficulty
As used in eye-tracking research, decision difficulty refers to the extent to which
alternatives differ. The extant literature consists of purchase decisions (where one product
is chosen from among several) or gambles (choosing between two gambles with related
payouts and probabilities). Basically, research finds that choices between similar options

68
require more fixations in order to perform the decision making task (Glöckner and Herbold
2011; Krajbich and Rangel 2011; Fiedler and Glöckner 2012). Although, Russo and Dosher
(1983) find decision difficulty has no influence on the number of transitions between
alternatives. These results suggest difficult decisions increase working memory load, but
the number of times attention shifts between alternatives remains constant.
Time Pressure
Eye-tracking studies examining time pressure demonstrate that reduced time leads
to shorter fixation duration, fewer fixations on textual elements, more attribute transitions,
and less overall information fixated on (Pieters and Warlop 1999; Reutskaja et al. 2011;
Van Herpen and Trijp 2011). Furthermore, Mormann et al. (2012) find that time pressure
leads to a greater influence of visual saliency on decision choice. Thus, under time pressure
people spend less time processing the various attributes and select the more prominent
option. These findings suggest that time pressure can reduce the amount of analysis (i.e.,
working memory load) taking place in order to meet a deadline.
In accounting, Bellora-Bienengräber et al. (2017) examine how time pressure
influences a manager’s performance evaluation of subordinates. They manipulate the
presence of time pressure and the format of corporate social responsibility (CSR)
information in a balanced scorecard and measure the impact on performance evaluations
and bonus allocation. Results of their analysis reveal that time pressure reduces
performance ratings. Thus, this paper suggests that managers under time pressure provide
lower performance ratings.
Distractors

69
A distractor potentially diverts attention away from a task. Eye-tracking research
on distractors finds somewhat counterintuitive results (e.g., Day, Shyi, and Wang 2006;
Day et al. 2009). For example, Day et al. (2006) examine whether flash banners (i.e.,
animated interactive website advertisements that can include sound and complex
animations like movies) containing irrelevant information distract consumers in an online
multi-attribute decision-making setting where one product must be chosen from a set of
alternatives. They find that not only are participants not distracted by the flash banners, but
their level of arousal and accuracy in decision making actually increases when the flash
banners are present.
Similarly, Day et al. (2009) study whether music tempo and task difficulty
influences decision making in a multi-attribute decision-making setting. They find that the
potential distractor (i.e., a fast music tempo in this case) increases the level of decision
accuracy. Specifically, they found that with the faster music tempo led to a different search
pattern and more information being searched. These findings suggest distractors may
increase the level of interest in tasks and improve outcomes. In view of the unexpected
results, one could argue that these studies were not actually testing distractors, but were
actually testing enhancers of attention. Intuitively, a distractor should negatively impact on
performance in a decision making task, therefore further research is required to explain
these findings.
V. DIRECTIONS FOR FUTURE RESEARCH
What role can eye-tracking technology play in accounting research? As noted
earlier a distinct advantage of an eye-tracking research tool is that it records unconscious
cognitive participant responses. Therefore, the research data is relatively less subject to
70
participant manipulation, subjectivity bias, social desirability bias, and demand effects.
Furthermore, eye-tracking technology can reduce common method bias since its use
reduces the reliance on one particular measurement method (Dimoka et al. 2012). In a
decision-making setting, we observe the participant’s focus of attention which in turn
suggests what information is perceived as most relevant to the task. Eye-tracking
contributes to the literature by providing additional insight into what information is actually
included in the decision versus what the test subjects “say” they think is relevant. In
addition eye-tracking allows us to view the visual search strategies employed when
performing a task.
Goal-Driven Attention
One potential area for future research involves research in goal-driven attention
settings. Eye-tracking researchers in other fields find that people use heuristics in decision-
making settings. In accounting, numerous studies over the years examine heuristics (for
literature reviews on heuristics see Solomon and Tortman 2003 and Trotman, Tan, and Ang
2011). Therefore, future research could re-examine accounting studies on heuristics
incorporating new eye-tracking measures. For instance, in cases where multiple heuristics
could lead to the same decision, eye-tracking could be useful in determining which is being
used. Specifically, researchers may identify whether there is a particular heuristic used by
top performing auditors that helps them perform their duties more effectively. A heuristic
employed by top performing auditors could then be incorporated into staff training or even
in accounting education.
To illustrate, Griffith, Hammersley, Kadous, and Young (2015) use an experiment
to examine whether an auditor’s mindset can influence subsequent auditor judgments of
71
complex estimates. Their primary dependent variables were the reasonableness of the
complex estimate, the decision about what action to take next, and the reason for taking
that action. They find that auditors prompted to approach the case with a deliberative
mindset (i.e., thinking more broadly and incorporating information from a variety of
sources) outperform those using different mindsets. In other words, they find that auditors
using a deliberative mindset are able to process a wider range of information and better
identify unreasonable client estimates. Eye-tracking technology could contribute to this
study and studies like this one by allowing researchers to see what particular pieces of
information auditors focus on when making their decisions. Specifically, eye-tracking
could help Griffith et al. answer questions such as: Did the more effective auditors use a
different and a potentially more effective scan path through the case materials? Did the
auditors consider all pieces of information available in the case equally or did they focus
attention on specific attributes?
Another potential research topic is how the utility effect (i.e., the tendency for
people to focus on information they believe to be more relevant) identified in other fields
of eye-tracking research applies to accountants. For instance, researchers could use eye-
tracking to identify what information audit managers focus on when conducting reviews.
For example, Brazel, Jackson, Schaefer, and Stewart (2016) use an experiment to examine
whether a supervisor’s review of audit staff work is influenced by the outcome of the
testing. Their dependent measure was participants’ performance evaluation rating of the
person in the experimental case. They find that when the additional work performed by
staff failed to find a misstatement that supervisors were then more likely to give lower
performance evaluations. Eye-tracking could identify the supervisor’s focus of attention

72
while reviewing the workpapers. For example, a lower performance evaluation may also
be associated with circumstances where the supervisor’s focus of attention suggests
concern with the underlying documentation. Therefore, eye-tracking could build upon
Brazel et al. (2016) by confirming that the supervisor was impacted by the ‘failure to find
a misstatement’ and not some other attribute of the auditor’s work, such as substandard
documentation.
Stimulus Driven Attention
With respect to stimulus driven attention settings, researchers could examine what
information users of financial information value the most. For instance, what parts of the
financial statements receive the most emphasis (i.e., MD&A, footnotes, charts,
illustrations, basic financial statements)? What types of information or sections in the
MD&A receive the most attention? Is management’s explanation for unsatisfactory
performance relatively ignored versus forward looking information? In the financial
statements, do people pay attention to the footnotes or other substantive information? What
line items receive the most attention? How does the format influence the user’s focus of
attention?
For example, Dilla, Janvrin, and Jeffrey (2013) examine in an experimental setting
whether professional and non-professional investors’ react differently to pro-forma
earnings information when presented in different formats (i.e., graphical vs. textual). They
conclude that graphical presentations of earnings information influence non-professional
investors’ judgments of current year earnings performance, future earnings potential, and
potential investment amount. However, graphical presentations only influence professional
investors’ judgments of future earnings potential and potential investment amount. Eye-
73
tracking technology could be utilized to build upon Dilla et al. (2013) by allowing for a
more precise investigation of the differences between in presentation format in terms of the
specific factors focused upon, the search strategies employed, and patterns in considering
various pieces of information.
Another potential topic to explore in stimulus driven settings is how proposed
regulatory changes influence users of financial statements, tax forms, or audit reports. For
example, if regulators propose a revision to the audit report that highlights a specific issue,
do users actually pay attention to the new information or does the change go unnoticed or
lead to other changes in judgment (e.g., Sirois et al. 2015)? In Assay, Libby, and
Rennekamp (2014), they examine the impact of pronoun use in management disclosures
on investor reactions in an experimental setting. They find that the increased use of
personal pronouns leads to stronger reactions from investors (i.e., larger changes in investor
valuation of stock value). Eye-tracking technology could examine whether attributes
similar to pronouns (e.g., bold colors, font types, or pictures) leads to stronger reactions
from investors. Specifically whether these potential distractors reduce or magnify the
positivity or negativity of the information being conveyed.
Attention and Working Memory
Regarding attention and working memory load, researchers could use eye-tracking
technology to investigate how accountants cope with large amounts of information.
Information overload, or simply receiving too much information has been a topic of interest
in accounting research for a number of years (see Brown-Liburd, Issa, and Lombardi 2015
for a brief review). More recently, big data has become a popular area in accounting (e.g.,
Alles 2015; Warren, Moffitt, and Byrnes 2015; Zhang, Yang, and Appelbaum 2015).
74
Therefore, future studies could use eye-tracking to help investigate how auditors react to
new trends or tools in big-data and at what point information overload becomes an issue.
The results could help determine at what point big data is too big to be useful to an
accountant, or at what point there is too much information for auditors to process (e.g.,
while assessing audit risk). It could also be used to investigate the best practices for
cognitive processing of high volume information streams. To examine this topic,
researchers could explore how accountants handle continuous streams of potentially
relevant information from multiple media sources. Research could help accountants train
and prepare for effective use of big data.
Eye-tracking could be used to examine how experience, time pressure, and
education influence an accountant’s ability to handle large or complicated amounts of
accounting information. For example, Simnett (1996) examines in an experiment how
information selection, information processing and task complexity influence the predictive
accuracy of auditors. The study finds that more experienced auditors are better at selecting
relevant evidence for their decisions than less experienced auditors, but he finds no
difference in information processing ability. Eye-tracking could extend Simnett (1996) by
identifying what visual search strategy is employed as well as what particular attributes are
selected by more experienced auditors.
Education and Training
Lastly, eye-tracking offers a potentially game-changing benefit in an educational
setting. Eye tracking presents an opportunity for students to learn what an expert
themselves may not be consciously aware of and able to teach. Specifically, groups of
people with certain traits or abilities (e.g., outstanding performance, expertise, or

75
experience) could be observed to see if they share a similar distinct scan/search paths
through a document. If a distinct search path is associated with a preferred outcome, then
it could be taught to others or information could be rearranged to facilitate a similar default
scan path. To illustrate, in an education study Mason, Pluchino, and Tornatora (2016) use
an eye-movement modeling example tool to examine the possibility of improving reading
comprehension in students. They randomly assign seventh grade students to a condition
where they use the eye-movement tool or to a condition without the tool. They find that
students who use the eye-movement modeling tool (i.e., a tool that models how students
should be processing illustrated text) outperformed those students that did not use the tool.
This same methodology could be applied to an audit setting. Researchers could examine
whether more experienced auditors review audit files differently than less experienced
auditors. If they find cases where they do, then we could train new auditors to use a similar
approach.
In addition, on exams or in case studies, eye-tracking could help identify where
students struggle with general concepts or specific terminology. For example, in an
auditing case study by Andiola, Lambert, and Lynch (2017), students learn about the audit
review process through closing review notes in a set of workpapers. Eye-tracking could
contribute to this case study by helping the authors identify specific terms, sentences or
concepts that students have difficulty understanding or comprehending. In addition, eye-
tracking could identify specific words, sentences or concepts students, accountants, or
others are struggling with that they might be embarrassed to admit to, or to which they are
not self-aware. Eye tracking could also help identify instances where students or others
have difficulty integrating data from tables/financial statements with text.
76
VI. CONCLUSION
This paper identifies areas where eye-tracking may enhance research in accounting.
In addition, this paper reviews extant literature where eye-tracking is applied to various
judgment and decision-making contexts. This paper also provides an overview of the
common eye-tracking metrics and their potential application to accounting research.
Although accounting researchers have very limited experience with eye-tracking, other
disciplines such as psychology (e.g., Armstrong and Olatunji 2012), education (e.g., Lai et
al. 2013), and marketing (e.g., Wedel and Pieters 2008) extensively use this technology.
Therefore, in order to demonstrate the usefulness of eye-tracking and to help generate
potential research topics, this paper also reviews extant literature in other disciplines where
eye-tracking technology is applied to various judgment and decision-making contexts.
As noted earlier, several accounting studies examine the role of attention in
accounting judgment and decision-making contexts. Although these studies thus far
narrowly focus on manager promotion and performance evaluations (e.g., Chen et al. 2016
or Kramer and Maas 2016) and changes in the audit report (e.g., Sirois et al. 2015) there
remains an abundance of future research opportunities. In an effort to stimulate additional
research, this paper suggests how eye-tracking can enhance extant accounting research.
Illustrative examples of promising research opportunities (extending extant research) are
provided under the categories of goal-driven attention, stimulus-driven attention, and
attention and working memory. In addition, this paper identifies how eye-tracking can be
applied to more contemporary decision making and educational circumstances. With
respect to either extant or contemporary research issues, eye-tracking offers the

77
incremental benefit of a more precise investigation of the specific factors focused upon in
performing a decision making task, as well as the visual search strategy employed.
78
PART 3: The Effect of Irrelevant Information and Minor Errors in Client
Documents on Audit Student Decisions using Eye-Tracking
I. INTRODUCTION
Eye-tracking is the process of measuring a person's eye activity (iMotion 2016).
Eye-tracking technology allows researchers to examine where attention is focused while
reviewing case materials and audit evidence. As discussed in Part 2, despite a call to use
eye-tracking in accounting research by Birnberg and Shields (1984), only four recent
studies in accounting utilize eye-tracking technology (Kramer and Maas 2016; Sirois,
Bedard, and Bera 2015; Chen et al. 2016; Bellora-Bienengräber, Mertins, and Bassen
2017). Although accounting has very limited experience with eye-tracking, other
disciplines such as psychology (e.g., Armstrong and Olatunji 2012), education (e.g., Lai et
al. 2013), and marketing (e.g., Wedel and Pieters 2008) extensively use this technology.
As noted earlier, a distinct advantage of an eye-tracking research tool is that it records
unconscious cognitive participant responses. Therefore, eye-tracking provides additional
insight into what information is actually included in the decision.
To further examine the results from Experiment 1, the third part of this paper
utilizes eye-tracking to examine how auditing student decisions are influenced by dirty
documents. Eye-tracking technology allows for a more precise investigation of the specific
factors focused upon in performing a decision-making task, as well as the visual search
strategy employed. Consistent with Experiment 1, participants assume the role of a staff
auditor completing the accounts receivable portion of an audit. The presence of irrelevant
information and minor errors is manipulated between treatment conditions. After
participants review the audit evidence they assess the likelihood of account misstatement

79
and the appropriate sample size. Trait skepticism is measured with the Hurtt (2010)
skepticism scale and participants are divided into high and low skeptic groups based on
their responses to this scale.
This study offers several contributions to the literature. First, this study answers the
long-awaited call by Birnberg and Shields (1984) for the use of eye tracking technology in
the study of attention in accounting. Recent auditing research using eye-tracking focuses
on investor perceptions of the audit report (e.g., Sirois, Bedard, and Bera 2015). This study
builds on this line of literature by applying this new technology to an audit evidence setting
and lays the foundation for the development of future research applications.
Second, the eye-tracking results indicate that an individual’s level of attention is
influenced by the presence of irrelevant information and/or minor errors. Particularly when
the Control condition with neither irrelevant information nor minor errors was compared
to Treatment 3 where both irrelevant information and minor errors were present. The
finding that the two extreme treatment conditions draw the most scrutiny suggests that
audit evidence which is not consistent with the auditor’s initial level of anticipated risk of
restatement (including a perfectly clean record) increases the auditor’s attention level.
Third, the eye-tracking results also suggest that a dilution effect occurs when irrelevant
information is present. In other words, when auditors encounter audit evidence containing
irrelevant information they may respond by displaying lower levels of attention than they
would if no irrelevant information is present.
The remainder of study will be organized into the following sections: Section II
reviews the theories supporting my hypotheses, and concludes with my hypotheses;
Section III describes the design of my experiment including details about the participants,

80
design, and experimental task, as well as the independent and dependent variables; Section
IV describes the results; and Section V presents the conclusions on this study.
II. HYPOTHESIS DEVELOPMENT
The PCAOB requires auditors to appropriately apply professional skepticism
throughout an audit, including in the areas of identifying and assessing the risk of account
misstatements and in the evaluation of audit evidence (PCAOB 2012). Furthermore, the
PCAOB states the objective of the auditor is to plan and perform the audit to obtain
appropriate audit evidence that is sufficient to support the opinion expressed in the audit
report (AS 15 2010). The presence of irrelevant information or minor errors should
seemingly have no impact on an auditor’s assessment of the sufficiency (i.e., the quantity)
and appropriateness (i.e., the quality) of audit evidence obtained or to be obtained.
However, as found in Part 1 of this study, the presence of irrelevant information or minor
errors does indeed raise a red flag for auditors and can lead to an increase in skeptical
judgment and action. Additionally, in practice, the auditor’s response to dirty records could
have a material impact on overall audit costs as well as audit effectiveness and subsequent
legal liability.
Extant theories on attention, such as cognitive load theory (see Sweller 1988),
suggest that auditors have a finite mental processing capacity when evaluating audit
evidence. Therefore, auditors should ideally focus on evidence that is the most relevant to
performing their task. Prior research on irrelevant information and belief updating (e.g.,
Ashton and Ashton 1988; Shelton 1999), together with this paper’s findings in Part 1,
suggest that irrelevant information and minor errors can influence auditor decision making.
81
This is especially the expectation if the presence of irrelevant information and minor errors
dilute the perceived informativeness and salience of the audit evidence.
This study examines how auditor students are influenced by the presence of
irrelevant information and minor errors when evaluating audit evidence. Eye-tracking
tracking technology is used to observe participants’ search paths, including data elements
fixated upon, dwell time within areas of interest, and the overall time spent reviewing the
evidence. Recent eye-tracking studies on decision making find that people fixate and dwell
on attributes they perceive as the most relevant (Glöckner and Herbold 2011; Kim et al.
2012; Oliveira et al. 2016). In addition, recent eye-tracking studies investigating dwell
times find that longer dwell times are associated with higher levels of cognitive processing
(Velichokovsky 1999; Velichokovsky et al. 2002; Glöckner and Herbold 2011). Therefore,
based on the results of Experiment 1, the presence of irrelevant information and minor
errors should result in a longer overall time spent reviewing the evidence, including a
higher number of fixations and longer dwell times on areas of interest. However, since it
is largely unknown how dirty records will impact an auditor’s level of attention, I propose
the following research question:
RQ1: Does the presence of irrelevant information and/or minor errors result in
individuals becoming less efficient (i.e., exhibit longer fixations and dwell times)
while reviewing audit evidence?
III. METHOD
Design and Participants
This study employs a 2 x 2 between-subjects design manipulating the presence of
irrelevant information in the client documents (i.e., present vs. not present) and whether

82
there are minor errors in the client documents (i.e., errors vs. no errors). The two primary
dependent variables in this study are the number of fixations and dwell time. This study
also measures the increase in the participant’s beliefs about account misstatement risk and
the increase in sample size.
Graduate and senior undergraduate students currently enrolled in auditing courses
at a large southeastern university were recruited as participants in this study.15 Students
were compensated for their participation with extra credit points in their audit class. A total
of 46 auditing students completed the experiment. Participants were randomly assigned to
one of the four treatment conditions. In addition to the Control condition there are three
other treatment conditions: Treatment 1 - no irrelevant information but containing minor
errors, Treatment 2 - irrelevant information but with no minor errors, and Treatment 3 -
both irrelevant information and minor errors are present.
Tasks and Procedures
Sona Systems was used to schedule participants for this study. Sona Systems allows
participants to view the available experiment timeslots online, as well as sends them
reminders the day before and the day of their lab sessions (Sona Systems 2017).
Specifically, participants were recruited through an email sent by their audit professors.
The email included a link to Sona Systems that allowed them to schedule a convenient lab
time (See Appendix C for a copy of the recruitment email).
As summarized in Figure 9, upon arriving at the lab, each student participant was
greeted by one of the experimenters and walked through the consent form line by line (see
Appendix C for a copy of the consent form). Next, they were given time to review the
15 This study was approved by the Internal Review Board at Virginia Commonwealth University.

83
consent form on their own. Students had to sign-off on the consent form before they could
proceed. Students who choose not to participate could get the same amount of extra credit
by completing a similar written assignment. No students chose to complete the alternative
assignment. After signing the consent form, participants were given a four-digit
identification number. Random four-digit identification numbers were assigned to each
participant in order to maintain confidentiality of data. A separate list of student names and
identification numbers was maintained in case a participant later requested to have their
data removed from the study.
Next, the participant was led into the eye-tracking room and seated in front of the
eye-tracking computer. Participants were given a brief introduction to the eye-tracking
technology and a brief overview of the experimental task and how to use the computer.
The Tobii X2-60 eye-tracker was used in this experiment. The technology is unobtrusive
and attached to the computer monitor. The benefit of the Tobii software is that it allows
participants to freely sit in front of the computer without having to wear special head gear
or maintain a specific distance from the monitor. It also has no problem tracking
participant’s eyes should they momentarily glance away from the monitor.
Prior to the start of the experiment, participants were calibrated to the eye-tracking
software. The calibration process required them to visually follow a bouncing ball around
the computer screen. The calibration process was uneventful accept for one instance where
heavy eye make-up appeared to interfere with the software’s ability to track the
participant’s eye movements.
Following calibration, participants accessed the audit case materials by entering
their four-digit identification number into the PC (see Appendix C Slides 1-3). The initial
84
slides presented participants with a hypothetical case scenario for them to read through.
The case scenario had participants assume the role of a staff auditor performing the
accounts receivable portion of an audit of a hypothetical company called Sprandel, Inc.16
The case scenario described Sprandel as a mid-sized public company specializing in the
production of plastic shaped bottles. The case indicated that the audit team assessed the
inherent risk for the account as being high, and the control risk for the account as being
low. Thus, the overall risk for the account was described as being moderate.
Participants were then given the task of assessing the likelihood of account
misstatement and determining the appropriate sample size. In order to provide a baseline
for assessing the likelihood of account misstatement, participants were informed that their
initial estimate of the account being misstated was 20 percent and in prior years the audit
team selected 10 items to test.
The next slide contained the audit evidence slide (see Slide 4 in Appendix C).
Participants could view the audit evidence slide for as long as they desired. The average
time participants viewed this slide across all four conditions was 55 seconds. Unlike
Experiment 1 participants were not required to spend any pre-defined length of time on the
audit evidence slide. After reviewing the case materials and audit evidence, the participant
clicked on a link that connected them to a Qualtrics survey that allowed them to enter their
responses for the follow-up assessment. The assessment consisted of questions relating to
the dependent variables and occurred immediately following the eye-tracking portion in
order to reduce memory loss.
16 The hypothetical company Sprandel, Inc., is adapted from a teaching case by Andiola, Lambert, and
Lynch (2017).
85
In order to minimize the size of the eye-tracking data file and to facilitate the most
efficient use of the eye-tracking computer stations, the participant moved to computer
station not equipped with the eye-tracking hardware in order to complete the post-
experiment questionnaire. The questionnaire was administered using a second Qualtrics
survey (See Slide 10 in Appendix C). Each participant entered their four-digit identification
number at the beginning of each stage of the experiment so that eye-tracking data could be
linked to the appropriate Qualtrics survey responses.
[Insert Figure 9 here]
Independent Variables
The first independent variable was the presence of irrelevant information. As shown
in Appendix C (see Slide 4), this variable was manipulated at two levels (irrelevant
information present vs. not present). Participants assigned to the irrelevant information
absent treatment condition were presented with a client document that had no irrelevant
information. This treatment condition only showed the customer name, invoice number,
invoice date, and invoice amount. Alternatively, participants assigned to the irrelevant
information present treatment condition were presented with a document that contained
irrelevant information in the form of unnecessary columns of information. The unnecessary
columns contained information on the state the customer is located in, the phone number
of the customer, the skew code of the items sold, and the name and number of items sold.17
The second independent variable examined the presence of minor errors. As shown
in Appendix C (see Slide 4), this variable was also manipulated at two levels (i.e., minor
errors present vs. minor errors absent). In the minor errors present treatment condition,
17 Three auditors with public accounting experience verified that the irrelevant information used in this
study accurately depicts what auditors encounter in practice.

86
participants were presented with client provided audit evidence that contained five minor
errors (e.g., the total account balance did not tie to the balance sheet, there were minor typo
errors, and pieces of the information seemed incomplete).18 Participants assigned to the
minor errors absent treatment condition were presented with a client document that was
free from errors (i.e., the total account balance tied to the balance sheet, the information
was complete, and there were no minor typo errors in the information).
Dependent Variables
The two attention-specific dependent variables in this experiment were total
fixations and dwell time. The first dependent variable, total fixations, is the sum of all
fixations within an area of interest. Fixation is a term used to describe when someone looks
at a particular data element or location for an extended period of time (Duchowski 2002).
Areas of interest (AOI) or regions of interest are areas of visual interest defined by the
researcher during the experiment (Kim, Seligman, and Kable 2012; Su, Rao, Li, Wang, and
Li 2012; Ashby and Rakow 2015).
The second dependent variable is dwell time. Dwell time is a term used to describe
the sum of fixations in one area before a participant fixates on another area (Bialkova and
van Trijp 2011). In other words, dwell time captures how long someone fixates on an AOI.
Panels A, B, C, and D of Figure 10 show the eight AOI’s tested in this study. Across all
four treatment conditions, AOI’s were created for the Customer column, the Invoice
Amount column, the Invoice Total area, and the spreadsheet Overall. In the treatment
conditions with minor errors (i.e., Treatment 1 and Treatment 3) there were four additional
18 In order to verify the types of errors participants noticed and how many were necessary to ensure
participants noticed them, this instrument was pilot tested with 40 undergraduate auditing students at a
large southeastern university.
87
AOI’s created for the errors. Specifically, there were AOI’s for the two customer column
errors, the date error, and the invoice column error.
[Insert Figure 10 here]
Participants also responded to questions relating to dependent variables from
Experiment 1. Specifically, the increase in the account misstatement likelihood and the
increase in sample size (see Appendix C Slide 7). The first dependent variable measured
the increase in the participant’s beliefs about account misstatement risk after encountering
a clean versus a dirty client document. Consistent with prior studies mentioned earlier in
the belief updating section (e.g., Ashton and Ashton 1988), participants were given an
initial estimate in the case description that the likelihood of the account being misstated
was 20 percent. Subsequently, after being presented with audit evidence that varied across
participants according to treatment condition, participants rated their beliefs about the
likelihood of the account being misstated on a scale ranging from 0 percent to 100 percent.
The second dependent variable was the participant’s choice of sample size after
encountering a clean vs a dirty client document. The initial sample size recommended to
participants was 10 client records based on prior experience with the client. However, after
reviewing the dirty document, participants were given the opportunity to select a sample
size from 0 to 30 client records (0 percent to 100 percent of the items displayed).
Post-Experimental Questionnaire
After addressing the dependent variable questions, participants completed a post-
experimental questionnaire. As shown in Appendix C (see Slides 8-16), the post-
experimental questionnaire included one manipulation check question, one debriefing
question, one attention check question, several demographic questions, and scales
88
measuring skepticism and risk aversion. The manipulation check question verified errors
were present and asked “Agree or Disagree - The file sent by the client appeared to contain
potential errors.” The debriefing question assessed whether perceived client competence
influenced participant responses and asked “Agree or Disagree - Your review of the file
increased your confidence in the client’s competence.” For both questions, participants
responded on a seven point Likert scale with 1 representing “strongly disagree” and 7
representing “strongly agree.” Since the presence of irrelevant information is something
participants may not be consciously aware of, there was no manipulation check question
relating to irrelevant information.
An attention check question was added to the case to verify participants were
actively reading each question. The attention check question was included as part of the
Hurtt (2010) skepticism scale (See Appendix C slide 12). Instead of asking participants to
rate how closely a statement described themselves, this attention check question asked
participants to “please select strongly disagree for this item.” This verified they were
actively reading the scale items and not just randomly selecting answers.
The demographic and experience questions captured student status (i.e., what year
in school), gender, age, years of professional experience in accounting, other work
experience, and whether English was their first language. Lastly, participants completed
the Hurtt (2010) 30 item skepticism scale (See Appendix C slide 11 – 13) and the 6-item
risk aversion scale from Blais and Weber (2006). The skepticism scale measures skepticism
using questions such as “I often accept other people’s explanations without further
thought” or “I am confident in my abilities.” Responses for each item were captured on a
seven point Likert scale with 1 representing “strongly disagree” and 7 representing
89
“strongly agree.” The risk aversion scale measures risk aversion by asking participants to
rate on a Likert scale from 1 representing “extremely unlikely” to 7 representing
“extremely likely” how likely they are to engage in a series of activities. An example of an
activity is “betting a day’s income at the horse races.”
Eye-Tracking Apparatus
The Tobii X2-60 eye-tracker was the primary input device in this experiment. The
eye-tracker was connected to the lower portion of a conventional computer monitor. The
eye-tracker sampled at 60 Hz with an accuracy of 0.4 degrees. One degree of accuracy
represents 11 millimeters (0.43 inches) on a screen at a distance of 65 centimeters or 26
inches away from the participant (about the size of a character or 20 pixels on a computer
screen). Raw eye-tracking data was collected and analyzed using Tobii Pro Studio.
IV. RESULTS
Demographics and Covariates
A total of 46 students completed the experiment. Three participants were later
removed because they had an eye-tracking accuracy score of less than 10 percent. Tobii
accuracy scores are an estimate of how accurately a participant’s eyes were tracked.
Therefore, 43 students were included in the analyses presented in this section. Of the 43
total participants, 11 students were in the control condition, 8 were in Treatment 1, 12 in
Treatment 2, and 12 in Treatment 3.
Table 10 summarizes the demographic information of the remaining 43
participants. The majority (76.70 percent) of participants fell within the age range of 21 to
30, 18.60 percent within the age range of 31 to 40, and 4.70 percent fell within the range
of 41 to 50. The majority of participants spoke English as a first language (69.80 percent).

90
There were slightly more male than female participants (55.80 percent were male). The
average years of professional work experience in accounting was 1.18 years, and the
average years of other work experience was 6.58 years. The most common student status
was Undergraduate Senior (48.80 percent), followed by 25.60 percent pursuing a Post-
Baccalaureate Certificate, and 25.60 percent in a Master’s program. When these
demographic variables were added to the analysis as covariates, there was no evidence that
the variables were significant. Therefore, the demographic variables were not included as
covariates in subsequent analyses.
To determine whether randomization had been achieved, the presence of irrelevant
information and the presence of minor errors were included as independent variables in a
MANOVA model, with the demographic variables included as dependent variables. A lack
of significance was found for all demographic variables. This finding provides some
evidence that randomization was achieved.
[Insert Table 10 here]
Manipulation Check
The manipulation check question addressed the presence of errors using seven point
Likert response scales with one representing “strongly disagree” and seven representing
“strongly agree.” The first manipulation check question asked participants “Agree or
Disagree – The file sent by the client appeared to contain potential errors.” The mean
response for treatment conditions containing errors was 5.42, and for treatment conditions
containing no errors the mean was 4.30. There was a significant difference (p < 0.05)
between treatment conditions with and without errors consistent with a successful
manipulation of the presence of errors. The 4.30 overall mean for treatment conditions with
91
no errors was probably a result of using the “agree or disagree” type Likert scale for
responses. Participants who were potentially unsure of whether errors were present or not
may have selected a neutral response of 4 representing “neither agree nor disagree” to be
safe. Additionally, the mean response for treatment conditions containing irrelevant
information was 4.72, and the mean response for treatment conditions without irrelevant
information was 5.00. There was no significant difference (p > 0.10) between these
treatment conditions providing evidence that the presence of irrelevant information did not
influence participant’s perception of errors being present. Thus, the results of the
manipulation check question indicate that the manipulation of the presence of minor errors
was successful.
Client Competence Assessment
The debriefing question regarding beliefs about client competency asked “Agree or
Disagree – Your review of the file increased your confidence in the client’s competence.”
The mean response for treatment conditions containing errors was 3.32, while the mean
response for treatment conditions not containing errors was 4.40. The difference between
these values is significant (p < 0.05) suggesting that the presence of minor errors influenced
participants’ assessments of client competence. In addition, the mean response for
treatment conditions containing irrelevant information was 3.91, and the mean response
for treatment conditions not containing irrelevant information was 3.78. The difference
between these values was not significant (p > 0.10) suggesting that the presence of
irrelevant information did not influence participant’s assessment of client competence.
Research Question Analysis
Heat Maps

92
Research Question 1 seeks to examine whether the presence of irrelevant
information or minor errors influences the level of attention participants give to audit
evidence when evaluating misstatement risk and the appropriate sample size. To examine
RQ1, a heat map analysis was conducted. Tobii studio creates heat maps based on the time
spent on each treatment condition (see Figure 11 Panels A-D). The warmer colored areas
(i.e., the brighter red colored areas) show increased levels of attention where there were
more fixations and longer dwell times. If there were no differences in attention levels across
treatment conditions, then we would expect to see similar colors and patterns of colors on
each heat map.
As shown in Figure 11, there was a clear difference in the attention levels between
the various treatment conditions. Based on a visual inspection of the heat maps, it appears
that the Control condition, which had no irrelevant information or minor errors present
(Figure 11 Panel A), and Treatment 3, which had both minor errors and irrelevant
information (Figure 11 Panel D), had the most warm-colored red areas indicating more
fixations and longer dwell times. Thus, the two extreme treatment conditions seemed to
draw the most scrutiny. This suggests that audit evidence which is not consistent with the
auditor’s initial level of anticipated risk of restatement (including a perfectly clean record)
increases the auditor’s attention level.
[Insert Figure 11 here]
Furthermore, a visual inspection of the heat maps for the Control condition and
Treatment 2 (which contained irrelevant information without minor errors) is noteworthy.
There was significantly less attention focused on Treatment 2 than on the Control condition
(see Figure 11, Panels A and C). This result provides evidence of a dilution effect occurring
93
when irrelevant information was present. In other words, when participants encounter audit
evidence containing irrelevant information they respond by displaying lower levels of
attention than they would if no irrelevant information was present. Overall, the results of
this heat map analysis suggest that attention is influenced by the presence of irrelevant
information and minor errors.
One-Way ANOVA Analysis of Overall Differences across Treatment Conditions
The primary dependent variables in this experiment were the number of fixations
and dwell time (see Table 11 for means and standard deviations). To further examine RQ1,
a one-way analysis of variance was conducted for the overall number of fixations and
overall dwell time variables. If there were no differences in participant level of attention
(i.e., number of fixations and dwell time) then there should be no significant differences
across treatment conditions. As shown in Table 11 Panel A, there was a significant
difference in fixation counts between treatment conditions (F(3, 39) = 6.15, p < 0.05).
These results suggest that there were significant differences in the level of attention across
treatment conditions.
To further analyze the result for number of fixations, a Tukey post hoc test was
conducted. Results of the Tukey post hoc test reveal that the Control condition (where
neither irrelevant information nor minor errors were present) and Treatment 3 (where both
irrelevant information and minor errors were present) were significantly different from
each other (p < 0.05). Additionally, Treatment 2 (where irrelevant information was present
and there were no minor errors) and Treatment 3 (where both irrelevant information and
minor errors were present) were significantly different from each other (p < 0.01). These
results confirm that participants had significantly more fixations on audit evidence when

94
both irrelevant information and minor errors were present. Thus, overall the results of these
tests provide evidence that the presence of irrelevant information or minor errors raises
attention levels.
[Insert Table 11 here]
Table 11 Panel B contains the results for the dwell time. The results for dwell time
are similar to Panel A. There was a significant overall difference between treatment
conditions (F(3, 39) = 5.35, p < 0.05). Similar to Panel A this result suggests that
participants spent different amounts of time viewing the overall spreadsheet depending on
the presence of irrelevant information or minor errors. To further analyze the dwell time
results, a Games-Howell post hoc test was conducted. A Games-Howell post hoc test was
used after a Levene’s test for homogeneity was found to be significant. Therefore, the
assumption of equal variances could not be assumed. Results of the Games’ Howell post
hoc test reveal that Treatment 2 (where irrelevant information was present and there were
no minor errors) was significantly different (p < 0.05) from Treatment 3 (where both
irrelevant information and minor errors were present). Since irrelevant information was
present in both of the treatment conditions, this result suggests that participants spent
significantly more time viewing the audit evidence when minor errors were present
compared to when there were no minor errors. Overall the one-way ANOVA results
support the findings of the heat map analysis and provide further evidence that the presence
of irrelevant information or minor errors can influence how auditors focus their attention.
Kruskal-Wallace Test
There are only 8 to 12 participants in each treatment condition. To address the lack
of power due to small sample sizes the Kruskal-Wallace test was conducted for fixations

95
and dwell times. The Kruskal-Wallace test is the nonparametric version of the one-way
ANOVA. Results of the Kruskal-Wallace test are shown in Table 12. Table 12 Panel A
shows the results for the analysis of fixations. The Kruskal-Wallace test found a significant
difference (p < 0.05) in the total number of fixations between the four treatment conditions.
Table 12 Panel B shows the Kruskal-Wallace test for dwell time. Consistent with Panel A,
there was a significant difference (p < 0.05) in the overall dwell time between the four
conditions. Overall these results are consistent with the parametric tests above and suggest
that the number of fixations and overall dwell time by participants significantly varied
depending on the presence of irrelevant information or minor errors.
[Insert Table 12 here]
Supplemental Analysis
To further investigate the differences in the eye-tracking results across treatment
conditions an additional mediation analysis was conducted. This additional analysis was
performed using the Haye’s (2010) PROCESS tool for SPSS to examine the relationship
between participant level of skepticism, attention in specific areas of interest, and
assessments of the misstatement likelihood and sample size. See Appendix D for the results
of these tests.
V. CONCLUSION
The purpose of Experiment 2 is to utilize eye-tracking technology to examine how
auditing students react to dirty documents. Eye-tracking is the process of measuring a
person’s eye activity (iMotion 2016). Specifically, eye-tracking technology allows for a
more precise investigation of the specific factors focused upon in performing a decision-
making task, as well as the visual search strategy employed. In Experiment 2, auditing
96
students from a large southeastern university assumed the role of staff auditors in the same
audit scenario as Experiment 1. However, in this experiment, the participant’s eye
movements were recorded while they reviewed the case materials and audit evidence.
Results of this experiment showed that participants focused their attention
differently depending on whether irrelevant information or minor errors were present. In
addition, eye-tracking offered additional insight into the influence of irrelevant information
and minor errors. Experiment 1 found no dilution effect when both irrelevant information
and minor errors were present. However, contrary to the results in Experiment 1, the eye-
tracking results suggest that irrelevant information triggers a dilution effect. In other words,
when auditors encounter audit evidence containing irrelevant information they respond by
displaying lower levels of attention than they would if no irrelevant information was
present. Another insight gained from eye-tracking is that audit evidence which is not
consistent with the initial level of anticipated risk of restatement (including a perfectly
clean record) increases the auditor’s attention level.
Future researchers could explore whether more experienced auditors or auditors
scoring high in trait skepticism are found to share a unique but similar scan path and/or
fixation points while processing a dirty record effectively. If so, audit firms and educators
can adapt the findings to enhance training in the appropriate application of professional
skepticism. For example, the results could help develop a preferred analytical framework
for reading/reviewing/analyzing client records.
The results of this study are subject to the same limitations that apply to any
research that employs a judgment and decision making setting. For example, the results
may have been different with professional participants. However, researchers have argued

97
that the use of professional participants should be avoided unless they are determined to be
essential to achieving specific research goals (Libby, Bloomfield, and Nelsen 2002). Given
that the students were trained to react similarly to professionals in our research scenario,
and the extensive history of using students in similar tests of economic theory (Smith
2008), I believe the use of students is appropriate in this setting. Additionally, the lack of
significant difference in the Hurtt Skepticism scale (2010) scores between the audit
participants in Experiment 1 and the students in Experiment 2 (see Table 6) provide
evidence that students were similar to auditors in their levels of trait skepticism. Another
limitation of this study, is that although it was designed to be realistic, the experimental
setting was far more simplified than a real-world audit setting. Thus, the responses in both
experiments may not reflect how auditors would respond in a more complex setting in
practice. Further, a lack of power with Experiment 2 was certainly a possible limitation in
interpreting the results for those tests.

98
REFERENCES
Allen, R. D. and Elder, R. J., 2005. A longitudinal investigation of auditor error
projection decisions. Auditing: A Journal of Practice & Theory 24 (2): 69–84.
Allen, R.D., Hermanson, D.R., Kozloski, T.M. and Ramsay, R.J., 2006. Auditor risk
assessment: Insights from the academic literature. Accounting Horizons, 20(2),
pp.157-177.
Alles, M.G., 2015. Drivers of the use and facilitators and obstacles of the evolution of big
data by the audit profession. Accounting Horizons, 29(2), pp.439-449.
American Institute of Certified Public Accountants (AICPA). 2002. Consideration of
Fraud in a Financial Statement Audit. Statements on Auditing Standards No. 99.
New York, NY: AICPA.
Andiola, L., Lambert, T., and Lynch, E., 2016. Sprandel, Inc.: A Teaching Case on
Closing Review Notes in an Electronic Environment through the Audit of
Accounts Receivable. Working Paper.
Antle, R. 1982. The auditor as an economic agent. Journal of Accounting Research 20
(2): 503–527.
Antle, R. 1984. Auditor independence. Journal of Accounting Research 22 (1): 1–20.
Antle, R. and Nalebuff, B., 1991. Conservatism and auditor-client negotiations. Journal
of Accounting Research 29 (Supplement): 31–54.
Armel, K.C., Beaumel, A. and Rangel, A., 2008. Biasing simple choices by manipulating
relative visual attention. Judgment and Decision Making, 3(5), p.396.

99
Armstrong, T. and Olatunji, B.O., 2012. Eye tracking of attention in the affective
disorders: A meta-analytic review and synthesis. Clinical psychology review,
32(8), pp.704-723.
Asare, S. K. 1992. The auditor’s going-concern decision: Interaction of task variables and
the sequential processing of evidence. The Accounting Review 67 (2): 379–393.
Asare, S. K., Cohen, J., and Trompeter, G., 2005. The effect of non-audit services on
client risk, acceptance and staffing decisions. Journal of Accounting and Public
Policy 24: 489–520.
Asay, H. S., Libby, R., & Rennekamp, K. (Working). Do Features that Associate
Managers with a Message Magnify Investors’ Reactions to Narrative Disclosures?
Ashbaugh, H., LaFond, R., and Mayhew, B. W., 2003. Do non-audit services
compromise auditor independence? Further evidence. The Accounting Review 78
(3): 611–639.
Ashby, N.J. and Rakow, T., 2015. Eyes on the prize? Evidence of diminishing attention
to experienced and foregone outcomes in repeated experiential choice. Journal of
Behavioral Decision Making.
Ashton, A. H. and Ashton, R. H., 1988. Sequential belief revision in auditing. The
Accounting Review 63 (October): 623–641.
Ashton, A. H. and Ashton, R. H., 1990. Evidence-responsiveness in professional
judgment—Effects of positive versus negative evidence and presentation mode.
Organizational Behavior and Human Decision Processes 46 (1): 1–19.
Ashton, A. H. 1991. Experience and error frequency knowledge as potential determinants
of audit expertise. The Accounting Review 66 (2): 218–239.
100
Atalay, A.S., Bodur, H.O. and Rasolofoarison, D., 2012. Shining in the center: Central
gaze cascade effect on product choice. Journal of Consumer Research, 39(4),
pp.848-866.
Awh, E., Vogel, E.K. and Oh, S.H., 2006. Interactions between attention and working
memory. Neuroscience, 139(1), pp.201-208.
Ballard, D.H., Hayhoe, M.M. and Pelz, J.B., 1995. Memory representations in natural
tasks. Journal of Cognitive Neuroscience, 7(1), pp.66-80.
Bamber, E. M., Ramsay, R. J., and Tubbs, R. M., 1997. An examination of the
descriptive validity of the belief-adjustment model and alternative attitudes to
evidence in auditing. Accounting, Organizations and Society 22 (3), pp. 249–268.
Bazerman, M. H. and Tenbrunsel, A. E., 2011. Good people often let bad things happen.
Why? Harvard Business Review (April): 58–65.
Beaulieu, P.R., 2001. The effects of judgments of new clients' integrity upon risk
judgments, audit evidence, and fees. Auditing: A Journal of Practice & Theory,
20(2), pp.85-99.
Bedard, J. C. and Biggs, S. F., 1991a. Pattern recognition, hypotheses generation, and
auditor performance in an analytical task. The Accounting Review 66 (3): 622–
642.
Bedard, J. C. and Biggs, S. F., 1991b. The effect of domain-specific experience on
evaluation of management representations in analytical procedures. Auditing: A
Journal of Practice & Theory 10 (Supplement): 77–90.
Beeler, J. D. and Hunton, J. E., 2002. Contingent economic rents: Insidious threats to
audit independence. Advances in Accounting Behavioral Research 5: 3–17.

101
Bellora-Bienengräber, L., Mertins, L., and Bassen, A., 2017. How much Attention do
Evaluators Pay to Corporate Social Responsibility (CSR) Information and Does
This Impact the Performance Ratings in a Balanced Scorecard Setting? –Results
from an Eye-Tracking Experiment. Work in progress.
Bernardi, R. A. 1994. Fraud detection: The effect of client integrity and competence and
auditor
cognitive style. Auditing: A Journal of Practice & Theory 13: 68–84.
Berryman, R. G. 1974. Auditor independence: its historical development and some
proposals for research. In Contemporary auditing problems: Proceedings of the
1974 Arthur Anderson University of Kansas symposium on auditing problems
(pp. 1-15).
Bialkova, S. and van Trijp, H.C., 2011. An efficient methodology for assessing attention
to and effect of nutrition information displayed front-of-pack. Food Quality and
Preference, 22(6), pp.592-601.
Bierstaker, J. L. and Wright, S., 2001. A research note concerning practical problem-
solving ability as a predictor of performance in auditing tasks. Behavioral
Research in Accounting 13: 49–59.
Bird, G.D., Lauwereyns, J. and Crawford, M.T., 2012. The role of eye movements in
decision making and the prospect of exposure effects. Vision Research, 60, pp.16-
21.
Birnberg, J. G. and Shields, M. D., 1984. The role of attention and memory in accounting
decisions. Accounting, Organizations and Society, 9(3), 365-382.
102
Blay, A. 2005. Independence threats, litigation risk, and the auditor’s decision process.
Contemporary Accounting Research 22 (4): 759–789.
Blay, A. D., and Geiger, M. A. 2013. Auditor Fees and Auditor Independence: Evidence
from Going Concern Reporting Decisions*. Contemporary Accounting Research,
30(2), 579-606.
Bloomfield, R. J. 1995. Strategic dependence and inherent risk assessments. The
Accounting Review 70 (1): 71–90.
Bonner, S. E. and Lewis, B. L., 1990. Determinants of auditor expertise. Journal of
Accounting Research 28 (Supplement): 1–20.
Bouwman, M.J., 1985. The use of protocol analysis in accounting. Accounting &
Finance, 25(1), pp.61-84.
Braun, R. L. 2000. The effect of time pressure on auditor attention to qualitative aspects
of misstatements indicative of potential fraudulent financial reporting.
Accounting, Organizations and Society 25: 243–259.
Brazel, J.F., Jackson, S.B., Schaefer, T.J. and Stewart, B.W., 2016. The outcome effect
and professional skepticism. The Accounting Review, 91(6), pp.1577-1599.
Brown, C.E., Peecher, M.E. and Solomon, I.R.A., 1999. Auditors' hypothesis testing in
diagnostic inference tasks. Journal of Accounting Research, 37(1), pp.1-26.
Brown, C. E. and Solomon, I., 1990. Auditor configural information processing in control
risk assessment. Auditing: A Journal of Practice & Theory 9 (Fall): 17–38.
Brown, C. E. and Solomon, I., 1991. Configural information processing in auditing: The
role of domain-specific knowledge. The Accounting Review 66 (January): 100–
119.

103
Brown-Liburd, H., Issa, H. and Lombardi, D., 2015. Behavioral implications of Big
Data's impact on audit judgment and decision making and future research
directions. Accounting Horizons, 29(2), pp.451-468.
Burgstahler, D. and Jiambalvo, J., 1986. Sample error characteristics and projection of
error to audit populations. The Accounting Review 61 (2): 233–248.
Butt, J. L. and Campbell, T. L., 1989. The effects of information order and hypothesis-
testing strategies on auditor’s judgments. Accounting, Organizations and Society
14 (5–6): 471–479.
Carmichael, D. R. and Craig, Jr., J. L., 1996. Proposal to say the “F” word in auditing
standards. The CPA Journal 66 (6) 22.
Carpenter, T. D. and Reimers, J. L. (2013). Professional Skepticism: The Effects of a
Partner's Influence and the Level of Fraud Indicators on Auditors' Fraud
Judgments and Actions. Behavioral Research in Accounting, 25(2), 45-69.
Causholli, M., Chambers, D.J. and Payne, J.L., 2014. Future nonaudit service fees and
audit quality. Contemporary Accounting Research, 31(3), pp.681-712.
Chan, K.H., Lin, K.Z. and Mo, P.L.L., 2003. An empirical study on the impact of culture
on audit-detected accounting errors. Auditing: A journal of Practice & theory,
22(2), pp.281-295.Hurtt, R. K. 2010. Development of a scale to measure
professional skepticism. Auditing: A Journal of Practice & Theory 29 (1): 149–
171.
Chandon, P., Hutchinson, J.W., Bradlow, E.T. and Young, S.H., 2009. Does in-store
marketing work? Effects of the number and position of shelf facings on brand

104
attention and evaluation at the point of purchase. Journal of Marketing, 73(6),
pp.1-17.
Chang, C. J. and Hwang, N. C. R., 2003. The impact of retention incentives and client
business risks on auditors’ decisions involving aggressive reporting practices.
Auditing: A Journal of Practice & Theory 22 (2): 207–218.
Chen, Y., Jermias, J. and Panggabean, T., 2016. The Role of Visual Attention in the
Managerial Judgment of Balanced‐Scorecard Performance Evaluation: Insights
from Using an Eye‐Tracking Device. Journal of Accounting Research.
Chen, L. and Pu, P., 2010, June. Eye-tracking study of user behavior in recommender
interfaces. In International Conference on User Modeling, Adaptation, and
Personalization (pp. 375-380). Springer Berlin Heidelberg.
Chung, H. and Kallapur, S., 2003. Client importance, non-audit services, and abnormal
accruals. The Accounting Review 78 (4): 931–955.
Clement, J., 2007. Visual influence on in-store buying decisions: an eye-track experiment
on the visual influence of packaging design. Journal of marketing management,
23(9-10), pp.917-928.
Cohen, J.R., Krishnamoorthy, G., Peytcheva, M. and Wright, A.M., 2013. How does the
strength of the financial regulatory regime influence auditors' judgments to
constrain aggressive reporting in a principles-based versus rules-based accounting
environment? Accounting Horizons, 27(3), pp.579-601.
Corbetta, M. and Shulman, G.L., 2002. Control of goal-directed and stimulus-driven
attention in the brain. Nature reviews neuroscience, 3(3), pp.201-215.
105
Cushing, B. E. 2003. Economic analysis of skepticism in an audit setting. Working paper,
University of Utah.
Day, R.F., 2010. Examining the validity of the Needleman–Wunsch algorithm in
identifying decision strategy with eye-movement data. Decision Support Systems,
49(4), pp.396-403.
Day, R.F., Shyi, G.C.W. and Wang, J.C., 2006. The effect of flash banners on
multiattribute decision making: Distractor or source of arousal? Psychology &
Marketing, 23(5), pp.369-382.
Day, R.F., Lin, C.H., Huang, W.H. and Chuang, S.H., 2009. Effects of music tempo and
task difficulty on multi-attribute decision-making: An eye-tracking approach.
Computers in Human Behavior, 25(1), pp.130-143.
DeAngelo, L. E. 1981. Auditor independence, ‘‘low balling,’’ and disclosure regulation.
Journal of Accounting and Economics 3 (2): 113–127.
DeFond, M., Raghunandan, K., and Subramanyam, K. R., 2002. Do non-audit service
fees impair auditor independence? Evidence from going-concern audit opinions.
Journal of Accounting Research 40: 1247–1274.
Deubel, H. and Schneider, W.X., 1996. Saccade target selection and object recognition:
Evidence for a common attentional mechanism. Vision research, 36(12), pp.1827-
1837.
Dilla, W.N., Janvrin, D.J. and Jeffrey, C., 2012. The impact of graphical displays of pro
forma earnings information on professional and nonprofessional investors'
earnings judgments. Behavioral Research in Accounting, 25(1), pp.37-60.
106
Dimoka, A., Banker, R.D., Benbasat, I., Davis, F.D., Dennis, A.R., Gefen, D., Gupta, A.,
Ischebeck, A., Kenning, P., Pavlou, P.A. and Müller-Putz, G., 2012. On the use of
neurophysiological tools in IS research: Developing a research agenda for
NeuroIS. MIS Quarterly.
Djamasbi, S., 2014. Eye tracking and web experience. AIS Transactions on Human-
Computer Interaction, 6(2), pp.37-54.
Djamasbi, S., Siegel, M. and Tullis, T., 2011, July. Visual hierarchy and viewing
behavior: An eye tracking study. In International Conference on Human-
Computer Interaction (pp. 331-340). Springer Berlin Heidelberg.
Djamasbi, S., Siegel, M., Skorinko, J. and Tullis, T., 2011. Online viewing and aesthetic
preferences of generation y and the baby boom generation: Testing user web site
experience through eye tracking. International Journal of Electronic Commerce,
15(4), pp.121-158.
Doty, J. R. 2011. What the PCAOB Expects for the Coming Year and Beyond (December
5). Washington DC: PCAOB.
Dreu, C. D. and Carnevale, P. J. D., 2003. Motivational bases of information processing
and strategy in conflict and negotiation. Advances in experimental social
psychology, 35, 235-291.
Duchowski, A.T., 2002. A breadth-first survey of eye-tracking applications. Behavior
Research Methods, Instruments, & Computers, 34(4), pp.455-470.
Durney, M., Elder, R.J. and Glover, S.M., 2013. Field data on accounting error rates and
audit sampling. Auditing: A Journal of Practice & Theory, 33(2), pp.79-110.
107
Einhorn, H.J. and Hogarth, IL M., 1985. A Contrast/Surprise Model for Updating Beliefs,
Working Paper, University of Chicago, Center for Decision Research.
Elder, R. J. and Allen, R. D., 1998. An empirical investigation of the auditor’s decision to
project errors. Auditing: A Journal of Practice & Theory 17 (2): 71–87.
Farmer, T. A., Rittenberg, L.E., and Trompeter, G.M., 1987. An investigation of the
impact of economic and organizational factors on auditor independence. Auditing:
A Journal of Practice & Theory 7 (1): 1–14.
Fellingham, J. C. and Newman, D. P., 1985. Strategic considerations in auditing. The
Accounting Review 60 (4): 634–650.
Fiedler, S. and Glöckner, A., 2012. The dynamics of decision making in risky choice: An
eye-tracking analysis.
Foulsham, T. and Kingstone, A., “Goal-Driven and Bottom-Up Gaze in an Active Real-
World Search Task.” Proceeding of the Association for Computing Machinery
Eye Tracking Research and Applications Symposium conference on March 28–
30, 2012, in Santa Barbara, CA. 189–92.
Fukukawa, H. and Mock, T. J., 2011. Audit risk assessments using belief versus
probability. Auditing: A Journal of Practice & Theory 30 (1): 75–99.
Fullerton, R. R., and Durtschi, C., 2005. The effect of professional skepticism on the
fraud detection skills of internal auditors. Working paper, Utah State University.
Frankel, R. M., Johnson, M. F., and Nelson, K. K., 2002. The relation between auditors’
fees for nonaudit services and earnings management. The Accounting Review 77
(Supplement): 71–105.
108
Frederick, D. M., Heiman-Hoffman, V., and Libby, R., 1994. The structure of auditors’
knowledge of financial statement errors. Auditing: A Journal of Practice &
Theory 13 (1): 1–21.
Gigerenzer, G., Todd, P.M. and ABC Research Group, T., 1999. Simple heuristics that
make us smart. Oxford University Press.
Glaholt, M.G. and Reingold, E.M., 2009. The time course of gaze bias in visual decision
tasks. Visual Cognition, 17(8), pp.1228-1243.
Glaholt, M.G. and Reingold, E.M., 2011. Eye movement monitoring as a process tracing
methodology in decision making research. Journal of Neuroscience, Psychology,
and Economics, 4(2), p.125
Glaholt, M.G. and Reingold, E.M., 2012. Direct control of fixation times in scene
viewing: Evidence from analysis of the distribution of first fixation duration.
Visual Cognition, 20(6), pp.605-626.
Glaholt, M.G., Wu, M.C. and Reingold, E.M., 2009. Predicting preference from fixations.
PsychNology Journal, 7(2), pp.141-158.
Glaholt, M.G., Wu, M.C. and Reingold, E.M., 2010. Evidence for top-down control of
eye movements during visual decision making. Journal of vision, 10(5), pp.15-15.
.Glöckner, A. and Herbold, A.K., 2011. An eye‐tracking study on information processing
in risky decisions: Evidence for compensatory strategies based on automatic
processes. Journal of Behavioral Decision Making, 24(1), pp.71-98.
Glover, S. M. 1997. The influence of time pressure and accountability on auditors’
processing of nondiagnostic information. Journal of Accounting Research 35
(Autumn): 213–227.
109
Glover, S. M. and Prawitt, D. F., 2013. Enhancing auditor professional skepticism. White
Paper Series of the Standards Working Group of the Global Public Policy
Committee.
Glover, S.M., Prawitt, D.F. and Wilks, T.J., 2005. Why do auditors over-rely on weak
analytical procedures? The role of outcome and precision. Auditing: A Journal of
Practice & Theory, 24(s-1), pp.197-220.
Goldberg, J.H. and Kotval, X.P., 1999. Computer interface evaluation using eye
movements: methods and constructs. International Journal of Industrial
Ergonomics, 24(6), pp.631-645.
Gramling, A. A. 1999. External auditors’ reliance on work performed by internal
auditors: The influence of fee pressure on this reliance decision. Auditing: A
Journal of Practice & Theory 18 (Supplement): 117–135.
Griffith, E.E., Hammersley, J.S., Kadous, K. and Young, D., 2015. Auditor mindsets and
audits of complex estimates. Journal of Accounting Research, 53(1), pp.49-77.
Guiral, A., Ruiz, E., and Rodgers, W. 2011. To What Extent Are Auditors’ Attitudes
toward the Evidence Influenced by the Self-Fulfilling Prophecy? Auditing: A
Journal of Practice & Theory: February 2011, Vol. 30, No. 1, pp. 173-190.
Hackenbrack, K. 1992. Implications of seemingly irrelevant evidence in audit judgment.
Journal of Accounting Research 30 (Spring): 126–136.
Hackenbrack, K. and Nelson, M. W., 1996. Auditors’ incentives and their application of
financial accounting standards. The Accounting Review 71 (1): 43–59.
Hammersley, J.S., 2006. Pattern identification and industry-specialist auditors. The
Accounting Review, 81(2), pp.309-336.
110
Harding, N. and Trotman, K. T., 2011. Enhancing Professional Skepticism via the Fraud
Brainstorming Discussion Outcomes. Working paper, The University of New
South Wales.
Hayes, J. 1982. Issues in protocol analysis. In Decision Making: An Interdisciplinary
Inquiry, edited by G. Ungson, and D. Braunstein, 61-77. Boston, MA: Kent
Publishing Company.
Hirst, D. E. 1994. Auditors' sensitivity to source reliability. Journal of Accounting
Research, 32(1), 113-126.
Hoffman, V. B. and Patton, J. M., 1997. Accountability, the dilution effect, and
conservatism in auditors’ fraud judgments. Journal of Accounting Research 35
(Autumn): 227–238.
Hoffman, J.E. and Subramaniam, B., 1995. The role of visual attention in saccadic eye
movements. Attention, Perception, & Psychophysics, 57(6), pp.787-795.
Hogarth, R. M. and Einhorn, H.J., 1992. Order affects in belief updating: The belief-
adjustment model. Cognitive Psychology 24 (1): 1–55.
Hoogduin, L. A., Hall, T. W., and Tsay, J. J., 2010. Modified sieve sampling: A method
for single- and multi-stage probability-proportional-to-size sampling. Auditing: A
Journal of Practice & Theory 29 (1): 125–148.
Hoque, Z., 2006. Methodological issues in accounting research: theories, methods and
issues. Spiramus Press Ltd.
Horstmann, N., Ahlgrimm, A. and Glöckner, A., 2009. How distinct are intuition and
deliberation? An eye-tracking analysis of instruction-induced decision modes. An
eye-tracking analysis of instruction-induced decision modes.
111
Houston, R. W. 1999. The effects of fee pressure and client risk on audit seniors’ time
budget decisions. Auditing: A Journal of Practice & Theory 18 (Fall): 70–86.
Houston, R.W., Peters, M.F. and Pratt, J.H., 1999. The audit risk model, business risk and
audit-planning decisions. The Accounting Review, 74(3), pp.281-298.
Howard, J.A. and Sheth, J.N., 1969. The theory of buyer behavior (Vol. 14). New York:
Wiley.
Huang, Y.F. and Kuo, F.Y., 2011. An eye-tracking investigation of internet consumers'
decision deliberateness. Internet Research, 21(5), pp.541-561.
Hurtt, R.K., Brown-Liburd, H., Earley, C.E. and Krishnamoorthy, G., 2013. Research on
auditor professional skepticism: Literature synthesis and opportunities for future
research. Auditing: A Journal of Practice & Theory, 32(sp1), pp.45-97.
Hurtt, R. K., Eining, M., and Plumlee, R. D., 2008. An experimental evaluation of
professional skepticism. Working paper, Baylor University.
Hwang, N.C.R. and Chang, C.J., 2010. Litigation environment and auditors’ decisions to
accept clients’ aggressive reporting. Journal of Accounting and Public Policy,
29(3), pp.281-295.
Hylas, R. E. and Ashton, R. H., 1982. Audit detection of financial statement errors. The
Accounting Review 57 (4): 751–766.
iMotion. 2016. Eye Tracking Pocket Guide. Available at: https://imotions.com/guides/.
Janiszewski, C., 1998. The Influence of Display Characteris tics on Visual Exploratory
Search Behavior. Journal of Consumer Research, 25(3), pp. 290-301.
Johnson, J.R., Leitch, R.A. and Neter, J., 1981. Characteristics of errors in accounts
receivable and inventory audits. Accounting Review, pp.270-293.

112
Johnstone, K. M., Sutton, M. H., and Warfield, T. D., 2001. Antecedents and
consequences of independence risk: Framework for analysis. Accounting
Horizons 15 (1): 1–18.
Jones, J., Massey, D.W. and Thorne, L., 2003. Auditor’s ethical reasoning: insights from
past research and implications for the future. Journal of Accounting Literature,
22, p.45.
Jones III, A., Norman, C.S. and Wier, B., 2010. Healthy lifestyle as a coping mechanism
for role stress in public accounting. Behavioral Research in Accounting, 22(1),
pp.21-41.
Kadous, K., Kennedy, S. J., and Peecher, M. E., 2003. The effect of quality assessment
and directional goal commitment on auditors’ acceptance of client-preferred
accounting methods. The Accounting Review 78 (3): 759–778.
Kaplan, S. E., Moeckel, C., and Williams, J. D., 1992. Auditors’ hypothesis plausibility
assessments in analytical review setting. Auditing: A Journal of Practice &
Theory 11 (Fall): 50–65.
Kelley, T. and Margheim, L., 1990. The impact of time budget pressure, personality, and
leadership variables on dysfunctional auditor behavior. Auditing: A Journal of
Practice & Theory 9 (Spring): 21–42.
Kemmelmeier, M., 2004. Separating the wheat from the chaff: does discriminating
between diagnostic and nondiagnostic information eliminate the dilution effect?
Journal of Behavioral Decision Making 17(3), pp.231-243.
Kim, B.E., Seligman, D. and Kable, J.W., 2012. Preference reversals in decision making
under risk are accompanied by changes in attention to different attributes.

113
Kizirian, T. G., Mayhew, B. W., and Sneathen, L. D., 2005. The impact of management
integrity on audit planning and evidence. Auditing: A Journal of Practice &
Theory 24 (2): 49–67.
Knechel, W. R. and Messier, Jr., W. F., 1990. Sequential auditor decision making:
Information search and evidence evaluation. Contemporary Accounting Research
6 (2-I): 386–406.
Knoepfle, D.T., Wang, J.T.Y. and Camerer, C.F., 2009. Studying learning in games using
eye‐tracking. Journal of the European Economic Association, 7(2‐3), pp.388-398.
Koonce, L. 1992. Explanation and counter explanation during audit analytical review.
The Accounting Review 67 (January): 59–76.
Koonce, L. 1993. A cognitive characterization of audit analytical review. Auditing: A
Journal of Practice & Theory 12 (Supplement): 57–76.
Krajbich, I., Armel, C. and Rangel, A., 2010. Visual fixations and the computation and
comparison of value in simple choice. Nature neuroscience, 13(10), pp.1292-
1298.
Krajbich, I., Lu, D., Camerer, C. and Rangel, A., 2012. The attentional drift-diffusion
model extends to simple purchasing decisions.
Krajbich, I. and Rangel, A., 2011. Multialternative drift-diffusion model predicts the
relationship between visual fixations and choice in value-based decisions.
Proceedings of the National Academy of Sciences, 108(33), pp.13852-13857.
Kramer, S. and Maas, V.S., 2016. Selective Attention to Performance Measures and Bias
in Subjective Performance Evaluations: An Eye-Tracking Study.

114
Kreutzfeldt, R. W. and Wallace, W. A., 1986. Error characteristics in audit populations:
Their profile and relationship to environmental factors. Auditing: A Journal of
Practice & Theory 6 (1): 20–43.
Krishnamoorthy, G., Mock, T. J., and Washington, M. T., 1999. A comparative
evaluation of belief revision models in auditing. Auditing: A Journal of Practice
& Theory 18 (2): 105–127.
Kruglanski, A.W., 1989. The psychology of being "right": The problem of accuracy in
social perception and cognition. Psychological Bulletin, 106(3), p.395.
Krull, G., Reckers, P. M. J., and Wong-On-Wing, B., 1993. The effect of experience,
fraudulent signals and information presentation order on auditors’ beliefs.
Auditing: A Journal of Practice & Theory 12 (Fall): 143–152.
Kunda, Z. 1990. The case for motivated reasoning. Psychological Bulletin 108 (3): 480–
498.
Lai, M.L., Tsai, M.J., Yang, F.Y., Hsu, C.Y., Liu, T.C., Lee, S.W.Y., Lee, M.H., Chiou,
G.L., Liang, J.C. and Tsai, C.C., 2013. A review of using eye-tracking technology
in exploring learning from 2000 to 2012. Educational Research Review, 10,
pp.90-115.
Larcker, D. F. and Richardson, S. A., 2004. Fees paid to audit firms, accrual choices, and
corporate governance. Journal of Accounting Research 42 (3): 625–658.
Libby, R. 1985. Availability and the generation of hypotheses in analytical review.
Journal of Accounting Research 23 (Autumn): 648–667.
Libby, R. and Tan, H. T., 1994. Modeling the determinants of audit expertise.
Accounting, Organizations and Society 19: 701–716.
115
Lim, S.L., O'Doherty, J.P. and Rangel, A., 2011. The decision value computations in the
vmPFC and striatum use a relative value code that is guided by visual attention.
Journal of Neuroscience, 31(37), pp.13214-13223.
Lohse, G.L., 1997. Consumer eye movement patterns on yellow pages advertising.
Journal of Advertising, 26(1), pp.61-73.
Loose, S.M. and Orquin, J.L., 2012. How stimuli presentation format affects visual
attention and choice outcomes in choice experiments. In ANZMAC 2012.
Lundgren, S. R. and Prislin, R., 1998. Motivated cognitive processing and attitude
change. Personality and Social Psychology Bulletin 24 (7): 715–726.
Magee, R. P. and Tseng, M. C., 1990. Audit pricing and independence. The Accounting
Review 65 (2): 315–336.
Maletta, M. J. and Kida, T., 1993. The effect of risk factors on auditors’ configural
information processing. The Accounting Review 68 (July): 681–691.
Maletta, M. and Wright, A., 1996. Audit evidence planning: An examination of industry
error characteristics. Auditing, 15(1), p.71.
Mason, L., Pluchino, P. and Tornatora, M., 2016. Using eye-tracking technology as an
indirect instruction tool to improve text and picture processing and learning.
British Journal of Educational Technology, 47(6).
Mautz, R. K. and Sharaf, H. A., 1961. The philosophy of auditing (No. 6). American
Accounting Association.
Meißner, M. and Decker, R., 2010. Eye-tracking information processing in choice-based
conjoint analysis. International Journal of Market Research, 52(5).
116
Meißner, M., Musalem, A. and Huber, J., 2012. Gaze cascade effects in repeated conjoint
choices. In Australian and New Zealand Marketing Academy (ANZMAC)
Conference Adelaide.
Meißner, M., Musalem, A. and Huber, J., 2016. Eye tracking reveals processes that
enable conjoint choices to become increasingly efficient with practice. Journal of
Marketing Research, 53(1), pp.1-17.
McDaniel, L. S. 1990. The effects of time pressure and audit program structure on audit
performance. Journal of Accounting Research 28 (Autumn): 267–285.
McMillan, J. J. and White, R. A., 1993. Auditors’ belief revisions and evidence search:
The effect of hypothesis frame, confirmation and professional skepticism. The
Accounting Review 68 (3): 443–465.
Montague, N.R., 2010. The effects of directional audit guidance on auditor confirmation
bias and professional skepticism when evaluating fair value estimates.
Mormann, M.M., Navalpakkam, V., Koch, C. and Rangel, A., 2012. Relative visual
saliency differences induce sizable bias in consumer choice.
Mormann, M., Towal, R.B. and Koch, C., 2013. The Role of Visual Attention in
Decision-Making: an Eye-Tracking Experiment. NA-Advances in Consumer
Research Volume 41.
Navalpakkam, V., Kumar, R., Li, L. and Sivakumar, D., 2012, July. Attention and
selection in online choice tasks. In International Conference on User Modeling,
Adaptation, and Personalization (pp. 200-211). Springer Berlin Heidelberg.
Nelson, M. 2009. A model and literature review of professional skepticism in auditing.
Auditing: A Journal of Practice & Theory 28 (2): 1-34.
117
Nichols, D. R. and Price, K. H., 1976. Auditor-firm conflict—Analysis using concepts of
exchange theory. The Accounting Review 51 (2): 335–346.
Nisbett, R.E., Zukier H., and Lemley, R.E. 1981. The Dilution Effect: Nondiagnostic
Information Weakens the Implications of Diagnostic Information. Cognitive
Psychology (April 1981): 248-77.
Nittono, H. and Wada, Y., 2009. Gaze shifts do not affect preference judgments of
graphic patterns. Perceptual and motor skills, 109(1), pp.79-94.
Oliveira, D., Machín, L., Deliza, R., Rosenthal, A., Walter, E.H., Giménez, A. and Ares,
G., 2016. Consumers' attention to functional food labels: Insights from eye-
tracking and change detection in a case study with probiotic milk. LWT-Food
Science and Technology, 68, pp.160-167.
Orquin, J.L. and Loose, S.M., 2013. Attention and choice: A review on eye movements in
decision making. Acta psychologica, 144(1), pp.190-206.
Orquin, J.L., Scholderer, J. and Jeppesen, H., 2012. What you see is what you buy: How
saliency and surface size of packaging elements affect attention and choice.
Society for Advancement of Behavioural Economics.
Orth, U.R. and Crouch, R.C., 2014. Is beauty in the aisles of the retailer? Package
processing in visually complex contexts. Journal of Retailing, 90(4), pp.524-537.
Paterson, J. S. and Valencia, A., 2011. The Effects of Recurring and Nonrecurring Tax,
Audit‐Related, and Other Nonaudit Services on Auditor Independence.
Contemporary Accounting Research, 28(5), 1510-1536.

118
Peecher, M.E., Solomon, I. and Trotman, K.T., 2013. An accountability framework for
financial statement auditors and related research questions. Accounting,
Organizations and Society, 38(8), pp.596-620.
Pieters, R. and Warlop, L., 1999. Visual attention during brand choice: The impact of
time pressure and task motivation. International Journal of Research in
Marketing, 16(1), pp.1-16.
Ponemon, L. 1993. The influence of ethical reasoning on auditors’ perception of
management’s integrity and competence. Advances in Accounting 11: 1–23.
Ponemon, L. and Gabhart, D., 1993. Ethical Reasoning in Accounting and Auditing.
Vancouver, Canada: Canadian General Accountants’ Research Foundation.
Public Company Accounting Oversight Board (PCAOB). 2012. Maintaining and
applying professional skepticism in audits
Pyszczynski, T. and Greenberg, J., 1987. Toward an integration of cognitive and
motivational perspectives on social inference - A biased hypothesis-testing model.
Advances in Experimental Social Psychology 20: 297–340.
Quadackers, L., Groot, T. and Wright, A., 2014. Auditors’ professional skepticism:
Neutrality versus presumptive doubt. Contemporary Accounting Research, 31(3),
pp.639-657.
Raaij, W., 1977. Consumer information processing for different information structures
and formats. NA-Advances in Consumer Research Volume 04.
Rayner, K. 1998. “Eye Movements in Reading and Information Processing: 20 Years of
Research,” Psychological Bulletin (124:3), pp. 372-422.
119
Renkewitz, F. and Jahn, G., 2012. Memory indexing: A novel method for tracing
memory processes in complex cognitive tasks. Journal of Experimental
Psychology: Learning, Memory, and Cognition, 38(6), p.1622.
Rennie, M., Kopp, L., and Lemon, W. M., 2007. Exploring trust and the auditor-client
relationship. Working paper, Universities of Lethbridge, Waterloo, and Regina.
Rest, J. R. 1986. Moral Development. Advances in Research and Theory. New York, NY:
Praeger.
Reutskaja, E., Nagel, R., Camerer, C.F. and Rangel, A., 2011. Search dynamics in
consumer choice under time pressure: An eye-tracking study. The American
Economic Review, 101(2), pp.900-926.
Rotter, J. B. 1967. A new scale for the measurement of interpersonal trust. Journal of
Personality 35 (4): 651–65.
Ruddock, C., Taylor, S. J., and Taylor S. L., 2006. Nonaudit services and earnings
conservatism: Is auditor independence impaired? Contemporary Accounting
Research 23 (3): 701–746.
Russo, J.E., 1978. Eye fixations can save the world: A critical evaluation and a
comparison between eye fixations and other information processing
methodologies. NA-Advances in Consumer Research Volume 05.
Russo, J.E. and Dosher, B.A., 1983. Strategies for multiattribute binary choice. Journal
of Experimental Psychology: Learning, Memory, and Cognition, 9(4), p.676.
Russo, J.E. and Leclerc, F., 1994. An eye-fixation analysis of choice processes for
consumer nondurables. Journal of Consumer Research, 21(2), pp.274-290.

120
Russo, J.E. and Rosen, L.D., 1975. An eye fixation analysis of multialternative
choice. Memory & Cognition, 3(3), pp.267-276.
Scholten, L., Van Knippenberg, D., Nijstad, B. A., and De Dreu, C. K., 2007. Motivated
information processing and group decision-making: Effects of process
accountability on information processing and decision quality. Journal of
Experimental Social Psychology, 43(4), 539-552.
Scholz, A., von Helversen, B. and Rieskamp, J., 2015. Eye movements reveal memory
processes during similarity-and rule-based decision making. Cognition, 136,
pp.228-246.
Schotter, E.R., Berry, R.W., McKenzie, C.R. and Rayner, K., 2010. Gaze bias: Selective
encoding and liking effects. Visual Cognition, 18(8), pp.1113-1132.
Schotter, E.R., Gerety, C. and Rayner, K., 2012. Heuristics and criterion setting during
selective encoding in visual decision making: Evidence from eye movements.
Visual cognition, 20(9), pp.1110-1129.
Selart, M., Kuvaas, B., Boe, O. and Takemura, K., 2006. The influence of decision
heuristics and overconfidence on multi-attribute choice: A process-tracing study.
European Journal of Cognitive Psychology, 18(03), pp.437-453.
Shaub, M. K. 1996. Trust and suspicion: The effects of situational and dispositional
factors on auditors’ trust of clients. Behavioral Research in Accounting 8: 154–
174.
Shelton, S. W. 1999. The effect of experience on the use of irrelevant evidence in auditor
judgement. The Accounting Review 74 (2): 217–224.

121
Shi, S.W., Wedel, M. and Pieters, F.G.M., 2013. Information acquisition during online
decision making: A model-based exploration using eye-tracking data.
Management Science, 59(5), pp.1009-1026.
Shimojo, S., Simion, C., Shimojo, E. and Scheier, C., 2003. Gaze bias both reflects and
influences preference. Nature neuroscience, 6(12), pp.1317-1322.
Siegel-Jacobs, K. and Yates, J.F., 1996. Effects of procedural and outcome accountability
on judgment quality. Organizational Behavior and Human Decision Processes,
65(1), pp.1-17.
Simnett, R., 1996. The effect of information selection, information processing and task
complexity on predictive accuracy of auditors. Accounting, Organizations and
Society, 21(7-8), pp.699-719.
Simon, H., 1957. A bounded-rationality model of rational choice. Models of Man, Social
and Rational: Mathematical Essays on Rational Human Behavior in a Social
Setting.
Sirois, L.P., Bédard, J. and Bera, P., 2015. The Informational Value of Key Audit Matters
in the Auditor’s Report: Evidence from an Eye-tracking Study. Available at
SSRN 2469905.
Smead, R.J., Wilcox, J.B. and Wilkes, R.E., 1981. How valid are product descriptions
and protocols in choice experiments? Journal of Consumer Research, 8(1), pp.37-
42.
Solomon, I., Shields, M. D., and Whittington, O. R., 1999. What do industry-specialist
auditors know? Journal of Accounting Research 37 (Spring): 191–208.

122
Solomon, I. and Trotman, K.T., 2003. Experimental judgment and decision research in
auditing: The first 25 years of AOS. Accounting, Organizations and
Society, 28(4), pp.395-412.
Sona Systems, 2017. Available at: https://www.sona-systems.com/default.aspx.
Sperling, G. and Weichselgartner, E., 1995. Episodic theory of the dynamics of spatial
attention. Psychological review, 102(3), p.503.
Srinidhi, B. and Gul, F. A., 2006. The differential effects of auditors’ non-audit and audit
fees on accrual quality. Contemporary Accounting Research.
Su, Y., Rao, L.L., Li, X., Wang, Y. and Li, S., 2012. From quality to quantity: The role of
common features in consumer preference. Journal of Economic Psychology,
33(6), pp.1043-1058.
Summerfield, J.J., Rao, A., Garside, N. and Nobre, A.C., 2011. Biasing perception by
spatial long-term memory. The Journal of Neuroscience, 31(42), pp.14952-14960.
Sütterlin, B., Brunner, T.A. and Opwis, K., 2008. Eye-tracking the cancellation and focus
model for preference judgments. Journal of Experimental Social
Psychology, 44(3), pp.904-911.
Tatler, B.W., Hayhoe, M.M., Land, M.F. and Ballard, D.H., 2011. Eye guidance in
natural vision: Reinterpreting salience. Journal of vision, 11(5), pp.5-5.
Teoh, S. H. 1992. Auditor independence, dismissal threats, and the market reaction to
auditor switches. Journal of Accounting Research 30 (1): 1–23.
Tetlock, P. E. 1983. Accountability and complexity of thought. Journal of Personality
and Social Psychology, 45, 74–83.
123
Theeuwes, J., 2010. Top–down and bottom–up control of visual selection. Acta
psychologica, 135(2), pp.77-99.
Tobii X2-60 Eye Tracker Accuracy and Precision Test Report. 2013. Available at:
http://www.tobiipro.com/siteassets/tobii-pro/accuracy-and-precision-tests/tobii-
x2-60-eye-tracker-accuracy-and-precision-test-report.pdf/?v=1.0
Toubia, O., de Jong, M.G., Stieger, D. and Füller, J., 2012. Measuring consumer
preferences using conjoint poker. Marketing Science, 31(1), pp.138-156.
Townsend, C. and Kahn, B.E., 2014. The “visual preference heuristic”: the influence of
visual versus verbal depiction on assortment processing, perceived variety, and
choice overload. Journal of Consumer Research, 40(5), pp.993-1015.
Trompeter, G. 1994. The effect of partner compensation schemes and generally accepted
accounting principles on audit partner judgment. Auditing: A Journal of Practice
& Theory 13: 56–71.
Trompeter, G. and Wright, A., 2010. The world has changed—Have analytical procedure
practices? Contemporary Accounting Research 27 (2): 669–700.
Trotman, K.T., Tan, H.C. and Ang, N., 2011. Fifty‐year overview of judgment and
decision‐making research in accounting. Accounting & Finance, 51(1), pp.278-
360.
Trotman, K.T. and Wright, W.F., 2012. Triangulation of audit evidence in fraud risk
assessments. Accounting, Organizations and Society, 37(1), pp.41-53.
Tubbs, R. M., Messier, W. F., and Knechel, W. R., 1990. Recency effects in the auditor’s
belief-revision process. The Accounting Review 65 (April): 452–460.

124
Van Herpen, E. and Van Trijp, H.C., 2011. Front-of-pack nutrition labels. Their effect on
attention and choices when consumers have varying goals and time constraints.
Appetite, 57(1), pp.148-160.
Velichkovsky, B.M., 1999. From levels of processing to stratification of cognition.
Stratification in cognition and consciousness, pp.203-235.
Velichkovsky, B.M., Rothert, A., Kopf, M., Dornhöfer, S.M. and Joos, M., 2002.
Towards an express-diagnostics for level of processing and hazard perception.
Transportation Research Part F: Traffic Psychology and Behaviour, 5(2), pp.145-
156.
Visschers, V.H., Hess, R. and Siegrist, M., 2010. Health motivation and product design
determine consumers’ visual attention to nutrition information on food products.
Public health nutrition, 13(07), pp.1099-1106.
Wang, Q., Yang, S., Liu, M., Cao, Z. and Ma, Q., 2014. An eye-tracking study of website
complexity from cognitive load perspective. Decision support systems, 62, pp.1-
10.
Warren Jr, J.D., Moffitt, K.C. and Byrnes, P., 2015. How big data will change
accounting. Accounting Horizons, 29(2), pp.397-407.
Wedel, M. and Pieters, R., 2008. A review of eye-tracking research in marketing. Review
of marketing research, 4(2008), pp.123-147.
Wilks, T. J. 2002. Predecisional distortion of evidence as a consequence of real-time
audit review. The Accounting Review 77 (1): 51–71.
Wrightsman, L. S. 1974. Assumptions About Human Nature: A Social-Psychological
Approach. Monterey, CA: Brooks/Cole Publishing Co.

125
Wurst, J., Neter, J. and Godfrey, J., 1991. Effectiveness of rectification in audit sampling.
The Accounting Review, pp.333-346.
Yarbus, A.L., 1967. Eye movement and vision, trans. B. Haigh. ed: Plenum Press, New
York.
Zhang, J., Yang, X. and Appelbaum, D., 2015. Toward effective Big Data analysis in
continuous auditing. Accounting Horizons, 29(2), pp.469-476.
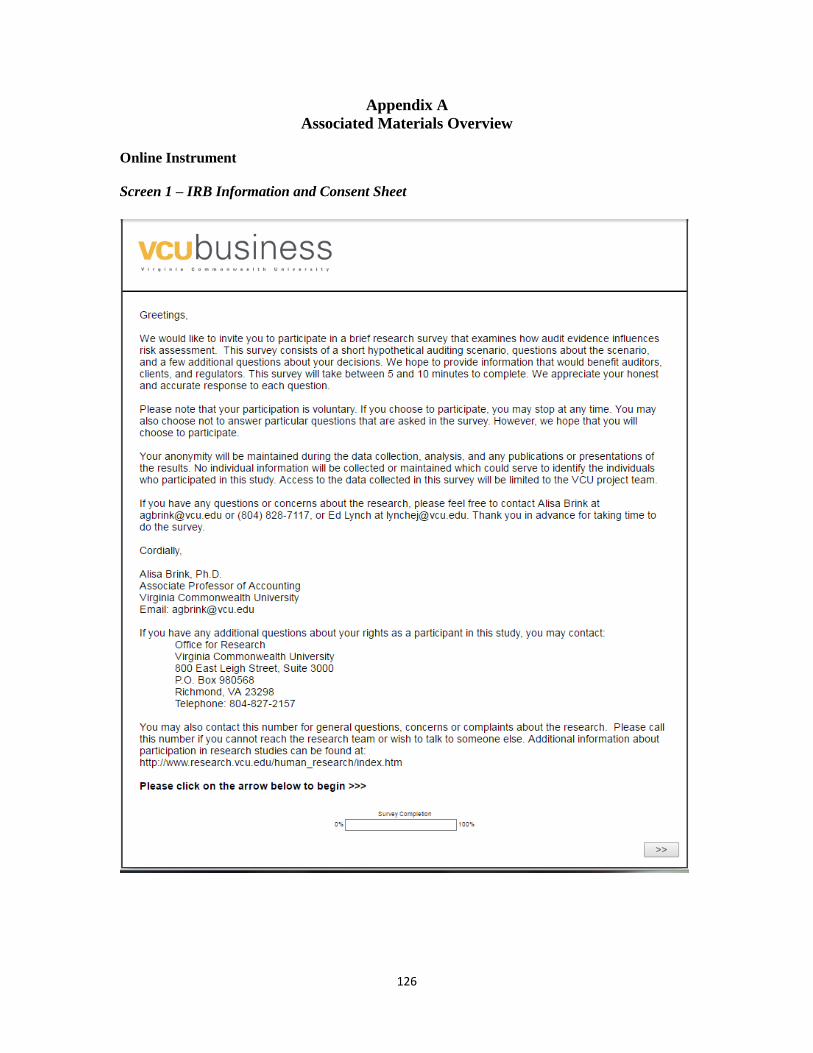
126
Appendix A
Associated Materials Overview
Online Instrument
Screen 1 – IRB Information and Consent Sheet
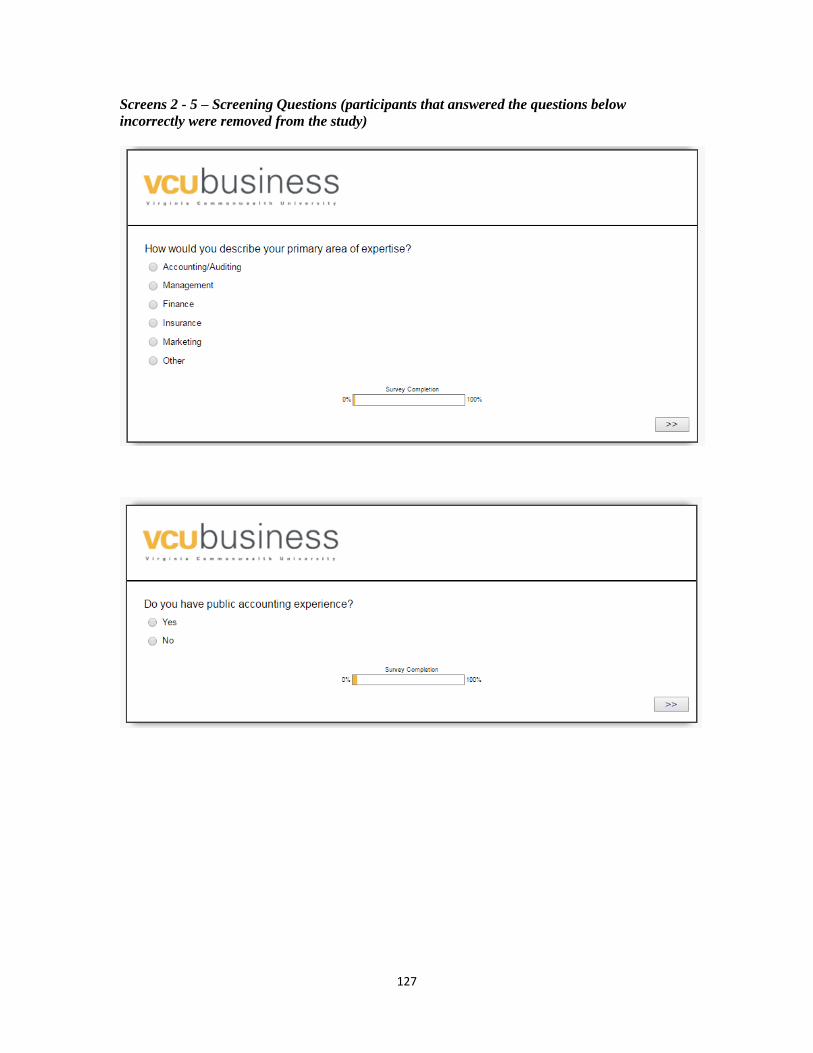
127
Screens 2 - 5 – Screening Questions (participants that answered the questions below
incorrectly were removed from the study)

128

129
Screen 6 – Case Description

130
Screen 7 – Key Information Quiz (participants had to select the correct answer to proceed)
Screen 8 – Task Reminder Screen

131
Screen 9 - Audit Evidence Screen (1 of the following 4 is randomly shown to participants)
Control Condition (no irrelevant information or minor errors):
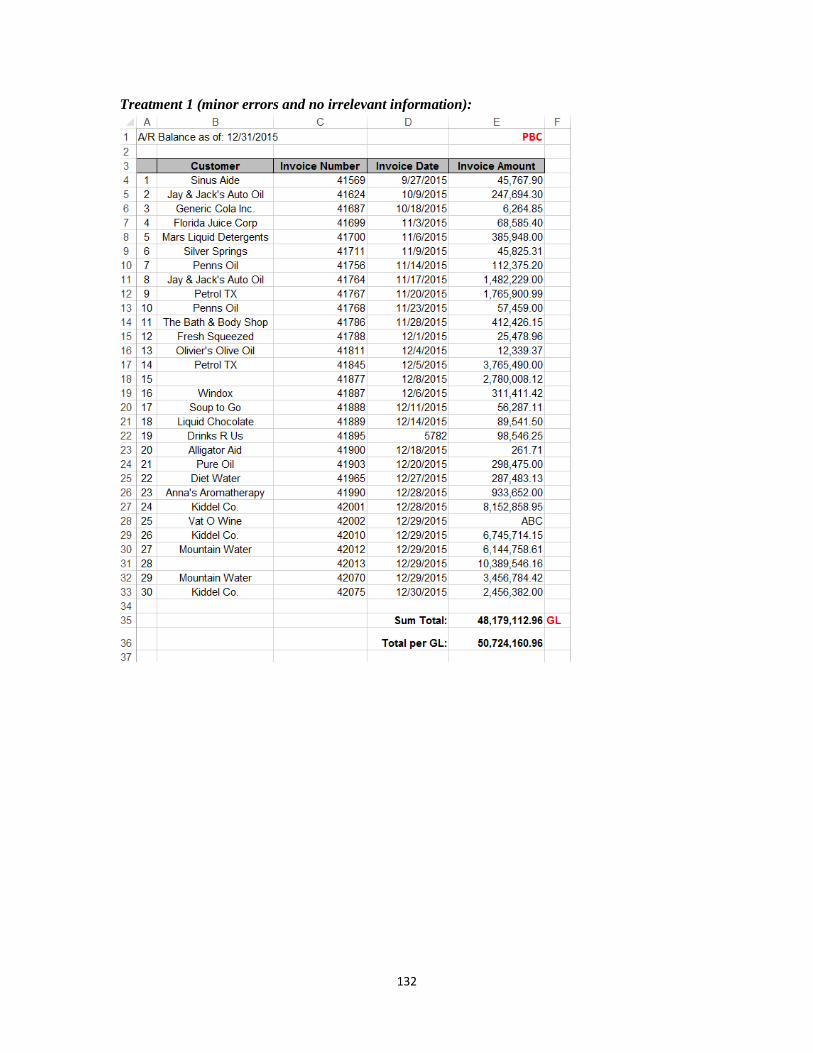
132
Treatment 1 (minor errors and no irrelevant information):
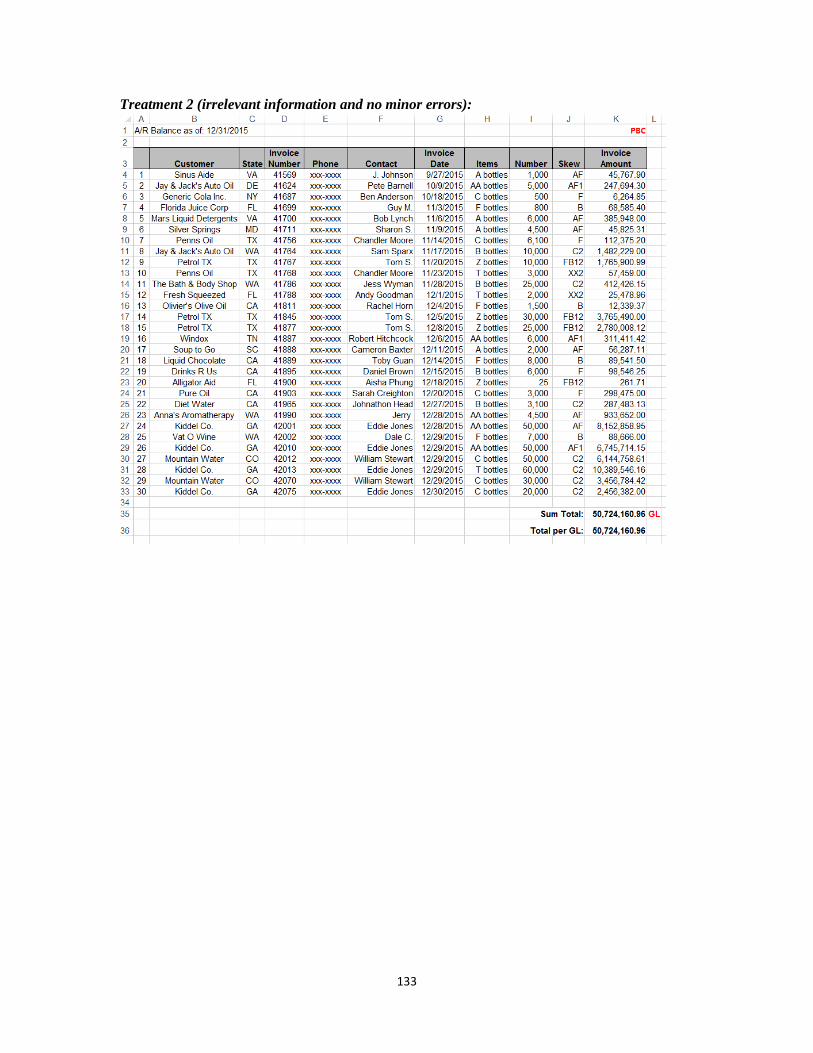
133
Treatment 2 (irrelevant information and no minor errors):
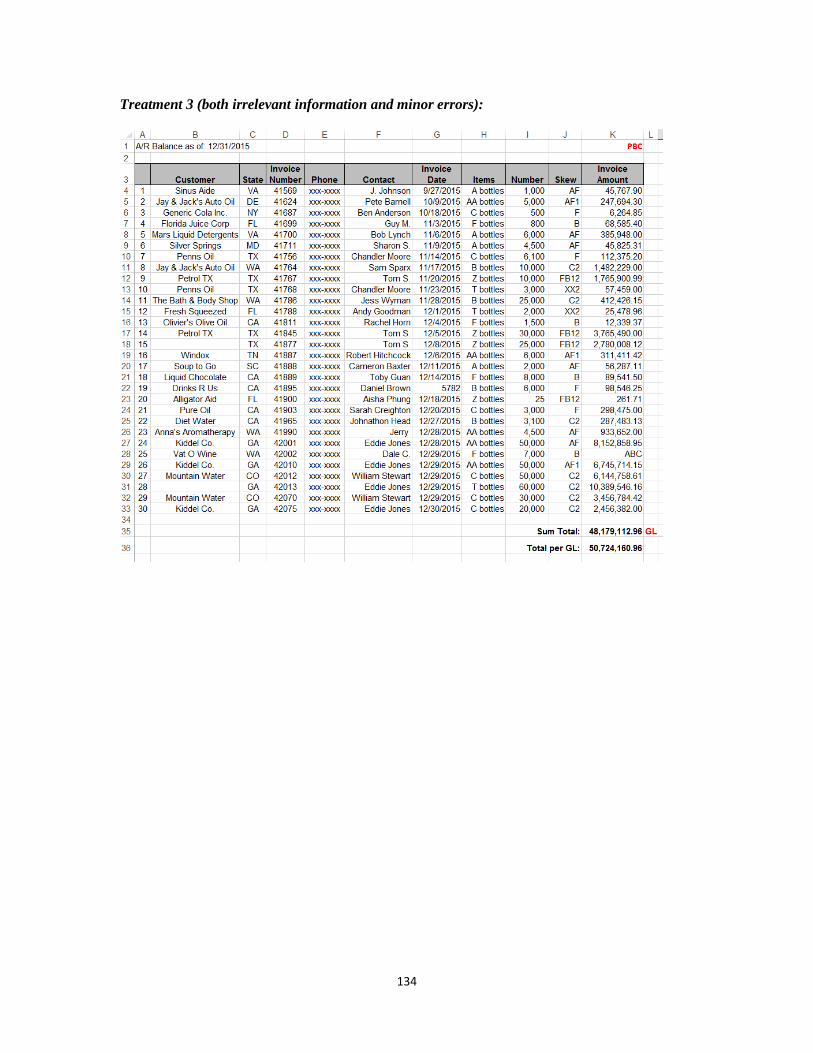
134
Treatment 3 (both irrelevant information and minor errors):

135
Screen 10 – Follow-up Assessment Questions
136
Screen 11 – Follow-up Assessment Questions Continued
137
Screen 12 – Attention Check Question (participants had to get this question correct to
continue)
Screen 13 – Post-Experimental Debrief Survey

138
Screen 14 – Post-Experimental Debrief Survey Continued

139
Screen 15 – Demographic Questions

140
Screens 16 - 18 – Skepticism Survey (Hurtt 2010)
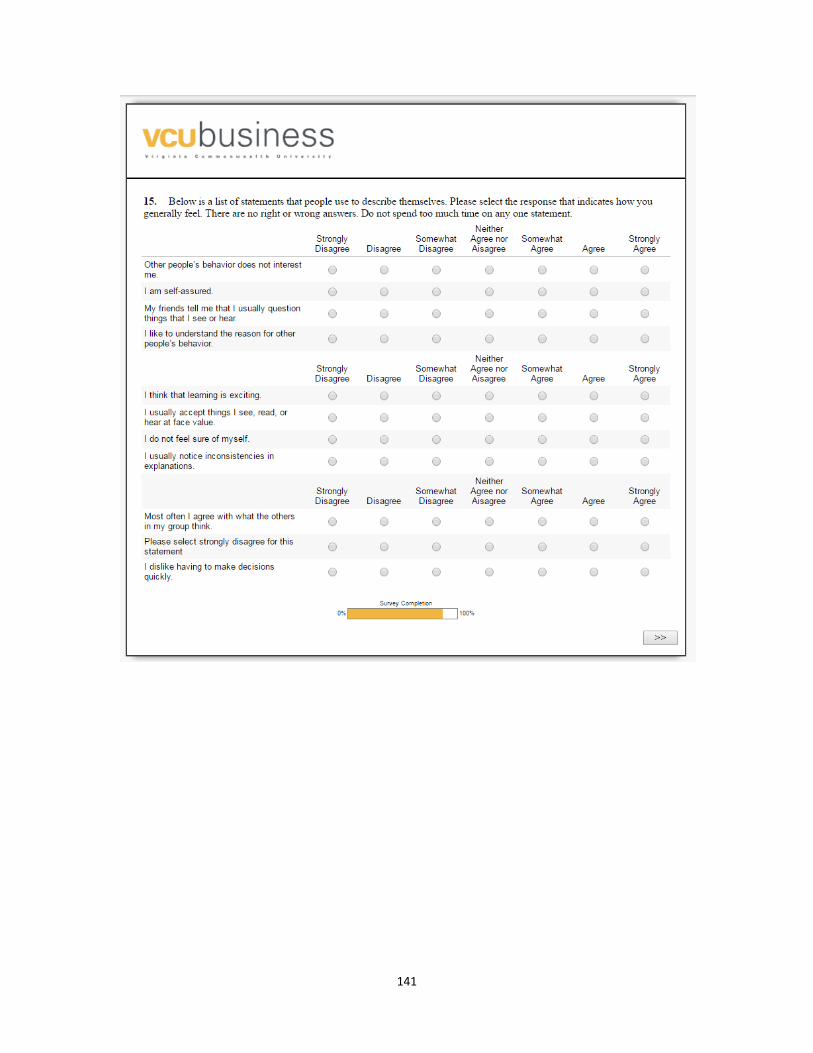
141

142
143
Screen 19 – Final Demographic Information
144
Appendix B
Responses to the Open-Ended Question
“Typical Shoebox, just trying to drill down to the necessary information. Clients either
send too much or not enough.”
“Loan files from a client were in a huge basket and they were not organized. They told us
to find everything on our own.”
“I've received literal shoeboxes of unorganized paperwork.”
“Request the client "refurbish" the files provided and prepare better organized
workpapers and source documents. Most of our clients are quite small and have limited
staff.”
“Irrelevant information, major errors in estimates”
“Client provided trial balance prior to making any adjusting entries that they knew
needed to be made.”
“Details did not agree to the trial balance. Several entries had to be made.”
“We have a bookkeeper for several small clients that keeps files in milk crates.”
“Tax client who was personal assistant that hadn't filed for 3 years. Spent several days
just sorting receipts into personal and business by year. Huge waste of time.”
“Not recording revenues in the appropriate month”
“Needed to be completely resubmitted due to not following directions. Materially
incomplete.”
“Shoe box no longer client”
“Sub-ledgers did not tie to general ledger
“Many out of period transactions”
“Minor errors”
“Errors and messy”
“A box of invoices that had never been entered”
“Go percentage was higher than expected. On examination returned good were placed
back in inventory without the sale being reversed”
145
“Beginning retained earning doesn't tie to prior year”
“Received a file that had no date order, missing documents”
“Home builder not using the percentage-of-completion method for costs.”
“Doesn't agree to GL”
“Partner helped with notes receivable”
“We have audited companies with false amounts and merchandise with different faults”
“Was a Japanese client and [they] had many unneeded columns for our audit work.”
“I uncovered a suspicious amount of open invoices to one single customer. It represented
about 30% of the total A/R. It turned out to be an entity related to the owner's family, and
should have been considered an owner's distribution, rather than a sale.”
“Irrelevant information with many minor and some major errors.”
“Client Quickbokks file consisted of journalist entries and no detail information and did
not reconcile”
“Client updated to a new software and we had to reformat and piecemeal files to meet our
audit requirements”
“[Client files were] Not agreed to GL”
“Having files that are not of year-end, so numbers are just slightly off”
“When the client throws everything (and I mean everything) into a box and brings it to
you.”
“A client was using quickbooks without any prior training and his books were almost
completely unusable.”
“I'm a CPA and have been in public accounting for my whole working career of 5 years
and have only done tax. Certainly, there are many times were I receive client prepared
financial statements in which there have been no attestation services performed and I
have to do many adjusting journal entries for the client to properly prepare the
financials.”
“Client hadn't completed bank reconciliations from May through the end of the year.”
146
Appendix C
Eye-Tracking Associated Materials Overview
Recruitment Email: Greetings,
Would you be interested in participating in a 15-20 minute auditor research study here at VCU? If so, we
invite you to participate in a study at the School of Business about how auditors respond to different client
documents.
As a currently enrolled auditing student age 18 or older, you are uniquely qualified to participate in this
research study.
The purpose of this study is to improve auditing students' learning and understanding of key auditing
concepts through the application of class concepts to a real world audit setting. Specifically, you will be
asked to review audit evidence and perform audit tasks based on your professional judgment while your
eye movements are being tracked.
For participating in this study you will receive 5 opportunity points.
Here's how to participate:
Step 1. Click on the link below to schedule a date and time for your 20-minute research session. (Please
note, there is limited space to participate in this research study. Sign-ups for the study are on a first-come,
first-serve basis)
Step 2. Details about the research session, including what to bring and where to go will be emailed to you
before your session.
Step 3. Attend your scheduled research session.
CLICK HERE TO SIGN UP: https://vcu-celab.sona-systems.com/Default.aspx?ReturnUrl=%2f
If you have any questions, complaints, or concerns about the research, contact Alisa Brink (804) 828-
7117 or [email protected].
Note - Alternatively, you can also receive the same opportunity points by completing a homework
assignment on your own (see your instructor for a copy of the homework assignment) and turning in a 2-3
page written response to your instructor. The homework assignment requires you to read an audit scenario
and respond to a list of case questions.

147
Consent Form:
RESEARCH SUBJECT INFORMATION AND CONSENT FORM
TITLE: The Accounts Receivable Sample Selection Case
VCU IRB NO.: HM20009511
INVESTIGATORS: Alisa Brink, Ph.D., Jodie Ferguson Ph.D., Lindsay Andiola Ph.D., and Edward Lynch
CPA
PURPOSE OF THE STUDY
The purpose of this study is to better understand how auditors respond to different client documents. You
are being asked to participate in this study to find out if audit students react differently depending on the
attributes of audit evidence.
DESCRIPTION OF THE STUDY AND YOUR INVOLVEMENT
If you decide to participate in this research study, you will be asked to sign this consent form after you have
had all your questions answered and understand what will happen to you.
In this study, you will be asked to sit at a regular computer desk that has an eye tracking device attached to
it. You will be asked to review some audit evidence provided by a fictitious client, and make some
judgements. As you read the information on the computer screen, your eye gaze location on the computer
screen will be measured. Only your eye movements will be tracked and no actual video of your eyes or
your face will be recorded. Your participation in the study should take about 15 minutes.
RISKS AND DISCOMFORTS
The eye tracking equipment used in this study is not attached to you and does not pose any danger to you
physically. There is also a risk of loss of confidentiality or privacy. There are no risks involved with
participating in this research beyond what is experienced in everyday life.
BENEFITS TO YOU AND OTHERS
You may not get any direct benefit from this study, but the information we learn in this study could help us
to better understand how audit students evaluate audit evidence.
COSTS
There are no costs for participating in this study beyond the time for you to participate in the research.
PAYMENT FOR PARTICIPATION
Students will receive five extra credit points for their participation in this study. Those students who wish
not to participate will have the opportunity to complete an equivalent task for the same amount of extra
credit. The equivalent task will involve students analyzing a similar case on their own and writing up a
typed response to the case questions and turning it into their professors.
CONFIDENTIALITY
Your identifiable information, such as your name, will be separate from your responses.
148
We will not share the responses you give us; however, information from the study and the consent form
signed by you may be looked at or copied for research or legal purposes by Virginia Commonwealth
University. Records may also be accessed by the Office of Human Research Protections (OHRP).
The research findings may be presented at meetings or published in papers, but your name will not ever be
used in these presentations or papers.
VOLUNTARY PARTICIPATION AND WITHDRAWAL
Your participation in this study is voluntary. You may decide to not participate in this study. Your
decision not to take part will involve no penalty or loss of benefits to which you are otherwise entitled. In
addition, your decision to participate will not affect your grade or academic standing. If you do participate,
you may freely withdraw from the study at any time. Your decision to with draw will involve no penalty or
loss of benefits to which you are otherwise entitled.
Your participation in this study may be stopped at any time by the study staff without your consent. The
reasons might include:
the study staff thinks it necessary for your health or safety;
you have not followed study instructions; or
administrative reasons require your withdrawal.
If you leave the study before the data collection is complete, your data will be removed from the analysis. If
after you leave the study, you still may have your information removed from the study up to one month
after your participation in this study. To have your information removed after you leave, please email or
call Dr. Brink at [email protected] or (804)828-7117.
QUESTIONS
If you have any questions, complaints, or concerns about your participation in this research, contact:
Alisa Brink, Ph.D.
Associate Professor of Accounting
Virginia Commonwealth University
Email: [email protected]
Phone: (804) 828-7117
The researcher named above is the best person to call for questions about your participation in this study.
If you have any general questions about your rights as a participant in this or any other research, you may
contact:
Office of Research
Virginia Commonwealth University
800 East Leigh Street, Suite 3000
P.O. Box 980568
Richmond, VA 23298
Telephone: (804) 827-2157
Contact this number to ask general questions, to obtain information or offer input, and to express concerns
or complaints about research. You may also call this number if you cannot reach the research team or if you
wish to talk with someone else. General information about participation in research studies can also be
found at
149
http://www.research.vcu.edu/human_research/volunteers.htm.
CONSENT
I have been given the chance to read this consent form. I understand the information about this study.
Questions that I wanted to ask about the study have been answered. My signature says that I am willing to
participate in this study. I will receive a copy of the consent form once I have agreed to participate.
Participant name printed Participant signature Date
________________________________________________
Name of Person Conducting Informed Consent Discussion
(Printed)
________________________________________________________________________
Signature of Person Conducting Informed Consent Discussion Date
________________________________________________________________________
Principal Investigator Signature (if different from above) Date
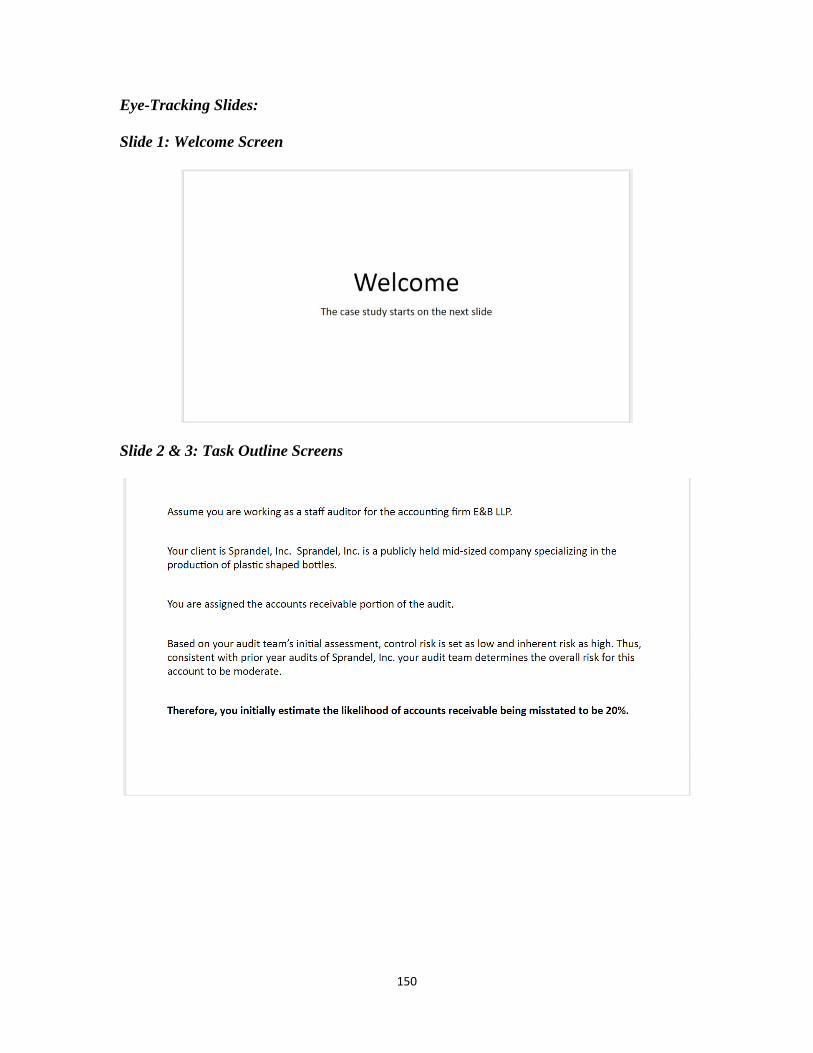
150
Eye-Tracking Slides:
Slide 1: Welcome Screen
Slide 2 & 3: Task Outline Screens
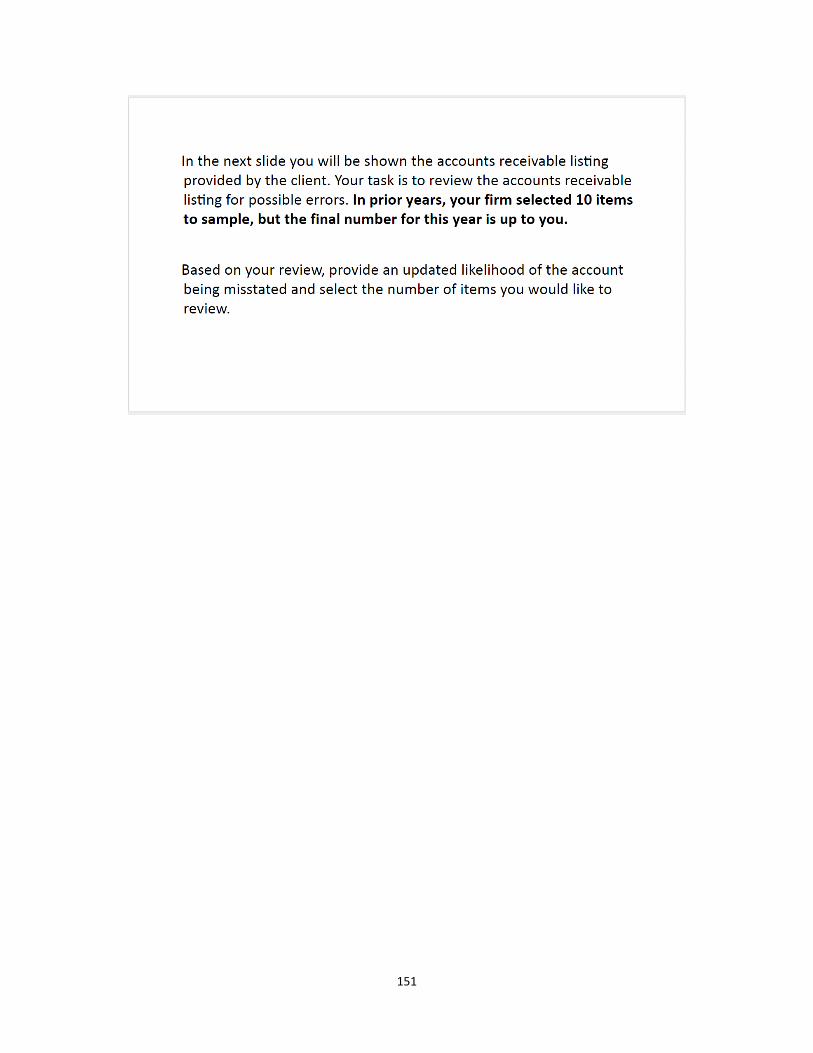
151
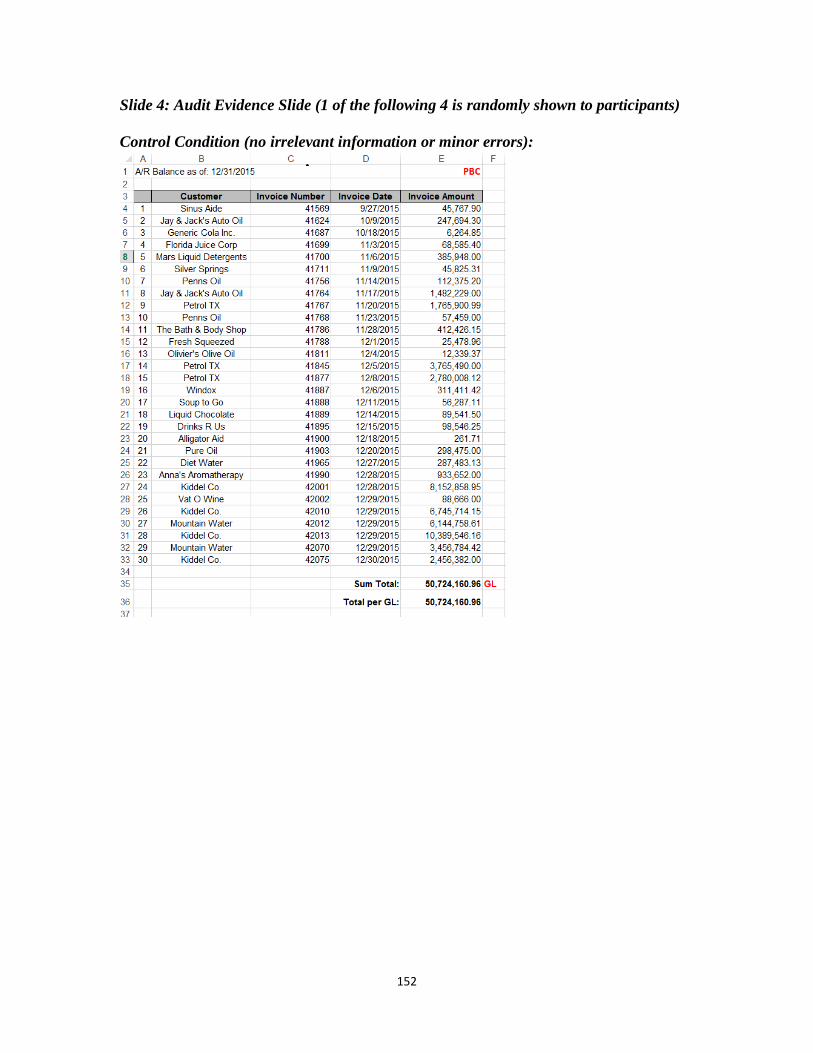
152
Slide 4: Audit Evidence Slide (1 of the following 4 is randomly shown to participants)
Control Condition (no irrelevant information or minor errors):
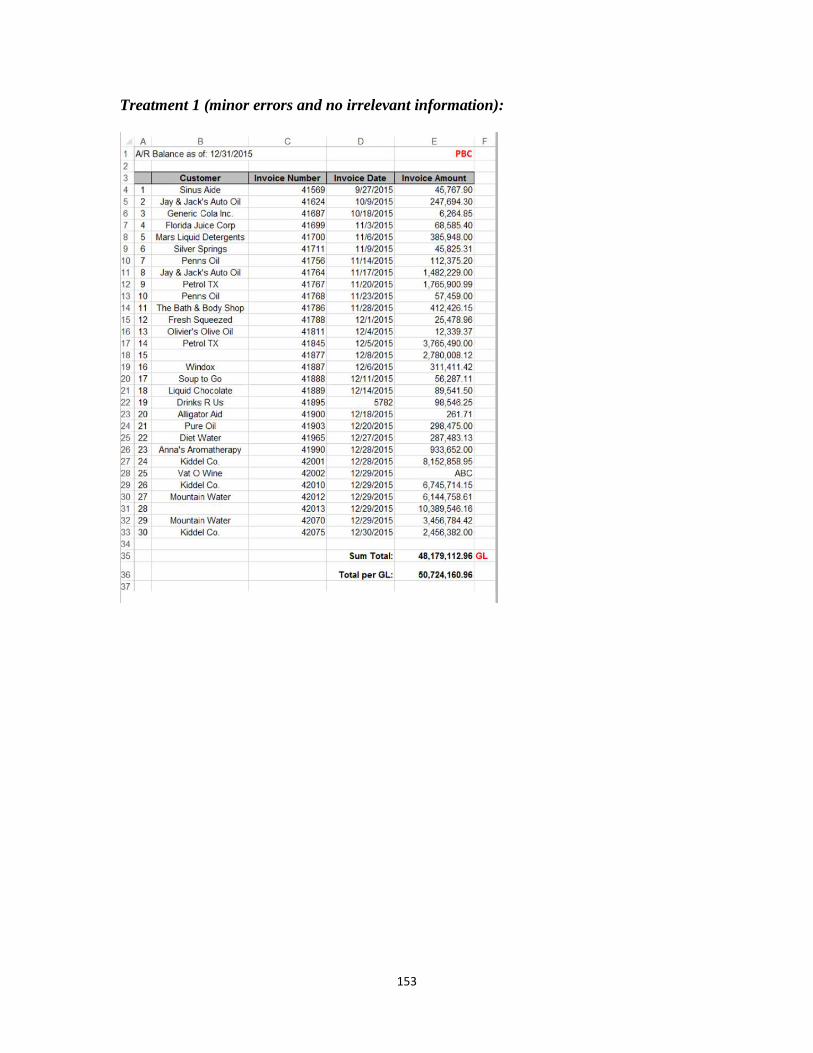
153
Treatment 1 (minor errors and no irrelevant information):

154
Treatment 2 (irrelevant information and no minor errors):

155
Treatment 3 (both irrelevant information and minor errors):
Slide 5: Qualtrics Survey Link
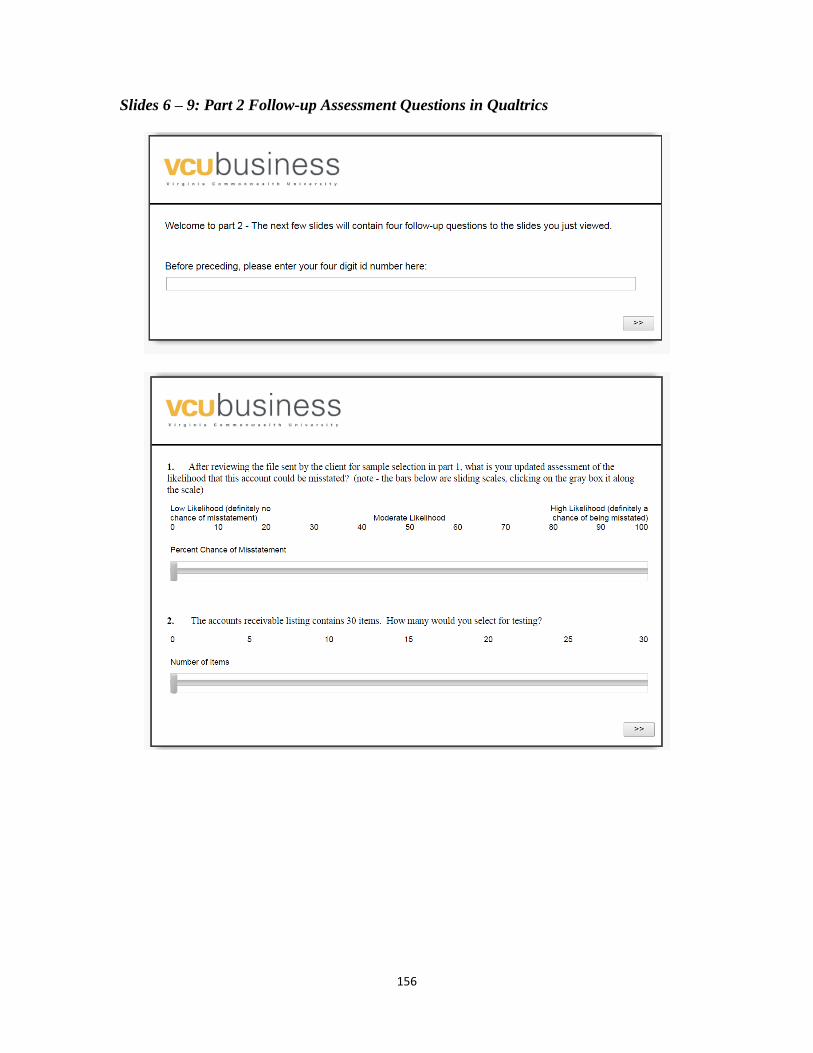
156
Slides 6 – 9: Part 2 Follow-up Assessment Questions in Qualtrics
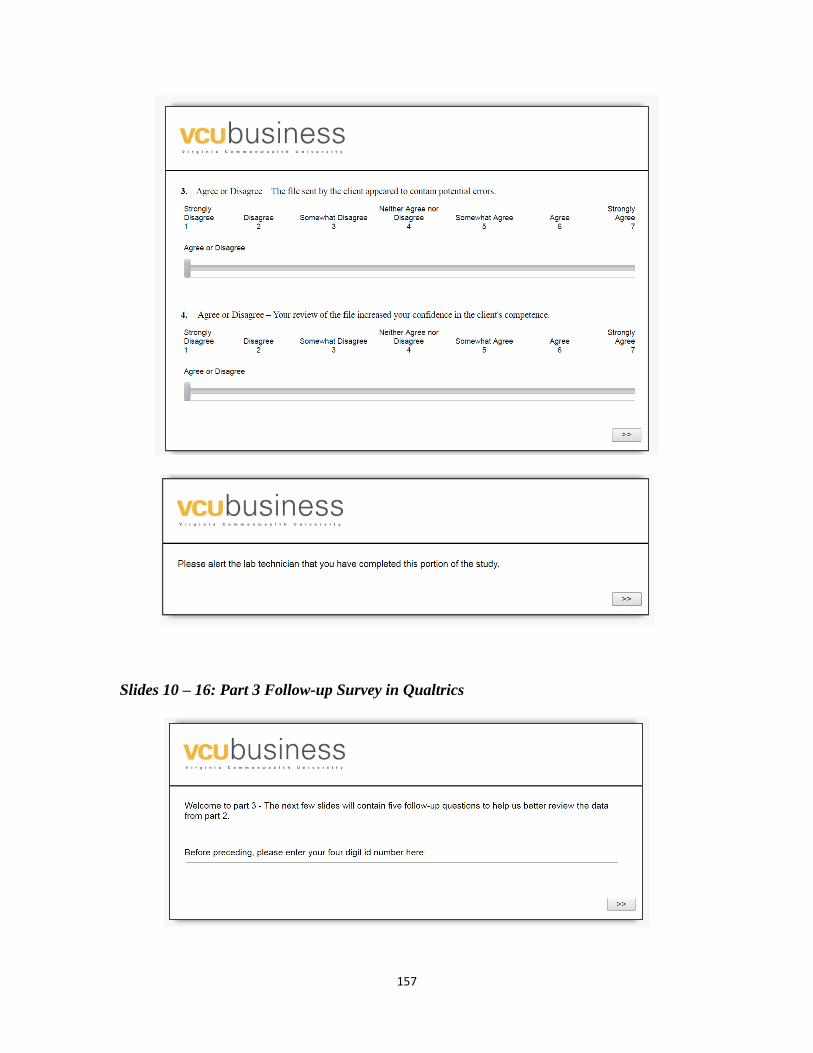
157
Slides 10 – 16: Part 3 Follow-up Survey in Qualtrics

158
Slide 11 – 13: Hurt (2010) Skepticism Scale Slides

159
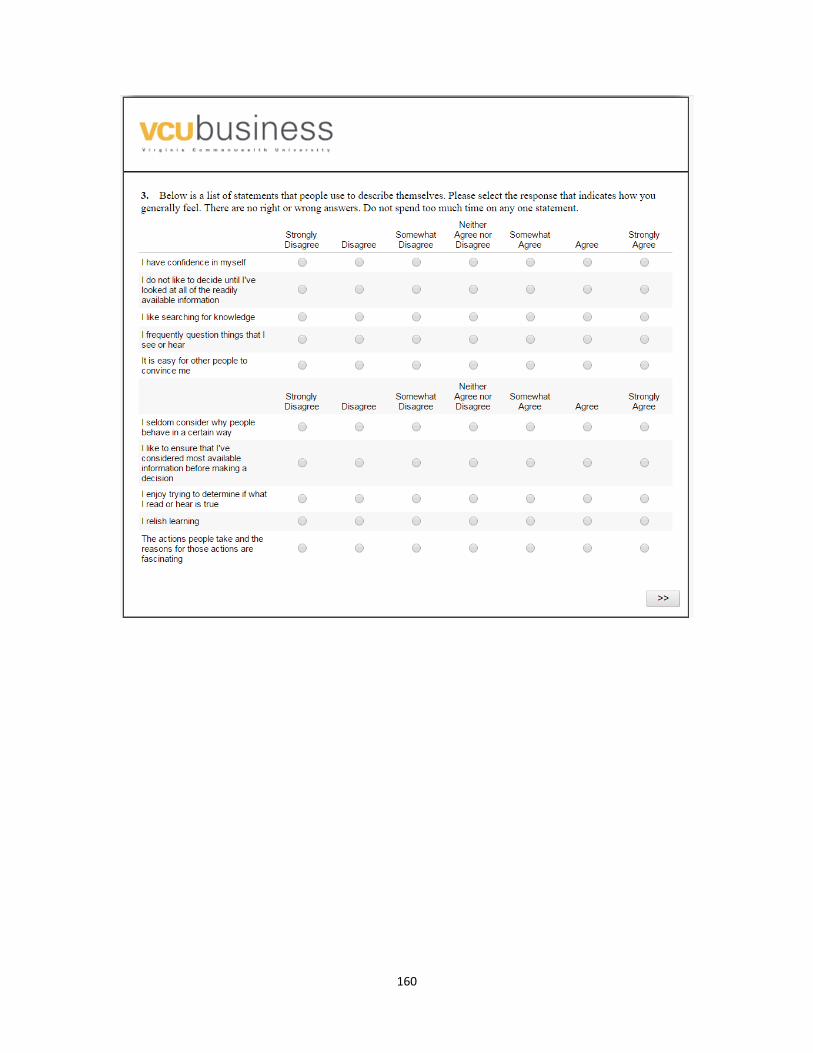
160

161
Slide 14: Risk Aversion Scale
162
Slide 15 – 16: Demographic Questions
163
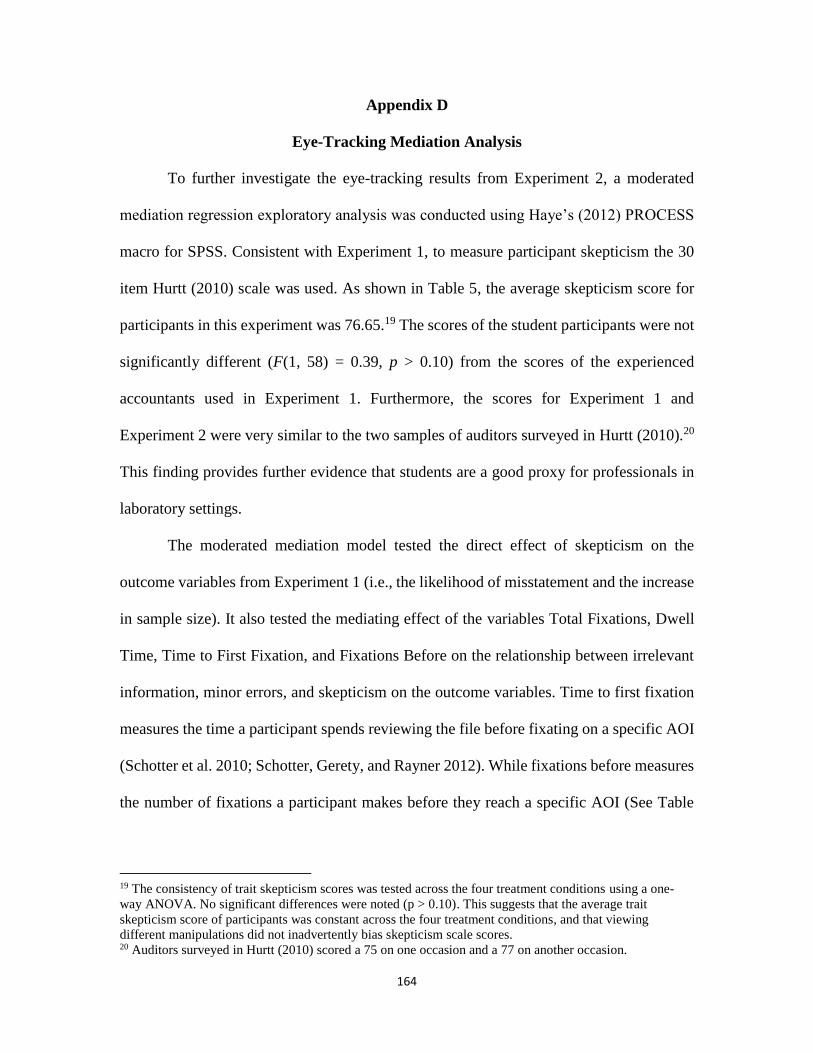
164
Appendix D
Eye-Tracking Mediation Analysis
To further investigate the eye-tracking results from Experiment 2, a moderated
mediation regression exploratory analysis was conducted using Haye’s (2012) PROCESS
macro for SPSS. Consistent with Experiment 1, to measure participant skepticism the 30
item Hurtt (2010) scale was used. As shown in Table 5, the average skepticism score for
participants in this experiment was 76.65.19 The scores of the student participants were not
significantly different (F(1, 58) = 0.39, p > 0.10) from the scores of the experienced
accountants used in Experiment 1. Furthermore, the scores for Experiment 1 and
Experiment 2 were very similar to the two samples of auditors surveyed in Hurtt (2010).20
This finding provides further evidence that students are a good proxy for professionals in
laboratory settings.
The moderated mediation model tested the direct effect of skepticism on the
outcome variables from Experiment 1 (i.e., the likelihood of misstatement and the increase
in sample size). It also tested the mediating effect of the variables Total Fixations, Dwell
Time, Time to First Fixation, and Fixations Before on the relationship between irrelevant
information, minor errors, and skepticism on the outcome variables. Time to first fixation
measures the time a participant spends reviewing the file before fixating on a specific AOI
(Schotter et al. 2010; Schotter, Gerety, and Rayner 2012). While fixations before measures
the number of fixations a participant makes before they reach a specific AOI (See Table
19 The consistency of trait skepticism scores was tested across the four treatment conditions using a one-
way ANOVA. No significant differences were noted (p > 0.10). This suggests that the average trait
skepticism score of participants was constant across the four treatment conditions, and that viewing
different manipulations did not inadvertently bias skepticism scale scores. 20 Auditors surveyed in Hurtt (2010) scored a 75 on one occasion and a 77 on another occasion.

165
13 for means and standard deviations). These variables help determine the order in which
AOI’s were examined by participants. In addition, they help determine the importance and
prominence of AOI’s to participants. If participants focus on one AOI earlier than another,
the AOI first focused upon most likely drew their attention for a specific reason or they
deemed that area to be important.
TABLE 13
Means and Standard Deviations for the Time to First Fixation and Number of Fixations
Before Across Variables
Panel A: Mean (Standard Deviation) Time to First Fixation
Treatment Condition
AOId Controla Errorsb Irrl_Infoc Both Irrl_Info
and Errors
Customer Column 3.84 (6.99) 1.51 (2.25) 8.89 (11.19) 2.53 (3.23)
Invoice Column 5.81 (4.07) 2.95 (1.65) 17.55 (25.62) 20.05 (26.75)
Cust. Col. Error 1 27.49 (18.02) 27.22 (20.28)
Cust. Col. Error 2 22.42 (17.36) 39.95 (21.37)
Date Error 37.07 (11.23) 48.09 (13.64)
Invoice Error 24.33 (14.85) 44.97 (25.14)
Totals 7.33 (6.31) 2.40 (1.27) 18.99 (30.59) 25.11 (38.20)
N 11 8 12 12
Panel B: Mean (Standard Deviation) Number of Fixations Before
Treatment Condition
AOI Control Errors Irrl_Info Both Irrl_Info
and Errors
Customer Column 5.27 (8.36) 3.25 (5.12) 10.64 (14.83) 4.42 (3.78)
Invoice Column 11.91 (7.89) 8.00 (5.90) 15.27 (11.17) 51.08 (48.14)
Cust. Col. Error 1 75.20 (51.96) 79.56 (68.47)
Cust. Col. Error 2 74.60 (52.26) 129.87 (74.61)
Date Error 117.75 (49.69) 138.33 (28.54)
Invoice Error 79.50 (52.83) 120.57 (28.93)
Totals 19.90 (19.99) 7.14 (5.81) 17.56 (22.28) 67.45 (110.21)
N 11 8 12 12
Notes: a Control represents the treatment condition with no irrelevant information or minor errors were present. b Errors is an independent variable at two levels, where in the first level minor errors are not present, and in the
second minor level errors are present. c Irrl_Info is an independent variable with two levels, where in the first level irrelevant information is not present,
and in the second level irrelevant information is present. dAOI represents Area of Interest.
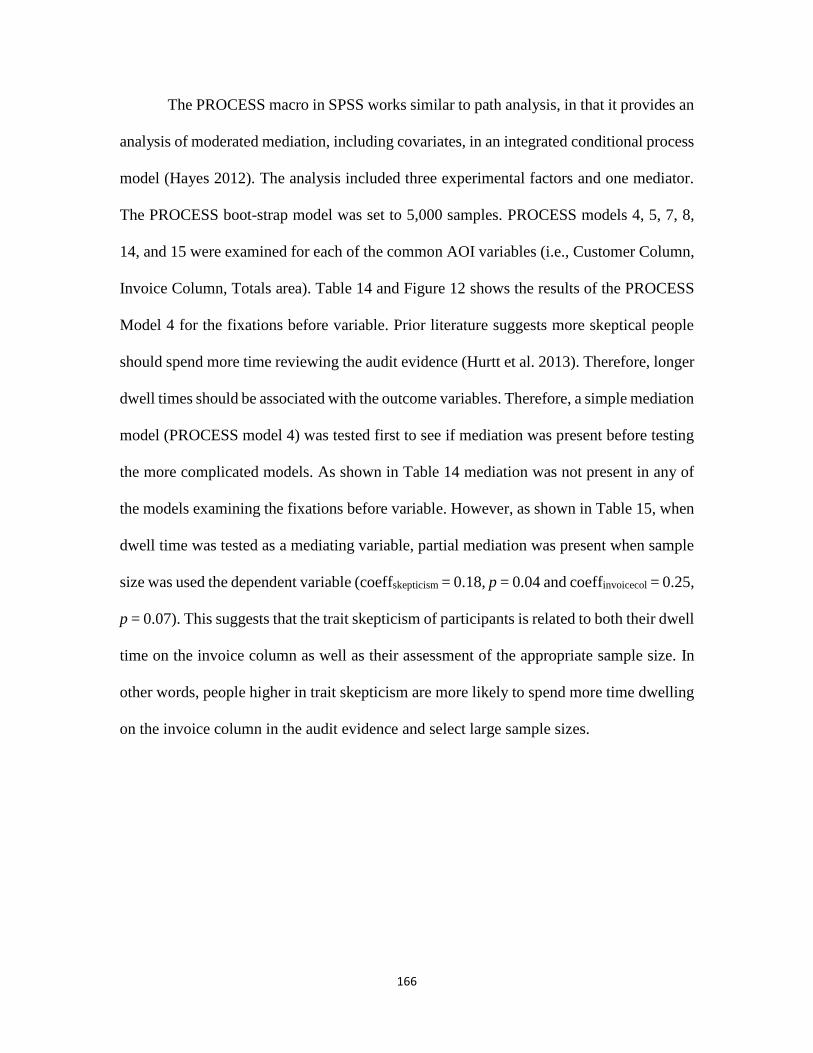
166
The PROCESS macro in SPSS works similar to path analysis, in that it provides an
analysis of moderated mediation, including covariates, in an integrated conditional process
model (Hayes 2012). The analysis included three experimental factors and one mediator.
The PROCESS boot-strap model was set to 5,000 samples. PROCESS models 4, 5, 7, 8,
14, and 15 were examined for each of the common AOI variables (i.e., Customer Column,
Invoice Column, Totals area). Table 14 and Figure 12 shows the results of the PROCESS
Model 4 for the fixations before variable. Prior literature suggests more skeptical people
should spend more time reviewing the audit evidence (Hurtt et al. 2013). Therefore, longer
dwell times should be associated with the outcome variables. Therefore, a simple mediation
model (PROCESS model 4) was tested first to see if mediation was present before testing
the more complicated models. As shown in Table 14 mediation was not present in any of
the models examining the fixations before variable. However, as shown in Table 15, when
dwell time was tested as a mediating variable, partial mediation was present when sample
size was used the dependent variable (coeffskepticism = 0.18, p = 0.04 and coeffinvoicecol = 0.25,
p = 0.07). This suggests that the trait skepticism of participants is related to both their dwell
time on the invoice column as well as their assessment of the appropriate sample size. In
other words, people higher in trait skepticism are more likely to spend more time dwelling
on the invoice column in the audit evidence and select large sample sizes.
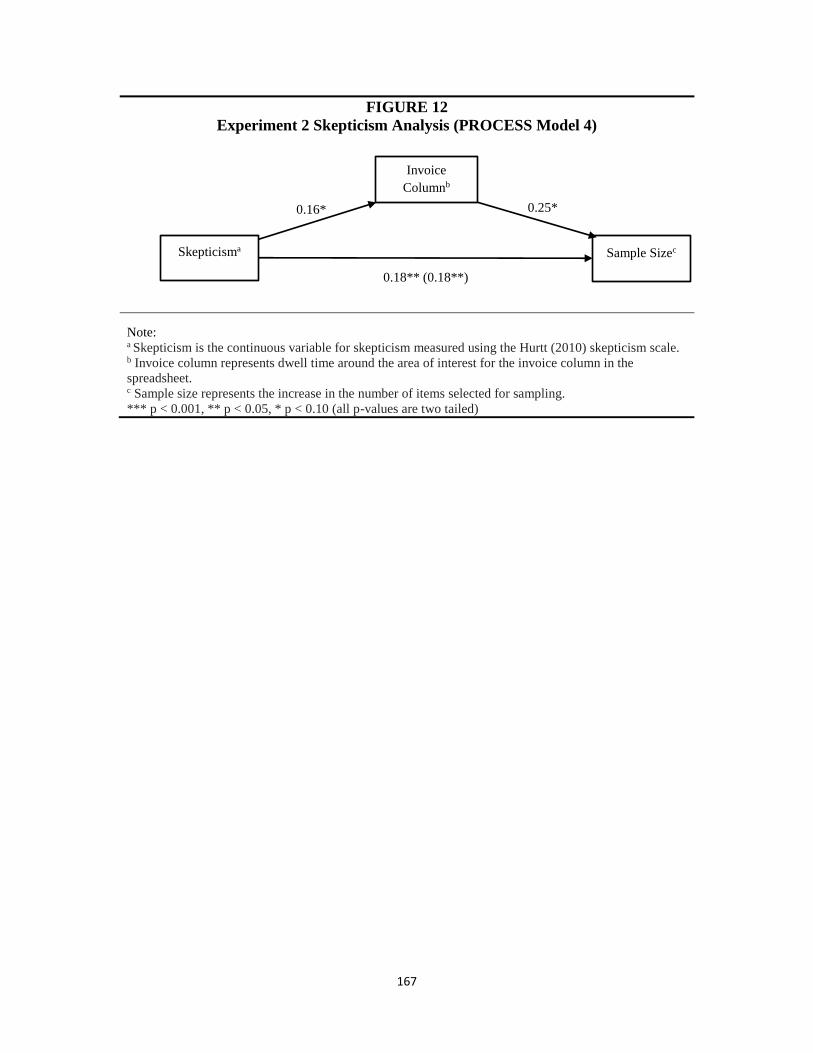
167
FIGURE 12
Experiment 2 Skepticism Analysis (PROCESS Model 4)
Note: a Skepticism is the continuous variable for skepticism measured using the Hurtt (2010) skepticism scale. b Invoice column represents dwell time around the area of interest for the invoice column in the
spreadsheet. c Sample size represents the increase in the number of items selected for sampling.
*** p < 0.001, ** p < 0.05, * p < 0.10 (all p-values are two tailed)
Skepticisma Sample Sizec
Invoice
Columnb
0.25* 0.16*
0.18** (0.18**)

168
TABLE 14
Experiment 2 Mediation Model Results (PROCESS Model 4)
Panel A – Fixations Before Customer Column
Misstatementa Sample Sizeb
X to M Direct Effect X to M Direct Effect
(Constant) 19.99 (12.43) 20.06 (33.71) 19.98 (12.43) -3.31 (6.63)
Skepticismc -0.18 (0.16) 0.34 (0.43) -0.18 (0.16) 0.21 (0.08)
Customer Col. -0.29 (0.42) -0.08 (0.08)
R-sq 0.03 0.04 0.03 0.18
MSE 89.63 0.68 89.63 23.88
F(df1, df2) 1.23 (1,38) 0.69 (2,37) 1.23 (1,38) 3.97 (2,37)
Panel B – Fixations Before Totals AOI
Misstatement Sample Size
X to M Direct Effect X to M Direct Effect
(Constant) 56.69 (90.13) -0.53 (31.86) 56.69 (90.13) -6.98 (5.86)
Skepticism -0.31 (1.17) 0.56 (0.41) -0.31 (1.17) 0.25 (0.08)**
Totals AOI 0.04 (0.06) 0.01 (0.01)
R-sq 0.00 0.07 0.00 0.27
MSE 4520.57 558.30 4520.57 18.94
F(df1, df2) 0.07 (1,33) 1.12 (2,32) 0.07 (1,33) 5.80 (2,32)**
Panel C – Fixations Before Invoice Column
Misstatement Sample Size
X to M Direct Effect X to M Direct Effect
(Constant) -66.53 (40.55) 19.73 (33.29) -66.53 (40.55) -4.01 (6.63)
Skepticism 1.18 (0.53)** 0.28 (0.44) 1.18 (0.53)** 0.21 (0.09)**
Invoice Col. 0.14 (0.13) 0.02 (0.02)
R-sq 0.12 0.06 0.12 0.19
MSE 941.18 592.67 941.18 23.50
F(df1, df2) 5.03 (1,38)** 1.17 (2,37) 5.03 (1,38)** 4.24 (2,37)**
Notes: a Misstatement likelihood was the dependent variable in these models. b Increase in sample size was the dependent variable in these models. c Skepticism is a continuous variable based on participants’ scores on the Hurtt (2010) skepticism scale.
* and ** denote a significance at the 0.10 and 0.05 level (two-tailed).
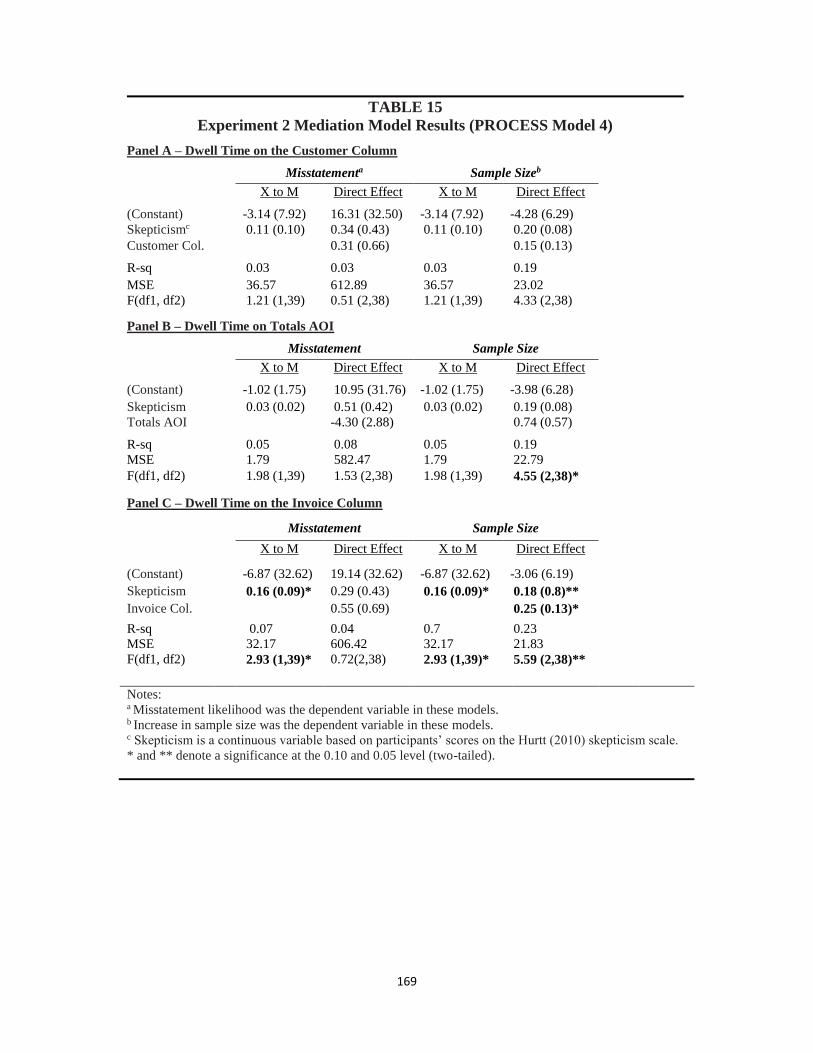
169
TABLE 15
Experiment 2 Mediation Model Results (PROCESS Model 4)
Panel A – Dwell Time on the Customer Column
Misstatementa Sample Sizeb
X to M Direct Effect X to M Direct Effect
(Constant) -3.14 (7.92) 16.31 (32.50) -3.14 (7.92) -4.28 (6.29)
Skepticismc 0.11 (0.10) 0.34 (0.43) 0.11 (0.10) 0.20 (0.08)
Customer Col. 0.31 (0.66) 0.15 (0.13)
R-sq 0.03 0.03 0.03 0.19
MSE 36.57 612.89 36.57 23.02
F(df1, df2) 1.21 (1,39) 0.51 (2,38) 1.21 (1,39) 4.33 (2,38)
Panel B – Dwell Time on Totals AOI
Misstatement Sample Size
X to M Direct Effect X to M Direct Effect
(Constant) -1.02 (1.75) 10.95 (31.76) -1.02 (1.75) -3.98 (6.28)
Skepticism 0.03 (0.02) 0.51 (0.42) 0.03 (0.02) 0.19 (0.08)
Totals AOI -4.30 (2.88) 0.74 (0.57)
R-sq 0.05 0.08 0.05 0.19
MSE 1.79 582.47 1.79 22.79
F(df1, df2) 1.98 (1,39) 1.53 (2,38) 1.98 (1,39) 4.55 (2,38)*
Panel C – Dwell Time on the Invoice Column
Misstatement Sample Size
X to M Direct Effect X to M Direct Effect
(Constant) -6.87 (32.62) 19.14 (32.62) -6.87 (32.62) -3.06 (6.19)
Skepticism 0.16 (0.09)* 0.29 (0.43) 0.16 (0.09)* 0.18 (0.8)**
Invoice Col. 0.55 (0.69) 0.25 (0.13)*
R-sq 0.07 0.04 0.7 0.23
MSE 32.17 606.42 32.17 21.83
F(df1, df2) 2.93 (1,39)* 0.72(2,38) 2.93 (1,39)* 5.59 (2,38)**
Notes: a Misstatement likelihood was the dependent variable in these models. b Increase in sample size was the dependent variable in these models. c Skepticism is a continuous variable based on participants’ scores on the Hurtt (2010) skepticism scale.
* and ** denote a significance at the 0.10 and 0.05 level (two-tailed).
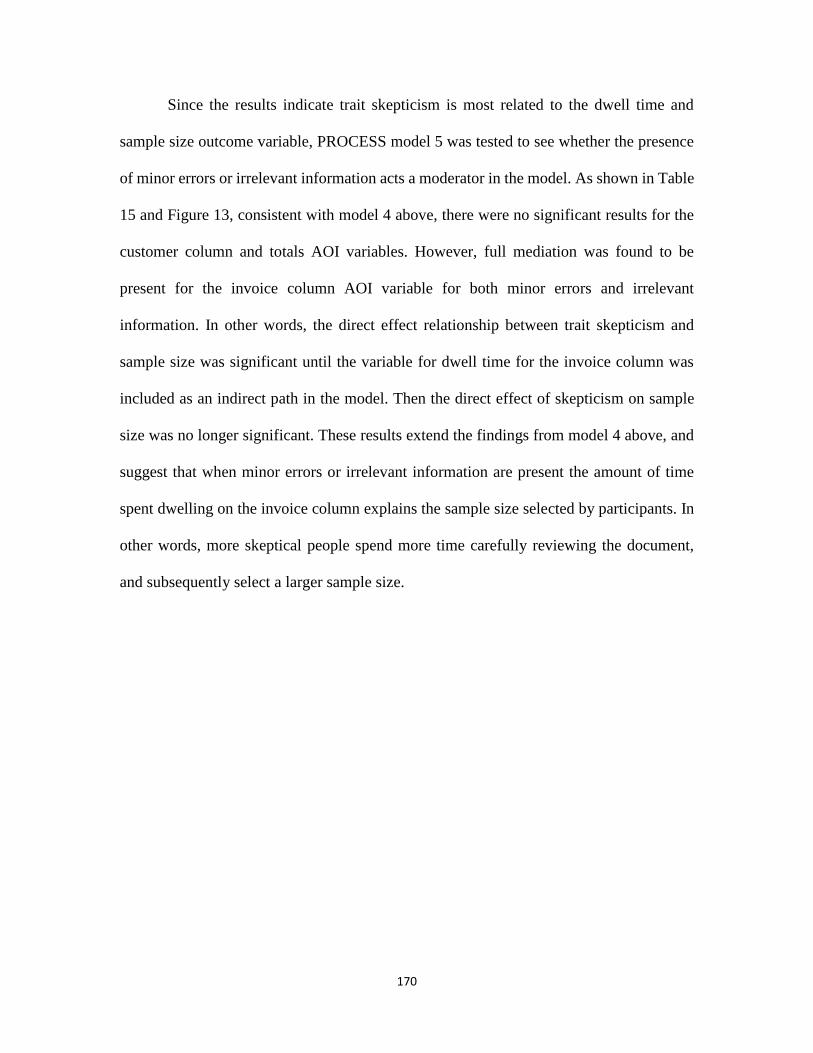
170
Since the results indicate trait skepticism is most related to the dwell time and
sample size outcome variable, PROCESS model 5 was tested to see whether the presence
of minor errors or irrelevant information acts a moderator in the model. As shown in Table
15 and Figure 13, consistent with model 4 above, there were no significant results for the
customer column and totals AOI variables. However, full mediation was found to be
present for the invoice column AOI variable for both minor errors and irrelevant
information. In other words, the direct effect relationship between trait skepticism and
sample size was significant until the variable for dwell time for the invoice column was
included as an indirect path in the model. Then the direct effect of skepticism on sample
size was no longer significant. These results extend the findings from model 4 above, and
suggest that when minor errors or irrelevant information are present the amount of time
spent dwelling on the invoice column explains the sample size selected by participants. In
other words, more skeptical people spend more time carefully reviewing the document,
and subsequently select a larger sample size.
171
TABLE 16
Experiment 2 Mediation Model Results (PROCESS Model 5)
Panel A – Dwell Time on the Customer Column (DV = Sample Size)
Minor Errorsa Irrelevant Informationb
X to M Direct Effect X to M Direct Effect
(Constant) -3.14 (7.92) -0.64 (9.33) -3.14 (7.92) 7.95 (10.79)
Skepticismc 0.11 (0.10) 0.16 (0.12) 0.11 (0.10) 0.06 (0.14)
Customer Col. 0.16 (0.13) 0.16 (0.12)
Moderator -8.64 (13.27) -18.40 (13.25)
Intercept 0.10 (0.17) 0.22 (0.17)
R-sq 0.03 0.20 0.03 0.24
MSE 36.57 36.57 36.57 22.66
F(df1, df2) 1.21 (1,39) 1.21 (1,39)* 1.21 (1,39) 2.85 (4,36)*
Panel B – Dwell Time on the Totals AOI (DV = Sample Size)
Minor Errors Irrelevant Information
X to M Direct Effect X to M Direct Effect
(Constant) -1.02 (1.75) -2.95 (9.35) -1.02 (1.75) 6.78 (10.75)
Skepticism 0.03 (0.02) 0.18 (0.12) 0.03 (0.02) 0.07 (0.14)
Totals AOI 0.78 (0.61) 0.67 (0.58)
Moderator -4.41 (13.47) -16.36 (13.21)
Intercept 0.05 (0.18) 0.20 (0.17)
R-sq 0.5 0.20 0.5 0.24
MSE 1.79 23.83 1.79 22.79
F(df1, df2) 1.97 (1,39) 2.27 (4,36) 1.97 (1,39) 2.77 (4,36)**
Panel C – Dwell Time on the Invoice Column (DV = Sample Size)
Minor Errors Irrelevant Information
X to M Direct Effect X to M Direct Effect
(Constant) -6.87 (7.43) -1.72 (9.04) -6.87 (7.43) 10.59 (10.63)
Skepticism 0.16 (0.09)* 0.17 (0.12) 0.16 (0.09)* 0.01 (0.14)
Invoice Col. 0.28 (12)* 0.26 (0.13)*
Moderator -5.09 (12.92) -20.44 (12.94)
Intercept 0.05 (0.17) 0.25 (0.17)
R-sq 0.7 0.25 0.7 0.28
MSE 32.17 22.52 32.17 21.35
F(df1, df2) 2.93 (1,39)* 2.93 (1,39)** 2.93 (1,39)* 3.57 (4,36)**
Notes: a The dichotomous variable for minor errors was the moderator in these models. b The dichotomous variable for irrelevant information was the moderator in these models. c Skepticism is a continuous variable based on participants’ scores on the Hurtt (2010) skepticism scale.
* and ** denote a significance at the 0.10 and 0.05 level (two-tailed).
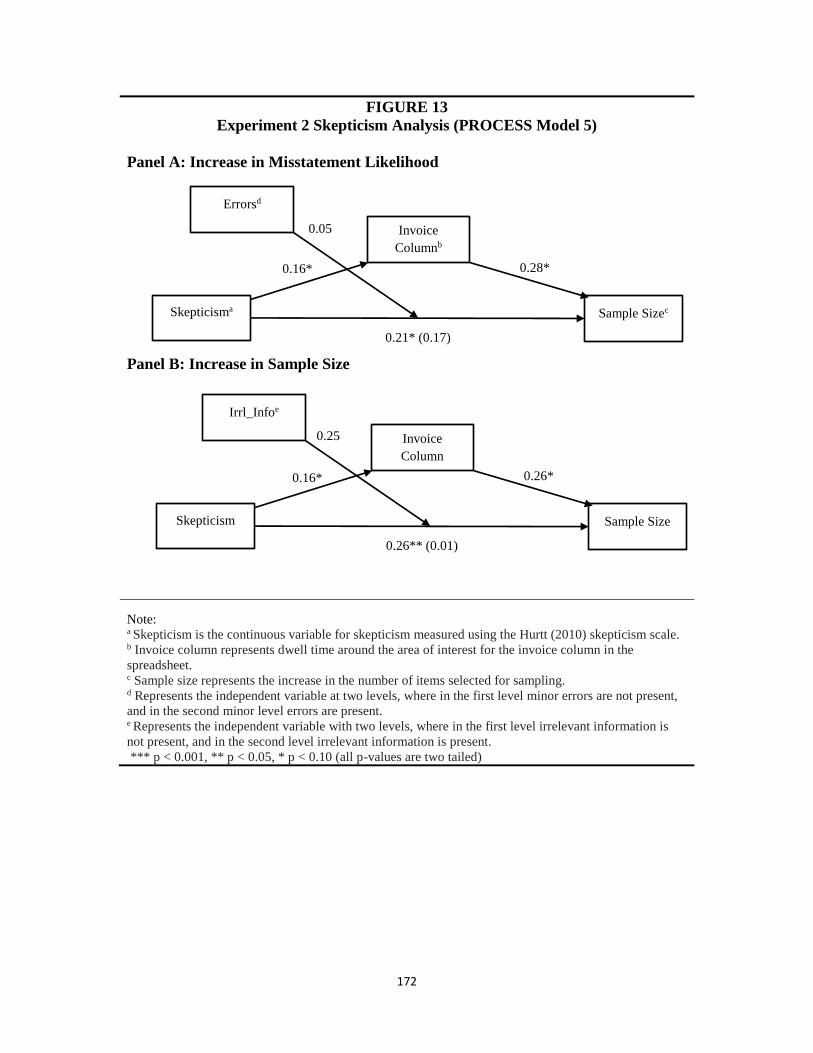
172
FIGURE 13
Experiment 2 Skepticism Analysis (PROCESS Model 5)
Panel A: Increase in Misstatement Likelihood
Panel B: Increase in Sample Size
Note: a Skepticism is the continuous variable for skepticism measured using the Hurtt (2010) skepticism scale. b Invoice column represents dwell time around the area of interest for the invoice column in the
spreadsheet. c Sample size represents the increase in the number of items selected for sampling. d Represents the independent variable at two levels, where in the first level minor errors are not present,
and in the second minor level errors are present. e Represents the independent variable with two levels, where in the first level irrelevant information is
not present, and in the second level irrelevant information is present.
*** p < 0.001, ** p < 0.05, * p < 0.10 (all p-values are two tailed)
Skepticism Sample Size
Invoice
Column
0.26* 0.16*
0.26** (0.01)
Irrl_Infoe
0.25
Skepticisma Sample Sizec
Invoice
Columnb
0.28* 0.16*
0.21* (0.17)
Errorsd
0.05
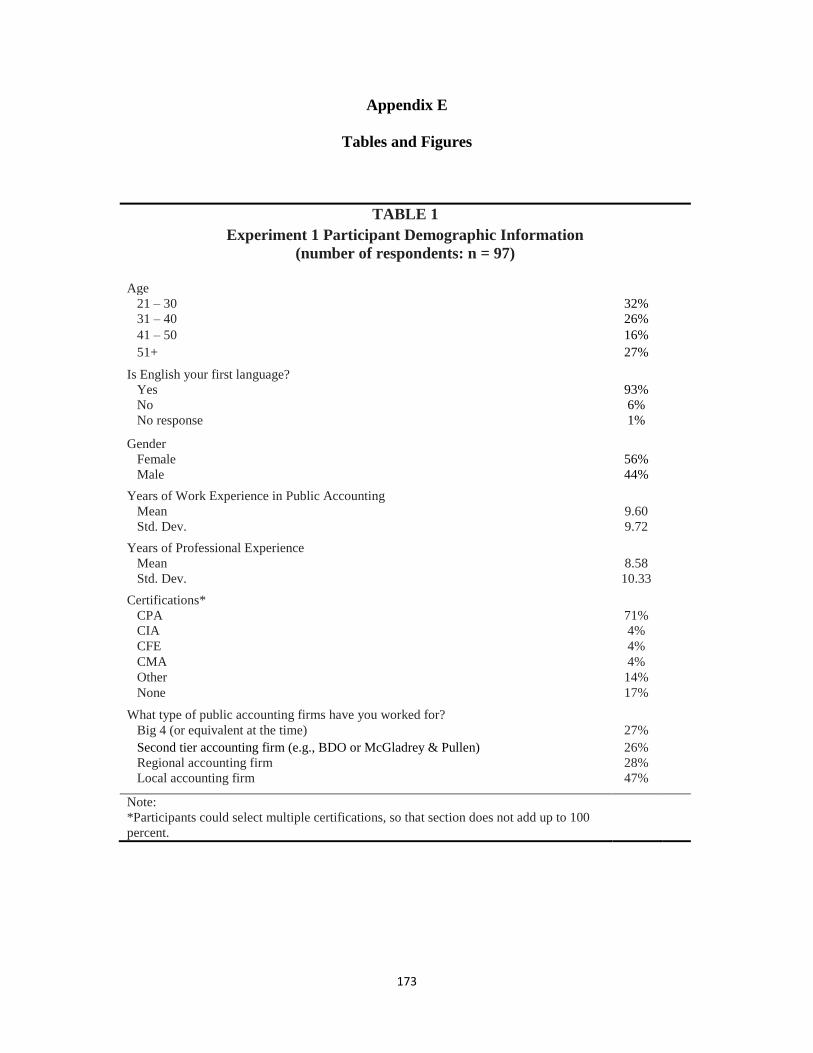
173
Appendix E
Tables and Figures
TABLE 1
Experiment 1 Participant Demographic Information
(number of respondents: n = 97)
Age
21 – 30 32%
31 – 40 26%
41 – 50 16%
51+ 27%
Is English your first language?
Yes 93%
No
No response
6%
1%
Gender
Female 56%
Male 44%
Years of Work Experience in Public Accounting
Mean 9.60
Std. Dev. 9.72
Years of Professional Experience
Mean 8.58
Std. Dev. 10.33
Certifications*
CPA 71%
CIA 4%
CFE 4%
CMA 4%
Other 14%
None 17%
What type of public accounting firms have you worked for?
Big 4 (or equivalent at the time) 27%
Second tier accounting firm (e.g., BDO or McGladrey & Pullen) 26%
Regional accounting firm 28%
Local accounting firm 47%
Note:
*Participants could select multiple certifications, so that section does not add up to 100
percent.
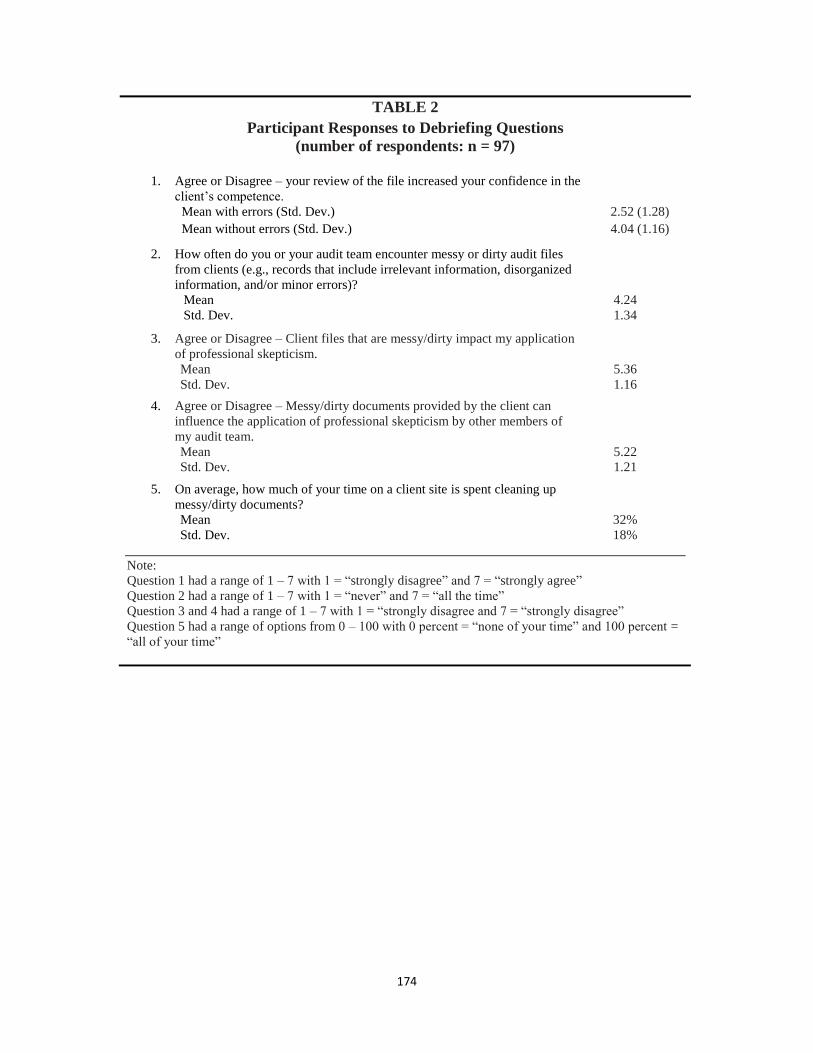
174
TABLE 2
Participant Responses to Debriefing Questions
(number of respondents: n = 97)
1. Agree or Disagree – your review of the file increased your confidence in the
client’s competence.
Mean with errors (Std. Dev.) 2.52 (1.28)
Mean without errors (Std. Dev.) 4.04 (1.16)
2. How often do you or your audit team encounter messy or dirty audit files
from clients (e.g., records that include irrelevant information, disorganized
information, and/or minor errors)?
Mean 4.24
Std. Dev. 1.34
3. Agree or Disagree – Client files that are messy/dirty impact my application
of professional skepticism.
Mean 5.36
Std. Dev. 1.16
4. Agree or Disagree – Messy/dirty documents provided by the client can
influence the application of professional skepticism by other members of
my audit team.
Mean 5.22
Std. Dev. 1.21
5. On average, how much of your time on a client site is spent cleaning up
messy/dirty documents?
Mean 32%
Std. Dev. 18%
Note:
Question 1 had a range of 1 – 7 with 1 = “strongly disagree” and 7 = “strongly agree”
Question 2 had a range of 1 – 7 with 1 = “never” and 7 = “all the time”
Question 3 and 4 had a range of 1 – 7 with 1 = “strongly disagree and 7 = “strongly disagree”
Question 5 had a range of options from 0 – 100 with 0 percent = “none of your time” and 100 percent =
“all of your time”

175
TABLE 3
Means and Standard Deviations for Misstatement Likelihood and Sample Size
Panel A: Mean (Std. Deviation) for Change in Misstatement Likelihooda
Irrelevant Informationc
Errorsd Absent
Present Total
No Errors
Present
16.52 (15.91)
n = 23
23.00 (21.82)
n = 24
19.83 (19.24)
n = 47
Errors
Present
26.93 (26.82)
n = 29
35.14 (28.59)
n = 21
30.38 (27.60)
n = 50
Total 22.33 (23.06)
n = 52
28.67 (25.66)
n = 45
Panel B: Mean (Std. Deviation) for Change in Sample Sizeb
Irrelevant Information
Errors Absent
Present Total
No Errors
Present
1.82 (3.79)
n = 23
3.17 (5.74)
n = 24
2.51 (4.88)
n = 47
Errors
Present
3.17 (3.12)
n = 29
5.76 (4.43)
n = 21
4.26 (3.90)
n = 50
Total 2.58 (3.47)
n = 52
4.38 (5.28)
n = 45
Notes: a The change from the initial misstatement estimate of 20 percent (ranging from 0 percent to 100
percent). b The change from the initial sample size of 10 items (ranging from 0 to 30 items). cIrrelevant Information = 0 if no irrelevant information is present, 1 if irrelevant information is present. dErrors = 0 if no minor errors are present, 1 if minor errors are present.

176
TABLE 4
Multivariate Analysis of Variance for the Increase in Misstatement Likelihood
and Increase in Sample Size as a Function of the Presence of Irrelevant
Information and the Presence of Minor Errors
Source Dependent
Variable
d
f MS F p-valuee η2
Irrl_Infoc Percent Increasea 1 1290.301 5.332 0.136 0.024
Sample Increaseb 1 92.892 4.940 0.029 0.050
Errorsd Percent Increase 1 3041.014 5.332 0.023 0.054
Sample Increase 1 92.892 4.969 0.028 0.051
Irrl_Info*
Errors
Percent Increase 1 17.969 0.032 0.859 0.000
Sample Increase 1 9.326 0.499 0.482 0.005
Error Percent Increase 9
3
570.281
Sample Increase 9
3
18.694
Notes: a The percent increase in the likelihood of account misstatement. b The increase in the number of items selected for sampling. c Irrl_Info is an independent variable with two levels, where in the first level irrelevant information is
not present, and in the second level irrelevant information is present. d Errors is an independent variable at two levels, where in the first level minor errors are not present,
and in the second minor level errors are present. eAll p-values are two-tailed.

177
TABLE 5
Hurtt (2010) Scale Responses
Exp. 1 Exp. 2
Scale Item
Mean
Score
(std. dev.)
Mean Score
(std. dev.)
1. I often accept other people’s explanation without further thought. 5.06 (1.34) 5.35 (1.31)
2. I feel good about myself 5.72 (0.89) 5.77 (1.07)
3. I wait to decide on issues until I can get more information 5.62 (0.91) 5.79 (0.94)
4. The prospect of learning excites me. 5.73 (0.84) 5.91 (1.04)
5. I am interested in what causes people to behave the way they do. 5.70 (1.05) 6.00 (1.16)
6. I am confident in my abilities 5.75 (1.02) 5.72 (1.12)
7. I often reject statements unless I have proof they are true. 4.85 (1.05) 5.09 (1.27)
8. Discovering new information is fun. 5.76 (0.77) 6.21 (0.83)
9. I take my time when making decisions. 5.66 (0.85) 5.56 (1.16)
10. I tend to immediately accept what other people tell me. 5.16 (1.15) 5.26 (1.35)
11. Other people’s behavior does not interest me. 5.08 (1.14) 4.91 (1.17)
12. I am self-assured. 5.32 (0.99) 5.19 (1.24)
13. My friends tell me that I usually question things that I see or hear. 4.70 (1.26) 4.70 (1.37)
14. I like to understand the reason for other people’s behavior. 5.56 (0.96) 5.60 (1.26)
15. I think that learning is exciting. 5.72 (0.94) 6.00 (0.93)
16. I usually accept things I see. 4.54 (1.23) 4.51 (1.40)
17. I do not feel sure of myself. 5.41 (1.32) 5.67 (1.29)
18. I usually notice inconsistencies in explanations. 5.16 (1.13) 4.93 (1.47)
19. Most often I agree with what others in my group think. 4.08 (1.09) 3.98 (1.44)
20. I dislike having to make decisions quickly. 4.87 (1.31) 5.00 (1.27)
21. I have confidence in myself. 5.66 (1.20) 5.81 (1.01)
22. I do not like to decide until I’ve looked at all of the readily
available information. 5.55 (0.96) 5.74 (0.76)
23. I like searching for knowledge. 5.55 (0.96) 5.72 (1.08)
24. I frequently question things I see or hear. 5.23 (0.93) 5.28 (1.16)
25. It is easy for other people to convince me. 4.66 (1.09) 4.63 (1.33)
26. I seldom consider why people behave in a certain way. 5.08 (1.23) 4.67 (1.61)
27. I like to ensure that I’ve considered most available information
before making a decision. 5.58 (0.86) 5.84 (0.89)
28. I enjoy trying to determine if what I read or hear is true. 5.19 (1.00) 5.42 (1.18)
29. I relish learning. 5.37 (1.05) 5.37 (1.46)
30. The actions people take and reasons for those actions are
fascinating. 5.40 (1.01) 5.33 (1.25)
Total: 75.58 (7.44) 76.65 (9.23)
n: 97 43
Note:
Exp. 1 refers to Experiment 1, while Exp. 2 refers to Experiment 2.
The means from Experiment 1 and 2 were not significantly different from one another (p > 0.10).
Each item had a scale of responses ranging from 1 representing “strongly disagree” to 7 “strongly
agree.”
Items 1, 10, 11, 16, 17, 19, 25, 26 are reverse coded when scoring.
Auditors surveyed in Hurtt (2010) scored a 75 on one occasion and a 77 on another occasion.

178
TABLE 6
Multivariate Analysis of Variance for the Increase in Misstatement Likelihood
and Increase in Sample Size as a Function of the Presence of Irrelevant
Information and the Presence of Minor Errors and Level of Skepticism
Source Dependent
Variable df MS F p-valuef η2
Irrl_Infoc Percent Increasea 1 1282.088 2.193 0.142 0.024
Sample Increaseb 1 91.646 4.414 0.031 0.051
Errorsd Percent Increase 1 3041.014 5.332 0.038 0.047
Sample Increase 1 92.892 4.969 0.058 0.040
Skept.e Percent Increase 1 490.527 0.839 0.362 0.009
Sample Increase 1 30.658 1.613 0.207 0.018
Irrl_Info*
Errors
Percent Increase 1 24.190 0.041 0.839 0.000
Sample Increase 1 5.125 0.270 0.605 0.003
Irrl_Info*Skept.
Percent Increase 1 37.053 0.063 0.802 0.001
Sample Increase 1 14.313 0.753 0.388 0.008
Errors*Skept. Percent Increase 1 487.943 0.835 0.363 0.009
Sample Increase 1 1.183 0.062 0.804 0.001
Irrl_Info*Errors
*Skept.
Percent Increase 1 0.130 0.000 0.988 0.000
Sample Increase 1 1.869 0.098 0.755 0.001
Error Percent Increase 89 584.542
Sample Increase 89 19.005
Notes: a The percent increase in the likelihood of account misstatement. b The increase in the number of items selected for sampling. c Irrl_Info is an independent variable with two levels, where in the first level irrelevant information is
not present, and in the second level irrelevant information is present. d Errors is an independent variable at two levels, where in the first level minor errors are not present,
and in the second minor level errors are present. e Skepticism was calculated using the Hurtt (2010) skepticism scale, and participants were separated
into high and low groups using a median split. fAll p-values are two-tailed.
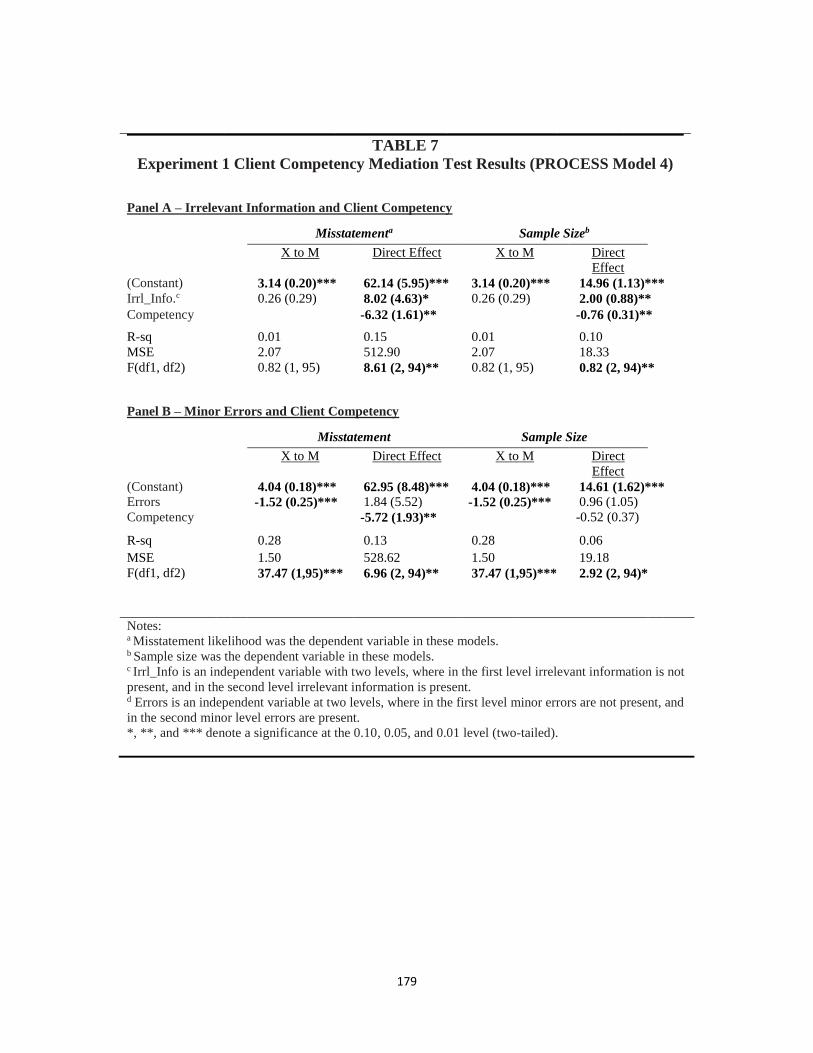
179
TABLE 7
Experiment 1 Client Competency Mediation Test Results (PROCESS Model 4)
Panel A – Irrelevant Information and Client Competency
Misstatementa Sample Sizeb
X to M Direct Effect X to M Direct
Effect
(Constant) 3.14 (0.20)*** 62.14 (5.95)*** 3.14 (0.20)*** 14.96 (1.13)***
Irrl_Info.c 0.26 (0.29) 8.02 (4.63)* 0.26 (0.29) 2.00 (0.88)**
Competency -6.32 (1.61)** -0.76 (0.31)**
R-sq 0.01 0.15 0.01 0.10
MSE 2.07 512.90 2.07 18.33
F(df1, df2) 0.82 (1, 95) 8.61 (2, 94)** 0.82 (1, 95) 0.82 (2, 94)**
Panel B – Minor Errors and Client Competency
Misstatement Sample Size
X to M Direct Effect X to M Direct
Effect
(Constant) 4.04 (0.18)*** 62.95 (8.48)*** 4.04 (0.18)*** 14.61 (1.62)***
Errors -1.52 (0.25)*** 1.84 (5.52) -1.52 (0.25)*** 0.96 (1.05)
Competency -5.72 (1.93)** -0.52 (0.37)
R-sq 0.28 0.13 0.28 0.06
MSE 1.50 528.62 1.50 19.18
F(df1, df2) 37.47 (1,95)*** 6.96 (2, 94)** 37.47 (1,95)*** 2.92 (2, 94)*
Notes: a Misstatement likelihood was the dependent variable in these models. b Sample size was the dependent variable in these models. c Irrl_Info is an independent variable with two levels, where in the first level irrelevant information is not
present, and in the second level irrelevant information is present. d Errors is an independent variable at two levels, where in the first level minor errors are not present, and
in the second minor level errors are present.
*, **, and *** denote a significance at the 0.10, 0.05, and 0.01 level (two-tailed).

180
Company
Number of mentions on
Google Scholar*
Tobii 9,230
SensoMotoric Instruments (SMI) 6,040
EyeLink 5,530
ISCAN 2,650
LC Technologies 1,130
EyeTech 441
The Eye Tribe 227
Ergoneers 185
Smart Eye 149
Mirametrix 92
Pupil Labs 80
Gazepoint 39
TABLE 8
Common Eye-Tracking Hardware Companies
*Per Imotion January 2017 blog.
**Note - The number of search results shown on google scholar includes a mix of
scholarly publications, patents, and book chapters.

181
Term Definition Use
Eye Fixations A term used to describe when someone
looks at a particular location for an
extended period of time.
Fixations suggest attributes relevant to
completing a decision making task.
Saccades A term used to describe quick eye
movements between locations or
fixations.
Saccades are used to track eye movements
between locations and the number of
times participants shift between areas of
interest.
Dwell Time A term used to describe the sum of
fixations in one area before a participant
moves on to the next area.
Dwell times are used to determine interest
or confusion. Longer dwell times could
signal confusion or higher levels of
processing.
Areas of Interest An area of interest is an area or region of a
visual stimulus highlighted by the
researcher during an experiment.
Areas of interest are used to compare and
contrast the amount of time participants
spend on visual areas.
Gaze Plot A plot showing the sequence of a
participant's scan through a document.
Gaze plots are used to determine the
viewing order of objects in a visual
stimulus in order to identify common
trends.
Heat Map Heat maps are color coordinated maps that
provide a visual representation of the
viewing intensity of participants. The
brighter the color the longer participants
focused on that area of the visual stimulus.
Heat maps are used to highlight areas of
interest, and to determine where people
focus their visual attention.
TABLE 9
Key Terms Summary

182
TABLE 10
Experiment 2 Participant Demographic Information
(number of respondents: n = 43)
Age
21 – 30 76.70%
31 – 40 18.60%
41 – 50 4.70%
51+ 0%
Is English your first language?
Yes 69.80%
No 30.20%
Gender
Female 44.20%
Male 55.80%
How many years of professional work experience do you have working in accounting?
Mean 1.18
Std. Dev. 2.61
How many years of other work experience do you have?
Mean 6.58
Std. Dev. 4.77
What is your current student status?
Senior 48.80%
Post-Baccalaureate Certificate 25.60%
Masters 25.60%
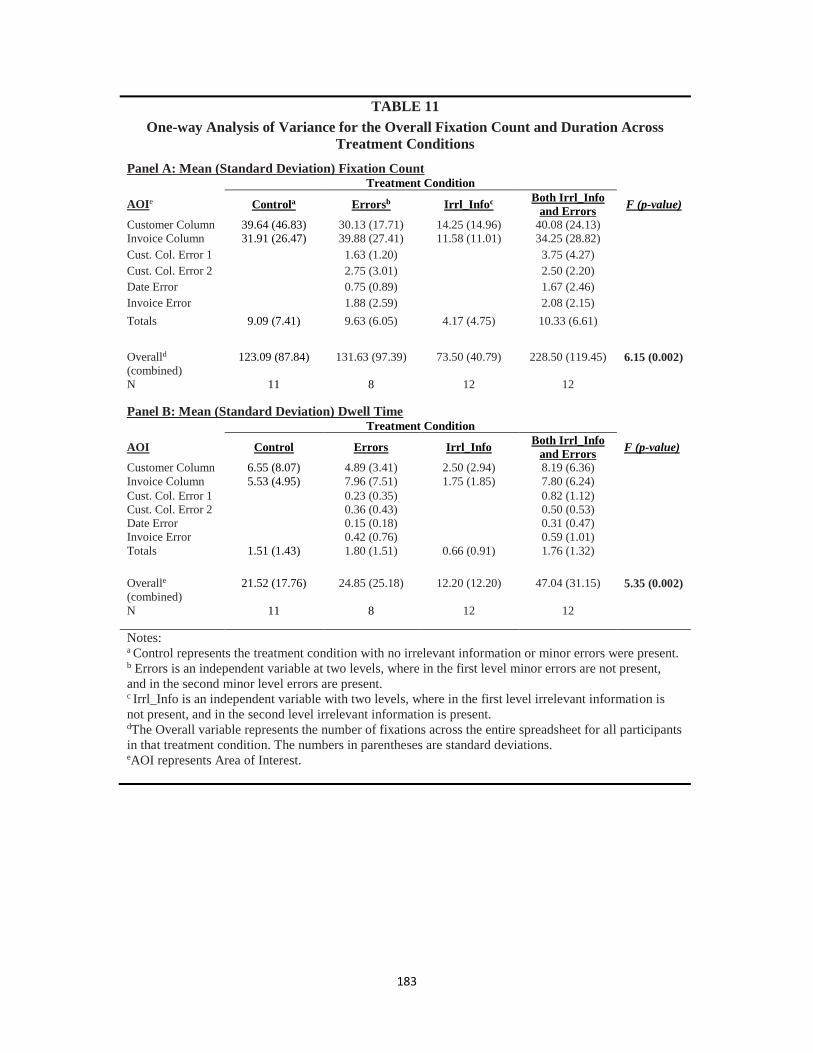
183
TABLE 11
One-way Analysis of Variance for the Overall Fixation Count and Duration Across
Treatment Conditions
Panel A: Mean (Standard Deviation) Fixation Count
Treatment Condition
AOIe Controla Errorsb Irrl_Infoc Both Irrl_Info
and Errors F (p-value)
Customer Column 39.64 (46.83) 30.13 (17.71) 14.25 (14.96) 40.08 (24.13)
Invoice Column 31.91 (26.47) 39.88 (27.41) 11.58 (11.01) 34.25 (28.82)
Cust. Col. Error 1 1.63 (1.20) 3.75 (4.27)
Cust. Col. Error 2 2.75 (3.01) 2.50 (2.20)
Date Error 0.75 (0.89) 1.67 (2.46)
Invoice Error 1.88 (2.59) 2.08 (2.15)
Totals 9.09 (7.41) 9.63 (6.05) 4.17 (4.75) 10.33 (6.61)
Overalld
(combined)
123.09 (87.84) 131.63 (97.39) 73.50 (40.79) 228.50 (119.45) 6.15 (0.002)
N 11 8 12 12
Panel B: Mean (Standard Deviation) Dwell Time
Treatment Condition
AOI Control Errors Irrl_Info Both Irrl_Info
and Errors F (p-value)
Customer Column 6.55 (8.07) 4.89 (3.41) 2.50 (2.94) 8.19 (6.36)
Invoice Column 5.53 (4.95) 7.96 (7.51) 1.75 (1.85) 7.80 (6.24)
Cust. Col. Error 1 0.23 (0.35) 0.82 (1.12)
Cust. Col. Error 2 0.36 (0.43) 0.50 (0.53)
Date Error 0.15 (0.18) 0.31 (0.47)
Invoice Error 0.42 (0.76) 0.59 (1.01)
Totals 1.51 (1.43) 1.80 (1.51) 0.66 (0.91) 1.76 (1.32)
Overalle
(combined)
21.52 (17.76) 24.85 (25.18) 12.20 (12.20) 47.04 (31.15) 5.35 (0.002)
N 11 8 12 12
Notes: a Control represents the treatment condition with no irrelevant information or minor errors were present. b Errors is an independent variable at two levels, where in the first level minor errors are not present,
and in the second minor level errors are present. c Irrl_Info is an independent variable with two levels, where in the first level irrelevant information is
not present, and in the second level irrelevant information is present. dThe Overall variable represents the number of fixations across the entire spreadsheet for all participants
in that treatment condition. The numbers in parentheses are standard deviations. eAOI represents Area of Interest.

184
TABLE 12
Kruskal-Wallis Test Results for Fixations and Dwell Times
Panel A: Mean (Standard Deviation) Fixation
Count
Treatment Condition
AOIe Controla Errorsb Irrl_Infoc Both Irrl_Info
and Errors (p-value)
Customer Column 39.64 (46.83) 30.13 (17.71) 14.25 (14.96) 40.08 (24.13) Invoice Column 31.91 (26.47) 39.88 (27.41) 11.58 (11.01) 34.25 (28.82) Cust. Col. Error 1 1.63 (1.20) 3.75 (4.27) Cust. Col. Error 2 2.75 (3.01) 2.50 (2.20) Date Error 0.75 (0.89) 1.67 (2.46) Invoice Error 1.88 (2.59) 2.08 (2.15)
Totals 9.09 (7.41) 9.63 (6.05) 4.17 (4.75) 10.33 (6.61)
Overalld
(combined) 123.09 (87.84) 131.63 (97.39) 73.50 (40.79) 228.50 (119.45) (0.001)
N 11 8 12 12
Panel B: Mean (Standard Deviation) Dwell Time
Treatment Condition
AOI Control Errors Irrl_Info Both Irrl_Info
and Errors
Customer Column 6.55 (8.07) 4.89 (3.41) 2.50 (2.94) 8.19 (6.36) Invoice Column 5.53 (4.95) 7.96 (7.51) 1.75 (1.85) 7.80 (6.24) Cust. Col. Error 1 0.23 (0.35) 0.82 (1.12) Cust. Col. Error 2 0.36 (0.43) 0.50 (0.53) Date Error 0.15 (0.18) 0.31 (0.47) Invoice Error 0.42 (0.76) 0.59 (1.01) Totals 1.51 (1.43) 1.80 (1.51) 0.66 (0.91) 1.76 (1.32)
Overall
(combined) 21.52 (17.76) 24.85 (25.18) 12.20 (12.20) 47.04 (31.15) (0.001)
N 11 8 12 12
Notes:
This table shows the results of the Kruskal-Wallis analysis to see if there were significant differences
between the four treatments for the overall fixation count and dwell time. a Control represents the treatment condition with no irrelevant information or minor errors were present. b Errors is an independent variable at two levels, where in the first level minor errors are not present,
and in the second minor level errors are present. c Irrl_Info is an independent variable with two levels, where in the first level irrelevant information is
not present, and in the second level irrelevant information is present. dThe Overall variable represents the number of fixations or dwell time across the entire spreadsheet for
all participants in that treatment condition. The numbers in parentheses are standard deviations. eAOI represents Area of Interest.
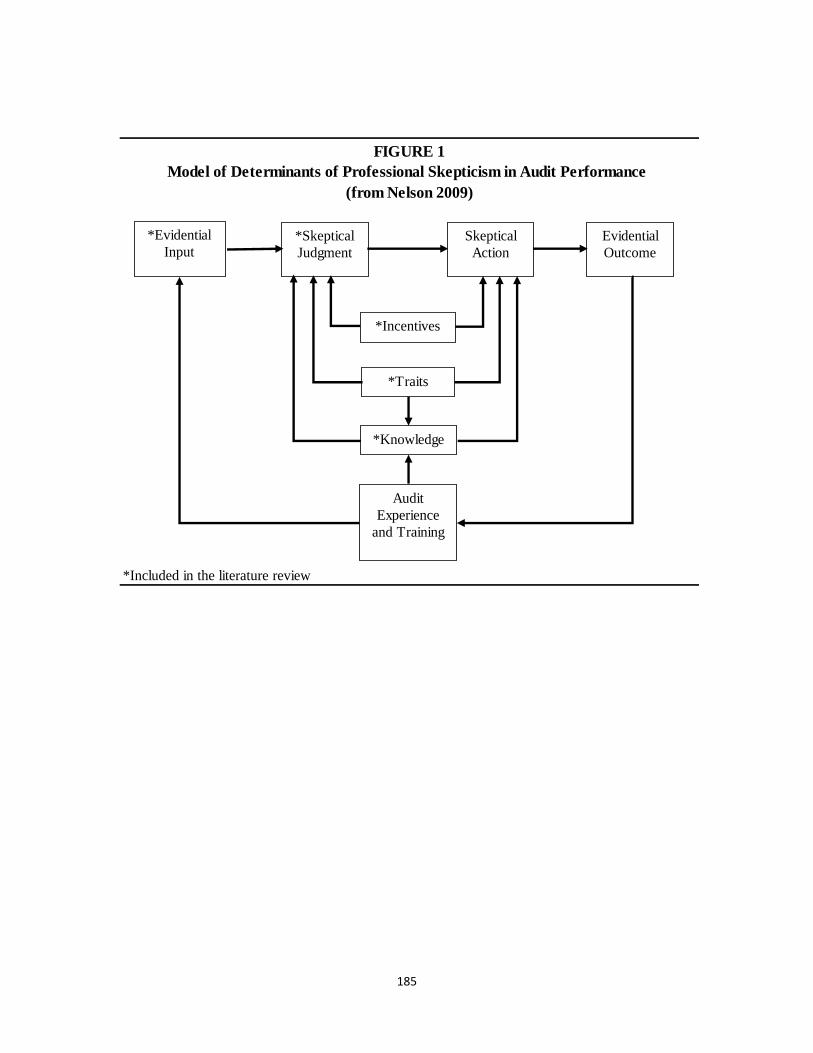
185
*Included in the literature review
*Included in the literature review
(from Hurtt et al. 2013)
FIGURE 1
Model of Determinants of Professional Skepticism in Audit Performance
(from Nelson 2009)
FIGURE 2
A Model of Antecedents to and Outcomes of Skeptical Judgment and Skeptical Action
*Evidential
Input*Skeptical
Judgment
Skeptical
Action
Evidential
Outcome
*Incentives
*Traits
*Knowledge
Audit
Experience
and Training
Antecedents
*Auditor Characteristics
*Evidential Characteristics
Client Characteristics
External Environment
Characteristics
Skeptical Judgment
Observed Judgment Outcomes
Skeptical Action
Observed Action Outcomes
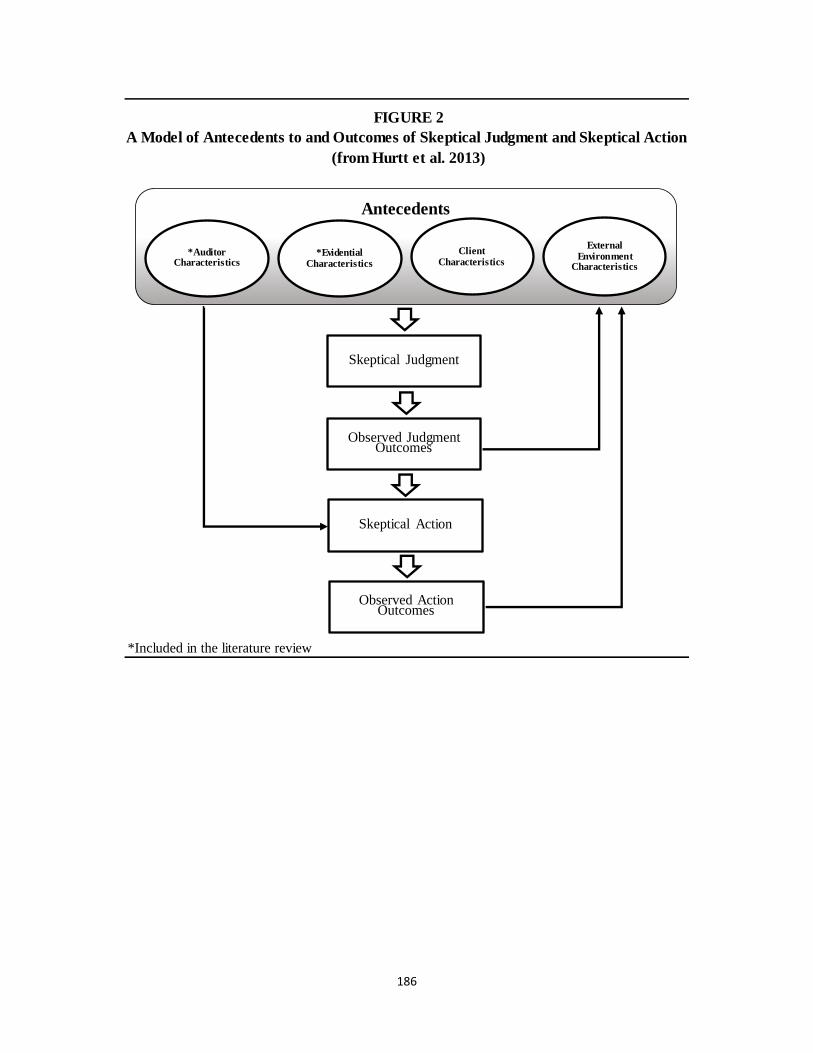
186
*Included in the literature review
*Included in the literature review
(from Hurtt et al. 2013)
FIGURE 1
Model of Determinants of Professional Skepticism in Audit Performance
(from Nelson 2009)
FIGURE 2
A Model of Antecedents to and Outcomes of Skeptical Judgment and Skeptical Action
*Evidential
Input*Skeptical
Judgment
Skeptical
Action
Evidential
Outcome
*Incentives
*Traits
*Knowledge
Audit
Experience
and Training
Antecedents
*Auditor Characteristics
*Evidential Characteristics
Client Characteristics
External Environment
Characteristics
Skeptical Judgment
Observed Judgment Outcomes
Skeptical Action
Observed Action Outcomes
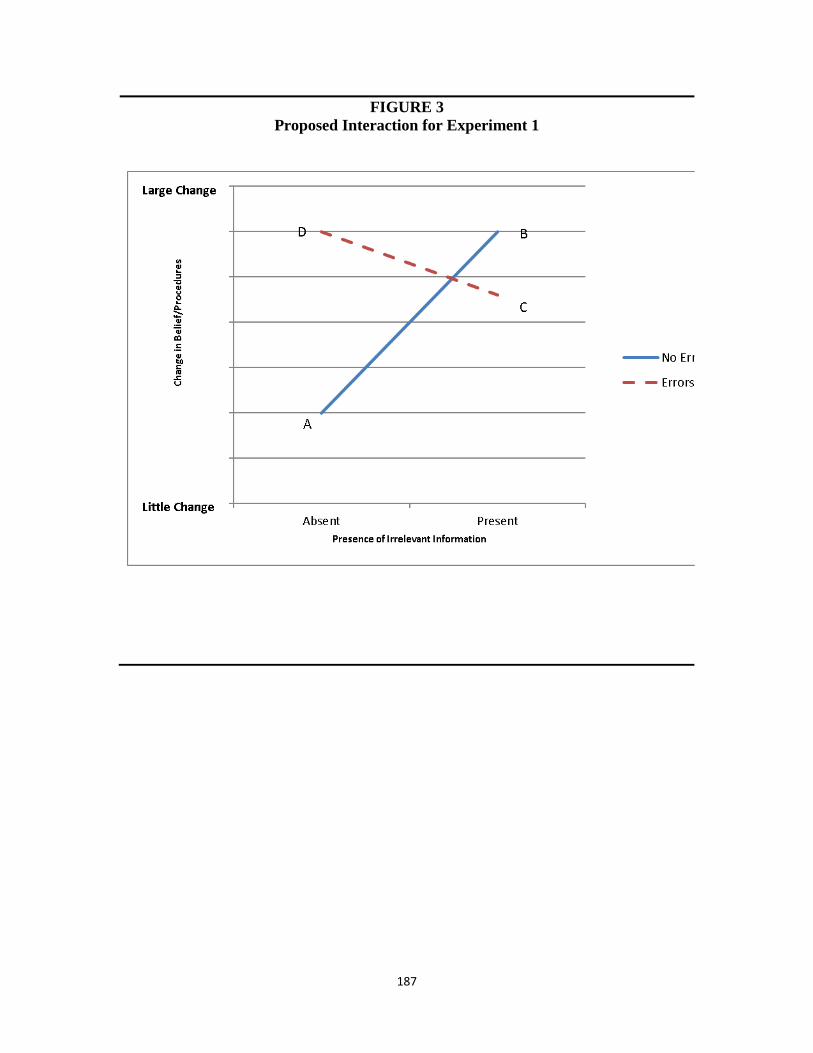
187
FIGURE 3
Proposed Interaction for Experiment 1
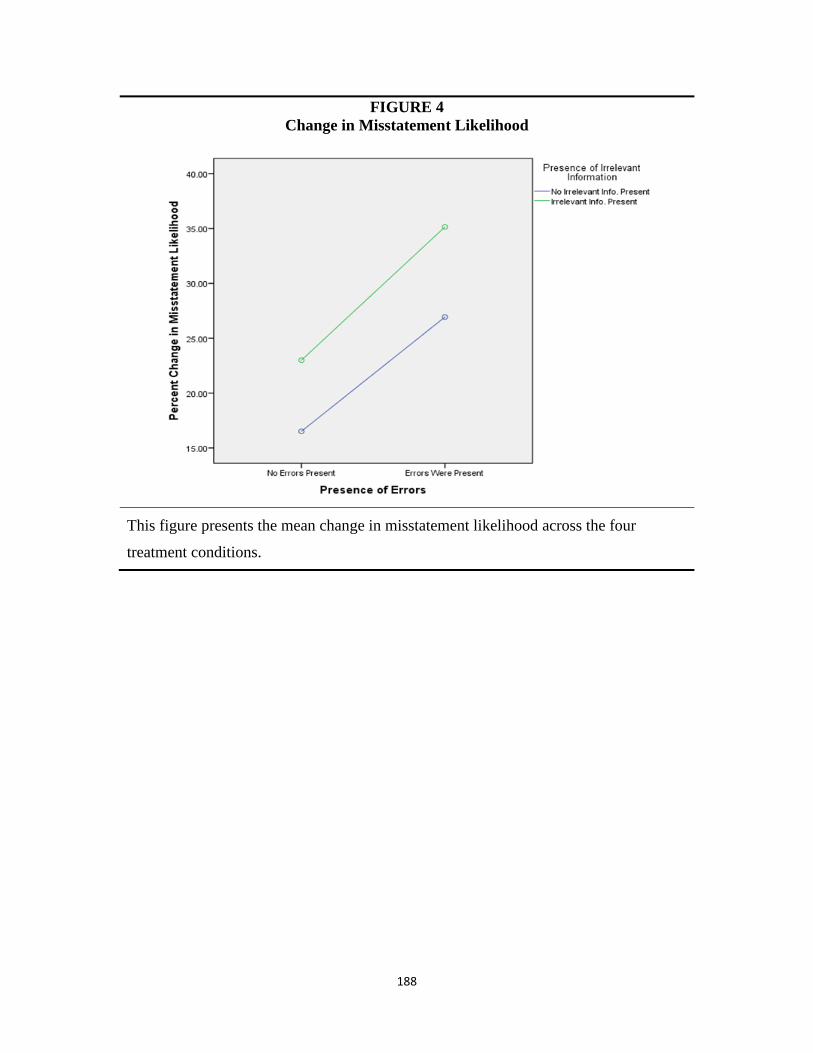
188
FIGURE 4
Change in Misstatement Likelihood
This figure presents the mean change in misstatement likelihood across the four
treatment conditions.
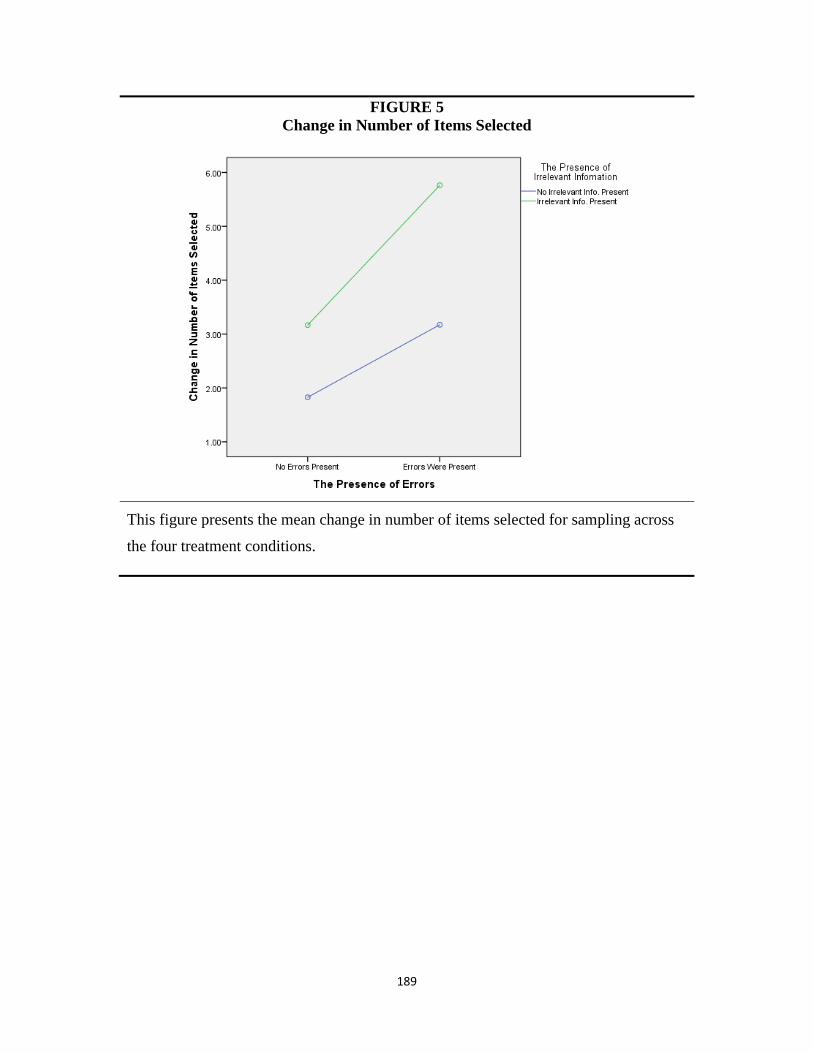
189
FIGURE 5
Change in Number of Items Selected
This figure presents the mean change in number of items selected for sampling across
the four treatment conditions.

190
FIGURE 6
Experiment 1 Client Competency Analysis (PROCESS Model 4)
Note: a Errors is an independent variable at two levels, where in the first level minor errors are not present, and
in the second minor level errors are present. b Client competency was measured as part of a series of debriefing questions. It asked: “Agree or
disagree, your review of the file increased your confidence in the client’s competence”. Answers were
captured on a seven point Likert scale with 1 representing “strongly disagree” and 7 representing
“strongly agree”. c Misstatement likelihood is the likelihood of the account being misstated.
*** p < 0.001, ** p < 0.05, * p < 0.10 (all p-values are two tailed)
Errorsa Misstatement
Likelihoodc
Client
Competencyb
-5.72** -1.52***
10.55** (1.84)
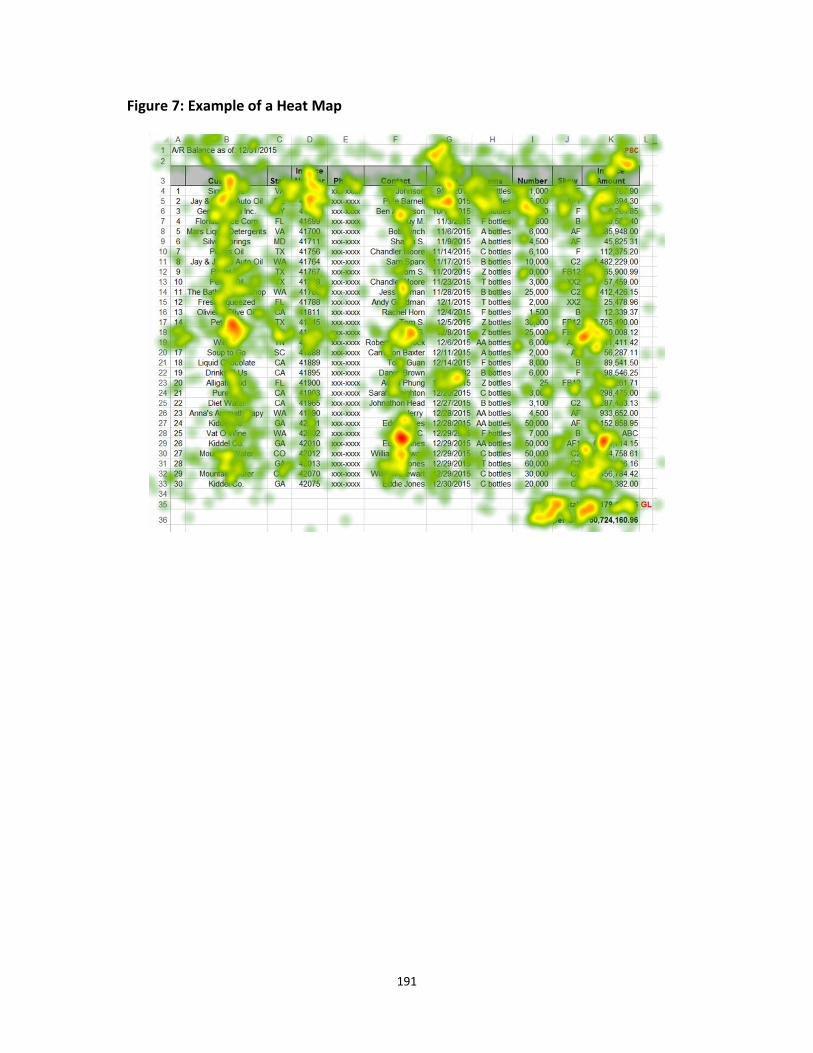
191
Figure 7: Example of a Heat Map
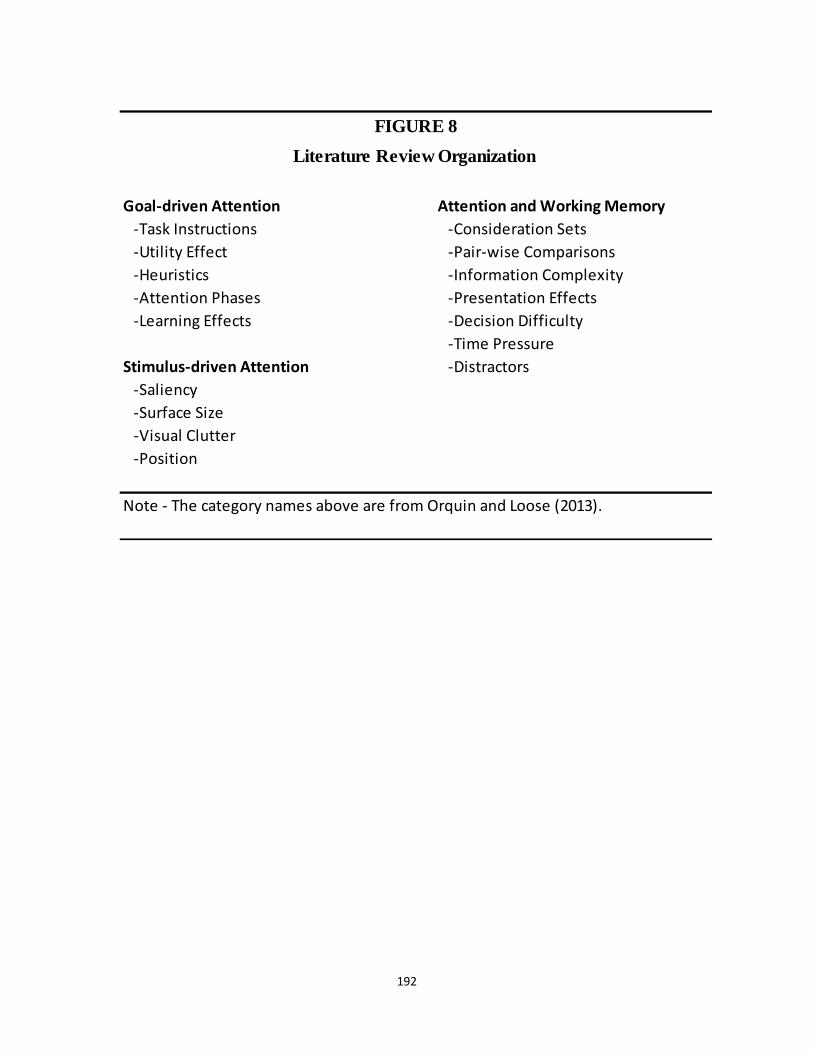
192
Goal-driven Attention Attention and Working Memory
-Task Instructions -Consideration Sets
-Utility Effect -Pair-wise Comparisons
-Heuristics -Information Complexity
-Attention Phases -Presentation Effects
-Learning Effects -Decision Difficulty
-Time Pressure
Stimulus-driven Attention -Distractors
-Saliency
-Surface Size
-Visual Clutter
-Position
FIGURE 8
Literature Review Organization
Note - The category names above are from Orquin and Loose (2013).

193
Figure 9: Illustration of the Experimental Process
Step 1 – Participants sign-up for eye-tracking time slots on Sona Systems
Step 2 – Once participants arrive at the lab they are greeted and walked through
the consent form by the researchers
Step 3 – Participants are led into the eye-tracking room and given an introduction
on the software and the overall task
Step 4 – Participants are calibrated to the eye-tracking software
Step 5 – Participants enter their four-digit identifier into the computer and then
view the case and audit evidence slides
Step 6 – After reviewing the case and evidence slides participants clicked on a link
taking them to the follow-up assessment on Qualtrics
Step 7 – On a separate computer, participants compete the post-experiment
questionnaire
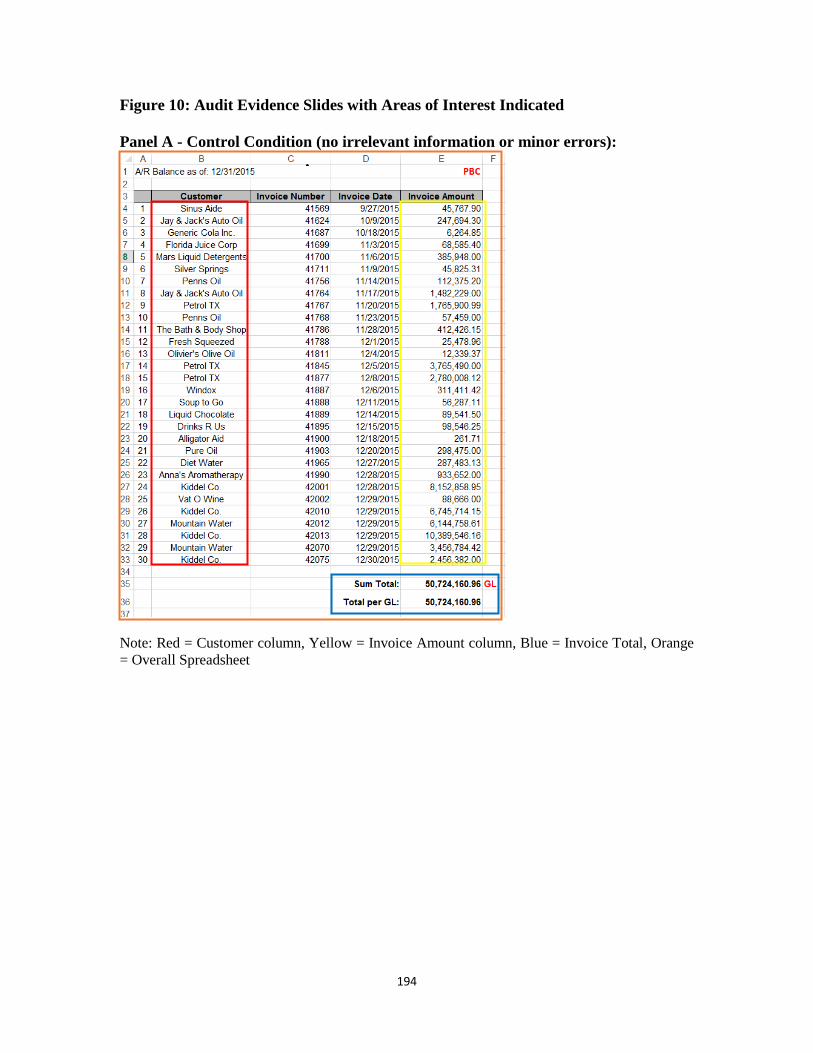
194
Figure 10: Audit Evidence Slides with Areas of Interest Indicated
Panel A - Control Condition (no irrelevant information or minor errors):
Note: Red = Customer column, Yellow = Invoice Amount column, Blue = Invoice Total, Orange
= Overall Spreadsheet

195
Panel B - Treatment 1 (minor errors and no irrelevant information):
Note: Red = Customer column, Yellow = Invoice Amount column, Blue = Invoice Total, Orange
= Overall Spreadsheet, Green = Customer column errors, Orange = Date column error, and Purple
= Invoice column error.

196
Panel C - Treatment 2 (irrelevant information and no minor errors):
Note: Red = Customer column, Yellow = Invoice Amount column, Blue = Invoice Total, Orange
= Overall Spreadsheet
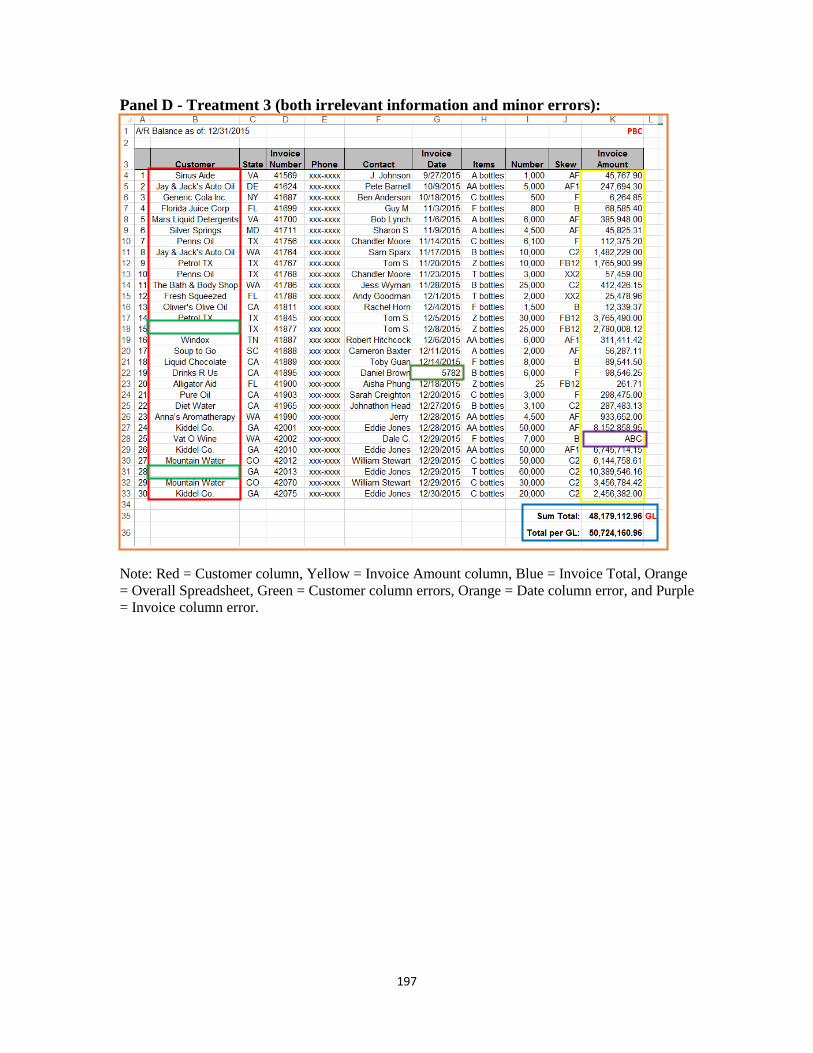
197
Panel D - Treatment 3 (both irrelevant information and minor errors):
Note: Red = Customer column, Yellow = Invoice Amount column, Blue = Invoice Total, Orange
= Overall Spreadsheet, Green = Customer column errors, Orange = Date column error, and Purple
= Invoice column error.

198
Figure 11: Heat Maps
Panel A – Control Condition (No irrelevant information or minor errors)
Panel B – Treatment 1 (Minor errors and no irrelevant information)
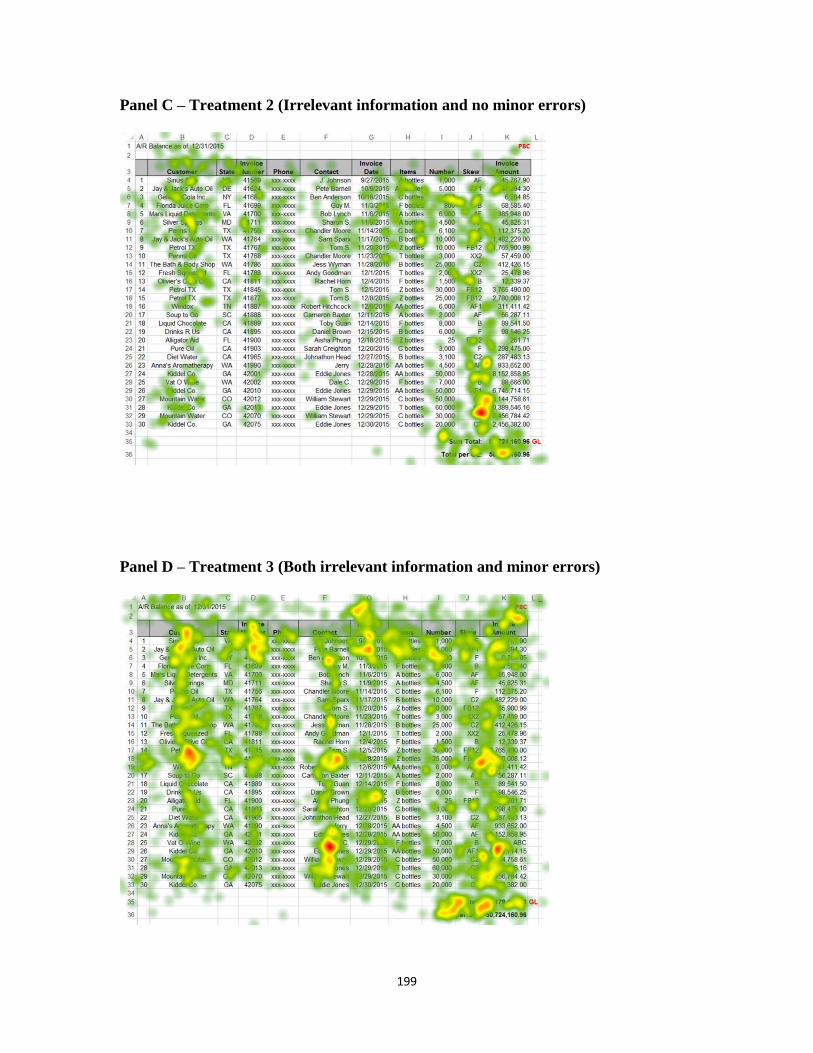
199
Panel C – Treatment 2 (Irrelevant information and no minor errors)
Panel D – Treatment 3 (Both irrelevant information and minor errors)
200
Vita
Edward Lynch was born in Washington D.C. and raised in Arlington Virginia. He earned
his B.S. in Accounting (Magna Cum Laude) and M.S. in Accounting from Virginia
Commonwealth University in 2010. Following graduation, he worked at Altria as an
auditor and then later in public accounting at Bazilio Cobb and Associates. In 2013, he
returned to Virginia Commonwealth University to start his Ph.D. in Accounting. During
his graduate studies, Edward was recognized as the J. Michael Cook Doctoral Consortium
Fellow, and was awarded the VSCPA Ph.D. accounting scholarship in 2015 and 2016.
Edward accepted a full-time position as an Assistant Professor in Accounting at California
State University at Fullerton in August 2017.