Real-time eye feature tracking from a video image sequence using Kalman filter
The Effects of Anxiety on Reading Efficiency An Eye-tracking ...
151
Masaryk University Faculty of Arts Department of Psychology Field of Study: Psychology Markéta Dohnalová The Effects of Anxiety on Reading Efficiency An Eye-tracking Study Master’s Thesis Thesis supervisor: Mgr. Tatiana Malatincová, Ph.D. Brno 2019
-
Upload
khangminh22 -
Category
Documents
-
view
3 -
download
0
Transcript of The Effects of Anxiety on Reading Efficiency An Eye-tracking ...
Masaryk University
Faculty of Arts
Department of Psychology
Field of Study: Psychology
Markéta Dohnalová
The Effects of Anxiety on Reading Efficiency An Eye-tracking Study
Master’s Thesis
Thesis supervisor: Mgr. Tatiana Malatincová, Ph.D.
Brno 2019

This master’s thesis was supported by the research infrastructure HUME Lab Experimental Humanities
Laboratory, Faculty of Arts, Masaryk University.

Declaration of Authorship
I hereby declare that this thesis is the result of my own original work and that it has not been submitted, in whole or in part, in any previous application for a degree. Due references have been made on all the used literature and resources.
In Brno, 30th April 2019
..................................................
Markéta Dohnalová

Acknowledgments
I would like to thank all my participants, especially those willing to spend over
two hours in the laboratory with me during my pilot studies.
My thanks also goes to Mgr. Čeněk Šašinka, PhD., for his goodwill and advice
concerning eye tracking; to Prof. Kenneth Holmqvist, for his consultation of my
design, his insightful input and the fastest existing course in the use of a high-speed
tower-mounted eye-tracker; and to Mgr. et Mgr. Eva Kundtová Klocová, PhD., for her
support and speedy replies to my many requests.
A special and heartfelt thanks goes to my friend Ing. Ondřej Takács, PhD., for
the incredible work he did in writing a software program that recognizes regressions
and perhaps more importantly for his support and generosity. To Bc. Jan Trtílek, for
his willingness to spend hours manually counting regressions and for his talent
in understanding what I mean.
A big thanks goes to my parents, for all the various ways they’ve supported me,
and to the many friends that took care of me, encouraged me, believed me and
consoled me in moments of crisis.
Last, but certainly not least, I would like to thank my supervisor Mgr. Tatiana
Malatincová, PhD. for her above standard guidance and support. I sincerely thank
her for all the e-mails she sent me at three a.m., all the consultations she squeezed
into her tight schedule, and all the priceless advice she so freely bestowed upon me.
I also thank her for encouraging me in all the moments that I felt like giving up.
Thank you for helping me carry this thesis through to the finish.
Abstract
In this thesis, the effects of anxiety on reading are examined within the framework of
the attentional control theory (ACT). The study is a 2 × 2 mixed experimental design.
High and low-anxious subjects read structurally difficult texts under ego-threatening
and neutral instructions. Eye tracking was used to measure their eye-movements
during reading and regressions were computed on the basis of single eye-movement
events using a tailored software program. There was no difference in readers’
comprehension, but high anxious individuals spent significantly more time on
regressions than low-anxious subjects in both conditions. An additional qualitative
exploration of regression scanpaths revealed significant variation in regressive reading
patterns and between subject differences indicated the use of various reading
strategies. Alternative explanations of the observed effect of anxiety on reading
regressions and implications for future research are discussed.
Key words: Test anxiety, ego threat, reading efficiency, reading regressions,
eye tracking, attentional control theory.

Contents
Abstract ............................................................................................................................... 5
Contents .............................................................................................................................. 5
Introduction ....................................................................................................................... 9
I. Theoretical background
1 Anxiety ......................................................................................................................... 11 Indicators and measures of anxiety ............................................................................ 12 1.1
1.1.1 Physiological/somatic indicators ................................................................................. 12 1.1.2 Behavioural indicators .................................................................................................. 13 1.1.3 Cognitive indicators ...................................................................................................... 13 1.1.4 Emotional/phenomenological indicators .................................................................... 14 State and trait anxiety ................................................................................................... 14 1.2
Test anxiety ..................................................................................................................... 14 1.3
1.3.1 Factors contributing to test anxiety ............................................................................. 16
2 Anxiety and cognition ............................................................................................. 18 A brief history of emotion and cognition ................................................................. 19 2.1
Anxiety from the view of cognitive psychology ....................................................... 21 2.2
Anxiety Disorders and Cognition ............................................................................... 21 2.3
Anxiety and Cognitive Processes ................................................................................ 23 2.4
2.4.1 Selective Attention ........................................................................................................ 24 2.4.2 Long-term memory ....................................................................................................... 24 2.4.3 Reasoning ...................................................................................................................... 25 2.4.4 Thought processes ......................................................................................................... 25 Worry ............................................................................................................................... 25 2.5
Attention bias ................................................................................................................. 27 2.6
3 Anxiety and cognitive performance ...................................................................... 30 Anxiety and academic performance ........................................................................... 30 3.1
Anxiety and sport performance ................................................................................... 31 3.2
Mediating and moderating factors of the relationship between anxiety and 3.3
performance .............................................................................................................................. 33 3.3.1 Subject Variables ........................................................................................................... 33 3.3.2 Task variables ................................................................................................................. 35
4 Explaining the relationship between anxiety and performance ...................... 37 The Development of the Attentional Control Theory (ACT) ............................... 38 4.1

4.1.1 Predecessors of ACT ..................................................................................................... 38 4.1.2 The Working Memory Construct and its Development .......................................... 39 4.1.3 Attentional Control Theory .......................................................................................... 43
5 Anxiety and reading ................................................................................................. 45 The reading process ....................................................................................................... 45 5.1
Reading and working memory, working memory capacity ................................... 47 5.2
The effect of anxiety on reading ................................................................................. 48 5.3
6 Eye-movements and eye tracking .......................................................................... 51 Short overview of the method and terminology ...................................................... 51 6.1
Studying eye-movements in reading .......................................................................... 53 6.2
6.2.1 Eye-movements in reading ........................................................................................... 53 6.2.2 Eye-mind hypothesis .................................................................................................... 54 6.2.3 Regressions .................................................................................................................... 56 6.2.4 Eye-tracking and regressions ...................................................................................... 58 6.2.5 Eye-movements in mindless reading ......................................................................... 59
II. The present study
1 Introduction to the present study .......................................................................... 61 Research questions and study aims ............................................................................ 63 1.1
Hypotheses ...................................................................................................................... 64 1.2
2 Method ........................................................................................................................ 65 Pilot studies and design modifications ...................................................................... 65 2.1
2.1.1 The first pilot study ...................................................................................................... 65 2.1.2 The second pilot study ................................................................................................. 66 Design of the current study ......................................................................................... 67 2.2
Participants ..................................................................................................................... 67 2.3
2.3.1 Targeted sample size and inclusion criteria ............................................................... 67 2.3.2 Recruitment ................................................................................................................... 68 2.3.3 Selection ......................................................................................................................... 68 Measures .......................................................................................................................... 70 2.4
2.4.1 Anxiety ............................................................................................................................ 70 2.4.2 Comprehension .............................................................................................................. 72 2.4.3 Reading time and eye-movement events .................................................................... 72 2.4.4 Regressions ..................................................................................................................... 73 2.4.5 Reading efficiency .......................................................................................................... 75 Stimuli .............................................................................................................................. 77 2.5
Setting and apparatus .................................................................................................... 77 2.6
Experiment procedure .................................................................................................. 78 2.7
2.7.1 Data processing and ethical aspects ............................................................................ 79 Defining and detecting regressions ............................................................................ 80 2.8
2.8.1 Specification for software detection ............................................................................ 81 2.8.2 Regression duration ...................................................................................................... 82 2.8.3 Manual data correction ................................................................................................ 83
3 Results ........................................................................................................................ 84 Statistical analysis ......................................................................................................... 84 3.1
Manipulation check ...................................................................................................... 84 3.2
3.2.1 The effect of anxiety on manipulation check scores ................................................ 86 3.2.2 Conclusion ...................................................................................................................... 87 Relations between reading variables ....................................................................................... 88 Descriptive statistics of reading measures ................................................................ 89 3.3
Testing hypotheses ........................................................................................................ 90 3.4
3.4.1 Statistic models and assumptions ............................................................................... 90 3.4.2 Comprehension .............................................................................................................. 91 3.4.3 Reading time .................................................................................................................. 91 3.4.4 Eye-movement events ................................................................................................... 92 3.4.5 Time spent on regressions ........................................................................................... 94 3.4.6 Reading efficiency ......................................................................................................... 96 Effects of task version ................................................................................................... 97 3.5
Summary of results ..................................................................................................... 100 3.6
4 Qualitative manual analysis of regressive scanpaths ...................................... 102
5 Discussion ................................................................................................................ 104 The effect of manipulation on low-anxious participants .................................... 105 5.1
Does an increase in time spent on regressions correspond to lower reading 5.2
efficiency? ................................................................................................................................ 106 A second look at regressions ...................................................................................... 107 5.3
Study limitations ......................................................................................................... 108 5.4
Implications for future research .............................................................................. 110 5.5
Conclusion ....................................................................................................................... 111
References ....................................................................................................................... 112
List of tables ................................................................................................................... 123
List of figures ................................................................................................................. 124
Appendices ...................................................................................................................... 125
9
Introduction Anxiety is known to have a negative influence on cognitive performance. It can
cause skilled and well-prepared individuals to fail in situations when they need
to perform their best. Reading is a complex cognitive task that is not exempt from the
undesirable effects of anxiety. Moreover, reading is a crucial skill that is closely tied to
education and codetermines success in the vast majority of scholarly tasks and tests.
Gaining a better understanding of how anxiety affects reading may have practical
implications for interventions aimed at helping highly test anxious individuals and
individuals suffering from anxiety disorders. It can also prove useful in helping
dyslectics by addressing accompanying emotional factors that make reading even more
difficult for them.
The main aim of this thesis is to examine how anxiety affects reading
in individuals with high and low trait anxiety under conditions of increased state
anxiety. The study specifically focuses on differences in reading efficiency and
in backward eye movements called regressions.
The thesis presents relevant research from the psychology of cognition and
emotion and describes the various ways in which anxiety has been found to affect
cognition. The theory central to the assumptions of the presented study is the
attentional control theory (Eysenck et al, 2007). This theory posits that anxiety
primarily affects the processing efficiency of cognitive tasks by reducing working
memory capacity. Task performance, on the other hand, often remains unaffected
by anxiety.
The empirical study presented is a modification of a previous experimental design
conducted by Calvo, Eysenck & Jiménez (1994b). Calvo and his colleagues examined
the effects of test anxiety on reading efficiency using a self-paced reading presentation
paradigm. The present study modifies the design by employing eye-tracking
technology to measure participants’ eye-movements online during reading. The
experimental design is complemented by a qualitative exploration of regressive
scanpaths. A final discussion considers possible interpretations of the observed data
and implications for future research.

10
I. Theoretical background
11
The first theoretical part of this thesis is divided into 6 sections. It begins by
presenting anxiety and its manifestations (section 1), followed by an account of how
anxiety relates to cognition (section 2). Section 3 then focuses specifically on the
effects of anxiety on cognitive performance. The attentional control theory and its
assumptions are described in section 4. Section 5 is devoted to the reading process and
how it can be affected by anxiety. The last 6th section introduces the method of eye
tracking and presents an overview of eye movements in reading.
1 Anxiety Anxiety, in the most general sense, can be described as the emotional reaction that
occurs in response to a perceived unspecified threat. The term is often used as an
equivalent of fear, but there is an important recognised conceptual and physiological
difference between the two. The term anxiety is used to describe a “future-oriented,
long-acting response broadly focused on a diffuse threat,” unlike fear, which describes
“an appropriate, present-oriented, and short-lived response to a clearly identifiable
and specific threat.” (APA, 2015, p. 66)
Like other emotions, anxiety is a complex, heterogeneous phenomenon, burdened
with conceptual ambiguity and resulting in multiple and to various extents converging
or diverging definitions, theoretical constructs, and empirical paradigms. There are
three basic perspectives from which anxiety can be viewed, corresponding to three
separate response systems associated with anxiety - the behavioural, the physiological and
the verbal/cognitive (Lang, 1985). These response systems are interconnected but distinct
entities and can often diverge in their reaction to anxiety-inducing stimuli (see for
example Craske & Craig, 1984). Correspondingly, theories of anxiety may present
contradictory predictions depending on which system they consider primary and
within which response system they choose to assess anxiety.
An evolutionary perspective on anxiety may offer a more unified conceptual
framework for making sense of the concept. In the view of evolutionary psychology,
each emotion is a specific response pattern “shaped by natural selection to offer
selective advantages in certain situations” (Marks & Nesse, 1994, p. 248). The most
general definition of the purpose of anxiety is “to prepare the individual to detect and
deal with threats” (Bateson, Brilot, & Nettle, 2011, p. 707). According to Marks and
Nesse (1994), anxiety is aroused by “any cues that indicate a risk of loss” and different
subtypes of anxiety (e.g. general anxiety, social anxiety, etc.) evolved as specific
12
responses to different kinds of resources being threatened (e.g. health, social status,
property, etc.).
Although this study’s main focus is on the link between test anxiety and cognitive
performance, given the complexity of the phenomenon of “anxiety” and how its
components are intertwined, one cannot study one aspect of it well without touching
upon the others. In the following chapter I will present a brief overview of the
principal indicators and measures of anxiety.
Indicators and measures of anxiety 1.1Given that anxiety, as mentioned above, is a complex state associated with
displays of cognitive, behavioural and physiological symptoms alike, there are many
possible indicators to its presence. A difficult question arises as to which symptoms
and to what degree must be present in order to establish a mental-physiological state
as truly anxious. Examples of questions that can arise are: Is increased heart rate and sweating in the presence of possibly threatening stimuli enough to conclude a person is experiencing anxiety? Can a person experience anxiety without being aware of it? Can a person be mistaken in saying they are feeling anxious? There is no consensus in the matter and the choice of
indicators is usually influenced by one’s preferred definition of anxiety and the
reactive system one chooses to focus on. Putting these problems aside for the moment,
a brief overview of the most commonly used indicators of anxiety follows.
1.1.1 Physiological/somatic indicators
Anxiety can manifest somatically in a number of ways. Common physiological
indicators of state anxiety associated with autonomic arousal include heart rate, blood
pressure, skin galvanic reaction, palmar sweat, and muscle activity (measured via
electromyography). Other methods of measurement include neuroimaging (e.g. EEG),
pupillometry (measuring changes in pupil diameter), or online measurement of ocular
events (e.g. blink duration and frequency, saccade speed and length, etc.).
The interpretation of somatic indicators is complicated by their ambiguity.
Different emotions can induce very similar physiological symptoms and the same
emotion may manifest itself differently depending on the individual and the situation.
Another complication is the absence of an already validated criterion for measuring
the examined emotion, which is necessary in order to correctly describe the link
between the emotion (anxiety) and somatic symptoms (e.g. blink frequency). See for
example Tichon, Wallis, Riek, & Mavin (2014).
13
Initial attempts to describe an arousal pattern specific for anxiety (vs. fear
or anger, for example) had not met with success (see for example Martin, 1961),
although this may be due to the fact that anxiety is a not a homogenous phenomenon.
More recent research has shown that specific kinds of anxiety elicit distinct patterns
of brain activity (see Heller, Nitschke, Etienne, & Miller, 1997; Nitschke, Heller,
Palmieri, & Miller, 1999). The lack of a clear physiological pattern for anxiety make
self-report measures an indispensable part of anxiety research.
Individuals suffering from anxiety disorders can display a variety of other symptoms
caused by long-term anxiety and the somatization of anxiety, including but not limited
to insomnia, restlessness, muscle aches and headaches (see for example Gelenberg,
2000). Neuroimaging studies have shown anxiety disorders to be associated with
larger and more sensitive amygdalae (see for example Cannistraro & Rauch, 2003).
1.1.2 Behavioural indicators
Behavioural indicators of state anxiety include ocular events, facial expressions
and head movements. Other observable behaviours or specific reactions can
be interpreted as behavioural indicators of anxiety, either because they are recognized
as such by the scientific community or because they are chosen as indicators
of anxiety by a researcher within a specific experimental design. Performance on tasks
is also sometimes considered a behavioural indicator. Anxiety is a typically
behavioural phenomenon in that it can be taught and conditioned (see Martin, 1961),
and individuals high in trait anxiety tend to display specific behavioural patterns,
most typically those of avoidant behaviour.
1.1.3 Cognitive indicators
The cognitive component of anxiety consists mostly in anxious cognitive content (i.e. worry) and a change in attentional focus. Anxiety alters attention in a way that creates
an attention and interpretation bias, which consists mostly in an increased tendency
to evaluate stimuli as threatening and a difficulty shifting attention away from
potentially threatening stimuli (see section 2.6). Attentional bias is often assessed via
experimental manipulations, mostly by measuring reaction times after exposure
to threatening and non-threatening stimuli. The measurement of eye-movements has
proven useful in these designs. Anxious thoughts and content are usually determined
on the basis of self-report or implicit association tests. The cognitive aspects of anxiety
are described in greater detail below in Section 2. Anxiety and cognition.
14
1.1.4 Emotional/phenomenological indicators
The subjectively experienced “feeling” of anxiety is of crucial importance, given
that self-report measures remain an indispensible tool for anxiety research.
A phenomenological view of anxiety can take us back to the common, intuitive
understanding of the term and also its linguistic history. Anxiety can be understood as
the unpleasant “narrowness” of being, or a “dark and distressing feeling of
expectation” (Joseph Lévy-Valensi, 1948, as cited in Crocq, 2015, p. 321). In the
17th century, anxiety was understood as “a state of agitation or depression with feelings
of distress in the praecordial region.” (Lazarus, & Averill, 1972, p. 245). The term
“anxiety” was historically often used to refer to distress linked to existential
and abstract fears (e.g. anxiety of fate, death, emptiness, guilt, etc.). Although
the definition of the term has since developed and shifted, anxiety remains
an indisputably unpleasant emotion, usually accompanied by worrying thoughts
and the presence of foreboding anticipation.
State and trait anxiety 1.2The distinction between state and trait anxiety is a common one and the two
terms today are generally accepted and used. Spielberger (1966), later to become the
leading author of the State-Trait Anxiety Inventory (STAI; Spielberger, Gorsuch,
Lushene, Vagg, & Jacobs, 1983), defines the two terms as follows: State anxiety is a “transitory state or condition of the organism that varies in intensity and
fluctuates over time” while trait anxiety refers to “individual differences in the extent to
which people are characterized by anxiety states and by prominent defenses against
such states.” (p. 12). The intensity of state anxiety experienced is then the consequence
of a combination of an individual's tendency to experience anxiety (i.e. trait anxiety)
and the strength of the stressor inducing it (i.e. the degree of threat), or, in other
words, the situational factor (see e.g. Eysenck, 1992).
Test anxiety 1.3Test anxiety can be defined as “…the proneness to worry about one’s own
performance (e.g., expectations of failure), and one’s own aptitude (e.g., self-
deprecatory thoughts) under evaluative or test conditions” (Calvo, Eysenck, Ramos &
Jimenéz, 1994, pp. 99-100).
Test anxiety can be considered a subtype of performance anxiety. Beilock,
Schaeeffer and Rozek (2017, p. 156) define performance anxiety as “fear and
15
apprehension connected to completion of a specific task (e.g., a test) or even
engagement with a specific domain (e.g., math).” Test anxiety is performance anxiety
experienced in the specific situation of being tested.
The construct of test anxiety can also be classified as a type of achievement
emotion. Pekrun (2006, 2017) described a variety of achievement emotions according
to whether they are (1) negative or positive and (2) activating or deactivating. Anxiety
is considered a negative activating emotion, whereas an example of a deactivating
positive emotion according to Pekrun would be relief (see Pekrun, 2017, p. 252).
The concept of test anxiety underwent significant development throughout the
years. Early on, it was studied as a single latent trait. In 1952, Mandler and Sarason
published a one-dimensional questionnaire called the Test Anxiety Questionnaire.
The items used in this questionnaire were chosen based on experiments studying the
affects of anxiety on learning. The criterion validity of the measure was assessed using
comparisons with MAT 1 , SAT 2 scores and predicted and actual grade average.
Individuals who tested high in test anxiety achieved significantly lower MAT and
SAT and predicted grade average scores than individuals low in anxiety. The scores
were also compared in groups of distinct social classes. The analysis confirmed that
test anxiety scores are higher for students who were on a scholarship and those whose
fathers had a middle class occupation (Mandler & Sarason, 1952).
In 1967, Liebert and Morris distinguished two main factors of test anxiety:
Worry and Emotionality. The distinction is still accepted by the most researchers in the
field today. The worry component describes cognitive content concerning one’s
performance, the risk of failure and comparing oneself with others. Emotionality describes the feelings of nervousness, tension and accompanying physiological
symptoms and arousal. Studies have shown that the worry component
is a significantly stronger predictor of performance impairment than the emotionality
component (see also section 3.1 Anxiety and academic performance). The distinction of
worry and emotionality became the basis of the Test Anxiety Inventory, published by
Spielberger in 1980. The questionnaire belongs among popular methods and has
presented extensive psychometric evidence of its reliability (see Zeidner & Matthews,
2003).
In 1983, Sarason published the Reactions to Tests questionnaire, which
described test anxiety on four separate dimensions. These dimensions were Worry,
1 Mathematical Aptitude Test. 2 Scholastic Aptitude Test.
16
Bodily Arousal, Tension and Test-irrelevant Thinking. The four sub-scales were chosen on the
basis of a factor analysis of 91 items taken from the Test Anxiety Scale (1978), a later
revision his first Test Anxiety Questionnaire (1952). The scales were compared
between each other according to how they were associated with intellectual
performance and cognitive interference. The main aim of this questionnaire was to
provide a tool that would better differentiate nuances in anxiety that most affect
cognitive performance.
Later on, models of test anxiety started to pay more attention to situational
factors and to describe the mechanisms underlying the emotion of test anxiety as a
dynamic process. Spielberger and Vagg (1995) introduced a transactional process
model of test anxiety. Their model presents test anxiety as a continuous process
determined by a dynamic interaction of personality and situation. Personality
influences an individual’s tendency to interpret the test situation in a certain way. The
resulting level of test anxiety is then a combination of this personality tendency and
the specific testing situation.
This transactional process model hints at the link between trait anxiety and
test anxiety. Individuals high in trait anxiety have a tendency to view a test situation
as more threatening, or to interpret an ambiguous situation more often as a test
situation, than individuals low in trait anxiety do. This is why trait-anxious
individuals are likely to experience a higher level of state anxiety in the given
situation. Correspondingly, individuals who score high in trait anxiety tend to score
high also in test anxiety measures. (See Sapp, 1999, for a description of the historical
evolution of the test-anxiety construct.)
1.3.1 Factors contributing to test anxiety
Appraisal and attribution
An individual’s evaluation of a situation and of his or her own capacity for
coping with it is known as appraisal (see also sections 2.1 to 2.3). The role appraisal
plays in the case of test anxiety has to do with a subject’s perceived control over their
performance. Weiner (1985) describes three dimensions of causal ascriptions
(appraisals) that play an important role in determining emotions associated with
success and failure. On the first dimension of locus, the appraisal assesses whether the
cause of achieved performance is internal (disposition, ability, etc.) or external (luck,
task specifics, characteristics of the evaluator, etc.). The second dimension Weiner
describes is the controllability of these causes. An internal appraisal of failure can be one

17
subjectively controllable (effort, motivation, amount of time invested in the task, etc.) or
one subjectively uncontrollable (e.g. ability, disposition). The final dimension is the
stability of attributed causes. Effort can be perceived both as a stable trait (e.g. laziness)
and as an unstable, context-dependent and willfully selected behavior. The third
dimension of stability has an important impact on the achievement goals individuals set
for themselves in future tasks. According to Weiner, all three causal attribution
dimensions have a direct influence on the achievement emotions one experiences.
Failure expectancy and achievement value, the control-value theory
Achievement emotions however are not influenced only by causal attributions
of the achieved result, but also by the subjective value of this achievement. Pekrun
(2006; 2017) describes this connection in the control-value theory of achievement
emotions. Pekrun’s theory conjoins the approaches of appraisal and expectancy-value
theories of emotion.
Expectancy-value theories explain achievement motivation as the result of an
individual’s assumptions about failure and success that can be described as functional
equations. In the equation, achievement motivation equals to the function of the
expectancy of success or failure and the value of this success or failure. (For a historical
overview of expectancy-value theories in achievement motivation research, see
Wigfield & Cambria, 2010.)
Pekrun uses this model to describe specific achievement emotions as
expectancy-value equations. Within his model, anxiety is a prospective (vs.
retrospective) failure (vs. success) emotion that can be described using the following
equation:
Anxiety = f [ EF × 1 – EF × VF],
where EF is the total expectancy of failure and VF is the total value of failure
(Pekrun, 2006, p. 321). According to this equation, the higher the expectancy of
failure in a test and the greater the value or subjective significance of this failure is,
the more test anxiety will an individual experience.
The control-value theory (Pekrun, 2006) then combines the expectancy-value
model with Weiner’s dimensions of causal attributions described above. Various
combinations lead to the experience of distinct achievement motivations. To
demonstrate on an example, expecting failure on a subjectively important test can
instigate both anxiety and hopelessness. Anxiety will be experienced when the cause
of the expected failure is attributed to at least partially controllable factors.

18
Hopelessness on the other hands will occur when the causes of failure are seen as
uncontrollable.
Social factors
A number of social factors have been found to influence the development
and/or maintenance of the tendency to experience performance anxiety. One of the
factors very significant for test anxiety is social evaluation and the associated fear of
being negatively judged. Dickerson, Gruenewald, & Kemeny (2004) conducted a series
of studies examining the effect of “social self” threats on physiological symptoms
associated with shame. Acute threats to the social self were found to increase cortisol
levels and proinflamamatory cytokine activity. Social evaluation is a powerful stressor
and plays an important role in test anxiety dynamics.
Social pressure can also take the form of negative stereotypes. These
stereotypes not only undermine an individual’s self-confidence, but can also lead to a
fear of confirming the negative stereotype if the individual performs poorly.
Stereotype threat, similarly to anxiety, can lead to impaired performance by loading
working memory (Schmader & Johns, 2003).
Performance anxiety can also be transmitted from one person to another.
Influential adults who partake in a child’s education progress have a significant
influence on their tendency to experience performance anxiety. Parents or teachers
with higher levels of a specific performance anxiety (e.g. math) can increase the
likelihood of their children also developing the same anxiety (see Beilock, Gunderson,
Ramirez, & Levine, 2010; Maloney, Ramirez, Gunderson, Levine, & Beilock, 2015).
See Beilock, Schaeffer, & Rozek, 2017, for an overview on performance anxiety.
2 Anxiety and cognition To comprehend how anxiety can affect the reading process, it is important to gain
an understanding of the broader effects of anxiety on cognition in general. The
relationship between anxiety and cognition is not a simple or straightforward one, nor
is there consensus about the key concepts and terms used to describe it (be it
“anxiety”, “cognition,” or “emotion”). Great variety can be found in research and
literature. Authors focus on different aspects of the problem, continue in different
theoretical traditions and adopt different terms to describe the same constructs, or
apply the same terms to different constructs, respectively. Yet despite these
divergences, they are in fact attempting to describe the same general but complex
phenomenon.
19
The aim of this chapter is not to decide between competing concepts and theories,
but rather to provide a broader understanding of the issue at hand. By presenting an
overview of the main theoretical issues concerning anxiety and cognition, I wish to
aid orientation in the terminology and create a wider theoretical framework within
which I can then introduce key concepts of the present study, described in the
subsequent chapters.
A brief history of emotion and cognition 2.1In 1962 Schachter and Singer conducted a now famous experiment regarding
the role of physiological arousal in emotional experience. They used epinephrine or
placebo injections in order to induce physiological arousal in their subjects. Subjects
also received one of several versions of (non-)information about what the effect of the
“Suproxin” they had allegedly received was, along with presentations of different cues
about what they may be experiencing. The study was said to demonstrate that the
same physiological arousal could lead to the experience of significantly different
emotions. The impact of the findings on the concept of emotion can be described by
the authors’ proposition that “emotional states may be considered a function of a state
of physiological arousal and of a cognition appropriate to this state of arousal.”
(Schachter, & Singer, 1962, p. 398) The authors also introduced the term “cognitive
label”, by which an individual interprets a state of arousal they are experiencing based
on cognitions and explanations available to them.
Although theories emphasizing cognitive aspects of emotions were by no means
absent in literature before, Schachter and Singer’s study had a large im on the
scientific community and opened the gateway for the development of more influential
cognitive theories of emotions.
The focal concept of the discussion became appraisal, or “the cognitive evaluation
of the nature and significance of a phenomenon or event.” (APA dict., 2015, p. 70) It
was clear that appraisal influences an individual’s experience of emotions, but how
this interaction works and whether it is necessary for the experience of emotion
remained unanswered.
A debate between Zajonc and Lazarus arose around the question of which comes
first, emotion or cognition. Zajonc (1980, 1984) argued for the primacy of emotion –
we first process stimuli automatically (assess its affective tone – positive or negative) and
only then cognitive processing follows. Lazarus (1982, 1984) argued for the primacy
20
of cognition, or, in his own words, that “thought is a necessary condition of emotion”
(1982, p. 1019). According to Lazarus emotion by definition requires cognitive appraisal.
To date, the debate is viewed by most as obsolete. First of all, Zajonc speaks
of affect whereas Lazarus mentions emotion. These terms however are not viewed
as equivalent. Affect is a term describing a more elementary unit of feeling, associated
primarily with the dimensions of pleasant-unpleasant and aroused-calm. Emotion on the
other hand is a “complex reaction pattern, involving experiential, behavioral, and
physiological elements…” (APA, 2015, p. 362). Second, it seems that Zajonc
and Lazarus’s approaches differ not only in their definition of emotion, but also in
their definition of cognition (Zajonc does not accept the term “cognitive” being used
for automatic processes). Finally, the empirical data collected throughout various
research studies since seem to imply that both affective and cognitive information by
itself (ambiguity of these terms aside) can initiate the process of emotion depending
on the situation and individual (see for example Lai, Hagoort, & Casasanto, 2012). See
Power & Dangleish, 2015, for an overview of the Zajonc-Lazarus debate, its impact
and attempts to resolve it.
The bond between emotion and cognition is more complex and interwined
than pioneer theorists like Lazarus and Zajonc anticipated. As Power and Dalgleish
(2015) summarize it: “the ‘emotion’ and the ‘cognition’ are integral and inseparable
parts of each other, and though it is useful to use different names for different aspects
of the generation of emotion, the parts are no more separable than are waves from the
water on which they occur” (p. 61).
Causality is now considered to exist in both directions between the “cognitive”
and the “affective”. Both conscious and unconscious appraisals, controlled and
automatic cognitive processes influence the experience of emotions. Interactions
between “cognition” and “emotion” occur not only in series, but also in parallel and
are present at all stages of emotional experience. Today, research focuses on describing
the specific mechanisms of the interaction of emotion and cognition and more
attention is devoted to studying its neurological foundations (see Power & Dalgleish,
2015).
The specific interactions of emotion and cognition will not be presented here,
but are exemplified in the following sections dedicated to the specific relationship
of anxiety and cognition.

21
Anxiety from the view of cognitive psychology 2.2
How do emotion and cognition interact specifically in the case of anxiety?
Lazarus and Averill (1972) presented a “cognitive” definition of anxiety as “an emotion
based on the appraisal of threat, an appraisal which entails symbolic, anticipatory, and uncertain elements” (p. 246, emphasis added). Lazarus and Averill go on to
describe the three basic characteristics of anxiety appraisals, which they view
as closely connected and interdependent.
Anxiety appraisals are symbolic in that they are often related to abstract ideas and
concepts (e.g. loss of identity, meaninglessness, and the like). They are anticipatory in that they are not confrontational reactions to recognizable present dangers
(as opposed to fear), but “expectation” reactions to yet unspecified threats. These
threats may be unspecified due to the fact that they pertain to the future
(i.e. foreboding), or because of a failure to comprehend the present. Finally, anxiety
appraisals are very strongly linked to uncertainty, be it the ambiguousness of a threat,
or motivational uncertainty as to what is to be done about it.
In view of these characteristics of anxiety and also the fact that defence
mechanisms (or defensive reappraisals) are very prominent with anxiety, the authors
go as far as to say that “anxiety involves a threat to the integrity of cognitive systems" themselves (p. 278, emphasis added). Lazarus and Averill view anxiety as an emotion
that has a specific and unique bond with cognition.
Anxiety Disorders and Cognition 2.3A clinical view of anxiety, focused mostly on specific anxiety disorders, can shed
light on some of the important aspects of the anxiety-cognition relationship. The
cognitivist approach to anxiety disorders has been influenced not only by general
cognitive theories of emotion, but largely also by the tradition of cognitive therapy,
especially the work of Albert Ellis and Aaron T. Beck (see Ehring, 2014, for an
overview). On the cognitive level, anxiety disorders are associated with altered cognitive appraisals, cognitive schemas and associated preferred coping strategies.
Pathological or excessive anxiety can be described as the consequence
of exaggerated threat appraisal relative to the “not-so-threatening” situation. All stages of
appraisal (primary appraisal, secondary appraisal, and reappraisal) are affected
in individuals suffering from anxiety disorders. Anxious individuals overestimate
harm and its consequences (primary appraisal) along with their own inability to cope
with it (secondary appraisal). They also suffer from biased safety estimates and tend

22
to show deficits in the employment of cognitive reappraisal. Cognitive reappraisal
is the updating of previously made appraisals or the reinterpretation of a situation or
threat. Reappraisal often serves to correct previous appraisal to correspond with newly
received information or to benefit the individual’s well-being and is a crucial
component of cognitive emotion regulation. See Beck, Emery, & Greenberg, 1985 and
Ehring, 2004, for reviews.
The tendency to make exaggerated threat appraisals may be the consequence of
maladaptive cognitive schemas. Beck and his colleagues (1985) view cognitive schemas as
“...‘cognitive structures’ that orient the individual to a situation and help him to select
relevant details from the environment and to recall relevant data” (p. 54). The
schemas of individuals with anxiety disorders tend to be more negative, rigid and less
flexible than those of healthy controls (see Ehring, 2014). The content of the
maladaptive schemas is disorder specific and the schematic “rules” can be described
by verbal statements such as: “Any strange situation should be regarded as dangerous.”, “It is always best to assume the worst.”, “They will attack at a sign of weakness.”, and other convictions
(Beck et al., 1985, p. 63).
Research suggests that these rigid cognitive schemas are maintained by several
mechanisms. One of these may be an underlying abnormality in lower-level or
automatic cognitive processes, for example an attention bias towards disorder-specific
threat (see more about attention bias in section 2.6).
Another important maintenance factor is behaviour, specifically avoidance and
safety-seeking behaviours, which are typical for individuals diagnosed with anxiety
disorders. Avoidance behaviour is behaviour aiming to avoid the source of perceived
threat. Socially anxious individuals for example try to stay away from situations such
as public speeches, eating in front of others, and the like. For individuals whose
anxieties are less specific though, it may be difficult or impossible to actively avoid
threats. Patients with GAD, whose fears tend to be rather general and future-oriented,
may instead resort to safety-seeking behaviours. These can include increased caution,
writing down lists, obsessive planning, or preparing for worst-case scenarios (see
Beesdo-Baum et al., 2012).
Finally, individuals with anxiety disorders tend to employ dysfunctional cognitive coping strategies, mainly in the forms of thought suppression and repetitive negative thinking (see Ehring, 2014). Thought suppression is the deliberate suppression of unwanted
negative thoughts (Purdon, 1999). In 1987, Wegner, Schneider and Carter described
thought suppression as leading to a paradoxical increase of the very same automatic
thoughts on the basis of their experiment with the famous “white bear”. Although

23
studies replicating this effect are inconsistent, thought suppression is still considered
an important factor in the development and maintenance of anxiety disorders (see
Purdon, 1999). Individuals with anxiety disorders also tend to concern themselves
with repeating thoughts about past, current or possible future problems, a behaviour
named repetitive negative thinking (see Ehring & Watkins, 2008). This phenomenon
is most clearly visible in the case of GAD’s excessive worry (see Ehring, 2014).
Cognitive therapy of anxiety disorders consists mostly in leading the client
to the realization and positive restructuring of maladaptive cognitive schemas and
supporting changes through tools of behavioral therapy, such as behavioral
experiments, aimed mostly at reducing maladaptive avoidance tendencies. A relatively
novel therapeutic method, focused on lower-level processes, is cognitive bias modification (CBM), consisting of exercises aimed at reducing either attentional bias or interpretation bias. CBM protocols often consist in computer exercises based on experimental
cognitive tasks such as the dot-probe task (see section 2.6). Individuals are,
for example, instructed to react as fast they can to a probe following the short
presentation of two faces – one neutral or happy and the other representing a negative
emotion. In CBM, the tasks are modified so that positive/neutral stimuli are more
often located in the position of the probe. Systematic repetition of trials is thought
to promote an implicitly acquired bias towards the positive/neutral stimuli (See Haim,
2010). The efficacy of this treatment is still disputed, with conflicting meta-analyses
finding non-existing to moderate overall effects (compare e.g. Hallion, & Ruscio, 2011;
Cristea, Kok, & Cuijpers, 2015; and Liu, Li, Han, & Liu, 2017).
Another relatively new approach in the therapy of anxiety disorders is that of
mindfulness based therapy. Its most notable representative is Acceptance and
Commitment Therapy (or ACT; Hayes, Strosahl & Wilson, 1999). This approach has
so far gained more consistent empirical support than CBM (see Hofman, Sawyer,
Witt, & Oh, 2010; Khoury et al., 2013), but can be viewed as only a variation of
cognitive therapy that emphasizes a specific phase of emotion regulation (i.e. the
acceptance of an emotion), one that is given less attention in traditional cognitive-
behavioral therapy (see Hofmann, & Asmundson, 2008).
Anxiety and Cognitive Processes 2.4As we’ve seen in the previous section, anxiety disorders are associated with
modified cognitive appraisals, schemas, limited coping strategies and also typical
behaviours such as avoidance, safety-seeking or thought suppression. In this chapter,
the focus shifts to the more specific effects anxiety can have on basic cognitive

24
processes. This topic was reviewed in detail by Mansell (2004) who describes the
effects of anxiety on 4 categories of cognitive processes: (1) selective attention, (2)
memory, (3) reasoning and (4) thought processes.
2.4.1 Selective Attention
Research has shown that anxiety affects selective attention in two distinct
ways. The first one is hypervigilance towards possible threats, that is, an attentional bias
towards threat. The second is, seemingly paradoxically, the avoidance of threatening stimuli. A possible evolutionary explanation of this double-effect is that anxiety can lead either
to an orienting mode (scanning for possible threat) or a defence mode (searching for
sources of safety, shift to flight-fright reaction) of the brain (see Mogg & Bradley,
1998). Whether the resulting response will be the former of the latter depends on
many factors, including trait anxiety, the intensity and type of the threat. Individuals
with anxiety disorders often often display a bias towards, or away from, disorder-
specific content (Mogg & Bradley, 1998). Studies have shown that threat-vigilant
processing biases can actually be induced. Participants who have been taught to be
vigilant to threat also report experiencing affective changes in the form of increased
state anxiety (Mathews and MacLeod, 2002).
Mogg, & Bradley (1998) argue that vulnerability to anxiety, characteristic
for individuals with anxiety disorders, has to do primarily with a lower threshold for
perceiving a stimulus as threatening. An attentional bias toward threatening stimuli
in itself is common to everyone including non-anxious individuals.
Since attention has an important role in the present study, a separate chapter
is dedicated to anxiety and attentional bias below in section 2.6.
2.4.2 Long-term memory
Anxiety can lead to preferred memorisation of threatening information,
or schema-appropriate information, alternatively. Although the generality of this
claim is disputed, studies have shown the effect of anxiety on memory for several
specific anxiety disorders. In a study by Radomsky & Rachman (1999), individuals
with OCD were better at remembering the location of touched (“contaminated”)
objects than participants in the control group. Mansell & Clark (1999) conducted
a study in which socially anxious individuals recalled less positive words from a
public feedback they received about themselves than low socially anxious participants.

25
Anxiety can also evoke “intrusive memories”, experienced as involuntary and
highly vivid imagery associated with traumatic or aversive autobiographical events.
Intrusive memories sometimes create the impression that they are happening in real
time (e.g. flashbacks in PTSD). The frequency of intrusive images has shown to be
greater in people with dissociative tendencies (see Clark, 1999, for a review).
2.4.3 Reasoning
Anxious individuals display biases in the interpretation of events, be it the
already mentioned overestimation of the probability and expected severity of
undesirable events taking place (see Mogg & Bradley, 1998) or the tendency to
interpret ambiguous stimuli (e.g. ambiguous sentences) as threatening (Eysenck,
Mogg, May, Richards, & Mathews, 1991). It has also been shown that the tendency to
make threatening interpretations can be trained in healthy individuals, leading to
their experiencing feelings of distress (Mathews & MacLeod, 2002).
Individuals with anxiety disorders may also display a tendency to use emotional reasoning, which is a particular heuristic of interpreting one’s (often somatic) feelings of
anxiety as evidence of real danger (see Mansell, 2004). Socially anxious individuals for
example may conclude that their public presentation was flawed on the basis of
feeling their hands shake (Mansell & Clark, 1999). See Clark & Wells (1995) for a
literature review of social anxiety and cognitive biases.
2.4.4 Thought processes
Anxious individuals tend to excessively think or ruminate about possible
future dangers in the form of worry, but also to suppress threatening thoughts
(see Ehring, 2004). This ambivalence seems analogous to the attentional
hypervigilance towards and avoidance away from threatening stimuli.
Worry is a crucial aspect of anxiety and it is sometimes viewed as
the equivalent of the cognitive component of anxiety (see Eysenck, Berkum 1992).
Given its importance, it deserves more attention and is further presented in the
following section.
Worry 2.5Worry is closely related to anxiety. The similarity of the two concepts is obvious
in the APA’s (2015) definition of worry as “a state of mental distress or agitation due
to concern about an impending or anticipated event, threat, or danger” (p. 1163). A
26
more informative and commonly used definition of anxiety was offered by Borkovec,
Robinson, Pruzinsky, & DePree in 1983 (p. 10):
Worry is a chain of thoughts and images, negatively affect-laden and relatively uncontrollable; it represents an attempt to engage in mental problem-solving on an issue whose outcome is uncertain but contains the possibility of one or more negative outcomes; consequently, worry relates closely to the fear process.
Although worry appears both in the form of thought and images, the form
of thoughts with a verbal component are predominant. This may distinguish worry
for example from obsessive thoughts experienced in OCD, which more often appear
as intrusive images (see Turner, Beidel, & Stanley, 1992). Worry is usually triggered
by an external or internal event, but can also appear spontaneously. Negative mood,
which correlates positively with worry, serves both as an onset and maintenance factor
of worry (see Borkovec et al., 1983).
Worry can become pathological due to increased intensity, frequency, and/or
limited controllability (experienced as automatic negative thoughts). Worry is a key
symptom of several anxiety disorders, most notably of generalized anxiety disorder, for
which it is an important diagnostic criterion (see DSM-V, p. 222). Individuals
suffering from GAD tend to experience excessive, uncontrollable worry with respect to
several commonly occurring domains (e.g. life circumstances, work, health, etc.;
see Turk & Mennin, 2011; Turner, Beidel, & Stanley, 1992).
In Borkovec et al.’s studies (1983) self-labelled worriers, as opposed to non-
worriers, scored higher in anxiety, depression and hostility, had greater difficulty
focusing on a monotonous attention task, and reported a higher frequency of negative
thought intrusions during the tasks.
Eysenck and Berkum (1992) identified two main components of worry: social
evaluation and physical threat. Trait anxiety correlated strongly with the component
of social evaluation, but not with worrying associated to physical threat. See also
Eysenck, 1984, for more about the relation of anxiety and worry.
Worry often leads to impaired cognitive performance, especially when present as
a component of test anxiety. Many studies have consistently shown worry to be more
closely related to cognitive and academic performance than the emotionality
component of test anxiety, the effect of worry being often sufficient for explaining the
overall effect of anxiety on cognitive performance (Deffenbacher, 1977, 1978; Zeidner,
1990; see Hembree, 1988 for a meta-analysis and Zeidner, 1988, for a review of the
27
differential aspects of the worry and emotionality components of test anxiety). Some of
these effects will be discussed further in the following chapters.
Attention bias 2.6Extensive literature has been devoted to the topic of attentional bias towards
threat in anxiety. Although the bias itself is a generally acknowledged and recognized
phenomenon, the specific mechanisms underlying it remain disputed. The study of
reactions to threatening stimuli is beyond the scope this thesis. However, there is a
close link between attentional bias research and the research of the effects of anxiety
on cognitive performance in tasks with neutral, non-threatening stimuli, and the two
approaches converge in their attempt to specify the exact cognitive processes
responsible for the observed differences between anxious and non-anxious individuals.
There is also an overlap between the paradigms used for exploring attentional bias
and the study of eye-movements in anxiety (see below).
Several theoretical models attempting to clarify the mechanisms underlying
attentional bias have been presented, and disagreements continue concerning: (1) the
specific processes and phases that constitute the bias (e.g. registration of stimulus,
activation of a “threat mode”, cognitive evaluation and re-evaluation, etc.); (2) the
order of these processes in time; (3) their localisation in the brain, including the
pathways that connect them; (4) the differentiation of automatic vs. controlled
processes, with some authors rejecting the idea of automatic attentional bias altogether
(see Wells & Matthews, 1994); (5) whether and which of the processes are
unconscious, preconscious, or conscious; and (6) how the identified component
processes interact and how they inform one another through feedback loops. Some
of the influential theoretical models include Beck & Clark’s (1997) cognitive model,
Öhman’s (1996) feature detection model, Mogg & Bradley’s (1998) cognitive-
motivational model and Bar-Haim et al.’s (2007) multidimensional model. Eysenck
and colleagues’ (2007) attentional control theory is also sometimes included, although
it is not primarily concerned with the processing of threat.
In their review of attentional bias mechanisms, Cisler and Koster (2010) present
the following experimental paradigms as the most commonly used for testing
conflicting predictions of the above mentioned theoretical models: (1) the modified
stroop task, (2) the dot-probe task, (3) the visual search task, (4) the spatial cueing task
and (5) the antisaccade task.

28
(1) In the modified stroop task, attentional bias in anxious individuals manifests as
a heightened response to reporting the colour of threatening words. (2) In the dot-probe task, two stimuli are briefly displayed on a screen at a small interval which
is sometimes below the limit of conscious processing. Following the display of these
stimuli, a probe appears in the location of one of them. Participants press a button
to indicate which stimulus was replaced (top or bottom). High-anxious individuals
demonstrate differences in response times for threatening and non-threatening
stimuli.
(3) The visual search task consists in participants searching for a target stimuli
amongst distractor stimuli. The task goal may for example to find a happy face amidst
angry faces or vice versa. (4) In the spatial cueing task participants focus on a point
between two rectangles. Before the presentation of a target in one of the rectangles,
an attention drawing cue is presented. The cue can either be valid, drawing attention
to the targeted rectangle, or invalid, drawing attention way from it. This cue can be
a threatening or neutral stimulus. The participants’ goal is to press a key as quickly as
they can indicating in which of the two rectangles the target appeared. Reaction times
between participants and conditions are compared.
(5) In the antisaccade task participants focus on a central fixation point on the
screen. They are then asked to look in the opposite direction of where a threatening
or neutral stimulus suddenly appears. The direction and duration of saccades are
compared. See Derakshan & Eysenck (2009), Derakshan, Ansari, Hansar, Shoker, &
Eysenck (2009) for more about the antisaccade task.
Cisler and Koster (2010) describe three separate effects of threat-related
attentional bias that can be recognized in the empirical data that has been obtained
using the presented paradigms. The first is a delayed disengagement from threat. This effect
has been demonstrated invariably in spatial cueing task designs and almost invariably
in the other paradigms. The second effect is that of facilitated attention towards threat. The
evidence for this effect is rather mixed, but the variance between studies seems to be
explained by the moderators of threat intensity and stimulus duration. The effect is
mostly present for sufficiently threatening stimuli displayed only for a short period
(see for example Koster, Crombez, Verschuere, Van Damme, & Wiersema, 2006). The
third and final effect described by Cisler and Koster is attentional avoidance. This,
contrary to facilitated attention towards threat, has been observed only for long
stimulus durations. Eye-tracking studies have observed attentional threat avoidance in
the form of eye-movements moving away from threatening stimuli. Pflugshaupt et al.
29
(2005) for example found that individuals suffering from arachnophobia first glance
very quickly at pictures of spiders and then look away from them.
Cisler and Koster (2010) also describe the main mediating mechanisms
of attentional bias effects in their integrative review. An important mediating
mechanism of attentional bias is attentional control. Difficulty disengaging from threat
was found to be more frequent in dispositionally anxious individuals with poor
attentional control. Anxious individuals with poor attentional control displayed
difficulty in disengaging also from stimuli presented for longer durations, contrary to
high anxious individuals without an attentional control deficit, who only displayed
this difficulty when the duration of stimulus presentation was short (Derryberry
& Reed, 2002). This and other findings about the mediating function of attentional
control in attentional bias are supportive of the main thesis of attentional control
theory (Eysenck et al., 2007), described further below. The theory posits that anxiety
impairs cognition primarily via the impairment of attentional control.
A second factor found to mediate the effect of anxiety on attentional bias is an
individual’s emotion regulation strategy. Gross (1998, p. 275) describes emotion regulation
as “the processes by which individuals influence which emotions they have, when
they have them, and how they experience and express these emotions.” Gross (1998,
Gross & Thompson, 2007) then presents 5 “families” of emotion regulation processes:
situation selection, situation modification, attentional deployment, cognitive change
and response modulation. The regulation process of attentional deployment is
associated with the willful allocation of attention. Individuals may relocate their
attention away from threatening, unpleasant or painful stimuli towards neutral
or pleasant stimuli as a method of emotion regulation (see Gross, 1998). Willful
attention allocation stands in contrast with the ability to control attention described
above and can be manipulated via the modification of task goals (see Cisler & Koster,
2010).
Studies support the existence of attentional bias in both automatic and
controlled stages of cognitive processing. Automatic attentional bias, which consists
mainly in facilitated attention towards threat, is an amygdala-centered process,
associated with enhanced amygdala activity. Top-down attentional bias, on the other
hand, manifests itself as various attentional control deficits, primarily a difficulty
disengaging from threatening stimuli, and is associated with reduced activity of the
prefrontal cortex (see Derakshan, & Eysenck, 2009; Cisler, & Koster, 2010 for
a review).
30
3 Anxiety and cognitive performance The intuitive assumption concerning anxiety and performance is that anxiety has
a detrimental effect on performance. It is a part of our general experience – forgetting
the speech we prepared when speaking in front of people, not remembering words on
an important interview, not being able to focus on a math test, are just a few
examples. When we are nervous and anxious, we tend to underachieve.
But when investigated empirically, the effect of anxiety on performance proved
very early on to be a complex one. Highly anxious individuals sometimes achieve
equivalent or even higher scores than their non-anxious peers. Stress sometimes
impairs performance, sometimes doesn’t. Several studies found surprising effects
of task type. Moldowsky and Moldowsky (1952) observed an effect of failure stress on
digit span items, but not vocabulary items. In a study by Aborn (1953), stress impaired
the recall of incidental learning, but not of explicitly instructed material. Some
studies even found stress to improve performance, for example in the case of simple
arithmetic problems (Steisel & Cohen, 1951) or the recall of words that were missed in
a previous memory task (Spence, 1957). For a review of these early findings, see
Martin, 1961.
Before I address this complex relationship between anxiety and cognitive
performance, I will briefly present findings from studies examining the effects of
anxiety on academic performance and performance in sports.
Anxiety and academic performance 3.1
The influence of anxiety on academic performance is hardly a direct one, and a
number of small-scale studies conducted throughout the years have found conflicting
results. Seipp (1991) conducted a meta-analysis of 126 studies examining the
relationship between anxiety and academic performance and found an overall negative
effect of r̅w = –0.21. A more modest estimate was found by Chappell et al. (2005), who
conducted a study investigating correlations between test anxiety and grade point
average in 5 414 undergraduate and graduate students. There was a significant
negative relationship between test anxiety and grade point average that corresponded
to approximately one third of a letter grade difference between high and low-anxious
individuals (i.e. the difference between B and B+).

31
Seipp’s (1991) analysis showed that the relationship between anxiety and
academic performance is closer for the subcomponent of worry than for that
of anxiety. In fact, the relationship between worry and academic performance was
large enough to explain the overall effect of anxiety. Anxiety type was another
significant moderator of the relation between anxiety and performance in Seipp’s
meta-analysis. The mean effect size for test anxiety was significantly larger than the
mean effect size of general anxiety (Δr̅ = 0.07). The effect sizes for state and trait
anxiety, however, were comparable.
A third moderator identified by Seipp (1991) was the method by which anxiety
was measured. The effect of anxiety on academic performance was larger in studies
where anxiety measures were more cognitive (as opposed to somatic, emotional, etc.)
and for studies where anxiety was measured after the task or performance.
Test anxiety, as could be expected, is reliably associated with poorer academic
performance (see Hembree, 1988, for a complex meta-analysis). In a study by Hopko,
Crittendon, & Wilson (2005), test anxiety was the only among a variety of measures
related to lower PIQ3 on standardized intelligence tests. The effect was significantly
larger for certain subtests compared to others. The authors interpreted this finding as
indicating that test anxiety may be linked to a more specific and less general cognitive
impairment.
Etiological studies show that individuals suffering from anxiety disorders also
struggle in the academic environment and are much more likely to drop out of or fail
to graduate from high school (e.g. Kessler, Foster, Saunders & Stang, 1995;
Van Ameringen, Mancini, & Farvolden, 2003). Subclinical social anxiety
(or “shyness”) in children (Crozier & Hostettler, 2003) and negative emotions in
students of middle school (Gumora & Arsenio, 2002) have also been found to have
a negative impact on academic performance.
Anxiety and sport performance 3.2
Sport psychology is another area of research interested in the possible negative
effects of anxiety on performance. The influence of anxiety on sport performance was
studied in many contexts, including golf (e.g. Clark, 2002), table tennis (e.g. Williams,
Vickers, & Rodrigues, 2002), rally driving (e.g. Wilson, Smith, Chattington, Ford, &
Marple-Horvat), climbing (e.g. Nieuwenhuys, Pijpers, Oudejans, & Bakker, 2008),
3 Performance intelligence quotient

32
karate (e.g. Williams & Elliot, 1999) and many more (see Wilson, 2008, for a review
of the anxiety-performance relationship in sport and an account of its mechanisms).
Sport psychology makes use of specific design paradigms, including simulations
with built-in eye tracking to measure gaze behaviour, and paradigms comparing
expert and novice players. These designs extend beyond sport and are also used to
study the behaviour of professionals in other areas, such as aviation (e.g. see Allsop &
Gray, 2014).
Sport psychology also coined the term competitive (competition) anxiety. Competitive
anxiety is defined as “a specific negative emotional response to competitive stressors”.
These stressors can be understood as “environmental demands (i.e., stimuli) associated
primarily and directly with competitive performance” (Mellalieu, Hanton, & Fletcher,
2009, p. 4).
The results yielded in research on anxiety and sport performance are analogous
to those in the domain of cognitive tasks – even in sport, anxiety can lead either to
detriments in performance or to enhanced performance, the latter brought about by
an anxiety-induced increase in motivation and arousal.
Conscious processing or self-focus theories, unique to the domain of sport psychology,
explain the detrimental effects of pressure-induced anxiety on sport performance as
the consequence of a shift from more efficient automated processes to less efficient
self-conscious and effortful step-by-step control of movements. Attentional control
theory (Eysenck, Derakshan, Santos, & Calvo, 2007) and its predecessor, the
processing efficiency theory (Eysenck & Calvo, 1992) also have a strong standing point
in sport psychology as models explaining the detrimental effect of anxiety on sport
performance. The results of studies testing the conflicting predictions of the conscious-
processing theories and the processing efficiency theory have primarily supported the
predictions of the latter (see Mullen & Hardy, 2000; Wilson, Smith, Chatington,
Ford, & Marple-Horvat, 2007; Wilson, Smith, & Holmes, 2007). Although the
conclusions of the studies were not unanimous, their results suggest that the
mechanism by which anxiety affects performance in sport is akin to the mechanism
underlying the relationship of anxiety and cognitive performance. See Wilson, 2008,
for a review of the attentional control theory in sport psychology.
33
Mediating and moderating factors of the 3.3relationship between anxiety and performance As mentioned above, the relationship between anxiety and cognitive
performance is a complex one. To answer the question of which factors explain some
of the variation in research findings, in the following text I am providing a list and a
brief description of the most important factors affecting the relationship between
anxiety and performance that have been identified through research.
3.3.1 Subject Variables
a. Type and intensity of anxiety, and level of arousal
Test anxiety, as already mentioned, is a stronger predictor of performance
decrements than general anxiety or anxiety manifested through somatic symptoms.
Some specific anxiety disorders can also lead to disorder-specific impairments (e.g.
social anxiety leads to longer reaction times in face-in-crowd task, see Mogg, Bradley,
& Philippot, 2004).
In general, the inverted U shape of the arousal-performance function defined
by the Yerkes-Dodson law (Yerkes, & Dodson, 1908) also applies for the relationship
of anxiety and performance. Moderate levels of arousal are optimal for cognitive
performance, while levels that are either too low or too high both result in poorer
performance (also see Stennett, 1957). Arousal is linked to motivation, which is
discussed next.
b. Motivation, effort, and compensation
Motivation tends to be increased in individuals high in trait anxiety, which
can explain why they often draw level with or sometimes even exceed their non-
anxious peers. Being afraid of failure, anxious individuals do their best to achieve
good scores, resulting in increased effort. This increased effort may be a method of
compensation for the impairment of cognition due to anxiety. Eysenck and colleagues
(e.g. Eysenck & Calvo, 1992; Calvo, Eysenck, Ramos, & Jimenez, 1994) have studied
various compensatory strategies highly anxious individuals use to sustain their level of
performance. These compensatory strategies use up a greater amount of cognitive
resources, so although performance effectiveness is preserved, processing efficiency
(see further below) is impaired.
The extreme ends of motivation, just like arousal, are detrimental to
performance. “Trying too hard” in situations of subjective importance (see Hardy,
34
Beattie, & Woodman, 2007), due either to high threat and/or high reward, leads to
performance impairment. On the other end of the scale, when anxious individuals are
not sufficiently motivated in a task, the effects of anxiety may affect not only their
processing efficiency, but also their performance effectiveness. In a study by
Broadbent, Cooper, Fitzgerald, & Parkes (1982), high trait anxiety correlated with
scores in the Cognitive Failures Questionnaire, which assesses cognitive slips and
errors in everyday life. This may be due to the fact that in such everyday situations
anxious individuals are not pressed to perform well and thus no longer resort to the
use of compensatory strategies, revealing the underlying cognitive impairment
associated with anxiety.
For a more detailed analysis of the effects of motivation on the anxiety-
performance relationship, see reviews by Eysenck, & Derakshan, 2011, and Berggren,
& Derakshan, 2013.
c. Self-confidence
Self-confidence, or “belief in success”, is considered an important factor
affecting the relationship between anxiety and performance, especially in the area of
sport psychology. Self-confidence constitutes one of the three scales of the Competitive State Anxiety Inventory-2 (CSAI-2; Martens, Vealey, Burton, Bump, & Smith, 1990), alongside
scales of cognitive and somatic responses, and represents the individual’s belief of how
capable they are of meeting the challenges of the task they face.
Within the framework of Hardy and Parfit’s (1990) cusp catastrophe model of
anxiety, Hardy, Beatty & Woodman (2007) expect a rapid drop in performance due to
the withdrawal of effort in the moment when the level of task requirements and
worry reach the point where the individual ceases to see themselves as capable of
completing the task. They argue for the inclusion of self-confidence in anxiety-
performance theories, noting that self-confidence is another moderating factor of the
effect of cognitive and somatic anxiety on performance (see Hardy, Woodman,
& Carrington, 2004).
The majority of studies conducted within the framework of the attentional
control theory do not use self-confidence as a measure in their designs. Eysenck (1982)
does however mention that a perceived low “subjective probability of performing the
task well” can cause a major drop in motivation despite a very high incentive (p. 88,
p. 109). The omission of the measure may also be due to the fact that the effect of self-
confidence on performance is mediated through effort and/or motivation.
35
3.3.2 Task variables
a. Task difficulty (demands) and importance (relevance)
When examining the effect of anxiety on performance, it is important to
consider the cognitive difficulty of the task examined. If no difference is found between
the cognitive performance of anxious and non-anxious individuals, it may be because
the level of task demands is too moderate (see Berggren & Derakshan, 2013) – high
enough to motivate and prompt anxious individuals to resort to the use of
compensatory strategies, but not sufficiently high to impair performance and manifest
an underlying anxiety-related deficit.
The interaction of cognitive task demands and perceived threat can lead to
rather surprising effects. A series of studies examined the effects of various stressors
on the performance of deep-sea divers (Baddeley, 1966d; Baddeley & Flemming, 1967;
Davis et al., 1972). Stressful vs. non-stressful conditions affected the divers’
performance in a manual dexterity task. However, this effect was absent when the
task was a cognitively demanding verbal task. The authors interpreted this effect as
the consequence of the limited attention capacity being fully used up by the
demanding task, leaving no room for worrying thoughts (about for example the
possible dangers of being 100 meters below the water surface). It therefore seems that
a reverse effect of cognitive performance on anxiety can be found, in that focusing on
a non-threatening cognitively demanding task can alleviate worrisome or intrusive
thoughts (see Baddeley, 2007). It is important to note, however, that the threat in this
particular set of studies was task-irrelevant and the authors were examining the effects
of state anxiety unassociated with elevated trait or test anxiety.
Task importance has to do with subjective relevance of the task and the degree to
which the tested subject perceives the test situation as threatening (i.e. level of ego-
threat). An increase in task importance leads to a parallel increase in the subject’s
level of state anxiety and worry (see Hardy, Beattie, & Woodman, 2007).
b. Temporal factors
Some of the effects of anxiety on cognition are time-dependent. For example,
the results of a study by Bar-Haim, Kerem, Lamy, & Zakay (2010) indicate that
anxious individuals (compared to non-anxious) subjectively experience time as moving
more slowly when exposed to threatening stimuli for only 2 seconds, but the group
differences disappear for longer exposure durations (4 and 8 seconds). This would
suggest that threat-related biases occur in early stages of cognitive processing.

36
Compensatory processing in anxious individuals has also been shown to
be affected by temporal factors. In a study by Ansari & Derakshan (2011), the length
of an inter-stimulus interval determined whether or not compensatory effort was
registered through CNV4 response. Differences were found only at longer inter-
stimulus intervals, suggesting that anxious participants “recruit more resources” when
given the benefit of a preparatory period.
These observations imply that various details of a study design that remain
unreported (e.g. waiting time, between-task intervals, the length of exposure to
a stimulus, etc.) might influence whether or not a difference between anxious and
non-anxious individuals is found, especially in the case attention bias paradigms
(described above).
c. Specific task characteristics
Besides temporal factors, there are other specific task characteristics that
moderate the effect of anxiety on performance. For example, anxious individuals seem
to struggle more with tasks involving more frequent and resembling distractor
responses, while their performance can sometimes be enhanced when the correct
response is very dominant (see Martin, 1961).
The type of cognitive processes required to successfully complete the task can
also be influential. The effect of anxiety on cognitive performance or efficiency can
be pronounced in tasks that require inhibition or shifting (see for example Eysenck,
Derkashan, Santos, & Calvo, 2007). Anxiety’s effect can be different for tasks assessing
automatic opposed to controlled processes. The specific verbal and motor components
of a task design will also lead to differences in the effect of anxiety on performance.
The effect of task specifics is one of the reasons why researchers in the field
have recently started to prefer simpler and more straightforward task paradigms over
complex tasks, although this comes with a certain cost to ecological validity.
d. Threatening vs. non-threatening stimuli
Threatening and neutral stimuli are processed differently, and this difference
is amplified in anxious individuals. Trait anxiety is associated with the already
mentioned attentional bias towards threat and an interpretation bias, which lead to
a preference of threatening interpretations of ambiguous stimuli.
4 Contingent negative variation.
37
Interestingly, studies have shown that emotionally biased processing can be
reduced by increasing an individual’s cognitive load, one study even finding a direct
reduction of the amygdala response to negatively affective images (Van Dillen &
Koole, 2009; see Berggren & Derakshan, 2013 for overview).
e. Working memory load
In dual-task paradigms, subjects are presented with a peripheral secondary task
while working on the primary task. Dual tasks create high demands on working
memory and lead more often to performance impairment in high-anxious individuals
than in their low-anxious peers (see for example Eysenck et al., 2007). The greatest
influence was found in tasks that create additional load on the central executive
(attentional load), compared to tasks that increase load either on the phonological loop
or the visuospatial sketchpad (see Eysenck, Payne, & Derakshan, 2005).
For a more detailed analysis of working memory load and anxiety
in performance tasks see Berggren, & Derakshan, 2013, and Moran, 2016 for
an extensive review and meta-analysis.
4 Explaining the relationship between anxiety and performance
The aim of this chapter is to present Eysenck and colleagues’ (2007) attentional
control theory (ACT), which constitutes the main theoretical framework of this study.
There are many advantages to the ACT.
For one, it is a theory that examines the anxiety-performance relationship in the
normal population and focuses on the effects of anxiety on cognitive tasks that do not
contain threatening stimuli. It is also a well-established theory that is continuously
developing in dialogue with empirical findings and offers valuable explanations of the
complex relation of anxiety and cognition. Last but not least, ACT offers a useful
paradigm for anxiety-performance research, mostly thanks to its distinction
of processing efficiency and performance effectiveness.
38
The Development of the Attentional Control Theory 4.1(ACT)
4.1.1 Predecessors of ACT
One of the early influential theories seeking to explain how anxiety leads to
cognitive impairment was Sarason’s (1988) cognitive interference theory (CIT). The main
hypothesis of CIT is that anxiety induces worry and self-preoccupation, emerging
in the form of task-irrelevant thoughts. These task-irrelevant thoughts interfere with
task-relevant cognitions and thus limit the amount of attention available for task-
related processes, leading to performance impairment. Since the worry component of
test anxiety has shown to best predict impairment of cognitive performance, Sarason’s
theory was a sensible attempt to explain observed phenomena. This early theory,
however, lacked precision and failed to explain (1) why anxiety (or more specifically
its worry component) does not always lead to performance impairment, and (2) which
specific cognitive mechanisms are involved in the interference process.
These points were addressed by Eysenck and Calvo’s (1992) processing efficiency theory (PET). Eysenck and Calvo introduced an important distinction using the terms
processing efficiency and performance effectiveness to explain inconsistencies in existing data
on anxiety and performance. While anxious individuals may achieve the same scores
as their non-anxious peers (equal performance effectiveness), they have to exert
greater effort or use up more of their resources in order to do so (lower processing
efficiency). According to PET, the reason why anxious individuals often meet (and
sometimes surpass) the standards of their non-anxious peers, is that anxiety, while
reducing efficiency, also enhances motivation. Increased motivation to succeed
(or avoid failure, respectively) prompts anxious individuals to exert greater effort and
to utilize various auxiliary compensation strategies. In Calvo et al.’s (1994b) study for
example, anxious subjects used subvocalization (articulatory rehearsal), made more
reading regressions and spend more time on the task than non-anxious subjects, but
achieved comparable performance in the tasks.
The second shortcoming of the previous cognitive interference theory was
addressed by PET by postulating that worry impairs processing efficiency by limiting
the capacity of working memory (WM). Designs using concurrent tasks that increase
load on WM led to a greater impairment in anxious individuals, supporting this
assumption. The effect was found only when the concurrent tasks placed demands on
the central executive, but not when placing load on the phonological loop or the
visuospatial sketchpad only. This lead the authors of PET to put forward a more
39
specific explanation, which posits that anxiety specifically disrupts the central
executive component of working memory.
Although this specification was an improvement over the initial vagueness
of CIT, it was still limited in that it did not specify which components of the central
executive in particular were influenced by anxiety. To specify these mechanisms
became the main purpose of the subsequently developed attentional control theory,
described further below. Parallel to the development of anxiety-performance theories,
the theoretical model of working memory also evolved with the same intention of
specifying working memory subcomponents and their functions. Since the working
memory model is a key component of the ACT’s theoretical framework, the following
section is dedicated to its development.
4.1.2 The Working Memory Construct and its Development
Working memory is an evolving conceptual construct that is generally acknowledged
and frequently applied in research. Despite the frequency of its use, it is still a
constract that lacks precision and many important questions remain unanswered. It
faces several conceptual difficulties, including the distinction of the working memory
construct from the construct of short term memory (STM) and the clarification of the
exact nature of WM and its components.
Miyake and Shah (1999, p. 450) presented an extensive definition of working
memory that unified contemporary views on the construct:
Working memory is those mechanisms or processes that are involved in the
control, regulation, and active maintenance of task-relevant information in the
service of complex cognition, including novel as well as familiar, skilled tasks.
It consists of a set of processes and mechanisms and is not a fixed "place" or
"box" in the cognitive architecture. It is not a completely unitary system in the
sense that it involves multiple representational codes and/or different
subsystems. Its capacity limits reflect multiple factors and may even be an
emergent property of the multiple processes and mechanisms involved.
Working memory is closely linked to LTM (long term memory), and its
contents consist primarily of currently activated LTM representations, but can
also extend to LTM memory representations that are closely linked to activated
retrieval cues and, hence, can be quickly reactivated (p. 450, note in
parentheses added).
40
Baddeley’s model of working memory
The first and most influential model of working memory to this day is that
of Baddeley (1986). It developed from the work of Baddeley and Hitch (1974), which
were the first authors to attempt a description of short-term memory as more than just
a short-term memory store. What led them to introduce the new construct was the
observation that limiting the capacity of STM leads to the impairment of cognitive
functioning. STM simply seemed to function like a multimodal working system.
The first challenge the authors faced was defining the model’s basic
components. Originally, three subsystems were described: the central executive and two
modality-based subsidiary storage systems, the phonological loop and the visuospatial sketchpad. Later a fourth component was added, labelled the episodic buffer (Baddeley,
2000).
The phonological loop is said to hold speech-based (perhaps purely acoustic)
information in a temporary store. It seems to depend on a temporary memory trace
that fades if not rehearsed or refreshed in some way and its rehearsal usually takes
the form of overt or covert vocalization. Similarly, the visuospatial sketchpad serves
as a temporary store of visual and spatial information and the rehearsal of the
information it holds, though less examined than the case of the phonological loop,
possibly involves eye-movements (see Baddeley, 2007).
The central executive (CE) is currently considered the most important component
of working memory, although in the first versions of the model it was only viewed
as a “limited pool” of general processing capacity. Later it was said to fill the function
of the attentional control of action, most probably associated with executive functions
of the frontal lobes (see Baddeley, 2007). Baddeley adopted Norman and Shallice’s
(1986) model of attentional control, which differentiates between behavioural control
at two levels - (1) the automatic, functioning on the basis of habits and schemas, and
(2) the intentional, which Norman & Shallice named the Supervisory Attentional System and which has the ability to override automatic and habitual responses.
Baddeley (2007) describes that since the role of the central executive
was redefined to serve mostly as an attentional and not a storage component,
the episodic buffer, taking up CE’s initial storage function, was added to the model.
The episodic buffer is understood as a temporary “work space” accessible through
conscious awareness that functions as the interface between separate WM subsystems
and long-term memory, as well as the interface between different codes of memory
(visual, verbal, episodic, etc.). Using various binding mechanisms, the episodic buffer

41
integrates information into a limited number of episodes. The limited capacity of the
episodic buffer is also used to explain individual differences in WM span.
Components of the Central Executive
The central executive has gradually attracted more and more attention from
researchers over the years and the question of what separate functions
or subcomponents constitute attentional control is now widely discussed.
Baddeley, in his more recent models of WM, identified four candidates
for separate executive component processes of the CE: (1) The general limited capacity
to focus attention. A relatively underspecified function and one that is difficult to study
due to the intervening variables of the automatisation of attentional processes and
varying individual attentional strategies. (2) The capacity to switch attention between tasks.
It seems that articulatory suppression impairs this capacity, suggesting that the
phonological loop may also serve an executive function. Auxiliary verbal control (“self-
talk”) has been observed in both verbal and non-verbal tasks. (3) The capacity to divide attention between concurrent tasks. This ability was found to be unusually well
preserved (in comparison with other functions) in the normal elderly population, but
impaired in patients with Alzheimer’s disease, supporting the assumption that is
an independent function (see for example Baddeley, Bressi, Della Sala, Logie, &
Spinnler, 1991). And finally, (4) the capacity to provide a link between WM and LTM.
See Baddeley, 2007, for a narrative review.
Perhaps with the exception of the fourth and final mentioned capacity of the
central executive, all of the proposed functions appear to be dependent on the frontal
lobes. Thus, functions of the CE and executive frontal lobe functions seem
to converge. This proposition was supported by studies that have found a link between
the dysexecutive syndrome and impaired dual task performance (see Baddeley, Della
Sala, Papagno, & Spinnler, 1997).
Miyake and colleagues (2000) examined executive functions in “frontal lobe
tasks” emloying a variety of common tasks used for the assessment executive
functions. These included, for example, the Wisconsin Card Sorting Test, the Tower
of Hanoi and others. Miyake and his colleagues used a latent variable analysis
to assess individual differences and evaluate the independence and separability of the
proposed executive functions. Miyake and his colleagues also link these functions to
the central executive of Baddeley’s WM system. On the basis of their study, the
authors presented three candidates for separate and relatively independent executive
functions. The first was the shifting function, which is responsible for shifting between
42
multiple tasks, operations or mental sets. The second was the updating function, which
serves to update and monitor working memory representations. Finally, the third
identified function was inhibition. This function enables the deliberate inhibition
of dominant, automatic or prepotent responses in situations that require it (Miyake et
al., 2000). Eysenck and his colleagues (2007) adopted this division of CE functions in
their attentional control theory.
Working Memory Span and Anxiety
Individual differences in working memory are usually described in terms
of differences in its capacity. Daneman & Carpenter (1980) proposed that working
memory involves a combination of the storage and processing of information and
designed a task combining these two functions, where the maximum number
of successfully recalled final words of sentences previously read out loud constituted
a measure now known as working memory span. Working memory span, to no surprise,
is closely linked to language comprehension, but complex span tasks also predict
a number of other abilities, including, for example, emotion regulation or resistance
to distraction (see Moran, 2016).
Moran (2016) conducted a meta-analysis of 177 correlational studies examining
the relationship between self-reported measures of anxiety and measures of
WM capacity and found anxiety to be significantly associated with lower scores
of WM capacity (g = .334), the effect being consistent for all types of working memory
span tasks (simple, complex and dynamic; see Moran, 2016). Experimental designs (in
which anxiety was manipulated) reviewed in his meta-analysis yielded mixed results,
which may possibly be due to design setbacks (it is often unclear whether or not
anxiety was successfully manipulated and/or lasted long enough).
There are several hypotheses explaining this rather robust link between
anxiety and WMC. Alongside various interference theories (e.g. Sarason’s and
Eysenck’s), there are other authors defending a different causal mechanism, consisting
in the competition of different functions localized in certain brain areas. These
theories are mostly a reflection of neurological findings, such as that the same areas
activated when experiencing anxiety are also associated with vigilance and spatial WM
processes (see for example Manoach et al., 2004). Since, from an evolutionary
perspective, anxiety is necessary for survival, anxiety is given priority and “wins” the
competition, leading to the impairment of the “defeated” function (see Shackman et
al., 2006). Other theories propose a domain-specific effect, i.e. distinct interactions
between different anxiety dimensions (worry vs. arousal) and different WM modalities
43
(phonological vs. spatial; see for example Robinson, Vytal, Cromwell, & Grillon,
2013). Worry has been found to lead to detriments on phonological performance only
for sufficiently demanding tasks, whereas arousal disrupts spatial working memory
across all levels of task difficulty (see Moran, 2016).
The link between anxiety and WMC has also been described in the opposite
direction. Working memory capacity may influence an individual’s tendency to
experience anxiety. A lower working memory capacity is associated with greater
distractor interference, a reduced ability to regulate one’s emotions, and a higher
frequency of intrusive thoughts. It may be that a limited WMC constitutes a risk
factor for the development of anxiety symptoms and disorders (see Moran, 2016).
Although there are still questions that need to be answered concerning the
relationship between anxiety and working memory, empirical research up till now
generally supports Eysenck et al.’s (2007) prediction that anxiety affects performance
via the working memory system.
4.1.3 Attentional Control Theory
The attentional control theory (Eysenck, Derakshan, Santos, & Calvo, 2007)
builds on the previous processing efficiency theory by proposing specific mechanisms
by which anxiety impairs attentional control pertaining to the central executive of the
WM system.
The main assumptions of the theory can be divided into three main premises.
1. Anxiety impairs the central executive
ACT posits that anxiety leads to impaired performance by disrupting the
functioning of the central executive component of working memory. Studies
comparing tasks involving the CE and other WM components, along with the fact
that the negative effect of anxiety on processing efficiency grows with increasing
demands on the CE, support this claim (see Eysenck et al, 2007, for a review).
2. Anxiety impairs attentional control by increasing the influence of the stimulus-driven attentional system
Eysenck and his colleagues posit that anxiety impairs central executive
functioning by disturbing the balance between top-down (goal directed) and bottom-up
(stimulus-driven) attentional processes (borrowing from Yantis’s distinction; Yantis,
1998). Anxiety shifts the scales in favour of stimulus-driven processing, which can
44
manifest as an attentional bias towards threatening stimuli and a failure to disengage
from it, but also as enhanced distractibility in the presence of any task-irrelevant
stimuli (though the effect remains stronger for threat-related material). Studies that
have found anxiety to enhance amygdala activation while reducing activity in
prefrontal cortical areas (particularly in the dorsal lateral and ventral lateral
prefrontal cortex areas) support this hypothesis (see Eysenck et al., 2007; Derakshan,
& Eysenck, 2009). ACT also states that the negative effect of anxiety on performance
can be reduced by use of compensatory strategies, most often in the forms of enhanced
effort and the use of additional processing resources.
3. Anxiety impairs the inhibition and shifting functions of the CE
According to ACT, anxiety primarily impairs the inhibition and shifting
functions of the CE, as defined by Miyake and colleagues (2000; see above).
Anxiety impairs processing efficiency (often also performance effectiveness)
in tasks requiring the inhibition function. This effect is pronounced for tasks that include
the inhibition of threatening stimuli. One of the paradigms used to test this
assumption is the antisaccade task (see section Attentional bias) where prolonged latencies
suggest that high anxious individuals take longer to disengage from threatening
(or irrelevant) stimuli (see Derakshan & Eysenck, 2009).
A similar effect of anxiety on performance was found for tasks requiring
the shifting function. This hypothesis was tested using task-switching paradigms like the
mixed antisaccade task, where anti- and pro-saccade trials are mixed within the same
block. Non-anxious individuals achieve higher scores when the task assignments
alternate than in monotonic blocks (consisting solely of either pro- or anti-saccade
trials) due to a phenomenon referred to as the “switch benefit”. More frequently
changing task goals may lead to an increase in performance by decreasing the negative
effect of goal neglect, which occurs when the same task is continually repeated. Anxious
individuals, however, show no improvement under the task-switching condition,
indicating they have a difficulty in managing the shifting mechanisms of attention
and benefiting from them (see Derakshan & Eysenck, 2009).
ACT views the updating function as the least affected by anxiety since it is not
directly connected to attentional control. Only when anxiety leads to an increase
of the overall demands on the central executive, i.e. under stressful conditions, does
the impairment of the function occur (see Eysenck et al., 2007).
The developments of ACT have brought with it many implications for research
on the anxiety-performance relationship. Along with a preference for simpler and
45
more direct designs testing specific cognitive functions and the effect of anxiety on
particular components of the central executive, the notion that anxiety may at times
only affect processing efficiency has given birth to new research paradigms. These
paradigms are based on the assumption that processing efficiency can be directly
expressed in terms of brain activity. They interpret increased activity in certain brain
areas as increased cognitive effort and, consequently, decreased processing efficiency.
Many of these studies have found a difference between anxious and non-anxious
individuals in tasks where no observable effect of anxiety on cognition was found in
behavioural data. This supports the assumption of ACT that although anxiety has no
visible effect on task performance itself, it does have an effect on processing efficiency.
(see Ansari, & Derakshan, 2011 for a more detailed analysis of the neural correlates of
cognitive effort).
5 Anxiety and reading
The reading process 5.1In this thesis, reading is understood as "the ability to extract visual information
from the page and comprehend the meaning of the text." (Rayner, Pollatsek, Ashby
& Clifton, 2012, p. 19.) It is a conservative view of the term that excludes
the skimming of texts or the “reading” of non-text material, such as maps.
There are many existing theoretical models of the reading process that attempt
to describe the various phases and levels of information processing that occur during
reading (see Alvermann, Unrau, & Ruddell, 2013, for an overview of influential
reading models). I have chosen to present an influential model of reading originally
described by Just and Carpenter in 1980. I have selected this model because it stresses
the function of working memory in reading and explores the reading process through
the observation of eye-movements.
The specific eye-movements generally discerned in reading are fixations (gaze rests on a certain place), saccades (eye-movements between fixations), and
regressions (backward saccades relative to the direction of the text). Eye-movements
during reading are described in detail further below.
Just and Carpenter (1980; 2013) attempted to create a model of reading
comprehension that would explain differences in fixation durations on separate words.
They assume that during a fixation, information processing occurs, i.e. the longer the
46
fixation, the more processing the word requires. Just and Carpenter assume that the
processing of words occurs within the working memory, which holds various
intermediate products (physical features of the text, words, meanings, etc.) of the
encoding and comprehension processes (extracting physical features, encoding words
on the basis of various codes, referring the word to an appropriate meaning, etc.).
According to their theory, working memory also directs the processing and
transformation of information, for example from physical features to sounds, from
words to representations, etc. This is how working memory creates new clusters to be
temporarily stored. Finally, working memory serves as the workplace where current
sensory input is processed via representations, schemas, and rules (e.g. orthographic,
syntactic, pragmatic etc.) from long-term memory.
Automatized reading processes occur rapidly and with a minimal expense to
attentional resources. Not yet automatized and more thoughtful processes take longer
and require more attention. Correspondingly, the longest fixations tend to be on new
and unfamiliar words, while words that are part of a well known or already
comprehended higher-order text unit (e.g. a phrase or a clause) may be skipped
entirely.
The role of working memory is analogous also for higher-order reading
processes. These include the determining of relations among words, clauses, and
finally entire units of text. Working memory enables the integration of
representations from previously viewed parts of the text with information from a new
sentence along with schemata from long term memory.
The pattern of eye movements in reading supports the immediacy assumption, which says that a reader attempts to relate each content word to its referent as soon
as possible from the moment it is viewed. If cues for the correct interpretation of a
word are found only later in the sentence or text, regressions commonly occur.
Just and Carpenter also include a computational episode in their account of the
reading process. The computational episode called “sentence wrap-up” occurs when
the reader reaches the end of a sentence. Consistent with the immediacy assumption,
when arriving at the end of a sentence a reader will try to complete its
comprehension. He will try to complete his understanding of the meaning by
searching for referents that have not yet been assigned, constructing remaining
interclause relations (in the form of mere assumptions if necessary) and dealing as
well as possible with any inconsistencies that remain. Only once the sentence is more-
or-less satisfactorily “wrapped-up” do the eyes move forward again, searching for the
next input. So the reader returns to the first phase of encoding in a new part of the
47
text and the reading process continues again from the beginning, as described. See
Just & Carpenter, 2013, for a detailed account of the model.
Reading and working memory, working memory 5.2capacity The two most important components of working memory for the cognitive task
of reading are the central executive and the phonological (or articulatory) loop. The
central executive is responsible for information processing and decision taking in
reading. The articulatory loop enables verbal material to be maintained longer in the
working memory, making it available for further processing.
The articulatory loop has shown to be more important as an auxiliary tool for
beginners learning to read than for fluent readers, and studies suggest it is possible to
read and understand statements without its use. The articulatory loop is important in
situations when the individual needs to judge phonological similarity, retain the
surface structure of a passage, when precise word order is necessary for
comprehension and perhaps also when the input rate of material exceeds the speed of
semantic processing. (See Baddeley, 1979.)
The central executive remains under investigation and specification, and its
precise role in reading is yet to be directly examined. Considering the CE is not a
singular component, it is highly probable that it will also play a multiple and complex
role in the reading process.
The specific function of inhibition, described as a component of the CE, may be
closely linked to reading comprehension. Inhibition differentiates well between good
and poor comprehenders (see Borella, Carretti, & Pelegrina, 2010). Good
comprehenders were found to better resist proactive interference (intrusion errors),
respond less to distractors and more successfully inhibit prepotent responses. Whitney,
Arnett, Driver, & Budd (2011) found two separate factors determining performance on
the reading span task: manipulation capacity and susceptibility to interference. Susceptibility
to interference, as in the study of Borella, Carretti, & Pelegrina (2010), is closely
related to inhibition. Robert, Borella, Fagot, Lecerf, & De Ribaupierre (2009)
investigated changes in WM and inhibitory control throughout the lifespan and found
that the efficiency of inhibition corresponds to the predicted level of attentional
resources available in distinct periods of life. Chiappe, Siegel, & Hasher (2000) have
gone as far as to posit that inhibitory processes determine WM capacity, although
48
according to Robert et al. (2009), this hypothesis can be reversed (i.e. WM capacity
may determine the ability to inhibit).
Individual differences in working memory and working memory span are
closely linked to reading comprehension. Working memory span was originally
assessed by a reading span measure (Daneman, & Carpenter, 1980). According to the
authors, reading span relies on both processing and storage functions of the WM.
Later studies have supported this prediction. WM deficit in poor comprehenders was
found mainly in tasks requiring both storage and processing of information. The effect
greater for tasks also including the inhibition of off-goal information and the updating
of memory content (see Carretti, Cornoldi, De Beni, & Romano, 2005; Carretti,
Borella, Cornoldi, & De Beni, 2009).
The effect of anxiety on reading 5.3The effects of anxiety on cognition, presented at length above, imply that
anxiety will also negatively affect reading comprehension. The fact that the reading
process relies heavily on working memory further supports this prediction.
In this section I will be focusing on the effects of anxiety on the reading
of neutral (i.e. non-threatening) material. For a complete picture, I will only briefly
mention studies exploring threat interpretation bias in reading. Calvo, Eysenck
& Estevez (1994a) studied differences between high and low-anxious individuals in
interpreting ambiguous sentences about ego-threat, physical-threat or non-threat
situations. High-anxious subjects showed facilitation towards drawing ego-threatening
inferences and made ego-threat inferences significantly faster than their low-anxious
peers. Low-anxious individuals on the other hand demonstrated the reversed effect
of facilitation for non-threatening inferences, but only when the probability of
a threatening interpretation of the ambiguous sentence was low. With high threat
probability, the differences between high and low anxious groups disappeared, with
low-anxious individuals equally showing facilitation for threat-affirmative
interpretations (see Calvo & Castillo, 2001). These findings correspond with theories
of attentional bias positing that bias towards threat is a common phenomenon and
that the difference between high and low anxious individuals simply resides in
a different threshold for perceiving stimuli as potentially threatening (Mogg
& Bradley, 1998).
How does anxiety affect the reading of neutral texts? According to Eysenck and
colleagues’ processing efficiency (Eysenck & Calvo, 1992) and attentional control
49
theories (Eysenck et al., 2007), anxiety should more often lead to an impairment
of reading efficiency than the impairment of reading performance itself, commonly
operationalized as reading comprehension. Studies support this prediction, including
a study conducted long before the existence of the processing efficiency theory itself.
In a study by Dizney, Rankin, & Johnston (1969), college females high in trait anxiety
scored comparably to their low-anxious peers in reading comprehension, but made
significantly more eye-movements during the process.
Within the framework of PET the effect was replicated several times. Calvo and
Carreiras (1993) conducted a study in which high test-anxious individuals showed
increased word-reading times in a moving-window reading task, but their
comprehension remained unimpaired. This study also found an interaction of anxiety
and specific linguistic variables on reading time, suggesting that anxiety selectively
impairs higher-order text level processes such as sentence integration, but not lower-
level processes such as encoding or lexical access. This may correspond with ACT’s
prediction of anxiety primarily impairing top-down attentional processes.
Also consistent with ACT, impaired reading performance was found in anxious
individuals only in test situations where they were prevented from using
compensatory strategies. The main auxiliary strategies high-anxious individuals resort
to in order to compensate for increased working memory load seem to be articulatory rehearsal, increased reading time and reading regressions (see Calvo, Eysenck, Ramos
& Jiménez, 1994b; Calvo, 1996).
Studies using articulatory suppression, especially in the form of irrelevant speech, found that overt articulation is more common in high-anxious individuals. This
suggests that the articulatory loop may play a special compensatory role for high
anxious subjects (Calvo, 1996). Articulatory rehearsal, however, actually serves
as something of a “last resort” for anxious individuals. When allowed to make
regressions or spend more time on reading, high anxious individuals used no more
articulation than their low-anxious peers (Calvo et al., 1994b).
Calvo et al.’s study (1994b) found that the most predominant and preferred
compensation strategy of high-anxious individuals reading under ego-threatening test
conditions was the use of reading regressions. That is to say, in order to achieve the same
reading comprehension scores as their low-anxious peers, high-anxious individuals
needed to return more often to already seen passages of the text. The interpretation of
this phenomenon within the framework of the then current PET explains these
regressions as ways of refreshing information that were not held in working memory
due to its reduced capacity caused by test anxiety. Not allowing regressions (subjects

50
could only move forward in the text) led to reduced reading speed (the 2nd choice
compensation strategy). When the pace of text presentation was fixed, subjects finally
resorted to articulatory rehearsal as their last available strategy of compensation.
Anxiety was also found to impair both reading efficiency and reading
comprehension in individuals suffering from PTSD. Sullivan, Griffiths, & Sohlberg
(2013, 2014) became interested in the subject because of their experience with PTSD
patients approaching them with similar problems. They said they were having
difficulties reading and comprehending texts and that their reading pace had
significantly decreased. PTSD is associated with several deficits of executive control,
including deficits in WM tasks, deficits in sustained attention and a decreased ability
to suppress distracting information. In their studies, Sullivan et al. (2014) found that
veterans suffering from PTSD took longer to read texts and had slower reaction times
than subjects in the control group. There was no effect found for paragraph
complexity or statement difficulty on the results of PTSD patients. However,
this effect may had been masked by the already mentioned prolonged reading times.
In self-report, readers with PTSD primarily ascribed their reading difficulties to
inattention to task. The authors interpret prolonged reading times in PTSD patients as
a result of impaired sustained attention due to intrusive thoughts associated with
PTSD. These attention-impairing intrusions may lead to “zoning out” or “mindless
reading”, in which the eyes continue to make forward saccades, but the text is
no longer being processed (see Reichle, Reineberg, & Schooler, 2010). Sullivan et al.
(2014) report that there was no effect of higher-order text charachteristics on patients’
reading times. Since syntactic and lexical effects are decreased in mindless reading
as opposed to mindful reading (Reichle, Reineberg, & Schooler, 2010; see below
section 6.2.5), the reported absence of higher-order text characteristics may speak in
favour of Sullivan et al.’s explanation.
It seems that intrusive thoughts associated with anxiety may impair reading
in two distinct ways. The first is the effect described Calvo et al. (2004). Anxiety loads
the working memory and leads readers to use compensatory strategies in order
to maintain their desired level of performance. The second way anxiety can affect
reading was described by Sullivan et al. (2013, 2014). According to their explanation,
anxiety impairs attention to the task through intrusive thoughts, which manifests
itself as mindless reading. Attention and working memory are very closely related
and intertwined concepts, and it is easily possible that these two demonstrations
of anxiety in reading are consequences of the same underlying process. A possible
factor influencing whether the mind chooses to wander or compensate may be

51
the degree of a subject’s motivation to achieve a certain level of performance. Another
factor is perhaps the intensity of anxiety, or specifically the intensity, frequency and
resistance of intrusive thoughts. Readers may also read mindlessly at varying depths
and with varying intensity for varying levels of anxiety. Schad, Nuthmann, & Engbert
(2012) proposed a levels of inattention hypothesis, describing mind wandering as occurring
in different degrees. “Weak” mind wandering was found to affect eye-movements
in reading only as a decrease of the sentence wrap-up effect, whereas in the case
of “deep” mind wandering, even low-level lexical effects of word length and frequency
were reduced.
Although both hypotheses explaining prolonged reading times in anxious
readers are linked to attention and executive processes, they may lead to distinct
predictions about the nature of eye movements in reading under anxiety. Are the
regressions anxious readers make mostly “refreshing” regressions or re-reading
regressions? Do the eye-movements on the text preceding a regression correspond
with normal, attentive reading, or can a reduction of the sentence-wrap up and/or
word frequency effects be seen? When readers regress, do they search for specific key
words essential for comprehension, or do they re-read entire passages? The analysis
of eye movements preceding regressions may hint at how well a sentence is processed
by a reader before they make a regression.
A more detailed description of eye movements and regressions in reading can be
found below in section 6.2.
6 Eye-movements and eye tracking
Short overview of the method and terminology 6.1Eye tracking is a technology that determines, with relatively high spatial and
temporal precision, where one’s visual gaze is located on an observed stimulus. The
most common eye-tracking technology works on the basis of measuring the angle
between the pupil centre and the first Purkinje image, which is the reflection of light
from the outer surface of the cornea (i.e. the pupil-corneal reflection system).
The most commonly used eye-trackers today emit infrared rays into the eye.
These are reflected from the cornea and then registered by a camera, which also
enables the recognition of the eye’s pupil centre. Eye-movements are measured
in angles, described in degrees and minutes. When combined with information about the
52
distance of the eye from the stimulus, gaze location on the stimulus surface can be
computed. This computation works only when the visual angel is sufficiently small, in
order to achieve necessary precision. Eye-trackers can be monocular or binocular,
depending on whether they measure movements of only one or both eyes. For a more
detailed description of eye-tracking technology and methodology, including historical
and alternative eye-tracking techniques, see Duchowski, 2007, and Holmqvist et al.,
2011.
There are several features of eye-trackers that influence the properties of the
output data from these devices. One of the features is the device’s sampling frequency, which designates how many times per second the position of the eye is registered. The
frequency of eye-trackers varies from 25 to 2000 Hz (number of recordings per
second), depending on the eye-tracker and its settings. Although high frequency may
be needed for a very detailed analysis of eye movements, a frequency of 250 Hz is
sufficient for most designs (see Holmqvist et al., 2011). A second characteristic is the
spatial accuracy of an eye-tracking device. Spatial accuracy corresponds to the average
difference between the actual gaze position and the position measured by the eye-
tracker. A related factor is spatial precision, which is the ability of the eye-tracker
to measure and reproduce the same gaze location in repeated measures. Temporal precision describes the delay of the eye-tracker compared to real time and
the consistency of this delay. Finally, eye-trackers vary in how sensitive they are
to the movement of the measured subject and in the method they use to filter data
and eliminate noise, that is all data unrelated to actual eye movements.
Eye-tracking methods provide scientists with many advantages. One of
the primary advantages of eye tracking is the possibility of recording precise
eye movement data online and in real time. Eye movements are extremely difficult
to control consciously, meaning that it is nearly impossible for subjects to pretend
or deceive by their eye movements without being “caught”. This holds the great
advantage of social desirability having a minimal effect on the collected data. Eye
tracking also offers the possibility of creating designs with relatively high ecological
validity. This is especially the case of eye-tracking portable glasses, which can be used
to measure eye-tracking data in authentic, non-laboratory environments.
The main disadvantages of eye tracking primarily concern data interpretation
and not the data itself. Eye tracking yields data that are sufficiently precise
and accurate for most research purposes, if both hardware and software are set up and
used correctly. With less robust or versatile eye-trackers, data loss may become
a significant problem. Some eye-trackers may lead to a loss of up to one third
53
of participants (see Holmqvist et al., 2011). Eye-trackers differ in how well they scan
eyes of a certain colour or shape and eyes with glasses or contact lenses. Since
a relatively stable position is necessary for good measurement, working with children
presents an additional difficulty (see ibid.).
The problems concerning data interpretation are of greater import than
questions of data precision. As Holmqvist et al. (2011, p. 71) simply put it: “It is
impossible to tell from eye-tracking data alone what people think.” The greatest
current challenge facing eye-tracking research is reliably describing the link between
eye-movements and underlying cognitive processes. Longer fixations, for example, can
mean both increased interest in a stimulus and difficulties in processing a stimulus.
Individuals can also “zone out”, that is fixate on a point without processing it.
Triesch, Ballard, Hayhoe, & Sullivan (2003) found that individuals can look directly
at a task-related stimulus item, without at all having activated working memory.
Furthermore, the mind is often aware of that which is not fixated. Underwood,
Chapman, Berger, & Crundall (2003) found that subjects remembered about 20%
of un-fixated objects from a driving simulation video and were unable to recall
some of the fixated objects. The ambiguity of eye-movements increases the risk
of researchers succumbing to confirmation biases and using backward reasoning
to support their predictions with eye-movement data (see Holmqvist et al., 2011).
The obscurity of eye-movement data interpretation has also led to disputes about the
eye-mind hypothesis concerning eye-movements in reading research, which closer
relates to this study and is described below in section 6.2.2.
Studying eye-movements in reading 6.2
6.2.1 Eye-movements in reading
The movement of the eyes during the process of reading is discontinuous. The
eyes move forward in “jumps” called saccades and the gaze lingers at certain points
called fixations during which information is processed. No new visual information is
retrieved from the stimulus during saccadic movements, a phenomenon called saccadic suppression. The duration of a reading fixation can vary greatly and depends to a large
degree on the difficulty of cognitive processing (see above in Just & Carpenter’s model
of reading). The average fixation duration in reading is 200-300 ms. Saccade duration
primarily depends on the visual distance covered. On average, a distance of 2 visual
degrees lasts 30 ms, a 5° distance requires 40-50 ms, and so on. See Rayner, 1998, for
a complex review of eye movements in reading.

54
The visual field can be divided into the foveal, parafoveal and peripheral area.
Visual acuity is high only in the fovea, which constitutes a mere 2 degrees of the visual
field and corresponds roughly to 6-9 letters of standard text. Although visual acuity is
considerably decreased in the parafovea (approximately 5° of the visual field
surrounding the fovea), parafoveal processing plays an important role in reading.
Parafoveal processing enables the apprehension of certain characteristics of text
following the currently fixated word. The apprehension of the word length, word
spaces, and the like of neighbouring words aids the interpretation of the currently
fixated word (see Rayner, 1998).
Eye-movements in reading do not necessarily coincide with shifts in attention.
One can shift attention without changing the location fixated by the eyes. Attention
seems to precede saccades when moving on in a text, perhaps helping determine
where the next saccade is to land.
Eye-movement patterns in reading are substantially idiosyncratic. Fixation
durations, saccade lengths and frequency of regressions all vary significantly between
individuals. Rayner (1998) describes that these measures are influenced by many
factors including a subject’s reading level, speed and strategy, but also by
typographical characteristics and text difficulty or the nature of the reading task itself.
Novice, weak or dyslexic readers tend to make more frequent and longer fixations,
shorter saccades and more frequent regressions than average readers. These
differences primarily reflect difficulties on the level of cognitive processing, and not
problems with the execution of eye-movements as such. Correspondingly, the training
of oculomotor movements in reading has shown inefficient in increasing the speed of
reading comprehension.
6.2.2 Eye-mind hypothesis
The eye-mind hypothesis states, that “under certain circumstances, the eye
fixates the referent of the symbol currently being processed.” (Carpenter & Just, 1976,
p. 139). In the tradition of reading research, the eye-mind hypothesis constitutes a key
premise for interpreting eye-movements in reading. A key assumption of Just and
Carpenter’s (1980) model of the reading process (described above) is that longer gaze
durations on words indicate that a higher cognitive load is necessary for their
processing. A gaze duration is the sum of fixation durations falling within one
designated visual area, for example a specific word. As mentioned above, readers make
longer fixations on difficult or new words and words located in specific locations.
Longer fixations also occur on words located at the end of a clause or sentence.
55
These prolonged fixations are related to information integration and the making of
reading inferences. All of the mentioned moments associated with longer fixation
durations are also moments of increased cognitive demand. In brief, the eye-mind assumption in the context of reading posits that the eye stays fixated on a word for as
long as it takes to process it.
The relationship between gaze duration and processing has proved to be a very
close one, but the synchronisation of eye and mind is not absolute. Morris and Rayner
(1991) describe two main exceptions to Just and Carpenter’s immediacy assumption. The
first is the parafoveal preview effect, in which the mind is “ahead of” the eyes, processing
information that has not yet been fixated. The second is the spill-over effect, or the
transfer of fixation durations onto following words. This effect manifests itself for
example as shorter than average gaze durations on words immediately following low
frequency words. The eyes can also be “ahead” of the mind, when they fixate new
words while the mind is processing previous ones held in working memory (see
Radach & Kennedy, 2004). Despite these deviations, the eye-mind hypothesis remains
a central and, for the most part, valid premise of reading research. In the words
of Radach and Kennedy (2004):
The relation between fixation positions and durations and local processing is
strong enough to produce reliable effects when sampled over groups of
participants and items and in this sense eye movement measures provide an
extremely sensitive index of local processing load (p. 7).
Although the eye-mind hypothesis has shown to hold in the vast majority of
cases, there is still no guarantee it will be valid, especially in new and yet untested
paradigms. Just & Carpenter (1976a, b) also present limitations of their eye-mind
hypothesis and stress the importance of task selection for experimental designs
studying the eye-mind relation. They recommend the experimental tasks should have
a clear structure. This structure should be described by adequate theoretical models,
providing researchers with a general idea of what basic mental operation phases occur
during the given task. For example in three-term series problems (e.g. “If John
is leading Bill, and Tom is following Bill, then where is John?”) a succession of
mental operations necessary for the successful accomplishment of the task is quite
easily deducible (Just & Carpenter 1976b, p. 141). This enables a more reliable
interpretation of the observed eye-movements in analogous reading tasks (ibid.). Tasks
should also have clearly assigned goals, obvious to both the subject and the researcher,
56
and they should be designed so as to minimize off-task eye-movements (see Just
& Carpenter, 1976a).
6.2.3 Regressions
10% to 15% of all saccades are regressions, or backward movements of the eyes (Rayner, 1998). Since text direction can be relative, regressions can be also defined
as “movements of the eyes in which the reader refixates information that has already
been fixated.” (Duffy, 1992, p. 464) Research has shown regressions to be linked to
comprehension difficulties. The frequency of regressions increases with increasing
conceptual difficulty (see Jacobson & Dodwell, 1979) and with comprehension
failures, as observed in the case of ambiguous sentences (see Rayner, 1998).
Fast readers make fewer regressions (Rayner, 1998) and the inability to regress has
shown to negatively impact reading comprehension (Schotter, Tran, & Rayner, 2014).
Holmqvist (2011) summarizes that research has found a higher frequency of
regressions with less proficient readers, readers suffering from visual disorders,
dyslexia, Alzheimer’s disease and readers with Broca’s or Wernicke’s aphasia (up to 2
- 3 times as many regressions as in the normal population). Texts containing spelling
errors or non-text patterns also lead to an increase of regressions (ibid). Regressions
tend to decrease with age from the period children learn to read onward, but may
increase again in older adulthood (see Rayner, Reichle, Stroud, Williams,
& Pollatsek, 2006).
Regressions can be divided into several subtypes. Very short backward saccades usually occur after long forward saccades and are conducted in order to correct the
error by which the previous forward saccade “missed the mark”. Other extremely
short regressions are intra-word regressions. Approximately 7,2% of fixated words receive
two or more consecutive fixations during the first encounter of the word (Rayner,
1998).
In general, within line regressions to a word on the line that is being read are
more frequent than regressions that go back to previous lines. The average length of
these backward saccades is 5.4 letters, which is shorter than the average 9.5 letters of
forward saccades (see Vitu, & McConkie, 2000). Long saccades, 10 or more letter
spaces back or to another line, are usually caused by comprehension failures. These
long regressions are most often initiated as soon as the reader comes upon
disambiguating information in the text. Most of these saccades are fairly accurate in
regressing to the approximate region of the text where the key word for
comprehension is found (Rayner, 1998).

57
Why do readers regress in a text? Regressions may be automatically initiated
corrective saccades, as mentioned above. They may also be initiated when
encountering problems with word identification. Vitu and McConkie (2000) found
that the probability of regressing was higher for words of low perceptibility, low word
frequency, for longer words and for words with high retinal eccentricity (i.e. words
lying further away in the visual periphery). Although regressions occurred more
commonly to words that had previously been skipped, word frequency also affected
regressions to non-skipped words. Regressions also occur when the reader encounters
higher-level comprehension difficulties. Semantic and syntactic complexities have
repeatedly been shown to increase the probability of regressive eye movements (see
Rayner, 1998; Vitu, & McConkie, 2000). Longer, mostly interline regressions may also
have to do with a difficulty in retaining information from previously viewed parts of
the text in working memory.
Duffy (1992) introduces another type of reading regressions. She distinguishes
eye regressions and mental regressions. When readers in her study encountered
comprehension difficulties in a text, for example in an ambiguous sentence, they
reacted in one of two ways. Either the reader only paused (made a longer fixation)
when coming upon disambiguating information, or they initiated a regression
to previous parts of the text. According to Duffy, prolonged fixations in these
circumstances indicate that the reader is attempting to make a “mental regression”
in order to refresh information needed for the reprocessing of what they are currently
reading. When a mental regression is not possible, the reader will return to the
relevant part of previous text using an eye regression. According to Duffy, mental
regressions may be preferred because they take less time and aren’t as costly
as eye regressions. On the other hand, eye regressions are more certain of retrieving
the correct information compared to mental regressions, which must rely on a reader’s
memory and can therefore be inaccurate. Clifton (1992) found that readers recovering
from errors use these same strategies. Readers either used backward saccades
to previous parts of the texts or displayed longer fixations further on in the sentence,
which may have been moments during which mental regressions occured.
Duffy proposes two main factors that may decide whether a reader will opt for
a mental or physical regression. The first is the level of information needed – the more
complex the information, the greater the probability that the individual will prefer
returning to the problematic section of the text physically. Data from studies using
various paradigms correspond with this first assumption. Ehrlich and Rayner (1983)
found that subjects only rarely regress in situations when the disambiguation
58
of pronouns is necessary. Subjects used eye-regressions only in 4% of the trials.
Frazier and Rayner (1982), on the other hand, found that subjects regressed in 43% of
garden-path sentences. The difference can be due to the fact that it is easier to retrieve
the antecedent of a pronoun from working memory than to reconstruct an entire
succession of words. Although there may be disagreement in how frequent regressions
are in reading in general, regressions seem to be common when the reader encounters
significant disruptions in comprehension.
The second factor influencing the choice between mental and eye regressions
is the distance of the targeted information. Readers will more willingly make eye-regressions
on the same line they are reading than to previous lines. This is perhaps due to the
costliness of distant regressions, where it becomes more difficult to precisely locate
and “land on” the desired part of the text.
6.2.4 Eye-tracking and regressions
With eye-tracking technology it is possible to define various regressive eye-
movement events. First of all, it is important to differentiate between backtracks,
regressions and look-backs. A backtrack is a saccade moving in the opposite direction
of the previous saccade. A regression is a saccade moving in the opposite direction of the
text. A regression can also be a backtrack, if following a forward saccade, but multiple
regressions can occur in sequence, in which case they are no longer backtracks. Look-backs (also called returns or refixations) are any saccades to areas of interest (e.g. specific
words) that had already been fixated. These need not necessarily be directed in the
opposite direction of the text, nor are all regressions look-backs, since the eyes often
regress to words that had been skipped during first-pass reading. (Holmqvist et al.,
2011)
Regressions can be assessed using various regression-related events. Amongst
the most common of these are measures describing the number of regressions. This can be
the total number of regressive saccades made when reading a text, or more specifically
the number of regressions from or to a certain area of interest (most often a specific
word). Another measure used is regression rate, or the number of regressions per a
chosen unit of measurement. Regression rate can be calculated for example as the
amount of regressions per second, per a certain number of words, per line, sentence,
paragraph, and so on. A related event is the regression scanpath, which is the rereading
scanpath that starts following a regression and ends when the eyes again reach the
point from which they initially departed. See Holmqvist et al., 2011, for a survey of
eye-movement events and measures.

59
6.2.5 Eye-movements in mindless reading
Mindless reading is generally associated with longer fixations and a decrease
of the effect of lexical and linguistic variables on fixation durations, which is most
visible as a decrease of the word frequency effect (see for example Reichle, Reineberg,
& Schooler, 2010; Luke, & Henderson, 2013; Foulsham, Farley, & Kingstone, 2013).
Schad, Nuthmann and Engbert (2012) report that they sometimes observed shorter
and sometimes longer fixations in mindless reading, but this is relative to the
frequency of the fixated word. Immediately before readers caught themselves mind-
wandering, eye movements appeared to be especially erratic (Reichle, Reineberg, &
Schooler, 2010).
Nguyen, Binder, Nemier and Ardoin (2014) observed mindless reading in
children. When reading mindlessly, 2nd-graders skipped words more often and had
shorter gaze durations and total reading times than in the case of focused reading.
Word frequency effects were also decreased in mindless reading. When focusing on
the task, the eyes made more fixations and regressions, mostly intra-word regressions.
The research so far says only very little about the specifics of regressions in
mindless reading. Reichle, Reineberg, & Schooler (2010) found that readers were less
likely to make interword regressions prior to self-caught mind-wandering. Luke and
Henderson (2013) compared eye-movements for normal vs. unreadable texts,
constructed of pseudo-words made of blocks instead of letters. In their study, they
found that readers also regressed when reading senseless texts, but mostly to “words”
that had been skipped. In normal reading on the other hand, the eyes frequently
returned not only to skipped words, but also to those that had already been fixated.
Luke and Henderson conclude from these findings that oculomotor processes may
drive certain types of regressions, while others require cognitive control.
Unfortunately, there are no studies yet focusing on regressions following mindless
reading or comparing these with regressions that occur during focused reading.
60
II. The present study
61
1 Introduction to the present study
The present study’s main purpose is to provide further insight into how
anxiety affects cognitive processes in during reading. Research investigating the
anxiety-performance relationship has repeatedly found significant effects of anxiety on
cognition, although this effect may not always be visible at first sight. The well-
established ACT theory holds that anxiety primarily affects processing efficiency. Although anxious participants often achieve comparable results to their non-anxious
peers, they do so at a greater cost to their cognitive resources. When cognitive load
increases beyond a certain limit, anxious individuals’ performance effectiveness can be
impaired along with their processing efficiency.
The present study is a modification of experiments presented in Calvo et al.’s
1994(b) paper, especially of the designs used in studies 3 and 4. Similarly to
Calvo et al.’s design, in the present study reading efficiencies of anxious and non-
anxious individuals were compared in neutral and anxiety-inducing conditions.
Reading efficiency measures were defined by reading time, time spent on regressions
and the proportion of regressions to total reading time. Ego-threatening instructions
were used to induce state anxiety in the experimental condition.
Ego threat, alternatively named evaluative stress, is commonly used in anxiety-
performance designs to manipulate state anxiety. Ego threat manipulations consist in
creating task conditions where an individual views potential task failure
as embarrassing, humiliating or otherwise negatively judged by others. Ego threat
designs often employ comparison with other participants, evaluation by professional or
expert evaluators, or associating performance with more stable personality traits
to induce anxiety. Individuals who score high in test anxiety tend to be more
susceptible to ego-threatening instructions. See Deffenbacher, 1978; Darke, 1988; Lee,
1999 for examples of designs using the ego-threat paradigm.
The results of Calvo et al.’s studies suggested that anxiety primarily affects
reading by increasing the number of reading regressions anxious participants make.
The time spent on regressions explained differences in reading time between anxious
and non-anxious participants. Increased time spent on regressions also resulted
in lower efficiency scores for high-anxious participants, although they achieved
comparable comprehension scores.

62
While the design of the present study resembles that of Calvo et al.’s
experiment, it focuses on different aspects of the problem. Calvo and his colleagues
were mostly interested in auxiliary strategies that anxious individuals use when they
read. The present study’s main aim is to explore the effects of anxiety on regressive eye movements. It seeks to gain insight into what kinds of regressions occur and what
specific mechanism can explain why anxious individuals use regressions more often
than non-anxious readers. A no less important aim of the study is to see if the effects
observed by Calvo et al. can be replicated.
The main modification to Calvo et al.’s design is the use of eye-tracking
technology to register online eye movements during reading. Eye-tracking provides
a more authentic method of detecting eye-movements than self-paced reading, thus
increasing the ecological validity of the measure of regressions. Moreover, eye-tracking
data allows for a precise count of eye-movements and subtypes of regressions can be
identified and differentiated. The specification of regressive movements can aid the
interpretation of the effect anxiety has on reading regressions.
A second modification is the deliberate selection of cognitively demanding
texts as task stimuli. Using cognitively demanding texts should increase participants’
working memory load. Several linguistic and syntactic text characteristics have been
found to increase working memory load. These include, for example, long compound
sentences, unusual word order, uncertain pronouns, pronouns located far from their
antecedents, frequent disjunctions and negations, or generally complex syntactic
structure (see Baddeley, 1979; Wright, 1980; Trabasso, Rollins, & Shaughnessy, 1971).
Texts rich in these characteristics were sought and preferred as stimuli material. It is
assumed that if anxiety affects reading primarily via the working memory system, this
effect will be pronounced for cognitively demanding texts.
Reading efficiency
The PET and ACT theories of the anxiety-performance relationship (see section 4
in part I) make a distinction between performance effectiveness and processing efficiency. The
efficiency of a task can be most basically defined as the ratio of performance to effort
or consumed resources (see Figure 1.1). Performance is usually understood as the
achieved score, or the direct result of a performance task.
Effort, on the other hand, can be operationalized using a variety of different
measures. Studies following the ACT model have used time invested in the task, the
use of auxiliary methods, or even increased activity in certain brain areas, among
others, as measures of effort (see section 4 in Part I).

63
Efficiency = Performance
Effort
Figure 1.1. Efficiency described as the performance to effort ratio
Reading efficiency can then be defined as the ratio of reading performance to the
effort or resources necessary to achieve this level of performance (see Calvo et al.,
1994b). Reading performance is traditionally operationalized as the level of reading
comprehension achieved and is measured by means of comprehension questions
following the reading of a text. For specific reading efficiency measured used in the
present study, see section 2.4.5.
Reading efficiency = Reading comprehension
Effort
Figure 1.2. Reading efficiency described as the ratio of reading comprehension
to effort
Research questions and study aims 1.1How do anxious and non-anxious individuals differ in how much time they take
to read a text, how many fixations they make, and how much time they spend on
regressions? How do they differ when they read under normal vs. anxiety-inducing
conditions? Do high-anxious individuals make more reading regressions than low-
anxious subjects? What kinds of regressions are these? What is their purpose? It is
into these problems that the present study aims to provide new insight.
More specifically, the aim of this study is to compare how non-anxious and
anxious students read and understand difficult texts in ego-threatening and neutral
task conditions.
The measures in which anxious and non-anxious individuals are being
compared are:
• reading performance (measured as reading comprehension)
• reading time
• eye-movement events (fixations and saccades)
64
• regressive eye movements (regressive fixations and saccades)
• time spent on regressions (or the rereading of the text)
• reading efficiency measures, operationalized as the ratio of
comprehension and (1) reading time, (2) reading regressions and (3) the
ratio of regressions to total reading time
A subsidiary goal of this study is to explore the regressive scanpaths of
participants and generate new hypotheses considering the various types and possible
functions of reading regressions in anxiety.
Hypotheses 1.2
On the basis of presented anxiety-cognition theories and the results of previous
empirical studies, the following hypotheses are postulated:
H1: There is a main effect of dispositional anxiety on participants’
a. reading time,
b. number of fixations,
c. time spent on regressions,
d. ratio of time spent on regressions to total reading time,
with anxious individuals spending more time / making more fixations / spending
more time on regressions / spending more time on regressions to total time than non-
anxious participants.
H2: There is an interaction effect of dispositional anxiety and experimental
manipulation on participants’
a. reading time
b. number of fixations
c. time spent on regressions
d. ratio of time spent on regressions to total reading time.
Specifically, the differences between anxious and non-anxious participants are greater
in the ego-threat condition as opposed to the control, with anxious readers achieving
higher scores in the selected reading measures than their non-anxious peers.

65
H3: There is an interaction effect of dispositional anxiety and experimental
manipulation on the reading efficiency of participants a expressed by
a. total reading time,
b. time spent on regressions,
c. ratio of regressions to total reading time,
where the difference in reading efficiency between anxious and non-anxious readers is
greater for the ego-threat condition as opposed to the control, and anxious readers
achieve lower efficiency scores than non-anxious participants.
A difference between anxious and non-anxious participants in comprehension
scores is not expected.
2 Method
Pilot studies and design modifications 2.1Two pilot studies were conducted prior to the experiment. These pilot studies
served several purposes.
The first aim of the pilot studies was to test the intended manipulation
procedure, especially the functionality of the chosen manipulation and of the task
stimuli. The pilot studies also served to prevent possible technical difficulties that may
arise in eye-tracking studies.
The second aim was to gain preliminary eye-tracking data and establish the
best way to process and quantify reading regressions. During the pilot studies, an
estimate could be made of the ratio of data lost due to calibration failure or
measurement inaccuracy (this was estimated to be around 15 - 20%).
2.1.1 The first pilot study Preliminary reading tasks were administered to 6 participants. The
participants’ level of trait anxiety was assessed using anxiety questionnaires.
Participants were then presented with three reading tasks, each containing a single
continuous text of 400 - 500 words. In each task, the text was followed by eleven
comprehension questions. Comprehension questions were either multiple choice
or short open questions.
In the first pilot, three conditions were used: control, task-relevant threat and
task-irrelevant threat. The task-relevant threat corresponds to the ego-threat condition

66
in the present study. The task irrelevant threat condition administered was meant
to induce anxiety unrelated to the current reading task. The task-irrelevant condition
was established by telling participants that after the experimental task a fourth
reading task would be presented. In the anticipated task, subjects would read a text
aloud and the experimenter would observe them and evaluate their performance and
diction. The participants of the study underwent a mock version of this task
to maintain credibility and enable task order counterbalancing.
The main conclusions of the first pilot study were the following. First of all,
the manipulations did not have a strong effect on participants according to their
subjective report. Second, due to the selection of rather long continuous texts,
calibration issues occurred more often, and eye-movement data precision decreased
toward the end of the trials. Third, a decision was made to leave out the third task-
irrelevant condition. One of the reasons for this decision was that the manipulation
did not show the desired effect on participants (they reported feeling anxious during
the mock-task, but not before it). Another reason was that administering more
conditions increased the likelihood that data loss would occur at least in one of the
trials, which would then lead to the exclusion all of the participant’s data. Moreover,
laboratory sessions with four reading tasks turned out to be very long and tiring.
Participants spent between an hour and half to two hours in the laboratory.
Likelihood of data loss and long experimental sessions would decrease the probability
of collecting a sufficiently large sample size.
2.1.2 The second pilot study Seven volunteers took part in the second pilot study. The texts and
comprehension questions remained the same as in the first pilot study, but the format
of the text was changed to improve eye-tracking data quality. Texts were presented
in smaller parts with larger spacing and font size and a validation of calibration was
added between the slides to increase precision. The third condition and the mock task
were omitted.
The main findings of the second pilot study concerned the text stimuli.
Participants reported that the correct response to comprehension questions required
good memorization of information from the text. It was concluded that under such
circumstances, the comprehension questions would be testing memory rather than
reading ability. To reduce the need for memorization, the choice was made to use
several shorter texts that would fit on a single slide, with 2 to 3 comprehension
questions following directly.

67
A preliminary manual analysis of regressions in the texts also showed that the
variability in reading measures was very significant. In an attempt to unify as much
as possible participants’ reading strategies as much as possible and increase the
likelihood that the texts would be difficult to read under working memory load,
a second decision was made to choose more syntactically challenging texts (see below
in section 2.5). Texts with more difficult sentence structure would also allow for
comprehension questions that inquire about the main theses of the text and do not
require the memorisation of specific or detailed information.
The results of the second pilot study also led to a modification of the
presentation of ego-threatening instructions. The choice was made to present
instructions also in written form in the presentation and to add a countdown at the
beginning of each text in the ego-threatening condition (see more in section 2.7).
Design of the current study 2.2The presented study was a 2 × 2 mixed experimental design. The first factor was
a between-subject variable corresponding to the level of participants’ dispositional test
anxiety (low vs. high anxiety). The second factor was the within subject-variable
of experimental condition (control vs. ego-threat). Each participant completed two
reading tasks during the experiment, one where instructions were manipulated to
increase state anxiety and one with neutral instructions (control condition). The
dependent variables were a variety of reading measures, including comprehension,
reading time, measures describing the number of eye-movement events, measures
describing reading regressions and reading efficiency measures (see section 2.4).
Participants 2.3
2.3.1 Targeted sample size and inclusion criteria The target sample size was set to 20 participants per anxiety group. The target
size was chosen on the basis of the experimental design and previous studies. The
main study of reference was the study by Calvo, Eysenck and Jiménez (1994), which
employed a sample of 18 students per group. However, Calvo and his colleagues did
not report standard deviations of mean scores, which is why power analysis could not
be conducted to estimate sufficient sample size. Due to an increased likelihood of data
loss due to the limitations of eye-tracking technology, a larger initial sample needed to
be recruited.
68
The only inclusion criteria for participants were fluency and literacy of the
Czech language. Participants with severe reading disorders or visual impairment were
excluded. All acquaintances of the experimenter were also excluded.
2.3.2 Recruitment Participants were primarily recruited from psychology courses at the Faculty of
Arts and the Faculty of Social studies and from the HUME lab participant pool at
Masaryk University. The experiment was presented in two psychology courses after
arranging with the respective teachers. The experiment was briefly introduced in
class, and the students received an invitation e-mail including the link to an online
screening and the anxiety questionnaire. In one of the courses, students could gain
bonus points for participating in a psychology experiment. E-mail invitations were
sent collectively to students in the HUME lab database. This participant pool
consisted of students enrolled in a subject concerning experimental research. Part of
the course requirements was participation in an experiment. An advertisement
appealing to volunteers was also published on social media groups (with the consent
of group administrators) and distributed as leaflets within the premises of Masaryk
University.
Since recruitment was still underway during first experimental sessions with
already recruited participants, participants who took part in the study were asked if
they could invite their acquaintances that might want to also participate by sending
them the link to the screening questionnaire.
2.3.3 Selection Participants were invited to participate in the experiment via a link to a Google
forms questionnaire. The online questionnaire included information about the
experiment, inclusion criteria and procedure, followed by informed consent and
consent to data processing (see Appendix 1). If the participant agreed to the
conditions, they could continue on to the second part of the questionnaire. The second
part served to assess the participant’s anxiety level. Participants responded to items of
3 separate anxiety questionnaires (see below in section 2.4 Measures).
Participants were sorted according to their anxiety scores. Respondents who
achieved scores corresponding to distinctly low or high anxiety were then invited to
participate in the laboratory part of the experiment. Another person than the
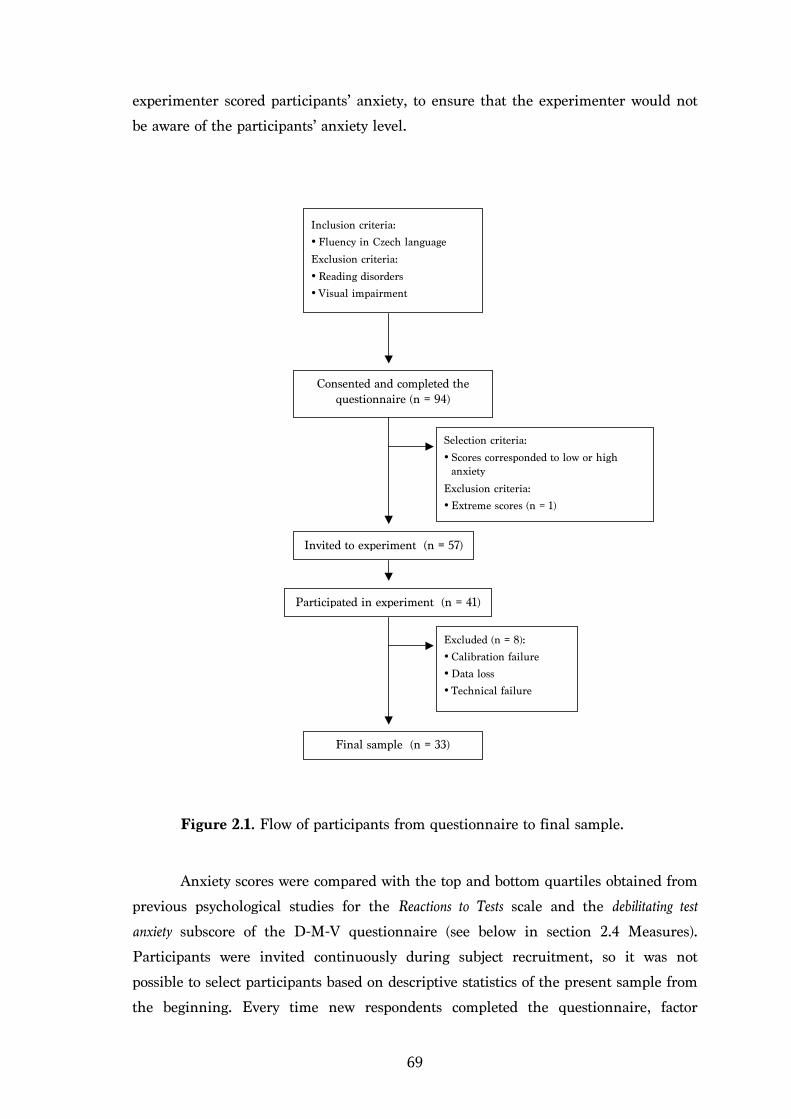
69
experimenter scored participants’ anxiety, to ensure that the experimenter would not
be aware of the participants’ anxiety level.
Figure 2.1. Flow of participants from questionnaire to final sample.
Anxiety scores were compared with the top and bottom quartiles obtained from
previous psychological studies for the Reactions to Tests scale and the debilitating test anxiety subscore of the D-M-V questionnaire (see below in section 2.4 Measures).
Participants were invited continuously during subject recruitment, so it was not
possible to select participants based on descriptive statistics of the present sample from
the beginning. Every time new respondents completed the questionnaire, factor
Selection criteria: • Scores corresponded to low or high
anxiety
Exclusion criteria: • Extreme scores (n = 1)
Final sample (n = 33)
Invited to experiment (n = 57)
Consented and completed the questionnaire (n = 94)
Inclusion criteria: • Fluency in Czech language Exclusion criteria: • Reading disorders • Visual impairment
Participated in experiment (n = 41)
Excluded (n = 8): • Calibration failure • Data loss • Technical failure

70
analyses were conducted for all three anxiety scales. New participants were sorted into
groups both according to the factor score and based on the comparison with quartiles.
Towards the end of recruitment, subjects were sorted solely based on the quartiles
of the anxiety factor. Participants whose scores fit within either the highest or the
lowest quartile were invited to participate in the experiment. One participant was
excluded due to extremely high anxiety scores, which indicated either an unreliable
response or pathological levels of anxiety, which were both grounds for exclusion.
Ninety-four students filled in the online questionnaire. Out of these, 57 were
invited to participate in the experiment. 46 responded to the invitation and scheduled
a session, out of which 41 actually came. Datasets of 8 participants were lost due
to calibration issues, data loss or other technical failures. The final sample consisted
of 33 students, 21 female and 12 male. 16 participants belonged to the high-anxiety
group, the other 17 to the low-anxiety group (see Figure 2.1).
Measures 2.4
2.4.1 Anxiety Three scales presented in the online questionnaire were used to assess
participants’ trait and test anxiety: the Taylor Manifest Anxiety Scale (Taylor, 1953);
Sarason’s (1984) Reactions to Tests questionnaire and the debilitating test anxiety
subscale of the D-M-V questionnaire (Dotazník motivace výkonu, Pardel, Maršálová,
a Hrabovská, 1984).
The Taylor Manifest anxiety scale is a personality scale of manifest anxiety.
It was based on studies examining the effect of manifest anxiety on performance. The
TMAS contains 38 items taken from the MMPI. Participants evaluate statements
about themselves formulated in the first person as either true or false. A sum of scores
of 16 - 38 points corresponds with high levels of manifest anxiety. The majority of
items concern frequently experienced somatic symptoms associated with anxiety, like
headaches, blushing, stomach problems, feelings of hunger, insomnia and others (e.g.
“I am very seldom troubled by constipation.”). Other items are related to worrying
(“I admit I have felt worried beyond reason over small things.”), experiencing feelings
of tension and nervousness (“I work under a great deal of tension.”) and beliefs about
the self (“I am more sensitive than most other people.”).
Odd-even test reliability was found to be r = 0.92. The test-retest reliability of
the original scale was shown to be r = 0.82 over 5 months and r = 0.81 for longer
71
periods of time. The method’s criterion validity was tested by comparing scores with
103 neurotic and psychotic individuals. Following experimental designs have
supported the validity of the TMAS (see Holtzman, Calvin, & Bitterman, 1952). The
TMAS is usually used in experimental designs to select anxious and non-anxious
participants from two ends of the distribution of scores (ibid).
The Reactions to Tests (Sarason, 1983) questionnaire is a measure designed
to assess separate dimensions of test anxiety. Subscale items were selected on the basis
of factor analysis (see section 1.3 in part I).
The questionnaire contains 40 items pertaining to four subscales of tension, worry, test-irrelevant thinking and bodily symptoms. Tension items assess an individual’s
tendency to feel a level of general tension (e.g. “I feel distressed and uneasy before
tests.”). Worry items concern the tendency to entertain worrying thoughts about one’s
performance, comparison to others, anticipation of failure, and the like (“While taking
a test, I find myself thinking how much brighter the other people are.”) Items in the
test-irrelevant thinking subscale have to do with experiencing thoughts during the test
situation that are unrelated to the task itself (“Irrelevant bits of information pop into
my head during a test.”). Bodily symptoms items refer to the experience of specific body
reactions associated with test situations (“My stomach gets upst before tests.”). Items
were originally scored on a scale of (1) = not typical, (2) = somewhat typical, (3) = quite
typical, (4) = very typical. In the present study, a Czech translation of the method was
used and responses were scored on a 5-point scale.
The validity of the subscales was tested in experimental designs, where
individuals achieving high and low scores in the RTT were compared in their
performance on anagram tasks. There was an effect of scores in the worry subtest
on anagram performance (F (2, 162) = 3.25, p < 0.05) and was shown to be associated
with cognitive interference (Sarason, 1983).
The debilitating test anxiety items (anxieta brzdiaca výkon) were taken from
a subscale of the original Slovak method that can be translated as the “Questionnaire
of performance motivation” (Dotazník motivácie výkonu, Pardel, Maršálová, a Hrabovská,
1984). The questionnaire’s other two subscales are performance motivation (motivácia výkonu) and facilitating test anxiety (anxieta podporujúca výkon) The method is based
on Atkinson’s (1974) model of motivation factors (see Mitterová, 2014).
The subscale of debilitating test anxiety contains 17 items, scored on a 6-point
Likert scale. The items concern emotions and worries associated with difficulties
72
experienced in test situations. Examples of items are: “When I feel tense, I am unable
to work as well as usual.”; “I feel exhausted after an exam.”; “When I feel afraid
during an exam, I experience memory lapses.”
The inner consistency of the D-M-V was assessed as a Cronbach’s alpha of
r = 0.81 to r = 0.87, test-retest reliability after a three week interval was rmedian = 0.84.
Correlations between subscales were weak but significant (rmedian = 0.11). Concurrent
validity was assessed by comparing scores with Ehlers’ and Merzse’s (1966)
questionnaire of performance motivation (r = 0.71, p < 0.01) and with Spielberger’s
STAI (r = 0.61, p < 0.01; Mitterová, 2014). Criterion validity was measured
by correlations with high school grade average, but yielded only small and often
insignificant results (ibid).
By way of the process described above in section 1.3.3, participants were
selected and sorted into groups according to their scores in the tree anxiety scales. The
final measure of anxiety used in analyses was a binominal variable, indicating either
low (0) or high (1) anxiety5.
The experimenter and all those involved in the processing of reading
regression data were blind to the participants’ anxiety levels to ensure the information
would not influence the experimental procedure or the manual analysis of the data.
The information about participants’ anxiety levels was added to the database only once
all participants’ reading measures were computed.
2.4.2 Comprehension Comprehension was operationalized using the sum score of correct responses
to the comprehension questions described in section 5.2. The maximum possible score
was 16, and was interpreted as 100% comprehension.
2.4.3 Reading time and eye-movement events The reading time for each participant and task was measured as the sum
of separate trial durations for each text of the task. Trial duration corresponds
to the time from the moment a text stimuli appeared on the screen to the moment the
participant ended the trial by pressing the spacebar and continuing on
5 Described also as non-anxious and anxious, respectively. The two terms are used interchangeably.
73
to the comprehension questions. Thus reading time also includes the time an
individual spent scanning the screen or possibly searching for the next action.
Basic eye-movement events were calculated on the basis of single event statistics
generated by BeGaze eye-tracking software. The following variables were derived:
The number of fixations was measured as the sum of all fixations a participant
made in all of the trials of a reading task. It is a measure closely related to reading
time and the total number of saccades. The number of fixations may be altered
depending on the software event detection settings. For this study the default fixation
detection parameters were used.
The number of saccades is the sum of all a participant’s saccades made in each
trial of a reading task. Default saccade detection parameters were used.
There is a slight disproportionality between the number of saccades and the
number of fixations (rcontrol = 0.84, rego-threat = 0.86, p < 0.001) due to the fact that several
fixations may follow one another without a saccade being detected between them, or
conversely, several saccades may follow one another without any fixations occurring in
between.
2.4.4 Regressions Number of regressive fixations
The number of regressive fixations was measured as the sum of all
a participant’s regressive fixations in all 7 trials of a reading task. A regressive fixation
is defined as any fixation located to the left of the previous fixation according to its
position on the x-axis. The count of regressive fixations was generated automatically
from BeGaze single event statistics using tailored software. It is a measure that was
not corrected in any way and also includes fixations that are found to the left of the
previous after the eyes made a jump to a new line and other regressive fixations
excluded in some of the following regression measures.
Number of regressive saccades
Similarly to the number of regressive fixations, the number of regressive
saccades represents the sum of all regressive saccades that one participant made
within a reading task. A regressive saccade is any saccade whose end position is
located to the left of its start position according to the x-axis. This measure includes
right-to-left saccades that do not belong to actual regressions to previously viewed
parts of the text.

74
Time spent on regressions
Regression. The regression of interest in this study is any meaningful return to
previously viewed parts of the text. In this sense a regression (or regressive event,
respectively) is not equivalent to a backward movement of the eyes, but includes all
eye-movement events within a location that has already been viewed once before. This
definition of regressions therefore excludes regressive saccades or fixations (defined
above) that are not associated with reading what has already been seen (e.g. corrective
regressive saccades, described below). Simultaneously, forward saccades are included if
they re-fixate already read passages of the text6.
For the specific operationalization and program definition of regressions, see
section 2.8.
Large regression. A large regression is any regression (as defined above) that covers
the distance of at least 15 letter spaces. 15 letter spaces is a distance that roughly
corresponds with smaller clauses or segments of text that express a single thought.
Large regressions correspond more closely to the regressions measured by Calvo et al.
(1994) in their study, where the text was presented sentence by sentence and it was
impossible to measure smaller regressions within these predefined segments.
Small regression. Any regression (as defined above) that covers a distance of between
5 to 15 letter spaces.
Rereading. Any regression (as defined above) that covers a distance of at least 5
letter spaces and includes at least three consecutive forward saccades. Most, but not
all, large regressions are also rereading regressions. Small regressions may in certain
situations be rereading regressions, but such situations are rare since 5 letter spaces
is a relatively short distance to fit 3 consecutive forward saccades.
Estimate of the number of regressive events. An additional measure was added that was
computed as the number of lines used in the tailored software to count regressions.
This number corresponds to a rough estimate of the number of regressions. This
measure, however, was not corrected by manual comparison with scanpaths (see
section 2.10 Manual data correction), and therefore contains errors stemming from
data loss and/or erratic eye movements.
6 Note: The word “regression” is used from here onward used in a specific sense, as described above. The word regression is traditionally used in eye-movement terminology to denote a backward movement of the eyes. In the empirical part of this thesis backward (right-to-left) movements of the eyes are named “regressive saccades” for better distinction of the two meanings.

75
Ratios of time spent on regressions to total time
The measures of the time spent on regressions in proportion to total reading
times gives an idea of how much time a subject spent rereading the text as opposed to
first time reading. It equals to the time spent on regressions (or large, small and
reread regressions, respectively) divided by total reading time and multiplied by 100 to
yield a measure described in per cent.
2.4.5 Reading efficiency In this study, reading efficiency variables were computed as ratios of reading
comprehension and several reading measures.
Reading efficiency = Reading comprehension
Reading measure
Figure 2.2. Reading efficiency described as the ratio of reading comprehension and
reading time
Given that some of these measures could turn out to be equal to zero, the formula
presented in Figure 2.2 needed to be adjusted (see Figure 2.3). Since the efficiency of
someone who made no regressions should not exceed their comprehension scores (as
not to favour those who read fast but had very weak comprehension scores), the
following adjusted formula was used:
Reading efficiencyadjusted = Reading comprehension1 + Reading measure
Figure 2.3. Adjusted formula for the computation of reading efficiency described
using regressions.
Since reading variables were described un numbers of various digit spaces, the
numbers were divided by multiples of ten to achieve more easily legible and
comparable efficiency scores. For the precise formulas used to compute efficiency
variables, see Appendix 2.
76
Reading efficiency measures were computed as ratios of comprehension and the
following measures:
1. Total reading time
This measure of reading efficiency belongs among the most intuitive. The more
time a subject spent reading the text, the more effort it required. The suitability
of this measure is amplified in this study, considering that achieving the best possible
comprehension/speed ratio was a part of the task assignment.
2. Number of fixations
The number of fixations is a measure closely related to reading time. The more
fixations, the more eye-movements the subject made and the more effort they exerted
into reading the task.
3. Number of regressive saccades/fixations
The more regressive saccades/fixations, the less direct a path did the subject follow
while reading. It can be assumed that less direct scanpaths take more effort, but it is
a question whether or not they are as such less efficient.
4. Time spent on regressions
Similarly to regressive saccades/fixations, time spent on regressions has to do with
the complexity of eye-movement patterns. This measure, however, also includes
rereading of certain passages. For example, in situations where the participant read
the text quickly once all the way through and then re-read it a second time from the
beginning, time on regressions may be large, yet the count of regressive fixations and
saccades will be small. It is also questionable whether an individual who reads a text
in this matter is reading less efficiently then someone who reads the text only once,
but makes more fixations and small regressive movements. It is also uncertain
whether a regressive reading pattern is more demanding of an individual’s cognitive
resources. Efficiencies were also computed for time spent on each type of regression
(large regressions, small regressions and rereading) and for ratios of time spent
on regressions to total time (see above in sections 2.4.3 and 2.4.4).

77
Stimuli 2.5
Texts were selected according to two main criteria. The first was syntactic and
structural difficulty (see section 1). Texts that were cumbersome, contained long and
complex sentences, etc., were preferred. The second criterion was that the texts did
not present factual information like specific names or numbers. The texts were chosen
so that the general meaning of the text should be easily understood when read
correctly without requiring memorization of specific passages. The selected texts were
slightly modified. Some sentence structures were merged to yield more difficult
presentation and specific facts, names or references were deleted.
The texts were taken from various sources: instruction manuals, psychology
textbooks and monographs. Most of the topics were psychological, philosophical or
historically political, since the texts needed to be of an argumentative nature, rather
than a presentation of empirical facts. Pairs of texts by the same authors were
selected, one used in each of the two sets of texts, to balance the versions as much as
possible.
There were two sets of texts, A and B. Each set contained 7 texts of 25 to 100
words each. The total length of the each set was near to 500 words (493 in variety A,
496 in B).
The texts and comprehension questions were presented to 6 volunteers before
they were used in the experiment. Each volunteer read only a part of the texts, so that
each text was evaluated by at least two respondents. The volunteers were inquired
about text and question difficulty, the clarity of question formulation and the need for
memorization. The questions were then modified according to respondents’ feedback
and the texts in the tasks were sorted according to their reported difficulty from
easiest to most difficult.
Setting and apparatus 2.6The experiment took place in a laboratory setting. An SMI iView X Hi-Speed
tower-mounted eye-tracker was used to measure eye-movements during reading.

78
Experiment procedure 2.7
1. Each participant came to the laboratory for an individual 1-hour long session.
The experimenter welcomed them, reminded them of the experimental procedure and
their rights as participants and then asked if they had any questions.
2. In the next step, the participant completed a short visual task to ascertain the
dominance of the eye. The SMI iView X Hi-Speed eye-tracker was set up to track the
participant’s dominant eye. The experimenter then introduced the eye-tracker to
the participant and adjusted it to fit the participant’s height and other parameters.
Once the eye-tracker successfully registered the eye’s gaze, the participant was
presented with a sample reading task. The task consisted of only one short text
followed by two comprehension questions. In the sample task, the correct responses
to the questions were shown to the participant after he responded to them himself.
The main purpose of the sample task was to acquaint the participant with the length
and difficulty of the task texts and the type of comprehension questions that would be
presented. It also helped decrease the effect of task order on reading.
3. After the sample task, the participant was presented with the first reading task
in either the control or the experimental condition. The order of the two tasks and
the text variety used for the experimental and control tasks were counterbalanced.
Both reading tasks consisted of 7 texts. Two to three multiple-choice
comprehension questions followed immediately after each of the texts. The task
instructions, texts and comprehension questions were all presented on the computer
screen in front of the participants. Participants used the spacebar to move forward to
the next slide and the computer mouse to select responses to comprehension
questions.
In both tasks participants were instructed to read as fast as possible while
achieving maximum comprehension. Further instructions varied depending on the
experimental condition.
Control task.
Instructions to the control task only asked participants to read the texts as fast as
they could while achieving the best comprehension possible. Participants were told
that the results from this task would be used to assess general reading tendencies of
anxious and non-anxious readers. For the exact formulation of the instructions, see
Appendix 4.
79
Ego-threatening task.
In the ego-threatening task, participants were given the same basic assignment as
in the control task and asked to read as fast as they could while achieving maximum
comprehension. In addition, they were told that the results of the task would be used
to compare reading efficiency across participants, and they were informed that reading
efficiency is a measure that correlates with intelligence and academic performance.
Participants were told that their reading times would be measured in this task. The
commencement of the measurement was signalized by a countdown and a beep before
each of the texts, elements that were absent in the control condition. The instructions
also emphasized the necessity to focus fully on the task at hand. See Appendix 4 for
the exact formulation.
Apart from the written instruction presented on screen, the administrator orally
reiterated and stressed the instructions before each task. The difference between the
tasks was emphasized, so that if the ego-threat condition followed, the experimenter
would stress that this time efficiency was being compared and time was being
measured, whereas if the second task was the control task, the experimenter
emphasized that time was no longer measured as in the previous task.
The participants were given a short break between the two reading tasks and were
allowed to leave the eye-tracking tower, stretch, and the like. The intermission also
served to eliminate transfer effects from tasks, for example the transfer of anxiety
from the ego-threatening task onto the control task.
4. After completing both reading tasks, the participants filled out a manipulation
check questionnaire on another computer in the laboratory (see section 3.2). They
were then debriefed and the true design of the experiment was fully disclosed
to them. The participants were asked to not share information about the experiment
with anyone.
After debriefing and answering potential questions of the participants, the
experimenter sincerely thanked them for their participation and offered them
a symbolic reward in the form of a small snack.
2.7.1 Data processing and ethical aspects
The project for the present study was approved by the Research Ethics
Committee of Masaryk University. The personal data processed during the experiment
were the participants’ names and e-mail addresses. The data was protected using
pseudonymization. Each participant was assigned with a random number code and
80
a meta-file was created that contained the codes, names and e-mail addresses of
participants. These were used during data collection for communication with the
participants. The meta-file was double password protected, stored on a safe device and
accessible only to the main experimenter. All experimental data was stored separately
in an anonymous form under the assigned codes. The meta-file was deleted after the
entire experimental process was enclosed and communication with participants was no
longer required.
Subjects were fully informed of the experimental procedure, participation
conditions and their rights as participants (see also Appendix 1). Each participant was
fully debriefed at the end of the session. The design of the experiment, including the
manipulation of state anxiety, was disclosed to them, and participants were assured
their results would not be compared individually. The experimenter explained that
anxiety may have caused a detriment in performance, asked the subject how they were
feeling and made sure any remnants of anxiety or unpleasant feelings were dispelled.
Considering that the manipulation used in the experiment was minimal, the levels of
anxiety induced were low and did not persist after the task was completed.
Defining and detecting regressions 2.8A software program was written in C# to aid the process of regression counting
on the basis of eye-movement event data generated automatically from BeGaze.
A regression was defined as all fixations and saccades from the beginning of a
backward saccade until a fixation that reached or surpassed the x position of the
initial starting fixation to the right (see Figure 2.4).
Eye-movement events had to satisfy the following conditions in order to be
counted as regressions:
1. The distance covered by the return of the gaze is at least 5 letter spaces.
Otherwise the gaze is considered to still fixate the same text unit (e.g. word) and not a
previous one.
The distance covered means the difference described in pixels between the location
of the 1st starting fixation of a regression and the left-most (or furthest back relative to
the text in case of between-line regressions) fixation pertaining to that same
regression. This is not necessarily the distance of the regressive saccade itself.
Participants often regressed using several subsequent smaller regressive saccades.
2. The regressive event is not a corrective saccade. Corrective saccades are right to
left saccades, which the eye makes when searching for the correct place to land the

81
next fixation or when correcting a saccade that went further right than needed. The
following types of corrective saccades were identified:
a) Regressive saccades moving the gaze from the end of a line of text to the
beginning of a new line.
b) A single regressive saccade at the end of a text line to a previous part of that
same line, immediately before jumping to the beginning of a new line.
c) A regressive saccade at the beginning of a new line after a jump from the
previously read line.
d) A regressive saccade jumping back to a skipped unit of text after a long
forward saccade, followed by a second forward saccade landing to the right of
the first forward saccade (see Figure 2.4). Such corrective saccades were
characteristic for some participants where they were clearly a part of first pass
reading.
2.8.1 Specification for software detection
The conditions described above were specified for the software as follows:
1. The distance of 5 letter spaces was calculated in pixels for each text size
separately, regressions below this limit were excluded.
2. Limits were set for each text size and line spacing combination to determine
jumps between lines. These limits were determined on the basis of manual
exploration of the data (comparing real Y-axis differences in jumps between
lines with Y-axis differences in within-line movements).
3. Regressions that were simultaneously jumps to new lines were excluded.
4. Single regressions (only one saccade and fixation) at the end of a line before
jumping to a new one were excluded.
5. Single regressions at the beginning of a line after jumping from a previous
line were excluded.
6. Corrective in-line saccades were defined as regressive right-to-left saccades that
a) do not surpass another fixation to their left and simultaneously b) are
followed by a forward saccade that surpasses the initial starting fixation to the
right. (See sentence 1. in Image x1.) These regressive saccades were excluded.

82
An additional exception was made to these conditions. When the fixation
durations were sufficiently long, such a situation was in fact considered a regression.
The limits were set to a minimum of 200 ms for the fixation duration of the fixation
preceding the regressive saccade (labeled 0 in the example, see Figure 2.4) and a
minimum of 250 ms for the fixation immediately following the regressive saccade
(labeled 1 in the example, see 1. in Figure 2.4). It was assumed that when fixations are
of a significant duration, re-reading does in fact occur. This assumption was made
based on manual exploration of scanpaths, where most corrective saccades were
of rather small fixation duration and borderline cases were often marked by longer
fixation durations.
Figure 2.4. Detecting corrective in-line regressive saccades
2.8.2 Regression duration
To measure the time that a regression took, the following time-marks were
used. To mark the beginning of a regression, the event end time of the fixation prior
to the first regressive saccade was chosen. The end time of the regression was decided
according to where the last fixation of the regression landed. If it landed within the
set radius of fourteen pixels around the starting fixation, the event end time of this
fixation was used (see 1. in Figure 2.5). It was supposed that in this case the fixation
belonged to the regressive event, since it was still reading the same part of the text. If
the last fixation exceeded the radius of the starting fixation to the right, the event
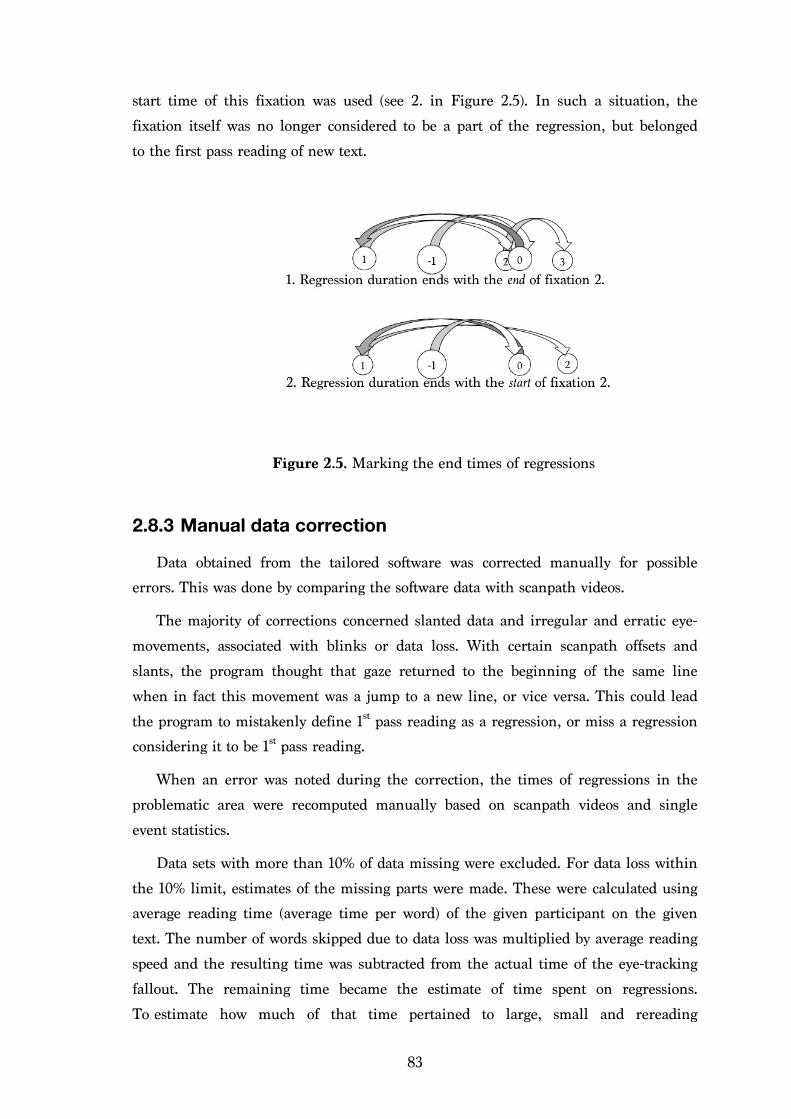
83
start time of this fixation was used (see 2. in Figure 2.5). In such a situation, the
fixation itself was no longer considered to be a part of the regression, but belonged
to the first pass reading of new text.
Figure 2.5. Marking the end times of regressions
2.8.3 Manual data correction
Data obtained from the tailored software was corrected manually for possible
errors. This was done by comparing the software data with scanpath videos.
The majority of corrections concerned slanted data and irregular and erratic eye-
movements, associated with blinks or data loss. With certain scanpath offsets and
slants, the program thought that gaze returned to the beginning of the same line
when in fact this movement was a jump to a new line, or vice versa. This could lead
the program to mistakenly define 1st pass reading as a regression, or miss a regression
considering it to be 1st pass reading.
When an error was noted during the correction, the times of regressions in the
problematic area were recomputed manually based on scanpath videos and single
event statistics.
Data sets with more than 10% of data missing were excluded. For data loss within
the 10% limit, estimates of the missing parts were made. These were calculated using
average reading time (average time per word) of the given participant on the given
text. The number of words skipped due to data loss was multiplied by average reading
speed and the resulting time was subtracted from the actual time of the eye-tracking
fallout. The remaining time became the estimate of time spent on regressions.
To estimate how much of that time pertained to large, small and rereading
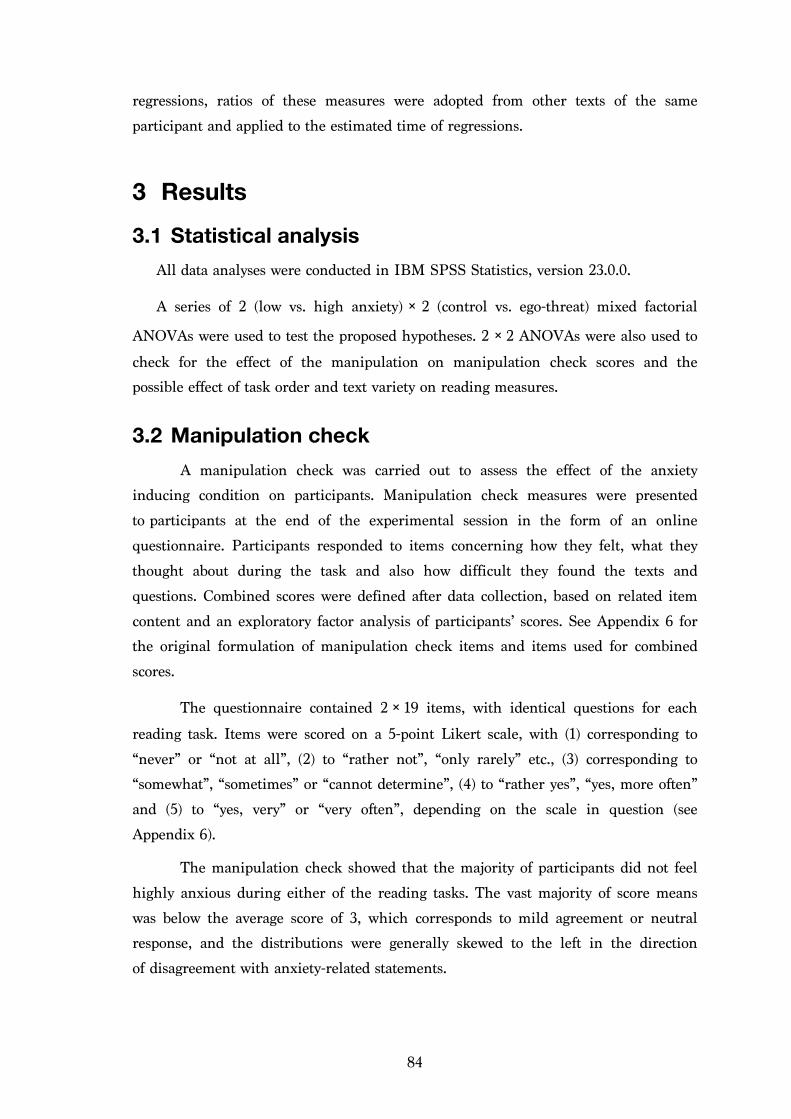
84
regressions, ratios of these measures were adopted from other texts of the same
participant and applied to the estimated time of regressions.
3 Results
Statistical analysis 3.1All data analyses were conducted in IBM SPSS Statistics, version 23.0.0.
A series of 2 (low vs. high anxiety) × 2 (control vs. ego-threat) mixed factorial
ANOVAs were used to test the proposed hypotheses. 2 × 2 ANOVAs were also used to
check for the effect of the manipulation on manipulation check scores and the
possible effect of task order and text variety on reading measures.
Manipulation check 3.2A manipulation check was carried out to assess the effect of the anxiety
inducing condition on participants. Manipulation check measures were presented
to participants at the end of the experimental session in the form of an online
questionnaire. Participants responded to items concerning how they felt, what they
thought about during the task and also how difficult they found the texts and
questions. Combined scores were defined after data collection, based on related item
content and an exploratory factor analysis of participants’ scores. See Appendix 6 for
the original formulation of manipulation check items and items used for combined
scores.
The questionnaire contained 2 × 19 items, with identical questions for each
reading task. Items were scored on a 5-point Likert scale, with (1) corresponding to
“never” or “not at all”, (2) to “rather not”, “only rarely” etc., (3) corresponding to
“somewhat”, “sometimes” or “cannot determine”, (4) to “rather yes”, “yes, more often”
and (5) to “yes, very” or “very often”, depending on the scale in question (see
Appendix 6).
The manipulation check showed that the majority of participants did not feel
highly anxious during either of the reading tasks. The vast majority of score means
was below the average score of 3, which corresponds to mild agreement or neutral
response, and the distributions were generally skewed to the left in the direction
of disagreement with anxiety-related statements.
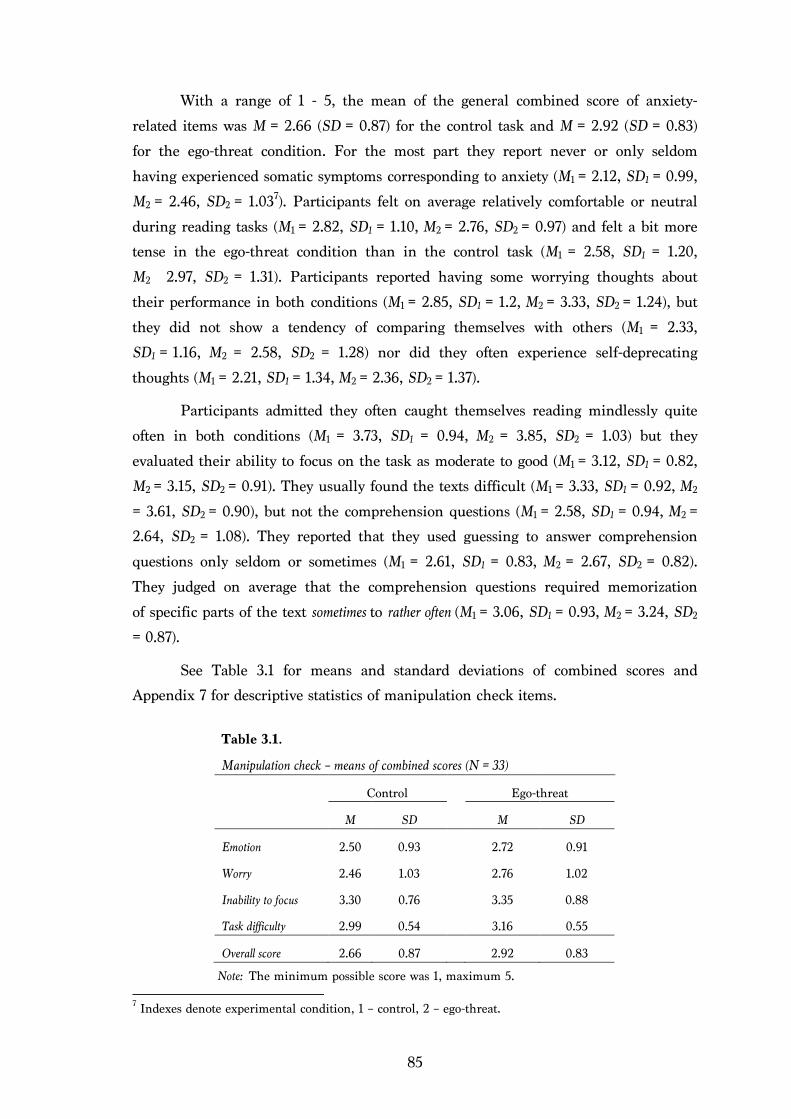
85
With a range of 1 - 5, the mean of the general combined score of anxiety-
related items was M = 2.66 (SD = 0.87) for the control task and M = 2.92 (SD = 0.83)
for the ego-threat condition. For the most part they report never or only seldom
having experienced somatic symptoms corresponding to anxiety (M1 = 2.12, SD1 = 0.99, M2 = 2.46, SD2 = 1.037). Participants felt on average relatively comfortable or neutral
during reading tasks (M1 = 2.82, SD1 = 1.10, M2 = 2.76, SD2 = 0.97) and felt a bit more
tense in the ego-threat condition than in the control task (M1 = 2.58, SD1 = 1.20, M2 2.97, SD2 = 1.31). Participants reported having some worrying thoughts about
their performance in both conditions (M1 = 2.85, SD1 = 1.2, M2 = 3.33, SD2 = 1.24), but
they did not show a tendency of comparing themselves with others (M1 = 2.33,
SD1 = 1.16, M2 = 2.58, SD2 = 1.28) nor did they often experience self-deprecating
thoughts (M1 = 2.21, SD1 = 1.34, M2 = 2.36, SD2 = 1.37).
Participants admitted they often caught themselves reading mindlessly quite
often in both conditions (M1 = 3.73, SD1 = 0.94, M2 = 3.85, SD2 = 1.03) but they
evaluated their ability to focus on the task as moderate to good (M1 = 3.12, SD1 = 0.82, M2 = 3.15, SD2 = 0.91). They usually found the texts difficult (M1 = 3.33, SD1 = 0.92, M2
= 3.61, SD2 = 0.90), but not the comprehension questions (M1 = 2.58, SD1 = 0.94, M2 =
2.64, SD2 = 1.08). They reported that they used guessing to answer comprehension
questions only seldom or sometimes (M1 = 2.61, SD1 = 0.83, M2 = 2.67, SD2 = 0.82).
They judged on average that the comprehension questions required memorization
of specific parts of the text sometimes to rather often (M1 = 3.06, SD1 = 0.93, M2 = 3.24, SD2
= 0.87).
See Table 3.1 for means and standard deviations of combined scores and
Appendix 7 for descriptive statistics of manipulation check items.
Table 3.1.
Manipulation check – means of combined scores (N = 33)
Control
Ego-threat
M SD M SD
Emotion 2.50 0.93
2.72 0.91
Worry 2.46 1.03
2.76 1.02
Inability to focus 3.30 0.76
3.35 0.88
Task difficulty 2.99 0.54 3.16 0.55
Overall score 2.66 0.87 2.92 0.83
Note: The minimum possible score was 1, maximum 5. 7 Indexes denote experimental condition, 1 – control, 2 – ego-threat.

86
Individual 2 × 2 ANOVAs were conducted to test the effects of manipulation
and anxiety on manipulation check scores. Ego-threatening instructions had a small
but significant effect on the Overall score (F(1, 31) = 8.24, p = 0.007, ηp² = 0.21, ηG² =
0.08, ΔM = 0.26) and also on the combined scores of Emotion (ΔM = 0.22) and Worry (ΔM = 0.30; see Table 3.2 for effect sizes).
Participants scored higher in anxiety in the ego-threat condition, as was
expected, but the differences were very small. Within emotion items, manipulation
had small significant effects on the scores of A4 – Tension (F(1, 31) = 6.62, p = 0.015, ηp²
= 0.18, ηG² = 0.05, ΔM = 0.39) and B – Somatic symptoms (F(1, 31) = 5.03, p = 0.032, ηp² =
0.14, ηG² = 0.06, ΔM = 0.34). From the individual worry items, manipulation had a
significant effect only on C1 – Worries about performance (F(1, 31) = 10.83, p = 0.003, ηp² =
0.26, ηG² = 0.08, ΔM = 0.48). See Appendix 7 for means and SDs of manipulation
check items.
As can be seen from mean differences and effect sizes, the manipulation had
only a very small effect on participants’ responses and did not induce a substantially
higher level of state anxiety than in the control condition.
Table 3.2.
Man. check – main effects of manipulation on combined scores (N = 33).
F(1, 31) p ηp² ηG²
Emotion 4.49* 0.042 0.13 0.04
Worry 8.74** 0.006 0.22 0.06
Focus 0.29 0.593 0.01 –
Difficulty 3.68 0.064 0.11 –
General effect 8.24** 0.007 0.21 0.08
** Effect was significant at the 0.01 level.
* Effect was significant at the 0.05 level.
3.2.1 The effect of anxiety on manipulation check scores
Anxiety had a significant effect on participants’ scores in the manipulation
check (see Table 3.3). Anxious participants experienced more anxiety during each task
than their low-anxious peers. This can serve to support the selection of participants
into the low and high anxiety groups, but says nothing about how successful the
manipulation check was itself. (see Table 3.3 for effect sizes, Appendix 8 for table

87
of means). The main hypothesis concerning the manipulation check, if successful, was
that there would be an interaction of anxiety and experimental manipulation
on manipulation check scores, with anxious participants achieving higher scores than
non-anxious, and the difference being greater in the ego-threat condition. The
collected data do not support this assumption, indicating that the manipulation was
less successful than desired.
There was no statistically significant interaction of anxiety x manipulation
on manipulation check scores. The only item that produced at least an indicated effect
was C3 – Self-doubt (F(1, 31) = 3.44, p = 0.073, ηp² = 0.10). With the exception of the
item C3 – Self-doubt (F(1, 31) = 3.44, p = 0.073, ηp² = 0.10), interaction effect sizes were
trivial and non-significant.
Table 3.3.
Man. check – main effects of anxiety on combined scores
F (1, 31) p ηp²
Emotion 17.82* 0.042 0.37
Worry 22.21** <0.001 0.42
Focus 13.88** 0.001 0.31
Difficulty 0.04 0.839 –
General effect 26.84** <0.001 0.46
** Effect was significant at the 0.01 level.
* Effect was significant at the 0.05 level.
3.2.2 Conclusion
The results of the analyses conducted on manipulation check scores indicate
that the ego-threatening instructions had only a minor effect on participants.
According to the participants’ self-reports, the manipulation was not strong enough to
induce considerably higher levels of arousal or worry the ego-threat condition as
opposed to the control condition, or to increase the difference between anxious and
non-anxious participants in the ego-threat condition compared to the control. The
manipulation check did, however, confirm differences between the anxious and non-
anxious group.

88
Table 3.4. Manipulation check - means of combined scores in low and high anxiety groups
Control
Ego-threat
LA
HA
LA
HA
M SD
M SD
M SD
M SD
Emotion 2.00 0.76
3.03 0.81
2.21 0.76
3.26 0.74
Worry 1.80 0.62
3.17 0.92
2.20 0.85
3.35 0.86
Focus 2.94 0.75
3.69 0.57
2.88 0.78
3.84 0.70
Difficulty 2.98 0.56
3.00 0.54
3.14 0.50
3.19 0.61
Gen. effect 2.11 0.62
3.24 0.72
2.41 0.70
3.46 0.59
Notes. LA – Low anxious group (N = 17). HA – High anxious group (N = 16).
Relations between reading variables To gain a better understanding of how closely interdependent the numerous
reading variables used in the study are, correlations between the variables were
compared. Appendix 9 presents a Pearson’s correlation matrix of all basic reading
variables for each experimental condition.
As expected, there were strong significant correlations between total reading
time and the number of reading events, i.e. the number of fixations (r1 = 0.93,
p1 < 0.001; r2 = 0.94, p2 < 0.001) and saccades (r1 = 0.83, p1 < 0.001; r2 = 0.77, p2 < 0.001)8.
The affinity with reading time is stronger for fixations than saccades. This effect is
also reflected in the somewhat weaker correlations of total time with regressive
fixations (r1 = 0.64, p1 < 0.001; r2 = 0.72, p2 < 0.001) and regressive saccades (r1 = 0.56,
p1 = 0.001; r2 = 0.53, p2 = 0.001). This difference is most probably due to the fact that
fixations are eye-movement events of generally longer duration than saccades.
Reading time also significantly correlated with time spent on regressions (r1, r2 =
0.92, p1 < 0.001, r2 = 0.92,, p2 < 0.001). The relation to reading time remained tight for
the measures of time spent on large regressions (r1 = 0.88, p1 < 0.001; r2 = 0.89,
p2 < 0.001) and time spent on rereading (r1 = 0.88, p1 < 0.001; r2 = 0.90, p2 < 0.001).
The exception to these close relationships was the measure of time spent on small
regressions. This measure did not significantly correlate with total reading time (r1 =
8 The indexes 1 and 2 refer to the experimental condition in question. Correlations r1 describe relations between variables in the control condition, correlations labeled as r2 pertain to the ego-threat task.
89
0.31, p1 = 0.083; r2 = 0.26, p2 = 0.140) or with time spent on regressions, large
regressions or rereading (see Appendix 9 for all correlation coefficients).
The measure of small regressions did moderately correlate with the number of
fixations (r1 = 0.42, p1 = 0.015; r2 = 0.35, p2 = 0.047), regressive fixations (r1 = 0.60, p1 <
0.001; r2 = 0.51, p2 = 0.002) and regressive saccades (r1 = 0.43, p1 = 0.013; r2 = 0.52,
p2 = 0.002), but it’s strongest relationship was with that of the estimate number of
events (r1 = 0.86, p1 < 0.001; r2 = 0.87, p2 < 0.001).
The correlation matrices show that small regressions stand apart from large and
re-reading regressions, and they seem to serve a different purpose in reading and are
more closely related to the number of regressive eye movement events than to the
time spent on regressions.
The correlations of text comprehension with other variables were weak,
inconsistent and non-significant. This means that spending more time reading or
making more regressions was not generally associated with higher comprehension
scores.
The main conclusions of the correlation analysis served to aid the selection
of relevant measures for the following statistical analyses. As the primary regressive
measures, large and rereading regressions were subsequently preferred over small
regressions and regressive eye-movement events. From regressive eye-movement
events, regressive fixations will be selected before regressive saccades.
Descriptive statistics of reading measures 3.3Participants took 5 minutes on average to read all 7 texts of a reading task
(without counting the time spent on reading instructions or responding
to comprehension questions). Their average comprehension score was 12 points out of
sixteen, which corresponds to 75% success rate. The average fixation count was 1200
fixations per reading task, out of which 367 (31%) were regressive. The average time
spent on regressions was 2 minutes 51 seconds for the control and 2 minutes
21 seconds for the ego-threat condition. See Table 3.5 for an overview of the most
important descriptive measures and Appendix 10 for descriptive statistics of all
reading and efficiency measures.
The idiosyncratic nature of reading was reflected in large differences between
extremes in the sample. Participants achieved a comprehension level as low as 5
points out of sixteen (corresponding to a 31% success) whereas several others achieved
full score. The fastest reader read all 7 texts in 2 minutes 52 seconds, the slowest took
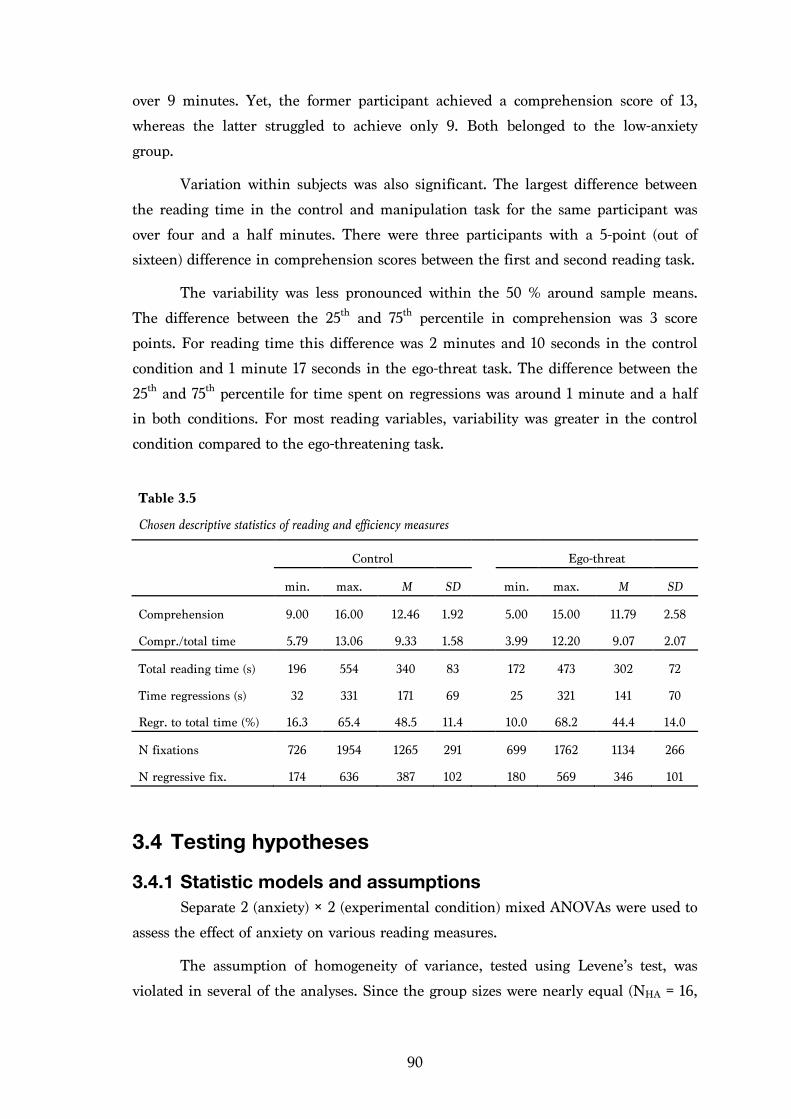
90
over 9 minutes. Yet, the former participant achieved a comprehension score of 13,
whereas the latter struggled to achieve only 9. Both belonged to the low-anxiety
group.
Variation within subjects was also significant. The largest difference between
the reading time in the control and manipulation task for the same participant was
over four and a half minutes. There were three participants with a 5-point (out of
sixteen) difference in comprehension scores between the first and second reading task.
The variability was less pronounced within the 50 % around sample means.
The difference between the 25th and 75th percentile in comprehension was 3 score
points. For reading time this difference was 2 minutes and 10 seconds in the control
condition and 1 minute 17 seconds in the ego-threat task. The difference between the
25th and 75th percentile for time spent on regressions was around 1 minute and a half
in both conditions. For most reading variables, variability was greater in the control
condition compared to the ego-threatening task.
Table 3.5 Chosen descriptive statistics of reading and efficiency measures
Control
Ego-threat
min. max. M SD
min. max. M SD
Comprehension 9.00 16.00 12.46 1.92
5.00 15.00 11.79 2.58
Compr./total time 5.79 13.06 9.33 1.58
3.99 12.20 9.07 2.07
Total reading time (s) 196 554 340 83
172 473 302 72
Time regressions (s) 32 331 171 69
25 321 141 70
Regr. to total time (%) 16.3 65.4 48.5 11.4
10.0 68.2 44.4 14.0
N fixations 726 1954 1265 291
699 1762 1134 266
N regressive fix. 174 636 387 102
180 569 346 101
Testing hypotheses 3.4
3.4.1 Statistic models and assumptions Separate 2 (anxiety) × 2 (experimental condition) mixed ANOVAs were used to
assess the effect of anxiety on various reading measures.
The assumption of homogeneity of variance, tested using Levene’s test, was
violated in several of the analyses. Since the group sizes were nearly equal (NHA = 16,
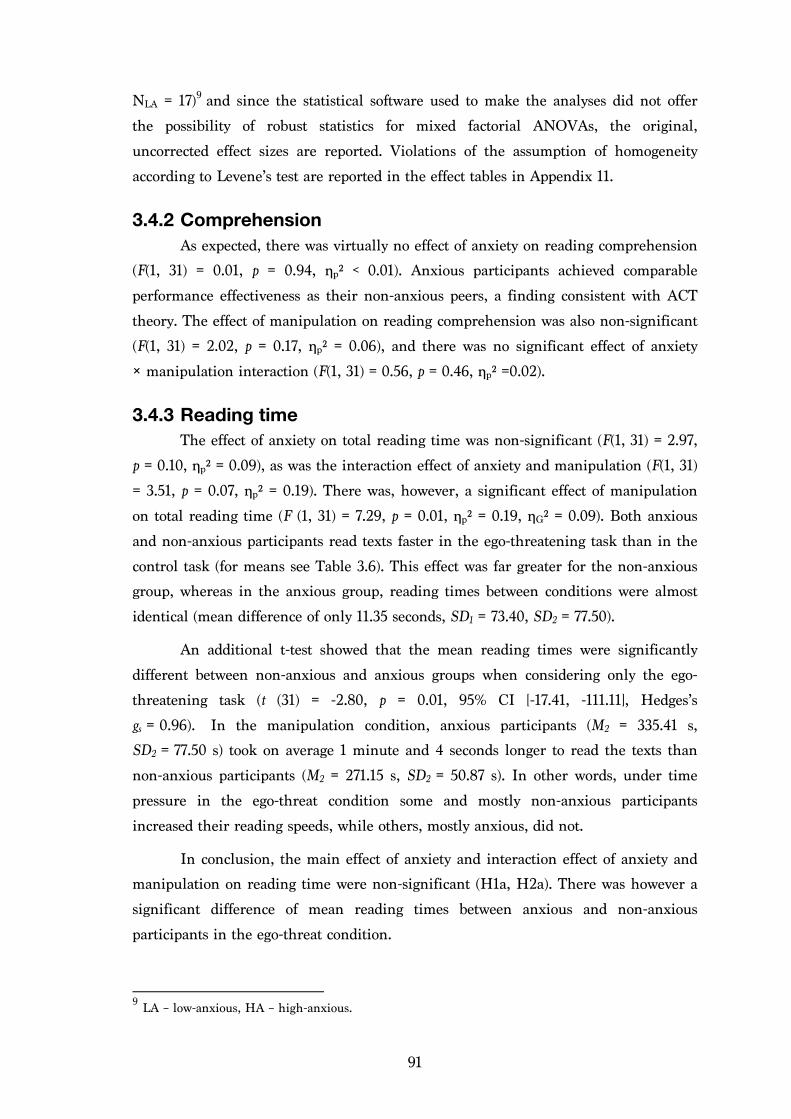
91
NLA = 17)9 and since the statistical software used to make the analyses did not offer
the possibility of robust statistics for mixed factorial ANOVAs, the original,
uncorrected effect sizes are reported. Violations of the assumption of homogeneity
according to Levene’s test are reported in the effect tables in Appendix 11.
3.4.2 Comprehension As expected, there was virtually no effect of anxiety on reading comprehension
(F(1, 31) = 0.01, p = 0.94, ηp² < 0.01). Anxious participants achieved comparable
performance effectiveness as their non-anxious peers, a finding consistent with ACT
theory. The effect of manipulation on reading comprehension was also non-significant
(F(1, 31) = 2.02, p = 0.17, ηp² = 0.06), and there was no significant effect of anxiety
× manipulation interaction (F(1, 31) = 0.56, p = 0.46, ηp² =0.02).
3.4.3 Reading time The effect of anxiety on total reading time was non-significant (F(1, 31) = 2.97,
p = 0.10, ηp² = 0.09), as was the interaction effect of anxiety and manipulation (F(1, 31)
= 3.51, p = 0.07, ηp² = 0.19). There was, however, a significant effect of manipulation
on total reading time (F (1, 31) = 7.29, p = 0.01, ηp² = 0.19, ηG² = 0.09). Both anxious
and non-anxious participants read texts faster in the ego-threatening task than in the
control task (for means see Table 3.6). This effect was far greater for the non-anxious
group, whereas in the anxious group, reading times between conditions were almost
identical (mean difference of only 11.35 seconds, SD1 = 73.40, SD2 = 77.50).
An additional t-test showed that the mean reading times were significantly
different between non-anxious and anxious groups when considering only the ego-
threatening task (t (31) = -2.80, p = 0.01, 95% CI [-17.41, -111.11], Hedges’s
gs = 0.96). In the manipulation condition, anxious participants (M2 = 335.41 s,
SD2 = 77.50 s) took on average 1 minute and 4 seconds longer to read the texts than
non-anxious participants (M2 = 271.15 s, SD2 = 50.87 s). In other words, under time
pressure in the ego-threat condition some and mostly non-anxious participants
increased their reading speeds, while others, mostly anxious, did not.
In conclusion, the main effect of anxiety and interaction effect of anxiety and
manipulation on reading time were non-significant (H1a, H2a). There was however a
significant difference of mean reading times between anxious and non-anxious
participants in the ego-threat condition.
9 LA – low-anxious, HA – high-anxious.

92
3.4.4 Eye-movement events The main effect of anxiety across the majority of eye-movement measures was
non-significant, with the exception of the measure of saccades (F(1, 31) = 6.62, p =
0.015, ηp² = 0.18). This exception might have been accidental, considering that there
was no such effect for the other, closely related, measures (see section 3.3 Relations
between reading variables).
Anxiety did however have a significant effect in interaction with the
experimental condition on the number of fixations (F(1, 31) = 4.78, p = 0.036, ηp² =
0.13, ηG² = 0.06) and the number of regressive fixations (F(1, 31) = 6.12, p = 0.019,
ηp² = 0.17, ηG² = 0.06) participants made (see Figures 3.2 and 3.3.) Low anxious
individuals made fewer fixations in the ego-threat task than in the control condition
(ΔM = 233, SD1 = 334, SD2 = 183), creating a significant difference between themselves
and their high anxious peers in the ego-threat condition (ΔM = 209, SDLA2 = 183,
SDHA2 = 301). The direction of the interaction effect of manipulation and anxiety was
analogical for regressive fixations.
Table 3.6
Means of reading measures for anxious and non-anxious groups
Control
Ego-threat
LA HA
LA
HA
M SD M SD
M SD
M SD
Comprehension 12.65 2.00
12.25 1.88
11.65 2.80
11.94 2.41
Total reading time (s) 334 94
347 73
271 51
335 78
N fixations 1265 339
1264 242
1032 183
1242 301
N regressive fix. 391 131
383 63
313 94
381 99
N saccades* 962 289
1032 167
790 149
1000 185
N regr. saccades 272 101 290 59
217 73
275 52
Note. LA - Low anxious group, N = 17. HA - High anxious group, N = 16. ** Main effect of anxiety was significant at the 0.01 level. * Main effect of anxiety was significant at the 0.05 level.
In reference to the postulated hypotheses, it was not confirmed that anxious
individuals make significantly more fixations than non-anxious (H1b), but there was a
significant difference in the number of fixations between high and low anxious
individuals in the ego-threat condition (H2b).
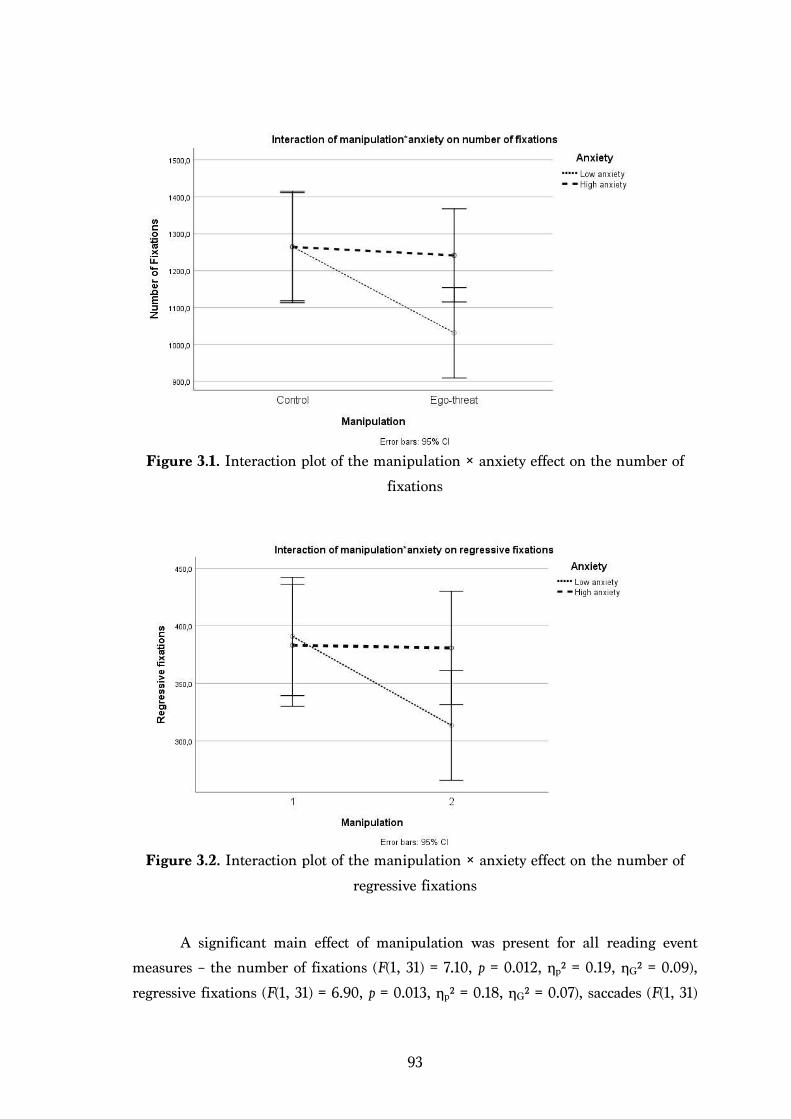
93
Figure 3.1. Interaction plot of the manipulation × anxiety effect on the number of
fixations
Figure 3.2. Interaction plot of the manipulation × anxiety effect on the number of
regressive fixations
A significant main effect of manipulation was present for all reading event
measures – the number of fixations (F(1, 31) = 7.10, p = 0.012, ηp² = 0.19, ηG² = 0.09),
regressive fixations (F(1, 31) = 6.90, p = 0.013, ηp² = 0.18, ηG² = 0.07), saccades (F(1, 31)

94
= 4.78, p = 0.036, ηp² = 0.13, ηG² = 0.08) and regressive saccades (F(1, 31) = 6.07,
p = 0.019, ηp² = 0.16, ηG² = 0.08). Participants made less eye-movements on average
in the ego-threatening condition as opposed to the control. These differences are
larger for the non-anxious group (see Table 3.6 for means and SDs).
3.4.5 Time spent on regressions Anxiety had a significant main effect on all measures relating to large
regressions. Anxious participants spent significantly more time on regressions (F(1, 31)
= 7.38, p = 0.01, ηp² = 0.19), large regressions (F(1, 31) = 8.81, p = 0.006, ηp² = 0.22) and
rereading (F(1, 31) = 8.65, p = 0.006, ηp² = 0.22) than their low-anxious peers in both
conditions. In the ego-threat condition, the main effect was amplified, since time
on regressions decreased for low-anxious participants.
The difference in regressions between low and high anxious participants
appeared stronger when expressed as the ratio of time spent on regressions to total
time (F(1, 31) = 10.27, p < 0.01, ηp² = 0.25). The effect was greatest for the ratio of large
regressions to total time (F(1, 31) = 13.03, p < 0.01, ηp² = 0.30). On average, large
regressions made up about 34.4% (control) and 27.5% (ego-threat) of reading time for
low anxious participants, whereas the proportions reached 43.7 % (control) and 44.8%
(ego-threat) for the high-anxious group. See table 3.7 for means and SDs.
Table 3.7
Means of regression measures for anxious and non-anxious groups
Control
Ego-threat
LA HA
LA HA
M SD M SD M SD M SD
Time regressions (s)* 158 82
184 52
104 45
180 72
Time large regr. (s)** 125 80
153 50
78 41
156 70
Time rereading (s)** 119 80
151 50
73 43
149 71
Time small regr. (s) 33 16
30 12
26 13
24 10
N regr. estimate 72 33 70 14 62 27 66 20
Regr. to total time (%)** 44.7 13.6
52.5 6.9
37.2 12.4
52.1 11.6
Large regr. to total t (%)** 34.4 14.4
43.7 8.7
27.5 11.7
44.8 13.1
Rereading to total t (%)** 32.7 14.8
44.0 8.9
25.3 12.5
42.5 13.6
Small regr. to total t (%) 10.3 5.3 8.8 3.0 9.7 4.7 7.3 2.6
Note. LA - Low anxious group. N = 17. HA - High anxious group. N = 16. ** Main effect of anxiety was significant at the 0.01 level.
95
Anxious and non-anxious participants did not significantly differ in any
measures concerning small regressions. The main effect of anxiety was trivial and
non-significant for both the time spent on small regressions (F(1, 31) = 0.35, p = 0.558,
ηp² = 0.01) and the estimated number of regressions (F(1, 31) = 0.02, p = 0.888,
ηp² < 0.01). The effect was also absent for the measures of regressive fixations and
regressive saccades mentioned above. See Appendix 11 for a table of effect sizes of
anxiety on all reading measures.
Significant effects of manipulation appeared for the time spent on regressions
(F(1, 31) = 5.31, p = 0.028, ηp² = 0.15, ηG² = 0.07), and its sister variable the ratio of
regressions to total time (F(1, 31) = 4.60, p = 0.04, ηp² = 0.13, ηG² = 0.05). The effects of
manipulation on large and rereading regressions were non-significant. The largest
effect of manipulation appeared for time spent on small regressions (F(1, 31) = 11.90, p = 0.002, ηp² = 0.28, ηG² = 0.10). This seems to correspond with the present effects of
manipulation on eye-movement event measures, seeing that small regressions
correlate with these measures (see section 3.4). Participants spent less time on
regressions in the ego-threat condition, a difference for which low-anxious
participants are mostly responsible, although for small regressions the difference is
also present in the high-anxious groups (see table 3.7).
The interaction effects of anxiety and manipulation on regression variables
were near to significant. For time spent on regressions the interaction effect was F(1,
31) = 4.14 (p = 0.051, ηp² = 0.12). See Appendix 11.
Conclusion concerning time spent on regressions
As expected, there was a significant effect of anxiety on the time spent on
regressions (H1c). A significant effect was only present for measures involving large
regressions (of at least 15 letter spaces) and was non-significant for small regressions
and regressive eye-movements.
The mean difference of time spent on regressions between high and low-
anxious participants was larger in the ego-threat condition (ΔM = 76 s) than in the
control condition (ΔM = 26 s). However, the interaction of anxiety and manipulation
(H2c) was non-significant at the 0.95 confidence level (F(1, 31) = 4.14, p = 0.051, ηp² =
0.12).
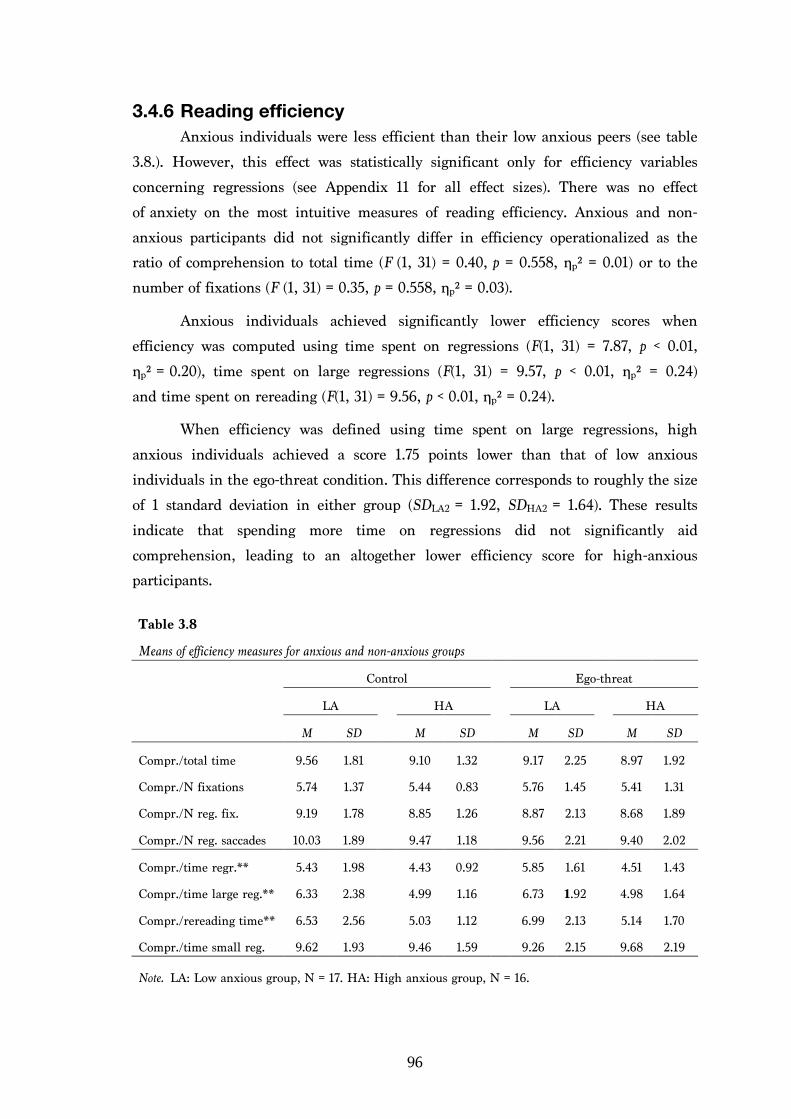
96
3.4.6 Reading efficiency Anxious individuals were less efficient than their low anxious peers (see table
3.8.). However, this effect was statistically significant only for efficiency variables
concerning regressions (see Appendix 11 for all effect sizes). There was no effect
of anxiety on the most intuitive measures of reading efficiency. Anxious and non-
anxious participants did not significantly differ in efficiency operationalized as the
ratio of comprehension to total time (F (1, 31) = 0.40, p = 0.558, ηp² = 0.01) or to the
number of fixations (F (1, 31) = 0.35, p = 0.558, ηp² = 0.03).
Anxious individuals achieved significantly lower efficiency scores when
efficiency was computed using time spent on regressions (F(1, 31) = 7.87, p < 0.01,
ηp² = 0.20), time spent on large regressions (F(1, 31) = 9.57, p < 0.01, ηp² = 0.24)
and time spent on rereading (F(1, 31) = 9.56, p < 0.01, ηp² = 0.24).
When efficiency was defined using time spent on large regressions, high
anxious individuals achieved a score 1.75 points lower than that of low anxious
individuals in the ego-threat condition. This difference corresponds to roughly the size
of 1 standard deviation in either group (SDLA2 = 1.92, SDHA2 = 1.64). These results
indicate that spending more time on regressions did not significantly aid
comprehension, leading to an altogether lower efficiency score for high-anxious
participants.
Table 3.8
Means of efficiency measures for anxious and non-anxious groups
Control
Ego-threat
LA HA
LA HA
M SD M SD M SD M SD
Compr./total time 9.56 1.81
9.10 1.32
9.17 2.25
8.97 1.92
Compr./N fixations 5.74 1.37
5.44 0.83
5.76 1.45
5.41 1.31
Compr./N reg. fix. 9.19 1.78
8.85 1.26
8.87 2.13
8.68 1.89
Compr./N reg. saccades 10.03 1.89 9.47 1.18 9.56 2.21 9.40 2.02
Compr./time regr.** 5.43 1.98
4.43 0.92
5.85 1.61
4.51 1.43
Compr./time large reg.** 6.33 2.38
4.99 1.16
6.73 1.92
4.98 1.64
Compr./rereading time** 6.53 2.56
5.03 1.12
6.99 2.13
5.14 1.70
Compr./time small reg. 9.62 1.93 9.46 1.59 9.26 2.15 9.68 2.19
Note. LA: Low anxious group, N = 17. HA: High anxious group, N = 16.
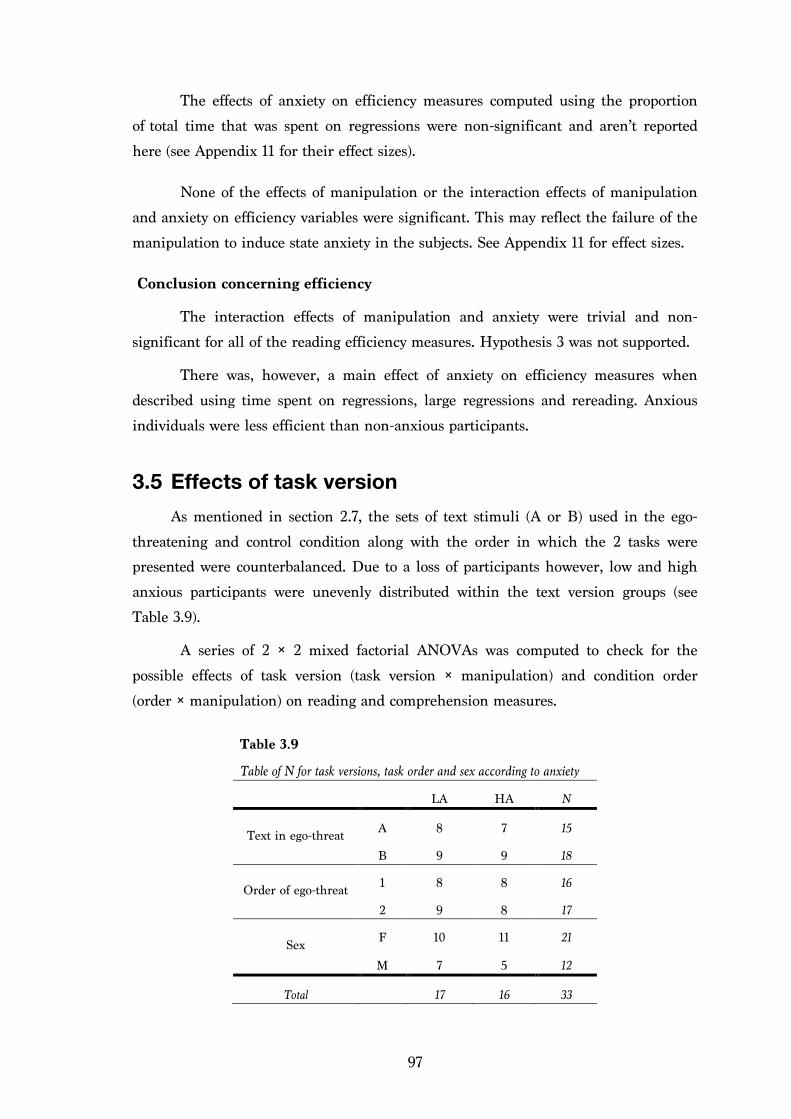
97
The effects of anxiety on efficiency measures computed using the proportion
of total time that was spent on regressions were non-significant and aren’t reported
here (see Appendix 11 for their effect sizes).
None of the effects of manipulation or the interaction effects of manipulation
and anxiety on efficiency variables were significant. This may reflect the failure of the
manipulation to induce state anxiety in the subjects. See Appendix 11 for effect sizes.
Conclusion concerning efficiency
The interaction effects of manipulation and anxiety were trivial and non-
significant for all of the reading efficiency measures. Hypothesis 3 was not supported.
There was, however, a main effect of anxiety on efficiency measures when
described using time spent on regressions, large regressions and rereading. Anxious
individuals were less efficient than non-anxious participants.
Effects of task version 3.5As mentioned in section 2.7, the sets of text stimuli (A or B) used in the ego-
threatening and control condition along with the order in which the 2 tasks were
presented were counterbalanced. Due to a loss of participants however, low and high
anxious participants were unevenly distributed within the text version groups (see
Table 3.9).
A series of 2 × 2 mixed factorial ANOVAs was computed to check for the
possible effects of task version (task version × manipulation) and condition order
(order × manipulation) on reading and comprehension measures.
Table 3.9
Table of N for task versions, task order and sex according to anxiety
LA HA N
Text in ego-threat A 8 7 15
B 9 9 18
Order of ego-threat 1 8 8 16
2 9 8 17
Sex F 10 11 21
M 7 5 12
Total 17 16 33
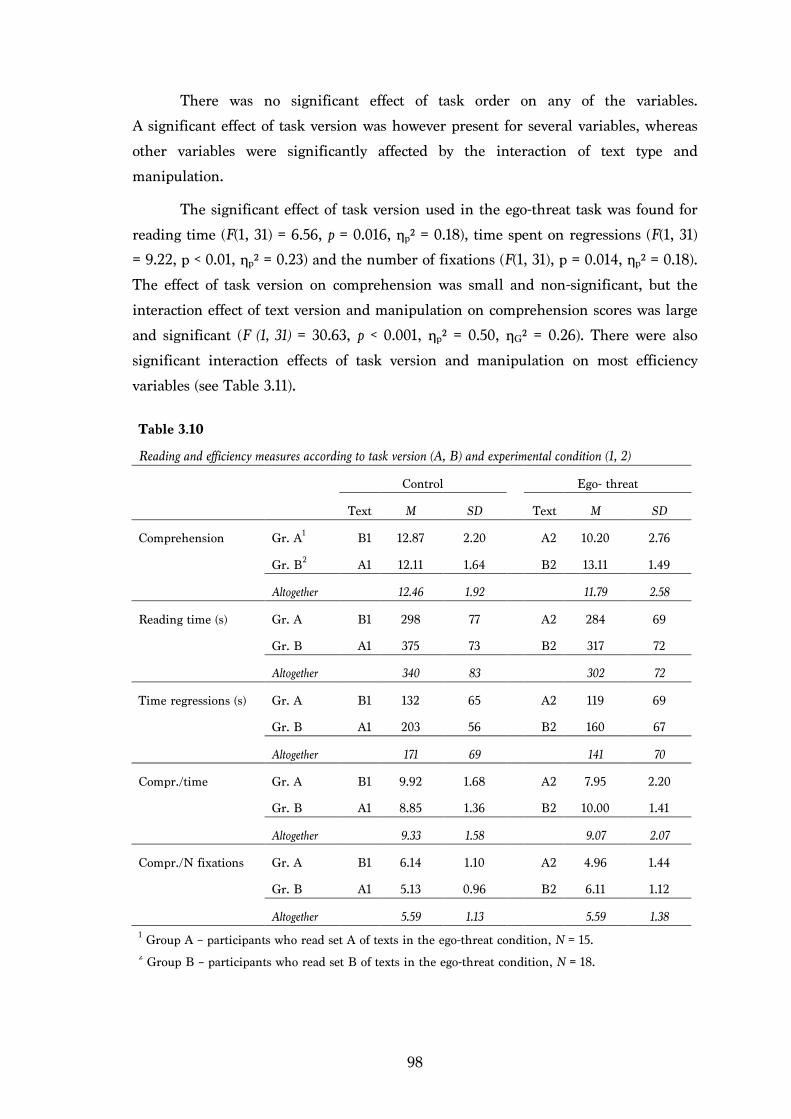
98
There was no significant effect of task order on any of the variables.
A significant effect of task version was however present for several variables, whereas
other variables were significantly affected by the interaction of text type and
manipulation.
The significant effect of task version used in the ego-threat task was found for
reading time (F(1, 31) = 6.56, p = 0.016, ηp² = 0.18), time spent on regressions (F(1, 31)
= 9.22, p < 0.01, ηp² = 0.23) and the number of fixations (F(1, 31), p = 0.014, ηp² = 0.18).
The effect of task version on comprehension was small and non-significant, but the
interaction effect of text version and manipulation on comprehension scores was large
and significant (F (1, 31) = 30.63, p < 0.001, ηp² = 0.50, ηG² = 0.26). There were also
significant interaction effects of task version and manipulation on most efficiency
variables (see Table 3.11).
Table 3.10
Reading and efficiency measures according to task version (A, B) and experimental condition (1, 2)
Control
Ego- threat
Text M SD Text M SD
Comprehension Gr. A1 B1 12.87 2.20
A2 10.20 2.76
Gr. B2 A1 12.11 1.64
B2 13.11 1.49
Altogether 12.46 1.92 11.79 2.58
Reading time (s) Gr. A B1 298 77
A2 284 69
Gr. B A1 375 73
B2 317 72
Altogether 340 83 302 72
Time regressions (s) Gr. A B1 132 65
A2 119 69
Gr. B A1 203 56
B2 160 67
Altogether 171 69 141 70
Compr./time Gr. A B1 9.92 1.68
A2 7.95 2.20
Gr. B A1 8.85 1.36
B2 10.00 1.41
Altogether 9.33 1.58 9.07 2.07
Compr./N fixations Gr. A B1 6.14 1.10
A2 4.96 1.44
Gr. B A1 5.13 0.96
B2 6.11 1.12
Altogether 5.59 1.13 5.59 1.38 1 Group A – participants who read set A of texts in the ego-threat condition, N = 15.
2 Group B – participants who read set B of texts in the ego-threat condition, N = 18.

99
When comparing scores between groups (see Table 3.10), the differences
showed that participants found set A more difficult than set B. Altogether, they
achieved lower comprehension scores in version A and also spent more time reading
it, made more regressions and achieved lower reading efficiency than in task version
B.
The most important question to answer is whether this effect of text version
may have biased the effects of anxiety on reading variables found in the analyses
described above. This is especially important considering that the groups were uneven.
The group with task version A in the control condition consisted of 15 participants,
out of which only 7 belonged to the anxious group. Task version B in the ego-threat
condition was presented to 18 participants, with even low and high anxiety subgroups
(9 participants in each group). See table 3.9.
Seeing the direction of the effects and taking into consideration that group B
is altogether “more anxious” than group A, it seems improbable that the effects of task
version have confounded the effect of anxiety detected in analyses reported above.
Additional 2 × 2 × 2 (task version × anxiety × manipulation) ANOVAs
confirmed that anxiety effects on primary reading variables prevailed when task
version was entered into the model10 . The interaction of task version × anxiety
× manipulation was significant for reading time (F (1, 29) = 4.74, p = 0.038,
ηp² = 0.23), the number of fixations (F (1, 29) = 5.84, p = 0.022, ηp² = 0.17) and time
spent on large regressions (F (1, 29) = 4.87, p = 0.035, ηp² = 0,14). The interaction was
also significant for reading efficiency expressed using time spent on regressions
(F(1, 29) = 4.31, p = 0.047, ηp² = 0.23) and time spent rereading (F(1, 29) = 4.74,
p = 0.038, ηp² = 0.23).
Table 3.11
Text variety × manipulation interaction effects for variables of efficiency
Efficiency defined as: F p ηp² ηG²
1. Compr./time
35.63 < 0.001 0.54 0.28
2. Compr./regress.
15.21 < 0.001 0.33 0.17
3. Compr./rereading
14.39 0.001 0.32 0.16
4. Compr./N fixations 34.02 < 0.001 0.52 0.27
5. Compr./regr. sacc. 31.55 < 0.001 0.50 0.28
10 2 × 2 × 2 ANOVAs were calculated only for selected variables, see table 3.12.
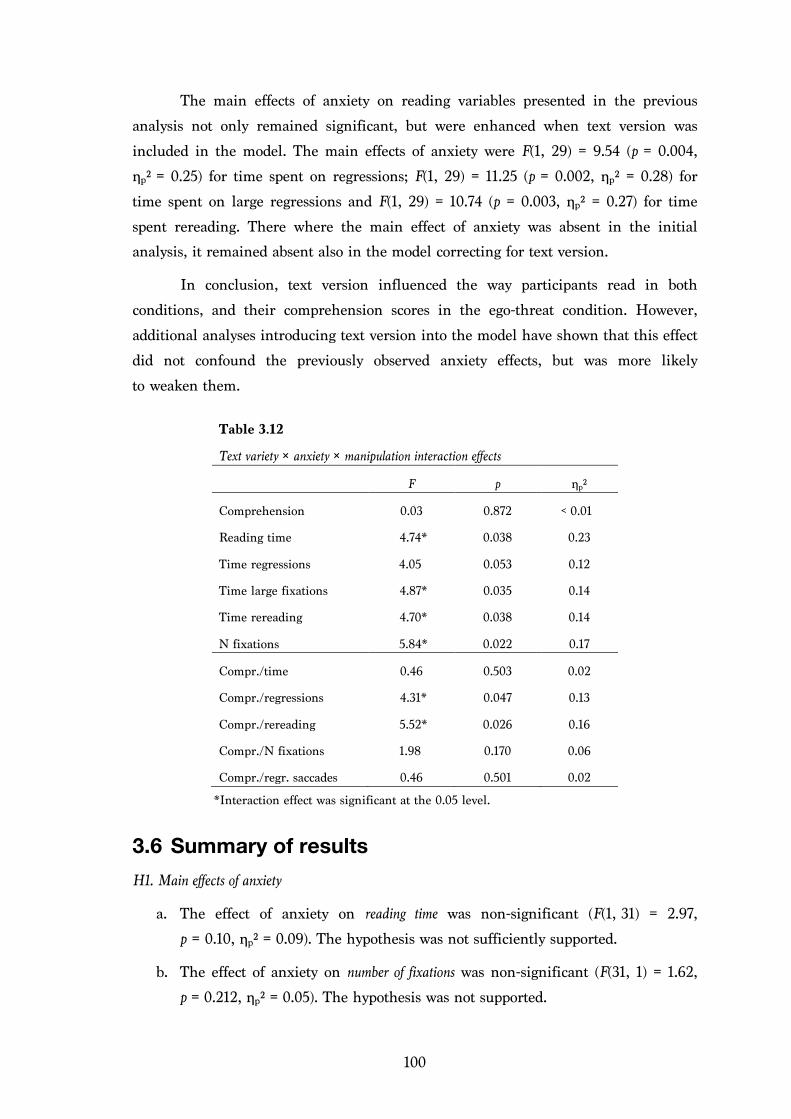
100
The main effects of anxiety on reading variables presented in the previous
analysis not only remained significant, but were enhanced when text version was
included in the model. The main effects of anxiety were F(1, 29) = 9.54 (p = 0.004,
ηp² = 0.25) for time spent on regressions; F(1, 29) = 11.25 (p = 0.002, ηp² = 0.28) for
time spent on large regressions and F(1, 29) = 10.74 (p = 0.003, ηp² = 0.27) for time
spent rereading. There where the main effect of anxiety was absent in the initial
analysis, it remained absent also in the model correcting for text version.
In conclusion, text version influenced the way participants read in both
conditions, and their comprehension scores in the ego-threat condition. However,
additional analyses introducing text version into the model have shown that this effect
did not confound the previously observed anxiety effects, but was more likely
to weaken them.
Table 3.12
Text variety × anxiety × manipulation interaction effects
F p ηp²
Comprehension 0.03 0.872 < 0.01
Reading time 4.74* 0.038 0.23
Time regressions 4.05 0.053 0.12
Time large fixations 4.87* 0.035 0.14
Time rereading 4.70* 0.038 0.14
N fixations 5.84* 0.022 0.17
Compr./time 0.46 0.503 0.02
Compr./regressions 4.31* 0.047 0.13
Compr./rereading 5.52* 0.026 0.16
Compr./N fixations 1.98 0.170 0.06
Compr./regr. saccades 0.46 0.501 0.02
*Interaction effect was significant at the 0.05 level.
Summary of results 3.6H1. Main effects of anxiety
a. The effect of anxiety on reading time was non-significant (F(1, 31) = 2.97,
p = 0.10, ηp² = 0.09). The hypothesis was not sufficiently supported.
b. The effect of anxiety on number of fixations was non-significant (F(31, 1) = 1.62,
p = 0.212, ηp² = 0.05). The hypothesis was not supported.
101
c. There was a significant main effect of anxiety on time spent on regressions (F(1, 31)
= 7.87, p < 0.01, ηp² = 0.20). Anxious individuals spent more time returning to
previously read parts of the text in the control (ΔM = 26 s) and the ego-threat
condition (ΔM = 76 s).
d. There was a significant main effect of anxiety on the ratio of time spent on regressions to total time (F(1, 31) = 10.27, p < 0.01, ηp² = 0.25). Anxious participants
dedicated a greater proportion of their reading time to regressions than non-
anxious participants.
H2. Interaction effects of anxiety and manipulation on reading measures
a. The interaction effect of anxiety and manipulation on total reading time was non
significant (F(1, 31) = 3.51, p = 0.07, ηp² = 0.19). However, non-anxious
participants spent significantly less time on average than anxious participants
in the ego-threatening condition (ΔM = 64.26 s, t (31) = -2.80, p = 0.01, 95%
CI [-17.41, -111.11], Hedges’s gs = 0.96). The data therefore indicated the
expected effect but the effect was not strong enough to reject the null
hypothesis.
b. There was a significant interaction of manipulation and anxiety on the number of fixations (F (1, 31) = 4.78, p = 0.036, ηp² = 0.13, ηG² = 0.06). Anxious
individuals made more fixations in the ego-threat condition than non-anxious
participants.
c. The interaction effect of anxiety and manipulation on the time spent on regressions was non-significant (F (1, 31) = 4.14, p = 0.051, ηp² = 0.12).
d. The interaction effect of anxiety and manipulation on the ratio of time spent on regressions to total time was also non-significant (F (1, 31) = 3.69, p = 0.064,
ηp² = 0.11).
H3. Interaction effects of anxiety and manipulation on reading efficiency
H3 a. – c.: Interaction effects of anxiety and manipulation on all of the reading
efficiency measures were small and non-significant.
There was a significant main effect (F(1, 31) = 7.87, p < 0.01, ηp² = 0.20)
of anxiety on efficiency computed as the ratio of comprehension to time spent on regressions, with anxious individuals achieving lower efficiency scores than non-anxious
participants. The effect was, however, comparable between the two conditions.
102
The effect of anxiety on reading efficiency computed as the ratio
of comprehension to time spent on regressions, the most intuitive of the measures
of efficiency, was very small and non-significant (F(1, 31) = 0.40, p = 0.531, ηp² = 0.20).
Comprehension
In agreement with our expectations, the effect of anxiety on comprehension
scores was small and non-significant (F(1, 31) = 0.01, p = 0.94, ηp² < 0.01).
Task version effects
There were significant effects of task version on reading variables. Task version
A was more difficult for participants, and this effect was pronounced for the ego-
threat condition. This effect should not have confounded the previously observed
main effects of anxiety, but may have weakened them.
4 Qualitative manual analysis of regressive scanpaths The manual analysis of a subsample of regressive scanpaths was conducted as
a part of data exploration and also a necessary step in the development of regression-
computing software.
Small, large and rereading regressions were recognized as distinct reading events.
Small regressions had the length of 5 to 15 letter spaces and were usually made
immediately following the first pass reading of the given word or segment. A subtype
of small regressions was recognized, which we called “clusters”. Unlike simple small
regressions that returned to a word once and continued forward again, the eyes shifted
forward and back again multiple times in a cluster. Cluster regressions were often
located either around difficult or unusual words, or at the end of sentences and
paragraphs, indicating integration processes and sentence wrap-up (see Just
& Carpenter, 1980, also section 5.1 in part I). Large regressions (longer than 15 letter
spaces) usually occurred either as jumps to words on another line or as rereading
regressions. Within lines jumps without rereading were rather rare.
Other distinctions between regressions could potentially be made. There were
visible differences in the density of fixations in rereading regressions between readers.
This offered a possibility of differentiating between rereading (usual density of fixations)
and rescanning (less dense and shorter fixations). Correspondingly, first pass reading
103
could sometimes be considered first pass scanning. Whether reading the text again after
such scanning should be considered as a regression is disputable.
Regressive patterns
During the manual analysis of the scanpaths, distinct “regressive styles” could be
recognized. Our observations more or less corresponded with Goldman and Saul’s
(1990) global reading approaches. Goldman and Saul compared how students read
short structured texts in various signalling conditions. They identified three global
and local reading approaches. Similar global approaches could be recognized also
in our data.
The first global approach described by Goldman and Saul is Once Through. This
corresponds to a straightforward, direct reading of the entire text from start to finish.
The second approach, Review, was used when the subject read the entire passage once
through to the end and then returned to reread either part or all of the text. The
third approach was Regress. In this approach, rereading occurred before the reader
reached the end of the text.
Hyöna, Lorch, & Kaakinen (2002) explored individual differences in reading in
a task where the respondents’ aim was to make a summary of the expository text.
Hyöna and his colleagues identified four different types of readers. The first were fast linear readers. Their reading was characterized by the absence of regressions.
The second group were slow linear readers, which made many forward fixations and
reviewed each sentence before continuing onward. The third group were nonselective readers. These often looked back during their reading to previously viewed sentences.
The final group was named topic structure processors. Topic structure processors paid
increased attention to headings, and were found to have the largest working-memory
capacity and write the most accurate text summaries. The distinction between fast linear readers and slow linear readers could be also applied to scanpaths in our data.
In the analysed regressive scanpaths, we also recognized a difference in how
erratic or confused participants’ regressions seemed. Considering that erratic eye-
movements are associated with mindless reading (see section 6.2.5 in part I), it may be
that anxiety leads to an increase of this type of “chaotic” regressions. See Appendix 12
for selected images of various regressive scanpaths.

104
Conclusion
Regressions observed in participants’ scanpaths were diverse in a number
of characteristics. Regressions do not constitute a unified measure because they
correspond to many distinct events, strategies, intentions, etc. In order to gain a more
precise understanding of how anxiety affects anxious readers, causing them to spend
more time on reading regressions, further analysis and operationalization of the types
of regressive events is needed. To truly understand how anxiety influences regressions,
measures including the function of regressions, and not only their amount and
durations, would be helpful.
Many questions arise from the present analysis: Which kind of regressions
is most responsible for the differences between low and high anxious subjects? How
do regressions change under state anxiety? Do individuals high in trait anxiety tend to
use different reading strategies than low-anxious individuals, regardless of the current
level of state anxiety? Is anxiety associated with how erratic regressions are?
Are regressions more often the result of strategic choice, or rather the result
of comprehension difficulties or mindless reading? Future studies may lead to a better
understanding of why anxious individuals make more regressions when they read.
5 Discussion The present study successfully replicated some of the effects from previous studies,
which are in agreement with the ACT theory. The effect of anxiety on comprehension
was non significant. Anxious and non-anxious participants achieved comparable
comprehension scores, which is in line with ACT’s premise that anxiety does not
primarily affect performance effectiveness.
There was a main effect of anxiety on time spent on regressions. Anxious
participants spent more time on regressions, large regressions and rereading than
their non-anxious peers in both conditions. The difference was stronger when
regressions were described in proportion to total reading time. Moreover, anxious
participants’ reading efficiency was lower than that of non-anxious subjects when
efficiency was calculated using these regressive measures. This can be interpreted as
the negative effect of anxiety on processing efficiency, as Calvo and his colleagues
interpret it in their study (1994b).
Several expected effects were non-significant in this study, namely the effect
of anxiety on total reading time and on the number of fixations, observed in previous
105
studies (Dizney, Rankin, & Johnston, 1969; Calvo et al., 1994), were both non-
significant. Even in Calvo et al.’s study however, these effects were significant only
in some of the experiments. The effect may perhaps be weakened by the variability
of reading time scores and fixation counts in non-threatening conditions, and/or there
may be some yet undescribed moderating variables of the effect of anxiety on reading
time. While the main effects of dispositional anxiety on total reading time and the
number of fixations were non-significant, the main effects of anxiety on efficiency computed as the ratio of comprehension to total reading time and to the time spent on
fixations were close to zero. This indicates that anxious individuals were no less
efficient than non-anxious in the most intuitive of efficiency measures.
The absence of significant effects of anxiety x manipulation interactions in this
study are most likely the result of manipulation failure. As indicated by the results
of the manipulation check and that of the main statistical analysis, ego-threatening
instructions had only a minor effect on the participants. The scores of the high-
anxious group indicate that anxious individuals may have felt increased anxiety
in both the control and ego-threatening condition. The experimental procedure itself
can be anxiety inducing, considering it occurs in a laboratory settings and participants
have to read with their head fixed in an eye-tracking tower. Whichever the case, the
difference between the two experimental conditions was not sufficiently large in order
to examine the difference in how anxious and non-anxious participants read under
considerably different levels of state anxiety.
The effect of manipulation on low-anxious 5.1participants Although it was hypothesized that the difference between anxious and non-
anxious individuals would be greater in the ego-threat condition than in the control
condition, it was, surprisingly, non-anxious participant who were responsible for the
difference where it was present. In the ego-threatening condition, low-anxious subjects
read faster, made less fixations and regressions, while achieving only slightly lower
comprehension scores than in the control.
There are several possible explanations of this effect. One of the explanations
may be the already mentioned possibility that the ego-threat condition did not have
an effect on high-anxious individuals in comparison to the control because anxious
participants experienced state anxiety in both tasks. Non-anxious individuals, on the
other hand, were not anxious in the control task, and therefore the difference between
the two tasks was greater.

106
The second possible explanation is that the difference between the control and
experimental condition for low-anxious participants may not have been the result of
increased anxiety in the ego-threat condition, but rather of increased motivation. The
ego-threatening instructions stressed the importance of speed in the task while
achieving the best possible comprehension score, and the inclusion of a countdown
before each text created time pressure. For non-anxious participants, it is easy to
interpret these instructions as challenging rather than threatening. Non-anxious
participants may have felt more motivated in the ego-threat condition, resulting in
faster reading and a decrease in regressions.
A third factor that may play a part in this observed effect is that of task strategy. It is possible that the differences between low and high anxious participants reflect
a preference for risk in the non-anxious participants and a preference of certainty in
anxious subjects. Applied in the study’s context, it may be that low-anxious
individuals decided to opt for a reading strategy that prioritizes speed, whereas high-
anxious individuals chose a strategy favouring precision. The failure of anxious
subjects to increase their speed in the ego-threatening condition may reflect
an inability of high-anxious individuals to flexibly adapt their reading strategy. This
would correspond with ACT’s postulate that anxiety has a negative effect on the
shifting functions of the central executive. The differences on which these
assumptions are based however are small, and the effects would need to be replicated
in order for the assumptions to gain importance. For the present moment, they may
serve as suggestions for future research.
The proposed explanations are not antagonistic. The anxiety-performance
relationship is known to have many moderator (see section 3.3 in part I.), and all
of the suggested factors may play a role
Does an increase in time spent on regressions 5.2correspond to lower reading efficiency? The only measures of reading efficiency significantly affected by anxiety were
those comparing comprehension to the time spent on regressions. The effects
of anxiety on efficiency adjusted to total reading time and to the number of fixations
were non-significant and negligible in size.
It is possible that real effects were masked in this study due to a small sample
size, unintended effects of text variety and the unsuccessful manipulation of state
anxiety. Moreover, the effects of anxiety on reading time and the number of fixations
were nearly significant. On the other hand, Calvo and his colleagues (1994) yielded
107
similarly ambivalent results concerning the differences of anxious and non-anxious
participants in total reading time.
However, it remains a question whether the amount of time spent on
regressions is a valid indicator of processing efficiency. Since individuals that regress
may spend an equal amount of time and make an equal amount of fixations during
their reading in order to achieve the same comprehension scores as non-regressors,
spending more time on regressions may just be an alternative, equally efficient
reading strategy. It is also possible that making regressions does, in fact, use
up a greater amount of cognitive resources than more direct reading patterns, but
there is no empirical evidence at the moment to support this assumption.
Moreover, distinct reading patterns were recognized during manual scanpath
exploration even within individuals who spent more time on regressions. Some
regressive paths were direct, while others were erratic and chaotic. Let us consider
two readers. One reads the text once through at a quick pace and then returns to the
beginning and reads it a second time, in a similarly direct fashion as the first time.
The second reader reads the text only once at a much slower pace, with a greater
amount of fixations and small regressions. If their reading times and comprehension
scores are equivalent, is it justifiable to regard the first reader as less efficient than
the second?
Further research is needed to explore differences in reading style, reading
strategy and situation-specific reading events. Due to significant inter- and intra-
individual differences in reading, comparing the eye-movements of a large sample of
readers in a sufficient amount of texts would yield the most informative results.
To differentiate between the effects of a more stable reading style or strategy and those
of state anxiety on eye movements, achieving a significant difference in state anxiety
between conditions is necessary.
A second look at regressions 5.3One of the aims of this study was to examine the reading regressions that
anxious readers make. Several types of regressions were identified on the basis of
manual data exploration, enabling the creation of separate measures of time spent on
regressions. These separate measures were large regressions, small regressions and re-
reading regressions. Eye tracking also allowed for measures of the number of
regressive eye-movements, i.e regressive saccades and fixations (described in section
2.4.4).
108
Data analysis revealed that large regressions and rereading regressions make
up the majority of time spent on regressions. Small regressions, on the other hand,
are related to regressive eye-movements. Anxiety significantly affected the amount
of large regressions, most of which were also re-reading regressions. Smaller
regressive events were not affected by anxiety.
These findings suggest that the difference between anxious and non-anxious
participants is not associated with eye-movement control or lower word-level cognitive
processes. The data indicate it is more likely that anxiety affects higher-level cognitive
processes, associated with sentence integration and the making of inferences.
The prevalence of long rereading regressions does not seem to reflect a process
of returning to specific words that were lost from working memory due
to an increased working memory load in anxious participants. It is possible, however,
that increased working memory load leads to comprehension failures, inducing
participants to reread entire passages. But there are also alternative explanations as
to what causes the difference of regressive behaviour in anxious and non-anxious
participants. Rereading could also result from mindless reading or from a difference
in reading strategy.
The proposition that the difference between anxious and non-anxious readers
may have to do with distinct reading strategies was already mentioned above. Support
for this assumption comes from the manual exploration of regressive scanpaths
(see section 4). Reading a text twice just as quickly from the beginning to the end does
not seem like the result of comprehension difficulties or increased working memory
load. Regressions have also been known to increase comprehension (see Schottter,
Tran, & Rayner, 2014). A more regressive strategy may be used to make preliminary
inferences in first pass reading, and confirming these first assumptions during second
pass reading.
Study limitations 5.4The results reported in this study may have been biased in several ways. The
effect of task version has been explained and may have resulted in the masking of
existing effects. Unequal numbers of anxious and non-anxious participants within the
task version groups due to data loss may have been the source of additional bias.
The main limitation of this study is the already mentioned insufficiency of the
experimental manipulation. Attaining a sufficient difference of state anxiety between
the control and manipulation is necessary for understanding the direct effects of state

109
anxiety on reading measures for anxious and non-anxious participants. The fact that
the experimental manipulation of anxiety did not succeed in inducing a significant
level of state anxiety also complicates the interpretation of results. Both of the reading
tasks may have been anxiety-inducing for high-anxious individuals.
For manipulation to be more successful, participants needed for the risk
of failure to be of greater importance than it was in the experimental situation.
To successfully induce ego-threat, telling the participants they would see their results
in comparison with others at the end of the task and giving them false feedback,
would most probably achieve better results. Participants could also be told that their
results were part of a group score, or that their performance might effect the success
of the research itself, which would then lead them to feel under greater pressure.
A set time limit could also be employed to increase time pressure. The task goal for
the participant would then be to read as many short texts and correctly respond to
as many comprehension questions as possible.
The results may not be generalizable to “normal” reading due to the unnatural
reading conditions. The participants read with their heads fixed in an eye-tracking
device and the experiment took place in a laboratory setting in the presence of an
experimenter. This may have mostly influenced anxious participants. The increased
difficulty of the chosen texts may have lead participants to make more regressions
than they would in regular reading. A more extensive pilot study of the selected texts
could have achieved higher task version comparability.
Several effects were indicated in the expected direction but were non-significant.
This could have been prevented by analysing data of a larger sample
size. The intended sample size was not achieved due to invited participants not
coming to the second experimental part of the study and due to data loss caused by
calibration and other technical failures.
Another limitation of the study is that only summed scores for all seven texts
of a task were analysed. A text-level analysis would have reduced potential effects of
text differences across tasks and increased statistical power of the analyses. Also, the
texts used as stimuli were difficult not only in structure, but also in their topics and
the vocabulary used, as was mentioned by several participants in their feedback.
It may be a better design strategy to artificially create structurally difficult texts
concerning familiar and simple topics, and thus minimize potential between-subject
differences in topic familiarity.
110
Implications for future research 5.5
As already mentioned above, future research examining the effect of anxiety on
reading should focus more on assessing participants’ reading strategies. A more
functional analysis of regressions, describing regressions according to their purpose in
reading, would help clarify what leads anxious participants to regress. A word level
analysis of eye-movements preceding regressions could indicate to what degree
mindless reading is the cause of regressions. To better assess the direct influence of
state anxiety on reading measures, it may be helpful to use online indicators of
anxiety simultaneously with online eye tracking.

111
Conclusion The results of the present study successfully replicated the effect of anxiety on
time spent on regressions, observed in a previous study by Calvo et al. (1994b). Eye-
tracking technology enabled us to specify that the observed regressions mostly served
to reread text passages. Anxious participants spent more time on regressions, large
regressions and rereading regressions than their low-anxious peers. There was
no difference in comprehension between anxious and non-anxious participants.
The effects of anxiety on reading time were non-significant and they were
negligible for reading efficiency computed as the ratio of comprehension to total
reading time. This has called into question the adequacy of using time spent on
regressions as an indicator of reading efficiency. A manual exploration of reading
scanpaths indicated that there are many distinct processes causing regressions
in reading and the amount of time spent on regressions may also be the consequence
of a participant’s reading strategy.
The study represents only a very small step towards describing and clarifying the
relationship of anxiety and reading. It does, however, offer a framework for future
designs that aim to explore the effects of anxiety on reading regressions. Its principal
implications for future research are the need to focus on reading strategies and
to investigate the possible link of regressions and mindless reading.
The differentiation of various types of regressions and the development of software for
computing time spent on rereading may prove useful for future researchers interested
in this topic. It is the author’s hope that this thesis will incite this interest and bring
attention to a small area of research that lay dormant for nearly two decades.

112
References
Allsop, J., & Gray, R. (2014). Flying under pressure: Effects of anxiety on attention and gaze behavior in aviation. Journal of Applied Research in Memory and Cognition, 3(2), 63–71.
Ansari, T. L., & Derakshan, N. (2011). The neural correlates of cognitive effort in anxiety: Effects on processing efficiency. Biological Psychology, 86(3), 337–348.
Anxiety. (2015). In G. R. VandenBos (Ed.), APA dictionary of psychology. 2nd edition. Washington, DC: American Psychological Association.
Appraisal. (2015). In G. R. VandenBos (Ed.), APA dictionary of psychology. 2nd edition. Washington, DC: American Psychological Association.
Atkinson, J. W., Raynor, J. O. (1974). Motivation and Achievement. New York: Halsted.
Baddeley, A. D. (1966). Influence of depth on the manual dexterity of free divers: A comparison between open sea and pressure chamber testing. Journal of Applied Psychology, 50(1), 81–85.
Baddeley, A. D. (1979). Working memory and reading. In P.A. Kolers, M. E. Wrolstad, & H. Bouma (eds), Processing of visible language (pp. 355-370). Boston, MA: Springer.
Baddeley, A. D. (1986). Working memory. Oxford: Oxford University Press.
Baddeley, A. D. (2000). The episodic buffer: a new component of working memory? Trends in Cognitive Sciences, 4(11), 417–423.
Baddeley, A. D. (2007). Working memory, thought, and action. Oxford: Oxford University Press.
Baddeley, A. D., & Fleming, N. C. (1967). The efficiency of divers breathing oxy-helium. Ergonomics, 10(3), 311–319.
Baddeley, A. D., & Hitch, G. (1974). Working memory. Psychology of Learning and Motivation 8, 47–89.
Baddeley, A. D., Bressi, S., Della Sala, S., Logie, R. and Spinnler, H. (1991). The decline of working memory in Alzheimer’s disease: a longitudinal study. Brain, 114, 2521–2542.
Baddeley, A. D., Della Sala, S., Papagno, C. and Spinnler, H. (1997). Dual task performance in dysexecutive and non-dysexecutive patients with a frontal lesion. Neuropsychology, 11(2), 187–194.
Bar-Haim, Y., Kerem, A., Lamy, D., & Zakay, D. (2010) When time slows down: The influence of threat on time perception in anxiety. Cognition and Emotion, 24(2), 255–263.
Bar-Haim, Y., Lamy, D., Pergamin, L., Bakermans-Kranenburg, M. J., & Van Ijzendoorn, M. H. (2007). Threat-related attentional bias in anxious and nonanxious individuals: a meta-analytic study. Psychological Bulletin, 133(1), 1–24.
Bar‐Haim, Y. (2010). Research review: attention bias modification (ABM): a novel treatment for anxiety disorders. Journal of Child Psychology and Psychiatry, 51(8), 859–870.
Bateson, M., Brilot, B., & Nettle, D. (2011). Anxiety: an evolutionary approach. The Canadian Journal of Psychiatry, 56(12), 707–715.
113
Beck, A. T., & Clark, D. A. (1997). An information processing model of anxiety: Automatic and strategic processes. Behaviour research and therapy, 35(1), 49–58.
Beck, A. T., Emery, G., & Greenberg, R. L. (1985). Anxiety disorders and phobias: A cognitive perspective. New York, NY: Basic Books.
Beesdo‐Baum, K., Jenjahn, E., Höfler, M., Lueken, U., Becker, E. S., & Hoyer, J. (2012). Avoidance, safety behavior, and reassurance seeking in generalized anxiety disorder. Depression and Anxiety, 29(11), 948–957.
Beilock, S. L., & Maloney, E. A. (2015). Math anxiety: A factor in math achievement not to be ignored. Policy Insights from the Behavioral and Brain Sciences, 2(1), 4–12.
Beilock, S. L., Gunderson, E. A., Ramirez, G., & Levine, S. C. (2010). Female teachers’ math anxiety affects girls’ math achievement. Proceedings of the National Academy of Sciences, 107(5), 1860–1863.
Beilock, S. L., Schaeffer, M. W., & Rozek, C. S. (2017). Understanding and addressing performance anxiety. In A. J. Elliot, C. S. Dweck, & D. S. Yeager (Eds.). Handbook of competence and motivation: Theory and application. New York: Guilford Press.
Berggren, N., & Derakshan, N. (2013). Attentional control deficits in trait anxiety: why you see them and why you don’t. Biological Psychology, 92(3), 440–446.
Berggren, N., Koster, E. H., & Derakshan, N. (2012). The effect of cognitive load in emotional attention and trait anxiety: An eye movement study. Journal of cognitive psychology, 24(1), 79–91.
Borella, E., Carretti, B., & Pelegrina, S. (2010). The specific role of inhibition in reading comprehension in good and poor comprehenders. Journal of Learning Disabilities, 43(6), 541–552.
Calvo, M. G. (1996). Phonological working memory and reading in test anxiety. Memory, 4(3), 289–306.
Calvo, M. G., & Carreiras, M. (1993). Selective influence of test anxiety on reading processes. British Journal of Psychology, 84(3), 375–388.
Calvo, M. G., & Dolores Castillo, M. (2001). Selective interpretation in anxiety: Uncertainty for threatening events. Cognition & Emotion, 15(3), 299–320.
Calvo, M. G., Eysenck, M. W., & Estevez, A. (1994). Ego-threat interpretive bias in test anxiety: On-line inferences. Cognition & Emotion, 8(2), 127–146.
Calvo, M. G., Eysenck, M. W., Ramos, P. M., & Jiménez, A. (1994). Compensatory reading strategies in test anxiety. Anxiety, Stress, and Coping, 7(2), 99–116.
Cannistraro, P. A., & Rauch, S. L. (2003). Neural circuitry of anxiety: Evidence from structural and functional neuroimaging studies. Psychopharmacology Bulletin, 37(4), 8–25.
Chapell, M. S., Blanding, Z. B., Silverstein, M. E., Takahashi, M., Newman, B., Gubi, A., & McCann, N. (2005). Test anxiety and academic performance in undergraduate and graduate students. Journal of Educational Psychology, 97(2), 268–274.
Chiappe, P., Siegel, L. S., & Hasher, L. (2000). Working memory, inhibitory control, and reading disability. Memory & Cognition, 28(1), 8–17.
Cisler, J. M., & Koster, E. H. (2010). Mechanisms of attentional biases towards threat in anxiety disorders: An integrative review. Clinical psychology review, 30(2), 203–216.
114
Clark, D. M. (1999). Anxiety disorders: Why they persist and how to treat them. Behaviour Research and Therapy, 37(1), S5–S27.
Clark, D. M., & Wells, A. (1995). A cognitive model of social phobia. In: Heimberg, Liebowitz, Hope, & Schneier (eds.). Social phobia: Diagnosis, assessment, and treatment (pp. 69-93). New York: Guilford Press.
Clark, R.D., III (2002). Do professional golfers ‘choke’? Perceptual and Motor Skills, 94, 1124-1130.
Clifton, C. (1992). Tracing the course of sentence comprehension: How lexical information is used. In K. Rayner (ed.). Eye Movements and Visual Cognition (pp. 397-414). New York, NY: Springer.
Craske, M. G., & Craig, K. D. (1984). Musical performance anxiety: The three-systems model and self-efficacy theory. Behaviour Research and Therapy, 22(3), 267–280.
Cristea, I. A., Kok, R. N., & Cuijpers, P. (2015). Efficacy of cognitive bias modification interventions in anxiety and depression: meta-analysis. The British Journal of Psychiatry, 206(1), 7–16.
Crocq, M. A. (2015). A history of anxiety: From Hippocrates to DSM. Dialogues in Clinical Neuroscience, 17(3), 319–325.
Crozier, W. R., & Hostettler, K. (2003). The influence of shyness on children's test performance. British Journal of Educational Psychology, 73(3), 317–328.
Daneman, M., & Carpenter, P. A. (1980). Individual differences in working memory and reading. Journal of Verbal Learning and Verbal Behaviour, 19, 450–466.
Darke, S. (1988). Effects of anxiety on inferential reasoning task performance. Journal of Personality and Social Psychology, 55(3), 499–505.
Davis, F. M., Osborne, J. P., Baddeley, A. D. and Graham, I. M. F. (1972). Diver performance: Nitrogen narcosis and anxiety. Aerospace Medicine, 43(10), 1079–1082.
Deffenbacher, J. L. (1977). Relationship of worry and emotionality to performance on the Miller Analogies Test. Journal of Educational Psychology, 69(2), 191–195.
Deffenbacher, J. L. (1978). Worry, emotionality, and task-generated interference in test anxiety: An empirical test of attentional theory. Journal of Educational Psychology, 70(2), 248–254.
Derakshan, N., & Eysenck, M. W. (2009). Anxiety, processing efficiency, and cognitive performance: New developments from attentional control theory. European Psychologist, 14(2), 168–176.
Derakshan, N., Ansari, T. L., Hansard, M., Shoker, L., & Eysenck, M. W. (2009). Anxiety, inhibition, efficiency, and effectiveness: An investigation using the antisaccade task. Experimental Psychology, 56(1), 48-55.
Derryberry, D., & Reed, M. A. (2002). Anxiety-related attentional biases and their regulation by attentional control. Journal of Abnormal Psychology, 111(2), 225–236.
Dickerson, S. S., Gruenewald, T. L., & Kemeny, M. E. (2004). When the social self is threatened: Shame, physiology, and health. Journal of Personality, 72(6), 1191–1216.
Dizney, H., Rankin, R., & Johnston, J. (1969). Eye-movement fixations in reading as related to anxiety in college females. Perceptual and Motor Skills, 28(3), 851–854.
Duchowski, A. (2007). Eye tracking methodology: Theory and practice. London: Springer-Verlag.
115
Duffy, S. A. (1992). Eye movements and complex comprehension processes. In K. Rayner (ed.). Eye Movements and Visual Cognition (pp. 462–471). New York, NY: Springer.
Ehring, T. (2014) Cognitive Theory. In P. Emmelkamp, T. Ehring (Eds.). The Wiley Handbook of Anxiety Disorders (pp. 104–124). Oxford: John Wiley & Sons.
Ehrlich, K., & Rayner, K. (1983). Pronoun assignment and semantic integration during reading: Eye movements and immediacy of processing. Journal of Verbal Learning and Verbal Behavior, 22(1), 75–87.
Emotion. (2015). In G. R. VandenBos (Ed.), APA dictionary of psychology. 2nd edition. Washington, DC: American Psychological Association.
Eysenck, M. (1982). Attention and arousal: Cognition and performance. New York, NY: Springer-Verlag.
Eysenck, M. W. (1984). Anxiety and the worry process. Bulletin of the Psychonomic Society, 22(6), 545–548.
Eysenck, M. W. (1992). Anxiety: The cognitive perspective. Hove, England: Psychology Press.
Eysenck, M. W., & Calvo, M. G. (1992). Anxiety and performance: The processing efficiency theory. Cognition & Emotion, 6(6), 409–434.
Eysenck, M. W., & Derakshan, N. (2011). New perspectives in attentional control theory. Personality and Individual Differences, 50(7), 955–960.
Eysenck, M. W., & Van Berkum, J. (1992). Trait anxiety, defensiveness, and the structure of worry. Personality and Individual Differences, 13(12), 1285–1290.
Eysenck, M. W., Derakshan, N., Santos, R., & Calvo, M. G. (2007). Anxiety and cognitive performance: attentional control theory. Emotion, 7(2), 336–353.
Eysenck, M. W., Mogg, K., May, J., Richards, A., & Mathews, A. (1991). Bias in interpretation of ambiguous sentences related to threat in anxiety. Journal of Abnormal Psychology, 100(2), 144–150.
Eysenck, M., Payne, S., & Derakshan, N. (2005). Trait anxiety, visuospatial processing, and working memory. Cognition & Emotion, 19(8), 1214–1228.
Fear. (2015). In G. R. VandenBos (Ed.), APA dictionary of psychology. 2nd edition. Washington, DC: American Psychological Association.
Foulsham, T., Farley, J., & Kingstone, A. (2013). Mind wandering in sentence reading: Decoupling the link between mind and eye. Canadian Journal of Experimental Psychology/Revue canadienne de psychologie expérimentale, 67(1), 51–59.
Frazier, L., & Rayner, K. (1982). Making and correcting errors during sentence comprehension: Eye movements in the analysis of structurally ambiguous sentences. Cognitive Psychology, 14(2), 178–210.
Freud, S. (1937). Výklad snů. Praha: Albert.
Friedman, N. P., & Miyake, A. (2004). The relations among inhibition and interference control functions: a latent-variable analysis. Journal of Experimental Psychology: General, 133(1), 101–135.
Gelenberg, A. J. (2000). Psychiatric and somatic markers of anxiety: Identification and pharmacologic treatment. Primary Care Companion to the Journal of Clinical Psychiatry, 2(2), 49–54.
Goldman, S. R., & Saul, E. U. (1990). Flexibility in text processing: A strategy competition model. Learning and Individual Differences, 2(2), 181-219.

116
Gross, J. J. (1998). The emerging field of emotion regulation: An integrative review. Review of General Psychology, 2(3), 271–299.
Gross, J. J., & Thompson, R. A. (2007). Emotion Regulation: Conceptual Foundations. In J. J. Gross (Ed.), Handbook of emotion regulation (pp. 3-24). New York, NY: Guilford Press.
Gumora, G., & Arsenio, W. F. (2002). Emotionality, emotion regulation, and school performance in middle school children. Journal of School Psychology, 40(5), 395–413.
Hallion, L. S., & Ruscio, A. M. (2011). A meta-analysis of the effect of cognitive bias modification on anxiety and depression. Psychological Bulletin, 137(6), 940–958.
Hardy, L. (1999). Stress, anxiety and performance. Journal of Science and Medicine in Sport, 2(3), 227–233.
Hardy, L., & Parfitt, G. (1991). A catastrophe model of anxiety and performance. British Journal of Psychology, 82(2), 163–178.
Hardy, L., Beattie, S., & Woodman, T. (2007). Anxiety‐induced performance catastrophes: Investigating effort required as an asymmetry factor. British Journal of Psychology, 98(1), 15–31.
Hardy, L., Woodman, T., & Carrington, S. (2004). Is self-confidence a bias factor in higher-order catastrophe models? An exploratory analysis. Journal of Sport and Exercise Psychology, 26(3), 359–368.
Havel, V. (1990). Moc bezmocných. Praha: Lidové noviny.
Hayes, S. C., Strosahl, K. D., & Wilson, K. G. (1999). Acceptance and commitment therapy. New York: Guilford Press.
Heller, W., Nitschke, J. B., Etienne, M. A., & Miller, G. A. (1997). Patterns of regional brain activity differentiate types of anxiety. Journal of Abnormal Psychology, 106(3), 376–385
Hembree, R. (1988). Correlates, causes, effects, and treatment of test anxiety. Review of Educational Research, 58(1), 47–77.
Hofmann, S. G., & Asmundson, G. J. (2008). Acceptance and mindfulness-based therapy: new wave or old hat?. Clinical Psychology Review, 28(1), 1–16.
Hofmann, S. G., Sawyer, A. T., Witt, A. A., & Oh, D. (2010). The effect of mindfulness-based therapy on anxiety and depression: A meta-analytic review. Journal of Consulting and Clinical Psychology, 78(2), 169–183.
Holmqvist, K., Nyström, M., Andersson, R., Dewhurst, R., Jarodzka, H., & Van de Weijer, J. (2011). Eye tracking: A comprehensive guide to methods and measures. Oxford: Oxford University Press.
Holtzman, W. H., Calvin, A. D., & Bitterman, M. E. (1952). New evidence for the validity of Taylor's Manifest Anxiety Scale. The Journal of Abnormal and Social Psychology, 47(4), 853–854.
Hopko, D. R., Crittendon, J. A., Grant, E., & Wilson, S. A. (2005). The impact of anxiety on performance IQ. Anxiety, Stress & Coping, 18(1), 17–35.
Hyönä, J., Lorch Jr, R. F., & Kaakinen, J. K. (2002). Individual differences in reading to summarize expository text: Evidence from eye fixation patterns. Journal of Educational Psychology, 94(1), 44–55.
Jacobson, J. Z., & Dodwell, P. C. (1979). Saccadic eye movements during reading. Brain and Language, 8(3), 303-314.
117
Just, M. A., & Carpenter, P. A. (1976a). Eye fixations and cognitive processes. Cognitive Psychology, 8(4), 441–480.
Just, M. A., & Carpenter, P. A. (1976b). The role of eye-fixation research in cognitive psychology. Behavior Research Methods & Instrumentation, 8(2), 139–143.
Just, M. A., Carpenter, P. A. (1980) A theory of reading: from eye fixations to comprehension. Psychological Revue, 87, 329–354.
Just, M. A., Carpenter, P. A. (2013) A theory of reading: from eye fixations to comprehension. In D. Alvermann, N. Unrau, R. B. Ruddell (eds.), Theoretical models and processes of reading. Newark, DE: International Reading Association.
Kant, I. (2016). Studie k dějinám a politice. (J. Loužil, P Stehlíková, K. Novotný, překl.). Praha: OIKOYMENH.
Kessler, R. C., Foster, C. L., Saunders, W. B., & Stang, P. E. (1995). Social consequences of psychiatric disorders, I: Educational attainment. American Journal of Psychiatry, 152(7), 1026–1032.
Khoury, B., Lecomte, T., Fortin, G., Masse, M., Therien, P., Bouchard, V., Chapleau, M. A., Paquin, K., & Hofmann, S. G. (2013). Mindfulness-based therapy: a comprehensive meta-analysis. Clinical Psychology Review, 33(6), 763–771.
Koster, E. H., Crombez, G., Verschuere, B., Van Damme, S., & Wiersema, J. R. (2006). Components of attentional bias to threat in high trait anxiety: Facilitated engagement, impaired disengagement, and attentional avoidance. Behaviour Research and Therapy, 44(12), 1757–1771.
Lai, V. T., Hagoort, P., & Casasanto, D. (2012). Affective primacy vs. cognitive primacy: Dissolving the debate. Frontiers in Psychology, 3(243). doi: 10.3389/fpsyg.2012.00243
Lang, P. J. (1985). The cognitive psychophysiology of emotion: Fear and anxiety. In A. H. Tuma & J. D. Maser (Eds.), Anxiety and the anxiety disorders (pp. 131–170). Hillsdale, NJ, US: Lawrence Erlbaum Associates, Inc.
Lazarus, R. S. (1982). Thoughts on the relations between emotion and cognition. American psychologist, 37(9), 1019–1024.
Lazarus, R. S. (1984). On the primacy of cognition. American Psychologist, 39(2), 124–129.
Lazarus, R. S., & Averill, J. R. (1972). Emotion and cognition: With special reference to anxiety. In C. D. Spielberger (Ed.), Anxiety: Current trends in theory and research (Vol. 2). New York: Academic Press.
Lee, J. H. (1999). Test anxiety and working memory. The Journal of Experimental Education, 67(3), 218–240.
Liebert, R. M., & Morris, L. W. (1967). Cognitive and emotional components of test anxiety: A distinction and some initial data. Psychological Reports, 20(3), 975–978.
Liu, H., Li, X., Han, B., & Liu, X. (2017). Effects of cognitive bias modification on social anxiety: A meta-analysis. PloS ONE, 12(4), doi: 10.1371/journal.pone.0175107
Luke, S. G., & Henderson, J. M. (2013). Oculomotor and cognitive control of eye movements in reading: evidence from mindless reading. Attention, Perception, & Psychophysics, 75(6), 1230–1242.
Mandler, M. J., & Sarason, S. B. (1952). A study of anxiety and learning. Journal of Abnormal and Social Psychology, 47(2), 166–173.
118
Manoach, D. S., White, N. S., Lindgren, K. A., Heckers, S., Coleman, M. J., Dubal, S., & Holzman, P. S. (2004). Hemispheric specialization of the lateral prefrontal cortex for strategic processing during spatial and shape working memory. NeuroImage, 21, 894–903.
Mansell, W. (2004). Cognitive psychology and anxiety. Psychiatry, 3(4), 6–10.
Mansell, W. & Clark, D. M. (1999). How do I appear to others? Social anxiety and biased processing of the observable self. Behaviour Research and Therapy, 37(5), 419–434.
Marks, I. M., & Nesse, R. M. (1994). Fear and fitness: An evolutionary analysis of anxiety disorders. Ethology and Sociobiology, 15(5-6), 247–261.
Martens, R., Burton, D., Vealey, R. S., Bump, L. A., & Smith, D. E. (1990). Development and validation of the competitive state anxiety inventory-2. Competitive Anxiety in Sport, 117–190.
Martin, B. (1961). The assessment of anxiety by physiological behavioral measures. Psychological Bulletin, 58(3), 234–255.
Masaryk, T. G. (1924). Česká otázka. O naší nynější krisi. Jan Hus. Praha: Státní nakladatelství.
Mathews, A., & MacLeod, C. (2002). Induced processing biases have causal effects on anxiety. Cognition & Emotion, 16(3), 331–354.
Mellalieu, S. D., Hanton, S., & Fletcher, D. (2009). A competitive anxiety review: Recent directions in sport psychology research. New York: Nova Science Publishers.
Mitterová, K. (2014) Dotazník výkonové motivace : Recenze metody. Testfórum, 7, 93–98.
Miyake, A., & Shah, P. (Eds.). (1999). Models of working memory: Mechanisms of active maintenance and executive control. New York: Cambridge University Press.
Miyake, A., Friedman, N. P., Emerson, M. J., Witzki, A. H., Howerter, A., & Wager, T. D. (2000). The unity and diversity of executive functions and their contributions to complex “frontal lobe” tasks: A latent variable analysis. Cognitive Psychology, 41(1), 49–100.
Mogg, K., & Bradley, B. P. (1998). A cognitive-motivational analysis of anxiety. Behaviour research and therapy, 36(9), 809–848.
Mogg, K., Philippot, P., & Bradley, B. P. (2004). Selective attention to angry faces in clinical social phobia. Journal of Abnormal Psychology, 113(1), 160–165.
Moran, T. P. (2016). Anxiety and working memory capacity: A meta-analysis and narrative review. Psychological Bulletin, 142(8), 831–864.
Mullen, R., & Hardy, L. (2000). State anxiety and motor performance: Testing the conscious processing hypothesis. Journal of Sports Sciences, 18(10), 785–799.
Nakonečný, M. (1995). Psychologie osobnosti. Praha: Academia.
Návod k obsluze Zetor 5211-7245. (n.d.). Retrieved from: http://www.agportal.cz/cz/nd/zetor.html
Nguyen, K. V., Binder, K. S., Nemier, C., & Ardoin, S. P. (2014). Gotcha! Catching kids during mindless reading. Scientific Studies of Reading, 18(4), 274–290.
Nieuwenhuys, A., Pijpers, J. R., Oudejans, R. R., & Bakker, F. C. (2008). The influence of anxiety on visual attention in climbing. Journal of Sport and Exercise Psychology, 30(2), 171–185.
119
Nitschke, J. B., Heller, W., Palmieri, P. A., & Miller, G. A. (1999). Contrasting patterns of brain activity in anxious apprehension and anxious arousal. Psychophysiology, 36(5), 628–637.
Norman, D. A. and Shallice, T. (1986). Attention to action: willed and automatic control of behaviour. In R. J. Davidson. G. E. Schwars, D. Shapiro (Eds.), Consciousness and self-regulation. Advances in research and theory (pp. 1–18). New York: Plenum Press.
Öhman, A. (1996). Preferential preattentive processing of threat in anxiety: Preparedness and attentional biases. Current Controversies in the Anxiety Disorders, 2, 253–290.
Pardel, T., Maršálová, L., & Hrabovská, A. (1984). Dotazník motivácie výkonu. Bratislava: Psychodiagnostika.
Pekrun, R. (2006). The control-value theory of achievement emotions: Assumptions, corollaries, and implications for educational research and practice. Educational Psychology Review, 18(4), 315–341.
Pekrun, R. (2017). Achievement emotions. Handbook of competence and motivation: Theory and application, 251–271.
Pflugshaupt, T., Mosimann, U. P., von Wartburg, R., Schmitt, W., Nyffeler, T., & Müri, R. M. (2005). Hypervigilance–avoidance pattern in spider phobia. Journal of Anxiety Disorders, 19(1), 105–116.
Power, M., & Dalgleish, T. (2015). Cognition and emotion: From order to disorder. Hove, England: Psychology press.
Purdon, C. (1999). Thought suppression and psychopathology. Behaviour Research and Therapy, 37(11), 1029–1054.
Ralph Radach & Alan Kennedy (2004) Theoretical perspectives on eye movements in reading: Past controversies, current issues, and an agenda for future research, European Journal of Cognitive Psychology, 16(1-2), 3–26.
Radomsky, A. S., & Rachman, S. (1999). Memory bias in obsessive–compulsive disorder (OCD). Behaviour Research and Therapy, 37(7), 605–618.
Rayner, K. (1998). Eye movements in reading and information processing: 20 years of research. Psychological Bulletin, 124(3), 372–422.
Rayner, K., Pollatsek, A., Ashby, J., & Clifton Jr, C. (2012). Psychology of Reading. New York, NY: Psychology Press.
Rayner, K., Reichle, E. D., Stroud, M. J., Williams, C. C., & Pollatsek, A. (2006). The effect of word frequency, word predictability, and font difficulty on the eye movements of young and older readers. Psychology and Aging, 21(3), 448–465.
Reichle, E. D., Reineberg, A. E., & Schooler, J. W. (2010). Eye movements during mindless reading. Psychological Science, 21(9), 1300–1310.
Robert, C., Borella, E., Fagot, D., Lecerf, T., & De Ribaupierre, A. (2009). Working memory and inhibitory control across the life span: Intrusion errors in the Reading Span Test. Memory & Cognition, 37(3), 336–345.
Robinson, O. J., Vytal, K., Cromwell, B., & Grillon, C. (2013). The impact of anxiety upon cognition: Perspective from human threat-of-shock studies. Frontiers in Human Neuroscience, 7, doi: 10.3389/fnhum.2013.00203
Russell, B. (1993). Logika, věda, filozofie, společnost. Praha: Svoboda-Libertas.

120
Sapp, M. (1999). Test anxiety: Applied research, assessment, and treatment interventions. Lanham, Maryland: University Press of America.
Sarason, I. G. (1978). The test anxiety scale: Concept and research. In C. D. Spielberger & I. G. Sarason (Eds.), Stress and anxiety (pp. 193-218). Washington, DC: Hemisphere.
Sarason, I. G. (1984). Stress, anxiety and cognitive interference: reactions to tests. Journal of Personality and Social Psychology, 46(4), 929–938.
Sarason, I. G. (1988). Anxiety, self-preoccupation and attention. Anxiety Research, 1(1), 3–7.
Sarason, S. B., & Mandler, G. (1952). Some correlates of test anxiety. The Journal of Abnormal and Social Psychology, 47(4), 810–817.
Schachter, S., & Singer, J. (1962). Cognitive, social, and physiological determinants of emotional state. Psychological Review, 69(5), 379–399.
Schad, D. J., Nuthmann, A., & Engbert, R. (2012). Your mind wanders weakly, your mind wanders deeply: objective measures reveal mindless reading at different levels. Cognition, 125(2), 179–194.
Schmader, T., & Johns, M. (2003). Converging evidence that stereotype threat reduces working memory capacity. Journal of personality and social psychology, 85(3), 440–452.
Schotter, E. R., Tran, R., & Rayner, K. (2014). Don’t believe what you read (only once) comprehension is supported by regressions during reading. Psychological Science, 25(6), 1218–1226.
Seipp, B. (1991). Anxiety and academic performance: A meta-analysis of findings. Anxiety Research, 4(1), 27–41.
Shackman, A. J., Sarinopoulos, I., Maxwell, J. S., Pizzagalli, D. A., Lavric, A., & Davidson, R. J. (2006). Anxiety selectively disrupts visuospatial working memory. Emotion, 6(1), 40–61.
Spielberger, C. D. (1980). Test anxiety inventory. Palo Alto, CA: Consulting Psychologist Press.
Spielberger, C. D. (ed.). (1966). Anxiety and behavior. New York: Academic press.
Spielberger, C. D., & Vagg, P. R. (1995). Test anxiety: A transactional process model. In C. D. Spielberger & P. R. Vagg (Eds.), Series in clinical and community psychology. Test anxiety: Theory, assessment, and treatment. (pp. 3–14). Philadelphia, PA, US: Taylor & Francis.
Spielberger, C. D., Gorsuch, R. L., Lushene, R., Vagg, P. R., & Jacobs, G. A. (1983). Manual for the state-trait anxiety inventory. Palo Alto, CA: Consulting Psychologists Press.
Stennett, R. G. (1957). The relationship of performance level to level of arousal. Journal of Experimental Psychology, 54(1), 54–61.
Sullivan, M. P., Griffiths, G. G., & Sohlberg, M. M. (2014). Effect of posttraumatic stress on study time in a task measuring four component processes underlying text-level reading. Journal of Speech, Language, and Hearing Research, 57(5), 1731–1739.
Sullivan, M. P., Griffiths, G., & Sohlberg, M. M. (2013). Comprehension of expository text in veterans with post traumatic stress disorder. Journal of Medical Speech-Language Pathology, 21, 413–428.

121
Taylor, J. A. (1953) A Personality Scale of Manifest Anxiety. The Journal of Abnormal and Social Psychology, 48(2), 285–290.
Tichon, J. G., Wallis, G., Riek, S., & Mavin, T. (2014). Physiological measurement of anxiety to evaluate performance in simulation training. Cognition, Technology & Work, 16(2), 203–210.
Trabasso, T., Rollins, H., & Shaughnessy, E. (1971). Storage and verification stages in processing concepts. Cognitive Psychology, 2(3), 239–289.
Triesch, J., Ballard, D. H., Hayhoe, M. M., & Sullivan, B. T. (2003). What you see is what you need. Journal of Vision, 3(1), 86–94.
Turk, C. L., & Mennin, D. S. (2011). Phenomenology of generalized anxiety disorder. Psychiatric Annals, 41(2), 72–78.
Turner, S. M., Beidel, D. C., & Stanley, M. A. (1992). Are obsessional thoughts and worry different cognitive phenomena?. Clinical Psychology Review, 12(2), 257–270.
Underwood, G., Chapman, P., Berger, Z., & Crundall, D. (2003). Driving experience, attentional focusing, and the recall of recently inspected events. Transportation Research Part F: Traffic Psychology and Behaviour, 6(4), 289–304.
Van Ameringen, M., Mancini, C., & Farvolden, P. (2003). The impact of anxiety disorders on educational achievement. Journal of Anxiety Disorders, 17(5), 561–571.
Van Dillen, L. F., & Koole, S. L. (2009). How automatic is “automatic vigilance”? The role of working memory in attentional interference of negative information. Cognition and Emotion, 23(6), 1106–1117.
Vitu, F., & McConkie, G. W. (2000). Regressive saccades and word perception in adult reading. In A. Kennedy, R. Radach, D. Heller, & J. Pynte (eds.), Reading as a perceptual process (pp. 301–326). New York: Elsevier.
Wegner, D. M., Schneider, D. J., Carter, S. R., & White, T. L. (1987). Paradoxical effects of thought suppression. Journal of personality and social psychology, 53(1), 5–13.
Weiner, B. (1985). An attributional theory of achievement motivation and emotion. Psychological review, 92(4), 548–573.
Whitney, P., Arnett, P. A., Driver, A., & Budd, D. (2001). Measuring central executive functioning: What's in a reading spa n? Brain and Cognition, 45(1), 1–14.
Wigfield, A., & Cambria, J. (2010). Expectancy-value theory: Retrospective and prospective. In S. Karabenick, T. C. Urdan (eds.), The decade ahead: Theoretical perspectives on motivation and achievement (pp. 35–70). Bingley, UK: Emerald Group Publishing Limited.
Williams, A. M., & Elliott, D. (1999). Anxiety, expertise, and visual search strategy in karate. Journal of Sport and Exercise Psychology, 21, 362–375.
Williams, A. M., Vickers, J. N., & Rodrigues, S. T. (2002). The effects of anxiety on visual search movement kinematics, and performance in table tennis: A test of Eysenck and Calvo’s processing efficiency theory. Journal of Sport and Exercise Psychology, 24, 438-455.
Wilson, M. (2008). From processing efficiency to attentional control: a mechanistic account of the anxiety–performance relationship. International Review of Sport and Exercise Psychology, 1(2), 184–201.
Wilson, M., Chattington, M., Marple-Horvat, D. E., & Smith, N. C. (2007). A comparison of self-focus versus attentional explanations of choking. Journal of Sport and Exercise Psychology, 29(4), 439–456.
122
Wilson, M., Smith, N. C., & Holmes, P. S. (2007). The role of effort in influencing the effect of anxiety on performance: Testing the conflicting predictions of processing efficiency theory and the conscious processing hypothesis. British Journal of Psychology, 98(3), 411–428.
Wilson, M., Smith, N. C., Chattington, M., Ford, M., & Marple-Horvat, D. E. (2006). The role of effort in moderating the anxiety-performance relationship: Testing the prediction of processing efficiency theory in simulated rally driving. Journal of Sports Sciences, 24, 1223–1233.
Wilson, M., Smith, N. C., Chattington, M., Ford, M., & Marple-Horvat, D. E. (2006). The role of effort in moderating the anxiety–performance relationship: Testing the prediction of processing efficiency theory in simulated rally driving. Journal of sports sciences, 24(11), 1223–1233.
Worry. (2015). In G. R. VandenBos (Ed.), APA dictionary of psychology. 2nd edition. Washington, DC: American Psychological Association.
Wright, P. (1980). Usability: The criterion for designing written information. In: P. A. Kolers P.A., M.E. Wrolstad, & H. Bouma (eds), Processing of visible language (pp. 183-205). Boston, MA: Springer-Verlag.
Yerkes, R. M., & Dodson, J. D. (1908). The relation of strength of stimulus to rapidity of habit‐formation. Journal of comparative neurology and psychology, 18(5), 459–482.
Zajonc, R. B. (1980). Feeling and thinking: Preferences need no inferences. American psychologist, 35(2), 151–175.
Zajonc, R. B. (1984). On the primacy of affect. American Psychologist, 39(2), 117–123.
Zeidner, M. (1990). Does test anxiety bias scholastic aptitude test performance by gender and sociocultural group? Journal of Personality Assessment, 55, 145–160.
Zeidner, M. (1998). Test anxiety: The state of the art. Perspectives on individual differences. New York: Kluwer academic publishers.
Zeidner, M., Matthews, G. (2002). Test anxiety. In R.Fernandez-Ballesteros (Ed.), Encyclopedia of psychological assessment. London: SAGE Publications.
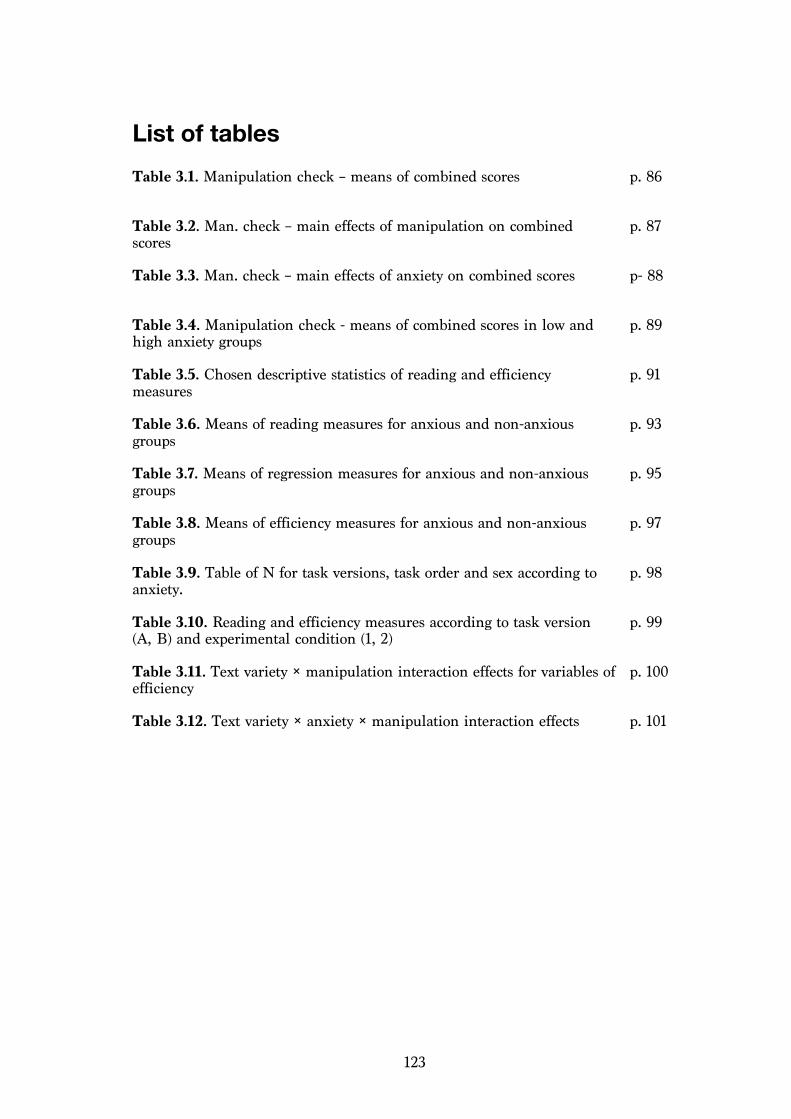
123
List of tables Table 3.1. Manipulation check – means of combined scores p. 86
Table 3.2. Man. check – main effects of manipulation on combined scores
p. 87
Table 3.3. Man. check – main effects of anxiety on combined scores p- 88
Table 3.4. Manipulation check - means of combined scores in low and high anxiety groups
p. 89
Table 3.5. Chosen descriptive statistics of reading and efficiency measures
p. 91
Table 3.6. Means of reading measures for anxious and non-anxious groups
p. 93
Table 3.7. Means of regression measures for anxious and non-anxious groups
p. 95
Table 3.8. Means of efficiency measures for anxious and non-anxious groups
p. 97
Table 3.9. Table of N for task versions, task order and sex according to anxiety.
p. 98
Table 3.10. Reading and efficiency measures according to task version (A, B) and experimental condition (1, 2)
p. 99
Table 3.11. Text variety × manipulation interaction effects for variables of efficiency
p. 100
Table 3.12. Text variety × anxiety × manipulation interaction effects p. 101
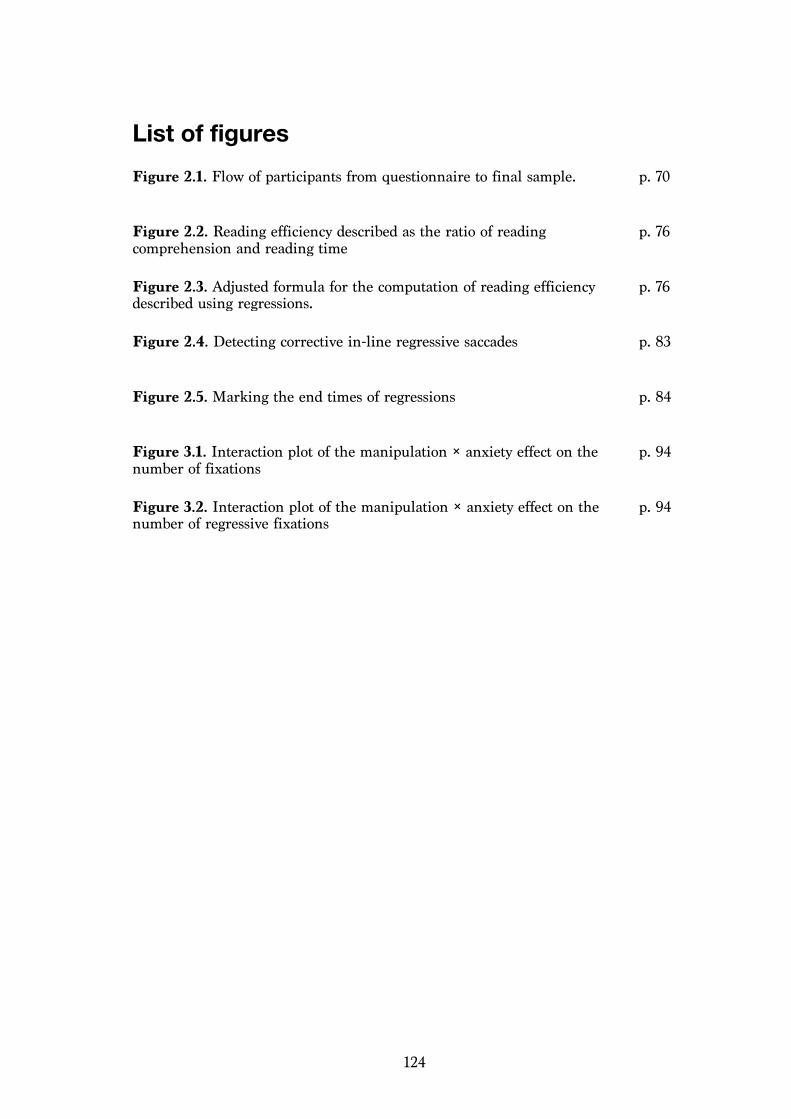
124
List of figures Figure 2.1. Flow of participants from questionnaire to final sample.
p. 70
Figure 2.2. Reading efficiency described as the ratio of reading comprehension and reading time
p. 76
Figure 2.3. Adjusted formula for the computation of reading efficiency described using regressions.
p. 76
Figure 2.4. Detecting corrective in-line regressive saccades
p. 83
Figure 2.5. Marking the end times of regressions
p. 84
Figure 3.1. Interaction plot of the manipulation × anxiety effect on the number of fixations
p. 94
Figure 3.2. Interaction plot of the manipulation × anxiety effect on the number of regressive fixations
p. 94
125
Appendices
Appendix 1. Study information and informed consent
Appendix 2. Transformed efficiency formulas
Appendix 3. Texts and comprehension questions
Appendix 4. Task instructions
Appendix 5. Link to tailored software for computing regressions
Appendix 6. Manipulation check items and combined scores
Appendix 7. Descriptive statistics of manipulation check items
Appendix 8. Table of mean scores for individual items of the manipulation check
according to dispositional anxiety
Appendix 9. Correlation matrices of reading measures
Appendix 10. Descriptive statistics of reading and efficiency measures
Appendix 11. Effects of anxiety on reading and efficiency measures
Appendix 12. Examples of regressive scanpaths

126
Appendix 1. Study information and informed consent
Adapted to text from Google forms format.
1) Introduction
VÁŽENÁ ÚČASTNICE, VÁŽENÝ ÚČASTNÍKU,
děkuji za to, že máte zájem o účast na výzkumu 'Vliv úzkosti na efektivitu čtení: eye-trackingová studie' a že jste si udělal/a čas na vyplnění tohoto dotazníku.
Jmenuji se Markéta Dohnalová a tuto studii provádím jako součást své diplomové práce z psychologie na Filozofické fakultě Masarykovy univerzity.
Studie zkoumá vztah mezi úzkostí, myšlenkovými procesy a očními pohyby které probíhají během čtení. Výsledky studie tak pomohou k hlubšímu a podrobnějšímu porozumění procesům, kterými může úzkost způsobovat obtíže při čtení. Tyto poznatky mohou pomoct lidem trpícím nadměrnou úzkostí, a také přispět k lepšímu porozumění emočním faktorům, které mohou komplikovat fungování lidí s poruchami učení, zejména s dyslexií.
Před vyplněním samotného dotazníku Vám budou předloženy informace o studii a požádám Vás o vyplnění informovaného souhlasu. Celkem 95 položek dotazníku slouží k posouzení Vaší tendence k prožívání úzkosti. Celý dotazník by Vám měl zabrat přibližně 20-30 minut, ačkoli se čas může lišit dle Vašeho individuálního tempa. Nejedná se o diagnostickou metodu, tedy nemusíte se bát, že by Vám někdo na základě Vašich odpovědí přiřadil diagnózu nebo hodnotil, do jaké míry jste "normální". Vyplnění dotazníku je předpokladem pro účast na druhé části výzkumu, která probíhá v laboratoři.
Dotazník, prosím, NEVYPLŇUJTE, POKUD: a) nejste rodilý mluvčí českého jazyka, b) nemáte zájem účastnit se experimentální části studie v laboratoři, nebo c) trpíte závažnou oční vadou nebo poruchou učení (např. dyslexií), která by Vám bránila v plnění úkolů v experimentální části.
V případě, že budete vybráni i do druhé fáze experimentu, obdržíte pozvánku na Vaši e mailovou adresu. Druhá fáze experimentu pak bude probíhat v týdnech od 25. 2. do 1. 3. 2019 a od 11. 3. do 15. 3. 2019. Budete si moct zvolit čas (bloky budou hodinové), který se Vám hodí.
Děkuji Vám za Váš zájem a čas.
S úctou
Markéta Dohnalová
Studentka psychologie FF MU
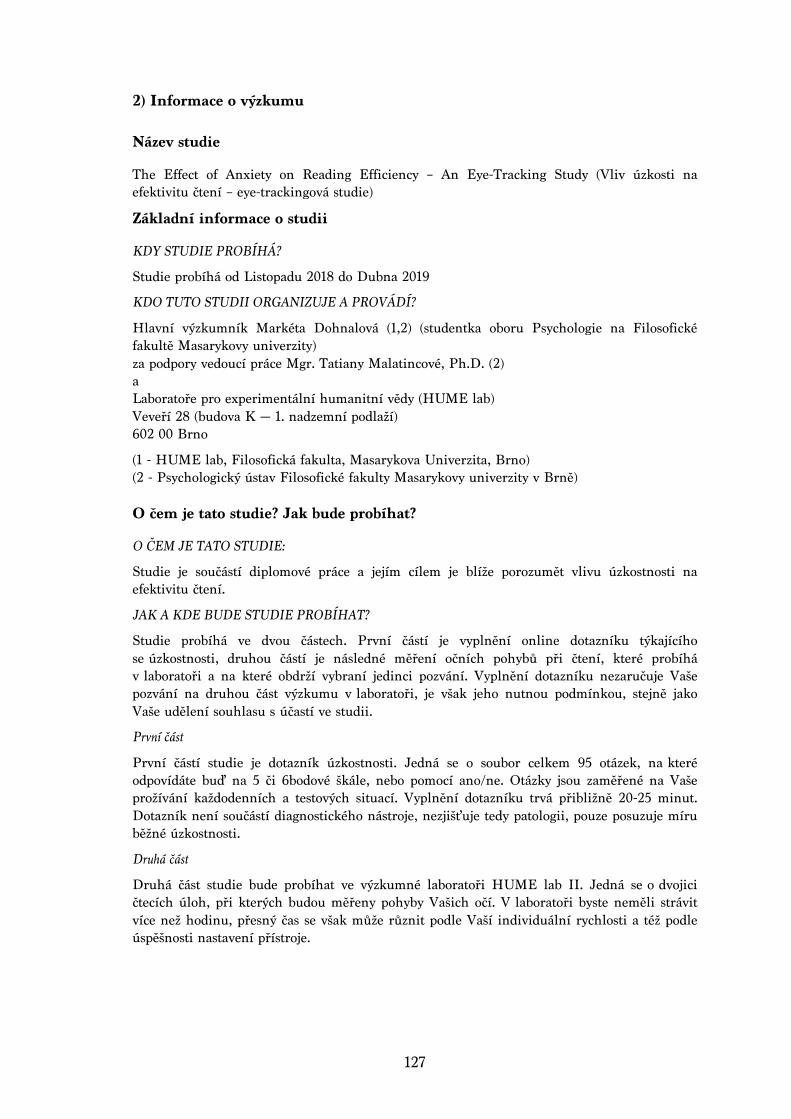
127
2) Informace o výzkumu
Název studie
The Effect of Anxiety on Reading Efficiency – An Eye-Tracking Study (Vliv úzkosti na efektivitu čtení – eye-trackingová studie)
Základní informace o studii
KDY STUDIE PROBÍHÁ?
Studie probíhá od Listopadu 2018 do Dubna 2019
KDO TUTO STUDII ORGANIZUJE A PROVÁDÍ?
Hlavní výzkumník Markéta Dohnalová (1,2) (studentka oboru Psychologie na Filosofické fakultě Masarykovy univerzity) za podpory vedoucí práce Mgr. Tatiany Malatincové, Ph.D. (2) a Laboratoře pro experimentální humanitní vědy (HUME lab) Veveří 28 (budova K — 1. nadzemní podlaží) 602 00 Brno
(1 - HUME lab, Filosofická fakulta, Masarykova Univerzita, Brno) (2 - Psychologický ústav Filosofické fakulty Masarykovy univerzity v Brně) O čem je tato studie? Jak bude probíhat?
O ČEM JE TATO STUDIE:
Studie je součástí diplomové práce a jejím cílem je blíže porozumět vlivu úzkostnosti na efektivitu čtení.
JAK A KDE BUDE STUDIE PROBÍHAT?
Studie probíhá ve dvou částech. První částí je vyplnění online dotazníku týkajícího se úzkostnosti, druhou částí je následné měření očních pohybů při čtení, které probíhá v laboratoři a na které obdrží vybraní jedinci pozvání. Vyplnění dotazníku nezaručuje Vaše pozvání na druhou část výzkumu v laboratoři, je však jeho nutnou podmínkou, stejně jako Vaše udělení souhlasu s účastí ve studii.
První část
První částí studie je dotazník úzkostnosti. Jedná se o soubor celkem 95 otázek, na které odpovídáte buď na 5 či 6bodové škále, nebo pomocí ano/ne. Otázky jsou zaměřené na Vaše prožívání každodenních a testových situací. Vyplnění dotazníku trvá přibližně 20-25 minut. Dotazník není součástí diagnostického nástroje, nezjišťuje tedy patologii, pouze posuzuje míru běžné úzkostnosti.
Druhá část
Druhá část studie bude probíhat ve výzkumné laboratoři HUME lab II. Jedná se o dvojici čtecích úloh, při kterých budou měřeny pohyby Vašich očí. V laboratoři byste neměli strávit více než hodinu, přesný čas se však může různit podle Vaší individuální rychlosti a též podle úspěšnosti nastavení přístroje.

128
Průběh druhé části:
Pozvánku na druhou část experimentu s konkrétním časem, kdy se máte dostavit do laboratoře, obdržíte e-mailem. Budete požádáni, abyste pokud možno přicházeli bez očního líčení či umělých řas, a abyste, pokud trpíte refrakční vadou, dali přednost brýlím bez silných obrouček nebo kontaktním čočkám.
V domluveném čase se poté dostavíte na určené místo a budete uvedeni do laboratoře, kde nejprve obdržíte informace o tom, co Vás čeká, a bude Vám dán prostor pro dotazy.
Poté se posadíte se k eye-trackingovému přístroji, kterým budou měřeny Vaše pohyby očí. Eye-tracking je metoda, která měří pohyby očí za pomocí odrazu infračerveného záření z Purkyňových obrazců oka. Běžně se využívá ke studiu zrakové pozornosti. (Viz fotku vysokorychlostního eye-trackingového přístroje níže.) Po nastavení přístroje Vám nejprve bude na obrazovce předložena příkladová čtecí úloha, kde si ve zkrácené verzi vyzkoušíte, jak budou vypadat následující úlohy. Proběhne kalibrace - nastavování přístroje, aby správně registroval Vaše oči, a případná dodatečná nastavování pro co nejpřesnější měření očních pohybů.
Následovat budou dvě čtecí úlohy, během kterých budou měřeny pohyby Vašich očí. Na obrazovce Vám budou předkládány konkrétní instrukce k úloze, texty ke čtení i následné otázky na porozumění textu. Mezi dílčími úlohami bude též probíhat rekalibrace. Po dokončení úloh vyplníte krátký dotazník, ve kterém odpovíte na otázky týkající se toho, jak se Vám na úlohách pracovalo.
Studií Vás bude provázet výzkumný/á asistent/ka, který/á bude zajišťovat kalibraci a na kterého se budete moct kdykoli během experimentu obrátit.
Jaké jsou podmínky pro účast na studii?
Vzhledem k povaze úlohy je nutné, aby byli respondenti rodilými mluvčími českého jazyka. Studie se dále nemůžete účastnit, pokud trpíte závažnými očními vadami nebo dyslexií. Refrakční oční vady (např. krátkozrakost) nejsou sami o sobě problémem, ale brýle, zejména v případě cylindrických vad (astigmatismus), snižují pravděpodobnost úspěšné registrace Vašich očí eye-trackingovým přístrojem. V případě neúspěšné registrace pohybů nebo nedostatečné přesnosti naměřených dat nemohou být Vaše data ve výzkumu použita.
Jaký je přínos studie?
Vaší účastí přispějete k porozumění vlivu úzkosti na poznávací procesy, konkrétně na čtení. Tyto poznatky mohou být dále využity pro vyvinutí metod a programů pro podporu jedinců s úzkostnými poruchami či s poruchami učení.
Co když budu chtít od studie odstoupit?
Vaše účast ve studii je dobrovolná. Můžete odmítnout účast v této studii a můžete kdykoli do uzavření sběru dat bez udání důvodů odstoupit od této studie a to bez postihů nebo ztráty výhod, k nimž byste byli jinak oprávněni. Vaše data budou v tomto případě z databáze odstraněna, po uzavření sběru dat však budou data zcela anonymizována (bude odstraněn dokument párující výzkumná data k osobním a identifikačním údajům) a nebude tedy již možné zpětně dohledat, která data patří Vám.
Jak budou zpracovány a chráněny mé osobní údaje?
Odpovědi z dotazníku v první části studie a v případě účasti na druhé části studie též výsledky měření budou ukládány pod číselným kódem, který Vám bude přiřazen. Vaše identifikační údaje (jméno a e-mailová adresa) potřebné pro komunikaci s Vámi (a též pro spárování dat z dotazníku s daty z experimentu) budou společně s číselným kódem uloženy ve zvláštním

129
souboru. K tomuto souboru bude mít přístup pouze hlavní výzkumnice, bude chráněný heslem a uložen odděleně od ostatních dat na bezpečném úložišti, odděleně od ostatních dat, které bude též chráněno heslem. Laboratoř HUME Lab a vedoucí diplomové práce budou mít přístup pouze ke kódovaným datům a nebudou mít k dispozici Vaše osobní údaje.
Po ukončení sběru dat bude soubor obsahující Vaše osobní údaje a kódy zničen a data budou uchována pouze v anonymní podobě. Tato data již bez osobních a identifikačních údajů (tj. anonymizovaná) mohou být pak v rámci otevřené vědy přístupná i dalším výzkumníkům.
Na koho se mám obrátit v případě dotazu?
Máte právo kdykoli v průběhu výzkumu klást otázky.
Pokud máte jakýkoliv dotaz týkající se této studie, obraťte se na:
Hlavního výzkumníka:
Markéta Dohnalová
Vedoucí diplomové práce:
Mgr. Tatiana Malatincová, PhD.
nebo na
Laboratoř pro experimentální humanitní vědy (HUME lab)
Veveří 28 (budova K — 1. nadzemní podlaží), 602 00 Brno
Tel. číslo: 549 49 8991
Tento projekt byl schválen Etickou komisí pro výzkum Masarykovy univerzity. V případě dotazů, nejasností či připomínek k průběhu výzkumu můžete kontaktovat vedení komise na adrese [email protected].
3) Informovaný souhlas
Souhlas s účastí ve výzkumném projektu a se zpracováním osobních údajů
UDĚLENÍ SOUHLASU S ÚČASTÍ NA VÝZKUMU
Prohlašuji, že jsem četl/a text Informace o výzkumu uvedený v předchozím bloku a porozuměl/a jsem jeho smyslu.
Souhlasím s mojí účastí v uvedeném výzkumném projektu a rozumím, že mohu souhlas odmítnout, případně svobodně a bez udání důvodů z účasti odstoupit.
Zároveň souhlasím s poskytnutím svých osobních údajů v rozsahu svého jména, e-mailové adresy, odpovědí z dotazníku a naměřených dat a jsem srozuměn/a s tím, že mé jméno a adresa NEbudou uloženy spolu s výzkumnými daty a poslouží výhradně pro komunikaci s výzkumníkem během sběru dat a pro spárování dat z první a druhé části výzkumu za pomocí kódu.
o Souhlasím
o Nesouhlasím
(účastník zaškrtl odpovídající)
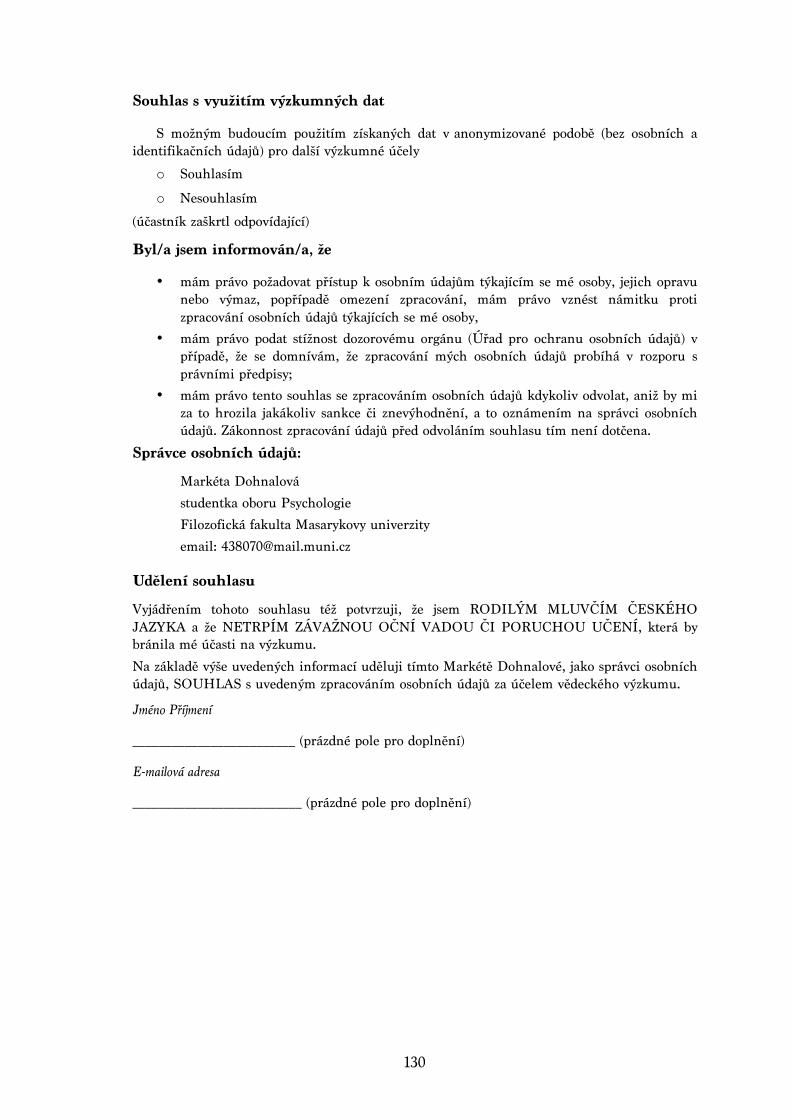
130
Souhlas s využitím výzkumných dat
S možným budoucím použitím získaných dat v anonymizované podobě (bez osobních a identifikačních údajů) pro další výzkumné účely
o Souhlasím
o Nesouhlasím
(účastník zaškrtl odpovídající)
Byl/a jsem informován/a, že
• mám právo požadovat přístup k osobním údajům týkajícím se mé osoby, jejich opravu nebo výmaz, popřípadě omezení zpracování, mám právo vznést námitku proti zpracování osobních údajů týkajících se mé osoby,
• mám právo podat stížnost dozorovému orgánu (Úřad pro ochranu osobních údajů) v případě, že se domnívám, že zpracování mých osobních údajů probíhá v rozporu s právními předpisy;
• mám právo tento souhlas se zpracováním osobních údajů kdykoliv odvolat, aniž by mi za to hrozila jakákoliv sankce či znevýhodnění, a to oznámením na správci osobních údajů. Zákonnost zpracování údajů před odvoláním souhlasu tím není dotčena.
Správce osobních údajů:
Markéta Dohnalová studentka oboru Psychologie Filozofická fakulta Masarykovy univerzity email: [email protected]
Udělení souhlasu
Vyjádřením tohoto souhlasu též potvrzuji, že jsem RODILÝM MLUVČÍM ČESKÉHO JAZYKA a že NETRPÍM ZÁVAŽNOU OČNÍ VADOU ČI PORUCHOU UČENÍ, která by bránila mé účasti na výzkumu.
Na základě výše uvedených informací uděluji tímto Markétě Dohnalové, jako správci osobních údajů, SOUHLAS s uvedeným zpracováním osobních údajů za účelem vědeckého výzkumu.
Jméno Příjmení
_________________________ (prázdné pole pro doplnění)
E-mailová adresa
__________________________ (prázdné pole pro doplnění)
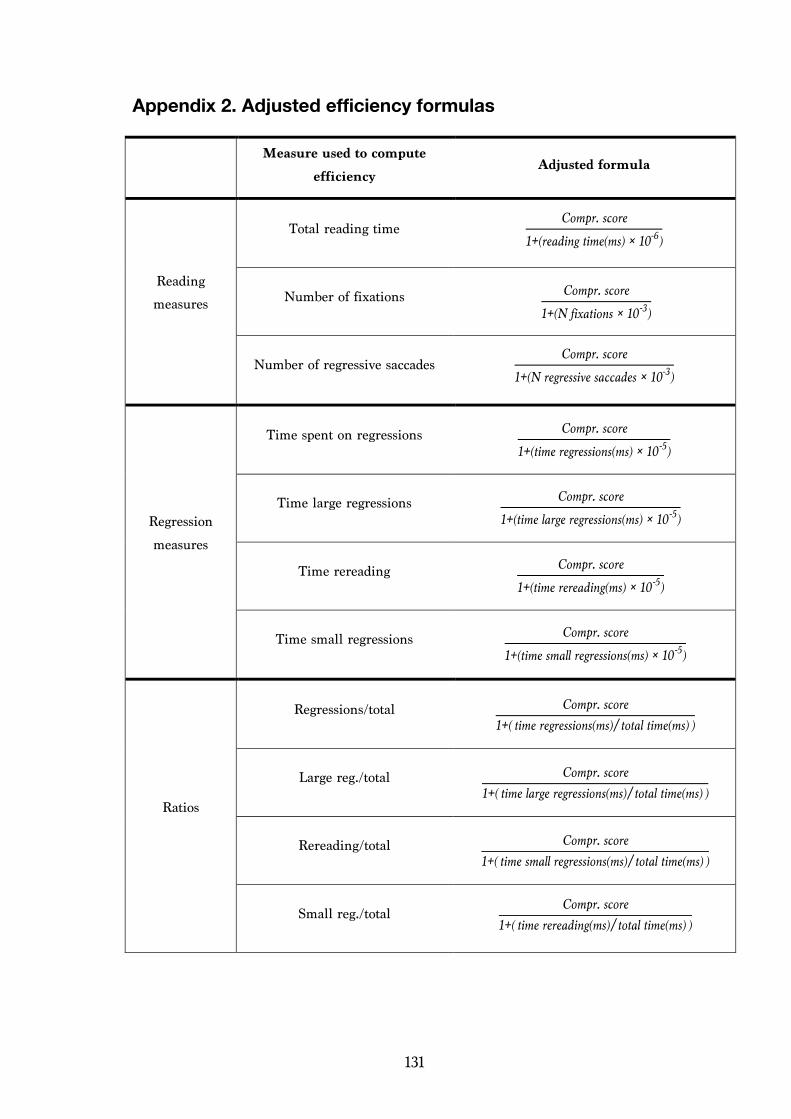
131
Appendix 2. Adjusted efficiency formulas
Measure used to compute
efficiency Adjusted formula
Reading
measures
Total reading time Compr. score
1+(reading time(ms) × 10-6)
Number of fixations Compr. score
1+(N fixations × 10-3)
Number of regressive saccades Compr. score
1+(N regressive saccades × 10-3)
Regression
measures
Time spent on regressions Compr. score
1+(time regressions(ms) × 10-5)
Time large regressions Compr. score
1+(time large regressions(ms) × 10-5)
Time rereading Compr. score
1+(time rereading(ms) × 10-5)
Time small regressions Compr. score
1+(time small regressions(ms) × 10-5)
Ratios
Regressions/total Compr. score1+( time regressions(ms) total time(ms) )
Large reg./total Compr. score1+( time large regressions(ms) total time(ms) )
Rereading/total Compr. score1+( time small regressions(ms) total time(ms) )
Small reg./total Compr. score
1+( time rereading(ms) total time(ms) )

132
Appendix 3. Texts and comprehension questions
The original sources of the texts are cited, texts were modified for the purpose of the experiment. The modified versions are presented. Correct responses are highlighted in italic.
Version A
Text 1 (Návod k obsluze Zetor 5211-7245)
Při parkování traktoru (soupravy) přes noc, mimo parkoviště, na neosvětlené komunikaci, nezapomeňte jej osvětlit nejméně jedním světlem viditelným zepředu i zezadu, umístěným na boku traktoru (soupravy) ke středu komunikace.
(29 slov)
1. Text je popisem toho, a. jak bezpečně parkovat traktor na neosvětlené komunikaci. b. jak zapnout světla umístěná na boku traktoru. c. jak řídit traktor na neosvětlené komunikaci. d. jaké světla zapnout při jízdě na neosvětlené komunikaci.
2. Autor textu uvádí, na které straně traktoru vzhledem k vozovce by světla měla být
rozsvícena. a. Ano. b. Ne.
Text 2 (Freud, 1937)
Za nepopřený poznatek smíme považovat, že veškerý materiál, tvořící obsah snu, nějakým způsobem pramení z prožitku, tedy je ve snu reprodukován, vybavován. Ale mylná by byla domněnka, že se taková souvislost snového obsahu s životem za bdění nutně a bez námahy jeví zřetelným výsledkem srovnání. Naopak souvislost musí být bedlivě hledána a v mnoha případech se dovede dlouhou dobu skrývat. Příčina vězí v některých zvláštnostech, které má vzpomínací schopnost ve snu a které se, třebas všeobecně pozorovány, dosud nedaly nijak objasnit.
(49 slov)
1. Autor v textu tvrdí, že všechen materiál tvořící sen nějak pramení z toho, co zažíváme. a. Ano. b. Ne.
2. Autor v textu tvrdí, že a. na základě snů nelze předvídat lidské chování. b. analýza snů nám pomáhá pochopit naše pravé touhy. c. vztah mezi snovým obsahem a reálným životem není zjevný. d. neexistuje kauzální vztah mezi snovým obsahem a reálným životem.
Text 3 (Russell, 1993)
I když připustíme, že Slunce, hvězdy a hmotný svět obecně nejsou výtvorem naší představivosti nebo množinou vhodných koeficientů v našich rovnicích, je to, co lze o nich říci, neobyčejně abstraktní, mnohem více, než jak se to projevuje z jazyka, který používají fyzikové, snaží-li se být srozumitelnými. Prostor a čas, jimiž se zabývají, nejsou prostorem a časem naší zkušenosti. Oběžné dráhy planet se až na jisté zcela abstraktní vlastnosti nepodobají ilustrovaným elipsám, které můžeme spatřit zaznamenány na mapách sluneční soustavy.
(79 slov)

133
1. Autor v textu uvádí, že Slunce, hvězdy a hmotný svět jsou jen výtvorem naší představivosti.
a. Ano. b. Ne.
2. Autor v textu tvrdí, že prostor a čas jsou pouhé iluze. a. Ano. b. Ne.
3. Dle autora oběžné dráhy planet a. by neměly být ilustrovány za pomocí elips. b. se elipsám podobají jen v několika málo aspektech. c. v realitě nejsou v ničem podobné elipsám zakresleným na mapách sluneční
soustavy. d. jsou jen výtvorem naší představivosti.
Text 4 (Nakonečný, 1995)
Motiv lze vymezit jako „faktor aktivace a řízení způsobů chování“, nutno poznamenat, že jako takový znamená buď objekt ve vnějším světě, který u individua vyvolává určitou pohotovost k chování, nebo vyjadřuje tuto pohotovost samu: v prvním případě se jím označuje např. jídlo, v druhém případě hlad. V obou případech však finálním efektem je dosažení určitého psychického stavu, uspokojení (v našem případě nasycení), dosažení objektu je pouze prostředkem dosažení tohoto vnitřního uspokojení.
(71 slov)
1. Autor využívá příkladu jídla a hladu, aby ukázal, že a. existují motivy společné všem lidem. b. existují motivy, které jsou pro lidský druh vždy žádoucí. c. chování vyplývá z interakce objektu a vnitřního stavu. d. motivy určují směr a intenzitu lidského chování.
2. Text obsahuje definici motivu. a. Ano. b. Ne.
Text 5 (Kant, 2016)
Ať už si děláme jakýkoli pojem o svobodě vůle v metafyzickém smyslu, přece jsou její projevy, lidská jednání, stejně jako každá jiná přírodní událost, určeny podle všeobecných přírodních zákonů. Dějiny, které se vyprávěním těchto jevů zabývají, jakkoli hluboko mohou být ukryty její příčiny, nechávají nás přesto o sobě doufat, že když pozorují hru svobody lidské vůle ve velkém, mohou odhalit její pravidelný běh; a tímto způsobem to, co u jednotlivých subjektů vypadá jako spletitá a prostá pravidla, bude moci být poznáno na celém rodu přesto jako neustále pokračující, i když pozvolný vývoj jeho původních vloh.
(95 slov)
1. Projevy svobodné vůle jsou dle autora určeny a. na základě rozhodnutí jednotlivých lidí. b. na základě toho, jak si lidská společnost interpretuje dějiny. c. na základě obecných přírodních zákonů. d. různě, záleží na tom, jak rozumíme pojmu “svobodná vůle”.
2. Podle autora nám nahlédnutí do dějin lidstva pomůže a. definovat pojem svobodné vůle. b. získat skutečnou svobodu v našem rozhodování, c. odhalit skryté příčiny lidského jednání. d. odhalit pravidelnost zdánlivě zcela nepravidelných jevů.
134
Text 6 (Havel, 1990)
Východní Evropou obchází strašidlo, kterému na Západě říkají „disidentství“. Toto strašidlo nespadlo z nebe. Je přirozeným projevem a nevyhnutelným důsledkem současné historické fáze systému, jímž obchází. Zrodila ho totiž situace, kdy tento systém už dávno není a z tisícerých důvodů už nemůže být založen na čisté a brutální mocenské svévoli, vylučující jakýkoliv nekonformní projev, kdy je ale na druhé straně už do té míry politicky statický, že téměř znemožňuje, aby se takový projev natrvalo uplatňoval v prostředí jeho oficiálních struktur.
(80 slov)
1. „Strašidlo disidentství“ přichází dle textu právě ve chvíli, kdy systém mimo jiné a. vylučuje jakýkoli nekonformní projev. b. je z důvodu změn doby výrazně nestabilní. c. již nemůže stavět na nekompromisním prosazování mocenských záměrů. d. je v kontextu světového obchodu ekonomicky nevýhodný.
2. Nekonformní projev se podle textu nemůže oficiálně v popisovaném systému trvale uplatnit proto, že
a. se politický systém stal příliš statickým. b. systém nekompromisně uplatňuje mocenskou svévoli. c. ještě pro něj nenastala v rámci historického vývoje správná chvíle. d. jsou nekonformní projevy vnímané jako protiústavní.
Text 7 (Masaryk, 1924)
Veliká francouzská revoluce a následující reakce a restaurace, pak revoluce menší, jakožto pokračování revoluce veliké, obracely pozornost nejširších vrstev na protivy a boj starého a nového režimu a živily teorie a pokusy o lepší, co možná definitivní reorganisaci států, národů Evropy a lidstva; v té době vzniká uvědomělý socialismus. Teoreticky doba nalézá svůj výraz v nové, vědecké historiografii. Filosofie dějin pěstuje se u všech národů, kvete historie, ekonomika, a vůbec všechny společenské vědy; ustaluje se sociologie jako soubor všech těchto speciálních pokusů, jako věda o lidské společnosti a jejím vývoji.
(90 slov)
1. Veliká francouzská revoluce dle textu vedla a. k novému způsobu politického myšlení. b. k silnějšímu národnímu cítění. c. ke krizi společenských věd. d. ke kritice socialismu.
2. Text uvádí vznik sociologie jako příčinu rozvoje přemýšlení nad lepší možnou organizací Evropských států.
a. Ano. b. Ne.
3. Autor v textu otevřeně hodnotí Velikou francouzskou revoluci jako pozitivní událost. a. Ano, protože podnítila rozvoj politického myšlení. b. Ne, autor ji hodnotí jako negativní událost. c. Ne, autor ji nehodnotí, pouze popisuje její historický vliv.
Součet slov textů varianty A: 493 slov
135
Version B
Text 1 (Návod k obsluze Zetor 5211 – 7245)
Při zahřívání motoru elektrickým ohřívačem chladicí kapaliny je nutno překontrolovat přívod elektrického proudu, zasunout zástrčku do ohřívače a potom připojit na síť. Po ukončení zahřívání odpojte od elektrické sítě. Až potom vytáhněte zástrčku z ohřívače.
(35 slov)
1. Text je a. popisem, jak správně postupovat v případě přehřívání motoru. b. popisem, jak správně a bezpečně zapojit elektrickou síť. c. popisem bezpečného postupu zahřívání motoru pomocí elektrického ohřívače. d. doporučením toho, jak lze efektivně využít elektrického ohřívače.
2. Autor v textu uvádí konkrétní rizika, která má špatné zacházení s elektrickým ohřívačem.
a. Ano. b. Ne.
Text 2 (Freud, 1937)
Rozbor příčin, vyvolávajících sen, zaujímá v pojednání spisovatelů velmi mnoho místa. Že se tento problém vynořil teprve, když se sen stal předmětem biologického bádání, je samozřejmé. Staří, kteří považovali sen za seslaný bohy, nepotřebovali hledat zdroj podnětů, vyvolávajících sen; sen pramenil z vůle božské nebo démonické síly, obsah snu z jejího vědění nebo záměru. Ve vědě se brzy vynořila otázka, zda podnět k snění je vždycky týž, anebo může být mnohonásobný, a s otázkou úvaha, zda příčinné vysvětlování snu patří do psychologie nebo spíše fyziologie.
(85 slov)
1. Uvedený text lze popsat jako a. přehled historického rozvoje zájmu o zkoumání příčin snu. b. popis správného postupu výkladu snů. c. kritiku nevědeckých vysvětlení původu snů. d. vysvětlení toho, jak může mnoho různých podnětů vést ke stejnému snovému
obsahu.
2. Text uvádí, že si ve starověku lidé sen vysvětlovali na základě pohybu tělních tekutin. a. Ano. b. Ne.
Text 3 (Russell, 1993)
Začněme slovem “skutečný”. Rozhodně existují objekty vnímání a tedy, má-li být otázka, zda tyto objekty jsou skutečné, otázkou relativní, musí ve světě existovat druhy objektů, totiž skutečné a neskutečné, a o neskutečných se předpokládá, že to jsou v podstatě takové objekty, které neexistují. Otázka, které vlastnosti musí mít nějaký objekt, aby to byl skutečný objekt, je otázkou, na kterou existuje málokdy, existuje-li vůbec nějaká, přiměřená odpověď.
(66 slov)
1. Lze říci, že hlavním cílem textu je… a. popsat typy neskutečných objektů. b. poukázat na problematičnost pojmu „skutečný“. c. popsat, jak funguje zkreslení lidského vnímání. d. popsat vlastnosti, které by měl mít skutečný objekt.
2. Text přímo vyjadřuje pochybnost o tom, zda jsou objekty vnímání skutečné. a. Ano. b. Ne.
136
3. Autor v textu řeší, zda vůbec lze definovat podmínky pro „skutečnost“ objektů.
a. Ano. b. Ne.
Text 4 (Nakonečný, 1995)
Co vyjadřují takové pojmy jako: vřelý, uzavřený, agresivní, bázlivý, prudký apod.? Vyjadřují obvykle více či méně oprávněné zobecnění pozorovaných projevů osobnosti, tedy jakési popisné charakteristiky osobnosti pozorovaného jedince. Existuje několikerý způsob charakterizování osobnosti jedince, které vyjadřují různý stupeň zobecněného pozorování, které má dvě východiska: prvním je pozorování projevů jedince v různých, ale srovnatelných situacích, a druhým je pozorování opakovaných projevů v takových situacích. Za těchto podmínek je možno dospět k obvyklé adjektivní psychologické charakteristice jedince, tj. označit jej určitou vlastností osobnosti, jako je např. bázlivost, označit jej za bázlivého.
(89 slov)
1. Autor mluví mimo jiné o podmínkách, které je potřeba naplnit, pokud a. chceme člověka označit nějakou vlastností. b. chceme nezaujatě pozorovat chování jedince. c. chceme aplikovat poznatky psychologie osobnosti v praxi. d. chceme efektivně zkoumat procesy jako paměť nebo vnímání.
2. Autor v textu poukazuje na slabé stránky adjektivní psychologie. a. Ano. b. Ne.
Text 5 (Kant, 2016)
U člověka (jako jediného rozumného tvora na zemi) by se měly ty přírodní vlohy, které jsou zaměřeny na užití jeho rozumu, plně rozvinout jen v rodu, nikoli však v jednotlivci. Rozum u nějakého tvora je schopnost rozšířit pravidla a záměry použití všech jeho sil daleko za přírodní instinkt a rozum nezná žádné hranice svých rozvrhů. Sám však nepůsobí instinktivně, nýbrž vyžaduje pokusy, cvičení a vyučování, aby pozvolna postupoval od jednoho stupně nahlédnutí k druhému.
(74 slov)
1. Autor v textu tvrdí, že: a. Žádný jednotlivec nedisponuje rozumem, disponuje jím pouze rod. b. Vlohy k užívání rozumu se plně nerozvíjí v jednotlivci, ale pouze v rodu. c. Člověk, na rozdíl od ostatních tvorů, disponuje přírodními vlohami i na
úrovni jednotlivce, nikoli pouze rodu. d. Člověk se liší od ostatních tvorů v tom, že jako jediný své přírodní vlohy
rozvíjí pomocí pokusů, cvičení a vyučování.
2. V textu autor popisuje rozum jako a. schopnost využít svých sil za hranice přírodního instinktu. b. schopnost využít svých sil k jednání proti svému přírodnímu instinktu. c. instinktivní schopnost umožňující využít co nejvhodněji své přírodní vlohy. d. schopnost pochopit důsledky, ke kterým vede jednání na základě přírodního
instinktu.
137
Text 6 (Havel, 1990)
Jedna zvláštnost, kterou se náš systém liší od různých jiných moderních diktatur, vychází z dědictví původního “dobrého pochopení” některých problémů společnosti. Náš systém disponuje nepoměrně konciznější, logicky strukturovanou, obecně srozumitelnou a ze své podstaty velice pružnou ideologií, která při své komplexnosti a uzavřenosti nabývá až povahy jakéhosi sekularizovaného náboženství: nabízí člověku hotovou odpověď na jakoukoli otázku, nelze ji dost dobře přijmout jen částečně a její přijetí zasahuje hluboko do lidské existence.
(71 slov)
1. Hlavní argument textu je, že se „náš“ systém od jiných moderních diktatur liší a. v povaze jeho ideologie. b. v tom, jak rozumí hodnotě lidské existence. c. v tom, jak přistupuje k náboženství. d. v způsobu rozdělení moci.
2. Autor tvrdí, že ideologie “našeho systému” a. má i pozitivní přínos pro společnost. b. je lepší než ideologie moderních diktatur. c. je díky své logické strukturovanosti lepší než tradiční náboženství. d. je založena na „dobrém pochopení“ některých problémů, se kterými se společnost potýká.
Text 7 (Masaryk, 1924)
Všecky tyto snahy buditelské, všecko to nadšené úsilí o samostatnou a samobytnou kulturu národního obrození přirozeně musilo býti založeno na nějakém jednotném názoru na svět a na život. Nemá-li život lidí myslících býti řetězem jednotlivých episod – a takového života člověk jen poněkud myslivější a opravdovější prostě nesnese, – musí všecka práce myšlenková, i praktická, založena býti na jistém a pevném základě filosofickém. Buď si základ ten jakýkoli, ale každý, kdo skutečně myslí, jej má, míti jej musí.
(76 slov)
1. Uvedený text lze popsat jako a. kritiku nedostatečného filosofického základu obrozeneckých snah. b. vysvětlení nutnosti jednotného filosofického názoru pro obrozenecké úsilí. c. popis vlivu epizod lidského života na rozvoj potřeby filosofického základu a
přirovnání k obrozeneckému úsilí. d. vysvětlení příčin rozdílu ve filosofických názorech obrozeneckých myslitelů.
2. Autor v textu tvrdí, že každý, kdo o věcech přemýšlí, staví své myšlení na nějakém filosofickém základě.
a. Ano. b. Ne.
3. Autor popisuje hlavní argumenty vytvářející jednotný filosofický základ obrozeneckého úsilí.
a. Ano. b. Ne.
Součet slov textů varianty B: 496 slov

138
Appendix 4. Task instructions
A. Control task
Slide 1:
Čtěte prosím pozorně následující instrukce.
Bude Vám prezentováno 7 krtákých textů o délce 25 – 100 slov. Za každým z textů následují 2-3 otázky na prozoumění textu s nucenou volbou. Na otázky odpovídejte vždy pouze na základě informací, které se nachází v textu.
Jednotlivé úlohy (texty + obrázky) jsou obdobné cvičné úloze, kteoru jste si vyzkoušeli na začátku experimentu. Texty jsou seřazeny dle vzrůstající náročnosti.
Data z této úlohy budou využita pro zkoumání obecných tendencí ve čtení u úzkostných a neúzkostných jedinců.
B. Ego-threatening instructions
Slide 1:
Čtěte prosím pozorně následující instrukce.
Slide 2:
Bude Vám prezentováno 7 krtákých textů o délce 25 – 100 slov. Za každým z textů následují 2-3 otázky na prozoumění textu s nucenou volbou. Na otázky odpovídejte vždy pouze na základě informací, které se nachází v textu.
Jednotlivé úlohy (texty + obrázky) jsou obdobné cvičné úloze, kteoru jste si vyzkoušeli na začátku experimentu. Texty jsou seřazeny dle vzrůstající náročnosti.
Slide 3:
Vaším úkolem je přečíst text co nejrychleji a ZÁROVEŇ dosáhnout co nejlepšího možného porozumění textu.
Vybrané texty jsou náročné, proto je třeba Vaší úplné pozornosti.
Jakmile je text zobrazen, můžete u něj setrvat jak dlouho potřebujete, ale po stisknutí mezerníku už se k němu nelze vracet.
Slide 4:
V této úloze se měří čas. Čas se měří pouze během čtení textů, během odpovídání na otázky se čas neměří.
Slide 5:
Začátek měření času oznámí zvykový signál.
Slide 6:
Data z této úlohy budou využita k porovnání individuálních rozdílů v čtecí efektivitě, včetně srovnání efektivity u úzkostných a neúzkostných jedinců.
Čtecí efektivita je poměr mezi rychlostí četby a porozuměním textu. Schopnost efektivně číst koreluje dle výzkumů s inteligencí a s akademickým úspěchem.
U ego-ohrožující úlohy dále před každým textem předcházelo odpočítávání. Na obrazovce se obrazila po sobě čísla 3, 2, 1 a poté obrázek se stopkami zároveň se zvukem pípnutí. Poté se účastnikovi zobrazil text.
139
Appendix 5. Link to tailored software for computing regressions Software for computing time spent on regressions on the basis of BeGaze single event
statistics is freely accessible at:
https://gitlab.com/ondrej.takacs/regrese?fbclid=IwAR3zWVt5zB4xWxHqnRbXGF2y0oJMk1C4jTSyQa8UXHfVwGoximd07ed6NQw
The program works best for fairly precisely measured gaze data. For data with larger
offsets or slanted scanpaths, comparing the software output with participants’
scanpaths manually is recommended to correct for possible errors, especially in the
detection of between-line jumps.
QR code to link:

140
Appendix 6. Manipulation check items and combined scores
All items were answered on a 5 point likert scale, with 5 denoting maximum agreemetg and/or frequency. Items
A3 and C5 are reversed.
Individual items:
A. Jak jste se během úlohy cítili? 1. Během úlohy jsem se cítil/a stísněný/á a neklidný/á. 2. Během úlohy jsem byl/a nervózní. 3. Během úlohy jsem se cítil/a příjemně. 4. Během úlohy jsem se cítil/a napjatý/á, v tenzi.
Skórování: (1) = vůbec ne, (2) = spíše ne, pouze nepatrně, (3) = mírně/nelze určit, (4) = spíše ano, (5) = ano, velmi
B. Somatické příznaky úzkosti. 1. Během úlohy, ve které se ne/odpočítával čas, jsem si u sebe všiml/a příznaků
úzkosti v těle (např. zrychlený tep, studené ruce, pot, třes, nevolnost,...).
Skórování: (1) = ne, nikdy, (2) = spíše ne, jen vzácně, (3) = občas, (4) = ano, častěji, (5) = ano, velmi často
C. Co Vás během úlohy napadalo? 1. Během úlohy jsem si dělal/a starost, abych podal/a dostatečně dobrý výkon. 2. Během úlohy mě napadalo, jak se mi oproti ostatním daří. 3. Během úlohy mě napadaly o sobě pochybující myšlenky typu: „Určitě to
nezvládnu.“ „Dělám to celé špatně.“ „Jsem horší než ostatní.“ 4. Během úlohy se mi stávalo, že jsem „četl/a očima“, aniž bych vnímal/a text. 5. Během úlohy se mi dařilo soustředit se na daný úkol.
Skórování: (1) = ne, nikdy, (2) = spíše ne, jen vzácně, (3) = občas, (4) = ano, častěji, (5) = ano, velmi často
D. Jak na Vás působily úlohy? 1. Texty v úloze byly náročné na porozumění. 2. Otázky v úloze byly náročné na porozumění. 3. K zodpovězení otázek bylo třeba zapamatování si konkrétních pasáží textu. 4. Během zodpovídání otázek jsem tipoval/a.
Skórování: (1) = vůbec ne, nikdy, (2) = spíše ne / málo kdy, (3) = něco mezi / jak kdy, (4) = spíše ano / častěji, (5) = ano, velmi / velmi často
Combined scores:
1. Emotion: mean of the sum of scores in items: A1, A2, A3 (reversed), A4 and B.
2. Worry: mean of the sum of scores in items: C1, C2 and C3.
3. Inability to focus: mean of the sum of scores in items: C4 and C5.
4. Difficulty: mean of the sum of scores in items: D1, D2 and D3.
5. General effect: mean of the sum of scores in items: A1, A2, A3 (reversed), A4, B, C1, C3 and C4. (Items that most loaded the main factor in both condition according factor analysis.)

Appe
ndix
7. D
escr
iptiv
e st
atis
tics
of m
anip
ulat
ion
chec
k ite
ms
Tab
le A
7
D
escrip
tive s
tatis
tics o
f man
ipula
tion
chec
k item
s (N
=33)
C
ontr
ol
E
go-th
reat
M
M
D
mod
e (n)
SD
M
MD
m
ode (
n)
SD
A1.
Une
asy,
res
tless
. 2.
21
2 2
(15)
1.
11
2.
36
2 2
(10)
1.
03
A2.
Ner
vous
. 2.
39
2 1
(9)
1.12
2.
58
3 4
(10)
1.
17
A3.
Fel
t com
fort
able
. (R
ever
sed.
) 2.
82
3 3
(11)
1.
10
2.
76
3 3
(13)
0.
97
A4.
Ten
sion
. 2.
58
2 2
(10)
1.
20
2.
97
3 4
(12)
1.
31
B. S
omat
ic s
ympt
oms
of a
nxie
ty.
2.12
2
1 (1
1)
0.99
2.46
2
2 (1
0)
1.03
C1.
Wor
ries
abo
ut p
erfo
rman
ce.
2.85
3
4 (1
0)
1.20
3.
33
4 4
(14)
1.
24
C2.
Com
pari
ng o
nese
lf w
ith o
ther
s. 2.
33
2 1
(10)
1.
16
2.
58
2 2
(9)
1.28
C3.
Sel
f-do
ubts
. 2.
21
2 1
(13)
1.
34
2.
36
2 2
(11)
1.
27
C4.
Min
dles
s re
adin
g.
3.73
4
4 (1
4)
0.94
3.
85
4 4
(13)
1.
03
C5.
Abi
lity
to fo
cus.
(Rev
erse
d.)
2.88
3
3 (1
7)
0.82
2.84
3
2 (1
2)
0.91
D1.
Tex
t diff
icul
ty.
3.33
3
4 (1
4)
0.92
3.
61
4 4
(14)
0.
90
D2.
Que
stio
n di
fficu
lty.
2.58
2
2 (1
7)
0.94
2.
64
3 2
(11)
1.
08
D3.
Nee
d to
mem
oriz
e te
xt.
3.06
3
3 (1
4)
0.93
3.
24
3 3
(13)
0.
87
D4.
Res
pons
e gu
essi
ng.
2.61
3
3 (1
5)
0.83
2.67
3
2 (1
4)
0.82
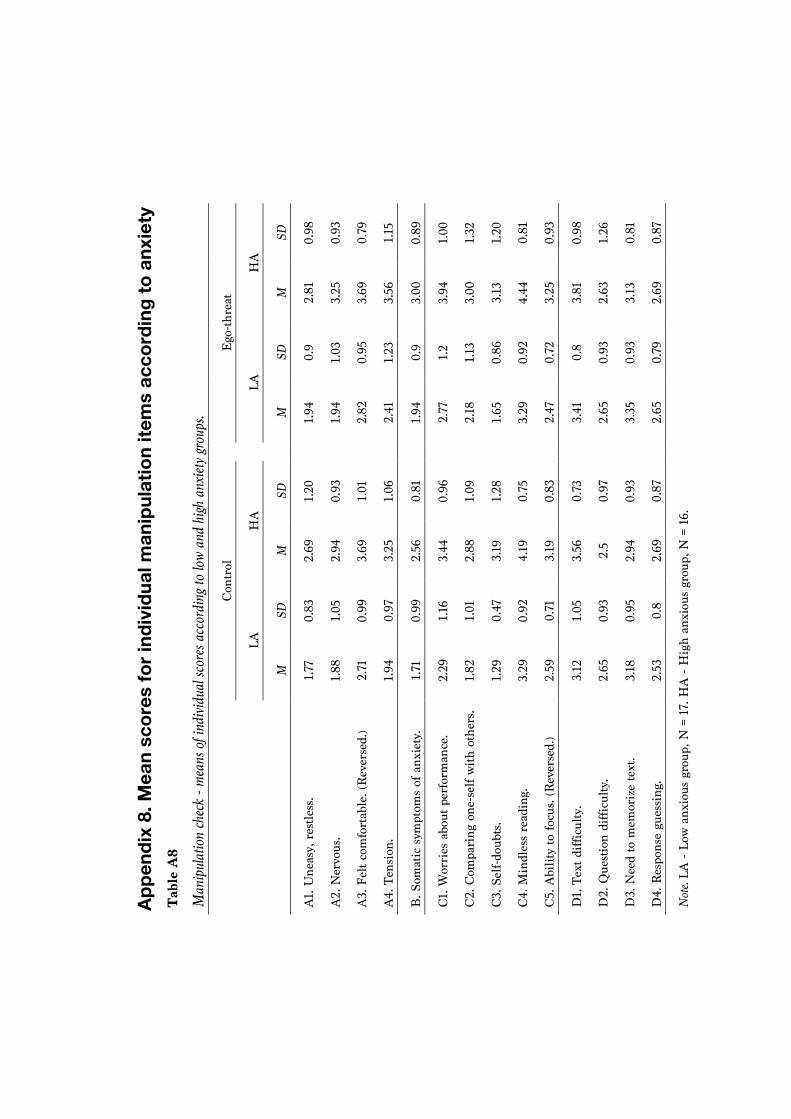
Appe
ndix
8. M
ean
scor
es fo
r ind
ivid
ual m
anip
ulat
ion
item
s ac
cord
ing
to a
nxie
ty
Tab
le A
8
M
anip
ulatio
n ch
eck -
mea
ns o
f ind
ividu
al sco
res a
ccor
ding
to lo
w an
d hig
h an
xiety
grou
ps.
C
ontr
ol
E
go-th
reat
LA
H
A
LA
H
A
M
SD
M
SD
M
SD
M
SD
A1.
Une
asy,
res
tless
. 1.
77
0.83
2.
69
1.20
1.94
0.
9 2.
81
0.98
A2.
Ner
vous
. 1.
88
1.05
2.
94
0.93
1.94
1.
03
3.25
0.
93
A3.
Fel
t com
fort
able
. (R
ever
sed.
) 2.
71
0.99
3.
69
1.01
2.82
0.
95
3.69
0.
79
A4.
Ten
sion
. 1.
94
0.97
3.
25
1.06
2.41
1.
23
3.56
1.
15
B. S
omat
ic s
ympt
oms
of a
nxie
ty.
1.71
0.
99
2.56
0.
81
1.
94
0.9
3.00
0.
89
C1.
Wor
ries
abo
ut p
erfo
rman
ce.
2.29
1.
16
3.44
0.
96
2.
77
1.2
3.94
1.
00
C2.
Com
pari
ng o
ne-s
elf w
ith o
ther
s. 1.
82
1.01
2.
88
1.09
2.18
1.
13
3.00
1.
32
C3.
Sel
f-do
ubts
. 1.
29
0.47
3.
19
1.28
1.65
0.
86
3.13
1.
20
C4.
Min
dles
s re
adin
g.
3.29
0.
92
4.19
0.
75
3.
29
0.92
4.
44
0.81
C5.
Abi
lity
to fo
cus.
(Rev
erse
d.)
2.59
0.
71
3.19
0.
83
2.
47
0.72
3.
25
0.93
D1.
Tex
t diff
icul
ty.
3.12
1.
05
3.56
0.
73
3.
41
0.8
3.81
0.
98
D2.
Que
stio
n di
fficu
lty.
2.65
0.
93
2.5
0.97
2.65
0.
93
2.63
1.
26
D3.
Nee
d to
mem
oriz
e te
xt.
3.18
0.
95
2.94
0.
93
3.
35
0.93
3.
13
0.81
D4.
Res
pons
e gu
essi
ng.
2.53
0.
8 2.
69
0.87
2.65
0.
79
2.69
0.
87
Not
e. LA
- L
ow a
nxio
us g
roup
, N =
17.
HA
- H
igh
anxi
ous
grou
p, N
= 1
6.
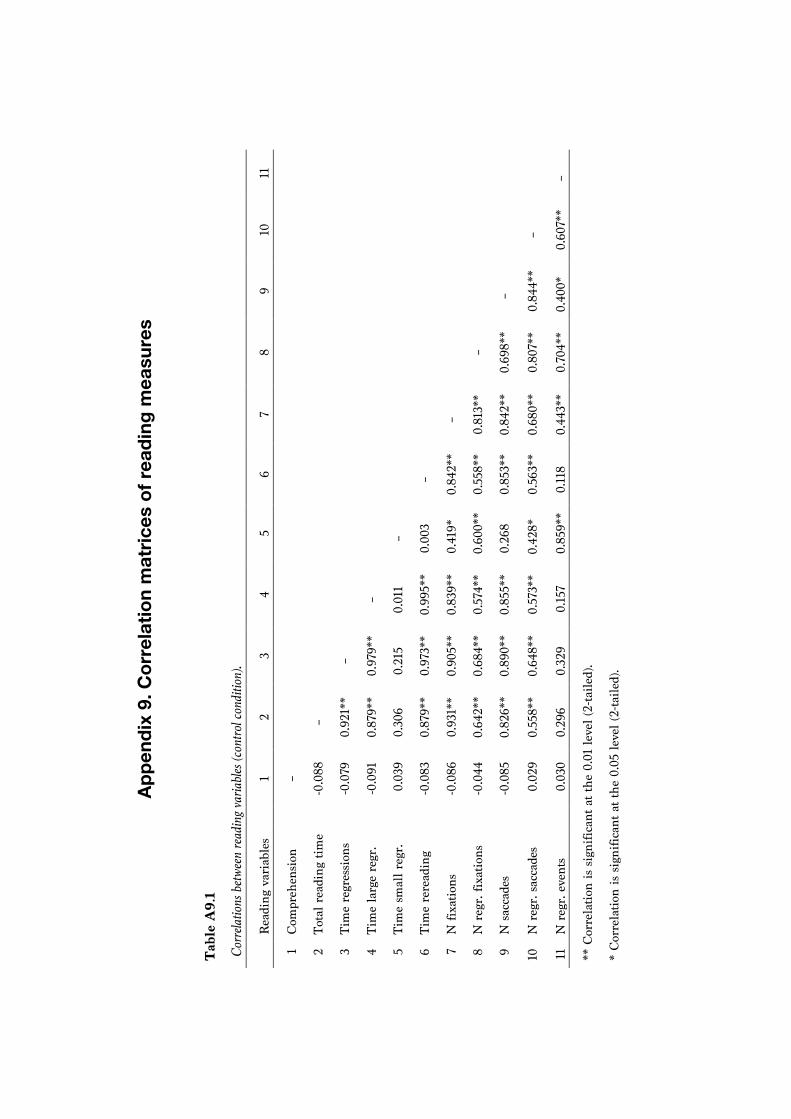
Appe
ndix
9. C
orre
latio
n m
atric
es o
f rea
ding
mea
sure
s
Tab
le A
9.1
Cor
relat
ions
betw
een
read
ing v
aria
bles (
cont
rol c
ondi
tion)
.
Rea
ding
var
iabl
es
1
2 3
4 5
6 7
8 9
10
11
1 C
ompr
ehen
sion
–
2
Tota
l rea
ding
tim
e
-0.0
88
–
3 Ti
me
regr
essi
ons
-0
.079
0.
921*
* –
4 Ti
me
larg
e re
gr.
-0
.091
0.
879*
* 0.
979*
* –
5
Tim
e sm
all r
egr.
0.0
39
0.30
6
0.21
5 0.
011
–
6
Tim
e re
read
ing
-0
.083
0.
879*
* 0.
973*
* 0.
995*
* 0.
003
–
7 N
fixa
tions
-0.0
86
0.93
1**
0.90
5**
0.83
9**
0.4
19*
0.84
2**
–
8
N r
egr.
fixa
tions
-0.0
44
0.64
2**
0.68
4**
0.57
4**
0.60
0**
0.55
8**
0.81
3**
–
9 N
sac
cade
s
-0.0
85
0.82
6**
0.89
0**
0.85
5**
0.26
8 0.
853*
* 0.
842*
* 0.
698*
* –
10
N r
egr.
sac
cade
s
0.0
29
0.55
8**
0.64
8**
0.57
3**
0.42
8*
0.56
3**
0.68
0**
0.80
7**
0.84
4**
–
11
N r
egr.
eve
nts
0
.030
0.
296
0.32
9 0
.157
0.
859*
* 0.
118
0.44
3**
0.70
4**
0.40
0*
0.60
7**
–
** C
orre
latio
n is
sig
nific
ant a
t the
0.0
1 le
vel (
2-ta
iled)
.
*
Cor
rela
tion
is s
igni
fican
t at t
he 0
.05
leve
l (2-
taile
d).

Appe
ndix
9. C
orre
latio
n m
atric
es o
f rea
ding
mea
sure
s T
able
A9.
2
Co
rrelat
ions
betw
een
read
ing v
aria
bles (
ego-
thre
at).
R
eadi
ng v
aria
bles
1 2
3 4
5 6
7 8
9 10
11
1 C
ompr
ehen
sion
–
2
Tota
l rea
ding
tim
e
0.05
9 –
3
Tim
e re
gres
sion
s
0.18
0 0.
920*
* –
4 Ti
me
larg
e re
gr.
0.
156
0.89
4**
0.98
6**
–
5 Ti
me
smal
l reg
r.
0.
157
0.26
2 0.
203
0.03
5 –
6 Ti
me
rere
adin
g
0.15
6 0.
902*
* 0.
981*
* 0.
997*
* 0
.028
–
7
N fi
xatio
ns
0.
094
0.93
7**
0.92
5**
0.88
4**
0.3
48*
0.89
1**
–
8
N r
egr.
fixa
tions
0.15
5 0.
722*
* 0.
809*
* 0.
738*
* 0
.513
**
0.73
1**
0.84
3**
–
9 N
sac
cade
s
0.07
0 0.
772*
* 0.
874*
* 0.
860*
* 0
.184
0.
851*
* 0.
856*
* 0.
781*
* –
10
N r
egr.
sac
cade
s
0.17
0 0.
532*
* 0.
686*
* 0.
611*
* 0
.515
**
0.58
6**
0.68
5**
0.85
9**
0.79
8**
–
11
N r
egr.
eve
nts
0.
174
0.28
2
0.3
41
0.19
9 0
.865
**
0.16
0 0
.406
* 0.
598*
* 0.
364*
0.
675*
* –
** C
orre
latio
n is
sig
nific
ant a
t the
0.0
1 le
vel (
2-ta
iled)
.
*
Cor
rela
tion
is s
igni
fican
t at t
he 0
.05
leve
l (2-
taile
d).
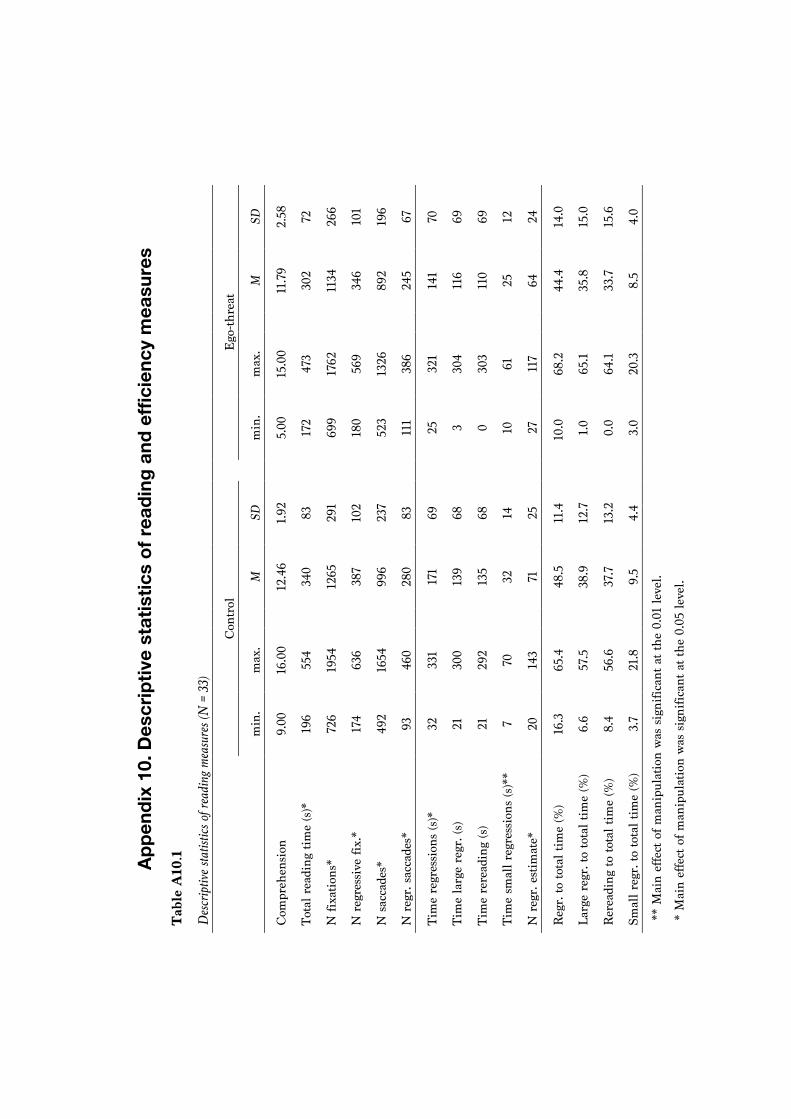
Appe
ndix
10.
Des
crip
tive
stat
istic
s of
read
ing
and
effic
ienc
y m
easu
res
Tab
le A
10.1
Des
crip
tive s
tatis
tics o
f rea
ding
mea
sure
s (N
= 3
3)
C
ontr
ol
E
go-th
reat
m
in.
max
.
M
SD
m
in.
max
.
M
SD
Com
preh
ensi
on
9.00
16
.00
12
.46
1.92
5.00
15
.00
11
.79
2.58
Tota
l rea
ding
tim
e (s
)*
196
554
34
0 83
172
473
30
2 72
N fi
xatio
ns*
726
1954
1265
29
1
699
1762
1134
26
6
N r
egre
ssiv
e fix
.*
174
636
38
7 10
2
180
569
34
6 10
1
N s
acca
des*
49
2 16
54
99
6 23
7
523
1326
892
196
N r
egr.
sac
cade
s*
93
460
28
0 83
111
386
24
5 67
Tim
e re
gres
sion
s (s
)*
32
331
17
1 69
25
321
14
1 70
Tim
e la
rge
regr
. (s)
21
30
0
139
68
3
304
11
6 69
Tim
e re
read
ing
(s)
21
292
13
5 68
0 30
3
110
69
Tim
e sm
all r
egre
ssio
ns (s
)**
7 70
32
14
10
61
25
12
N r
egr.
est
imat
e*
20
143
71
25
27
117
64
24
Reg
r. to
tota
l tim
e (%
) 16
.3
65.4
48.5
11
.4
10.0
68
.2
44
.4
14.0
Larg
e re
gr. t
o to
tal t
ime
(%)
6.6
57.5
38.9
12
.7
1.
0 65
.1
35
.8
15.0
Rer
eadi
ng to
tota
l tim
e (%
) 8.
4 56
.6
37
.7
13.2
0.0
64.1
33.7
15
.6
Smal
l reg
r. to
tota
l tim
e (%
) 3.
7 21
.8
9.
5 4.
4
3.0
20.3
8.5
4.0
** M
ain
effe
ct o
f man
ipul
atio
n w
as s
igni
fican
t at t
he 0
.01
leve
l.
* M
ain
effe
ct o
f man
ipul
atio
n w
as s
igni
fican
t at t
he 0
.05
leve
l.
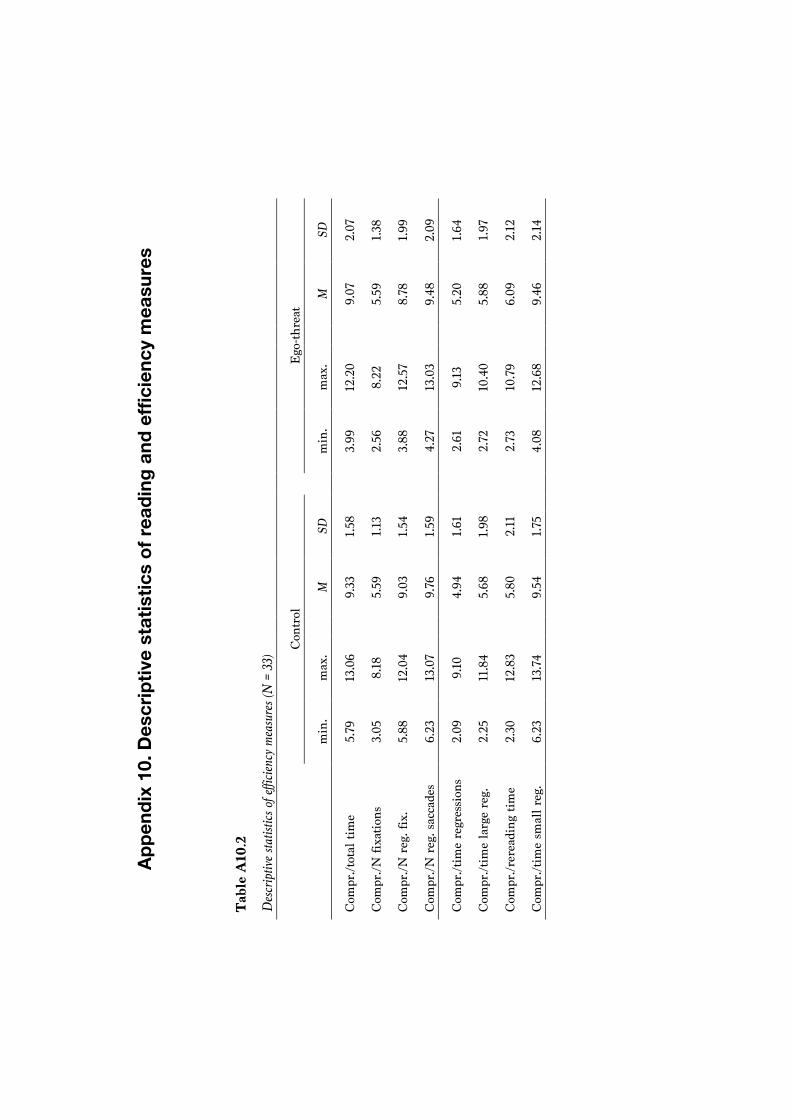
Appe
ndix
10.
Des
crip
tive
stat
istic
s of
read
ing
and
effic
ienc
y m
easu
res
T
able
A10
.2
D
escr
iptiv
e sta
tistic
s of e
fficie
ncy m
easu
res (
N =
33)
C
ontr
ol
E
go-th
reat
m
in.
max
.
M
SD
m
in.
max
.
M
SD
Com
pr./t
otal
tim
e 5.
79
13.0
6
9.33
1.
58
3.
99
12.2
0
9.07
2.
07
Com
pr./N
fixa
tions
3.
05
8.18
5.59
1.
13
2.
56
8.22
5.59
1.
38
Com
pr./N
reg
. fix
. 5.
88
12.0
4
9.03
1.
54
3.
88
12.5
7
8.78
1.
99
Com
pr./N
reg
. sac
cade
s 6.
23
13.0
7
9.76
1.
59
4.
27
13.0
3
9.48
2.
09
Com
pr./t
ime
regr
essi
ons
2.09
9.
10
4.
94
1.61
2.61
9.
13
5.
20
1.64
Com
pr./t
ime
larg
e re
g.
2.25
11
.84
5.
68
1.98
2.72
10
.40
5.
88
1.97
Com
pr./r
erea
ding
tim
e 2.
30
12.8
3
5.80
2.
11
2.
73
10.7
9
6.09
2.
12
Com
pr./t
ime
smal
l reg
. 6.
23
13.7
4
9.54
1.
75
4.
08
12.6
8
9.46
2.
14

Appe
ndix
11.
Effe
cts
of a
nxie
ty o
n re
adin
g an
d ef
ficie
ncy
mea
sure
s T
able
A11
.1
M
ain
effec
ts an
d in
terac
tion
effec
ts of
anxie
ty an
d m
anip
ulatio
n on
read
ing v
aria
bles.
M
ain
anxi
ety
M
ain
man
ipul
atio
n
Inte
ract
ion
F
(1, 3
1)
p η p²
F
(1, 3
1)
p η p²
η G²
F
(1, 3
1)
p η p²
η G²
Com
preh
ensi
on
0.01
0.
936
0.00
2.02
0.
170
0.06
–
0.
56
0.46
2 0.
02
–
Tota
l rea
ding
tim
eb 2.
97
0.09
5 0.
09
7.
29*
0.01
0 0.
19
0.09
3.51
0.
070
0.10
–
N fi
xatio
nsb
1.62
0.
212
0.05
7.10
* 0.
012
0.19
0.
09
4
.78*
0.
036
0.13
0.
06
N r
egre
ssiv
e fix
. 0.
90
0.35
1 0.
35
6.
90*
0.01
3 0.
18
0.07
6.1
2*
0.01
9 0.
17
0.06
N s
acca
des
6.6
2*
0.01
5 0.
18
4.
78*
0.03
6 0.
13
0.08
2.24
0.
145
0.07
–
N r
egr.
sac
cade
sa 3.
16
0.08
5 0.
09
6.
07*
0.01
9 0.
16
0.08
1.95
0.
173
0.06
–
Tim
e re
gres
sion
s 7
.38*
0.
01
0.19
5.31
* 0.
028
0.15
0.
07
4.
14
0.05
1 0.
12
–
Tim
e la
rge
regr
.b 8
.81*
* 0.
006
0.22
3.
17
0.08
5 0.
09
–
3.94
0.
056
0.11
–
Tim
e re
read
ing
8.6
5**
0.00
6 0.
22
3.98
0.
055
0.11
–
3.
28
0.08
0 0.
10
–
Tim
e sm
all r
egre
ssio
ns
0.35
0.
558
0.01
11.
90**
0.
002
0.28
0.
10
0.
20
0.65
7 0.
01
–
N r
egr.
est
imat
ea 0.
02
0.88
8 0.
00
6.
99*
0.01
3 0.
18
0.03
1.59
0.
217
0.05
–
Reg
r. to
tota
l tim
ea 1
0.27
**
0.00
3 0.
25
4
.60*
0.
040
0.13
0.
05
3.
69
0.06
4 0.
11
–
Larg
e re
gr. t
o to
tal t
ime
13.
03**
0.
001
0.30
1.88
0.
180
0.06
–
3.
57
0.06
8 0.
10
–
Rer
eadi
ng to
tota
l tim
ea 1
2.84
**
0.00
1 0.
29
3.
26
0.08
1 0.
10
–
2.54
0.
121
0.08
–
Smal
l reg
r. to
tota
l tim
e
2.19
0.
149
0.07
3.26
0.
081
0.10
–
0.
60
0.44
4 0.
02
– N
otes
. LA
- L
ow a
nxio
us g
roup
, N =
17.
HA
- H
igh
anxi
ous
grou
p, N
= 1
6.
a A
ccor
ding
to L
even
e's te
st, t
he v
aria
nces
wer
e un
equa
l for
low
and
hig
h-an
xiou
s in
divi
dual
s in
the
cont
rol c
ondi
tion
at th
e 0.
05 s
igni
fican
ce le
vel.
b A
ccor
ding
to L
even
e's te
st, t
he v
aria
nces
wer
e un
equa
l for
low
and
hig
h-an
xiou
s in
divi
dual
s in
the
ego-
thre
at c
ondi
tion
at th
e 0.
05 s
igni
fican
ce le
vel.
** E
ffect
was
sig
nific
ant a
t the
0.0
1 le
vel.
* E
ffect
was
sig
nific
ant a
t the
0.0
5 le
vel.

Appe
ndix
11.
Effe
cts
of a
nxie
ty o
n re
adin
g an
d ef
ficie
ncy
mea
sure
s T
able
A11
.2
M
ain
effec
ts an
d in
terac
tion
effec
ts of
anx
iety a
nd m
anip
ulatio
n on
effic
iency
varia
bles.
M
ain
anxi
ety
M
ain
man
ipul
atio
n
Inte
ract
ion
F
(1, 3
1)
p η p²
F
(1, 3
1)
p η p²
η G²
F
(1, 3
1)
p η p²
η G²
Com
pr./t
otal
tim
e 0.
40
0.53
1 0.
01
0.
46
0.50
2 0.
02
–
0.11
0.
741
0.00
–
Com
pr./N
fixa
tions
0.
84
0.36
6 0.
03
0.
00
0.98
0 0.
00
–
0.01
0.
921
0.00
–
Com
pr./N
reg
. fix
. 0.
28
0.60
2 0.
01
0.
43
0.51
5 0.
01
–
0.04
0.
844
0.00
–
Com
pr./N
reg
. sac
cade
sa 1.
95
0.17
3 0.
17
0.
48
0.49
5 0.
02
–
0.24
0.
625
0.01
–
Com
pr./t
ime
regr
essi
onsa
7.8
7**
0.00
9 0.
20
0.
56
0.46
1 0.
01
–
0.25
0.
622
0.01
–
Com
pr./t
ime
larg
e re
g.a
9.5
7**
0.00
4 0.
24
0.
23
0.63
3 0.
01
–
0.26
0.
614
0.01
–
Com
pr./r
erea
ding
tim
ea 9
.56*
* 0.
004
0.24
0.46
0.
501
0.02
–
0.
17
0.68
0 0.
01
–
Com
pr./t
ime
smal
l reg
. 0.
05
0.82
2 0.
00
0.
03
0.85
7 0.
00
–
0.53
0.
473
0.02
–
Com
pr./r
eg. t
o tim
e 2.
26
0.14
0 0.
07
0.
59
0.45
0 0.
02
–
0.08
0.
780
<0.
01
–
Com
pr./L
reg
to ti
me
6.54
0.
083
0.09
0.76
0.
390
0.02
–
0.
03
0.86
1 <0
.01
–
Com
pr./R
erea
d to
tim
e 3.
53
0.07
0 0.
10
0.
46
0.50
1 0.
02
–
0.06
0.
802
<0.0
1 –
Com
pr./S
reg
to ti
me
0.07
0.
790
<0.0
1
1.46
0.
236
0.05
–
0.
80
0.37
9 0
.03
–
Not
es. L
A -
Low
anx
ious
gro
up, N
= 1
7. H
A -
Hig
h an
xiou
s gr
oup,
N =
16.
a A
ccor
ding
to L
even
e's te
st, t
he v
aria
nces
wer
e un
equa
l for
low
and
hig
h-an
xiou
s in
divi
dual
s in
the
cont
rol c
ondi
tion
at th
e 0.
05 s
igni
fican
ce le
vel.
** E
ffect
was
sig
nific
ant a
t the
0.0
1 le
vel.
* E
ffect
was
sig
nific
ant a
t the
0.0
5 le
vel.
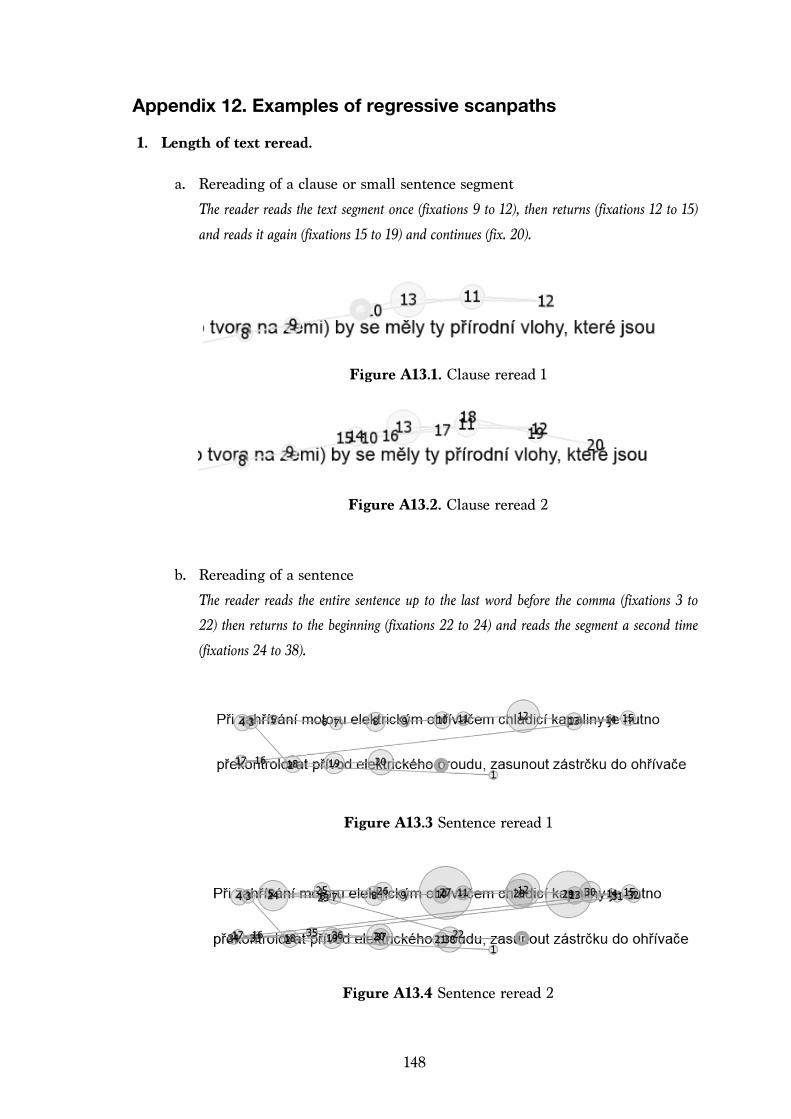
148
Appendix 12. Examples of regressive scanpaths
1. Length of text reread.
a. Rereading of a clause or small sentence segment
The reader reads the text segment once (fixations 9 to 12), then returns (fixations 12 to 15) and reads it again (fixations 15 to 19) and continues (fix. 20).
Figure A13.1. Clause reread 1
Figure A13.2. Clause reread 2
b. Rereading of a sentence
The reader reads the entire sentence up to the last word before the comma (fixations 3 to 22) then returns to the beginning (fixations 22 to 24) and reads the segment a second time (fixations 24 to 38).
Figure A13.3 Sentence reread 1
Figure A13.4 Sentence reread 2
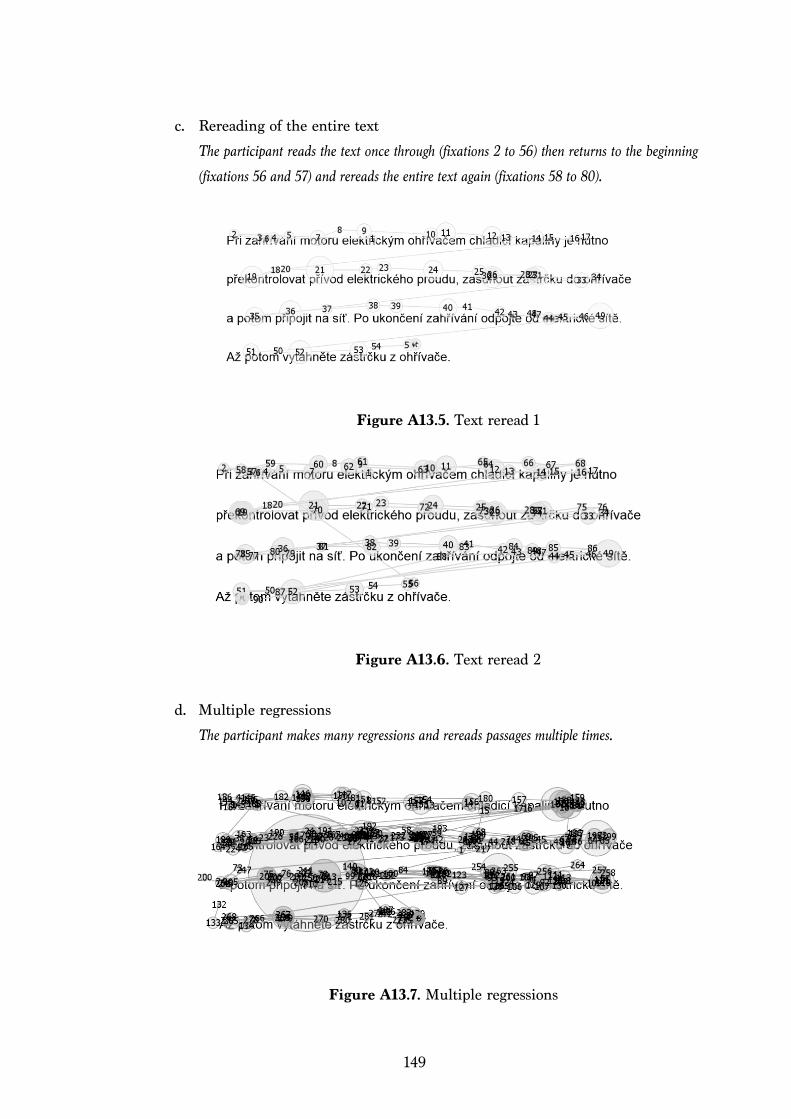
149
c. Rereading of the entire text
The participant reads the text once through (fixations 2 to 56) then returns to the beginning (fixations 56 and 57) and rereads the entire text again (fixations 58 to 80).
Figure A13.5. Text reread 1
Figure A13.6. Text reread 2
d. Multiple regressions
The participant makes many regressions and rereads passages multiple times.
Figure A13.7. Multiple regressions
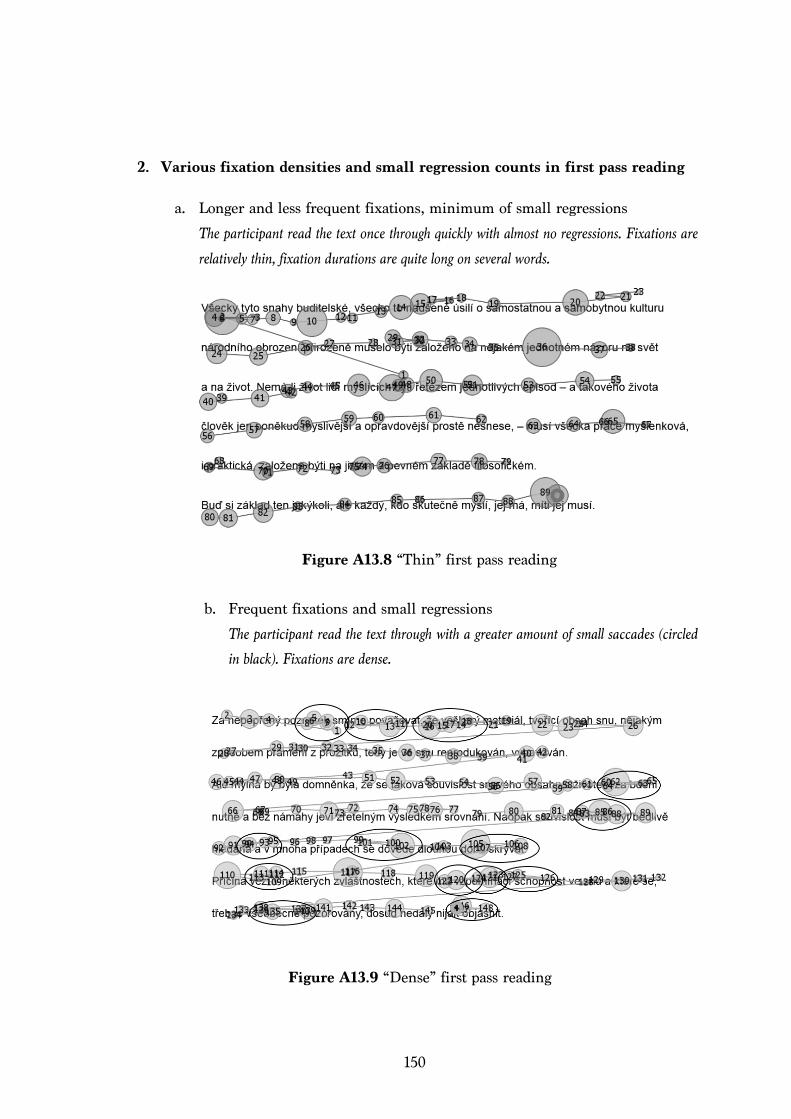
150
2. Various fixation densities and small regression counts in first pass reading
a. Longer and less frequent fixations, minimum of small regressions
The participant read the text once through quickly with almost no regressions. Fixations are relatively thin, fixation durations are quite long on several words.
Figure A13.8 “Thin” first pass reading
b. Frequent fixations and small regressions
The participant read the text through with a greater amount of small saccades (circled in black). Fixations are dense.
Figure A13.9 “Dense” first pass reading