Forest Service Heritage Times V12 N2 2002 William Reed, Editor
TEMPERATURE DETERMINATION OF A COLD N2
DISCHARGE PLASMA BY THE FIT OF THE EXPERIMENTALSPECTRA WITH THE SIMULATED EMISSION SPECTRA
M. BAZAVAN, I. IOVAUniversity of Bucharest, Faculty of Physics , POB MG-11, Romania, E-mail:
Abstract. We have had obtained the temperature of a cold hollowcathode electric discharge (HCED) plasma by fitting the experimentalrotational spectra of the vibrational-rotational N2 first negativesystem (FNS) and of second positive system (SPS) sequences, with thesimulate spectra of the same plasma. With the accordance of therotational temperature from different rotational transitions , withan accuracy of 10%, we found a local thermodynamic equilibrium(LTE) in a cold HCED plasma.Key words: Plasma spectroscopy, computational physics.
1. INTRODUCTION
Nitrogen plasma is a very important tool intreatment of different material surfaces and also inthe study of several atmospheric and physical andchemical medium processes. One of the most importantparameter in the plasma tool is the gas temperature(Tg). The electronic temperature (Te) is, generally,more greater than gas temperature, while the rotationtemperature (Tr) has, practically, the same value as thelast one [1, 2].
On these reason we have determined the rotationtemperature, by the fitting the experimental spectra ofthe FNS and SPS from a cold HCED in N2, with the samespectra simulated.
2.EXPERIMENTAL
Experimental spectra where obtained from amolecular nitrogen plasma, produced in a HCED device
presented by the authors in a early published paper[3].
The experimental data where achieved on a computerby using a leading spectral system consisting of a SPM-2 Zeiss 650 tr/mm monochromator coupled with a EMI-9558QB photomultiplier and a data acquisition system. Thevoltage was placed in the range 200-400 Volts, thegases pressures in the range of 0-8 Torr and thecurrent intensity 0-200 mA.
3. FUNDAMENTALS OF THE MOLECULAR SPECTROSCOPY
The rotational spectra corresponding to thetransitions FNS and SPSwere fitted using synthetic spectra following thesteps:
1. Upper and lower energy level corresponded tothe implied transitions:
(1)where the vibrational term is :
(2)and the rotational term:
(3)
(4)In the (1)-(4) equations the constants have thefollowing significance: v is the vibrational quantumnumber, J is the rotational quantum number, χe and yeare the anharmonicity constants, αe characterize thevibration-rotation interaction, Bv and Dv characterizeeach vibrational level.
The spin-orbit interacting energy:
2
(5)which for FNS is zero (Λ=0), and for SPS has aneglected value [3].
2. The wave number calculation:
(6)
(7)
(8)where R, Q, P represents those three branchescorrespond to the selection rules, respectively ΔJ=+1,0 and -1.
3. The relative intensity of a rotation spectralline is described by the follow relationship:
(9)where SJ'J'' is the Hönl-London factor which easily canbe see in [5,6], and CJ' is an alternating coefficientin the distribution intensity of a vibrational band,which depend on the nuclear spin I, which in thenitrogen molecular case (I=1) are the values(I+1)/(2I+1)=2/3 for the symmetric levels andrespectively I/(2I+1)=1/3 for the asymmetric levels.
4. Simulation of the intensity in the rotationalstructure of the vibrational band:
(10)where P(λ, λv'J'v''J'') represents the spectral lineprofile. In our case the apparatus spectral width ismore larger then the plasma broadening spectral line(Doppler, Stark). The profile function is assumed to beof a Gaussian tip:
(11)
3
where δλ is the full width at half maximum of the lineand in our case were approximate 2Å.
5. The fit of the simulated spectra with theexperimental spectra was made by the χ2 functionminimized:
(12) having the rotation temperature as a fittingparameter.
4. RESULTS AND DISCUTIONS
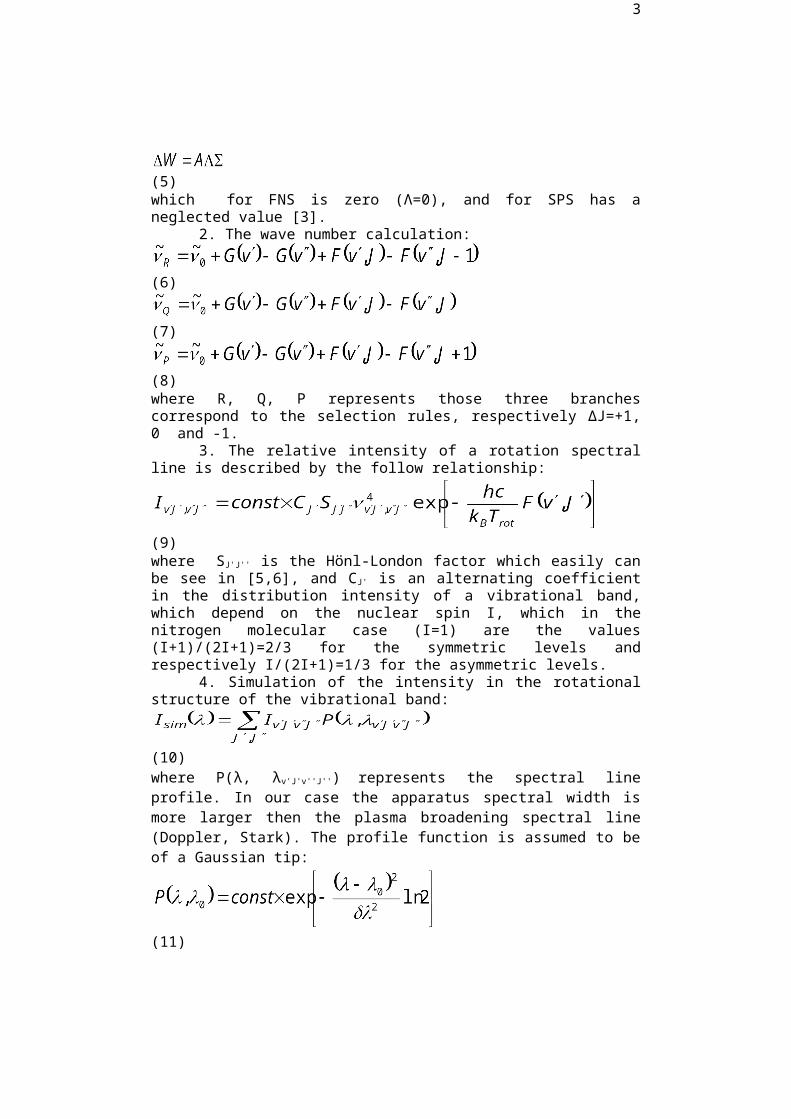
On the Fig. 1 we can see a nitrogen spectra fromthe molecular nitrogen HCED, containing the FNS and SPSbands.
Figure1. Molecular nitrogen spectra in the HCED
Because the rotational structure of the vibrationalbands in our conditions can' t be resolved, theBoltzmann method for temperature determination is notpossible. The rotational temperature was determined bythe fit of some vibrational bands belonging to theneutral nitrogen molecule SPS v'-v'': 0-2, 1-3, 1-0 andto the ionic nitrogen molecule FNS, v'-v'': 0-0, 0-1.The vibrational bands were choused in a such a way that
4
there baseline to be not influenced by the neighborhoodband.
3760 3765 3770 3775 3780 3785 3790 3795 3800 38050
0.05
0.1
0.15
0.2
0.25
0.3
0.35
0.4
0.45
0.5
[A]
I [a.u.]
[A] [A] [A] [A]
experimentalsimulated
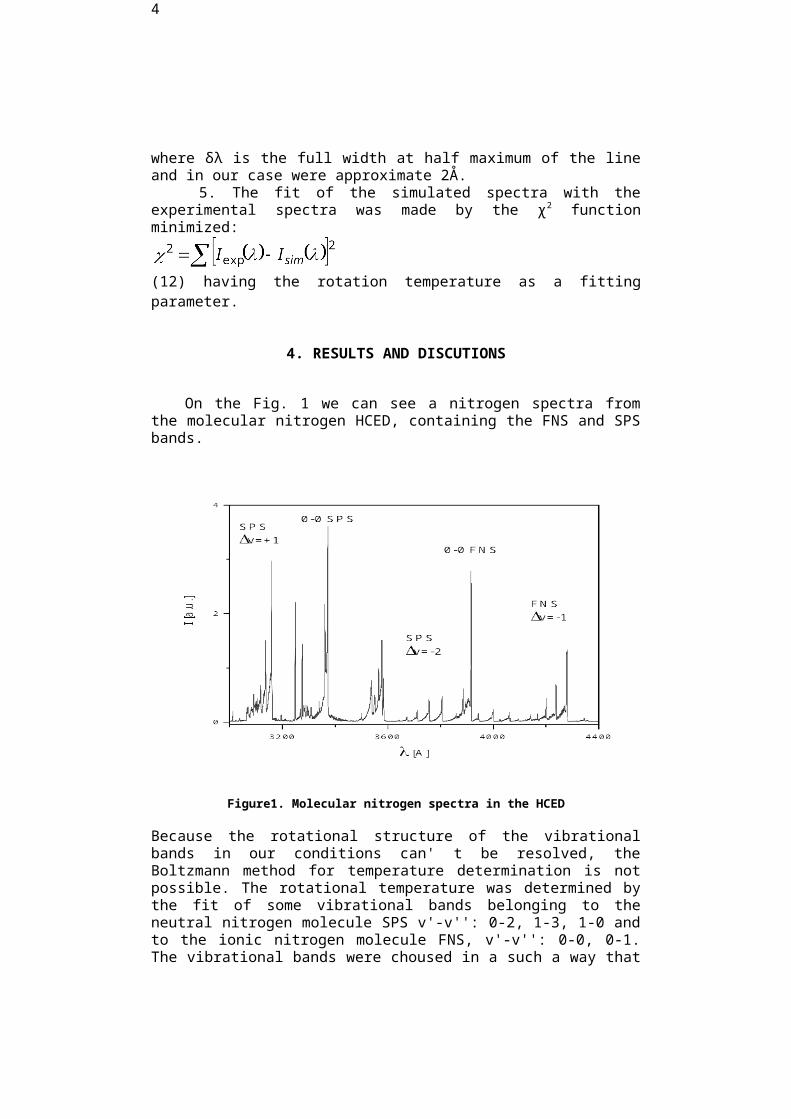
Figure 2. Experimental and simulated spectra belonging to 0-2 SPSλ=3805Ǻ
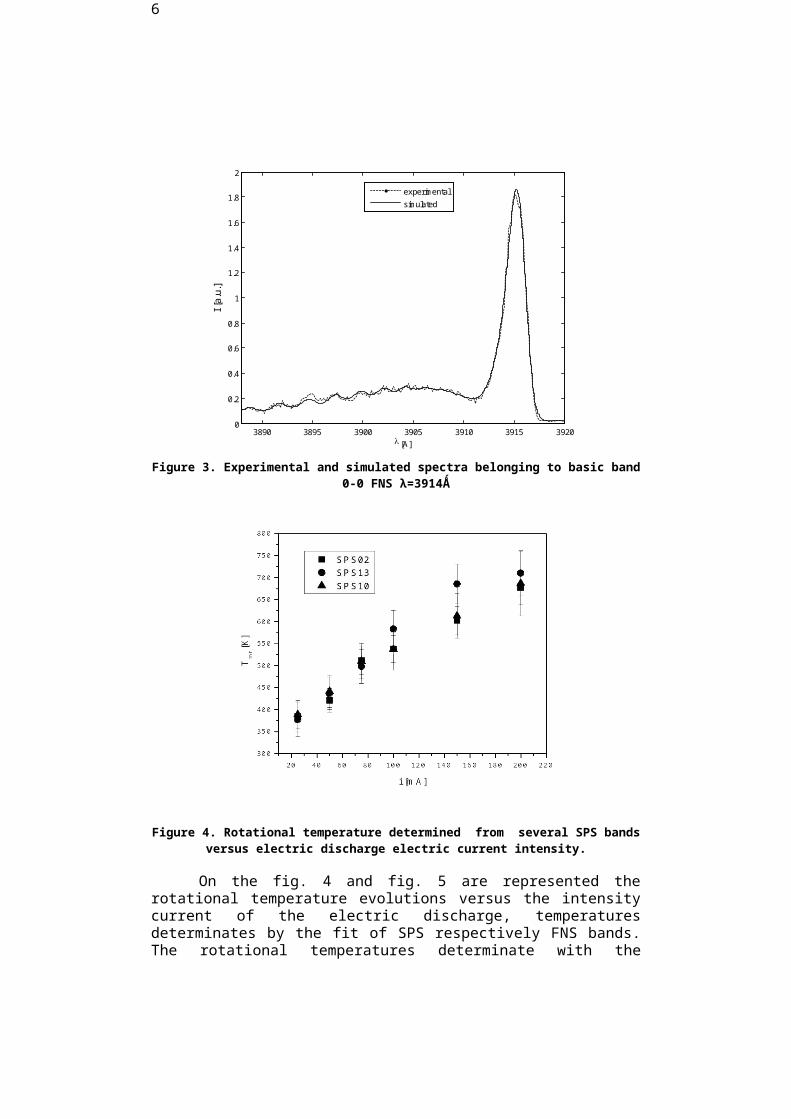
In the fig. 2 and fig. 3 are represented on thesame picture the experimental and the simulated spectrafor the 0-2 band N2(C3Πu-B3Πg) and the 0-0 basic bandbelonging to the electronic transition N2
+(B2Σu+-X2Σg
+).The comparison of the experimental and simulatedspectra shows a good fit on the fig. 2 the alternatingintensity of both spectra is well illustrated. The goodquality of experimental spectra fit is given also bythe relative standard deviations of the rotationaltemperature which in general, is of the 10%.
5
3890 3895 3900 3905 3910 3915 39200
0.2
0.4
0.6
0.8
1
1.2
1.4
1.6
1.8
2
[A]
I [a.u.]
experimentalsimulated
Figure 3. Experimental and simulated spectra belonging to basic band0-0 FNS λ=3914Ǻ
Figure 4. Rotational temperature determined from several SPS bandsversus electric discharge electric current intensity.
On the fig. 4 and fig. 5 are represented therotational temperature evolutions versus the intensitycurrent of the electric discharge, temperaturesdeterminates by the fit of SPS respectively FNS bands.The rotational temperatures determinate with the
6
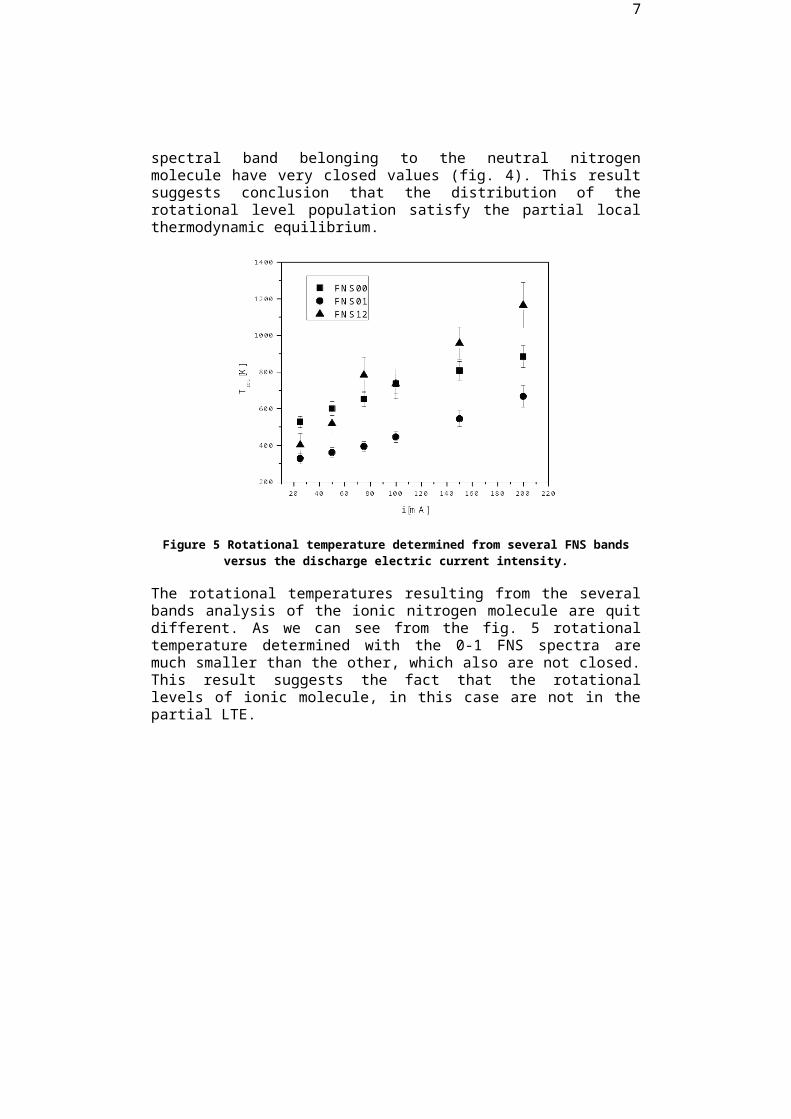
spectral band belonging to the neutral nitrogenmolecule have very closed values (fig. 4). This resultsuggests conclusion that the distribution of therotational level population satisfy the partial localthermodynamic equilibrium.
Figure 5 Rotational temperature determined from several FNS bandsversus the discharge electric current intensity.
The rotational temperatures resulting from the severalbands analysis of the ionic nitrogen molecule are quitdifferent. As we can see from the fig. 5 rotationaltemperature determined with the 0-1 FNS spectra aremuch smaller than the other, which also are not closed.This result suggests the fact that the rotationallevels of ionic molecule, in this case are not in thepartial LTE.
7
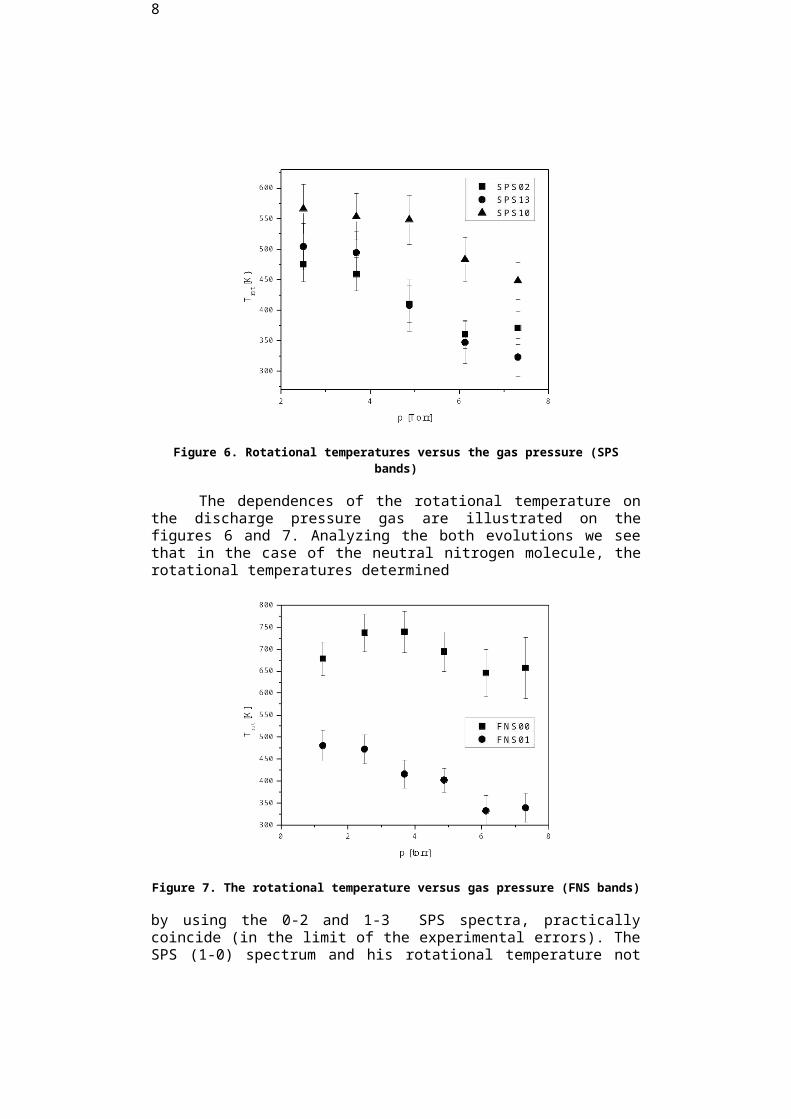
Figure 6. Rotational temperatures versus the gas pressure (SPSbands)
The dependences of the rotational temperature onthe discharge pressure gas are illustrated on thefigures 6 and 7. Analyzing the both evolutions we seethat in the case of the neutral nitrogen molecule, therotational temperatures determined
Figure 7. The rotational temperature versus gas pressure (FNS bands)
by using the 0-2 and 1-3 SPS spectra, practicallycoincide (in the limit of the experimental errors). TheSPS (1-0) spectrum and his rotational temperature not
8
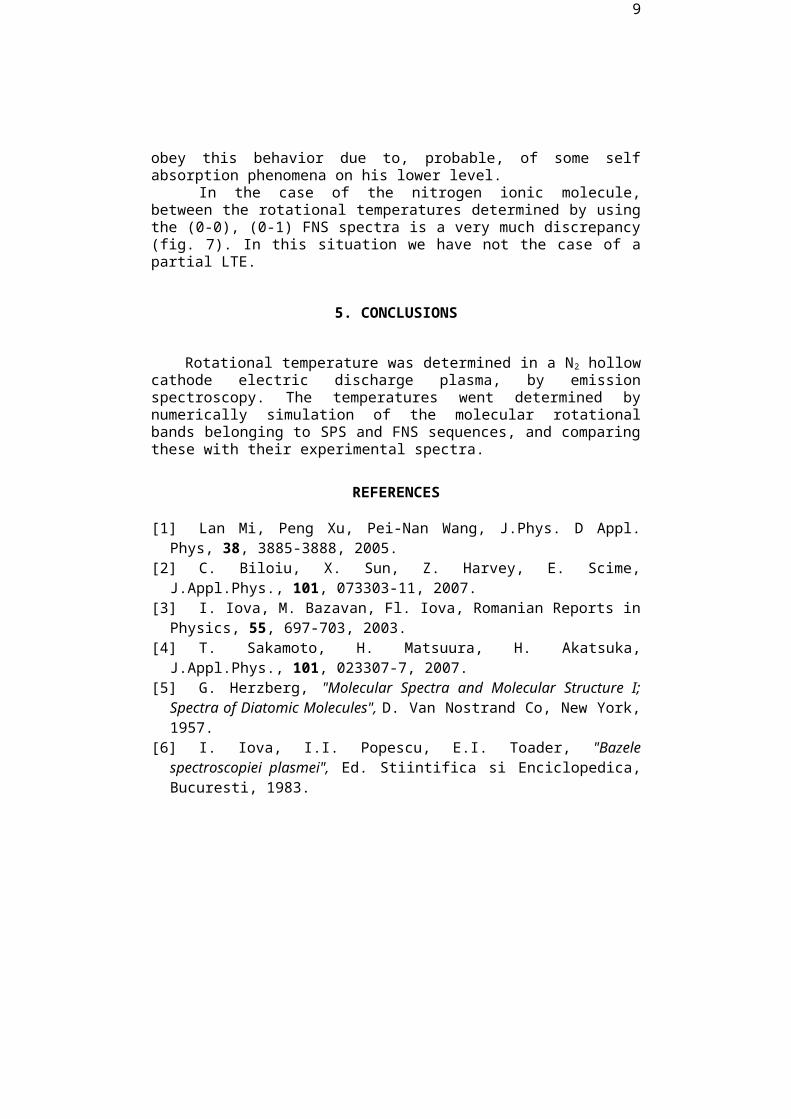
obey this behavior due to, probable, of some selfabsorption phenomena on his lower level.
In the case of the nitrogen ionic molecule,between the rotational temperatures determined by usingthe (0-0), (0-1) FNS spectra is a very much discrepancy(fig. 7). In this situation we have not the case of apartial LTE.
5. CONCLUSIONS
Rotational temperature was determined in a N2 hollowcathode electric discharge plasma, by emissionspectroscopy. The temperatures went determined bynumerically simulation of the molecular rotationalbands belonging to SPS and FNS sequences, and comparingthese with their experimental spectra.
REFERENCES
[1] Lan Mi, Peng Xu, Pei-Nan Wang, J.Phys. D Appl.Phys, 38, 3885-3888, 2005.
[2] C. Biloiu, X. Sun, Z. Harvey, E. Scime,J.Appl.Phys., 101, 073303-11, 2007.
[3] I. Iova, M. Bazavan, Fl. Iova, Romanian Reports inPhysics, 55, 697-703, 2003.
[4] T. Sakamoto, H. Matsuura, H. Akatsuka,J.Appl.Phys., 101, 023307-7, 2007.
[5] G. Herzberg, "Molecular Spectra and Molecular Structure I;Spectra of Diatomic Molecules", D. Van Nostrand Co, New York,1957.
[6] I. Iova, I.I. Popescu, E.I. Toader, "Bazelespectroscopiei plasmei", Ed. Stiintifica si Enciclopedica,Bucuresti, 1983.
9
Copyright © 2022 FDOKUMEN