The Effect of Transaction Pricing on the Adoption of Electronic Payments: A Cross-Country Comparison
28
WORKING PAPER NO. 05-28 THE EFFECT OF TRANSACTION PRICING ON THE ADOPTION OF ELECTRONIC PAYMENTS: A CROSS-COUNTRY COMPARISON Wilko Bolt De Nederlandsche Bank, Amsterdam David Humphrey Florida State University, Tallahassee, Visiting Scholar, Federal Reserve Bank of Philadelphia Roland Uittenbogaard De Nederlandsche Bank, Amsterdam November 2005
-
Upload
independent -
Category
Documents
-
view
1 -
download
0
Transcript of The Effect of Transaction Pricing on the Adoption of Electronic Payments: A Cross-Country Comparison

WORKING PAPER NO. 05-28 THE EFFECT OF TRANSACTION PRICING ON THE
ADOPTION OF ELECTRONIC PAYMENTS: A CROSS-COUNTRY COMPARISON
Wilko Bolt
De Nederlandsche Bank, Amsterdam
David Humphrey Florida State University, Tallahassee,
Visiting Scholar, Federal Reserve Bank of Philadelphia
Roland Uittenbogaard De Nederlandsche Bank, Amsterdam
November 2005

The Effect of Transaction Pricing onthe Adoption of Electronic Payments:
A Cross-Country Comparison∗
Wilko Bolt†, David Humphrey‡, Roland Uittenbogaard§
November 2005
Abstract
Pricing should speed up the substitution of low cost electronic payments for expensivepaper-based transactions and cash. But by how much? Norway has explicitly pricedindividual payment transactions and rapidly shifted to electronic payments while theNetherlands has experienced the same shift without direct pricing. Controlling for dif-ferences between countries, we estimate the incremental effect of pricing on the shift toelectronic payments. If users strongly value the improved convenience or security ofelectronic payments, pricing—viewed negatively by most consumers—may not be necessaryto ensure rapid adoption of electronic payments.(92 words)
Keywords: electronic payments, transaction pricing, demand elasticity, social benefits
JEL Code: D12, G21
∗The authors would like to thank Hans Brits, Nicole Jonker, Raymond Kleijmeer, and Carlo Winder forvaluable comments and suggestions. The views expressed in this article are those of the authors alone anddo not necessarily represent those of De Nederlandsche Bank, the European System of Central Banks, theFederal Reserve Bank of Philadelphia, or the Federal Reserve System. This paper is available free of chargeat: www.philadelphiafed.org/econ.wps/index.html.
†Wilko Bolt is senior economist in the Research Division at the De Nederlandsche Bank, Amsterdam, TheNetherlands, and is currently working in the Financial Research Department of the European Central Bankin Frankfurt, email: [email protected]
‡David Humphrey is professor of finance at Florida State University, Tallahassee, FL, U.S.A., and VisitingScholar, Payment Cards Center, Federal Reserve Bank of Philadelphia, email: [email protected]
§Roland Uittenbogaard is economist in the Payments Policy Division at De Nederlandsche Bank, Am-sterdam, The Netherlands, and is currently employed by the European Commission in Brussels, email:[email protected]

1 Introduction
The production of electronic payments by banks typically cost from one-third to one-halfas much as its paper-based equivalent or cash (c.f., Humphrey, Willesson, Bergendahl, andLindblom, 2005). As well, merchants’ cost of accepting electronic payments over giro net-works and at the point of sale are also lower (credit cards excepted). Since the resource costof a country’s payments system may account for 2% to 3% of its GDP, it is clear that shiftingfrom paper to electronic payments can confer social benefits. Importantly, the discountedvalue of these benefits will be larger the more rapidly this shift occurs.
There is overwhelming evidence that consumers respond to price incentives but almostno evidence of what this response may be in the payments area. Although consumers areused to responding to price incentives, they tend not to welcome the opportunity to tradeoff perceived payment preferences with relative prices when their payment use has commonlybeen viewed as being “free.”1 While businesses typically pay directly for the payment servicesthey use via explicit transaction fees or compensating balances, consumers have traditionallypaid implicitly through lost float or lower (or no) interest on transaction balances. Inaddition, due to competitive reasons, banks fear a loss of deposit market share if they movefirst (and are perhaps the only one) to explicitly price consumer payment transactions whileanti-trust authorities would be suspicious of industry efforts to coordinate such pricing.
One country—Norway—has overcome these difficulties by coordinating only the timing ofwhen direct pricing of consumer payments would start—not the level of prices to be chargedwhich could in fact be zero. The quid pro quo was an elimination of banks’ practice ofrecouping payment costs through payment float—debiting consumer accounts prior to a valuedate for bill payments or delaying funds availability for credits to accounts—which made itappear that payment use was “free.” The goal was to make payment costs more explicitso consumers could match better the benefits and costs of different payment instruments, aresponse expected to lower the social cost of their payment system.2
Our main purpose is to determine the effect of differential transaction-based pricing ofpayment instruments on the adoption rate of electronic payments. This is done by compar-ing the shift to electronic payments in two countries—one that has pricing (Norway) and onethat does not (Netherlands). Transaction-based prices are key since they affect consumers’decisions about payment use whereas fixed fees are sunk costs ex post that do not vary withusage and thus have limited behavioral effects. The implied discounted social benefit thatfollows from a possibly more rapid substitution of low cost for high cost payment instru-ments is also estimated. Data on payment instrument use for many developed countries isavailable annually in various Bank for International Settlements and European Central Bankdocuments, as well as from payment statistics by national central banks. As these timeseries rarely exceed 15 years, a parsimonious model specification is necessary. A comparabletime series of actual payment instrument prices on a broad range of payment instruments isavailable only for Norway. We contrast the rapid adoption of electronic payments in Norwayover 1990-2004 with the experience of the Netherlands which also rapidly adopted electronic
1Surveys indicate that customers are sensitive to price increases of payment instruments and react accord-ingly by switching to cheaper ones, see Humphrey, Kim and Vale (2001).
2Pricing in Norway was implemented by banks individually and encouraged by the central bank. The factthat the larger banks were first to introduce explicit pricing made it easier for the other banks to follow aftera lag. Bank efforts to improve the payment system have also occurred in Canada (to eliminate the floatincentive to use checks), Germany (to truncate checks and collect them electronically), and the Netherlands(shifting from paper-based credit transfers to “straight-through-processed” direct debits).
2
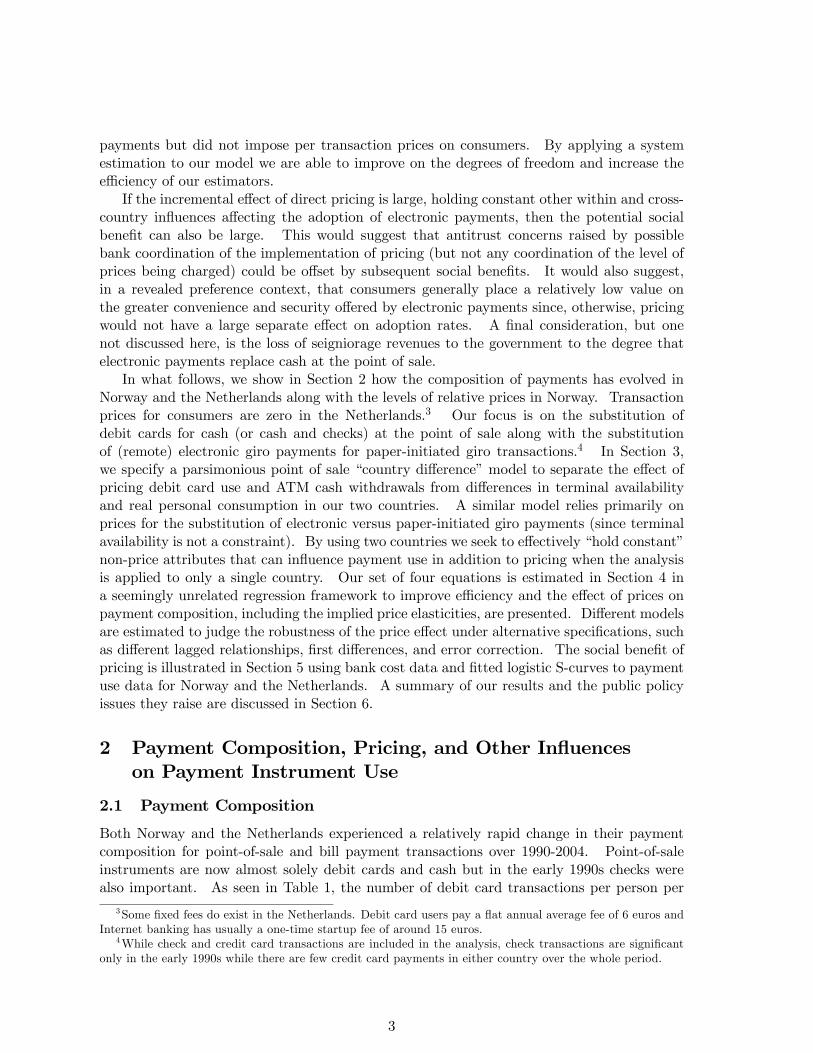
payments but did not impose per transaction prices on consumers. By applying a systemestimation to our model we are able to improve on the degrees of freedom and increase theefficiency of our estimators.
If the incremental effect of direct pricing is large, holding constant other within and cross-country influences affecting the adoption of electronic payments, then the potential socialbenefit can also be large. This would suggest that antitrust concerns raised by possiblebank coordination of the implementation of pricing (but not any coordination of the level ofprices being charged) could be offset by subsequent social benefits. It would also suggest,in a revealed preference context, that consumers generally place a relatively low value onthe greater convenience and security offered by electronic payments since, otherwise, pricingwould not have a large separate effect on adoption rates. A final consideration, but onenot discussed here, is the loss of seigniorage revenues to the government to the degree thatelectronic payments replace cash at the point of sale.
In what follows, we show in Section 2 how the composition of payments has evolved inNorway and the Netherlands along with the levels of relative prices in Norway. Transactionprices for consumers are zero in the Netherlands.3 Our focus is on the substitution ofdebit cards for cash (or cash and checks) at the point of sale along with the substitutionof (remote) electronic giro payments for paper-initiated giro transactions.4 In Section 3,we specify a parsimonious point of sale “country difference” model to separate the effect ofpricing debit card use and ATM cash withdrawals from differences in terminal availabilityand real personal consumption in our two countries. A similar model relies primarily onprices for the substitution of electronic versus paper-initiated giro payments (since terminalavailability is not a constraint). By using two countries we seek to effectively “hold constant”non-price attributes that can influence payment use in addition to pricing when the analysisis applied to only a single country. Our set of four equations is estimated in Section 4 ina seemingly unrelated regression framework to improve efficiency and the effect of prices onpayment composition, including the implied price elasticities, are presented. Different modelsare estimated to judge the robustness of the price effect under alternative specifications, suchas different lagged relationships, first differences, and error correction. The social benefit ofpricing is illustrated in Section 5 using bank cost data and fitted logistic S-curves to paymentuse data for Norway and the Netherlands. A summary of our results and the public policyissues they raise are discussed in Section 6.
2 Payment Composition, Pricing, and Other Influenceson Payment Instrument Use
2.1 Payment Composition
Both Norway and the Netherlands experienced a relatively rapid change in their paymentcomposition for point-of-sale and bill payment transactions over 1990-2004. Point-of-saleinstruments are now almost solely debit cards and cash but in the early 1990s checks werealso important. As seen in Table 1, the number of debit card transactions per person per
3Some fixed fees do exist in the Netherlands. Debit card users pay a flat annual average fee of 6 euros andInternet banking has usually a one-time startup fee of around 15 euros.
4While check and credit card transactions are included in the analysis, check transactions are significantonly in the early 1990s while there are few credit card payments in either country over the whole period.
3
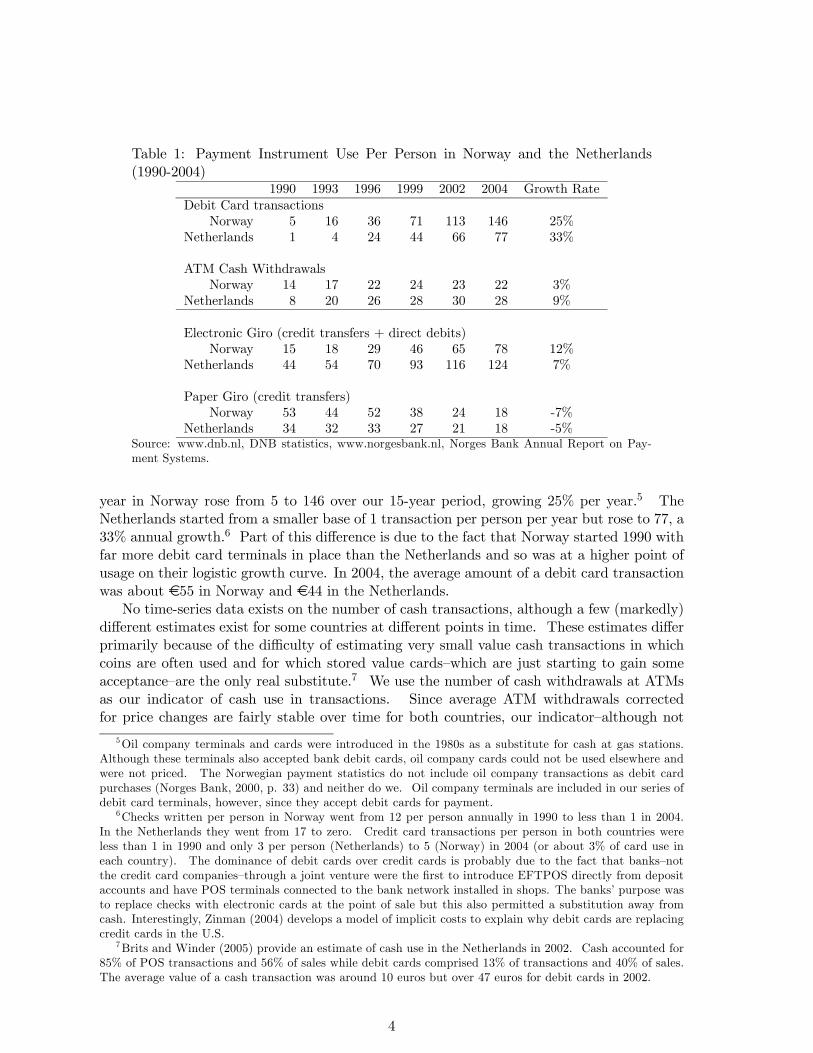
Table 1: Payment Instrument Use Per Person in Norway and the Netherlands(1990-2004)
1990 1993 1996 1999 2002 2004 Growth RateDebit Card transactions
Norway 5 16 36 71 113 146 25%Netherlands 1 4 24 44 66 77 33%
ATM Cash WithdrawalsNorway 14 17 22 24 23 22 3%
Netherlands 8 20 26 28 30 28 9%
Electronic Giro (credit transfers + direct debits)Norway 15 18 29 46 65 78 12%
Netherlands 44 54 70 93 116 124 7%
Paper Giro (credit transfers)Norway 53 44 52 38 24 18 -7%
Netherlands 34 32 33 27 21 18 -5%Source: www.dnb.nl, DNB statistics, www.norgesbank.nl, Norges Bank Annual Report on Pay-ment Systems.
year in Norway rose from 5 to 146 over our 15-year period, growing 25% per year.5 TheNetherlands started from a smaller base of 1 transaction per person per year but rose to 77, a33% annual growth.6 Part of this difference is due to the fact that Norway started 1990 withfar more debit card terminals in place than the Netherlands and so was at a higher point ofusage on their logistic growth curve. In 2004, the average amount of a debit card transactionwas about €55 in Norway and €44 in the Netherlands.
No time-series data exists on the number of cash transactions, although a few (markedly)different estimates exist for some countries at different points in time. These estimates differprimarily because of the difficulty of estimating very small value cash transactions in whichcoins are often used and for which stored value cards—which are just starting to gain someacceptance—are the only real substitute.7 We use the number of cash withdrawals at ATMsas our indicator of cash use in transactions. Since average ATM withdrawals correctedfor price changes are fairly stable over time for both countries, our indicator—although not
5Oil company terminals and cards were introduced in the 1980s as a substitute for cash at gas stations.Although these terminals also accepted bank debit cards, oil company cards could not be used elsewhere andwere not priced. The Norwegian payment statistics do not include oil company transactions as debit cardpurchases (Norges Bank, 2000, p. 33) and neither do we. Oil company terminals are included in our series ofdebit card terminals, however, since they accept debit cards for payment.
6Checks written per person in Norway went from 12 per person annually in 1990 to less than 1 in 2004.In the Netherlands they went from 17 to zero. Credit card transactions per person in both countries wereless than 1 in 1990 and only 3 per person (Netherlands) to 5 (Norway) in 2004 (or about 3% of card use ineach country). The dominance of debit cards over credit cards is probably due to the fact that banks—notthe credit card companies—through a joint venture were the first to introduce EFTPOS directly from depositaccounts and have POS terminals connected to the bank network installed in shops. The banks’ purpose wasto replace checks with electronic cards at the point of sale but this also permitted a substitution away fromcash. Interestingly, Zinman (2004) develops a model of implicit costs to explain why debit cards are replacingcredit cards in the U.S.
7Brits and Winder (2005) provide an estimate of cash use in the Netherlands in 2002. Cash accounted for85% of POS transactions and 56% of sales while debit cards comprised 13% of transactions and 40% of sales.The average value of a cash transaction was around 10 euros but over 47 euros for debit cards in 2002.
4
perfect—seems to be in reasonable correspondence with actual cash use.8 While each cashwithdrawal (€138 on average in Norway and €107 in the Netherlands in 2004) funds multipleactual cash transactions, the act of withdrawing cash is priced in Norway while its use at thepoint of sale is not. Thus we compare debit card and cash use at the point where both areactually priced and consumer choice is exercised.9
In both Norway and the Netherlands, debit card use expanded at a rapid rate whilegrowth of ATM cash withdrawals was much smaller. As shown below, the average price ofan ATM withdrawal rose relative to a debit card transaction in Norway but these two priceswere both zero in the Netherlands. If relative price was the only influence on relative use, wewould expect a slower growth for ATM withdrawals in Norway (where the ATM price was,after 1996, higher than debit cards) than in the Netherlands (where there is no difference inrelative prices). We see indications of this for ATMs in Table 1 (as growth in Norway isslower than in the Netherlands) but we do not see it for debit card use (where the reverseholds).
In order to reflect the substantially lower cost associated with electronic bill payments,employee disbursements, and interbusiness transactions over giro networks, the price of anelectronic giro payment in Norway was less than a paper-initiated giro transaction (eitherdelivered in the mail or passed over the counter at a bank or postal office). Since giro priceswere zero in the Netherlands, one would expect to see a more rapid growth of electronic girotransactions and slower growth (or greater reduction) of paper giro transactions in Norwaythan in the Netherlands. Both of these expectations are realized in Table 1. Per personuse of electronic giro payments in Norway rose from 15 to 78 over 1990-2004 (growing 12% ayear) while only rising from 44 to 124 over the same period in the Netherlands (growing 7%annually).10 At the same time, paper giro use fell in both countries but from a higher leveland at a greater rate in Norway. Indeed, by 2004 individuals in both countries initiated only18 paper giro transactions per year.
2.2 Payment Prices in Norway
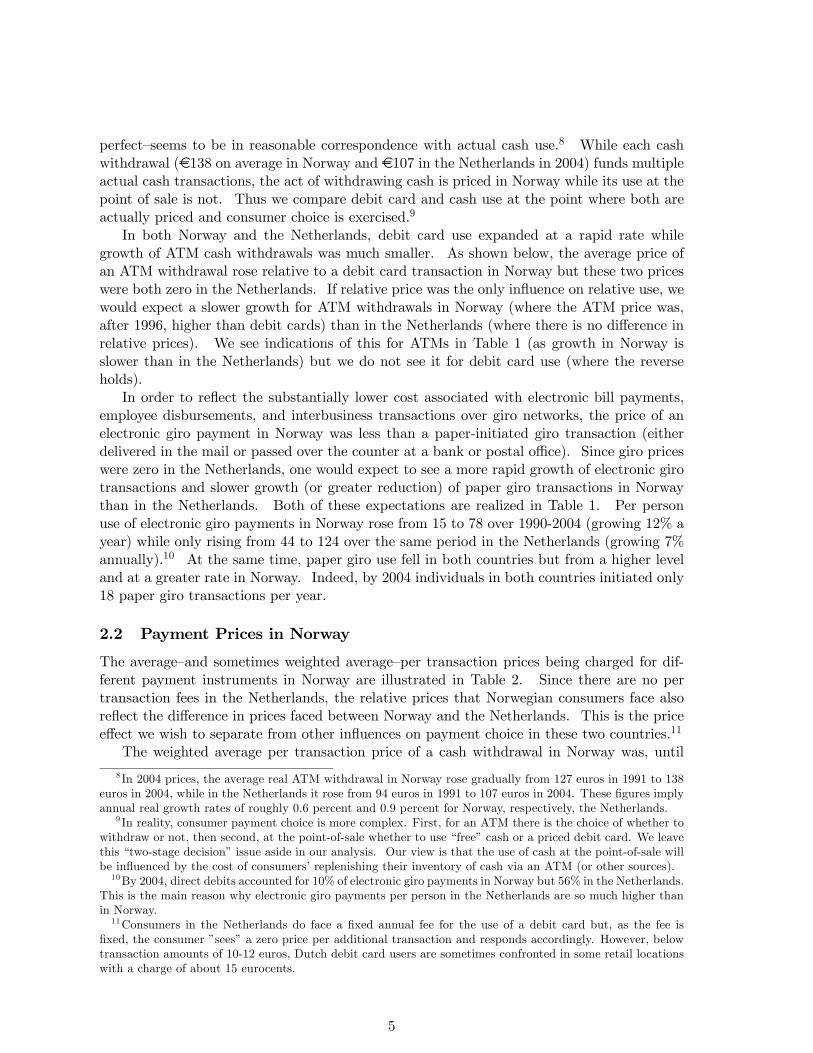
The average—and sometimes weighted average—per transaction prices being charged for dif-ferent payment instruments in Norway are illustrated in Table 2. Since there are no pertransaction fees in the Netherlands, the relative prices that Norwegian consumers face alsoreflect the difference in prices faced between Norway and the Netherlands. This is the priceeffect we wish to separate from other influences on payment choice in these two countries.11
The weighted average per transaction price of a cash withdrawal in Norway was, until
8 In 2004 prices, the average real ATM withdrawal in Norway rose gradually from 127 euros in 1991 to 138euros in 2004, while in the Netherlands it rose from 94 euros in 1991 to 107 euros in 2004. These figures implyannual real growth rates of roughly 0.6 percent and 0.9 percent for Norway, respectively, the Netherlands.
9 In reality, consumer payment choice is more complex. First, for an ATM there is the choice of whether towithdraw or not, then second, at the point-of-sale whether to use “free” cash or a priced debit card. We leavethis “two-stage decision” issue aside in our analysis. Our view is that the use of cash at the point-of-sale willbe influenced by the cost of consumers’ replenishing their inventory of cash via an ATM (or other sources).10By 2004, direct debits accounted for 10% of electronic giro payments in Norway but 56% in the Netherlands.
This is the main reason why electronic giro payments per person in the Netherlands are so much higher thanin Norway.11Consumers in the Netherlands do face a fixed annual fee for the use of a debit card but, as the fee is
fixed, the consumer ”sees” a zero price per additional transaction and responds accordingly. However, belowtransaction amounts of 10-12 euros, Dutch debit card users are sometimes confronted in some retail locationswith a charge of about 15 eurocents.
5
Table 2: Average Per Transaction Prices for Different Payment Instruments inNorway
Prices in Euros 1990 1993 1996 1999 2002 2004 Growth RateDebit Card Price
Norway .18 .23 .25 .26 .28 .26 2%
ATM Cash Withdrawal PriceNorway .05 .18 .24 .29 .39 .40 14%
Relative Price: Debit Card/ATM Cash Withdrawal3.60 1.28 1.04 .90 .72 .65 -11%
Electronic Giro PriceNorway .10 .18 .22 .23 .31 .27 7%
Paper Giro PriceNorway .35 .62 1.18 1.86 2.65 2.76 15%
Relative Price: Electronic Giro/Paper Giro.29 .29 .20 .12 .11 .09 -8%
Source: www.dnb.nl, DNB statistics, www.norgesbank.nl, Norges Bank Annual Report on Pay-ment Systems.
.
1996, less than that for debit cards.12 This was because a cash withdrawal at one’s own bankwas free during business hours and prices applied only to withdrawals after business hours orat another bank’s ATM. While debit cards started out in 1990 with a price that was morethan three times higher than the weighted average of different ATM prices (Row 3, Table 2),it ended up being only 65% of the cash withdrawal price in 2004. Thus only after 1996 did theabsolute price of a debit card favor its use over cash when EFTPOS terminals were available.But even before 1996, there was an indirect inducement to use debit cards in Norway whenit became possible in late 1992 to obtain “cash-back” from a debit card transaction at thepoint of sale.13 This avoided the extra cost and inconvenience of having to use an ATMto withdraw cash since small amounts of cash could be obtained at no additional cost whenmaking purchases at the local market.
There was a stronger relative price inducement to use an electronic rather than a paper-initiated giro transaction for consumer bill payments. In 1990, the price of an electronicgiro transaction was only 29% as high as a paper giro payment but by 2004 this had fallento only 9% of the paper price. In the beginning, electronic giro payments were initiated viatelephone but this was later overtaken by the spread of Internet banking. This applies tocredit transfers where the consumer retains control in initiating a payment, as opposed toa direct debit where the receiver of the credit initiates the debit to the consumer’s accountunder a prearranged contractual agreement. In addition, it is noted that billers often give a
12This observation only holds on a per-transaction basis. On average one ATM withdrawal could fundroughly 2 to 3 debit card transactions. However, since this difference in “transaction domain” between bothinstruments is relatively stable over time, it should only affect the intercept in our model in logs.13Although cash-back transactions and cash at the counter at one’s own bank are also sources for obtaining
cash for free in Norway—and implicitly lower the effective price for obtaining cash compared to our use of theweighted average of free and priced ATM access—these data are available only for recent years and thereforecould not be included in the analysis.
6

slight discount to customers that pay by direct debit, thus creating a price advantage overan electronic giro. Due to lack of data, this relative price discount could not be taken intoconsideration here.
It is important to note that the prices charged in Norway do not cover the full bank cost ofmaking a payment (c.f., Flatraaker and Robinson, 1995; Gresvik and Øwre, 2003). In 1988,transaction prices covered only around 25% of the banks’ payment cost but this coverage hadrisen to around 70% in 2001.14
2.3 Terminal Availability and Levels of Consumption
While relative prices provide an inducement to use electronic payments at the point of sale,this can be accomplished only if a merchant has an EFTPOS terminal that can be used.This observation points to the two-sided nature of the payment market which influences theadoption rate of new payment instruments. In particular, the market for electronic paymentservices is considered a two-sided market in the sense that both consumers and merchantsare needed simultaneously to demand and “consume” card payments. Suppliers of paymentcard services (or so-called “platforms”) can effectively cross-subsidize between merchantsand consumers through differential pricing to stimulate this demand. In two-sided markets,typically only one side is charged on a transaction basis while the other side obtains theservice (almost) for free in order to generate greater demand.15 Indeed, merchants value awide diffusion of payment cards among consumers while consumers benefit from high terminaldensity at retail locations that accept their cards. In our analysis, payment card and ATMterminal density are included to take this two-sided effect into account in explaining relativepayment card usage.
Table 3 shows the number of EFTPOS terminals in place in Norway and the Netherlandsover 1990-2004 per one million of population (which controls for differences in populationsize).16 As shown in the first two rows, Norway had almost twice as many debit cardterminals as the Netherlands in 2004 and this difference was far more extreme in earlierperiods. While the growth of EFTPOS terminals has been more than twice as rapid inthe Netherlands, it still has a long way to go to provide the same density of terminal accessas Norway. By this measure alone, it really would not be possible—regardless of any priceincentive—for consumers in the Netherlands to use debit cards with the same intensity perperson as they do in Norway. As noted earlier, there is no price incentive to use debit cardsin the Netherlands so there are two reasons—no price incentive and fewer EFTPOS terminalsper person—to expect that the Netherlands would use debit cards less intensively than inNorway. Even so, as shown below, it is difficult to separate the effect of prices from terminalavailability on debit card and ATM use.
The same “separation problem” exists for cash withdrawals at ATMs. Norway pricesATM withdrawals while the Netherlands does not and for the entire period Norway alsoprovided a greater density of ATMs to withdraw cash from (Row 3, Table 3). Separating the
14The relationship between fees and underlying costs is different in Sweden with surplus bank revenuesfrom card transactions cross-subsidizing the expense of providing cash, distorting resource allocation (SverigesRiksbank, 2004).15 In Norway, the consumer side is directly charged for its use of payment instruments while in the Nether-
lands the retailer side of the market pays per transaction. Bolt and Tieman (2004) provide an explanationfor these widely observed completely skewed pricing strategies in two-sided markets. See Rochet and Tirole(2003) for a rigorous analysis of two-sided markets and competition.16 In 2004, the population in the Netherlands was 16.3 million; in Norway it was 4.6 million.
7

Table 3: Terminal Availability, Real Consumption, and Demographic Influences onPayment Instrument Use
1990 1993 1996 1999 2002 2004 Growth RateDebit Card EFTPOS Terminals (per mil population)
Norway 2,487 6,324 8,932 13,214 17,723 21,091 15%Netherlands 148 1,600 6,170 9,176 10,941 11,967 34%
ATM Terminals (per mil population)Norway 419 396 426 451 484 473 0.8%
Netherlands 180 291 395 421 465 468 6.6%
Real Per Capita Personal Consumption (in 1000)Norway 11.9 12.1 13.9 15.1 17.8 16.7 2.3%
Netherlands 9.2 9.3 9.9 10.9 11.4 11.3 1.4%
Share of Young Adults in PopulationNorway 8.0 7.8 7.2 6.4 6.0 6.0 -1.9%
Netherlands 8.5 8.2 7.0 6.1 6.0 6.0 -2.3%Source: www.dnb.nl, DNB statistics,National Accounts, Dutch CBS, www.norgesbank.nl, NorgesBank Annual Report on Payment Systems, IFS.
price effect from the terminal effect for ATM cash withdrawals may be somewhat easier heresince by 2004 both countries had almost the same ATM density but withdrawals were pricedonly in Norway and, compared to the Netherlands after 1993, per person use in Norway wascorrespondingly less (Row 3, Table 1).17
Inferences on the relative importance of pricing may be more accurate if two other possible,but small, influences on payment choice are considered. One concerns differences in the levelof real per capita personal consumption between the two countries, since higher levels of realconsumption tend to be associated with larger numbers of transactions.18 A second influenceconcerns the possibility that changes in the number of young adults in both countries mayaffect differences in new payment adoption rates. Consumer surveys indicate that youngadults and higher income individuals adopt new payment arrangements more rapidly thanothers even without pricing. But direct pricing could well affect the adoption rates of thosewith greater habit persistence, a lower opportunity cost, or who do not value much the addedconvenience or security that electronic payments can offer.
The level and variation of both per capita consumption and the share of young adultsin the population over time are illustrated in the bottom half of Table 3. Real per capitaconsumption in Norway was 29% greater than that in the Netherlands in 1990 but rose to be
17As Norway is roughly nine times larger than the Netherlands, differences in population density maycompromise the usefulness of our availability measure of ATM and EFTPOS terminals. However, bothcountries are highly urbanized which is probably the most important driver for installing terminals. InNorway, the five largest cities account for about 25% of total population but for only 1% of total geographicarea (see Norway Statistics, www.ssb.no). Less extreme, in the Netherlands, the 10 largest cities make uproughly 20% of Dutch population with 3.5% of the area (see CBS statistics, www.cbs.nl.). Since this differencein densities is effectively a constant over 15 years, in our log-difference equation its impact would affect onlythe intercept and not the slope parameter, which is our terminal elasticity.18All monetary values for Norway (prices as well as real consumption) have been translated from Norwegian
kroner into euros using a purchasing power parity exchange rate. Also, real per capita consumption in Norwayincludes oil revenues only indirectly as some of this revenue is used to finance government expenditures whichlikely reduces taxes from what they would otherwise be, permitting real consumption to be larger.
8

48% higher in 2004. This difference should be associated with a rising number of all typesof transactions in Norway relative to the Netherlands. There are smaller differences betweenthese two countries in the shares of young adults—new entrants into the labor force aged 20to 24. Indeed, these shares are falling in both countries.19
3 A Country-Difference Model of Payment Choice
3.1 A Country-Difference Model
Differences between Norway and the Netherlands are used to try to explain per capita use ofdebit cards, ATM cash withdrawals, and electronic and paper giro payments. As outlinedabove, the main influences on payment use and composition are differences in the numberof EFTPOS and ATM terminals per million population, the prices being charged in Norway(positive) and the Netherlands (zero), and differences in the level of real per capita consump-tion. Our time period is short (only 15 years) as time-series data on payment instrument usehas only recently been deemed important enough to be routinely collected at the country levelby government agencies. While some time-series on some payment types do exist for longerperiods in some countries, this information is not comprehensive nor are payment instrumentprices available since very few types of payment services are directly priced. Norway isthe exception that allows us to undertake this analysis. These data constraints impose aparsimonious specification on our explanatory four-equation model:
CARDt = α1 + α2CARDTERMINALt−1 + α3CARDPRICEt
+ 1/2(α22CARDTERMINAL2t−1 + α33CARDPRICE2t )
+ α23CARDTERMINALt−1 ∗ CARDPRICEt
+ α4CONSUMPTIONt + ε1t
(1)
ATMt = β1 + β2ATMTERMINALt−1 + β3CARDPRICEt
+ 1/2(β22ATMTERMINAL2t−1 + β33CARDPRICE2t )
+ β23ATMTERMINALt−1 ∗ CARDPRICEt
+ β4CONSUMPTIONt + ε2t
(2)
EGIROt = γ1 + γ2EGIROPRICEt + 1/2(γ22EGIROPRICE2t )
+ γ3CONSUMPTIONt + ε3t(3)
PGIROt = δ1 + δ2EGIROPRICEt + 1/2(δ22EGIROPRICE2t )
+ δ3CONSUMPTIONt + ε4t.(4)
In the variable definitions, NOR indicates Norway and NL indicates Netherlands anddifferences between these countries are expressed in index form:20
19Demographic variables are typically extremely smooth series. In implementation, these variables createdconvergence problems in our system estimations and were deleted.20 In many cases, the log of the absolute difference in our variables between countries was negative (or changed
from positive to negative) so all variables are expressed as the log of the ratio or index of the difference betweencountries.
9

CARD = ln (NOR debit card use/NL debit card use),on a per person basis;
CARDTERMINAL = ln (NOR card terminals/NL card terminals),per million population;
CARDPRICE = ln (NOR card price/NOR ATM price);CONSUMPTION = ln (NOR personal consumption/NL personal consumption,
real per capita;ATM = ln (NOR ATM cash withdrawals/NL ATM cash withdrawals),
per person;ATMTERMINAL = ln (NOR ATM terminals/NL ATM terminals),
per million population;EGIRO = ln (NOR electronic giro use/NL electronic giro use),
per person;EGIROPRICE = ln (NOR electronic giro price/NOR paper giro price);PGIRO = ln (NOR paper giro use/NL paper giro use),
per person.
Since debit card and ATM terminals have to be in place before consumers can use them,and even when in place typically have a lag before they are used at a significant level, thesetwo terminal variables are lagged by one year in the model to give a closer correspondencebetween the exogenous availability of new terminals and their possible effect on use. Prices,of course, also have to be known before they can affect payment choice. The lag here is likelymuch shorter and prices are specified as exogenous and contemporaneous.21
Looking at the data, it appears that the two countries differ in when they introducedelectronic payment instruments. In the Netherlands, usage of the electronic giro was ona higher level than in Norway in 1990 whereas Norway had a higher density of ATM andEFTPOS terminals. This “starting value” problem is taken into account in our logarithmicspecification through the intercept which is not restricted to a value of 1 (which would implyequal starting values for 1990).
3.2 Illustrating the Determinants of Payment Composition
While our model looks different from the usual demand equation specification used to estimateprice effects on payment instrument use in a single country (c.f., Humphrey, Kim, and Vale,2001), the same variables—quantity of use, levels of own price, substitute price, and income(via consumption)—are included in the analysis. Ideally, we would like to run an experimentwhere there are no price inducements to affect consumer choice of payment instruments ina country, observe the rate of adoption of electronic payments based solely on non-priceconsiderations along with terminal availability (if required), and then re-run the experimentadding price inducements in order to separate price from non-price effects. This wouldaddress the omitted variable problem of unknown non-price attributes of different paymentinstruments.22 Our use of two countries—one with pricing, one without—addresses the non-price attribute omitted variable problem if country differences in non-price attributes arerelatively small, as seems likely. In any case, we also estimate the effect of pricing in one
21The effects of different lag arrangements on the results are noted in Section 4.22For example, if an electronic payment instrument offers significant convenience or security benefits com-
pared to its paper-based alternative, then pricing the paper instrument higher than its electronic alternativewould likely generate a larger price response than if such non-price attributes did not exist.
10
country (Norway) below but are aware that these results may incorporate unknown non-priceattributes.
The observed relationships underlying our four-equation model are illustrated in the twofigures below. In Figure 1, the price of debit cards in Norway is steadily falling relativeto the weighted average price actually incurred for an ATM cash withdrawal over 1990-2004(line with circles). Although the relative price of debit cards was falling, the absolute pricewas higher than a weighted average of ATM cash withdrawal prices up until 1996 (Table 2).Thus it is not surprising that relative debit card use in Norway compared to the Netherlandswas falling (as seen in the top line with boxes) up until 1997. After 1996-97, the absoluteprice of debit cards in Norway was less than an ATM cash withdrawal and debit card usein Norway expanded slightly faster than in the Netherlands (which did not have this priceinducement).23 While a falling relative price is expected to promote use, this apparentlyoccurred only when the price of a debit card transaction was absolutely less than an ATMwithdrawal. Overall, the pattern of debit card and ATM prices in Norway reduced debitcard use relative to the Netherlands up to 1996 and expanded it slightly afterward (shownas a slight rise in the top line with boxes after 1996). Thus we should not expect a strongprice elasticity response for debit card use. And, indeed, the response we obtain is weak.
The situation for ATMs is essentially the reverse. The average ATM price is lower thanthat for debit cards in Norway over 1990-1996 so ATM use in Norway may be expected toexceed that in the Netherlands where these prices are the same (both at zero). But ATMuse in Norway expands at a slower rate than in the Netherlands up until 1995 (as the bottomline with boxes falls over this period). After 1998 when the debit card price is absolutelylower than the ATM price, Norwegian ATM use falls slightly relative to the Netherlands.Consumer choice seems to be affected by absolute prices as well as changes in relative prices.
For debit cards as well as ATMs, use seems to closely follow the availability of terminalsneeded for these transactions. This implies a positive relationship. As shown below, however,ATM terminal availability appears to have gotten ahead of terminal use in both countriestoward the end of our period, leading to a negative relationship where terminals expand butuse falls.
The price-use relationship for electronic and paper giro transactions seems clearer, per-haps because there are no “terminal constraints” and likely weaker non-price attributes topotentially confound the effect of prices on relative giro use.24 In Figure 2, the price of anelectronic giro transaction in Norway falls relative to paper only after 1993 (line with circles).Importantly, and unlike the debit card to ATM price relationship, the electronic giro price isalways absolutely lower than the paper price in Norway. Thus use of electronic giro paymentsin Norway is seen to rise relative to that in the Netherlands over the whole period (bottomline with boxes) while the relative use of paper giros falls—although only slightly—after 1995(top line with boxes). The relationships illustrated in Figure 2 indicate that the relativelevel of payment prices, as well as the change in relative prices over time, is important indetermining relative payment use for giro payments. The same holds for debit card andATM use in Figure 1.
23This is where the ratio of the debit card to ATM price equaled one so the log of this value (the line withcircles) was at zero in the figure. The curves in all figures are cubic splines of plotted actual observations.24While an Internet connection is needed for consumers to make an electronic credit transfer, this is not
needed for a direct debit. As well, the number of Internet connections far exceeds the number of Internetbanking users so an Internet connection does not act as a binding “access constraint” in the same manner asa debit card or ATM terminal. Obviously, the same holds for telephone connections and telephone giros.
11
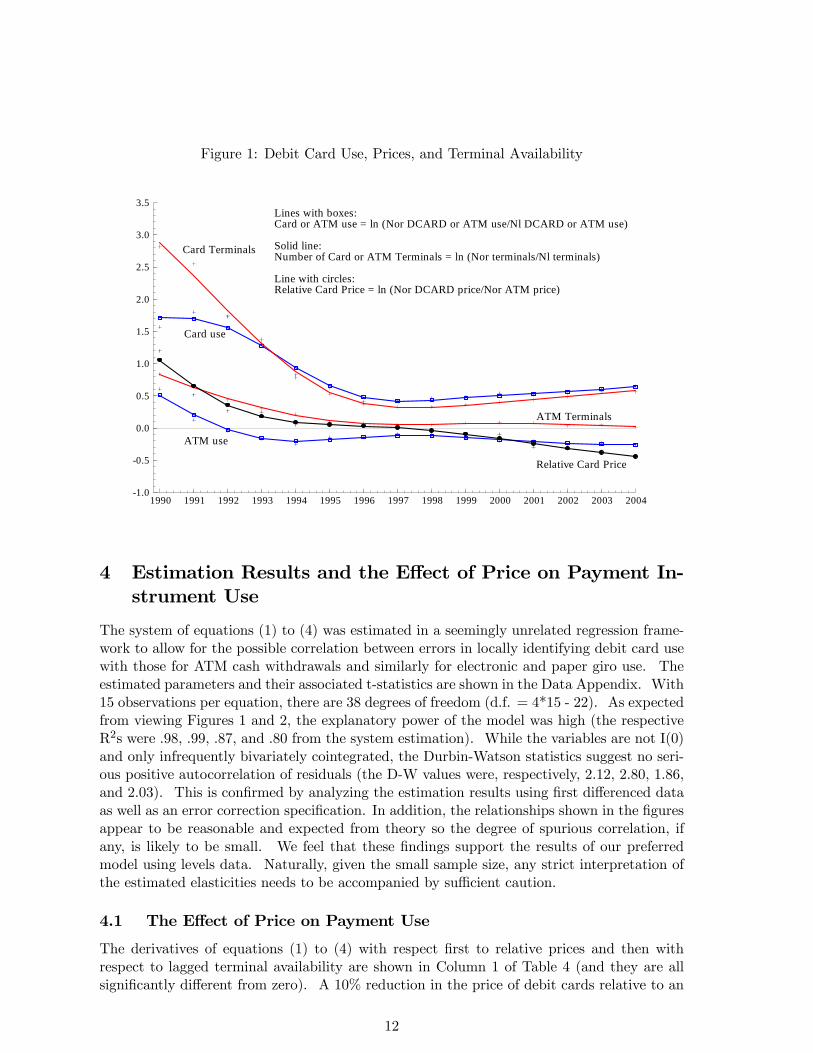
Figure 1: Debit Card Use, Prices, and Terminal Availability
1990 1991 1992 1993 1994 1995 1996 1997 1998 1999 2000 2001 2002 2003 2004-1.0
-0.5
0.0
0.5
1.0
1.5
2.0
2.5
3.0
3.5
Card use
ATM Terminals
Card Terminals
ATM use
Lines with boxes:Card or ATM use = ln (Nor DCARD or ATM use/Nl DCARD or ATM use)
Solid line:Number of Card or ATM Terminals = ln (Nor terminals/Nl terminals)
Line with circles:Relative Card Price = ln (Nor DCARD price/Nor ATM price)
Relative Card Price
4 Estimation Results and the Effect of Price on Payment In-strument Use
The system of equations (1) to (4) was estimated in a seemingly unrelated regression frame-work to allow for the possible correlation between errors in locally identifying debit card usewith those for ATM cash withdrawals and similarly for electronic and paper giro use. Theestimated parameters and their associated t-statistics are shown in the Data Appendix. With15 observations per equation, there are 38 degrees of freedom (d.f. = 4*15 - 22). As expectedfrom viewing Figures 1 and 2, the explanatory power of the model was high (the respectiveR2s were .98, .99, .87, and .80 from the system estimation). While the variables are not I(0)and only infrequently bivariately cointegrated, the Durbin-Watson statistics suggest no seri-ous positive autocorrelation of residuals (the D-W values were, respectively, 2.12, 2.80, 1.86,and 2.03). This is confirmed by analyzing the estimation results using first differenced dataas well as an error correction specification. In addition, the relationships shown in the figuresappear to be reasonable and expected from theory so the degree of spurious correlation, ifany, is likely to be small. We feel that these findings support the results of our preferredmodel using levels data. Naturally, given the small sample size, any strict interpretation ofthe estimated elasticities needs to be accompanied by sufficient caution.
4.1 The Effect of Price on Payment Use
The derivatives of equations (1) to (4) with respect first to relative prices and then withrespect to lagged terminal availability are shown in Column 1 of Table 4 (and they are allsignificantly different from zero). A 10% reduction in the price of debit cards relative to an
12
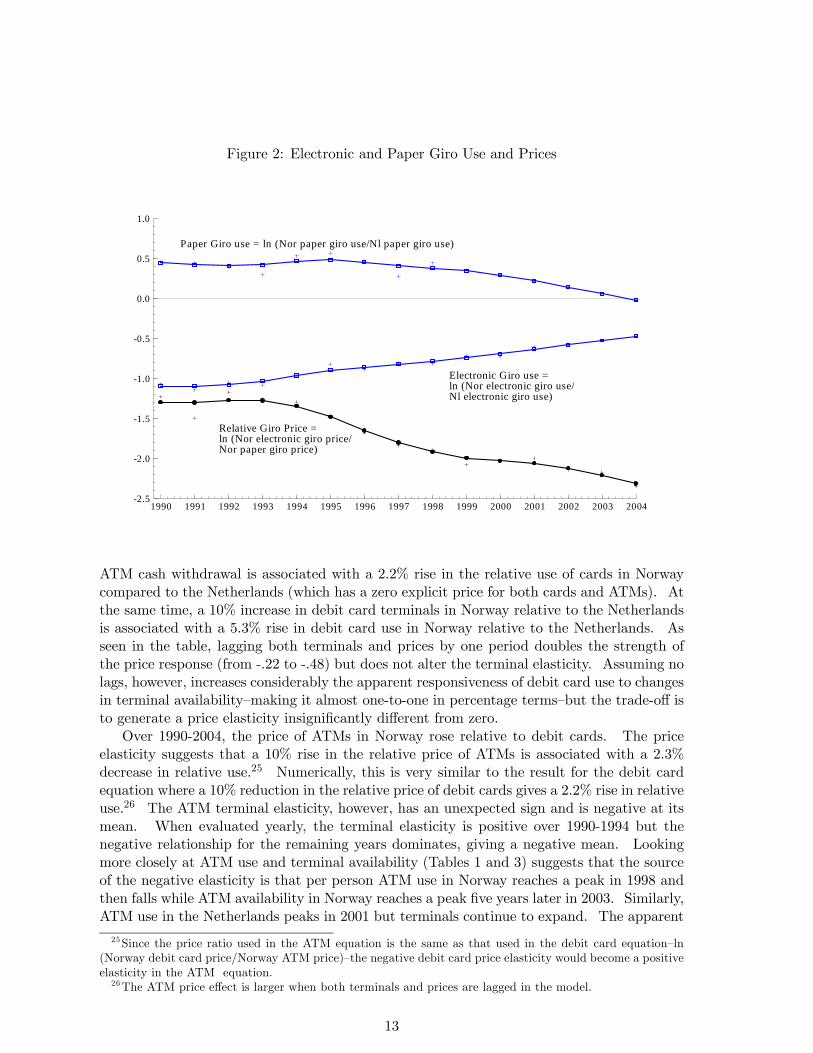
Figure 2: Electronic and Paper Giro Use and Prices
1990 1991 1992 1993 1994 1995 1996 1997 1998 1999 2000 2001 2002 2003 2004-2.5
-2.0
-1.5
-1.0
-0.5
0.0
0.5
1.0
Electronic Giro use =ln (Nor electronic giro use/Nl electronic giro use)
Paper Giro use = ln (Nor paper giro use/Nl paper giro use)
Relative Giro Price =ln (Nor electronic giro price/Nor paper giro price)
ATM cash withdrawal is associated with a 2.2% rise in the relative use of cards in Norwaycompared to the Netherlands (which has a zero explicit price for both cards and ATMs). Atthe same time, a 10% increase in debit card terminals in Norway relative to the Netherlandsis associated with a 5.3% rise in debit card use in Norway relative to the Netherlands. Asseen in the table, lagging both terminals and prices by one period doubles the strength ofthe price response (from -.22 to -.48) but does not alter the terminal elasticity. Assuming nolags, however, increases considerably the apparent responsiveness of debit card use to changesin terminal availability—making it almost one-to-one in percentage terms—but the trade-off isto generate a price elasticity insignificantly different from zero.
Over 1990-2004, the price of ATMs in Norway rose relative to debit cards. The priceelasticity suggests that a 10% rise in the relative price of ATMs is associated with a 2.3%decrease in relative use.25 Numerically, this is very similar to the result for the debit cardequation where a 10% reduction in the relative price of debit cards gives a 2.2% rise in relativeuse.26 The ATM terminal elasticity, however, has an unexpected sign and is negative at itsmean. When evaluated yearly, the terminal elasticity is positive over 1990-1994 but thenegative relationship for the remaining years dominates, giving a negative mean. Lookingmore closely at ATM use and terminal availability (Tables 1 and 3) suggests that the sourceof the negative elasticity is that per person ATM use in Norway reaches a peak in 1998 andthen falls while ATM availability in Norway reaches a peak five years later in 2003. Similarly,ATM use in the Netherlands peaks in 2001 but terminals continue to expand. The apparent
25Since the price ratio used in the ATM equation is the same as that used in the debit card equation—ln(Norway debit card price/Norway ATM price)—the negative debit card price elasticity would become a positiveelasticity in the ATM equation.26The ATM price effect is larger when both terminals and prices are lagged in the model.
13

Table 4: Price and Terminal Elasticities Under Different Model SpecificationsLagged Lagged Terminals No Lags Separate PricesTerminals and Prices Own Substitute
Debit CardPrice Effect -.22* -.48* -.06 -.19 -.03
Terminal Effect .53* .57* .94* .49*
ATM Cash WithdrawalPrice Effect .23* .31* .29* -.85* .69*
Terminal Effect -.16* -.49* -.35* -.35*
Electronic GiroPrice Effect -.46* -.53* -.44 .21* .10*
Paper GiroPrice Effect .27* .25* .33* -.03 .03
Starred (*) values indicate a P-value smaller than .01 in a two-tailed t test.
explanation for the negative ATM terminal elasticity is that ATM use has reached saturation(due in part to the price disincentive) while terminals are still being added, giving the resultthat terminals are expanding while use is falling.
The estimated price effects for electronic and paper giro payments conform to expectationssince, when the relative price of electronic giro transactions falls 10%, relative use of thisinstrument in Norway rises 4.6% compared to the Netherlands. Similarly, a 10% increase inthe relative price of paper giro payments is associated with a 2.7% reduction in relative usebetween the two countries.27 Our preferred model in equations (1) to (4) was respecifiedso that direct debits, which comprise 10% of electronic giro payments in Norway but 56% inthe Netherlands, were deleted from the electronic giro use and price data. This had almostno effect on the results shown in Column 1 of Table 4. Equations (1) to (4) were respecifiedagain to include checks with ATMs so that both can substitute with debit cards. Checkswere important in the early 1990s, had a high price, and their use effectively fell to zeroby 2004. Nothing of substance was changed except that the debit card price elasticity lostsignificance.
Real per capita personal consumption was markedly higher in Norway and growing fasterthan in the Netherlands. We expected that this would have a significantly positive effect onexpanding relative electronic payment use in Norway. However, as seen in the Data Appendixwhere the parameter results are shown, the effect of real per capita personal consumption onpayment use was insignificant in all four equations.
Just as an exercise, equations (1) to (4) were simplified by deleting the squared terminal,squared price, and terminal-price interaction variables. Then the remaining price ratio ineach equation (e.g., debit card price/ATM price and electronic giro price/paper giro price)was reexpressed as the log of separate own and substitute price variables for each equation.The resulting own and substitute price elasticities, along with the reestimated terminal effect,are shown in the last two columns of Table 4. Our preferred model (in Column 1) is specifiedin ratio form, due to our limited sample, but it is of interest to see the implied own and cross-
27Since the same price ratio is used in both the electronic and paper giro equations—ln (Norway electronicgiro price/Norway paper giro price), the negative electronic giro price elasticity would become a positiveelasticity in the paper giro equation.
14
price elasticities that result from estimating each price elasticity separately. All but oneown price elasticity is negative and three of the four cross-price elasticities are positive (aswould be expected for a substitute payment instrument). However, considering that onlyone negative own elasticity and two positive cross elasticities were significant, it seems thatthe price effects are not very strong.
An earlier study of the effects of payment instrument pricing in Norway over 1989-1995found significant and inelastic own price elasticities for debit cards (-.35) and ATM cashwithdrawals (-.55) along with significant substitution between debit cards and ATMs whichranged from -.11 to -.46 (see Humphrey, Kim, and Vale, 2001). Although this study did notcontrol for terminal availability as we do, the results obtained do not greatly differ from ours.In both studies, own price elasticities are all inelastic and debit cards significantly substitutefor ATM cash withdrawals with an elasticity less than .50.
4.2 An Error Correction Specification
Although our model is specified in log-differences between Norway and the Netherlands, thevariables used in our system estimation are non-stationary. As the estimation results may bebiased and could reflect spurious correlations, our model was reestimated in first differenceand error-correction forms. The model in levels, in first differences, or in error correctionform are all nested within an “autoregressive distributed lag” framework. The imposedrestrictions in this framework are linear and easily tested.
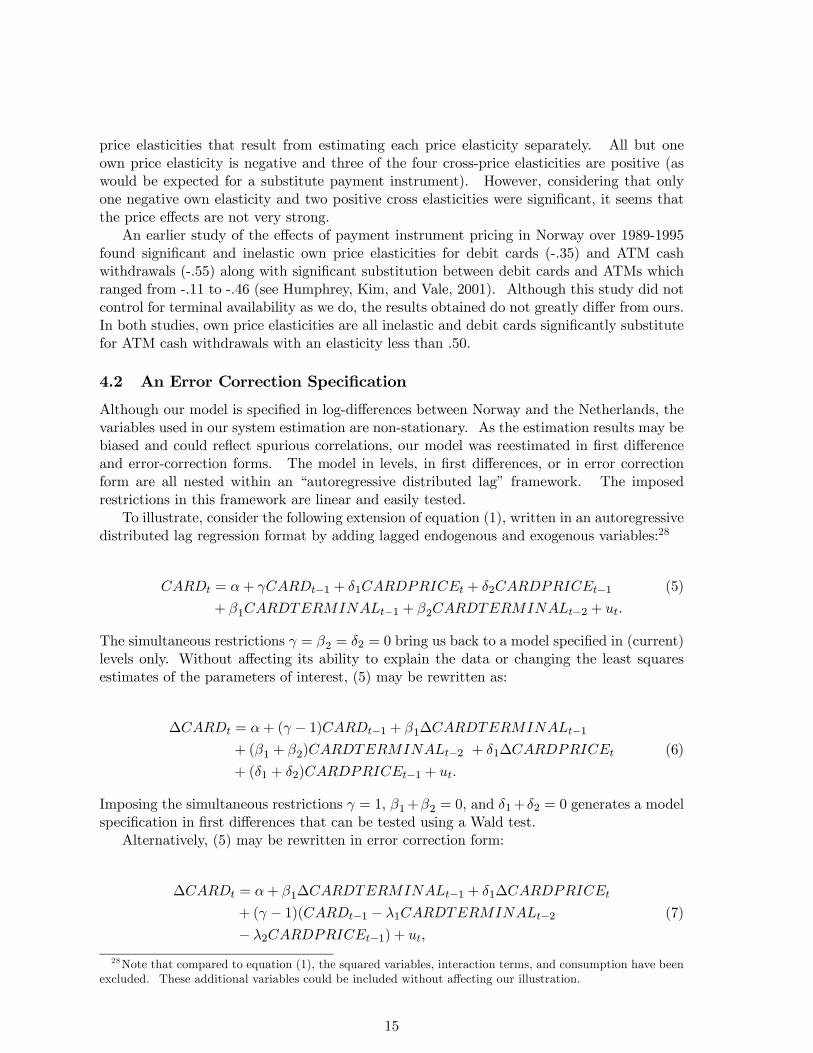
To illustrate, consider the following extension of equation (1), written in an autoregressivedistributed lag regression format by adding lagged endogenous and exogenous variables:28
CARDt = α+ γCARDt−1 + δ1CARDPRICEt + δ2CARDPRICEt−1 (5)
+ β1CARDTERMINALt−1 + β2CARDTERMINALt−2 + ut.
The simultaneous restrictions γ = β2 = δ2 = 0 bring us back to a model specified in (current)levels only. Without affecting its ability to explain the data or changing the least squaresestimates of the parameters of interest, (5) may be rewritten as:
∆CARDt = α+ (γ − 1)CARDt−1 + β1∆CARDTERMINALt−1
+ (β1 + β2)CARDTERMINALt−2 + δ1∆CARDPRICEt (6)
+ (δ1 + δ2)CARDPRICEt−1 + ut.
Imposing the simultaneous restrictions γ = 1, β1+β2 = 0, and δ1+δ2 = 0 generates a modelspecification in first differences that can be tested using a Wald test.
Alternatively, (5) may be rewritten in error correction form:
∆CARDt = α+ β1∆CARDTERMINALt−1 + δ1∆CARDPRICEt
+ (γ − 1)(CARDt−1 − λ1CARDTERMINALt−2 (7)
− λ2CARDPRICEt−1) + ut,
28Note that compared to equation (1), the squared variables, interaction terms, and consumption have beenexcluded. These additional variables could be included without affecting our illustration.
15

where λ1 =β1+β2γ−1 and λ2 =
δ1+δ2γ−1 .
If the parameter γ1−1 is negative and significantly different from zero, the model in errorcorrection format cannot be rejected. In (7) we have an equilibrium relationship:
∆CARDt = α+ β1∆CARDTERMINALt−1 + δ1∆CARDPRICEt + ut,
and an equilibrium error,
CARDt−1 − λ1CARDTERMINALt−2 − λ2CARDPRICEt−1,
that measures the extent to which the long-run relationship between the variables CARDt−1,CARDTERMINALt−2 and CARDPRICEt−1 is not satisfied. Consequently, the feedbackparameter γ − 1 can be interpreted as the proportion of the resulting disequilibrium thatis reflected in the movement of CARDt in one period. If specified in logarithms, the pa-rameters λ1 and λ2 yield estimates of long-run elasticities that would be equivalent to theprice and terminal elasticities we derived from equations (1) to (4) if our model in levels isappropriate. Interestingly, error correction models are also appropriate when the variablesare non-stationary and are particularly attractive when the dependent variable is I(1). Gen-erally, the significance of the parameter γ−1 indicates the existence of a long-run equilibriumand the cointegration of the non-stationary variables.29 This would allow direct estimationof our preferred model in levels.
The error correction results of all four equations are shown in Table 5 along with the priceand terminal elasticities for our preferred model from Table 1 using levels data along withnew elasticities using only first differenced data. In a first difference framework both terminalelasticities have the expected sign and are significant, but this is at the expense of poor resultsfor the price elasticities. In the error correction form, the debit card price elasticity is nolonger significant but the other price elasticities have the expected sign and are significant(even with a reduction in degrees of freedom), although in two cases the feedback parameterwas not significant at the 5% level. Given our data limitations, the results weakly suggestthat the price elasticities using levels data in equations (1) to (4)—our preferred model—arerobust and can be relied upon as long-run estimates.
4.3 Estimation of Electronic for Paper Substitution in Norway
The effect of pricing on payment instrument use is also estimated for Norway alone. Thisapproach should give similar results to our country difference model if non-price characteris-tics that affect payment use in a country are not too strong. The specification is linear andsimpler than our country difference model (due to degrees of freedom considerations) and allthe data are for Norway:
CARDATMt = α1 + α2CARDATMTERMINALt−1 (8)
+ α3CARDATMPRICEt + α4CONSUMPTIONt + ε1t
ELEPAPERt = β1 + β2ELEPAPERPRICEt + β3CONSUMPTIONt + 2t (9)
29As a stability condition, the feedback parameter γ − 1 needs to be between zero and -1.
16

Table 5: Price and Terminal Elasticities: Data in Levels and First DifferencesLevels 1st Differenced 1st Differenced & Levels DataData Data in an Error Correction Model
Debit CardPrice Effect -.22* .47 3.25
Terminal Effect .53* .75* .82Feedback Parameter -.066
ATM Cash WithdrawalPrice Effect .23* .06 .32*
Terminal Effect -.16* .47* -.39*Feedback Parameter -.826*
Electronic GiroPrice Effect -.46* .37* -.60*
Feedback Parameter -.240
Paper GiroPrice Effect .27* .11 .49*
Feedback Parameter -.448*Starred (*) values indicate a P-value smaller than .01 in a two-tailed t test.Debit cards and ATMs formed one system estimation while electronic and paper giros formedanother in the first differenced and error correction models.
where:
CARDATM = ln (debit card use/ATM use),on a per person basis;
CARDATMTERMINAL = ln (card terminals/ATM terminals),per million population;
CARDATMPRICE = ln (debit card price/ATM price);CONSUMPTION = ln (personal consumption),
real per capita;ELEPAPER = ln (electronic giro use/paper giro use),
per person;ELEPAPERPRICE = ln (electronic giro price/paper giro price).
Equations (8) and (9) were estimated in a systems equation framework (with 23 degreesof freedom, d.f. = 2*15 - 7). As shown in Table 6, the elasticity of substitution betweendebit cards and cash was -.20 using levels data and -.31 in first differences. A 10% risein the relative price of an ATM cash withdrawal (which reduces the ratio of debit card toATM prices) is associated with a small (2.0% or 3.1%) rise in the ratio of debit card to ATMuse. If this parameter was -1.0, then the expenditure shares of debit cards and ATMs wouldbe unchanged since a 10% relative rise in the ATM price would be exactly offset by a 10%decrease in relative ATM use. Since the parameter is less than one (in absolute value), theexpenditure share of ATMs rises as the price-induced substitution is less responsive than in(say) a traditional Cobb-Douglas framework where the elasticity of input substitution to aprice change is 1.0. The elasticity of terminal availability on debit card and ATM use is .54which indicates that a 10% relative rise in debit card terminals leads to a 5.4% relative risein debit card use.
17

Table 6: Price and Terminal Substitution for NorwayDebit Card/ATM substitution:
Levels Data 1st Differenced DataPrice Effect -.20* -.31*
Terminal Effect .54* .06
Electronic/Paper Giro Substitution:Price Effect .54* .13
Starred (*) values indicate a P-value smaller than .01 in a two-tailed t test.
The substitution elasticity between electronic and paper giro transactions had the wrongsign (at .54) and was significant using levels data in a system estimation. Use of firstdifferenced data did not alter this sign but dropping real personal consumption from (8)and (9), which had a large and significant effect, did (giving a significant -1.98 value forelectronic/paper giro substitution).
4.4 Conclusions Regarding the Effect of Pricing on Payment Use
Three conclusions can be drawn from our price elasticity results so far. First, in Table4 and in our alternative specification here, the effect of terminal availability on relativedebit card and ATM use exceeds that for pricing since the terminal elasticities are larger.This implies that convenience, safety, and other non-price attributes of different paymentinstruments are themselves an important inducement to change payment use, as long asterminals are available, than is price. Even so, pricing does have a significant effect ininfluencing payment choice but not as much as we had expected. A second conclusion,which follows in part from the first, is that changes in relative prices (or terminals) bothhave a smaller than proportional effect on relative use. In this sense, both effects arerelatively inelastic. Third, the similarity of the price elasticity results from our countrydifference model with those for debit card/ATM substitution in Norway alone suggests thatthe omitted variable of unspecified non-price payment instrument attributes is not strongenough to markedly distort price elasticity results derived from a single-country estimation.
Although approximate, our overall conclusion is that while terminal availability appearsto have a stronger effect on relative payment instrument use than does direct per transactionpricing, the shift to electronic payments could be speeded up when pricing is combined withterminal availability.30 If both prices and terminals are expanded at similar percentagerates then the adoption of electronic payments could have been speeded up by perhaps 40%compared to not having per transaction pricing.31 As seen in Tables 2 and 3, however, debitcard terminals changed at a much greater rate than did the price of ATMs or the relativeprices of cards to ATMs, indicating that in this instance a potential speedup of 40% is toohigh and was not realized.
More precisely, for Norway the average annual growth in debit card terminal densityequaled +15%, whereas the growth in card price relative to ATMs was -11%. Given theestimated elasticities in Table 4, this would predict a relative rise of debit card use over ATMs
30Dutch survey results confirm the relative importance of terminal availability for payment instrument usageand stress also the non-price attributes of payment instruments (e.g. , in the adoption of stored-value cards,see Jonker, 2005).31This estimate is derived from the ratio of the price elasticity in our preferred model (-22%) in Column 1
of Table 4 to the terminal elasticity (53%), which equals .42.
18

of 15 × 0.53% + 11 × 0.22% = 10.4% from the terminal and price effects alone. Withoutany price inducements this increase in usage would be 15 × 0.53% = 8.0%, suggesting thatthe substitution process has been speeded up by approximately 2.4/10.4 = 23%, althoughthe realized contribution of pricing to debit card adoption was 2.4% a year.32 Electronicgiro payments do not have a terminal constraint and the influence of consumption growthon payment use is not significant so only the effect of pricing is measured. The growth ofelectronic giro relative to paper giro prices was -8% while the price elasticity in Table 4 was.46, suggesting that the realized contribution of pricing to the adoption of electronic giropayments was 8× 0.46% = 3.7% annually. Thus in terms of both the size of the estimatedprice elasticities and their realized impact on adoption rates, the effect of pricing on theshift to electronic payments is greater for giro transactions than for debit cards. The factthat terminal elasticities are an important component of the substitution process for cardssuggests that non-priced attributes—such as convenience and security—play a greater role forcards versus cash than for electronic versus paper giro transactions.
5 Illustrating the Social Benefit of Electronic Payments
Logistic or “S-curves” have been successfully used to approximate the adoption and dispersionof new products and technology, such as the adoption of the telephone, the television, theInternet, and the use of robots in manufacturing. This procedure is applied here to electronicpayments since, during our 15-year period, the shares of debit cards (in total debit card andATM transactions) and electronic giros (in electronic plus paper giro payments) made thetransition from rising at an increasing rate to rising at a decreasing rate (c.f., Table 7).33
Over 1990-2004, the average change in debit card shares at 4 percentage points per yearin both countries suggests that per transaction pricing of debit card and ATM transactionsin Norway did not appear to speed up the adoption of cards. If it had, we would expectto see a larger average share change for Norway than for the Netherlands (rather than thereverse seen in Table 7). This result is essentially consistent with the low estimated priceelasticities for debit cards compared to electronic giros seen in Tables 4 and 5.34
The smaller change in electronic giro shares for the Netherlands compared to Norwayimplies that pricing giro transactions has speeded up the transition to electronics. For girotransactions, the relative price of paper giros was rising but, in addition, the electronic pricewas absolutely lower than the paper price. Although the relative price of ATM transactionswas also rising over our sample period, the debit card price was absolutely higher than theATM price for the beginning one-third of our sample. While economists maintain that onlychanges in relative prices matter, common sense suggests that consumers are also influencedby absolute prices. Our data show a falling relative price of debit cards over the whole periodbut, if the debit card price had remained above the weighted average of an ATM transactionfor the entire period as well, it is very unlikely that many consumers would have chosen touse a debit card unless the non-price attributes were very strong.
32The same calculation using price (-.20) and terminal (.54) elasticities for Norway alone from Table 6 givesa 20% speedup for debit card use (with a contribution of 2.2% annually).33The coverage of an inflection point for electronic giros in the Netherlands is weak, however.34 Indeed, replacing the dependent variables in equations (1) to (4) with the index of shares, rather than the
index of per person use, reverses the sign for the debit card price elasticity and gives an insignificant papergiro price effect. With the index of shares—ln [(Norway share electronic/share paper)/(Netherlands shareelectronic/share paper)] the price effects are weaker than those we identified earlier.
19
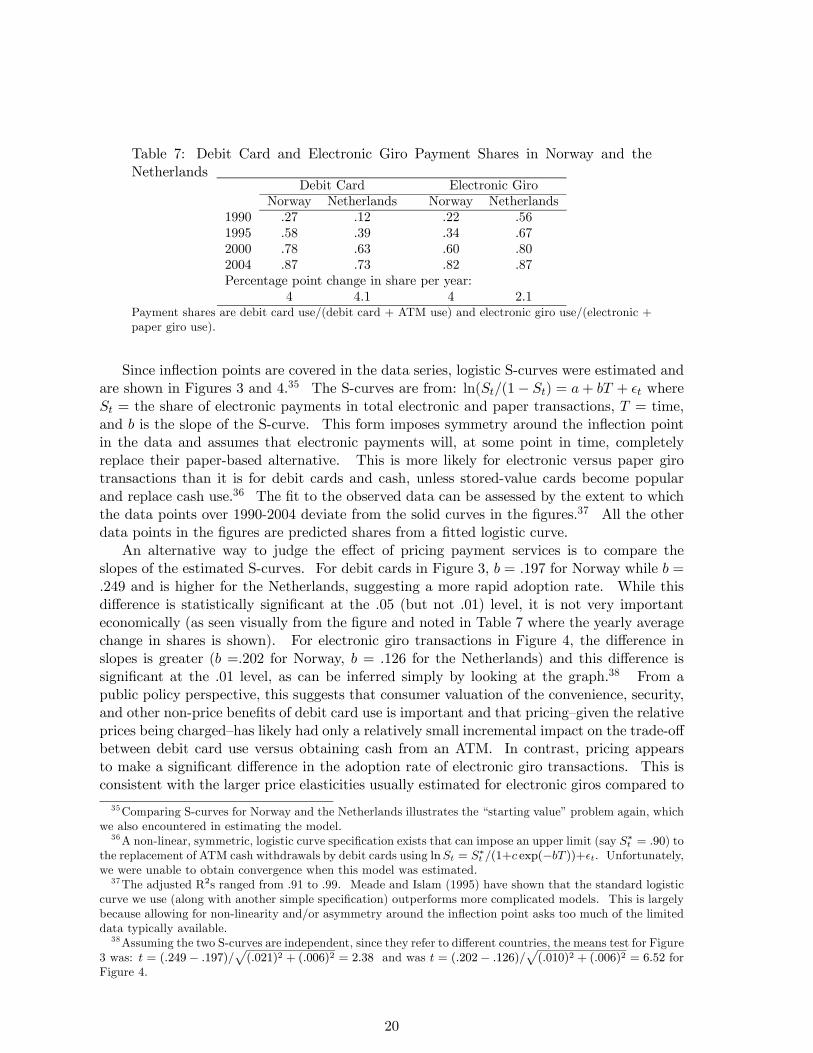
Table 7: Debit Card and Electronic Giro Payment Shares in Norway and theNetherlands
Debit Card Electronic GiroNorway Netherlands Norway Netherlands
1990 .27 .12 .22 .561995 .58 .39 .34 .672000 .78 .63 .60 .802004 .87 .73 .82 .87Percentage point change in share per year:
4 4.1 4 2.1Payment shares are debit card use/(debit card + ATM use) and electronic giro use/(electronic +paper giro use).
Since inflection points are covered in the data series, logistic S-curves were estimated andare shown in Figures 3 and 4.35 The S-curves are from: ln(St/(1− St) = a+ bT + t whereSt = the share of electronic payments in total electronic and paper transactions, T = time,and b is the slope of the S-curve. This form imposes symmetry around the inflection pointin the data and assumes that electronic payments will, at some point in time, completelyreplace their paper-based alternative. This is more likely for electronic versus paper girotransactions than it is for debit cards and cash, unless stored-value cards become popularand replace cash use.36 The fit to the observed data can be assessed by the extent to whichthe data points over 1990-2004 deviate from the solid curves in the figures.37 All the otherdata points in the figures are predicted shares from a fitted logistic curve.
An alternative way to judge the effect of pricing payment services is to compare theslopes of the estimated S-curves. For debit cards in Figure 3, b = .197 for Norway while b =.249 and is higher for the Netherlands, suggesting a more rapid adoption rate. While thisdifference is statistically significant at the .05 (but not .01) level, it is not very importanteconomically (as seen visually from the figure and noted in Table 7 where the yearly averagechange in shares is shown). For electronic giro transactions in Figure 4, the difference inslopes is greater (b =.202 for Norway, b = .126 for the Netherlands) and this difference issignificant at the .01 level, as can be inferred simply by looking at the graph.38 From apublic policy perspective, this suggests that consumer valuation of the convenience, security,and other non-price benefits of debit card use is important and that pricing—given the relativeprices being charged—has likely had only a relatively small incremental impact on the trade-offbetween debit card use versus obtaining cash from an ATM. In contrast, pricing appearsto make a significant difference in the adoption rate of electronic giro transactions. This isconsistent with the larger price elasticities usually estimated for electronic giros compared to
35Comparing S-curves for Norway and the Netherlands illustrates the “starting value” problem again, whichwe also encountered in estimating the model.36A non-linear, symmetric, logistic curve specification exists that can impose an upper limit (say S∗t = .90) to
the replacement of ATM cash withdrawals by debit cards using lnSt = S∗t /(1+c exp(−bT ))+ t. Unfortunately,we were unable to obtain convergence when this model was estimated.37The adjusted R2s ranged from .91 to .99. Meade and Islam (1995) have shown that the standard logistic
curve we use (along with another simple specification) outperforms more complicated models. This is largelybecause allowing for non-linearity and/or asymmetry around the inflection point asks too much of the limiteddata typically available.38Assuming the two S-curves are independent, since they refer to different countries, the means test for Figure
3 was: t = (.249− .197)/ (.021)2 + (.006)2 = 2.38 and was t = (.202− .126)/ (.010)2 + (.006)2 = 6.52 forFigure 4.
20

Figure 3: Debit Card Transaction Shares for Norway and the Netherlands
1965 1970 1975 1980 1985 1990 1995 2000 2005 2010 2015 2020
0.0
0.1
0.2
0.3
0.4
0.5
0.6
0.7
0.8
0.9
1.0
Norw ay Debit Card TransactionsActual data: 1990-2004
Netherlands Debit Card TransactionsActual data: 1990-2004
NO RDCARDP RED × Y EARP NLDCARDP RED × YEARP
Spline k=7.00 Spline k=7.00
debit cards.The discounted social benefit of electronic payments can be approximated by considering
the difference in the bank cost of producing electronic versus paper payments (Row 1 ofTable 8) and the speed by which a country shifts to electronic payments (determined, as anapproximation, from Figures 3 and 4).39 The per transaction bank cost figures used hereare for Norway but are very similar to those for the Netherlands. As the time taken to shiftfrom paper to electronics differed across countries and payment instruments, we computedbenefits using a common number of years (40). We started when the share of electronicswas .10 and ended when it reached .90, to eliminate the slow start and finish evident in thefitted S-curves which are farther from our observation set. Once a .90 share was attained,the undiscounted nominal benefits remained at that level until the end of the 40-year period.Benefits are computed using the level of payments in 1999, noted in the footnote to the table,since we do not have information on what that level was before 1990 nor after 2004. Theannual per person benefits were discounted at 3% and sums of the per person discounted (andundiscounted) benefits are shown in Table 8. Shifting to debit cards from ATMs apparentlysaves €945 per person in Norway and €769 in the Netherlands while the shift to electronicfrom paper giro payments saves €814 and €881 per person, respectively, in the two countries.Factoring in the savings from eliminating checks adds €461 and €676 in savings per personin Norway and the Netherlands, discounted over the same 40-year period.40 Overall, the
39Savings in merchant costs are typically unknown but, if estimated, should be included (taking care not todouble count certain expenses, such as including bank fees in merchant costs). Some merchant cost savingsinformation does exist for point-of-sale transactions in the Netherlands but no information exists for merchantsavings for giro payments (Brits and Winder, 2005).40Bank check costs per transaction were 2.70 euros while debit card expenses were .30 euros. This gives a
21
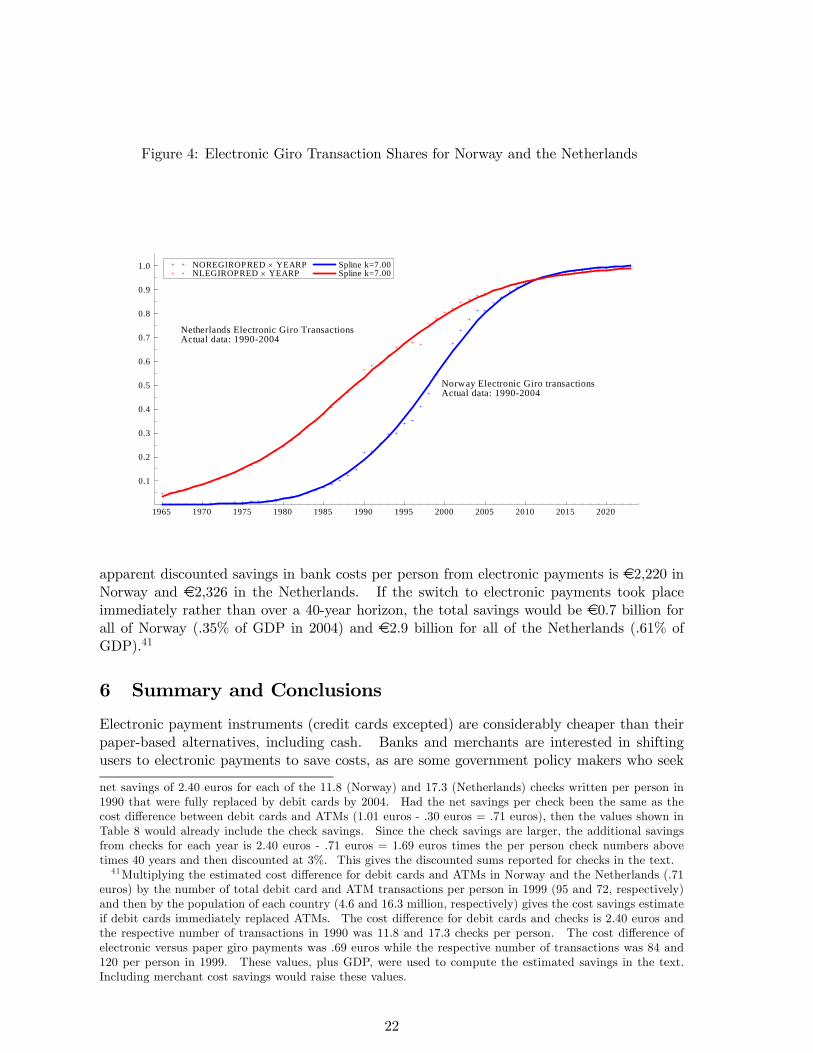
Figure 4: Electronic Giro Transaction Shares for Norway and the Netherlands
1965 1970 1975 1980 1985 1990 1995 2000 2005 2010 2015 2020
0.1
0.2
0.3
0.4
0.5
0.6
0.7
0.8
0.9
1.0
Norway Electronic Giro transactionsActual data: 1990-2004
Netherlands Electronic Giro TransactionsActual data: 1990-2004
NOREGIROPRED × YEARP NLEGIROPRED × YEARP
Spline k=7.00 Spline k=7.00
apparent discounted savings in bank costs per person from electronic payments is €2,220 inNorway and €2,326 in the Netherlands. If the switch to electronic payments took placeimmediately rather than over a 40-year horizon, the total savings would be €0.7 billion forall of Norway (.35% of GDP in 2004) and €2.9 billion for all of the Netherlands (.61% ofGDP).41
6 Summary and Conclusions
Electronic payment instruments (credit cards excepted) are considerably cheaper than theirpaper-based alternatives, including cash. Banks and merchants are interested in shiftingusers to electronic payments to save costs, as are some government policy makers who seek
net savings of 2.40 euros for each of the 11.8 (Norway) and 17.3 (Netherlands) checks written per person in1990 that were fully replaced by debit cards by 2004. Had the net savings per check been the same as thecost difference between debit cards and ATMs (1.01 euros - .30 euros = .71 euros), then the values shown inTable 8 would already include the check savings. Since the check savings are larger, the additional savingsfrom checks for each year is 2.40 euros - .71 euros = 1.69 euros times the per person check numbers abovetimes 40 years and then discounted at 3%. This gives the discounted sums reported for checks in the text.41Multiplying the estimated cost difference for debit cards and ATMs in Norway and the Netherlands (.71
euros) by the number of total debit card and ATM transactions per person in 1999 (95 and 72, respectively)and then by the population of each country (4.6 and 16.3 million, respectively) gives the cost savings estimateif debit cards immediately replaced ATMs. The cost difference for debit cards and checks is 2.40 euros andthe respective number of transactions in 1990 was 11.8 and 17.3 checks per person. The cost difference ofelectronic versus paper giro payments was .69 euros while the respective number of transactions was 84 and120 per person in 1999. These values, plus GDP, were used to compute the estimated savings in the text.Including merchant cost savings would raise these values.
22
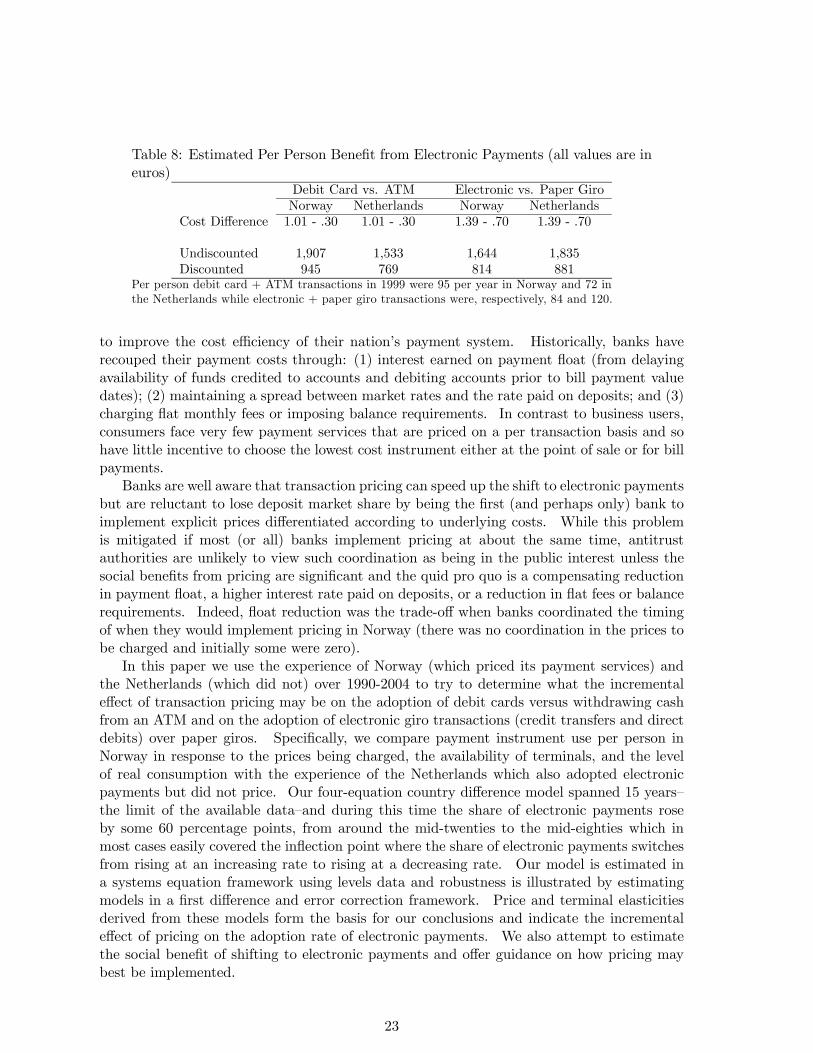
Table 8: Estimated Per Person Benefit from Electronic Payments (all values are ineuros)
Debit Card vs. ATM Electronic vs. Paper GiroNorway Netherlands Norway Netherlands
Cost Difference 1.01 - .30 1.01 - .30 1.39 - .70 1.39 - .70
Undiscounted 1,907 1,533 1,644 1,835Discounted 945 769 814 881
Per person debit card + ATM transactions in 1999 were 95 per year in Norway and 72 inthe Netherlands while electronic + paper giro transactions were, respectively, 84 and 120.
to improve the cost efficiency of their nation’s payment system. Historically, banks haverecouped their payment costs through: (1) interest earned on payment float (from delayingavailability of funds credited to accounts and debiting accounts prior to bill payment valuedates); (2) maintaining a spread between market rates and the rate paid on deposits; and (3)charging flat monthly fees or imposing balance requirements. In contrast to business users,consumers face very few payment services that are priced on a per transaction basis and sohave little incentive to choose the lowest cost instrument either at the point of sale or for billpayments.
Banks are well aware that transaction pricing can speed up the shift to electronic paymentsbut are reluctant to lose deposit market share by being the first (and perhaps only) bank toimplement explicit prices differentiated according to underlying costs. While this problemis mitigated if most (or all) banks implement pricing at about the same time, antitrustauthorities are unlikely to view such coordination as being in the public interest unless thesocial benefits from pricing are significant and the quid pro quo is a compensating reductionin payment float, a higher interest rate paid on deposits, or a reduction in flat fees or balancerequirements. Indeed, float reduction was the trade-off when banks coordinated the timingof when they would implement pricing in Norway (there was no coordination in the prices tobe charged and initially some were zero).
In this paper we use the experience of Norway (which priced its payment services) andthe Netherlands (which did not) over 1990-2004 to try to determine what the incrementaleffect of transaction pricing may be on the adoption of debit cards versus withdrawing cashfrom an ATM and on the adoption of electronic giro transactions (credit transfers and directdebits) over paper giros. Specifically, we compare payment instrument use per person inNorway in response to the prices being charged, the availability of terminals, and the levelof real consumption with the experience of the Netherlands which also adopted electronicpayments but did not price. Our four-equation country difference model spanned 15 years—the limit of the available data—and during this time the share of electronic payments roseby some 60 percentage points, from around the mid-twenties to the mid-eighties which inmost cases easily covered the inflection point where the share of electronic payments switchesfrom rising at an increasing rate to rising at a decreasing rate. Our model is estimated ina systems equation framework using levels data and robustness is illustrated by estimatingmodels in a first difference and error correction framework. Price and terminal elasticitiesderived from these models form the basis for our conclusions and indicate the incrementaleffect of pricing on the adoption rate of electronic payments. We also attempt to estimatethe social benefit of shifting to electronic payments and offer guidance on how pricing maybest be implemented.
23

The effects of pricing differ depending on which instruments are being considered. Over-all, pricing has a smaller effect on shifting consumers from ATM cash withdrawals to debitcard use than it does in shifting use from paper to electronic giro transactions. The reasonfor this difference seems to be that there are non-price benefits associated with debit card use(convenience, security) that consumers value such that the availability of terminals neededfor debit card transactions has a stronger effect on debit card use than prices, as evidencedby the fact that the debit card price elasticity is smaller than the terminal elasticity. Debitcards also substitute for costly checks and the high price on these instruments in Norway wasassociated with their virtual elimination, although the same thing happened in the Nether-lands which did not price. While terminal availability appears to have a stronger effecton debit card use than does pricing, the shift to cards can be speeded up when pricing iscombined with terminal availability. Using our estimated elasticities and the actual changesin prices and terminals, the predicted relative rise of debit card use over ATMs was 8.0%from terminal effects alone but rose to 10.4% with pricing, an increase of around 20%.
The effect of pricing on electronic giro use was greater than it was for debit cards sincethe electronic giro price elasticity is larger and the percent change in price experienced wasgreater. Reasons for this difference are the above-mentioned non-price convenience andsecurity attributes of debit cards along with the fact that for one-third of our time period theabsolute price of a debit card transaction was higher than the weighted average price of anATM cash withdrawal. In contrast, the price of an electronic giro was always absolutely lowerthan the paper giro price. Even though the relative prices of debit cards and electronic giroswere both falling over the entire period, the higher absolute price of a debit card transactionversus an ATM would be expected to dull the overall price response being measured for theentire period since there is no strong reason to believe that the price response is symmetric(and symmetry was not imposed in our model) since the non-price attributes of debit cardsand ATMs are different. Thus if pricing is implemented, it will likely be more successful ifthe absolute price of the less expensive instrument is always absolutely lower per transactionthan the price of the more expensive instrument.42
In terms of cost savings, the shift from ATM cash withdrawals and checks to debit cardsplus the savings from shifting from paper to electronic giro transactions—if it happened with-out a lag—may save €0.7 billion in bank costs for Norway (.35% of GDP in 2004) and €2.9billion for the Netherlands (.61% of GDP).43 Merchant cost savings, for which little infor-mation exists, would increase these savings estimates as would viewing the discounted bankcost savings over a 40-year transition period (and is noted in the text). As both of thesecountries are well on their way to realizing the full potential gains from electronic payments,the issue of pricing or not pricing is a policy topic for developed countries that are not asfar along in the substitution process or for most developing countries that are just in theinitial stages of thinking about how to improve the efficiency of their payments system. Thesocial benefits of electronic payments are quite large and may convince antitrust authoritiesto allow the coordination of the timing of the implementation of pricing (but not of coursethe prices to be charged) to speed up this transition if banks wished to adopt explicit pricing.And with interest rate margins falling, worsening the recoupment of bank payment costs, thiswish may soon become a reality.
42This was not done in Norway, perhaps because dispensing cash via an ATM was already less expensivethan dispensing it through a branch office (assuming the rise in dispensing frequency at an ATM does not riseenough to offset this advantage).43The savings are absolutely higher for the Netherlands primarily because its population (16.3 million) is
much larger than that of Norway (4.6 million), but GDP per capita is lower.
24

7 Bibliography
Bolt, W., and A.F. Tieman, 2004. Skewed Pricing in Two-Sided Markets: An IO Ap-proach. DNB Working Paper 2004/13, De Nederlandsche Bank.
Brits, H., and C. Winder, 2005. Payments Are No Free Lunch. DNB Occasional Study3(2), De Nederlandsche Bank.
De Nederlandsche Bank, 2004. The Cost of Payments. Quarterly Bulletin, March, 57-64.
Flatraaker, D.-I., and P. Robinson, 1995. Income, Costs, and Pricing in the PaymentSystem. Norges Bank Economic Bulletin, 66, 321-332.
Gresvik, O., and G. Øwre, 2003. Costs and Income in the Norwegian Payments System2001. An Application of the Activity Based Costing Framework. Working Paper 2003/8,Norges Bank.
Humphrey, D., M. Kim, and B. Vale, 2001. Realizing the Gains from Electronic Payments:Costs, Pricing and Payment Choice. Journal of Money, Credit and Banking, 33, 216-234.
Humphrey, D., M. Willesson, G. Bergendahl, and T. Lindblom, forthcoming 2005. Ben-efits from a Changing Payment Technology in European Banking. Journal of Banking andFinance.
Jonker, N., 2005. Payment Instruments as Perceived by Consumers—A Public Survey.DNB Working Paper 2005/53, De Nederlandsche Bank.
Norges Bank, 2004, 2000, 1997. Annual Report on Payment Systems. Norway.
Meade, N., and T. Islam, 1995. Forecasting with Growth Curves: An Empirical Compar-ison. International Journal of Forecasting, 11, 199-215.
Rochet, J-C., and J. Tirole, 2003. Platform Competition in Two-Sided Markets. Journalof the European Economic Association, 1, 990-1029.
Sveriges Riksbank, 2004. Prices and Costs in the Swedish Payment System, in FinancialStability Report, pp. 65-73.
Zinman, J., 2004. Why Use Debit Instead of Credit? Consumer Choice in a Trillion-DollarMarket. Federal Reserve Bank of New York Staff Reports, No. 191, July.
25

8 Data Appendix.
Parameter estimates and t-statistics are shown below for the system estimation of equations(1) to (4). Standard errors were computed from a heteroscedastic-consistent matrix (Robust-White).44
Variable Parameter Estimation T-statistic
Constant α1 .497961 2.77398DIFDCARDTML α2 .373649 2.55827DIFDCARDPRICE α3 .055702 .180209DIFDCARDTML2 α22 .167924 1.24453DIFDCARDPRICE2 α33 .870318 1.21951DCARDTMLPRICE α23 -.308628 -.922949DIFPCONS α4 -.571509 -1.13726Constant β1 .035974 .554554DIFATMTML β2 -1.67562 -8.56053DIFDCARDPRICE β3 1.00388 5.85276DIFATMTML2 β22 5.93594 7.78129DIFDCARDPRICE2 β33 2.33231 3.40630ATMTMLPRICE β23 -3.15162 -4.50450DIFPCONS β4 -.138567 -.766170Constant γ1 -.519080 -1.21248DIFEGIROPRICE γ2 1.06886 2.15115DIFEGIROPRICE2 γ22 .881313 3.06231DIFPCONS γ3 .544589 1.13520Constant δ1 -.606181 -1.20153DIFEGIROPRICE δ2 -1.69478 -2.90182DIFEGIROPRICE2 δ22 -1.13584 -3.30711DIFPCONS δ3 -.678980 -1.34759
Debit Card equation (1): R2 = .978, Durbin-Watson = 2.12ATM Cash Withdrawal equation (2): R2 = .987, Durbin-Watson = 2.80Electronic Giro equation (3): R2 = .872, Durbin-Watson = 1.86Paper Giro equation (4): R2 = .802, Durbin-Watson = 2.03
Data description and sources:
The Netherlands:Source: DNB Statistics (www.dnb.nl), CBS Statistics (www.cbs.nl) and National Accountsstatistics.
44Our data computations follow a translog type of approach where squared values of variables are computedas (ln X)2 rather than ln (X2) and interaction variables are (ln X)(ln Y) rather than ln (XY). Consequently,first differences are computed as (ln X)2t−(ln X)2t−1 rather than ln (X2)t−ln (X2)t−1 and interaction variablesare (ln X)(ln Y)t−(ln X)(ln Y)t−1 rather than ln (XY)t−ln (XY)t−1. The two approaches give similar butnot identical results.
26

Debit card transactions include goods purchased with domestic debit cards; credit card usage(of about 3% of total card usage) is not included. Debit card terminals are EFTPOS terminalsat the point-of-sale in retail locations. ATM cash withdrawal transactions include onlywithdrawals with domestic debit cards. ATM terminals are owned by Dutch commercialbanks. Paper-based giro transactions include ordinary credit transfers (“mail giro”) andinpayment transfers (“accept-giro”). Electronic giro transactions include credit transfers,standing order credit transfers and direct debits.
Consumption is derived from national accounts data on final private consumption expendi-tures, per capita, and corrected for inflation using CPI data. Demographic data are con-structed using data from the Dutch Central Bureau of Statistics.
Norway:Source: Norges Bank (www.norgesbank.no), Norges Bank Annual Report on Payment Sys-tems (2004, 2000, 1997), Statistics Norway (www.ssb.no), and International Finance Statisticsdatabase.
Debit card transactions include goods purchased with Norwegian payment cards in Norwayand abroad but does not include use of oil company cards (see footnote 4 in the text). Debitcard terminals are EFTPOS terminals that also include terminals owned by oil companies(since all debit cards can be used). ATM cash withdrawal transactions include withdrawalsfrom commercial banks and savings banks. These banks own the ATM terminals. Debit cardprice relates to the bank per transaction price for payment cards using an EFTPOS terminal.ATM withdrawal price is a weighted price for a cash withdrawal, based on observed pricesand volume weights corresponding to withdrawals at a bank’s own ATM terminals duringopening hours and outside of opening hours, and other banks’ ATM terminals during openinghours and outside of opening hours. Paper-based giro transactions include mail giro, girofor cash payments, account debits, and money orders. Electronic giro transactions includecompany terminal giros, giro via Internet or telephone, credit transfers, and direct debits.Paper-based giro price is a weighted price per transaction using observed prices and volumeweights corresponding to mail giro, giro for cash payments, account debits, and money orders.Electronic giro price is a weighted price per transaction using observed prices and volumeweights for terminal giro, Internet giro, telephone giro, and direct debits.
Consumption is derived from IFS data on final private consumption expenditures, per capita,and corrected for inflation using CPI data. All nominal values and prices are converted intoeuros using a purchasing power parity exchange rate published by Norges Bank. Demographicdata are constructed using data from Statistics Norway.
Some missing values at the beginning of the sample were estimated by applying simple ex-trapolation procedures.
27